Declining Loneliness Over Time: Evidence From American Colleges and High Schools
Upload
independentCategory
view
2download
0
RESEARCH ARTICLE
Microsatellite Analysis of Museum SpecimensReveals Historical Differences in GeneticDiversity between Declining and More StableBombus SpeciesKevin Maebe1*, Ivan Meeus1, Maarten Ganne1, Thibaut De Meulemeester2,Koos Biesmeijer2, Guy Smagghe1*
1 Department of Crop Protection, Faculty of Bioscience Engineering, Ghent University, Coupure links 653,Ghent, Belgium, 2 Naturalis Biodiversity Center, Darwinweg 2, Leiden, the Netherlands
* [email protected] (KM); [email protected] (GS)
AbstractWorldwide most pollinators, e.g. bumblebees, are undergoing global declines. Loss of ge-
netic diversity can play an essential role in these observed declines. In this paper, we inves-
tigated the level of genetic diversity of seven declining Bombus species and four more
stable species with the use of microsatellite loci. Hereto we genotyped a unique collection
of museum specimens. Specimens were collected between 1918 and 1926, in 6 provinces
of the Netherlands which allowed us to make interspecific comparisons of genetic diversity.
For the stable species B. pascuorum, we also selected populations from two additional time
periods: 1949–1955 and 1975–1990. The genetic diversity and population structure in B.pascuorum remained constant over the three time periods. However, populations of declin-
ing bumblebee species showed a significantly lower genetic diversity than co-occurring sta-
ble species before their major declines. This historical difference indicates that the
repeatedly observed reduced genetic diversity in recent populations of declining bumblebee
species is not caused solely by the decline itself. The historically low genetic diversity in the
declined species may be due to the fact that these species were already rare, making them
more vulnerable to the major drivers of bumblebee decline.
IntroductionAll over the world different pollinator species are undergoing major declines (e.g. [1]). General-ist foragers like many bumblebees, that are essential pollinators in natural and managed ecosys-tems, are no exception to this general phenomenon [2–4]. Different hypotheses aim to explainthe observed declines in bee populations, e.g. the impact of pathogen infections and pathogenspill-over from reared pollinators, the use of pesticides, diet specialization, landscape modifica-tion and loss of forage (as reviewed in: [1–5]). Although all these factors and their interactionsinfluence pollinator populations at different locations and at different scales (from individual,
PLOSONE | DOI:10.1371/journal.pone.0127870 June 10, 2015 1 / 15
OPEN ACCESS
Citation: Maebe K, Meeus I, Ganne M, DeMeulemeester T, Biesmeijer K, Smagghe G (2015)Microsatellite Analysis of Museum SpecimensReveals Historical Differences in Genetic Diversitybetween Declining and More Stable BombusSpecies. PLoS ONE 10(6): e0127870. doi:10.1371/journal.pone.0127870
Academic Editor:Wolfgang Arthofer, University ofInnsbruck, AUSTRIA
Received: July 22, 2014
Accepted: April 21, 2015
Published: June 10, 2015
Copyright: © 2015 Maebe et al. This is an openaccess article distributed under the terms of theCreative Commons Attribution License, which permitsunrestricted use, distribution, and reproduction in anymedium, provided the original author and source arecredited.
Data Availability Statement: All relevant data areavailable via Dryad (http://datadryad.org/resource/doi:10.5061/dryad.251r0).
Funding: This work was supported by the ResearchFoundation of Flanders (FWO-Vlaanderen,G.0558.12N; www.fwo.be); the Special ResearchFund of Ghent University (BOF-UGent; www.ugent.be); and the Belgian Research Policy, ResearchProgramme Science For A Sustainable Development(Belspo; www.belspo.be). The funders had no role in

to colony, to population), the agricultural intensification with increasing loss of habitats andforage resources, which started between 1950–1980 [4,6–8], is thought to be the key driver inEurope [5]. Genetic processes can also contribute to the observed decline as a consequence of,e.g. habitat fragmentation and limited migration. Indeed, low genetic diversity might threatenpopulations by limiting their ability to adapt to future environmental change [9–11]. For in-stant, it may predispose populations to disease epidemics [3,12]. Secondly, low diversity mayresult in inbreeding, thereby reducing individual fitness and threatening population extinction[10–11,13–14].
Based on contemporary specimens, several studies have shown that populations of decliningbumblebee species have lower levels of genetic diversity compared to stable species [3,15–18].However, as discussed by Lozier et al. [19], without information on the historic situation, thequestion remains: is this low diversity actually the result of recent declines, or is it due to histor-ical, e.g. pre-decline, differences in genetic variation among species? Differentiating betweenthese two causes could be achieved by comparison of the levels of genetic diversity of popula-tions before the major drivers of bumblebee declines have acted [20–21]. Thus, by contrastingpast and recent genetic diversity, one could obtain estimates of the magnitude of these driverson population sizes and the levels of gene flow between these populations [17–18].
In this paper, we compared the genetic diversity of declining and more stable bumblebeespecies before their major recent decline (between 1950–1980) [6–8]. We used microsatellitesto genotype a set of pin-mounted museum specimens of 4 stable bumblebee species: Bombuspascuorum, B. hortorum, B. pratorum and B. lapidarius, and 7 declining species: B.muscorum,B. veteranus, B. ruderarius, B. sylvarum, B. humilis, B. ruderatus and B. subterraneus [22]. Sam-ples were all collected in the Netherlands (1918–1926) before the recent declines started (be-tween 1950–1980) [4,6–8]. Furthermore, we compared our results with currently available data(time period: 1975–2009) on genetic diversity in bumblebees [16,23–29] to obtain further in-sights whether the genetic diversity is similar in historical and current populations of the samedeclining and stable species. Together, these findings contribute to our understanding of thechanges in population genetic processes and can provide valuable information for the imple-mentation of conservation strategies.
Material and Methods
Museum specimens and their distributionMuseum specimens of 11 bumblebee species were selected from the Hymenoptera collection ofthe Naturalis Biodiversity Center in Leiden taking into consideration their distribution in theNetherlands (Fig 1).
We divided the selected species in groups based on their presence and status on the red listof the Netherlands [22] (S1 Table). Bumblebee species grouped as ‘declining’ have been given ared list status of ‘vulnerable’, ‘endangered’, ‘critically endangered’ or ‘disappeared’, while spe-cies grouped as ‘stable’ did not have a special red list status although these species also hadrange reductions. This first division of the species according to their red list status correspondsto the decline in their distribution (= trend, S1 Table). Here, species distribution is calculatedas the relative areal size (i.e. the amount of hour blocks a species has been found / the totalamount of hour blocks checked) x 100%, with an hour block representing a 5 x 5 km squarearea. The decline in distribution is calculated as: (the relative areal size of after 1970—relativeareal size before 1970) / relative areal size before 1970) x 100% [22]. The species assigned to the‘decline’ group showed a decline in distribution of 65% or more between 1970 and 2003, whilefor the ‘stable’ species the decline in distribution was less than 40% ([22], S1 Table). Further-more, we divided the group of declining species in two based on their distribution before 1970:
Historical Lower Genetic Diversity in Declining spp
PLOS ONE | DOI:10.1371/journal.pone.0127870 June 10, 2015 2 / 15
study design, data collection and analysis, decision topublish, or preparation of the manuscript.
Competing Interests: The authors have declaredthat no competing interests exist. Coauthor of thesubmitting paper (GS) is editor for PLOS ONE andthis does not alter the authors’ adherence to all thePLOS ONE policies on sharing data and materials.

Fig 1. Distribution of the specimens of the declining andmore stableBombus spp. Specimens collected in the Netherlands between the years 1918–1926 before the recent bumblebee declines started (1950–1980), with a picture of each Bombus spp. used in the analysis. Species pictures from [56]. Theletters refer to each sampling location: A = N-Holland, B = Z-Holland, C = Overrijssel, D = Gelderland and E = Limburg. Symbol size refers to the amount ofspecies sampled at that location, while the numbers refer to which species. With for the stable and widespread species: 1 = B. hortorum, 2 = B. lapidarius, 3 =B. pratorum, 4 = B. pascuorum; for the declining and restricted species: 5 = B. humilis, 6 = B. ruderatus, 7 = B. subterraneus, 8 = B. sylvarum, and for thedeclining and widespread species: 9 = B.muscorum, 10 = B. ruderarius, and 11 = B. veteranus.
doi:10.1371/journal.pone.0127870.g001
Historical Lower Genetic Diversity in Declining spp
PLOS ONE | DOI:10.1371/journal.pone.0127870 June 10, 2015 3 / 15

species with a distribution lower than 10% were considered as restricted (with mean (SD): 6.1%(2.8%)) while declining species with a distribution between 15–25% were considered as wide-spread (19.1% (2.4%); T-test, t = -6.465, d.f. = 5, P< 0.001). The group of declining and wide-spread species was not significantly different in range from the group of widespread but stablespecies (23.2% (2.8%); T-test, t = 1.937, d.f. = 4, P = 0.125).
Based on these criteria, we selected 4 stable and widespread bumblebee species: B. pas-cuorum (N = 38); B. hortorum (N = 30), B. pratorum (N = 10) and B. lapidarius (N = 19), 3 de-clining but widespread species: B.muscorum (N = 20), B. veteranus (N = 8) and B. ruderarius(N = 28), and 4 declining but restricted species: B. sylvarum (N = 16), B. humilis (N = 20), B.ruderatus (N = 17) and B. subterraneus (N = 7). Populations were collected in the period 1918–1926 and in 5 Dutch provinces: North-Holland, South-Holland, Gelderland, Overijssel andLimburg (Fig 1). Samples from a province were from one locality or different localities close to-gether (within a 5 x 5 km frame). For all populations, 7 to 10 bumblebee workerswere genotyped.
For B. pascuorum, we selected additional specimens from 4 populations of two more recenttime periods, 1949–1955 (N = 40) and 1975–1990 (N = 49) and from one additional province:Drenthe. These extra 8 populations allowed us to investigate the genetic diversity of B. pas-cuorum over space and time. We suspected this to remain fairly stable as this species was andstill is abundantly present in the Netherland. Deviations from this suspected result could indi-cate artefacts associated with the genotyping of museum specimens.
DNA extraction and microsatellite protocolBumblebee DNA was extracted from one middle leg of each selected museum specimen with aChelex method (InstaGene Matrix, BioRad) as described in [28]. Workers were genotyped at10 microsatellite loci that have a size range lower or around 200 bp to avoid the chance of nullalleles [20]: B11, B100, B121, B126 and B132 [30] and BT04, BT08, BT10, BT11 [31] as origi-nally developed from B. terrestris, and BL02 [31] as derived from B. lucorum. Microsatelliteswere then amplified by PCR and visualized with capillary electrophoreses as described in [28].Genotype replications of 48 random individuals were conducted to examine the genotypicerror rate.
Data analysisNot all genotyped individuals of a population were included in the analysis due to several vali-dation steps. First, specimens which could not be scored in a reliable manner for a minimum of5 microsatellite loci, were excluded. Second, we used the program Colony 2.0 [32] employingcorrections for genotyping errors (5% per locus) to search for the presence of multiple sistersfrom the same colony. To exclude problems using Colony 2.0 on populations with low geneticvariability [33], we checked our data also with the program Kinalyzer [34] with both the ‘2 al-lele’ algorithm and the ‘consensus’method. We randomly selected one individual per sibshipfor further analysis.
As the microsatellites used here were developed from B. terrestris and B. lucorum, we neededto validate if they could be used in a reliable manner in the different Bombus spp. We tested forgenotypic linkage disequilibrium with FSTAT 2.9.3 [35] and for genotype frequencies againstHW equilibrium expectations for each population of a species with GENALEX 6.3 [36]. Whenexcess homozygosity was found, the programMICROCHECKER 2.2.3 [37] was used to checkfor evidence of null alleles.
Historical Lower Genetic Diversity in Declining spp
PLOS ONE | DOI:10.1371/journal.pone.0127870 June 10, 2015 4 / 15

Genetic diversityWe estimated genetic diversity in each population using the allelic richness (AR) and Nei’s un-biased expected heterozygosity (HE; [38]). The latter statistic is not biased by the sample size ofpopulations within the same species and appears not to be affected by null alleles [39]. The pro-gram HP-RARE [40], with hierarchical rarefaction to correct for sampling size, and GENALEX6.3 [36] were used to estimate AR and calculate HE for each microsatellite locus, respectively.As some of our groups did not pass the Levine test, we used only nonparametric tests (e.g. In-dependent samples Mann-Whitney U test) in SPSS (version 21.0.0.0) to examine if the geneticdiversity differed significantly between the widespread stable versus the restricted and wide-spread declining species and an ANOVA with Repeated Measures Factors to examine the ge-netic diversity between populations of B. pascuorum.
We conducted a sensitivity analysis of the calculated mean heterozygosity (HE) for eachpopulation of the different Bombus spp. in the time period 1918–1926 based on more stringentexclusion policies for missing data. We started this analysis from a maximum of 50% missingvalues (or 5 loci) within one specimen towards a more stringent exclusion step of only 10% (orone locus) missing data.
Estimation of the genetic diversity and comparison between groups ofspeciesHere, we used only a low number of specimens (n = 10 and after excluding step only 6–10) toestimate the genetic diversity for the different Bombus species. This is mainly due to the lownumber of available collection specimens and the study design of having a comparable samplesize for all populations of each species. Normally, a reliable estimation of genetic diversity ismade with 20–25 or more specimens of a population. Possible problems with low samplingsize could be avoided by including more microsatellite loci. However, including more loci wasnot doable as DNA extracts were expended. Here, we still believe that our data is trustworthyas the estimations of genetic diversity for the different populations of a species are of a compa-rable magnitude and less then the differences in genetic diversity observed between the threedifferent groups of species.
Furthermore, we compare the genetic diversity between groups of species. However, the in-terpretation of the observed inter-specific differences cannot be made easily due to: (i) muta-tion rates which may vary at different microsatellites loci and (ii) differences in polymorphismof the microsatellite loci. To remedy these effects, we used the same microsatellite loci for eachspecies and bumblebee specimens with similar distribution in The Netherlands. In addition,we compared a group of 7 declining species with a group of 4 stable bumblebee species insteadof single species. Furthermore, each group consisted of bumblebee species of multiple subge-nera. In this way we minimize inconsistencies and perform a valid comparison between groupsof species [17–19].
Population structureGenetic differentiation values (FST) between the B. pascuorum populations within years andwithin populations between years were calculated using 1000 permutations in FSTAT 2.9.3[35] and re-calculated after applying the ENA correction for null alleles as implemented inFREENA [41]. We also estimated the true measure of differentiation, Jost’s D [42], using thesoftware SMOGD v2.6 [43].
Historical Lower Genetic Diversity in Declining spp
PLOS ONE | DOI:10.1371/journal.pone.0127870 June 10, 2015 5 / 15
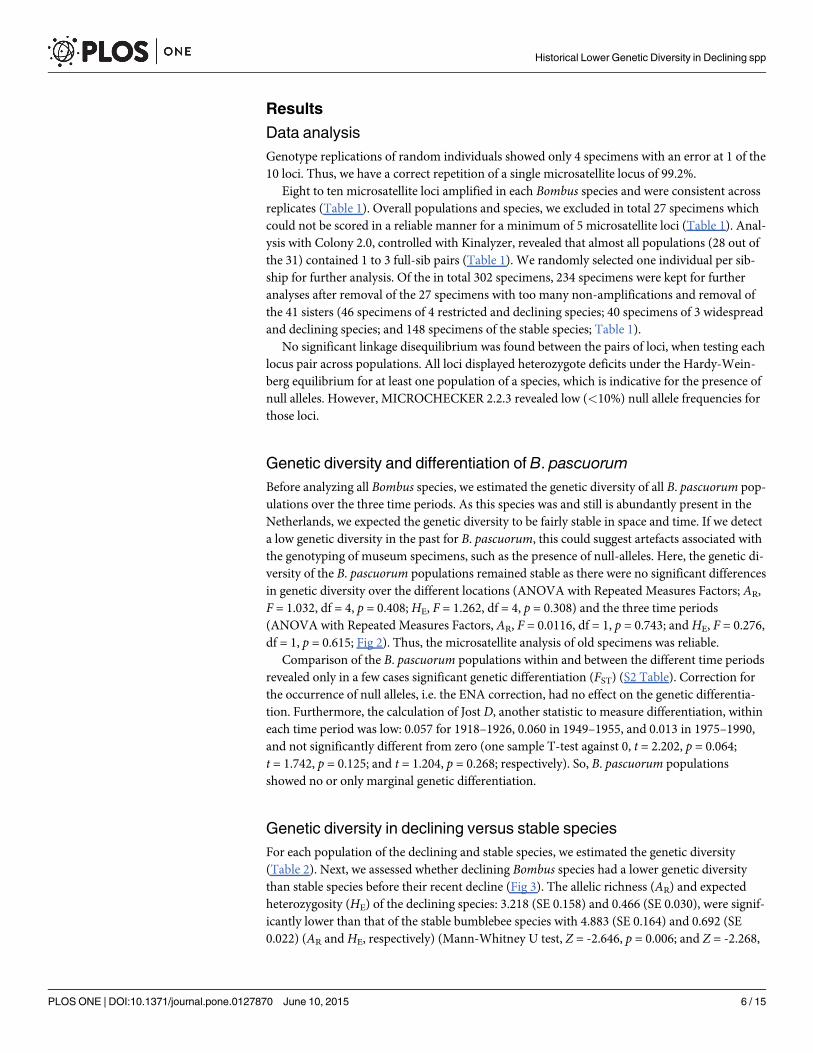
Results
Data analysisGenotype replications of random individuals showed only 4 specimens with an error at 1 of the10 loci. Thus, we have a correct repetition of a single microsatellite locus of 99.2%.
Eight to ten microsatellite loci amplified in each Bombus species and were consistent acrossreplicates (Table 1). Overall populations and species, we excluded in total 27 specimens whichcould not be scored in a reliable manner for a minimum of 5 microsatellite loci (Table 1). Anal-ysis with Colony 2.0, controlled with Kinalyzer, revealed that almost all populations (28 out ofthe 31) contained 1 to 3 full-sib pairs (Table 1). We randomly selected one individual per sib-ship for further analysis. Of the in total 302 specimens, 234 specimens were kept for furtheranalyses after removal of the 27 specimens with too many non-amplifications and removal ofthe 41 sisters (46 specimens of 4 restricted and declining species; 40 specimens of 3 widespreadand declining species; and 148 specimens of the stable species; Table 1).
No significant linkage disequilibrium was found between the pairs of loci, when testing eachlocus pair across populations. All loci displayed heterozygote deficits under the Hardy-Wein-berg equilibrium for at least one population of a species, which is indicative for the presence ofnull alleles. However, MICROCHECKER 2.2.3 revealed low (<10%) null allele frequencies forthose loci.
Genetic diversity and differentiation of B. pascuorumBefore analyzing all Bombus species, we estimated the genetic diversity of all B. pascuorum pop-ulations over the three time periods. As this species was and still is abundantly present in theNetherlands, we expected the genetic diversity to be fairly stable in space and time. If we detecta low genetic diversity in the past for B. pascuorum, this could suggest artefacts associated withthe genotyping of museum specimens, such as the presence of null-alleles. Here, the genetic di-versity of the B. pascuorum populations remained stable as there were no significant differencesin genetic diversity over the different locations (ANOVA with Repeated Measures Factors; AR,F = 1.032, df = 4, p = 0.408; HE, F = 1.262, df = 4, p = 0.308) and the three time periods(ANOVA with Repeated Measures Factors, AR, F = 0.0116, df = 1, p = 0.743; and HE, F = 0.276,df = 1, p = 0.615; Fig 2). Thus, the microsatellite analysis of old specimens was reliable.
Comparison of the B. pascuorum populations within and between the different time periodsrevealed only in a few cases significant genetic differentiation (FST) (S2 Table). Correction forthe occurrence of null alleles, i.e. the ENA correction, had no effect on the genetic differentia-tion. Furthermore, the calculation of Jost D, another statistic to measure differentiation, withineach time period was low: 0.057 for 1918–1926, 0.060 in 1949–1955, and 0.013 in 1975–1990,and not significantly different from zero (one sample T-test against 0, t = 2.202, p = 0.064;t = 1.742, p = 0.125; and t = 1.204, p = 0.268; respectively). So, B. pascuorum populationsshowed no or only marginal genetic differentiation.
Genetic diversity in declining versus stable speciesFor each population of the declining and stable species, we estimated the genetic diversity(Table 2). Next, we assessed whether declining Bombus species had a lower genetic diversitythan stable species before their recent decline (Fig 3). The allelic richness (AR) and expectedheterozygosity (HE) of the declining species: 3.218 (SE 0.158) and 0.466 (SE 0.030), were signif-icantly lower than that of the stable bumblebee species with 4.883 (SE 0.164) and 0.692 (SE0.022) (AR and HE, respectively) (Mann-Whitney U test, Z = -2.646, p = 0.006; and Z = -2.268,
Historical Lower Genetic Diversity in Declining spp
PLOS ONE | DOI:10.1371/journal.pone.0127870 June 10, 2015 6 / 15

p = 0.024; Table 2). Although two declining species (B. ruderatus and B. subterraneus) had acomparable meanHE as some of the stable species (Fig 3).
The lower genetic diversity within the declining species as reported here could be the resultof the smaller distribution range of some species in the declining group. This was not the case.Indeed, when we divided the species declining before 1970s in restricted and widespread spe-cies [22], the result remained the same. The genetic diversity of the widespread/declininggroup was significantly lower than that of the stable species (AR, Z = -2.121, p = 0.034; and HE,Z = -2.121, p = 0.034) and the restricted/declining group was also significantly lower than that
Table 1. Scoring efficiency of the microsatellite loci for eachBombus spp.
PUA PUA PUA PUA PUA PUA PUA PUA PUA PUAGroup Species n NA FS B11 B121 B132 B100 B126 BT11 BL02 BT04 BT08 BT10 L
Widespread / Stable B. hortorum 30 (22) 3 5 0.0 0.0 25.0 0.0 31.3 0.0 70.0 0.0 18.8 0.0 10
B. lapidarius 19 (12) 6 1 0.0 0.0 41.7 41.7 100.0 0.0 58.3 0.0 58.3 0.0 9
B. pratorum 10 (8) 1 1 0.0 0.0 12.5 12.5 12.5 0.0 0.0 25.0 37.5 0.0 10
B. pascuorum 127(106)* 6 15 2.8 0.0 10.4 100.0 1.9 3.8 100.0 14.2 3.8 0.0 8
Restriced / Declining B. humilis 20 (16) 0 4 0.0 0.0 25.0 0.0 31.3 0.0 0.0 0.0 18.8 0.0 10
B. ruderatus 17 (12) 2 3 100.0 0.0 41.7 0.0 0.0 0.0 58.3 41.7 16.7 0.0 9
B.subterraneus
7 (7) 0 0 0.0 0.0 0.0 0.0 0.0 0.0 0.0 100.0 100.0 0.0 8
B. sylvarum 16 (11) 3 2 9.1 0.0 54.5 0.0 54.5 0.0 0.0 0.0 45.5 0.0 10
Widespread /Declining
B. muscorum 20 (15) 3 2 6.7 6.7 46.7 6.7 6.7 0.0 0.0 0.0 33.3 0.0 10
B. ruderarius 28 (18) 3 7 61.1 0.0 27.8 0.0 0.0 0.0 0.0 0.0 27.8 27.8 10
B. veteranus 8 (7) 0 1 0.0 0.0 14.3 0.0 14.3 0.0 14.3 0.0 14.3 0.0 10
TOTAL 302(234)* 27 41 9.5
With n = the number of workers and between brackets the number of workers used in all further analysis, NA = the number of specimens that were not
amplifiable, FS = the number of full sibs, and PUA = the proportion of unsuccessfully amplified individuals per locus (in %). Microsatellite loci not used for
further analysis are underlined with a full line, loci that were not used in only one population of a certain species are underlined with a dotted line, L = the
number of loci used in further analysis.
* = workers of B. pascuorum from two additional time points: 1942–1960 and 1975–1995.
doi:10.1371/journal.pone.0127870.t001
Fig 2. Genetic diversity of the Bombus pascuorum populations. The mean allelic richness (AR) and expected heterozygosity (HE) averaged across loci(and S.E.) between the B. pascuorum populations over the different locations and the three time periods.
doi:10.1371/journal.pone.0127870.g002
Historical Lower Genetic Diversity in Declining spp
PLOS ONE | DOI:10.1371/journal.pone.0127870 June 10, 2015 7 / 15

of the stable species for AR (Z = -2.309, p = 0.021) and showed the same trend for HE (Z =-1.732, p = 0.083, Fig 3). Both groups of declining species were not different from each other(AR, Z = -0.354, p = 0.857 and HE, Z = -1.414, p = 0.229; Table 2 and Fig 3). This indicates thathistorically declining species already had a lower genetic diversity than bumblebee species withstable populations.
As we arbitrary chose to exclude specimens of which showed non-amplifications for 6loci or more, there are still specimens in our analyses with non-amplifications which couldhave an effect on our results. However; the sensitivity analysis of the calculated mean hetero-zygosity showed that HE was stable over the different exclusion steps (from five non-ampli-cations per specimens allowed in the analyses to only 1 non-amplification per specimens, see
Table 2. Historical genetic diversity within all Bombus species.
AR HE
Species Location Year n Mean SE Mean SE
Widespread / stable
B. hortorum Gelderland 1918 8 5.095 0.826 0.697 0.076
Overijsssel 1918 7 5.490 0.465 0.763 0.034
Z-Holland 1923 7 5.502 0.488 0.778 0.026
B. lapidarius Limburg 1918 5 4.000 1.000 0.553 0.125
Overijssel 1918 7 4.604 0.571 0.710 0.041
B. pratorum Overijssel 1918 8 4.114 0.640 0.604 0.084
B. pascuorum Limburg 1918 9 4.962 0.582 0.694 0.085
N-Holland 1924 9 4.777 0.692 0.702 0.072
Overijssel 1918 8 5.035 0.704 0.685 0.089
Gelderland 1925 7 5.250 0.457 0.733 0.041
Total 75 4.883 0.164 0.692 0.022
Restricted / declining
B. humilis Gelderland 1926 8 2.907 0.455 0.425 0.097
Limburg 1918 8 2.527 0.415 0.366 0.094
B. ruderatus Z-Holland 1923 5 3.571 0.649 0.543 0.103
Overijssel 1918 7 4.044 0.300 0.669 0.031
B. subterraneus Overijssel 1925 7 4.111 0.526 0.625 0.078
B. sylvarum Limburg 1918 6 3.116 0.642 0.451 0.118
Limburg 1920 5 2.778 0.547 0.458 0.101
Subtotal 46 3.293 0.236 0.598 0.042Widespread / declining
B. muscorum Limburg 1918 7 3.222 0.621 0.401 0.112
Overijssel 1918 8 3.750 0.596 0.503 0.099
B. ruderarius Limburg 1918 7 3.519 0.607 0.496 0.112
N-Holland 1924 5 3.167 0.654 0.490 0.104
Overijssel 1918 6 2.184 0.539 0.252 0.103
B. veteranus Limburg 1918 7 2.942 0.574 0.382 0.109
Subtotal 40 3.131 0.222 0.421 0.040Total 86 3.218 0.158 0.466 0.030
Here, we describe the mean values (and SE) of the allelic richness (AR), and the expected heterozygosity (HE) for each Bombus spp. over allmicrosatellite loci and populations within the time period 1918–1926. With n: the number of samples used for this analysis after removal of the
identified sisters.
doi:10.1371/journal.pone.0127870.t002
Historical Lower Genetic Diversity in Declining spp
PLOS ONE | DOI:10.1371/journal.pone.0127870 June 10, 2015 8 / 15

also S3 Table). Most importantly, the significant differences of HE between stable and declin-ing species remained.
Furthermore, within each bumblebee species, a few populations had non-amplifications forall their individuals for one microsatellite loci, which could have an impact on our estimate ofgenetic diversity. To exclude the presence of these effects, we removed the populations whichhad non-amplifications for a certain microsatellite loci and we re-analyzed the genetic diversityof each population with the same 8 microsatellites (B11, B121, B126, B132, BT04, BT08, BT10,and BT11). This analysis showed also no major impact of the non-amplifications on our data-set (S4 Table).
Discussion
Genetic diversity in declining versus stable speciesOur results showed that historical populations of declining bumblebee species had a signifi-cantly lower genetic diversity than found within the historical populations of co-distributedmore stable species (Fig 3). In studies with recent specimens, this lower genetic diversity in de-clining bumblebee species is sometimes explained as a reduction in genetic diversity in re-sponse to environmental drivers (e.g. [17–18]). However, this latter hypothesis was formulatedwithout having any information on the genetic diversity present within the populations ofthese bumblebee species before their major declines [17–18]. Interestingly, our results were ob-tained with museum specimens of nine decades ago, that is two to three decades before the de-clines of most bumblebees started. As reported for Belgium [7–8] and for the Netherlands andBritain [6] and reviewed in [18], general drivers like the reduction in floral resources by agricul-tural intensification started around 1950. Thus here, the observed difference in genetic varia-tion between declining and stable bumblebee species was not due to a recent reduction ingenetic diversity but was already present in the years 1918–1926. This result is relevant for theinterpretation of other studies which solely used recent specimens to assess genetic diversity[15–19].
Fig 3. Historical genetic diversity of declining versus stable bumblebee species.Comparison of the mean allelic richness (AR) and expectedheterozygosity (HE) averaged across loci between the populations of the declining and more stable Bombus species within the time period 1918–1926. Withindication of the significance level, * = P < 0.05
doi:10.1371/journal.pone.0127870.g003
Historical Lower Genetic Diversity in Declining spp
PLOS ONE | DOI:10.1371/journal.pone.0127870 June 10, 2015 9 / 15

Genetic diversity and rarityOur results showed that declining bumblebee species had lower levels of genetic diversity thanstable species. One possible explanation for the lower genetic diversity of the declining speciesin the early 20th century could be a lower abundance of these species in this time period. In-deed, small bumblebee populations can have a reduced genetic diversity as a result of higher ge-netic drift [11,13]. However, there are indications that rarity alone cannot totally explain theobserved low genetic diversity of the declining species: (i) some declining species were presentin the collection with a magnitude comparable to some of the stable species between the years1900–1940. However, this method is not fully reliable as it has caveats, e.g. collector biases andpreference for collecting rare species over common ones [20]. (ii) by referring to historical pub-lications or expert judgement indicating a fairly common status. No historical information ofthe Netherlands is present but some of these declining species were reported as abundant inBelgium [44–45]. For example: B. veteranus (then called B. equestris) ranked with second low-est allelic richness (2.942) was described as “fairly common” in Belgium [44–45]. However, asboth indications have their own drawbacks, rarity is still a valid explanation of the low geneticdiversity observed in the declining species. There are also some other possible explanations ofthe low genetic diversity in the declining bumblebees: (i) having small effective populationsizes could be an intrinsic characteristic of those species. If this would be the case it makesthose species originally more vulnerable for the major drivers of bumblebee decline; (ii) the ge-netic diversity in the populations of the declining species could be altered due to habitat frag-mentation or population isolation events before the dates used in this study (1918–1926).Therefore we could search for a genetic bottleneck. However, the use of bottleneck tests forhaplodiploid species is somewhat dubious, as there are many violations of the model assump-tions certainly when the power is low due to low samples size [46]. So, we cannot exclude thatthe declining species had undergone a historical decline before 1918–1926. Thus, for now isnot known what the cause of the observed differences in genetic diversity is. Further research isneeded to investigate the causes of the reduced genetic diversity in the declined bumblebee spe-cies and thus to be able to distinguish between historical and the more contemporary causes.
Historical versus recent level of genetic variationBy comparing the levels of genetic variability among populations before a genetic bottleneckwith those found in current populations, one will be able to determine if the observed lower ge-netic variation is a consequence of recent population declines, or an ancestral state [20–21]. In-deed, Bouzat et al. [47] showed a human-induced decrease in genetic diversity over time due toa decrease in allel number between historical and recent populations. However, other studiesclearly showed that genetic diversity remains stable despite declines in population size [20,48–50]. We compared the genetic diversity of the declining and stable bumblebee species from ourstudy also with the available data on genetic diversity from the literature (S5 Table). Although,we should compare the genetic diversity of historical populations with recent populations ofthe same species from the same location, this alternative comparison also indicates that the ge-netic diversity between historical and recent populations of stable and declining species re-mained fairly stable over the time (Fig 4). Only by contrasting past and recent genetic diversity,one could obtain estimates of the magnitude of the drivers on population sizes and the levels ofgene flow between these populations. This could then be used for genetically monitoring popu-lations for conservation and management [20,51]. Furthermore, as genetic variation is the rawmaterial required for future adaptive potential, comparing genetic diversity levels betweenBombus species may help to detect populations at risk of decline.
Historical Lower Genetic Diversity in Declining spp
PLOS ONE | DOI:10.1371/journal.pone.0127870 June 10, 2015 10 / 15

ConservationOur results have strong implications for conservation strategies. Determination of the geneticdiversity of bumblebees can reveal which species are more vulnerable to local extinction inthe longer term. Indeed, our study shows that all bumblebee species with a low genetic diver-sity and thus predicted to be vulnerable to decline, suffered more severe declines than theother species. However, it should be remarked that knowing the genetic diversity will not al-ways identify which population is threatened. Indeed, two declining species showed similarlevels of expected heterozygosity but had stronger declines than stable species with similarlevels of heterozygosity (Fig 3). Thus, clearly also other factors than genetic diversity can playa role in the observed bumblebee declines. However and in general, these results suggest thatdetermination of the genetic diversity is still a very good tool to predict bumblebee decline.Indeed, all five species with historically low genetic diversity levels (HE lower than 0.550 anda AR lower than 3.5) have subsequently suffered strong declines in their distribution. Hence,as bumblebee populations with high genetic diversity may be less likely to decline or to go lo-cally extinct, improving the genetic diversity of the populations of restricted bumblebee spe-cies is a valuable strategy.
Being able to directly measure the genetic diversity from historical bumblebee popula-tions allows for a better estimation of historical effective population sizes, levels of gene flow,and the relatedness between populations [20–21]. As the estimations of these population pa-rameters are performed before the major (human) perturbations caused in the last decades,they are essential for making realistic conservation plans [20–21]. Furthermore, includinghistorical data into conservation genetics could also help to put conservation goals into per-spective [20–21]. Indeed, it could give an idea of a certain population size goal in the absenceof recent scientific evidence. Such a clear framework of reference should be provide to avoidthe dominance of more economic and politic reasons within conservation plans [21]. Indeed,several studies using historical specimens to estimate the effective population size showedthat including historical samples can prevent us from reaching misleading conclusions[47,52–55].
Fig 4. Historic versus recent genetic diversity of declining and stable bumblebee species.Comparison of the genetic diversity as the mean allelicrichness (AR) and the expected heterozygosity (HE) averaged across loci (± S.D.) between the historical and recent data of a) the declining and b) the morestable bumblebee spp., with data from our project and from the literature [13,24–30]. See also S5 Table for referees and genetic parameters ofthese populations.
doi:10.1371/journal.pone.0127870.g004
Historical Lower Genetic Diversity in Declining spp
PLOS ONE | DOI:10.1371/journal.pone.0127870 June 10, 2015 11 / 15
In conclusion, our results demonstrate that species with a lower genetic diversity are theones that are currently endangered. However, species with a high genetic diversity could still beat risk for extinction. Indeed, the more stable species also underwent distribution declines butnot as severe as the declining group. So, to preserve bumblebee diversity one must tackle alsothe current drivers of bumblebee decline, to ensure that these low and even high genetic diver-sity species will not go extinct. It is therefore recommended that conservation strategies createmore suitable habitat for sustaining bumblebee populations.
Supporting InformationS1 Table. Distribution, trend of decline and red list status of the different Bombus spp. Inthis table we presented, the distribution before and after 1970, trend of decline and red list sta-tus of the different Bombus spp. following Peeters and Reemer [1]. Species distribution is calcu-lated as the relative areal size = (amount of hour blocks a species is found / the total amount ofhour blocks checked) � 100%, with an hour block = 5 x 5 km square. The decline in distributionor trend is calculated by Peeters and Reemer [1] as: (the relative areal size of after 1970—rela-tive areal size before 1970) / relative areal size before 1970 � 100%).(PDF)
S2 Table. Population structuring of the B. pascuorum populations. Pairwise FST (with ENAcorrection) for the different populations of B. pascuorum under the diagonal and the harmonicmean of Dest across loci above the diagonal, a) between locations within a time period, and b)within a location between time periods. With indication of the significance level, �� =P< 0.001 and � = P< 0.005.(PDF)
S3 Table. Sensitivity analysis of genetic diversity. After removal of identified sisters, we con-ducted a sensitivity analysis of the calculated mean expected heterozygosity (HE) for each pop-ulation of the different Bombus spp. in the time period 1918–1926, based on more stringentexclusion policies for missing data. From a maximum of 5 microsatellite loci with missing val-ues within one specimen towards only one locus with missing data. With n = the total numberof workers in each exclusion step and � = too low number of specimens.(PDF)
S4 Table. Estimation of genetic diversity after extra data exclusion steps. Recalculations ofthe genetic diversity were performed after removal of three species (B. subterraneus, B. rudera-tus and B. lapidarius) and populations with non-amplifications and based on the same 8 micro-satellite loci in each species.(PDF)
S5 Table. Comparison of the genetic diversity in historical and recent populations of de-clining and more stable bumblebee species. The data was obtained from our study and fromthe available data on recent populations found in the literature. With time periods: ‘historical’= 1895–1930; and ‘recent ‘ = 1975–2010’.(PDF)
AcknowledgmentsWe thank F.A.A. Bakker, the collection manager Hymenoptera of the Naturalis BiodiversityCentre (NCB) in Leiden, for the assistance collecting the specimens. We also thank four anony-mous reviewers for their helpful comments and suggestions.
Historical Lower Genetic Diversity in Declining spp
PLOS ONE | DOI:10.1371/journal.pone.0127870 June 10, 2015 12 / 15

Author ContributionsConceived and designed the experiments: KM IM KB GS. Performed the experiments: KM IMMG. Analyzed the data: KM IM. Contributed reagents/materials/analysis tools: KM TDM KB.Wrote the paper: KM IM KB GS.
References1. Potts SG, Biesmeijer JC, Kremen C, Neumann P, Schweiger O, KuninWE. Global pollinator declines:
trends, impacts and drivers. Trends Ecol. 2010; 25: 345–353. doi: 10.1016/j.tree.2010.01.007 PMID:20188434
2. Williams PH, Osborne JL. Bumblebee vulnerability and conservation world-wide. Apidologie. 2009; 40:367–387. doi: 10.1051/apido/20009025
3. Cameron SA, Lozier JD, Strange JP, Koch JB, Cordes N, Solter LF, et al. Patterns of widespread de-cline in North American bumble bees. Proc Natl Acad Sci USA. 2011; 18: 662–667. doi: 10.1073/pnas.1014743108
4. Carvalheiro LG, KuninWE, Keil P, Aguirre-Gutiérrez J, Ellis WN, Fox R, et al. Species richness de-clines and biotic homogenization have slowed down for NW-European pollinators and plants. Ecol Lett.2013; 16: 870–878. doi: 10.1111/ele.12121 PMID: 23692632
5. Vanbergen AJ, the Insect Pollinators Initiative. Threats to an ecosystem service: pressures on pollina-tors. Front Ecol Environ. 2013; Available: doi: 10.1890/120126 PMID: 24891843
6. Biesmeijer JC, Roberts SPM, Reemer M, Ohlemüller R, Edwards M, Peeters T, et al. Parallel declinesin pollinators and insect-pollinated plants in Britain and the Netherlands. Science. 2006; 313: 351–354.doi: 10.1126/science.1127863 PMID: 16857940
7. Rasmont P, Mersch P. Premiere estimation de la dérive faunique chez les bourdons de la Belgique (Hy-menoptera, Apidae). Annls Soc R Zool Belg. 1988; 118: 141–147.
8. Rasmont P, Leclercq J, Jacob-Remacle A, Pauly A, Gaspar C. The faunistic drift of Apoidea in Belgium.Commission of the European Communities, Brussels, 237 pp.
9. Goulson D, Osborne JL. Foraging Economics. In Goulson D, editor. Bumblebees: Behaviour, Ecologyand conservation. Oxford University Press; 2010. pp. 96.
10. Spielman D, Brook BW, FrankhamR. Most species are not driven to extinction before genetic factorsimpact them. Proc Natl Acad Sci USA. 2004; 101: 15261–15264. doi: 10.1073/pnas.0403809101PMID: 15477597
11. FrankhamR. Genetics and extinction. Biol Cons. 2005; 126: 131–140. doi: 10.1016/j.biocon.2005.05.002
12. Whithorn PR, Tinsley MC, BrownMJF, Darvill B, Goulson D. Genetic diversity, parasite prevalence andimmunity in wild bumblebees. Proc R Soc B. 2011; 278: 1195–1202. doi: 10.1098/rspb.2010.1550PMID: 20926436
13. Zayed A. Bee genetics and conservation. Apidologie. 2009; 40: 237–262. doi: 10.1051/apido/2009026
14. Reed DH, Frankham R. Correlation between fitness and genetic diversity. Conserv Biol. 2003; 17:230–237. doi: 10.1046/j.1523-1739.2003.01236.x
15. Darvill B, Ellis JS, Goulson D. Population structure and inbreeding in a rare and declining bumblebee,Bombus muscorum (Hymenoptera: Apidae). Mol Ecol. 2006; 15: 601–611. doi: 10.1111/j.1365-294X.2006.02797.x PMID: 16499688
16. Ellis JS, Knight ME, Darvill B, Goulson D Extremely low effective population sizes, genetic structuringand reduced genetic diversity in a threatened bumblebee species, Bombus sylvarum (Hymenoptera:Apidae). Mol Ecol. 2006; 15: 4375–4386. doi: 10.1111/j.1365-294X.2006.03121.x PMID: 17107471
17. Charman TG, Sears J, Green RE, Bourke AFG. Conservation genetics, foraging distance and nest den-sity of the scarce Great Yellow Bumblebee (Bombus distinguendus). Mol Ecol. 2010; 19: 2661–2674.doi: 10.1111/j.1365-294X.2010.04697.x PMID: 20561194
18. Goulson D, Lye GC, Darvill B. Decline and conservation of bumble bees. Annu Rev Entomol. 2008; 53:191–208. doi: 10.1146/annurev.ento.53.103106.093454 PMID: 17803456
19. Lozier JD, Strange JP, Stewart IJ, Cameron SA Patterns of range-wide genetic variation in six NorthAmerican bumble bee (Apidae: Bombus) species. Mol Ecol. 2011; 20: 4870–4888. doi: 10.1111/j.1365-294X.2011.05314.x PMID: 22035452
20. Wandeler P, Hoeck PEA, Keller LF. Back to the future: museum specimens in population genetics.Trends Ecol Evol. 2007; 22: 634–642. doi: 10.1016/j.tree.2007.08.017 PMID: 17988758
21. Leonard JA. Ancient DNA applications for wildlife conservation. Mol Ecol. 2008; 17: 4189–4196.
Historical Lower Genetic Diversity in Declining spp
PLOS ONE | DOI:10.1371/journal.pone.0127870 June 10, 2015 13 / 15
22. Peeters TMJ, Reemer M. Bedreigde en verdwenen bijen in Nederland (Apidae S.L.): Basisrapport metvoorstel voor de Rode Lijst. Stichting European Invertebrate Survey, The Netherlands, 2003. Available:http://www.repository.naturalis.nl/document/46554
23. Darvill B, O’Connor S, Lye GC, Lepais O, Goulson D. Cryptic differences in dispersal lead to differentialsensitivity to habitat fragmentation in two bumblebee species. Mol Ecol. 2010; 19: 53–63. doi: 10.1111/j.1365-294X.2009.04423.x PMID: 20002583
24. Connop S, Hill T, Steer J, Shaw P. Microsatellite analysis reveals the spatial dynamics of Bombushumilis and Bombus sylvarum. Insect Conserv Diver. 2010; 143: 2739–2746. doi: 10.1111/j.1752-4598.2010.00116.x
25. Goulson D, Kaden JC, Lepais O, Lye GC, Darvill B. Population structure, dispersal and colonization his-tory of the garden bumblebee Bombus hortorum in the Western Isles of Scotland. Conserv Genet.2011; 12: 867–879. doi: 10.1007/s10592-011-0190-4
26. Kraus FB, Wolf S, Moritz RFA. Male flight distance and population substructure in the bumblebee Bom-bus terrestris. J Anim Ecol. 2009; 78: 247–252. doi: 10.1111/j.1365-2656.2008.01479.x PMID:19120605
27. Kraus FB, Szentgyörgyi H, Rozej E, Rhode M, Moron D, Woyciechowski M, et al. Greenhouse bumble-bees (Bombus terrestris) spread their genes into the wild. Conserv Genet. 2011; 12: 187–192. doi: 10.1007/s10592-010-0313-7
28. Maebe K, Meeus I, Maharramov J, Grootaert P, Michez D, Rasmont P, et al. Microsatellite analysis inmuseum samples reveals inbreeding before the regression of Bombus veteranus. Apidologie. 2013;44: 188–197. doi: 10.1007/s13592-012-0170-9
29. Schmid-Hempel P, Schmid-Hempel R, Brunner PC, Seeman OD, Allen GR. Invasion success of thebumblebee, Bombus terrestris, despite a drastic genetic bottleneck. Heredity. 2007; 99: 414–422. doi:10.1038/sj.hdy.6801017 PMID: 17551520
30. Estoup A, Solignac M, Harry M, Cornuet J-M. Characterization of (GT)n and (CT)n microsatellites intwo insect species Apis mellifera and Bombus terrestris. Nucleic Acids Res. 1993; 21: 1427–1431. doi:10.1093/nar/21.6.1427 PMID: 8464734
31. Reber-Funk C, Schmidt-Hempel R, Schmid-Hempel P. Microsatellite loci for Bombus spp. Mol EcolNotes. 2006; 6: 83–86. doi: 10.1111/j.1471-8286.2005.01147.x
32. Wang JL. Sibship reconstruction from genetic data with typing errors. Genetics. 2004; 166: 1963–1979.doi: 10.1534/genetics.166.4.1963 PMID: 15126412
33. Ashley MV, Berger-Wolf TY, Caballero IC, ChaovalitwongseW, Das Gupta B, Sheikh SI. Full siblingsreconstruction in wild populations frommicrosatellite genetic markers. In: Computational Biology: NewResearch. Nova, 2008.
34. Ashley MV, Caballero IC, ChaovalitwongseW, Das Gupta B, Govindan P, Sheikh SI, et al. Kinalyzer, acomputer program for reconstructing sibling groups. Mol Ecol Resour. 2009; 9: 1127–1131. doi: 10.1111/j.1755-0998.2009.02562.x PMID: 21564851
35. Goudet J. Fstat: a program to estimate and test gene diversities and fixation indices (version 2.9.3). Up-dated from Goudet, J (1995): Fstat (version 1.2): a computer program to calculate F-statistics. J Hered.2001; 86: 485–486.
36. Peakall R, Smouse F. GENALEX 6: Genetic Analysis in Excel. Population Genetic Software for Teach-ing and Research. Australian National University, Canberra, Australia, 2006.
37. Van Oosterhout C, HutchinsonWF, Wills DPM, Shipley P. MICROCHECKER: software for identifyingand correcting genotyping errors. Mol Ecol Notes. 2004; 4: 535–538. doi: 10.1111/j.1471-8286.2004.00684.x
38. Nei M. Estimation of average heterozygosity and genetic distance from a small number of individuals.Genetics. 1978; 89: 583–590. PMID: 17248844
39. Chapuis M-P, Lecoq M, Michalakis Y, Loiseau A, Sword GA, Piry S, et al. Do outbreaks affect geneticpopulation structure? A worldwide survey in Locusta migratoria, a pest plagued by microsatellite null al-leles. Mol Ecol. 2008; 17: 3640–3653. doi: 10.1111/j.1365-294X.2008.03869.x PMID: 18643881
40. Kalinowski ST. HP-RARE 1.0: a computer program for performing rarefaction on measures of allelicrichness. Mol Ecol Notes. 2005; 5: 187–189. doi: 10.1111/j.1471-8286.2004.00845.x
41. Chapuis M-P, Estoup A. Microsatellite null alleles and estimation of population differentiation. Mol BiolEvol. 2007; 24: 621–631. doi: 10.1093/molbev/msl191 PMID: 17150975
42. Jost L. G(ST) and its relatives do not measure differentiation. Mol Ecol. 2008; 17: 4015–4026. doi: 10.1111/j.1365-294X.2008.03887.x PMID: 19238703
43. Crawford NG. SMOGD: software for the measurement of genetic diversity. Mol Ecol Resour. 2010; 10:556–557. doi: 10.1111/j.1755-0998.2009.02801.x PMID: 21565057
Historical Lower Genetic Diversity in Declining spp
PLOS ONE | DOI:10.1371/journal.pone.0127870 June 10, 2015 14 / 15

44. Ball JF. Les bourdons de la Belgique. Ann Soc Entomol Belg. 1914; 58: 77–108. Available: http://www.atlashymenoptera.net/biblio/Ball_1914_Bourdons_Belgique_full.pdf
45. Ball JF. Notes supplémentaires sur les bourdons de la Belgique. Ann Soc Entomol Belg. 1920; 60: 31–43. Available: http://www.atlashymenoptera.net/biblio/Ball_1920_Bourdons_Belgique_full.pdf
46. Peery MZ, Kirby R, Reid BN, Stoelting R, Doucet-Bëer E, Robinson S, et al. Reliability of genetic bottle-neck tests for detecting recent populations declines. Mol Ecol. 2012; 21: 3403–3418. doi: 10.1111/j.1365-294X.2012.05635.x PMID: 22646281
47. Bouzat JL, Lewin HA, Paige KN. The ghost of genetic diversity past: historical DNA analysis of thegreater prairie chicken. Am Nat. 1998; 152: 1–6. doi: 10.1086/286145 PMID: 18811397
48. Ruzzante DE, Taggart CT, Doyle RW, Cook D. Stability in the historical pattern of genetic structure ofNewfoundland cod (Gadus morhua) despite the catastrophic decline in population size from 1964 to1994. Conserv Genet. 2001; 2: 257–269.
49. Brown JW, van Coeverden de Groot PJ, Birt TP, Seutin G, Boag PT, Friesen VL. Appraisal of the con-sequences of the DDTinduced bottleneck on the level and geographic distribution of neutral geneticvariation in Canadian peregrine falcons, Falco peregrinus. Mol Ecol. 2007; 16: 327–343. PMID:17217348
50. Pertoldi C, Hansen MM, Loeschcke V, Madsen AB, Jacobsen L, Baagoe H. Genetic consequences ofpopulation decline in the European otter (Lutra lutra): an assessment of microsatellite DNA variation inDanish otters from 1883 to 1993. Proc R Soc Lond B Biol Sci. 2001; 268: 1775–1781.
51. Schwartz MK, Luikart G, Waples RS. Genetic monitoring as a promising tool for conservation and man-agement. Trends Ecol Evol. 2007; 22(1): 25–33. PMID: 16962204
52. Hansen MM, Ruzzante DE, Nielsen EE, Bekkevold D, Mensberg KL. Long-term effective populationsizes, temporal stability of genetic composition and potential for local adaptation in anadromous browntrout (Salmo trutta) populations. Mol Ecol. 2002; 11: 2523–2535. PMID: 12453237
53. Heath DD, Busch C, Kelly J, Atagi DY. Temporal change in genetic structure and effective populationsize in steelhead trout (Oncorhynchus mykiss). Mol. Ecol. 2002; 11: 197–214. PMID: 11856422
54. Miller CR, Waits LP. The history of effective population size and genetic diversity in the Yellowstonegrizzly (Ursus arctos): Implications for conservation. Proc Natl Acad Sci USA. 2003; 100: 4334–4339.PMID: 12655042
55. Hoffman EA, Schueler FW, Blouin MS. Effective population sizes and temporal stability of genetic struc-ture in Rana pipiens, the northern leopard frog. Evolution Int J Org Evolution. 2004; 58: 2536–2545.
56. Rasmont P, Iserbyt I. Atlas of the European Bees: genus Bombus. STEP Project, Atlas Hymenoptera,Mons, Gembloux. 2010. Available: http://www.zoologie.umh.ac.be//hymenoptera/page.asp?ID=169.Accessed 10 December 2012.
Historical Lower Genetic Diversity in Declining spp
PLOS ONE | DOI:10.1371/journal.pone.0127870 June 10, 2015 15 / 15
Copyright © 2022 FDOKUMEN