Loneliness within a nomological net: An evolutionary perspective
http://psp.sagepub.com/Bulletin
Personality and Social Psychology
http://psp.sagepub.com/content/41/1/78The online version of this article can be found at:
DOI: 10.1177/0146167214557007
2015 41: 78 originally published online 24 November 2014Pers Soc Psychol BullD. Matthew T. Clark, Natalie J. Loxton and Stephanie J. Tobin
Declining Loneliness Over Time: Evidence From American Colleges and High Schools
Published by:
http://www.sagepublications.com
On behalf of:
Society for Personality and Social Psychology
can be found at:Personality and Social Psychology BulletinAdditional services and information for
http://psp.sagepub.com/cgi/alertsEmail Alerts:
http://psp.sagepub.com/subscriptionsSubscriptions:
http://www.sagepub.com/journalsReprints.navReprints:
http://www.sagepub.com/journalsPermissions.navPermissions:
What is This?
- Nov 24, 2014OnlineFirst Version of Record
- Dec 9, 2014Version of Record >>
by guest on December 9, 2014psp.sagepub.comDownloaded from by guest on December 9, 2014psp.sagepub.comDownloaded from
Personality and SocialPsychology Bulletin2015, Vol. 41(1) 78 –89© 2014 by the Society for Personalityand Social Psychology, IncReprints and permissions: sagepub.com/journalsPermissions.navDOI: 10.1177/0146167214557007pspb.sagepub.com
Article
557007 PSPXXX10.1177/0146167214557007Personality and Social Psychology BulletinClark et al.research-article2014
People need to connect with others (Baumeister & Leary, 1995), and failing to satisfy this need causes loneliness, which correlates with poor sleep quality (Cacioppo & Patrick, 2008), poor immune function (Pressman et al., 2005), higher stress hormones (Kiecolt-Glaser et al., 1984), and dysregulation of the body’s inflammatory system (Hackett, Hamer, Endrighi, Brydon, & Steptoe, 2012). A widespread opinion is that modern society is increasingly lonely. Authors of news articles declare that “we have never been more detached from one another, or lonelier” (Marche, 2012, para. 3), and the title of an article in The New York Times states, “The Lonely American Just Got a Bit Lonelier” (Fountain, 2006). These articles are based on research that demonstrates declining social engagement; in comparison with decades past, people are less likely to join clubs, have fewer confidants, and are less likely to perceive others as trustworthy (McPherson, Smith-Lovin, & Brashears, 2006; Putnam, 2000). Social engagement through the internet, however, could be replacing traditional forms of sociability (Deters & Mehl, 2013), and some suggest the evidence of social decline is based on flawed indicators (Fischer, 2011). These uncertainties suggest that although sociability patterns have changed, the need to belong may still be satisfied. The purpose of this article is to examine changes in loneliness over time.
Changes in Sociability
Several societal trends suggest loneliness is increasing. Americans have become less likely in recent decades to join clubs, vote, have dinner with friends, and go on picnics (Putnam, 2000). Since the 1970s, Americans’ trust in indi-viduals has declined (Paxton, 1999). Americans reported declines in their number of confidants. In 1985, 10% of peo-ple reported they discuss important matters with no one; in 2004, 25% reported the same (McPherson et al., 2006). Evidence supporting declines in sociability has been criti-cized because it often relies on single items, which Fischer (2011) described as “partial, confounded, and idiosyncratic” (p. 11). Researchers question findings that suggest Americans have fewer people with whom to discuss important matters because participants may interpret the term “important mat-ters” differently. Approximately half of participants who report they do not talk to anyone about important matters also report that in the past 6 months, they had nothing
1The University of Queensland, Brisbane, Australia
Corresponding Author:D. Matthew T. Clark, School of Psychology, University of Queensland, Brisbane, St Lucia, Queensland 4072, Australia. Email: [email protected]
Declining Loneliness Over Time: Evidence From American Colleges and High Schools
D. Matthew T. Clark1, Natalie J. Loxton1, and Stephanie J. Tobin1
AbstractWe examined changes in loneliness over time. Study 1 was a cross-temporal meta-analysis of 48 samples of American college students who completed the Revised UCLA Loneliness Scale (total N = 13,041). In Study 1, loneliness declined from 1978 to 2009 (d = −0.26). Study 2 used a representative sample of high school students from the Monitoring the Future project (total N = 385,153). In Study 2, loneliness declined from 1991 to 2012. Declines were similar among White students (d = −0.14), Black students (d = −0.17), male students (d = −0.11), and female students (d = −0.11). Different loneliness factors showed diverging trends. Subjective isolation declined (d = −0.20), whereas social network isolation increased (d = 0.06). We discuss the declines in loneliness within the context of other cultural changes, including changes to group membership and personality.
Keywordsloneliness, sociability, society, meta-analysis
Received February 14, 2014; revision accepted September 30, 2014
by guest on December 9, 2014psp.sagepub.comDownloaded from
Clark et al. 79
important about which to talk (Bearman & Parigi, 2004). Similar problems emerge in other measures of social net-works. People interpret “friends” and “close friends” differ-ently, and if a previous survey question was taxing, participants may reduce efforts to recall the extent of social networks for subsequent questions (Fischer, 2011).
A limitation of examining only objective indicators of social engagement is that subjective feelings of loneliness may not match objective isolation. Health outcomes relate more consistently with subjective feelings of loneliness than with objective indicators (Cacioppo & Patrick, 2008). In one study, both subjective ratings of loneliness and objective rat-ings of social network size predicted immune response to vaccination independently (Pressman et al., 2005), and another study found that quality rather than frequency of social interactions was more important to physical and psy-chological health outcomes (Reis, Wheeler, Kernis, Spiegel, & Nezlek, 1985). Although some forms of sociability have decreased, others forms may have increased (Paxton, 1999). One opportunity for increased sociability is the internet. Online groups help people with marginalized identities (e.g., gay or lesbian) accept their identities, reducing loneliness (McKenna & Bargh, 1998). Posting on social networking sites decreases feelings of loneliness (Deters & Mehl, 2013). The internet, however, may impede social connection. Self-disclosure on the internet elicits more negative reactions from others than similar self-disclosure in person (Forest & Wood, 2012), and social media may provide an avenue for people to be ignored, lowering perceptions of belonging (Tobin, Vanman, Verreynne, & Saeri, 2014).
Loneliness correlates with individual difference variables that have been changing over time. Loneliness correlates with lower extraversion and self-esteem (Civitci & Civitci, 2009; Saklofske & Yackulic, 1989), and extraversion and self-esteem have increased over time (Twenge, 2001; Twenge & Campbell, 2001), suggesting loneliness is decreasing. Loneliness correlates with lower empathy and secure attach-ment (Davis, 1983; DiTommaso, Brannen-McNulty, Ross, & Burgess, 2003), and empathy and secure attachment declined (Konrath, Chopik, Hsing, & O’Brien, 2014; Konrath, O’Brien, & Hsing, 2011), suggesting loneliness is increas-ing. Because these findings do not clearly suggest whether loneliness is increasing or decreasing, a direct examination of loneliness over time is warranted.
Study 1
Study 1 examined changes in loneliness over time using cross-temporal meta-analysis. Cross-temporal meta-analyses allow assessment of mean levels of a construct among people of the same age over successive time periods, allowing analysis of generational differences (Twenge, 2001). This approach has been used to examine changes in empathy, extraversion, and self-esteem (Konrath et al., 2011; Twenge, 2001; Twenge & Campbell, 2001). We examined scores on the Revised UCLA
Loneliness Scale (R-UCLA; Russell, Peplau, & Cutrona, 1980). The R-UCLA demonstrates adequate internal consis-tency (α = .94) and measures loneliness indirectly with items such as “My social relationships are superficial (Russell et al., 1980).” Although many other loneliness scales exist and using multiple scales is preferable, only the R-UCLA has appeared in a sufficient number of studies to offer reliable estimates of loneliness over time. We also examined gender differences in loneliness. In some studies that use the R-UCLA, males scored higher, but in other studies, no gender difference was found (Davis & Kraus, 1989; Lawler-Row, Hyatt-Edwards, Wuensch, & Karremans, 2011; Russell et al., 1980).
Method
Literature search and inclusion criteria. Using Web of Knowl-edge—a comprehensive database containing most journals in the social, behavioral, and medical sciences—we searched for studies that cited the R-UCLA (Russell et al., 1980). We used the following inclusion criteria: (a) studies must have used all 20 items of the R-UCLA; (b) participants must have been American college students from 4-year institutions, excluding 2-year and military colleges; (c) participants must not have been selected for inclusion in the study based on R-UCLA scores; (d) participants must not have been selected based on attributes that predict loneliness, such as shyness, sociability, or being in a romantic relationship; (e) studies must not contain interventions that affected R-UCLA scores; and (f) studies must have provided an overall loneliness mean. When researchers did not report loneliness means, we contacted the authors and requested this information. For longitudinal studies, we used the first loneliness mean.
Scoring. Researchers used a variety of methods to score the R-UCLA. Although the original article used the sum of a 4-point scale (Russell et al., 1980), many researchers used 5- or 7-point scales, averaging or summing to calculate lone-liness. We excluded studies using alternate scorings because scoring can change the results of cross-temporal meta-analy-ses (Gentile, Twenge, & Campbell, 2010).1 When research-ers did not report how they scored the scale and we were able to locate their e-mail addresses, we contacted them for details of their scoring methods. When unable to identify a scoring method, we excluded the study. The final sample included 48 studies of American college students.
Year of collection. We followed procedures of previous cross-temporal meta-analyses to estimate the year of data collec-tion (Konrath et al., 2011). We recorded a collection date if a paper reported the date of data collection or if we were informed of a date during e-mail correspondence. If an arti-cle contained the date the journal received it for review, we subtracted 1 year to obtain an estimate of when data were collected. If there were no other indicators, we used the date of publication minus 2 years.
by guest on December 9, 2014psp.sagepub.comDownloaded from
80 Personality and Social Psychology Bulletin 41(1)
Data analysis strategy. We followed the data analysis strategy of previous cross-temporal meta-analyses (Konrath et al., 2011). We correlated mean loneliness scores with year of data collection. We weighted scores by sample size to pro-duce a better estimate of a population mean. We then calcu-lated the effect size of changes in loneliness by using predicted loneliness scores derived from the following regression equation: y = Bx + c, where B = the unstandard-ized regression coefficient, c = the regression constant, y = the predicted loneliness score, and x = the year. We used this equation to compare predicted loneliness levels in various years to examine magnitude of change. We divided changes in loneliness by the standard deviation to represent the effect size in standard deviation units. We calculated the standard deviations by averaging all the standard deviations reported in the studies. We did not use group-level standard deviations (i.e., variations between studies) because they were consider-ably smaller than individual standard deviations, and researchers typically interpret effects sizes at the individual level (Trzesniewski & Donnellan, 2010; Twenge & Camp-bell, 2010).
Results
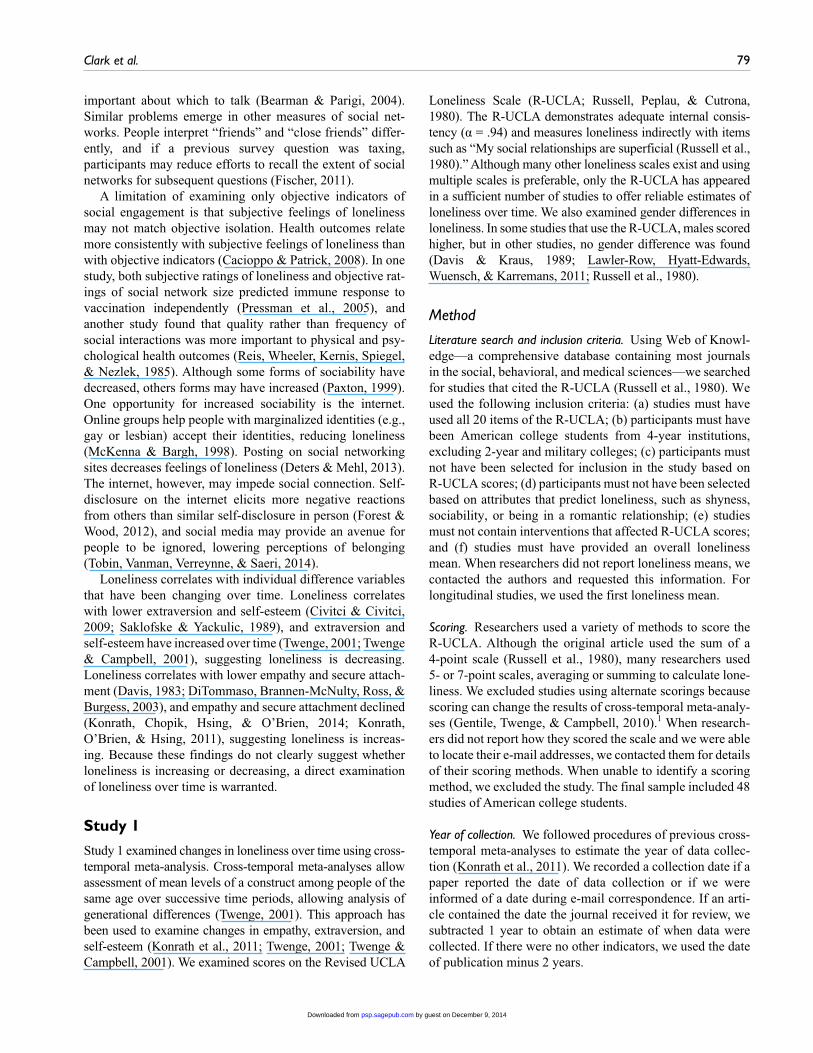
The online supplementary materials contain the loneliness means and citations for each study used in this analysis. We correlated year with loneliness, weighted by sample size. A
decline in loneliness was observed, r(46) = −.30, 95% confi-dence interval (CI) = [−0.54, −0.02], p = .039, k = 48, N = 13,041. Contemporary college students reported lower lone-liness than earlier counterparts did. A scatterplot of loneli-ness means by year is shown in Figure 1, in which two outliers are apparent. The outliers were 4.63 and 3.03 stan-dard deviations above the mean, although both had Mahalanobis distances below 2.50, suggesting they were not multivariate outliers. Removing the outliers increased the effect size, but we focused on conservative estimate and included outliers for all calculations.2 Figure 1 suggested a curvilinear relationship, and to investigate this possibility, we centered and squared the year variable and entered it into a regression with the linear term. The curvilinear trend indi-cated rising loneliness before 1990, and declining loneliness afterwards, but this relationship did not significantly predict loneliness, β = −.26, t = −1.91, p = .063, k = 48, N = 13,041.
We calculated effect size by comparing predicted 1978 and 2009 means. We used a regression equation (B = −0.082, constant = 199.989) to calculate means of 37.793 and 35.251 for 1978 and 2009, respectively. We used the average stan-dard deviation of 9.85 to obtain an effect size estimate, d = −0.26, a modest value that was smaller than those reported in other cross-temporal meta-analyses, including empathy (d = −0.65, for the Empathic Concern subscale; d = −0.44, for the Perspective Taking subscale), extraversion (d = 0.80), and self-esteem (d = 0.30; Gentile et al., 2010; Konrath et al.,
Figure 1. Scatterplot of loneliness means by year.Note. Only studies using the original scaling are included. Regression line reflects weighting by n. R-UCLA = Revised UCLA Loneliness Scale.
by guest on December 9, 2014psp.sagepub.comDownloaded from
Clark et al. 81
2011; Twenge, 2001). The change in loneliness over time produced a large 95% CI. The 95% CIs for the regression B weights ranged from −0.160 to −0.004, and the derived d scores ranged from −0.55 to −0.01.
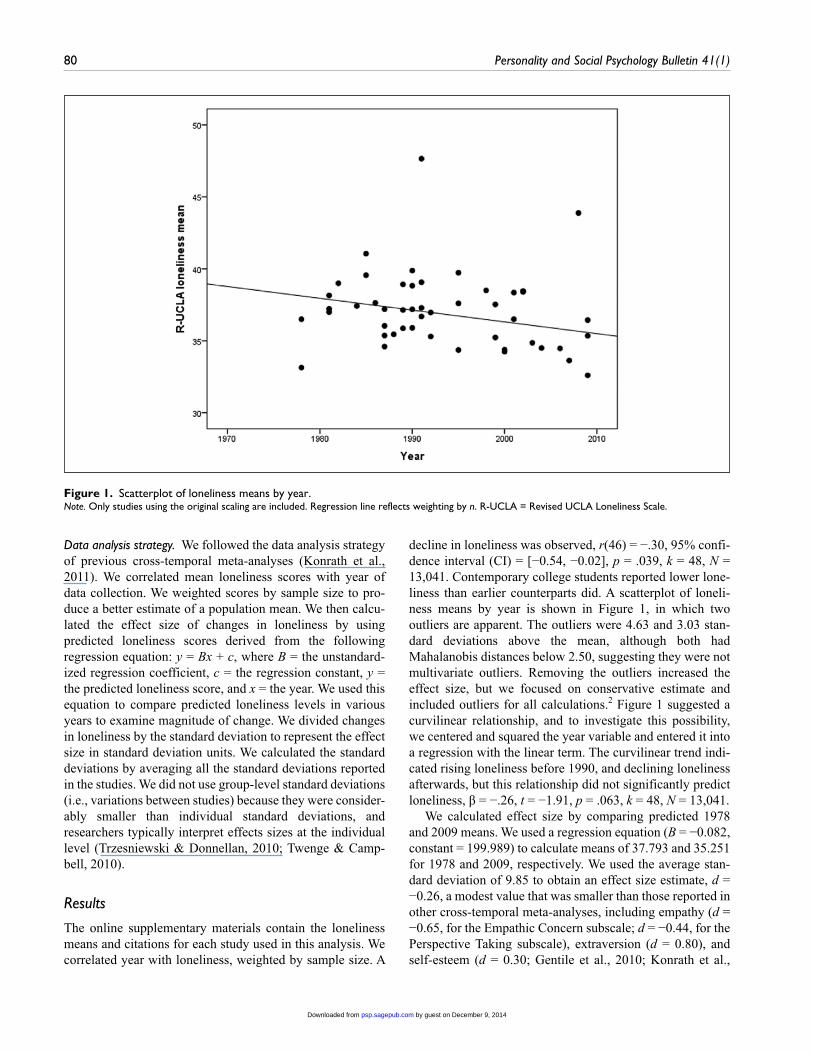
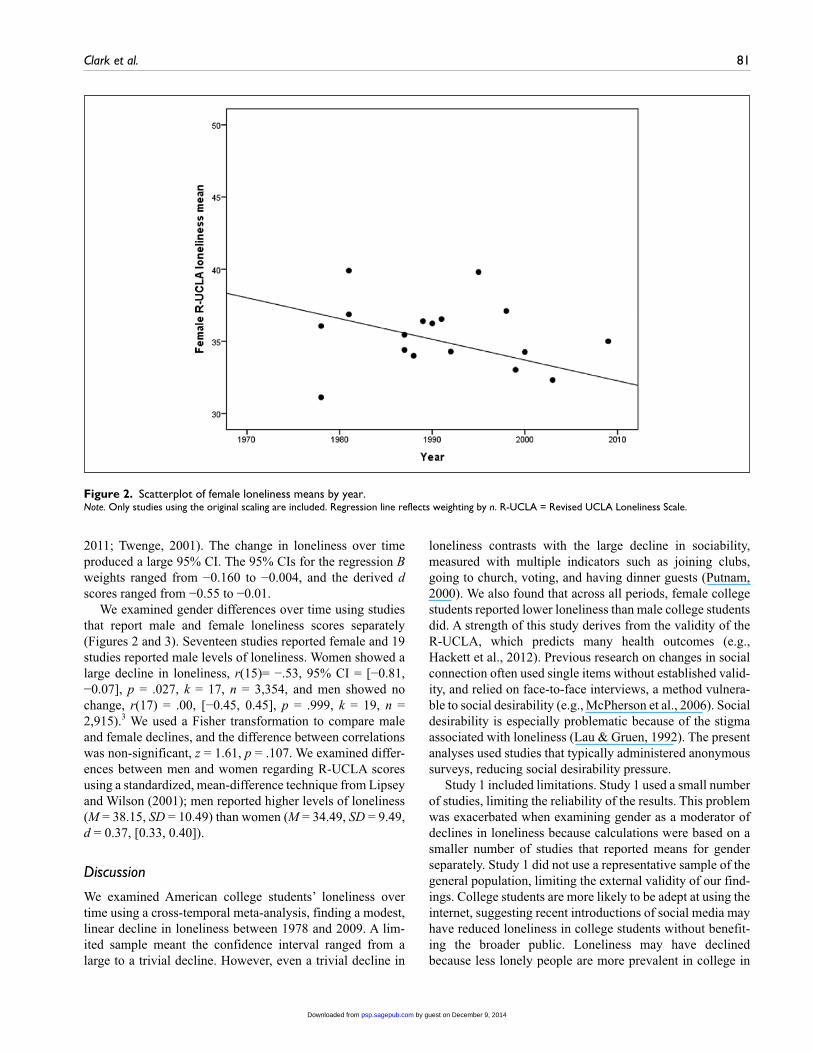
We examined gender differences over time using studies that report male and female loneliness scores separately (Figures 2 and 3). Seventeen studies reported female and 19 studies reported male levels of loneliness. Women showed a large decline in loneliness, r(15)= −.53, 95% CI = [−0.81, −0.07], p = .027, k = 17, n = 3,354, and men showed no change, r(17) = .00, [−0.45, 0.45], p = .999, k = 19, n = 2,915).3 We used a Fisher transformation to compare male and female declines, and the difference between correlations was non-significant, z = 1.61, p = .107. We examined differ-ences between men and women regarding R-UCLA scores using a standardized, mean-difference technique from Lipsey and Wilson (2001); men reported higher levels of loneliness (M = 38.15, SD = 10.49) than women (M = 34.49, SD = 9.49, d = 0.37, [0.33, 0.40]).
Discussion
We examined American college students’ loneliness over time using a cross-temporal meta-analysis, finding a modest, linear decline in loneliness between 1978 and 2009. A lim-ited sample meant the confidence interval ranged from a large to a trivial decline. However, even a trivial decline in
loneliness contrasts with the large decline in sociability, measured with multiple indicators such as joining clubs, going to church, voting, and having dinner guests (Putnam, 2000). We also found that across all periods, female college students reported lower loneliness than male college students did. A strength of this study derives from the validity of the R-UCLA, which predicts many health outcomes (e.g., Hackett et al., 2012). Previous research on changes in social connection often used single items without established valid-ity, and relied on face-to-face interviews, a method vulnera-ble to social desirability (e.g., McPherson et al., 2006). Social desirability is especially problematic because of the stigma associated with loneliness (Lau & Gruen, 1992). The present analyses used studies that typically administered anonymous surveys, reducing social desirability pressure.
Study 1 included limitations. Study 1 used a small number of studies, limiting the reliability of the results. This problem was exacerbated when examining gender as a moderator of declines in loneliness because calculations were based on a smaller number of studies that reported means for gender separately. Study 1 did not use a representative sample of the general population, limiting the external validity of our find-ings. College students are more likely to be adept at using the internet, suggesting recent introductions of social media may have reduced loneliness in college students without benefit-ing the broader public. Loneliness may have declined because less lonely people are more prevalent in college in
Figure 2. Scatterplot of female loneliness means by year.Note. Only studies using the original scaling are included. Regression line reflects weighting by n. R-UCLA = Revised UCLA Loneliness Scale.
by guest on December 9, 2014psp.sagepub.comDownloaded from
82 Personality and Social Psychology Bulletin 41(1)
recent years, resulting from a change in college demograph-ics. The racial composition of American colleges is chang-ing. In 1981, White, non-Hispanic Americans earned 86% of bachelor’s degrees; in 2007, the same group earned 72% of bachelor’s degree (U.S. Census Bureau, 2007). Despite increases in minorities, college students in the United States remain predominantly White, non-Hispanic. Minorities are unlikely to experience lower loneliness than White Americans, driving declines in loneliness. Another demo-graphic change is the increase in women attending college. In 1975, 44% of college degrees were awarded to women; in 2007, 59% of degrees were awarded to women (U.S. Census Bureau, 2010). We found that female college students expe-rienced lower loneliness than male college students did, so increasing numbers of women in college may explain declines in loneliness. However, we also found declines in loneliness in female samples, suggesting increasing the pro-portion of women does not explain fully declines in loneli-ness. Study 1 suggests a decline in loneliness among American college students, but it is unclear whether results generalize beyond this population.
Study 2
Addressing concerns regarding the representativeness of the sample in Study 1, Study 2 used a representative sample of high school students. Unlike college samples, high school
samples have stable gender compositions. Although a high school sample may include other demographic changes (e.g., changes in ethnic composition), such changes reflect demo-graphic changes in America broadly. A representative sample of high school students was available from the Monitoring the Future (MTF) project (Johnston, Bachman, O’Malley, & Schulenberg, 2012b). The project began in 1975, surveying the behaviors, attitudes, and values of Grade 12 American high school students (see http://www.monitoringthefuture.org, for more information). The sample is representative of public- and private-school students in the 48 contiguous states. The MTF project began collecting loneliness data in 1977, and data from Grades 8 and 10 in 1991.
Using data from the MTF project, Trzesniewski and Donnellan (2010) reported slight declines in loneliness from 1977 to 2006. They used only Grade 12 data, which are less representative of the general population than the data from Grades 8 and 10 because Grade 12 has higher drop-out rates than Grades 8 and 10. Approximately 11% to 20% of stu-dents drop out by Grade 12 (Johnston et al., 2012b), whereas fewer than 5% of students drop out by Grade 10 and fewer than 2% of students drop out by Grade 8 (Johnston, Bachman, O’Malley, & Schulenberg, 2012a). In addition, Trzesniewski and Donnellan did not specifically focus on loneliness. They examined a variety of variables such as cynicism, trust, ego-ism, self-enhancement, individualism, and self-esteem. They reported an overall decline in loneliness without examining
Figure 3. Scatterplot of male loneliness means by year.Note. Only studies using the original scaling are included. Regression line reflects weighting by n. R-UCLA = Revised UCLA Loneliness Scale.
by guest on December 9, 2014psp.sagepub.comDownloaded from
Clark et al. 83
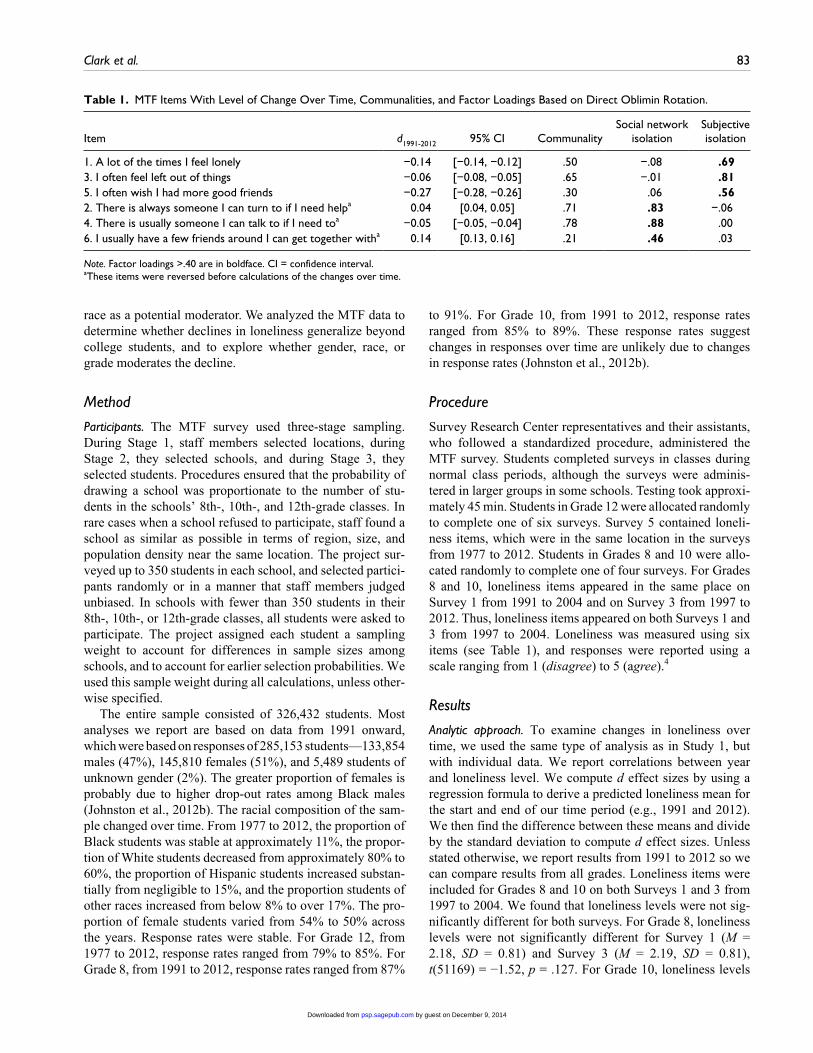
Table 1. MTF Items With Level of Change Over Time, Communalities, and Factor Loadings Based on Direct Oblimin Rotation.
Item d1991-2012 95% CI CommunalitySocial network
isolationSubjective isolation
1. A lot of the times I feel lonely −0.14 [−0.14, −0.12] .50 −.08 .693. I often feel left out of things −0.06 [−0.08, −0.05] .65 −.01 .815. I often wish I had more good friends −0.27 [−0.28, −0.26] .30 .06 .562. There is always someone I can turn to if I need helpa 0.04 [0.04, 0.05] .71 .83 −.064. There is usually someone I can talk to if I need toa −0.05 [−0.05, −0.04] .78 .88 .006. I usually have a few friends around I can get together witha 0.14 [0.13, 0.16] .21 .46 .03
Note. Factor loadings >.40 are in boldface. CI = confidence interval.aThese items were reversed before calculations of the changes over time.
race as a potential moderator. We analyzed the MTF data to determine whether declines in loneliness generalize beyond college students, and to explore whether gender, race, or grade moderates the decline.
Method
Participants. The MTF survey used three-stage sampling. During Stage 1, staff members selected locations, during Stage 2, they selected schools, and during Stage 3, they selected students. Procedures ensured that the probability of drawing a school was proportionate to the number of stu-dents in the schools’ 8th-, 10th-, and 12th-grade classes. In rare cases when a school refused to participate, staff found a school as similar as possible in terms of region, size, and population density near the same location. The project sur-veyed up to 350 students in each school, and selected partici-pants randomly or in a manner that staff members judged unbiased. In schools with fewer than 350 students in their 8th-, 10th-, or 12th-grade classes, all students were asked to participate. The project assigned each student a sampling weight to account for differences in sample sizes among schools, and to account for earlier selection probabilities. We used this sample weight during all calculations, unless other-wise specified.
The entire sample consisted of 326,432 students. Most analyses we report are based on data from 1991 onward, which were based on responses of 285,153 students—133,854 males (47%), 145,810 females (51%), and 5,489 students of unknown gender (2%). The greater proportion of females is probably due to higher drop-out rates among Black males (Johnston et al., 2012b). The racial composition of the sam-ple changed over time. From 1977 to 2012, the proportion of Black students was stable at approximately 11%, the propor-tion of White students decreased from approximately 80% to 60%, the proportion of Hispanic students increased substan-tially from negligible to 15%, and the proportion students of other races increased from below 8% to over 17%. The pro-portion of female students varied from 54% to 50% across the years. Response rates were stable. For Grade 12, from 1977 to 2012, response rates ranged from 79% to 85%. For Grade 8, from 1991 to 2012, response rates ranged from 87%
to 91%. For Grade 10, from 1991 to 2012, response rates ranged from 85% to 89%. These response rates suggest changes in responses over time are unlikely due to changes in response rates (Johnston et al., 2012b).
Procedure
Survey Research Center representatives and their assistants, who followed a standardized procedure, administered the MTF survey. Students completed surveys in classes during normal class periods, although the surveys were adminis-tered in larger groups in some schools. Testing took approxi-mately 45 min. Students in Grade 12 were allocated randomly to complete one of six surveys. Survey 5 contained loneli-ness items, which were in the same location in the surveys from 1977 to 2012. Students in Grades 8 and 10 were allo-cated randomly to complete one of four surveys. For Grades 8 and 10, loneliness items appeared in the same place on Survey 1 from 1991 to 2004 and on Survey 3 from 1997 to 2012. Thus, loneliness items appeared on both Surveys 1 and 3 from 1997 to 2004. Loneliness was measured using six items (see Table 1), and responses were reported using a scale ranging from 1 (disagree) to 5 (agree).4
Results
Analytic approach. To examine changes in loneliness over time, we used the same type of analysis as in Study 1, but with individual data. We report correlations between year and loneliness level. We compute d effect sizes by using a regression formula to derive a predicted loneliness mean for the start and end of our time period (e.g., 1991 and 2012). We then find the difference between these means and divide by the standard deviation to compute d effect sizes. Unless stated otherwise, we report results from 1991 to 2012 so we can compare results from all grades. Loneliness items were included for Grades 8 and 10 on both Surveys 1 and 3 from 1997 to 2004. We found that loneliness levels were not sig-nificantly different for both surveys. For Grade 8, loneliness levels were not significantly different for Survey 1 (M = 2.18, SD = 0.81) and Survey 3 (M = 2.19, SD = 0.81), t(51169) = −1.52, p = .127. For Grade 10, loneliness levels
by guest on December 9, 2014psp.sagepub.comDownloaded from
84 Personality and Social Psychology Bulletin 41(1)
were not significantly different in Survey 1 (M = 2.19, SD = 0.79) and Survey 3 (M = 2.20, SD = 0.79), t(58452) = −1.51, p = .131. We combined data from these surveys for all sub-sequent analyses.
Racial, gender, and grade differences. We examined racial, gen-der, and grade differences in loneliness. Males (M = 2.21, SD = 0.78) did not differ from females (M = 2.22, SD = 0.80) in reported loneliness, t(278475.48) = −1.33, p = .184. Grades differed in their level of loneliness, F(2, 285149) = 104.31, p < .001. We used Bonferroni corrections and found Grade 12 students (M = 2.26, SD = 0.78) reported slightly higher loneliness than Grade 10 students (M = 2.21, SD = 0.78, d = 0.06, p < .001), who reported nearly the same lone-liness as Grade 8 students (M = 2.20, SD = 0.80, d = 0.01, p = .045). From 2005 onward, the MTF project recorded the proportion of Hispanic students in samples. We used these data, and found that loneliness differed among ethnicities, F(3, 60455) = 96.00, p < .001. Using Bonferroni correction, we found that White students (M = 2.14, SD = 0.79) reported lower loneliness than Black students (M = 2.23, SD = 0.80, d = −0.11, p < .001), Hispanic students (M = 2.21, SD = 0.80, d = −0.09, p < .001), and students of other or missing race (M = 2.29, SD = 0.83, d = −0.19, p < .001). Hispanic students reported loneliness levels that were not significantly differ-ent from Black students (p = .430). Students of other or
missing race reported higher loneliness than Black (d = 0.07, p < .001) or Hispanic students (d = 0.10, p < .001).
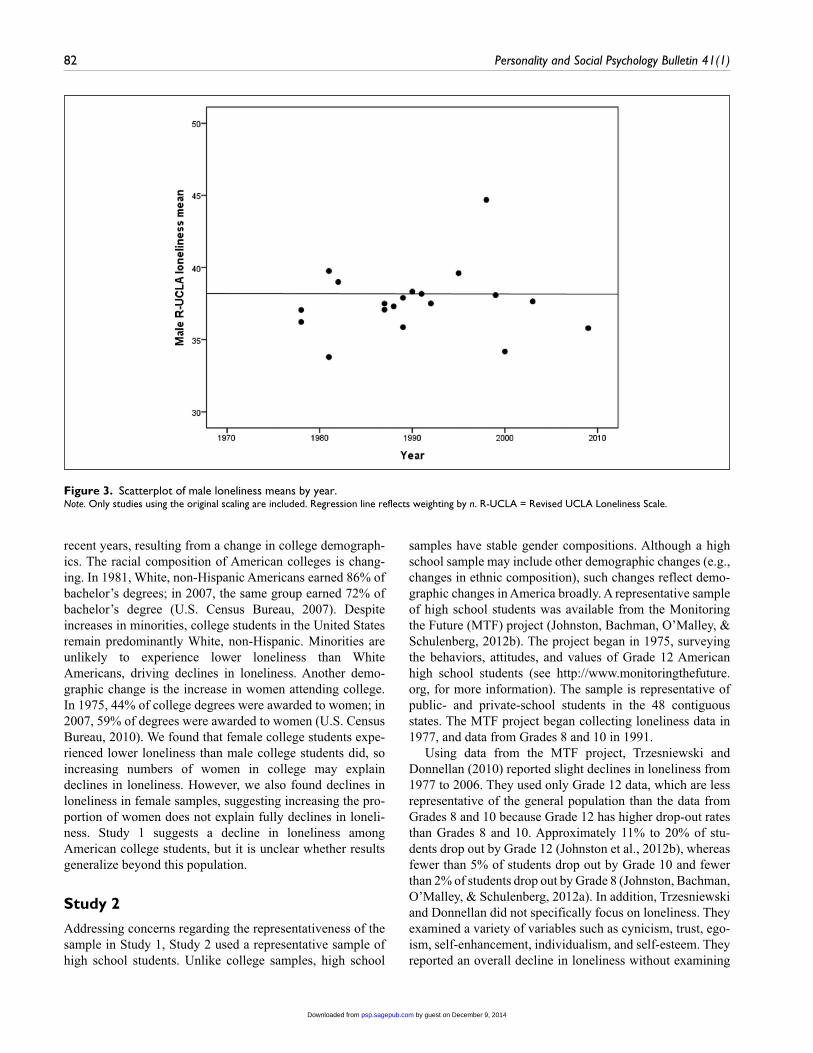
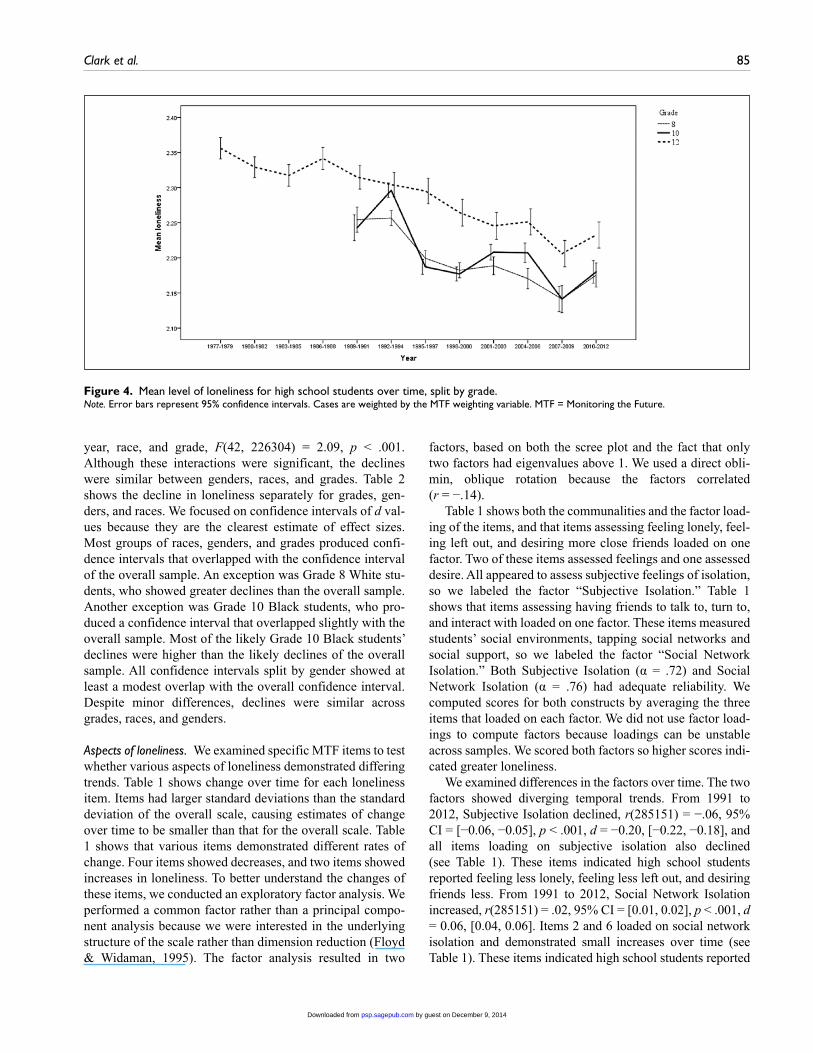
Changes to loneliness over time. High school students reported declining loneliness from 1991 to 2012 (see Table 2). We examined a possible curvilinear relationship by centering and squaring the year variable and entering both the curvilin-ear and linear relationship into a regression. The curvilinear variable predicted loneliness (β = .018, t = 9.16, p < .001). In contrast to the curve in Study 1, Study 2 produced a curve that was very shallow and visually indistinguishable from the linear relationship. The curvilinear relationship did not predict more variance than the linear relationship (β = −.038, t = −18.94, p < .001), so we focused on the stronger, linear relationship. Figure 4 shows mean loneliness by year. We split results by grade because Grade 12 means were available for a greater period, allowing us to assess trends for that grade over more time. Figure 4 shows a somewhat erratic, although generally linear, decline over time. Grade 10 stu-dents reported spikes in loneliness during periods 1992 to 1994 and 2001 to 2006.
We examined differences in the decline in loneliness between grades, genders, and races. There was a three-way interaction between year, gender, and grade, F(42, 292769) = 2.27, p < .001. Using data from only White and Black stu-dents, we further found a three-way interaction between
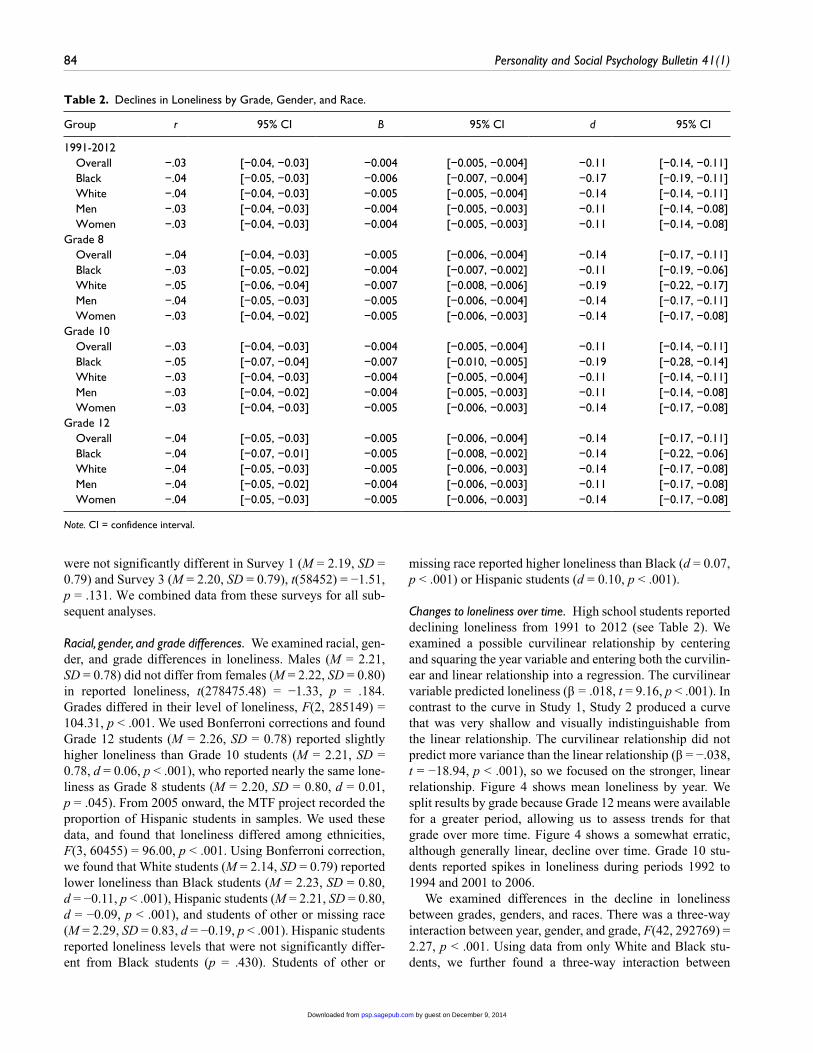
Table 2. Declines in Loneliness by Grade, Gender, and Race.
Group r 95% CI B 95% CI d 95% CI
1991-2012 Overall −.03 [−0.04, −0.03] −0.004 [−0.005, −0.004] −0.11 [−0.14, −0.11] Black −.04 [−0.05, −0.03] −0.006 [−0.007, −0.004] −0.17 [−0.19, −0.11] White −.04 [−0.04, −0.03] −0.005 [−0.005, −0.004] −0.14 [−0.14, −0.11] Men −.03 [−0.04, −0.03] −0.004 [−0.005, −0.003] −0.11 [−0.14, −0.08] Women −.03 [−0.04, −0.03] −0.004 [−0.005, −0.003] −0.11 [−0.14, −0.08]Grade 8 Overall −.04 [−0.04, −0.03] −0.005 [−0.006, −0.004] −0.14 [−0.17, −0.11] Black −.03 [−0.05, −0.02] −0.004 [−0.007, −0.002] −0.11 [−0.19, −0.06] White −.05 [−0.06, −0.04] −0.007 [−0.008, −0.006] −0.19 [−0.22, −0.17] Men −.04 [−0.05, −0.03] −0.005 [−0.006, −0.004] −0.14 [−0.17, −0.11] Women −.03 [−0.04, −0.02] −0.005 [−0.006, −0.003] −0.14 [−0.17, −0.08]Grade 10 Overall −.03 [−0.04, −0.03] −0.004 [−0.005, −0.004] −0.11 [−0.14, −0.11] Black −.05 [−0.07, −0.04] −0.007 [−0.010, −0.005] −0.19 [−0.28, −0.14] White −.03 [−0.04, −0.03] −0.004 [−0.005, −0.004] −0.11 [−0.14, −0.11] Men −.03 [−0.04, −0.02] −0.004 [−0.005, −0.003] −0.11 [−0.14, −0.08] Women −.03 [−0.04, −0.03] −0.005 [−0.006, −0.003] −0.14 [−0.17, −0.08]Grade 12 Overall −.04 [−0.05, −0.03] −0.005 [−0.006, −0.004] −0.14 [−0.17, −0.11] Black −.04 [−0.07, −0.01] −0.005 [−0.008, −0.002] −0.14 [−0.22, −0.06] White −.04 [−0.05, −0.03] −0.005 [−0.006, −0.003] −0.14 [−0.17, −0.08] Men −.04 [−0.05, −0.02] −0.004 [−0.006, −0.003] −0.11 [−0.17, −0.08] Women −.04 [−0.05, −0.03] −0.005 [−0.006, −0.003] −0.14 [−0.17, −0.08]
Note. CI = confidence interval.
by guest on December 9, 2014psp.sagepub.comDownloaded from
Clark et al. 85
year, race, and grade, F(42, 226304) = 2.09, p < .001. Although these interactions were significant, the declines were similar between genders, races, and grades. Table 2 shows the decline in loneliness separately for grades, gen-ders, and races. We focused on confidence intervals of d val-ues because they are the clearest estimate of effect sizes. Most groups of races, genders, and grades produced confi-dence intervals that overlapped with the confidence interval of the overall sample. An exception was Grade 8 White stu-dents, who showed greater declines than the overall sample. Another exception was Grade 10 Black students, who pro-duced a confidence interval that overlapped slightly with the overall sample. Most of the likely Grade 10 Black students’ declines were higher than the likely declines of the overall sample. All confidence intervals split by gender showed at least a modest overlap with the overall confidence interval. Despite minor differences, declines were similar across grades, races, and genders.
Aspects of loneliness. We examined specific MTF items to test whether various aspects of loneliness demonstrated differing trends. Table 1 shows change over time for each loneliness item. Items had larger standard deviations than the standard deviation of the overall scale, causing estimates of change over time to be smaller than that for the overall scale. Table 1 shows that various items demonstrated different rates of change. Four items showed decreases, and two items showed increases in loneliness. To better understand the changes of these items, we conducted an exploratory factor analysis. We performed a common factor rather than a principal compo-nent analysis because we were interested in the underlying structure of the scale rather than dimension reduction (Floyd & Widaman, 1995). The factor analysis resulted in two
factors, based on both the scree plot and the fact that only two factors had eigenvalues above 1. We used a direct obli-min, oblique rotation because the factors correlated (r = −.14).
Table 1 shows both the communalities and the factor load-ing of the items, and that items assessing feeling lonely, feel-ing left out, and desiring more close friends loaded on one factor. Two of these items assessed feelings and one assessed desire. All appeared to assess subjective feelings of isolation, so we labeled the factor “Subjective Isolation.” Table 1 shows that items assessing having friends to talk to, turn to, and interact with loaded on one factor. These items measured students’ social environments, tapping social networks and social support, so we labeled the factor “Social Network Isolation.” Both Subjective Isolation (α = .72) and Social Network Isolation (α = .76) had adequate reliability. We computed scores for both constructs by averaging the three items that loaded on each factor. We did not use factor load-ings to compute factors because loadings can be unstable across samples. We scored both factors so higher scores indi-cated greater loneliness.
We examined differences in the factors over time. The two factors showed diverging temporal trends. From 1991 to 2012, Subjective Isolation declined, r(285151) = −.06, 95% CI = [−0.06, −0.05], p < .001, d = −0.20, [−0.22, −0.18], and all items loading on subjective isolation also declined (see Table 1). These items indicated high school students reported feeling less lonely, feeling less left out, and desiring friends less. From 1991 to 2012, Social Network Isolation increased, r(285151) = .02, 95% CI = [0.01, 0.02], p < .001, d = 0.06, [0.04, 0.06]. Items 2 and 6 loaded on social network isolation and demonstrated small increases over time (see Table 1). These items indicated high school students reported
Figure 4. Mean level of loneliness for high school students over time, split by grade.Note. Error bars represent 95% confidence intervals. Cases are weighted by the MTF weighting variable. MTF = Monitoring the Future.
by guest on December 9, 2014psp.sagepub.comDownloaded from
86 Personality and Social Psychology Bulletin 41(1)
declines in having someone to turn to and having friends with whom to interact. Item 4 loaded on social network isolation but showed a slight decline. Item 4 indicated that students reported increasing likelihood that they have someone to talk to. Disparities between temporal patterns of the two factors are clearest in the contrast between Items 6 and 5. Item 6 showed that high school students had fewer friends with whom to “get together with” whereas Item 5 shows declines in their desire for more friends, suggesting a contrast between subjective experiences and social environments.
Discussion
Results from Study 2 mirrored results from Study 1, finding declines in loneliness over time. Although Study 1 was based on a moderate number of studies, limiting reliability, Study 2 was based on a very large number of participants, increasing reliability of the findings. Study 2 found that the decline among White students from 1991 to 2012 was d = −.14, which extrapolated to the same period as Study 1 equates to d = −0.21, slightly lower than the overall effect (d = −0.26) found in Study 1. The r values were very differ-ent between Studies 1 and 2 because Study 1 correlated year with loneliness means of overall studies whereas Study 2 correlated year with individual loneliness scores. There was substantially more variation in individual scores than group means, inflating correlations based on group means. Interpreting d scores addressed this issue because those scores were unaffected by the reduction in variability (Trzesniewski & Donnellan, 2010; Twenge & Campbell, 2010).
Study 2 found that White students reported lower loneli-ness than Black students, Hispanic students, or students of other races. High loneliness among minorities may reflect prejudice they experience (Dovidio, Kawakami, & Gaertner, 2002). Students who reported “other” races experienced the highest loneliness, and their proportions expanded greatly over time. This increasing proportion reduced overall decline of loneliness, explaining why rates of decline for White and Black students were higher than overall declines. Declines in loneliness were similar across races, although Grade 8 White Students and Grade 10 Black students reported greater declines in loneliness.
Study 2 found that the trend of loneliness includes diverg-ing elements; two factors emerged from the factor analysis, and these factors demonstrated diverging temporal trends. One factor, Subjective Isolation, measured the students’ rat-ing of loneliness and desire for more friends. The other fac-tor, Social Network Isolation, measured the students’ ratings of their social network such as having friends with whom to interact. Subjective isolation declined, but social network isolation increased, suggesting high school students per-ceived less loneliness but poorer social networks. The con-trast between feeling lonely and poorer social networks was made clearer by comparing temporal trends of the items.
Item 6 showed high school students reported fewer friends with whom to interact over time, but Item 5 suggested less desire for more friends over time.
General Discussion
We found declines in loneliness over time. Study 1 suggests a decline in loneliness among American college students, and Study 2 generalizes results to a representative sample of high school students, providing converging evidence that loneliness declined over time. This decline contrasts with the idea that society is becoming increasingly lonely, an idea present in both popular media (Fountain, 2006) and research (Kanai et al., 2012). The contrast may be due to negativity bias, a bias that causes negative events to appear more nega-tive the closer events are to the present (Rozin & Royzman, 2001). People may imagine examples of isolation in the pres-ent easily but forget examples from the past. People may ide-alize the past, focusing on aspects of loneliness that are increasing, and overlook aspects of loneliness that are decreasing. Study 2 reveals that aspects of loneliness show varying trends. Subjective isolation decreased, reflecting declines in experiences of loneliness. In contrast, social net-work isolation increased, reflecting declines in perceived interactions and support from friends. Particularly striking were trends for two items that suggested high school students reported fewer friends with whom to interact, but less desire for more friends.
Trends of loneliness occurred in the context of many other cultural changes that could influence loneliness. Over time, extraversion and self-esteem increased substantially (Gentile et al., 2010; Twenge, 2001), and both correlate strongly with lower loneliness (Civitci & Civitci, 2009; Saklofske & Yackulic, 1989). Another cultural trend is that society is more accepting, a trend suggested by declines in violence and discrimination (Pinker, 2011). One trend is the emer-gence of social media, and although social media can reduce feelings of loneliness (Deters & Mehl, 2013), social media is unlikely a factor because social media became prominent recently and after declines in loneliness began. Not all cul-tural trends point to lower loneliness. Empathy and secure attachments declined, and insecure attachments increased (Konrath et al., 2014; Konrath et al., 2011). High insecure attachments, low empathy, and low secure attachments pre-dict higher loneliness (Davis, 1983; DiTommaso et al., 2003).
Other cultural trends influence how people relate to each other, including trends toward greater independence and greater emphasis on personal success. People have become increasingly individualistic (Twenge, Campbell, & Gentile, 2012). American high school students have increased desire for expensive possessions, money, and high-paying jobs (Twenge & Kasser, 2013), and parents place less emphasis on raising obedient children (Hamamura, 2012). People are more likely to describe themselves using masculine traits
by guest on December 9, 2014psp.sagepub.comDownloaded from
Clark et al. 87
such as “independent” and “assertive” (Twenge, 1997), and recent generations rate effort as more important to success than previous generations did (Hamamura, 2012). Each of these cultural trends likely influences and is influenced by the others, resulting in dynamic, reciprocal relationships. Identifying which cultural trends precede the others is difficult.
These cultural trends could result from modernization. Modernization is a process that produces parallel changes in diverse and scattered cultures. A clear example of modern-ization is the vast majority of cultures demonstrating trends toward fewer children per women, a trend observed despite those cultures having vastly different circumstances and his-tories (Newson, Postmes, Lea, & Webley, 2005). Modernization includes a broad range of factors such as ris-ing mobility, urbanization, divorce, economic output, and labor specialization, and declining contact with kin (Hamamura, 2012; Newson et al., 2005; Putnam, 2000). These trends can influence how people relate to each other. Greater economic opportunities offer individuals more lati-tude to manage their own money, decide whom to date, and decide whom to marry, reducing the influence of kin and giv-ing people more autonomy, which may increase individual-ism (Hamamura, 2012). As jobs become more specialized, workers are required to possess more specialized training, driving increases in achievement-orientated mind-sets (Hamamura, 2012). Economic changes lead to increased individuality, which could lead to decreasing interest in friends, increasing self-reliance, increasing self-esteem, and decreasing loneliness. These explanations are speculative, requiring evidence from future research.
Future Research
Because of the complexity of societal trends, more research is needed before an adequate explanation of various cul-tural trends is reached. Future research should explore whether other cultures demonstrate similar changes found in the United States regarding loneliness. If modernization is responsible for the changes, similar changes should be evident across diverse cultures. Some research in this area has been conducted. One cross-cultural study found increases in individualism in both Japan and the United States, pointing to similar modernization factors in the two countries, including increasing urban population, decreas-ing family size, and increasing divorce (Hamamura, 2012). Although the study found similar patterns between the two countries, the study also found diverging trends, most nota-bly a decline in trust in the United States but not in Japan. A similar analysis for loneliness may identify whether the decrease in subjective isolation and increase in social net-work isolation occurs in other cultures, indicating changes result from modernization, or are specific to the United States, indicating changes result from unique features of American culture.
Future research should examine changes in relationship quality, a construct at least as important to social well-being as frequency of social activities (Cacioppo & Patrick, 2008; Reis et al., 1985), yet little research examines changes over time regarding relationship quality. Data on changes to rela-tionship quality are necessary for a complete understanding of changes in loneliness. Measures of relationship quality such as relationship satisfaction and social support correlate negatively with loneliness, and may be changing over time (Sarason, Sarason, Shearin, & Pierce, 1987; Segrin, Powell, Givertz, & Brackin, 2003). Higher relationship quality could account for reduced loneliness despite reduced social contact.
Conclusion
Loneliness declined over time. Although the decline in lone-liness is small, it contrasts sharply with expectations of large increases in loneliness, expectations found both in the public discourse (Fountain, 2006) and in the scientific literature (Kanai et al., 2012). Fine-grained analyses in Study 2 dem-onstrated diverging trends. Over time, high school students reported less subjective isolation but more social network isolation. These trends occurred in the context of many other cultural trends such as increasing extraversion, increasing self-esteem, decreasing secure attachment, and decreasing empathy. Understanding the complex nature of these cultural trends requires further research, and examining whether these cultural trends are similar outside of the United States would suggest whether the trends result from broad factors of modernization or unique facets of American culture.
Authors’ Note
Natalie J. Loxton is now at School of Applied Psychology, Griffith University.
Declaration of Conflicting Interests
The author(s) declared no potential conflicts of interest with respect to the research, authorship, and/or publication of this article.
Funding
The author(s) received no financial support for the research, author-ship, and/or publication of this article.
Notes
1. Gentile, Twenge, and Campbell (2010) analyzed scores on the Rosenberg Self-Esteem Scale and found an increase in self-esteem for studies using the 4-point scale but found no change in self-esteem for studies using the 5-point scale. They speculated that the existence of a neutral midpoint changed responses to the scale. We were unable to do the same analysis as no alter-nate scoring of Revised UCLA Loneliness Scale (R-UCLA) appeared in enough studies to analyze separately. We examined whether including alternate scoring would change our results. We converted scores that used an alternate scale to a score that
by guest on December 9, 2014psp.sagepub.comDownloaded from
88 Personality and Social Psychology Bulletin 41(1)
would be obtained with a 1 to 4 scale. For instance, if a scale was 1 to 5, we divided scores by 5 and then multiplied by 4. These calculations are problematic because a score of 5 converts to 4, 4 converts to 3.2, and 1 converts to 0.8, introducing a large amount of distortion. We also converted any scores based on the averages of items to scores based on the sum of the items. Including these scores, we found loneliness did not correlate sig-nificantly with year of collection, r(58) = −.15, 95% confidence interval (CI) = [−0.39, 0.11], p = .268, k = 60, n = 15,178.
2. Removing the outliers in Figure 1 increased the estimated rela-tionship between loneliness and year. The relationship with the outliers was moderate, r(46) = −.30, p = .039. The relationship without the outliers was stronger, r(44) = −.42, 95% CI = [−0.63, −0.15], p = .004, k = 46, n = 12,724.
3. Removing the outlier in Figure 3 resulted in the relationship between loneliness and year becoming more negative, albeit not significantly so. The calculation with the outlier showed no relationship, r(17) = .00, p = .999. The calculation without the outlier was stronger but not significant, r(16) = −.16, 95% CI = [−0.58, 0.33], p = .518, k = 18, n = 2,741.
4. The Monitoring the Future (MTF) loneliness items lack estab-lished psychometric properties or validity. We recruited 250 par-ticipants from Amazon’s Mechanical Turk to assess the validity of the MTF loneliness items. The sample consisted of 151 men (60.4%). The average age was 35.50 (SD = 13.42). The sample consisted of 179 Caucasians, 21 Asians, 23 Africans, and 27 people of other races. The MTF scale had adequate reliability (α = .85) and showed a strong correlation with the R-UCLA, r(248) = .86, 95% CI = [0.82, 0.89], p < .001. These results attest to the construct validity of the MTF loneliness items.
Supplemental Material
The online supplemental material is available at http://pspb.sagepub.com/supplemental.
References
Baumeister, R. F., & Leary, M. R. (1995). The need to belong: Desire for interpersonal attachments as a fundamental human motiva-tion. Psychological Bulletin, 117, 497-529. doi:10.1037/0033-2909.117.3.497
Bearman, P., & Parigi, P. (2004). Cloning headless frogs and other important matters: Conversation topics and network structure. Social Forces, 83, 535-557. doi:10.1353/sof.2005.0001
Cacioppo, J. T., & Patrick, W. (2008). Loneliness: Human nature and the need for social connection. New York, NY: W.W. Norton.
Civitci, N., & Civitci, A. (2009). Self-esteem as mediator and mod-erator of the relationship between loneliness and life satisfac-tion in adolescents. Personality and Individual Differences, 47, 954-958. doi:10.1016/j.paid.2009.07.022
Davis, M. H. (1983). Measuring individual differences in empa-thy: Evidence for a multidimensional approach. Journal of Personality and Social Psychology, 44, 113-126. doi:10.1037/0022-3514.44.1.113
Davis, M. H., & Kraus, L. A. (1989). Social contact, loneliness, and mass-media use: A test of 2 hypotheses. Journal of Applied Social Psychology, 19, 1100-1124. doi:10.1111/j.1559-1816.1989.tb01242.x
Deters, F. G., & Mehl, M. R. (2013). Does posting Facebook sta-tus updates increase or decrease loneliness? An online social networking experiment. Social Psychological and Personality Science, 4, 579-586. doi:10.1177/1948550612469233
DiTommaso, E., Brannen-McNulty, C., Ross, L., & Burgess, M. (2003). Attachment styles, social skills and loneliness in young adults. Personality and Individual Differences, 35, 303-312. doi:10.1016/S0191-8869(02)00190-3
Dovidio, J. F., Kawakami, K., & Gaertner, S. L. (2002). Implicit and explicit prejudice and interracial interaction. Journal of Personality and Social Psychology, 82, 62-68. doi:10.1037/0022-3514.82.1.62
Fischer, C. S. (2011). Still connected: Family and friends in America since 1970. New York, NY: Russell Sage Foundation.
Floyd, F. J., & Widaman, K. F. (1995). Factor analysis in the devel-opment and refinement of clinical assessment instruments. Psychological Assessment, 7, 286-299. doi:10.1037/1040-3590.7.3.286
Forest, A. L., & Wood, J. V. (2012). When social networking is not working: Individuals with low self-esteem recognize but do not reap the benefits of self-disclosure on Facebook. Psychological Science, 23, 295-302. doi:10.1177/0956797611429709
Fountain, H. (2006, July 2). The lonely American just got a bit lone-lier. The New York Times. Available from http://www.nytimes.com
Gentile, B., Twenge, J. M., & Campbell, W. K. (2010). Birth cohort differences in self-esteem, 1988-2008: A cross-temporal meta-analysis. Review of General Psychology, 14, 261-268. doi:10.1037/a0019919
Hackett, R. A., Hamer, M., Endrighi, R., Brydon, L., & Steptoe, A. (2012). Loneliness and stress-related inflammatory and neuroendocrine responses in older men and women. Psychoneuroendocrinology, 37, 1801-1809. doi:10.1016/j.psyneuen.2012.03.016
Hamamura, T. (2012). Are cultures becoming individualistic? A cross-temporal comparison of individualism-collectivism in the United States and Japan. Personality and Social Psychology Review, 16, 3-24. doi:10.1177/1088868311411587
Johnston, L. D., Bachman, J. G., O’Malley, P. M., & Schulenberg, J. E. (2012a). Monitoring the future: A continuing study of American youth (8th- and 10th-Grade Surveys). Inter-University Consortium for Political and Social Research. Retrieved from http://doi.org/10.3886/ICPSR34574.v1
Johnston, L. D., Bachman, J. G., O’Malley, P. M., & Schulenberg, J. E. (2012b). Monitoring the future: A continuing study of American youth (12th-Grade Survey). Inter-University Consortium for Political and Social Research. Retrieved from http://doi.org/10.3886/ICPSR34861.v1
Kanai, R., Bahrami, B., Duchaine, B., Janik, A., Banissy, M. J., & Rees, G. (2012). Brain structure links loneliness to social perception. Current Biology, 22, 1975-1979. doi:10.1016/j.cub.2012.08.045
Kiecolt-Glaser, J. K., Ricker, D., George, J., Messick, G., Speicher, C., Garner, W., & Glaser, R. (1984). Urinary cortisol levels, cellular immunocompetency, and loneliness in psychiatric inpatients. Psychosomatic Medicine, 46, 15-23.
Konrath, S. H., Chopik, W. J., Hsing, C. K., & O’Brien, E. (2014). Changes in adult attachment styles in American college students
by guest on December 9, 2014psp.sagepub.comDownloaded from

Clark et al. 89
over time: A meta-analysis. Personality and Social Psychology Review, 18, 326-348. doi:10.1177/1088868314530516
Konrath, S. H., O’Brien, E. H., & Hsing, C. (2011). Changes in dispositional empathy in American college students over time: A meta-analysis. Personality and Social Psychology Review, 15, 180-198. doi:10.1177/1088868310377395
Lau, S., & Gruen, G. E. (1992). The social stigma of lone-liness: Effect of target person’s and perceiver’s sex. Personality and Social Psychology Bulletin, 18, 182-189. doi:10.1177/0146167292182009
Lawler-Row, K. A., Hyatt-Edwards, L., Wuensch, K. L., & Karremans, J. C. (2011). Forgiveness and health: The role of attachment. Personal Relationships, 18, 170-183. doi:10.1111/j.1475-6811.2010.01327.x
Lipsey, M. W., & Wilson, D. B. (2001). Practical meta-analysis. London, England: SAGE.
Marche, S. (2012, April 2). Is Facebook making us lonely? The Atlantic. Available from http://www.theatlantic.com
McKenna, K. Y. A., & Bargh, J. A. (1998). Coming out in the age of the Internet: Identity “demarginalization” through vir-tual group participation. Journal of Personality and Social Psychology, 75, 681-694. doi:10.1037/0022-3514.75.3.681
McPherson, M., Smith-Lovin, L., & Brashears, M. E. (2006). Social isolation in America: Changes in core discussion net-works over two decades. American Sociological Review, 71, 353-375. doi:10.1177/000312240607100301
Newson, L., Postmes, T., Lea, S. G., & Webley, P. (2005). Why are modern families small? Toward an evolutionary and cul-tural explanation for the demographic transition. Personality and Social Psychology Review, 9, 360-375. doi:10.1207/s15327957pspr0904_5
Paxton, P. (1999). Is social capital declining in the United States? A multiple indicator assessment. American Journal of Sociology, 105, 88-127. doi:10.1086/210268
Pinker, S. (2011). The better angels of our nature: Why violence has declined. New York, NY: Viking.
Pressman, S. D., Cohen, S., Miller, G. E., Barkin, A., Rabin, B. S., & Treanor, J. J. (2005). Loneliness, social network size, and immune response to influenza vaccination in college freshmen. Health Psychology, 24, 297-306. doi:10.1037/0278-6133.24.3.297
Putnam, R. D. (2000). Bowling alone: The collapse and revival of American community. Sydney, Australia: Simon & Schuster.
Reis, H. T., Wheeler, L., Kernis, M. H., Spiegel, N., & Nezlek, J. (1985). On specificity in the impact of social participation on phys-ical and psychological health. Journal of Personality and Social Psychology, 48, 456-471. doi:10.1037/0022-3514.48.2.456
Rozin, P., & Royzman, E. B. (2001). Negativity bias, negativity dominance, and contagion. Personality and Social Psychology Review, 5, 296-320. doi:10.1207/S15327957PSPR0504_2
Russell, D., Peplau, L. A., & Cutrona, C. (1980). The Revised UCLA Loneliness Scale: Concurrent and discriminant validity
evidence. Journal of Personality and Social Psychology, 39, 472-480. doi:10.1037/0022-3514.39.3.472
Saklofske, D., & Yackulic, R. (1989). Personality predictors of loneliness. Personality and Individual Differences, 10, 467-472. doi:10.1016/0191-8869(89)90011-1
Sarason, I. G., Sarason, B. R., Shearin, E. N., & Pierce, G. R. (1987). A brief measure of social support: Practical and theoretical implications. Journal of Social and Personal Relationships, 4, 497-510. doi:10.1177/0265407587044007
Segrin, C., Powell, H. L., Givertz, M., & Brackin, A. (2003). Symptoms of depression, relational quality, and loneliness in dating relationships. Personal Relationships, 10, 25-36. doi:10.1111/1475-6811.00034
Tobin, S. J., Vanman, E. J., Verreynne, M., & Saeri, A. K. (2014). Threats to belonging on Facebook: Lurking and ostracism. Social Influence. Advance online publication. doi:10.1080/ 15534510.2014.893924
Trzesniewski, K. H., & Donnellan, M. B. (2010). Rethinking “generation me”: A study of cohort effects from 1976-2006. Perspectives on Psychological Science, 5, 58-75. doi:10.1177/1745691609356789
Twenge, J. M. (1997). Changes in masculine and feminine traits over time: A meta-analysis. Sex Roles, 36, 305-325. doi:10.1007/BF02766650
Twenge, J. M. (2001). Birth cohort changes in extraversion: A cross-temporal meta-analysis, 1966-1993. Personality and Individual Differences, 30, 735-748. doi:10.1016/S0191-8869(00)00066-0
Twenge, J. M., & Campbell, W. K. (2001). Age and birth cohort differences in self-esteem: A cross-temporal meta-analysis. Personality and Social Psychology Review, 5, 321-344. doi:10.1207/S15327957PSPR0504_3
Twenge, J. M., & Campbell, W. K. (2010). Birth cohort differences in the monitoring the future dataset and elsewhere: Further evidence for generation me—Commentary on Trzesniewski & Donnellan (2010). Perspectives on Psychological Science, 5, 81-88. doi:10.1177/1745691609357015
Twenge, J. M., Campbell, W. K., & Gentile, B. (2012). Increases in individualistic words and phrases in American books, 1960-2008. PLoS ONE, 7, e40181. doi:10.1371/journal.pone.0040181
Twenge, J. M., & Kasser, T. (2013). Generational changes in mate-rialism and work centrality, 1976-2007: Associations with temporal changes in societal insecurity and materialistic role modeling. Personality and Social Psychology Bulletin, 39, 883-897. doi:10.1177/0146167213484586
U.S. Census Bureau. (2007). Table 289. Degrees earned by level and race/ethnicity. Retrieved from www.census.gov/compendia/ statab/2010/tables/10s0289.xls
U.S. Census Bureau. (2010). Statistical abstract of the United States. Washington, DC: Government Printing Office.
by guest on December 9, 2014psp.sagepub.comDownloaded from
Copyright © 2022 FDOKUMEN