Community Colleges: - ERIC
201
American Association of Community Colleges One Dupont Circle, NW Suite 410 Washington, DC 20036-1176 www.aacc.nche.edu ISBN 0-87117-365-4 4 th American Association of Community Colleges Edition KENT A. PHILLIPPE AND LEILA GONZÁLEZ SULLIVAN National Profile of Community Colleges: Trends & Statistics Community Community Colleges: Colleges: Trends & Statistics Trends & Statistics of of National Profile
-
Upload
khangminh22 -
Category
Documents
-
view
2 -
download
0
Transcript of Community Colleges: - ERIC

American Association of Community Colleges
One Dupont Circle, NWSuite 410
Washington, DC 20036-1176www.aacc.nche.edu
ISBN 0-87117-365-4 4th
A m e r i c a n A s s o c i a t i o n o f C o m m u n i t y C o l l e g e s
Edition
KENT A. PHILLIPPE AND LEILA GONZÁLEZ SULLIVANN
ational Profile of Com
munity C
olleges:Trends & Statistics
CommunityCommunityColleges:Colleges:
Trends & StatisticsTrends & Statistics
of of NationalProfile

4th
A m e r i c a n A s s o c i a t i o n o f C o m m u n i t y C o l l e g e s
Edition
KENT A. PHILLIPPE AND LEILA GONZÁLEZ SULLIVAN
Trends & StatisticsTrends & StatisticsColleges:Colleges:
CommunityCommunityof of
NationalProfile

The American Association of Community Colleges (AACC) is the primary advo-cacy organization for the nation’s community colleges. The association representsmore than 1,100 two-year, associate degree–granting institutions and more than11 million students. AACC promotes community colleges through six strategicaction areas: national and international recognition and advocacy, learning andaccountability, leadership development, economic and workforce development,connectedness across AACC membership, and international and interculturaleducation. Information about AACC and community colleges may be found atwww.aacc.nche.edu.
Editor: Deanna D’ErricoDesign: Brian GallagherPrinter: Kirby Lithographic
© 2005 American Association of Community Colleges
All rights reserved. No part of this book may be reproduced or transmitted in anyform or by any means, electronic or mechanical, including, without limitation,photocopying, recording, or by any information storage and retrieval system,without written permission from the publisher:
Community College PressAmerican Association of Community CollegesOne Dupont Circle, NWSuite 410Washington, DC 20036
Printed in the United States of America.
ISBN 0-87117-365-4

iiiNational Profile of Community Colleges: Trends & Statistics 4TH EDITION
List of Figures and Tables . . . . . . . . . . . . . . . . . . . . . . . . . . . . . . . iv
Preface . . . . . . . . . . . . . . . . . . . . . . . . . . . . . . . . . . . . . . . . . . . ix
Community Colleges Past and Present . . . . . . . . . . . . . . . . . . . . . 1
Community College Enrollment . . . . . . . . . . . . . . . . . . . . . . . . . 19
The Social and Economic Impact of Community Colleges . . . . . . . 63
Community College Staff and Services . . . . . . . . . . . . . . . . . . . . 97
College Education Costs and Financing . . . . . . . . . . . . . . . . . . . 127
A Look at the Future . . . . . . . . . . . . . . . . . . . . . . . . . . . . . . . . 159
Glossary . . . . . . . . . . . . . . . . . . . . . . . . . . . . . . . . . . . . . . . . . 175
References. . . . . . . . . . . . . . . . . . . . . . . . . . . . . . . . . . . . . . . . 179
Index . . . . . . . . . . . . . . . . . . . . . . . . . . . . . . . . . . . . . . . . . . . 183
About the Authors . . . . . . . . . . . . . . . . . . . . . . . . . . . . . . . . . . 190
I
II
III
IV
V
VI
CONTENTS
iv American Association of Community Colleges
LIST OF FIGURES AND TABLES
CHAPTER I
Figure 1.1 Number of Community Colleges: 1901–2004 . . . . . . . . . . . . . . . . . . . . . . . . . . 7Figure 1.2 Location of Community Colleges . . . . . . . . . . . . . . . . . . . . . . . . . . . . . . . . . . . 10Figure 1.3 Percentage of U.S. Population Aged 18 or Older Served by
Community Colleges: 2001–2002 . . . . . . . . . . . . . . . . . . . . . . . . . . . . . . . . 13Figure 1.4 Enrollment at Community Colleges: Fall 2002 . . . . . . . . . . . . . . . . . . . . . . . . . 16Figure 1.5 Percentage Distribution of Community Colleges by Enrollment: 2002 . . . . . . . 17Figure 1.6 Distribution of Community Colleges by Urbanicity: 2002 . . . . . . . . . . . . . . . . 18
Table 1.1 Number of Community Colleges: 1901–2004 . . . . . . . . . . . . . . . . . . . . . . . . . . 8 Table 1.2 Number of Community Colleges by State: 2004. . . . . . . . . . . . . . . . . . . . . . . . . 9Table 1.3 Undergraduate Enrollment: Fall 2001 and Full Year 2001–2002. . . . . . . . . . . . 12Table 1.4 Percentage of U.S. Population Aged 18 or Older Served by
Community Colleges: Fall 2001 and Full Year 2001–2002 . . . . . . . . . . . . . 14
CHAPTER II
Figure 2.1 Undergraduate and Graduate Enrollment: 1965–2001 . . . . . . . . . . . . . . . . . . . 23Figure 2.2 Undergraduate Enrollment: Fall 2001 and Full Year 2001–2002. . . . . . . . . . . . 27Figure 2.3 Age Distribution of Community College Students: Biennially, 1993–2001. . . . 31Figure 2.4 Community College Enrollment by Race/Ethnicity: 1993 . . . . . . . . . . . . . . . . 40Figure 2.5 Community College Enrollment by Race/Ethnicity: 2002 . . . . . . . . . . . . . . . . 41Figure 2.6 Immigrant Status of Public Community College Students: 2003–2004 . . . . . . 46Figure 2.7 Employment Status of Public Community College Students by
Attendance Status: 2003–2004 . . . . . . . . . . . . . . . . . . . . . . . . . . . . . . . . . . . 52Figure 2.8 Distribution of Main Limiting Condition for Undergraduates
With Disabilities: 1999–2000. . . . . . . . . . . . . . . . . . . . . . . . . . . . . . . . . . . . 61
Table 2.1 Undergraduate and Graduate Enrollment: 1965–2001 . . . . . . . . . . . . . . . . . . . 24Table 2.2 Undergraduate Fall Enrollment: 1993–2002 . . . . . . . . . . . . . . . . . . . . . . . . . . . 26Table 2.3 Undergraduate Fall Enrollment by Attendance Status and
Gender: 1993–2002 . . . . . . . . . . . . . . . . . . . . . . . . . . . . . . . . . . . . . . . . . . . 28Table 2.4 Distribution of Community College Fall Enrollment by Age and
Attendance Status: Biennially, 1993–2001 . . . . . . . . . . . . . . . . . . . . . . . . . . 32Table 2.5 Community College Enrollment by Gender, Age, and
Attendance Status: Fall 2001 . . . . . . . . . . . . . . . . . . . . . . . . . . . . . . . . . . . . 34Table 2.6 Community College Enrollment by Age and Gender: Fall 2001 . . . . . . . . . . . . 35Table 2.7 Undergraduate Fall Enrollment by Race/Ethnicity: 1993–2002 . . . . . . . . . . . . 36Table 2.8 Ethnic Origins of Hispanic Undergraduates: 1999–2000 . . . . . . . . . . . . . . . . . 42Table 2.9 Ethnic Origins of Asian/Pacific Islander Undergraduates: 1999–2000. . . . . . . . 43Table 2.10 Immigrant Status of Undergraduates: 2003–2004 . . . . . . . . . . . . . . . . . . . . . . . 44Table 2.11 Primary Language Spoken in the Home of Undergraduates:
1992–1993, 1995–1996, and 1999–2000. . . . . . . . . . . . . . . . . . . . . . . . . . . . . 45

vNational Profile of Community Colleges: Trends & Statistics 4TH EDITION
Table 2.12 Highest Level of Education Attained by Parents of Undergraduates: 1995–1996 and 1999–2000. . . . . . . . . . . . . . . . . . . . . . . . 47
Table 2.13 Highest Level of Education Planned by Undergraduates: 1995–1996, 1999–2000, and 2003–2004 . . . . . . . . . . . . . . . . . . . . . . . . . . 48
Table 2.14 Highest Level of Education Planned by Public Community College Students, by Parents’ Highest Level of Education Attained: 1999–2000 . . . . . . . . . . . . . . . . . . . . . . . . . . . . . . . . . . . . . . . . . . . . . . . . . . 49
Table 2.15 Employment Status of Public Community College Students by Attendance Status and Age: 2003–2004 . . . . . . . . . . . . . . . . . . . . . . . . . . . . . . 50
Table 2.16 Undergraduates’ Self-Perceptions of Employment Status: 1995–1996, 1999–2000, and 2003–2004 . . . . . . . . . . . . . . . . . . . . . . . . . . 51
Table 2.17 Percentage of Undergraduates With Risk Factors Associated With Decreased Persistence in College: 1995–1996, 1999–2000, and 2003–2004 . . . . . . . . . . . . . . . . . . . . . . . . . . . . . . . . . . . . 53
Table 2.18 Income of Undergraduates by Dependency Status: 2003–2004. . . . . . . . . . . . . 54Table 2.19 Type of College Enrolled in by Full-Time, Full-Year Dependent
Undergraduates by Family Income: 1989–1990 and 1999–2000 . . . . . . . . . 55Table 2.20 Dependent Undergraduates’ Income by Race/Ethnicity: 2003–2004. . . . . . . . . 56Table 2.21 Independent Undergraduates’ Income by Race/Ethnicity: 2003–2004 . . . . . . . 58Table 2.22 Percentage of Undergraduates Who Attended College In-State and
Distance From Home: 1999–2000 . . . . . . . . . . . . . . . . . . . . . . . . . . . . . . . . 60
CHAPTER III
Figure 3.1 Life Earnings Estimates for Full-Time, Year-Round Workers by Gender and Education . . . . . . . . . . . . . . . . . . . . . . . . . . . . . . . . . . . . . . . . . 74
Figure 3.2 Percentage of Community College Certificates and Associate Degrees Awarded, by Race/Ethnicity: 2001–2002 . . . . . . . . . . . . . . . . . . . . . . . . . . . 77
Figure 3.3 Main Purpose for Enrolling for 1995–1996 Beginning Community College Students . . . . . . . . . . . . . . . . . . . . . . . . . . . . . . . . . . . . . . . . . . . . . . 83
Figure 3.4 Distribution of 1995–1996 Beginning Community College Students, by Highest Degree Expected: Degree Attainment and Persistence Status as of June 2001 . . . . . . . . . . . . . . . . . . . . . . . . . . . . . . . . . . . . . . . . . 87
Figure 3.5 Percentage of 1995–1996 Beginning Community College Students Who Transferred to a 4-Year College, by Degree Expectation . . . . . . . . . . . . 88
Table 3.1 Highest Level of Education Attained by People Aged 25 or Older: 1993–2002 . . . . . . . . . . . . . . . . . . . . . . . . . . . . . . . . . . . . . . . . . . . . . . . . . . 68
Table 3.2 Highest Level of Education Attained by People Aged 25 or Older, by Gender and Race/Ethnicity: 2002 . . . . . . . . . . . . . . . . . . . . . . . . . . . . . . . . 70
Table 3.3 Mean and Median Earnings of Workers Aged 25 or Older, by Education, . . . . . . Race/Ethnicity, and Gender: 2002 . . . . . . . . . . . . . . . . . . . . . . . . . . . . . . . . 72
Table 3.4 Mean Earnings of Workers Aged 25 or Older, by Highest Level of Education Attained: 1994–2002. . . . . . . . . . . . . . . . . . . . . . . . . . . . . . . . . . 75

vi American Association of Community Colleges
Table 3.5 Certificates and Degrees Awarded by Title IV Colleges: 1994–2002 . . . . . . . . . 76Table 3.6 Community College Certificates and Degrees Awarded, by State/Jurisdiction:
2001–2002 . . . . . . . . . . . . . . . . . . . . . . . . . . . . . . . . . . . . . . . . . . . . . . . . . . 78Table 3.7 Community College Certificates and Degrees Awarded, by Field of Study:
2001–2002 . . . . . . . . . . . . . . . . . . . . . . . . . . . . . . . . . . . . . . . . . . . . . . . . . . 80Table 3.8 Community College Certificates and Degrees Awarded, by Gender and
Race/Ethnicity: 2001–2002 . . . . . . . . . . . . . . . . . . . . . . . . . . . . . . . . . . . . . 82Table 3.9 June 2001 Award and Persistence Status of Undergraduates Entering College
1995–1996, by Highest Degree Expected and College Type. . . . . . . . . . . . . 84Table 3.10 Percentage of 1995–1996 Beginning Community College Students
Who Attained Degrees at or Attended 4-Year Colleges, by Degree Expectation and Purpose . . . . . . . . . . . . . . . . . . . . . . . . . . . . . . . . . 86
Table 3.11 Percentage of 1995–1996 Beginning Community College Students WhoTransferred to a 4-Year College: Degree Attainment and Persistence Status as of 2001, by Degree Expectation . . . . . . . . . . . . . . . . . . . . . . . . . . . 89
Table 3.12 Top 15 Hot Programs at Community Colleges: 2004 . . . . . . . . . . . . . . . . . . . . 90Table 3.13 Top 15 Hot Programs at Community Colleges, by Starting Salary:
2004 . . . . . . . . . . . . . . . . . . . . . . . . . . . . . . . . . . . . . . . . . . . . . . . . . . . . . . . 91Table 3.14 Top 15 For-Credit Hot Programs at Community Colleges: 2000 and
2004 . . . . . . . . . . . . . . . . . . . . . . . . . . . . . . . . . . . . . . . . . . . . . . . . . . . . . . . 92Table 3.15 Percentage of Baccalaureate Recipients, by Field of Study and Type of
College First Attended: 1999–2000 . . . . . . . . . . . . . . . . . . . . . . . . . . . . . . . 93Table 3.16 Number of First-Time Candidates Taking the NCLEX-RN Exam and
Percentage Passing, by Credential Earned: 2000–2004 . . . . . . . . . . . . . . . . . 94Table 3.17 Teaching Status of 1999–2000 Baccalaureate Recipients, by Type of
College First Attended: 2001 . . . . . . . . . . . . . . . . . . . . . . . . . . . . . . . . . . . . 96
CHAPTER IV
Figure 4.1 Full-Time Executive/Administrative/Managerial Staff at Public Community Colleges, by Race/Ethnicity: 2002 . . . . . . . . . . . . . . . . . . . . . 109
Figure 4.2 New Hires of Full-Time Executive/Administrative/Managerial Staff at PublicCommunity Colleges, by Race/Ethnicity: 2002 . . . . . . . . . . . . . . . . . . . . . 112
Figure 4.3 Full-Time Faculty’s Years to Retirement, by College Type: 1999–2000 . . . . . . 117Figure 4.4 Enrollment in Distance Education Courses, by Type of College:
2000–2001 . . . . . . . . . . . . . . . . . . . . . . . . . . . . . . . . . . . . . . . . . . . . . . . . . 124Figure 4.5 Community Colleges Offering Service Learning: 2003 . . . . . . . . . . . . . . . . . . 125Figure 4.6 Curricular Areas in Which Community Colleges Offer Service
Learning Activities: 2003 . . . . . . . . . . . . . . . . . . . . . . . . . . . . . . . . . . . . . . 126
Table 4.1 Occupations of Community College Employees, by Employment Status and Gender: 2001 . . . . . . . . . . . . . . . . . . . . . . . . . . . . . . . . . . . . . . 102

viiNational Profile of Community Colleges: Trends & Statistics 4TH EDITION
Table 4.2 Full-Time Employees at Public Community Colleges, by Faculty Statusand Occupation: Fall 2001 . . . . . . . . . . . . . . . . . . . . . . . . . . . . . . . . . . . . . 104
Table 4.3 New Hires in Public Community Colleges, by Occupation and Gender: 2001 . . . . . . . . . . . . . . . . . . . . . . . . . . . . . . . . . . . . . . . . . . . . . . . 105
Table 4.4 Public Community College Staff by Employment Status, Occupation, andRace/Ethnicity: 2001 . . . . . . . . . . . . . . . . . . . . . . . . . . . . . . . . . . . . . . . . . 106
Table 4.5 New Full-Time Hires in Public Colleges, by Occupation and Race/Ethnicity:2001 . . . . . . . . . . . . . . . . . . . . . . . . . . . . . . . . . . . . . . . . . . . . . . . . . . . . . . 110
Table 4.6 Characteristics of Community College CEOs: 2004 . . . . . . . . . . . . . . . . . . . . 113Table 4.7 Compensation of Community College CEOs: 2004 . . . . . . . . . . . . . . . . . . . . 114Table 4.8 Employee Benefits Received by Community College CEOs: 2004 . . . . . . . . . 115Table 4.9 College Faculty, by Employment Status and Age: 1998–1999 . . . . . . . . . . . . . 116Table 4.10 Highest Level of Education Attained by College Faculty, by Employment
Status and Teaching Field: 1998-1999 . . . . . . . . . . . . . . . . . . . . . . . . . . . . 118Table 4.11 Time Spent on Activities by Full-Time College Faculty: 1998–1999. . . . . . . . 119Table 4.12 Percentage of Community Colleges Offering International Programs and
Services: 1995 and 2000. . . . . . . . . . . . . . . . . . . . . . . . . . . . . . . . . . . . . . . 120Table 4.13 Top 30 Community Colleges, by Nonresident Alien Student Enrollment:
2002 . . . . . . . . . . . . . . . . . . . . . . . . . . . . . . . . . . . . . . . . . . . . . . . . . . . . . . 121Table 4.14 Percentage of Colleges Offering Certificate- or Degree-Level Distance
Education Programs, by College Type and Size: 2000–2001 . . . . . . . . . . . 122Table 4.15 Number and Percentage Distribution of 2-Year and 4-Year Title IV
Degree-Granting Colleges, by Distance Education Program Status: 2000–2001 . . . . . . . . . . . . . . . . . . . . . . . . . . . . . . . . . . . . . . . . . . . . . . . . . 123
CHAPTER V
Figure 5.1 Sources of Revenue for Public Colleges: 2001–2002 . . . . . . . . . . . . . . . . . . . . 131Figure 5.2 Sources of Expenses for Public Colleges: 2001–2002. . . . . . . . . . . . . . . . . . . . 136Figure 5.3 College Tuition and Fees: 1976–2002 . . . . . . . . . . . . . . . . . . . . . . . . . . . . . . . 141Figure 5.4 Public Community College Share of Pell Grant Dollars: 1991–2003 . . . . . . . 149Figure 5.5 Authorized and Actual Maximum Pell Grant Awards: 1973–2004 . . . . . . . . . 150Figure 5.6 Average Financial Need of Full-Time, Full-Year Dependent Undergraduates:
1989–1990 and 1999–2000 . . . . . . . . . . . . . . . . . . . . . . . . . . . . . . . . . . . . 158
Table 5.1 Sources of Revenue for Colleges: 2000–2001 . . . . . . . . . . . . . . . . . . . . . . . . . 132Table 5.2 Sources of Expenses for Colleges: 2000–2001 . . . . . . . . . . . . . . . . . . . . . . . . . 134Table 5.3 Sources of Scholarship and Fellowship Funds for Colleges: 2000–2001 . . . . . 137Table 5.4 College Tuition and Fee Revenues and Federal Grant Scholarship Expenses:
2000–2001 . . . . . . . . . . . . . . . . . . . . . . . . . . . . . . . . . . . . . . . . . . . . . . . . . 138Table 5.5 Average College Tuition and Fees: 1976–2002 . . . . . . . . . . . . . . . . . . . . . . . . 139Table 5.6 Average College Tuition and Fees: 1976–2002 . . . . . . . . . . . . . . . . . . . . . . . . 140Table 5.7 Average In-State College Tuition and Fees: 2000–2001 and 2001–2002 . . . . . 142

viii American Association of Community Colleges
Table 5.8 Average In-State Tuition and Fees for Public Community Colleges: 1996–2002 . . . . . . . . . . . . . . . . . . . . . . . . . . . . . . . . . . . . . . . . . . . . . . . . . 144
Table 5.9 Average In-State Tuition and Fees for Public Community Colleges, by State: 1996–2002. . . . . . . . . . . . . . . . . . . . . . . . . . . . . . . . . . . . . . . . . . 146
Table 5.10 Percentage of Federal Student Aid Received by Public Community Colleges: 1991–2003 . . . . . . . . . . . . . . . . . . . . . . . . . . . . . . . . . . . . . . . . . 148
Table 5.11 Authorized and Actual Maximum Pell Grant Awards: 1973–2004 . . . . . . . . . 151Table 5.12 Percentage of Full-Time Undergraduates Who Received Grants, by
Source of Grant: 1989–1990 and 1999–2000 . . . . . . . . . . . . . . . . . . . . . . 152Table 5.13 Percentage of Undergraduates Who Received Financial Aid, by Dependency
Status: 2003–2004 . . . . . . . . . . . . . . . . . . . . . . . . . . . . . . . . . . . . . . . . . . . 153Table 5.14 Amount of Financial Aid Received by Undergraduates, by Dependency
Status: 2003–2004 . . . . . . . . . . . . . . . . . . . . . . . . . . . . . . . . . . . . . . . . . . . 154Table 5.15 Average Tuition for Full-Time Community College Students, by
Dependency Status and Family Income: Selected Academic Years, 1989–2004 . . . . . . . . . . . . . . . . . . . . . . . . . . . . . . . . . . . . . . . . . . . . . . . . . 155
Table 5.16 Average Price of Attendance and Expected Family Contribution for Full-Time Community College Students, by Dependency Status and Family Income: Selected Academic Years, 1989–2004 . . . . . . . . . . . . . . . . 156
CHAPTER VI
Figure 6.1 U.S. Population Projection: 2000–2050 . . . . . . . . . . . . . . . . . . . . . . . . . . . . . 163Figure 6.2 Projected Percentage of White Non-Hispanics and Minorities in the U.S.
Population: 2000–2050 . . . . . . . . . . . . . . . . . . . . . . . . . . . . . . . . . . . . . . . 164Figure 6.3 Number of High School Graduates, Actual and Projected: 1988–2013. . . . . . 165Figure 6.4 Associate Degrees Awarded, Actual and Projected: 1988–2013 . . . . . . . . . . . . 166Figure 6.5 Public Community College Educational and General Expenditures:
Actual and Projected: 1988–2013. . . . . . . . . . . . . . . . . . . . . . . . . . . . . . . . 167Figure 6.6 Enrollment at Public Community Colleges, Actual and Projected:
1988–2013 . . . . . . . . . . . . . . . . . . . . . . . . . . . . . . . . . . . . . . . . . . . . . . . . . 168Figure 6.7 Enrollment at Independent Community Colleges, Actual and Projected:
1988–2013 . . . . . . . . . . . . . . . . . . . . . . . . . . . . . . . . . . . . . . . . . . . . . . . . . 169Figure 6.8 Full-Time Equivalent College Enrollment, Actual and Projected:
1988–2013 . . . . . . . . . . . . . . . . . . . . . . . . . . . . . . . . . . . . . . . . . . . . . . . . . 170
Table 6.1 Occupations With the Largest Projected Job Growth: 2002–2012 . . . . . . . . . 171Table 6.2 Occupations With the Fastest Projected Job Growth: 2002–2012. . . . . . . . . . 172Table 6.3 Occupations With the Largest Projected Job Declines: 2002–2012. . . . . . . . . 173

ixNational Profile of Community Colleges: Trends & Statistics 4TH EDITION
PREFACE
The fourth edition of theNational Profile ofCommunity Colleges: Trends
and Statistics provides a broadoverview of America’s communitycolleges as they enter their secondcentury. Introductory text for eachchapter gives the reader context,complemented by charts and graphsto provide a more detailed represen-tation of enrollment, funding, andother key issues.
Chapter 1 recounts the historyof community colleges and summa-rizes some of the more pressingissues facing them today. Chapter 2provides detailed information anddemographics concerning enroll-ment at community colleges andputs it in perspective with the restof higher education. Chapter 3describes the impact of communitycolleges on students and their communities through measures suchas degree and certificate completion,employment data, and educationalattainment within the general population. Chapter 4 offers a viewof staffing at community colleges,from the presidency and senioradministration to faculty and support staff. Chapter 5 focuses onthe financial aspects of communitycolleges, as they affect the institu-tion and its students. Chapter 6presages trends and issues that willdefine the community college of the future.
In the 21st century, communitycolleges must continue to be flexibleand innovative to meet the varied,complex, and changing needs ofstudents and communities.
Increased national visibility andurgent demands such as our post–September 11, 2001, economyrequire new and inventive responses.As enrollments rise and demands foraccountability grow, the collegesmust balance the challenge of ensur-ing both access—the open door tohistorically underserved popula-tions—and success—measurableattainment in the form of degrees,certifications, and other benchmarksof achievement. The National Profilehelps document these trends.
The National Profile’s data comefrom several sources, including surveys conducted by the AmericanAssociation of Community Colleges(AACC), scholars from the communi-ty college field, the U.S. Departmentof Education, the U.S. CensusBureau, and the Bureau of LaborStatistics. Because of differingmethodologies, numbers may varyacross the many tables and figuresdespite efforts to report statisticsconsistently. The most recent dataavailable were used to create thesetables. Many data sets are notimmediately available after collec-tion, as they must go through inter-nal review processes at the organiza-tion that collects them.
Overall enrollment is reportedusing full-year unduplicated head-counts. This method counts eachstudent once for the academic yearregardless of the number of terms in which he or she attended classes.Breakdowns within student enrollments are not available forfull-year, unduplicated headcounts.Therefore, race, sex, age, and other
demographic information arereported based on fall term atten-dance, which accounts for 60% ofthe full-year enrollment. In somecases, statistics may not add up to100% because of rounding.
The National Profile focuses oncredit enrollment at community col-leges because no accurate nationaldata exist about noncredit activity atcommunity colleges. The U.S.Department of Education providesdefinitions and a collection mecha-nism for credit enrollment throughthe Integrated PostsecondaryEducation Data System (IPEDS),but noncredit enrollment has noequivalent.
Based on contacts with statesthat collect some of this informa-tion, AACC estimates that morethan 5 million students each year participate in some form ofnoncredit educational activities atcommunity colleges. Noncreditcoursework is a substantial andgrowing component of communitycollege activity—far more than personal interest or recreationalclasses. Career, technical, and vocational studies are importantcomponents, with many noncreditclasses leading to some form of vendor certification. Most collegesalso offer noncredit, contractedtraining customized to fit the needsof local business and industry, government agencies, and otherorganizations. AACC hopes to seean increase in the reporting of non-credit enrollment and will continueto monitor the data as they areavailable.

x American Association of Community Colleges
summarizing the data presented inmany of the tables. DeannaD’Errico provided significant sup-port in editing and guiding thispublication through to completion.
Margaret Rivera provided supportthroughout the production of thispublication, reviewing manuscriptsand data and providing general over-sight to this project. D
This book would not have been pos-sible without the hard work and sup-port of many people. Sara McPhee,Arina Lindley, and Cynthia Vervenaprovided assistance in collecting and
�

1National Profile of Community Colleges: Trends & Statistics 4TH EDITION
The seeds of the Americancommunity college wereplanted just before the Civil
War when Congress passed theMorrill Act in 1862. This legislationwas the first concrete expression ofthe belief that all citizens, not just aprivileged few, should have access tohigher education. Extended to theformer Confederate states in 1890,the Morrill Act granted each state30,000 acres of federal land permember of its congressional delega-tion to establish a university, hencethe term land grant. These publicuniversities were to prepare studentsfor careers in agriculture, engineering,and military science: In effect, thenew public institutions constitutedthe first national workforce develop-ment initiatives. At the same time,the concept of basic education for allAmericans was expanding with therise of public high schools thatextended schooling beyond the ele-mentary grades.
At the turn of the century, yetanother innovation was introducedin American education when it
became apparent that some meanswas needed to bridge the spanbetween high schools and universi-ties. Students who sought a tradi-tional liberal arts education couldapply for admission to public andprivate colleges and universities,according to Cohen and Brawer(2003). However, these traditionalinstitutions generally did not addressthe need for trained workers to servethe industries that were emerging inthe first decades of the 20th century,nor were sufficient seats available forall who sought entry to higher edu-cation. The pressure to train work-ers, coupled with the growingimportance of science and technolo-gy, gave impetus to the move toestablish two-year colleges that com-bined liberal education with college-level vocational instruction. Calledjunior colleges, these original institu-tions were usually branches of eitherlocal school districts or universities.
Joliet Junior College, establishedin 1901, is the oldest continuouslyoperating public two-year college inthe United States. Grounded in the
ideas of educators William RaineyHarper, president of the University ofChicago, and J. Stanley Brown, prin-cipal of the public high school inJoliet, Illinois, the new institutionoffered a fifth and sixth year of studybeyond high school that was compa-rable to the first two years of college.High school graduates who lackedmoney to attend or were not accept-ed at the highly competitive universi-ties of the era now had access to post-secondary education. Even before1901, a number of two-year privatecolleges existed around the country,in part to train teachers for the grow-ing public education system.
The new model gained populari-ty rapidly, and by 1910, 5% ofAmerican 18-year-olds were enrollingin colleges and universities, includingthe newly created junior colleges.During that same period, Californialegislators provided their high schoolswith funding to offer the first twoyears of college study, and by 1921that state had established 21 colleges,the largest system of public two-yearcolleges in the country. Missouri,
Community CollegesPast and Present
I
2 American Association of Community Colleges
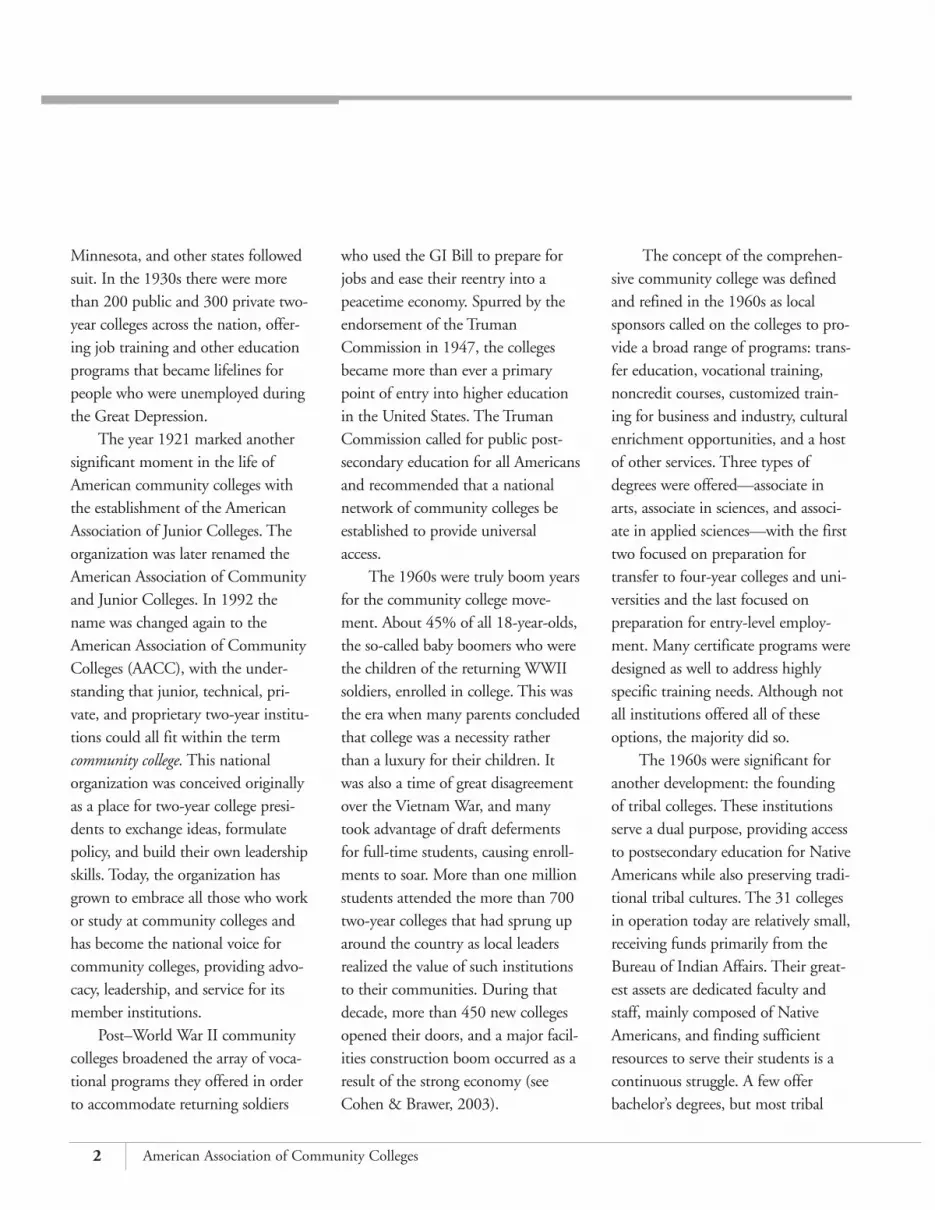
Minnesota, and other states followedsuit. In the 1930s there were morethan 200 public and 300 private two-year colleges across the nation, offer-ing job training and other educationprograms that became lifelines forpeople who were unemployed duringthe Great Depression.
The year 1921 marked anothersignificant moment in the life ofAmerican community colleges withthe establishment of the AmericanAssociation of Junior Colleges. Theorganization was later renamed theAmerican Association of Communityand Junior Colleges. In 1992 thename was changed again to theAmerican Association of CommunityColleges (AACC), with the under-standing that junior, technical, pri-vate, and proprietary two-year institu-tions could all fit within the termcommunity college. This nationalorganization was conceived originallyas a place for two-year college presi-dents to exchange ideas, formulatepolicy, and build their own leadershipskills. Today, the organization hasgrown to embrace all those who workor study at community colleges andhas become the national voice forcommunity colleges, providing advo-cacy, leadership, and service for itsmember institutions.
Post–World War II communitycolleges broadened the array of voca-tional programs they offered in orderto accommodate returning soldiers
who used the GI Bill to prepare forjobs and ease their reentry into apeacetime economy. Spurred by theendorsement of the TrumanCommission in 1947, the collegesbecame more than ever a primarypoint of entry into higher educationin the United States. The TrumanCommission called for public post-secondary education for all Americansand recommended that a nationalnetwork of community colleges beestablished to provide universalaccess.
The 1960s were truly boom yearsfor the community college move-ment. About 45% of all 18-year-olds,the so-called baby boomers who werethe children of the returning WWIIsoldiers, enrolled in college. This wasthe era when many parents concludedthat college was a necessity ratherthan a luxury for their children. Itwas also a time of great disagreementover the Vietnam War, and manytook advantage of draft defermentsfor full-time students, causing enroll-ments to soar. More than one millionstudents attended the more than 700two-year colleges that had sprung uparound the country as local leadersrealized the value of such institutionsto their communities. During thatdecade, more than 450 new collegesopened their doors, and a major facil-ities construction boom occurred as aresult of the strong economy (seeCohen & Brawer, 2003).
The concept of the comprehen-sive community college was definedand refined in the 1960s as localsponsors called on the colleges to pro-vide a broad range of programs: trans-fer education, vocational training,noncredit courses, customized train-ing for business and industry, culturalenrichment opportunities, and a hostof other services. Three types ofdegrees were offered—associate inarts, associate in sciences, and associ-ate in applied sciences—with the firsttwo focused on preparation for transfer to four-year colleges and uni-versities and the last focused onpreparation for entry-level employ-ment. Many certificate programs weredesigned as well to address highly specific training needs. Although notall institutions offered all of theseoptions, the majority did so.
The 1960s were significant foranother development: the foundingof tribal colleges. These institutionsserve a dual purpose, providing accessto postsecondary education for NativeAmericans while also preserving tradi-tional tribal cultures. The 31 collegesin operation today are relatively small,receiving funds primarily from theBureau of Indian Affairs. Their great-est assets are dedicated faculty andstaff, mainly composed of NativeAmericans, and finding sufficientresources to serve their students is acontinuous struggle. A few offerbachelor’s degrees, but most tribal

3National Profile of Community Colleges: Trends & Statistics 4TH EDITION
colleges offer the associate degree astheir highest credential.
The independent, nonprofit,two-year colleges faced many chal-lenges during the last half of the20th century. At one time morenumerous than their sister publicinstitutions, the independent col-leges saw the balance shift in themid 1950s when they became lessable to compete with the lower costsand greater resources of the publicsector. Some ceased operations andothers merged with universities orbecame baccalaureate-granting insti-tutions. Today there are fewer than150 independent two-year collegesin operation, many of them single-sex or religiously affiliated.
Now, 100 years after the firstvisionary leaders made the Americandream of universal access to highereducation a reality through a nation-wide network of two-year colleges,these institutions play a central role inthe lives of millions of people andtheir communities. In Fall 2002, 11.6million students were enrolled in the1,158 public, independent, and tribalcommunity colleges, including 6.6million students taking courses forcredit and 5 million taking noncreditcourses, most of whom were partici-pating in short-term job training.Most Americans have a communitycollege, branch campus, or extensioncenter within an hour’s drive of theirhomes, and they turn to their local
college whenever they have learningneeds over the course of a lifetime.For many communities, these collegesare also the center of recreational andcultural life in the area. Furthermore,community colleges have been recog-nized as a critical element of the eco-nomic well-being of the nation, andcountries around the world are look-ing to adapt this model for their ownpostsecondary education systems.
Contemporary community col-leges face numerous challenges asthey enter their second century ofservice. American higher education isevolving from a European modelintroduced in the Middle Ages to aform that is not yet fully defined.Clearly, any new model must bemarked by greater flexibility, fewerboundaries, and more varied struc-tures. The hallmark of communitycolleges has always been flexible andrapid response to learners’ needs, sothey are well positioned to lead thisevolution. In the meantime and forthe near future, the colleges mustaddress these significant challenges:
• limited funding in combinationwith substantial enrollmentgrowth
• increasing demand for accounta-bility
• growing diversity in the studentbody
• renewed emphasis on workforceand teacher preparation
• constantly changing technologies• impending turnover in community
college leadership
The paramount challenge, ofcourse, is how to fund a broad rangeof services for a growing student bodywhen resources continue to be limit-ed. The early years of the currentdecade have been difficult ones forcommunity colleges as state fundingfor higher education has beenreduced drastically because of thedepressed economy. Colleges’ alloca-tions have been significantly reduced,particularly in those states that collectthe greater portion of revenuesthrough income and sales taxes—which are the revenue sources mostlikely to be affected by an economicdownturn. In fact, state tax fundingfor higher education in 2000 (basedon per capita personal income) was$23.4 billion below the peak expen-diture reached in 1979, according to Mortenson (2000) of The PellInstitute for the Study of Opportunityin Higher Education.
Community colleges have usedsome traditional and some newstrategies for coping with theirreduced financial resources. Manyhave cut faculty and staff positions ordelayed filling vacancies. Equipmentpurchases, facilities maintenance, andconstruction projects have also beenpostponed. In an effort to bring inadditional revenues, tuition and fees

4 American Association of Community Colleges
at the colleges increased an average of12% in 2002.
On the more creative side, somecolleges have forged new partner-ships with private industry and nonprofit organizations to supportcostly career program curricula suchas nursing, automotive technology,and information technology. Othershave worked with their states tointroduce slot machines or othermeans of increasing revenues foreducation. In New Jersey, the gover-nor and the community collegessigned a formal agreement, the NewJersey Compact, which makes theseinstitutions the preferred providers ofworkforce training, working in con-junction with the U.S. Departmentsof Commerce, Labor, and Education.The New Jersey colleges will alsopartner with the AFL-CIO to offerapprentice training. Still other col-leges are taking advantage of newfederal funds for special programssuch as homeland security.
The funding stresses of the early2000s must be placed in the contextof the growing demand for postsec-ondary education. Between 1998 and2002, enrollments in two-year col-leges increased by 18%, while four-year institutions grew at a rate of only10% (National Center for EducationStatistics [NCES], 2004e). There aremany reasons for this enrollmentincrease, including a larger college-agepopulation (the baby boom echo),
the need to retrain workers dis-placed by a poor economy, and thegreater numbers of people of colorundertaking college studies. The rising cost of attending four-yearcolleges and universities has alsopushed many students to begin theirstudies at a community college,where tuition is substantially lowerand they can save on the overall costof a college education. Nevertheless,one consequence of the funding difficulties community colleges haveexperienced in recent years is thatthey have been forced to turn awayhundreds of thousands of studentsbecause they simply do not have theresources to serve them.
There are signs that this grimeconomic picture is changing. In2004, a number of states—includingCalifornia, Virginia, North Carolina,and Arizona—increased their alloca-tions for community colleges afterseveral years of budget cuts. Theseincreased funds are certainly wel-come, but it will take the colleges several years to catch up and restoreservices they reduced or eliminatedduring the lean years. And, giventhe trend toward continued enroll-ment growth, the colleges will needto manage well the resources theydo have in order to continue offer-ing the highest quality and greatestrange of education services for theircommunities.
Another challenge for the present
and the immediate future is the con-tinuing demand for accountability.The reduction in government sup-port for higher education has notlessened the interest in holding col-leges accountable; rather, it has pro-duced an even greater desire to ensurethat public dollars are spent wiselyand that there is a real return oninvestment. The EducationCommission of the States (2000)reported that as of 2001, 19 stateshad some form of performance fund-ing tying a percentage of budget allo-cations to an institution’s achievementon specified performance criteria.Twenty-seven states had performancebudgeting requirements that allowgovernors and legislators to considercampus achievement on key indica-tors as one factor in determining allocations. Thirty-nine states hadperformance reporting programsmandating that colleges provide periodic updates regarding their per-formance on key indicators, but theywere not tied to funding. Many statescombine either performance fundingor performance budgeting withreporting requirements.
Working with state agencies andeducation organizations, communitycolleges have become actively engagedin identifying key indicators that givea true picture of their effectiveness.This is a very complex process inlight of the diverse education goalsstudents have when enrolling and the

5National Profile of Community Colleges: Trends & Statistics 4TH EDITION
broad mission of the colleges, rangingfrom transfer education to careerpreparation to community develop-ment and enrichment. States nowspecify between 3 and 37 key indica-tors of institutional effectiveness, suchas graduation rates, transfer rates,passing scores on licensure exams,student satisfaction, and job place-ment data. To address these accounta-bility mandates, community collegeshave developed much more sophisti-cated means of collecting and analyz-ing data, and many have increasedtheir research staffs.
The growing diversity of the stu-dent body is another challenge that isexpected to continue over the next 20to 30 years, based on population pro-jections. One group of studentsincludes recent high school graduateswho plan to transfer to baccalaureate-granting institutions. Another groupis somewhat older, often lacks basicskills and English language skills, andseeks job skills for immediate entryinto the workforce. Yet another groupis composed of workers who want todiversify or upgrade job skills througheither credit or noncredit study.Finally, there is a group that seeksenrichment through coursework andrecreational or cultural activities. Ofcourse, these groups include bothmen and women and people of allcolors, abilities, academic preparation,and ages. Community colleges mustaddress the lifelong learning
demands of all these groups througha comprehensive array of servicesthat is constantly being adjusted.This requires greater capacity overalland the willingness to let go of serv-ices that are no longer useful whilerapidly deploying new services tar-geted to specific, even individualized,needs. Ultimately, this challengefocuses on ensuring students’ educa-tional success over a lifetime regard-less of their backgrounds and goals.
The contemporary communitycollege is also challenged by the needto maintain the currency of curriculain light of workforce preparationmandates, competition from othereducation providers, and the global-ized economy. New programs appearalmost daily as colleges develop pro-grams that prepare workers foremerging career fields, such as infor-mation technology security andhomeland security.
To meet workforce preparationmandates while addressing the cur-rent shortage of teachers, many col-leges have been prompted tostrengthen existing teacher trainingprograms or add new ones. Theyhave established more formal articula-tion agreements with baccalaureateteacher preparation programs so thatstudents can move smoothly fromone institution to another and reducetime in training. In some cases, theseagreements involve dual enrollmentand special support services. Still
other two-year colleges have intro-duced baccalaureate teacher trainingprograms of their own. For example,in 2003, a new College of Educationat Miami Dade College (FL) beganoffering bachelor’s degree programsleading to teacher certification inexceptional student education(K–12), secondary mathematics(6–12), and secondary science (6–12)with concentrations in biology, chem-istry, earth science, and physics.
The decision to offer bachelor’sdegrees at community colleges is thesubject of considerable discussion atthe moment. On one hand, propo-nents state that this level of program-ming is needed to serve students whowould have difficulty engaging instudy at distant universities. If accessto higher education is the issue, thenthese degrees make sense. The prox-imity and lower costs of programs atcommunity colleges are positive fac-tors in the eyes of these supporters.On the other hand, opponents insistthat offering bachelor’s degrees is aform of “mission creep” that distractsfrom the community college’s truepurpose and may divert neededresources away from associate-levelprograms. Opponents also feel thathaving both levels of degrees on thesame campus could create a kind ofclassism among faculty and students.
Coping with continuouslychanging technologies is yet anotherchallenge for community colleges.

6 American Association of Community Colleges
Maintaining current, up-to-date labo-ratories, training facilities, and curric-ula for students is critical to ensurethat exiting students take with themskills that not only meet marketdemands but also will make themcompetitive in the current market-place. Now and for the foreseeablefuture, every instructional andadministrative process will be affected by technology. At present,the majority of faculty have intro-duced some form of technology intotheir teaching repertoire, rangingfrom simple PowerPoint presenta-tions in the classroom to full-scaleonline courses and degree programs.Computerized simulations, streamingvideo, synchronous and asynchro-nous discussions, and many othertechnology-assisted instructionalactivities are becoming the norm. E-mail is the standard for communi-cation between instructors and students, and course managementsystems such as WebCT andBlackboard are widely used. As a nat-ural consequence of these instruction-al innovations, colleges are underconsiderable pressure to provide state-of-the-art equipment, the latest soft-ware, and regular training for faculty.
On the administrative side, afteran initial sluggish period, colleges aretruly becoming paperless—replacingcatalogs, personnel and proceduresmanuals, budget materials, studentrecords, and many other materialswith online versions. Moreover, col-leges are finding that such changesinvolve more than simple transitionsfrom paper to electronic formats;each process must be reconceived andredesigned, with the incentive ofreducing processing time and allow-ing greater access to useful data forfaculty and staff. Technologies arealso affecting facilities. New con-struction generally takes the form of“smart buildings,” where many func-tions are controlled by computer, andolder facilities are being retrofitted tobe smart as well.
The high cost of all of these newtechnology tools, together with therelated staff training and technicalsupport costs, places great pressureon colleges to acquire sufficient fiscalresources and manage these wisely.This is particularly difficult duringyears when the American economiccycle is in a downturn, which hap-pens at some point in each decade.During these periods, college leaders
must try to keep education costsaffordable while also ensuring thatenough dollars flow into the institu-tion from public and private sourcesto support all operations, includingthose that are technology based.
The many challenges facingcommunity colleges today must beaddressed at the same time that asignificant turnover in leadership isoccurring. A survey conducted in2001 by AACC (Shults, 2001)showed that between one quarterand one half of presidents and senior administrators expected toretire in the next three to five years.Similar rates have been projected forsenior faculty and support staff. Theretirement exodus in this decadewill entail a significant loss of insti-tutional knowledge, but it will alsopresent opportunities to do thingsdifferently and bring rising starsamong administrators and faculty tothe fore. Fortunately, communitycolleges have a long history ofresilience and innovation that willallow them to make the leadershiptransition and find effective solu-tions for contemporary and futurechallenges. D

7National Profile of Community Colleges: Trends & Statistics 4TH EDITION
200
400
600
800
1,000
1,200
1901 1910 1920 1930 1940 1950 1960
Year
1970 1980 1990 2000 2004
Num
ber
of c
olle
ges
Figure 1.1Number of Community Colleges: 1901–2004
Source: AACC (2004b)

8 American Association of Community Colleges
Table 1.1Number of Community Colleges: 1901–2004
Source: AACC (2004b)
Year # of Colleges
1901 1
1910 25
1920 74
1930 180
1940 238
1950 330
1960 412
1970 909
1980 1,058
1990 1,108
2000 1,155
2004 1,158
9National Profile of Community Colleges: Trends & Statistics 4TH EDITION
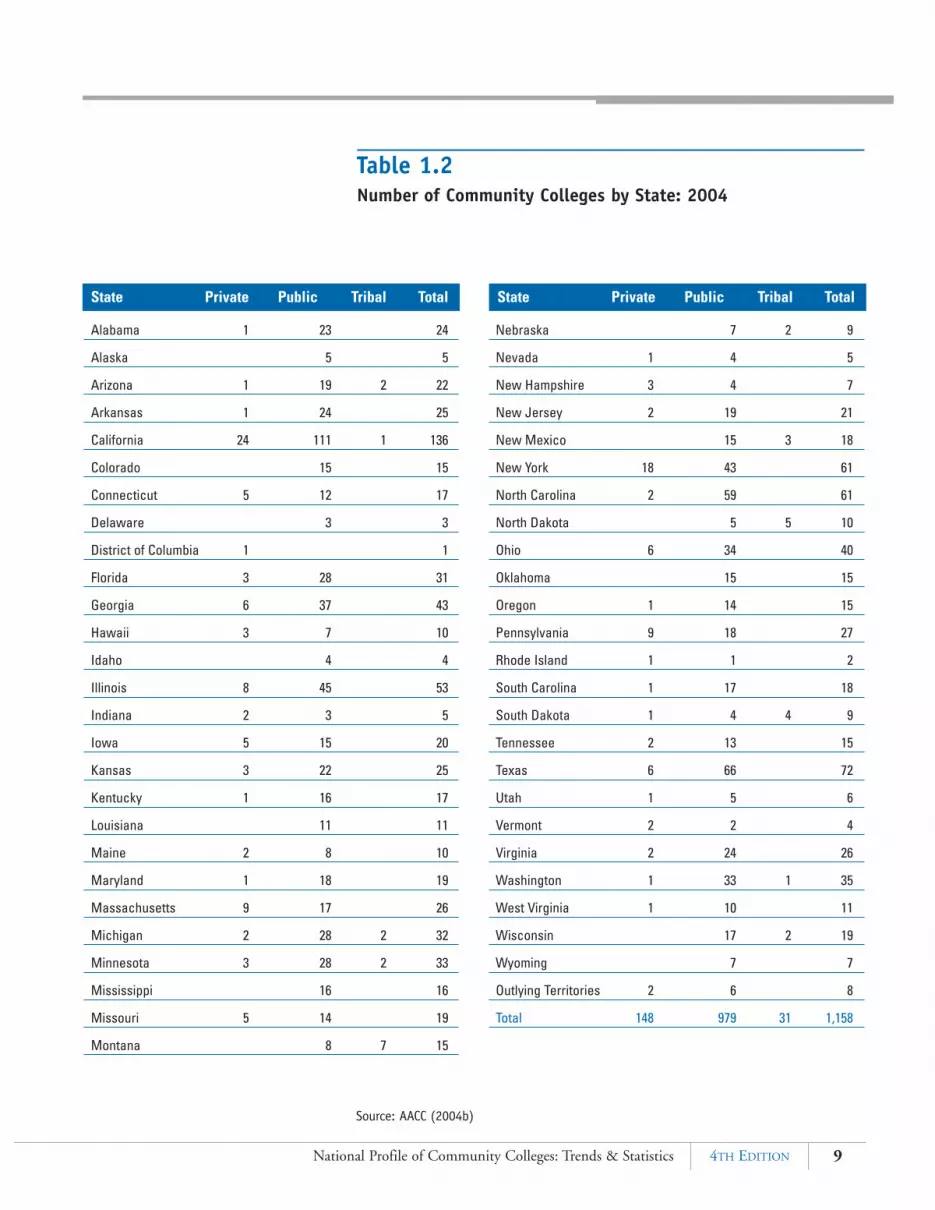
Table 1.2Number of Community Colleges by State: 2004
Source: AACC (2004b)
Alabama 1 23 24
Alaska 5 5
Arizona 1 19 2 22
Arkansas 1 24 25
California 24 111 1 136
Colorado 15 15
Connecticut 5 12 17
Delaware 3 3
District of Columbia 1 1
Florida 3 28 31
Georgia 6 37 43
Hawaii 3 7 10
Idaho 4 4
Illinois 8 45 53
Indiana 2 3 5
Iowa 5 15 20
Kansas 3 22 25
Kentucky 1 16 17
Louisiana 11 11
Maine 2 8 10
Maryland 1 18 19
Massachusetts 9 17 26
Michigan 2 28 2 32
Minnesota 3 28 2 33
Mississippi 16 16
Missouri 5 14 19
Montana 8 7 15
Nebraska 7 2 9
Nevada 1 4 5
New Hampshire 3 4 7
New Jersey 2 19 21
New Mexico 15 3 18
New York 18 43 61
North Carolina 2 59 61
North Dakota 5 5 10
Ohio 6 34 40
Oklahoma 15 15
Oregon 1 14 15
Pennsylvania 9 18 27
Rhode Island 1 1 2
South Carolina 1 17 18
South Dakota 1 4 4 9
Tennessee 2 13 15
Texas 6 66 72
Utah 1 5 6
Vermont 2 2 4
Virginia 2 24 26
Washington 1 33 1 35
West Virginia 1 10 11
Wisconsin 17 2 19
Wyoming 7 7
Outlying Territories 2 6 8
Total 148 979 31 1,158
State Private Public Tribal Total State Private Public Tribal Total

10 American Association of Community Colleges
Figure 1.2Location of Community Colleges

11National Profile of Community Colleges: Trends & Statistics 4TH EDITION
Source: AACC (2004b)

12 American Association of Community Colleges
Table 1.3Undergraduate Enrollment: Fall 2001 and Full Year 2001–2002
Source: NCES (2004e, 2004h)
Full year Fall as a % College Type Fall 2001 2001–2002 of full year
Public 6,097,454 9,937,952 61.4%
Independent 134,383 195,922 68.6%
Total 6,231,837 10,133,874 61.5%
Full year Fall as a % College Type Fall 2001 2001–2002 of full year
Public 4,962,705 5,816,865 85.3%
Independent 2,671,851 3,051,839 87.5%
Total 7,634,556 8,868,704 86.1%
Community Colleges
4-Year Colleges

13National Profile of Community Colleges: Trends & Statistics 4TH EDITION
CaliforniaArizona
New MexicoIllinois
WashingtonWyoming
KansasOregon
NebraskaTexas
AlaskaUtahIowa
NevadaNational Total
MinnesotaVirginiaFlorida
MichiganNorth Carolina
ColoradoMaryland
IdahoHawaii
MississippiWisconsinOklahomaArkansasAlabama
South CarolinaRhode Island
KentuckyMissouri
OhioDelaware
New JerseyNew York
GeorgiaMassachusettsNorth Dakota
TennesseeIndiana
ConnecticutMontana
New HampshirePennsylvaniaWest Virginia
MaineLouisiana
South DakotaVermont
District of Columbia
4% 8% 10% 12%6%2%
Figure 1.3Percentage of U.S. Population Aged 18 or Older Served byCommunity Colleges: 2001–2002
Source: NCES (2004h); U.S. Census Bureau (2004b)

14 American Association of Community Colleges
Table 1.4Percentage of U.S. Population Aged 18 or Older Served byCommunity Colleges: Fall 2001 and Full Year 2001–2002
% of % ofFall as a % of Population population population
Full year full-year aged 18 or served servedState Fall 2001 2001–2002 enrollment older fall 2001 2001–2002 Rank
Alabama 76,500 119,583 64.0% 3,355,089 2.3% 3.6% 28
Alaska 11,736 23,934 49.0% 443,064 2.6% 5.4% 11
Arizona 185,039 344,333 53.7% 3,861,087 4.8% 8.9% 2
Arkansas 45,401 72,423 62.7% 2,011,990 2.3% 3.6% 27
California 1,481,850 2,460,008 60.2% 25,177,335 5.9% 9.8% 1
Colorado 79,220 137,236 57.7% 3,291,814 2.4% 4.2% 20
Connecticut 44,148 64,068 68.9% 2,593,471 1.7% 2.5% 42
Delaware 12,291 18,224 67.4% 604,636 2.0% 3.0% 34
District of Columbia — — — 460,873 0.0% 0.0% 51
Florida 345,619 551,038 62.7% 12,568,154 2.7% 4.4% 17
Georgia 108,313 171,884 63.0% 6,162,187 1.8% 2.8% 37
Hawaii 25,969 37,632 69.0% 931,428 2.8% 4.0% 23
Idaho 27,014 39,029 69.2% 950,204 2.8% 4.1% 22
Illinois 345,475 684,062 50.5% 9,272,276 3.7% 7.4% 4
Indiana 69,219 112,339 61.6% 4,535,822 1.5% 2.5% 41
Iowa 72,353 111,879 64.7% 2,221,237 3.3% 5.0% 13
Kansas 72,545 124,364 58.3% 1,998,360 3.6% 6.2% 7
Kentucky 69,762 101,986 68.4% 3,079,098 2.3% 3.3% 31
Louisiana 33,169 57,301 57.9% 3,268,183 1.0% 1.8% 48
Maine 12,905 17,816 72.4% 991,471 1.3% 1.8% 47
Maryland 109,848 165,221 66.5% 4,017,277 2.7% 4.1% 21
Massachusetts 90,301 134,645 67.1% 4,925,984 1.8% 2.7% 38
Michigan 201,407 324,624 62.0% 7,433,782 2.7% 4.4% 18
Minnesota 130,189 175,543 74.2% 3,717,580 3.5% 4.7% 15
Mississippi 60,376 84,397 71.5% 2,094,765 2.9% 4.0% 24
Missouri 85,021 134,227 63.3% 4,229,728 2.0% 3.2% 32
Montana 10,049 16,303 61.6% 685,747 1.5% 2.4% 43
% Served# Served

15National Profile of Community Colleges: Trends & Statistics 4TH EDITION
Source: NCES (2004e, 2004h)
% of % ofFall as a % of Population population population
Full year full-year aged 18 or served servedState Fall 2001 2001–2002 enrollment older fall 2001 2001–2002 Rank
Nebraska 36,117 71,547 50.5% 1,276,129 2.8% 5.6% 9
Nevada 49,081 77,119 63.6% 1,543,076 3.2% 5.0% 14
New Hampshire 15,063 21,959 68.6% 951,142 1.6% 2.3% 44
New Jersey 132,100 189,285 69.8% 6,396,274 2.1% 3.0% 35
New Mexico 54,599 97,995 55.7% 1,328,276 4.1% 7.4% 3
New York 285,695 407,357 70.1% 14,441,533 2.0% 2.8% 36
North Carolina 181,629 262,416 69.2% 6,171,175 2.9% 4.3% 19
North Dakota 9,098 13,223 68.8% 485,091 1.9% 2.7% 39
Ohio 176,741 268,356 65.9% 8,537,248 2.1% 3.1% 33
Oklahoma 61,461 94,800 64.8% 2,588,799 2.4% 3.7% 26
Oregon 87,208 157,877 55.2% 2,618,763 3.3% 6.0% 8
Pennsylvania 132,749 201,656 65.8% 9,418,495 1.4% 2.1% 45
Rhode Island 18,372 27,102 67.8% 814,451 2.3% 3.3% 30
South Carolina 71,956 106,055 67.8% 3,046,567 2.4% 3.5% 29
South Dakota 6,865 8,300 82.7% 560,348 1.2% 1.5% 49
Tennessee 77,230 112,660 68.6% 4,348,929 1.8% 2.6% 40
Texas 487,502 843,088 57.8% 15,302,983 3.2% 5.5% 10
Utah 55,377 83,492 66.3% 1,549,836 3.6% 5.4% 12
Vermont 6,209 6,629 93.7% 471,443 1.3% 1.4% 50
Virginia 149,939 242,740 61.8% 5,433,719 2.8% 4.5% 16
Washington 184,899 325,831 56.7% 4,483,340 4.1% 7.3% 5
West Virginia 18,890 25,272 74.7% 1,406,199 1.3% 1.8% 46
Wisconsin 109,376 161,692 67.6% 4,064,317 2.7% 4.0% 25
Wyoming 17,179 25,269 68.0% 369,486 4.6% 6.8% 6
Outlying Territories 15,575 18,055 86.3% — — — —
Total 6,246,629 10,133,874 61.6% 212,490,261 2.9% 4.8%
% Served# Served

16 American Association of Community Colleges
Figure 1.4Enrollment at Community Colleges: Fall 2002
Less than 1,00021%
1,000–1,99916%
2,000–2,99912%
3,000–3,99911%
4,000–4,9998%
5,000–9,99917%
10,000 or more15%
Source: NCES (2004e)

17National Profile of Community Colleges: Trends & Statistics 4TH EDITION
Figure 1.5Percentage Distribution of Community Collegesby Enrollment: 2002
20%
10%
30%
40%
50%
60%
70%
80%
Less than1,000
1,000–1,999
2,000–2,999
3,000–3,999
Enrollment
4,000–4,999
5,000–9,999
10,000or more
Dist
ribu
tion
of
colle
ges
Source: NCES (2004e)
■ Public■ Independent

18 American Association of Community Colleges
Figure 1.6Distribution of Community Colleges by Urbanicity: 2002
Large city14%
Fringe of large city18%
Midsized city24%
Fringe of midsized city6%
Large town5%
Small town24%
Rural9%
Source: NCES (2004h)

19National Profile of Community Colleges: Trends & Statistics 4TH EDITION
Community colleges continueto be seen as the portal toopportunity in the United
States, offering high-quality educa-tion programs and services that meetthe needs of an increasingly diversenational population. Whether stu-dents enroll for a few courses or afull-degree program, they expect toleave with the knowledge and skillsneeded for effective participation inthe workforce and civic life of thiscountry. For those who aspire to ahigher standard of living, communi-ty colleges are truly an open door.
The reasons for choosing toattend these community colleges areas diverse as the students themselves:ease of access, low cost, excellent aca-demic programs that meet learners’and employers’ needs, a broad arrayof support services, proximity to stu-dents’ homes, flexibility of schedul-ing, a welcoming campus environ-ment, and links to other levels ofeducation. And, in an era when mostjobs require at least some collegeeducation and most people canexpect to work outside the home for
a major portion of their lives, thedecision to attend college is not aluxury but a necessity. For more than6.5 million students taking coursesfor credit each fall, these institutionshave become the colleges of choice.
The aspirations of these studentsare equally varied. Some seek career-focused degrees that will allow themto enter or move upward in the jobmarket. Others plan to transfer toinstitutions offering bachelor’s degreesafter one or two years of study. Someare broadening their array of job skillsby taking a set of courses or anotherdegree in a specialized area so theycan be more competitive in the work-force. A growing number of studentsalready have degrees (associate, bache-lor’s, master’s, and higher degrees) andare coming to community colleges forspecific job skills that will help themchange careers or advance in theircurrent careers. Newly arrived immi-grants look to community colleges asa place to learn English and gain jobskills. Still others enroll for enrich-ment courses in the arts, new tech-nologies, or other areas of interest.
Ease of access and low cost are oftenthe factors that first draw students tocommunity college campuses. Even ifthey decide to enroll at the lastmoment, students generally can gainentry to the college, although specificacademic programs may have selec-tive admissions. Based on skillsassessments and counseling at thepoint of initial enrollment, they areable to design a program of studythat meets their education goals andlife circumstances.
Recent national surveys confirmthat cost is the primary concern ofmost college students. Many of themare financially independent, workingfull or part time and supporting fam-ilies while enrolled. (CommunityCollege Survey, 2002; NCES, 1996).The low tuition at community col-leges, combined with the possibilityof financial aid, makes postsecondaryeducation an option for many whootherwise could not attend collegebecause they lack the financialresources. For low-income families,these colleges provide a way toescape the cycle of poverty.
Community College Enrollment
II

20 American Association of Community Colleges
Community colleges also offer manyfamilies a means to reduce the totalcost of a baccalaureate education bykeeping expenses low for the first twoyears and making the transition easierthrough articulation agreements withfour-year institutions. Furthermore,the presence of a community collegewithin driving distance of most peo-ple’s homes allows students to avoidthe expenses associated with residen-tial campuses. Community collegesprovide an excellent alternative tofour-year and for-profit institutions.
Currently, the average age ofcommunity college students is 29.(NCES, 2004j;) This is probablycaused primarily by an increase in thenumber of traditional-age students(17–21) attending community col-leges. The lower tuition at communi-ty colleges, along with cost savingsfrom staying at home, are incentivesfor many students and families of thebaby boom generation.
Since 1985, more than half of allcommunity college students havebeen women. Many of these womenare in their mid- to late twenties,attend part time, have children, andhave chosen to return to school sothey can gain skills to help supporttheir families. Easy access and lowcost are compelling factors in theirdecision to enroll. Other attractionsare the existence of support servicessuch as tutoring and campus-basedchild care at many of the colleges, as
well as the close proximity of cam-puses to their homes. Also, becausesome of these female students areunsure about their ability to succeedacademically, the nonthreateninglearning-centered campus environ-ment allows them to make a com-fortable transition into college.
Students of color have foundcommunity colleges to be an excel-lent entry point into higher educa-tion. At present, the majority ofBlack and Hispanic students in thiscountry begin their postsecondarystudies at these colleges. Low tuitionis certainly an important factor, andthe greater diversity of the studentpopulation may help minorities—who are often the first in their fami-lies to attend college—feel at homeon campus. Many colleges offer tar-geted services for these students,including English language studies,social activities, and articulationagreements with historically Blackcolleges and universities (HBCUs).At least seven community colleges,primarily in the South, are HBCUs.For students of color, like female stu-dents, close proximity to home andflexible course schedules at two-yearcolleges help them meet family andjob obligations and maintain links totheir communities.
About 33% of all communitycollege students are minorities, andthat proportion is expected to rise asthe American population becomes
increasingly diverse. This contingentof minority students includes a grow-ing number of Asian Americans and asmall population enrolled at tribalcolleges established specifically tomeet the education needs of NativeAmericans. One noteworthy develop-ment over the past few years has beenan increase in the number of collegesdesignated by the federal governmentas Hispanic-serving institutions(HSIs), that is, colleges with morethan 25% Hispanic student enroll-ment. Particularly in the Southwestand West, the number of HSIs thatare community colleges is expected toincrease dramatically in the next fewyears.
The comprehensive mission ofmost community colleges makesthem attractive to a broad range ofpeople who seek particular programsor opportunities. Many teens acceler-ate their studies by taking collegecourses while in high school throughdual-enrollment and advanced place-ment options, thus saving substan-tially on the cost of education. High-performing students can participatein honors programs; the communitycollege honors society, Phi ThetaKappa; and student leadership pro-grams. Students who lack the skillsfor college study can begin withdevelopmental education and Englishas a second language courses.Baccalaureate holders can return tostudy new areas or expand their job

21National Profile of Community Colleges: Trends & Statistics 4TH EDITION
skills. People with disabilities canenroll at these readily accessiblecampuses and succeed academicallywith the aid of special support serv-ices. Foreign students can takeadvantage of America’s superiorhigher education system and make atransition to life in the United Statesor apply their advanced learning intheir home countries after gradua-tion. Senior citizens can take creditand noncredit courses and engage incultural activities or even attain thecollege degree they were unable toearn in their earlier years. Thenewest population of learners, thosewho choose to study through dis-tance education, has also found ahome in these colleges via theInternet. All of these groups enrichthe learning environment on com-munity college campuses.
An important component in themission of these institutions is todevelop the human capital that makesthis country a powerful global eco-nomic force. To that end, communitycolleges work closely with businessand industry to offer for-credit andnoncredit programs focused on work-force development. New academicprograms are continually being creat-ed and existing programs are fine-tuned to meet changing marketneeds. As new career fields such ascybersecurity, nanotechnology, agri-science, and biotechnology andhealth-care professionals who special-
ize in these fields emerge, communitycolleges are able to respond rapidlywith degree programs, certificates,and customized training. People seek-ing to enter existing fields where thedemand for workers is growing—such as health care, retailing, andhuman services—can gain skills attheir local college and move quicklyinto jobs.
With a highly diverse studentbody characterized by differing aspi-rations, life circumstances, and skilllevels, community colleges are chal-lenged to provide learning experi-ences and support services that meetthe needs of distinct groups. Theymust also be accountable for the out-comes of their programs and services,ensuring that all students accomplishtheir education goals and can demon-strate real learning that can be appliedin work and life settings. The chal-lenge is particularly difficult whenserving students who are consideredto be at high risk—students who areacademically underprepared, bur-dened with family responsibilities,working more than 30 hours perweek, studying part time, and lackingfinancial resources. They may haveless ambitious aspirations and aremore likely to drop out or pause.Fortunately, the array of services avail-able at community colleges and thegreater levels of individual attentionmake it possible for high-risk studentsto persist in their studies, complete
degrees, and move on to higher levelsof study or entry-level jobs.
Whatever the aspirations andpreparation levels of students whoenroll, they will find that communitycolleges offer a dynamic, learning-centered environment that fosterssuccess. In colleges that are makingthe transition to the learning collegemodel, faculty have developed newinstructional approaches that pro-duce measurable learning outcomes,and staff have strengthened the sup-port services that help studentsachieve their academic goals. Thesecolleges have become vibrant learningcommunities where students, faculty,and staff work collaboratively to learnand grow.
As the United States has movedfrom providing higher education pri-marily to the most privileged mem-bers of its population to one thatprovides opportunities to all mem-bers of the population, communitycolleges have come to the forefront,welcoming all those who aspire toadvanced learning. In partnershipwith schools, businesses, and otherorganizations in their local areas,community colleges provide oppor-tunities for learning over a lifetime.With enrollments at degree-grantinginstitutions projected to grow by20% in the next 10 years, communi-ty colleges—the people’s colleges—will continue to be a vital part ofAmerican life and learning. D

22 American Association of Community Colleges

23National Profile of Community Colleges: Trends & Statistics 4TH EDITION
Figure 2.1Undergraduate and Graduate Enrollment: 1965–2001
6
4
8
10
12
2
1965
1981
1989
1993
1999
2001
1997
1995
1991
1985
1987
1983
1973
1977
1979
1975
1969
1971
1967
Enro
llmen
t, in
mill
ions
Year
Source: Snyder (2003)
Note. Data are based on the U.S. Department of Education definition of community colleges(see Glossary).
4-year colleges
Community colleges

24 American Association of Community Colleges
Table 2.1Undergraduate and Graduate Enrollment: 1965–2001
Year Public Independent Total Public Independent Total Grand Total
1965a 1,041,264 131,688 1,172,952 2,928,332 1,819,580 4,747,912 5,920,864
1966a 1,189,169 136,801 1,325,970 3,159,748 1,904,154 5,063,902 6,389,872
1967a 1,372,053 140,709 1,512,762 3,443,975 1,955,011 5,398,986 6,911,748
1968a 1,646,474 145,822 1,792,296 3,784,178 1,936,617 5,720,795 7,513,091
1969 1,934,346 133,187 2,067,533 3,962,522 1,974,605 5,937,127 8,004,660
1970 2,195,412 123,973 2,319,385 4,232,722 2,028,780 6,261,502 8,580,887
1971 2,457,319 121,970 2,579,289 4,346,990 2,022,365 6,369,355 8,948,644
1972 2,640,939 115,247 2,756,186 4,429,696 2,028,938 6,458,634 9,214,820
1973 2,889,621 122,479 3,012,100 4,529,895 2,060,128 6,590,023 9,602,123
1974 3,285,482 118,512 3,403,994 4,703,018 2,116,717 6,819,735 10,223,729
1975 3,836,366 133,753 3,970,119 4,998,142 2,216,598 7,214,740 11,184,859
1976 3,751,786 131,535 3,883,321 4,901,691 2,227,125 7,128,816 11,012,137
1977 3,901,769 141,173 4,042,942 4,945,224 2,297,621 7,242,845 11,285,787
1978 3,873,690 154,777 4,028,467 4,912,203 2,319,422 7,231,625 11,260,092
1979 4,056,810 159,856 4,216,666 4,980,012 2,373,221 7,353,233 11,569,899
1980 4,328,782 197,505 4,526,287 5,128,612 2,441,996 7,570,608 12,096,895
1981 4,480,708 235,503 4,716,211 5,166,324 2,489,137 7,655,461 12,371,672
1982 4,519,653 252,053 4,771,706 5,176,434 2,477,640 7,654,074 12,425,780
1983 4,459,330 264,136 4,723,466 5,223,404 2,517,791 7,741,195 12,464,661
1984 4,279,097 251,676 4,530,773 5,198,273 2,512,894 7,711,167 12,241,940
1985 4,269,733 261,344 4,531,077 5,209,540 2,506,438 7,715,978 12,247,055
1986 4,413,691 265,857 4,679,548 5,300,202 2,523,761 7,823,963 12,503,511
1987 4,541,054 235,168 4,776,222 5,432,200 2,558,220 7,990,420 12,766,642
1988 4,615,487 259,668 4,875,155 5,545,901 2,634,281 8,180,182 13,055,337
1989 4,883,660 267,229 5,150,889 5,694,303 2,693,368 8,387,671 13,538,560
1990 4,996,475 243,608 5,240,083 5,848,242 2,730,312 8,578,554 13,818,637
1991 5,404,815 247,085 5,651,900 5,904,748 2,802,305 8,707,053 14,358,953
Community Colleges 4-Year Colleges

25National Profile of Community Colleges: Trends & Statistics 4TH EDITION
Community Colleges 4-Year Colleges
Source: Snyder (2003)
Note. Data are based on the U.S. Department of Education definition of community colleges(see Glossary).
aData for community college branch campuses of 4-year colleges are included with the 4-year colleges.
Year Public Independent Total Public Independent Total Grand Total
1992 5,484,555 237,835 5,722,390 5,900,012 2,864,957 8,764,969 14,487,359
1993 5,337,328 228,539 5,565,867 5,851,760 2,887,176 8,738,936 14,304,803
1994 5,308,467 221,243 5,529,710 5,825,213 2,923,867 8,749,080 14,278,790
1995 5,277,829 214,700 5,492,529 5,814,545 2,954,707 8,769,252 14,261,781
1996 5,314,463 248,864 5,563,327 5,806,036 2,998,157 8,804,193 14,367,520
1997 5,360,686 244,883 5,605,569 5,835,433 3,061,332 8,896,765 14,502,334
1998 5,245,963 243,351 5,489,314 5,891,806 3,125,847 9,017,653 14,506,967
1999 5,339,449 253,250 5,592,699 5,969,950 3,228,575 9,198,525 14,791,224
2000 5,697,388 251,043 5,948,431 6,055,398 3,308,460 9,363,858 15,312,289
2001 5,996,701 253,878 6,250,579 6,236,455 3,440,953 9,677,408 15,927,987
Change 1965–1971 136.0% -5.9% 97.7% 44.5% 11.5% 31.9% 44.9%
Change 1971–1981 82.3% 93.1% 82.8% 18.8% 23.1% 20.2% 38.3%
Change 1981–1991 20.6% 4.9% 19.8% 14.3% 12.6% 13.7% 16.1%
Change 1991–2001 11.0% 2.7% 10.6% 5.6% 22.8% 11.1% 10.9%
Change 1965–2001 475.9% 92.8% 432.9% 113.0% 89.1% 103.8% 169.0%

26 American Association of Community Colleges
Table 2.2Undergraduate Fall Enrollment: 1993–2002
Source: NCES (2004e)
Year Public Independent Total Public Independent Total Grand Total
1993 5,450,395 130,465 5,580,860 4,656,882 2,294,001 6,950,883 12,531,743
1994 5,434,265 127,211 5,561,476 4,603,818 2,295,465 6,899,283 12,460,759
1995 5,349,385 126,576 5,475,961 4,612,236 2,314,091 6,926,327 12,402,288
1996 5,381,112 127,111 5,508,223 4,597,086 2,332,324 6,929,410 12,437,633
1997 5,407,886 130,092 5,537,978 4,619,671 2,312,213 6,931,884 12,469,862
1998 5,397,934 135,449 5,533,383 4,677,908 2,436,049 7,113,957 12,647,340
1999 5,446,613 126,785 5,573,398 4,716,552 2,469,520 7,186,072 12,759,470
2000 5,812,042 130,329 5,942,371 4,798,961 2,557,797 7,356,758 13,299,129
2001 6,097,454 134,383 6,231,837 4,962,705 2,671,851 7,634,556 13,866,393
2002 6,417,269 145,117 6,562,386 5,091,050 2,762,638 7,853,688 14,416,074
Change 1993–1998 -1.0% 3.8% -0.9% 0.5% 6.2% 2.3% 0.9%
Change 1998–2002 18.9% 7.1% 18.6% 8.8% 13.4% 10.4% 14.0%
Change 1993–2002 17.7% 11.2% 17.6% 9.3% 20.4% 13.0% 15.0%
Community Colleges 4-Year Colleges

27National Profile of Community Colleges: Trends & Statistics 4TH EDITION
Figure 2.2Undergraduate Enrollment: Fall 2001 and Full Year 2001–2002
2
4
6
8
10
12
Communitycolleges
4-yearcolleges
Enro
llmen
t, in
mill
ions
College type
Source: NCES (2004e, 2004h)
■ Fall 2001■ Full year, 2001–2002

28 American Association of Community Colleges
Table 2.3Undergraduate Fall Enrollment by Attendance Status andGender: 1993–2002
Community Colleges 4-Year Colleges
Attendance Status and Gender Public Independent Total Public Independent Total
1993
Enrolled full time 1,945,383 97,963 2,043,346 3,523,655 1,730,872 5,254,527
Enrolled part time 3,505,012 32,502 3,537,514 1,133,227 563,129 1,696,356
% part time 64.3% 24.9% 63.4% 24.3% 24.5% 24.4%
Men 2,301,563 48,425 2,349,988 2,192,611 1,031,969 3,224,580
Women 3,148,832 82,040 3,230,872 2,464,271 1,262,032 3,726,303
% women 57.8% 62.9% 57.9% 52.9% 55.0% 53.6%
Total 5,450,395 130,465 5,580,860 4,656,882 2,294,001 6,950,883
1994
Enrolled full time 1,962,057 96,240 2,058,297 3,507,009 1,745,795 5,252,804
Enrolled part time 3,472,208 30,971 3,503,179 1,096,809 549,670 1,646,479
% part time 63.9% 24.3% 63.0% 23.8% 23.9% 23.9%
Men 2,286,357 47,303 2,333,660 2,148,006 1,021,959 3,169,965
Women 3,147,908 79,908 3,227,816 2,455,812 1,273,506 3,729,318
% women 57.9% 62.8% 58.0% 53.3% 55.5% 54.1%
Total 5,434,265 127,211 5,561,476 4,603,818 2,295,465 6,899,283
1995
Enrolled full time 1,923,171 96,473 2,019,644 3,529,783 1,758,164 5,287,947
Enrolled part time 3,426,214 30,103 3,456,317 1,082,453 555,927 1,638,380
% part time 64.0% 23.8% 63.1% 23.5% 24.0% 23.7%
Men 2,245,429 46,644 2,292,073 2,130,861 1,018,214 3,149,075
Women 3,103,956 79,932 3,183,888 2,481,375 1,295,877 3,777,252
% women 58.0% 63.1% 58.1% 53.8% 56.0% 54.5%
Total 5,349,385 126,576 5,475,961 4,612,236 2,314,091 6,926,327

29National Profile of Community Colleges: Trends & Statistics 4TH EDITION
Community Colleges 4-Year Colleges
Attendance Status and Gender Public Independent Total Public Independent Total
1996
Enrolled full time 1,945,488 98,674 2,044,162 3,546,207 1,783,675 5,329,882
Enrolled part time 3,435,587 28,474 3,464,061 1,050,879 548,649 1,599,528
% part time 63.8% 22.4% 62.9% 22.9% 23.5% 23.1%
Men 2,263,554 49,045 2,312,599 2,108,371 1,035,936 3,144,307
Women 3,117,521 78,103 3,195,624 2,488,715 1,296,388 3,785,103
% women 57.9% 61.4% 58.0% 54.1% 55.6% 54.6%
Total 5,381,075 127,148 5,508,223 4,597,086 2,332,324 6,929,410
1997
Enrolled full time 1,960,742 101,023 2,061,765 3,598,019 1,811,076 5,409,095
Enrolled part time 3,447,144 29,069 3,476,213 1,021,652 501,137 1,522,789
% part time 63.7% 22.3% 62.8% 22.1% 21.7% 22.0%
Men 2,282,305 52,248 2,334,553 2,103,500 1,009,590 3,113,090
Women 3,125,581 77,844 3,203,425 2,516,171 1,302,623 3,818,794
% women 57.8% 59.8% 57.8% 54.5% 56.3% 55.1%
Total 5,407,886 130,092 5,537,978 4,619,671 2,312,213 6,931,884
1998
Enrolled full time 1,965,884 103,227 2,069,111 3,648,944 1,955,237 5,604,181
Enrolled part time 3,432,050 32,222 3,464,272 1,028,964 480,812 1,509,776
% part time 63.6% 23.8% 62.6% 22.0% 19.7% 21.2%
Men 2,295,059 54,851 2,349,910 2,112,727 1,061,055 3,173,782
Women 3,102,875 80,598 3,183,473 2,565,181 1,374,994 3,940,175
% women 57.5% 59.5% 57.5% 54.8% 56.4% 55.4%
Total 5,397,934 135,449 5,533,383 4,677,908 2,436,049 7,113,957

30 American Association of Community Colleges
Attendance Status and Gender Public Independent Total Public Independent Total
1999
Enrolled full time 2,000,219 97,290 2,097,509 3,698,691 1,992,007 5,690,698
Enrolled part time 3,446,394 29,495 3,475,889 1,017,861 477,513 1,495,374
% part time 63.3% 23.3% 62.4% 21.6% 19.3% 20.8%
Men 2,325,023 52,971 2,377,994 2,124,546 1,080,651 3,205,197
Women 3,121,590 73,814 3,195,404 2,592,006 1,388,869 3,980,875
% women 57.3% 58.2% 57.3% 55.0% 56.2% 55.4%
Total 5,446,613 126,785 5,573,398 4,716,552 2,469,520 7,186,072
2000
Enrolled full time 2,071,643 101,014 2,172,657 3,772,041 2,078,945 5,850,986
Enrolled part time 3,740,399 29,315 3,769,714 1,026,920 478,852 1,505,772
% part time 64.4% 22.5% 63.4% 21.4% 18.7% 20.5%
Men 2,496,709 55,870 2,552,579 2,151,133 1,125,938 3,277,071
Women 3,315,333 74,459 3,389,792 2,647,828 1,431,859 4,079,687
% women 57.0% 57.1% 57.0% 55.2% 56.0% 55.5%
Total 5,812,042 130,329 5,942,371 4,798,961 2,557,797 7,356,758
2001
Enrolled full time 2,225,445 107,000 2,332,445 3,919,363 2,190,672 6,110,035
Enrolled part time 3,872,009 27,383 3,899,392 1,043,342 481,179 1,524,521
% part time 63.5% 20.4% 62.6% 21.0% 18.0% 20.0%
Men 2,603,313 56,652 2,659,965 2,223,843 1,170,482 3,394,325
Women 3,494,141 77,731 3,571,872 2,738,862 1,501,369 4,240,231
% women 57.3% 57.8% 57.3% 55.2% 56.2% 55.5%
Total 6,097,454 134,383 6,231,837 4,962,705 2,671,851 7,634,556
2002
Enrolled full time 2,423,384 112,759 2,536,143 4,046,191 2,263,598 6,309,789
Enrolled part time 3,993,885 32,358 4,026,243 1,044,859 499,040 1,543,899
% part time 62.2% 22.3% 61.4% 20.5% 18.1% 19.7%
Men 2,704,592 59,857 2,764,449 2,279,557 1,203,953 3,483,510
Women 3,712,677 85,260 3,797,937 2,811,493 1,558,685 4,370,178
% women 57.9% 58.8% 57.9% 55.2% 56.4% 55.6%
Total 6,417,269 145,117 6,562,386 5,091,050 2,762,638 7,853,688
Community Colleges 4-Year Colleges
Table 2.3 (cont’d)Undergraduate Fall Enrollment by Attendance Status andGender: 1993–2002
Source: NCES (2004e)
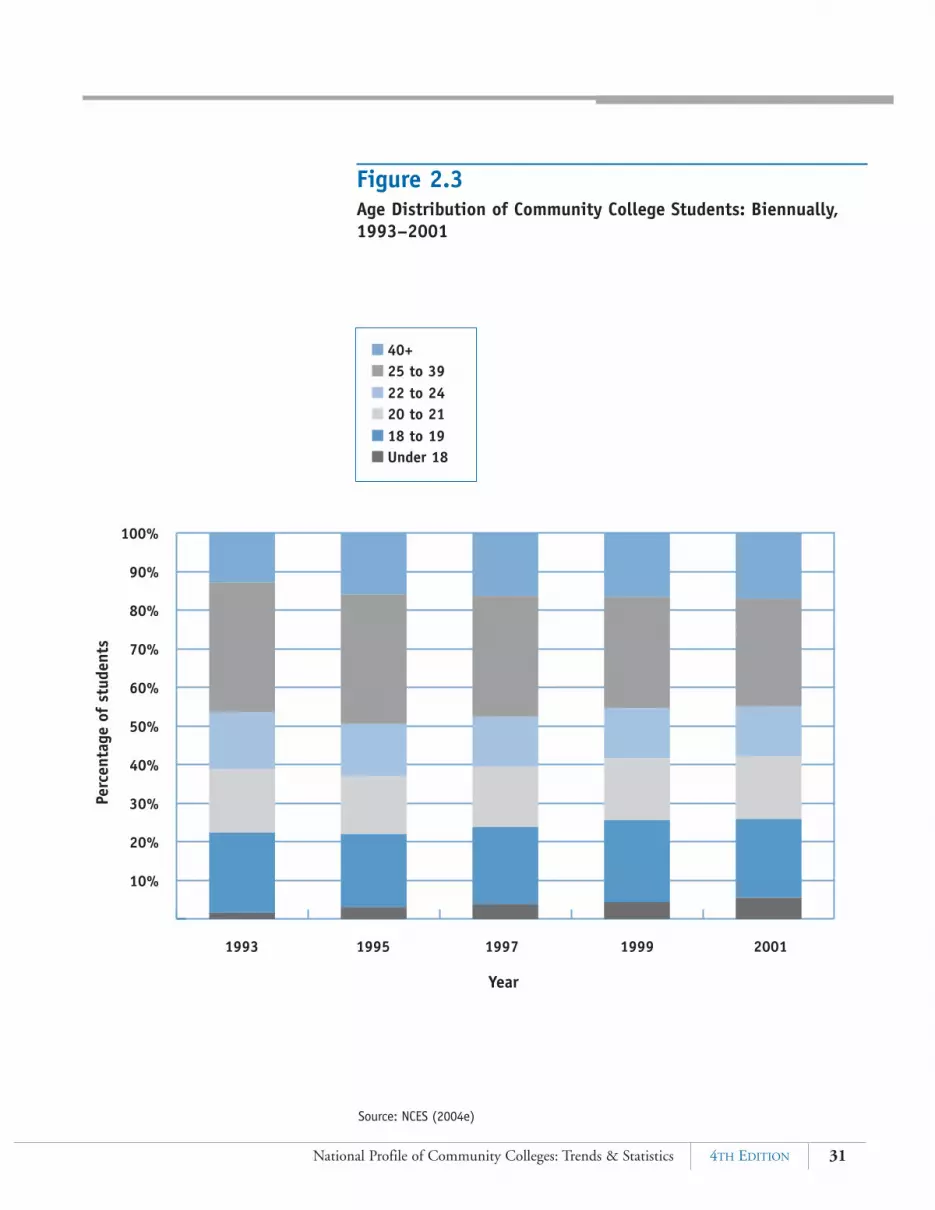
31National Profile of Community Colleges: Trends & Statistics 4TH EDITION
Figure 2.3Age Distribution of Community College Students: Biennually,1993–2001
19971993 1995 1999 2001
Perc
enta
ge o
f st
uden
ts
Year
10%
20%
30%
40%
50%
60%
70%
80%
90%
100%
Source: NCES (2004e)
■ 40+■ 25 to 39■ 22 to 24■ 20 to 21■ 18 to 19■ Under 18

32 American Association of Community Colleges
Table 2.4Distribution of Community College Fall Enrollment by Age andAttendance Status: Biennually, 1993–2001
Source: NCES (2004e)
Enrolled Part Time Enrolled Full Time All Students
Age Public Independent Total Public Independent Total Public Independent Total
1993
Under 18 1.6% 0.9% 1.6% 1.6% 2.5% 1.7% 1.6% 2.1% 1.6%
18–19 10.3% 6.3% 10.3% 35.3% 35.8% 35.4% 20.6% 29.7% 20.8%
20–21 12.8% 11.9% 12.7% 21.5% 18.9% 21.4% 16.3% 17.5% 16.4%
22–24 15.6% 15.8% 15.6% 13.7% 13.3% 13.7% 14.8% 13.8% 14.8%
25–29 17.1% 17.8% 17.1% 10.1% 10.2% 10.1% 14.2% 11.7% 14.2%
30–34 13.9% 14.8% 13.9% 6.8% 6.0% 6.7% 11.0% 7.8% 10.9%
35–39 11.1% 11.9% 11.1% 4.7% 4.1% 4.7% 8.5% 5.7% 8.4%
40–49 12.3% 11.9% 12.3% 4.6% 3.6% 4.5% 9.1% 5.3% 9.0%
50–64 3.7% 2.6% 3.7% 0.9% 0.8% 0.9% 2.6% 1.2% 2.5%
65 or older 0.9% 0.1% 0.9% 0.1% 0.0% 0.1% 0.6% 0.1% 0.6%
Age unknown 0.7% 6.0% 0.8% 0.6% 4.8% 0.8% 0.7% 5.0% 0.8%
1995
Under 18 3.6% 2.3% 3.6% 2.1% 1.8% 2.1% 3.1% 1.9% 3.1%
18–19 9.4% 6.2% 9.4% 35.7% 34.3% 35.6% 18.7% 27.9% 18.9%
20–21 11.2% 10.7% 11.2% 21.8% 19.9% 21.7% 15.0% 17.8% 15.0%
22–24 13.6% 14.3% 13.7% 13.1% 14.5% 13.1% 13.4% 14.5% 13.5%
25–29 16.5% 18.4% 16.5% 10.3% 11.7% 10.4% 14.3% 13.2% 14.3%
30–34 13.0% 14.4% 13.0% 6.2% 6.5% 6.2% 10.6% 8.3% 10.6%
35–39 11.0% 12.3% 11.1% 4.5% 4.5% 4.5% 8.7% 6.3% 8.7%
40–49 14.0% 13.9% 14.0% 4.7% 4.2% 4.7% 10.7% 6.4% 10.6%
50–64 5.0% 3.6% 5.0% 1.1% 1.0% 1.1% 3.6% 1.6% 3.6%
65 or older 1.6% 0.4% 1.6% 0.2% 0.1% 0.2% 1.1% 0.2% 1.1%
Age unknown 1.0% 3.5% 1.0% 0.3% 1.5% 0.4% 0.7% 1.9% 0.8%
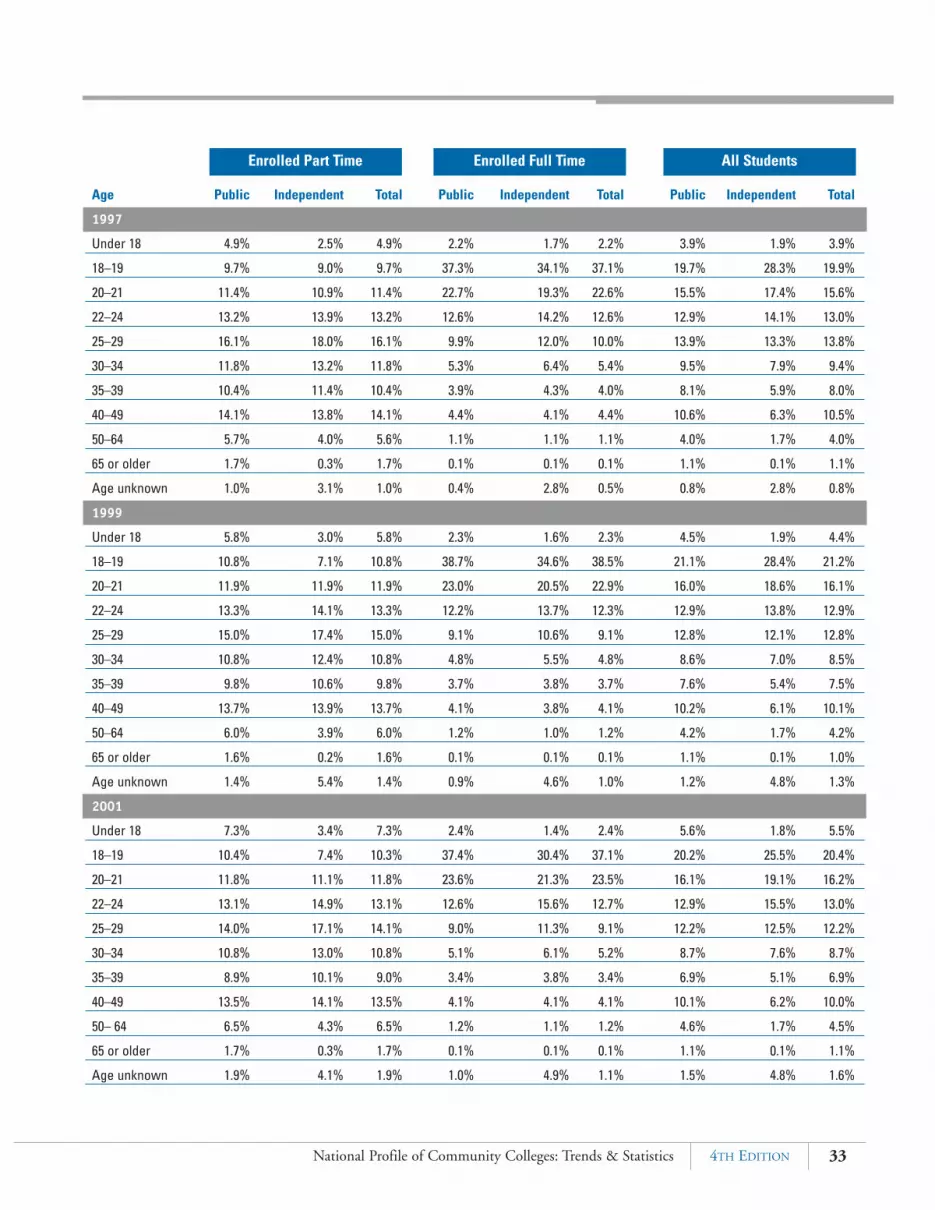
33National Profile of Community Colleges: Trends & Statistics 4TH EDITION
Age Public Independent Total Public Independent Total Public Independent Total
1997
Under 18 4.9% 2.5% 4.9% 2.2% 1.7% 2.2% 3.9% 1.9% 3.9%
18–19 9.7% 9.0% 9.7% 37.3% 34.1% 37.1% 19.7% 28.3% 19.9%
20–21 11.4% 10.9% 11.4% 22.7% 19.3% 22.6% 15.5% 17.4% 15.6%
22–24 13.2% 13.9% 13.2% 12.6% 14.2% 12.6% 12.9% 14.1% 13.0%
25–29 16.1% 18.0% 16.1% 9.9% 12.0% 10.0% 13.9% 13.3% 13.8%
30–34 11.8% 13.2% 11.8% 5.3% 6.4% 5.4% 9.5% 7.9% 9.4%
35–39 10.4% 11.4% 10.4% 3.9% 4.3% 4.0% 8.1% 5.9% 8.0%
40–49 14.1% 13.8% 14.1% 4.4% 4.1% 4.4% 10.6% 6.3% 10.5%
50–64 5.7% 4.0% 5.6% 1.1% 1.1% 1.1% 4.0% 1.7% 4.0%
65 or older 1.7% 0.3% 1.7% 0.1% 0.1% 0.1% 1.1% 0.1% 1.1%
Age unknown 1.0% 3.1% 1.0% 0.4% 2.8% 0.5% 0.8% 2.8% 0.8%
1999
Under 18 5.8% 3.0% 5.8% 2.3% 1.6% 2.3% 4.5% 1.9% 4.4%
18–19 10.8% 7.1% 10.8% 38.7% 34.6% 38.5% 21.1% 28.4% 21.2%
20–21 11.9% 11.9% 11.9% 23.0% 20.5% 22.9% 16.0% 18.6% 16.1%
22–24 13.3% 14.1% 13.3% 12.2% 13.7% 12.3% 12.9% 13.8% 12.9%
25–29 15.0% 17.4% 15.0% 9.1% 10.6% 9.1% 12.8% 12.1% 12.8%
30–34 10.8% 12.4% 10.8% 4.8% 5.5% 4.8% 8.6% 7.0% 8.5%
35–39 9.8% 10.6% 9.8% 3.7% 3.8% 3.7% 7.6% 5.4% 7.5%
40–49 13.7% 13.9% 13.7% 4.1% 3.8% 4.1% 10.2% 6.1% 10.1%
50–64 6.0% 3.9% 6.0% 1.2% 1.0% 1.2% 4.2% 1.7% 4.2%
65 or older 1.6% 0.2% 1.6% 0.1% 0.1% 0.1% 1.1% 0.1% 1.0%
Age unknown 1.4% 5.4% 1.4% 0.9% 4.6% 1.0% 1.2% 4.8% 1.3%
2001
Under 18 7.3% 3.4% 7.3% 2.4% 1.4% 2.4% 5.6% 1.8% 5.5%
18–19 10.4% 7.4% 10.3% 37.4% 30.4% 37.1% 20.2% 25.5% 20.4%
20–21 11.8% 11.1% 11.8% 23.6% 21.3% 23.5% 16.1% 19.1% 16.2%
22–24 13.1% 14.9% 13.1% 12.6% 15.6% 12.7% 12.9% 15.5% 13.0%
25–29 14.0% 17.1% 14.1% 9.0% 11.3% 9.1% 12.2% 12.5% 12.2%
30–34 10.8% 13.0% 10.8% 5.1% 6.1% 5.2% 8.7% 7.6% 8.7%
35–39 8.9% 10.1% 9.0% 3.4% 3.8% 3.4% 6.9% 5.1% 6.9%
40–49 13.5% 14.1% 13.5% 4.1% 4.1% 4.1% 10.1% 6.2% 10.0%
50– 64 6.5% 4.3% 6.5% 1.2% 1.1% 1.2% 4.6% 1.7% 4.5%
65 or older 1.7% 0.3% 1.7% 0.1% 0.1% 0.1% 1.1% 0.1% 1.1%
Age unknown 1.9% 4.1% 1.9% 1.0% 4.9% 1.1% 1.5% 4.8% 1.6%
Enrolled Part Time Enrolled Full Time All Students

34 American Association of Community Colleges
Table 2.5Community College Enrollment by Gender, Age, and AttendanceStatus: Fall 2001
Source: NCES (2004e)
Note. Total enrollment by age may vary from other tables because of unreported data.
Men Women Total
% % %Age Full time Part time part time Full time Part time part time Full time Part time part time
17 or younger 22,630 125,432 84.7% 33,164 159,051 82.7% 55,794 284,483 83.6%
18–19 397,600 184,410 31.7% 466,069 217,765 31.8% 863,669 402,175 31.8%
20–21 265,379 203,877 43.4% 282,945 254,179 47.3% 548,324 458,056 45.5%
22–24 139,656 222,657 61.5% 157,082 286,619 64.6% 296,738 509,276 63.2%
25–29 88,494 231,916 72.4% 124,239 314,476 71.7% 212,733 546,392 72.0%
30–34 44,236 171,610 79.5% 76,289 249,012 76.5% 120,525 420,622 77.7%
35–39 26,489 131,555 83.2% 53,029 216,549 80.3% 79,518 348,104 81.4%
40–49 34,120 186,677 84.5% 62,291 338,202 84.4% 96,411 524,879 84.5%
50–64 11,791 93,660 88.8% 16,735 159,020 90.5% 28,526 252,680 89.9%
65 or older 1,124 25,338 95.8% 1,075 41,295 97.5% 2,199 66,633 96.8%
Unknown 12,413 32,298 72.2% 14,010 41,014 74.5% 26,423 73,312 73.5%
18–21 662,979 388,287 36.9% 749,014 471,944 38.7% 1,411,993 860,231 37.9%
40 or older 47,035 305,675 86.7% 80,101 538,517 87.1% 127,136 844,192 86.9%
Total 1,043,932 1,609,430 60.7% 1,286,928 2,277,182 63.9% 2,330,860 3,886,612 62.5%

35National Profile of Community Colleges: Trends & Statistics 4TH EDITION
Table 2.6Community College Enrollment by Age and Gender: Fall 2001
Source: NCES (2004e)
Note. Total enrollment by age may vary from other tables because of unreported data.
Age Men Women % women
17 or younger 148,062 192,215 56.5%
18–19 582,010 683,834 54.0%
20–21 469,256 537,124 53.4%
22–24 362,313 443,701 55.0%
25–29 320,410 438,715 57.8%
30–34 215,846 325,301 60.1%
35–39 158,044 269,578 63.0%
40–49 220,797 400,493 64.5%
50–64 105,451 175,755 62.5%
65 or older 26,462 42,370 61.6%
Unknown 44,711 55,024 55.2%
18–21 1,051,266 1,220,958 53.7%
40 or older 352,710 618,618 63.7%
Total 2,653,362 3,564,110 57.3%
Gender

36 American Association of Community Colleges
Table 2.7Undergraduate Fall Enrollment by Race/Ethnicity: 1993–2002
Community Colleges 4-Year Colleges All Colleges
% of % of % of % enrolled inFall Total Minority Fall Total Minority Fall Total Minority community
Race/Ethnicity enrollment enrollment enrollment enrollment enrollment enrollment enrollment enrollment enrollment colleges
1993
Black 568,657 10.2% 38.5% 691,954 10.0% 44.7% 1,260,611 10.1% 41.7% 45.1%
Native American 65,322 1.2% 4.4% 46,327 0.7% 3.0% 111,649 0.9% 3.7% 58.5%
Asian/Pacific Islander 290,580 5.2% 19.7% 325,458 4.7% 21.0% 616,038 4.9% 20.4% 47.2%
Hispanic 551,922 9.9% 37.4% 483,107 7.0% 31.2% 1,035,029 8.3% 34.2% 53.3%
Minority subtotal 1,476,481 26.5% 100.0% 1,546,846 22.3% 100.0% 3,023,327 24.1% 100.0% 48.8%
White, non-Hispanic 3,857,662 69.1% — 4,991,754 71.8% — 8,849,416 70.6% — 43.6%
Race/ethnicity unknown 154,686 2.8% — 234,952 3.4% — 389,638 3.1% — 39.7%
Nonresident alien 92,031 1.6% — 177,331 2.6% — 269,362 2.1% — 34.2%
Total 5,580,860 100.0% — 6,950,883 100.0% — 12,531,743 100.0% — 44.5%
1994
Black 585,333 10.5% 38.0% 703,837 10.2% 43.9% 1,289,170 10.3% 41.0% 45.4%
Native American 68,310 1.2% 4.4% 48,523 0.7% 3.0% 116,833 0.9% 3.7% 58.5%
Asian/Pacific Islander 308,368 5.5% 20.0% 347,230 5.0% 21.7% 655,598 5.3% 20.9% 47.0%
Hispanic 579,410 10.4% 37.6% 502,937 7.3% 31.4% 1,082,347 8.7% 34.4% 53.5%
Minority subtotal 1,541,421 27.7% 100.0% 1,602,527 23.2% 100.0% 3,143,948 25.2% 100.0% 49.0%
White, non-Hispanic 3,771,591 67.8% — 4,898,810 71.0% — 8,670,401 69.6% — 43.5%
Race/ethnicity unknown 156,416 2.8% — 219,524 3.2% — 375,940 3.0% — 41.6%
Nonresident alien 92,048 1.7% — 178,422 2.6% — 270,470 2.2% — 34.0%
Total 5,561,476 100.0% — 6,899,283 100.0% — 12,460,759 100.0% — 44.6%
1995
Black 581,176 10.6% 37.2% 710,359 10.3% 42.8% 1,291,535 10.4% 40.1% 45.0%
Native American 70,482 1.3% 4.5% 50,506 0.7% 3.0% 120,988 1.0% 3.8% 58.3%
Asian/Pacific Islander 307,667 5.6% 19.7% 362,589 5.2% 21.9% 670,256 5.4% 20.8% 45.9%
Hispanic 601,423 11.0% 38.5% 534,552 7.7% 32.2% 1,135,975 9.2% 35.3% 52.9%
Minority subtotal 1,560,748 28.5% 100.0% 1,658,006 23.9% 100.0% 3,218,754 26.0% 100.0% 48.5%
White, non-Hispanic 3,654,395 66.7% — 4,841,184 69.9% — 8,495,579 68.5% — 43.0%
Race/ethnicity unknown 170,819 3.1% — 248,357 3.6% — 419,176 3.4% — 40.8%
Nonresident alien 89,999 1.6% — 178,780 2.6% — 268,779 2.2% — 33.5%
Total 5,475,961 100.0% — 6,926,327 100.0% — 12,402,288 100.0% — 44.2%

37National Profile of Community Colleges: Trends & Statistics 4TH EDITION
Community Colleges 4-Year Colleges All Colleges
% of % of % of % enrolled inFall Total Minority Fall Total Minority Fall Total Minority community
Race/Ethnicity enrollment enrollment enrollment enrollment enrollment enrollment enrollment enrollment enrollment colleges
1996
Black 593,187 10.8% 36.7% 716,400 10.3% 42.5% 1,309,587 10.5% 39.6% 45.3%
Native American 70,497 1.3% 4.4% 51,583 0.7% 3.1% 122,080 1.0% 3.7% 57.7%
Asian/Pacific Islander 315,550 5.7% 19.5% 373,018 5.4% 22.1% 688,568 5.5% 20.8% 45.8%
Hispanic 636,730 11.6% 39.4% 546,340 7.9% 32.4% 1,183,070 9.5% 35.8% 53.8%
Minority subtotal 1,615,964 29.3% 100.0% 1,687,341 24.4% 100.0% 3,303,305 26.6% 100.0% 48.9%
White, non-Hispanic 3,615,123 65.6% — 4,791,489 69.1% — 8,406,612 67.6% — 43.0%
Race/ethnicity unknown 183,551 3.3% — 269,087 3.9% — 452,638 3.6% — 40.6%
Nonresident alien 93,565 1.7% — 181,493 2.6% — 275,058 2.2% — 34.0%
Total 5,508,223 100.0% — 6,929,410 100.0% — 12,437,633 100.0% — 44.3%
1997
Black 605,994 10.9% 36.4% 730,041 10.5% 42.5% 1,336,035 10.7% 39.5% 45.4%
Native American 71,258 1.3% 4.3% 54,652 0.8% 3.2% 125,910 1.0% 3.7% 56.6%
Asian/Pacific Islander 325,606 5.9% 19.6% 381,443 5.5% 22.2% 707,049 5.7% 20.9% 46.1%
Hispanic 661,542 11.9% 39.7% 551,723 7.9% 32.1% 1,213,265 9.7% 35.9% 54.5%
Minority subtotal 1,664,400 30.1% 100.0% 1,717,859 24.7% 100.0% 3,382,259 27.1% 100.0% 49.2%
White, non-Hispanic 3,581,854 64.7% — 4,991,754 71.8% — 8,573,608 68.7% — 41.8%
Race/ethnicity unknown 210,241 3.8% — 234,952 3.4% — 445,193 3.6% — 47.2%
Nonresident alien 81,483 1.5% — 177,331 2.6% — 258,814 2.1% — 31.5%
Total 5,537,978 100.0% — 6,950,883 100.0% — 12,488,861 100.0% — 44.3%
1998
Black 619,093 11.2% 36.2% 763,870 10.7% 42.5% 1,382,963 10.9% 39.4% 44.8%
Native American 71,454 1.3% 4.2% 55,769 0.8% 3.1% 127,223 1.0% 3.6% 56.2%
Asian/Pacific Islander 344,356 6.2% 20.1% 393,400 5.5% 21.9% 737,756 5.8% 21.0% 46.7%
Hispanic 674,660 12.2% 39.5% 584,554 8.2% 32.5% 1,259,214 10.0% 35.9% 53.6%
Minority subtotal 1,709,563 30.9% 100.0% 1,797,593 25.3% 100.0% 3,507,156 27.7% 100.0% 48.7%
White, non-Hispanic 3,539,943 64.0% — 4,857,116 68.3% — 8,397,059 66.4% — 42.2%
Race/ethnicity unknown 227,927 4.1% — 274,104 3.9% — 502,031 4.0% — 45.4%
Nonresident alien 55,950 1.0% — 185,144 2.6% — 241,094 1.9% — 23.2%
Total 5,533,383 100.0% — 7,113,957 100.0% — 12,647,340 100.0% — 43.8%

38 American Association of Community Colleges
% of % of % of % enrolled inFall Total Minority Fall Total Minority Fall Total Minority community
Race/Ethnicity enrollment enrollment enrollment enrollment enrollment enrollment enrollment enrollment enrollment colleges
1999
Black 630,611 11.3% 36.3% 777,420 10.8% 42.5% 1,408,031 11.0% 39.5% 44.8%
Native American 71,673 1.3% 4.1% 55,732 0.8% 3.0% 127,405 1.0% 3.6% 56.3%
Asian/Pacific Islander 337,294 6.1% 19.4% 401,219 5.6% 21.9% 738,513 5.8% 20.7% 45.7%
Hispanic 696,975 12.5% 40.1% 596,811 8.3% 32.6% 1,293,786 10.1% 36.3% 53.9%
Minority subtotal 1,736,553 31.2% 100.0% 1,831,182 25.5% 100.0% 3,567,735 28.0% 100.0% 48.7%
White, non-Hispanic 3,522,112 63.2% — 4,861,312 67.6% — 8,383,424 65.7% — 42.0%
Race/ethnicity unknown 237,233 4.3% — 303,987 4.2% — 541,220 4.2% — 43.8%
Nonresident alien 77,500 1.4% — 189,591 2.6% — 267,091 2.1% — 29.0%
Total 5,573,398 100.0% — 7,186,072 100.0% — 12,759,470 100.0% — 43.7%
2000
Black 674,687 11.4% 35.1% 807,506 11.0% 42.2% 1,482,193 11.1% 38.7% 45.5%
Native American 74,175 1.2% 3.9% 57,154 0.8% 3.0% 131,329 1.0% 3.4% 56.5%
Asian/Pacific Islander 378,294 6.4% 19.7% 411,400 5.6% 21.5% 789,694 5.9% 20.6% 47.9%
Hispanic 792,755 13.3% 41.3% 635,592 8.6% 33.2% 1,428,347 10.7% 37.3% 55.5%
Minority subtotal 1,919,911 32.3% 100.0% 1,911,652 26.0% 100.0% 3,831,563 28.8% 100.0% 50.1%
White, non-Hispanic 3,633,929 61.2% — 4,882,823 66.4% — 8,516,752 64.0% — 42.7%
Race/ethnicity unknown 298,319 5.0% — 365,849 5.0% — 664,168 5.0% — 44.9%
Nonresident alien 90,212 1.5% — 196,434 2.7% — 286,646 2.2% — 31.5%
Total 5,942,371 100.0% — 7,356,758 100.0% — 13,299,129 100.0% — 44.7%
2001
Black 724,646 11.6% 35.4% 854,422 11.2% 42.5% 1,579,068 11.4% 38.9% 45.9%
Native American 77,542 1.2% 3.8% 59,632 0.8% 3.0% 137,174 1.0% 3.4% 56.5%
Asian/Pacific Islander 394,643 6.3% 19.3% 428,766 5.6% 21.3% 823,409 5.9% 20.3% 47.9%
Hispanic 850,893 13.7% 41.6% 668,874 8.8% 33.2% 1,519,767 11.0% 37.4% 56.0%
Minority subtotal 2,047,724 32.9% 100.0% 2,011,694 26.3% 100.0% 4,059,418 29.3% 100.0% 50.4%
White, non-Hispanic 3,754,447 60.2% — 4,990,959 65.4% — 8,745,406 63.1% — 42.9%
Race/ethnicity unknown 327,807 5.3% — 428,038 5.6% — 755,845 5.5% — 43.4%
Nonresident alien 101,859 1.6% — 203,865 2.7% — 305,724 2.2% — 33.3%
Total 6,231,837 100.0% — 7,634,556 100.0% — 13,866,393 100.0% — 44.9%
Community Colleges 4-Year Colleges All Colleges
Table 2.7 (cont’d)Undergraduate Fall Enrollment by Race/Ethnicity: 1993–2002
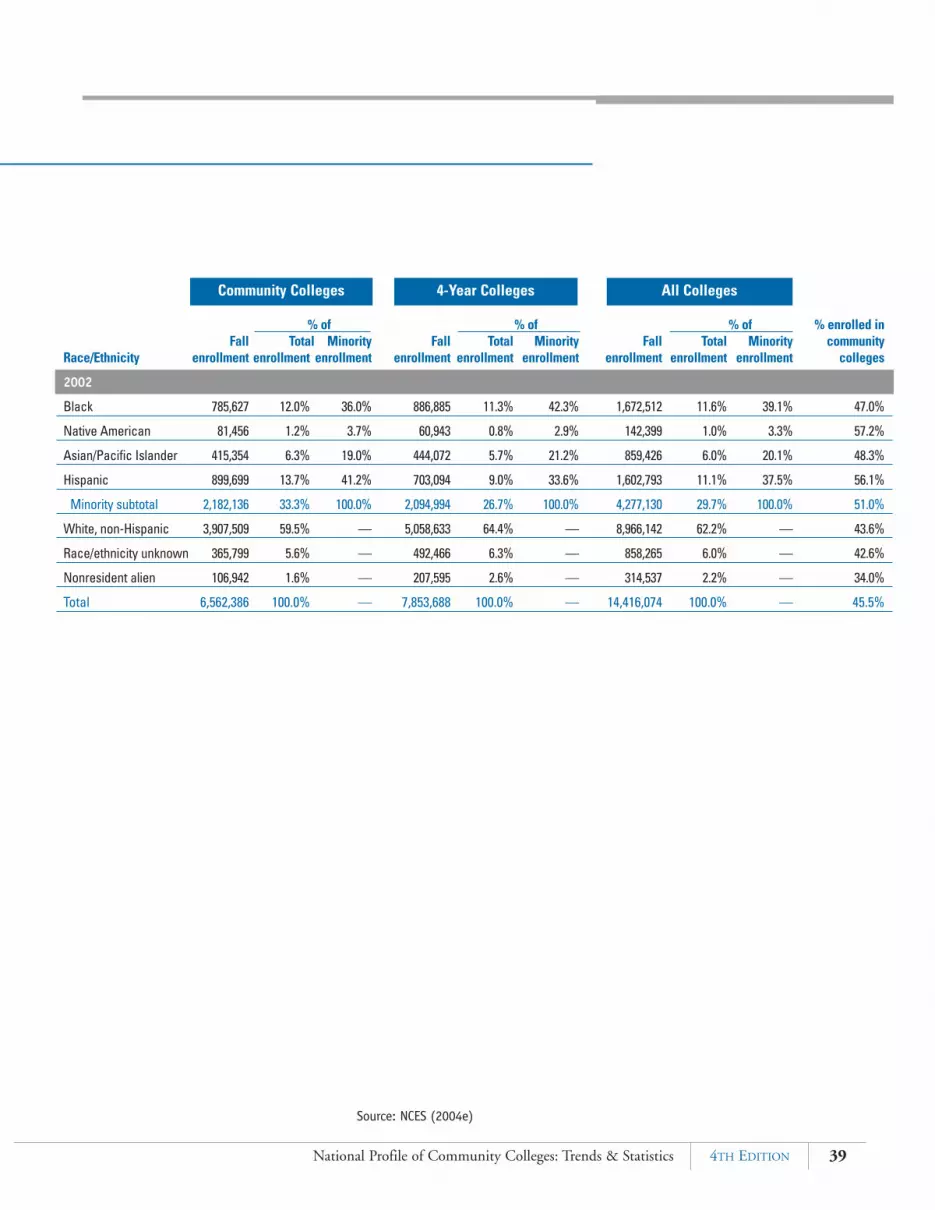
39National Profile of Community Colleges: Trends & Statistics 4TH EDITION
% of % of % of % enrolled inFall Total Minority Fall Total Minority Fall Total Minority community
Race/Ethnicity enrollment enrollment enrollment enrollment enrollment enrollment enrollment enrollment enrollment colleges
2002
Black 785,627 12.0% 36.0% 886,885 11.3% 42.3% 1,672,512 11.6% 39.1% 47.0%
Native American 81,456 1.2% 3.7% 60,943 0.8% 2.9% 142,399 1.0% 3.3% 57.2%
Asian/Pacific Islander 415,354 6.3% 19.0% 444,072 5.7% 21.2% 859,426 6.0% 20.1% 48.3%
Hispanic 899,699 13.7% 41.2% 703,094 9.0% 33.6% 1,602,793 11.1% 37.5% 56.1%
Minority subtotal 2,182,136 33.3% 100.0% 2,094,994 26.7% 100.0% 4,277,130 29.7% 100.0% 51.0%
White, non-Hispanic 3,907,509 59.5% — 5,058,633 64.4% — 8,966,142 62.2% — 43.6%
Race/ethnicity unknown 365,799 5.6% — 492,466 6.3% — 858,265 6.0% — 42.6%
Nonresident alien 106,942 1.6% — 207,595 2.6% — 314,537 2.2% — 34.0%
Total 6,562,386 100.0% — 7,853,688 100.0% — 14,416,074 100.0% — 45.5%
Community Colleges 4-Year Colleges All Colleges
Source: NCES (2004e)

40 American Association of Community Colleges
Figure 2.4Community College Enrollment by Race/Ethnicity: 1993
Black10%
White, non-Hispanic69%
Nonresident alien2%
Race/ethnicity unknown3%
Asian/Pacific Islander5%
Native American1%
Hispanic10%
Source: NCES (2004e)

41National Profile of Community Colleges: Trends & Statistics 4TH EDITION
Figure 2.5Community College Enrollment by Race/Ethnicity: 2002
Black12%
White, non-Hispanic59%
Nonresident alien2%
Race/ethnicity unknown6%
Asian/Pacific Islander6%
Native American1%
Hispanic14%
Source: NCES (2004e)

42 American Association of Community Colleges
Table 2.8Ethnic Origins of Hispanic Undergraduates: 1999–2000
Source: NCES (2005)
Note. Because of sampling methodology, some populations may beunderrepresented.
Total # ofMexican, Other Hispanic
Mexican-American, Puerto Hispanic studentsCollege Type or Chicano Cuban Rican origin (estimated)
Public community college 55.2% 2.3% 6.8% 30.0% 1,105,300
Public 4-year college 44.6% 4.4% 17.9% 28.7% 507,760
Independent nonprofit 4-year college 24.6% 3.6% 43.2% 23.8% 307,080
Proprietary college 44.3% 2.4% 18.9% 29.4% 294,700
More than one college 52.8% 4.6% 10.7% 26.9% 173,080
Total 47.6% 3.0% 15.7% 28.5% 2,426,340
Ethnic Origin

43National Profile of Community Colleges: Trends & Statistics 4TH EDITION
Table 2.9Ethnic Origins of Asian/Pacific Islander Undergraduates:1999–2000
Source: NCES (2004j)
Note. Because of sampling methodology, some populations may be underrepresented.
AsianCollege Type Chinese Korean Filipino Japanese Vietnamese Indian
Public community college 23.5% 8.8% 12.7% 11.0% 16.7% 9.4%
Public 4-year college 27.4% 17.5% 6.3% 12.4% 10.6% 11.9%
Independent nonprofit 4-year college 28.0% 16.9% 11.8% 12.4% 3.5% 12.7%
Proprietary college 16.0% 9.7% 16.2% 9.5% 9.7% 9.0%
More than one college 25.6% 12.4% 10.8% 7.1% 18.8% 13.3%
Total 25.1% 13.1% 10.5% 11.2% 12.8% 11.0%
Other Total # of otherAsian/ Asian/Pacific
Native Guamanian Pacific Islanders College Type Thai Hawaiian Samoan or Chamorro Islander (estimated)
Public community college 3.6% — — — 14.4% 294,510
Public 4-year college 2.6% 0.8% — — 10.3% 262,230
Independent nonprofit 4-year college 2.0% — — — 12.7% 86,870
Proprietary college 2.6% — — — 27.3% 33,240
More than one college 1.8% 0.7% — — 9.6% 59,880
Total 2.9% 0.4% — — 13.1% 743,910
Ethnic Origin
Ethnic Origin

44 American Association of Community Colleges
Table 2.10Immigrant Status of Undergraduates: 2003–2004
Source: NCES (2005)
Resident alien/eligible Foreign-born Citizen, parents All other
College Type noncitizen citizen foreign born citizens
Public community college 8.2% 6.1% 11.5% 74.2%
Public 4-year college 5.9% 5.2% 11.1% 77.9%
Independent nonprofit 4-year college 5.6% 6.5% 11.2% 76.7%
Proprietary college 8.2% 6.7% 13.9% 71.3%
More than one college 7.6% 6.2% 13.2% 73.1%
Total 7.1% 11.4% 17.6% 86.9%
Immigrant Status

45National Profile of Community Colleges: Trends & Statistics 4TH EDITION
Table 2.11Primary Language Spoken in the Home of Undergraduates:1992–1993, 1995–1996, and 1999–2000
Source: NCES (2004i, 2004j)
Note. Because of sampling methodology, some populations may be underrepresented.
Spanish,Catalan, Chinese,
Galician, Cantonese, College Type English Basque Mandarin Japanese Korean Arabic German Other
1992–1993
Public community college 87.7% 5.3% 0.7% 0.2% 0.3% 0.4% 0.4% 5.0%
Public 4-year college 90.9% 3.5% 1.0% 0.2% 0.4% 0.3% 0.2% 3.6%
Independent nonprofit 4-year college 91.7% 4.4% 0.2% 0.4% 0.2% 0.2% 0.2% 2.7%
Proprietary college 82.7% 9.3% 0.6% 0.9% 0.3% 0.6% 0.2% 5.4%
More than one college 88.7% 3.9% 1.4% 0.3% 0.3% 0.4% 0.1% 5.0%
Total 88.6% 4.9% 0.8% 0.3% 0.4% 0.4% 0.3% 4.4%
1995–1996
Public community college 87.5% 7.0% 0.5% 0.1% 0.1% 0.3% 0.4% 4.1%
Public 4-year college 90.3% 2.9% 1.2% 0.5% 0.4% 0.2% 0.1% 4.4%
Independent nonprofit 4-year college 88.8% 3.6% 0.9% 0.4% 1.2% 0.4% 0.1% 4.6%
Proprietary college 84.7% 9.7% 0.2% 0.1% 0.1% 0.1% 0.2% 4.9%
More than one college 85.2% 6.8% 1.2% 0.1% 0.6% 0.0% 0.1% 6.0%
Total 88.2% 5.4% 0.8% 0.3% 0.4% 0.2% 0.2% 4.5%
1999–2000
Public community college 85.6% 6.2% 1.0% 0.4% 0.3% 0.3% 0.2% 6.0%
Public 4-year college 89.1% 4.5% 1.1% 0.4% 0.7% 0.2% 0.2% 3.9%
Independent nonprofit 4-year college 89.7% 4.4% 0.9% 0.1% 0.3% 0.2% 0.2% 4.2%
Proprietary college 83.5% 9.5% 0.8% 0.1% 0.2% 0.5% 0.1% 5.4%
More than one college 87.6% 4.7% 1.1% 0.3% 0.5% 0.3% 0.1% 5.5%
Total 87.3% 5.5% 1.0% 0.4% 0.4% 0.3% 0.2% 5.0%
Primary Language Spoken

46 American Association of Community Colleges
Figure 2.6Immigrant Status of Public Community College Students:2003–2004
Foreign-born citizen6.1%
All other citizens74.2%
Resident alien/eligiblenoncitizen8.2%
Citizen, parentsforeign born
11.5%
Source: NCES (2005)

47National Profile of Community Colleges: Trends & Statistics 4TH EDITION
Table 2.12Highest Level of Education Attained by Parents ofUndergraduates: 1995–1996 and 1999–2000
Source: NCES (2004i, 2004j)
Note. Totals may not equal 100% because of rounding.
2 or moreDid not High school Less than years of Master's Doctoral/ % first-
complete diploma or 2 years college/ Bachelor's degree or professional generationCollege Type high school equivalent of college AA degree degree equivalent degree student
1995–1996
Public community college 11.2% 40.3% 10.0% 10.9% 17.7% 7.6% 2.5% 51.5%
Public 4-year college 4.5% 30.4% 7.8% 10.3% 25.3% 15.0% 6.7% 34.9%
Independent nonprofit 4-year college 5.1% 34.6% 5.8% 7.7% 21.7% 14.8% 10.4% 39.7%
Proprietary college 13.4% 50.6% 7.6% 8.9% 12.6% 5.0% 1.9% 64.0%
More than one college 8.8% 34.5% 6.7% 10.3% 19.7% 13.8% 6.2% 43.3%
Total 8.3% 36.8% 8.4% 10.1% 20.4% 11.1% 5.1% 45.1%
1999–2000
Public community college 11.1% 34.2% 11.4% 12.6% 20.0% 7.6% 3.2% 45.3%
Public 4-year college 5.1% 24.0% 10.1% 12.3% 26.2% 15.6% 6.7% 29.1%
Independent nonprofit 4-year college 4.8% 23.6% 9.0% 10.2% 25.3% 16.2% 11.0% 28.4%
Proprietary college 11.5% 40.2% 10.5% 12.1% 16.3% 6.1% 3.2% 51.7%
More than one college 4.6% 24.9% 11.2% 14.6% 24.5% 14.2% 6.0% 29.5%
Total 7.9% 29.2% 10.6% 12.3% 22.8% 11.7% 5.6% 37.1%
Highest Level of Education Attained

48 American Association of Community Colleges
Table 2.13Highest Level of Education Planned by Undergraduates:1995–1996, 1999–2000, and 2003–2004
Source: NCES (2004i, 2004j, 2005)
Note. Totals may not equal 100% because of rounding.
Highest Level of Education Planned
Post- Advanced degree: No degree Associate Bachelor's baccalaureate Master's doctoral or first
College Type or certificate Certificate degree degree certificate degree professional
1995–1996
Public community college 3.0% 3.8% 12.0% 42.0% 0.4% 28.3% 10.5%
Public 4-year college 0.3% 0.3% 0.7% 19.9% 0.6% 54.4% 23.9%
Independent nonprofit 4-year college 0.5% 0.2% 0.7% 16.5% 0.4% 53.8% 27.9%
Proprietary college 2.4% 22.8% 14.5% 33.8% 0.2% 21.6% 4.7%
More than one college 0.3% 3.1% 3.9% 23.5% 0.7% 48.0% 20.4%
Total 1.6% 3.4% 6.6% 30.1% 0.5% 40.7% 17.3%
1999–2000
Public community college 3.1% 3.6% 14.1% 42.9% 0.3% 28.7% 7.4%
Public 4-year college 0.5% 0.3% 1.3% 23.5% 0.4% 56.0% 18.1%
Independent nonprofit 4-year college 0.2% 0.2% 1.0% 19.9% 0.2% 56.7% 21.8%
Proprietary college 2.2% 11.6% 15.1% 40.6% 0.3% 24.8% 5.4%
More than one college 0.7% 1.1% 3.3% 25.0% 0.5% 52.0% 17.5%
Total 1.7% 2.4% 7.5% 32.3% 0.3% 42.5% 13.3%
2003–2004
Public community college 1.1% 2.5% 15.1% 37.2% 0.5% 31.7% 12.0%
Public 4-year college 0.1% 0.2% 1.0% 23.9% 0.7% 50.2% 24.0%
Independent nonprofit 4-year college 0.1% 0.2% 0.9% 20.6% 0.7% 51.2% 26.4%
Proprietary college 1.3% 11.2% 12.2% 31.8% 0.6% 32.0% 10.9%
More than one college 0.5% 1.4% 5.2% 28.3% 0.9% 44.2% 19.6%
Total 0.6% 2.2% 8.0% 29.8% 0.6% 40.7% 18.0%

49National Profile of Community Colleges: Trends & Statistics 4TH EDITION
Table 2.14Highest Level of Education Planned by Public CommunityCollege Students, by Parents' Highest Level of EducationAttained: 1999–2000
Source: NCES (2004i, 2004j)
Note. Totals may not equal 100% because of rounding.
Did not High school Vocational/ Less than 2 or morecomplete diploma technical 2 years years of college/
Highest Level of Education Planned by Students high school or equivalent training of college AA degree
No degree or certificate 23.4% 39.9% 3.1% 3.7% 9.2%
Certificate 20.7% 45.8% 9.6% 3.8% 8.0%
Associate degree 14.3% 41.2% 2.4% 9.5% 13.0%
Bachelor's degree 10.2% 35.3% 3.4% 7.4% 12.8%
Master's degree 7.6% 27.5% 3.6% 8.0% 14.8%
Advanced degree: doctoral or first professional 9.4% 22.1% 2.5% 8.2% 11.0%
Total, all students 11.1% 34.2% 3.3% 8.1% 12.6%
Doctoral Bachelor's Master's degree Professional degree or
Highest Level of Education Planned by Students degree or equivalent degree equivalent
No degree or certificate 11.7% 5.7% 0.9% 2.6%
Certificate 6.9% 3.6% 0.0% 1.6%
Associate degree 14.4% 3.9% 0.7% 0.7%
Bachelor's degree 23.3% 5.7% 1.0% 0.9%
Master's degree 22.2% 11.3% 2.9% 2.3%
Advanced degree: doctoral or first professional 22.7% 17.4% 3.0% 3.6%
Total, all students 20.0% 7.6% 1.6% 1.6%
Parents' Highest Level of Education Attained
Parents' Highest Level of Education Attained

50 American Association of Community Colleges
Table 2.15Employment Status of Public Community College Students byAttendance Status and Age: 2003–2004
Source: NCES (2005)
Note. Totals may not equal 100% because of rounding.
Age Did not work Worked part time Worked full time
Attended full time, full year
19 or younger 20.1% 64.5% 15.4%
20–22 18.3% 59.1% 22.6%
23–29 27.7% 40.6% 31.7%
30–39 30.5% 36.2% 33.4%
40 or older 36.7% 27.8% 35.5%
Total 23.1% 53.7% 23.3%
Attended part time, full year
19 or younger 22.3% 53.5% 24.1%
20–22 14.2% 51.1% 34.7%
23–29 15.3% 33.4% 51.4%
30–39 20.4% 26.8% 52.9%
40 or older 21.6% 22.3% 56.1%
Total 18.5% 36.4% 45.1%
Attended full time, part year
19 or younger 23.2% 54.8% 21.9%
20–22 18.9% 51.1% 30.0%
23–29 24.4% 35.5% 40.1%
30–39 38.3% 24.1% 37.6%
40 or older 37.5% 18.5% 44.0%
Total 25.4% 42.0% 32.7%
Attended part time, part year
19 or younger 22.6% 46.3% 31.1%
20–22 16.3% 39.9% 43.9%
23–29 13.2% 29.8% 57.0%
30–39 19.3% 19.9% 60.8%
40 or older 18.8% 21.4% 59.8%
Total 17.5% 29.4% 53.2%
Total, all students
19 or younger 21.6% 56.9% 21.5%
20–22 16.7% 50.1% 33.2%
23–29 17.6% 33.4% 49.0%
30–39 22.7% 25.0% 52.4%
40 or older 22.5% 22.1% 55.4%
Total 20.0% 38.4% 41.6%
Employment Status

51National Profile of Community Colleges: Trends & Statistics 4TH EDITION
Table 2.16Undergraduates' Self-Perceptions of Employment Status:1995–1996, 1999–2000, and 2003–2004
Source: NCES (2004i, 2004j, 2005)
Student Employee Does College Type who works who studies not work
1995–1996
Public community college 41.8% 41.9% 16.3%
Public 4-year college 59.6% 16.2% 24.2%
Independent nonprofit 4-year college 56.8% 21.0% 22.2%
Proprietary college 41.6% 31.7% 26.8%
More than one college 59.8% 19.3% 21.0%
Total 49.8% 29.0% 21.2%
1999–2000
Public community college 37.7% 46.4% 15.9%
Public 4-year college 60.3% 16.6% 23.1%
Independent nonprofit 4-year college 54.3% 22.8% 22.9%
Proprietary college 45.1% 35.6% 19.3%
More than one college 55.1% 24.1% 20.8%
Total 48.4% 31.6% 20.0%
2003–2004
Public community college 45.2% 34.9% 20.0%
Public 4-year college 61.6% 13.7% 24.7%
Independent nonprofit 4-year college 55.0% 21.1% 24.0%
Proprietary college 35.3% 41.5% 23.3%
More than one college 55.1% 24.0% 20.9%
Total 51.4% 26.3% 22.3%
Self-Perceptions of Status

52 American Association of Community Colleges
Figure 2.7Employment Status of Public Community College Students byAttendance Status: 2003–2004
20%
10%
30%
40%
50%
60%
Attended full time,full year
Attended full time,part year
Attended part time,part year
All studentsAttended part time,full year
Perc
enta
ge o
f st
uden
ts
Attendance status
Source: NCES (2005)
■ Did not work■ Worked part time■ Worked full time

53National Profile of Community Colleges: Trends & Statistics 4TH EDITION
Table 2.17Percentage of Undergraduates With Risk Factors AssociatedWith Decreased Persistence in College: 1995–1996,1999–2000, and 2003–2004
Source: NCES (2004i, 2004j, 2005)
Note. Risk factors are based on factors identified in NCES publications. See Horn (1996) for more detail.
Worked Has GED HasEnrolled full time or no at least Average
Independent Delayed less than Has Single while high school 1 risk # of risk College Type student enrollment full time dependents parent enrolled diploma factor factors
1995–1996
Public community college 62.4% 42.8% 71.0% 31.4% 14.8% 50.4% 11.0% 88.7% 2.4
Public 4-year college 37.0% 18.9% 32.9% 14.0% 5.7% 22.8% 3.0% 56.2% 1.2
Independent nonprofit 4-year college 42.2% 25.1% 31.0% 20.6% 7.4% 28.8% 4.7% 51.4% 1.4
Proprietary college 66.2% 48.2% 30.9% 38.5% 17.5% 38.7% 15.8% 84.2% 2.2
More than one college 45.9% 25.9% 41.4% 24.9% 11.6% 28.7% 7.3% 71.7% 1.7
Total 50.8% 32.1% 48.6% 24.5% 11.0% 36.4% 8.1% 72.7% 1.8
1999–2000
Public community college 63.7% 58.7% 69.5% 34.5% 16.4% 52.6% 9.8% 90.7% 2.9
Public 4-year college 43.6% 39.3% 29.9% 23.3% 10.7% 32.4% 4.8% 60.6% 1.5
Independent nonprofit 4-year college 37.6% 31.5% 33.3% 17.6% 9.2% 24.7% 2.4% 60.8% 1.7
Proprietary college 69.1% 64.1% 25.8% 39.5% 21.6% 46.9% 10.7% 89.0% 2.6
More than one college 43.0% 34.0% 45.6% 23.1% 10.1% 33.7% 3.8% 73.8% 1.9
Total 50.9% 45.5% 47.9% 26.9% 13.3% 37.8% 6.5% 75.0% 2.2
2003–2004
Public community college 61.2% 50.3% 66.1% 35.4% 17.2% 40.8% 11.6% 85.7% 2.4
Public 4-year college 34.3% 23.3% 30.2% 14.3% 6.3% 21.6% 3.6% 51.4% 1.1
Independent nonprofit 4-year college 37.7% 26.8% 26.7% 20.0% 9.0% 25.5% 4.5% 49.7% 1.3
Proprietary college 76.1% 57.2% 28.0% 46.2% 27.2% 47.6% 18.3% 88.9% 2.5
More than one college 48.1% 34.1% 44.9% 25.3% 11.6% 31.7% 6.9% 68.4% 1.7
Total 50.3% 38.4% 45.2% 27.1% 13.2% 32.7% 8.4% 69.5% 1.8
Risk Factors

54 American Association of Community Colleges
Table 2.18Income of Undergraduates by Dependency Status: 2003–2004
Source: NCES (2005)
Note. Totals may not equal 100% because of rounding.
% of % of More students students
Less than $10,000– $20,000– $30,000– $50,000– $75,000– than below below College Type $10,000 $19,999 $29,999 $49,999 $74,999 $99,999 $100,000 $30,000 $50,000
Dependent students (parents' income)
Public community college 7.0% 8.6% 10.7% 21.4% 23.1% 12.9% 16.4% 26.2% 47.6%
Public 4-year college 4.3% 6.6% 8.3% 18.4% 22.9% 16.9% 22.6% 19.2% 37.6%
Independent nonprofit 4-year college 4.6% 6.4% 8.4% 17.2% 18.8% 17.6% 27.0% 19.4% 36.6%
Proprietary college 12.3% 14.1% 16.1% 21.1% 17.4% 9.2% 10.0% 42.4% 63.5%
More than one college 5.6% 7.1% 9.7% 18.6% 20.2% 15.9% 22.9% 22.4% 41.0%
Total 5.6% 7.5% 9.5% 19.3% 21.9% 15.4% 20.9% 22.6% 41.9%
Independent students (personal income)
Public community college 20.6% 17.3% 15.6% 20.0% 14.7% 6.6% 5.3% 53.4% 73.4%
Public 4-year college 26.3% 19.2% 15.9% 17.5% 12.1% 5.0% 4.0% 61.4% 78.9%
Independent nonprofit 4-year college 20.9% 16.0% 15.6% 19.3% 15.6% 7.0% 5.6% 52.5% 71.8%
Proprietary college 25.5% 21.4% 17.4% 17.0% 11.4% 3.9% 3.4% 64.3% 81.3%
More than one college 21.7% 19.5% 14.4% 18.3% 15.4% 6.6% 4.2% 55.6% 73.9%
Total 22.5% 18.2% 15.8% 18.9% 13.9% 6.0% 4.7% 56.5% 75.4%
All students (parents' income for dependent students and personal income for independent students)
Public community college 15.3% 13.9% 13.7% 20.6% 18.0% 9.0% 9.6% 42.9% 63.4%
Public 4-year college 11.8% 10.9% 10.9% 18.1% 19.2% 12.8% 16.2% 33.7% 51.8%
Independent nonprofit 4-year college 10.7% 10.0% 11.1% 18.0% 17.6% 13.6% 18.9% 31.9% 49.9%
Proprietary college 22.4% 19.7% 17.1% 17.9% 12.8% 5.2% 5.0% 59.1% 77.0%
More than one college 13.4% 13.1% 12.0% 18.4% 17.9% 11.4% 13.9% 38.4% 56.8%
Total 14.1% 12.9% 12.7% 19.1% 17.8% 10.7% 12.8% 39.7% 58.7%
Income

College Type
55National Profile of Community Colleges: Trends & Statistics 4TH EDITION
Table 2.19Type of College Enrolled in by Full-Time, Full-Year DependentUndergraduates by Family Income: 1989–1990 and 1999–2000
Source: Choy (2004)
Note. Totals may not equal 100% because of rounding.
Public Independent Proprietarycommunity Public nonprofit less-than-
Family Income college 4-year college 4-year college 4-year
1989–1990
Lowest quarter 16.4% 47.0% 28.0% 8.7%
Lower middle quarter 19.7% 53.5% 22.8% 4.0%
Upper middle quarter 15.5% 56.4% 25.2% 2.9%
Highest quarter 10.6% 52.4% 35.7% 1.3%
Total 15.5% 52.4% 28.0% 4.1%
1999–2000
Lowest quarter 24.7% 47.4% 22.9% 5.0%
Lower middle quarter 22.3% 51.9% 23.8% 2.0%
Upper middle quarter 18.6% 51.7% 28.0% 1.7%
Highest quarter 12.6% 53.9% 32.6% 0.9%
Total 19.4% 51.3% 27.0% 2.4%

56 American Association of Community Colleges
Table 2.20Dependent Undergraduates’ Income by Race/Ethnicity:2003–2004
% ofstudents
Less than $10,000– $20,000– $30,000– $40,000– $50,000– $60,000– $70,000– $80,000– $100,000 who areRace/Ethnicity $10,000 $19,999 $29,999 $39,999 $49,999 $59,999 $69,999 $79,999 $99,999 or more dependent
Public community colleges
Black 14.1% 15.9% 17.7% 12.2% 10.5% 5.8% 5.7% 3.3% 5.9% 9.0% 28.9%
Native American 20.2% 6.8% 4.8% 16.5% 10.9% 8.7% 6.7% 2.0% 6.0% 17.6% 26.6%
Asian 12.5% 11.4% 12.2% 14.4% 8.5% 11.0% 6.5% 3.3% 8.7% 11.6% 41.9%
Hawaiian/other Pacific Islander 11.2% 6.5% 2.3% 9.6% 18.1% 7.0% 3.7% — 9.0% 32.6% 52.8%
Hispanic 10.0% 13.4% 15.8% 10.9% 11.0% 9.0% 11.5% 2.9% 6.5% 9.2% 41.4%
White, non-Hispanic 4.2% 5.7% 8.1% 10.2% 10.6% 9.8% 10.8% 9.2% 11.6% 19.8% 40.3%
Other 8.1% 15.5% 14.8% 8.9% 6.6% 12.4% 6.8% 11.2% 2.0% 13.7% 43.6%
More than one race 6.6% 8.0% 11.8% 15.2% 7.6% 13.7% 6.7% 5.9% 8.8% 15.7% 39.9%
Total 7.0% 8.6% 10.7% 10.9% 10.5% 9.4% 9.8% 7.0% 9.7% 16.4% 38.8%
Public 4-year colleges
Black 8.8% 14.2% 17.4% 11.4% 11.8% 6.6% 5.5% 6.4% 7.4% 10.6% 55.9%
Native American 4.2% 8.6% 6.3% 12.5% 13.5% 10.5% 10.6% 6.2% 14.6% 13.1% 51.3%
Asian 8.4% 11.5% 13.2% 9.2% 9.2% 6.3% 11.4% 5.7% 7.0% 18.0% 70.6%
Hawaiian/other Pacific Islander 8.9% 7.6% 1.4% 15.2% 1.9% 9.1% 17.4% 8.7% 9.1% 20.8% 70.4%
Hispanic 7.1% 16.5% 14.0% 10.9% 9.4% 10.0% 8.4% 4.6% 8.2% 10.9% 63.5%
White, non-Hispanic 3.0% 4.0% 6.1% 8.5% 9.2% 8.7% 10.8% 8.6% 15.0% 26.2% 67.2%
Other 4.1% 5.5% 12.1% 7.8% 7.1% 12.2% 15.2% 10.0% 10.8% 15.2% 59.0%
More than one race 3.1% 6.9% 9.8% 6.3% 10.4% 11.6% 11.7% 7.0% 14.5% 18.9% 68.2%
Total 4.3% 6.6% 8.3% 9.0% 9.5% 8.6% 10.3% 7.8% 13.2% 22.6% 65.7%
Independent nonprofit 4-year colleges
Black 9.9% 12.6% 14.6% 13.5% 10.9% 7.8% 5.8% 8.1% 6.7% 10.2% 42.8%
Native American — — — — — — — — — — 40.7%
Asian 8.1% 8.1% 9.9% 10.8% 8.4% 8.2% 6.9% 6.3% 9.3% 24.0% 76.2%
Hawaiian/other Pacific Islander — — — — — — — — — — —
Hispanic 12.6% 15.7% 14.2% 9.6% 9.7% 5.1% 7.0% 5.1% 7.1% 13.9% 55.7%
White, non-Hispanic 2.5% 4.2% 6.8% 7.6% 7.9% 7.6% 8.8% 7.7% 15.8% 31.1% 66.5%
Other 4.6% 6.1% 5.2% 17.2% 10.1% 10.0% 4.5% 3.3% 5.5% 33.5% 60.9%
More than one race 2.7% 5.8% 9.6% 13.6% 10.5% 5.0% 4.7% 5.5% 12.7% 30.0% 62.2%
Total 4.6% 6.4% 8.4% 8.7% 8.5% 7.4% 8.1% 7.4% 13.6% 27.0% 62.3%
Income
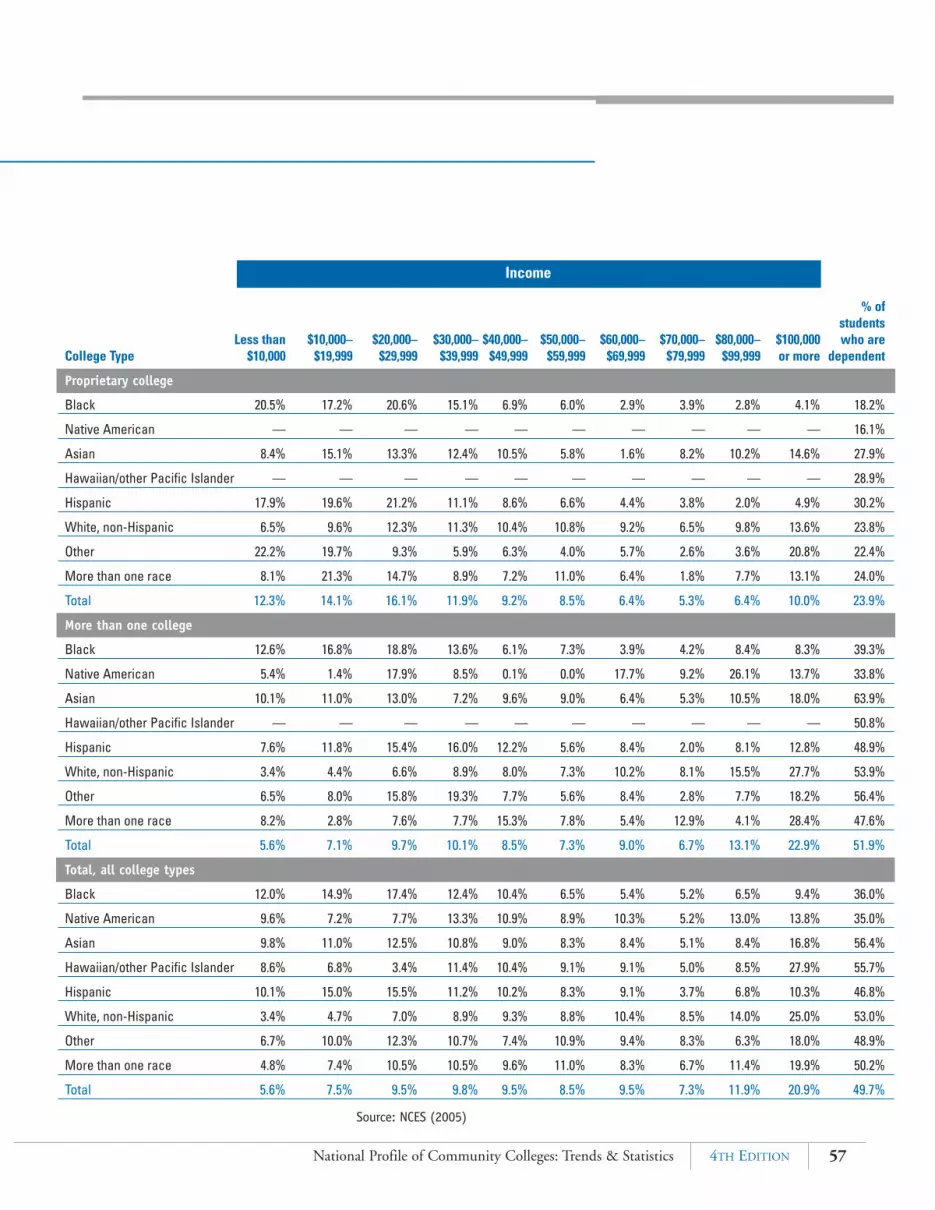
57National Profile of Community Colleges: Trends & Statistics 4TH EDITION
Source: NCES (2005)
% ofstudents
Less than $10,000– $20,000– $30,000– $40,000– $50,000– $60,000– $70,000– $80,000– $100,000 who areCollege Type $10,000 $19,999 $29,999 $39,999 $49,999 $59,999 $69,999 $79,999 $99,999 or more dependent
Proprietary college
Black 20.5% 17.2% 20.6% 15.1% 6.9% 6.0% 2.9% 3.9% 2.8% 4.1% 18.2%
Native American — — — — — — — — — — 16.1%
Asian 8.4% 15.1% 13.3% 12.4% 10.5% 5.8% 1.6% 8.2% 10.2% 14.6% 27.9%
Hawaiian/other Pacific Islander — — — — — — — — — — 28.9%
Hispanic 17.9% 19.6% 21.2% 11.1% 8.6% 6.6% 4.4% 3.8% 2.0% 4.9% 30.2%
White, non-Hispanic 6.5% 9.6% 12.3% 11.3% 10.4% 10.8% 9.2% 6.5% 9.8% 13.6% 23.8%
Other 22.2% 19.7% 9.3% 5.9% 6.3% 4.0% 5.7% 2.6% 3.6% 20.8% 22.4%
More than one race 8.1% 21.3% 14.7% 8.9% 7.2% 11.0% 6.4% 1.8% 7.7% 13.1% 24.0%
Total 12.3% 14.1% 16.1% 11.9% 9.2% 8.5% 6.4% 5.3% 6.4% 10.0% 23.9%
More than one college
Black 12.6% 16.8% 18.8% 13.6% 6.1% 7.3% 3.9% 4.2% 8.4% 8.3% 39.3%
Native American 5.4% 1.4% 17.9% 8.5% 0.1% 0.0% 17.7% 9.2% 26.1% 13.7% 33.8%
Asian 10.1% 11.0% 13.0% 7.2% 9.6% 9.0% 6.4% 5.3% 10.5% 18.0% 63.9%
Hawaiian/other Pacific Islander — — — — — — — — — — 50.8%
Hispanic 7.6% 11.8% 15.4% 16.0% 12.2% 5.6% 8.4% 2.0% 8.1% 12.8% 48.9%
White, non-Hispanic 3.4% 4.4% 6.6% 8.9% 8.0% 7.3% 10.2% 8.1% 15.5% 27.7% 53.9%
Other 6.5% 8.0% 15.8% 19.3% 7.7% 5.6% 8.4% 2.8% 7.7% 18.2% 56.4%
More than one race 8.2% 2.8% 7.6% 7.7% 15.3% 7.8% 5.4% 12.9% 4.1% 28.4% 47.6%
Total 5.6% 7.1% 9.7% 10.1% 8.5% 7.3% 9.0% 6.7% 13.1% 22.9% 51.9%
Total, all college types
Black 12.0% 14.9% 17.4% 12.4% 10.4% 6.5% 5.4% 5.2% 6.5% 9.4% 36.0%
Native American 9.6% 7.2% 7.7% 13.3% 10.9% 8.9% 10.3% 5.2% 13.0% 13.8% 35.0%
Asian 9.8% 11.0% 12.5% 10.8% 9.0% 8.3% 8.4% 5.1% 8.4% 16.8% 56.4%
Hawaiian/other Pacific Islander 8.6% 6.8% 3.4% 11.4% 10.4% 9.1% 9.1% 5.0% 8.5% 27.9% 55.7%
Hispanic 10.1% 15.0% 15.5% 11.2% 10.2% 8.3% 9.1% 3.7% 6.8% 10.3% 46.8%
White, non-Hispanic 3.4% 4.7% 7.0% 8.9% 9.3% 8.8% 10.4% 8.5% 14.0% 25.0% 53.0%
Other 6.7% 10.0% 12.3% 10.7% 7.4% 10.9% 9.4% 8.3% 6.3% 18.0% 48.9%
More than one race 4.8% 7.4% 10.5% 10.5% 9.6% 11.0% 8.3% 6.7% 11.4% 19.9% 50.2%
Total 5.6% 7.5% 9.5% 9.8% 9.5% 8.5% 9.5% 7.3% 11.9% 20.9% 49.7%
Income

58 American Association of Community Colleges
Table 2.21Independent Undergraduates’ Income by Race/Ethnicity: 2003–2004
% of students Less than $5,000- $10,000- $20,000- $30,000- $50,000 who are
Race/Ethnicity $5,000 $9,999 $19,999 $29,999 $49,999 or more independent
Public community college
Black 16.2% 11.0% 23.6% 18.3% 17.8% 13.1% 71.1%
Native American 14.0% 7.4% 18.7% 13.6% 22.3% 24.1% 73.4%
Asian 16.6% 6.4% 14.9% 10.2% 21.2% 30.7% 58.1%
Hawaiian/other Pacific Islander 17.8% 3.7% 17.7% 6.9% 24.9% 29.2% 47.2%
Hispanic 13.7% 8.9% 20.1% 17.3% 18.3% 21.8% 58.6%
White, non-Hispanic 9.7% 8.0% 14.8% 15.0% 20.7% 31.8% 59.7%
Other 15.9% 18.2% 18.0% 11.7% 17.2% 19.1% 56.4%
More than one race 7.9% 9.0% 19.5% 14.6% 26.5% 22.6% 60.2%
Total 11.9% 8.7% 17.3% 15.6% 20.0% 26.6% 61.2%
Public 4-year college
Black 16.9% 12.7% 20.4% 17.9% 15.4% 16.7% 44.1%
Native American 6.7% 14.9% 25.5% 14.4% 17.3% 21.2% 48.8%
Asian 29.0% 14.6% 12.8% 9.2% 14.2% 20.3% 29.4%
Hawaiian/other Pacific Islander — — — — — — 29.7%
Hispanic 12.8% 13.0% 22.1% 20.1% 17.9% 14.1% 36.5%
White, non-Hispanic 13.4% 10.9% 19.1% 15.4% 18.1% 23.2% 32.8%
Other 15.5% 17.3% 8.8% 19.6% 22.0% 16.8% 41.0%
More than one race 13.2% 14.6% 17.3% 15.8% 17.7% 21.4% 31.8%
Total 14.6% 11.8% 19.2% 15.9% 17.5% 21.1% 34.3%
Independent nonprofit 4-year college
Black 13.0% 10.5% 17.5% 22.4% 18.6% 18.1% 57.2%
Native American — — — — — — 59.3%
Asian 21.7% 10.5% 22.1% 8.4% 20.6% 16.8% 23.8%
Hawaiian/other Pacific Islander — — — — — — —
Hispanic 18.6% 10.8% 18.3% 15.1% 19.6% 17.6% 44.3%
White, non-Hispanic 9.7% 7.6% 14.9% 13.7% 19.3% 34.8% 33.6%
Other 10.9% 17.7% 18.1% 16.2% 9.9% 27.3% 39.1%
More than one race 14.3% 8.9% 5.9% 19.8% 22.6% 28.5% 37.8%
Total 12.0% 8.9% 16.0% 15.6% 19.3% 28.2% 37.7%
Income

59National Profile of Community Colleges: Trends & Statistics 4TH EDITION
Source: NCES (2005)
% of students Less than $5,000- $10,000- $20,000- $30,000- $50,000 who are
Race/Ethnicity $5,000 $9,999 $19,999 $29,999 $49,999 or more independent
Proprietary college
Black 15.6% 12.5% 23.7% 22.0% 13.3% 13.0% 81.8%
Native American 10.1% 13.4% 11.7% 31.9% 15.4% 17.6% 83.9%
Asian 17.1% 10.4% 23.3% 11.0% 11.9% 26.4% 72.1%
Hawaiian/other Pacific Islander 10.0% 5.3% 10.7% 33.7% 27.1% 13.2% 71.1%
Hispanic 15.1% 15.1% 25.0% 16.6% 15.4% 12.8% 69.8%
White, non-Hispanic 12.4% 9.6% 18.2% 15.7% 20.0% 24.1% 76.2%
Other 13.4% 22.3% 31.8% 8.0% 12.5% 12.1% 77.6%
More than one race 13.8% 10.2% 30.2% 18.4% 15.7% 11.8% 76.0%
Total 13.9% 11.6% 21.4% 17.4% 17.0% 18.7% 76.1%
More than one college
Black 14.3% 13.0% 20.6% 20.5% 16.9% 14.8% 60.7%
Native American 27.7% 9.0% 14.7% 19.9% 5.8% 22.9% 66.2%
Asian 26.4% 6.3% 13.0% 10.6% 19.2% 24.4% 36.1%
Hawaiian/other Pacific Islander — — — — — — 49.2%
Hispanic 11.1% 10.9% 23.7% 14.6% 17.9% 21.8% 51.1%
White, non-Hispanic 9.9% 7.9% 19.1% 13.3% 19.2% 30.6% 46.1%
Other 22.7% 12.1% 20.6% 5.5% 11.0% 28.2% 43.6%
More than one race 20.2% 10.6% 17.9% 8.4% 19.6% 23.4% 52.4%
Total 12.6% 9.1% 19.5% 14.4% 18.3% 26.1% 48.1%
Total, all colleges
Black 15.8% 11.6% 22.2% 19.5% 16.6% 14.3% 64.0%
Native American 13.5% 10.5% 19.2% 16.4% 19.1% 21.4% 65.0%
Asian 20.8% 8.8% 15.4% 9.9% 18.6% 26.5% 43.6%
Hawaiian/other Pacific Islander 19.6% 4.7% 20.3% 13.2% 19.9% 22.3% 44.4%
Hispanic 14.2% 10.9% 21.3% 17.2% 17.8% 18.7% 53.2%
White, non-Hispanic 10.9% 8.8% 16.5% 14.9% 19.8% 29.2% 47.0%
Other 15.5% 18.0% 18.4% 12.8% 16.4% 18.9% 51.1%
More than one race 11.3% 10.4% 19.0% 15.3% 22.6% 21.5% 49.8%
Total 12.8% 9.7% 18.2% 15.8% 18.9% 24.6% 50.3%
Income

60 American Association of Community Colleges
Table 2.22Percentage of Undergraduates Who Attended College In-Stateand Distance From Home: 1999–2000
Source: NCES (2004j)
90th percentile
% attended Average Median in milesCollege Type in-state miles miles from home
Public community college 95.5% 33 9 40
Public 4-year college 88.8% 100 22 235
Independent nonprofit 4-year college 65.2% 214 31 781
Proprietary college 87.3% 81 14 182
More than one college 86.3% 93 14 206
Total 88.2% 86 13 191
Distance From Home, All Students

61National Profile of Community Colleges: Trends & Statistics 4TH EDITION
Figure 2.8Distribution of Main Limiting Condition for UndergraduatesWith Disabilities: 1999–2000
5%
10%
15%
20%
25%
30%
Hearin
g impa
irmen
t
Blind
or vi
sual
impa
irmen
t
Spee
ch or
lang
uage
impa
irmen
t
Orth
oped
ic or
mob
ility
impa
irmen
t
Atte
ntion
defic
it dis
order
Health
impa
irmen
t/prob
lem
Mental
illne
ss/de
pres
sion
Deve
lopmen
tal di
sabil
ity
Brain
injur
yOt
her
Spec
ific l
earn
ing di
sabil
ity/d
yslex
ia
Perc
enta
ge o
f st
uden
ts
Limiting condition
Source: NCES (2004j)
■ Public community college■ Public 4-year college■ Independent nonprofit 4-year college


63National Profile of Community Colleges: Trends & Statistics 4TH EDITION
Just as investors do in the busi-ness world, those who use com-munity college services demanda high return on investment
(ROI). Community college studentswant assurance that their academicefforts and tuition dollars will resultin real learning for their many liferoles, as well as increased earnings.Employers want well-prepared work-ers who can be productive in a high-ly competitive global workplace.Community colleges want to be surethat they are fulfilling their missionsand making substantial contribu-tions to the quality of life of the resi-dents in their communities. Andlegislators want to know that publicfunds are being used efficiently tohelp people become contributingmembers of society.
Individual students can counton a high ROI for their tuition dol-lars. According to the 2002 census,full-time year-round workersbetween the ages of 25 and 64 withhigh school diplomas earned anaverage of $34,547 annually, where-as workers with associate degrees
earned an average of $42,204 eachyear (U.S. Census Bureau, 2004a).These earnings compound over thecourse of a worker’s lifetime. Highschool dropouts might expect to earn$1 million (1999 dollars) if they areemployed steadily over 40 years ofwork life, and high school graduatesmight expect to earn $1.2 million.Those with an associate degree canearn $1.6 million, and those with abaccalaureate—which many commu-nity college students eventuallyachieve—can earn $2.1 million dur-ing their work lives. Clearly, educa-tion pays off.
Unfortunately, these data alsoshow that women and minorities stillearn less than men and Whites forcomparable work. However, theirearnings are higher when they have acollege degree, and the incrementalvalue of these degrees is as high oreven higher than it is for Whites. Formany thousands of women andminority students, community col-leges are the entry point to higherlevels of education and higher earn-ings over a lifetime.
A study conducted recently ofthe 39 community college districtsin Illinois shows that a college edu-cation can provide significant finan-cial benefits for students (IllinoisCommunity College Board, 2002).This study revealed that the averageannual earnings of a person with anassociate degree were 112.6% morethan those of someone who did notcomplete high school and 34%more than those of someone with ahigh school diploma or GED. Overa work life of 35 to 40 years, associ-ate degree holders may earn asmuch as $350,000 more than theirless-educated colleagues. Moreover,students in Illinois had a 26.1%return on their education invest-ments and recovered all costs in 5.6years. These findings show that astudent’s standard of living is likelyto increase and the community islikely to benefit economicallythrough consumer spending andincreased tax revenues.
In addition to increasing one’searning potential, a college educa-tion increases a person’s work
The Social and Economic Impact ofCommunity Colleges
III

64 American Association of Community Colleges
options, according to theEmployment Policy Foundation(EPF). EPF tracks job gains andlosses in different industry sectorsand reported in late 2001 that man-ufacturing job losses continuedthroughout that year while job gainsoccurred in the retail sector, educa-tion services, medical services, con-struction, and finance—fields allrequiring higher skill levels.
Furthermore, when fillingvacant positions, employers soughtspecific higher-order skills and pre-ferred graduates who had completedsystematic programs of study. Thejob applicant’s possession of a collegedegree was seen as a valuable jobasset. Concluding that the Americanjob market was experiencing a pro-found structural change, EPFadvised those who want to takeadvantage of the new economy tocomplete a college degree and seekwork in growth career fields.Students in community colleges aredoing just that.
Of course, the impact of com-munity college education extendsbeyond economic capacity. A “Facesof the Future” survey conducted byAACC indicated that students valuethe intellectual growth and increasedself-confidence resulting from theirtime in college (VanDerLinden,2002). When asked to rate their col-leges, the majority of studentsreported that they were satisfied or
very satisfied with the learning envi-ronment and campus climate andwith the respect they received frominstructors and staff. For these stu-dents, then, community collegestudies offer an opportunity for per-sonal growth and the developmentof broader perspectives that can beapplied in their family and civic livesas well as at work. Very often, theiracademic success inspires students toundertake further study toward abaccalaureate, a goal they might nothave contemplated before, an under-taking that expands their economicand personal options even more.
Community colleges areaddressing the demand for ROIwith increasingly sophisticated eco-nomic models that calculate thebenefits of investing taxpayer dollarsin these colleges. Research indicatesthat every dollar invested in a com-munity college yields an average of$3.00 in benefits back to the tax-payers (ACCT, 2003). These bene-fits include the increased capacity ofstudents as wage earners and taxpay-ers and reduced costs for publicservices such as incarceration andhealth care.
For example, the study conduct-ed by the Illinois community collegedistricts addressed the role those col-leges played in the state economy. In2001, the combined budget of thesedistricts was $1.9 billion, and $1.2billion (63%) was spent in the form
of wages, salaries, and supply pur-chases that flowed directly into theIllinois economy. Skills acquired byworkers through coursework at com-munity colleges increased by $10.1billion the output of the Illinoisindustries in which these workerswere employed. Moreover, becausecommunity college students tend tostay in the local area, they constitutea long-term economic resource forthe state. Further calculationsrevealed that taxpayers’ support forIllinois community colleges in 2001($1.1 billion) would be fully recov-ered in 9.1 years in the form ofhigher tax revenues and reducedpublic expenditures for unemploy-ment, welfare, and other services.
Similarly, an economic impactstudy of the Virginia CommunityCollege System (VCCS) in2000–2001 showed that the esti-mated dollar value of increasedworkforce productivity as a result ofcoursework at these colleges wasapproximately $395 million per year(Virginia Community CollegeSystem, 2003). The value of thefuture stream of benefits from thatproductivity increase was close to$3.7 billion. The findings indicatedthat for every tax dollar invested inthe community colleges, $2.20accrued to Virginia’s economy.Noting that the VCCS enrolled63% of undergraduates in the state,the findings also suggested that

65National Profile of Community Colleges: Trends & Statistics 4TH EDITION
Virginia would need nearly $400million in additional tax dollars toaccommodate these students at four-year colleges.
Yet another study by the LosAngeles Community CollegesDistrict showed comparable results(Los Angeles Community Colleges,2002). Taking into account the eco-nomic activity generated by districtexpenditures ($964 million inwages, salaries, benefits, supplies,and operating expenses), the eco-nomic activity generated by stu-dents’ expenditures ($354 millionspent by more than 100,000 full-time equivalent students) and thegreater annual income of formerstudents ($5.3 billion), the LosAngeles colleges estimated that theypumped $6.6 billion into the localeconomy in 2000–2001. Based onsuch studies, legislators and businessleaders can be assured that commu-nity colleges are major forces in stateeconomies and provide a very realROI for their communities.
Community colleges contributeto the economy in another impor-tant way—they offer programs incareer fields where there is the mostdemand both locally and nationally.Each year, AACC identifies hot pro-grams—courses of study from whichstudents are hired immediately upongraduation, and sometimes evenbefore they complete their degrees.According to the most recent survey
(McPhee, 2004), 46% of the hotprograms identified by the respond-ing colleges (for-credit and noncred-it) were in allied health fields. Thefive hottest programs were registerednursing, law enforcement, licensedpractical nursing, radiology, andcomputer technologies. Registerednursing was the hottest program inall six regions of the country, andLPN, radiology, and law enforce-ment were hot in three or moreregions. Entry-level jobs in thesefields generally paid higher startingsalaries, ranging from $27,500 to$38,400 per year, although thesalaries varied depending on theregion. These findings were similarto the Bureau of Labor Statistics’spredictions that between 2002 and2012, 6 of the top 10 growth occu-pations will be in allied health fields,which are expected to grow by 32%(Hecker, 2004). Similarly, during theheight of the technology boom,computer technologies courses andprograms were the most frequentlyadded by colleges. Additionally,graduates of those programs receivedsome of the highest starting salariesreported (McPhee, 2004).
Community colleges will con-tinue to be the primary providers ofeducation for these workers, througheither degrees and certificates ornoncredit training programs. Forthat reason, they are continuallyadjusting their curricula to meet
local employment needs. Twenty-sixpercent of the respondents to the2004 hot programs survey notedthat in the past three years they hadadded courses or programs in alliedhealth fields; 17% added offerings ininformation technologies, and14.7% added offerings in the skilledtrades—industrial field. These addi-tions included programs with bothfor-credit and noncredit courses.Also, of the 65.4% of respondentswho noted that they had revisedtheir curricula to address homelandsecurity needs, half indicated thatthey had added courses or entireprograms in a related area.Emerging career areas associatedwith homeland security include firstresponders, security and protectiveservices, infrastructure security, andcybersecurity.
Given the benefits of degrees forindividuals and society, the less-than-optimal college participation ratesfound in many states today is a con-tinuing concern. The Americanworkforce must be prepared to com-pete in today’s global economy,yet—according to a 2003 report ofthe Education Commission of theStates—rates of high school comple-tion are somewhat stagnant, andyoung people who do complete highschool may find it impossible toenroll because financing a collegeeducation is beyond their means.Women, minorities, new immi-

66 American Association of Community Colleges
grants, and other nontraditionalpopulations may not be participatingin postsecondary education at desir-able rates either. Community col-leges will need to continue theircommitment to providing access inorder to reduce the current participa-tion gap and ensure that our nationis positioned for economic strengthwith a highly educated workforce.
All in all, legislators, businessleaders, the general public, and stu-dents themselves can count on com-
munity colleges to provide a realROI as they carry out their mis-sions. As was noted in TheKnowledge Net: ConnectingCommunities, Learners, andColleges—the report of the AACCNew Expeditions futuring projectconducted in 2000 with fundingfrom the W. K. KelloggFoundation—community collegesare the nexus of a constantly chang-ing world. They connect with localcommunities through education and
enrichment programs and con-tribute substantially to the economyand to the quality of life. They linkthe various levels of the Americaneducation system and draw studentsto learning-centered campuses for alifetime of growth and development.The impact of community collegeshas been felt for the past 100 years,and they are poised to play an evenmore central role in the learningnetwork of our country in the nextcentury. D

67National Profile of Community Colleges: Trends & Statistics 4TH EDITION

68 American Association of Community Colleges
Table 3.1Highest Level of Education Attained by PeopleAged 25 or Older: 1993–2002 (numbers in thousands)
% change
Highest Level of Education Attained 1993 1994 1995 1996 1997 1998 1999 2000 2001 2002 1993–2002
# of people aged 25 or older
None 1,010 1,012 1,005 966 916 844 848 851 892 870 -13.9%
Elementary grades 1–4 2,370 2,144 2,069 2,061 1,924 1,990 1,894 1,891 1,918 2,032 -14.3%
Elementary grades 5–6 3,484 3,622 3,620 3,479 3,548 3,614 3,621 3,542 3,633 3,789 8.8%
Elementary grades 7–8 8,263 7,737 7,253 7,116 6,929 6,334 6,034 5,896 5,886 5,880 -28.8%
High school grade 9 3,967 3,986 3,965 4,133 4,026 3,902 3,657 3,680 3,859 3,751 -5.4%
High school grade 10 5,724 5,860 5,667 5,808 5,605 5,297 5,332 4,975 5,014 5,037 -12.0%
High school grade 11 7,376 7,079 6,934 7,161 7,580 7,577 7,454 7,019 7,406 7,589 2.9%
High school diploma 57,589 56,515 56,450 56,559 57,586 58,714 57,935 58,086 58,272 58,456 1.5%
Some college, no degree 27,095 28,554 29,355 29,201 29,367 29,638 30,102 30,753 31,441 30,991 14.4%
Associate degree 10,356 11,460 11,894 12,171 12,407 12,868 13,074 13,692 14,840 15,051 45.3%
Occupational associate degree 5,962 6,327 6,384 6,495 6,527 6,767 6,884 7,221 7,849 8,070 35.4%
Academic associate degree 4,394 5,133 5,510 5,676 5,880 6,101 6,190 6,471 6,991 6,981 58.9%
Bachelor's degree 23,619 24,256 25,313 26,540 27,357 28,305 29,495 29,840 31,500 32,282 36.7%
Master's degree 8,310 8,398 8,817 9,101 9,132 9,232 9,767 10,396 10,978 11,487 38.2%
Professional degree 2,236 2,267 2,428 2,416 2,447 2,568 2,502 2,586 2,605 2,737 22.4%
Doctorate 1,425 1,623 1,668 1,611 1,761 1,868 2,039 2,023 2,145 2,190 53.7%
Total 162,826 164,512 166,438 168,323 170,581 172,751 173,754 175,230 180,389 182,142 11.9%
Year

Source: U.S. Census Bureau (1998, 1999, 2000, 2001, 2002, 2003, 2004a)
Note. Details may not equal totals because of rounding. High school diploma includes GED orhigh school equivalency.
% change
Highest Level of Education Attained 1993 1994 1995 1996 1997 1998 1999 2000 2001 2002 1993–2002
% of people aged 25 or older
None 0.6% 0.6% 0.6% 0.6% 0.5% 0.5% 0.5% 0.5% 0.5% 0.5% -23.0%
Elementary grades 1–4 1.5% 1.3% 1.2% 1.2% 1.1% 1.2% 1.1% 1.1% 1.1% 1.1% -23.4%
Elementary grades 5–6 2.1% 2.2% 2.2% 2.1% 2.1% 2.1% 2.1% 2.0% 2.0% 2.1% -2.8%
Elementary grades 7–8 5.1% 4.7% 4.4% 4.2% 4.1% 3.7% 3.5% 3.4% 3.3% 3.2% -36.4%
High school grade 9 2.4% 2.4% 2.4% 2.5% 2.4% 2.3% 2.1% 2.1% 2.1% 2.1% -15.5%
High school grade 10 3.5% 3.6% 3.4% 3.5% 3.3% 3.1% 3.1% 2.8% 2.8% 2.8% -21.3%
High school grade 11 4.5% 4.3% 4.2% 4.3% 4.4% 4.4% 4.3% 4.0% 4.1% 4.2% -8.0%
High school diploma 35.4% 34.4% 33.9% 33.6% 33.8% 34.0% 33.3% 33.1% 32.3% 32.1% -9.3%
Some college, no degree 16.6% 17.4% 17.6% 17.3% 17.2% 17.2% 17.3% 17.6% 17.4% 17.0% 2.2%
Associate degree 6.4% 7.0% 7.1% 7.2% 7.3% 7.4% 7.5% 7.8% 8.2% 8.3% 29.9%
Occupational associate degree 3.7% 3.8% 3.8% 3.9% 3.8% 3.9% 4.0% 4.1% 4.4% 4.4% 21.0%
Academic associate degree 2.7% 3.1% 3.3% 3.4% 3.4% 3.5% 3.6% 3.7% 3.9% 3.8% 42.0%
Bachelor's degree 14.5% 14.7% 15.2% 15.8% 16.0% 16.4% 17.0% 17.0% 17.5% 17.7% 22.2%
Master's degree 5.1% 5.1% 5.3% 5.4% 5.4% 5.3% 5.6% 5.9% 6.1% 6.3% 23.6%
Professional degree 1.4% 1.4% 1.5% 1.4% 1.4% 1.5% 1.4% 1.5% 1.4% 1.5% 9.4%
Doctorate 0.9% 1.0% 1.0% 1.0% 1.0% 1.1% 1.2% 1.2% 1.2% 1.2% 37.4%
Total 100.0% 100.0% 100.0% 100.0% 100.0% 100.0% 100.0% 100.0% 100.0% 100.0%
Year
69National Profile of Community Colleges: Trends & Statistics 4TH EDITION

70
Table 3.2Highest Level of Education Attained by People Aged 25 orOlder, by Gender and Race/Ethnicity: 2002
Men Women Total
Highest Level of Education Attained # (1,000s) % # (1,000s) % # (1,000s) %
White, non-Hispanic
No high school 798 1.2% 745 1.1% 1,543 1.2%
Some high school, no diploma 6,599 10.3% 6,939 10.0% 13,538 10.1%
High school diploma 20,197 31.5% 23,801 34.3% 43,998 33.0%
Associate degree 5,095 8.0% 6,639 9.6% 11,734 8.8%
Occupational associate degree 2,867 4.5% 3,503 5.1% 6,370 4.8%
Academic associate degree 2,228 3.5% 3,136 4.5% 5,364 4.0%
Some college, no degree 11,068 17.3% 12,309 17.8% 23,377 17.5%
Bachelor's degree 12,936 20.2% 12,841 18.5% 25,777 19.3%
Master's degree 4,626 7.2% 4,819 7.0% 9,445 7.1%
Professional degree 1,524 2.4% 713 1.0% 2,237 1.7%
Doctorate 1,240 1.9% 526 0.8% 1,766 1.3%
Total 64,083 100.0% 69,332 100.0% 133,415 100.0%
Black, non-Hispanic
No high school 333 3.9% 323 2.9% 656 3.3%
Some high school, no diploma 1,473 17.1% 1,955 17.7% 3,428 17.5%
High school diploma 2,995 34.9% 3,671 33.2% 6,666 33.9%
Some college, no degree 1,784 20.8% 2,141 19.4% 3,925 20.0%
Associate degree 589 6.9% 1,005 9.1% 1,594 8.1%
Occupational associate degree 301 3.5% 510 4.6% 811 4.1%
Academic associate degree 288 3.4% 495 4.5% 783 4.0%
Bachelor's degree 996 11.6% 1,340 12.1% 2,336 11.9%
Master's degree 293 3.4% 496 4.5% 789 4.0%
Professional degree 66 0.8% 76 0.7% 142 0.7%
Doctorate 63 0.7% 42 0.4% 105 0.5%
Total 8,592 100.0% 11,049 100.0% 19,641 100.0%
Source: U.S. Census Bureau (2004a)
Note. Too few Native Americans were included in the sample to produce reliable estimates.High school diploma includes GED or equivalency.
American Association of Community Colleges

71National Profile of Community Colleges: Trends & Statistics 4TH EDITION
Men Women Total
Highest Level of Education Attained # (1,000s) % # (1,000s) % # (1,000s) %
Asian/Pacific Islander
No high school 108 2.9% 283 6.9% 391 5.0%
Some high school, no diploma 284 7.6% 312 7.6% 596 7.6%
High school diploma 769 20.6% 957 23.2% 1,726 21.9%
Some college, no degree 438 11.7% 455 11.0% 893 11.4%
Associate degree 239 6.4% 309 7.5% 548 7.0%
Occupational associate degree 114 3.0% 156 3.8% 270 3.4%
Academic associate degree 125 3.3% 153 3.7% 278 3.5%
Bachelor's degree 1,148 30.7% 1,289 31.3% 2,437 31.0%
Master's degree 470 12.6% 355 8.6% 825 10.5%
Professional degree 127 3.4% 86 2.1% 213 2.7%
Doctorate 158 4.2% 78 1.9% 236 3.0%
Total 3,741 100.0% 4,124 100.0% 7,865 100.0%
Hispanic
No high school 2,113 21.3% 1,960 20.1% 4,073 20.7%
Some high school, no diploma 2,245 22.6% 2,147 22.0% 4,392 22.3%
High school diploma 2,727 27.5% 2,766 28.4% 5,493 27.9%
Some college, no degree 1,252 12.6% 1,239 12.7% 2,491 12.7%
Associate degree 491 5.0% 550 5.6% 1,041 5.3%
Occupational associate degree 267 2.7% 277 2.8% 544 2.8%
Academic associate degree 224 2.3% 273 2.8% 497 2.5%
Bachelor's degree 781 7.9% 811 8.3% 1,592 8.1%
Master's degree 184 1.9% 197 2.0% 381 1.9%
Professional degree 76 0.8% 65 0.7% 141 0.7%
Doctorate 47 0.5% 21 0.2% 68 0.3%
Total 9,916 100.0% 9,756 100.0% 19,672 100.0%
All people aged 25 or older
No high school 3,360 3.9% 3,331 3.5% 6,691 3.7%
Some high school, no diploma 10,735 12.3% 11,523 12.1% 22,258 12.2%
High school diploma 26,947 31.0% 31,509 33.1% 58,456 32.1%
Some college, no degree 14,661 16.9% 16,330 17.2% 30,991 17.0%
Associate degree 6,466 7.4% 8,585 9.0% 15,051 8.3%
Occupational associate degree 3,577 4.1% 4,493 4.7% 8,070 4.4%
Academic associate degree 2,889 3.3% 4,092 4.3% 6,981 3.8%
Bachelor's degree 15,925 18.3% 16,357 17.2% 32,282 17.7%
Master's degree 5,595 6.4% 5,893 6.2% 11,488 6.3%
Professional degree 1,795 2.1% 942 1.0% 2,737 1.5%
Doctorate 1,514 1.7% 676 0.7% 2,190 1.2%
Total 86,998 100.0% 95,146 100.0% 182,144 100.0%
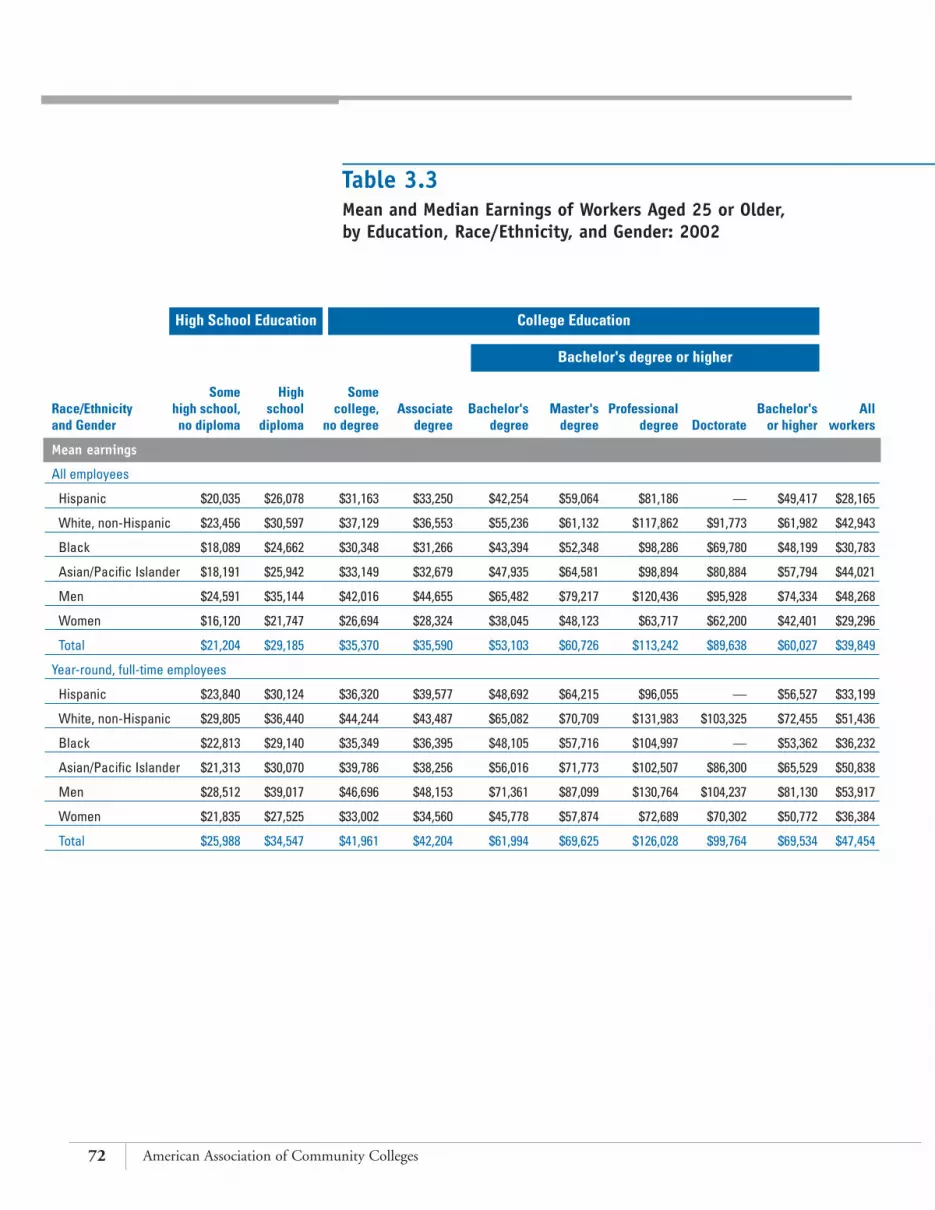
72 American Association of Community Colleges
Table 3.3Mean and Median Earnings of Workers Aged 25 or Older,by Education, Race/Ethnicity, and Gender: 2002
Some High SomeRace/Ethnicity high school, school college, Associate Bachelor's Master's Professional Bachelor's All and Gender no diploma diploma no degree degree degree degree degree Doctorate or higher workers
Mean earnings
All employees
Hispanic $20,035 $26,078 $31,163 $33,250 $42,254 $59,064 $81,186 — $49,417 $28,165
White, non-Hispanic $23,456 $30,597 $37,129 $36,553 $55,236 $61,132 $117,862 $91,773 $61,982 $42,943
Black $18,089 $24,662 $30,348 $31,266 $43,394 $52,348 $98,286 $69,780 $48,199 $30,783
Asian/Pacific Islander $18,191 $25,942 $33,149 $32,679 $47,935 $64,581 $98,894 $80,884 $57,794 $44,021
Men $24,591 $35,144 $42,016 $44,655 $65,482 $79,217 $120,436 $95,928 $74,334 $48,268
Women $16,120 $21,747 $26,694 $28,324 $38,045 $48,123 $63,717 $62,200 $42,401 $29,296
Total $21,204 $29,185 $35,370 $35,590 $53,103 $60,726 $113,242 $89,638 $60,027 $39,849
Year-round, full-time employees
Hispanic $23,840 $30,124 $36,320 $39,577 $48,692 $64,215 $96,055 — $56,527 $33,199
White, non-Hispanic $29,805 $36,440 $44,244 $43,487 $65,082 $70,709 $131,983 $103,325 $72,455 $51,436
Black $22,813 $29,140 $35,349 $36,395 $48,105 $57,716 $104,997 — $53,362 $36,232
Asian/Pacific Islander $21,313 $30,070 $39,786 $38,256 $56,016 $71,773 $102,507 $86,300 $65,529 $50,838
Men $28,512 $39,017 $46,696 $48,153 $71,361 $87,099 $130,764 $104,237 $81,130 $53,917
Women $21,835 $27,525 $33,002 $34,560 $45,778 $57,874 $72,689 $70,302 $50,772 $36,384
Total $25,988 $34,547 $41,961 $42,204 $61,994 $69,625 $126,028 $99,764 $69,534 $47,454
Bachelor's degree or higher
College EducationHigh School Education

73National Profile of Community Colleges: Trends & Statistics 4TH EDITION
Some High SomeRace/Ethnicity high school, school college, Associate Bachelor's Master's Professional Bachelor's All and Gender no diploma diploma no degree degree degree degree degree Doctorate or higher workers
Median earnings
All employees
Hispanic $16,877 $22,289 $26,737 $27,577 $35,556 $47,358 $50,694 — $38,221 $21,791
White, non-Hispanic $20,377 $25,954 $30,938 $31,836 $41,979 $50,916 $80,301 $72,353 $46,964 $32,173
Black $16,046 $21,682 $26,607 $28,152 $38,917 $41,906 $52,210 $60,399 $40,619 $25,832
Asian/Pacific Islander $17,545 $22,397 $27,356 $31,019 $40,125 $56,779 $73,441 $73,148 $46,504 $31,756
Men $20,726 $30,658 $35,755 $39,863 $50,730 $61,807 $86,741 $75,004 $55,229 $36,116
Women $12,990 $19,285 $23,020 $25,810 $33,662 $41,790 $50,308 $51,627 $36,626 $23,865
Total $17,787 $25,081 $29,902 $31,358 $41,361 $50,703 $76,659 $71,541 $46,025 $30,552
Year-round, full-time employees
Hispanic $20,043 $25,893 $30,756 $34,297 $39,888 $50,058 $71,287 — $42,796 $25,953
White, non-Hispanic $25,653 $31,047 $36,847 $37,840 $50,661 $57,000 $91,155 $79,395 $54,533 $39,815
Black $20,096 $25,608 $30,640 $32,950 $41,663 $46,711 $56,412 — $42,995 $30,395
Asian/Pacific Islander $20,458 $26,111 $31,354 $35,769 $46,978 $62,337 $77,163 $80,054 $52,346 $38,818
Men $23,804 $33,036 $40,159 $41,658 $53,108 $66,933 $100,000+ $81,077 $60,553 $40,706
Women $17,124 $24,216 $28,838 $31,193 $39,818 $48,275 $60,092 $60,425 $42,046 $30,445
Total $21,552 $29,800 $35,505 $36,783 $48,895 $56,494 $85,920 $77,215 $52,091 $36,311
Source: U.S. Census Bureau (2004a)
Note. Too few Native Americans were included in the sample to produce reliable estimates.High school diploma includes GED or high school equivalency. Empty cells indicate too fewcases to produce reliable estimates.
Bachelor's degree or higher
College EducationHigh School Education

74 American Association of Community Colleges
Figure 3.1Life Earnings Estimates for Full-Time, Year-Round Workers byGender and Education (based on 1997–1999 work experience)
Bachelor's degree
High school diploma
No high school diploma
Some college
Associate degree
Master's degree
Professional degree
Doctorate
$0.5 $1.0 $1.5 $2.0 $2.5
Lifetime earnings, in millions
$3.5 $4.5 $5.0$4.0$3.0
Source: U.S. Census Bureau (2002)
■ Women■ Men

75National Profile of Community Colleges: Trends & Statistics 4TH EDITION
Table 3.4Mean Earnings of Workers Aged 25 or Older, by Highest Levelof Education Attained: 1994–2002
% % % Highest Level of change change changeEducation Attained 1994 1995 1996 1997 1998 1999 2000 2001 2002 1994–1998 1998–2002 1994–2002
Current dollars
Less than 9th grade $15,191 $14,021 $15,043 $16,214 $17,070 $16,928 $18,394 $18,519 $18,935 12% 11% 25%
9–12 grade, no diploma $15,982 $17,009 $18,384 $19,621 $18,913 $19,474 $22,076 $22,969 $22,463 18% 19% 41%
High school diploma $21,836 $23,063 $23,946 $24,711 $25,257 $26,527 $27,978 $28,816 $29,185 16% 16% 34%
Some college, no degree $24,747 $26,760 $28,720 $29,550 $30,571 $32,267 $33,945 $34,567 $35,370 24% 16% 43%
Associate degree $27,681 $29,033 $29,702 $31,218 $33,765 $33,506 $35,103 $35,972 $35,590 22% 5% 29%
Bachelor's degree $38,947 $38,574 $39,525 $41,904 $45,390 $47,423 $51,649 v52,462 $53,103 17% 17% 36%
Master's degree $46,536 $47,785 $50,362 $51,362 $52,951 $55,922 $61,295 $63,823 $60,726 14% 15% 30%
Professional degree $82,749 $85,601 $94,130 $95,521 $95,954 $102,014 $95,150 $101,728 $113,242 16% 18% 37%
Doctorate $67,909 $64,654 $72,464 $77,505 $75,071 $86,985 $80,223 $85,675 $89,638 11% 19% 32%
Total $28,645 $29,579 $31,054 $32,536 $34,068 $35,824 $38,068 $39,378 $39,849 19% 17% 39%
Constant 2002 dollars
Less than 9th grade $18,233 $16,430 $17,167 $18,116 $18,808 $18,267 $19,208 $18,814 $18,935 3% 1% 4%
9–12 grade, no diploma $19,183 $19,931 $20,979 $21,923 $20,839 $21,015 $23,053 $23,334 $22,463 9% 8% 17%
High school diploma $26,209 $27,026 $27,327 $27,610 $27,828 $28,626 $29,216 $29,274 $29,185 6% 5% 11%
Some college, no degree $29,703 $31,358 $32,775 $33,017 $33,683 $34,820 $35,447 $35,117 $35,370 13% 5% 19%
Associate degree $33,225 $34,021 $33,895 $34,881 $37,203 $36,157 $36,657 $36,544 $35,590 12% -4% 7%
Bachelor's degree $46,747 $45,201 $45,105 $46,820 $50,011 $51,175 $53,935 $53,296 $53,103 7% 6% 14%
Master's degree $55,856 $55,995 $57,472 $57,388 $58,342 $60,346 $64,008 $64,838 $60,726 4% 4% 9%
Professional degree $99,322 $100,308 $107,419 $106,728 $105,723 $110,084 $99,361 $103,346 $113,242 6% 7% 14%
Doctorate $81,509 $75,762 $82,694 $86,598 $82,714 $93,866 $83,774 $87,038 $89,638 1% 8% 10%
Total $34,382 $34,661 $35,438 $36,353 $37,536 $38,658 $39,753 $40,004 $39,849 9% 6% 16%
Source: U.S. Census Bureau (1998, 1999, 2000, 2002, 2004a)
Note. High school diploma includes GED or high school equivalency.
Year

76 American Association of Community Colleges
Table 3.5Certificates and Degrees Awarded by Title IV Colleges:1994–2002
Change % change
1994–1995 1994–1995to to
Certificates and Degrees Awarded 1994–1995 1995–1996 1996–1997 1997–1998 1999–2000 2000–2001 2001–2002 2001–2002 2001–2002
Pre-baccalaureate
Less than 2-year certificate 481,257 483,326 508,954 493,597 525,853 533,398 586,538 105,281 21.9%
Associate degree 527,752 530,457 547,596 553,352 562,929 582,945 599,479 71,727 13.6%
Greater than 2, but less than 4-year certificate 32,402 31,699 32,639 32,576 27,020 26,017 27,666 -4,736 -14.6%
Total pre-baccalaureate awarded 1,041,411 1,045,482 1,089,189 1,079,525 1,115,802 1,142,360 1,213,683 172,272 16.5%
Post-baccalaureate
Bachelor's degree 1,162,013 1,167,446 1,176,174 1,191,083 1,245,806 1,307,455 1,364,132 202,119 17.4%
Post-baccalaureate certificate 7,853 8,529 7,955 7,953 13,405 15,486 16,974 9,121 116.1%
Master's degree 394,244 403,569 416,825 430,210 456,603 471,166 487,602 93,358 23.7%
Post-master's certificate 8,368 8,525 8,629 8,768 8,948 9,513 10,532 2,164 25.9%
Doctorate 43,792 44,162 45,544 45,823 44,511 44,916 44,198 406 0.9%
First professional degree 75,353 75,966 77,898 78,116 79,201 80,395 81,279 5,926 7.9%
First professional certificate 415 694 495 676 835 729 800 385 92.8%
Total post-baccalaureate awarded 530,025 541,445 557,346 571,546 603,503 622,205 641,385 111,360 21.0%
Source: NCES (2004c)
Note. Includes all colleges eligible for Federal Title IV Student Financial Aid participation.Data are unavailable for 1998–1999.
Academic Year

77National Profile of Community Colleges: Trends & Statistics 4TH EDITION
Figure 3.2Percentage of Community College Certificates and AssociateDegrees Awarded, by Race/Ethnicity: 2001–2002
60%
50%
40%
30%
20%
10%
70%
80%
90%
100%
Blac
k, no
n-Hisp
anic
Native
Ameri
can
Asian
/Pac
ific I
sland
er
Hispan
ic
Race
/eth
nicity
unkn
own
Nonres
ident
alien
White,
non-
Hispan
ic
Perc
enta
ge o
f st
uden
ts
Race/ethnicity
Source: NCES (2004c)
■ Certificates■ Associate degrees
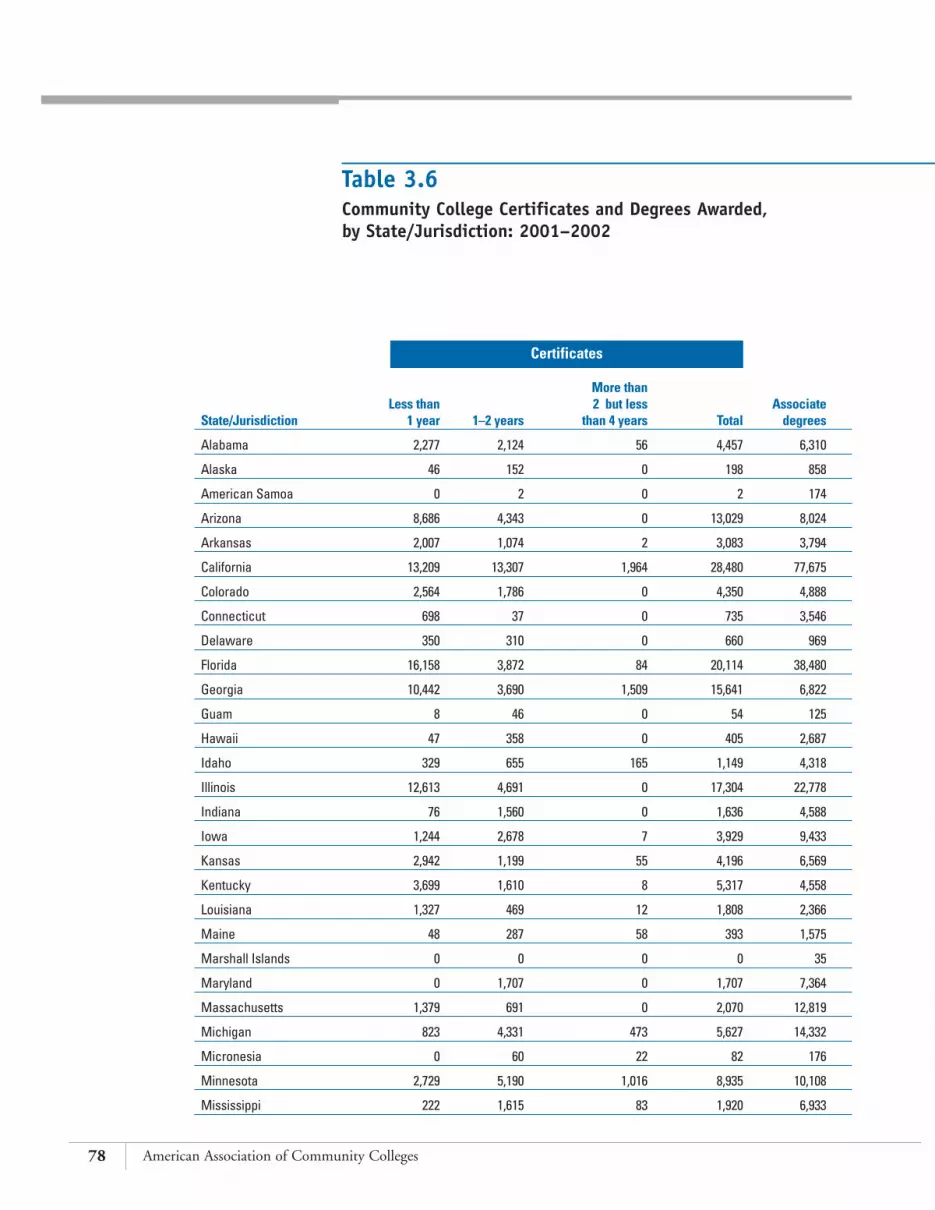
78 American Association of Community Colleges
Table 3.6Community College Certificates and Degrees Awarded,by State/Jurisdiction: 2001–2002
More than Less than 2 but less Associate
State/Jurisdiction 1 year 1–2 years than 4 years Total degrees
Alabama 2,277 2,124 56 4,457 6,310
Alaska 46 152 0 198 858
American Samoa 0 2 0 2 174
Arizona 8,686 4,343 0 13,029 8,024
Arkansas 2,007 1,074 2 3,083 3,794
California 13,209 13,307 1,964 28,480 77,675
Colorado 2,564 1,786 0 4,350 4,888
Connecticut 698 37 0 735 3,546
Delaware 350 310 0 660 969
Florida 16,158 3,872 84 20,114 38,480
Georgia 10,442 3,690 1,509 15,641 6,822
Guam 8 46 0 54 125
Hawaii 47 358 0 405 2,687
Idaho 329 655 165 1,149 4,318
Illinois 12,613 4,691 0 17,304 22,778
Indiana 76 1,560 0 1,636 4,588
Iowa 1,244 2,678 7 3,929 9,433
Kansas 2,942 1,199 55 4,196 6,569
Kentucky 3,699 1,610 8 5,317 4,558
Louisiana 1,327 469 12 1,808 2,366
Maine 48 287 58 393 1,575
Marshall Islands 0 0 0 0 35
Maryland 0 1,707 0 1,707 7,364
Massachusetts 1,379 691 0 2,070 12,819
Michigan 823 4,331 473 5,627 14,332
Micronesia 0 60 22 82 176
Minnesota 2,729 5,190 1,016 8,935 10,108
Mississippi 222 1,615 83 1,920 6,933
Certificates

79National Profile of Community Colleges: Trends & Statistics 4TH EDITION
Source: NCES (2004c)
More than Less than 2 but less Associate
1 year 1–2 years than 4 years Total degrees
Missouri 1,065 1,037 25 2,127 7,314
Montana 5 200 2 207 1,361
Nebraska 614 651 2 1,267 3,423
Nevada 0 252 0 252 2,056
New Hampshire 465 186 0 651 2,161
New Jersey 220 644 0 864 11,280
New Mexico 466 793 35 1,294 3,436
New York 669 1,741 70 2,480 40,533
North Carolina 9,419 3,338 2 12,759 13,927
North Dakota 45 380 3 428 1,746
Northern Marianas Islands 0 0 0 0 82
Ohio 3,027 1,725 2 4,754 15,668
Oklahoma 163 342 0 505 6,318
Oregon 244 1,169 60 1,473 5,972
Palau 0 0 26 26 32
Pennsylvania 5,131 1,112 281 6,524 12,262
Puerto Rico 30 94 0 124 1,064
Rhode Island 25 147 0 172 1,916
South Carolina 4,203 1,231 114 5,548 6,211
South Dakota 102 373 242 717 1,297
Tennessee 807 479 0 1,286 5,991
Texas 6,328 11,118 575 18,021 28,358
Utah 358 587 11 956 6,898
Vermont 0 116 0 116 766
Virginia 2,924 1,822 0 4,746 10,552
Washington 4,421 3,621 626 8,668 19,461
West Virginia 1 135 0 136 2,156
Wisconsin 8,558 3,273 433 12,264 10,065
Wyoming 36 314 3 353 1,683
Grand Total 133,249 94,724 8,026 235,999 486,293
Certificates

80 American Association of Community Colleges
Table 3.7Community College Certificates and Degrees Awarded,by Field of Study: 2001–2002
Agricultural business and production 3,852 3,794
Agricultural sciences 155 814
Architecture and related programs 9 339
Area, ethnic, and cultural studies 280 93
Biological/life sciences 101 1,477
Business management and administrative services 37,109 71,515
Communications 409 1,978
Communications technologies 808 1,878
Computer and information sciences 9,873 17,590
Conservation and renewable natural resources 1,018 1,214
Construction trades 8,598 2,337
Consumer and personal services 9,875 3,781
Education 2,003 8,348
Engineering 78 1,586
Engineering-related technologies 8,019 19,164
English language and literature/letters 179 839
Foreign languages and literatures 288 508
Health professions and related sciences 64,880 65,197
Home economics 1,355 836
Law and legal studies 1,389 4,410
Liberal arts and sciences, general studies, and humanities 3,659 196,358
Library science 198 94
Marketing operations/marketing and distribution 8,720 4,983
Mathematics 6 672
Mechanics and repairers 18,128 7,952
Multi/interdisciplinary studies 240 12,898
Not classified by field of study 3 135
Parks, recreation, leisure, and fitness studies 658 793
AssociateField of Study Certificates Degrees

81National Profile of Community Colleges: Trends & Statistics 4TH EDITION
Source: NCES (2004c)
Philosophy and religion 4 95
Physical sciences 26 1,297
Precision production trades 11,303 6,822
Protective services 17,483 15,103
Psychology 43 1,623
Public administration and services 794 2,999
ROTC and military technologies 0 62
Science technologies 251 839
Social sciences and history 204 5,421
Theological studies/religious vocations 15 9
Transportation and material moving workers 9,987 738
Visual and performing arts 2,465 11,740
Vocational home economics 11,534 7,962
Total awarded 235,999 486,293
AssociateField of Study Certificates Degrees

82 American Association of Community Colleges
Table 3.8Community College Certificates and Degrees Awarded,by Gender and Race/Ethnicity: 2001–2002
Asian/ Race/ Black, Native Pacific White, ethnicity Nonresident
Gender non-Hispanic American Islander Hispanic non-Hispanic unknown alien Total
Number awarded
Associate degrees
Men 14,859 1,795 10,478 16,938 127,749 7,691 4,548 184,058
Women 32,626 3,871 15,617 30,820 202,566 10,194 6,541 302,235
Total 47,485 5,666 26,095 47,758 330,315 17,885 11,089 486,293
Certificates
Men 14,464 1,294 4,533 10,450 74,187 5,583 994 111,505
Women 19,934 1,617 5,635 12,454 78,338 5,055 1,461 124,494
Total 34,398 2,911 10,168 22,904 152,525 10,638 2,455 235,999
Percentage awarded
Associate degrees
Men 8.1% 1.0% 5.7% 9.2% 69.4% 4.2% 2.5% 100.0%
Women 10.8% 1.3% 5.2% 10.2% 67.0% 3.4% 2.2% 100.0%
Total 9.8% 1.2% 5.4% 9.8% 67.9% 3.7% 2.3% 100.0%
Certificates
Men 13.0% 1.2% 4.1% 9.4% 66.5% 5.0% 0.9% 100.0%
Women 16.0% 1.3% 4.5% 10.0% 62.9% 4.1% 1.2% 100.0%
Total 14.6% 1.2% 4.3% 9.7% 64.6% 4.5% 1.0% 100.0%
Source: NCES (2004c)
Race/Ethnicity

83National Profile of Community Colleges: Trends & Statistics 4TH EDITION
Figure 3.3Main Purpose for Enrolling for 1995–1996 BeginningCommunity College Students
Degree or certificate21%
Transfer to a4-year college
37%
Personal enrichment16%
Other transfer3%
Job skills23%
Source: Hoachlander, Sikora, & Horn (2003, Table 3)

84 American Association of Community Colleges
Table 3.9June 2001 Award and Persistence Status of UndergraduatesEntering College 1995–1996, by Highest Degree Expected and College Type
Enrolled Enrolled at at a less than a
Highest Degree Expected Bachelor's Associate 4-year 4-year Not in 1995–1996 degree degree Certificate Any award college college enrolled
Public community college
Less than bachelor's degree 1.5% 17.1% 12.8% 31.4% 0.5% 6.2% 61.8%
Bachelor's degree 9.3% 16.7% 8.2% 34.2% 10.8% 9.4% 45.6%
Advanced degree 18.5% 15.1% 7.8% 41.4% 12.9% 9.9% 35.7%
Unknown 5.2% 11.0% 14.5% 30.7% 3.7% 12.1% 53.5%
Total 10.3% 15.8% 9.7% 35.8% 8.4% 9.1% 46.8%
Public 4-year college
Less than bachelor's degree 4.3% 20.3% 8.8% 33.4% 7.0% 3.8% 55.8%
Bachelor's degree 39.6% 6.9% 3.7% 50.2% 14.4% 3.9% 31.6%
Advanced degree 60.0% 2.3% 2.4% 64.7% 14.6% 2.6% 18.1%
Unknown 48.6% 6.0% 3.6% 58.2% 14.5% 2.2% 25.1%
Total 53.0% 4.4% 2.8% 60.2% 14.5% 2.8% 22.5%
Independent nonprofit 4-year college
Less than bachelor's degree — — — — — — —
Bachelor's degree 51.5% 4.7% 2.3% 58.5% 9.7% 2.8% 29.0%
Advanced degree 75.2% 2.0% 1.0% 78.2% 7.1% 2.1% 12.6%
Unknown 68.0% 2.9% 2.0% 72.9% 4.6% 0.9% 21.7%
Total 68.9% 2.8% 1.8% 73.5% 7.1% 2.3% 17.1%
Proprietary college
Less than bachelor's degree 0.0% 4.7% 57.9% 62.6% 0.1% 1.6% 35.7%
Bachelor's degree 3.7% 11.1% 44.7% 59.5% 1.4% 2.2% 37.0%
Advanced degree 3.3% 16.1% 41.9% 61.3% 4.6% 5.0% 29.2%
Unknown 1.5% 7.8% 45.9% 55.2% 0.0% 1.2% 43.6%
Total 4.4% 23.1% 26.8% 54.3% 2.1% 3.0% 40.6%
No Award AttainedAward Attained

85National Profile of Community Colleges: Trends & Statistics 4TH EDITION
No Award Attained
Enrolled Enrolled at at public independent
Highest Degree Expected Bachelor's Associate 4-year 4-year Not in 1995–1996 degree degree Certificate Any award college college enrolled
Othera
Less than bachelor's degree 0.0% 7.8% 46.0% 53.8% 0.0% 6.0% 40.2%
Bachelor's degree 3.5% 17.9% 30.0% 51.4% 7.4% 8.7% 32.5%
Advanced degree 17.3% 15.0% 34.6% 66.9% 4.0% 4.3% 24.8%
Unknown 0.7% 7.7% 43.6% 52.0% 0.6% 2.8% 44.5%
Total 1.1% 3.7% 56.3% 61.1% 1.1% 2.9% 35.0%
All colleges
Less than bachelor's degree 1.2% 7.9% 28.5% 37.6% 0.6% 4.7% 52.5%
Bachelor's degree 18.1% 12.6% 10.7% 41.4% 10.4% 7.1% 40.4%
Advanced degree 46.6% 13.3% 5.7% 65.6% 11.8% 5.1% 23.4%
Unknown 23.6% 7.3% 17.5% 48.4% 5.6% 5.6% 39.9%
Total 28.8% 10.0% 12.1% 50.9% 8.8% 5.6% 34.7%
Source: NCES (2004b)
aIncludes less than 2-year and private nonprofit community colleges.
Award Attained

86 American Association of Community Colleges
Table 3.10Percentage of 1995–1996 Beginning Community CollegeStudents Who Attained Degrees at or Attended 4-Year Colleges,by Degree Expectation and Purpose
Attained Attended, Total attending Degree Expectation and degree Attended, no longer Total 4 years or Enrollment Purpose in 1995–1996 or certificate still enrolled enrolled attended attaining degrees
Degree expectation in community college
None 21.2% 8.2% 5.1% 13.4% 34.5%
Any credential or transfer 38.8% 8.2% 4.0% 12.2% 51.0%
Certificate 42.3% 0.0% 0.0% 0.0% 42.4%
Associate degree 37.8% 7.2% 3.2% 10.4% 48.2%
Transfer to 4-year college 39.2% 13.9% 7.2% 21.1% 60.4%
Enrollment purpose
Job skills 30.1% 3.5% 1.2% 4.7% 34.9%
Degree or certificate 36.0% 7.2% 1.9% 9.1% 45.1%
Transfer to 4-year institution 43.0% 14.0% 6.4% 20.4% 63.4%
Othera 33.5% 8.9% 4.0% 12.8% 46.3%
Source: Hoachlander, Sikora, & Horn (2003, Table 7b)
aIncludes transfer to other community college and transfer for personal enrichment.
Status of 4-Year Students Not Attaining a Degree or Certificate

87National Profile of Community Colleges: Trends & Statistics 4TH EDITION
Figure 3.4Distribution of 1995–1996 Beginning Community CollegeStudents, by Highest Degree Expected: Degree Attainment andPersistence Status as of June 2001
40%
30%
60%
80%
100%
Less
than
a
bach
elor's
degre
e
Bach
elor's
degre
e
Adva
nced
degre
e
Don't
know
All s
tude
nts
Perc
enta
ge o
f st
uden
ts
Highest degree expected in 1995–1996
Source: NCES (2004b)
Persistence Status■ No degree, not enrolled■ Still enrolled■ Associate degree or certificate■ Bachelor’s degree

88 American Association of Community Colleges
Figure 3.5Percentage of 1995–1996 Beginning Community College StudentsWho Transferred to a 4-Year College, by Degree Expectation
20%
10%
30%
40%
50%
60%
Trans
fer t
o a
4-ye
ar co
llege
Asso
ciate
degre
e
Certi
ficate
No deg
ree
All s
tude
nts
Highest degree expected in 1995–1996
Perc
enta
ge o
f st
uden
ts
Source: NCES (2004b)

89National Profile of Community Colleges: Trends & Statistics 4TH EDITION
Table 3.11Percentage of 1995–1996 Beginning Community CollegeStudents Who Transferred to a 4-Year College: DegreeAttainment and Persistence Status as of 2001, by DegreeExpectation
Attained Total Attained Degree Expectation in Transferred to bachelor's Still enrolled in persisted in associate 1995–1996 4-year college degree 4-year college 4-year college degrees
Transfer to a 4-year college 50.8% 44.0% 38.3% 82.3% 18.8%
Associate degree 26.5% 29.1% 49.5% 78.6% 50.6%
Certificate 1.0% — — — —
No degree 21.1% 27.6% 45.2% 72.8% 19.4%
Total 28.9% 34.7% 44.3% 78.9% 33.3%
Source: Hoachlander, Sikora, & Horn (2003, Table 8)
Note. Empty cells indicate too few cases to produce reliable estimates.
Degree Attainment and Persistence Status of Transfer Students as of 2001

90 American Association of Community Colleges
Table 3.12Top 15 Hot Programs at Community Colleges: 2004
% of Average Average # Program programs starting salary of students
1. Registered nursing 19.6% $38,416 170
2. Law enforcement 5.7% $31,865 179
3. Licensed practical nursing 5.1% $27,507 98
4. Radiology 4.6% $35,612 72
5. Computer technologies 3.7% $35,469 778
6. Automotive 3.5% $32,498 162
7. Nursing assistant 3.1% $16,754 140
8. Dental hygiene 2.9% $35,956 59
9. Health information technology 2.6% $26,578 54
10. Construction 2.5% $34,414 223
11. Education 2.4% $30,810 297
12. Business 2.2% $31,366 506
13. Networking 2.1% $35,938 64
14. Electronics 1.7% $32,734 58
15. Medical assistant 1.7% $22,953 121
Source: McPhee (2004)
Note. Hot programs are those in which students, according to reporting colleges, are in highdemand upon graduation. Data pertain to both for-credit and noncredit programs.
Program Statistics
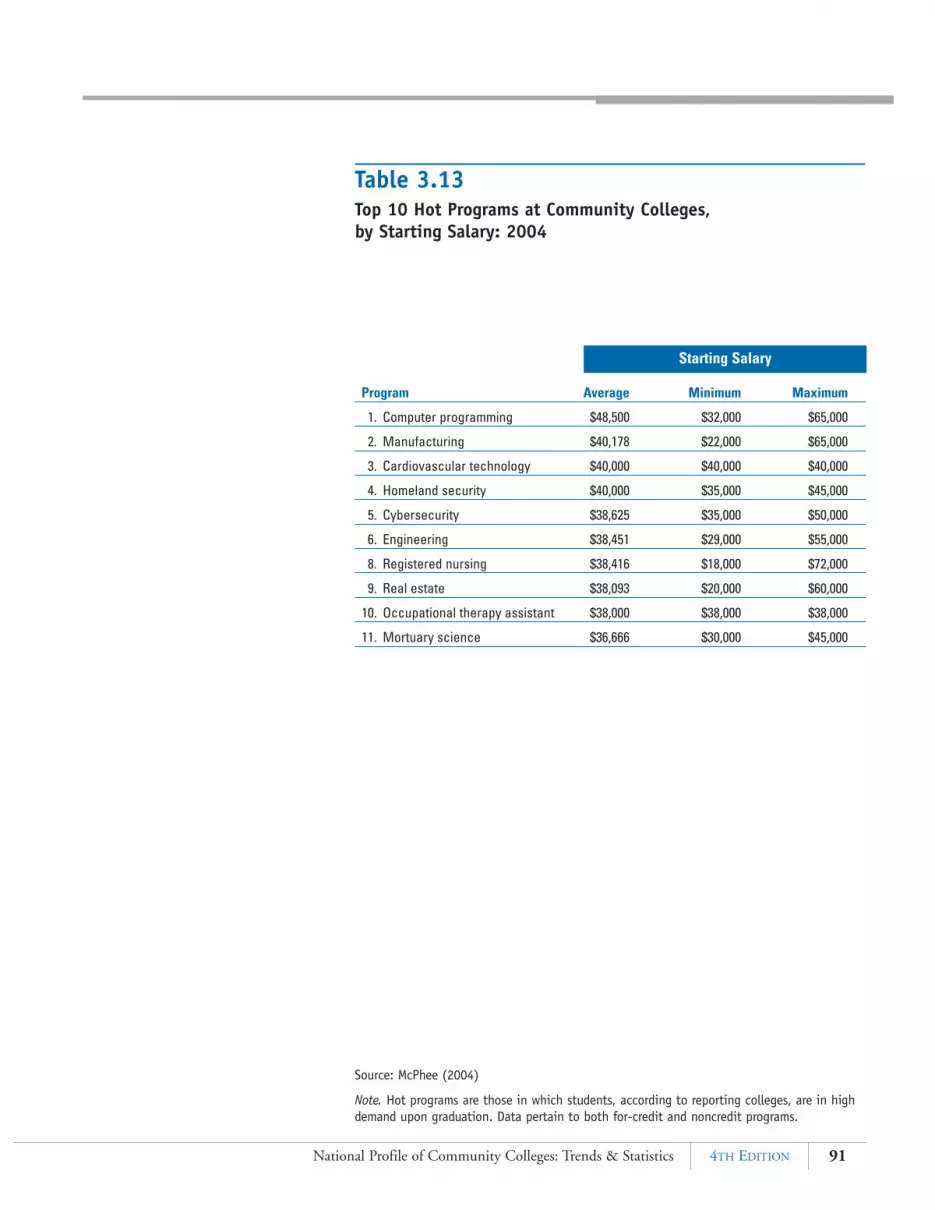
91National Profile of Community Colleges: Trends & Statistics 4TH EDITION
Table 3.13Top 10 Hot Programs at Community Colleges, by Starting Salary: 2004
Program Average Minimum Maximum
1. Computer programming $48,500 $32,000 $65,000
2. Manufacturing $40,178 $22,000 $65,000
3. Cardiovascular technology $40,000 $40,000 $40,000
4. Homeland security $40,000 $35,000 $45,000
5. Cybersecurity $38,625 $35,000 $50,000
6. Engineering $38,451 $29,000 $55,000
8. Registered nursing $38,416 $18,000 $72,000
9. Real estate $38,093 $20,000 $60,000
10. Occupational therapy assistant $38,000 $38,000 $38,000
11. Mortuary science $36,666 $30,000 $45,000
Source: McPhee (2004)
Note. Hot programs are those in which students, according to reporting colleges, are in highdemand upon graduation. Data pertain to both for-credit and noncredit programs.
Starting Salary
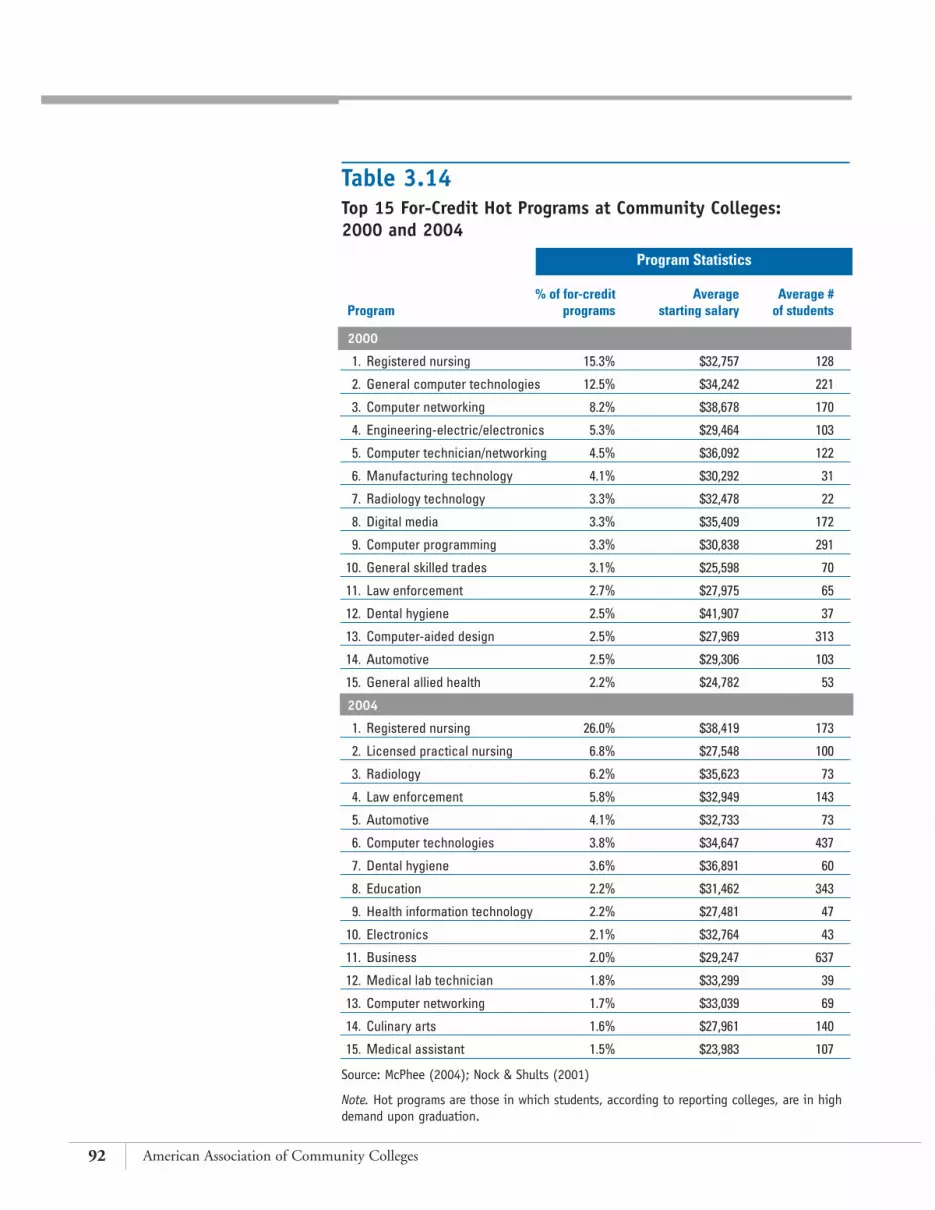
92 American Association of Community Colleges
Table 3.14Top 15 For-Credit Hot Programs at Community Colleges: 2000 and 2004
% of for-credit Average Average # Program programs starting salary of students
2000
1. Registered nursing 15.3% $32,757 128
2. General computer technologies 12.5% $34,242 221
3. Computer networking 8.2% $38,678 170
4. Engineering-electric/electronics 5.3% $29,464 103
5. Computer technician/networking 4.5% $36,092 122
6. Manufacturing technology 4.1% $30,292 31
7. Radiology technology 3.3% $32,478 22
8. Digital media 3.3% $35,409 172
9. Computer programming 3.3% $30,838 291
10. General skilled trades 3.1% $25,598 70
11. Law enforcement 2.7% $27,975 65
12. Dental hygiene 2.5% $41,907 37
13. Computer-aided design 2.5% $27,969 313
14. Automotive 2.5% $29,306 103
15. General allied health 2.2% $24,782 53
2004
1. Registered nursing 26.0% $38,419 173
2. Licensed practical nursing 6.8% $27,548 100
3. Radiology 6.2% $35,623 73
4. Law enforcement 5.8% $32,949 143
5. Automotive 4.1% $32,733 73
6. Computer technologies 3.8% $34,647 437
7. Dental hygiene 3.6% $36,891 60
8. Education 2.2% $31,462 343
9. Health information technology 2.2% $27,481 47
10. Electronics 2.1% $32,764 43
11. Business 2.0% $29,247 637
12. Medical lab technician 1.8% $33,299 39
13. Computer networking 1.7% $33,039 69
14. Culinary arts 1.6% $27,961 140
15. Medical assistant 1.5% $23,983 107
Source: McPhee (2004); Nock & Shults (2001)
Note. Hot programs are those in which students, according to reporting colleges, are in highdemand upon graduation.
Program Statistics

93National Profile of Community Colleges: Trends & Statistics 4TH EDITION
Table 3.15Percentage of Baccalaureate Recipients, by Field of Study andType of College First Attended: 1999–2000
Social/ Computer/behavioral Life Physical information
College Type Humanities sciences sciences sciences Math science
Public 4-year college 45.7% 46.7% 51.3% 53.2% 57.8% 45.7%
Public community college 17.0% 18.7% 18.5% 10.8% 7.7% 29.7%
Public college, less-than-2-year 0.2% 0.3% 0.1% 0.1% 0.0% 0.3%
Private nonprofit 4-year college 34.1% 32.3% 28.6% 35.5% 33.9% 21.5%
Private nonprofit community college 1.2% 0.4% 0.7% 0.3% 0.6% 0.1%
Private nonprofit college, less-than-2-year 0.2% 0.1% 0.0% 0.0% 0.0% 0.2%
Private 4-year college 0.3% 0.0% 0.1% 0.0% 0.0% 1.8%
Private community college 0.7% 0.8% 0.6% 0.0% 0.0% 0.0%
Private college, less-than-2-year 0.7% 0.8% 0.0% 0.0% 0.0% 0.7%
% who ever attended a community college 49.2% 46.7% 45.9% 42.6% 38.1% 60.0%
Other Business/ Vocational/ technical/ Total,
College Type Engineering Education management Health technical professional all fields
Public 4-year college 57.6% 47.9% 50.4% 52.7% 52.4% 55.8% 49.8%
Public community college 18.4% 26.8% 22.0% 21.4% 22.8% 19.2% 20.2%
Public college, less-than-2-year 0.0% 0.0% 0.3% 0.3% 0.0% 0.1% 0.2%
Private nonprofit 4-year college 22.6% 22.6% 23.1% 21.4% 22.1% 22.8% 27.0%
Private nonprofit community college 0.3% 1.2% 0.6% 2.8% 1.2% 0.5% 0.9%
Private nonprofit college, less-than-2-year 0.0% 0.1% 0.2% 0.1% 0.0% 0.0% 0.1%
Private 4-year college 0.6% 0.3% 1.7% 0.3% 0.0% 0.6% 0.6%
Private community college 0.3% 0.5% 1.0% 0.6% 0.2% 0.4% 0.6%
Private college, less-than-2-year 0.2% 0.6% 0.7% 0.4% 1.4% 0.6% 0.6%
% who ever attended a community college 48.3% 58.3% 57.3% 60.1% 59.2% 50.4% 52.3%
Source: NCES (2004a)
Field of Study
Field of Study

94 American Association of Community Colleges
Table 3.16Number of First-Time Candidates Taking the NCLEX-RN Exam andPercentage Passing, by Credential Earned: 2000–2004
January–March April–June July–August September–December Full yearCredential Earned # % passing # % passing # % passing # % passing # % passing
2000
Diploma 640 82.3% 455 84.0% 1,301 85.1% 283 77.0% 2,679 83.4%
Baccalaureate 5,332 85.9% 5,331 86.9% 13,796 83.2% 1,589 72.7% 26,048 83.9%
Associate degree 8,260 83.9% 9,838 86.2% 21,544 84.0% 3,023 74.4% 42,665 83.8%
% with associate degree 58.0% — 63.0% — 58.8% — 61.8% — 59.8% —
2001
Diploma 544 85.3% 337 87.8% 1,163 87.6% 266 79.7% 2,310 86.2%
Baccalaureate 5,065 86.7% 4,841 88.3% 13,327 85.9% 1,599 75.4% 24,832 85.9%
Associate degree 7,991 83.7% 8,950 88.1% 21,401 86.3% 3,225 75.0% 41,567 85.3%
% with associate degree 58.8% — 63.3% — 59.6% — 63.4% — 60.5% —
2002
Diploma 551 85.3% 336 87.2% 1,336 86.8% 201 84.6% 2,424 86.3%
Baccalaureate 4,906 87.6% 4,104 88.6% 15,411 86.7% 1,385 77.7% 25,806 86.7%
Associate degree 7,692 86.3% 8,542 55.5% 23,408 86.9% 2,668 75.8% 42,310 86.7%
% with associate degree 58.5% — 65.8% — 58.3% — 62.7% — 60.0% —
2003
Diploma 591 90.0% 466 93.8% 1,276 89.7% 232 81.9% 2,565 89.8%
Baccalaureate 5,277 87.0% 6,425 90.4% 13,141 86.2% 1,787 79.1% 26,630 86.9%
Associate degree 9,010 87.1% 13,283 90.0% 21,832 86.5% 3,298 77.5% 47,423 87.0%
% with associate degree 60.6% — 65.8% — 60.2% — 62.0% — 61.9% —
Time Period and Pass Rate

95National Profile of Community Colleges: Trends & Statistics 4TH EDITION
January–March April–June July–August September–December Full yearCredential Earned # % passing # % passing # % passing # % passing # % passing
2004
Diploma 836 87.2% 498 91.2% — — — — — —
Baccalaureate 6,637 87.2% 7,438 88.2% — — — — — —
Associate degree 10,854 87.0% 14,804 88.2% — — — — — —
% with associate degree 59.2% — 65.1% — — — — — — —
Totals, 2000–2004
Diploma 3,162 86.0% 2,092 88.9% 5,076 87.2% 982 80.3% 9,978 86.3%
Baccalaureate 27,217 86.9% 28,139 88.5% 55,675 85.5% 6,360 76.2% 103,316 85.8%
Associate degree 43,807 85.7% 55,417 80.9% 88,185 85.9% 12,214 75.7% 173,965 85.7%
% with associate degree 59.1% — 64.7% — 59.2% — 62.5% — 60.6% —
Source: NCSBN (2004a, 2004b, 2004c, 2004d, 2004e)
Note. NCLEX-RN exam: National Council Licensure Examinations for Registered Nursing. Emptycells indicate that data were not available at the time of publication.
aTotals for 2000–2004 exclude 2004 data.
Time Period and Pass Rate

96 American Association of Community Colleges
Table 3.17Teaching Status of 1999–2000 Baccalaureate Recipients, byType of College First Attended: 2001
Private Private % who everPublic Public nonprofit nonprofit Private Private attended a 4-year community 4-year community 4-year community community
Teaching Status college college college college college college college
Sub or aide, not certified, no prep 56.3% 11.9% 30.9% 0.1% 0.0% 0.0% 52.1%
Did not teach/prepare, considered 46.4% 20.4% 29.9% 0.5% 1.1% 0.8% 52.4%
Did not teach, did prepare 47.9% 22.1% 25.1% 1.5% 0.8% 1.9% 53.3%
Taught, not certified, did not prepare 46.5% 19.3% 31.4% 1.1% 0.0% 0.0% 48.0%
Taught, not certified, did prepare 50.9% 22.6% 23.7% 0.8% 0.0% 2.1% 65.5%
Taught, certified 50.7% 22.5% 24.5% 1.2% 0.1% 0.3% 56.9%
Teach full time currently 48.7% 21.9% 27.4% 1.0% 0.1% 0.4% 53.5%
Teach part time currently 54.0% 19.3% 23.1% 1.3% 0.4% 0.5% 57.8%
Employed as a K–12 teacher 49.7% 22.9% 25.6% 0.6% 0.1% 0.5% 56.1%
Taught K–12 50.0% 21.2% 26.4% 1.0% 0.2% 0.4% 54.7%
All 1999–2000 baccalaureate recipients 49.8% 20.2% 27.0% 0.9% 0.6% 0.6% 52.3%
Source: NCES (2004a)
Type of College First Attended

97National Profile of Community Colleges: Trends & Statistics 4TH EDITION
Community colleges areexperiencing a real chang-ing of the guard as the new
century progresses. Presidents areretiring in increasing numbers, asare senior administrators, faculty,and support staff. A survey con-ducted by AACC in 2001 revealedthat 45% of presidents intend toretire by 2007 (Shults, 2001).Presidents responding to the surveyalso noted that at least one fourth oftheir senior administrators and sen-ior faculty would retire by that timeas well.
This situation has both negativeand positive consequences. Theretirement of such large numbers ofdedicated leaders and workers willresult in a significant knowledgedrain as the collective wisdom ofthese people, gained through manyyears of experience, leaves withthem. The knowledge drain may beparticularly serious with regard toall of the support staff who carryout the day-to-day routines thatensure the effective functioning ofcolleges. It is also possible that some
of the vacancies caused by retire-ments will not be filled if budgetconstraints continue, and this mayaffect the capacity of colleges tocarry out some functions. Perhapsthe greatest difficulty arising fromthe retirement exodus may be thelack of potential leaders in thepipeline, because many of the senioradministrators who might have beenexpected to assume higher-levelpositions will choose instead to con-clude their careers and retire.
The departure of so many peo-ple during the next few years, how-ever, also offers an excellent opportu-nity for colleges to discard outdatedpractices, create new work patterns,and introduce organizational struc-tures and models that promotegreater efficiency. Colleges may reas-sign resources and develop new pro-grams and services based on theemerging needs of students andcommunities. Vacancies resultingfrom retirements may be used to hireor promote energetic new leadersand workers with new ideas that willhelp colleges respond to the many
changes occurring in contemporaryhigher education. Finally, collegeswill have the opportunity to employa more diverse faculty and staff thatreflect more closely the growingdiversity of the student body andthe general population.
This diversification is alreadyoccurring. Women now constitutenearly 27% of public and privatecommunity college presidents, upfrom 11% in 1991. Numbers ofpresidents who are minorities havealso increased, from 8.6% in 1986to 19.8% in 2004 (AACC, 2004a).Numbers of women and minoritiesin the administrative and facultyranks are growing as well.
Although community collegesalaries are generally lower thanthose in four-year colleges and haveremained somewhat stagnant duringthe past few years, partly because ofbudget restraints, they are stillattractive to many educators. In2004, salaries for presidents of com-munity college systems and districtsaveraged $182,294, whereas salariesfor presidents of single-campus col-
Community College Staffand Services
IV

98 American Association of Community Colleges
leges averaged $126,504. Benefitssuch as housing, automobiles, andretirement plans made compensa-tion packages even more valuable.Compensation for about 7% ofpresidents was provided by collegefoundations, which contributed anaverage of $14,251 to the basesalary (Blount & Associates &Lindley, 2005). The chief academicofficer in a community collegeearned an average of $94,490 in2003–2004, and the chief businessofficer averaged $88,170. The aver-age earnings of a chief studentaffairs officer were $82,460,depending on the size of the college.
Faculty salaries in communitycolleges continue to be lower thanthose at four-year colleges, but theyare catching up. Although not allcommunity colleges have faculty rankand tenure structures, in 2003 thosethat did reported the average salaryfor a full-time community collegeprofessor as $65,600, as compared to$69,600 for the same rank at a bac-calaureate-granting college.Interestingly, instructors at commu-nity colleges averaged $38,000 versus$36,200 for those in four-year col-leges. Faculty salaries overall show abroad range, with the highest and thelowest figures occurring in the samestate ($92,000 average for a full pro-fessor in a New York City college ver-sus $27,000 average for an instructorin rural upstate New York).
Gender differentials in salaryremain a problem: Male professorsat community colleges average$66,030, compared to $62,357 forfemale professors (AmericanAssociation of University Professors,2004). The gap is somewhat smallerfor instructors, with men earning$39,499 on average and womenearning $38,691. The wave of retirements has helped communitycolleges to some extent during aperiod of fiscal restraints becausenew hires tend to enter at lowerranks and salaries. However, salarycompression has been problematicwhen pay rates for entry levels are increased to address marketrates, and these new hires earnalmost as much as associate profes-sors who have been at a college for several years. Faculty salaries, like those of presidents and adminis-trators, vary considerably based on the region of the country and the rural or urban location of thecollege.
Community colleges rely on amix of full- and part-time facultyin order to offer students the
broadest array of courses, with morethan two thirds of instructional staff on part-time assignments. Itis important to note that, although
part-time instructors may outnum-ber full-time faculty at many colleges, the majority of class sec-tions are still taught by full-timers.
The adjunct instructors generallyteach one or two courses per semes-ter and earn between $2,000 and$3,000 per course. Some teach part time by choice while raisingchildren or holding another full-time job, and some accept part-timepositions in the hope of eventuallybecoming full-time faculty. In many cases, adjunct instructorsteach at more than one college during the same semester.
Students benefit from the use of part-time faculty in several ways.Many of the adjunct instructorshave business and industry experi-ence that adds a real-life element totheir teaching and may provide stu-dents with valuable contacts andinternships. Talented and dedicatedadjunct instructors can also be a realasset when they bring highly special-ized skills in rapidly growing fieldssuch as some specialized alliedhealth and emerging technologiesfields for which full-time facultymight be very difficult to recruit.And, despite their many time com-mitments, adjuncts often makethemselves available outside of class,just as full-time faculty do, to workwith students and support theirlearning. Colleges are able to offer a greater selection of courses andsections while keeping overallinstructional costs low by usinghighly qualified, temporary, non-salaried instructors.

99National Profile of Community Colleges: Trends & Statistics 4TH EDITION
However, concerns have beenraised regarding the growing use of“perma-temps,” as the New YorkTimes called adjunct instructors(Berger, 2002). Adjunct instructorsin community colleges assert thattheir jobs are made more difficultbecause they are frequently hired atthe last minute, are usually requiredto use syllabi and textbooks withwhich they are unfamiliar, have littleor no office space for class prepara-tion and meetings with students, andlack secretarial support and technolo-gy. For most adjunct instructors thereis little time or incentive to beinvolved in department meetings,curriculum discussions, studentadvising, and other work that isexpected of full-time faculty. Inresponse, many community collegeshave instituted mentoring projects,buddy systems, orientations, profes-sional development sessions, andother services for adjunct instructors.
Because human resources aretheir greatest assets, community col-leges are devoting greater attentionto professional development for allfaculty, administrators, and staff.Even in times of restricted finances,many colleges try to provide variousmeans for their employees to growprofessionally, including tuitionreimbursement for advanced studies,attendance at conferences, sabbati-cals, and mini-grants for specialprojects. The concern about
impending retirements has led manycolleges to establish leadership train-ing programs such as the LeadershipInstitute at the College of LakeCounty (CLC) in Illinois. At CLC,faculty, administrators, and supportstaff come together in a two-dayretreat to learn about the Illinoiscommunity college system and thenational picture. Personal leadershipskills development is also included,and participants prepare a profession-al development plan to extend theirgrowth activities over time. Anotherprofessional development opportuni-ty, the Department Chairs Institute,was initiated in 2003 by the NorthCarolina State University Departmentof Adult and Community CollegeEducation in cooperation with theNorth Carolina CommunityCollege System.
Nationally there are also excel-lent leadership programs and profes-sional development opportunities.AACC offers the annual PresidentsAcademy for new and experiencedCEOs and established the FutureLeaders Institute for aspiring execu-tive administrators in 2003. A num-ber of the affiliated councils ofAACC offer leadership training pro-grams as well. These include theNational Institute for LeadershipDevelopment (NILD) for aspiringwomen leaders in community col-leges; the National CommunityCollege Hispanic Council
Leadership Fellows Program,designed to prepare Latinos andLatinas for the presidency; and theNational Council on BlackAmerican Affairs LeadershipDevelopment Institute for AfricanAmerican Midlevel Administrators.Other councils offer targeted train-ing such as the Summer Institute onMarketing and Public Relationssponsored by the National Councilfor Marketing and Public Relationsand the Presidents’ FundraisingWorkshop sponsored by the Councilfor Resource Development.
Perhaps the most significantchange in community college pro-grams and services over the past fewyears has been the learning collegemovement, which was triggered byRobert Barr and John Tagg in 1995and further developed by TerryO’Banion, president emeritus of theLeague for Innovation in theCommunity College. With the1997 publication of A LearningCollege for the 21st Century,O’Banion challenged colleges tofocus on students’ learning, providelearning opportunities through mul-tiple delivery modes and time-frames, reenvision faculty facilitatorsof learning, and gather data to provethat learning has truly occurred.Also, all members of the collegecommunity were to be viewed aslearners themselves, as well as con-tributors to students’ learning. The

100 American Association of Community Colleges
principles O’Banion proposed werenot entirely new, but in combina-tion and with a clear emphasis onstudents’ learning, the learning col-lege idea constituted a paradigmshift in education.
The capacity of community col-leges to respond strategically toemerging learning needs is furtherillustrated by their emphasis inother program areas including serv-ice learning, welfare-to-work initia-tives, and teacher training. Servicelearning is an approach to educationthat combines formal study withpractical experience as a volunteer.Students who enroll in a servicelearning program generally take oneor more for-credit courses in whichthey study the concepts of service,civic responsibility, and volun-teerism; engage in a supervised serv-ice activity in the local community;and reflect on their experiences.Such programs allow students toearn credits toward a degree, gainvaluable work experience, and exam-ine their roles in resolving societalproblems while also benefiting theagencies and communities for whichthey volunteer.
More than ever, community col-leges are seen as the engines ofworkforce preparation and econom-ic growth. In addition to preparingthe general population for workthrough for-credit and noncreditcourses, their welfare-to-work pro-
grams continue to help poor andundereducated people gain job skillsso that they can exit the public assis-tance system and become productivemembers of society. For example,the Work and Learn Center atMonroe Community College inRochester, New York, offers a varietyof training options and services tomore than 3,000 clients each year.The California CommunityColleges Chancellor’s Office andseveral other sponsors spearheadedanother such program, BuildingIndividual and Community Self-Sufficiency Through Service.California welfare recipients enrollin AmeriCorps, take early childhoodcourses, and gain work experience inchild-care centers, some of whichare on community college campuses.
One of the newest programmat-ic efforts in community collegesaddresses the nation’s critical short-age of teachers. Community collegeshave traditionally offered courses inareas such as elementary educationand early childhood education, withthe expectation that students willtransfer into baccalaureate-levelteacher training programs.Additional formal articulationarrangements have been establishedrecently, including the Marylandinitiative to offer the associate ofarts in teaching at all 19 of its com-munity colleges, with guaranteedadmission to a state university
teacher training baccalaureate pro-gram upon completion of the two-year degree. Other states have com-mon course-numbering systems orcommon general education corecurricula that accelerate teachertraining, and some two-year col-leges, such as Miami Dade College,have established separate schools ofeducation that can now offer bache-lor’s degrees.
There is no doubt that commu-nity colleges make a major differ-ence in their local areas by providinghigh-quality instruction throughdegree programs and certificates,for-credit courses, and noncreditofferings. Moreover, the impact ofthese colleges extends far beyondtheir academic programs when theirmany community services are takeninto account. According to TheKnowledge Net: ConnectingCommunities, Learners, and Colleges,“Community colleges must serve allsegments of the community. Thisincludes the civic sector, theemployer community, and the edu-cation sector” (AACC/ACCT,2000). In addition to the workforcetraining and service learning pro-grams mentioned earlier, faculty andstaff are regularly involved withmany other outreach efforts thatbenefit local residents. Many col-leges are also creating new servicesthat help the growing Hispanic pop-ulation in their target areas adapt to
101National Profile of Community Colleges: Trends & Statistics 4TH EDITION
American society. The CentroCommunitario at BrunswickCommunity College in NorthCarolina is an excellent example of apartnership with the local commu-nity and the Mexican government.
Community colleges are fullyengaged with local school districts aswell. Many offer tech programs withnearby high schools under the CarlD. Perkins Vocational and TechnicalEducation Act, as well as dual-enrollment programs in which highschool students can get a head starton their college studies. Still othercolleges have established partnershipprograms in specialized career fields,such as the online bridge programin nursing at Olive-Harvey Collegein Chicago and the Valdez MathInstitute for high schoolers at SanJoaquin Delta College.
Middle schools are receivingmore attention as well, because col-leges recognize that families and stu-dents need to begin planning forhigher education at the earliest pos-sible moment. Funded by federaldollars, GEAR UP (Gaining EarlyAwareness and Readiness forUndergraduate Programs) has beenimplemented on numerous campus-es to help low-income youth preparefor eventual college studies. Math and science and career-focused programs are directed tothis age level in colleges across thecountry, in the hope that as middleschool students become comfortablewith the college environment theywill see a college degree as a goalworth achieving.
As has always been the case,community college programs and
services to their communities offerfar more than courses and degrees.These colleges, and all those whowork in them, are dedicated to thewell-being of their local areas. Tothat end, members of the surround-ing communities can take advantageof day-care centers, career counsel-ing, cultural and sports events, eth-nic festivals, political debates, drugeducation, parenting classes, seniorcitizens programs, and theater andmusic troupes, among a host ofservices. And most campus facilitiescan be used by the college’s friendsand neighbors. Through the dedica-tion of their faculty and staffs andtheir programs and services, com-munity colleges make vital contribu-tions to the intellectual and eco-nomic capital and the overall qualityof life in their communities. D

102 American Association of Community Colleges
Table 4.1Occupations of Community College Employees, by EmploymentStatus and Gender: 2001
Occupation Full time Part time % full time Men Women % men Total
Public colleges
Professional staff
Faculty 109,183 219,331 33.2% 167,535 160,979 49.0% 328,514
Executive/administrative/managerial 21,470 1,208 95.9% 11,344 11,052 49.3% 22,396
Instruction/research assistant 0 926 0.0% 548 660 54.6% 1,208
Other administrative 5,381 793 87.2% 2,437 3,737 60.5% 6,174
Other professional (support services) 33,507 12,104 73.5% 16,705 28,906 63.4% 45,611
Total 169,541 234,362 42.0% 198,569 205,334 50.8% 403,903
Nonprofessional staff
Technical and paraprofessional 27,773 16,149 63.2% 16,948 26,974 61.4% 43,922
Clerical and secretarial 53,350 31,208 63.1% 12,038 72,520 85.8% 84,558
Skilled crafts 5,391 1,353 79.9% 5,682 1,062 15.7% 6,744
Service/maintenance 24,283 8,418 74.3% 23,205 9,496 29.0% 32,701
Total 110,797 57,128 66.0% 57,873 110,052 65.5% 167,925
Total public college staff 280,338 291,490 49.0% 256,442 315,386 55.2% 571,828
Independent colleges
Professional staff
Faculty 2,777 2,928 48.7% 2,836 2,869 50.3% 5,705
Executive/administrative/managerial 1,082 26 91.6% 537 644 54.5% 1,181
Instruction/research assistant 0 99 0.0% 7 19 73.1% 26
Other administrative 808 175 82.2% 357 626 63.7% 983
Other professional (support services) 1,342 249 84.3% 549 1,042 65.5% 1,591
Total 6,009 3,477 63.3% 4,286 5,200 54.8% 9,486
Nonprofessional staff
Technical and paraprofessional 484 288 62.7% 202 570 73.8% 772
Clerical and secretarial 1,159 12 99.0% 131 1,040 88.8% 1,171
Skilled crafts 57 182 23.8% 156 83 34.7% 239
Service/maintenance 568 3,959 12.5% 2,131 2,396 52.9% 4,527
Total 2,268 4,441 33.8% 2,620 4,089 60.9% 6,709
Total independent college staff 8,277 12,236 40.4% 8,475 12,038 58.7% 20,513
GenderEmployment Status

103National Profile of Community Colleges: Trends & Statistics 4TH EDITION
Occupation Full time Part time % full time Men Women % men Total
All community colleges
Professional staff
Faculty 111,960 222,259 33.5% 170,371 163,848 49.0% 334,219
Executive/administrative/managerial 22,552 1,234 95.7% 11,881 11,696 49.6% 23,577
Instruction/research assistant 0 1,025 0.0% 555 679 55.0% 1,234
Other administrative 6,189 968 86.5% 2,794 4,363 61.0% 7,157
Other professional (support services) 34,849 12,353 73.8% 17,254 29,948 63.4% 47,202
Total 175,550 237,839 42.5% 202,855 210,534 50.9% 413,389
Nonprofessional staff
Technical and paraprofessional 28,257 16,437 63.2% 17,150 27,544 61.6% 44,694
Clerical and secretarial 54,509 31,220 63.6% 12,169 73,560 85.8% 85,729
Skilled crafts 5,448 1,535 78.0% 5,838 1,145 16.4% 6,983
Service/maintenance 24,851 12,377 66.8% 25,336 11,892 31.9% 37,228
Total 113,065 61,569 64.7% 60,493 114,141 65.4% 174,634
Total community college staff 288,615 303,726 48.7% 264,917 327,424 55.3% 592,341
GenderEmployment Status
Source: NCES (2004f)

104 American Association of Community Colleges
Table 4.2Full-Time Employees at Public Community Colleges, by FacultyStatus and Occupation: Fall 2001
Total Nontenured, on Not on No full-time
Occupation Tenured tenure track tenure track faculty status employees
Instruction combined with research/public service 27,992 12,496 141,148 12,104 193,740
Primarily instruction 1,771 449 8,173 186 10,579
Primarily research 4 0 9 27 40
Primarily public service (e.g., extension) 51 0 1,073 1,565 2,689
Executive/administrative 263 47 1,121 13,091 14,522
Other administrative 63 4 521 3,518 4,106
Other professional (e.g., library) 222 181 2,522 20,558 23,483
Technical/paraprofessional 0 0 0 27,160 27,160
Clerical and secretarial 0 0 0 49,596 49,596
Skilled crafts 0 0 0 3,871 3,871
Service/maintenance 0 0 0 19,757 19,757
Total 30,366 13,177 154,567 151,433 349,543
Source: NCES (2004d)
Faculty Status

105National Profile of Community Colleges: Trends & Statistics 4TH EDITION
New Hires
Table 4.3New Hires in Public Community Colleges, by Occupation andGender: 2001
Total % newOccupation Men Women % men Total staff hires
Professional staff
Faculty 3,938 4,357 47.5% 8,295 109,183 7.6%
Executive/administrative/managerial 565 582 49.3% 1,147 21,470 5.3%
Other administrative 154 182 45.8% 336 5,381 6.2%
Other professional (support services) 892 1,617 35.6% 2,509 33,507 7.5%
Total professional staff 5,549 6,738 45.2% 12,287 169,541 7.2%
Nonprofessional staff
Technical and paraprofessional 901 1,205 42.8% 2,106 27,773 7.6%
Clerical and secretarial 435 3,343 11.5% 3,778 53,350 7.1%
Skilled crafts 185 44 80.8% 229 5,391 4.2%
Service/maintenance 1,109 435 71.8% 1,544 24,283 6.4%
Total nonprofessional staff 2,630 5,027 34.3% 7,657 110,797 6.9%
Total new hires 8,179 11,765 41.0% 19,944 280,338 7.1%
Source: NCES (2004f)
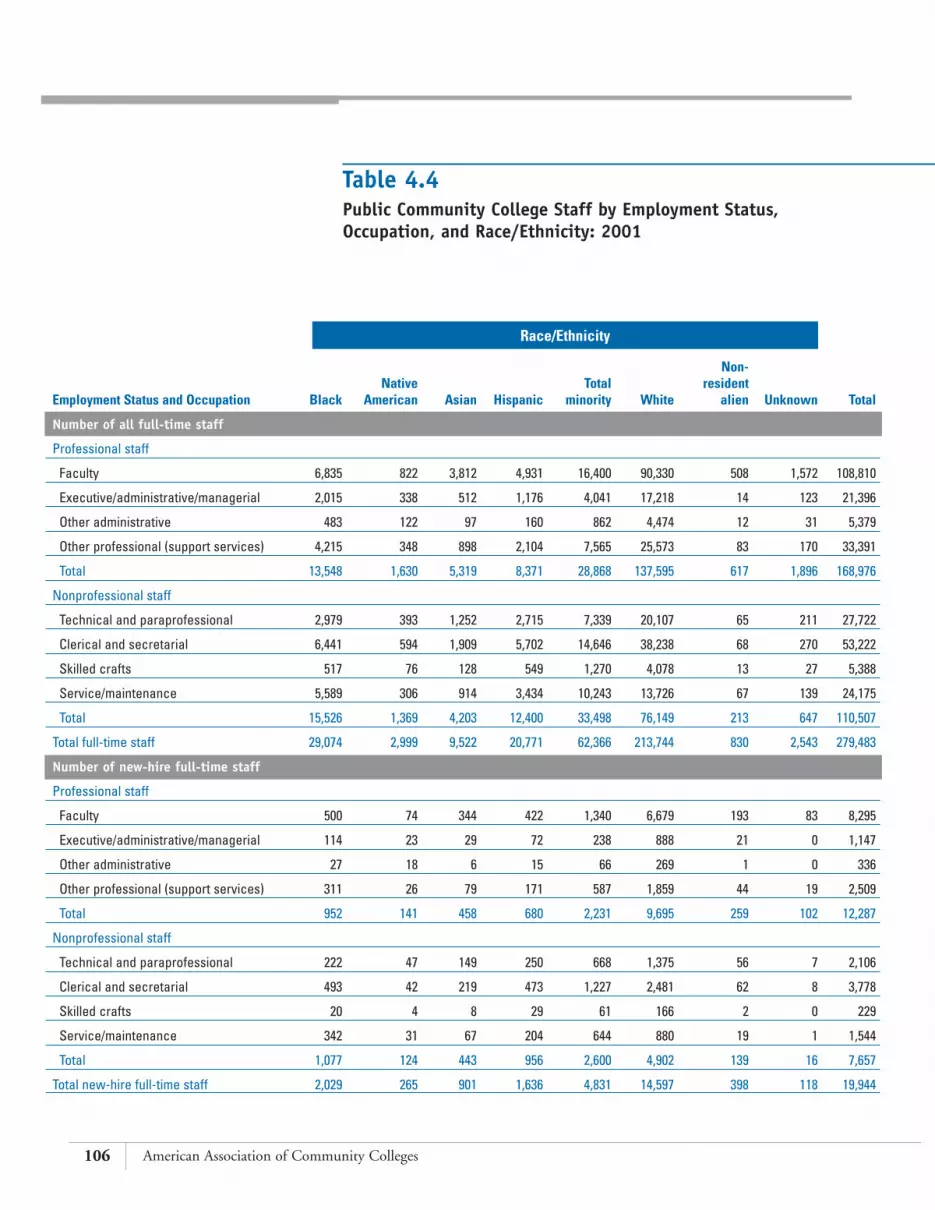
106 American Association of Community Colleges
Table 4.4Public Community College Staff by Employment Status,Occupation, and Race/Ethnicity: 2001
Non-Native Total resident
Employment Status and Occupation Black American Asian Hispanic minority White alien Unknown Total
Number of all full-time staff
Professional staff
Faculty 6,835 822 3,812 4,931 16,400 90,330 508 1,572 108,810
Executive/administrative/managerial 2,015 338 512 1,176 4,041 17,218 14 123 21,396
Other administrative 483 122 97 160 862 4,474 12 31 5,379
Other professional (support services) 4,215 348 898 2,104 7,565 25,573 83 170 33,391
Total 13,548 1,630 5,319 8,371 28,868 137,595 617 1,896 168,976
Nonprofessional staff
Technical and paraprofessional 2,979 393 1,252 2,715 7,339 20,107 65 211 27,722
Clerical and secretarial 6,441 594 1,909 5,702 14,646 38,238 68 270 53,222
Skilled crafts 517 76 128 549 1,270 4,078 13 27 5,388
Service/maintenance 5,589 306 914 3,434 10,243 13,726 67 139 24,175
Total 15,526 1,369 4,203 12,400 33,498 76,149 213 647 110,507
Total full-time staff 29,074 2,999 9,522 20,771 62,366 213,744 830 2,543 279,483
Number of new-hire full-time staff
Professional staff
Faculty 500 74 344 422 1,340 6,679 193 83 8,295
Executive/administrative/managerial 114 23 29 72 238 888 21 0 1,147
Other administrative 27 18 6 15 66 269 1 0 336
Other professional (support services) 311 26 79 171 587 1,859 44 19 2,509
Total 952 141 458 680 2,231 9,695 259 102 12,287
Nonprofessional staff
Technical and paraprofessional 222 47 149 250 668 1,375 56 7 2,106
Clerical and secretarial 493 42 219 473 1,227 2,481 62 8 3,778
Skilled crafts 20 4 8 29 61 166 2 0 229
Service/maintenance 342 31 67 204 644 880 19 1 1,544
Total 1,077 124 443 956 2,600 4,902 139 16 7,657
Total new-hire full-time staff 2,029 265 901 1,636 4,831 14,597 398 118 19,944
Race/Ethnicity

107National Profile of Community Colleges: Trends & Statistics 4TH EDITION
Non-Native Total resident
Employee Status and Occupation Black American Asian Hispanic minority White alien Unknown Total
Number of part-time staff
Professional staff
Faculty 14,888 1,329 5,869 10,123 32,209 167,991 1,330 17,368 218,898
Executive/administrative/managerial 133 47 19 49 248 608 11 108 975
Other administrative 100 11 17 55 183 665 3 17 868
Other professional (support services) 53 2 8 16 79 624 1 89 793
Total 15,174 1,389 5,913 10,243 32,719 169,888 1,345 17,582 221,534
Nonprofessional staff
Technical and paraprofessional 1,398 53 219 872 2,542 8,814 139 595 12,090
Clerical and secretarial 1,927 142 867 1,362 4,298 10,636 215 998 16,147
Skilled crafts 4,791 266 1,114 3,692 9,863 19,606 594 1,009 31,072
Service/maintenance 136 7 77 72 292 1,014 4 43 1,353
Total 8,252 468 2,277 5,998 16,995 40,070 952 2,645 60,662
Total part-time staff 23,426 1,857 8,190 16,241 49,714 209,958 2,297 20,227 282,196
Percentage of full-time staff
Professional staff
Faculty 6.3% 0.8% 3.5% 4.5% 15.1% 83.0% 0.5% 1.4% 100.0%
Executive/administrative/managerial 9.4% 1.6% 2.4% 5.5% 18.9% 80.5% 0.1% 0.6% 100.0%
Other administrative 9.0% 2.3% 1.8% 3.0% 16.0% 83.2% 0.2% 0.6% 100.0%
Other professional (support services) 12.6% 1.0% 2.7% 6.3% 22.7% 76.6% 0.2% 0.5% 100.0%
Total 8.0% 1.0% 3.1% 5.0% 17.1% 81.4% 0.4% 1.1% 100.0%
Nonprofessional staff
Technical and paraprofessional 10.7% 1.4% 4.5% 9.8% 26.5% 72.5% 0.2% 0.8% 100.0%
Clerical and secretarial 12.1% 1.1% 3.6% 10.7% 27.5% 71.8% 0.1% 0.5% 100.0%
Skilled crafts 9.6% 1.4% 2.4% 10.2% 23.6% 75.7% 0.2% 0.5% 100.0%
Service/maintenance 23.1% 1.3% 3.8% 14.2% 42.4% 56.8% 0.3% 0.6% 100.0%
Total 14.0% 1.2% 3.8% 11.2% 30.3% 68.9% 0.2% 0.6% 100.0%
Total % of full-time staff 10.4% 1.1% 3.4% 7.4% 22.3% 76.5% 0.3% 0.9% 100.0%
Race/Ethnicity

108 American Association of Community Colleges
Source: NCES (2004f)
Table 4.4 (cont’d)Public Community College Staff by Employment Status,Occupation, and Race/Ethnicity: 2001
Non-Native Total resident
Employee Status and Occupation Black American Asian Hispanic minority White alien Unknown Total
Percentage of new-hire full-time staff
Professional staff
Faculty 6.0% 0.9% 4.1% 5.1% 16.2% 80.5% 2.3% 1.0% 100.0%
Executive/administrative/managerial 9.9% 2.0% 2.5% 6.3% 20.7% 77.4% 1.8% 0.0% 100.0%
Other administrative 8.0% 5.4% 1.8% 4.5% 19.6% 80.1% 0.3% 0.0% 100.0%
Other professional (support services) 12.4% 1.0% 3.1% 6.8% 23.4% 74.1% 1.8% 0.8% 100.0%
Total 7.7% 1.1% 3.7% 5.5% 18.2% 78.9% 2.1% 0.8% 100.0%
Nonprofessional staff
Technical and paraprofessional 10.5% 2.2% 7.1% 11.9% 31.7% 65.3% 2.7% 0.3% 100.0%
Clerical and secretarial 13.0% 1.1% 5.8% 12.5% 32.5% 65.7% 1.6% 0.2% 100.0%
Skilled crafts 8.7% 1.7% 3.5% 12.7% 26.6% 72.5% 0.9% 0.0% 100.0%
Service/maintenance 22.2% 2.0% 4.3% 13.2% 41.7% 57.0% 1.2% 0.1% 100.0%
Total 14.1% 1.6% 5.8% 12.5% 34.0% 64.0% 1.8% 0.2% 100.0%
Total % of new-hire full-time staff 10.2% 1.3% 4.5% 8.2% 24.2% 73.2% 2.0% 0.6% 100.0%
Percentage of part-time staff
Professional staff
Faculty 6.8% 0.6% 2.7% 4.6% 14.7% 76.7% 0.6% 7.9% 100.0%
Executive/administrative/managerial 13.6% 4.8% 1.9% 5.0% 25.4% 62.4% 1.1% 11.1% 100.0%
Other administrative 11.5% 1.3% 2.0% 6.3% 21.1% 76.6% 0.3% 2.0% 100.0%
Other professional (support services) 6.7% 0.3% 1.0% 2.0% 10.0% 78.7% 0.1% 11.2% 100.0%
Total 6.8% 0.6% 2.7% 4.6% 14.8% 76.7% 0.6% 7.9% 100.0%
Nonprofessional staff
Technical and paraprofessional 11.6% 0.4% 1.8% 7.2% 21.0% 72.9% 1.1% 4.9% 100.0%
Clerical and secretarial 11.9% 0.9% 5.4% 8.4% 26.6% 65.9% 1.3% 6.2% 100.0%
Skilled crafts 15.4% 0.9% 3.6% 11.9% 31.7% 63.1% 1.9% 3.2% 100.0%
Service/maintenance 10.1% 0.5% 5.7% 5.3% 21.6% 74.9% 0.3% 3.2% 100.0%
Total 13.6% 0.8% 3.8% 9.9% 28.0% 66.1% 1.6% 4.4% 100.0%
Total % of part-time staff 8.3% 0.7% 2.9% 5.8% 17.6% 74.4% 0.8% 7.2% 100.0%
Race/Ethnicity

109National Profile of Community Colleges: Trends & Statistics 4TH EDITION
Figure 4.1Full-Time Executive/Administrative/Managerial Staff at PublicCommunity Colleges, by Race/Ethnicity: 2002
Source: NCES (2004f)
Black9%
White, non-Hispanic81%
Unknown/nonresident alien1%
Asian/Pacific Islander2%
Native American2%
Hispanic5%

110 American Association of Community Colleges
Table 4.5New Full-Time Hires in Public Colleges, by Occupation andRace/Ethnicity: 2001
Asian/ Race/ Non-Native Pacific Minority ethnicity resident
Occupation Black American Islander Hispanic subtotal White unknown unknown Total
Community colleges
Professional staff
Faculty 500 74 344 422 1,340 6,679 193 83 8,295
Executive/administrative/managerial 114 23 29 72 238 888 21 0 1,147
Other administrative 27 18 6 15 66 269 1 0 336
Other professional (support services) 311 26 79 171 587 1,859 44 19 2,509
Total 952 141 458 680 2,231 9,695 259 102 12,287
Nonprofessional staff
Technical and paraprofessional 222 47 149 250 668 1,375 56 7 2,106
Clerical and secretarial 493 42 219 473 1,227 2,481 62 8 3,778
Skilled crafts 20 4 8 29 61 166 2 0 229
Service/maintenance 342 31 67 204 644 880 19 1 1,544
Total 1,077 124 443 956 2,600 4,902 139 16 7,657
Total community college staff 2,029 265 901 1,636 4,831 14,597 398 118 19,944
Distribution
Professional staff
Faculty 6.0% 0.9% 4.1% 5.1% 16.2% 80.5% 2.3% 1.0% 100.0%
Executive/administrative/managerial 9.9% 2.0% 2.5% 6.3% 20.7% 77.4% 1.8% 0.0% 100.0%
Other administrative 8.0% 5.4% 1.8% 4.5% 19.6% 80.1% 0.3% 0.0% 100.0%
Other professional (support services) 12.4% 1.0% 3.1% 6.8% 23.4% 74.1% 1.8% 0.8% 100.0%
Total 7.7% 1.1% 3.7% 5.5% 18.2% 78.9% 2.1% 0.8% 100.0%
Nonprofessional staff
Technical and paraprofessional 10.5% 2.2% 7.1% 11.9% 31.7% 65.3% 2.7% 0.3% 100.0%
Clerical and secretarial 13.0% 1.1% 5.8% 12.5% 32.5% 65.7% 1.6% 0.2% 100.0%
Skilled crafts 8.7% 1.7% 3.5% 12.7% 26.6% 72.5% 0.9% 0.0% 100.0%
Service/maintenance 22.2% 2.0% 4.3% 13.2% 41.7% 57.0% 1.2% 0.1% 100.0%
Total 14.1% 1.6% 5.8% 12.5% 34.0% 64.0% 1.8% 0.2% 100.0%
Total community college staff 10.2% 1.3% 4.5% 8.2% 24.2% 73.2% 2.0% 0.6% 100.0%
Race/Ethnicity

111National Profile of Community Colleges: Trends & Statistics 4TH EDITION
Source: NCES (2004f)
Asian/ Race/ Non-Native Pacific Minority ethnicity resident
Occupation Black American Islander Hispanic subtotal White unknown unknown Total
4-year colleges
Professional staff
Faculty 1,569 140 2,108 1,089 4,906 18,236 853 2,644 26,639
Executive/administrative/managerial 387 17 81 89 574 2,140 76 28 2,818
Other administrative 120 10 28 33 191 535 22 23 771
Other professional (support services) 1,948 125 1,515 918 4,506 14,312 558 1,407 20,783
Total 4,024 292 3,732 2,129 10,177 35,223 1,509 4,102 51,011
Nonprofessional staff
Technical and paraprofessional 799 65 402 435 1,701 3,956 132 187 5,976
Clerical and secretarial 1,896 95 508 1,028 3,527 6,894 264 65 10,750
Skilled crafts 145 13 25 100 283 963 25 2 1,273
Service/maintenance 2,148 48 173 751 3,120 3,015 137 73 6,345
Total 4,988 221 1,108 2,314 8,631 14,828 558 327 24,344
Total 4-year college staff 9,012 513 4,840 4,443 18,808 50,051 2,067 4,429 75,355
Distribution
Professional staff
Faculty 5.9% 0.5% 7.9% 4.1% 18.4% 68.5% 3.2% 9.9% 100.0%
Executive/administrative/managerial 13.7% 0.6% 2.9% 3.2% 20.4% 75.9% 2.7% 1.0% 100.0%
Other administrative 15.6% 1.3% 3.6% 4.3% 24.8% 69.4% 2.9% 3.0% 100.0%
Other professional (support services) 9.4% 0.6% 7.3% 4.4% 21.7% 68.9% 2.7% 6.8% 100.0%
Total 7.9% 0.6% 7.3% 4.2% 20.0% 69.0% 3.0% 8.0% 100.0%
Nonprofessional staff
Technical and paraprofessional 13.4% 1.1% 6.7% 7.3% 28.5% 66.2% 2.2% 3.1% 100.0%
Clerical and secretarial 17.6% 0.9% 4.7% 9.6% 32.8% 64.1% 2.5% 0.6% 100.0%
Skilled crafts 11.4% 1.0% 2.0% 7.9% 22.2% 75.6% 2.0% 0.2% 100.0%
Service/maintenance 33.9% 0.8% 2.7% 11.8% 49.2% 47.5% 2.2% 1.2% 100.0%
Total 20.5% 0.9% 4.6% 9.5% 35.5% 60.9% 2.3% 1.3% 100.0%
Total 4-year college staff 12.0% 0.7% 6.4% 5.9% 25.0% 66.4% 2.7% 5.9% 100.0%
Race/Ethnicity

112 American Association of Community Colleges
Figure 4.2New Hires of Full-Time Executive/Administrative/ManagerialStaff at Public Community Colleges, by Race/Ethnicity: 2002
Black10%
White, non-Hispanic77%
Unknown/nonresident alien2%
Asian/Pacific Islander3%
Native American2%
Hispanic6%
Source: NCES (2004f)

113National Profile of Community Colleges: Trends & Statistics 4TH EDITION
Source: AACC (2004a); Blount & Associates & Lindley (2005)
Table 4.6Characteristics of Community College CEOs: 2004
Race/ethnicity
Black 8.5%
Native American 2.8%
Asian/Pacific Islander 1.5%
Hispanic 6.5%
Other 0.5%
Minority subtotal 19.8%
White 80.1%
Gender
Men 73.5%
Women 26.5%
Age
under 40 0.5%
40–44 2.5%
45–49 6.8%
50–54 21.5%
55–59 36.9%
60–64 25.2%
65 or older 6.6%
Tenure as a CEO
0–2.5 years 25.7%
2.6–4 years 21.0%
5–9 years 27.5%
10–14 years 13.9%
15–19 years 6.3%
20–24 years 2.7%
25–29 years 1.6%
30 or more years 1.1%
Highest level of education
Doctorate (PhD, EdD, etc.) 85.0%
JD 2.0%
Master's 11.0%
Other 1.0%
% of All CEOsCharacteristics
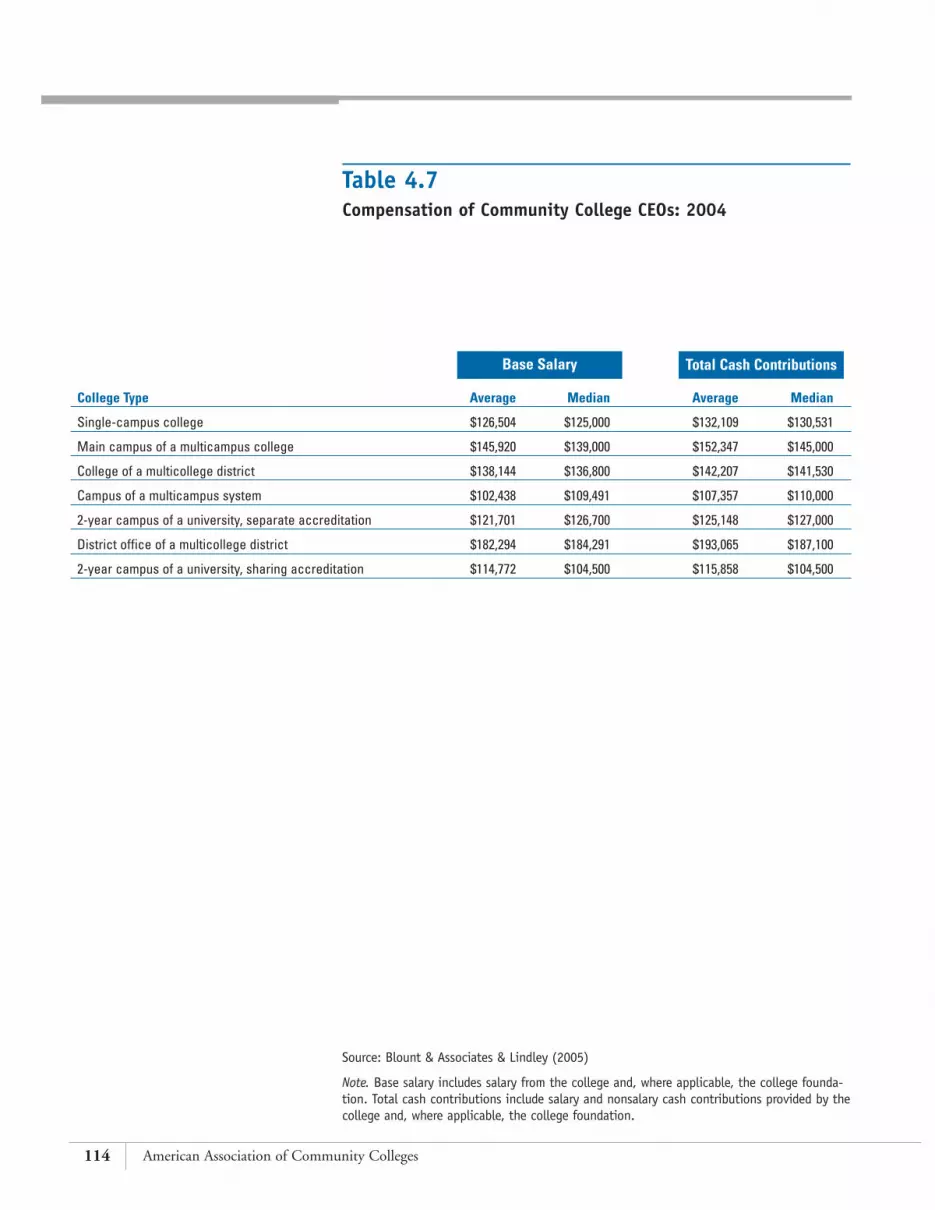
114 American Association of Community Colleges
Table 4.7Compensation of Community College CEOs: 2004
College Type Average Median Average Median
Single-campus college $126,504 $125,000 $132,109 $130,531
Main campus of a multicampus college $145,920 $139,000 $152,347 $145,000
College of a multicollege district $138,144 $136,800 $142,207 $141,530
Campus of a multicampus system $102,438 $109,491 $107,357 $110,000
2-year campus of a university, separate accreditation $121,701 $126,700 $125,148 $127,000
District office of a multicollege district $182,294 $184,291 $193,065 $187,100
2-year campus of a university, sharing accreditation $114,772 $104,500 $115,858 $104,500
Source: Blount & Associates & Lindley (2005)
Note. Base salary includes salary from the college and, where applicable, the college founda-tion. Total cash contributions include salary and nonsalary cash contributions provided by thecollege and, where applicable, the college foundation.
Base Salary Total Cash Contributions

115National Profile of Community Colleges: Trends & Statistics 4TH EDITION
Table 4.8Employee Benefits Received by Community College CEOs: 2004
100% Partial Not covered by Not offered by Benefits covered coverage the college the college
Individual medical coverage
Medical 49% 49% 1% 0%
Prescription drugs 30% 62% 3% 3%
Dental 30% 47% 18% 3%
Vision 22% 38% 16% 17%
Hearing 11% 28% 7% 40%
Individual insurance coverage
Life 55% 27% 10% 4%
Long-term disability 36% 21% 23% 13%
Short-term disability 31% 17% 22% 19%
Accidental death and dismemberment 31% 16% 20% 22%
Travel accident 13% 3% 9% 60%
Long-term care 6% 6% 27% 45%
Family coverage
Medical 24% 50% 20% 3%
Prescription drugs 16% 55% 20% 6%
Dental 17% 43% 29% 6%
Vision 13% 33% 23% 21%
Hearing 7% 25% 12% 39%
Life 4% 10% 26% 44%
Source: Blount & Associates & Lindley (2005)
Coverage

116 American Association of Community Colleges
Table 4.9College Faculty, by Age and Employment Status: 1998–1999
Source: NCES (2004k)
Employment Status and Type of College/Program Under 35 35–44 45–54 55–64 65–69 70+
Employed full time
Public 4-year, with doctoral programs 7.4% 27.7% 34.4% 24.2% 4.8% 1.4%
Private nonprofit 4-year, with doctoral programs 8.3% 28.7% 33.7% 22.9% 4.7% 1.6%
Public 4-year, no doctoral programs 6.6% 21.6% 34.8% 30.9% 4.8% 1.3%
Private nonprofit 4-year, no doctoral programs 7.6% 26.4% 36.3% 24.8% 3.5% 1.5%
Public community college 6.5% 21.9% 41.2% 27.1% 2.2% 1.0%
Private nonprofit community college 15.8% 12.8% 32.1% 28.9% 8.0% 2.3%
Total 7.3% 25.3% 36.0% 25.9% 4.1% 1.4%
Employed part time
Public 4-year, with doctoral programs 13.6% 28.8% 28.8% 17.9% 7.7% 3.1%
Private nonprofit 4-year, with doctoral programs 7.5% 27.1% 29.3% 19.9% 4.8% 11.5%
Public 4-year, no doctoral programs 12.7% 21.8% 36.8% 19.6% 4.4% 4.7%
Private nonprofit 4-year, no doctoral programs 14.8% 25.7% 32.0% 16.4% 6.3% 4.7%
Public community college 12.1% 25.8% 37.3% 18.2% 4.3% 2.2%
Private nonprofit community college 8.0% 30.7% 29.6% 25.3% 4.3% 2.1%
Total 12.6% 25.9% 34.1% 18.2% 5.3% 3.9%
Age

117National Profile of Community Colleges: Trends & Statistics 4TH EDITION
Figure 4.3Full-Time Faculty’s Years to Retirement, by College Type:1999–2000
20%
40%
50%
30%
10%
60%
70%
80%
90%
100%
Publi
c 4-ye
ar,
with do
ctoral
prog
rams
Priva
te no
nprof
it 4-
year,
with do
ctoral
prog
rams
Publi
c 4-ye
ar,
no do
ctoral
prog
rams
Priva
te no
nprof
it 4-
year,
no do
ctoral
prog
rams
Priva
te no
nprof
it
commun
ity co
llege
Publi
c com
munity
colle
ge
Perc
enta
ge o
f fa
cult
y
College type
Source: NCES (2004k)
■ 25+ years■ 21–25 years■ 16–20 years■ 11–15 years■ 6–10 years■ 1–5 years

118 American Association of Community Colleges
Table 4.10Highest Level of Education Attained by College Faculty, byEmployment Status and Teaching Field: 1998–1999
Source: NCES (2004k)
Less thanFirst associate
Employment Status and Type of College/Teaching Field Doctorate professional Master’s Bachelor’s Associate degree
Employed full time
Public 4-year, with doctoral programs 70.1% 14.1% 13.9% 1.7% 0.0% 0.1%
Private nonprofit 4-year, with doctoral programs 66.7% 23.6% 8.1% 1.5% 0.1% 0.1%
Public 4-year, no doctoral programs 69.4% 2.1% 26.2% 2.2% 0.0% 0.2%
Private nonprofit 4-year, no doctoral programs 59.1% 6.0% 32.2% 2.3% 0.1% 0.3%
Private nonprofit community college 18.2% 1.9% 61.7% 12.7% 3.4% 2.1%
Public community college 20.3% 2.3% 58.3% 17.8% 0.0% 1.4%
Business, law, and communications 8.6% 6.8% 68.2% 14.1% 0.7% 1.6%
Health sciences 4.5% 2.4% 62.0% 22.5% 6.8% 1.7%
Humanities 29.8% 0.9% 68.3% 0.8% 0.3% 0.0%
Natural sciences and engineering 25.5% 1.3% 57.0% 12.9% 2.9% 0.4%
Social sciences and education 26.6% 1.7% 67.9% 3.1% 0.7% 0.0%
Occupation-specific programs 10.0% 0.9% 33.6% 31.1% 11.9% 12.5%
All other programs 11.1% 0.4% 67.3% 13.6% 4.1% 3.5%
Total full time 57.7% 9.2% 27.8% 4.0% 0.7% 0.2%
Employed part time
Public 4-year, with doctoral programs 28.8% 21.5% 42.0% 7.1% 0.3% 0.3%
Private nonprofit 4-year, with doctoral programs 35.4% 18.4% 36.0% 9.9% 0.2% 0.1%
Public 4-year, no doctoral programs 21.2% 6.1% 60.6% 11.2% 0.2% 0.7%
Private nonprofit 4-year, no doctoral programs 22.6% 9.7% 55.6% 11.1% 0.2% 0.8%
Private nonprofit community college 8.2% 2.7% 58.6% 19.8% 5.6% 5.2%
Public community college 7.9% 4.8% 64.1% 21.1% 2.1% 0.0%
Business, law, and communications 2.4% 8.1% 56.4% 25.6% 4.7% 3.0%
Health sciences 2.4% 3.5% 40.5% 31.6% 13.2% 8.8%
Humanities 12.6% 1.3% 76.1% 9.8% 0.0% 0.3%
Natural sciences and engineering 9.8% 2.0% 61.5% 19.2% 4.6% 2.9%
Social sciences and education 14.2% 2.7% 69.5% 12.6% 1.0% 0.0%
Occupationally specific programs 4.5% 2.7% 16.3% 24.5% 25.1% 26.8%
All other programs 3.0% 0.7% 57.7% 28.3% 5.8% 4.6%
Total part time 18.2% 8.7% 54.1% 14.1% 2.5% 1.1%
Highest Level of Education

119National Profile of Community Colleges: Trends & Statistics 4TH EDITION
Table 4.11Time Spent on Activities by Full-Time College Faculty:1998–1999
Source: NCES (2004k)
Type of College/Program Teaching Research Administration All other activities
Public 4-year, with doctoral programs 46.4% 24.0% 13.7% 16.0%
Private nonprofit 4-year, with doctoral programs 43.4% 25.9% 14.1% 16.6%
Public 4-year, no doctoral programs 63.2% 10.5% 13.4% 13.0%
Private nonprofit 4-year, no doctoral programs 62.4% 8.3% 16.7% 12.5%
Public community college 71.9% 3.8% 11.5% 12.9%
Private nonprofit community college 61.3% 4.5% 20.2% 14.0%
Total 56.7% 15.2% 13.9% 14.3%
Faculty’s Activities

120 American Association of Community Colleges
Table 4.12Percentage of Community Colleges Offering InternationalPrograms and Services: 1995 and 2000
Source: Blair, Phinney, & Phillippe (2001)
Program 1995 2000
Global awareness activities 43% 83%
International business activities 23% 60%
International components in classes 40% 82%
% of Colleges

121National Profile of Community Colleges: Trends & Statistics 4TH EDITION
Table 4.13Top 30 Community Colleges, by Nonresident Alien StudentEnrollment: 2002
Houston Community College System Houston TX 3,970
Santa Monica College Santa Monica CA 2,755
Broward Community College Fort Lauderdale FL 2,525
Borough of Manhattan Community College New York NY 2,102
Collin County Community College District Plano TX 1,893
Miami Dade College Miami FL 1,888
Montgomery College Central Administration Rockville MD 1,854
LaGuardia Community College Long Island City NY 1,561
Northern Virginia Community College Annandale VA 1,532
Oakland Community College Bloomfield Hills MI 1,328
Central Piedmont Community College Charlotte NC 1,288
City College of San Francisco San Francisco CA 1,197
De Anza College Cupertino CA 1,168
Richland College Dallas TX 1,091
Nassau Community College Garden City NY 1,040
Pasadena City College Pasadena CA 1,027
Foothill College Los Altos Hills CA 1,000
Bergen Community College Paramus NJ 949
Valencia Community College Orlando FL 922
Wake Technical Community College Raleigh NC 905
Georgia Perimeter College Decatur GA 824
Moraine Valley Community College Palos Hills IL 808
North Harris Montgomery Community College District The Woodlands TX 793
Oklahoma City Community College Oklahoma City OK 788
Quincy College Quincy MA 752
Grossmont College El Cajon CA 749
El Camino College Torrance CA 744
Palm Beach Community College Lake Worth FL 728
Diablo Valley College Pleasant Hill CA 721
Kingsborough Community College Brooklyn NY 717
Source: Blair, Phinney, & Phillippe (2001)
College City State # enrolled

122 American Association of Community Colleges
Table 4.14Percentage of Colleges Offering Certificate- or Degree-LevelDistance Education Programs, by College Type and Size:2000–2001
Source: NCES (2004e)
Note. Percentages are based on the estimated 4,130 community and 4-year Title IV-eligible,degree-granting colleges in the nation. Detail may not sum to totals because of rounding.
Any college-levelcertificate or degree
programs Certificate programs
Programs Designed to Be Completed EntirelyThrough Distance Education
Degree programs
Offered Colleges Graduate/ Graduate/any with Certificate Under- first- Degree Under- first-
distance distance programs graduate professional programs graduate professional education All education at either certificate certificate at either degree degree
College Type and Size courses colleges programs level programs programs level programs programs
College type
Public community college 90% 22% 25% 15% 15% — 20% 20% —
Public 4-year college 89% 47% 53% 25% 13% 18% 48% 28% 43%
Private 4-year college 40% 14% 36% 14% 10% 10% 33% 19% 28%
Size of college
Less than 3,000 students 41% 11% 27% 12% 11% 6% 22% 16% 21%
3,000–9,999 students 88% 32% 37% 14% 12% 12% 34% 25% 38%
10,000 or more students 95% 49% 51% 30% 16% 30% 47% 27% 57%
All colleges 56% 19% 34% 16% 12% 13% 30% 21% 35%

123National Profile of Community Colleges: Trends & Statistics 4TH EDITION
Table 4.15Number and Percentage Distribution of 2-Year and 4-Year TitleIV Degree-Granting Colleges, by Distance Education ProgramStatus: 2000–2001
Source: Waits & Lewis (2003)
Note. Percentages are based on the estimated 4,130 community and 4-year Title IV-eligible,degree-granting colleges in the nation. Detail may not sum to totals because of rounding.
Distance Education Program Status
Did not offer in 2000–2001,Offered in Planned to offer in did not plan to offer in the
Total # of 2000–2001 the next 3 years next 3 yearsCollege Type and Size colleges # % # % # %
College type
Public community college 1,070 960 90% 50 5% 50 5%
Private community college 640 100 16% 150 23% 400 62%
Public 4-year college 620 550 89% 20 3% 50 8%
Private 4-year college 1,800 710 40% 290 16% 790 44%
Size of college
Less than 3,000 students 2,840 1,160 41% 460 16% 1,220 43%
3,000–9,999 students 870 770 88% 50 5% 60 7%
10,000 or more students 420 400 95% 10 2% 10 2%
All colleges 4,130 2,320 56% 510 12% 1,290 31%

124 American Association of Community Colleges
Figure 4.4Enrollment in Distance Education Courses, by Type of College:2000–2001
Public communitycolleges
48%
Private 4-yearcolleges19%
Public 4-yearcolleges31%
Source: Waits & Lewis (2003)

125National Profile of Community Colleges: Trends & Statistics 4TH EDITION
Figure 4.5Community Colleges Offering Service Learning: 2003
Interested butdoes not offer yet19%
Offers servicelearning
71%
Not interested10%
Source: Prentice, Robinson, & McPhee (2003)

126 American Association of Community Colleges
Figure 4.6Curricular Areas in Which Community Colleges Offer ServiceLearning Activities: 2003
Business
Health
English
Humanities
Social sciences
Information technologies
Other
Languages/ESL/ESOL
Math
Technical/vocational
Education
Science
10% 20% 30% 40% 60% 80%70%50%
Percentage of community colleges
Source: Prentice, Robinson, & McPhee (2003)

127National Profile of Community Colleges: Trends & Statistics 4TH EDITION
Americans continue tobelieve that a college edu-cation is essential for eco-
nomic success and civic participa-tion, according to recent Chronicleof Higher Education survey reports(Selingo, 2003, 2004). They favoruniversal access and have consider-able confidence in colleges and uni-versities to provide high-qualitylearning experiences. Nevertheless,nearly 80% of middle-class respon-dents in the survey worried that theywould have difficulty funding col-lege studies for their children orthemselves. These are legitimateworries: Between 1991–1992 and2001–2002 tuition at all collegesrose by 74%, and for communitycolleges, tuition increased from anaverage of $1,189 in 1991–1992 to$1,772 in 2001–2002, an increaseof about 49% (see Table 5.5).
The costs of attending commu-nity colleges are still favorable whencontrasted with an average cost in2002 of $10,636 for tuition, room,and board at public four-year col-leges and $26,854 at private four-
year colleges. These tuition and feelevels and their annual rate ofgrowth differ considerably depend-ing on the region of the country.Furthermore, at public communitycolleges and four-year colleges alike,these costs have tended to rise morerapidly in recent years because oflower levels of state and local appro-priations for higher education.
Many students try to offset col-lege costs through federal and stategrants and loans. In 2002–2003,more than $40 billion was distrib-uted nationwide to eligible studentsby federal and state governmentsand colleges and universities.Approximately one third of Pell dol-lars (about $4.4 billion in 2003) wasawarded to community college stu-dents. The annual grant aid maxi-mum was $4,050 per student, butawards averaged $2,000, which gen-erally covered the entire tuitionamount.
Still, students had to cover othereducation-related costs, such as thosefor books, child care, and transporta-tion, and continued to feel financial
stress as a result. Many had to workpart or full time to support theirstudies, and this sometimes had anegative impact on their academicprogress. Changes in governmentpolicies, generally at the state level,have also affected the distribution offinancial aid grants, providing pro-portionally more dollars for meritori-ous middle-class students and fewerdollars for needy low-income stu-dents. Finally, there has been a shiftaway from grants that need not berepaid (42% of awards in 2000) andtoward loans that may leave studentswith heavy debts upon graduation.In 2000, only 42% of financial aidawards were grants, whereas 58%were loans (Lane, 2003).
In spite of this grim outlook forcollege costs, enrollments in all eco-nomic, racial, and ethnic groupshave grown since the 1980s, andcommunity colleges strive to staytrue to their open-door policy, pro-viding access for many who other-wise could not attend college.However, severe funding cuts in sev-eral states, including California and
College Education Costs and Financing
V

128 American Association of Community Colleges
Florida, have resulted in faculty andstaff hiring freezes. Because of thesurge in enrollments in these states,when classes filled, additional classescould not always be opened toaccommodate all the potential stu-dents, and late registrants were actu-ally turned away. Officials inCalifornia estimated that close to175,000 students were turned awayfrom community colleges in2003–2004; in North Carolina,some 56,000 students were not ableto register (Evelyn, 2004).
At the same time that studentsand their families are trying to findaffordable higher education options,community colleges are workinghard to contain and even reducecosts while maintaining a full rangeof services and programs. Generallycommunity college revenues, whichnationwide approach $33 billionannually (see Table 5.1) are derivedfrom the following sources: tuitionand fees; federal, state, and localfunds; and grants, gifts, and sales.The proportion from each sourcedepends on the college’s location,with state funding usually playingthe pivotal role. Although on theaverage, public community collegesreceive approximately equal revenuefrom state, local, and tuition dollars,the total amount of support collegesreceive varies greatly, with very fewstates actually receiving one third oftheir revenues from each. In fact,
states such as Kansas, Illinois, andArizona receive a larger portion oftheir total revenue from local sourcesthan from the state. Other states,such as Florida, Indiana, andMassachusetts, receive more than50% of their revenue from the state.Still others, including NewHampshire, Vermont, andPennsylvania, depend more heavilyon tuition than do either of theother two revenue streams.
Perhaps the greatest challengefor community colleges in the nearfuture will be maintaining currentservice levels in light of their states’fiscal difficulties. In effect, states willhave to increase funding for highereducation by 5%–6% annually justto maintain the status quo while alsoaccounting for inflation, expectedhigh school graduation rates, andconsequent college enrollmentincreases. However, the majority ofstates—particularly those that relyon sales taxes rather than propertytaxes for revenue—have a structuraldeficit of 0.5% annually in fundingcurrent services. That is, these stateswould have to increase taxes by0.5% each year just to fund the serv-ices that are currently supported.Alternatively, the states would haveto hold spending growth to about4.5% annually rather than the 5%needed to maintain current services.
This built-in problem was lessnoticeable in good economic times,
but the past few years have beencharacterized by slow growth andrecession. In such times, the generalpublic is less willing or able tospend, thus reducing sales tax rev-enues. At the same time, legislatorsare highly resistant to raising taxes.The situation is further complicatedby the public demand for increasedservices in other areas, such as K–12education, prisons, and health care.These other services are viewed asnecessities, whereas higher educationis sometimes seen as a luxury that isless deserving of public funding.
Whatever the economic distressof states in the past few years, theyare still major contributors to com-munity college finances, and mosthave developed elaborate means fordeciding how much to allocate tothe colleges. A survey conducted in 2000 by the Denver-basedEducation Commission of the StatesCommunity College Policy Centerrevealed that 29 states used a fund-ing formula to determine appropria-tions, whereas 15 states did not doso. Elements in these formulas mayinclude enrollment in current andpast years, enrollment projections,space utilization, and comparisonwith peer colleges. Because work-place training has become so criticalto the economic vitality of commu-nities, some states are also beginningto reimburse colleges for noncreditworkplace training courses. This is a

129National Profile of Community Colleges: Trends & Statistics 4TH EDITION
significant change from as recent asa decade ago when noncredit cours-es were largely recreational in natureor provided a forum for learningnew hobbies.
In recent years, many states havealso introduced performance-basedinitiatives to allocate some proportionof the funds as a means of holdingcolleges and universities accountableand ensuring that taxpayer dollarsspent on higher education benefit thestate optimally. Ten states reportedthat performance on designated indi-cators was tied directly to budgetallocations. Some of the most fre-quently used performance indicatorswere job placement, transfer rates,graduation rates, retention, passrates on licensure examinations, andstudent satisfaction surveys.
Containing tuition costsbecomes increasingly difficult asfunding has shifted from the federalgovernment to states and, in somecases, from states to local sources. Invirtually all states, these shifts haveaffected tuition. To illustrate thisshift, between 1980 and 1996 feder-al appropriations for community col-leges declined by 69%, and stateappropriations grew by only 7%. Inthat same period, tuition and feesincreased by 117%, and local appro-priations (county or municipality)grew by 47%. To keep tuition costsfrom rising even higher, most col-leges have tapped other revenue
sources to compensate for the loss ofpublic funds, including grants, pri-vate donations, and auxiliary servicesincome such as that from cafeterias,bookstores, and vending machines.
Some colleges are able to chargespecial rates for customized trainingand do sufficient training of thistype to help support other programsor needs at the college. Other col-leges establish close partnershipswith local businesses to share educa-tion or training costs. An example ofthis practice is a partnership betweena college and a local hospital inwhich the hospital in need of quali-fied nursing staff provides classroomand clinical lab space and fundssome of the faculty to teach specificcourses for the associate degree nurs-ing program. The relationship mayinclude tuition grants to studentsthat will be waived in exchange forthe student working at the collegefor a specified period of time aftergraduation. This trend has led toobservations that public higher edu-cation is becoming privatized.
Operating expenditures for com-munity colleges are categorized large-ly as follows: instruction, academicsupport (library, tutoring, etc.), stu-dent services, public/communityservices, administrative costs, physi-cal plant operation and mainte-nance, and scholarships. Between1980 and 1996, these expendituresincreased by 49% in constant dol-
lars, with scholarships growing by660%, perhaps to reduce the impactof tuition increases on students(Merisotis & Wolanin, 2000).
It is important to note that, inthe service-intensive field of educa-tion, personnel costs account forapproximately 85% of the budget.Colleges have attempted to keepthese costs low by hiring greaternumbers of part-time staff andadjunct instructors and by not fillingsome positions. Because cuts in full-time personnel often involve con-tracts and tenure issues, colleges havegenerally avoided this strategy forreducing costs, choosing instead toincrease class sizes, encourage earlyretirements, and delay equipmentpurchases, among other measures.The pressure to keep budgets fromexpanding has had to be balancedagainst demands for new programsand additional support services suchas career counseling, job placement,and online student services. The ris-ing price of utilities, health benefits,and technology, together with theneed to address problems resultingfrom deferred maintenance of agingphysical plants, has put even morestress on their budgets.
In the view of some legislatorsand members of the public, highereducation has operated inefficientlyfor many years because the cost ofattending college has increased at afaster rate than has the cost of living.

130 American Association of Community Colleges
Yet introducing cost-effectivenessstrategies and tightening the fiscalbelt have neither reduced collegecosts nor changed negative publicperceptions appreciably. To counter-act this view, community collegeshave developed sophisticated eco-nomic models to demonstrate thevalue of their contributions to localand state economies. They have alsobecome more entrepreneurial, diver-sifying their revenue streams throughpartnerships with business andindustry, sale of assets such as realestate, and customized training pro-grams that may supply the collegewith state-of-the-art equipment.
Distance learning is anothermeans colleges have used in theattempt to contain costs andenhance revenues. Providing coursesonline has allowed colleges to reachunderserved populations and accom-modate workers who want to learnwhenever they can and whereverthey are. This strategy has resulted innew enrollments and additionaltuition income, while not strainingphysical facilities where space is at apremium. However, the expectationthat offering degrees and coursesonline could be done at a lower costthan on campus has not proved true.When the cost of faculty training,high-tech equipment, and round-
the-clock technical support is takeninto account, distance educationmay actually increase costs.
Fundraising is yet anothermeans to supplement funding alloca-tions. The first two-year collegefoundation was established sometimein the 1920s at Long Beach CityCollege in California, and since thattime these ancillary organizationshave assumed a significant role insupporting college programs andservices. According to a 1997 surveyby AACC, 88% of responding com-munity colleges had a foundation,with average assets estimated at over$2 million (Phillippe & Eblinger,1998). Through the contributions ofbusinesses, alumni, friends of thecollege, and foundation board mem-bers, these foundations raise moneyfor scholarships, equipment purchas-es, facilities improvements, andmany other college needs.
As fiscal support from publicsources has dwindled, communitycollege foundations have evolvedinto highly sophisticated operationsthat manage large investments, con-duct capital campaigns, and linkwith alumni services. Annual solici-tations, golf tournaments, socialevents, and planned giving programsare other foundation activities onbehalf of their colleges. Furthermore,
just as at four-year colleges, fundrais-ing has become a primary functionof community college presidents (upto 40% of their time), and manycolleges have added developmentoffices to support this crucial work.
In their second century of exis-tence, community colleges will haveto address these and other financialconditions as they compete in aglobalized education environment.Ever-increasing costs for personneland institutional operations, surgingenrollments, competition from othereducation providers, evolving work-force development needs, and newtechnologies will all require creativeresponses and new fundingapproaches. The continued diversifi-cation of the student body and theinflux of immigrants will lead tonew or expanded needs for targetedsupport services. Remedial educationwill continue to be an importantcomponent of the colleges’ program-ming in order to ensure students’success. Demands for accountabilityand cost effectiveness will not disap-pear. Still, community colleges haveproven over the past 100 years thatthey are capable of meeting suchchallenges, and they can be expectedto continue using all resources opti-mally to prepare students for success-ful roles in American society. D

131National Profile of Community Colleges: Trends & Statistics 4TH EDITION
Figure 5.1Sources of Revenue for Public Colleges: 2001–2002
10%
5%
15%
20%
25%
30%
35%
40%
45%
50%
Tuition andfees
State Local Auxiliaryenterprises
OtherFederal
Source of revenue
Perc
enta
ge o
f re
venu
e
Source: Knapp et al. (2004); NCES (2004g)
Note. Includes only colleges that use the Government Accounting Standards Board accounting standards.
■ Community colleges■ 4-year colleges

132 American Association of Community Colleges
Table 5.1Sources of Revenue for Colleges: 2000–2001
Community Colleges 4-Year Colleges
Revenues RevenuesCollege Type and Source of Funds ($1,000s) % ($1,000s) %
Public colleges (GASB)a
Tuition and fees $6,133,203 19.5% $25,330,908 17.7%
Government appropriations $17,249,414 54.9% $45,984,845 32.1%
Federal $77,304 0.2% $1,638,648 1.1%
State $11,831,392 37.6% $44,117,490 30.8%
Local $5,340,718 17.0% $228,707 0.2%
Government grants and contracts $4,457,986 14.2% $20,554,713 14.4%
Federal (excluding Pell grants) $1,524,435 4.8% $15,427,544 10.8%
State $2,150,460 6.8% $4,443,486 3.1%
Local $783,092 2.5% $683,683 0.5%
Private gifts, grants, and contracts $376,197 1.2% $8,464,323 5.9%
Endowment income $27,617 0.1% $1,247,897 0.9%
Sales and services of educational activities $228,442 0.7% $4,749,548 3.3%
Auxiliary enterprises $1,696,626 5.4% $14,682,143 10.3%
Hospitals $0 0.0% $15,936,422 11.1%
Independent operations $134,853 0.4% $801,778 0.6%
Other sources $1,134,545 3.6% $5,311,191 3.7%
Total current funds revenues $31,438,882 100.0% $143,063,768 100.0%
Public colleges (FASB)b
Tuition and fees $1,731 7.1% $453,770 21.4%
Government appropriations $16,066 66.3% $320,915 15.1%
Federal $14 0.1% $3,997 0.2%
State $3,190 13.2% $316,918 15.0%
Local $12,863 53.1% $0 0.0%
Government grants and contracts $4,634 19.1% $168,044 7.9%
Federal (excluding Pell grants) $4,080 16.8% $132,273 6.2%
State $500 2.1% $32,457 1.5%
Local $54 0.2% $3,315 0.2%
Private gifts, grants, and contracts $289 1.2% $107,513 5.1%
Contributions from affiliated entities $0 0.0% $0 0.0%
Investment returns $180 0.7% $76,294 3.6%
Sales and services of educational activities $0 0.0% $10,383 0.5%
Sales and services of auxiliary enterprises $1,158 4.8% $121,908 5.8%
Hospitals $0 0.0% $823,499 38.9%
Independent operations $41 0.2% $0 0.0%
Other revenue $138 0.6% $36,002 1.7%
Total revenues and investment returns $24,237 100.0% $2,118,328 100.0%

133National Profile of Community Colleges: Trends & Statistics 4TH EDITION
Community Colleges 4-Year Colleges
Revenues RevenuesCollege Type and Source of Funds ($1,000s) % ($1,000s) %
Private nonprofit colleges
Tuition and fees $321,724 53.1% $30,996,381 38.0%
Government appropriations $8,912 1.5% $770,523 0.9%
Federal $3,712 0.6% $374,051 0.5%
State $4,870 0.8% $382,486 0.5%
Local $329 0.1% $13,986 0.0%
Government grants and contracts $73,435 12.1% $10,708,529 13.1%
Federal (excluding Pell grants) $53,714 8.9% $9,445,497 11.6%
State $14,687 2.4% $774,017 0.9%
Local $5,034 0.8% $489,016 0.6%
Private gifts, grants, and contracts $58,617 9.7% $14,978,461 18.4%
Contributions from affiliated entities $11,827 2.0% $810,408 1.0%
Investment returns $20,996 3.5% -$3,623,323 -4.4%
Sales and services of educational activities $15,949 2.6% $3,452,731 4.2%
Sales and services of auxiliary enterprises $39,294 6.5% $8,703,316 10.7%
Hospitals $694 0.1% $7,125,648 8.7%
Independent operations $2,020 0.3% $3,499,024 4.3%
Other revenue $52,096 8.6% $4,147,227 5.1%
Total revenues and investment returns $605,564 100.0% $81,568,928 100.0%
Private for-profit colleges
Tuition and fees $1,756,833 87.2% $2,583,644 87.5%
Government appropriations, grants, and contracts $132,901 6.6% $141,801 4.8%
Federal (excluding Pell grants) $105,474 5.2% $81,879 2.8%
State and local $27,426 1.4% $59,922 2.0%
Private grants and contracts $1,189 0.1% $1,659 0.1%
Investment income and gains (losses) $7,163 0.4% $12,574 0.4%
Sales and services of educational activities $23,311 1.2% $40,081 1.4%
Sales and services of auxiliary enterprises $66,660 3.3% $106,327 3.6%
Other revenue $27,389 1.4% $66,168 2.2%
Total revenues and investment returns $2,015,446 100.0% $2,952,254 100.0%
Source: Knapp et al. (2004); NCES (2004g)
Note. Public and private colleges use different accounting standards, thus the categories differ. Data are based on the U.S. Department of Education definition of community colleges (see Glossary).
aPublic colleges that use the Government Accounting Standards Board standards.bPublic colleges that use the Financial Accounting Standards Board standards.

134 American Association of Community Colleges
Table 5.2Sources of Expenses for Colleges: 2000–2001
Community Colleges 4-Year Colleges
Revenues RevenuesCollege Type and Source of Funds ($1,000s) % ($1,000s) %
Public colleges (GASB)a
Educational and general expenses and transfersb $27,929,494 93.9% $107,619,308 77.7%
Instructionb $12,891,414 43.3% $38,387,046 27.7%
Research $19,889 0.1% $17,894,529 12.9%
Public service $726,898 2.4% $7,600,822 5.5%
Academic support $2,513,924 8.5% $10,672,817 7.7%
Student services $2,993,737 10.1% $5,315,732 3.8%
Institutional support $4,517,063 15.2% $10,703,012 7.7%
Operation and maintenance of plant $2,799,281 9.4% $8,174,309 5.9%
Scholarships and fellowships $1,177,982 4.0% $6,574,492 4.7%
Mandatory transfers $289,308 1.0% $2,296,550 1.7%
Auxiliary enterprises $1,720,056 5.8% $14,524,986 10.5%
Hospitals $0 0.0% $15,316,448 11.1%
Independent operations $45,431 0.2% $732,392 0.5%
Other expenses $47,486 0.2% $359,959 0.3%
Total current funds expenses and transfers $29,742,468 100.0% $138,553,094 100.0%
Public colleges (FASB)c
Instruction $7,148 29.8% $538,801 26.6%
Research $77 0.3% $117,330 5.8%
Public service $285 1.2% $53,256 2.6%
Academic support $3,009 12.6% $138,294 6.8%
Student services $3,183 13.3% $64,374 3.2%
Institutional support $4,900 20.4% $119,546 5.9%
Auxiliary enterprises $1,907 8.0% $130,130 6.4%
Net grant aid to students $1,292 5.4% $12,441 0.6%
Hospitals $0 0.0% $829,953 41.0%
Independent operations $1,401 5.8% $18 0.0%
Other expenses $770 3.2% $21,163 1.0%
Total expenses $23,971 100.0% $2,025,307 100.0%

135National Profile of Community Colleges: Trends & Statistics 4TH EDITION
Source: Knapp et al. (2004); NCES (2004g)
Note. Data are based on the U.S. Department of Education definition of community colleges(see Glossary).
aPublic colleges that use the Government Accounting Standards Board standards.aExcludes Pell Grants and nonmandatory transfers.cPublic colleges that use the Financial Accounting Standards Board standards.
Community Colleges 4-Year Colleges
Revenues RevenuesCollege Type and Source of Funds ($1,000s) % ($1,000s) %
Private nonprofit colleges
Instruction $193,428 33.5% $27,413,897 32.2%
Research $5,772 1.0% $9,019,966 10.6%
Public service $5,967 1.0% $1,467,325 1.7%
Academic support $34,412 6.0% $7,333,851 8.6%
Student services $80,717 14.0% $6,036,478 7.1%
Institutional support $141,764 24.6% $11,292,310 13.3%
Auxiliary enterprises $52,880 9.2% $8,957,973 10.5%
Net grant aid to students $15,500 2.7% $1,160,660 1.4%
Hospitals $1,896 0.3% $7,253,479 8.5%
Independent operations $1,510 0.3% $3,133,099 3.7%
Other expenses $43,046 7.5% $1,979,086 2.3%
Total expenses $576,893 100.0% $85,048,123 100.0%
Private for-profit colleges
Instruction $583,727 32.1% $726,328 30.1%
Research and public service $18,019 1.0% $4,878 0.2%
Academic support, student services, and institutional support $952,056 52.3% $1,385,095 57.4%
Auxiliary enterprises $67,872 3.7% $113,371 4.7%
Net grant aid to students $25,269 1.4% $18,519 0.8%
Other expenses $174,184 9.6% $166,465 6.9%
Total expenses $1,821,126 100.0% $2,414,655 100.0%

136 American Association of Community Colleges
Figure 5.2Sources of Expenses for Public Colleges: 2001–2002
10%
5%
15%
20%
25%
30%
35%
40%
45%
50%
Instruction Studentservices
Academicsupport
Publicservice
Institutionalsupport
Operationand
maintenanceof plant
Scholarshipsand
fellowships
Research
Source of expenses
Perc
enta
ge o
f ex
pens
es
Source: Knapp et al. (2004); NCES (2004g)
Note. Data pertain only to colleges that use the Government Accounting Standards Boardaccounting standards.
■ Community colleges■ 4-year colleges

137National Profile of Community Colleges: Trends & Statistics 4TH EDITION
Table 5.3Sources of Scholarship and Fellowship Funds for Colleges:2000–2001
Community Colleges 4-Year Colleges
Revenues RevenuesCollege Type and Source of Funds ($1,000s) % ($1,000s) %Public colleges (GASB)a
Federal government $2,687,724 73.3% $3,462,540 36.6%Pell grants $2,489,909 67.9% $2,894,741 30.6%Other federal grants $197,815 5.4% $567,799 6.0%
State government $605,393 16.5% $2,252,641 23.8%Local government $12,059 0.3% $10,323 0.1%Private $104,595 2.9% $941,725 9.9%Institutional $258,121 7.0% $2,802,004 29.6%Total scholarships and fellowships $3,667,891 100.0% $9,469,233 100.0%Public colleges (FASB)b
Federal government $968 60.5% $29,397 25.2%Pell grants $689 43.1% $23,836 20.4%Other federal grants $279 17.5% $5,561 4.8%
State government $128 8.0% $14,896 12.8%Local government $232 14.5% $0 0.0%Private $270 16.9% $10,080 8.6%Institutional $0 0.0% $62,293 53.4%Total scholarships and fellowships $1,599 100.0% $116,665 100.0%Private nonprofit collegesFederal government $57,694 45.7% $1,874,848 14.1%
Pell grants $50,182 39.7% $1,118,502 8.4%Other federal grants $7,512 6.0% $756,345 5.7%
State government $36,127 28.6% $1,258,774 9.4%Local government $2,136 1.7% $50,508 0.4%Private $13,753 10.9% $2,565,327 19.2%Institutional $16,536 13.1% $7,586,944 56.9%Total scholarships and fellowships $126,246 100.0% $13,336,401 100.0%Private for-profit collegesFederal government $387,241 74.1% $268,739 62.6%
Pell grants $309,159 59.1% $228,423 53.2%Other federal grants $78,082 14.9% $40,316 9.4%
State and local grants $123,150 23.6% $126,330 29.4%Institutional $12,341 2.4% $34,226 8.0%Total scholarships and fellowships $522,731 100.0% $429,296 100.0%
Source: Knapp et al. (2004); NCES (2004g)Note. Data are based on the U.S. Department of Education definition of community colleges(see Glossary).aPublic colleges that use the Government Accounting Standards Board standards.bPublic colleges that use Financial Accounting Standards Board standards.

138 American Association of Community Colleges
Table 5.4College Tuition and Fee Revenues and Federal Grant ScholarshipExpenses: 2000–2001
Community Colleges 4-Year Colleges
% of tuition % of tuitionAmount and fee Amount and fee
Revenues and Grant Expenses by College Type ($1,000s) revenue ($1,000s) revenue
Public colleges (GASB)a
Tuition and fee revenue $6,133,203 $25,330,908
Pell grant funds spent $2,489,909 40.6% $2,894,741 11.4%
Other federal grant funds spent $197,815 3.2% $567,799 2.2%
Total federal funds spent $2,687,724 43.8% $3,462,540 13.7%
Public colleges (FASB)b
Tuition and fee revenue $1,731 $453,770
Pell grant funds spent $689 39.8% $23,836 5.3%
Other federal grant funds spent $279 16.1% $5,561 1.2%
Total federal funds spent $968 55.9% $29,397 6.5%
Private nonprofit colleges
Tuition and fee revenue $321,724 $30,996,381
Pell grant funds spent $50,182 15.6% $1,118,502 3.6%
Other federal grant funds spent $7,512 2.3% $756,345 2.4%
Total federal funds spent $57,694 17.9% $1,874,847 6.0%
Private for-profit colleges
Tuition and fee revenue $1,756,833 $2,583,644
Pell grant funds spent $309,159 17.6% $228,423 8.8%
Other federal grant funds spent $78,082 4.4% $40,316 1.6%
Total federal funds spent $387,241 22.0% $268,739 10.4%
Source: Knapp et al. (2004); NCES (2004g)
aPublic colleges that use the Government Accounting Standards Board standards.bPublic colleges that use Financial Accounting Standards Board standards.

139National Profile of Community Colleges: Trends & Statistics 4TH EDITION
All CollegesCommunity Colleges 4-Year Colleges
Source: Snyder (2003)
Table 5.5Average College Tuition and Fees: 1976–2002(in current dollars)
Academic Year Public Independent Total Public Independent Total Public Independent Total
1976–1977 $283 $1,592 $346 $617 $2,534 $1,218 $479 $2,467 $924
1977–1978 $306 $1,706 $378 $655 $2,700 $1,291 $512 $2,624 $984
1978–1979 $327 $1,831 $411 $688 $2,958 $1,397 $543 $2,867 $1,073
1979–1980 $355 $2,062 $451 $738 $3,225 $1,513 $583 $3,130 $1,163
1980–1981 $391 $2,413 $526 $804 $3,617 $1,679 $635 $3,498 $1,289
1981–1982 $434 $2,605 $590 $909 $4,113 $1,907 $714 $3,953 $1,457
1982–1983 $473 $3,008 $675 $1,031 $4,639 $2,139 $798 $4,439 $1,626
1983–1984 $528 $3,099 $730 $1,148 $5,093 $2,344 $891 $4,851 $1,783
1984–1985 $584 $3,485 $821 $1,228 $5,556 $2,567 $971 $5,315 $1,985
1985–1986 $641 $3,672 $888 $1,318 $6,121 $2,784 $1,045 $5,789 $2,181
1986–1987 $660 $3,684 $897 $1,414 $6,658 $3,042 $1,106 $6,316 $2,312
1987–1988 $706 $4,161 $809 $1,537 $7,116 $3,201 $1,218 $6,988 $2,458
1988–1989 $730 $4,817 $979 $1,646 $7,722 $3,472 $1,285 $7,461 $2,658
1989–1990 $756 $5,196 $978 $1,780 $8,396 $3,800 $1,356 $8,147 $2,839
1990–1991 $824 $5,570 $1,087 $1,888 $9,083 $4,009 $1,454 $8,772 $3,016
1991–1992 $936 $5,754 $1,189 $2,117 $9,759 $4,385 $1,628 $9,419 $3,286
1992–1993 $1,025 $6,059 $1,276 $2,349 $10,294 $4,752 $1,782 $9,942 $3,517
1993–1994 $1,125 $6,370 $1,399 $2,537 $10,952 $5,119 $1,942 $10,572 $3,827
1994–1995 $1,192 $6,914 $1,488 $2,681 $11,481 $5,391 $2,057 $11,111 $4,044
1995–1996 $1,239 $7,094 $1,522 $2,848 $12,243 $5,786 $2,179 $11,864 $4,338
1996–1997 $1,276 $7,236 $1,543 $2,987 $12,881 $6,118 $2,271 $12,498 $4,564
1997–1998 $1,314 $7,464 $1,695 $3,110 $13,344 $6,351 $2,360 $12,801 $4,755
1998–1999 $1,327 $7,854 $1,725 $3,229 $13,973 $6,723 $2,430 $13,428 $5,013
1999–2000 $1,338 $8,235 $1,721 $3,349 $14,588 $7,044 $2,506 $14,081 $5,238
2000–2001 $1,333 $9,067 $1,698 $3,501 $15,470 $7,372 $2,562 $15,000 $5,377
2001–2002 $1,379 $10,010 $1,772 $3,746 $16,287 $7,828 $2,727 $15,851 $5,719
% change 1976–1977 to 1981–1982 53.3% 63.6% 70.6% 47.5% 62.3% 56.5% 49.1% 60.2% 57.6%
% change 1981–1982 to 1991–1992 115.5% 120.9% 101.7% 132.8% 137.3% 129.9% 128.1% 138.3% 125.6%
% change 1991–1992 to 2001–2002 47.3% 74.0% 49.0% 77.0% 66.9% 78.5% 67.5% 68.3% 74.1%
% change 1976–1977 to 2001–2002 386.6% 528.8% 412.8% 507.6% 542.7% 542.4% 469.8% 542.6% 518.9%

140 American Association of Community Colleges
All CollegesCommunity Colleges 4-Year Colleges
Source: Snyder (2003)
Table 5.6Average College Tuition and Fees: 1976–2002(in constant 2001 dollars)
Academic Year Public Independent Total Public Independent Total Public Independent Total
1976–1977 $882 $4,953 $1,075 $1,918 $7,883 $3,790 $1,489 $7,674 $2,875
1977–1978 $896 $4,984 $1,105 $1,913 $7,891 $3,774 $1,495 $7,667 $2,877
1978–1979 $888 $4,970 $1,115 $1,867 $8,029 $3,791 $1,473 $7,784 $2,912
1979–1980 $866 $5,030 $1,100 $1,799 $7,868 $3,691 $1,423 $7,637 $2,837
1980–1981 $841 $5,186 $1,130 $1,727 $7,773 $3,608 $1,364 $7,517 $2,769
1981–1982 $846 $5,072 $1,148 $1,771 $8,009 $3,714 $1,390 $7,696 $2,836
1982–1983 $868 $5,519 $1,238 $1,892 $8,511 $3,925 $1,464 $8,144 $2,983
1983–1984 $939 $5,508 $1,298 $2,040 $9,053 $4,166 $1,584 $8,622 $3,169
1984–1985 $996 $5,942 $1,400 $2,093 $9,472 $4,377 $1,655 $9,061 $3,385
1985–1986 $1,055 $6,045 $1,463 $2,169 $10,076 $4,584 $1,720 $9,529 $3,590
1986–1987 $1,067 $5,950 $1,449 $2,283 $10,754 $4,913 $1,787 $10,201 $3,734
1987–1988 $1,100 $6,483 $1,261 $2,395 $11,088 $4,987 $1,898 $10,889 $3,830
1988–1989 $1,093 $7,212 $1,466 $2,464 $11,560 $5,198 $1,923 $11,169 $3,978
1989–1990 $1,080 $7,423 $1,397 $2,542 $11,994 $5,429 $1,937 $11,638 $4,056
1990–1991 $1,117 $7,548 $1,474 $2,559 $12,308 $5,433 $1,970 $11,888 $4,087
1991–1992 $1,217 $7,480 $1,546 $2,752 $12,687 $5,701 $2,116 $12,245 $4,271
1992–1993 $1,294 $7,646 $1,610 $2,964 $12,990 $5,997 $2,248 $12,546 $4,438
1993–1994 $1,379 $7,808 $1,715 $3,109 $13,425 $6,275 $2,381 $12,959 $4,691
1994–1995 $1,425 $8,260 $1,777 $3,202 $13,715 $6,440 $2,457 $13,273 $4,832
1995–1996 $1,440 $8,243 $1,769 $3,309 $14,225 $6,723 $2,531 $13,785 $5,040
1996–1997 $1,440 $8,168 $1,742 $3,372 $14,540 $6,906 $2,564 $14,107 $5,152
1997–1998 $1,450 $8,234 $1,869 $3,430 $14,721 $7,006 $2,604 $14,121 $5,245
1998–1999 $1,441 $8,531 $1,874 $3,507 $15,178 $7,302 $2,640 $14,586 $5,445
1999–2000 $1,422 $8,753 $1,829 $3,560 $15,506 $7,487 $2,663 $14,967 $5,568
2000–2001 $1,370 $9,323 $1,746 $3,600 $15,908 $7,580 $2,635 $15,425 $5,529
2001–2002 $1,379 $10,010 $1,772 $3,746 $16,287 $7,828 $2,727 $15,851 $5,719
% change 1976–1977 to 1981–1982 -4.0% 2.4% 6.8% -7.7% 1.6% -2.0% -6.7% 0.3% -1.3%
% change 1981–1982 to 1991–1992 43.9% 47.5% 34.7% 55.4% 58.4% 53.5% 52.3% 59.1% 50.6%
% change 1991–1992 to 2001–2002 13.3% 33.8% 14.6% 36.1% 28.4% 37.3% 28.9% 29.4% 33.9%
% change 1976–1992 to 2001–2002 56.4% 102.1% 64.8% 95.3% 106.6% 106.5% 83.2% 106.6% 99.0%

141National Profile of Community Colleges: Trends & Statistics 4TH EDITION
Figure 5.3College Tuition and Fees: 1976–2002
$2,000
$4,000
$6,000
$8,000
$10,000
$12,000
$14,000
$16,000
$18,000
1976
–197
7
1982
–198
3
1989
–199
0
1995
–199
6
1999
–200
0
2000
–200
1
2001
–200
2
1997
–199
8
1996
–199
7
1998
–199
9
1992
–199
3
1993
–199
4
1994
–199
5
1990
–199
1
1991
–199
2
1985
–198
6
1987
–198
8
1986
–198
7
1988
–198
9
1983
–198
4
1984
–198
5
1979
–198
0
1980
–198
1
1981
–198
2
1977
–197
8
1978
–197
9
Tuit
ion
and
fees
, in
cons
tant
200
1 do
llars
Academic year
Source: Snyder (2003)
Independent 4-year colleges
Public 4-year colleges
Independent community colleges
Public community colleges

142 American Association of Community Colleges
Table 5.7Average In-State College Tuition and Fees: 2000–2001 and 2001–2002
State 2000–2001 2001–2002 % change 2000–2001 2001–2002 % change 2000–2001 2001–2002 % change
Alabama $1,672 $1,990 19.0% $2,987 $3,245 8.6% $9,334 $10,229 9.6%
Alaska $1,674 $1,717 2.6% $2,941 $3,065 4.2% $9,381 $9,852 5.0%
Arizona $924 $962 4.2% $2,346 $2,488 6.1% $9,322 $9,759 4.7%
Arkansas $1,158 $1,314 13.5% $3,011 $3,387 12.5% $9,109 $9,952 9.3%
California $315 $315 0.1% $2,566 $2,730 6.4% $17,219 $18,399 6.9%
Colorado $1,655 $1,685 1.9% $2,980 $3,159 6.0% $15,445 $16,245 5.2%
Connecticut $1,868 $1,889 1.2% $4,553 $4,772 4.8% $20,056 $21,075 5.1%
Delaware $1,680 $1,800 7.2% $4,789 $5,065 5.8% $8,415 $8,755 4.0%
District of Columbia — — — $2,070 $2,070 0.0% $19,186 $20,093 4.7%
Florida $1,438 $1,494 3.9% $2,366 $2,555 8.0% $13,805 $14,708 6.5%
Georgia $1,260 $1,293 2.6% $2,699 $2,838 5.2% $13,770 $14,555 5.7%
Hawaii $1,066 $1,067 0.1% $2,968 $3,051 2.8% $8,000 $8,777 9.7%
Idaho $1,316 $1,410 7.2% $2,628 $2,860 8.8% $13,664 $5,326 -61.0%
Illinois $1,532 $1,569 2.4% $4,178 $4,567 9.3% $15,317 $16,194 5.7%
Indiana $2,108 $2,121 0.6% $3,786 $4,002 5.7% $16,078 $16,973 5.6%
Iowa $2,141 $2,362 10.3% $3,157 $3,470 9.9% $14,630 $15,383 5.1%
Kansas $1,378 $1,441 4.5% $2,642 $2,700 2.2% $11,206 $11,987 7.0%
Kentucky $1,342 $1,561 16.3% $2,898 $3,194 10.2% $10,176 $10,972 7.8%
Louisiana $935 $1,009 7.9% $2,783 $2,865 2.9% $15,591 $16,539 6.1%
Maine $2,594 $2,642 1.8% $4,267 $4,804 12.6% $16,450 $17,619 7.1%
Maryland $2,301 $2,244 -2.5% $4,772 $4,973 4.2% $18,621 $19,652 5.5%
Massachusetts $1,894 $1,946 2.8% $4,003 $3,999 -0.1% $20,566 $21,526 4.7%
Michigan $1,743 $1,780 2.2% $4,615 $5,054 9.5% $11,155 $11,802 5.8%
Minnesota $2,507 $2,746 9.5% $4,009 $4,494 12.1% $16,243 $16,986 4.6%
Mississippi $1,138 $1,362 19.6% $2,969 $3,410 14.9% $9,659 $10,004 3.6%
Missouri $1,472 $1,498 1.8% $3,879 $4,111 6.0% $12,600 $13,218 4.9%
Montana $2,004 $2,159 7.8% $3,079 $3,467 12.6% $9,631 $9,926 3.1%
Nebraska $1,421 $1,498 5.4% $3,101 $3,228 4.1% $11,619 $14,074 21.1%
Nevada $1,369 $1,410 3.0% $2,344 $2,437 4.0% $11,465 $13,510 17.8%
New Hampshire $3,933 $4,324 10.0% $6,458 $6,728 4.2% $18,261 $19,186 5.1%
New Jersey $2,295 $2,236 -2.6% $5,609 $6,078 8.4% $16,680 $17,403 4.3%
Independent 4-Year CollegesPublic 4-Year CollegesPublic Community Colleges

143National Profile of Community Colleges: Trends & Statistics 4TH EDITION
Source: Snyder (2003)
Independent 4-Year CollegesPublic 4-Year CollegesPublic Community Colleges
State 2000–2001 2001–2002 % change 2000–2001 2001–2002 % change 2000–2001 2001–2002 % change
New Mexico $876 $921 5.0% $2,627 $2,838 8.0% $14,062 $14,499 3.1%
New York $2,562 $2,584 0.9% $4,063 $4,140 1.9% $17,433 $18,357 5.3%
North Carolina $896 $1,014 13.3% $2,298 $2,646 15.1% $14,274 $15,110 5.9%
North Dakota $1,902 $2,090 9.9% $2,942 $3,130 6.4% $8,026 $8,362 4.2%
Ohio $2,292 $2,373 3.6% $4,742 $5,142 8.4% $15,419 $16,259 5.4%
Oklahoma $1,253 $1,214 -3.1% $2,259 $2,373 5.0% $10,587 $11,405 7.7%
Oregon $1,637 $1,722 5.2% $3,646 $3,862 5.9% $17,533 $18,308 4.4%
Pennsylvania $2,287 $2,369 3.6% $5,917 $6,316 6.7% $17,821 $18,796 5.5%
Rhode Island $1,806 $1,854 2.7% $4,506 $4,708 4.5% $18,320 $19,177 4.7%
South Carolina $1,467 $1,787 21.8% $4,701 $5,502 17.0% $12,713 $13,429 5.6%
South Dakota $2,857 $2,964 3.7% $3,484 $3,692 6.0% $11,194 $11,796 5.4%
Tennessee $1,441 $1,652 14.6% $2,950 $3,340 13.2% $12,922 $13,682 5.9%
Texas $929 $981 5.6% $2,785 $2,975 6.8% $11,865 $12,728 7.3%
Utah $1,571 $1,679 6.9% $2,226 $2,388 7.3% $3,754 $4,014 6.9%
Vermont $3,004 $3,148 4.8% $7,142 $7,470 4.6% $15,740 $16,407 4.2%
Virginia $1,132 $1,131 -0.1% $3,723 $3,775 1.4% $13,118 $13,892 5.9%
Washington $1,758 $1,885 7.2% $3,600 $3,788 5.2% $15,874 $16,638 4.8%
West Virginia $1,661 $1,661 0.0% $2,551 $2,645 3.7% $12,999 $13,136 1.1%
Wisconsin $2,262 $2,310 2.1% $3,417 $3,691 8.0% $15,032 $15,907 5.8%
Wyoming $1,440 $1,490 3.4% $2,575 $2,807 9.0% — — —
All states $1,333 $1,379 3.5% $3,501 $3,746 7.0% $15,470 $16,287 5.3%

144 American Association of Community Colleges
Table 5.8Average In-State Tuition and Fees forPublic Community Colleges: 1996–2002
% changeState 1996–1997 1997–1998 1998–1999 1999–2000 2000–2001 2001–2002 1996–2002
Alabama $1,359 $1,343 $1,521 $1,486 $1,672 $1,990 46.4%
Alaska $1,850 $1,900 $1,968 $2,028 $1,674 $1,717 -7.2%
Arizona $783 $820 $857 $901 $924 $962 22.9%
Arkansas $937 $942 $981 $1,059 $1,158 $1,314 40.3%
California $371 $379 $396 $317 $315 $315 -15.1%
Colorado $1,395 $1,449 $1,574 $1,548 $1,655 $1,685 20.8%
Connecticut $1,722 $1,814 $1,814 $1,892 $1,868 $1,889 9.7%
Delaware $1,330 $1,380 $1,440 $1,616 $1,680 $1,800 35.3%
Florida $1,151 $1,252 $1,307 $1,330 $1,438 $1,494 29.8%
Georgia $1,093 $1,153 $1,206 $1,384 $1,260 $1,293 18.3%
Hawaii $789 $956 $1,004 $1,052 $1,066 $1,067 35.2%
Idaho $1,043 $1,102 $1,186 $1,253 $1,316 $1,410 35.2%
Illinois $1,290 $1,347 $1,424 $1,502 $1,532 $1,569 21.6%
Indiana $2,331 $2,415 $2,124 $2,127 $2,108 $2,121 -9.0%
Iowa $1,845 $1,885 $1,982 $2,060 $2,141 $2,362 28.0%
Kansas $1,248 $1,285 $1,343 $1,310 $1,378 $1,441 15.4%
Kentucky $1,215 $1,232 $1,240 $1,318 $1,342 $1,561 28.5%
Louisiana $1,047 $1,080 $925 $876 $935 $1,009 -3.6%
Maine $2,545 $2,594 $2,837 $2,586 $2,594 $2,642 3.8%
Maryland $2,102 $2,171 $2,250 $2,262 $2,301 $2,244 6.8%
Massachusetts $2,341 $2,221 $2,122 $1,926 $1,894 $1,946 -16.9%
Michigan $1,576 $1,618 $1,680 $1,747 $1,743 $1,780 13.0%
Minnesota $2,187 $2,245 $2,375 $2,359 $2,507 $2,746 25.6%
Mississippi $954 $958 $968 $968 $1,138 $1,362 42.7%
Missouri $1,281 $1,311 $1,411 $1,443 $1,472 $1,498 17.0%
Montana $1,610 $1,713 $1,891 $1,961 $2,004 $2,159 34.1%
Academic Year

145National Profile of Community Colleges: Trends & Statistics 4TH EDITION
% changeState 1996–1997 1997–1998 1998–1999 1999–2000 2000–2001 2001–2002 1996–2002
Nebraska $1,227 $1,267 $1,350 $1,372 $1,421 $1,498 22.1%
Nevada $1,010 $1,106 $1,170 $1,208 $1,369 $1,410 39.6%
New Hampshire $2,858 $3,177 $3,706 $3,744 $3,933 $4,324 51.3%
New Jersey $1,949 $2,033 $2,054 $2,149 $2,295 $2,236 14.7%
New Mexico $659 $679 $648 $823 $876 $921 39.7%
New York $2,519 $2,576 $2,543 $2,554 $2,562 $2,584 2.6%
North Carolina $581 $584 $585 $778 $896 $1,014 74.6%
North Dakota $1,783 $1,798 $1,841 $1,893 $1,902 $2,090 17.2%
Ohio $2,335 $2,388 $2,457 $2,377 $2,292 $2,373 1.6%
Oklahoma $1,268 $1,285 $1,193 $1,239 $1,253 $1,214 -4.3%
Oregon $1,526 $1,573 $1,629 $1,584 $1,637 $1,722 12.9%
Pennsylvania $2,013 $2,098 $2,164 $2,115 $2,287 $2,369 17.7%
Rhode Island $1,736 $1,746 $1,746 $1,746 $1,806 $1,854 6.8%
South Carolina $1,114 $1,162 $1,220 $1,338 $1,467 $1,787 60.4%
South Dakota $3,430 $3,930 $2,627 $2,747 $2,857 $2,964 -13.6%
Tennessee $1,047 $1,133 $1,238 $1,314 $1,441 $1,652 57.8%
Texas $791 $820 $890 $895 $929 $981 24.0%
Utah $1,390 $1,439 $1,459 $1,500 $1,571 $1,679 20.8%
Vermont $2,516 $2,616 $2,716 $2,846 $3,004 $3,148 25.1%
Virginia $1,466 $1,475 $1,405 $1,140 $1,132 $1,131 -22.8%
Washington $1,447 $1,516 $1,591 $1,649 $1,758 $1,885 30.3%
West Virginia $1,373 $1,404 $1,473 $1,579 $1,661 $1,661 21.0%
Wisconsin $1,947 $2,061 $2,115 $2,118 $2,262 $2,310 18.6%
Wyoming $1,048 $1,157 $1,235 $1,320 $1,440 $1,490 42.1%
All states $1,276 $1,318 $1,323 $1,336 $1,333 $1,379 8.1%
Academic Year
Source: Snyder (2003)

146 American Association of Community Colleges
Table 5.9Average In-State Tuition and Fees for Public Community Colleges,by State: 1996–2002 (in constant 2002 dollars)
% changeState 1996–1997 1997–1998 1998–1999 1999–2000 2000–2001 2001–2002 1996–2002
Alabama $1,527 $1,479 $1,649 $1,572 $1,710 $1,990 30.3%
Alaska $2,079 $2,092 $2,134 $2,146 $1,712 $1,717 -17.4%
Arizona $880 $903 $929 $953 $944 $962 9.3%
Arkansas $1,053 $1,037 $1,063 $1,121 $1,184 $1,314 24.8%
California $417 $417 $429 $335 $322 $315 -24.5%
Colorado $1,568 $1,596 $1,706 $1,638 $1,692 $1,685 7.5%
Connecticut $1,935 $1,998 $1,967 $2,002 $1,910 $1,889 -2.4%
Delaware $1,495 $1,520 $1,561 $1,710 $1,718 $1,800 20.4%
Florida $1,294 $1,379 $1,417 $1,407 $1,471 $1,494 15.5%
Georgia $1,228 $1,270 $1,308 $1,464 $1,289 $1,293 5.3%
Hawaii $887 $1,053 $1,088 $1,113 $1,091 $1,067 20.3%
Idaho $1,172 $1,214 $1,286 $1,325 $1,346 $1,410 20.3%
Illinois $1,450 $1,483 $1,543 $1,590 $1,567 $1,569 8.2%
Indiana $2,620 $2,660 $2,303 $2,251 $2,156 $2,121 -19.0%
Iowa $2,074 $2,076 $2,149 $2,180 $2,189 $2,362 13.9%
Kansas $1,403 $1,415 $1,456 $1,387 $1,409 $1,441 2.7%
Kentucky $1,365 $1,357 $1,344 $1,395 $1,372 $1,561 14.3%
Louisiana $1,177 $1,189 $1,003 $927 $956 $1,009 -14.2%
Maine $2,860 $2,857 $3,076 $2,736 $2,653 $2,642 -7.6%
Maryland $2,362 $2,391 $2,440 $2,394 $2,353 $2,244 -5.0%
Massachusetts $2,631 $2,446 $2,301 $2,038 $1,937 $1,946 -26.0%
Michigan $1,771 $1,782 $1,822 $1,849 $1,782 $1,780 0.5%
Minnesota $2,458 $2,472 $2,575 $2,496 $2,564 $2,746 11.7%
Mississippi $1,072 $1,055 $1,050 $1,024 $1,164 $1,362 27.0%
Missouri $1,440 $1,444 $1,530 $1,527 $1,505 $1,498 4.1%
Montana $1,809 $1,886 $2,050 $2,075 $2,049 $2,159 19.3%
Academic Year

147National Profile of Community Colleges: Trends & Statistics 4TH EDITION
% changeState 1996–1997 1997–1998 1998–1999 1999–2000 2000–2001 2001–2002 1996–2002
Nebraska $1,379 $1,395 $1,464 $1,451 $1,453 $1,498 8.6%
Nevada $1,135 $1,218 $1,269 $1,279 $1,400 $1,410 24.2%
New Hampshire $3,212 $3,499 $4,018 $3,961 $4,022 $4,324 34.6%
New Jersey $2,190 $2,239 $2,227 $2,274 $2,347 $2,236 2.1%
New Mexico $741 $748 $702 $871 $896 $921 24.3%
New York $2,831 $2,837 $2,757 $2,702 $2,620 $2,584 -8.7%
North Carolina $653 $643 $634 $823 $916 $1,014 55.3%
North Dakota $2,004 $1,980 $1,997 $2,003 $1,945 $2,090 4.3%
Ohio $2,624 $2,630 $2,664 $2,515 $2,344 $2,373 -9.6%
Oklahoma $1,425 $1,415 $1,294 $1,311 $1,281 $1,214 -14.8%
Oregon $1,715 $1,732 $1,766 $1,676 $1,674 $1,722 0.4%
Pennsylvania $2,262 $2,310 $2,347 $2,237 $2,339 $2,369 4.7%
Rhode Island $1,951 $1,923 $1,893 $1,847 $1,847 $1,854 -5.0%
South Carolina $1,252 $1,280 $1,323 $1,416 $1,500 $1,787 42.7%
South Dakota $3,855 $4,328 $2,849 $2,907 $2,922 $2,964 -23.1%
Tennessee $1,177 $1,248 $1,343 $1,391 $1,474 $1,652 40.4%
Texas $889 $903 $965 $947 $950 $981 10.3%
Utah $1,562 $1,585 $1,582 $1,587 $1,607 $1,679 7.5%
Vermont $2,828 $2,881 $2,945 $3,011 $3,072 $3,148 11.3%
Virginia $1,648 $1,624 $1,523 $1,206 $1,158 $1,131 -31.3%
Washington $1,626 $1,670 $1,725 $1,745 $1,798 $1,885 15.9%
West Virginia $1,543 $1,546 $1,597 $1,670 $1,699 $1,661 7.7%
Wisconsin $2,188 $2,270 $2,293 $2,241 $2,313 $2,310 5.6%
Wyoming $1,178 $1,274 $1,339 $1,397 $1,473 $1,490 26.5%
All states $1,434 $1,451 $1,434 $1,420 $1,370 $1,379 -3.8%
Academic Year
Source: Snyder (1999, 2003); Snyder & Hoffman (2001)

148 American Association of Community Colleges
Table 5.10Percentage of Federal Student Aid Received by PublicCommunity Colleges: 1991–2003
Source: College Board (2004, Table 5)
Stafford StaffordCampus- subsidized unsubsidized
Academic Year Pell grant based aid loans loans
1991–1992 24.3% 9.3% 6.4% —
1992–1993 25.7% 9.7% 6.3% 6.7%
1993–1994 30.0% 9.6% 6.1% 4.3%
1994–1995 32.7% 9.7% 5.9% 4.9%
1995–1996 32.7% 9.6% 5.8% 5.1%
1996–1997 33.0% 9.8% 5.8% 5.0%
1997–1998 32.8% 9.9% 5.8% 5.0%
1998–1999 32.4% 9.9% 5.7% 4.7%
1999–2000 33.4% 9.8% 5.5% 4.4%
2000–2001 33.7% 9.8% 5.4% 4.4%
2001–2002 35.0% 9.8% — —
2002–2003 34.7% 9.0% 6.3% 5.3%
10-year change 9.0% -0.7% 0.0% 5.3%
Federal Student Aid

149National Profile of Community Colleges: Trends & Statistics 4TH EDITION
Figure 5.4Public Community College Share of Pell Grant Dollars:1991–2003
5%
10%
15%
20%
25%
30%
35%
40%
1991
–199
2
1992
–199
3
1993
–199
4
1994
–199
5
1995
–199
6
1996
–199
7
1997
–199
8
1998
–199
9
1999
–200
0
2000
–200
1
2001
–200
2
2002
–200
3
Academic year
Perc
enta
ge o
f gr
ant
dolla
rs
Source: College Board (2004)

150 American Association of Community Colleges
Figure 5.5Authorized and Actual Maximum Pell Grant Awards: 1973–2004
$2,000
$1,000
$3,000
$4,000
$5,000
$6,000
$7,000
1976
–197
7
1975
–197
6
1974
–197
5
1973
–197
4
1982
–198
3
1989
–199
0
1995
–199
6
1999
–200
0
2000
–200
1
2001
–200
2
2002
–200
3
2003
–200
4
1997
–199
8
1996
–199
7
1998
–199
9
1992
–199
3
1993
–199
4
1994
–199
5
1990
–199
1
1991
–199
2
1985
–198
6
1987
–198
8
1986
–198
7
1988
–198
9
1983
–198
4
1984
–198
5
1979
–198
0
1980
–198
1
1981
–198
2
1977
–197
8
1978
–197
9
Cons
tant
200
3 do
llars
Academic year
Source: College Board (2004)
Authorized
Actual

151National Profile of Community Colleges: Trends & Statistics 4TH EDITION
Table 5.11Authorized and Actual Maximum Pell Grant Awards: 1973–2004
Source: College Board (2004, Table 8)
Academic Year Authorized Actual Authorized Actual
1973–1974 $1,400 $452 $5,739 $1,853
1974–1975 $1,400 $1,050 $5,207 $3,905
1975–1976 $1,400 $1,400 $4,727 $4,727
1976–1977 $1,400 $1,400 $4,450 $4,450
1977–1978 $1,800 $1,400 $5,391 $4,193
1978–1979 $1,800 $1,600 $5,029 $4,470
1979–1980 $1,800 $1,800 $4,553 $4,553
1980–1981 $1,800 $1,750 $4,011 $3,899
1981–1982 $1,900 $1,670 $3,813 $3,352
1982–1983 $2,100 $1,800 $3,932 $3,370
1983–1984 $2,300 $1,800 $4,162 $3,257
1984–1985 $2,500 $1,900 $4,345 $3,302
1985–1986 $2,600 $2,100 $4,360 $3,521
1986–1987 $2,600 $2,100 $4,259 $3,440
1987–1988 $2,300 $2,100 $3,658 $3,340
1988–1989 $2,500 $2,200 $3,818 $3,360
1989–1990 $2,700 $2,300 $3,937 $3,354
1990–1991 $2,900 $2,300 $4,024 $3,191
1991–1992 $3,100 $2,400 $4,101 $3,175
1992–1993 $3,100 $2,400 $3,981 $3,082
1993–1994 $3,700 $2,300 $4,612 $2,867
1994–1995 $3,900 $2,300 $4,737 $2,794
1995–1996 $4,100 $2,340 $4,844 $2,765
1996–1967 $4,300 $2,470 $4,942 $2,839
1997–1998 $4,500 $2,700 $5,039 $3,024
1998–1999 $4,500 $3,000 $4,959 $3,306
1999–2000 $4,500 $3,125 $4,872 $3,383
2000–2001 $4,800 $3,300 $5,028 $3,457
2001–2002 $5,100 $3,750 $5,179 $3,808
2002–2003 $5,100 $4,000 $5,100 $4,000
2003–2004 $5,100 $4,050 $5,100 $4,050
Constant 2003 DollarsCurrent Dollars

152 American Association of Community Colleges
Table 5.12Percentage of Full-Time Undergraduates Who Received Grants,by Source of Grant: 1989–1990 and 1999–2000
% Average % AverageCollege Type receiving amount receiving amount
Pell grant
Public community college 20% $1,700 24% $2,200a
Public 4-year college 21% $2,100 22% $2,200
Private, nonprofit 4-year college 24% $2,100 23% $2,100
Private, for-profit less-than-4-year college 49% $2,200 51% $2,200
State grant
Public community college 11% $1,000 18%a $1,200
Public 4-year college 14% $1,400 21%a $2,000a
Private, nonprofit 4-year college 25% $2,500 26% $2,700
Private, for-profit less-than-4-year college 9% $2,800 18%a $1,900a
Institutional grant
Public community college 10% $900 16%a $900
Public 4-year college 15% $2,400 24%a $2,900a
Private, nonprofit 4-year college 49% $4,900 65%a $7,600a
Private, for-profit less-than-4-year college 6% $2,100 10% $1,000a
Source: Choy (2004)
Note. Numbers are expressed in constant 1999 dollars.
aStatistically significant change between academic years, 1989–2000.
1989–1990 1999–2000

153National Profile of Community Colleges: Trends & Statistics 4TH EDITION
Table 5.13Percentage of Undergraduates Who Received Financial Aid, byDependency Status: 2003–2004
Loans(excluding Work- Federal Federal Federal State
College Type and Dependency Status All aid Grants PLUS) study aid grants loans aidPublic community collegeDependent 42.7% 35.4% 12.3% 3.7% 28.0% 19.7% 11.3% 13.0%Independent, no dependent, unmarried 45.0% 36.8% 13.6% 3.4% 26.9% 19.5% 13.2% 10.4%Independent, no dependent, married 40.3% 30.9% 7.3% 2.1% 12.5% 6.6% 6.6% 7.2%Independent with dependents 54.0% 48.6% 12.4% 3.7% 36.2% 33.1% 11.8% 13.8%Total 46.8% 39.8% 12.1% 3.5% 29.2% 23.1% 11.3% 12.3%Public 4-year collegeDependent 69.2% 50.7% 44.7% 10.0% 51.9% 21.8% 42.9% 22.2%Independent, no dependent, unmarried 69.2% 52.5% 49.0% 6.4% 55.4% 35.3% 47.5% 15.3%Independent, no dependent, married 58.2% 38.6% 36.7% 4.6% 41.8% 18.3% 35.0% 9.3%Independent with dependents 70.1% 60.9% 42.7% 5.2% 52.9% 43.5% 41.4% 16.5%Total 68.6% 51.7% 44.5% 8.5% 51.9% 26.6% 42.8% 19.6%Independent nonprofit 4-year collegeDependent 85.1% 77.7% 60.3% 30.3% 66.5% 24.8% 58.1% 25.0%Independent, no dependent, unmarried 78.5% 63.7% 54.0% 9.6% 59.2% 31.8% 51.7% 16.8%Independent, no dependent, married 77.1% 61.3% 42.9% 5.9% 49.1% 18.5% 42.1% 10.3%Independent with dependents 82.6% 69.6% 49.3% 3.8% 57.4% 39.7% 48.1% 22.4%Total 83.3% 73.5% 56.3% 21.1% 62.8% 28.2% 54.4% 22.6%Proprietary collegeDependent 85.2% 59.7% 72.6% 4.1% 80.0% 48.4% 69.9% 12.4%Independent, no dependent, unmarried 89.7% 56.3% 77.6% 1.8% 82.2% 39.9% 75.8% 9.9%Independent, no dependent, married 84.3% 45.7% 65.4% 1.3% 69.0% 21.9% 64.6% 8.0%Independent with dependents 92.0% 76.9% 73.4% 1.7% 83.9% 66.7% 72.2% 8.7%Total 89.2% 65.7% 73.4% 2.3% 81.4% 52.8% 71.8% 9.8%Multiple collegesa
Dependent 64.9% 44.3% 43.6% 9.4% 51.0% 22.7% 41.8% 12.3%Independent, no dependent, unmarried 67.3% 47.3% 45.5% 6.6% 52.4% 28.4% 44.0% 9.8%Independent, no dependent, married 57.0% 36.3% 30.4% 1.8% 35.2% 12.5% 29.5% 7.9%Independent with dependents 71.2% 57.8% 42.7% 3.7% 53.1% 40.2% 41.1% 9.5%Total 66.3% 47.6% 42.7% 7.0% 50.6% 27.3% 41.1% 10.9%All collegesDependent 63.8% 50.3% 38.1% 11.2% 47.8% 22.8% 36.4% 18.6%Independent, no dependent, unmarried 61.8% 46.9% 37.0% 4.9% 46.1% 28.0% 35.8% 12.4%Independent, no dependent, married 53.3% 37.5% 24.7% 3.0% 29.7% 12.4% 23.7% 8.2%Independent with dependents 65.9% 57.2% 31.3% 3.7% 48.7% 40.6% 30.4% 14.2%Total 63.2% 50.7% 35.0% 7.5% 46.4% 27.6% 33.7% 15.6%
Source: NCES (2005)aStudents who attended more than one college in the 2003–2004 academic year.
Total Aid Received

154 American Association of Community Colleges
Table 5.14Amount of Financial Aid Received by Undergraduates, byDependency Status: 2003–2004
Loans(excluding Work- Federal Federal Federal State
College Type and Dependency Status Total aid Grants PLUS) study aid grants loans aidPublic community collegeDependent $3,154 $2,415 $2,853 $1,915 $2,923 $2,334 $2,460 $1,206Independent, no dependent, unmarried $3,424 $1,866 $4,436 $2,194 $3,764 $2,022 $4,212 $1,076Independent, no dependent, married $2,244 $1,399 $4,072 $1,700 $3,163 $1,815 $3,808 $1,086Independent with dependents $3,291 $2,194 $4,022 $2,183 $3,544 $2,261 $3,936 $1,041Total $3,177 $2,161 $3,638 $2,047 $3,331 $2,240 $3,412 $1,116Public 4-year collegeDependent $7,645 $4,365 $4,973 $2,038 $6,097 $2,698 $4,263 $2,512Independent, no dependent, unmarried $8,201 $3,432 $6,988 $2,217 $7,674 $2,569 $6,750 $2,022Independent, no dependent, married $6,501 $2,794 $6,797 $2,006 $6,776 $2,262 $6,736 $2,184Independent with dependents $7,359 $3,340 $6,584 $1,876 $7,614 $2,754 $6,489 $1,865Total $7,618 $3,988 $5,593 $2,042 $6,584 $2,669 $5,078 $2,372Independent nonprofit 4-year collegeDependent $15,616 $9,236 $6,734 $1,807 $7,983 $2,650 $4,647 $3,092Independent, no dependent, unmarried $10,382 $5,406 $8,088 $1,989 $8,023 $2,599 $7,165 $2,422Independent, no dependent, married $8,037 $4,288 $7,449 $1,890 $6,994 $2,626 $6,807 $2,458Independent with dependents $8,182 $4,367 $6,873 $1,958 $7,385 $2,595 $6,460 $2,288Total $13,142 $7,676 $6,943 $1,823 $7,831 $2,626 $5,349 $2,858Proprietary collegeDependent $10,037 $3,780 $6,010 $2,361 $7,962 $2,594 $4,610 $3,011Independent, no dependent, unmarried $8,876 $2,922 $7,756 $2,589 $7,233 $2,362 $6,554 $2,510Independent, no dependent, married $8,496 $3,220 $7,872 ns $7,276 $2,290 $6,956 $3,670Independent with dependents $8,156 $3,197 $6,473 $2,642 $7,339 $2,627 $6,001 $2,840Total $8,767 $3,275 $6,759 $2,515 $7,458 $2,567 $5,875 $2,878Multiple collegesa
Dependent $7,395 $4,114 $4,787 $1,738 $6,051 $2,600 $4,060 $2,128Independent, no dependent, unmarried $7,507 $2,890 $7,243 $2,118 $7,284 $2,458 $6,915 $1,597Independent, no dependent, married $5,867 $2,281 $7,444 ns $6,699 $2,221 $6,972 $1,146Independent with dependents $6,826 $2,937 $6,493 $2,549 $7,006 $2,582 $6,253 $1,499Total $7,166 $3,462 $5,764 $1,912 $6,538 $2,559 $5,245 $1,864All collegesDependent $8,594 $5,163 $5,282 $1,901 $6,065 $2,573 $4,195 $2,350Independent, no dependent, unmarried $7,023 $3,073 $6,949 $2,170 $6,600 $2,366 $6,375 $1,768Independent, no dependent, married $5,345 $2,485 $6,801 $1,918 $6,136 $2,203 $6,404 $1,820Independent with dependents $5,786 $2,899 $6,032 $2,143 $5,840 $2,484 $5,765 $1,589Total $7,350 $4,018 $5,816 $1,961 $6,085 $2,492 $5,055 $2,071
Source: NCES (2005)
aStudents who attended more than one college in the 2003–2004 academic year.
Total Aid Received

155National Profile of Community Colleges: Trends & Statistics 4TH EDITION
Table 5.15Average Tuition for Full-Time Community College Students, byDependency Status and Family Income: Selected AcademicYears, 1989–2004
Dependency Status and Family Income 1989–1990 1992–1993 1995–1996 1999–2000 2003–2004 1989–1990 1992–1993 1995–1996 1999–2000 2003–2004Dependency statusDependent students $1,200 $1,500 $1,600 $1,700 $2,000 $900 $1,100 $1,100 $1,100 $1,300Independent students $1,300 $1,500 $1,700 $1,600 $1,900 $500 $600 $800 $700 $800Unmarried, no dependents $1,300 $1,500 $2,000 $1,700 $1,900 $700 $700 $1,400 $900 $1,000Married, not dependents $1,000 $1,600 $2,100 $1,600 $2,200 $700 $1,100 $1,500 $1,100 $1,500Unmarried with dependents $1,200 $1,500 $1,500 $1,400 $1,800 $100 $300 $400 $400 $500Married, with dependents $1,300 $1,600 $1,500 $1,600 $2,000 $600 $600 $400 $600 $800Family incomeDependent students
Lowest quarter $1,000 $1,500 $1,500 $1,700 $1,800 $300 $500 $500 $600 $500Lower middle quarter $1,300 $1,500 $1,600 $1,900 $2,000 $1,000 $1,100 $1,100 $1,300 $1,300Upper middle quarter $1,300 $1,500 $1,700 $1,800 $2,100 $1,100 $1,400 $1,500 $1,500 $1,700Highest quarter $1,200 $1,500 $1,600 $1,600 $2,100 $1,100 $1,400 $1,400 $1,400 $1,800
Independent studentsLowest quarter $1,300 $1,500 $1,700 $1,500 $1,800 $400 $300 $500 $400 $500Lower middle quarter $1,300 $1,700 $1,800 $1,600 $1,900 $600 $900 $1,000 $700 $700Upper middle quarter $1,100 $1,300 $1,500 $1,700 $2,000 $500 $800 $800 $1,000 $1,100Highest quarter $1,200 $1,600 $1,900 $1,400 $2,100 $900 $1,200 $1,500 $1,200 $1,800
Total, all students $1,200 $1,500 $1,600 $1,700 $2,000 $700 $900 $1,000 $1,000 $1,100
Source: NCES (2004j, 2005)
Note. Numbers are expressed in constant 2003 dollars.
aIncludes all tuition and fees charged by the college. Averages include fees charged to out-of-district and out-of-state students.
bTuition and fees minus grant aid received. Where grant aid was greater than tuition and fees,the value was set to zero.
Average Tuitiona Average Net Tuitionb

156 American Association of Community Colleges
Table 5.16Average Price of Attendance and Expected Family Contributionfor Full-Time Community College Students, by Dependency Statusand Family Income: Selected Academic Years, 1989–2004
Dependency Status and Family Income 1989–1990 1992–1993 1995–1996 1999–2000 2003–2004 1989–1990 1992–1993 1995–1996 1999–2000 2003–2004
Dependency status
Dependent students $8,100 $8,400 $8,200 $9,400 $9,800 $7,200 $7,500 $7,000 $7,700 $7,800
Independent students $10,600 $9,500 $9,900 $11,000 $11,200 $7,900 $7,000 $7,300 $7,800 $7,300
Unmarried, no dependents $10,300 $9,600 $10,200 $10,900 $11,000 $8,100 $7,600 $7,800 $8,100 $7,500
Married, no dependents $10,000 $9,600 $10,000 $11,200 $12,000 $8,600 $8,100 $8,400 $9,700 $9,900
Unmarried, with dependents $10,900 $9,300 $9,700 $10,700 $10,900 $6,200 $5,700 $6,700 $7,000 $6,200
Married, with dependents $11,000 $9,600 $9,900 $11,200 $11,600 $8,500 $6,700 $6,800 $7,300 $7,400
Family income
Dependent students
Lowest quarter $8,000 $8,300 $7,700 $9,200 $9,500 $5,900 $6,300 $5,300 $6,200 $6,000
Lower middle quarter $8,400 $8,100 $8,300 $9,500 $9,800 $7,600 $7,200 $7,300 $8,000 $7,900
Upper middle quarter $8,200 $9,000 $8,400 $9,500 $10,100 $7,800 $8,600 $7,800 $8,700 $8,800
Highest quarter $7,600 $8,300 $8,200 $9,600 $10,000 $7,400 $8,100 $7,900 $8,900 $8,900
Independent students
Lowest quarter $10,500 $9,500 $9,800 $10,800 $11,000 $7,100 $6,200 $6,500 $6,600 $6,200
Lower middle quarter $10,700 $9,700 $10,400 $10,800 $11,200 $8,300 $7,700 $7,200 $7,400 $6,700
Upper middle quarter $10,700 $9,200 $9,900 $11,500 $11,400 $8,200 $7,100 $7,800 $9,300 $8,000
Highest quarter $10,300 $9,600 $9,500 $11,200 $11,700 $9,000 $8,600 $8,700 $10,000 $10,200
Total, all students $9,100 $8,800 $8,800 $10,000 $10,400 $7,500 $7,300 $7,100 $7,800 $7,600
Average Price of Attendancea Average Net Price of Attendanceb

157National Profile of Community Colleges: Trends & Statistics 4TH EDITION
Source: NCES (2005); Wei, Li, & Berkner (2004)
Note. Numbers are expressed in constant 2003 dollars.
aAverage price of attendance includes tuition, fees, books, supplies, room and board, transportation, and personal expenses, based on institutionally estimated budgets.bAverage net price of attendance equals price of attendance minus grant and loan aidreceived. Includes students who received no financial aid.cFederal expected family contribution is the amount students and families are expected tocontribute to the price of attendance at a postsecondary institution, based on federal needsanalysis.
Dependency Status and Family Income 1989–1990 1992–1993 1995–1996 1999–2000 2003–2004
Dependency status
Dependent students $10,200 $9,800 $8,100 $9,600 $10,200
Independent students $3,800 $3,600 $4,700 $4,300 $3,200
Unmarried, no dependents $7,300 $5,900 $5,000 $4,500 $3,300
Married, no dependents $2,500 $4,000 $10,300 $12,000 $11,900
Unmarried, with dependents $700 $500 $1,500 $1,100 $700
Married, with dependents $2,200 $2,700 $4,600 $3,900 $3,200
Family income
Dependent students
Lowest quarter $3,200 $2,800 $1,200 $1,200 $1,000
Lower middle quarter $7,200 $6,400 $4,400 $6,100 $5,400
Upper middle quarter $13,200 $8,600 $10,500 $12,200 $12,000
Highest quarter $21,100 $27,000 $19,900 $26,600 $29,700
Independent students
Lowest quarter $1,900 $1,600 $500 $500 $300
Lower middle quarter $4,200 $3,600 $2,200 $2,200 $1,300
Upper middle quarter $3,600 $3,700 $5,600 $6,600 $4,400
Highest quarter $9,100 $9,600 $18,400 $17,500 $14,100
Total, all students $7,700 $7,300 $7,000 $7,600 $7,600
Average Expected Family Contributionc

158 American Association of Community Colleges
Figure 5.6Average Financial Need of Full-Time, Full-Year DependentUndergraduates: 1989–1990 and 1999–2000
$4,000
$2,000
$6,000
$8,000
$10,000
$12,000
$14,000
$16,000
Public communitycollege
Private nonprofit4-year college
Public 4-yearcollege
Private nonprofitcommunity college
Aver
age
need
, in
cons
tant
199
9 do
llars
College type
Source: Choy (2004)
Note. Amounts reported for 1999–2000 represent statistically significant change from 1989–1990.
■ 1989–1990■ 1999–2000

159National Profile of Community Colleges: Trends & Statistics 4TH EDITION
Over the past 100 years,community colleges haveweathered many challenges
in their evolution from small collegeswith limited reach and missions cen-tered on transfer and vocationaltraining to the large, sophisticatededucational enterprises of today.Now, at the beginning of a secondcentury of service, they are evolvinginto mature organizations with com-prehensive missions and a clearly rec-ognized position in the Americaneducation system. And they arebeing recognized by national andcommunity leaders as innovative col-leges that are critical to the economicand cultural well-being of their com-munities and the nation as a whole.These colleges are located squarely atthe center of the continuum thatbegins with early childhood educa-tion and K–12 schools and extendsthrough college, graduate programs,and lifelong learning.
Moreover, in an era of global-ization when American competitive-ness in world markets depends on aworkforce educated to perform
effectively in a knowledge economy,community colleges play a criticalrole. They develop the nation’shuman capital, thus contributingdirectly to national productivity,raising incomes and tax revenues,and building economic capacity.With most modern jobs requiring atleast some college education as wellas current skills, these engines ofeconomic growth help to close theparticipation gap by ensuring thatpeople of all social levels—from newimmigrants to laid off workers topeople who already hold advanceddegrees—have access to job trainingso they can become productivemembers of American society. To agreat extent, then, as these people’scolleges go, so goes the nation.
The mature state of today’s com-munity colleges presents a momentof choice. In the life of any organiza-tion, reaching maturity requireschoosing a course of action: Eithercontinue to do what was successfulin the past and hope to avoid stagna-tion, or respond to new environmen-tal conditions with creativity and
innovation and perhaps becomesomething different in the process.The choice community colleges willmake depends on a number of issuesthat can be sorted into several broadcategories: new student demograph-ics, teaching and learning, workforcedevelopment, credentialing, funding,and public policy.
The changing face of the nationis also the changing face of commu-nity colleges, as people of all back-grounds and ages use these collegesto meet their education goals. By2015, the traditional college-agepopulation is expected to grow from26 million to 30 million, withHispanics accounting for 49% of theincrease. The states of California,Texas, New York, Florida, andGeorgia will experience the highestgrowth in this age group. Because oftheir position as a preferred entrypoint into higher education forHispanics and other students ofcolor, community colleges can expectto see higher absolute numbers aswell as more diversity in their stu-dent bodies. At the same time,
A Look at the FutureVI

160 American Association of Community Colleges
greater numbers of adults—includingrecent immigrants, international stu-dents, and senior citizens—will alsoseek their services. In the nextdecade, community colleges canexpect an overall enrollment increaseof about 13%. However, budgetchallenges that have plagued commu-nity colleges for decades have alreadyresulted in the open door closing forsome students in California andFlorida. Community colleges muststrive to find alternatives to ensurethat access to higher education isavailable to those who want it.
In conjunction with changingstudent demographics at communitycolleges, the need for basic skillsinstruction and remediation will con-tinue to be a controversial issue. Thecommitment to the open door pre-sumes a commitment to provide thesupport students need to succeed,and this often means bringing theirreading, writing, and mathematicalskills up to a point where they canmanage college studies. Communitycolleges have readily assumed the taskof providing this type of instructionbecause they understand that persist-ence and success depend on the req-uisite skills foundation. This stancehas placed considerable stress onavailable resources that continue todecrease as other social needs grow.Therefore, the coming years providean optimal time for community col-leges to make stronger connections
with K–12 to better align curriculumto ensure that exiting students arebetter prepared for college-levelwork. Acknowledging that postsec-ondary education or training is essen-tial and providing appropriate fund-ing to ensure universal access, be itinto remedial academic work, work-force training, or general education isan urgent matter that communitycollege leaders and policymakersmust address.
The core mission of communitycolleges will continue to be teachingand learning, and the needs of anew mix of students combined withthe emergence of new technologieswill certainly affect how those fun-damental processes are carried out.In fact, many of the instructionaldevelopments discussed in thischapter are already under way.Within the context of the learningcollege concept—whether or notcolleges formally adopt thisapproach—greater emphasis will beplaced on multiple instructionaldelivery modes. Faculty will evolvefrom traditional lecturers into learn-ing facilitators who use new tech-nologies to personalize instructionfor each student. Active and collabo-rative learning will be the norm, andoutcomes assessment will be a partof each learning experience. Thelearning environment will be all-encompassing, including not just theclassroom and college campus, but
the work and living spaces of stu-dents and even cyberspace. Today,the general population’s access tomassive amounts of information viathe Internet has transformed thelearning enterprise, and full imple-mentation of wireless technology inthe near future will enhance instruc-tional capacity even more. Supportservices will also continue to evolve,particularly as the Web and newtechnologies expand the ways theseservices can be delivered.
Distributed or distance educa-tion can be expected to grow expo-nentially as more students combinethis format with face-to-face courses.Distance education has alreadyerased some of the traditionalboundaries observed by higher edu-cation in the past. In the future theglobal reach of local colleges will bea reality as people around the worldselect courses on the basis of theirimmediate education needs ratherthan proximity to a college. The lowcost of community colleges willmake this option even more attrac-tive. Web-based instruction will alsobe used increasingly in continuingeducation for students who wantnoncredit, subject-specific instruc-tion to upgrade job skills and foremployers needing training for theiremployees. The continued expan-sion of distance education willrequire that colleges have state-of-the-art equipment, sufficient techni-

161National Profile of Community Colleges: Trends & Statistics 4TH EDITION
cal support, and appropriate securitymeasures in place. Also, every facul-ty member will have to be highlyskilled in developing and deliveringinstruction by this means. Finally,local and state policies regardingfunding and tuition structures willneed to be reassessed because geo-graphic borders are no longer mean-ingful delineators.
In a world where workforcedevelopment has become the primarymandate for all higher educationinstitutions, community colleges willcontinue to stand in the vanguard.Their ability to rapidly design andimplement curriculums for emergingcareer fields has always given them acompetitive edge over other educa-tion providers. For that reason,courses in fields such as bioterrorism,complementary health services, andnanotechnology can all be found atcommunity colleges today. The col-leges can be expected to continue thisrapid curricular response in thefuture as societal and technologicaldevelopments lead to the creation ofcareer fields unimagined today.
The accelerating pace of modernlife has caused great pressure toreduce the time needed for work-force preparation. In order to mini-mize time in training, communitycolleges must resolve the disconnec-tions that exist in American educa-tion today. Their current efforts toestablish career pathways beginning
in high school and continuing withseamless transfer to the baccalaure-ate and graduate levels are a goodstart, but much remains to be done.Likewise, there are many examplesof two- and four-year colleges work-ing together to provide a seamlesstransition from one to the other.These include locating four-yearcampuses at two-year colleges so thatworking adults can finish a bache-lor’s degree without moving, design-ing common course numbering sys-tems between colleges, and imple-menting articulation agreements thatguarantee the transfer of credits.
Although many traditionalboundaries have disappeared with theadvent of the Internet and the prac-tices just described, there is still asense that the various education sec-tors are operating independently ofeach other. For that reason, studentsmay graduate from high school with-out the requisite skills for collegework, and many community collegestudents still have difficulty transfer-ring all the credits they have earnedto a four-year college or university.High school students in dual-enroll-ment programs may find that thecourses are not transferable becausebaccalaureate-granting colleges ques-tion the academic rigor of such stud-ies. People who engage in noncreditcontinuing education courses andprofessional development workshops,or who study at a for-profit college,
may not be able to count these stud-ies toward a desired degree.
Because many of these studentsarrive first at the doors of communi-ty colleges, these colleges will needto take leadership in bringingtogether all parties to resolve theproblem of transferring for-creditand noncredit learning experiencesand applying these to degreerequirements. Together, K–12 edu-cators and representatives from two-and four-year colleges, for-profiteducation providers, corporations,and others will need to design aneducation network in which alltypes of learning activities can bevalidated and students can movereadily among sectors to achievetheir educational goals. Discussionsabout academic credentialing arealready occurring, and there aremany proponents of a national tran-script bank where students candeposit information on any learningactivity they undertake over a life-time. Students could then give per-mission to educators, employers,and others who need access to thecomplete learning record.
Changing public policy will bethe key to resolving many of theissues that may affect communitycolleges in the future. First and fore-most, policymakers must address theneed for adequate funding if theyexpect the American education sys-tem to produce workers who are

162 American Association of Community Colleges
fully prepared to compete in a glob-al economy. And, rather than pittingdifferent sectors of the educationsystem against each other in a battlefor scarce resources, policymakersmust see—and fund—education asa continuum of services that citizenswill access throughout their lives.For many states this will entailresolving the structural deficits thathamper their ability to provide thesocial capital their citizens need.
Whatever the future levels ofpublic funding, there will be greaterexpectations for accountability.Community colleges will have toexpand their capacity to collect anduse data in order to respond to pub-lic inquiries about institutional effec-tiveness and learning. Particularly intimes when state revenues are in adown cycle and the demand forsocial services is growing, collegeswill need to demonstrate the valueadded for tax dollars spent. It willalso be critically important thatcommunity college leaders partici-pate in policy discussions aboutappropriate indicators and incentivesfor effective performance. Finally,
these leaders will need to ensure thataccountability mandates ultimatelybenefit students. Data gathered foraccountability purposes must beused to improve programs and serv-ices, manage resources wisely, andincrease retention rates for students.These data must also be used to doc-ument students’ successes, specifical-ly, not just the traditional measuresof success such as graduation ortransfer, but also job attainment,increase in job level, completion of acertificate, or even a smaller measuresuch as completion of a course orseries of courses (such as remedia-tion) that take students to the nextstep of their academic career.
Other public policy issues sur-face periodically with the passage offederal legislation that affects com-munity colleges, including the CarlD. Perkins Vocational and AppliedTechnology Act, the WorkforceInvestment Act, and the HigherEducation Act. Recent legislativeproposals have focused on the enroll-ment of undocumented immigrantsand international students inAmerican colleges and universities.
These laws and similar legislative ini-tiatives will continue to affect fund-ing and thus dictate the college’sability to educate workers, providefinancial aid, and reduce barriers toenrollment. Community collegeleaders will have to take an activerole at both the state and federal levels as the public policies embod-ied in such legislation is formulated.
In the face of the challenges thatlie ahead—surging enrollments, newstudent demographics, new teachingand learning approaches, continuedemphasis on preparing a world-classworkforce, cycles of economicgrowth and recession, and globaliza-tion—community colleges willundoubtedly choose the path ofinnovation. The new generation ofpresidents that is now assumingleadership will bring new skills andtalents to bear as they guide theircolleges into the future. Havingachieved organizational maturity,community colleges may well evolveinto something different, but theywill still remain true to their corevalues of access, academic excel-lence, and student-centeredness. D

163National Profile of Community Colleges: Trends & Statistics 4TH EDITION
Figure 6.1U.S. Population Projection: 2000–2050
50
100
150
200
250
300
350
400
450
2005 2010 2015 2020 2025
Year
2030 2035 2040 2045 20502000
Popu
lati
on, i
n m
illio
ns
Source: U.S. Census Bureau (2004c)

164 American Association of Community Colleges
Figure 6.2Projected Percentage of White Non-Hispanics and Minorities inthe U.S. Population: 2000–2050
10%
20%
30%
40%
50%
60%
70%
80%
2005 2010 2015 2020 2025
Year
2030 2035 2040 2045 20502000
Perc
enta
ge o
f po
pula
tion
Source: U.S. Census Bureau (2004c)
White, non-Hispanics
Minorities

165National Profile of Community Colleges: Trends & Statistics 4TH EDITION
Figure 6.3Number of High School Graduates, Actual and Projected:1988–2013
500
1,000
1,500
2,000
2,500
3,000
3,500
Year
Num
ber
of h
igh
scho
ol g
radu
ates
, in
tho
usan
ds
1988
1989
1990
1991
1992
1993
1994
2000
2001
2006
2012
2013
2011
2007
2008
2009
2010
2002
2003
2004
2005
1995
1996
1997
1998
1999
Source: Herald & Hussar (2004)
Actual Projected

166 American Association of Community Colleges
Figure 6.4Associate Degrees Awarded, Actual and Projected: 1988–2013
100,000
200,000
300,000
400,000
500,000
600,000
700,000
800,000
Year
Num
ber
of a
ssoc
iate
deg
rees
aw
arde
d
1988
1989
1990
1991
1992
1993
1994
2000
2001
2006
2012
2013
2011
2007
2008
2009
2010
2002
2003
2004
2005
1995
1996
1997
1998
1999
Source: Herald & Hussar (2004)
HighMiddleLow
Projected
Actual Projected
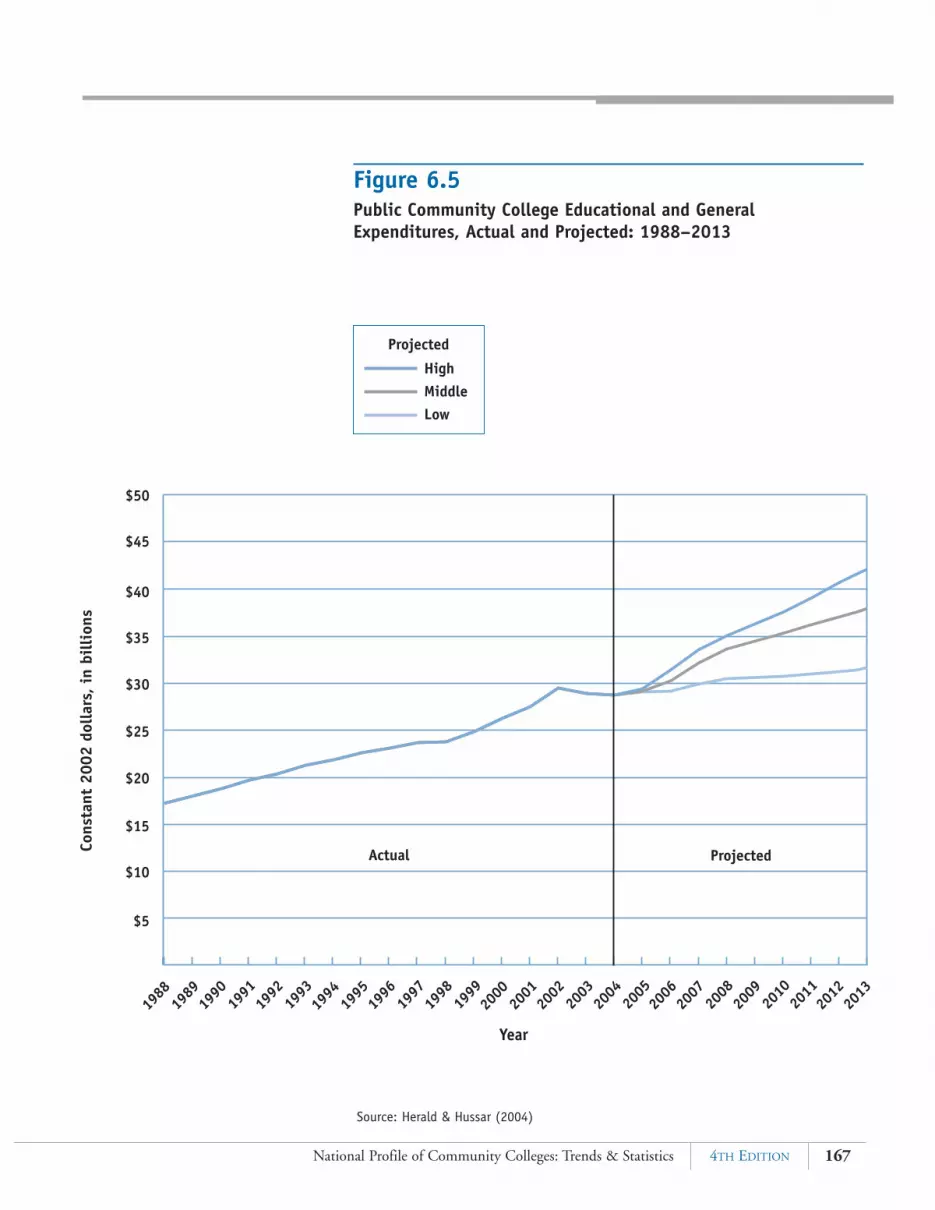
167National Profile of Community Colleges: Trends & Statistics 4TH EDITION
Figure 6.5Public Community College Educational and GeneralExpenditures, Actual and Projected: 1988–2013
$5
$10
$15
$20
$25
$30
$35
$45
$50
$40
Year
Cons
tant
200
2 do
llar
s, i
n bi
llio
ns
1988
1989
1990
1991
1992
1993
1994
2000
2001
2006
2012
2013
2011
2007
2008
2009
2010
2002
2003
2004
2005
1995
1996
1997
1998
1999
Source: Herald & Hussar (2004)
Actual Projected
HighMiddleLow
Projected

168 American Association of Community Colleges
Figure 6.6Enrollment at Public Community Colleges, Actual and Projected: 1988–2013
1,000
2,000
3,000
4,000
5,000
6,000
7,000
8,000
Year
Enro
llm
ent,
in
thou
sand
s
1988
1989
1990
1991
1992
1993
1994
2000
2001
2006
2012
2013
2011
2007
2008
2009
2010
2002
2003
2004
2005
1995
1996
1997
1998
1999
Source: Herald & Hussar (2004)
Actual Projected
HighMiddleLow
Projected

169National Profile of Community Colleges: Trends & Statistics 4TH EDITION
Figure 6.7Enrollment at Independent Community Colleges,Actual and Projected: 1988–2013
50
100
150
200
250
300
350
Year
Enro
llm
ent,
in
thou
sand
s
1988
1989
1990
1991
1992
1993
1994
2000
2001
2006
2012
2013
2011
2007
2008
2009
2010
2002
2003
2004
2005
1995
1996
1997
1998
1999
Source: Herald & Hussar (2004)
Actual Projected
HighMiddleLow
Projected
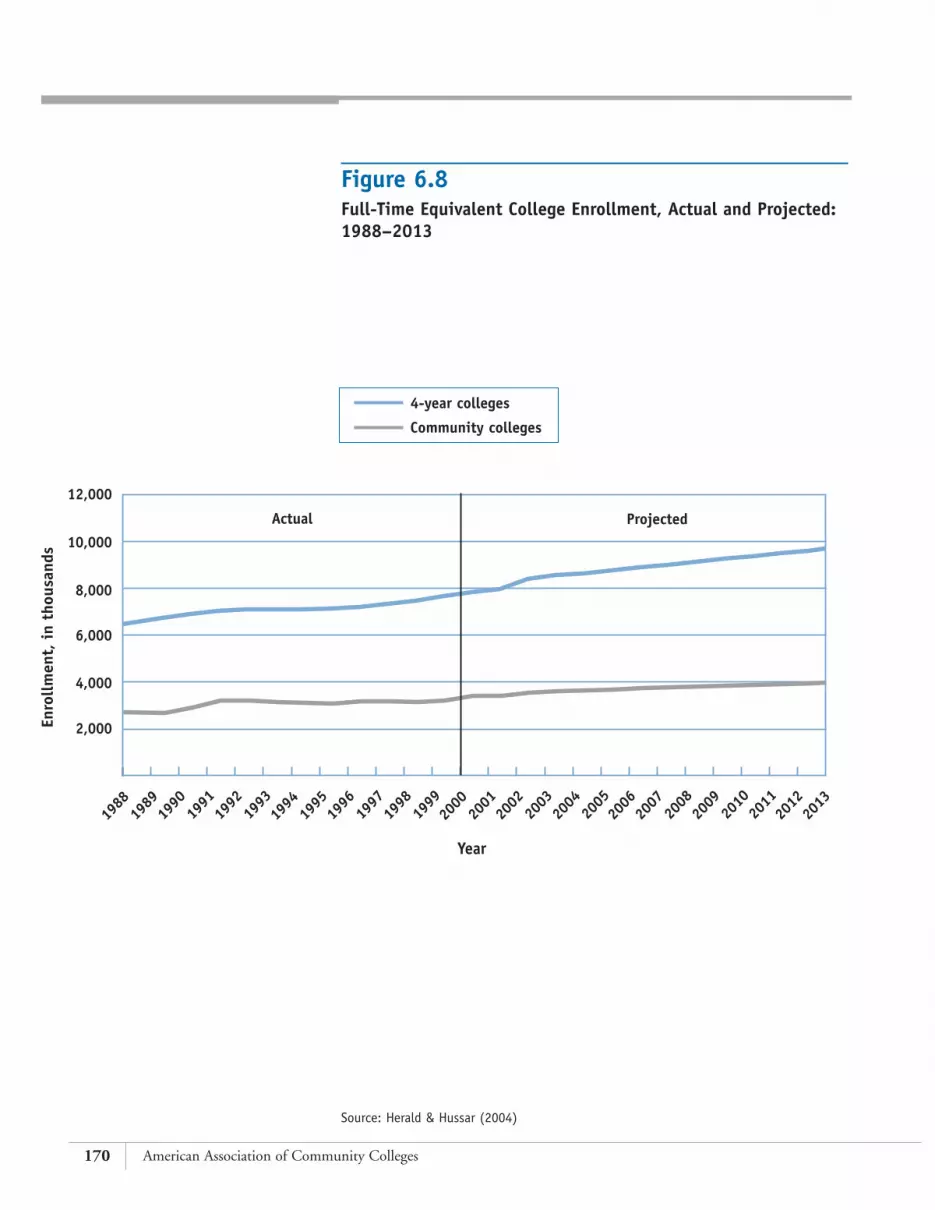
170 American Association of Community Colleges
Figure 6.8Full-Time Equivalent College Enrollment, Actual and Projected:1988–2013
2,000
4,000
6,000
8,000
10,000
12,000
Year
Enro
llm
ent,
in
thou
sand
s
1988
1989
1990
1991
1992
1993
1994
2000
2001
2006
2012
2013
2011
2007
2008
2009
2010
2002
2003
2004
2005
1995
1996
1997
1998
1999
Source: Herald & Hussar (2004)
4-year colleges
Community colleges
Actual Projected

171National Profile of Community Colleges: Trends & Statistics 4TH EDITION
TABLE 6.1Occupations With the Largest Projected Job Growth:2002–2012 (numbers in thousands)
Source: Hecker (2004)
Occupation 2002 2012 # %
Registered nurses 2,284 2,908 623 27%
Postsecondary teachers 1,581 2,184 603 38%
Retail salespersons 4,076 4,672 596 15%
Customer service representatives 1,894 2,354 460 24%
Food prep and food services workers 1,990 2,444 454 23%
Cashiers, except gaming 3,432 3,886 454 13%
Janitors and cleaners 2,267 2,681 414 18%
General and operations managers 2,049 2,425 376 18%
Waiters and waitresses 2,097 2,464 367 18%
Nursing aides 1,375 1,718 343 25%
# of Employees Change, 2002–2012

172 American Association of Community Colleges
TABLE 6.2Occupations With the Fastest Projected Job Growth:2002–2012 (numbers in thousands)
Source: Hecker (2004)
Occupation 2002 2012 # %
Medical assistants 365 579 215 59%
Network system and data communications analysts 186 292 106 57%
Physician assistants 63 94 31 49%
Social and human service assistants 305 454 149 49%
Home health aides 580 859 279 48%
Medical records and health information technicians 147 216 69 47%
Physical therapist aides 37 54 17 46%
Computer software engineers, applications 394 573 179 46%
Computer software engineers, system software 281 409 128 45%
Physical therapist assistants 50 73 22 45%
# of Employees Change, 2002–2012

173National Profile of Community Colleges: Trends & Statistics 4TH EDITION
Occupation 2002 2012 # %
Farmers and ranchers 1,158 920 -238 -21%
Sewing machine operators 315 216 -99 -31%
Word processors and typists 241 148 -93 -39%
Stock clerks and order fillers 1,628 1,560 -68 -4%
Secretaries, except legal, medical, executive 1,975 1,918 -57 -3%
Electrical and electronic equipment assemblers 281 230 -51 -18%
Computer operators 182 151 -30 -17%
Telephone operators 50 22 -28 -56%
Postal service mail sorters and processors 253 226 -26 -10%
Loan interviewers and clerks 170 146 -24 -14%
# of Employees Change, 2002–2012
TABLE 6.3Occupations With the Largest Projected Job Declines:2002–2012 (numbers in thousands)
Source: Hecker (2004)


175National Profile of Community Colleges: Trends & Statistics 4TH EDITION
academic support: expenditures forsupport services that are an integralpart of the institution’s primary mis-sion of instruction, research, or pub-lic service.
associate degree: an award that nor-mally requires at least 2 but fewerthan 4 years of full-time-equivalentcollege work.
attainment: the highest level ofeducation a student completed.
Baccalaureate and Beyond Study(B&B): longitudinal studies thatfollow first-time baccalaureate recip-ients for 5 years or more. Recipientsare a subsample of the students inthe National Postsecondary StudentAid Study.
Beginning Postsecondary StudentStudy (BPS): a longitudinal studythat follows first-time freshmen for5 years or more. These students area subsample of the students in theNational Postsecondary Student AidStudy.
branch campus: an affiliated cam-pus of a college that is not separatelyaccredited and does not separatelyoffer a degree.
campus-based aid: student finan-cial aid from federal, state, and localgovernments administered throughthe institution, not directly to thestudent. An example is CollegeWork-Study.
certificate: a formal award certify-ing the satisfactory completion of apostsecondary program.
College Work-Study: a program inwhich a student is paid through fed-eral and matching institutionalfunds for work on the campus or onits behalf.
community college (AACC defini-tion): an institution that is accredit-ed (or undergoing accreditation) byone of the six regional accreditingbodies and primarily offers the asso-ciate degree as the highest degree. Acommunity college can also be acampus that offers the associatedegree as the highest award but ispart of a regionally accredited, bac-calaureate-granting institution.
community college (U.S.Department of Education defini-tion): an institution of higher edu-cation that is accredited by anagency recognized by theDepartment of Education and offersthe associate degree as the highestaward.
constant dollars: the value of thedollar adjusted for the impact ofinflation. The Consumer PriceIndex was used to adjust for theeffects of inflation.
current dollars: the actual dollarvalue, not adjusted for inflation.
Current Population Survey (CPS):a monthly survey of about 50,000households conducted by the U.S.Census Bureau for the Bureau ofLabor Statistics. Respondents areinterviewed to obtain informationabout the employment status ofeach member of the household aged15 or older.
degree-seeking students: studentsenrolled in courses for credit whoare recognized by the institution asseeking a degree or formal award.
employment status (faculty andstaff ): full-time or part-time statusas determined by the institution.
fall headcount enrollment: thenumber of students enrolled incourses creditable toward a diploma,certificate, degree, or other formalaward, as of October 15 (or theinstitution’s official fall reportingdate). Includes students who arepart of vocational or occupationalprograms and students enrolled inoff-campus centers.
GLOSSARY

176 American Association of Community Colleges
federal aid: any financial aid pro-vided to students by the federal gov-ernment.
federal revenue: includes bothrestricted and unrestricted appropri-ations, grants, gifts, and contractsfrom federal sources, except for PellGrant dollars, which are separatelyreported, unless otherwise noted.
field of study: the primary field ofstudy a degree or certificate wasawarded in, as classified by the insti-tution based on guidelines devel-oped by the U.S. Department ofEducation.
financial aid: any of a wide varietyof programs designed to aid a stu-dent financially to attend a postsec-ondary institution.
first-generation student: studentwhose parents have had no postsec-ondary education.
first-time, first-year student: a stu-dent attending any institution for thefirst time at the undergraduate level.
four-year college: a college thatoffers a baccalaureate or higherdegree as its primary award.
full-time employment: 35 or morehours per week.
full-time student: a studentenrolled for 12 or more credits (24or more contact hours a week).
full-year unduplicated headcount:the number of students enrolledduring the 12-month reporting peri-od in any courses leading to adegree or other formal award, andthe number of students enrolled incourses that are part of a terminalvocational or occupational program.
independent (private) college: acollege operated by privatelyappointed officials, which derives itsfunding primarily from privatesources.
independent student: according tofederal financial aid guidelines, stu-dents are considered independent ifthey meet any of the following crite-ria: age 24 or older, veteran of theU.S. armed forces, enrolled in agraduate or professional program(beyond a bachelor’s degree), mar-ried, orphan or ward of the court, orhave legal dependents other than aspouse. In addition, financial aidofficers may designate students whodo not meet these criteria to be inde-pendent if the students can docu-ment they are in fact self-supporting.
institutional aid: any aid the collegeprovides to the student to help defraythe cost of attending the college.
institutional support: expendituresfor day-to-day operations establishedto provide service and maintenanceof grounds and facilities used foreducational and general purposes.
instruction: category of expendi-tures that includes all expendituresfor instruction and instructors’salaries, including both credit andnoncredit academic instruction.
Integrated PostsecondaryEducational Data System(IPEDS): a series of surveys con-ducted by the U.S. Department ofEducation. The surveys provideaggregate data at the college leveland cover topics such as enrollment,institutional finances, institutionalcharacteristics, degree and certificatecompletion, staff and faculty status,faculty salaries, and, soon, studentgraduation and transfer activities.
international programs: programsthat deal with training students incountries other than the UnitedStates or programs that specialize inteaching about other countries.
local revenue: category of revenuethat includes both restricted and

177National Profile of Community Colleges: Trends & Statistics 4TH EDITION
unrestricted appropriations, grants,gifts, and local sources, unless other-wise noted.
National Postsecondary StudentAid Study (NPSAS): a survey con-ducted by the U.S. Department ofEducation every three or four years.Data is collected on a stratified ran-dom sample of students from all lev-els of postsecondary institutions eli-gible for student financial aid; thebest source for nationally representa-tive data on financial aid, studentfinances, and other individual stu-dent characteristics.
National Study of PostsecondaryFaculty (NSOPF): a survey con-ducted every six or so years by theU.S. Department of Education.Data is collected on a stratified ran-dom sample of instructional facultyfrom all levels of postsecondary insti-tutions. NSOPF is one of the bestsources of information availableabout faculty at community colleges.
part-time employment: fewer than35 hours per week.
part-time student: a student enrolledfor 11 or fewer credits (fewer than 24contact hours a week).
Pell Grant: federally funded grantsto students based on family financial
need; includes all federal Pell Grantfunds received by the college.
per capita (state): total amount offunds divided by the total popula-tion of the state.
persistence: whether a student is stillpursuing a degree or certificate byattending a postsecondary institution.
private gifts, grants, and con-tracts: revenues from privatedonors, private contracts, and for-eign governments.
proprietary college: a for-profitcollege run by private citizens orcorporations.
public college: a college that isoperated by publicly elected orappointed officials and that derivesits funding primarily from publicsources.
public service: category of fundsbudgeted to provide noninstruction-al services beneficial to groups exter-nal to the institution.
race/ethnicity: racial or ethnic cate-gory that people identify with,according to the terminology usedby the U.S. Department ofEducation: Black, non-Hispanic;American Indian or Alaskan native;
Asian or Pacific Islander; Hispanic;White, non-Hispanic.
remedial education: courses inreading, writing, or mathematics forcollege students lacking the skillsnecessary to perform work at thelevel required by the institution.
replacement value: estimated costto replace buildings and equipmentowned, rented, or used by the insti-tution.
research: funds spent to produceresearch outcomes commissioned byan agency either external to theinstitution or separately budgeted byan organizational unit within theinstitution.
service learning: a program inte-grated into curriculum in which astudent volunteers as part of his orher coursework and integrates thisservice activity into the learningexperience.
state aid: any student financial aidprovided by a state government.
state revenue: category of revenuethat includes both restricted andunrestricted appropriations, grants,gifts, and contracts from statesources, unless otherwise noted.

178 American Association of Community Colleges
student services: expenditures foradmissions, registration, and activi-ties whose primary purpose is tocontribute to students’ emotionaland physical well-being and to theirintellectual, cultural, and socialdevelopment outside the context ofthe formal instructional program.
subsidized loans: loans to studentsto help defray attendance costs,where interest accrual is paid forwhile the student is still pursuing adegree. Includes Perkins loans andsome Stafford loans.
Title IV institution: an institutionthat meets the federal guidelines toreceive federal funds as a part of TitleIV of the Higher Education Act.
transfer: academic transition inwhich a student stops attending onecollege to begin attending another,often with credits earned at the firstinstitution transferring to apply forcredit at the second institution.
tribal college: a college operated bya Native American nation.
tuition and fees: the average annualamount a student spends to attendclasses full time. Tuition and fees donot include books and supplies,room and board, or living expenses.
unsubsidized loans: loans to stu-dents to help defray attendancecosts, where interest accrues to thestudent’s loan amount while he orshe is still pursuing a degree.Unsubsidized loans include PLUS,SLA, and some Stafford loans.
workforce training: education pro-grams designed to increase skillsneeded for specific jobs.

179National Profile of Community Colleges: Trends & Statistics 4TH EDITION
American Association of Community Colleges. (2004a).2004 demographics: Community college presidents[Electronic fact sheet]. Retrieved June 1, 2004, fromhttp://www.ccleadership.org/resource_center/demo_snapshots.htm
American Association of Community Colleges. (2004b).AACC membership database [Data file].Washington, DC: American Association ofCommunity Colleges.
American Association of Community Colleges &Association of Community College Trustees. (2000).The knowledge net: Connecting communities, learners, and colleges. Washington, DC: CommunityCollege Press.
American Association of University Professors. (2004).Don’t blame faculty for high tuition: The annual reporton the economic status of the profession, 2003–2004.Washington, DC: Author.
Association of Community College Trustees. (2003,September 18). Community colleges put more dollarsthan they cost in public pockets [Press release].Retrieved March 8, 2004, fromhttp://acct.org/about/Press/091803press.htm
Berger, L. (2002, August 4). The rise of the perma-temp[Education Life section]. The New York Times, pp. 20–23.
Blair, D., Phinney, L., & Phillippe, K. A. (2001).International programs at community colleges [Researchbrief ]. Washington, DC: American Association ofCommunity Colleges.
Blount, P., & Associates, Inc., & Lindley, A. (2005).Compensation and benefits of community college CEOs:2004 [Research brief ]. Washington, DC: AmericanAssociation of Community Colleges.
Choy, S. P. (2004). Paying for college: Changes between
1990 and 2000 for full-time dependent undergraduates(NCES 2004–075). Washington, DC: U.S.Department of Education, National Center forEducation Statistics.
Cohen, A. M., & Brawer, F. B. (2003). The Americancommunity college (4th ed.). San Francisco: Jossey-Bass.
College Board. (2004). Trends in student aid: 2004.Washington, DC: Author.
Community College Survey of Student Engagement.(2002). Engaging community colleges: A first look.Austin, TX: Author.
Community College Survey of Student Engagement.(2003). Engaging community colleges: National bench-marks of quality. Austin, TX: Author.
Education Commission of the States. (2000). State fund-ing for community colleges: A 50-state survey. Denver:Author.
Education Commission of the States. (2003). Closing thecollege participation gap. Denver: Author.
Evelyn, J. (2004, April 30). Community colleges at acrossroads. The Chronicle of Higher Education, pp.A27–28.
Hecker, D. E. (2004). Employment outlook: 2002–12:Occupational employment projections to 2012.Monthly Labor Review, 127(2), 80–105.
Herald, D. G., & Hussar, W. J. (2004). Projections ofeducation statistics to 2013 (NCES 2004-013).Washington, DC: U.S. Department of Education,National Center for Education Statistics.
Hoachlander, G., Sikora, A. C., & Horn, L. (2003).Community college students: Goals, academic prepara-tion, and outcomes (NCES 2003–164). Washington,DC: U.S. Department of Education, NationalCenter for Education Statistics.
REFERENCES

180 American Association of Community Colleges
Horn, L. J. (1996). Nontraditional undergraduates: Trendsin enrollment from 1986 to 1992 and persistence andattainment among 1989–90 beginning postsecondarystudents (NCES 97-578). U.S. Department ofEducation, National Center for Education Statistics.Washington, DC: U.S. Government Printing Office.
Illinois Community College Board. (2002). Fact sheet:Economic impact Illinois’ 39 community college districts[Research report]. Springfield, IL: Author.
Knapp, L. G., Kelly, J. E., Whitmore, R. W., Wu, S.,Levine, B., Huh, S., & Broyles, S. (2004).Enrollment in postsecondary institutions: Fall 2001 andfinancial statistics, fiscal year 2001 (NCES 2004-155).Washington, DC: U.S. Department of Education,National Center for Education Statistics.
Lane, K. (2003, February 17). How much is too much:What happens when the least expensive college edu-cation becomes too expensive? Community CollegeWeek, pp. 7–9.
Los Angeles Community Colleges. (2002). The economicimpact of the Los Angeles Community Colleges[Research report]. Retrieved March 8, 2004 fromhttp://research.laccd.edu/research/General/Ecimpact.htm
McPhee, S. (2004). Hot programs at community colleges[Research brief ]. Washington, DC: AmericanAssociation of Community Colleges.
Merisotis, J. P., & Wolanin, T. R. (2000). Communitycollege financing: Strategies and challenges (NewExpeditions Issues Paper No. 5). Washington, DC:American Association of Community Colleges.
Mortenson, T. G. (2000). Poverty, race, and the failure ofpublic policy: The crisis of access in higher educa-tion. Academe, 6, 38–40.
National Center for Education Statistics. (1996).1995–1996 national postsecondary student aid study.Washington, DC: U.S. Department of Education.
National Center for Education Statistics. (2004a).Baccalaureate and beyond longitudinal study: First fol-low-up (B&B:99/01) Washington, DC: U.S.
Department of Education. Available from the DataAnalysis System Web site,http://www.nces.ed.gov/das
National Center for Education Statistics. (2004b).Beginning postsecondary students longitudinal study:Second follow-up (BPS:96/01) (NCES 2003-163).Washington, DC: U.S. Department of Education.Available from the Data Analysis System Web site,http://www.nces.ed.gov/das
National Center for Education Statistics. (2004c).Integrated postsecondary education data system (IPEDS)completions survey [Data file].Washington, DC: U.S.Department of Education.
National Center for Education Statistics. (2004d).Integrated postsecondary education data system (IPEDS)employees by assigned position survey [Datafile].Washington, DC: U.S. Department of Education.
National Center for Education Statistics. (2004e).Integrated postsecondary education data system (IPEDS)fall enrollment survey [Data file]. Washington, DC:U.S. Department of Education.
National Center for Education Statistics. (2004f ).Integrated postsecondary education data system (IPEDS)fall staff survey [Data file]. Washington, DC: U.S.Department of Education.
National Center for Education Statistics. (2004g).Integrated postsecondary education data system (IPEDS)finance survey [Data file]. Washington, DC: U.S.Department of Education.
National Center for Education Statistics. (2004h).Integrated postsecondary education data system (IPEDS)institutional characteristics survey [Data file].Washington, DC: U.S. Department of Education.
National Center for Education Statistics. (2004i).National postsecondary student aid study: 1995–96.Washington, DC: U.S. Department of Education.Available from the Data Analysis System Web site,http://www.nces.ed.gov/das
National Center for Education Statistics. (2004j).

181National Profile of Community Colleges: Trends & Statistics 4TH EDITION
National postsecondary student aid study: 1999–2000.Washington, DC: U.S. Department of Education.Available from the Data Analysis System Web site,http://www.nces.ed.gov/das
National Center for Education Statistics. (2004k).National study of postsecondary faculty:1998–99.Washington, DC: U.S. Department of Education.Available from the Data Analysis System Web site,http://www.nces.ed.gov/das
National Center for Education Statistics. (2005).National postsecondary student aid study: 2003–2004.Washington, DC: U.S. Department of Education.Available from the Data Analysis System Web site,http://www.nces.ed.gov/das
National Council for State Boards of Nursing. (2004a).NCLEX statistics from NCSBN: 2000. Chicago, IL:Author.
National Council for State Boards of Nursing. (2004b).NCLEX statistics from NCSBN: 2001. Chicago, IL:Author.
National Council for State Boards of Nursing. (2004c).NCLEX statistics from NCSBN: 2002. Chicago, IL:Author.
National Council for State Boards of Nursing. (2004d).NCLEX statistics from NCSBN: 2003. Chicago, IL:Author.
National Council for State Boards of Nursing. (2004e).NCLEX statistics from NCSBN: 2004. Chicago, IL:Author.
Nock, M. M., & Shults, C. (2001). Hot programs at com-munity colleges [Research brief ]. Washington, DC:Community College Press.
O’Banion, T. (1997). A learning college for the 21st centu-ry. Washington, DC: ACE/Oryx Press.
Phillippe, K., & Eblinger, I. R. (1998). Community col-lege foundations: Funding the community college future.Washington, DC: American Association ofCommunity Colleges.
Prentice, M., Robinson, G., & McPhee, S. (2003).
Service learning in community colleges: 2003 nationalsurvey results [Research brief ]. Washington, DC:American Association of Community Colleges.
Selingo, J. (2003, May 2). What Americans think abouthigher education. The Chronicle of Higher Education,pp. A11–A16.
Selingo, J. (2004, May 7). U.S. public’s confidence incolleges remains high. The Chronicle of HigherEducation, p. A35.
Shults, C. (2001). The critical impact of impending retire-ments on community college leadership [Researchbrief ]. Washington, DC: American Association ofCommunity Colleges.
Snyder, T. D. (1999). Digest of education statistics: 1998(NCES 2001-034). Washington, DC: U.S.Department of Education, National Center forEducation Statistics.
Snyder, T. D. (2003). Digest of education statistics: 2002(NCES 2003–060). Washington, DC: U.S.Department of Education, National Center forEducation Statistics.
Snyder, T. D., & Hoffman, C. M. (2001). Digest of edu-cation statistics: 2000 (NCES 2001-034).Washington, DC: U.S. Department of Education,National Center for Education Statistics.
U.S. Census Bureau. (1998). State population estimates:Annual time series, July 1, 1990 to July 1, 1997.Washington, DC: U.S. Department of Commerce.
U.S. Census Bureau. (1999). Educational attainment inthe United States: March 1998. Washington, DC:U.S. Department of Commerce.
U.S. Census Bureau. (2000). Educational attainment inthe United States: March 1999. Washington, DC:U.S. Department of Commerce.
U.S. Census Bureau. (2001). Educational attainment inthe United States: March 2000. Washington, DC:U.S. Department of Commerce.
U.S. Census Bureau. (2002). The big payoff: Educationalattainment and synthetic estimates of work-life

182 American Association of Community Colleges
earnings. Washington, DC: U.S. Department ofCommerce.
U.S. Census Bureau. (2004a). Educational attainment inthe United States: March 2001 and March 2002.Washington, DC: U.S. Department of Commerce.
U.S. Census Bureau. (2004b). State population estimates:Annual estimates of the population by sex and age:April 1, 2000 to July 1, 2003 (SC-EST2003-02-01).Washington, DC: U.S. Department of Commerce.
U.S. Census Bureau. (2004c). U.S. interim projections byage, sex, race, and Hispanic origin. Washington, DC:U.S. Department of Commerce.
VanDerLinden, K. E. (2002). Credit student analysis:1999 and 2000 (Faces of the Future). Washington,DC: American Association of Community Colleges.
Virginia Community College System. (2003, April 9).Study shows community colleges make major impact
on commonwealth’s economy [Press release].Retrieved March 8, 2004 fromhttp://www.vccs.edu/aboutvccs/news_releases/eco-nomicimpact.htm
Waits, T., & Lewis, L. (2003). Distance education atdegree-granting postsecondary institutions: 2000–2001(NCES 2003-017). Washington, DC: U.S.Department of Education, National Center forEducation Statistics.
Wei, C. C., Li, X., & Berkner, L. (2004). A decade ofundergraduate student aid: 1989–90 to 1999–2000(NCES 2004-158). Washington, DC: U.S.Department of Education, National Center forEducation Statistics.Wellman, J. V. (2002). State pol-icy and community college baccalaureate transfer.Washington, DC: National Center for Public Policyand Higher Education.

183National Profile of Community Colleges: Trends & Statistics 4TH EDITION
A
accountability, 4, 130, 162adjunct instructors, 99administration, 6administrators. See also community
college employeesminorities, 97professional development for, 99retirement of, 97salaries for, 97turnover of, 6
advanced placement programs, 20AFL-CIO, 4age
of community college students, 20, 31–35
employment status of students by, 50
of faculty, 116allied health programs, 65American Association of Community
and Junior Colleges, 2American Association of Community
Colleges (AACC)establishment of, 2Faces of the Future survey, 64foundations survey, 130Future Leaders Institute, 99hot programs survey, 65The Knowledge Net, 66Presidents Academy, 99retirement survey, 97turnover survey, 6
American Association of Junior Colleges, 2
AmeriCorps, 100Arizona, 4Asian/Pacific Islanders
certificates and associate degrees statistics for, 77, 82
as community college employees, 106–112
as community college students, 20
educational attainment of, 71enrolled in higher education
programs, 36–43ethnic origins of, 43income of dependent, 56–57income of independent, 58–59mean and median earnings for,
72–73associate degrees
by field of study, 80–81by gender and race/ethnicity, 82income of workers with, 63life earnings estimates for
individuals with, 74mean and median earnings of
workers with, 72–73mean earnings for workers
with, 75by state, 78–79statistics for, 76–77
attendance status, 52
B
bachelor’s degree programstransition to, 20trends in, 5
bachelor’s degreescommunity college students
with, 20–21by field of study and type of
college attended, 93life earnings estimates for
individuals with, 74mean and median earnings of
workers with, 72–73mean earnings for workers
with, 75statistics for, 76for students entering college
1995–1996, 84–85teaching status of recipients of, 96
Barr, Robert, 99
benefitsfor CEOs, 115for community college
presidents, 98Blacks
certificates and associate degreesfor, 77, 82
as community college employees, 106–111, 113
as community college students, 20
educational attainment of, 70enrolled in higher education
programs, 36–43income of dependent, 56–57income of independent, 58–59mean and median earnings for,
72–73Brown, J. Stanley, 1Brunswick Community College, 101Building Individual and Community
Self-Sufficiency Through Service, 100
Bureau of Indian Affairs, 2
C
Californiacommunity college funding in,
4, 127–128, 160two-year colleges in, 1–2
California Community Colleges, 100Carl D. Perkins Vocational and
Technical Education Act, 101, 162
Centro Communitario (Brunswick Community College), 101
certificates/certificate programscommunity college students
in, 49in distance education programs,
122by field of study, 80–81by gender and race/ethnicity, 82
INDEX

184 American Association of Community Colleges
by state, 78–79statistics for students earning,
76–77trends in, 2
chief academic officers, 98. See also community college employees
chief business officers, 98. See also community college employees
CEOs. see also community college employees
benefits for, 115characteristics of, 113compensation for, 114
chief student affairs officers, 98. See also community college employees
college education costscontainment of, 129–130as factor for students, 19–20overview, 127–130
college education financing, 127College of Lake County, 99community college employees
as new hires, 105occupations of, 102–103professional development for, 99
community college presidentsretirement survey for, 97women as, 97
community collegesaccess to, 3, 20award status for students entering
college 1995–1996, 84–85bachelor’s degree programs
offered by, 5challenges faced by, 3–5, 159comprehensive, 2degrees offered by, 2distribution of, 17–18education and general
expenditures for, 167
effect of technological advances on, 5–6
effectiveness of, 4–5expenses for, 134–136financial issues for, 3–4future outlook for, 159–162historical background of, 1–3hot programs at, 65, 90–92location of, 10–11mission of, 20–21, 160number of, 7–9operating costs for, 129outreach efforts by, 100–101percentage of population
serviced by, 13public policy issues for,
161–162revenue for, 128, 131–133scholarship sources for, 137service levels for, 128social and economic impact of,
63–66staff and services of, 97–101tuition for, 138–147turnover of leadership in, 6
comprehensive community colleges, 2
Council for Resource Development,99
Cubans, 42. See also Hispanics
D
Department of Commerce, 4Department of Education, 4Department of Labor, 4dependent students
income by race/ethnicity, 56–57income of, 54
developmental education programs, 20
disabilities. See students with dis-abilities
distance educationcost containment through, 130enrollment in, 21outlook for, 160–161percentage of colleges offering,
122–123by type of college, 124
distribution, of community colleges,17–18
diversity. see also minoritieschallenges related to, 21,
159–160trends in student-body, 5, 20
doctorateslife earnings estimates for
individuals with, 74mean and median earnings of
workers with, 72–73mean earnings for workers with,
75statistics for, 76
draft deferments, 2dual-enrollment programs
arrangements regarding, 5enrollment in, 20explanation of, 101
E
earnings. See also income; salaryby educational attainment, 75estimates of life, 74mean and median, 72–73
economic impact, of community colleges, 63–66
Education Commission of the States, 4, 128
educational attainmentincome and, 63life earnings estimates by, 74mean and median earnings by,
72–73, 75of parents of higher education

185National Profile of Community Colleges: Trends & Statistics 4TH EDITION
students, 47, 49of people 25 and older, 68–71of students entering college1995–1996, 84–85
employment options, 63–66Employment Policy Foundation
(EPF), 64employment status
by attendance status, 52of community college students,
50–52self-perceptions of, 51
English as second languages classes, 19–20
enrollmentbackground of, 2–4distribution of community
colleges by, 17dual, 5, 20, 101full-time equivalent, 170for high school advance
placement classes, 20for independent community
colleges, 169personal reasons for, 19for public community colleges,
168purpose of, 83by race/ethnicity, 37–39, 56–57statistics for, 2–5, 12, 16,
24–30trends in, 4, 21, 23
ethnically diverse students. See alsominorities; specific ethnic and racial groups
enrolled in higher education programs, 36–43
income of dependent, 56–57income of independent, 58–59
expensesfor community colleges,
134–136for four-year colleges, 134–136
F
Faces of the Future survey (American Association of Community Colleges), 64
faculty. See also community college employees
by age and employment status, 116
diversification of, 97educational attainment of, 118minorities as, 97professional development for, 99retirement of senior, 97salaries for, 98time spent on activities by, 119years to retirement for, 117
family incomeaverage tuition for students by,
155of dependent higher education
students, 55federal student aid
percentage of, 148types of, 127
field of studyassociate degrees by, 80–81bachelor’s degrees by, 93
financial aidamount received by students, 154overview of, 127percentage of federal, 148percentage of students receiving,
152–153Florida, 128, 160four-year college faculty
educational attainment of, 118statistics for, 111, 116–117
four-year collegescommunity college students
attending or attaining degrees at, 86, 88–89
distance education programs in, 122–124
expenses for, 134–136revenue for, 131–133scholarship sources for, 137tuition for, 138–143
full-time faculty. See also facultyby race/ethnicity, 109–111statistics for, 104time spent on activities by, 119use of, 98
full-time studentsattendance status of, 52employment status of, 50enrollment of, 28–30, 32–34family income of dependent, 55
fundingbased on performance, 4outlook for, 162overview of, 3–4
fundraising, 130
G
GEAR-UP (Gaining Early Awareness and Readiness for Undergraduate Programs), 101
gender. See also womenassociate degrees by, 82of community college employees,
102–103of community college students, 20educational attainment by, 70–71enrollment statistics by, 28–30,
34–35life earnings estimates by, 74mean and median earnings by,
72–73GI Bill, 2grants, 127, 149–152Great Depression, 2

186 American Association of Community Colleges
H
Harper, William Rainey, 1high school dropouts
income of, 63life earnings estimates for, 74mean and median earnings of,
72–73mean earnings for, 75
high school graduatesincome of, 63life earnings estimates for, 74mean and median earnings of,
72–73mean earnings for, 75
high school partnerships, 101Higher Education Act, 162Hispanic-serving institutions (HSIs),
20Hispanics
certificates and associate degreesstatistics for, 77, 82
as community college employees,106–112
educational attainment of, 71enrolled in higher educationprograms, 20, 36–43ethnic origins of, 42income of dependent, 56–57income of independent, 58–59mean and median earnings for,
72–73outreach programs for,
100–101historically Black colleges and
universities (HBCUs), 20honors programs, 20
I
Illinois, 63–64immigrants. See also minorities
English languages classes for, 19in higher education programs,
44, 46income. See also earnings; salary
by dependency status, 54by education, race/ethnicity,
and gender, 72enrollment by family, 55of workers with associate
degrees, 63independent students
income by race/ethnicity, 58–59income of, 54
independent two-year colleges, 3international programs and services,
120
J
job declines, 173job growth, 171–172Joliet Junior College, 1junior colleges, 1–2. See also
community colleges
K
W. K. Kellogg Foundation, 66The Knowledge Net: Connecting
Communities, Learners, and Colleges (American Association of Community Colleges), 66
L
land grants, 1Leadership Institute (College of
Lake County), 99League for Innovation in the
Community College, 99
learning college movementexplanation of, 99–100transition to, 21
location, 10–11Long Beach City College, 130Los Angeles Community Colleges
District, 65
M
master’s degreeslife earnings estimates for
workers with, 74mean and median earnings of
workers with, 72–73mean earnings for workers with,
75statistics for, 76
Mexican/Mexican Americans/ Chicanos, 42. See alsoHispanics
Miami Dade College, 5, 100Minnesota, 2minorities. See also diversity;
ethnically diverse students; specific ethnic and racial groups
associate degrees for, 82certificates and associate degrees
for, 77as community college employees,
106–112as community college presidents,
97as community college students,
20educational attainment of,
70–71enrolled in higher education
programs, 36–43income of, 63income of dependent, 56–57

187National Profile of Community Colleges: Trends & Statistics 4TH EDITION
income of independent, 58–59mean and median earnings for,
72–73provision of increased access for,
66mission, 20–21, 160Missouri, 2Monroe Community College, 100Morrill Act (1862), 1
N
National Community College Hispanic Council Leadership Fellows Program, 99
National Council for Marketing andPublic Relations, 99
National Council on Black American Affairs LeadershipDevelopment Institute for African American Midlevel Administrators, 99
National Institute for Leadership Development (NILD), 99
Native Americanscertificates and associate degrees
for, 77, 82as community college employees,
106–112as community college students,
20income of dependent, 56–57income of independent, 58–59tribal colleges for, 2–3, 20
NCLEX-RN Exam, 94–95New Expenditures futuring project,
66New Jersey, 4New Jersey Compact, 4nonprofit organizations, 4nonresident aliens. See also immigrants
certificates and associate degrees
for, 77, 82as community college employees,
106–108, 110–111in higher education programs,
36–44top 30 community colleges with
enrollment of, 121North Carolina, 4, 128North Carolina Community
College System, 99North Carolina State University, 99
O
O’Banion, Terry, 99–100Olive-Harvey College, 101
P
Pacific Islanders. See Asian/Pacific Islanders
parents’ educational attainment, 47,49
part-time faculty, 98. see also facultypart-time students
attendance status of, 52employment status of, 50enrollment of, 28–30, 32–34
partnershipswith business and industry, 4, 21to contain costs, 129examples of, 100–101
Pell grants, 127, 149–151performance-based initiatives, 129performance reporting programs, 4perma-temps, 99Phi Theta Kappa, 20presidents. See community college
presidentsPresidents Academy (American
Association of Community Colleges), 99
President’s Fundraising Workshop(Council for ResourceDevelopment), 99
primary language in home, 45private industry, 4professional degrees
life earnings estimates for individuals with, 74
mean and median earnings of workers with, 72–73
mean earnings for workers with,75
statistics for, 76Puerto Ricans, 42. See also Hispanics
R
return on investment (ROI), 63–66revenue
for community colleges, 128, 131–133
for four-year colleges, 131–133risk factors, 52
S
salary. See also earnings; incomefor administrators, 97for chief academic officers, 98for CEOs, 114for chief student affairs officers,
98for community college
presidents, 97for faculty, 98gender differences in, 98hot programs by starting,
91–92San Joaquin Delta College, 101scholarships, 137senior citizens, 21

188 American Association of Community Colleges
service learningcommunity colleges offering,
125curricular areas for, 126explanation of, 100
social impact, 63–66staff. See community college
employees; specific types of employees
statescommunity college financing in,
127–129number of community colleges
in, 9percentage of population
serviced by community colleges in, 13–15
studentsby age, 20, 31–35Asian/Pacific Islander, 43aspirations of, 19, 21attending or attaining degrees at
four-year colleges, 86, 88–89average financial needs for, 158average price of attendance for,
156–157average tuition by family
income, 155award status of, 84–85with bachelor’s degrees, 20–21cost as an issue for, 19–20with disabilities, 61distance education for, 21by distance from home, 60diversity of, 5, 20–21, 159–160by employment status, 50enrollment statistics for, 23–30family income of dependent, 55financial aid for, 152–154foreign, 21full-time, 28–30, 32–34by gender, 20, 28–30, 34, 35by highest level of education
planned, 48–49, 87Hispanic, 42by immigrant status, 44, 46income by dependency status,
54, 56–57income of dependent students
by race/ethnicity, 56–57individuals with disabilities as,
21by parents’ level of education
attained, 47, 49minorities as, 20part-time, 28–30, 32–34by primary language spoken in
home, 45by race/ethnicity, 37–39, 82with risk factors associated with
decreased persistence in college, 52
self-perceptions of employment status, 51
seniors as, 21students with disabilities
accessibility and support servicesfor, 21
limiting condition for, 61Summer Institute on Marketing and
Public Relations (National Council for Marketing and Public Relations), 99
T
Tagg, John, 99teacher training programs
initiatives in, 100trends in, 5
technological advances, 5–6, 161Title IV colleges
certificates and degrees awarded by, 76
by distance education programs,123
tribal collegesenrollment in, 20establishment of, 2–3
Truman Commission, 2tuition
average, 155efforts to contain, 129as factor for community collegestudents, 19–20in-state, 142–147statistics for, 138–147
U
United Statesassociate degrees conferred in,
166high school graduates in, 165occupations with fastest projected
job growth in, 172occupations with largest projected
job growth in, 171population projections for, 163public community college
education and general expenditures in, 167
White, non-Hispanic and minority projections for, 164
urbanicity, 18
V
Valdez Math Institute, 101Virginia, 4Virginia Community College
System (VCCS), 64–65
W
welfare-to-work initiatives, 100

189National Profile of Community Colleges: Trends & Statistics 4TH EDITION
Whitescertificates and associate degrees
statistics for, 77, 82as community college employees,
106–112educational attainment of, 70enrolled in higher education programs, 36–43income of dependent, 56–57income of independent, 58–59mean and median earnings for,
72–73
women. See also genderassociate degrees for, 82as community college presidents,
97as community college students,
20educational attainment of,
70–71faculty salary for, 98income of, 63life earnings estimates for, 74
mean and median earnings for, 72–73
provision of increased access for,66
Work and Learn Center (Monroe Community College), 100
Workforce Investment Act, 162workforce preparation
meeting mandates for, 5outlook for, 161

190 American Association of Community Colleges
Kent A. Phillippe, a senior research associate, has beeninstrumental in developing a strong, reliable researchcapacity at the American Association of CommunityColleges (AACC) for 10 years. He has integrated diversenational data sets from sources including the U.S. CensusBureau, the U.S. Department of Education, and AACCdata files to better understand and describe communitycolleges and the communities they serve. These integra-tions have been integral in producing publications widelyused as resources for information on community collegesand in providing a rich resource for survey research andproject-specific college selections based on predefined cri-teria. Phillippe serves on advisory panels for nationalresearch projects including the U.S. Department ofEducation’s National Postsecondary Student Aid Study,the Beginning Postsecondary Student Longitudinal Study,and the National Study of Postsecondary Faculty, as wellas projects funded by the U.S. Department of Labor, theLumina Foundation, and the Fund for the Improvementof Postsecondary Education. Phillippe has a BA in psy-chology from Hamline University and an MA in clinicaland counseling psychology from Southern MethodistUniversity; he attended a Michigan State University doc-toral program in child/family clinical psychology.
Leila González Sullivan is the W. Dallas HerringProfessor of Community College Education in theDepartment of Adult and Community CollegeEducation (ACCE) at North Carolina State University,where she teaches graduate courses and serves as execu-tive director of the National Initiative for InstitutionalEffectiveness. She also directs the Hispanic LeadershipFellows Program for the National Community CollegeHispanic Council (NCCHC) and the DepartmentChairs Institute sponsored by the ACCE department.Prior to this appointment, Sullivan was the interim direc-tor of community college relations at The College Boardin New York. She was president of the CommunityCollege of Baltimore County, Essex Campus(1996–1999), after serving as president of MiddlesexCommunity College (CT) and interim president ofGateway Community College (CT). Sullivan has beeninvolved in the community college movement at thenational, regional, and local levels for many years. Shewas a member of the board of directors of the AmericanAssociation for Community Colleges (1993–1996 and1999–2002). She was national president of the AmericanAssociation for Women in Community Colleges(AAWCC) and is currently legislative liaison for its board(in 1998, she received AAWCC’s Carolyn DesjardinsPresident of the Year award). She has served on theAACC Commission on Learning and CommunicationsTechnologies and served as secretary and vice president ofthe NCCHC board (1991–2000). Sullivan holds an EdDdegree in vocational education administration and anEdS in adult education, both from the University ofArkansas. She earned an MA in Spanish literature fromNew York University and a baccalaureate in English liter-ature from Trinity College in Washington, DC. In May1997, she received the Trinity College CentennialAlumnae Award for Academic Excellence.
ABOUT THE AUTHORS