Declining Efficiency of Mettur Thermal Power Station - CAG
10
Analysis report on the declining efficiency of Mettur Thermal Power Stations AT|20190911 Declining Efficiency of Mettur Thermal Power Station: Reasons, Risks and Remedies? Abstract Energy plays a vital role in supporting the economic growth of Tamil Nadu. Coal-fired plants have been contributing to the bulk of the electricity generated in this state for over fifty years now. However, the constant burning of coal, increasing water utilisation, and release of fly ash and toxic gases like SOx and NOx are stressing the livelihood of communities living in proximity to the plant. This study is focused on the qualitative and quantitative analysis of operations of the 1,440 MW coal-fired plant in Mettur, in terms of its coal consumption, energy generation, fly ash production and utilisation, and most importantly, water utilisation. It is observed that the plant has been operating in violation of the Environment (Protection) Amendment Rules, 2014, Fly Ash Utilisation Notification, 2009, MoEFCC Notification in 2015 on water utilisation, and the National Tariff Policy, 2016. Since energy generation by old and inefficient coal-fired plants like the four units (4X210MW) of the Mettur Thermal Power Station has a massive load on the environment and natural resources, these should be decommissioned and subsequently replaced with clean energy sources like solar power. This shift will help the State to meet its energy demands in a more sustainable fashion. Introduction The Mettur Thermal Power Station (MTPS) was established as the first inland thermal power plant of Tamil Nadu Electricity Board in 1987 (and it is presently run by its subsidiary Tamil Nadu Generation and Distribution Corporation Limited - TANGEDCO). The MTPS (indicated by a purple arrow) is located in Salem district 1 and has been constructed at 1.4 km from the bank of Cauvery river and 500 meters away from its narrow diversion (see figure 1). Since the core zone of MTPS is located in close proximity to the Cauvery river, the plant has a very high impact on the aquatic ecosystem, whereas the fly ash affects 2 both the water and land ecology, and neighbourhood residents’ health due to air pollution. Besides, it affects the livelihood of farmers and fishermen by depletion in the quality and quantity of water in Cauvery river, which is the power plant’s only source of water. 1 https://www.twadboard.tn.gov.in/content/salem 2 https://www.thermalwatch.org.in/environmental-impact-assessment/impacts-power-plants
-
Upload
khangminh22 -
Category
Documents
-
view
1 -
download
0
Transcript of Declining Efficiency of Mettur Thermal Power Station - CAG
Analysis report on the declining efficiency of Mettur Thermal Power Stations AT|20190911
Declining Efficiency of Mettur Thermal Power Station:
Reasons, Risks and Remedies?
Abstract
Energy plays a vital role in supporting the economic growth of Tamil Nadu.
Coal-fired plants have been contributing to the bulk of the electricity generated in
this state for over fifty years now. However, the constant burning of coal, increasing
water utilisation, and release of fly ash and toxic gases like SOx and NOx are
stressing the livelihood of communities living in proximity to the plant.
This study is focused on the qualitative and quantitative analysis of operations of
the 1,440 MW coal-fired plant in Mettur, in terms of its coal consumption, energy
generation, fly ash production and utilisation, and most importantly, water
utilisation. It is observed that the plant has been operating in violation of the
Environment (Protection) Amendment Rules, 2014, Fly Ash Utilisation Notification,
2009, MoEFCC Notification in 2015 on water utilisation, and the National Tariff
Policy, 2016. Since energy generation by old and inefficient coal-fired plants like the
four units (4X210MW) of the Mettur Thermal Power Station has a massive load on
the environment and natural resources, these should be decommissioned and
subsequently replaced with clean energy sources like solar power. This shift will
help the State to meet its energy demands in a more sustainable fashion.
Introduction
The Mettur Thermal Power Station (MTPS) was established as the first inland
thermal power plant of Tamil Nadu Electricity Board in 1987 (and it is presently run
by its subsidiary Tamil Nadu Generation and Distribution Corporation Limited -
TANGEDCO). The MTPS (indicated by a purple arrow) is located in Salem district 1
and has been constructed at 1.4 km from the bank of Cauvery river and 500 meters
away from its narrow diversion (see figure 1).
Since the core zone of MTPS is located in close proximity to the Cauvery river, the
plant has a very high impact on the aquatic ecosystem, whereas the fly ash affects 2
both the water and land ecology, and neighbourhood residents’ health due to air
pollution. Besides, it affects the livelihood of farmers and fishermen by depletion in
the quality and quantity of water in Cauvery river, which is the power plant’s only
source of water.
1https://www.twadboard.tn.gov.in/content/salem 2https://www.thermalwatch.org.in/environmental-impact-assessment/impacts-power-plants
Analysis report on the declining efficiency of Mettur Thermal Power Stations AT|20190911
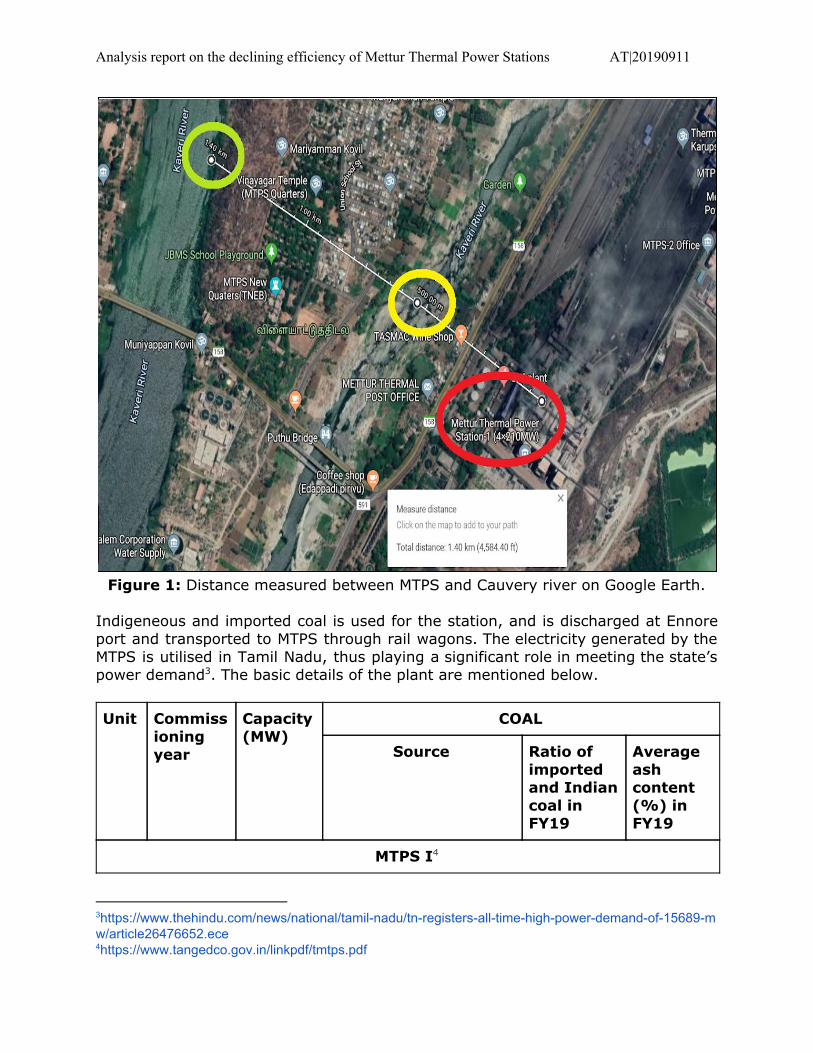
Figure 1: Distance measured between MTPS and Cauvery river on Google Earth.
Indigeneous and imported coal is used for the station, and is discharged at Ennore
port and transported to MTPS through rail wagons. The electricity generated by the
MTPS is utilised in Tamil Nadu, thus playing a significant role in meeting the state’s
power demand . The basic details of the plant are mentioned below. 3
Unit Commiss
ioning
year
Capacity
(MW)
COAL
Source Ratio of
imported
and Indian
coal in
FY19
Average
ash
content
(%) in
FY19
MTPS I 4
3https://www.thehindu.com/news/national/tamil-nadu/tn-registers-all-time-high-power-demand-of-15689-mw/article26476652.ece 4https://www.tangedco.gov.in/linkpdf/tmtps.pdf

Analysis report on the declining efficiency of Mettur Thermal Power Stations AT|20190911
1 1987 210 Indian coal from
Mahanadi coalfields
Limited (Talchar & IB
Valley), Orissa, Eastern
coalfields Limited and
Ranikanj, West Bengal.
5:18 39.06
2 1987 210
3 1989 210
4 1990 210 Imported coal
(Indonesia)
9.76
MTPS II 5
5 2013 600 Indian coal from
Mahanadi coalfields
Limited (Talchar & IB
Valley), Orissa, Eastern
coalfields Limited and
Ranikanj, West Bengal.
3:8 42.92
Imported coal
(Indonesia)
11.54
Table 1: Overview of MTPS I and MTPS II
Methodology
The study has been done to capture the performance of both phases of MTPS based
on the data consolidated and analysed through various sources. The qualitative
data has been reviewed from reports, news articles and information available on
official websites of MoEFCC, CEA and TNPCB; the quantitative data has been
obtained from TANGEDCO’s website, Environmental Statements (ES) for MTPS I
and MTPS II submitted by TANGEDCO, and the reports published by the Central
Electricity Authority (CEA).
Results and Discussion
1. Performance of MTPS: The Plant Load Factor (PLF) of a coal-fired plant is the 6
ratio between the amount of electricity generated by a plant to the amount of
electricity it could have generated under ideal conditions. According to data
obtained from the Load Generation Balance Report of CEA, the average actual
electricity demand in Tamil Nadu was 262.35, 286.33, 290.43 and 299.95
MU/day, indicating a steady increase from 2015-2019. However, according to
data provided in the respective ES for year 2015-16, 2016-17, 2017-18 and
2018-19, the production by MTPS I has been significantly lower than its
capacity of 840 MW with a PLF of 81%, 77.88%, 69.39%, and 78.92%. Even the
5https://www.tangedco.gov.in/linkpdf/tmtps.pdf 6https://www.thermalwatch.org.in/resources/plant-load-factor

Analysis report on the declining efficiency of Mettur Thermal Power Stations AT|20190911
more recently commissioned unit of the power plant, MTPS II with a capacity of
600 MW, operated with a low PLF of 74.49% , 65.55%, 67.5% and 79.74%. The 7
performance of both MTPS I and MTPS II appears to be fluctuating, with neither
plant yet working at an optimal capacity (see figure 2).
Figure 2: Actual production vs installed capacity (MW) for the four years.
7https://www.tangedco.gov.in/linkpdf/mtps2.pdf

Analysis report on the declining efficiency of Mettur Thermal Power Stations AT|20190911
2. Coal consumption and ash content in coal: Through the analysis of ES, it
was found that in 2015-16 ash content of coal used in MTPS I was 33.28%, after
which it rose to 35.12%, 34.86% and further reduced to 32.16% in 2018-19. At
MTPS II, the ash content of coal had risen from 27.36% to 35.91% in the same
period which is beyond the 34% limit stipulated in its Environmental Clearance
(EC). Also, this violates the stipulation in the Environment (Protection)
Amendment Rules, 2014 which stipulates the same criteria of ash content under
34% (see figure 3).
Figure 3: Percentage (%) of ash content in coal.
It was observed that the efficiency of power generation in Units Per Kilogram
(units/Kg) of coal consumed for MTPS I was 1.43, 1.40, 1.42, and 1.43, and for
MTPS II was 1.58, 1.51, 1.46 and 1.45 from year 2015-19. In simple terms, it
means that for each kilogram of coal consumed, the units generated by the power
station was constant for MTPS I and had decreased for MTPS II in respective years.
This, when seen with the use of coal with higher ash content, indicates that the
efficiency of the plant has been adversely impacted by using coal with a higher ash
content.
3. Ash generation and utilisation: All coal power plants are required to
completely utilise the fly ash generated by them. As for MTPS, it is observed
that the highest level of fly ash generated, 1.44 million tons (MT) in MTPS I, was
in 2016-17 and its utilisation was the highest, 132%, in the year 2015-16. This
could be due to utilisation of 0.465 MT of fly ash from the 18.53 MT of ash
available as balance stock from previous years. In MTPS II, the generation of fly

Analysis report on the declining efficiency of Mettur Thermal Power Stations AT|20190911
ash was highest (0.71 MT) in 2018-19 and its utilisation was the highest,
98.19%, in 2016-17 (see figure 4).
Figure 4: Fly ash generation (MT) vs fly ash utilisation (MT).
In 2017-18, fly ash utilisation reduced to 36.80% and 73.08% in MTPS I and MTPS
II respectively, which is a violation of the 100% fly ash utilisation target that had to
be achieved from 2014 onwards stipulated through a Notification in 2009. In case

Analysis report on the declining efficiency of Mettur Thermal Power Stations AT|20190911
of MTPS II, it is also a violation of the EC condition where it is stipulated that
“100% utilisation of fly ash shall be achieved from day one”.
4. Water utilisation: For every megawatt hour, a coal-based power plant is
mandated to use only up to 3.5 cubic metres of water, as per MoEFCC
notification in 2015. In a flagrant violation of this rule, MTPS I has been
consuming nearly twice this amount. In contrast, in MTPS II, water consumption
is much lesser and within the stipulated limit. An analysis of the water utilisation
for MTPS I showed that the water consumed for process, cooling and domestic
purpose is 182.90% (2015-16), 179.50% (2016-17), 190.67% (2017-18) and
183.59% (2018-19) of the permitted limit (see figure 6).
Figure 6: The water consumed in MTPS I and MTPS II.

Analysis report on the declining efficiency of Mettur Thermal Power Stations AT|20190911
Since coal power plants are water-intensive, the National Tariff Policy in 2016
required all coal plants to use treated water if there was a Sewage Treatment Plant
within a 50 km radius. This then mandates that MTPS meet its freshwater
requirement from the sewage treatment plants (STPs) of Mettur municipality with a
capacity of 6,374 KLD working within a 50 km radius of MTPS. The STP pointed 8
with yellow arrow is located 2.84 Km from MTPS (see figure 7). However, as per the
documents provided to us, MTPS does not use the treated water, and instead relies
on Cauvery to meet its water requirement.
Figure 7: Distance measured between MTPS and Mettur Sewage Treatment Plant
on Google Earth.
Conclusion
This study establishes falling efficiency of the four units of MTPS I, which have been
operating for 29-32 years now, and the nearly 6 year old unit of MTPS II, as
observed in the study period. Despite the fact that efficiency in MTPS I seems to
have marginally improved this year, it is low compared to 2015-16 and 2016-17.
Further, it has been observed that MTPS II, although a recently commissioned
plant, has been performing sub-optimally, recording a PLF of about 79.74% so far
this year. The power plant is operating in violation of multiple rules and standards,
summarised below:
1. Utilisation of coal with ash content higher than 34% ash content transgress the
Environment (Protection) Amendment Rules in 2014.
8https://www.tnpcb.gov.in/pdf_2019/PrsCauvery24919.pdf

Analysis report on the declining efficiency of Mettur Thermal Power Stations AT|20190911
2. Non-compliance with 100% Fly Ash Utilisation notification, 2009 even 5 years
after the deadline.
3. Negligence in the norm of 3.5 cum/MWh water utilisation in line with MoEFCC
notification in 2015, and
4. Operating in violation of the National Tariff Policy, 2016 by not utilising treated
sewage water for the plant.
The poor performance of MTPS is intensifying the depth of consequences like water
crisis , air pollution and deterioration of the three ecologically sensitive areas- 9
Vanavasi, Gonur and Mettur Palamali reserved forests -within 25 kilometers radius
from the plant. Moreover, it is stressing the water of Cauvery , a major river and 10
source of livelihood for farmers, fishermen and others living along the river bank in
Salem district and for a number of miles in the other downstream districts of 11
Tamil Nadu.
This provides a compelling reason to expedite the process of decommissioning the 12
four units of MTPS I in line with the note of CEA, which suggests retirement of
plants which are inefficient or older than 25 years. Instead of planning to
commission more power plants, the state utility should channelise its efforts in
improving the efficiency of existing plants such as MTPS II. Although, the
decommissioning of MTPS I will decline its installed capacity by 58.33%, it will
significantly decline the freshwater utilisation by 79.96%, coal consumption by
64.88%, and fly-ash generation by 67.30% (see Annexure I). Following the
analysis, we propose the following as the way forward:
● Decommission the four units (4X210MW) of MTPS I.
● In its mainland, install a 22 MW linear fresnel concentrated solar power (CSP)
plant along with a thermal energy storage (TES) which operates with 50% 13
Capacity Utilisation Factor (CUF) . 14
● Improve the PLF of 600 MW MTPS II to develop an efficient coal-solar hybrid
system with this 22 MW CSP plant. 15
● Establish the proposed 100 MW floating solar photovoltaic (FSPV) which 16
operates with a CUF of 35% over the Stanley reservoir of Mettur Dam. 17
9https://www.indiatoday.in/india/story/tamil-nadu-water-crisis-dead-fish-wash-up-taps-go-dry-chennai-water-shortage-1553152-2019-06-2 10https://www.academia.edu/10449260/Impacts_of_Coastal_Coal_Based_Thermal_Power_Plants_on_Water_Report_of_Visit_to_Some_Operational_and_In_Pipeline_Plants_in_Andhra_Pradesh_and_Tamil_Nadu 11https://indiaclimatedialogue.net/2019/05/17/photo-feature-coping-with-a-stressed-cauvery/ 12https://www.cag.org.in/sites/default/files/database/coal_power_plants_in_tn-_a_decade_of_false_starts_and_falling_performances.pdf 13https://shaktifoundation.in/wp-content/uploads/2017/09/State-of-CSP-in-India.pdf 14https://www.sciencedirect.com/science/article/pii/S1876610215005135/pdfft?isDTMRedir=true&download=true 15https://academic.oup.com/ce/article-pdf/2/1/1/25132271/zky004.pdf 16https://www.saurenergy.com/solar-energy-news/tamil-nadu-planning-to-bid-out-250-mw-floating-solar-projects 17http://aquaticcommons.org/9512/1/na_2285.pdf

Analysis report on the declining efficiency of Mettur Thermal Power Stations AT|20190911
● Install Rooftop Solar Photovoltaic (RTPV) to its overall potential of 242 MW
operates with a CUF of 20% in Salem district as per Rooftop Revolution Report
in 2018.
The installed capacity of MTPS would reduce to 600 MW after the retirement of
MTPS I. However, it can be enhanced to 964 MW from the above recommended
measures (see Annexure II). Further, an expansion of the Floating solar plant by
TANGEDCO on 14,690 ha of water spread area of stanley reservoir of Mettur Dam 18
-in line with Tamil Nadu Solar Policy in 2019- can highly contribute to achieving 19
the target installation of 9,000 MW solar capacity in Tamil Nadu by 2023. Also, it
contributes to water conservation by reduction in evaporation from the reservoir 20
and will eventually fill up the post-decommissioning gap of 477 MW power
generation in the Mettur thermal power plant.
References
1. Mettur Thermal Power Plant-I, Environmental Statement (2015-16).
2. Mettur Thermal Power Plant-I, Environmental Statement (2016-17).
3. Mettur Thermal Power Plant-I, Environmental Statement (2017-18).
4. Mettur Thermal Power Plant-I, Environmental Statement (2018-19).
5. Mettur Thermal Power Plant-I, TANGEDCO’s Brief Report.
6. Mettur Thermal Power Plant-I, Tariff Filing Forms: For Determination of Tariff.
7. Mettur Thermal Power Plant-II, Environmental Statement (2016-17).
8. Mettur Thermal Power Plant-II, Environmental Statement (2017-18).
9. Mettur Thermal Power Plant-II, Environmental Statement (2018-19).
10.Mettur Thermal Power Plant-II, TANGEDCO’s Brief Report.
11.Mettur Thermal Power Plant-II, Tariff Filing Forms: For Determination of Tariff.
12.Mettur Thermal Power Plant-II, Environment Clearance (2007). 13.Fly Ash Generation Report (2015-16).
14.Fly Ash Generation Report (2016-17).
15.Fly Ash Generation Report (2017-18).
16.Load Generation Balance Report (2016-17).
17.Load Generation Balance Report (2017-18).
18.Load Generation Balance Report (2018-19).
19.Load Generation Balance Report (2019-20).
Written by Aakanksha Tiwari, Researcher- Environment and Climate Action
Tags: Coal; Energy demand; Cauvery river; Water crisis; Decommissioning of
thermal power plant
18http://aquaticcommons.org/9512/1/na_2285.pdf 19https://www.saurenergy.com/solar-energy-news/tamil-nadu-planning-to-bid-out-250-mw-floating-solar-projects 20http://www.iosrjen.org/Papers/Conf.19050-2019/ELECTRICAL/Volume-2/5.%2028-34.pdf