SERVICE QUALITY IN HIGHER EDUCATION: MANAGEMENT STUDENTS' PERSPECTIVE
Upload
khangminh22Category
view
3download
0
The Economic and Social Research Foundation (ESRF)
THDR 2014: Background Paper No. 9ESRF Discussion Paper 63
2014 www.esrftz.org
DECLINING QUALITY OF EDUCATION: SUGGESTIONS
FOR ARRESTING AND REVERSING THE TREND
By Prof. Suleman Sumra and Dr. Joviter K. Katabaro


THDR 2014: Background Paper No. 9, ESRF Discussion Paper 63 | i
DECLINING QUALITY OF EDUCATION: SUGGESTIONS FOR ARRESTING AND
REVERSING THE TREND
ByProf. Suleman Sumra and Dr. Joviter K. Katabaro
THDR 2014: Background Paper No. 9ESRF Discussion Paper 63
ISBN: 978-9987-610-98-3@ 2014 Economic and Social Research Foundation
Email: [email protected] • Website: www.esrftz.org
Published by:

ii | THDR 2014: Background Paper No. 9, ESRF Discussion Paper 63
List of Tables and Charts ....................................................................................................... iiiAcronyms................................................................................................................................ ivAbstract ................................................................................................................................... vIntroduction ............................................................................................................................ 1
Declining Quality of Education: Increased Schooling, Little Learning .............................. 3 Findings from Uwezo Assessments ..............................................................................................................................5 Findings from SACMEQ Assessments .........................................................................................................................8 Findings from EGRA, EGMA National Assessments ......................................................................................... 10 National Examinations: PSLE .......................................................................................................................................... 11 National Examinations: CSEE Results ........................................................................................................................ 12
Why is Education not delivering? ........................................................................................ 15 Lack of Vision for Education: Lessons from History .......................................................................................... 15 Teachers and Teaching ...................................................................................................................................................... 19 Language of Instruction: An Issue Dead and Buried? .................................................................................... 25
Unprepared Youths Seeking Employment ......................................................................... 29
The Way forward ................................................................................................................... 30 Evidence based Policy Making ..................................................................................................................................... 30 Collaboration with Different Stakeholders............................................................................................................ 31 Measuring Success by Competencies developed ........................................................................................... 31 Preparing Youths for Employment ............................................................................................................................. 32 Revamping Technical and Vocational Education .............................................................................................. 34 Developing a clear vision for Education ................................................................................................................. 36 Value for Money: Financing Education .................................................................................................................... 37 Teachers and Teacher Support over Infrastructure .......................................................................................... 41 Resolving the Language of Instruction Issue ...................................................................................................... 42 Is the Big Results Now (BRN) the Solution?........................................................................................................... 43
Conclusions ........................................................................................................................... 44References ............................................................................................................................. 45List of Experts Consulted ..................................................................................................... 46
Table of Contents

THDR 2014: Background Paper No. 9, ESRF Discussion Paper 63 | iii
List of Tables
Table 1: Highest education level achieved by Adults in Tanzania (1991/92 – 2007) ............................2Table 2: Top 5 and Bottom 5 Districts: Percentage of Children Passing all Subjects Tested by
Districts, 2012 ..................................................................................................................................................................7Table 3: Level and trends in Pupil Achievement for SACMEQ Countries ....................................................9Table 4: Percentages of Pupils Reaching Various Levels of Competence in Reading .......................... 9Table 5: Percentages of Pupils Reaching Various Levels of Competence in Mathematics ............. 10Table 6: Performance in CSEE by Ownership of Schools 2007 ........................................................................ 13Table 7: Number of qualified teachers and qualified teacher-pupil ratio ................................................ 20Table 8: PTR by Regions ............................................................................................................................................................ 21Table 9: Student Teacher Ratio (STR) in Government and Non-Government Secondary Schools ............................................................................................................................................................................ 22Table 10: School Inspection for 2012/2013 .................................................................................................................... 23Table 11: Selected Statistics for the Education Sector Expenditure ................................................................ 38Table 12: Allocation of Education Sector Budget by Sub-Sectors .................................................................... 38Table 13: Decomposition of Wage Bill by Sub - Sectors 2013/14 ..................................................................... 39Table 14: Estimates of Per- Primary School Spending by Regions ................................................................... 39Table 15: Estimates of Expenditure per Student.......................................................................................................... 40
List of Charts
Chart 1: GER and NER in Secondary Schools 2002 - 2012 ......................................................................................4Chart 2: Percent of Children who can read A standard 2 Level Story in Kiswahili ..................................5Chart 3: Percentage of Children who can Read a Standard 2 Level Story in English ............................6Chart 4: Percentage of Children Meeting Standard Two Level in Numeracy.............................................7Chart 4: English Reading Levels by Family and Income ..........................................................................................8Chart 5: Pupils Passing PSLE by Grades A, B and C 2001-2013 ......................................................................... 11Chart 6: Pass Rates in Form 4 Examinations (CSEE) by Divisions 2001-2013 ........................................... 12Chart 7: Number of Secondary School in per cents by Ownership 2002 - 2013 .................................. 13
List of Tables and Charts

iv | THDR 2014: Background Paper No. 9, ESRF Discussion Paper 63
ACSEE Advanced Certificate for Secondary Education ExaminationAK AkaziKanozeATE Association of Tanzanian EmployersBEST Basic Education Statistics TanzaniaCSEE Certificate for Secondary Education ExaminationEDC Education Development CorporationEFA Education for AllEGRA Early Grade Reading AssessmentEGMA Early Grade Mathematics AssessmentETP Education and Training PolicyESR Education for Self RelianceGER Gross Enrolment RateGoR Government of RwandaHBS Household Budget SurveyIEG Independent Evaluation GroupLOI Language of InstructionMDAs Ministries, Departments and AgenciesMDG Millennium Development GoalsNACTE National Council for Technical EducationNECTA National Examinations Council TanzaniaNER Net Enrolment RateNSGRP National Strategy for Growth and Reduction of PovertyPEDP Primary Education Development ProgrammePRSP Poverty Reduction Strategy PaperPSLE Primary School Leaving ExaminationPTR Pupil Teacher RatioSACMEQ The Southern and Eastern African Consortium for Monitoring Educational QualitySEDP Secondary Education Development PlanSSME Snapshot of School Management EffectivenessSTR Student Teacher RatioSTWT School to Work TransitionTANU Tanganyika African National UnionTPR Teacher Pupil RatioUPE Universal Primary EducationUSAID United States Agency for International DevelopmentUTS Unified Teacher ServiceVETA Vocational Education and Training AuthorityVTC Vocational Training CentresWR Work Readiness
Acronyms

THDR 2014: Background Paper No. 9, ESRF Discussion Paper 63 | v
Abstract
This paper looks at the issue of falling quality of education in the last two decades. The issue of quality in education is complex and multi-faceted. Quality of education can be looked at from the input, process, output and outcome perspectives. This paper focuses on quality
of education from outcome level. We examine quality in terms of learning outcomes among children. Information for the paper was mainly obtained through desk study of various reports and publications. Key individuals were interviewed to get their perspectives on the current situation and ways in which the situation can be rectified.
The paper shows that learning outcomes at primary and secondary levels are poor. Both independent assessments and national examinations findings have been used to make the case. Uwezo findings in 2011 and 2012 show that majority of children in schools are not able to read, both Kiswahili and English, at their class levels. Similar results were evident in the assessment done by RTI for USAID. Results of Primary School Education Leaving Examinations (PSLE) show that a large number of children do not achieve the required knowledge and skills to pass the examination and achieve the intended learning outcomes. In 2012, only 30.7 per cent of the 865,534 pupils who sat for the PSLE passed the examination. Similar situation exists at the secondary school level. In 2012, less than half, 43.1 per cent of all the students who sat for the Certificate of Secondary Education Examinations (CSEE) passed the examinations (BEST 2013). Both the national examinations and independent assessments show poor learning outcomes.
The poor learning outcomes are a result of several factors. In many schools, learning environment is not conducive to learning. Lack of classrooms, toilets, water, and electricity and inadequate supply of (motivated) teachers contribute to poor learning outcomes. Unlike in 1960s and 1970s there is no clear vision that currently drives education in the country,
In order to improve the quality of education, we propose actions that need to be taken. The Government should realise that there is a learning crisis and should put quality of education at the centre of their plans and actions. It is possible for our schools to provide quality education. There are no easy solutions and instead of developing quick fix solutions, evidence based decisions need to be made. As a matter of priority we need to focus on teachers. Quality education can be achieved if we have adequate number of well-trained and motivated teachers. Government needs to ensure that all schools, whether in rural areas or in urban areas, have required number of teachers. Learning environment need to be improved by building enough classrooms, and providing adequate number of textbooks. Schools should provide children with safe and welcoming environment; and parents should have a say on how the schools are run. More than anything else, there should be willingness and commitment from the government to improve quality of education, even for the children living in the remotest parts of the country.
The issue of the language of instruction has an impact on the quality of education. Using Kiswahili as a language of instruction in primary school and English at secondary level creates problems for children from public schools while benefitting children from English medium primary schools. The issue needs to be resolved in an impassionate way and should be in the best interest of the

vi | THDR 2014: Background Paper No. 9, ESRF Discussion Paper 63
children. Uwezo assessments have shown that majority of children finishing primary schools do not have the knowledge to benefit from the English medium secondary schools. If English will continue to be the language of instruction at secondary school level, then teaching of English as a subject at primary school level will need to be vastly improved.

THDR 2014: Background Paper No. 9, ESRF Discussion Paper 63 | 1
‘‘It is now clearly time for us to think seriously about this question: What is the educational system in Tanzania intended to do - what is its purpose? Having decided that, we have to look at the tasks it has to do. In the light of that examination we can consider whether, in our present circumstances, further modifications are required or whether we need a change in the whole approach.’’ (Nyerere: 1967)
The above quote from Mwalimu Nyerere is as valid today as it was at the time when he was writing the policy paper Education for Self Reliance. Despite the changes in the education provision and despite implementation of Primary Education Development Programmes
(PEDP) and Secondary Education Plan (SEDP) since the turn of the century, we are unclear about the philosophy that is guiding the education sector. In order to accelerate development and benefit from opportunities provided by globalisation and by being a member of the East African community, Tanzania needs to develop its human resources to be competitive in the labour markets. This entails providing our youths with knowledge, skills and capabilities that are appropriate for the 21st Century global labour market.
In 1960s, Theodor Schultz, a Nobel Prize winning economist, established the term “Human Capital” (Berger: 2006) to differentiate between different types of workers. Human Capital is the stock of competencies, knowledge, social and personality attributes, including creativity, embodied in the ability to perform labour so as to produce economic value. Human Capital Theory argues that investment in human capital leads to greater economic outputs. It suggests that education or training raises the productivity of workers by imparting useful knowledge and skills, hence raising workers’ future income by increasing their lifetime earnings (Becker: 1964). Human capital theory influenced policies in many countries, including Tanzania that saw investment in education as having direct impact on national growth.
An expanding economy like Tanzania requires highly skilled labour force. It is obvious that the country needs to invest heavily in education to build its human capital. Lack of adequately educated workforce can be a hindrance to investments in sectors such as manufacturing, construction, mining, agriculture, finance, communications etc. Impressive increases in investments have been achieved at secondary and tertiary levels as well. Researchers have shown that increases in enrolment only, though important, are not fundamental to economic development. Hanushek and Wobmann (2007), among others, have established that it is not enrolment per se, but the quality of education and learning outcomes that is more strongly correlated with economic development. That is an area in which the Tanzanian education system faces major challenges.
Table 1 gives the snapshot of the education levels of the Tanzanian population by location. This table shows that two decades of efforts have not made a big difference in the education levels of the adult population. In Dar es Salaam for example, the proportion of people with university education dropped from 2.9 percent in 2000/01 to 2.6 percent in 2007. Proportion of adults with no education has remained stagnant, around 28 per cent.
Introduction

2 | THDR 2014: Background Paper No. 9, ESRF Discussion Paper 63
Table 1: Highest education level achieved by Adults in Tanzania (1991/92 – 2007)
LevelDar es Salaam Other Urban Rural Mainland
91/92 00/01 2007 91/92 00/01 2007 91/92 00/01 2007 91/92 00/01 2007
No education 9.0 7.6 7.9 13.0 13.1 12.1 28.0 29.0 28.5 24.9 25.2 23.6 Adult education 1.2 0.9 0.4 1.3 1.1 0.7 3.7 2.3 1.2 3.3 2.1 1.1
P. 1 - 4 8.6 6.4 5.2 14.3 9.8 7.9 15.8 12.8 12.3 15.2 11.9 10.9 P. 5 - 8 57.0 60.6 57.0 58.8 57.6 58.9 49.0 52.5 52.4 50.7 53.8 54.0 F.1 – 4 17.4 14.9 16.6 8.9 12.7 13.7 2.1 2.2 4.1 3.9 4.6 7.0 F. 5 - 6 1.4 1.7 2.4 1.0 0.9 1.0 0.1 0.2 0.2 0.3 0.4 0.6 Diploma/ University 1.6 2.9 2.6 0.4 0.7 0.9 0.0 0.1 0.3 0.2 0.4 0.6
Course after primary 0.2 1.6 2.0 1.1 1.4 1.4 0.8 0.4 0.5 0.8 0.6 0.8
Course after secondary 2.3 2.7 4.8 0.6 2.2 2.8 0.2 0.2 0.4 0.4 0.7 1.1
Course after F. 6 n.a. n.a. 0.8 n.a. n.a. 0.4 n.a. n.a. 0.0 n.a. n.a. 0.2
Other certificate 1.3 0.8 1.1 0.6 0.6 0.4 0.2 0.2 0.1 0.3 0.3 0.2
Total 100.0 100.0 100.0 100.0 100.0 100.0 100.0 100.0 100.0 100.0 100.0 100.0 In this table P stands for Primary levels, i.e. Primary one through to Primary eight.
F stands for secondary levels, i.e. Form one to Form six.Source: Household Budget Survey, 2007
Proportion of the population with secondary and above levels of education is low, less than 10 per cent, and most of these are in Dar es Salaam. This table shows, even in terms of quantity, great effort is necessary to improve the human capital in terms of education to increase productivity and bring growth in the country.
This paper is divided into four sections. In the first section we will produce evidence to show that schools are not delivering. The aim of education is to provide knowledge and develop various skills such as communication, intellectual, and, interpersonal. Education also develops core-ethical values such as respect for others, respect for work, love for the nation, honesty, truthfulness and empathy towards weaker members of the society. For the purpose of this paper we limit the discussion on education to its academic role, making children master subject matter and develop basic skills in literacy and numeracy. In the second section we will discuss reasons behind poor learning outcomes. In the third section, we will discuss the outcome of poor learning on the issue of youth employment and the failure of education in producing youths with marketable skills. In the fourth section we will discuss possible actions that can be taken to overcome the identified problems.

THDR 2014: Background Paper No. 9, ESRF Discussion Paper 63 | 3
Education and Training Policy (URT: 1995) stipulates aims and objectives of education for various levels. For primary level the policy states that the aims and objective of primary education are, among others, “to enable every child to acquire basic learning tools of literacy, communication, numeracy and problem solving as well as basic learning content of integrated relevant knowledge, skills and attitudes needed for survival and development to full capacity” (URT 1995, 5). PEDP III states that the aim of primary education “is to enable every child to acquire basic skills of literacy, communication, numeracy and problem solving as well as basic learning content of integrated relevant knowledge skills and attitudes needed for survival and development to full capacity; provide the child with the foundations leading to self-initiative, self-advancement and self-confidence; prepare the child for second level education (secondary, vocational, technical and continuing education) and; prepare the child for the world of work” (URT 2012a).
These objectives have guided the plans to develop primary and secondary education in the country. The first Primary Education Development Programme (PEDP) was implemented from 2001 to 2006. The PEDP I recorded several successes, the key being significant increases in enrolment in primary education, both for boys and girls. Focus of PEDP was to increase inputs to solve problems in primary education. It does not talk of what kind of primary school graduates the country need to produce. The focus of the document is on increasing enrolment through increased resources to the primary sector – resources to be used for constructing classrooms, recruiting more teachers, providing more funds to schools, and so on.
The highest priority of PEDP was to increase overall gross and net enrolment of girls and boys (URT: 2001, 4). PEDP aimed at achieving UPE by enrolling all the children between the ages of 7 to 13 into Standard 1 by 2005. To ensure that children of the poor are enrolled, the government decided to abolish school fees in 2002. Since 2002, there has been a dramatic increase in enrolment. In 2002, the first year of PEDP, standard one enrolment increased by 23.4 percent. In 2002 there were more than a million children in primary schools than in 2001 (URT: 2003)
By 2010, the GER was 97.6 for boys and 99.2 for girls and the Net Enrolment Ratio (NER) was 91.4 for boys and 92.5 for girls (URT, 2012). This indicates that nearly all the children between the ages of seven and 13 were enrolled in primary schools. However, the momentum was not sustained. Number of both boys and girls in primary education has been falling since the initial years of PEDP implementation. Enrolments of both boys and girls in 2012 were lower than in 2009 despite the growth of population. In 2012 there were 4,086,280 boys in primary schools compared to 4,248,764 in 2009 and number of girls had fallen from 4,192,789 in 2009 to 4,160,892 in 2012. The trend has continued as shown by the recent BEST (URT: 2014) data. Both the NER and the GER have fallen during the period. The GER and NER fell from 110.5 and 95.9 in 2009 to 98.4 and 92.0 in 2012 and to 96.2 and 89.7 in 2013 indicating that proportionally there are fewer children in school than before. The problem is much worse in some regions. In Kigoma, for example, 27 out of every 100 school going age children (7 to 13) are not enrolled in school. Even in Dar es Salaam, 26 out of every 100 children are not in school. Nearly a million children, between the ages of 7 and 13 are not currently in primary schools. The problem is further compounded by high dropout rates in primary schools.
Declining Quality of Education:Increased Schooling, Little Learning

4 | THDR 2014: Background Paper No. 9, ESRF Discussion Paper 63
In 2012, nearly 55,302 children dropped out before completing their primary education, 12,021 of them in standard one (URT: 2014). If the current trend continues, and unless some urgent measures are taken by the government, Tanzania is unlikely to meet its educational millennium goals. At primary school level, the nation faces crisis of both access to and quality of primary education, our achievements during the last decade are being eroded.
The initial increase in enrolment was made possible by massive construction efforts, whereby new classrooms and in some cases new schools were constructed. Government also recruited more teachers and ensured that schools were provided with adequate teaching and learning materials. With increased enrolment and large number of pupils graduating from primary education a Secondary Education Development Plan was developed in 2003, similar to PEDP for primary education. Implementation of SEDP led to significant increases in secondary school enrolment as shown by Chart 1.
Source: BEST (2001 to 2013)
Within a decade both GER and NER for lower secondary schools (F.1 to 4) rose from less than 10 percent to more than 30 percent, a significant achievement for a poor country like Tanzania. However, even at secondary school level there is decline in GER and NER in 2013.
For secondary education, the aims and objectives stipulated by ETP is “to provide opportunities for the acquisition of knowledge, skills, attitudes and understanding in prescribed or selected fields of study” (URT: 1995, 6). What children should learn at each level is specified in greater detail in proscribed syllabi for each subject at primary and secondary levels. In the next section we will discuss how far children acquire specified skills and knowledge for their level.
Although enrolment ratios, both at primary and secondary levels, have fallen in last years we can reasonably be satisfied with the efforts of the government to put most children in school. It is the quality of education provided, and what our children acquire during schooling that raises an alarm to the public. Next sections will discuss how much learning is taking place in our schools.

THDR 2014: Background Paper No. 9, ESRF Discussion Paper 63 | 5
Findings from uwezo Assessments
As noted earlier, the implementation of PEDP and SEDP has led to massive increases in enrolment, but there are concerns that learning outcomes have not improved. We will examine evidence both from the national examinations and from independent assessments of learning outcomes. The largest ever assessment of learning outcomes in the country was carried out by Uwezo Tanzania in 2011 and their findings are depressing. Around 100,000 and 40,000 children were assessed in all the 133 districts in the country. Uwezo assessed children’s reading ability in Kiswahili and English and their numeracy competencies. The tests used by Uwezo were based on standard two syllabi in the three subject areas of Kiswahili, English and Maths (Uwezo: 2011). A primary school syllabus stipulates that children by end of class two should be able to read simple texts in English and Kiswahili and be able to do simple additions, subtractions and multiplications.
Chart 2: Percentage of Children who can read a Standard 2 level Story in Kiswahili: By Class, Gender and Location
Source: Uwezo 2011
As the tests developed were at standard 2 level, it was expected that all the children in standard 3 would be able to read the text. The findings were particularly surprising for Kiswahili literacy as it is the national language and is used widely in all forms of communication. In standard 3, where the expectation was that all children would be able to read the simple text in Kiswahili, only one-third of the children were able to do so. In urban areas nearly half of the children were able to read compared to less than one-third in rural areas. By standard seven, 21 children out of 100 in rural areas and 13 children out of 100 in urban areas were unable to read the standard two text. It was particularly worrying that 19 out of 100 children finishing their primary schooling were illiterate. These illiterate primary school graduates add to the pool of illiterate people in the country after their primary school. Girls’ performance was slightly better than that of boys. Uwezo assessment conducted in 2012 had similar results. The 2012 findings mirror the findings of the previous two years in relation to outcomes by gender. Girls outperformed boys at all ages in reading a Kiswahili story. For example, 53 per cent of girls aged 12 years were able to read a Kiswahili story compared with 46 per cent of boys of the same age. Similarly six out of 10 girls aged 14 years passed the Uwezo Kiswahili test as compared to five out of 10 boys.
Although large number of primary school pupils was unable to read the Kiswahili text, reading levels for English were even poorer.

6 | THDR 2014: Background Paper No. 9, ESRF Discussion Paper 63
Chart 3 shows the number of children who were able to read a standard two level English text. As most of communication in Tanzania is done in Kiswahili, the importance of English is low. However, for children finishing primary education it is important to have gained enough knowledge of English to enable them to cope with English as a medium of instruction in secondary schools. English reading levels were very low for all classes. There were no significant gender differences in reading English, as both females and males from pre-school to Standard seven did not perform well. Although reading English was a challenge for children in both urban and rural settings, urban children were generally better readers than rural children. Nationwide, just over 50 percent of all children in standard seven were able to read a standard two level English story. With respect to English acquisition, girls marginally outperformed boys at almost all ages. For example, among children aged 13 years, 37 per cent of boys were able to read an English story compared with 40 per cent of girls. Similarly, at age nine, eight per cent of boys passed the English test as compared to 10 per cent of girls.
Uwezo carried out another national assessment in 2012. Results for both Kiswahili and English were similar to the Uwezo assessment done in 2011. Both Uwezo 2011 and 2012 showed that very few children were learning to read in early primary school. Nationally, only 1 in four children in standard three read a standard two level story in Kiswahili. It is not until standard five that a majority of students were able to read at standard two level. Competence in reading and comprehending a story in English remained low. Uwezo 2012 confirmed that rates of English literacy were significantly poorer than rates of Kiswahili literacy in all classes. By standard seven, half of all students leaving primary school had not acquired basic English reading skills, which is the medium of instruction in secondary school.
Uwezo also assessed children for their ability in basic numeracy. The findings from the survey showed that overall 65 percent of children in standard seven were able to solve a standard two multiplication problem. The situation was not encouraging. For example, only 15 percent of children in standard two were able to solve standard two multiplication problems. As with literacy skills, urban children outperform rural children in numeracy, though there was not a large difference between girls and boys.

THDR 2014: Background Paper No. 9, ESRF Discussion Paper 63 | 7
Source: Uwezo 2011
Numeracy results were better than those for literacy. More children seem to be acquiring more skills sooner. Pass rates for the numeracy test in 2012 were higher across all grades. For example, in 2012, about 44 per cent of students in standard three passed the numeracy test compared with 37 per cent in 2011. However the 2012 assessment excluded seven districts and these results will need to be confirmed in future.
As in the other subjects, the gap in performance between boys and girls in numeracy is small. Girls appear to marginally outperform boys at all ages. For example, among children aged 13 years, 76 per cent of girls passed the Uwezo numeracy test at multiplication level compared with 74 per cent of boys. Similarly, among children aged nine years, 36 per cent of the girls passed the Uwezo numeracy test compared to 31 per cent of the boys. For those aged 12 years, 69 per cent of the girls passed the maths test compared to 63 per cent of the boys.
There were three variables that affected children’s performance. The largest effect was due to the location. Children from urban areas performed better than children from rural areas in all the three areas assessed as shown in Table 2.
Table 2: Top 5 and Bottom 5 Districts: Percentages of Children passingall three Subjects Tested by Districts, 2012
District Kiswahili English Maths All 3 Subjects Rank
Temeke 74.2 45.8 80.4 66.8 1Arusha Urban 64.8 55.0 78.4 66.1 2Morogoro Urban 72.3 46.2 77.8 65.4 3Songea Urban 68.2 51.3 75.9 65.1 4Kinondoni 76.1 43.6 73.8 64.5 5Tarime 17.9 12.3 43.4 24.5 122Biharamulo 27.0 9.2 36.3 24.2 123Serengeti 15.4 9.5 44.7 23.2 124Bariadi 18.8 13.9 36.1 22.9 125Kasulu 25.3 5.7 33.0 21.3 126
Source: Uwezo (2013, 6)

8 | THDR 2014: Background Paper No. 9, ESRF Discussion Paper 63
Apart from location, children’s performance is correlated to mother’s educational level and their socio-economic status. Children of better educated mothers tend to do well both in literacy and numeracy. Similarly children from wealthier family perform better than children from poor family. Although mother’s education and socio-economic status affect performance in all the three areas, the effect is more pronounced for English (Uwezo: 2011).
Children whose mothers received higher education perform better in reading English than those whose mothers received less education. About 60 percent of children in standard five to seven whose mother received higher education can read English, compared with 22 percent whose mothers did not attend school. Similarly, about 10 percent of children aged standards one and two whose mother received higher education can read English, compared with 1 percent whose mothers did not attend school (Uwezo: 2011).
Numbers of children who can read a standard two level English story tend to increase as household income increases. Children’s story reading ability is directly linked to the household income. Households with high income recorded 38 percent of children who can read an English story, and on the other hand the same households recorded 15 percent of the children who cannot read anything. Very low income households recorded 20 percent of children who can read an English story, while very low income household recorded great proportion of children who cannot read anything. As the income increases, the number of children who can read a story increases as well.
Chart 5: English Reading Levels by Family Income
Source: Uwezo 2011
Findings from SACMEQ Assessments
The Southern and Eastern African Consortium for Monitoring Education Quality (SACMEQ) paints a much better picture of quality of education in the country. Tanzania became a member of the consortium in 2000 and so far two assessments have been carried out in the country, SACMEQ II in 2000 and the SACMEQ III in 2007. SACMEQ IV is in the planning stage and it is likely to be carried out in 2014.
The ministries of education in relevant countries (14 at the last count) are responsible to carry out the assessment. SACMEQ assesses pupils in standard six in two areas, reading and numeracy. In 2000, about 2854 pupils from 181 schools were assessed. In 2007, the number of children assessed was 4194 from 196 schools.

THDR 2014: Background Paper No. 9, ESRF Discussion Paper 63 | 9
Table3: Level and trends in Pupil Achievement for SACMEQ Countries
CountryPupil Reading Scores Pupil Mathematics Scores
2000 2007 2000 2007Botswana 521.1 534.6 512.9 520.5Kenya 546.5 543.1 563.3 557.0Lesotho 451.2 467.9 447.2 476.9Malawi 428.9 433.5 432.9 447.0Mauritius 536.4 573.5 584.6 623.3Mozambique 516.7 476.0 530.0 483.8Namibia 448.8 496.9 430.9 471.0Seychelles 582.0 575.1 554.3 550.7South Africa 492.3 494.9 486.1 494.8Swaziland 529.6 549.4 516.5 540.8Tanzania 545.9 577.8 522.4 552.7Uganda 482.4 478.7 506.3 481.9Zambia 440.1 434.4 436.2 435.2Zanzibar 478.2 533.9 478.1 486.2Zimbabwe 504.7 507.7 - 519.8SACMEQ 500.0 511.8 500.0 509.5
Source: IIEP (2010) 4
Table 3 show that in 2007 pupils in Tanzania outperformed pupils in all the other countries in their reading competency. For Tanzania, the mean reading score increased from 545.9 to 577.8, an increase of 31 points. Similarly the mean score for numeracy increased from 522.4 to 552.7, an increase of 31 points. For Tanzania, the mean scores of standard six pupils showed a high levels of achievements both in 2000 and 2007 as the scores were significantly higher than the SACMEQ means.
SACMEQ measures of assessing literacy and numeracy are different from those used by Uwezo. SACMEQ measures pupils reading ability by eight levels of competencies and similarly numeracy competencies are also measured by eight levels of abilities. Pupils achieving various levels of reading and numeracy competency levels are shown in Tables 4 and 5. It is not clear why the SACMEQ findings are different from those of Uwezo. This may be due to the different approaches used by these two assessments.
Table 4: Percentages of Pupils Reaching Various Levels of Competence in Reading
Level Reading Levels Reading Competency 2000 2007 Change
1. Pre-reading Matches words and pictures involving concrete concepts and everyday objects 2.8 1.4 -1.4
2. Emergent Matches words and pictures involving prepositions and abstract concepts 5.5 2,1 -3.4
3. Basic Interprets meaning (by matching words and phrases, completing sentences), 9.4 6.6 -2.8
4. Reading for meaning Reads to link and interpret information located in various parts of the text 18.9 12.0 -6.9
5. Interpretive Interprets information from various parts of the text in association with external information 21.4 16.9 -4.5
6. Inferential Reads to combine information from various parts of the text so as to infer the writer’s purpose 20.6 28.0 +7.4
7. AnalyticalLocates information in longer texts (narrative, document or expository) in order to combine information from various parts of the text so as to infer the writer’s personal beliefs (value systems, prejudices and biases).
18.8 26.8 +8.0
8. Critical Reads from various parts of the text so as to infer and evaluate what the writer has assumed about both the topic and the characteristics of the reader 2.7 6.2 +3.5
Source: IIEP (2010) 4

10 | THDR 2014: Background Paper No. 9, ESRF Discussion Paper 63
Table 4 shows that majority of the standard six pupils had achieved high levels of reading competencies, although there were few who had not attained basic levels of literacy competency. SACMEQ report does not state what level of competency pupils were required to achieve in standard six. Overall, according to SACMEQ, majority of standard six pupils had achieved high levels of reading competencies. Between 2000 and 2007, more children were able to achieve higher levels of reading competencies than in 2000. In Table 5 performance in mathematics is equally impressive. Average performance in mathematics for all the SACMEQ countries increased by only 9.5 points compared to an increase of 30.3 points for Tanzania.
Table 5: Percentages of Pupils Reaching Various Levels of Competence in Mathematics
Level Numeracy Levels Mathematical Competency 2000 2007 Change
1. Pre – numeracy Applies single step addition and subtraction 2.8 0.7 -2.1
2. Emergent Applies a two-step addition and subtraction involving carrying. 22.7 12.6 -10.1
3. Basic Translates verbal information into arithmetic operations. 35.0 29.8 -5.2
4. Beginning Translates verbal or graphic information into simple arithmetic problems. 21.4 25.5 +4.1
5. Competent Translates verbal, graphical, or tabular information into an arithmetic form in order to solve a given problem. 9.9 19.3 +9.4
6. Mathematically skilled
Solves multiple-operation problems (using the correct order) involving fractions, ratios, and decimals. 6.2 8.7 +2.5
7. Concrete problem solving
Extracts and converts information from tables, charts and other symbolic presentations in order to identify, and then solve multi-step problems.
1.6 2.5 +0.9
8. Abstract problem solving
Identifies the nature of an unstated mathematical problem embedded within verbal or graphic information and then translate this into symbolic, algebraic or equation form in order to solve a problem.
0.4 1.0 +0.6
Source: IIEP (2010) 4
Findings from egra egma and ssme national baseline assessment
The national assessment of learning outcomes among Tanzanian children was conducted between October 21 and November 1 in 2013 using the Early Grade Reading Assessment (EGRA) and Early Grade Mathematics Assessment (EGMA) tools to assess children’s reading ability in Kiswahili and English and in mathematics. Data were collected from 200 primary schools in 20 districts. In all the districts, 2,226 standard 2 pupils were assessed (USAID: 2014). Preliminary findings of EGRA showed:
1. Pupils perform much better on the Kiswahili assessment than they do on their English assessment.2. In general pupils perform reasonably well on Kiswahili pre-reading skills (syllable, sounds,
familiar words, and invented words) although even there are too many pupils unable to respond correctly to a single item.
3. Reading comprehension was significantly better for Kiswahili than English. Although 40 percent per cent of the pupils were reading with some comprehension, very few pupils were reading with full comprehension. Nearly 40 percent per cent of the pupils scored zero on comprehension sub-task.
4. Hardly any pupil was able to read English with any level of confidence and none were able to read with confidence.

THDR 2014: Background Paper No. 9, ESRF Discussion Paper 63 | 11
EGMA findings showed:
1. Pupils in standard two did reasonably well on more procedural tasks. On addition level one and subtraction level one pupils scored on average 60 per cent or more on these sub-tasks.
2. Pupils did better on addition than on subtraction. About 22 per cent of the pupils were unable to answer even a single subtraction level one question.
3. Nearly 58 per cent of the pupils were unable to answer subtraction level 2 item correctly such as 18 - 4 =
4. Assessed pupils did better on addition than on subtraction. 22 per cent of the pupils were unable to answer a single level one subtraction item, the easiest of the item being 4 - 1=
Like Uwezo findings the EGRA and EGMA assessment found that the differences in performance by gender were not statistically significant. Pupils in urban areas tended to perform better than pupils in rural areas.
National Examinations: Primary School Leaving Examinations (PSLE)
Chart 6 shows the percentages of pupils passing standard seven examinations. The exam is arguably the most important examination a child will sit in his life. Those who pass the examination can be admitted to government secondary schools. The chart shows that great majority of the pupils passing PSLE do so with a Grade C pass. Poor grades in PSLE mean that they join secondary education with a weak foundation.
Source: URT (BEST data for 2001 to 2013)
Those from well to do families can join private secondary schools if they can afford the cost. Proportion of pupils passing PSLE has increased and decreased over time. The biggest jump in the percentage of pupils passing PSLE came in 2004 when number of pupils passing jumped from 27.5 per cent to 48.7 per cent. If the test questions are standardised then such fluctuations are unlikely to happen.

12 | THDR 2014: Background Paper No. 9, ESRF Discussion Paper 63
Chart 6 shows that after 2006 when the pass rate reached 70 per cent, the pass rate has been fluctuating between 50 and 60 percent. Chart 6 shows that most of those passing PSLE pass with C grade. The number of pupils passing with A grade has been one or less, in out of every 100 students sitting for the exam. In 2013, 1.1 percent of the pupils who sat for PSLE obtained A, 9.7 percent obtained B and 39.8 obtained a C grade. Overall outcome of seven years of primary education is dismal at best. Similar trends can be observed for the national form four examinations.
In secondary schools, girls tend to perform consistently poorly than boys. In 2012, about 35.6 per cent of the boys passed compared to 26.7 per cent of the girls. Not only fewer girls pass the PSLE, but those who do so pass with lower grades. In 2012, for example, 0.5 per cent of the boys passed with an A grade, 6.0 per cent with a B grade and 29.0 per cent with a C grade. On the other hand 0.2 per cent of the girls, less than half as many as boys, passed with an A grade, 3.5 per cent with a B grade and 22.6 per cent passed with a C grade (URT: 2013).
National Examinations: CSEE results
Source: BEST various years
Chart 7 shows that proportion of students passing with divisions 1, 2 and 3 has been declining since 2001. On the other hand those with division 4 and those failing have increased. Those failing have recorded the steepest rise since 2007. Overall, performance of secondary schools, as measured by national examinations, has been dismal.
Pass rates by subjects are equally poor. In 2012 CSEE, only 26.1 per cent of all the students sitting for the English passed. Performance in basic maths was dismal, only 11.3 per cent passed. The pass rate for girls was seven per cent (BEST: 2014). In none of the subject listed in BEST, pass rate was more than 50 per cent. The best pass rate was in Kiswahili where 47.7 per cent passed.
One of the factors that explain such steep rise in failure rate is increased establishment of community schools. If we look at the performance of pupils by ownership of schools, we find that the best
THDR 2014: Background Paper No. 9, ESRF Discussion Paper 63 | 13
performing schools are seminaries followed by government schools, non- government and community schools. Community schools have historically performed poorly because of the nature of their modalities of establishment. Most of the community schools were constructed hurriedly to cater for the expanded intake at secondary due to PEDP I & II. Consequently, no teachers or other related inputs were put in place a prior. Coincidentally, most of the children selected to join these schools had lower pass rates and could not be helped quick enough to catch up with advanced studies, let alone language problems. As such a child selected to join a community school has a much lower chance of passing the CSEE (URT: 2008) as shown in Table 6.
Table 6: Performance in CSEE by Ownership of School 2007
StatusDivision
TotalI II III I-III IV Failed
Government 9.70 12.67 25.52 47.89 45.37 6.75 17,103Community 2.88 7.58 20.08 30.54 57.29 12.17 44,390Private 5.10 8.25 22.31 35.66 55.32 9.02 51,991Seminaries 14.75 14.83 27.20 56.78 39.01 4.22 3,912
Source: URT (2008,65).
We are using data from 2007 to make a point as the BEST in subsequent years do not analyse the CSEE performance by type of school and by gender. Table 6 clearly shows that students in community school perform poorly than in any other type of school. Seminaries are the best performing schools. This situation persists today.
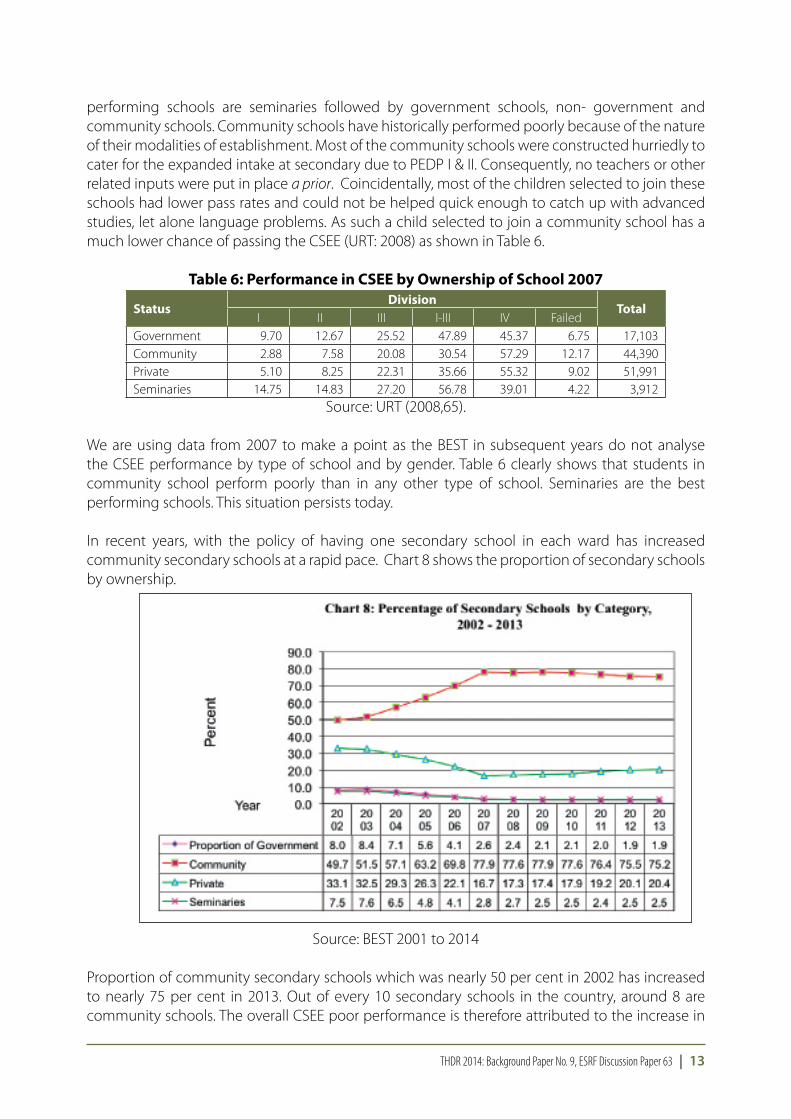
In recent years, with the policy of having one secondary school in each ward has increased community secondary schools at a rapid pace. Chart 8 shows the proportion of secondary schools by ownership.
Source: BEST 2001 to 2014
Proportion of community secondary schools which was nearly 50 per cent in 2002 has increased to nearly 75 per cent in 2013. Out of every 10 secondary schools in the country, around 8 are community schools. The overall CSEE poor performance is therefore attributed to the increase in

14 | THDR 2014: Background Paper No. 9, ESRF Discussion Paper 63
the ratio of the number of community secondary schools. These schools which were built through community efforts most often do not have the required number of qualified teachers, especially teachers for science subjects. The schools lack laboratory facilities as well. Due to lack of teachers and facilities, students in community schools do not do well, especially in science subjects. In the next section we will examine reasons behind the failure of schools to provide quality education to students, both at primary and secondary levels.

THDR 2014: Background Paper No. 9, ESRF Discussion Paper 63 | 15
There are several reasons for the current situation. Although there are many factors that have led to the decline of Tanzanian education quality, given the scope of this paper, we will analyse few key factors that we believe have impacted education the most.
Lack of Vision for Education: Lessons from History?
Historically, Tanzanian educational policies and reforms received high praise from many educators and politicians both nationally and internationally. Tanzania had a vision for education that guided the education policies and practices in years following independence. The vision and the policies changed overtime to meet a changing situation in the country. Nyerere, the first President of the country, was a visionary leader and his vision transcended the education sector. We will examine the visions and the policies that have shaped the current education policies and practices.
Development of Post-Colonial Education
Educational Policies 1961 – 67: Nation Building: The major problem that the government faced in initial years after independence was to create a nation called Tanganyika by uniting a country hitherto divided along ethnic, language, race, religion, and gender and wealth lines. There were more than hundred ethnic groups in Tanganyika, as the country was called then, each with its own language and distinct culture. In order to make various groups in the country to feel that they belong to one nation, education was used by the government as a tool to create a sense of nationhood. Educational polices during this period were defined by three focuses.
Centralisation: The newly empowered rulers sought to establish control over education, the most important ideological apparatus. This led to increasing centralisation of the education system. Prior to independence, various bodies were responsible for provision of education. There were separate administrative authorities controlling education for each of the three races – African, Asian and African- apart from various church bodies. Under the Education Ordinance of 1961, the three segregated education committees were abolished; and in their place a single committee on education was established (Cameron and Dodd: 1970; 174). As a result of this ordinance, education came under the formal control of Tanzania’s Ministry of Education.
The state control of education was further enhanced through legislation passed by the National Assembly in 1962, establishing a Unified Teaching Service (UTS). Under the legislation, UTS became the legal employer of teachers at all levels. Although the voluntary agencies continued to pay the salaries of teachers from grants-in-aid, they lost their independent control over salaries and working conditions and the recruitment and posting of teachers (Morrison: 1976; 96). Despite the control established over voluntary agencies, the continued existence of these agencies had several drawbacks. Most important of these was that the older, Christian agencies, retained considerable influence on the development of education at the local level (Morrison: 1976; 97). These problems eventually contributed considerably to the decision involving nationalisation of schools during the post-Arusha period and the state became practically the only provider of formal education,
Why is Education not delivering?

16 | THDR 2014: Background Paper No. 9, ESRF Discussion Paper 63
although Christian seminaries continued to operate as they were seen as institutions preparing religious leaders.
Uniformity: The second concern of the government was to create a sense of nationhood and overcome racial, religious, and ethnic differences within the society. The second tendency during this period was therefore towards uniformity. The first act was to abolish admission to schools on the basis of race, religion or income. The integration of racially organised school system was to be accomplished from the top down. Higher education in East Africa was already organised along non-racial lines. Secondary schools and primary schools were to follow suit. With independence, curriculum reforms were initiated. The state was anxious for the curriculum to reflect national identity and thereby to prescribe a common syllabus for all children. To achieve integration of primary schools, the Ministry of Education made Kiswahili as the only language of instruction in the primary schools. The policy did away with Gujarati, Punjabi and Urdu that were used as language of instruction in Asian schools. Kiswahili was made compulsory subject up to the school certificate level (Morrison: 1976; 164). The result was that by 1966, African pupils formed the majority of the students in schools previously built for Asian and European children.
The Education Ordinance also made obligatory admission to school on non-religious and non-racial basis. During the colonial period, religion was an important consideration when admitting a pupil to mission-run schools. To overcome continuing religious discrimination, the government established regional selection boards to introduce effective government control over admissions. To reduce disparity in enrolment based on income, fees were abolished in 1963 in all aided secondary schools because they discriminated against children of the poor and therefore mostly against African children (Cameron and Dodd: 1970; 176).
Expansion: The third concern was to meet the increasing demand for high and middle level manpower, the demand made more urgent with the departure of the colonists. The third tendency during the period 1961-66 was expansion of secondary and post-secondary education to meet manpower demands. The First Five Year Plan had set 1980 as the target date for self-sufficiency in trained manpower. The Plan called for slow down of primary education expansion in favour of secondary and tertiary education expansion.
At the beginning of the last plan (1st Five Year Plan) we took a deliberate decision to give priority to the expansion of secondary education, teacher training and the University. …. that meant that we had very little money available to devote to expanding the primary school system. These achievements will contribute greatly to our aim of becoming self-sufficient in the high-level manpower by 1980 (Nyerere: 1969).
By mid- 1960s the basic structures of education in post-colonial period were established and the major problems inherited from colonial education were addressed, or on the way to be addressed. Secondary and higher education had been expanded, a national university had been established, and discrimination in access based on religion and race had been eliminated. Abolition of fees ensured that no child was barred from accessing education. Kiswahili as a medium of instruction in primary schools, and a common curriculum, were part of nation building. This effort was further strengthened by not limiting teachers and students to schools in areas from where they originated. The ruling party then began to focus on the nature of education that was provided and to recast education to help in building a socialist society, which always was the priority of the ruling Party.

THDR 2014: Background Paper No. 9, ESRF Discussion Paper 63 | 17
Education for Self – Reliance: Using education to prepare a socialist person: In 1967 Tanzania decided to follow a socialist path of development. Like during the earlier part of Tanzanian independence, one can see that the process of change in the education sector, like in other sectors, was led by the governing party TANU. Education changes were seen as political issues rather than bureaucratic. Every time changes were made, it was the Party organs that made the changes and directed the government to implement them. That is true for ESR as well. Although ESR was initiated by President Nyerere, it was discussed and approved by the National Executive Committee of the party before the Ministry of Education was directed to implement it. All efforts were used to inform the public about education for self-reliance. Mass media, speeches of leaders, including speeches byPresident Nyerere were used for the purpose. The result was that all stakeholders, parents, student, and teachers became familiar with the purpose and approach of ESR. Nyerere argued for a different kind of education than provided during the colonial period.
The paper called for a complete transformation of the organisation of the schools, the structure of educational system, and the content of learning. It called for reinforcement of cooperative, rather than competitive methods of learning and work, and for the need for student participation and decision-making in the school. Socialist ideology was to permeate the whole of the educational system. Pupils at primary school levels, were to be taught elements of modern agriculture: they were expected to become agents of economic and political change within the Ujamaa Villages. The aim was:
The education provided must therefore encourage the development in each citizen of three things: an enquiring mind; an ability to learn from what others do, and reject or adopt it to his own needs; and a basic confidence in his own position as a free and equal member of society, who values other and is valued by them, for what he does and not for what he obtains. (Nyerere: 1968; 274)
ESR determined the overall direction of primary education for the future. It was a revolutionary document that meant the transformation from the inherited elitist and colonial education system to a development of schools that were at the same time productive units that would teach the socialist co-operative values. The fundamental shift was an attempt to make education more appropriate to a rural, developing society, where primary schooling was meant to be both universal and a preparation for work in the communities. Primary education was to be a complete education, relevant and useful for the recipients and not preparation for the next level of education. Another significant policy measure was an introduction of the National Examinations Council (NECTA) charged with all examinations of schools and teacher training and technical colleges.
UPEI (1974 – 85): ESR was the beginning phase of the UPE in Tanzania. It provided the ideological content for UPE and stipulated the purpose of mass education. Earlier, after independence, it was planned to achieve UPE by 1989. However, the ruling party in 1970s realised that for national development it was necessary to achieve UPE as soon as possible. It was realised that an educated population was necessary for national growth. The rationale was that children with even basic education will be more productive in the agriculture sector than those who did not have education.
Enrolment in primary schools showed considerable increase after Musoma resolution in 1974. Between 1974 and 1978 the enrolment in primary schools more than doubled. It was estimated that by 1981, more than 90 per cent of all eligible children were enrolled in primary schools. However, the increases in enrolment were not sustained and began to fall after 1982. Enrolment in

18 | THDR 2014: Background Paper No. 9, ESRF Discussion Paper 63
1986 was lower than in 1979, despite a three per cent yearly increase in population growth (BEST various years).
The period between 1985 and 2000 was one of stagnation. Enrolments declined, schools became dilapidated and there was a general falling of education standards. This was the period of economic stagnation arising from rising oil prices and meeting costs of war against Idi Amin in Uganda. By 1985, the number of children enrolling in primary education has increased greatly and the government was unable to meet the requirements of the education sector. Schools lacked even the most basics, such as chalk, pencils, exercise books etc.
To revamp education, especially the primary education, the government launched the Education and Training Policy (ETP) in 1995 to guide reforms in the education sector. It should be noted here that much of the genesis of the ETP were the results of the National Task Force on developing education system for the 21st Century. Towards the end of the 20th Century concern grew at international level over large numbers of out of school children in developing countries. In 1990, the World Conference on Education for All held at Jomtien in Thailand set out a vision for education and restated the goal of achieving Universal Primary Education by all the countries in the world by the year 2000. By 2000, it was realised that despite the progress towards achieving UPE, many countries had failed to achieve the goal. To kick start the process another meeting was held in Dakar where all countries agreed to the Dakar Framework for Action (DFA). Box 1 shows the goals that each country, including Tanzania had to achieve.
BOx 1: THE DAKAR FRAMEWORK OF ACTION: EDUCATION FOR ALL GOALS
1. Expanding and Improving comprehensive early childhood care and education, especially for the most vulnerable and disadvantages children.
2. Ensuring that by 2015 all children, particularly girls, children in difficult circumstances and those belonging to ethnic minorities, have access to and complete free and compulsory primary education of good quality.
3. Ensuring that the learning needs of all young people and adults are met through equitable access to appropriate learning and life skills programmes.
4. Achieving a 50per cent improvement in levels of adult literacy by 2015, especially for women, and equitable access to basic and continuing education for all adults.
5. Eliminating gender disparities in primary and secondary education by 2005, and achieving gender equality in education by 2015, with a focus on ensuring girls’ full and equal access to and achievement in basic education of good quality.
6. Improving all aspects of the quality of education and ensuring excellence of all so that recognised and measurable learning outcomes are achieved by all, especially in literacy, numeracy and essential life skills.
This is the context that shaped the education in Tanzania in the 21st Century.
UPE II (2001 – 2006): UPE I was implemented in a one party state where the control of the Party on all aspects of national development was total. TANU guided the national and social development. Politics played a big role in education policy formulation in the post-colonial period.
The driving force for UPE II is more international. The Education for All (EFA) movement and the education targets within the MDGs have provided an impetus for Tanzania and many African countries to push for Universal Primary Education (UPE), often with extensive external support.

THDR 2014: Background Paper No. 9, ESRF Discussion Paper 63 | 19
Processes involved in Tanzania are similar to what is happening in other developing countries in Africa. All these countries required to develop a development vision, a Poverty Reduction Strategy Paper, and reforms in various sectors to ensure eradication of poverty. Education is seen to play a crucial role in this process; Primary Education Development Programme (PEDP) was developed to ensure all children can access primary education. External assistance for development efforts has become conditional on having a PRSP. PRSP and UPE documents were prepared by technocrats – with little consultation with broader sections of the population. Preparation of Primary Education Development Plan (PEDP) was carried out by technical groups consisting of government officials, few academicians, representatives of donor agencies and civil society organization representatives. PEDP therefore is more of a technical document and is devoid from political inputs.
National development policies including policies on social sectors in the country are governed by Tanzania Development Vision 2025. The Vision sees education playing a central role in bringing about social and economic transformation:
Education should be treated as a strategic agent for mind-set transformation and for the creation of a well-educated nation, sufficiently equipped with the knowledge needed to competently and competitively solve the development challenges which face the nation. In this light, the education system should be restructured and transformed qualitatively with a focus on promoting creativity and problem solving (URT 2000:19).
Subsequent government policies have been guided by the National Vision. These policies include the 2004 Poverty Reduction Strategy Paper (PRS) and, the National Strategy for Growth and Reduction of Poverty (NSGRP). Both PRSP and NSGRP see a strong role for education in reducing poverty in the country. The role of education is seen as to create “a well-educated, knowledgeable and skilled Tanzanian able to competently and competitively cope with political, social, cultural, economic and technological development challenges at national and international levels”.
Teachers and teaching
That is what I meant when I said earlier that the assumption that teachers are not powerful is one of the biggest fallacies of our society. For teachers can make or ruin our society. As a group they have power which is second to none. … It is they, the teachers now at work and now going through Training College, who are shaping what Tanzania will become, much more than we who pass laws, make rules, and make speeches! (Nyerere: 1972)
Current low levels of learning and falling standards of education in Tanzania are partly a result of poor teacher competencies and poor teaching motivation. These problems are compounded by poor teacher management, deployment, training and monitoring. In order to overcome these problems the government developed a comprehensive strategy to address these problems. The Teacher Development and Management Strategy (TDMS) 2008 -2013 (URT: 2008) recommended a holistic approach to address the problems of teachers.
The proposed areas of actions were:1. Attract and retain adequate high quality teachers2. Obtain, high quality primary and lower secondary school teachers3. Obtain adequate high quality upper secondary school teachers and school managers4. Train and develop adequate high quality teacher educators, faculty and education managers

20 | THDR 2014: Background Paper No. 9, ESRF Discussion Paper 63
5. Obtain adequate high quality vocational and technical education teachers6. Obtain adequate high quality faculty staff and leaders for faculties of education and university
colleges of education7. Strengthen collaboration between ministries of education and vocational training and PMO-
RALG on matters related to teacher training, development and management8. Improve reform processes and linkages between teacher education programmes9. Ensure continued in-service teacher training and professional growth10. Improve the assessment and evaluation procedures in teacher education programmes11. Improve college infrastructure and facilities for conducive teaching and learning environment.
Learning environment would have greatly improved if the recommendations of TDMS had been implemented. Unfortunately most of the recommendations still remain on paper.
The quality of education is directly related to the quality of teaching and learning. The role of teachers in improving the quality of education is crucial. Several studies have shown the link between teacher quality and quality of education. Studies (Coleman1966, Husen et al, 1987; Solomon 1987) clearly indicate that teacher quality does have a positive impact on the level of academic achievement of students attending schools in developing countries. Bacchus (1996) argues that the poorer the country, the greater the impact teacher quality is likely to have on students’ achievement. Given a lack of teaching and learning materials in many developing countries, teacher quality assumes a far greater importance in improving the quality of education than would be the case otherwise. Given this importance, it is vital to improve the professional competences of teachers and to raise their morale by improving their living conditions, so that the quality of basic education does not decline. There are several problems facing the education sector in terms of teachers. The first one and the most pressing one is inadequate number of teachers.
Inadequate number of teachers:
There are many factors that determine the quality of teaching, including teacher qualifications and experiences, their level of motivation, and working conditions. There are several issues that need to be considered. First is the available number of teachers for both primary and secondary education. Obviously children will not learn if there are no teachers to teach.
Table7: Number of Qualified Teachers and Qualified Teacher-Pupil Ratio
2001 2006 2012 2013
Primary Education
Number of Primary schools 12,815 14,700 16,331 16,343Total Enrolment 4,881,588 7,959,884 8,247,172 8,231,913Number of qualified teachers 105,921 151,882 174,834 187,413Qualified teacher pupil ratio 1:46 1:52 1:47 1:44
Secondary Education
Number of secondary schools 927 2289 4,528 4,576Total enrolment 289,699 675,672 1,884,272 1,804,927Number of qualified teachers 14,352 23,905 55,155 65,513
Qualified teacher student ratio 1:20 1:29 1:34 1:28Source: URT (2001; 2006; 2012; 2013; 2014)

THDR 2014: Background Paper No. 9, ESRF Discussion Paper 63 | 21
Table 7 shows that the PTR in primary schools has improved from 1:52 in 2006 to 1:44 in 2013, slightly less than the recommended PTR of 45 (URT: 2009). Table 8 shows that majority of the teachers teaching in primary schools are Grade A teachers and about a quarter of the teachers are diploma holders. Nearly a quarter of all the diploma holding teachers are in Dar es Salaam and more than half of them are in four regions of Dar es Salaam, Kagera, Iringa and Arusha indicating the tendency that more qualified teachers prefer to teach in urban areas. More than eight thousand teachers teaching in primary schools are graduates or holders of postgraduate degrees, most of them teaching in Dar es Salaam, Mwanza and Mbeya regions. It is likely that they teach in private primary schools.
In secondary schools too, the student teacher ratio (STR) is less than the recommended ratio of 1:30. However, this overall PTR and STRs mask variations by regions and by schools. Table 8 shows the PTR in primary schools by regions.
Table8: PTR in Primary Schools by Regions 2013
Region Std. 1 – VII Enrolment
TeachersPQTR
B/C A Diploma BA/BSC Post Grads Others Total
Qualified
Arusha 318,565 67 4915 3703 163 159 197 8940 36
Dar esSaalam 476,693 335 1968 11,800 985 70 188 14,823 32Dodoma 389,296 180 3299 4692 226 39 23 8256 47Geita 440,924 27 5742 1604 82 51 14 7479 59Iringa 219,853 35 1417 3642 183 35 11 5277 42Kagera 465,768 222 3206 6231 87 14 112 9538 49Katavi 92,382 0 1949 655 11 26 0 2641 35Kigoma 337,878 0 6499 185 229 145 38 7058 48Kilimanjaro 292,469 15 5970 2809 114 168 25 9061 32Lindi 160,612 0 3140 92 200 26 11 3458 46Manyara 246,292 4 4287 1441 48 43 48 5819 42Mara 437,564 0 8049 284 280 69 69 8682 50Mbeya 529,347 22 9920 1829 435 378 4 12,562 42Morogoro 387,071 0 8775 448 221 173 3 9617 40Mtwara 235,760 27 3928 1099 226 32 1 5285 45Mwanza 618,501 0 10,678 335 1651 235 33 12,899 48Njombe 156,685 53 2331 1096 99 46 6 3572 44Pwani 225,435 0 5286 336 8 139 22 5769 39
Rukwa 202,425 0 3874 119 62 55 20 4110 49Ruvuma 270,718 0 4940 1156 62 64 16 6222 44Shinyanga 294,788 0 6180 172 84 59 109 6495 45Simiyu 325,665 7 3879 2597 25 34 17 6535 50Singida 254,933 1 5220 150 43 76 12 5489 46Tabora 414,061 0 6733 820 250 57 45 7860 53
Tanga 438,228 0 9474 297 44 151 55 9966 44
Grand Total 8,231,913 995 131,659 47,592 5818 2344 1079 187,413 44
Source: URT (2014)
The problem of regional variations has existed for many years now. Geita, a newly formed region for example, has serious shortage of teachers where there are 59 pupils per teacher compared to 32 pupils per teacher in Kilimanjaro. On average a teacher in Singida has to teach nearly twice the number of pupils than a teacher in Kilimanjaro does. This problem of poor distribution of teachers has been there for decades, without the ministry taking steps to rectify it. Certain regions, such as Arusha,

22 | THDR 2014: Background Paper No. 9, ESRF Discussion Paper 63
Dar es Salaam and Kilimanjaro are favoured in terms of teacher allocation. Apart from the regional variations, there are rural urban variations as well. A World Bank study (2011) on Service Delivery Index found that PTR in rural areas was 50 compared to 39 in urban areas.
Table 9 shows the regional variations of secondary school teachers. Variations in STR are not as marked as in primary education. Average variations by regions do not really bring out the problem. There are schools, mostly in urban areas, which have low PTR and STR. Remote schools have the problem of attracting and retaining teachers. There is severe shortage of science and mathematics teachers.
Table9: Student Teacher Ratio (STR) in Government and Non-Government Secondary Schools, 2013
Regions Enrol.F1 – F6
Teachers Qualified TeachersSTR SQTRPost
Grad Grads Dip Licen. Other Total Post grad Grads Dip Total
Arusha 105805 73 1998 1856 215 50 4192 56 1819 1856 3731 25 28Dar es Salaam 181461 389 3778 3355 245 86 7853 328 3429 3355 7112 23 26Dodoma 63445 85 1479 1439 151 29 3183 55 1349 1439 2843 20 22Geita 50620 10 504 673 67 31 1285 10 484 673 1167 39 43Iringa 64418 53 1404 1166 124 63 2810 38 1244 1166 2448 23 26Kagera 85851 32 1201 1477 205 97 3012 26 1116 1477 2619 29 33Katavi 11080 1 171 222 36 17 447 1 168 222 391 25 28Kigoma 56465 87 857 928 226 79 2177 29 746 928 1703 26 33Kilimanjaro. 135541 138 2967 2740 250 88 6183 64 2659 2740 5463 22 25Lindi 27300 4 438 513 71 17 1043 3 418 513 934 26 29Manyara 53731 19 962 1066 124 56 2227 13 874 1066 1953 24 28Mara 83974 61 1274 1277 169 123 2904 50 1186 1277 2513 29 33Morogo. 150584 79 2784 2692 239 42 5836 64 2620 2692 5376 26 28Mbeya 85423 67 1651 1876 194 17 3805 56 1424 1876 3357 22 25Mtwara 40732 15 666 830 51 8 1570 13 632 830 1475 26 28Mwanza 131894 121 2314 2150 150 56 4791 107 2145 2150 4402 28 30Njombe 41072 27 779 843 96 28 1773 21 708 843 1572 23 26Pwani 61746 179 1783 1258 108 41 3369 121 1595 1258 2974 18 21Ruvuma 28384 10 609 642 117 18 1396 7 581 642 1230 20 23Rukwa 55046 34 1035 1388 109 31 2597 26 994 1388 2408 21 23Singida 46639 14 763 926 94 70 1867 11 723 926 1660 25 28Siminyu 42910 10 562 850 101 25 1548 9 535 850 1394 28 31Shinyanga 42979 22 736 814 75 49 1696 15 681 814 1510 25 28Tabora 59567 11 890 1090 127 35 2153 9 827 1090 1926 28 31Tanga 98260 26 1676 1754 174 60 3690 20 1578 1754 3352 27 29Total 1804927 1567 33281 33825 3518 1216 73407 1153 30535 33825 65513 25 28
Source: URT (2014)
Proportion of female teachers is low, 32.5 percent of all the teachers teaching in secondary schools were female and the proportion did not differ much by qualification.
Variations at school levels are even more glaring. A study done by Tamasha (2012) in 16 primary and 16 secondary schools in 8 districts of the country found that on average the student teacher ratio in secondary schools was 1:88 and only one school had a SEDP target ratio of 1:30. Four other schools had a student to teacher ratio of less than 50. The study found that in eight out of 13 secondary schools the student –teacher ratio was higher than 50. It was higher than 100 in four out of 13 schools. In Musoma and Temeke the ratios were so high that it was difficult to comprehend how learning can take place in those schools. In primary schools surveyed, the teacher pupil ratio was 1:54 but in none of the school it was more than 100. In Arusha, Makete, Musoma and Temeke the student teacher ratio in secondary schools was worse than in primary schools, yet in secondary schools there should be more teachers, including specialist subject teachers. That is where the problem lies in secondary schools.

THDR 2014: Background Paper No. 9, ESRF Discussion Paper 63 | 23
Monitoring of Teaching and Learning Activities:
Table 10 highlights the problem of monitoring of teachers. In contrast to 2001, when every school was inspected at least once, currently, 37.4 percent of primary and 45.9 percent of secondary schools are inspected in a given year. This is illustrated in table 10.
Table 10: School inspection for 2012/2013
Institution/Category Number(March ’13)
Targeted for Inspection Inspected % Inspected
Pre-primary 14,283 6,166 2,026 32.9
Primary 16,442 7,165 2,682 37.4
Secondary 4,576 1,815 833 45.9Source: URT (2014)
Weak Students make Poor Teachers:
Having adequate number of qualified teachers is a necessary but not a sufficient condition for quality education. Motivation, dedication, work ethics are perhaps more important to ensure that children receive quality education. In recent years students who have done well in their O and A- levels are reluctant to join the teaching profession. Several studies have shown that the majority who join the profession as a last option include those who have recorded poor performance in exit examinations. A study by Mkumbo (2012) stated that the most often stated reasons by teachers for joining the profession was the ease with which students could become a teacher. Student teachers were guaranteed a job on completion of their training unlike in other professions. A teacher in Pwani region stated:
I think the major reason that compelled me to join this profession [teaching] was the fact that I thought it’d be easy to secure employment after my studies. But if it were possible to get employment in other professions I would have never joined the teaching profession.
Many teachers joining the teaching profession dream to leave it as soon as they find another job. Although given the current situation in the labour market they may have to wait a long time for that to happen. Teachers who are not committed to the profession may not make an effort to make a career of the profession. Surely, in such a situation quality of education will suffer. Students join the profession because of poor grades. Several teachers in Mkumbo’s study said that students can join the profession when their grades were so poor that they could not join other professions. A typical answer was provided by a teacher from Singida who said:
People join this profession [teaching] as a last resort; they have not been able to find anything else meaningful in their life and, of course, teaching profession is the only remaining option. I am a typical example; I’m here because my Form six results were miserable; I wanted to do Economics, but my grades couldn’t allow me, otherwise I wouldnt have been a teacher.
With such a “reputation” of the profession it is no wonder that only students with low grades join the teacher training colleges. Given the poor content knowledge these students have it is unlikely that they will be capable to engage in quality teaching. Obviously, there were some teachers who stated that they became teachers because they preferred to become a teacher, they loved teaching, but such teachers were few and far between. A study done by Sumra

24 | THDR 2014: Background Paper No. 9, ESRF Discussion Paper 63
(2005) found teachers giving similar reasons for joining the profession. However, the number of teachers with positive attitudes towards teaching was low. Sumra study found that most of the primary school teachers stated that they became a teacher through choice, because teaching appealed to them. Some mentioned that their own teachers acted as positive role models and this influenced their decision. As the most educated person in a village, teachers would have a strong influence on their pupils. Pupils would see teaching as something to aim for.
Status of the profession seems to have deteriorated in recent years. In the 1990s the profession seemed to have a high status. Study done by Cooksey (1990) showed that the major reason given by teachers for joining the teaching profession was “to help build the nation”. Surprisingly, in 1990, 76 per cent of the teachers saw teaching as a respected profession, and nine out of ten respondents said salary was not an important consideration. This situation seems to have changed drastically over the last two and half decades. Low status, poor living and working conditions of teachers is deterring many students to despise the profession.
Working Conditions of Teachers:
As shown earlier, the PTR in both primary and secondary schools has improved in recent years. Area of concern is lack of adequate number of classrooms, especially in primary schools. Although large numbers of classrooms have been constructed during PEDP and through community efforts, the problem remains. The World Bank (2011) study found that on average there were 74 children per classroom; 70 in rural areas and 92 in urban areas. BEST (2012) data shows that there are 111,661 classrooms available for 8,247,172 pupils, giving pupil classroom ratio (PCR) of 1: 74. There are large regional variations in the PCR; Kilimanjaro has a PCR of 1:43 compared to 1:77 for Rukwa. There are many schools, especially in urban areas where the ratio is much higher. Teaching approaches that teachers learn are mostly ineffective in such large classes.
The problem of availability of desks is equally serious. Teachers have to teach large number of pupils sitting on the floor. The desk problem affects some regions more than others. Kilimanjaro has desk shortage of only 1.2 percent compared to desk shortage of 85.1 percent in Mtwara. This means that on average one child out of 100 is sitting on the floor compared to 85 children in Rukwa. Textbook problem has been discussed often and still remains crucial both in primary and secondary schools. In Form one, for example, there was shortage of books for computer studies of 94.1 percent; 84.3 percent for geography; 81.9 percent for Kiswahili books. Only 24.4 percent of 4528 secondary schools and 17.5 percent of 16,331 primary schools had electricity. On average there was one computer for every 1549 pupils in primary schools and for 199 students in secondary schools (BEST: 2012).
It will be understatement of fact to say teachers are working in a difficult environment. Class sizes are large as a result of lack of classrooms, many children have to sit on the floor as there are not enough desks in schools; majority of primary and secondary schools have no electricity. All these factors affect the performance of teachers and these problems need to be addressed in order to improve the quality of education.
Weak Content Knowledge of teachers:
Knowledge of content is as important for teachers as the knowledge of ways of how to teach this content. This is a major problem in many developing countries. Teachers in Tanzania not only

THDR 2014: Background Paper No. 9, ESRF Discussion Paper 63 | 25
lack techniques of teaching but their content knowledge of the subjects that they teach is also poor. A study by the World Bank assessed the content knowledge of Tanzanian teachers in English and mathematics. Ten teachers of standard 4 and those who taught standard 4 in the previous years, from 180 randomly selected primary schools (132 rural and 48 urban) were assessed through tests in English and mathematics. The test comprised material from both lower and upper primary school in English and mathematics. The test consisted of a number of different tasks ranging from a simple spelling task (involving 4 questions) to a more challenging vocabulary test (involving 13 questions) in languages and from adding double digits (one question) to solving a complex logic problem (involving two questions) in mathematics. It is logical to expect of a teacher that he or she should have knowledge of what he/she will teach in a class. In order to know Share of Teachers with Minimum Knowledge, teachers were given a basic knowledge test. In this test, 14 questions were related to the lower primary curriculum on the language test and 5 questions were related to the primary mathematics curriculum. A teacher getting all the questions correctly was classified as having the minimum required knowledge to teach in a primary school.
The study found that only one out of 10 teachers managed to complete all the questions on the primary language curriculum. There was slight difference between rural and urban teachers. Thirteen percent of the teachers in rural areas, and five percent of the teachers in urban areas completed all the questions correctly. For mathematics, the performance was slightly better, with 75 percent of the teachers managing to complete all questions on the primary mathematics curriculum. Differences between teachers in rural and urban areas were not significant.
Teacher Absenteeism:
Even when teachers are competent, which many are not, learning can only take place if teachers are in class and teaching. The World Bank study (2011) found that on any given day 23 percent of teachers, 20 percent in rural areas and 36 per cent in urban areas, were not in school p.16). Even when teachers were in school, 53 per cent of them were not in classrooms at any given time. Teacher’s absenteeism was much higher in urban areas, where 68 percent of the teachers were not in class compared to 50 percent in rural areas. On average pupils were taught for only two hours and 04 minutes out of required five hours of teaching. In rural areas pupils were taught for two hours 11 minutes compared to one hour 24 minutes of teaching in urban areas.
Tamasha study found that in schools with high student-teacher ratios, students were taught fewer classes. This is particularly the case in secondary schools where it is not easy for teachers to teach subjects outside their areas of specialisation. On the day of the survey the study found that on average students were taught 2.5 classes; the number of classes taught was on average, less than two in eight of 14 schools and less than three in 10 of 14 schools. By contrast, in primary schools, pupils were taught 3.5 classes. Only in six of 15 schools were pupils taught less than three classes.
Language of Instruction: A dead and buried ISSUE?
There is overwhelming research evidence that children learn best when they are taught in their mother tongue (Bisong, 1995; Poth 1997; Ufomota, 1999). During earlier years, the issue of Language of Instruction (LOI) in Tanzania generated emotional and sometimes hot debate among academicians, politicians and the public in general. The issue seems to have slipped off the agenda in recent years.

26 | THDR 2014: Background Paper No. 9, ESRF Discussion Paper 63
Following independence, the government promoted the use of Kiswahili at all levels and made it a national language. In education, after introduction of Kiswahili as LOI in primary schools it was presumed that it was only a matter of time before Kiswahili became a LOI in secondary and higher education. As late as 1997, the government announced a language policy, Sera ya Utamaduni stressing the need to use Kiswahili throughout the education system. However, this aspect of the policy was not implemented due to lack of political will (Brock-Utne: 2003, 15).
The debate on the LOI has primarily focused on the use of English at secondary level. The current practice of using Kiswahili in primary schools for the majority of children and English at secondary and higher level is creating quality problems at secondary levels. This would not have been a problem had children in public schools received a good grounding in English. Although passing PSLE, vast majority of children entering secondary schools have very low competency in English. This does affect their performance in secondary schools. Looking from the students’ perspective, all the terminologies they learned and used for seven years of primary education in Kiswahili were not of use from day one in secondary schools. They must re-learn new terms in English.
Most of the debate on the use of English appears to be confusing. Confusion is between using English as a medium of instruction and teaching English as a foreign language. No one would argue against teaching English to our students. English is an important language in today’s world and all Tanzanian students should learn it and be fluent in it. The issue of language of instruction is totally different; it is using English in classrooms to teach other subjects such as History, Geography, and Biology and so on. Especially when this is done when majority of the students, and of teachers, do not have the required language competency to teach and learn in English.
It is well documented that students and teachers in secondary schools have not attained levels of competency required to make English as a language of instruction. Both teachers and students struggle to express themselves in English. Studies have shown that using English as a language of instruction in secondary education has a profound effect on the quality of education. Nearly thirty years ago Criper and Dodd (1984; 14) wrote:
Throughout their secondary school career little or no other subject information is getting across to about 50 per cent of the pupils in our sample. Only about 10 per cent of Form IV’s are at a level at which one might expect English medium education to begin.
Roy – Campbell and Qorro (1984; 14) reports a study done by Mlama which found that in an essay examination given in the study yielded thoughtful and concise responses when the students were asked to use Kiswahili, but disjointed and nearly unintelligible responses to the same question by the same students when it was asked in English. A more recent study conducted by Hakielimu (2008) found:
Overall, data show that while children’s Kiswahili language competencies are generally well developed, English language competencies are poorly developed in both primary and secondary school students. Students had difficulty in reading, writing and translating the language. This is particularly troublesome in case of secondary school students. On entering secondary schools, children not only have to relearn all the terms and concepts in a new language but also to take on a more difficult set of subjects. If the majority of the students in secondary schools are unable to read and understand the language in which they are taught, as our data show, it is difficult to see how their learning can be enhanced.

THDR 2014: Background Paper No. 9, ESRF Discussion Paper 63 | 27
A recent study by Tamasha, a civil society organisation in Arusha, used Uwezo tools to measure competencies of secondary school students in 16 schools selected randomly from 8 districts in the country. The findings are startling! They found:
• Only 34 per cent were capable of reading a simple English passage from a Standard Two text and an even smaller percentage (23 per cent) were able to answer questions on the same simple text. This of course does not guarantee that they can cope with the more sophisticated English of secondary school textbooks.
• Twenty-three percent were incapable of reading the text or could only identify the letters. Twenty-one percent could not answer the questions at all.
• More than 50 per cent of the students were able to answer the questions without difficulty in only two schools, one in Arusha, and one in Longido (on the border with Kenya). In Iringa 50 per cent and in Temeke 34 per cent of the students could not answer the questions at all.
• In Arusha and Iringa, students in secondary school actually did worse, on average, than their counterparts in primary schools.
British colonial power pushed for use of English often at the expense of Kiswahili. During the colonial period Kiswahili was used as a medium of instruction for the first five years but English became a language of instruction in the last three years of primary education, giving an impression that English was required for higher levels of education. As only a tiny fraction of African children were able to access secondary education meant that only a small portion was afforded the opportunity to learn English. It is surprising that despite the fact that importance of Kiswahili was enhanced immediately after independence there was no serious push to make Kiswahili a medium of instruction for secondary and tertiary education.
There is also a problem of equity arising from the dual language policy in education. Vast majority of children in Tanzania enrol in Kiswahili medium, poorly resourced and poorly performing primary schools. A small number of children, mostly from the well to do families attend fee charging English medium primary schools, creating a dual education system – one for the children of the rich and another for the children of the poor. Children from both these two types of schools enrol in the same secondary schools where the LOI is in English. Obviously, children from private schools who have gone through up to nine years of schooling in English (2 years of pre-primary and seven years of primary) get a head start because of their familiarity with the language. There is no research to show what proportion of students coming from English-medium private schools proceed to higher secondary and tertiary education compared to those coming from Kiswahili-medium public schools.
The prestige associated with knowledge of English never disappears. Skutnabb-Kangas coins the term linguicism (as with race in racism), which legitimises and reproduces an unequal division of power (both material and non-material) and resources between groups based on language (Skutnabb-Kangas and Phillipson,1996:162). However, one can argue that the ‘exclusion’ in education through the failure to support adequate learning of English in primary school is a reversal of processes of nation-building in the 1960s and 1970s in which the use of Kiswahili was a major factor in unifying a nation of 120 ethnic groups. The use of English as the LOI in secondary

28 | THDR 2014: Background Paper No. 9, ESRF Discussion Paper 63
school without support for children in state schools to acquire adequate levels of English at primary school is leading to the creation and entrenchment of a privileged class, and is an un-researched factor of exclusion and inequity in education.
The issue still remains a matter of concern, and some of the Tanzania-related documents we reviewed did acknowledge this (e.g. Carr-Hill et al., 2005; Wedgewood, 2005; TEN/MET, 2007), some with reference to the ability of teachers to operate in the official LOI, obviously a potentially disabling factor for the students. The most hard-hitting is the paper written by Martha Qorro who concludes that ‘using English as the language of instruction in Tanzanian secondary schools and institutions of higher learning does more harm than good’ (Qorro, 2006:14). Perhaps it is time now to re-visit the issue and any decision taken need to be based on evidence rather than on emotions. It is clear that children who have grasped the basics of literacy in a language with which they are familiar are better able to successfully apply those skills to other languages.
Given the fact that learning outcomes among our school graduates are poor, it is no wonder that school graduates find it difficult to find employment. In the next section the issue of youth employment will be discussed.

THDR 2014: Background Paper No. 9, ESRF Discussion Paper 63 | 29
In Tanzania, youth represents about 18 percent of the total population. Although proportion of the youth in the total population has remained fairly constant in the last two decades, in absolute numbers, the size of youth has almost doubled from 4.4 million in 1990 to 8.1 million in 2010 (Morisset 2012). Tanzania is facing a youth unemployment crisis which is unrivalled by many other nations in the world. In 2012, Tanzania was home to more unemployed 15 to 24-year-olds per capita than in 109 other countries. A survey by the non-governmental organization Restless Development found that out of over 1,000 young people across Tanzania, only 14 percent reported working a formal, wage-earning job (Global Post: 2013). The low level of youths finding jobs in formal sector is partly a result of low level of educational attainments, and partly it is the result of the changing economic environment since the economic crisis of the late 1970s and early 1980s. Structural Adjustment Programme (SAP) led to liberalisation of the economy. In the early years of independence, the government was the major employer. Situation changed after SAP, currently private sector is the main employer. Inability of the private sector to generate jobs in large numbers, is also responsible for current unemployment and underemployment among youths in the country.
The study by Restless Development found that of the approximately 900,000 youths (15-24 years) who entered the job market in 2011, 14 percent did not complete primary school, 44 percent finished their primary but did not access secondary education. Thirty eight percent reached secondary but did not finish form four and only four percent went beyond form four level. Overall, this study and the Household Budget Survey data in Table 1 study show that the stock of well qualified people in Tanzania is low, despite large investments made since independence in the sector. Problem of youth unemployment originates from education in the country that fails to teach the skills and intellectual prowess that employers are looking for. Tanzanian education provides general knowledge but not skills that are necessary for employment (Global Post: 2013).
Tanzanian employers are concerned about the quality of education in the country. They argue that poorly qualified labour force is one of the factors making Tanzania unattractive for business. The World Economic Forum Global Competitiveness Report for 2007/2008 indicates that 15.7 per cent of the factors contributing to the difficulty of doing business in Tanzania were due to problems associated with labour. These included an inadequately educated workforce, poor work ethics and restrictive labour regulations (ATE: 2011). A slightly outdated study, a tracer study done by the University of Dar es Salaam in 2003, found that while employers had high regard for scientific and technical knowledge possessed by graduates, they were concerned about the English proficiency, communication skills, problem solving ability, innovativeness, creativity and often negative attitudes towards other workers and unwillingness to learn (ATE: 2011, 17). Attitudes towards work tend to be negative with an absence of creativity, accountability and motivation and a reluctance to change. ATE also argued that there was a mismatch between the supplies of skills and the demand, vocational training institutes, technical colleges and universities supply graduates whose skills often do not match with the skills needed by employers. It is obvious that schools will have to change in order to produce youths who have employable skills, and this needs to be done soon.
Unprepared youths seeking Employment
30 | THDR 2014: Background Paper No. 9, ESRF Discussion Paper 63
In this section we will discuss measures necessary to ensure improved quality of education in Tanzania. It is important that time is spent on discussing ways in which the sector performance can be improved rather than rushing into implementing half thought-through solutions. The policy making should be guided by two principles. One, all decisions that we make should be evidence based, and two, that a wider public ownership of the policies be ensured through involvement of various stakeholders in the process.
Evidence Based policy making:
There is a need to develop a culture of evidence based policy and practice and to learn from experiences of others. Evidence based decision making requires deep analysis of evidence, its relevance to the Tanzanian situation, cost-effectiveness, and foreseeing any challenges that may arise. Adapting what has worked in other countries, or even in Tanzania, should not be done hastily, without thorough analysis. Projects that look promising may not work when scaled up. There have been several promising looking projects implemented in the country in the past and others are currently being implemented.
It is important for policy makers to be aware of projects and experiments that have taken place or are taking place. Twaweza is currently doing an experiment on performance based incentives in primary schools, whereby teachers who increase the literacy and numeracy levels of their pupils will receive cash rewards. Save the Children, in early 2000s, implemented a project to improve quality of education by training teachers to adapt child centred teaching. Care Tanzania had an impressive project called Tusome Vitabu with the aim of developing reading culture among primary school pupils. The project established, and stocked, libraries in 1588 primary schools in 16 districts, benefitting 774,687 pupils (Katabaro and Mutakyahwa: 2007). Children’s Book Project is producing reading material for children in primary schools for a number of years now. Oxfam and Aga Khan Foundation have carried out projects in various districts of the country, focusing on improving the quality of education.
Currently there are two major projects being carried out in Tanzania. In 2011, the USAID launched a project called Tanzania 21st Century (TZ21) in Mtwara to improve child learning outcomes in lower primary schools through e-learning. DFID has recently funded a project called EQUIP T which has just become operational. The project focuses on improving early grade reading and numeracy.
There is need by the MOEVT to put in place a mechanism to ensure learning takes place from all the projects that are being implemented in the country and at the end decide what aspects of these initiatives can be scaled up.
The second issue that needs to be considered is to see that policy making is an inclusive process that involves all sections of the policy. Education is an issue that concerns us all. Parents, community, government, civil society, industries, businesses, and various political parties are stakeholders of the sector. Expertise of all the stakeholders needs to be garnered for improving the sector. Of particular
The way Forward:

THDR 2014: Background Paper No. 9, ESRF Discussion Paper 63 | 31
importance is the large number of academics that we have. All these academics, educated in most cases by the government, are experts in their fields and many have gained national and international recognition. It is important to recognise and tap-in to the experiences and knowledge of eminent professors and academicians, some still working at various universities and some retired, to improve the education sector. These professors and academicians have not only studied Tanzanian education but have also studied policies and practices in other countries. Their knowledge will be useful to improve our policies and practices. One possible way in which this can be done is by forming a high level think tank which will advise the MOEVT. In USA such think tanks provide valuable advice to the USA government on various issues including education. Currently, the role of the academicians seems to be limited to providing consultancy services to the government or donor partners.
Collaboration with different stakeholders:
The Government also needs to collaborate closely with Civil Society Organisations (CSOs) operating in the country. Although most of the CSOs are small, run by a single person, there are some who have attracted recognition through the work which they are doing. There is a need to take stock of CSOs, government agencies as well as Faith Based Organisations (FBOs) and private partners working in the area of education. Well established organisations may be encouraged to fully participate in the policy formulation, monitoring as well as reviews of education programmes, offer informed advice on curriculum development and reviews as well as assessment patterns. The Government can use their expertise to improve the quality of education through regular dialogue and consultations.
In recent years, the number of universities has increased considerably giving a large pool of academics whose expertise the ministry can tap into. One possible way to do this would be to constitute a “think tank” whose expertise can be utilised by the government.
Measuring success by Competencies developed
If we want to revolutionise our education, to make it focus on developing skills, abilities and competencies then the way we assess our children need to be changed. In Tanzania, when all is said and done, educational success in primary and secondary education is measured in terms of examination results. Graduates are categorized into two categories, those who pass and those who fail, judged on the basis of one set of one time examinations.
What do these examinations look like, and what do they measure? The PSLE examinations are multiple choices, and in large part they measure regurgitation of facts. Even the English and Kiswahili language examinations do not require students to write a single sentence! Language competency means that a student can read, write and speak a particular language. A student doing PSLE can pass the language paper without having developed the ability to speak, write or read in the particular language by ticking the right box. The maths paper is better where students have to calculate the answer. Our examinations do not measure analytical or problem solving skills. They do not measure the outcomes or capabilities we have described above. As our examinations do not demand these skills and competencies teachers do not focus on teaching competencies and focus on teaching to pass. Children go thorough past papers and practice on it. The increased pressure to perform has meant that teachers teach to enable students to pass the examinations.
The nature of examinations that we have are distorting learning objectives to focus on aspects that are not the skills and capabilities we desperately need, and that we begin to believe that we are

32 | THDR 2014: Background Paper No. 9, ESRF Discussion Paper 63
doing better when in fact we are not. Major complaint of teachers of tertiary education is that their students lack basic competencies.
If examinations is what ‘counts’; examinations should count what matters. In our view examinations policy and structure should be significantly revised. The assessment should measure the capabilities and skills we need. These include complex comprehension, analysis, problem-solving, creativity, and writing. For PSLE we need to revise ways in which pupils are judged as pass or fail. Currently, pupils can pass the exam if they do well even in one subject. A pupil will pass PSLE if he/she gets 40 marks in, say, Kiswahili paper. Even if he/she gets zero in the rest of the three papers, he/she will be considered as having passed the examination. We suggest that for a pupil to pass, he/she should not have less than 30 per cent in each of the four papers.
Within the context of evidence - based policy making, wider collaboration with various stakeholders, and by measuring success by competencies developed, we propose four areas where changes can be implemented to ensure we prepare our youth for employment by providing them with quality education, education that will ensure that learning takes place.
Preparing youth for Employment:
Our youth enter the labour market ill prepared for it. For employment youth needs to have “hard” and “soft” skills. Hard skills are provided by tertiary, technical and vocational training institutions. There is no place where students get the “soft” skills needed to adjust well to the world of work. As stated earlier, employers complain that youths lack the English proficiency, communication skills, problem solving ability, innovativeness, creativity and often negative attitudes towards other workers and unwillingness to learn. Some of these skills are the prerogative of the formal schooling to develop, while others need to be developed somewhere else. There are a number of government, NGO, and private sector training organizations already offering some sort of hard skills training opportunities but that the critical, complementary domain of workplace-oriented soft-skills, was not being addressed.
There are examples where “soft” skills needed for employment have successfully been developed. We will discuss the Rwandan experience to overcome the problem of youth employment. Education Development Corporation (EDC) has implemented a project, called Akazi Kanoze in Rwanda to ensure youths are prepared for employment in the formal sector. The project has two programs. The first program is the Work Readiness (WR) training and the second is school to work transition (STWT).
1. Work readiness training (WR) is training devised for youths who have completed secondary education and who are currently unemployed. The training uses an engaging, learner-centred approach and materials designed especially for secondary-level Rwandan students. The curriculum employs hands-on application of the soft skills most demanded by Rwandan employers, such as time management, communication, planning, work-appropriate behaviour and attitudes, team and independent work, financial literacy, entrepreneurship, workplace health and safety, workplace rights and responsibilities, and customer orientation and satisfaction. Youth learn this information and practice these skills in role-plays and other activities; the youth themselves, their trainers, and external assessors assess mastery. This component of the proposed package also includes training and ongoing coaching and performance monitoring of school-based trainers and local and national-level administrators and managers.

THDR 2014: Background Paper No. 9, ESRF Discussion Paper 63 | 33
2. School to Work Transition programming (STWT) is designed for students who are in secondary schools. The training includes youth mentoring by trained school based coaches in the development and initial implementation of life and career plans, and student placement in a relevant intern opportunity. They can include paid/unpaid short or long-term work experience, continued training in a particular skill area via a public or private provider, or self-employment/ entrepreneurship. In each school, STWT coaches develop a portfolio of bridging opportunities based on the youth life/career plans of each youth cohort; periodic, and localized labour and market demand studies; and on the development of ongoing public-private (and public-public) partnerships between schools and local institutions. Coaches will place each youth in at least one kind of bridging opportunity. After youth participate in bridging opportunities, their experience is evaluated through employer satisfaction surveys as well as youth feedback gathered by youth-led short message service (SMS) follow-up. The ‘school to work transition’ component of proposed package includes training, coaching, and performance monitoring of school-based STWT officers and local and national-level administrators and managers. It also includes the development of national and provincial level private sector engagement strategies by a working group that includes Government of Rwanda (GoR) and private sector representatives. Finally, it includes provincial level labour/market demand studies that inform local strategies.
AkaziKanoze’s design was based on EDC’s experiences of implementing youth livelihood projects in various countries. For example, the Haitian Out-of-School Youth Livelihood Initiative (IDEJEN) began as a research initiative in September 2003 and developed into a nationwide livelihoods project that provided non-formal basic education, life skills, technical training, and livelihood support to more than 13,000 out of-school youth, aged 15 to 24, across eight out of 10 geographical departments. EDC drew from IDEJEN design of the Timor LestePrepara Ami baSerbisu/Preparing us for work (PAS) Project (2007-2010). PAS helped rural, out-of-school youth to cultivate knowledge, behaviours, and practical work experience linked to better livelihood outcomes. After an eight month on- and off the- job training period, participants pursued one of the three livelihood pathways over the course of four months: internships; non-formal education courses; or initiation/expansion of a small business. Of the 2,078 youth who participated in PAS training, 57 per cent became employed and 151 returned to formal schooling or further training.
There is evidence to show that both the WR and STWT projects succeed in improving the employability of the youth. At the time of AK’s mid-term evaluation in April, 2012, the program had produced 2,710 graduates, of whom 1,413 (53 per cent) were male and 1,297 (47 per cent) were female. Among these graduates, 1,851 (68.3 per cent) found employment, including 880 women. Quantitative and qualitative data indicated that employers, AK graduates, and sub-grantee partners were satisfied with the level of soft and the hard skills that youth developed through their participation in the project. Employers reported that the soft skills graduates developed through the WR training, such as customer service, leadership, conflict resolution, and working with others, were particularly valued.
A 2012 survey of 43 companies that hired at least two AK graduates as employees or interns showed that 97 per cent of graduates met or exceeded employers’ expectations with regard to soft skills as well as balancing personal and work life. Among the surveyed group, female and male graduates performed equally well. A 2013 Rwanda Development Board surveyed 5 of 51 private and public companies compared RDB interns who received WR training to those who did not. Eighty-five percent of employers said that AK graduates perform better at work than other employees.

34 | THDR 2014: Background Paper No. 9, ESRF Discussion Paper 63
There is need to look at initiatives such as AkaziKanoze, and perhaps others in Africa, and to develop similar training to ensure that Tanzanian youths find employment and remain employed. In order to make our secondary school graduates employable two other areas need attention. First is the English language competency. English is becoming increasingly important for employment especially in tourism, hospitality, mining, industries and trade. Teaching of English both at primary and secondary levels need to be improved. Second area that needs attention is the ICT competency.
Tanzanian education policies and plans are supportive of ICT in education. SIDA support an ICT project in Teachers’ Colleges from 2006 to 2009. During the project all the 34 colleges were provided with computer labs and internet connections. The aim was to make all tutors teaching at teachers’ college computer literate and use computers in their teaching.
It is expected that student teachers graduating from teachers’ colleges will provide the necessary momentum to teaching ICT in primary and secondary schools. Currently there is sylabii for teaching of ICT in schools but no teachers and necessary infrastructure to teach the subject. Introduction of ICT is thus in line with the national goal of using ICT as an integral part of the national development. This should be seen as a first step towards making Tanzania a learning society. MOEVT need to roll out ICT in secondary schools as a matter of priority. Graduating students with good command of English, knowledge of the labour needs and ICT competency will have a good chance of employment.
Revamp technical and vocational education
Soft skills needed for the work place can be built in normal secondary schools. For youths to have hard skills, technical and vocational training needs to be strengthened. In Tanzania technical education is considered to be training provided to graduates of secondary education. There are 248 technical educational institutions in the country, 139 of them owned by over 15 Ministries, Departments and Agencies (MDAs). The rest of the institutions are owned by faith based organisations and individuals.
Technical Educational Institutions offer programmes in agriculture, education, engineering, manufacturing, construction, and so on. In 2012 more than 10,000 students were enrolled in technical institutions. The country also has a large number of vocational institutions operating under Vocational Education and Training Authority (VETA) and Folk Development Colleges (FDCs). In 2011, there were 57 FDCs and 693 Vocational Training Centres (VTCs) offering courses such as agriculture and food processing; automotive mechanics; hospitality and tourism; mining; printing, electrical technicians and so on. In 2011 there were 58,778 males and 51,236 females enrolled in these FDCs and VTCs (URT: 2012, 141).
Employers have to pay 6 per cent as skills development levy. It was expected that the funds generated will be used to support Vocational Education and Training Authority (VETA). Employers through their organisation Association of Tanzania Employers (ATE) have shown dissatisfaction with the quality of training and skill development provided by the FDCs and VTCs. Study done by JE Austin Associates for ATE lists the following as the major concerns of the Tanzanian employers:
- The Skills delivery system is divided and does not provide the skills businesses require
There are two governing institutions, which have mandates for vocational training. . The Vocational Education Training Authority (VETA) has responsibility for coordinating, regulating, financing,

THDR 2014: Background Paper No. 9, ESRF Discussion Paper 63 | 35
providing and promoting vocational education in the country, and the National Council for Technical Education (NACTE) has the responsibility for coordinating regulating and accrediting technical skills providers.
- The Skills Development Levy is not implemented, nor distributed transparently
ATE believe that only 2 per cent of the 6 per cent is directly traceable to VETA, the remaining 4 per cent is not allocated transparently and perceived by the private sector to be a hidden tax.
- Tanzania’s private sector has given up on the existing skills delivery system
Levy system is does not contribute to skills development, and employers have to privately train their employees, increasing their cost of doing business and impeding their competitiveness. Other firms either decide not to pay the levy expecting that they will have to train their employees instead, or informally engage temporary employees to limit their payroll and SDL obligations.
- Tanzania’s private sector, and private skills providers, lack incentives to invest in human capital development and ongoing training
To cope with the ineffective system, firms have adopted several strategies to acquire the requisite skills to competitively operate. Larger businesses with resources cope by sending their employees to other countries, or training their staff internally. Those that cannot afford to invest in training, cope by hiring unskilled labour, or temporary employees, usually resulting in higher rates of employee turnover, and lower productivity. Companies feel that they are double paying for skills provision to their employees because they contribute to the SDL, yet still have to train employees themselves. This leaves little additional resource for ongoing development. Similarly, private skills providers have little incentive to invest because the market is deemed distorted, with most resources going to VETA schools and little to private skills providers that are VETA authorized training facilities.
- Vocational and Technical Education Providers lack coordination amongst themselves.
Students, who do not qualify for secondary education, view vocational training as an opportunity to secure employment. Though students view a nationally recognized certificate as important for employment opportunities, there is no perceived educational progression between vocational education and continuing education, thus limiting their job possibilities. There is little linkage between vocational training schools, technical training schools, and universities. This perpetuates the perception that vocational education is a „dead-end‟ track and does not motivate students to excel in their studies with the hopes of future educational advancement beyond Level 3.
- The skills delivery system is poor in quality.
Although a Competency Based Educational Training (CBET) system has been proposed by VETA and NACTE, it is in varying stages of implementation, and with varied results. Many VETA-certified training institutions still provide course offerings based on a knowledge-based system, not based on skills acquisition.
VETA system, the study argues, has resulted in unsatisfied private sector clients, and graduates with no applicable understanding of the concepts they are exposed to from training. These

36 | THDR 2014: Background Paper No. 9, ESRF Discussion Paper 63
graduates are ill prepared to enter the workforce. To compensate for this inadequate system, some Tanzanian firms make do with the existing systems, while other companies hire more qualified staff from other countries, or send their workers to other countries for skills development. In both cases the productivity of these firms, the service delivery of the skills providers and the overall competitiveness of these businesses suffer. (JE Austin Associates: 2011, 4/5).
There is need for the ATE to have inputs into the ways technical and vocational educational institutions operate. VETA and technical colleges need to periodically identify skills gaps and provide courses and programmes accordingly. VETA also needs to look at skill gaps that exist in the current situation and prepare programmes accordingly. For example, telecommunication has become a leading sector in the last few years with mobile phones reaching every corner of the country. Yet, there are no courses offered by VETA on mobile phone repair. In order to improve technical and vocational education and to make it more aligned with the skill gaps in employment market, there is need to develop a PEDP or SEDP like programmes for technical and vocations education sub-sectors.
Developing a Clear vision for education
Society expects that output of the school system should have attained a noticeable and measurable behavioural change. This change in behaviour need to be captured by evaluating life skills imparted. We all agree that education is important but are not very clear about what the purpose of education is. As discussed earlier, the vision for education, the role education has to play, was much clearer in the early days of independence. Education was used for unity, nation building, manpower planning, creating a socialist person and so on. Clarity of goal, what we need to achieve is important, ie.”Promise” of education or expectation from it. We all agree that education is expected to produce graduates who are able to thrive in a fast changing world, meet challenges and solve problems, be entrepreneurial and create jobs, be critical and active citizens. Yet targets rarely focus on these sorts of outcomes of education, and methods of measurement do not measure these sorts of skills and attributes. The main point here is that education systems ought to have a clear set of outcomes for its students, and design all the rest of the pieces around these outcomes. In focusing on outcomes, we posit that the most important aspect of education is the capabilities of its graduates; the most important question in education is ‘what are students able to do?’
This is a big shift from what is currently happening in our schools. We are more concerned about what our students “know” than what our students can do. For example, are we concerned about our children’s writing ability? If this is one of the competencies that we expect our schools need to develop, then we would plan that this is done in classrooms and assess this ability. There is a tension between quantity and quality in education – there are trade-offs – and rapid expansion of education inevitably affects quality. But it is mistaken to plan to take care of quantity and enrolments first and quality later. The recent report of the World Bank primary education programmes carried out by its Independent Evaluation Group (IEG) noted that “Most of the WB projects have focused on expanding access and less on improved learning outcomes” (World Bank: 2006; xii). Importantly, the IEG argues that both access and improvements in learning outcomes need to be addressed together.
Countries need to resist the temptation of access first and improve learning outcomes later; expansion and quality improvement can have mutually reinforcing effects. However, competing pressures may make it difficult to undertake quality retrofitting at a later data. (xii)

THDR 2014: Background Paper No. 9, ESRF Discussion Paper 63 | 37
What are these capabilities? These are things that will enable students – whether of primary, secondary or other levels of education – to thrive in the world and in the next stage of formal schooling where applicable. For example, it is not important for our students to “know” all the facts but it is important that they know how to find the needed information. This is important for two reasons, first people tend to forget facts over time and secondly, “facts” change overtime. We feel there are several capabilities that are crucial. An ability to read and write and do basic numeracy is crucial for anyone to survive in present day. Literacy and numeracy are also important because they are basis of further learning. Perhaps no skill is more important than the skill to learn. Schools should prepare our children so that they are able to go on acquiring skills and knowledge in a wide variety of life situations once formal education has come to an end. Effective learners know how to learn and have tools and strategies to serve that purpose. The rapidly expanding pool of new information and the rise of international cooperation have increased the importance of such skills while the unpredictability and rapidity of change requires a closer connection between school education and lifelong learning. These are necessary for success in the academic world, the world of work and the society of the future.
As stated earlier, reading and numeracy skills play a central role in an individual’s learning at school. The ability to read and understand instructions and text is a basic requirement of success in all school subjects. A solid grounding in mathematics is at the very core of the educational curriculum. Analytical skills, logic skills and reasoning are all well enhanced through the study of mathematics. Compulsory training of children in mathematics is therefore an important requirement for participation in society, ultimately making an indispensable contribution to national competitiveness and the knowledge society.
Our children should develop these skills, reading and numeracy, in early years of schooling. Yet, studies like Uwezo show that many of our children finishing primary school have not developed these competencies. Other capabilities that are important are ability to comprehend, analyse, ask questions and think critically; be creative, innovate and solve problems even when faced with new challenges. It also requires a set of aptitudes such as being reflective, balanced and considerate of others; self-confidence and desire to take initiative; think out of the box and laterally, be imaginative. A full discussion of these outcomes is beyond the scope of this paper; the idea is simply to illustrate the sort of things that should be the prime focus of education policies. Once there is this clarity of vision about the purposes of education, it can guide the development of the entire education system.
We recommend a revision of education vision that focuses on the capabilities of its learners, that focuses on the skills, abilities and aptitudes of its graduates, because this is what will enable its graduates to thrive in the world and more effectively contribute to national development. Once a consensus is reached on the broad capabilities that are needed from our school graduates then other pieces will fall in place.
Value for money: financing education
Tanzania spends a significant amount of its financial resources on education with the expectation that this investment will have a positive impact on national development and on reduction of poverty. Financing of education sector reflects government’s commitments and priorities. Education has been the largest spending sector in the Tanzanian budget for a long time now, but the sector allocation has fluctuated over time, Table 5 shows the funds allocated to the education sector for the last decade.

38 | THDR 2014: Background Paper No. 9, ESRF Discussion Paper 63
Table 11: Selected Statistics for the Education Sector Expenditures (in %)(2008/09 to 2012/13)
2008/09 2009/10 2010/11 2011/12 2012/13
Actual Actual Actual Actual Actual
Sector expenditure as a share in total expenditure 19.3 17.9 18.9 18.3 18.0
Sector expenditure as a share of GDP 5.0 4.8 5.2 4.8 5.1
Share of decentralized of sector expenditure 49.9 59.4 60.8 68.1 65.6
Share of age bill sector spending 60.4 61.1 64.0 54.0 58.2
Share of development sector spending 9.5 8.4 7.2 4.0 5.9
Source: Jones and Ndaruhutse (2014), 2.
Education sector spending as a share of GDP remains relatively high for a developing country. The share of the education sector has declined from the actual expenditure of 19.3 percent in 2008/09 to 18.0 per cent in 2013/14. This is significantly lower than the 22 per cent average projected in the ESDP for the period 2008-2017 indicating the 2012/13 budget is not aligned with the ESDP strategy (URT: 2008, 41).
Table 12: Allocation of Education Sector Budget by Sub- Sectors as% of Total Expenditure
Sub - sector 2009/10actual
2010/11actual
2011/2011actual
2012/2013actual
Administration 4% 3% 2% 6%
Pre- and primary 50% 47% 51% 52%
Secondary 13% 15% 18% 17%
Higher education 24% 27% 26% 22%
Teacher education 3.7% 2.2% 2.0% 1.6%
Technical and vocational 4.5% 5.0% 1.4% 0.6%
Adult/non-formal/folk development 1.5% 0.8% 0.5% 0.5%
Total 100.0% 100.0% 100.0% 100.0%
Source: Jones and Ndaruhutse (2014) p. 25
Table 12 shows that primary education gets the largest allocation, accounting for more than half of the total sector budget. Share of secondary education has risen from 13 percent in 2009/10 to 17.0 percent in 2012/13. The share of higher education dropped from 27 percent in 2011/12 to22 percent in 2012/13. The budget shares to the main three sub-sectors (primary, secondary and higher education) are broadly in line with international benchmarks of 50 per cent for primary, 20 per cent for secondary and 20 per cent for higher education (Jones and Ndaruhutse2014).
Wage bill
Wages and personal emoluments (PE) account for a large share of the education sector budget as shown in Table 13.

THDR 2014: Background Paper No. 9, ESRF Discussion Paper 63 | 39
Table 13: Decomposition of wage bill by sub-sector 2013/14
Sub- Sector Amount (Tsh. Billions
% of the Wage Bill
% of Sub-sector total
% of Sector total
Administration 29 2 22 1Pre- and Primary Education 1,232 71 85 46Secondary Education 424 25 85 16Higher education 6 0 1 0Teacher Education 25 1 49 1Technical and Vocational Training 0 0 2 0Adult/Non- formal/ Community/ Folk Develop. 7 0 38 0
Total 1,724 100 64 64Source: Jones and Ndaruhutse (2014) 15
Table 13 shows that out of the total 1,724 billion wage bill of the education sector, 96 per cent are spent in paying the salaries and other PE for primary and secondary education. In 2013/14 budget 1,724 billion shillings, out of the total education sector budget of 2,683 billion shillings, were allocated for PE (wages and all personal allowances), which is 64 per cent of the total budget. Of the total education sector budget, 46 per cent goes towards paying the PE for the primary education sector and a further 16 per cent for wages and personal allowances in the secondary education sector. Within sub-sectors, PE accounts for a large share of the sub-sector budget. 85 per cent of primary and secondary education budget is allocated for the payment of PE leaving very little money for quality improvement initiatives.
Inequality in Public Funding
Increasing part of the government budget spending is decentralised. Around 70 per cent of the education sector budget in FY 2013/14 is at decentralised levels, up from 65 per cent in the FY 2012/13 budget and 62 per cent in FY 2012/13 actual expenditure. This demonstrates an on-going commitment to spend more of the education budget at district level. This has created inequality in spending levels. Some regions receive more per pupil allocation than others. Table 14 below shows the 5 regions that receive highest per primary school pupil allocation and 5 districts that receive the lowest per pupil allocation.
Table 14: Estimates of Per Primary School Pupil Spending by regions
Region2012/13 2012/13 2013/14 2012/13 2012/13 2013/14Budget Actual Budget Budget Actual Budget
Ten thousand Tshs. RankFive Top RegionsKilimanjaro 221 221 250 1 1 1Morogoro 179 176 205 5 5 2Arusha 180 179 199 4 3 3Mbeya 165 155 198 9 8 4Manyara 169 169 195 8 6 5Five Bottom RegionsKagera 131 125 127 15 14 15Iringa 110 110 125 17 17 16Ruvuma 102 100 119 18 18 17Mwanza 114 114 106 16 16 18Simiyu 66 66 74 19 19 19Tabora 154 153 182 10 9 10Tanga 131 114 154 14 15 14Average 155 154 177
Source: Jones and Ndaruhutse (2014) 29

40 | THDR 2014: Background Paper No. 9, ESRF Discussion Paper 63
As teacher PE accounts for the major part of the expenditure at the primary education level, these inequalities reflect unequal distribution of teachers between regions. In order to remove this inequality in public spending the government has to ensure that PTR are same across regions and districts.
Value for money
Higher per pupil spending does not necessarily mean better outcomes. Table 15 shows the unit cost per student for various levels. Data show that per primary school pupil expenditure is 142,000 shillings per annum. The cost of educating a secondary school student is 259,000 shillings, almost twice as much as for primary school pupil. Expenditure per tertiary level student is around 33 times the cost of a primary school pupil.
Table 15: Estimates of Expenditure per Student
LevelTotal Cost per
student(Thousands Ths)
Recurrent cost per student
(Tsh thousands)
Development cost per student (Tsh thousands)
Cost relative to basic (based on recurrent cost)
Pre and Primary 142 133 9 1Secondary 259 255 3 1.9Higher 4,798 4,375 423 33Teacher Education 1,494 1,494 0 11Technical/ vocational 132 107 25 0.8Adult/non-formal 85 84 1 0.6
Source: Jones and Ndaruhutse (2013) page 18
Using the 2012 figure for number of primary school graduates (i.e. those who pass the exam at end of Standard VII), Jones and Ndaruhutse have estimated that the cost of producing one graduate of basic education is Tsh 2,246,000. This means that the cost per year of producing a Basic education graduate is around twice the overall cost per student34, i.e. half of the Basic education budget is spent on students who are repeating or will drop-out. Whilst it is wrong to categorise this as ‘wasted’ expenditure, it does represent big inefficiencies in the Basic education system (Jones and Ndaruhutse: 2014; 18). Jones and Ndaruhutse report significant variations in nominal estimates of budget per primary pupil across the regions with Kilimanjaro budgeting to spend more than three times the amount per primary student compared to Simiyu. Jones and Ndaruhutse estimate the cost of producing a secondary education graduate at Tsh 1,878,000 (around 1.5 times the overall cost per student). Although unit costs per student are in the region of double those for basic, secondary proves more efficient per graduate because of a combination of fewer years of study and higher survival rates.
Public Expenditure Review (2011) use the number of Primary School Level Examination (PSLE) passes to calculate value for money. They calculated that the national average of producing a PSLE pass was TShs 1,062,499 in 2010. However, there were some districts which were spending considerably less to produce a PSLE pass than other districts. Kilombero spent 574,287 TShs for a passer as opposed to Sikonge which spent 2,390,588 per PSLE passer (PER 2011, 55). The cost of producing a CSEE pass (division 1 to 3) was estimated to be 3.8 million shillings in 2008 and 8.2 million in 2010 (PER: 2011, 47). Clearly there is a problem with value for money in the Tanzanian education system. Low pass rates in CSEE in 2012 and 2013 pose a considerable challenge for value for money. In order to increase value for money schools need to be more efficient by decreasing dropouts and repetition and by increasing the pass rates in PSLE, CSEE and ACSEE.

THDR 2014: Background Paper No. 9, ESRF Discussion Paper 63 | 41
Teachers and teacher support over infrastructure
Teachers are key for any improvement to happen in the education sector. If we are concerned about student outcome, then we should gear our policy to student performance. The most important thing happening in education is the interaction between a teacher and his/her pupils. Several teachers’ related issues are important. There are many issues that need to be addressed as far as teacher preparation, deployment and management are concerned. We have seen that most of students joining teachers colleges with the aim of becoming teachers are those with low pass grades in CSEE and ACSEE. Their knowledge of the subject content that they will teach after becoming teachers is low. This situation is unlikely to change as the status of teachers is low, not many students want to become teachers. We are going to get academically weak students in the teaching profession for a foreseeable future. The quality of teaching can be improved by the pre- service and in-service these teachers receive. Both pre-service and in-service training of teachers, need to be tailored to achieve the vision for the sector. Reform for quality education is grounded on pedagogical training of teachers that focuses on developing abilities.
Second issue is about the deployment of teachers. Fair distribution of teachers between regions, districts and schools has always been a problem. This needs to be addressed. Singida has a PTR of 70 compared to 32 for Kilimanjaro. This means, on average, a teacher in Singida is teaching more than twice as many pupils than a teacher in Kilimanjaro (BEST 2012, 31). PTR between and within districts are more unequal. Generally, urban schools have a better PTR than rural schools. There are remote rural schools where there is one teacher for more than 200 pupils.
Quality education is possible when all teachers are properly trained, supported and paid. Teacher accountability is an issue that need to be addressed. For a teacher to pay attention to the class, a pupil in particular, will need to be morally as well as materially motivated. Teachers need better pay, timely paid and a decent working environment.
For education that focuses on outcome, teacher accountability is important. The government can focus on all the things discussed above – teacher preparation, deployment, support and management – but in the end teachers have to deliver. Policies need to be in place to ensure that teachers deliver. In all the years I have been a student of education, I have never witnessed a case where a teacher has lost a job, or not received his/her salary, because of non-performance. There are primary and secondary schools which continue to function and teachers getting their salaries even when year after year all their pupils fail. I do not think there is any other sector where job security is as guaranteed as in education sector, even in case of non- performance.
Another issue, related with non-performance, is the issue of teacher attendance. Obviously, students will not learn unless teachers are in class and teaching. A study done by the World Bank and the African Economic Research Consortium in 2011 (World Bank: 2011, 16) found that “one in four teachers in Tanzania is absent from school on any given day”. Absenteeism rate was higher in urban areas compared to rural areas. Even when in school, teachers were not in classroom teaching. On average pupils in primary schools in Tanzania are taught two hours and four minutes in a day out of five hours and 12 minutes when they should be taught. In urban areas pupils were taught for only one hour and 24 minutes in a day (World Bank: 2011, 19). The causes for teachers’ absenteeism are many, including spending sometime of private matters (even if they are within school premises), follow up of their delayed or irregularly paid salaries and other benefits. Yet, teachers’ motivation to teach has been reported indirectly to be lower than expected.

42 | THDR 2014: Background Paper No. 9, ESRF Discussion Paper 63
The World Bank study also looked at the minimum knowledge that teachers had. The study prepared two tests one for English and second for mathematics. Both these tests were based on primary school curriculum. The study found that two in 10 teachers was struggled to spell a simple word and one in 10 teachers failed to correctly subtract double digit numbers (World Bank: 2011, 20).
There are areas that can be fixed through good planning. Teacher deployment can be addressed by ensuring a fair distribution of teachers between schools. There are areas that can be fixed over a medium term. Making pre-service and in-service focus on developing capabilities will require changes at the policy level and will need redoing the teachers colleges and other training institutions. Perhaps more important is how to ensure teachers attend and teach. It is time we try out performance based incentives. Simply stated this means that we pay teachers who deliver and get rid of those who do not. We reward teachers, who perform, whatever measure we set, and penalise those teachers who do not perform. Non-performing teachers can be weeded out of the system. We do not know how to structure performance based incentives as there is no evidence to show it works. But when all else has been tried and not worked, this option is worth trying.
The bottom line is this: without motivated and competent teachers focused on pupil learning all the reforms will come to nought. If teachers are at the heart of education, they ought also to be at the heart of our policy and practice, budgets and political rhetoric. Teachers should be facilitated by proper infrastructure, in-service training, on-time payment of salaries and by improving their living conditions.
Resolving the Language of instruction issue
The issue of the language of instruction has been on the agenda since independence. Although there is enough evidence to show that the continued use English as MoI is disadvantageous to academic achievement and is directly related to the failing quality of education, English continues to be used as LOI at secondary and tertiary levels. The debate is dominated basically by two strands of arguments. Those who support the use of English argue that it increases the chances of students mastering English which is important for them to interact and benefit from the global economy. Supporters argue that English is the language of science, technology and development. Arguments of those who oppose the use of English argue, based on solid research evidence that continued use of English as a LOI is disadvantageous to academic achievement and is directly related to the failures of education.
There is agreement among educationalists that children learn best in their own language, or at least in a language they know well, and that by doing so should not impair their ability to learn a second language effectively such as English. Despite this widely agreed position the government appears to have been steadfastly against an open exploration of the language issue, and to our knowledge SEDP does not address the issue. The question of medium of instruction cannot be ignored or side-lined if secondary education is to produce capable students. The policy challenge is how to teach in a medium with which the vast majority students are comfortable, as well as build proficiency in English – which is increasingly valuable in a globalizing world. We do not have the answers, but two next moves seem sensible. First, invite and encourage several private and government secondary schools to serve as ‘pilots’ which teach using Kiswahili as medium of instruction (including development of materials, teacher training, etc), and monitor performance carefully. Second, invite all sides on this issue to have a thoughtful, open debate – based on solid

THDR 2014: Background Paper No. 9, ESRF Discussion Paper 63 | 43
evidence and research – and use it to inform policy. Using English as a medium of instruction when the majority of students do not have sufficient proficiency in the language means that students do not improve their English and they do not learn anything. This is especially the case when many of the teachers who teach them are not competent in English.
Is Big Results Now (BRN) the solution?
MOEVT has identified nine strategies to change the education system in the country. Through these strategies, MOEVT aims to increase PSLE and CSEE pass rates to 60 per cent by 2013; to 70 per cent by 2014 and to more than 80 per cent by 2015 (URT: 2013). To achieve the improved performances in examinations, nine strategies will be applied under three broad areas of transparency, motivation and support. Under transparency, two strategies will be used.
The first strategy aims at ranking all schools by their performances, primary schools by their performance in PSLE and secondary schools by the performance in CSEE examinations. Head teachers and head masters of the schools not performing well will be held accountable. The poorly performing schools will be supported and guided to improve their performances. This approach has been tried in several Latin American countries where poorly performing schools are given added funds and support to improve their performance. In Tanzania, the playing field is not level for schools to compete. There are large variations in PTR, available classrooms, the socio-economic status of the children’s parents. All these have an effect on children performance. In a situation of uneven playing field, a better way of competing will be for schools to compete with itself. Measure of success should be the progress made every year. Better performing schools, teachers, and pupils will be awarded by the regional and district authorities. However, the devil is in details which are not provided. How the schools, children and particularly teachers will be selected and what kind of rewards will be provided.
The second strategy to be used under transparency focuses on national examination that will assess children’s literacy and numeracy skills. If done properly this strategy has a potential to transform the learning in primary schools. As Uwezo reports for 2011 and 2012 show, many children do not achieve the required levels of literacy and numeracy skills. The third strategy is to reward schools that do well in the national examinations and in the assessment of literacy and numeracy skills. Support will be provided to schools to ensure that they do well. The fourth strategy aims at improving school management. For this purpose schools will be provided with a manual that will guide their day to day actions. This guide has already been produced and distributed to schools. The fifth strategy targets teachers’ abilities to teach reading, writing and numeracy. The sixth strategy focuses on developing programmes that build capacity of teachers to teach and of pupils to learn. The seventh strategy aims to provide schools with grants to run and manage schools properly. The eighth strategy will be to build basic infrastructures needed by schools to function well as schools. The last strategy aims at motivating teachers to enhance their commitment and performance. BRN, if implemented, has a potential to improve learning in our schools and revive the teachers’ morale to function as committed teachers.

44 | THDR 2014: Background Paper No. 9, ESRF Discussion Paper 63
There should be no doubt that our education is in crisis and needs immediate solutions. In the final analysis it is the government who has to make decisions to ensure the quality of education improves and that our youths are able to compete on the East African, African and the World labour market. The paper shows that the quality of education in the country has deteriorated in the last few years. The focus of the government has been on expansion, at the expense of quality to ensure that as many children as possible enter school. Great deal of effort and resources have gone on inputs, building classrooms, ensuring schools have textbooks, hiring more teachers, building toilet facilities etc. These are important for education, safe and adequate infrastructure is necessary, but more important is the learning that take place within the four walls of these shining classrooms, and that has not happened.
We have also argued that education progress is worth its name if and where it enables students to develop capabilities, aptitudes and skills that will enable them to thrive in further education and in the world. This approach measures success in terms of outcomes rather than inputs, assessing both the quantity and quality of student graduates. It is focused on the central question: ‘what are students able to do?’
Our basic point is simple. The major education policy challenge in Tanzania is to have basic education goals focused on capabilities, and organize everything else (teacher education, curriculum, textbooks, libraries, examinations, inspection, use of mobile phones, internet and other technologies) around this. Teachers will need to be at the heart of this transformation, and therefore must be meaningfully involved from the beginning and throughout. This is the right time to do it. The question is whether the Government, its development partners, civil society, and all of us are up to the task.
Conclusion

THDR 2014: Background Paper No. 9, ESRF Discussion Paper 63 | 45
Association of Tanzania Employers ATE (2011) Business Agenda Tanzania : 2011-2014
Bastos, Carlos Aguirre and Roland R. Rebas(2011) “Review and Evaluation of the Performanceof Tanzania’s Higher Education Institutions in Science, Technology Innovations” International Consultants
Becker, Gary S (1964) Human Capital New York: Columbia University Press
Becker, Gary S (2006) “Health and Human Capital: The Inaugural T.W. Schultz Lecture” Review of Agricultural Economics 28.3 323-325
Beeby, C. (1966) The Quality of Education in Developing Countries Cambridge: Harvard Press
Bisong, J. (1995), ‘Language choice and cultural imperialism: a Nigerianperspective’. ELT Journal, 49 (2), 122-132.
Bloom, David; David Canning and Kevin Chan (2005) “Higher Education and Economic Development in Africa” Harvard University
Brock-Utne, B., Zubeida Desai and Martha Qorro.(2003), Language of instruction in Tanzania and South Africa. Dar es Salaam: E & D Publishers.
Buchert, Lene (1994) Education in the Development of Tanzania 1919 – 1990. Dar es Salaam: MkukiwaNyota
Cameron, J. and W.A. Dodd (1970) Society, Schools and Progress in Tanzania Oxford: Pergamon
Carr-Hill, R., Ndalichako, J., Athumani, A., Biervliet, W., Brands, J. A., Galabawa, J., Hammink, K., Mosha, H., Nguni, S. and Omari, I. (2005), Education Sector situational analysis (final report). Dar es Salaam: Arcadis / Span and Economic and Social Research Foundation.
Cooksey, B;A. Ishumi; G. Malekela and J. Galabawa (1991). “A Survey of Living and Working Conditions of Primary and Secondary School Teachers on Mainland Tanzania”.Final Report.
Criper, C. And W. Dodd (1984) “Report on the teaching of English language and its use as a medium of education in Tanzania” Dar es Salaam: Ministry of Education and Culture/ British Council
Evans, Peter and Marcella Deluca (2008) “Disabilities and Gender in Primary education” OECD/CERSFreire, P. (1972) Pedagogy of the Oppressed,Harmondsworth: Penguin.
Glewwe, Paul; AlakaHolla and Michael Kremer (2008) “Teacher Incentives in the Developing World”
Reference

46 | THDR 2014: Background Paper No. 9, ESRF Discussion Paper 63
Global Post (2013) www.globalpost.com/dispatches/globalpost-blogs/rights/tanzania-youth-employment-crisis
Hakielimu (2008) Quality of Education in Tanzania Dar es Salaam: Hakielimu
Hanushek, Eric A, (2002) “Teacher Quality” in Lance Izumi and Williamson M. Evers (eds) Teacher Quality New York: Hoover Press
Hardman, Frank and Hillary Dachi (2012) “Evaluation of School – Based INSET Pilot Programme” Ministry of Education and Vocational Training/UNICEF
ICAI (2012) DFID’s Education Programmes in Three East African Countries Report 10 London
IIEP (2006) “Education for Rural People in Africa” FAO/UNESCO
IIEP (2010) “SACMEQ III: In search of Quality, What the data tell us?” UNESCO International Institute for Educational Planning Newsletter Vol. XXVIII, No.3 Sept – Dec 2010; Paris: UNESCO
Independent Evaluation Group (IEG) (2006) From Schooling Access to Learning Outcomes. An Unfinished Agenda: An Evaluation of World bank Support to Primary Education. The World Bank: Washington DC.
JE Austin Associates (2011) Skills Development Assessment Study done for the Association of Tanzania Employers (ATE).
Jones, Amir and SusyNdaruhuste (2013) Tanzania Rapid Budget Assessment: Education prepared for DfiD by CfBT Education trust
Katabaro, J.K; and R.G. Mutayahwa (2007) “The Impact of Readership Promotion Activities on Pupil Performance” Dar es Salaam: CARE Tanzania
Lema, Elieshi, Marjorie Mbilinyi and RakeshRajani (2004) Nyerere on Education Dar es Salaam: HakiElimu, E&D Limited and TheMwalimuNyerereFoudation.
Mkumbo, Kitila (2012) “Teachers’ Commitment to and Experiences of the Teaching Profession in Tanzania: Findings of Focus Group Research” International Education Studies Vol. 5, No. 3; June 2012, 222- 227
Morisset, Jacques (2012) blogs.worldbank.org/africacan/youth-in-tanzania-a-growing-uneducated-labor-force.
Morrison, David R. (1976) Education and Politics in Africa: The Tanzanian Case Montreal: Mcgill – Queen’s University Press.
Mrutu, Aminiel S; Godfrey E. Ponera and Emmanuel M. Nkumbi (2010) “The SACMEQ II Project in Tanzania: A Study of the Conditions of Schooling and the Quality of Education” SACMEQ Educational Policy Research Series Harare and Dar es Salaam: SACMEQ/ Ministry of Education and Culture Tanzania.

THDR 2014: Background Paper No. 9, ESRF Discussion Paper 63 | 47
Nyerere, Julius K. (1956) “Statement to the U.N. Fourth Committee, 1956” in Nyerere: Freedom and Unity/UhurunaUmoja Dares Salaam: Oxford University Press. 40- 47
Nyerere, Julius K. (1966) Nyerere: Freedom and Unity/UhurunaUmoja Dares Salaam: Oxford University Press.
Nyerere, Julius K. (1966a) “The power of teachers” Speech given at the Morogoro Teachers’ College, 27th August 1966, in Lema, Elieshi, Marjorie Mbilinyi and RakeshRajani (edited) (2004) Nyerere on Education Dar es Salaam: HakiElimu, E&D Limited and The MwalimuNyerereFoundation.
Nyerere, Julius K. (1969) “Speech delivered to the Tanzania African National Union (TANU) Conference on 28th May 1969.”
Poth, J. (1997), Language planning in a plurilingual educational context (African edition) (Morris, D. R., Trans.). Paris: UNESCO.
Qorro, M. (2006), Does Language of Instruction affect quality of education? Dar es Salaam Hakielimu.
Riggio, Eliana (2012) “Children in an Urban Tanzania” Dar es Salaam: UNICEF
Riley, Kathryn (2008) “School Leadership and School Culture: Making Sense of Leadership” The World Bank
Rousso, Harilyn (2008) “Education for All: A Gender and Disability Perspective” Paper prepared for the World Bank
Roy-Campbell, Zaline and Martha Qorro (1997;14) Language Crisis in Tanzania: The Myth of English versus Education Dar es Salaam: MkukinaNyota
SACMEQ (2011) “Trends in Achievement Levels of Grade 6 pupils in Tanzania Mainland” Policy Brief Number 2
Sammons, Pam; Josh Hillman and Peter Mortimore (1995) “Key Characteristics of Effective Schools: A Review of School Effectiveness Research” Institute of Education, University of London
Samoff, Joel (1990) “Modernising a Socialist Vision: Education in Tanzania” in Carnoy, Martin and Joel Samoff; Education and Social Transition in the Third World. Princeton: Princeton University PressScheerens, Jaap (1999) “School Effectiveness in Developed and Developing Countries: A Review of Research Evidence” University of Twente/The World Bank
Skutnabb-Kangas and Phillipson, R. (1996), The possible role of donors in a Language Policy for All. Paper presented at the Role of Aid in the Development of Education for All, report from the 1996 NASEDEC conference, Agricultural University of Norway.
StansburgKendyll and Joy Zimmerman (undated) “Lifeline to the Classroom: Designing Support for Beginning Teachers” WestEnd Improving Education through Research, Development and Service

48 | THDR 2014: Background Paper No. 9, ESRF Discussion Paper 63
Stone, J.E; Guy S. Bruce; and Dan Hursh (2007) “Effective Schools, Common Practices: Twelve Ingredients of Success from Tennessee’s Most Effective Schools”. A report prepared for the Education Consumers Foundation.
Sumra, Suleman (2005) The Living and Working Conditions of Teachers in Tanzania: A Research Report Dar es Salaam: Hakielimu/Tanzania Teachers’ Union
Tamasha (2012) Education: Schooling or Fooling? Arusha: Tamasha
TEN/MET. (2007), Strengthening Education in Tanzania: CSO Contribution to the Education Sector Review 2007. Dar es Salaam: TEN/MET.
Tibandebage, Paula and AumaOkwany (2012) “Free Primary Education: Are We Postponing Exclusion?”
Tibategeza, EustardRutalemwa (2010) “Implication of Bilingual Education in Tanzania: The realities in the schools” Nordic Journal of African Studies 19(4) 227-249
Ufomata, T. (1999), ‘Major and minor languages in complex linguistic ecologies: the Nigerian experience’. International Journal of Educational Development (special issues on language), 19, 367-382
UNESCO (2000) Education for All and Children who are Excluded World Education Forum Dakar Senegal 20-25 April 2002
UNESCO (2005) “EFA Global Monitoring Report Chapter 1: Understanding Education Quality” Paris: UNESCO
UNESCO (2006) Teachers and Educational Quality: Monitoring Global Needs for 2015 Montreal: Institute for Statistics, UNESCO
UNESCO (2008) “Education for All in Least Developed Countries” Paris: UNESCO
UNESCO (2012) EFA Monitoring Report: Youth and Skills Putting Education to Work, Paris
UNICEF (2002) “Defining Qulaity in Education” A paper presented by UNICEF at the meeting of the International Working Group on Education Florence, Italy
Unterhalter, Elaine “Education, Capabilities and Social Justice” Background paper prepared for the Education for All Global Monitoring Report 2003/2004 Paris: UNESCO Dar es Salaam: The Ministry of Education and Vocational Training
USAID (2014) National Baseline Assessment for the 3Rs (Reading, Writing and Arithmetic) Using EGRA, EGMA and SSME in Tanzania: Headline Findings Report. Study carried out for USAID by RTI
URT (1969) Tanzania Second Five – Year Plan for Economic and Social Development: 1st July, 1969 – 30th June, 1974. Vol.1: General Analysis Dar es Salaam: Government Printers

THDR 2014: Background Paper No. 9, ESRF Discussion Paper 63 | 49
URT (1999) “National Higher Education Policy” Dar es Salaam: Ministry of Science, Technology and Higher Education
URT (2000) The Tanzania Development Vision 2025. Dar es Salaam: Planning Commission
URT (2001) Education Sector Development Programme: Primary Education Development Plan (2002 – 2006), Basic Education Development Committee (BEDC), Ministry of Education and Culture.
URT (2002) Basic Statistics in Education: 1997 – 2001 National Data Dar es Salaam: The Ministry of Education and Culture.
URT (2003) ‘Education Sector Public Expenditure Review 2003’ Dar es Salaam: Ministry of Education and Culture.
URT (2004a) Basic Statistics in Education 1995-2004, National data. Dar es Salaam: Ministry of Education and Culture.
URT (2004b) ‘Education Sector Public Expenditure Review 2004’ Dar es Salaam: Ministry of Education and Culture.
URT (2005) National Strategy for Growth and Reduction of Poverty (NSGRP) Dar es Salaam: Vice President’s Office.
URT (2006) Basic Education Statistics in Tanzania (BEST) 2002-2006 National Data Dar es Salaam: Ministry of Education and Culture.
URT (2006a) “Primary Education Development Programme II” Basic Education Development Committee, Ministry OfEducation and Culture
URT (2006b) “The Secondary Education Development Report (SEDP): Annual Performance Report” Basic Education development Committee, Dar es Salaam: Ministry Of Education and Culture,
URT (2008) Basic Education Statistics in Tanzania (BEST 2004 – 2008 National Data Dar es Salaam: Ministry of Education and Vocational Training.
URT (2008a) “Baseline study: The Quality of Teaching and Learning. Processes in Tanzanian Primary Schools” Dar es Salaam: MOEVT/UNICEF.
URT (2008b) The Teacher Development and Management Strategy (TDMS) 2008 – 2013. Dar es Salaam: Basic Education Development Committee, Dar es Salaam: Ministry of Education and Vocational Training.
URT (2009) Minimum Standards for Pre-Primary and Primary Education in Tanzania Dar es Salaam: Ministry of Education and Vocational Training
URT (2009a) “Joint Education Sector Review 2009: Annual Performance Report” Dar es Salaam: Education Sector Development Committee, Dar es Salaam: Ministry of Education and Vocational Training

50 | THDR 2014: Background Paper No. 9, ESRF Discussion Paper 63
URT (2009c) “Secondary Education Development Plan II (2010-2014)” Education Sector Development Plan (ESDP) Dares Salaam: MOEVT
URT (2010) Basic Education Statistics in Tanzania (BEST) 2006 – 2010 Revised National Data Dar es Salaam: Ministry of Education and Vocational Training
URT (2010a) “Education Sector Performance Report 2009/2010” Education Sector Development Committee, MOEVT
URT (2010b) National Strategy for Growth and Reduction of Poverty II (NSGRP II) Dar es Salaam: Ministry of Finance and Economic Affairs
URT (2011a) The Tanzania Five Year Development Plan 2011/12 – 2015/16: Unleashing Tanzania’s Latent Growth potentials Dar es Salaam: President’s Office, Planning Commission
URT (2012) Basic Education Statistics in Tanzania (BEST) 2008 – 2012 National Data Dar es Salaam: Ministry of Education and Vocational Training
URT (2012a) “Primary Education Development Programme III” Basic Education Development Committee, Ministry of Education and Vocational Development.URT (2013) Mpango wa Matokeo Makubwa Sasa Sekta ya Elimu Dar es Salaam: WizarayaElimunaMafunzoyaUfundi.
URT (2014) Basic Education Statistics in Tanzania (BEST) 2009 – 2013 National Data (Draft)Dar es Salaam: Ministry of Education and Vocational Training
Uwezo (2011) Are our Children Learning? Annual Learning Assessment Report Dar es Salaam: Uwezo Tanzania.
Uwezo (2013) Are our Children Learning? Annual Learning Assessment Report Dar es Salaam: Uwezo Tanzania.
WCEFA (1990) Meeting Basic Learning Needs: A Vision for the 1990s Background Documents. Jomtein Thailand.
Wedgewood, R. (2005), Post-Basic Education and Poverty in TanzaniaEdinburgh: Centre of African Studies, University of Edinburgh.
Woods, Eric (2008) “Tanzania Country Case Study – Country Profile” Paper prepared for the Education for All Global Monitoring Report.
World Bank (2006) “From Schooling Access to Learning Outcomes: An Unfinished Agenda: An Evaluation of World bank Support to Primary Education” Washington: Independent Evaluation Group (IEG), World Bank.
World Bank (2010) “Addressing Equity Issues in the Delivery of Public Services in Tanzania and Uganda: A human resource management perspective. Policy Note
World Bank (2011) “Service Delivery Indicators: Pilot in Education and Health care in Africa” World

THDR 2014: Background Paper No. 9, ESRF Discussion Paper 63 | 51
Bank and African Economic Research Consortium.
Wort, M.A.A. (1997) “Distance Education and the Training of Primary School Teachers in Tanzania”
Wort, M.A.A.; J. Mrutu, J.; Kassi, F.; (1993) “Strengthening of In-Service Correspondence Education for Primary School Teachers in Tanzania” Ministry of Education and Culture, Tanzania and SIDA.

52 | THDR 2014: Background Paper No. 9, ESRF Discussion Paper 63
Rajani, Rakesh - Head, Twaweza
Missokia, Elizabeth - Executive Director, Hakielimu
Sekwao, Christine - Coordinator, TEN/MET
Ishumi, Abel - School of Education, University of Dar es Salaam
Mushi, PAK - School of Education, University of Dar es Salaam
Mkude, Daniel - Retired Professor, University of Dar es Salaam
List of Experts Consulted

THDR 2014: Background Paper No. 9, ESRF Discussion Paper 63 | 53

54 | THDR 2014: Background Paper No. 9, ESRF Discussion Paper 63


Copyright © 2022 FDOKUMEN