CHAPTER - II - CAG
69
21 CHAPTER - II Performance reviews relating to Government companies 2.1 Functioning of State Transport Undertakings Executive Summary In Tamil Nadu, the Public transport is provided by seven State Transport Undertakings (STUs) which had a fleet strength of 20,104 buses as on 31 March 2009. The STUs carried an average of 196.96 lakh passengers per day during 2008-09. The total turnover of STUs (Rs.5,050.63 crore) in 2008-09 was equal to 2.21 per cent of the State gross domestic product for the year. The performance audit of STUs for the period from 2004-05 to 2008-09 was conducted to assess the efficiency and economy of STUs’ operations, ability to meet their financial commitments, possibility of realigning the business model to tap non-conventional sources of revenue, existence and adequacy of fare policy and effectiveness of the top management in monitoring the affairs of the STUs. Out of the seven STUs of the State, Audit selected four STUs, i.e., one having its service entirely within the Metro city (MTC), the second having only long distance services (SETC), the third-TNSTC (KBM) and the fourth-TNSTC (MDU) having a mix of both town and mofussil services. Finances and Performance The STUs suffered continuous losses during the four years ending 2008-09 and had an accumulated loss of Rs.3,884.99 crore as on 31 March 2009. Six STUs operating in mofussil/town and express services earned Rs.15.99 per kilometre (KM) but expended Rs.18.32 per KM in 2008-09. The Metropolitan Transport Corporation (Chennai) Limited (MTC), earned Rs.24.59 per KM but expended Rs.27.90 per KM in 2008-09. Share in Public Transport While the State allows exclusive operation of transport services by STUs within Chennai city and Madurai Town, it allows both private operators and STUs to operate services in other towns and mofussil areas. The six STUs and private operators increased their fleet strength from 20,359 buses as on 31 March 2005 to 24,027 buses as on 31 March 2009. MTC increased its fleet from 2,773 to 3,260 during the above period. The vehicle density per one lakh population had increased from 36 in 2004-05 to 42 in 2008-09 in the State. In Chennai, the same increased from 36 to 38 during the above period. Vehicle profile and utilisation Two mofussil STUs test checked increased their fleet strength by 4,526 buses during 2004-09 and thereby, reduced the percentage of overaged vehicles from 69.27 to 37.67 during the review period. Similarly SETC and MTC added 730 and 2,407 buses during the review period and reduced the percentage of overaged express and city buses from 99.54 to 34.91 and 77.17 to 25.34 during the review period respectively. As the replacement of buses by these STUs was without internal generation of funds and at the direction of the Government, the replacement through borrowed funds had increased the interest burden of four STUs by Rs.85.72 crore during the review period. The fleet utilisation of three STUs remained at 95 per cent during review period and in respect of MTC varied from 78.84 per cent in 2004-05 to 87.57 per cent in 2008-09. The vehicle productivity of two mofussil STUs and SETC was more than All India Average of 313 KMs per day and ranged between 441 - 459 KMs and 614 - 627 KMs respectively during the review period. In case of MTC, it ranged between 261 and 298 KMs per day during the review period. The passenger load factor of mofussil and express buses improved from 78.98 per cent in 2004-05 to 85.46 per cent in 2008-09. But in MTC, the same increased from 80.81 in 2004-05 to 85.92 in 2006-07, but declined to 75.25 per cent in 2008-09 due to operation of deluxe and other special services for which the public patronage was less. Economy in operations Manpower and fuel constitute 78.49 per cent of the total cost. Interest, depreciation and taxes account for 13.32 per cent and are not controllable in the short term. Thus, the major cost saving has to come from manpower and fuel. All the four STUs test checked had excess
-
Upload
khangminh22 -
Category
Documents
-
view
3 -
download
0
Transcript of CHAPTER - II - CAG
21
CHAPTER - II Performance reviews relating to Government companies 2.1 Functioning of State Transport Undertakings
Executive Summary
In Tamil Nadu, the Public transport is provided by seven State Transport Undertakings (STUs) which had a fleet strength of 20,104 buses as on 31 March 2009. The STUs carried an average of 196.96 lakh passengers per day during 2008-09. The total turnover of STUs (Rs.5,050.63 crore) in 2008-09 was equal to 2.21 per cent of the State gross domestic product for the year. The performance audit of STUs for the period from 2004-05 to 2008-09 was conducted to assess the efficiency and economy of STUs’ operations, ability to meet their financial commitments, possibility of realigning the business model to tap non-conventional sources of revenue, existence and adequacy of fare policy and effectiveness of the top management in monitoring the affairs of the STUs. Out of the seven STUs of the State, Audit selected four STUs, i.e., one having its service entirely within the Metro city (MTC), the second having only long distance services (SETC), the third-TNSTC (KBM) and the fourth-TNSTC (MDU) having a mix of both town and mofussil services.
Finances and Performance
The STUs suffered continuous losses during the four years ending 2008-09 and had an accumulated loss of Rs.3,884.99 crore as on 31 March 2009. Six STUs operating in mofussil/town and express services earned Rs.15.99 per kilometre (KM) but expended Rs.18.32 per KM in 2008-09. The Metropolitan Transport Corporation (Chennai) Limited (MTC), earned Rs.24.59 per KM but expended Rs.27.90 per KM in 2008-09.
Share in Public Transport
While the State allows exclusive operation of transport services by STUs within Chennai city and Madurai Town, it allows both private operators and STUs to operate services in other towns and mofussil areas. The six STUs and private operators increased their fleet strength from 20,359 buses as on 31 March 2005 to 24,027 buses as on 31 March 2009. MTC increased its fleet from 2,773 to 3,260 during the above period. The vehicle density per one lakh population had
increased from 36 in 2004-05 to 42 in 2008-09 in the State. In Chennai, the same increased from 36 to 38 during the above period.
Vehicle profile and utilisation
Two mofussil STUs test checked increased their fleet strength by 4,526 buses during 2004-09 and thereby, reduced the percentage of overaged vehicles from 69.27 to 37.67 during the review period. Similarly SETC and MTC added 730 and 2,407 buses during the review period and reduced the percentage of overaged express and city buses from 99.54 to 34.91 and 77.17 to 25.34 during the review period respectively. As the replacement of buses by these STUs was without internal generation of funds and at the direction of the Government, the replacement through borrowed funds had increased the interest burden of four STUs by Rs.85.72 crore during the review period.
The fleet utilisation of three STUs remained at 95 per cent during review period and in respect of MTC varied from 78.84 per cent in 2004-05 to 87.57 per cent in 2008-09. The vehicle productivity of two mofussil STUs and SETC was more than All India Average of 313 KMs per day and ranged between 441 - 459 KMs and 614 - 627 KMs respectively during the review period. In case of MTC, it ranged between 261 and 298 KMs per day during the review period. The passenger load factor of mofussil and express buses improved from 78.98 per cent in 2004-05 to 85.46 per cent in 2008-09. But in MTC, the same increased from 80.81 in 2004-05 to 85.92 in 2006-07, but declined to 75.25 per cent in 2008-09 due to operation of deluxe and other special services for which the public patronage was less.
Economy in operations
Manpower and fuel constitute 78.49 per cent of the total cost. Interest, depreciation and taxes account for 13.32 per cent and are not controllable in the short term. Thus, the major cost saving has to come from manpower and fuel. All the four STUs test checked had excess
Audit Report (Commercial) for the year ended 31 March 2009
22
manpower over and above the norm and thereby incurred idle wages of Rs.542.38 crore during the period under review. The STUs did not achieve their own targets for fuel consumption resulting in extra expenditure of Rs.33.76 crore during the same period.
As a result of cancellations due to controllable factors like want of crew and vehicles, the four STUs were deprived of contribution to an extent of Rs.169.17 crore.
Four STUs outsourced bus body construction despite availability of cheaper in-house capacity and incurred an avoidable extra expenditure of Rs.6.86 crore. Besides, the delay in construction of bus bodies in-house resulted in loss of potential revenue of Rs.1.49 crore.
Revenue Maximisation
The STUs do not have any policy for tapping non-traffic revenue sources by taking up large scale public-private partnership projects on their vacant land.
Need for a regulator
The Government does not have a policy to revise the fare based on normative cost. Within the ambit of existing fare structure, STUs test checked did not revise the fare for “Travel as you please” and lost a revenue of Rs.48.94 crore.
Fulfilment of social obligations
The STUs collectively failed to liquidate the dues in respect of terminal benefits (Rs.969.99 crore) to the retired employees and admitted liability towards the victims of accidents (Rs.158.15 crore) as they diverted the funds earmarked for these obligations towards their working capital needs.
Monitoring
The fixation of targets for various operational parameters and an effective Management Information System (MIS) for obtaining feed back on achievement thereof are essential for monitoring by the top management. But the MIS system of the STUs was not effective as it did not have an integrated data base on the operations of individual depots and routes.
Conclusion and Recommendations
Though STUs are suffering losses due to their high cost of operations and very meagre increase in revenue, they may control the loss by tapping non-conventional sources of revenue and keeping the manpower and KMPL within the norm. The loss may also be reduced by controlling the loss of scheduled KMs. The review contains five recommendations to improve the performance of STUs. Creating a regulator to regulate fares and services and tapping non-conventional sources of revenue by undertaking PPP projects are stressed in these recommendations.
Introduction
2.1.1 In Tamil Nadu, public road transport is provided by the seven State Transport Undertakings (STUs), which are mandated to provide high quality, efficient, reasonably priced, safe and secure road transport. While the State allows exclusive operation of transport services by the STU within Chennai city and Madurai town, it allows both the private operators and STUs to operate their services in other towns, mofussil and long distance routes. The fare structure is controlled by the State Government, which commonly applies to both STUs and private operators.
Chapter-II Performance Reviews relating to Government companies
23
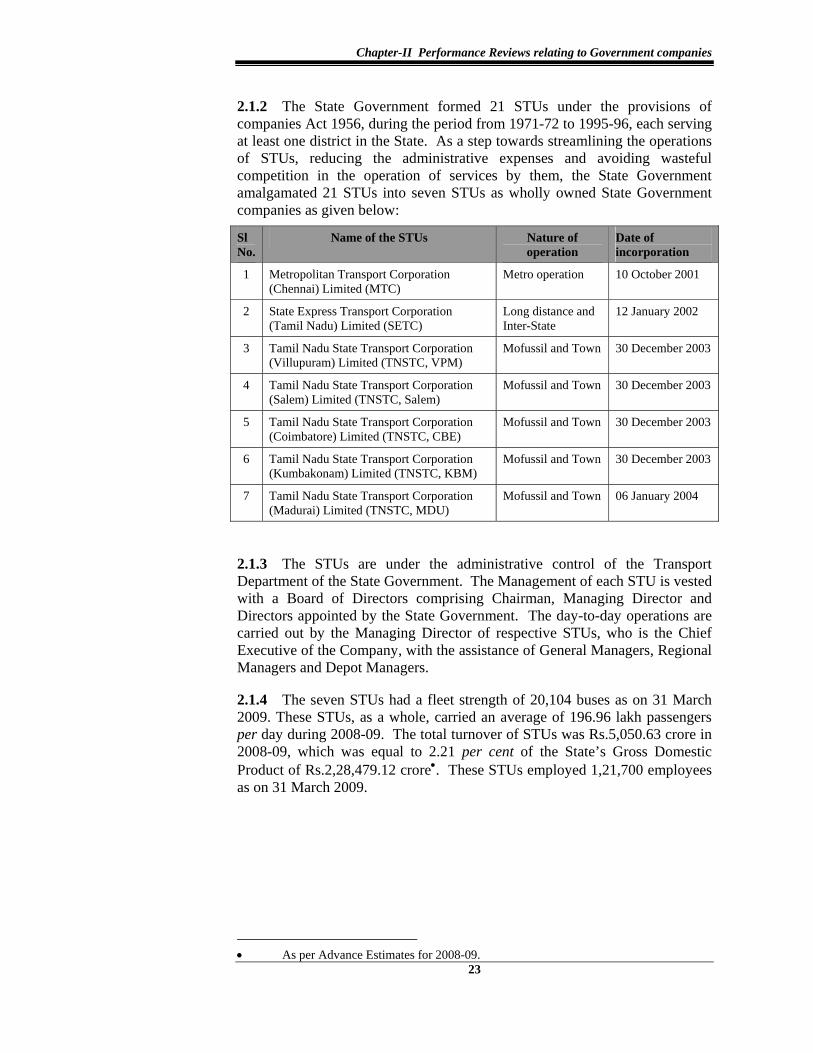
2.1.2 The State Government formed 21 STUs under the provisions of companies Act 1956, during the period from 1971-72 to 1995-96, each serving at least one district in the State. As a step towards streamlining the operations of STUs, reducing the administrative expenses and avoiding wasteful competition in the operation of services by them, the State Government amalgamated 21 STUs into seven STUs as wholly owned State Government companies as given below:
Sl No.
Name of the STUs Nature of operation
Date of incorporation
1 Metropolitan Transport Corporation (Chennai) Limited (MTC)
Metro operation 10 October 2001
2 State Express Transport Corporation (Tamil Nadu) Limited (SETC)
Long distance and Inter-State
12 January 2002
3 Tamil Nadu State Transport Corporation (Villupuram) Limited (TNSTC, VPM)
Mofussil and Town 30 December 2003
4 Tamil Nadu State Transport Corporation (Salem) Limited (TNSTC, Salem)
Mofussil and Town 30 December 2003
5 Tamil Nadu State Transport Corporation (Coimbatore) Limited (TNSTC, CBE)
Mofussil and Town 30 December 2003
6 Tamil Nadu State Transport Corporation (Kumbakonam) Limited (TNSTC, KBM)
Mofussil and Town 30 December 2003
7 Tamil Nadu State Transport Corporation (Madurai) Limited (TNSTC, MDU)
Mofussil and Town 06 January 2004
2.1.3 The STUs are under the administrative control of the Transport Department of the State Government. The Management of each STU is vested with a Board of Directors comprising Chairman, Managing Director and Directors appointed by the State Government. The day-to-day operations are carried out by the Managing Director of respective STUs, who is the Chief Executive of the Company, with the assistance of General Managers, Regional Managers and Depot Managers.
2.1.4 The seven STUs had a fleet strength of 20,104 buses as on 31 March 2009. These STUs, as a whole, carried an average of 196.96 lakh passengers per day during 2008-09. The total turnover of STUs was Rs.5,050.63 crore in 2008-09, which was equal to 2.21 per cent of the State’s Gross Domestic Product of Rs.2,28,479.12 crore•. These STUs employed 1,21,700 employees as on 31 March 2009.
• As per Advance Estimates for 2008-09.
Audit Report (Commercial) for the year ended 31 March 2009
24
Scope and Methodology of Audit
2.1.5 A Review on the working of STUs was included in the Report of the Comptroller and Auditor General of India for the year ended 31 March 2000 (Commercial), Government of Tamil Nadu. The report was discussed by the Committee on Public Undertakings (COPU) during 2002. The recommendations of COPU are awaited (October 2009).
The present performance review conducted between December 2008 and July 2009 covered the performance of STUs during the period from 2004-05 to 2008-09. The review mainly focuses on operational efficiency, financial management, fare policy, fulfilment of social obligations and monitoring by top management of the STUs. Out of the seven STUs of the State, Audit selected four STUs, i.e., one having its service entirely within the Metropolitan city (MTC), the second having only long distance services (SETC), the third-TNSTC (KBM) and the fourth-TNSTC (MDU) having a mix of both town and mofussil services. The audit examination involved scrutiny of records at the Head Office, four Central Workshops, their bus body building units, 30 out of 157 depots of these four STUs. The regional offices and depots were selected based on their fleet strength, occupancy ratio, earnings per KM and cost of operations. The fleet strength of selected depots as on 31 March 2008 was 2,653 buses (23 per cent) against the total strength of 11,421 buses for four STUs.
2.1.6 The methodology adopted for attaining the audit objectives with reference to audit criteria consisted of explaining audit objectives to the top management, scrutiny of records at the Head Office and selected units, interaction with the auditee personnel, analysis of data with reference to audit criteria, raising of audit queries, discussion of audit findings with the Management and issue of draft review to the Management for comments.
Audit Objectives
2.1.7 The objectives of the performance audit were to assess:
Operational Performance
• the extent to which these STUs were able to keep pace with the growing demand for public transport;
• whether the STUs succeeded in recovering the cost of operations;
• whether adequate maintenance was undertaken to keep the vehicles roadworthy; and
• the extent to which economy was ensured in cost of operations.
Chapter-II Performance Reviews relating to Government companies
25
Financial Management
• whether the STUs were able to meet their commitments and recover their dues efficiently; and
• the possibility of realigning the business model of the STUs to tap non-conventional sources of revenue and adopting innovative methods of accessing such funds.
Fare Policy
• the existence and adequacy of fare policy.
Monitoring by Top Management
• whether the monitoring by STUs’ top management was effective.
Audit Criteria
2.1.8 The audit criteria adopted for assessing the achievement of the audit objectives were:
• All India Average (AIA) for performance parameters;
• performance standards and operational norms fixed by the Association of State Road Transport Undertakings (ASRTU);
• physical and financial targets / norms fixed by the Management;
• norms for life of a bus, fuel efficiency norms, etc.;
• instructions of the State Government and other relevant rules and regulations; and
• Procedures laid down by the STUs.
Audit Report (Commercial) for the year ended 31 March 2009
26
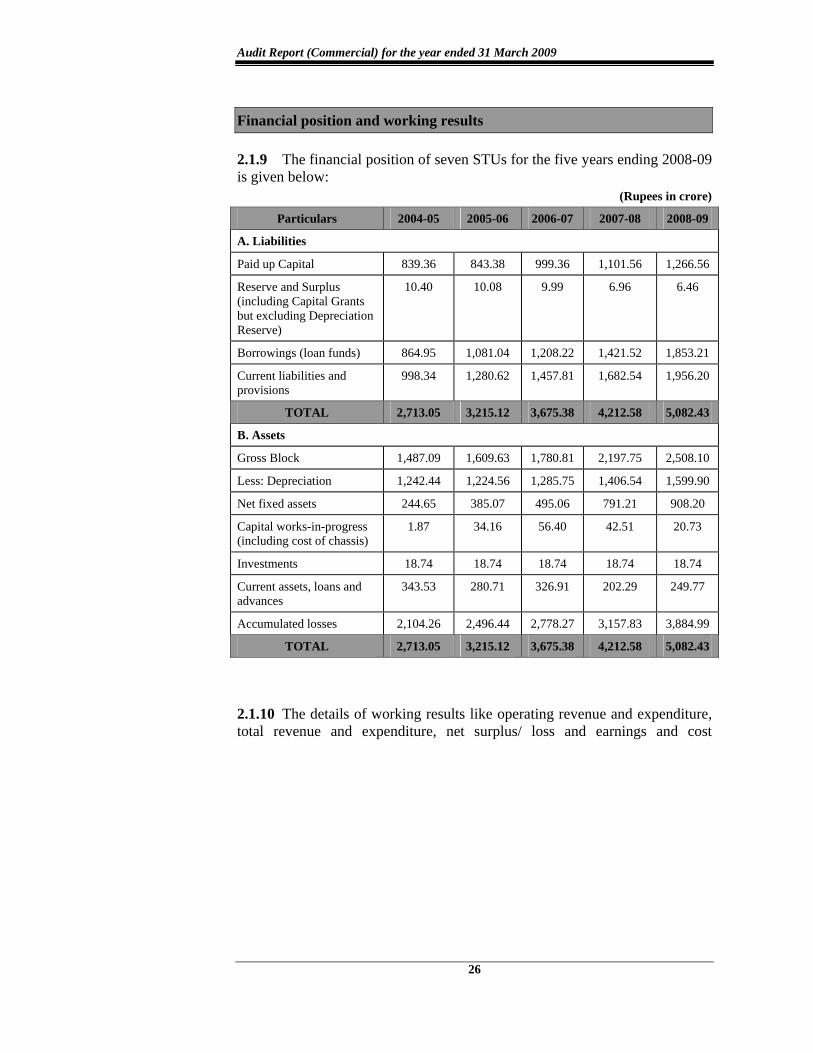
Financial position and working results 2.1.9 The financial position of seven STUs for the five years ending 2008-09 is given below:
(Rupees in crore)
Particulars 2004-05 2005-06 2006-07 2007-08 2008-09
A. Liabilities
Paid up Capital 839.36 843.38 999.36 1,101.56 1,266.56
Reserve and Surplus (including Capital Grants but excluding Depreciation Reserve)
10.40 10.08 9.99 6.96 6.46
Borrowings (loan funds) 864.95 1,081.04 1,208.22 1,421.52 1,853.21
Current liabilities and provisions
998.34 1,280.62 1,457.81 1,682.54 1,956.20
TOTAL 2,713.05 3,215.12 3,675.38 4,212.58 5,082.43
B. Assets
Gross Block 1,487.09 1,609.63 1,780.81 2,197.75 2,508.10
Less: Depreciation 1,242.44 1,224.56 1,285.75 1,406.54 1,599.90
Net fixed assets 244.65 385.07 495.06 791.21 908.20
Capital works-in-progress (including cost of chassis)
1.87 34.16 56.40 42.51 20.73
Investments 18.74 18.74 18.74 18.74 18.74
Current assets, loans and advances
343.53 280.71 326.91 202.29 249.77
Accumulated losses 2,104.26 2,496.44 2,778.27 3,157.83 3,884.99
TOTAL 2,713.05 3,215.12 3,675.38 4,212.58 5,082.43
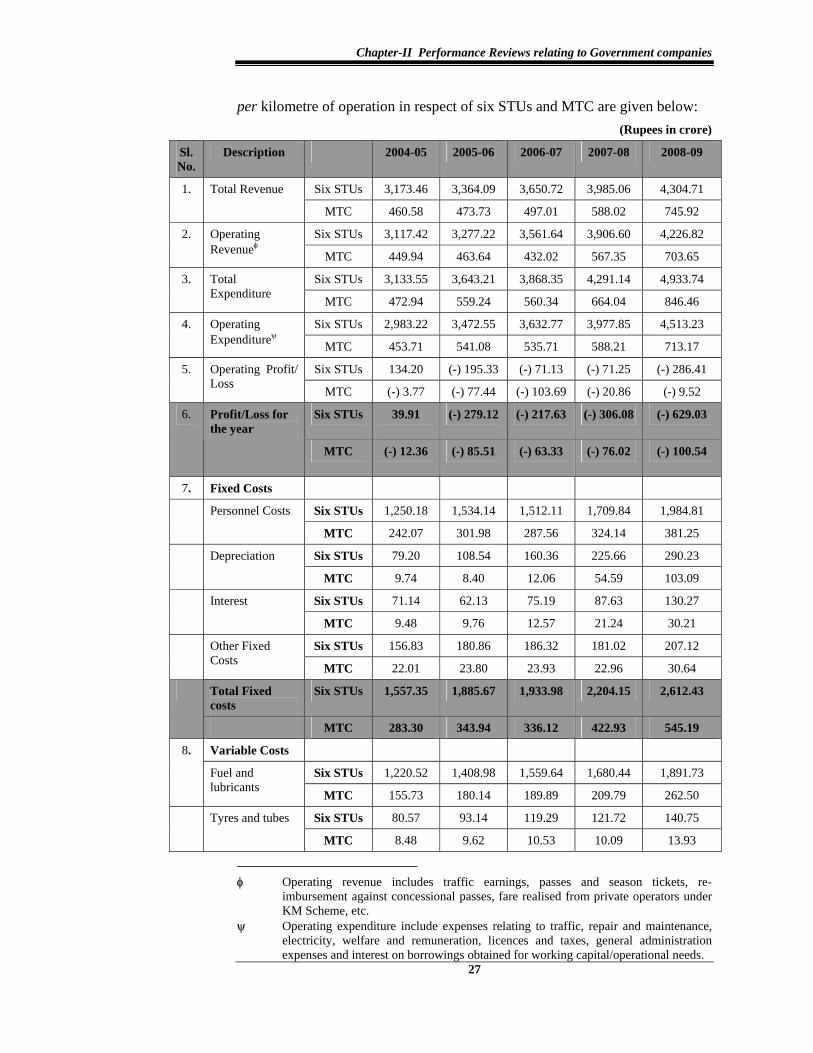
2.1.10 The details of working results like operating revenue and expenditure, total revenue and expenditure, net surplus/ loss and earnings and cost
Chapter-II Performance Reviews relating to Government companies
27
per kilometre of operation in respect of six STUs and MTC are given below: (Rupees in crore)
Sl.No.
Description 2004-05 2005-06 2006-07 2007-08 2008-09
Six STUs 3,173.46 3,364.09 3,650.72 3,985.06 4,304.71 1. Total Revenue
MTC 460.58 473.73 497.01 588.02 745.92
Six STUs 3,117.42 3,277.22 3,561.64 3,906.60 4,226.82 2. Operating Revenueφ MTC 449.94 463.64 432.02 567.35 703.65
Six STUs 3,133.55 3,643.21 3,868.35 4,291.14 4,933.74 3. Total Expenditure MTC 472.94 559.24 560.34 664.04 846.46
Six STUs 2,983.22 3,472.55 3,632.77 3,977.85 4,513.23 4. Operating Expenditureψ MTC 453.71 541.08 535.71 588.21 713.17
Six STUs 134.20 (-) 195.33 (-) 71.13 (-) 71.25 (-) 286.41 5. Operating Profit/ Loss MTC (-) 3.77 (-) 77.44 (-) 103.69 (-) 20.86 (-) 9.52
Six STUs 39.91 (-) 279.12 (-) 217.63 (-) 306.08 (-) 629.03 6. Profit/Loss for the year
MTC (-) 12.36 (-) 85.51 (-) 63.33 (-) 76.02 (-) 100.54
7. Fixed Costs
Six STUs 1,250.18 1,534.14 1,512.11 1,709.84 1,984.81 Personnel Costs
MTC 242.07 301.98 287.56 324.14 381.25
Six STUs 79.20 108.54 160.36 225.66 290.23 Depreciation
MTC 9.74 8.40 12.06 54.59 103.09
Six STUs 71.14 62.13 75.19 87.63 130.27 Interest
MTC 9.48 9.76 12.57 21.24 30.21
Six STUs 156.83 180.86 186.32 181.02 207.12 Other Fixed Costs
MTC 22.01 23.80 23.93 22.96 30.64
Total Fixed costs
Six STUs 1,557.35 1,885.67 1,933.98 2,204.15 2,612.43
MTC 283.30 343.94 336.12 422.93 545.19
Variable Costs
Six STUs 1,220.52 1,408.98 1,559.64 1,680.44 1,891.73
8.
Fuel and lubricants
MTC 155.73 180.14 189.89 209.79 262.50
Six STUs 80.57 93.14 119.29 121.72 140.75 Tyres and tubes
MTC 8.48 9.62 10.53 10.09 13.93
φ Operating revenue includes traffic earnings, passes and season tickets, re-
imbursement against concessional passes, fare realised from private operators under KM Scheme, etc.
ψ Operating expenditure include expenses relating to traffic, repair and maintenance, electricity, welfare and remuneration, licences and taxes, general administration expenses and interest on borrowings obtained for working capital/operational needs.
Audit Report (Commercial) for the year ended 31 March 2009
28
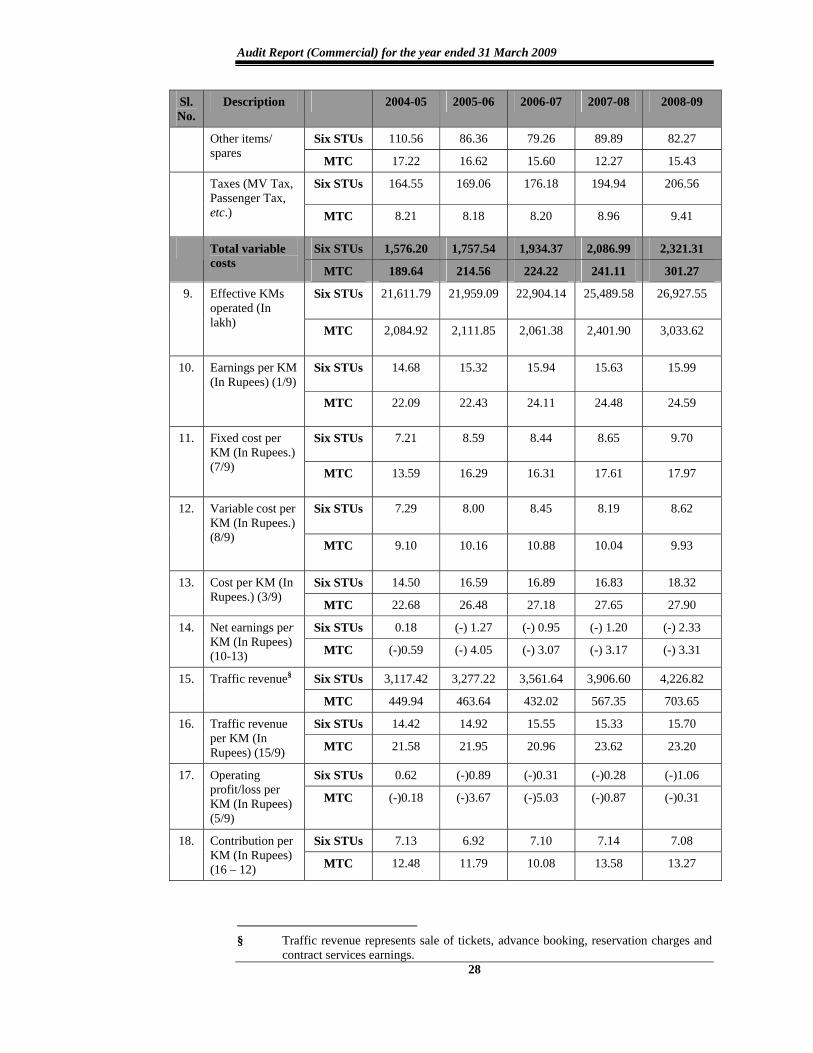
Sl.No.
Description 2004-05 2005-06 2006-07 2007-08 2008-09
Six STUs 110.56 86.36 79.26 89.89 82.27 Other items/ spares
MTC 17.22 16.62 15.60 12.27 15.43
Six STUs 164.55 169.06 176.18 194.94 206.56 Taxes (MV Tax, Passenger Tax, etc.) MTC 8.21 8.18 8.20 8.96 9.41
Six STUs 1,576.20 1,757.54 1,934.37 2,086.99 2,321.31 Total variable costs MTC 189.64 214.56 224.22 241.11 301.27
Six STUs 21,611.79 21,959.09 22,904.14 25,489.58 26,927.55 9. Effective KMs operated (In lakh)
MTC 2,084.92 2,111.85 2,061.38 2,401.90 3,033.62
Six STUs 14.68 15.32 15.94 15.63 15.99 10. Earnings per KM (In Rupees) (1/9)
MTC 22.09 22.43 24.11 24.48 24.59
Six STUs 7.21 8.59 8.44 8.65 9.70 11. Fixed cost per KM (In Rupees.) (7/9) MTC 13.59 16.29 16.31 17.61 17.97
Six STUs 7.29 8.00 8.45 8.19 8.62 12. Variable cost per KM (In Rupees.) (8/9)
MTC 9.10 10.16 10.88 10.04 9.93
Six STUs 14.50 16.59 16.89 16.83 18.32 13. Cost per KM (In Rupees.) (3/9)
MTC 22.68 26.48 27.18 27.65 27.90
Six STUs 0.18 (-) 1.27 (-) 0.95 (-) 1.20 (-) 2.33 14. Net earnings per KM (In Rupees) (10-13) MTC (-)0.59 (-) 4.05 (-) 3.07 (-) 3.17 (-) 3.31
Six STUs 3,117.42 3,277.22 3,561.64 3,906.60 4,226.82 15. Traffic revenue§
MTC 449.94 463.64 432.02 567.35 703.65
Six STUs 14.42 14.92 15.55 15.33 15.70 16. Traffic revenue per KM (In Rupees) (15/9) MTC 21.58 21.95 20.96 23.62 23.20
Six STUs 0.62 (-)0.89 (-)0.31 (-)0.28 (-)1.06 17. Operating profit/loss per KM (In Rupees) (5/9)
MTC (-)0.18 (-)3.67 (-)5.03 (-)0.87 (-)0.31
Six STUs 7.13 6.92 7.10 7.14 7.08 18. Contribution per KM (In Rupees) (16 – 12) MTC 12.48 11.79 10.08 13.58 13.27
§ Traffic revenue represents sale of tickets, advance booking, reservation charges and
contract services earnings.
Chapter-II Performance Reviews relating to Government companies
29
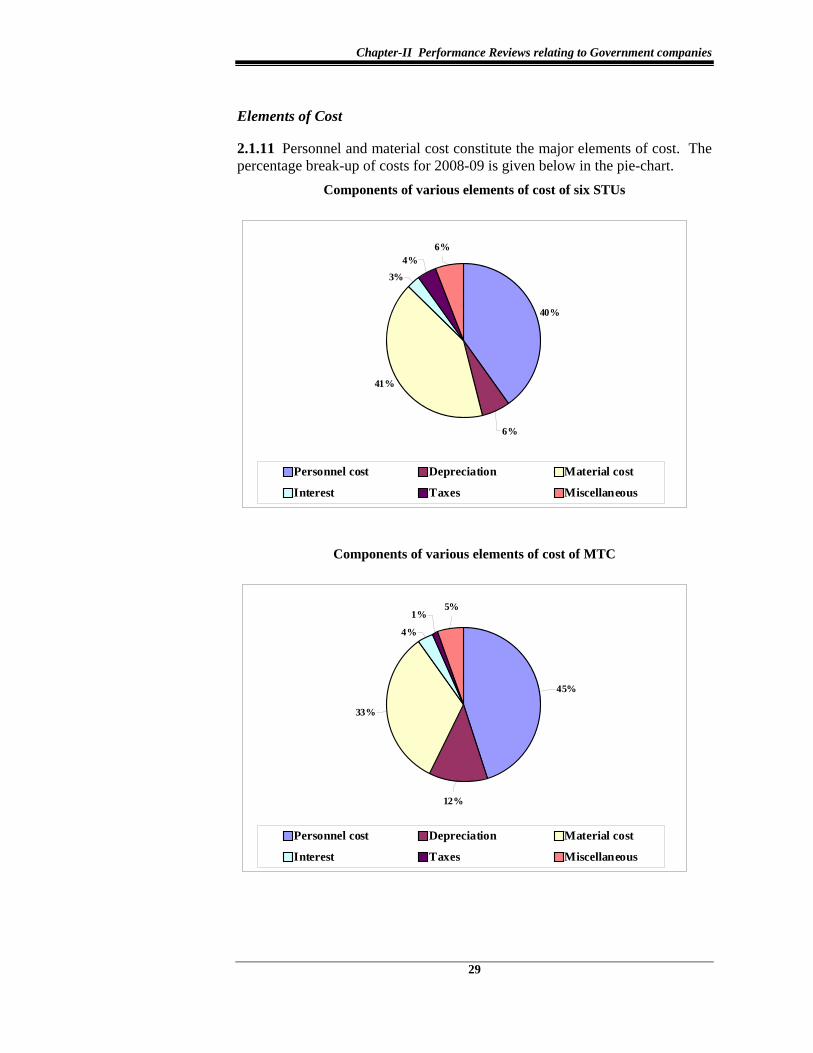
Elements of Cost
2.1.11 Personnel and material cost constitute the major elements of cost. The percentage break-up of costs for 2008-09 is given below in the pie-chart.
Components of various elements of cost of six STUs
40%
41%
3%
4%
6%
6%
Personnel cost Depreciation Material cost
Interest Taxes Miscellaneous
Components of various elements of cost of MTC
4%
1%5%
45%
12%
33%
Personnel cost Depreciation Material cost
Interest Taxes Miscellaneous
Audit Report (Commercial) for the year ended 31 March 2009
30
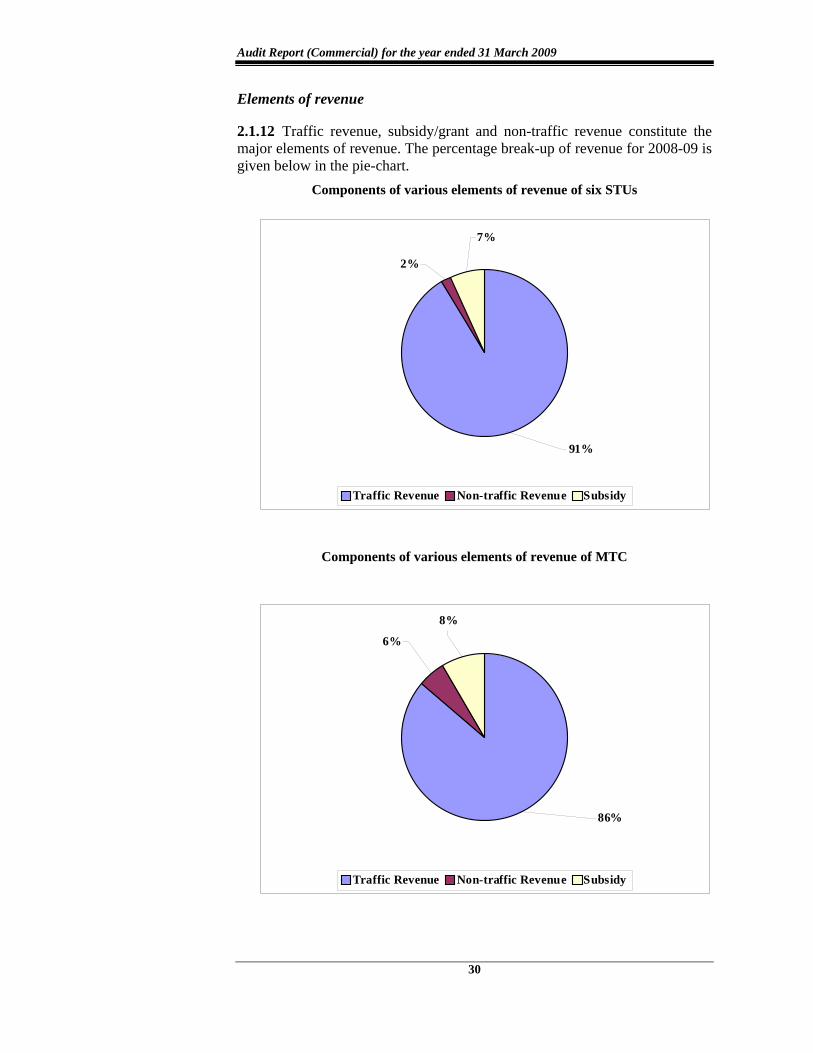
Elements of revenue
2.1.12 Traffic revenue, subsidy/grant and non-traffic revenue constitute the major elements of revenue. The percentage break-up of revenue for 2008-09 is given below in the pie-chart.
Components of various elements of revenue of six STUs
91%
7%
2%
Traffic Revenue Non-traffic Revenue Subsidy
Components of various elements of revenue of MTC
86%
8%
6%
Traffic Revenue Non-traffic Revenue Subsidy
Chapter-II Performance Reviews relating to Government companies
31
Audit Findings
2.1.13 Audit explained the audit objectives to the STUs and the Government in an ‘entry conference’ held on 17 February 2009. Subsequently, audit findings were reported to the STUs and the Government on 9 September 2009 and discussed in an ‘Exit Conference’ held on 10 December 2009, wherein the Secretary, Transport Department, Government of Tamil Nadu and the Managing Directors of STUs were present. The views expressed by the Government and the Management in the exit conference have been considered while finalising this review. The Audit findings are discussed below:
Operational Performance
2.1.14 The operational performance of all STUs for the five years ending 2008-09 is given in the Annexure–7. The operational performance of the STUs was evaluated on various operational parameters as described below. It was also seen whether the STUs were able to maintain pace with the growing demand for public transport. Audit noticed that the operational parameters and cost of operations vary considerably in operation of transport services within the Chennai city and other town/mofussil/long distance routes. As such, the audit findings pertaining to MTC and other six STUs have been consolidated and discussed exclusively in the succeeding paragraphs. These audit findings show that the losses can be reduced and there is scope for improvement in the performance of STUs.
Share of STUs in public transport
2.1.15 The transport policy of the State Government aims at making public transportation popular and efficient so that more and more passengers use the system and, thereby, reduce the traffic congestion. In view of this, it is essential that the operations of the STUs expand atleast in proportion to the growth of population in the State of Tamil Nadu.
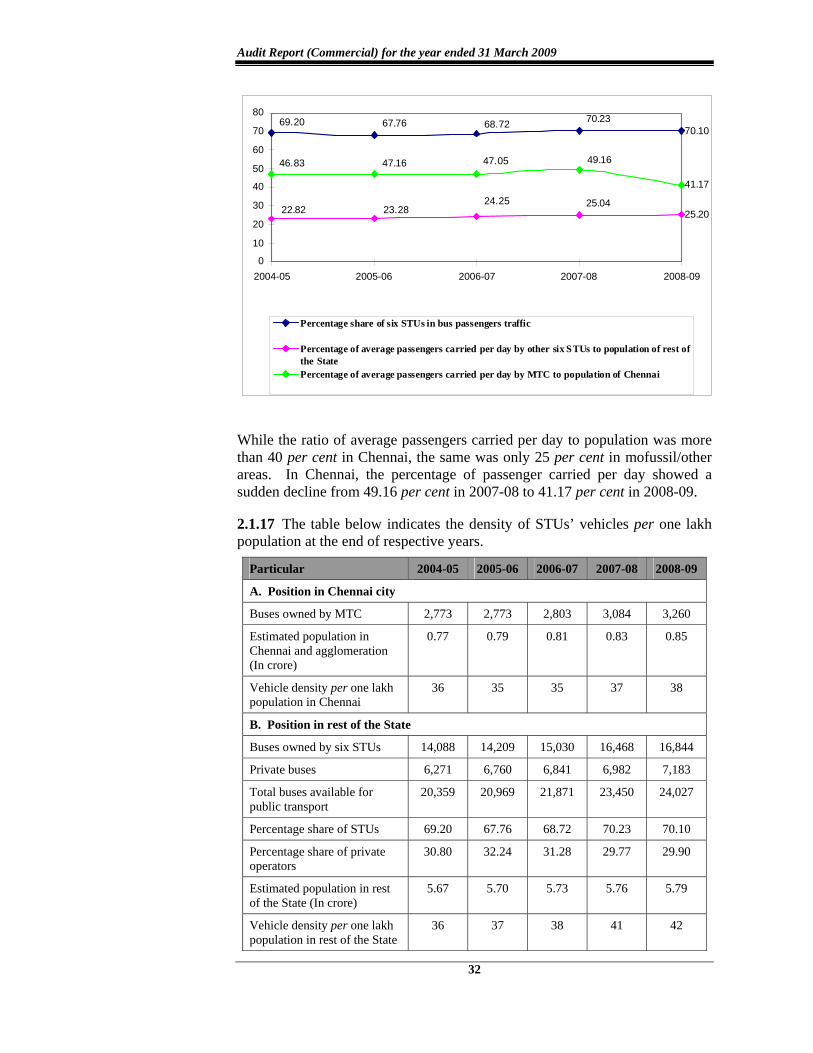
2.1.16 A line-graph depicting the percentage share of buses held by STUs in public transport and percentage of average passengers carried per day by MTC/other six STUs to the population of Chennai/other parts of the State during five years ending 2008-09 is given below:
Audit Report (Commercial) for the year ended 31 March 2009
32
70.10
25.20
41.17
70.2368.7267.7669.20
25.0424.2523.2822.82
49.1647.0547.1646.83
0
10
20
30
40
50
60
70
80
2004-05 2005-06 2006-07 2007-08 2008-09
Percentage share of six STUs in bus passengers traffic
Percentage of average passengers carried per day by other six STUs to population of rest ofthe StatePercentage of average passengers carried per day by MTC to population of Chennai
While the ratio of average passengers carried per day to population was more than 40 per cent in Chennai, the same was only 25 per cent in mofussil/other areas. In Chennai, the percentage of passenger carried per day showed a sudden decline from 49.16 per cent in 2007-08 to 41.17 per cent in 2008-09.
2.1.17 The table below indicates the density of STUs’ vehicles per one lakh population at the end of respective years.
Particular 2004-05 2005-06 2006-07 2007-08 2008-09
A. Position in Chennai city
Buses owned by MTC 2,773 2,773 2,803 3,084 3,260
Estimated population in Chennai and agglomeration (In crore)
0.77 0.79 0.81 0.83 0.85
Vehicle density per one lakh population in Chennai
36 35 35 37 38
B. Position in rest of the State
Buses owned by six STUs 14,088 14,209 15,030 16,468 16,844
Private buses 6,271 6,760 6,841 6,982 7,183
Total buses available for public transport
20,359 20,969 21,871 23,450 24,027
Percentage share of STUs 69.20 67.76 68.72 70.23 70.10
Percentage share of private operators
30.80 32.24 31.28 29.77 29.90
Estimated population in rest of the State (In crore)
5.67 5.70 5.73 5.76 5.79
Vehicle density per one lakh population in rest of the State
36 37 38 41 42
Chapter-II Performance Reviews relating to Government companies
33
It is evident from the table that the state had a total fleet strength of 27,287 buses at the end of March 2009; of which 20,104 buses were held by seven STUs. The population of the State (excluding Chennai) had increased by 2.79 per cent during the period from 2004-05 to 2008-09 whereas the vehicle strength had increased by 17.65 per cent during the same period (taking 2003-04 as base year). On the other hand, while the population of Chennai increased by 12.31 per cent during the same period, the vehicle density for one lakh population increased by 4.69 per cent, indicating that MTC’s fleet strength had not increased in proportion to the growth of population. Moreover, the vehicle density in Chennai was lower than the comparable vehicle density in Bangalore (57 to 73 during the review period) highlighting further need to increase the vehicle strength.
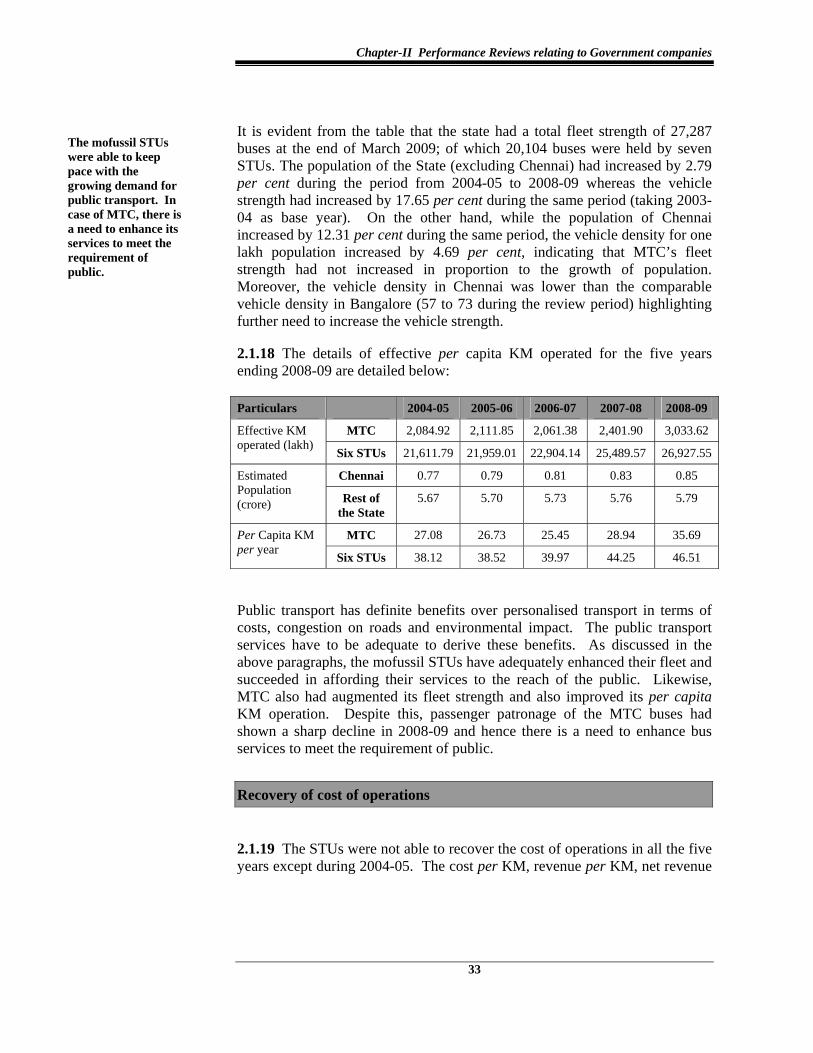
2.1.18 The details of effective per capita KM operated for the five years ending 2008-09 are detailed below:
Public transport has definite benefits over personalised transport in terms of costs, congestion on roads and environmental impact. The public transport services have to be adequate to derive these benefits. As discussed in the above paragraphs, the mofussil STUs have adequately enhanced their fleet and succeeded in affording their services to the reach of the public. Likewise, MTC also had augmented its fleet strength and also improved its per capita KM operation. Despite this, passenger patronage of the MTC buses had shown a sharp decline in 2008-09 and hence there is a need to enhance bus services to meet the requirement of public.
Recovery of cost of operations
2.1.19 The STUs were not able to recover the cost of operations in all the five years except during 2004-05. The cost per KM, revenue per KM, net revenue
The mofussil STUs were able to keep pace with the growing demand for public transport. In case of MTC, there is a need to enhance its services to meet the requirement of public.
Particulars 2004-05 2005-06 2006-07 2007-08 2008-09
MTC 2,084.92 2,111.85 2,061.38 2,401.90 3,033.62 Effective KM operated (lakh) Six STUs 21,611.79 21,959.01 22,904.14 25,489.57 26,927.55
Chennai 0.77 0.79 0.81 0.83 0.85 Estimated Population (crore) Rest of
the State 5.67 5.70 5.73 5.76 5.79
MTC 27.08 26.73 25.45 28.94 35.69 Per Capita KM per year Six STUs 38.12 38.52 39.97 44.25 46.51
Audit Report (Commercial) for the year ended 31 March 2009
34
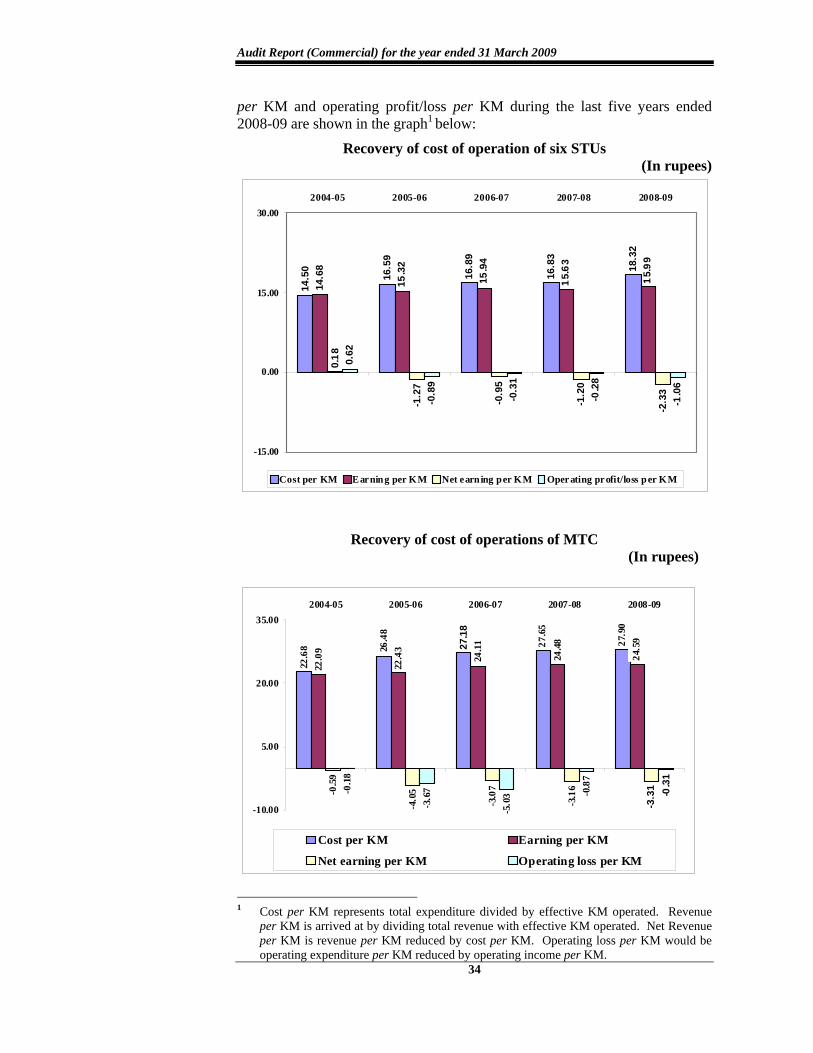
per KM and operating profit/loss per KM during the last five years ended 2008-09 are shown in the graph1 below:
Recovery of cost of operation of six STUs (In rupees)
14.5
0
16.5
9
16.8
9
16.8
3
18.3
2
14.6
8
15.3
2
15.9
4
15.6
3
15.9
9
0.18
-1.2
7
-0.9
5
-1.2
0
-2.3
3
0.62
-0.8
9
-0.3
1
-0.2
8
-1.0
6
-15.00
0.00
15.00
30.002004-05 2005-06 2006-07 2007-08 2008-09
Cost per KM Earning per KM Net earning per KM Operating profit/loss per KM
Recovery of cost of operations of MTC (In rupees)
27.9
0
27.6
5
27.1
8
26.4
8
22.6
8
24.5
9
24.4
8
24.1
1
22.4
3
22.0
9
-3.3
1
-3.1
6
-3.0
7
-4.0
5-0.5
9
-0.3
1
-0.8
7
-5.0
3
-3.6
7-0.1
8
-10.00
5.00
20.00
35.002004-05 2005-06 2006-07 2007-08 2008-09
Cost per KM Earning per KM
Net earning per KM Operating loss per KM
1 Cost per KM represents total expenditure divided by effective KM operated. Revenue
per KM is arrived at by dividing total revenue with effective KM operated. Net Revenue per KM is revenue per KM reduced by cost per KM. Operating loss per KM would be operating expenditure per KM reduced by operating income per KM.
Chapter-II Performance Reviews relating to Government companies
35
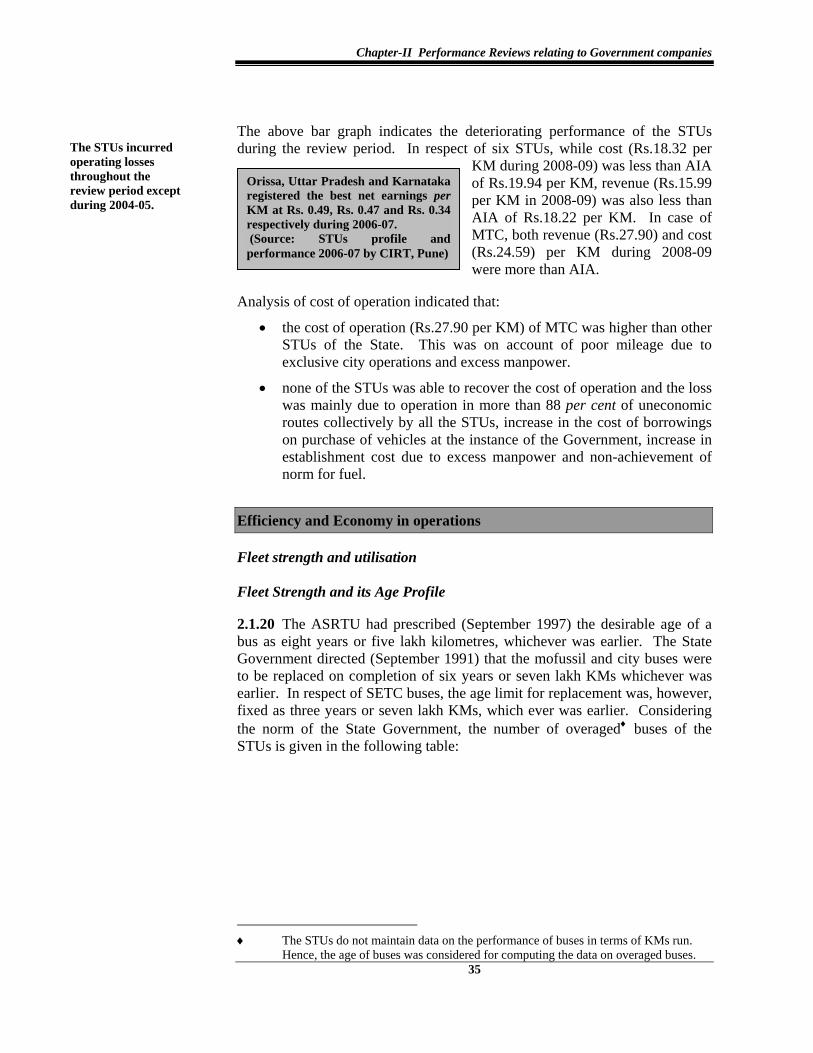
The above bar graph indicates the deteriorating performance of the STUs during the review period. In respect of six STUs, while cost (Rs.18.32 per
KM during 2008-09) was less than AIA of Rs.19.94 per KM, revenue (Rs.15.99 per KM in 2008-09) was also less than AIA of Rs.18.22 per KM. In case of MTC, both revenue (Rs.27.90) and cost (Rs.24.59) per KM during 2008-09 were more than AIA.
Analysis of cost of operation indicated that:
• the cost of operation (Rs.27.90 per KM) of MTC was higher than other STUs of the State. This was on account of poor mileage due to exclusive city operations and excess manpower.
• none of the STUs was able to recover the cost of operation and the loss was mainly due to operation in more than 88 per cent of uneconomic routes collectively by all the STUs, increase in the cost of borrowings on purchase of vehicles at the instance of the Government, increase in establishment cost due to excess manpower and non-achievement of norm for fuel.
Efficiency and Economy in operations
Fleet strength and utilisation Fleet Strength and its Age Profile
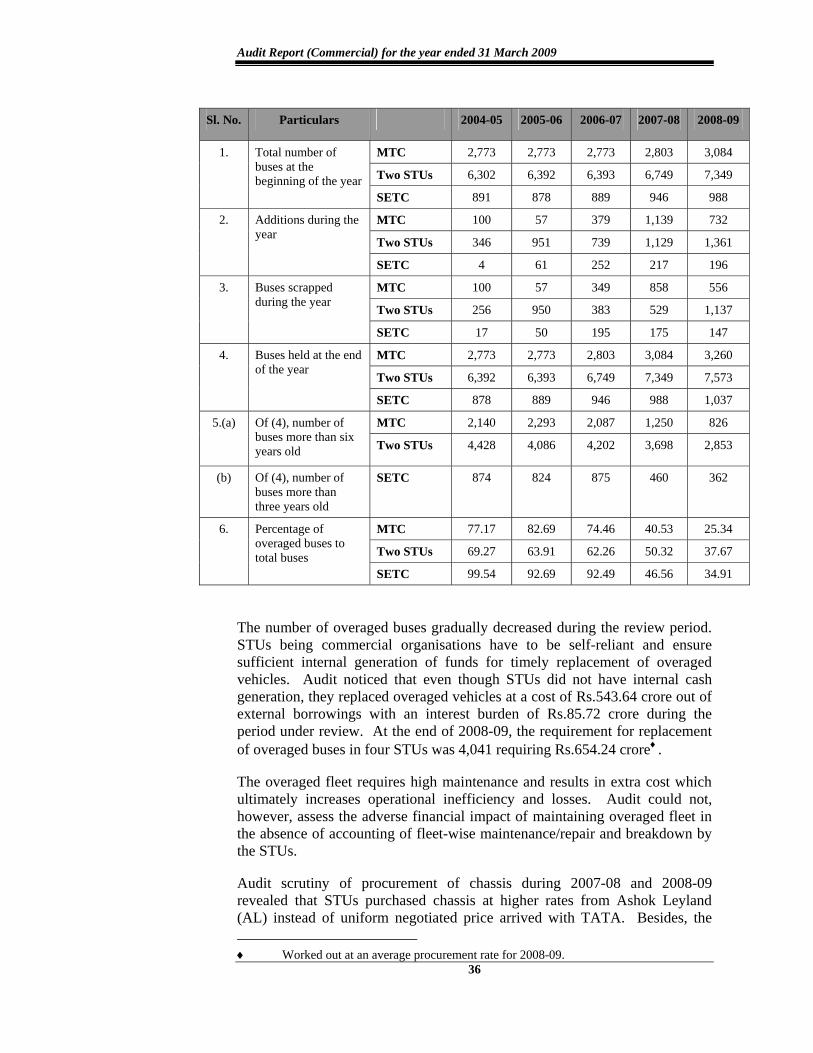
2.1.20 The ASRTU had prescribed (September 1997) the desirable age of a bus as eight years or five lakh kilometres, whichever was earlier. The State Government directed (September 1991) that the mofussil and city buses were to be replaced on completion of six years or seven lakh KMs whichever was earlier. In respect of SETC buses, the age limit for replacement was, however, fixed as three years or seven lakh KMs, which ever was earlier. Considering the norm of the State Government, the number of overaged♦ buses of the STUs is given in the following table:
♦ The STUs do not maintain data on the performance of buses in terms of KMs run.
Hence, the age of buses was considered for computing the data on overaged buses.
The STUs incurred operating losses throughout the review period except during 2004-05.
Orissa, Uttar Pradesh and Karnataka registered the best net earnings per KM at Rs. 0.49, Rs. 0.47 and Rs. 0.34 respectively during 2006-07. (Source: STUs profile and performance 2006-07 by CIRT, Pune)
Audit Report (Commercial) for the year ended 31 March 2009
36
Sl. No. Particulars 2004-05 2005-06 2006-07 2007-08 2008-09
MTC 2,773 2,773 2,773 2,803 3,084
Two STUs 6,302 6,392 6,393 6,749 7,349
1. Total number of buses at the beginning of the year
SETC 891 878 889 946 988
MTC 100 57 379 1,139 732
Two STUs 346 951 739 1,129 1,361
2. Additions during the year
SETC 4 61 252 217 196
MTC 100 57 349 858 556
Two STUs 256 950 383 529 1,137
3. Buses scrapped during the year
SETC 17 50 195 175 147
MTC 2,773 2,773 2,803 3,084 3,260
Two STUs 6,392 6,393 6,749 7,349 7,573
4. Buses held at the end of the year
SETC 878 889 946 988 1,037
MTC 2,140 2,293 2,087 1,250 826 5.(a) Of (4), number of buses more than six years old Two STUs 4,428 4,086 4,202 3,698 2,853
(b) Of (4), number of buses more than three years old
SETC 874 824 875 460 362
MTC 77.17 82.69 74.46 40.53 25.34
Two STUs 69.27 63.91 62.26 50.32 37.67
6. Percentage of overaged buses to total buses
SETC 99.54 92.69 92.49 46.56 34.91
The number of overaged buses gradually decreased during the review period. STUs being commercial organisations have to be self-reliant and ensure sufficient internal generation of funds for timely replacement of overaged vehicles. Audit noticed that even though STUs did not have internal cash generation, they replaced overaged vehicles at a cost of Rs.543.64 crore out of external borrowings with an interest burden of Rs.85.72 crore during the period under review. At the end of 2008-09, the requirement for replacement of overaged buses in four STUs was 4,041 requiring Rs.654.24 crore♦.
The overaged fleet requires high maintenance and results in extra cost which ultimately increases operational inefficiency and losses. Audit could not, however, assess the adverse financial impact of maintaining overaged fleet in the absence of accounting of fleet-wise maintenance/repair and breakdown by the STUs.
Audit scrutiny of procurement of chassis during 2007-08 and 2008-09 revealed that STUs purchased chassis at higher rates from Ashok Leyland (AL) instead of uniform negotiated price arrived with TATA. Besides, the ♦ Worked out at an average procurement rate for 2008-09.
Chapter-II Performance Reviews relating to Government companies
37
rates offered by TATA were inclusive of transportation cost. Thus, purchase at higher cost led to extra and avoidable expenditure of Rs.14.77 crore during 2007-08 and 2008-09.
Fleet utilisation
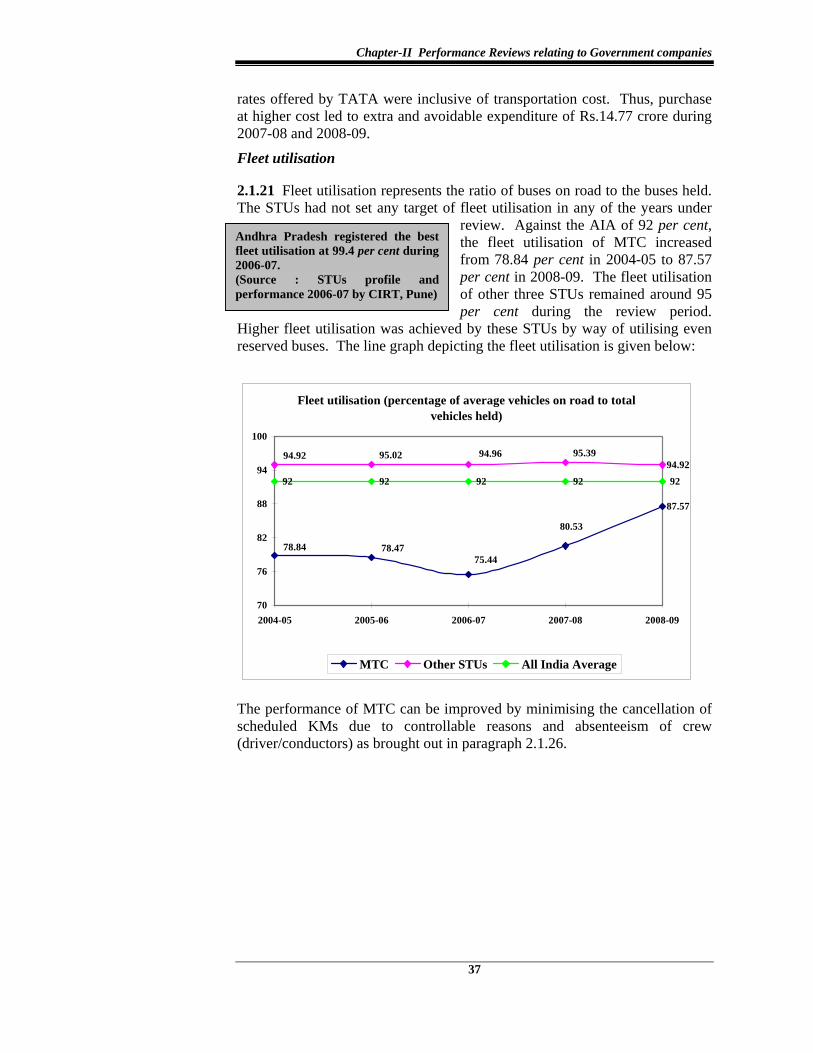
2.1.21 Fleet utilisation represents the ratio of buses on road to the buses held. The STUs had not set any target of fleet utilisation in any of the years under
review. Against the AIA of 92 per cent, the fleet utilisation of MTC increased from 78.84 per cent in 2004-05 to 87.57 per cent in 2008-09. The fleet utilisation of other three STUs remained around 95 per cent during the review period.
Higher fleet utilisation was achieved by these STUs by way of utilising even reserved buses. The line graph depicting the fleet utilisation is given below:
Fleet utilisation (percentage of average vehicles on road to total vehicles held)
87.57
94.92
92 92 92 92 92
80.53
75.4478.4778.84
95.3994.9695.0294.92
70
76
82
88
94
100
2004-05 2005-06 2006-07 2007-08 2008-09
MTC Other STUs All India Average
The performance of MTC can be improved by minimising the cancellation of scheduled KMs due to controllable reasons and absenteeism of crew (driver/conductors) as brought out in paragraph 2.1.26.
Andhra Pradesh registered the best fleet utilisation at 99.4 per cent during 2006-07. (Source : STUs profile and performance 2006-07 by CIRT, Pune)
Audit Report (Commercial) for the year ended 31 March 2009
38
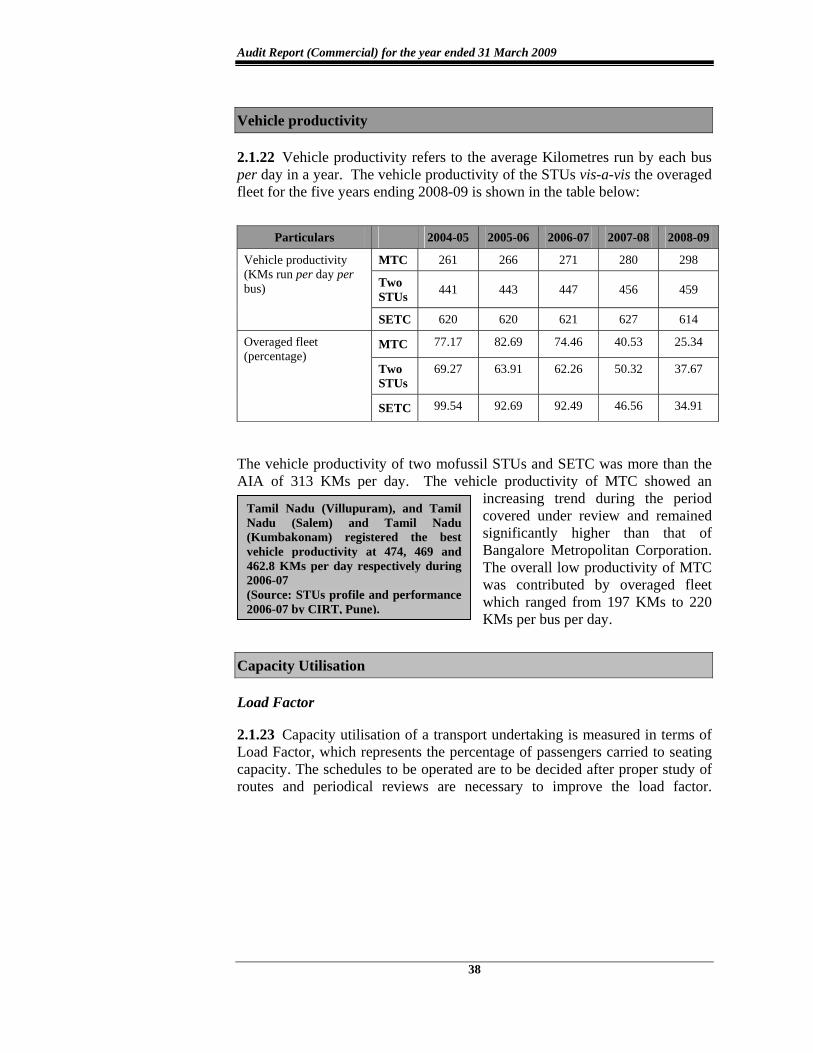
Vehicle productivity
2.1.22 Vehicle productivity refers to the average Kilometres run by each bus per day in a year. The vehicle productivity of the STUs vis-a-vis the overaged fleet for the five years ending 2008-09 is shown in the table below:
Particulars 2004-05 2005-06 2006-07 2007-08 2008-09
MTC 261 266 271 280 298
Two STUs 441 443 447 456 459
Vehicle productivity (KMs run per day per bus)
SETC 620 620 621 627 614
MTC 77.17 82.69 74.46 40.53 25.34
Two STUs
69.27 63.91 62.26 50.32 37.67
Overaged fleet (percentage)
SETC 99.54 92.69 92.49 46.56 34.91
The vehicle productivity of two mofussil STUs and SETC was more than the AIA of 313 KMs per day. The vehicle productivity of MTC showed an
increasing trend during the period covered under review and remained significantly higher than that of Bangalore Metropolitan Corporation. The overall low productivity of MTC was contributed by overaged fleet which ranged from 197 KMs to 220 KMs per bus per day.
Capacity Utilisation
Load Factor
2.1.23 Capacity utilisation of a transport undertaking is measured in terms of Load Factor, which represents the percentage of passengers carried to seating capacity. The schedules to be operated are to be decided after proper study of routes and periodical reviews are necessary to improve the load factor.
Tamil Nadu (Villupuram), and Tamil Nadu (Salem) and Tamil Nadu (Kumbakonam) registered the best vehicle productivity at 474, 469 and 462.8 KMs per day respectively during 2006-07 (Source: STUs profile and performance 2006-07 by CIRT, Pune).
Chapter-II Performance Reviews relating to Government companies
39
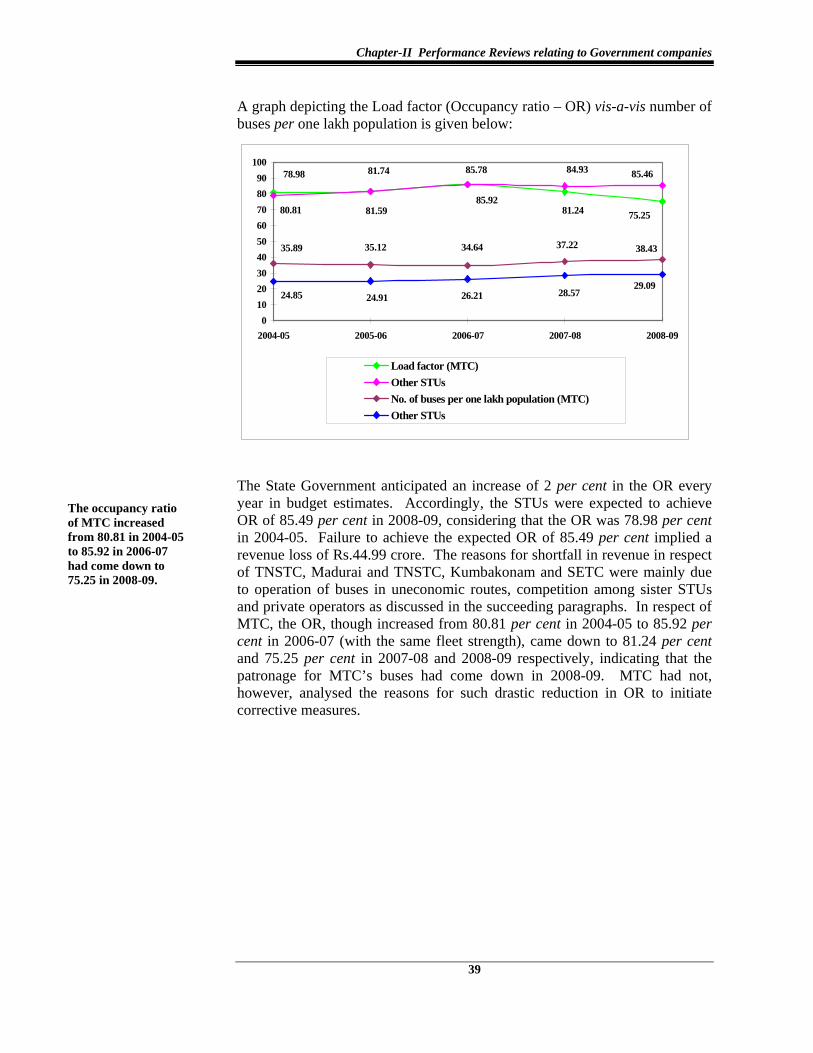
A graph depicting the Load factor (Occupancy ratio – OR) vis-a-vis number of buses per one lakh population is given below:
85.9281.5980.81 75.2581.24
85.7881.7478.98 85.4684.93
38.4337.2234.6435.1235.89
29.0928.5726.2124.9124.85
0102030405060708090
100
2004-05 2005-06 2006-07 2007-08 2008-09
Load factor (MTC)Other STUsNo. of buses per one lakh population (MTC)Other STUs
The State Government anticipated an increase of 2 per cent in the OR every year in budget estimates. Accordingly, the STUs were expected to achieve OR of 85.49 per cent in 2008-09, considering that the OR was 78.98 per cent in 2004-05. Failure to achieve the expected OR of 85.49 per cent implied a revenue loss of Rs.44.99 crore. The reasons for shortfall in revenue in respect of TNSTC, Madurai and TNSTC, Kumbakonam and SETC were mainly due to operation of buses in uneconomic routes, competition among sister STUs and private operators as discussed in the succeeding paragraphs. In respect of MTC, the OR, though increased from 80.81 per cent in 2004-05 to 85.92 per cent in 2006-07 (with the same fleet strength), came down to 81.24 per cent and 75.25 per cent in 2007-08 and 2008-09 respectively, indicating that the patronage for MTC’s buses had come down in 2008-09. MTC had not, however, analysed the reasons for such drastic reduction in OR to initiate corrective measures.
The occupancy ratio of MTC increased from 80.81 in 2004-05 to 85.92 in 2006-07 had come down to 75.25 in 2008-09.
Audit Report (Commercial) for the year ended 31 March 2009
40
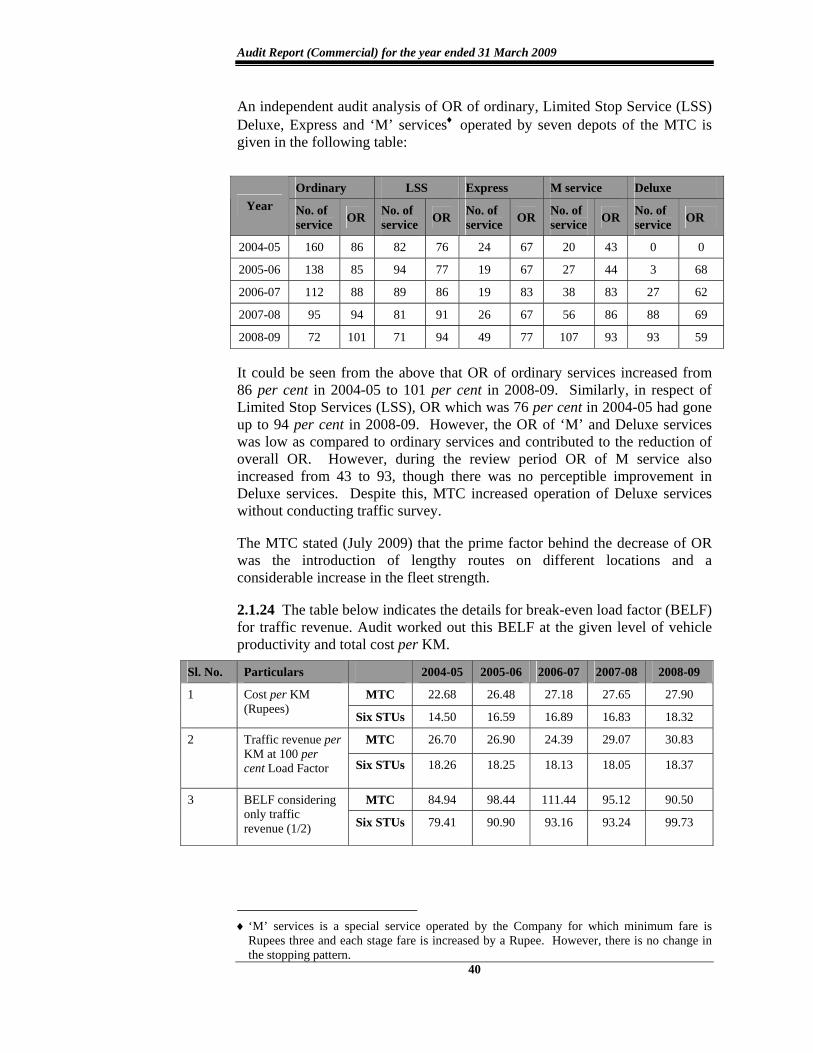
An independent audit analysis of OR of ordinary, Limited Stop Service (LSS) Deluxe, Express and ‘M’ services♦ operated by seven depots of the MTC is given in the following table:
Ordinary LSS Express M service Deluxe Year No. of
service OR No. of service OR No. of
service OR No. of service OR No. of
service OR
2004-05 160 86 82 76 24 67 20 43 0 0
2005-06 138 85 94 77 19 67 27 44 3 68
2006-07 112 88 89 86 19 83 38 83 27 62
2007-08 95 94 81 91 26 67 56 86 88 69
2008-09 72 101 71 94 49 77 107 93 93 59
It could be seen from the above that OR of ordinary services increased from 86 per cent in 2004-05 to 101 per cent in 2008-09. Similarly, in respect of Limited Stop Services (LSS), OR which was 76 per cent in 2004-05 had gone up to 94 per cent in 2008-09. However, the OR of ‘M’ and Deluxe services was low as compared to ordinary services and contributed to the reduction of overall OR. However, during the review period OR of M service also increased from 43 to 93, though there was no perceptible improvement in Deluxe services. Despite this, MTC increased operation of Deluxe services without conducting traffic survey.
The MTC stated (July 2009) that the prime factor behind the decrease of OR was the introduction of lengthy routes on different locations and a considerable increase in the fleet strength.
2.1.24 The table below indicates the details for break-even load factor (BELF) for traffic revenue. Audit worked out this BELF at the given level of vehicle productivity and total cost per KM.
Sl. No. Particulars 2004-05 2005-06 2006-07 2007-08 2008-09
MTC 22.68 26.48 27.18 27.65 27.90 1 Cost per KM (Rupees) Six STUs 14.50 16.59 16.89 16.83 18.32
MTC 26.70 26.90 24.39 29.07 30.83 2 Traffic revenue per KM at 100 per cent Load Factor Six STUs 18.26 18.25 18.13 18.05 18.37
MTC 84.94 98.44 111.44 95.12 90.50 3 BELF considering only traffic revenue (1/2) Six STUs 79.41 90.90 93.16 93.24 99.73
♦ ‘M’ services is a special service operated by the Company for which minimum fare is
Rupees three and each stage fare is increased by a Rupee. However, there is no change in the stopping pattern.
Chapter-II Performance Reviews relating to Government companies
41
The load factor of all the four STUs was lower than the break even load factor in all the five years. In respect of MTC, the BELF indicated progressive improvement as it has come down to 90.50 in 2008-09 from 111.44 in 2006-07. Hence, by better route planning and reducing cost of operation, there is a scope for the MTC to turn around. In respect of the other three STUs, the BELF showed a negative trend, as it increased from 79.41 per cent to 99.73 per cent requiring immediate corrective actions by these STUs not only for improving their occupancy but also for reducing the cost of operation.
Route Planning
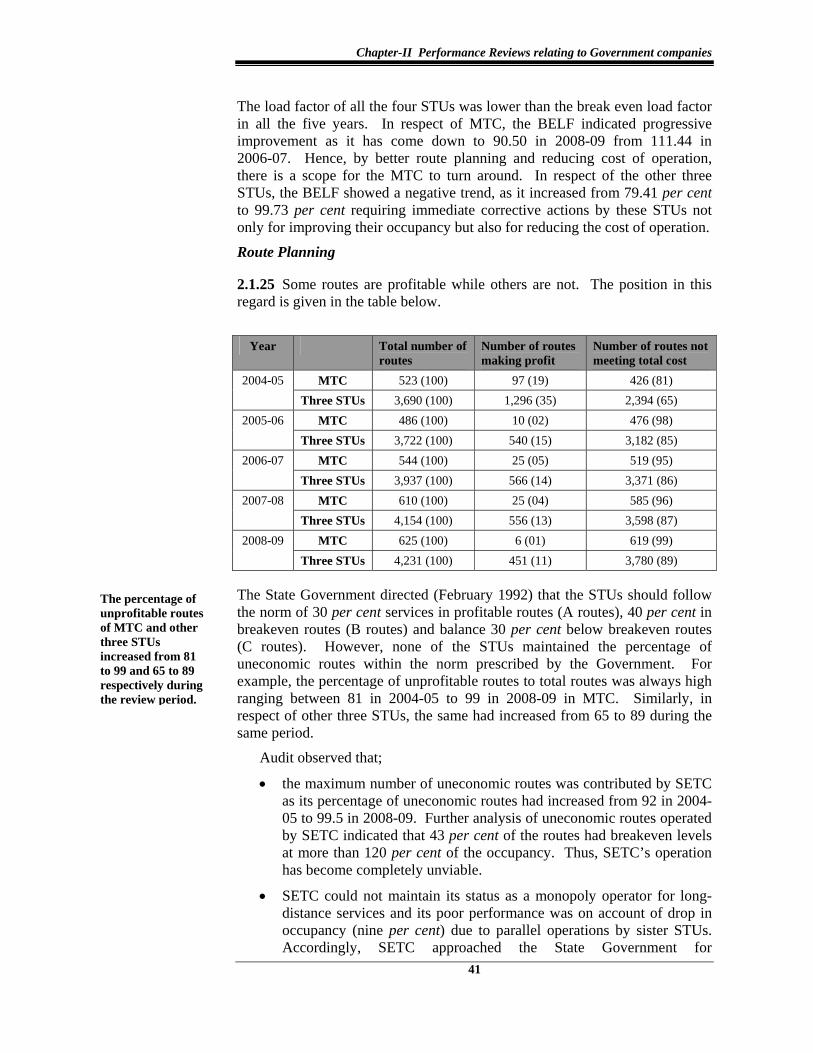
2.1.25 Some routes are profitable while others are not. The position in this regard is given in the table below.
Year Total number of routes
Number of routes making profit
Number of routes not meeting total cost
MTC 523 (100) 97 (19) 426 (81) 2004-05 Three STUs 3,690 (100) 1,296 (35) 2,394 (65)
MTC 486 (100) 10 (02) 476 (98) 2005-06 Three STUs 3,722 (100) 540 (15) 3,182 (85)
MTC 544 (100) 25 (05) 519 (95) 2006-07 Three STUs 3,937 (100) 566 (14) 3,371 (86)
MTC 610 (100) 25 (04) 585 (96) 2007-08 Three STUs 4,154 (100) 556 (13) 3,598 (87)
MTC 625 (100) 6 (01) 619 (99) 2008-09 Three STUs 4,231 (100) 451 (11) 3,780 (89)
The State Government directed (February 1992) that the STUs should follow the norm of 30 per cent services in profitable routes (A routes), 40 per cent in breakeven routes (B routes) and balance 30 per cent below breakeven routes (C routes). However, none of the STUs maintained the percentage of uneconomic routes within the norm prescribed by the Government. For example, the percentage of unprofitable routes to total routes was always high ranging between 81 in 2004-05 to 99 in 2008-09 in MTC. Similarly, in respect of other three STUs, the same had increased from 65 to 89 during the same period.
Audit observed that;
• the maximum number of uneconomic routes was contributed by SETC as its percentage of uneconomic routes had increased from 92 in 2004-05 to 99.5 in 2008-09. Further analysis of uneconomic routes operated by SETC indicated that 43 per cent of the routes had breakeven levels at more than 120 per cent of the occupancy. Thus, SETC’s operation has become completely unviable.
• SETC could not maintain its status as a monopoly operator for long-distance services and its poor performance was on account of drop in occupancy (nine per cent) due to parallel operations by sister STUs. Accordingly, SETC approached the State Government for
The percentage of unprofitable routes of MTC and other three STUs increased from 81 to 99 and 65 to 89 respectively during the review period.
Audit Report (Commercial) for the year ended 31 March 2009
42
reimbursement of loss suffered by it on this account. During the review period, SETC claimed Rs.95.74 crore, of which, Rs.47.16 crore was reimbursed by the sister STUs as directed by the State Government and the remaining Rs.48.58 crore was absorbed by SETC. Though Government decided as early as in 1997 to rationalise long distance services and entrust it exclusively to SETC, the decision was not implemented so far. Consequently, SETC continued to incur loss, which had increased from Rs.31.39 crore in 2004-05 to Rs.86.27 crore in 2008-09.
• The OR of TNSTC, Madurai was grossly affected by the unauthorised operation of mini-buses and share autos. Though the STUs reported such operations to the Regional Transport Offices, no corrective action had been taken so far. Consequently, the STUs sustained an estimated revenue loss of Rs.182 crore during the review period.
• TNSTC, Madurai and TNSTC, Kumbakonam commenced (November 1999) operation of services to the farmers’ market viz., “Uzhavar Sandhai” on the directives of the State Government. Audit noticed that these STUs suffered a total revenue loss of Rs.6.50 crore during the review period due to exclusive operation of services to the farmers’ market without collection of luggage fare. However, these STUs did not pursue with the State Government for reimbursement of above loss.
• In respect of TNSTC, Madurai, during the review period, the management carried out modifications in 236 routes based on public/political dignitaries demand etc., without any analysis of viability. It was observed that average earning per KM decreased in these routes after modifications and additional losses amounting to Rs.10.67 crore during 2004-05 to 2008-09 were incurred. Thus, modifications of routes proved counter productive.
The State Government stated (December 2009) that the introduction of new routes was a social obligation based on public representations. In respect of TNSTC, Madurai, it stated that continuous efforts were being taken to curb the unauthorised operations of mini buses, vans, etc. The fact remained that the STUs introduced new routes without a study on economic viability and without any compensation from the Government. Consequently, the STUs continued to suffer heavy losses on account of these factors.
Cancellation of scheduled Kilometres
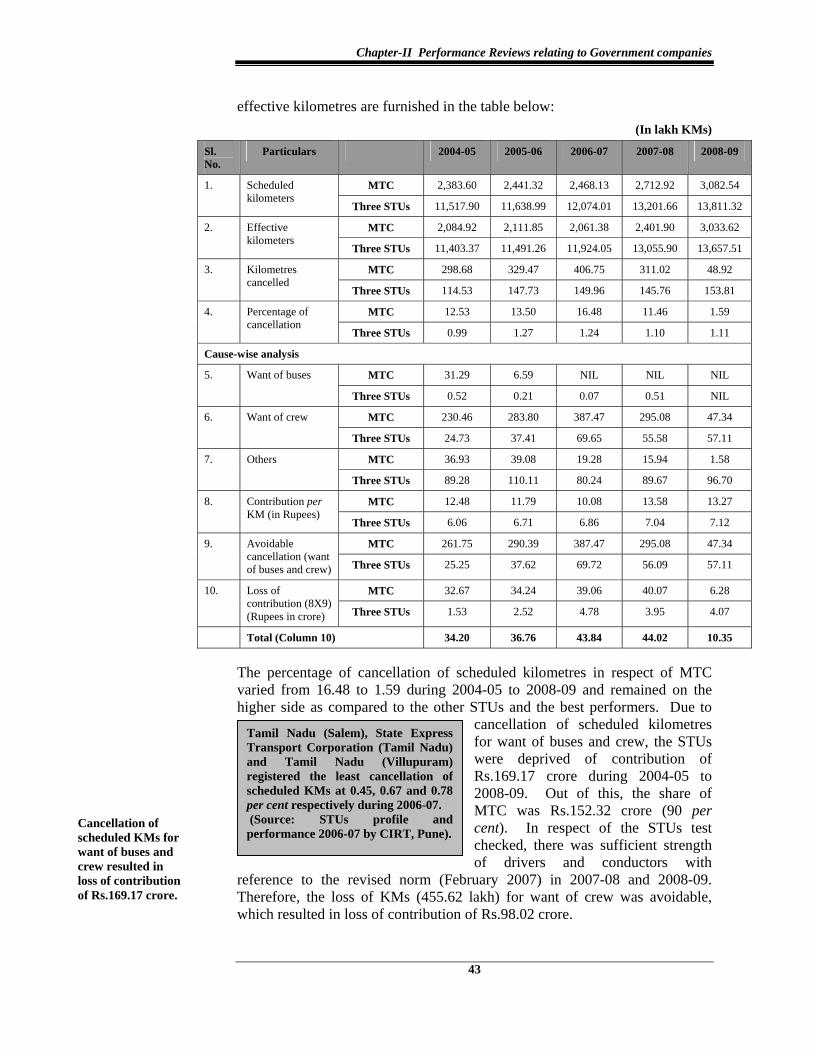
2.1.26 The details of scheduled kilometres, effective kilometres, cancelled kilometres calculated as difference between the scheduled kilometres and
Chapter-II Performance Reviews relating to Government companies
43
effective kilometres are furnished in the table below: (In lakh KMs)
Sl. No.
Particulars 2004-05 2005-06 2006-07 2007-08 2008-09
MTC 2,383.60 2,441.32 2,468.13 2,712.92 3,082.54 1. Scheduled kilometers
Three STUs 11,517.90 11,638.99 12,074.01 13,201.66 13,811.32
MTC 2,084.92 2,111.85 2,061.38 2,401.90 3,033.62 2. Effective kilometers
Three STUs 11,403.37 11,491.26 11,924.05 13,055.90 13,657.51
MTC 298.68 329.47 406.75 311.02 48.92 3. Kilometres cancelled
Three STUs 114.53 147.73 149.96 145.76 153.81
MTC 12.53 13.50 16.48 11.46 1.59 4. Percentage of cancellation
Three STUs 0.99 1.27 1.24 1.10 1.11
Cause-wise analysis
MTC 31.29 6.59 NIL NIL NIL 5. Want of buses
Three STUs 0.52 0.21 0.07 0.51 NIL
MTC 230.46 283.80 387.47 295.08 47.34 6. Want of crew
Three STUs 24.73 37.41 69.65 55.58 57.11
MTC 36.93 39.08 19.28 15.94 1.58 7. Others
Three STUs 89.28 110.11 80.24 89.67 96.70
MTC 12.48 11.79 10.08 13.58 13.27 8. Contribution per KM (in Rupees)
Three STUs 6.06 6.71 6.86 7.04 7.12
MTC 261.75 290.39 387.47 295.08 47.34 9. Avoidable cancellation (want of buses and crew) Three STUs 25.25 37.62 69.72 56.09 57.11
MTC 32.67 34.24 39.06 40.07 6.28 10. Loss of contribution (8X9) (Rupees in crore) Three STUs 1.53 2.52 4.78 3.95 4.07
Total (Column 10) 34.20 36.76 43.84 44.02 10.35
The percentage of cancellation of scheduled kilometres in respect of MTC varied from 16.48 to 1.59 during 2004-05 to 2008-09 and remained on the higher side as compared to the other STUs and the best performers. Due to
cancellation of scheduled kilometres for want of buses and crew, the STUs were deprived of contribution of Rs.169.17 crore during 2004-05 to 2008-09. Out of this, the share of MTC was Rs.152.32 crore (90 per cent). In respect of the STUs test checked, there was sufficient strength of drivers and conductors with
reference to the revised norm (February 2007) in 2007-08 and 2008-09. Therefore, the loss of KMs (455.62 lakh) for want of crew was avoidable, which resulted in loss of contribution of Rs.98.02 crore.
Tamil Nadu (Salem), State Express Transport Corporation (Tamil Nadu) and Tamil Nadu (Villupuram) registered the least cancellation of scheduled KMs at 0.45, 0.67 and 0.78 per cent respectively during 2006-07. (Source: STUs profile and performance 2006-07 by CIRT, Pune).
Cancellation of scheduled KMs for want of buses and crew resulted in loss of contribution of Rs.169.17 crore.
Audit Report (Commercial) for the year ended 31 March 2009
44
Maintenance of vehicles
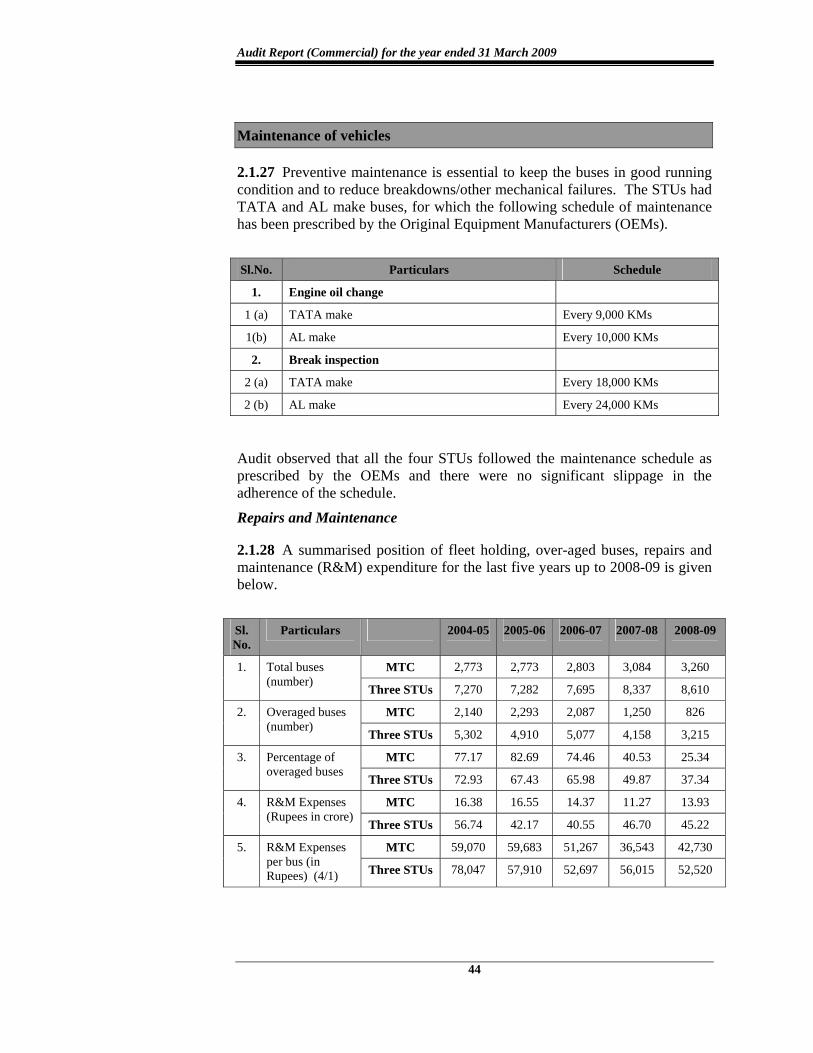
2.1.27 Preventive maintenance is essential to keep the buses in good running condition and to reduce breakdowns/other mechanical failures. The STUs had TATA and AL make buses, for which the following schedule of maintenance has been prescribed by the Original Equipment Manufacturers (OEMs).
Sl.No. Particulars Schedule
1. Engine oil change
1 (a) TATA make Every 9,000 KMs
1(b) AL make Every 10,000 KMs
2. Break inspection
2 (a) TATA make Every 18,000 KMs
2 (b) AL make Every 24,000 KMs
Audit observed that all the four STUs followed the maintenance schedule as prescribed by the OEMs and there were no significant slippage in the adherence of the schedule.
Repairs and Maintenance
2.1.28 A summarised position of fleet holding, over-aged buses, repairs and maintenance (R&M) expenditure for the last five years up to 2008-09 is given below.
Sl. No.
Particulars 2004-05 2005-06 2006-07 2007-08 2008-09
MTC 2,773 2,773 2,803 3,084 3,260 1. Total buses (number) Three STUs 7,270 7,282 7,695 8,337 8,610
MTC 2,140 2,293 2,087 1,250 826 2. Overaged buses (number)
Three STUs 5,302 4,910 5,077 4,158 3,215
MTC 77.17 82.69 74.46 40.53 25.34 3. Percentage of overaged buses Three STUs 72.93 67.43 65.98 49.87 37.34
MTC 16.38 16.55 14.37 11.27 13.93 4. R&M Expenses (Rupees in crore)
Three STUs 56.74 42.17 40.55 46.70 45.22
MTC 59,070 59,683 51,267 36,543 42,730 5. R&M Expenses per bus (in Rupees) (4/1) Three STUs 78,047 57,910 52,697 56,015 52,520
Chapter-II Performance Reviews relating to Government companies
45
The R&M expenses per bus have decreased during the period from 2004-05 to 2007-08 in line with the reduction in the percentage of overaged buses. R&M expenses per bus in respect of MTC, however, increased in 2008-09 due to major body repair expenditure incurred during the year. None of the STUs maintained the data on expenditure incurred on R&M in respect of overaged buses separately and hence Audit could not ascertain the extent to which the increase in R&M expenditure was attributable to overaged buses.
Manpower Cost
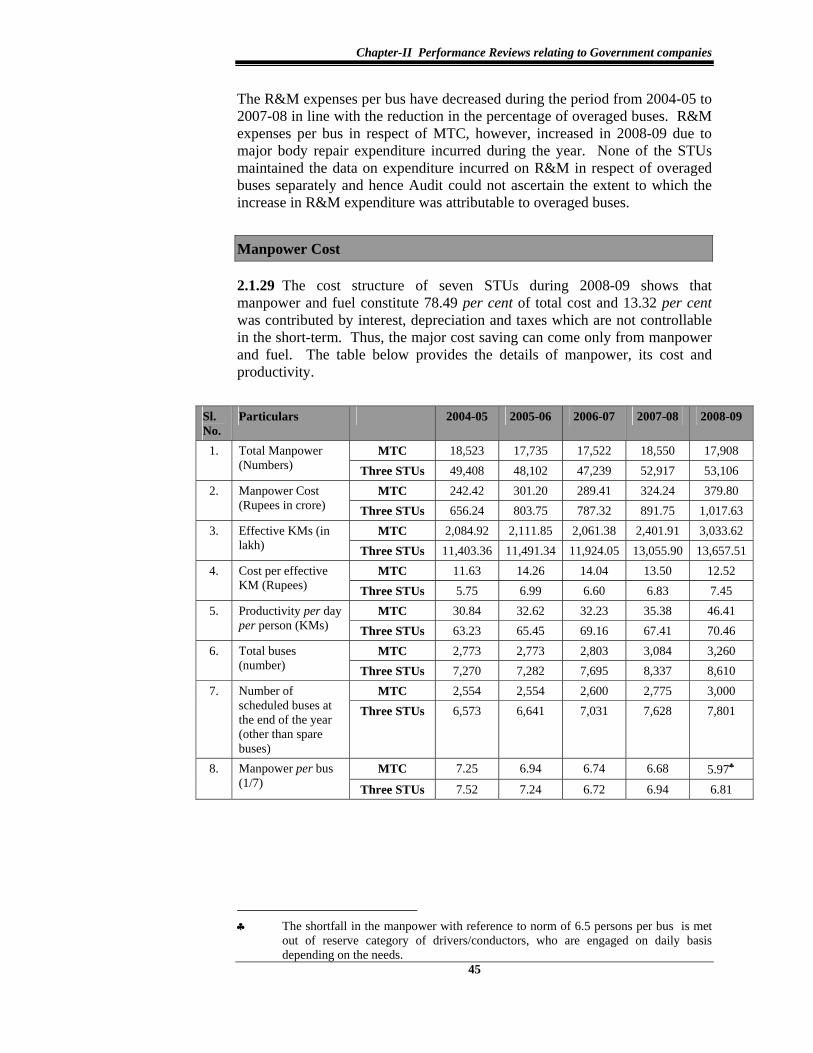
2.1.29 The cost structure of seven STUs during 2008-09 shows that manpower and fuel constitute 78.49 per cent of total cost and 13.32 per cent was contributed by interest, depreciation and taxes which are not controllable in the short-term. Thus, the major cost saving can come only from manpower and fuel. The table below provides the details of manpower, its cost and productivity.
Sl. No.
Particulars 2004-05 2005-06 2006-07 2007-08 2008-09
MTC 18,523 17,735 17,522 18,550 17,908 1. Total Manpower (Numbers) Three STUs 49,408 48,102 47,239 52,917 53,106
MTC 242.42 301.20 289.41 324.24 379.80 2. Manpower Cost (Rupees in crore) Three STUs 656.24 803.75 787.32 891.75 1,017.63
MTC 2,084.92 2,111.85 2,061.38 2,401.91 3,033.62 3. Effective KMs (in lakh) Three STUs 11,403.36 11,491.34 11,924.05 13,055.90 13,657.51
MTC 11.63 14.26 14.04 13.50 12.52 4. Cost per effective KM (Rupees) Three STUs 5.75 6.99 6.60 6.83 7.45
MTC 30.84 32.62 32.23 35.38 46.41 5. Productivity per day per person (KMs) Three STUs 63.23 65.45 69.16 67.41 70.46
MTC 2,773 2,773 2,803 3,084 3,260 6. Total buses (number) Three STUs 7,270 7,282 7,695 8,337 8,610
MTC 2,554 2,554 2,600 2,775 3,000 7. Number of scheduled buses at the end of the year (other than spare buses)
Three STUs 6,573 6,641 7,031 7,628 7,801
MTC 7.25 6.94 6.74 6.68 5.97♣ 8. Manpower per bus (1/7) Three STUs 7.52 7.24 6.72 6.94 6.81
♣ The shortfall in the manpower with reference to norm of 6.5 persons per bus is met
out of reserve category of drivers/conductors, who are engaged on daily basis depending on the needs.
Audit Report (Commercial) for the year ended 31 March 2009
46
The manpower cost of MTC was Rs.12.52 per KM in 2008-09 against the AIA of Rs.7.50 per KM (2006-07).
The State Government fixed (May 2004) a revised norm of men per bus ratio at 6.50 (Driver:2.5, Conductor:2.5 and all other employees:1.5). The State Government, while fixing the overall ratio of 6.5, changed (March 2007) the
internal composition of norms as drivers:2.625, Conductors:2.625 and other categories: 1.25. Manpower of four STUs with reference to the norms was analysed in Audit and it was observed that excess manpower was deployed in ‘other category’ in
all STUs. While the STUs other than SETC made efforts to reduce manpower during the review period, it remained in excess by 115 per cent at the end of 2008-09 in SETC. The idle wages worked out to Rs.542.38 crore (TNSTC, MDU: Rs.277.76 crore, SETC: Rs.120.15 crore, MTC: Rs.85.65 crore and TNSTC, KBM: Rs.58.82 crore) during the review period.
In MTC, there was continuous absenteeism of drivers and conductors (9.19 per cent) throughout the review period leading to cancellation of scheduled KMs as discussed vide Paragraph 2.1.26. MTC, however, did not take any effective step to arrest the absenteeism during the review period. In spite of availability of casual and daily paid crew during the years 2007-08 and 2008-09, MTC incurred expenditure of Rs.23.12 crore towards overtime allowance (double duty wages). However, this amount could be reduced considerably by deploying casual and daily rated crew.
In respect of the other three STUs, the surplus manpower was predominantly in ‘other’ staff category, which aggregated to 2,723 persons (27.54 per cent) over and above the norm of 9,986 persons as on March 2009. TNSTC, Madurai continuously maintained its driver and conductor strength within the norm, whereas the other two STUs exceeded their norms for drivers and conductors.
The State Government stated (December 2009) that it had formed a Committee in November 2009 to re-fix the norms of manpower.
Fuel Cost
2.1.30 Fuel is a major cost element which constituted 37.27 per cent of the total expenditure for all the seven STUs in 2008-09. Control of fuel costs by a road transport undertaking has a direct bearing on its productivity. The targets fixed by the STUs for fuel consumption, actual consumption, mileage obtained per
North West Karnataka State Road Transport, Karnataka State Road Transport and Himachal Pradesh registered the best performance at 4.89, 4.99 and 4.94 manpower per bus. (Source: STUs profile and performance 2006-07 by CIRT, Pune)
North West Karnataka State Road Transport, Uttar Pradesh and Andhra Pradesh registered mileage of 5.45, 5.33 and 5.26 KMPL. (Source : STUs profile and performance 2006-07 by CIRT, Pune )
Four STUs incurred idle wages of Rs.542.38 crore due to excess manpower.
Chapter-II Performance Reviews relating to Government companies
47
litre (Kilometre per litre i.e., KMPL), and extra expenditure incurred thereon are detailed in Annexure-8.
It could be seen from the Annexure that the KMPL in respect of all the four STUs showed an increasing trend. Even though, the actual KMPL achieved during the review period was better than the AIA, it was lower than the STU’s own norm mainly in respect of SETC and MTC. The overall shortfall had resulted in an estimated loss of Rs.33.76 crore during the review period.
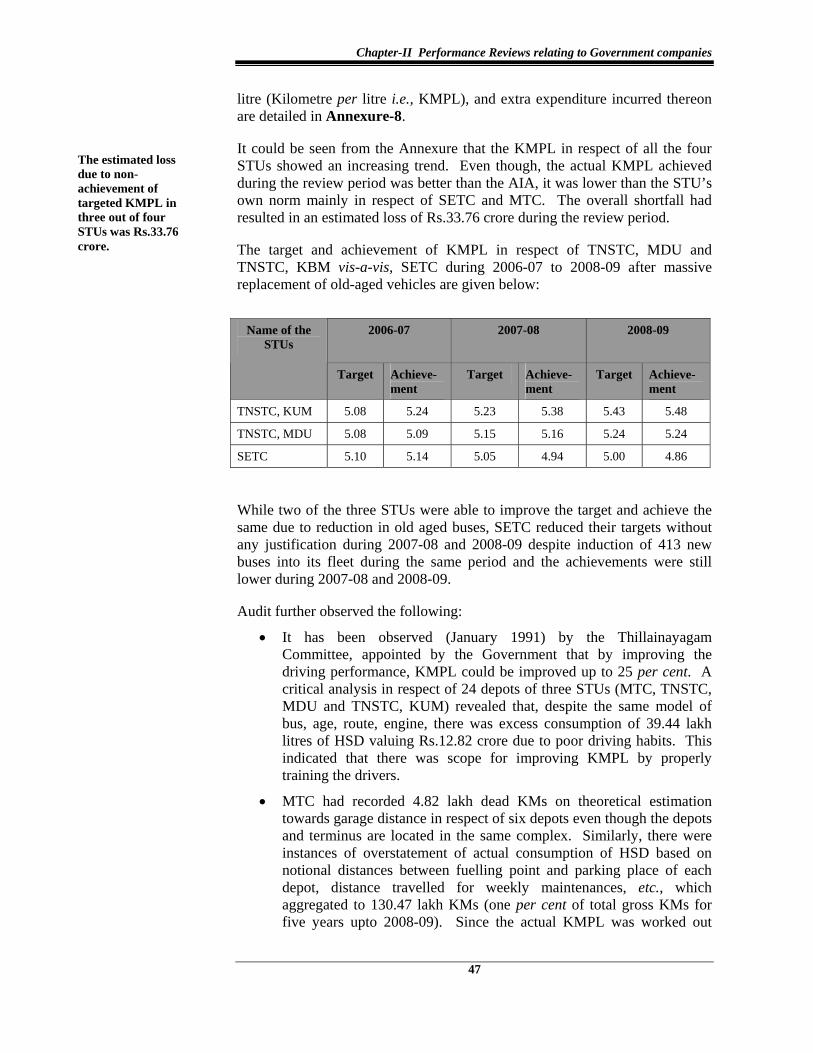
The target and achievement of KMPL in respect of TNSTC, MDU and TNSTC, KBM vis-a-vis, SETC during 2006-07 to 2008-09 after massive replacement of old-aged vehicles are given below:
2006-07 2007-08 2008-09 Name of the STUs
Target Achieve-ment
Target Achieve-ment
Target Achieve-ment
TNSTC, KUM 5.08 5.24 5.23 5.38 5.43 5.48
TNSTC, MDU 5.08 5.09 5.15 5.16 5.24 5.24
SETC 5.10 5.14 5.05 4.94 5.00 4.86
While two of the three STUs were able to improve the target and achieve the same due to reduction in old aged buses, SETC reduced their targets without any justification during 2007-08 and 2008-09 despite induction of 413 new buses into its fleet during the same period and the achievements were still lower during 2007-08 and 2008-09.
Audit further observed the following:
• It has been observed (January 1991) by the Thillainayagam Committee, appointed by the Government that by improving the driving performance, KMPL could be improved up to 25 per cent. A critical analysis in respect of 24 depots of three STUs (MTC, TNSTC, MDU and TNSTC, KUM) revealed that, despite the same model of bus, age, route, engine, there was excess consumption of 39.44 lakh litres of HSD valuing Rs.12.82 crore due to poor driving habits. This indicated that there was scope for improving KMPL by properly training the drivers.
• MTC had recorded 4.82 lakh dead KMs on theoretical estimation towards garage distance in respect of six depots even though the depots and terminus are located in the same complex. Similarly, there were instances of overstatement of actual consumption of HSD based on notional distances between fuelling point and parking place of each depot, distance travelled for weekly maintenances, etc., which aggregated to 130.47 lakh KMs (one per cent of total gross KMs for five years upto 2008-09). Since the actual KMPL was worked out
The estimated loss due to non-achievement of targeted KMPL in three out of four STUs was Rs.33.76 crore.
Audit Report (Commercial) for the year ended 31 March 2009
48
including these notional distances, the actual achievement of KMPL claimed by MTC was an inflated figure.
• The MTC recorded 29.24 lakh KMs for the period 2005-06 to 2008-09 as dead KMs without assigning any reason indicating absence of management control over the dead KMs and fuel consumption.
The State Government stated (December 2009) that the continuous improvement in KMPL of all the STUs was due to counseling and regular training of the drivers. It was further stated that for SETC, drop in KMPL was due to introduction of Ultra Deluxe buses in large numbers. However, the introduction of Ultra Deluxe bus was not a reason for low KMPL as other STUs, which were operating Ultra Deluxe buses, achieved better KMPL than that of SETC.
Engine oil
2.1.31 Engine oil is changed in accordance with the schedule prescribed by the Original Equipment Manufacturer (OEM). The STUs did not fix any norm for consumption. Comparison of actual consumption with OEM’s norms indicated that there was excess consumption of 8.07 lakh litres of engine oil in respect of MTC and SETC during the review period valued at Rs.5.64 crore.
Body building
2.1.32 Four STUs test-checked got 7,682 buses fabricated and put on road through outsourcing (2,472 buses) and by in-house body building units (5,210 buses) during the review period. A review of body building activities through outsourcing and by the in-house facilities revealed that:
• there was delay in constructing the bus body in respect of 5,210 buses (68 per cent) which were fabricated in-house in the STUs’ own body building units. Considering the standard time of 30 days required for construction of bus body, the excess time taken in respect of the above buses ranged between one to 37 days which resulted in loss of contribution of Rs.1.49 crore.
• the State Government directed (1992) that the STUs should dispense with outsourcing the bus body building activities wherever there was a similar facility within their own STUs. MTC and TNSTC KBM, despite having their own in-house capacity for construction of ordinary buses, outsourced bus body construction of 453 ordinary buses at a total cost of Rs.24.72 crore. However, the cost would have been Rs.17.86 crore if the work was undertaken in-house. Thus, outsourcing the activity led to an avoidable extra expenditure of Rs.6.86 crore.
In spite of having inhouse bus fabrication facilities, the STUs outsourced bus body building and incurred avoidable extra expenditure of Rs.6.86 crore.
Chapter-II Performance Reviews relating to Government companies
49
Financial Management
2.1.33 Raising of funds for capital expenditure, i.e., for replacement/ addition of buses happens to be the major challenge in financial management of STUs’ affairs. This issue has been covered in Paragraph 2.1.20. The section below deals with the STUs’ efficiency in raising claims and their recovery. This section also analyses whether an opportunity exists to realign the business model to generate more resources without compromising on service delivery.
Claims and Dues
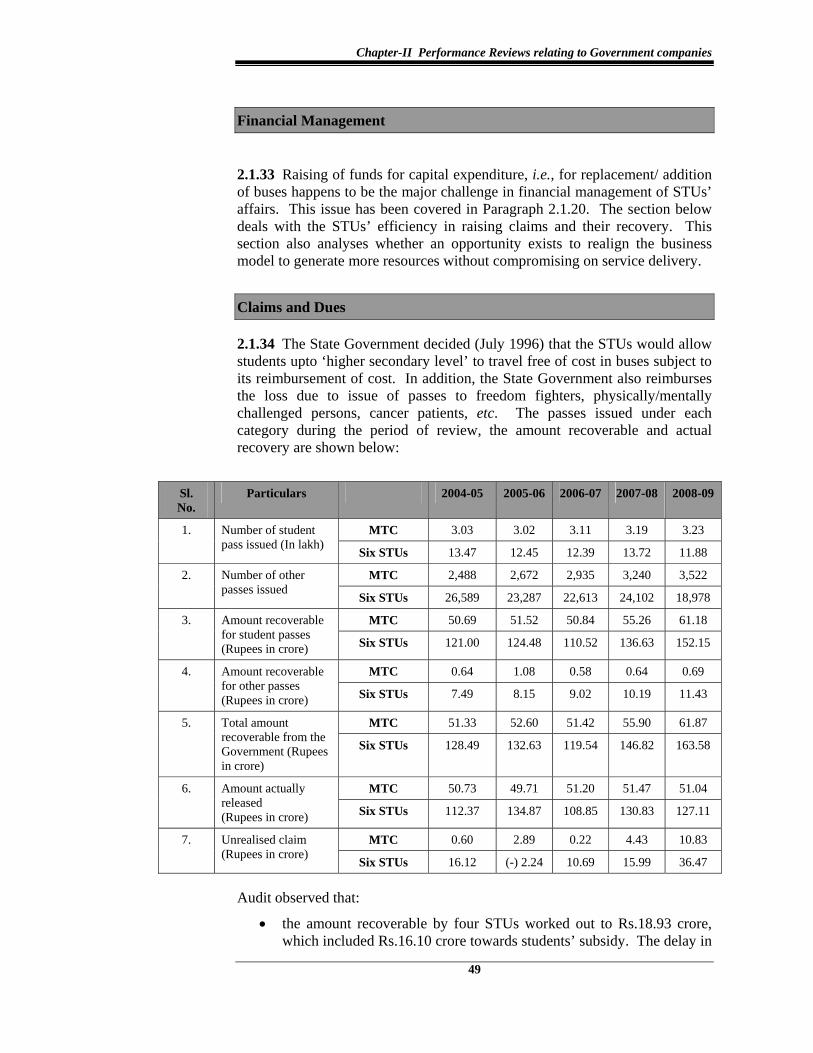
2.1.34 The State Government decided (July 1996) that the STUs would allow students upto ‘higher secondary level’ to travel free of cost in buses subject to its reimbursement of cost. In addition, the State Government also reimburses the loss due to issue of passes to freedom fighters, physically/mentally challenged persons, cancer patients, etc. The passes issued under each category during the period of review, the amount recoverable and actual recovery are shown below:
Sl. No.
Particulars 2004-05 2005-06 2006-07 2007-08 2008-09
MTC 3.03 3.02 3.11 3.19 3.23 1. Number of student pass issued (In lakh) Six STUs 13.47 12.45 12.39 13.72 11.88
MTC 2,488 2,672 2,935 3,240 3,522 2. Number of other passes issued
Six STUs 26,589 23,287 22,613 24,102 18,978
MTC 50.69 51.52 50.84 55.26 61.18 3. Amount recoverable for student passes (Rupees in crore) Six STUs 121.00 124.48 110.52 136.63 152.15
MTC 0.64 1.08 0.58 0.64 0.69 4. Amount recoverable for other passes (Rupees in crore) Six STUs 7.49 8.15 9.02 10.19 11.43
MTC 51.33 52.60 51.42 55.90 61.87 5. Total amount recoverable from the Government (Rupees in crore)
Six STUs 128.49 132.63 119.54 146.82 163.58
MTC 50.73 49.71 51.20 51.47 51.04 6. Amount actually released (Rupees in crore) Six STUs 112.37 134.87 108.85 130.83 127.11
MTC 0.60 2.89 0.22 4.43 10.83 7. Unrealised claim (Rupees in crore) Six STUs 16.12 (-) 2.24 10.69 15.99 36.47
Audit observed that:
• the amount recoverable by four STUs worked out to Rs.18.93 crore, which included Rs.16.10 crore towards students’ subsidy. The delay in
Audit Report (Commercial) for the year ended 31 March 2009
50
getting reimbursement had aggravated the cash crunch situation of STUs. Consequently, the STUs had to depend on borrowed funds for their working capital needs.
• MTC failed to prefer claim of advertisement revenue amounting to Rs.2.52 crore from six firms for the period from February 2003 to March 2005 on the ground that these claims were under dispute in the High Court of Chennai. However, the dispute pending in the High Court did not pertain to these six firms and related to some other six firms. Hence, there was no justification for not preferring timely claims. But MTC decided (September 2008) not to prefer the claim as it felt that there was no possibility of recovering the amount.
Realignment of business model
2.1.35 The STUs were mandated to provide an efficient, adequate and economical road transport to public. Therefore, they cannot take an absolutely commercial view in running their operations. They are required to cater to uneconomical routes to fulfill its mandate and keep the fares affordable. In such a situation, it is imperative for the STUs to tap revenue from non-traffic sources to cross-subsidise their operations. However, the share of non-traffic revenues (other than interest on investments) was nominal at 1.98 per cent of total revenue during 2004-09. This revenue mainly came from advertisements, profit on sale of condemned buses and sale of scrap, etc.
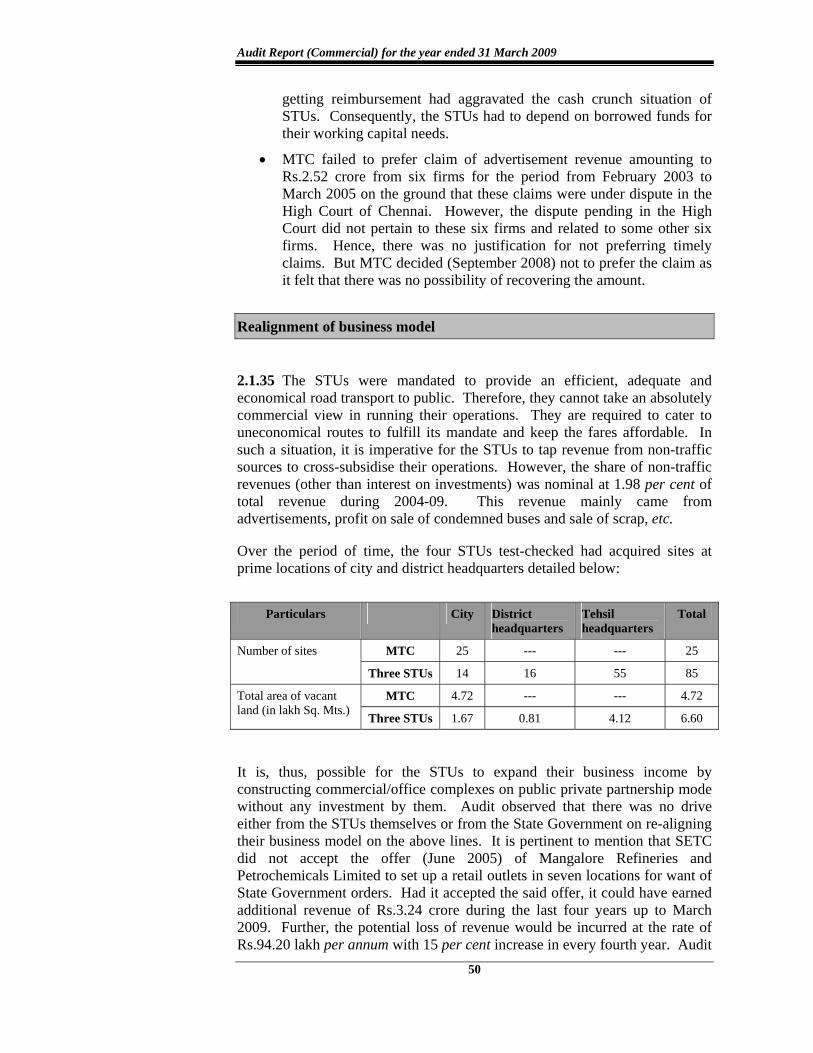
Over the period of time, the four STUs test-checked had acquired sites at prime locations of city and district headquarters detailed below:
Particulars City District headquarters
Tehsil headquarters
Total
MTC 25 --- --- 25 Number of sites
Three STUs 14 16 55 85
MTC 4.72 --- --- 4.72 Total area of vacant land (in lakh Sq. Mts.)
Three STUs 1.67 0.81 4.12 6.60
It is, thus, possible for the STUs to expand their business income by constructing commercial/office complexes on public private partnership mode without any investment by them. Audit observed that there was no drive either from the STUs themselves or from the State Government on re-aligning their business model on the above lines. It is pertinent to mention that SETC did not accept the offer (June 2005) of Mangalore Refineries and Petrochemicals Limited to set up a retail outlets in seven locations for want of State Government orders. Had it accepted the said offer, it could have earned additional revenue of Rs.3.24 crore during the last four years up to March 2009. Further, the potential loss of revenue would be incurred at the rate of Rs.94.20 lakh per annum with 15 per cent increase in every fourth year. Audit
Chapter-II Performance Reviews relating to Government companies
51
further noticed that there were instances in which there were substantial losses of non-operational revenue as mentioned below:
• MTC delayed finalisation of tender for advertisement in air conditioned buses and further delay in allotment of buses for display of advertisements. These delays led to revenue loss of Rs.1.10 crore during the period December 2007 to July 2008.
• The contract (August 2006) for display of advertisement in 810 buses of MTC was valid up to the end of June 2008 and it did not provide for premature surrender of licence by the allottees. However, MTC accepted (September 2007) surrender of the licences in September 2007. This has resulted in a revenue loss of Rs.69.20 lakh.
Fare policy and fulfilment of social obligations
Existence and fairness of fare policy
2.1.36 In Tamil Nadu, the fixation of fares is done by the State Government. The fare policy adopted by the Government did not take into account the cost of operations. Moreover, there is no system in place for periodic revision of fares based on the cost of operations of the STUs. The latest revision of fare by the State Government was effected in December 2001.
The fare policy of the Government had no scientific basis as it did not take into account, the normative cost. The ideal revenue taking into consideration the loss of revenue on account of low vehicle productivity, low load factor and cancellation of scheduled KMs and the ideal cost eliminating the avoidable cost on account of excess manpower and fuel consumption has been indicated in Annexure-9.
The data in the Annexure do not take into account other inefficiencies such as excess tyre cost, defective route planning, etc. Nonetheless, it shows that the net loss could be lower, if the operations are properly planned and efficiently managed than what they actually are. Thus, the case made by the STUs for increase in fare includes their inefficiencies and would make the commuters pay more than what they should be actually paying.
Therefore, it is necessary to regulate the fares on the basis of a normative cost. It would be desirable to have an independent regulatory body (like State Electricity Regulatory Commission) to fix the fares, specify operations on uneconomical routes and address the grievances of commuters.
While the revision of fare for transport service is a Government policy decision, STUs were allowed to maximise the traffic revenue within the ambit of fare policy in respect of special services and extra transport facilities offered by them. However, Audit noticed that the opportunities for the STUs to maximise the revenue in respect of such special services were not availed in the instances detailed below:
Audit Report (Commercial) for the year ended 31 March 2009
52
• MTC has been extending (since December 2001) a special concession viz., “Travel As You Please” (TAYP) by collecting Rs.30 per day and Rs.600 per month irrespective of the number of trips and the distance involved in a day’s journey. Consequent upon extension of area of operation from 40 to 50 KMs from January 2007, the maximum fare collected by MTC increased from Rs.15 to Rs.25 per trip. However, there was no corresponding increase in the fare of TAYP, thereby lost the opportunity of earning a revenue of Rs.48.94 crore for the period January 2007 to March 2009.
• MTC and TNSTC, Madurai were operating their city services under “LSS”, “M-service”, “Express” and “Deluxe”. The applicable fare for these services was ranging from Rs.2.50 to Rs.25. Between 30 April and 3 May 2009, these STUs operated the above services but collected the fare applicable for ordinary services (from Rs.2 to Rs.6.50). The reasons for such reduction were not recorded either at the STU level or at the State Government level. Thus, these two STUs suffered a loss of Rs.3.93 crore during the above period due to charging lower fare.
• Some buses belonging to Trichy division of TNSTC, Kumbakonam took a circuitous route due to permanent closure of an old bridge across Coleroon River since December 2005. The additional distance involved per day per bus due to this was 31.67 KMs. However, the STU did not correspondingly increase the fare for undertaking the operation of additional distance. The loss suffered by the STU on this account worked out to Rs.5.43 crore.
The State Government stated (December 2009) that it was not possible for MTC to revise the fare without its orders. The reply is not convincing because the revision was possible by MTC itself.
Adequacy of services on uneconomical routes
2.1.37 As already discussed in Paragraph 2.1.25, 99 per cent of the routes operated by MTC and 89 per cent of routes operated by other three STUs became uneconomical as of 31 March 2009. However, the position would change if the STUs improves their efficiency in fuel, operation of scheduled KMs, manpower management, etc. Nonetheless, there would still be some routes, which would be uneconomical. As none of the STUs was able to adhere to the Government norms (February 1992) of 30 per cent for operation of uneconomic routes, the desirability to have an independent regulatory body to specify the quantum of uneconomical services taking into account the present needs of commuters is further underlined.
Fulfilment of social obligations
Dues against accident compensation
2.1.38 During the period covered under review, buses of STUs were involved in 39,381 accidents and 5,492 fatal accidents. As on 31 March 2009, the accident compensation claims yet to be paid worked out to Rs.158.15 crore.
The Company suffered revenue loss of Rs.48.94 crore due to non-revision of fare under ‘travel as you please scheme’ in line with the extended area of operation.
Chapter-II Performance Reviews relating to Government companies
53
In addition, there were claims (Rs.1,346.65 crore) preferred by victims of accidents against STUs, which were not settled by the STUs as of 31 March 2009. Inability of the STUs to pay the compensation had resulted in blocking of STUs’ funds of Rs.78.25 crore in the form of deposits in various courts which had neither benefited the STUs nor the victims.
During the review period, there were 1,076 instances in which the buses of the STUs were attached in various courts for non-payment of the awarded amount of Rs.24.62 crore.
Thus, the STUs lacked a long-term plan for timely payment of compensation, which is a social obligation.
Non-payment of statutory dues to the employees
2.1.39 To enable prompt payment of terminal benefits to the retired employees of the STUs, the State Government had formed exclusive trusts for provident fund and gratuity along with formation of respective STUs. In addition, the State Government formed a separate pension fund in 1998 for the employees of STUs. However, the pension fund trust was not recognised by the Income Tax Authorities due to non-investment of the trust funds in the approved investment schemes like LIC and UTI, etc. Pending clearance of the pension fund, the State Government directed (March 2005) the STUs to invest their contribution in nationalised banks on monthly basis. Contrary to it, the STUs diverted their contributions (equivalent to 12 per cent of pay) to their working capital requirement. In addition, the contributions to provident fund and gratuity fund were also diverted by STUs towards working capital. The accumulation of statutory dues not paid by four STUs as on 31 March 2009, test checked in Audit, was as under:
• Provident Fund : Rs.568.37 crore
• Pension Fund : Rs.268.31 crore
• Gratuity : Rs.133.31 crore
The State Government stated (December 2009) that it had released (October 2009) Rs.115 crore for settlement of pension commutation of all STUs. The fact remained that the said amount was released after it was pointed out by Audit during September 2009.
Monitoring by top management
MIS data and monitoring of service parameters
2.1.40 For an organisation like Road Transport Corporation, to succeed in operating economically, efficiently and effectively, there has to be written norms of operations, service standards and targets. Further, there has to be a sound Management Information System (MIS) to report on achievement of targets and norms. The achievements need to be reviewed to address deficiencies and also to set targets for subsequent years. The targets should
Audit Report (Commercial) for the year ended 31 March 2009
54
generally be such that their achievement would make an organisation self-reliant. In the light of this, Audit reviewed the system prevalent in the STUs.
• Integrated database of the operations of the individual depots was not maintained indicating lack of control by the top level.
• At the depot level, though the average cost and profit of each route are indicated, there is no data on bus-wise profitability to enable decision making on continuation of the number of services.
• Both SETC and MTC did not maintain route-wise occupancy ratio based on passenger KM vis-a-vis effective KM. This had deprived the management of an opportunity to take corrective action in respect of low occupancy routes.
Acknowledgement
Audit acknowledges the co-operation and assistance extended by the Management of STUs in conducting this Performance Review.
Conclusion
Operational performance
• The vehicle density per one lakh population in Chennai was only 38, which was lower than the comparable density of 73 in Bangalore. However, in rest of the State, it increased from 36 to 42 during the period covered under review.
• The STUs could not recover the cost of operation in all the years covered under review except during 2004-05.
• As against the AIA fleet utilisation of 92 per cent, the fleet utilisation of MTC was between 78.84 and 87.57 per cent during the period covered under review. In respect of other three STUs, the same was above AIA.
• The passenger load factor of mofussil and express STUs showed a steady increase from 78.98 per cent in 2004-05 to 85.46 per cent in 2008-09. But in MTC, the same declined from 80.81 in 2004-05 to 75.25 in 2008-09.
• The manpower per bus which was more than the norm in MTC and other three STUs, resulted in idle wages of Rs.542.38 crore.
Financial Management
• Though the revenue from non-traffic sources constituted only 1.98 per cent of the total revenue during 2004-09, the STUs did
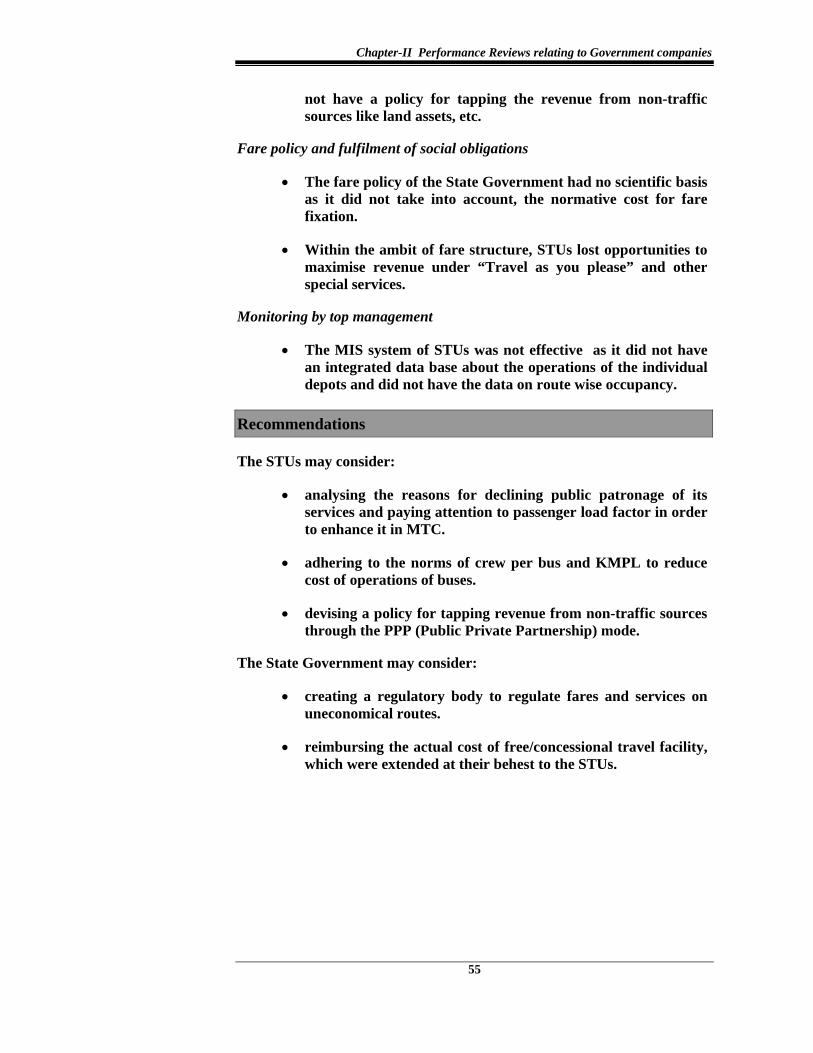
Chapter-II Performance Reviews relating to Government companies
55
not have a policy for tapping the revenue from non-traffic sources like land assets, etc.
Fare policy and fulfilment of social obligations
• The fare policy of the State Government had no scientific basis as it did not take into account, the normative cost for fare fixation.
• Within the ambit of fare structure, STUs lost opportunities to maximise revenue under “Travel as you please” and other special services.
Monitoring by top management
• The MIS system of STUs was not effective as it did not have an integrated data base about the operations of the individual depots and did not have the data on route wise occupancy.
Recommendations
The STUs may consider:
• analysing the reasons for declining public patronage of its services and paying attention to passenger load factor in order to enhance it in MTC.
• adhering to the norms of crew per bus and KMPL to reduce cost of operations of buses.
• devising a policy for tapping revenue from non-traffic sources through the PPP (Public Private Partnership) mode.
The State Government may consider:
• creating a regulatory body to regulate fares and services on uneconomical routes.
• reimbursing the actual cost of free/concessional travel facility, which were extended at their behest to the STUs.
56
2.2 Working of Tamil Nadu Civil Supplies Corporation Limited
Executive Summary The Tamil Nadu Civil Supplies Corporation Limited is engaged in procurement of essential commodities from the farmers, central agencies etc., hulling of paddy, transportation and storage of essential commodities for distribution under Public Distribution System (PDS). The performance review of the activities of the Company for the period from 2004-05 to 2008-09 was conducted to ascertain the economy, efficiency and effectiveness of the Company in carrying out all its business activities and its ability to deliver according to its mandate. Financial position and working results All deficit in PDS sales are made good by the Government by way of subsidy. The Company incurred an excess of expenditure over income of Rs.6,358.06 crore for the four years ending 31 March 2008. The Company was found late in preferring/pursuing claims for receipt/ reimbursement of various expenses and dues. A sum of Rs.96.57 crore was pending receipt from the Government of India on account of Custom Milled Rice subsidy. Procurement
The Company was not geared to meet expectations set out for it to act as a market intervention agency. The procurement target for paddy were set below the minimum requirement for distribution under PDS throughout the review period even though sufficient quantity of paddy was available in the market. The infrastructure at Direct Procurement Centres were inadequate. Deficiencies in procurement
The Company failed to lift rice from Government of India allocated under Sampoorna Grameen Rozgar Yojana scheme during 2006-07 depriving continuous employment to 37,874 persons for 100 days in four districts. The Company did not prefer revised claim of wholesale/retail margin for sale of sugar since 2001 even after knowing the willingness of GOI for such revision subject to production of supporting documents. Excess purchase of wheat than requirements, extension of undue benefits to roller flour mills, incorrect assessment of requirement of sugar and non-availing competitive rates for purchase of pulses etc., were also observed.
Hulling
Utilisation of Company’s own Modern Rice Mills (MRMs) capacity was dismal and it heavily depended on private hulling agents. Hours lost due to controllable factors in its own mills resulted in avoidable expenditure of Rs.13.35 crore due to hulling of paddy through private hullers. This was despite COPU recommendations in 1989 to optimise in-house capacity and minimise dependence on private hullers. Storage and transportation
The Company faced abnormal storage losses, which are controllable factor, of beyond 1 percent to 4 percent. In violation of the norms prescribed, the Company regularised excess storage loss of 41,624 MT of Paddy valued at Rs.24.99 crore pertaining to the KMS 2004-2007. The Company had hired godown space beyond its needs and incurred wasteful storage charges of Rs.7.08 crore during 2004-08. Implementation of non-Public Distribution System Schemes The Company has been incurring losses in implementation of non-PDS schemes such as supply of commodities to noon meal schemes which had increased the food subsidy to the extent of Rs.37.59 crore. Conclusion and Recommendation
The performance of the Company was tardy in preferring/pursuing its claims and recovery of dues. The Company neither fixed targets realistically nor procured paddy as per their targets. It incurred controllable and avoidable expenditure in procurement of pulses, wheat and sugar. The Company could not utilise hulling capacity of its own MRMs. It used godown space inefficiently and hired space beyond its needs. These contributed to increase in subsidy and overburdened the State exchequer. The Company must ensure that all admissible elements of cost are claimed without delay, must exercise effective control over procurement & hulling operations and reduce storage & transportation costs by streamlining activities.
Chapter-II Performance Reviews relating to Government companies
57
Introduction
2.2.1 The Tamil Nadu Civil Supplies Corporation Limited was formed in April 1972. The Company engages in procurement of essential commodities from the farmers/central pool/other agencies, hulling rice in its Modern Rice Mills (MRM) as well as through private hulling agents, movement of commodities to various storage points for supply to Public Distribution System (PDS) and other welfare schemes and operating ration shops/departmental stores.
The Management of the Company is vested in a Board of Directors (BOD) headed by a Chairman nominated by the State Government. The day to day affairs are looked after by the Managing Director assisted by five General Managers, a Company Secretary and a Financial Advisor-cum-Chief Accounts Officer. The Company has regional offices in all the 31 districts of the State, 265 godowns (including 60 hired godowns), 23 MRMs, 26 Amudham Departmental Stores (ADS), 1,187 Fair Price Shops (Ration Shop), three petrol/diesel dealerships etc.
Scope of Audit
2.2.2 The performance of the Company was last reviewed and included in the Report of the Comptroller and Auditor General of India (Commercial) for the year 1986-87. The cash management and performance of MRM were subsequently reviewed and included in the Audit Report (Commercial) for the year 1993-94.
The present performance review covers the activities of the Company during 2004-2009. The audit findings are based on a test check of records at the Corporate office and 10* (30 per cent) out of 31 Regional offices of the Company selected at random. The test check covered the transactions relating to procurement, transport, hulling, storage and distribution activities (more than 50 per cent).
Audit objectives
2.2.3 The performance review was conducted to ascertain the economy, efficiency and effectiveness of:
• the system of the procurement of paddy, liftment of rice/wheat from Food Corporation of India (FCI), purchase of sugar,pulses and other items, contract management for hulling of paddy, storage and transportation of commodities; and
• the internal control and internal audit system.
* Chennai (North/South), Thanjavur, Nagapattinam, Thiruvarur, Kanchipuram,
Tiruvallur, Tiruchirapalli, Pudukottai, Erode and Coimbatore.
Audit Report (Commercial) for the year ended 31 March 2009
58
Audit criteria
2.2.4 The following criteria were adopted for analysis:
• Government policies prescribing paddy procurement and implementation of PDS and other schemes;
• procedure for procurement of various commodities as per the manuals;
• annual hulling plan prepared by the Company in its own/private mills;
• norms fixed for storage losses and
• terms and conditions in the contracts for procurement, transport and hulling operations.
Audit methodology
2.2.5 Audit adopted the following methodology:
• Review of Government budget and policy statements on procurement of paddy, PDS and other welfare schemes;
• Review of minutes of the BOD of the Company;
• Scrutiny of tender and contract files;
• Scrutiny of orders relating to Central pool allotment of rice and its liftment, production reports of MRMs, utilisation and operation reports of godowns;
• Review of internal audit reports and internal control system and interaction and discussion with the Management.
Audit findings
2.2.6 Audit explained the performance review objectives to the Management and the Government in the ‘Entry conference’ held during February 2009. The audit findings were reported to the Management/Government in September 2009 and discussed in the ‘Exit conference’ held in October 2009, wherein Principal Secretary, Co-operation, Food and Consumer Protection Department, Government of Tamil Nadu participated. The views expressed by the Government in the Exit conference have been considered while finalising this performance review and are discussed in succeeding paragraphs.
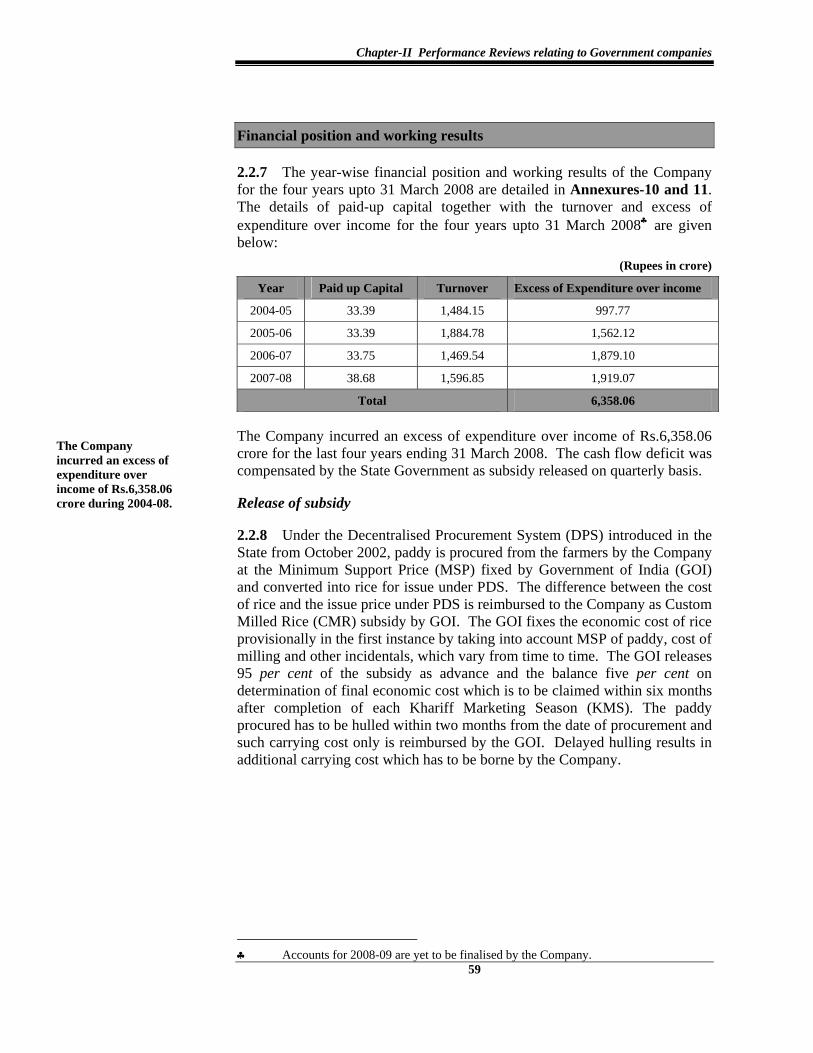
Chapter-II Performance Reviews relating to Government companies
59
Financial position and working results
2.2.7 The year-wise financial position and working results of the Company for the four years upto 31 March 2008 are detailed in Annexures-10 and 11. The details of paid-up capital together with the turnover and excess of expenditure over income for the four years upto 31 March 2008♣ are given below:
(Rupees in crore)
Year Paid up Capital Turnover Excess of Expenditure over income
2004-05 33.39 1,484.15 997.77
2005-06 33.39 1,884.78 1,562.12
2006-07 33.75 1,469.54 1,879.10
2007-08 38.68 1,596.85 1,919.07
Total 6,358.06
The Company incurred an excess of expenditure over income of Rs.6,358.06 crore for the last four years ending 31 March 2008. The cash flow deficit was compensated by the State Government as subsidy released on quarterly basis.
Release of subsidy
2.2.8 Under the Decentralised Procurement System (DPS) introduced in the State from October 2002, paddy is procured from the farmers by the Company at the Minimum Support Price (MSP) fixed by Government of India (GOI) and converted into rice for issue under PDS. The difference between the cost of rice and the issue price under PDS is reimbursed to the Company as Custom Milled Rice (CMR) subsidy by GOI. The GOI fixes the economic cost of rice provisionally in the first instance by taking into account MSP of paddy, cost of milling and other incidentals, which vary from time to time. The GOI releases 95 per cent of the subsidy as advance and the balance five per cent on determination of final economic cost which is to be claimed within six months after completion of each Khariff Marketing Season (KMS). The paddy procured has to be hulled within two months from the date of procurement and such carrying cost only is reimbursed by the GOI. Delayed hulling results in additional carrying cost which has to be borne by the Company.
♣ Accounts for 2008-09 are yet to be finalised by the Company.
The Company incurred an excess of expenditure over income of Rs.6,358.06 crore during 2004-08.
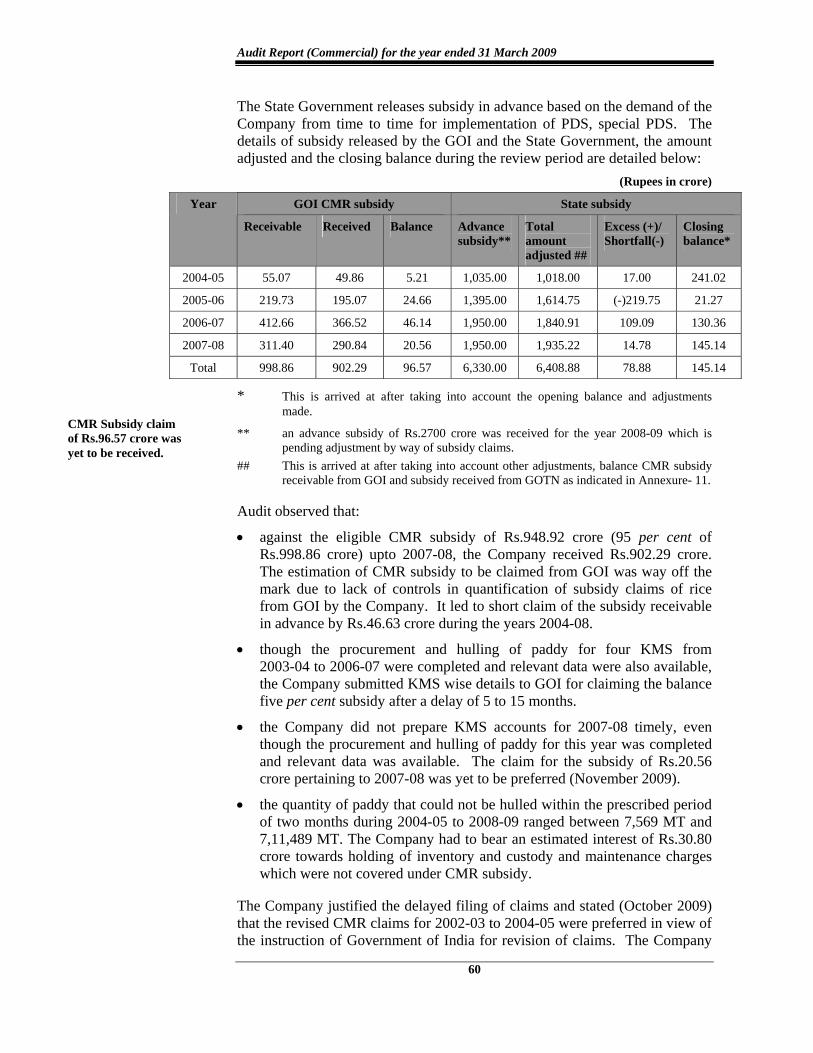
Audit Report (Commercial) for the year ended 31 March 2009
60
The State Government releases subsidy in advance based on the demand of the Company from time to time for implementation of PDS, special PDS. The details of subsidy released by the GOI and the State Government, the amount adjusted and the closing balance during the review period are detailed below:
(Rupees in crore)
GOI CMR subsidy State subsidy Year
Receivable Received Balance Advance subsidy**
Total amount adjusted ##
Excess (+)/ Shortfall(-)
Closing balance*
2004-05 55.07 49.86 5.21 1,035.00 1,018.00 17.00 241.02
2005-06 219.73 195.07 24.66 1,395.00 1,614.75 (-)219.75 21.27
2006-07 412.66 366.52 46.14 1,950.00 1,840.91 109.09 130.36
2007-08 311.40 290.84 20.56 1,950.00 1,935.22 14.78 145.14
Total 998.86 902.29 96.57 6,330.00 6,408.88 78.88 145.14
* This is arrived at after taking into account the opening balance and adjustments made.
** an advance subsidy of Rs.2700 crore was received for the year 2008-09 which is pending adjustment by way of subsidy claims.
## This is arrived at after taking into account other adjustments, balance CMR subsidy receivable from GOI and subsidy received from GOTN as indicated in Annexure- 11.
Audit observed that:
• against the eligible CMR subsidy of Rs.948.92 crore (95 per cent of Rs.998.86 crore) upto 2007-08, the Company received Rs.902.29 crore. The estimation of CMR subsidy to be claimed from GOI was way off the mark due to lack of controls in quantification of subsidy claims of rice from GOI by the Company. It led to short claim of the subsidy receivable in advance by Rs.46.63 crore during the years 2004-08.
• though the procurement and hulling of paddy for four KMS from 2003-04 to 2006-07 were completed and relevant data were also available, the Company submitted KMS wise details to GOI for claiming the balance five per cent subsidy after a delay of 5 to 15 months.
• the Company did not prepare KMS accounts for 2007-08 timely, even though the procurement and hulling of paddy for this year was completed and relevant data was available. The claim for the subsidy of Rs.20.56 crore pertaining to 2007-08 was yet to be preferred (November 2009).
• the quantity of paddy that could not be hulled within the prescribed period of two months during 2004-05 to 2008-09 ranged between 7,569 MT and 7,11,489 MT. The Company had to bear an estimated interest of Rs.30.80 crore towards holding of inventory and custody and maintenance charges which were not covered under CMR subsidy.
The Company justified the delayed filing of claims and stated (October 2009) that the revised CMR claims for 2002-03 to 2004-05 were preferred in view of the instruction of Government of India for revision of claims. The Company
CMR Subsidy claim of Rs.96.57 crore was yet to be received.
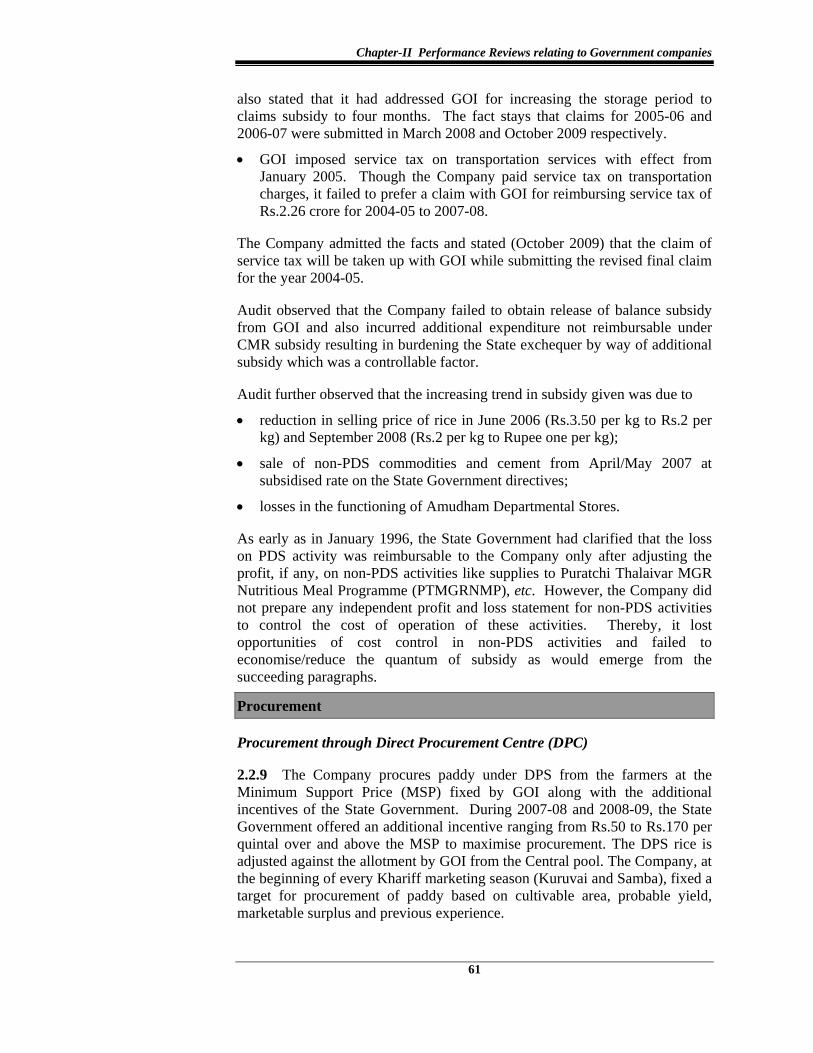
Chapter-II Performance Reviews relating to Government companies
61
also stated that it had addressed GOI for increasing the storage period to claims subsidy to four months. The fact stays that claims for 2005-06 and 2006-07 were submitted in March 2008 and October 2009 respectively.
• GOI imposed service tax on transportation services with effect from January 2005. Though the Company paid service tax on transportation charges, it failed to prefer a claim with GOI for reimbursing service tax of Rs.2.26 crore for 2004-05 to 2007-08.
The Company admitted the facts and stated (October 2009) that the claim of service tax will be taken up with GOI while submitting the revised final claim for the year 2004-05.
Audit observed that the Company failed to obtain release of balance subsidy from GOI and also incurred additional expenditure not reimbursable under CMR subsidy resulting in burdening the State exchequer by way of additional subsidy which was a controllable factor.
Audit further observed that the increasing trend in subsidy given was due to
• reduction in selling price of rice in June 2006 (Rs.3.50 per kg to Rs.2 per kg) and September 2008 (Rs.2 per kg to Rupee one per kg);
• sale of non-PDS commodities and cement from April/May 2007 at subsidised rate on the State Government directives;
• losses in the functioning of Amudham Departmental Stores.
As early as in January 1996, the State Government had clarified that the loss on PDS activity was reimbursable to the Company only after adjusting the profit, if any, on non-PDS activities like supplies to Puratchi Thalaivar MGR Nutritious Meal Programme (PTMGRNMP), etc. However, the Company did not prepare any independent profit and loss statement for non-PDS activities to control the cost of operation of these activities. Thereby, it lost opportunities of cost control in non-PDS activities and failed to economise/reduce the quantum of subsidy as would emerge from the succeeding paragraphs.
Procurement
Procurement through Direct Procurement Centre (DPC)
2.2.9 The Company procures paddy under DPS from the farmers at the Minimum Support Price (MSP) fixed by GOI along with the additional incentives of the State Government. During 2007-08 and 2008-09, the State Government offered an additional incentive ranging from Rs.50 to Rs.170 per quintal over and above the MSP to maximise procurement. The DPS rice is adjusted against the allotment by GOI from the Central pool. The Company, at the beginning of every Khariff marketing season (Kuruvai and Samba), fixed a target for procurement of paddy based on cultivable area, probable yield, marketable surplus and previous experience.
Audit Report (Commercial) for the year ended 31 March 2009
62
The target fixed and the actual procurement of paddy during 2004-09 are shown below:
(In lakh MT) Khariff Marketing Season
State Anticipated yield
Estimated marketable surplus
Paddy require-ment*
Procure-ment target
Actual procure-ment
Percentage of achievement to procurement target
Percentage of achievement to requirement
2004-05 75.00 45.00 23.00 16.50 9.73 58.9 42.3
2005-06 78.00 46.80 23.00 16.50 13.82 83.7 60.1
2006-07 78.00 46.80 23.00 16.50 16.08 97.4 69.9
2007-08 78.00 46.80 23.00 16.50 14.49 87.8 63.0
2008-09** 80.00 48.00 23.00 19.20 16.47 85.80 71.6 * Paddy requirement exclude paddy equivalent of rice Below Poverty Line (BPL) and
Antyodaya Anna Yojana (AAY) lifted under Central Pool allotment from FCI. ** Procurement upto May 2009 for season covering the period from October 2008 to
September 2009.
Audit observed:
• The Company fixed the procurement targets below the minimum requirements in PDS, thereby indicating that its approach was unrealistic and not on any scientific basis. Considering the actual requirement of paddy of around 23.00 lakh MT for each KMS and available marketable surplus 45 to 48 lakh MT (approx.) the fixation of lower target coupled with the dismal procurement performance indicated ineffective planning in procurement. This has resulted in avoidable transportation cost of Rs.29.62 crore to the GOI on movement of 29.62 lakh MT of rice from other States besides non achievement of the objective of helping the farmers in the State.
• Despite the State Government offering an additional incentive of Rs.500 per MT and Rs.1,700 per MT during KMS 2007-08 and 2008-09 respectively and the MSP being more than market rates, the Company failed to achieve the procurement targets.
The Company stated (October 2009) that the procurement during 2007-08 was low due to crop failure and the farmers sold paddy to traders directly without considering the incentives extended by the Government. The reply is not convincing because the shortfall in actual procurement was noticed in all the five years under review for which the Company did not analyse the reasons.
Identification of genuine farmers
2.2.10 To ensure that the benefit of DPS reaches genuine farmers, procurement guidelines envisaged procurement of paddy from farmers only. But, the company had not formulated any procedure for mandatory production and verification of identity cards of the farmers at the point of purchase. In the absence of such a system, audit could not verify the genuineness of the beneficiaries of the DPS system.
Chapter-II Performance Reviews relating to Government companies
63
The Company accepted the audit observation (October 2009) and agreed to send proposal to State Government for issue of identity cards to the farmers to ascertain genuineness of the beneficiaries.
Poor Infrastructure at Direct Procurement Centres
2.2.11 As on 31 March 2008, the Company had 1,297 procurement centres in the State and employed its own staff/temporary staff for paddy procurement in each DPC under the supervision of the Regional Office of the Company.
Audit noticed that infrastructure at the DPCs was inadequate as Digital weighing machines were installed only in 960 out of 1,297 DPCs and moisture meters available in the DPCs were not provided with printers.
An amount of Rs.24.12 crore was shown as shortages towards transit loss recoverable up to 2007-08 from temporary procurement assistants, who were recruited seasonally without obtaining security. This includes a minimum of Rs.20 crore pending from 2004-05 onwards. It is preposterous to prescribe that such a large sum is to be recovered from low paid temporary assistants.
The Company stated (October 2009) that action is being taken to upgrade the infrastructure at DPCs. The Company further stated that recoveries from the erstwhile DPC staff could not be effected due to stay orders obtained against recoveries. The fact, however, remained that the Company had no classification of amount pending recovery based on reasons. The possibility of recovery of the amounts is remote.
Procurement of essential commodities and pulses
2.2.12 The Company, besides procurement of paddy, is engaged in:
• liftment of rice, wheat and sugar from FCI/Sugar Mills under Central pool allotment to the State.
• purchase of non-levy sugar from Co-operative Sugar Mills on need basis.
• purchase of pulses and other commodities from open market through open tender for supply to noon meal and other special PDS schemes of the State.
The details of procurement of essential commodities, pulses and edible oil during the period from 2004-05 to 2007-08 are given in the table below:
(In MTs)
Year Rice Wheat Sugar Pulses Edible oil
2004-05 24,59,199 71,934 2,29,600 31,544 3,211
2005-06 28,55,849 84,026 3,35,977 26,642 2,516
2006-07 21,70,405 1,14,779 3,86,015 30,842 1,801
2007-08 28,82,193 96,332 2,74,763 76,898 27,782
Note: 2008-09 figures not available.
Audit Report (Commercial) for the year ended 31 March 2009
64
Supply of rice
2.2.13 The Company lifts rice from Central pool allotment through FCI besides the adjustment of the converted rice obtained under DPS. The Central pool allotment is categorised by the GOI into Above Poverty Line (APL), Below Poverty Line (BPL) and Targeted Public Distribution System (TPDS). But, the State Government implements Universal Public Distribution System whereby essential commodities are issued to all the families irrespective of their income levels. While cardholders under universal PDS are issued 20 Kg (maximum) of rice per month at the rate of Re.1 per Kg, the Antyodaya Anna Yojana (AAY) families are supplied 35 Kg per month at Rs.1 per Kg. Further, the Company undertakes liftment, storing and issue of rice allotted by GOI on behalf of the State Government for implementation of Sampoorna Grameen Rozgar Yojana (SGRY), which is a scheme to provide additional wage employment to the poor in rural areas and, thereby, ensure food security.
Non liftment of Rice
2.2.14 Audit noticed that the Company failed to lift 18,937 MTs of rice allotted by GOI during 2006-07 under SGRY which resulted in depriving continuous employment generation for 100 days and food to 37,874 persons in four≠ districts of the state. Consequently, the infrastructure works for a value of Rs.10.70 crore earmarked under the scheme could not be undertaken.
The Company stated (October 2009) that the non-liftment of rice was due to non-availability of adequate stock at FCI depots and before stock was moved from other depots, the validity period had expired. The reply is not convincing as the Company could have avoided this by better planning.
Wheat
2.2.15 The Company undertakes conversion of wheat into wheat products like rava, maida and atta through private millers under open tender system. The allotment of wheat by GOI to the State was 10,000 MT per month up to May 2006, which was reduced to 3,783 MT from June 2006. In addition, the GOI made an ad-hoc allotment of 10,000 MT from September 2008 to March 2009. The following deficiencies were observed in liftment of wheat and conversion of wheat into wheat products.
Liftment of wheat in excess of requirement and undue benefit to Millers
2.2.16 The Company, against the monthly requirement of 5,000 MT of wheat for custom milling, lifted 50,000 MT of wheat between October 2008 and February 2009, resulting in locking up of funds amounting to Rs.57.70 crore and loss of interest of Rs.2.59 crore on the blocked capital for nine months.
The Company stated (October 2009) that wheat was lifted to ensure uninterrupted supply under PDS. The reply is not convincing as the Company failed to plan the liftment according to the requirement under PDS resulting in
≠ Namakkal, Perambalur, Sivaganga and Ramanathapuram.
Chapter-II Performance Reviews relating to Government companies
65
accumulation of stocks and locking of capital. The State was burdened by controllable subsidy.
2.2.17 The Company entered into agreement with 43 Roller Flour Mills (RFM) for custom milling of wheat, which provided for selling back the entire quantity of Atta (6 per cent), Bran (24 per cent) and any quantity of Rava and Maida not required by the Company to the RFM at the rates determined by the State Government on the recommendations of the Company.
Audit noticed that the Company fixed the sale price of these commodities to RFM by adopting concessional rate of wheat fixed (Rs.9,860 per MT) by GOI instead of market rate (Rs.11,540 per MT). Audit estimated that this resulted in passing of an undue benefit of Rs.1.08 crore to the RFM during the period from April 2007 to September 2009.
The Company stated (October 2009) that sale price fixed covered all elements of cost and there was no undue benefit extended to the millers. The reply is not convincing as the Company failed to charge the market rate of wheat for private sales and instead charged subsidised wheat rates.
Incorrect adoption of base rate for milling and failure to restrict purchase
2.2.18 While finalising (September 2008) the milling rates for wheat products, the Company incorrectly allowed packing charges at Rs.2,000 per MT instead of Rs.1,490 per MT for Rava/Maida and Rs.1,900 per MT for Atta. This resulted in passing of undue benefit of Rs.2.21 crore in respect of 69,349 MT of wheat milled from September 2008 to September 2009 in the form of excess packing charges.
The Company stated (October 2009) that the milling rates were finalised based on the lowest rate obtained after negotiations. The reply is not convincing as the audit observation relates to finalisation of rates without proper evaluation and incorrect inclusion of packing charges on input instead of on output.
2.2.19 The Company entered into an agreement (26 August 2008) with a private supplier for supply of 5,000 MT of wheat reserving the right either to increase or decrease the ordered quantity by 25 per cent. The Company could take delivery of only 2,120.38 MT out of the ordered quantity of 5,000 MT at Rs.13,980 per MT within the due date (September 2008), the Company could have restricted the quantity upto 1,629.62 MT while granting extension of time. However, it accepted delivery made by the millers in spite of the fact that the GOI had allotted (September 2008) 50,000 MT at Rs.11,540 per MT, which was cheaper by Rs.2,440 per MT. The Company, by not restricting the ordered quantity to 3,750 MT, incurred an extra expenditure of Rs.30.50 lakh (1,250 MTs X Rs.2,440).
The Company stated (October 2009) that to avoid delay in regular processing of wheat into wheat products, it had resorted to this purchase of 5,000 MT. The reply is not convincing as the Company despite knowing the allotment and supply of wheat from FCI at PDS rates accepted further quantity from the private supplier.
Failure to charge the market rate from RFMs resulted in extension of undue benefit of Rs.1.08 crore.
Audit Report (Commercial) for the year ended 31 March 2009
66
Incorrect fixation of Selling price of wheat products under PDS
2.2.20 While preparing (April 2007) the cost statement for fixation of Selling Price for wheat products, the Company failed to include the cost incurred towards VAT on purchase of wheat which resulted in incorrect fixation of selling price by Rs.500 per MT. The loss incurred by the Company worked out to Rs.1.82 crore on the sale of 36,367 MT of wheat products (September 2009) and continued to lose Rs.5 lakh per month for an average sale of 1,000 MT per month.
Sugar
2.2.21 The GOI allotted an average quantity of 11,260 MT of levy sugar on monthly basis to be released by various sugar mills for distribution under PDS during the period from 2004-05 to 2008-09. The procedure requires the Company to submit the claims to FCI on monthly basis for reimbursement of the wholesale margin and transportation charges incurred from the Sugar Price Equalisation Fund (SPEF). Besides the levy sugar, the Company also purchased non-levy sugar from Tamil Nadu Co-operative Sugar Federation (TNCSF).
Delay in initiating claims of Settlement of Sugar Price Equalisation Fund and short supply
2.2.22 Audit observed that:
• against the prescribed time limit of one month for preferring the claims, the Company preferred monthly claims with delays ranging from 60 to 90 days.
• though GOI directed (August 2002/December 2003) the Company to furnish supporting documents for its enhanced claim of wholesale margin, it is yet to submit (August 2009) the documents for the period up to 2000-01.
• in May 2009, the Company based on the Audit’s observation, submitted a revised claim for Rs.2.25 crore of transportation charges reimbursable by GOI for the period 2001-2008.
• the revised claim for wholesale/retail margin for 2001-2008 was neither worked out nor claimed from GOI till date.
The Company stated (October 2009) that while the claims for the period from 1996-97 to 2002-03 were submitted in September 2009, the claims for the remaining periods were under preparation. The reply indicated the lackadaisical approach in preferring claims from the GOI.
Incorrect assessment of requirement and non-availing of competitive rates
2.2.23 A review of system of procurement of non-levy sugar indicated that in spite of downward trend in prices of sugar, the Company procured an average quantity of 22,775 MT of sugar every month against the requirement of 20,000 MT at the rates ranging from Rs.15,000 to Rs.18,200 per MT during the year
Incorrect fixation of selling price of wheat products resulted in loss of Rs.1.82 crore.
Chapter-II Performance Reviews relating to Government companies
67
2006-07 resulting in accumulation of stock of 41,703 MT at the end of March 2007.
The Company stated (October 2009) that the procurement of sugar was based on standard requirement and the liftment was regulated accordingly. The reply is not supported by facts as the Company had not procured during May 2007 and restricted its purchase to 9,350 MT in June 2007, which proved that there was excess purchase in 2006-07.
• Instead of obtaining the rates of non levy sugar from each co-operative sugar mill to facilitate a comparative analysis before placing orders, the Company accepted the allocation of non levy sugar by TNCSF and lifted 8.37 lakh MT between April 2005 and March 2009 from the respective mills at higher rates. Thus, an opportunity to procure sugar at economical rates had been lost and an avoidable extra expenditure of Rs.9.52 crore was incurred.
The Company stated (October 2009) that it placed orders based on the receipt of details and price on pro rata basis from the Federation. The reply confirmed the fact that the Company had not exercised the option of placing orders economically.
Pulses and other commodities
2.2.24 The Company purchases pulses and other commodities from open market through open tender for implementation of various schemes viz., PTMGRNMP, Special PDS schemes entrusted by the State Government.
Audit noticed that:
• the Company, instead of placing an annual contract for bulk supply of 32,814 MT of Toor/Masoor Dhall with a staggered delivery schedule to avail the price advantage (Rs.13,860 to Rs.2,708 per MT) during the harvest season (March/April of every year), placed order on piecemeal basis with various suppliers during 2006-07 and 2007-08. This resulted in an avoidable expenditure of Rs.25.62 crore.
The Company stated (October 2009) that the placement of bulk orders would result in loss since maintaining huge stock poses additional problems to the company. The reply is not convincing because by not placing bulk order with staggered delivery, the Company lost the opportunity of gaining price advantage and staggered delivery would have taken care of storage issues.
• Agreements for the supply of pulses provide for forfeiture of Earnest Money Deposit/Security Deposit whenever the supplies were made less than the contracted quantity with admissible variation of quantities up to five per cent. In 11 agreements during the period from August 2004 to January 2009, the quantities supplied were less than 95 per cent. However, the Company failed to forfeit the Security Deposit and, thereby, extended an undue benefit of Rs.3.17 crore to the suppliers.
Failure to procure sugar at economical rates resulted in avoidable expenditure of Rs.9.52 crore.
Non procurement of pulses on annual contract basis resulted in avoidable expenditure of Rs.25.62 crore.
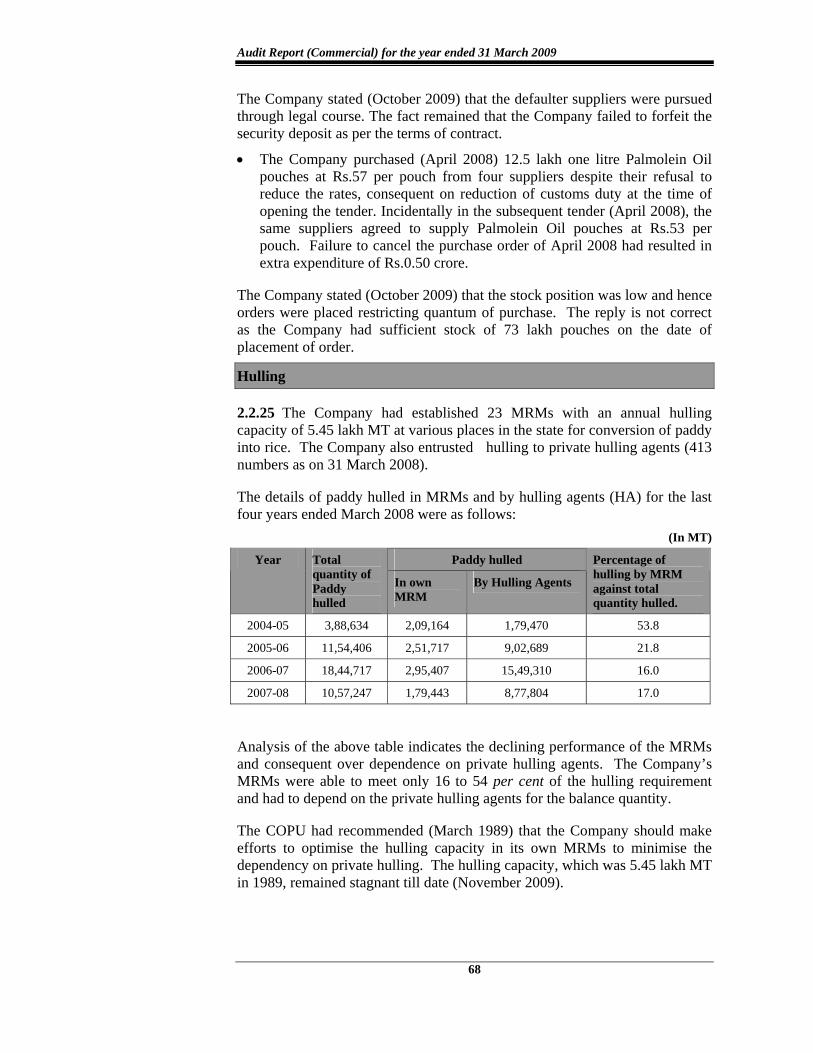
Audit Report (Commercial) for the year ended 31 March 2009
68
The Company stated (October 2009) that the defaulter suppliers were pursued through legal course. The fact remained that the Company failed to forfeit the security deposit as per the terms of contract.
• The Company purchased (April 2008) 12.5 lakh one litre Palmolein Oil pouches at Rs.57 per pouch from four suppliers despite their refusal to reduce the rates, consequent on reduction of customs duty at the time of opening the tender. Incidentally in the subsequent tender (April 2008), the same suppliers agreed to supply Palmolein Oil pouches at Rs.53 per pouch. Failure to cancel the purchase order of April 2008 had resulted in extra expenditure of Rs.0.50 crore.
The Company stated (October 2009) that the stock position was low and hence orders were placed restricting quantum of purchase. The reply is not correct as the Company had sufficient stock of 73 lakh pouches on the date of placement of order.
Hulling
2.2.25 The Company had established 23 MRMs with an annual hulling capacity of 5.45 lakh MT at various places in the state for conversion of paddy into rice. The Company also entrusted hulling to private hulling agents (413 numbers as on 31 March 2008).
The details of paddy hulled in MRMs and by hulling agents (HA) for the last four years ended March 2008 were as follows:
(In MT)
Paddy hulled Year Total quantity of Paddy hulled
In own MRM
By Hulling Agents
Percentage of hulling by MRM against total quantity hulled.
2004-05 3,88,634 2,09,164 1,79,470 53.8
2005-06 11,54,406 2,51,717 9,02,689 21.8
2006-07 18,44,717 2,95,407 15,49,310 16.0
2007-08 10,57,247 1,79,443 8,77,804 17.0
Analysis of the above table indicates the declining performance of the MRMs and consequent over dependence on private hulling agents. The Company’s MRMs were able to meet only 16 to 54 per cent of the hulling requirement and had to depend on the private hulling agents for the balance quantity.
The COPU had recommended (March 1989) that the Company should make efforts to optimise the hulling capacity in its own MRMs to minimise the dependency on private hulling. The hulling capacity, which was 5.45 lakh MT in 1989, remained stagnant till date (November 2009).
Chapter-II Performance Reviews relating to Government companies
69
Performance of Modern Rice Mills
2.2.26 The physical performance of MRMs together with down time analysis for the five years ending March 2009 is indicated in Annexure-12. The performance of MRM was peak in 2006-07 when capacity utilisation of 45 per cent was achieved.
Audit observed that
• hours lost due to controllable factors like non-availability of raw paddy,®load men, space, husk removal and unplanned preventive maintenance (in excess of allowance of 30 days in a year per mill) constituted 63.1 per cent of idle hours during the years 2004-05 to 2007-08. Lack of planning and inadequate control over these factors led the Company not being able to hull a minimum of 6.68 lakh MT of paddy during the said period. As this paddy was got hulled through the private agents, the Company paid avoidable hulling charges of Rs.13.35 crore to the private hulling agents.
The Company stated (October 2009) that hulling of paddy in MRMs was increased or decreased depending on the overall stock position. The fact remained that the Company had sufficient paddy stock but could not utilise the MRM facilities due to excess down time, a controllable factor.
• the State Government had fixed the out-turn ratio for conversion of paddy at 67 per cent for raw rice and 68 per cent for boiled rice. Audit noticed that the average out-turn of rice obtained in MRM ranged between 54.4 and 66.7 per cent in respect of raw rice and 62.9 to 65.9 per cent in respect of boiled rice. The low out-turn translated into loss of 7,016.45 MT of rice valued conservatively at Rs.7.60 crore. The Company had not analysed the reasons for low out turn.
Storage
2.2.27 The milling policy of each KMS envisaged a minimum period of two months for storage of paddy. As on 31 March 2009, the Company had 265 godowns (205/60 own/hired godowns with a capacity to handle 6.54 lakh MT and 1.86 lakh MT respectively) situated all over the State with a capacity of 8,40,400 MT. The Company, during 2004-08, handled 1,78,51,954 MT of food grains and incurred Rs.41.24 crore on storage including Rs.13.70 crore paid for 60 hired godowns.
Audit observed deficiencies in storage management decisions.
• With the bi monthly average quantity handled by the Company of 7.44 lakh MT and the Company’s own storage capacity being 6.54 lakh MT, the Company should have restricted hiring of the godowns to handle stores to the extent of 0.90 lakh MT. However, the Company hired godowns for 1.86 lakh MT which resulted in hiring of excess space beyond its needs.
® Minimum procurement during the commencement of Kuruvai season 2007-08.
Lack of planning and inadequate control over various controllable factors resulted in payment of hulling charges of Rs.13.35 crore to the private hulling agents.
Audit Report (Commercial) for the year ended 31 March 2009
70
Consequently the Company incurred wasteful storage charges amounting to Rs.7.08 crore during 2004-05 to 2007-08.
• The Company constructed (March 2007) 22 gunny godowns (500 MT each) at a cost of Rs.1.22 crore at various places in the State, violating the delegation of powers by splitting the works to avoid approval by the Board. These godowns are yet (August 2009) to be put to any beneficial use, therefore the expenditure of Rs.1.22 crore incurred towards construction of godowns remained unproductive.
The Company stated (October 2009) that it had obtained the State Level Co-ordination Committee’s clearance in September 2000 for the construction of eight godowns. It further stated that as the regular godowns could not be fully utilised, the construction of gunny godowns was taken up. The reply is not correct as the State Government, in December 2002, required the Company to furnish the final outcome of the discussion made with Tamil Nadu Warehousing Corporation regarding construction of these godowns. Audit noticed that gunnies were stored in all the regular godowns only and hence the construction of exclusive gunny godowns lacked justification.
Abnormal losses in storage
2.2.28 During storage, the food grains undergo weight reduction owing to causes like driage, different modes of weighment during receipt and issue, multiple handling, spillages etc. The Company, in adopting GOI norms for regularisation of storage loss, fixed (January 2005) that for every decrease of one per cent in moisture, the loss in weight should be reckoned as 0.25 per cent.
The Company was facing abnormal storage losses of more than one per cent. The Company constituted (August 2005) a committee to study the proposals for regularisation /recovery. The committee regularised 41,624.197 MT of losses in storage relating to three KMS upto 2006-07, citing longer storage period, drop in moisture etc., and ordered recovery from the employees only for a quantity of 1,312.03 MT valued at Rs.1.13 crore.
A review of regularisation proposals indicated that:
• the quantity regularised by the Committee was 41,624 MT of paddy pertaining to KMS 2004-05 to 2006-07. For this quantity, the percentage of storage loss was two to four per cent and the moisture content was between 17 and 20 per cent. As this quantity does not fulfill the norms prescribed by GOI, such losses regularised in excess of norms amounted to Rs.24.99 crore.
• the Company adopted earlier norms issued in 1993 (more than one per cent) for the regularisation of storage loss of 12,799.656 MT involving an amount of Rs.9.45 crore for KMS 2006-07 also, which was in contravention of the approved norms.
• the Company attributed higher driage loss of paddy to the long storage period without any scientific study. Hence, the veracity of data compiled
Regularisation of excess storage loss of Rs.24.99 crore in violation of norms.
Chapter-II Performance Reviews relating to Government companies
71
and adopted for regularisation of storage loss could not be ensured in Audit.
• even after finalisation of recovery of Rs.5.04 crore by the Headquarters of the Company, there was no follow up of recovery at the regional level from persons transferred to other regions/retired as per the Company’s policy.
The Company stated (October 2009) that the storage loss beyond permissible limit was unavoidable due to longer storage period and storage of paddy in unscientific godowns/cover and plinth storage. The reply is not convincing as these factors were considered while fixing the storage loss norms by the Company. Audit recommends that the Company must take decisions early to recover the losses as per extant rules.
Non-utilisation of infrastructure created for better food grain management
2.2.29 The Company entered (August 2006) in to an agreement with the FCI to implement Integrated Information System for Food Grain Management at a cost of Rs.5.72 crore which was given as a grant. The project envisaged linking all godowns and 31 regional offices to Headquarters to obtain online details of stock position of any godown at a given point of time. These systems (hardware and software) were supplied during 2007 to various godowns. In addition, the Company had created additional infrastructure valued at Rs.0.58 crore. However, the Company is yet to make the changes to suit its requirement and thus, the facilities created at a cost of Rs.6.30 crore remained idle (October 2009) and the objective for which it was contemplated was yet to be achieved.
The Company stated (October 2009) that action is being taken to operationalise the hardware/software through outsourcing. However, the fact remained that these systems, which were installed in 2007 are yet to be operationalised. The decision to outsource indicates inadequate planning in execution of project on Integrated Information System for Food Grain Management.
Transportation
2.2.30 The transportation of PDS commodities involves transport of paddy from Direct Procurement Centres (DPC), liftment of rice from FCI storage points to its own / hired godowns, transportation of commodities within the regions and transportation of PDS and other commodities to its retail outlets and Noon Meal Centres.
Based on the quotations (region wise) received, the Company evaluated the rates offered and awarded transport contracts to the lowest tenderer. The Company moved 169.55 lakh MT of foodgrains during the period from 2004-05 to 2007-08 and incurred transportation charges of Rs.535.83 crore.
Audit observed deficiencies in award of contracts and movement of commodities in test checked regions:
Audit Report (Commercial) for the year ended 31 March 2009
72
• While awarding the transport contracts for 2006-07, the Company failed to ascertain the reasons for abnormal increase ( ranging from 20 to 63 per cent) in the rates offered by 31 regional contractors even after reckoning the escalation cost in the price of diesel as compared to the previous year. This has resulted in avoidable extra expenditure of Rs.2.24 crore.
• Failure to move maximum stock of 3.71 lakh MT from nearest FCI depots (Egmore, Sembanarkoil, Arakkonam and Avadi) to its own godowns in Chennai North/South, Nagapattinam, Tiruvallur and Kanchipuram regions during 2004-05 to 2007-08 had resulted in an avoidable extra expenditure of Rs.1.77 crore on account of movement of foodgrains from the farthest points.
The Company stated (October 2009) that the FCI issued release orders according to the availability of quantum of stock and further stated that detailed instructions have been issued to minimise expenditure on transportation by advance planning and in consultation with FCI officials.
Public Distribution System
Performance of Fair Price Shops
2.2.31 The goal of the Public Distribution System is to ensure food security to all citizens, by making available essential commodities through fair price shops. The Company supplemented the role of co-operatives (28,849 shops) by operating 1,187 shops (1,097 full shops and 90 part time shops) as on 31 March 2009.
Audit observed in three regions test checked the average loss per shop run by the Company during the review period ranged between Rs.61,304 and Rs.1,73,937 per annum, against the loss for co-operative FPS which ranged between Rs.15,136 and Rs.49,554 per annum. The matter was commented in Paragraph No.3.1.5.1 of the CAG’s Audit Report (Civil) 2000- Government of Tamil Nadu. However, no concrete step had been taken so far to contain the deficit.
The Company admitted (October 2009) the fact and attributed the same to high establishment cost.
Irregularities in Fair Price Shops
2.2.32 Each Regional Manager was to conduct periodical inspection of the Fair Price Shops to prevent malpractices and irregularities. The Company also issued instructions to this effect but was not effectively complied with by any of the regional heads. Vigilance cell of the Company inspected FPS and detected cases of irregularities as given below:
Year Number of units inspected
Number of cases charge sheeted
Amount involved (Rupees in lakh)
2004-05 890 888 16.27
2005-06 959 1,226 42.38
Failure to move maximum stock from nearest FCI depots resulted in extra expenditure of Rs.1.77 crore.
Chapter-II Performance Reviews relating to Government companies
73
Year Number of units inspected
Number of cases charge sheeted
Amount involved (Rupees in lakh)
2006-07 1,489 2,158 97.15
2007-08 916 1,184 65.92
2008-09 1,322 1,501 135.08
TOTAL 356.80
Audit further noticed:
• there were differences between the quantity of rice lifted as per the Company records (133.74 lakh MT) and the quantity of rice lifted as per Commissioner of Civil Supplies (CCS) (124.98 lakh MT) during the year 2004-05 to 2007-08. The quantity of rice as per Company’s records was always more than the quantity mentioned in CCS records. The Company had not evolved any mechanism for reconciliation.
• failure to collect coupons from co-operative societies as a proof of supply of rice to the beneficiaries under SGRY scheme upto March 2009 for a quantity of 14,936 MT of rice indicates absence of control mechanism in supply of rice.
Implementation of non-PDS schemes
Functioning of Departmental Stores
2.2.33 The Company was operating 26 Amudham Departmental Stores (ADS) in the districts of Chennai (22) and Cuddalore (four) to make available non-ration commodities (groceries and beverages) at a reasonable price with a low profit margin. The working results of ADS for the last four years ended March 2008 are indicated in the Annexure-13.
Audit noticed:
• fixed cost i e., the establishment cost and administrative cost showed a steady increase during the years 2004-05 to 2007-08 resulting in an over all cash loss of Rs.1.59 crore which is claimed as subsidy from the State Government even though the same was not eligible for claiming PDS subsidy.
• out of 26 ADS in operation, 20 shops (17 in Chennai and 3 in Cuddalore) had not earned profit in any of the years from 2005-09. The losses were due to low turnover and meagre profit margin coupled with high administrative cost. 21 out of 26 ADS could not achieve the sales targets in any of the years and as a result, the net loss increased from Rs.8.83 lakh in 2004-05 to Rs.1.13 crore in 2007-08.
The Company’s claim (October 2009) that it was running these shops to have market intervention is not convincing as ADS shops are only in two regions and their role in the local market is insignificant. Audit recommends that appropriate action may be taken either for improving the performance or close down unviable shops.
Audit Report (Commercial) for the year ended 31 March 2009
74
Supply of commodities to noon meal centres
2.2.34 The Company has been implementing various welfare schemes viz., supply of essential commodities to noon meal centers under PTMGRNMP. As per the directions (August and September 2003) of the Government, the Company fixed the economic cost in respect of commodities supplied to PTMGRNMP based on the average purchase rate in the previous year. Subsequently, the Company sought (May 2007) approval of the Government to claim based on the actual cost for the respective years from 2007-08. Though the Government directed (April 2008) to submit separate proposals for claiming differential costs, the Company had not forwarded any revised proposal for the year 2007-08 but adopted the old formula. Thus, failure of the Company to comply with the directions of the Government/Board of Directors had inflated food subsidy to the extent of Rs.37.59 crore for the years 2007-2008 and 2008-09.
Internal control
2.2.35 Internal controls are tools which contribute to efficient and effective management of any Organisation. The internal control system in the Company was deficient because it did not ensure:
• reconciliation of long pending items (more than three years) in Bank Reconciliation Statement with regard to unidentified debits and credits;
• rendition of information to the management regarding pendency in recovery of penalties levied against the employees towards storage loss and outstanding claims;
• review of pending legal cases by the top management as year-wise break up of cases region-wise as well as at Head office were not maintained;
• review of expenditure incurred on civil works including repairs and maintenance. A case of irregular payment for incomplete works amounting to Rs.9.85 lakh was noticed in Thanjavur region during November 2007 to January 2008.
• adequacy of system of obtaining regular balance confirmation in respect of receivable/payable and reviewing policies and procedures for reducing operational expenditure; and
• updating of the functional manuals relating to procurement, processing, storage, accounting and audit.
Audit recommends for strengthening of internal control system in various areas of operations.
2.2.36 The Company had its own internal audit wing headed by Senior Manager under the over all control of the Financial Adviser and Chief Accounts Officer, to whom reports of internal audit findings are submitted.
Audit noticed a large number of pending objections (9,752) which included 2,922 objections valuing Rs.58.73 crore pending settlement for more than three years.
Chapter-II Performance Reviews relating to Government companies
75
• The internal wing is headed by the Financial Advisor and Chief Accounts Officer, who is also responsible for compilation of accounts of the Company and, therefore, is not independent.
• 65 out of 620 units are pending inspection as on 31 July 2009.
Besides the above wing, the Company appointed Chartered Accountants as internal auditors to conduct internal audit in specified areas. Audit noticed that neither the internal audit reports nor summary of important objections were submitted to the Board.
Acknowledgement
Audit acknowledges the co-operation and assistance extended by Staff and Management in conducting this Performance Review of working of the Company.
Conclusion
The performance of the Company was extremely tardy in preferring/pursuing its claims and recovery of dues as there was no system to ensure timely raising of bills. The Company neither fixed targets realistically nor procured paddy as per their targets. It incurred avoidable expenditure in procurement of pulses, wheat and sugar. The Company could not utilise hulling capacity of paddy in its own MRMs which resulted in overdependence on private hulling agents and did not restrict the storage losses within the norms.
All these contributed to increase in subsidy and thereby overburdening the State exchequer.
Recommendations
The Company must:
• ensure that the required bills/claims are preferred without delay.
• ensure that all admissible elements of cost are included and claimed in the final rates of rice/sugar fixed by GOI.
• devise a system of effective control over procurement and hulling operations to avoid over dependence on private hulling agents.
• streamline storage/transport management to reduce storage losses and avoid extra expenditure on transport and
• strengthen internal controls and checks.
The matter was reported to the Government in September 2009; its reply is awaited (December 2009).
76
2.3 Information Technology Review on the Computerisation of Tamil Nadu State
Marketing Corporation Limited
Executive Summary TTaammiill NNaadduu SSttaattee MMaarrkkeettiinngg CCoorrppoorraattiioonn LLiimmiitteedd ((CCoommppaannyy)) hhaass tthhee eexxcclluussiivvee pprriivviilleeggee ooff wwhhoolleessaallee ssuuppppllyy aanndd rreettaaiill vveennddiinngg ooff IInnddiiaann MMaaddee FFoorreeiiggnn LLiiqquuoorr ((IIMMFFLL)) iinn tthhee SSttaattee.. IIMMFFLL iiss pprrooccuurreedd aanndd ddiissttrriibbuutteedd tthhrroouugghh iittss 4411 ddeeppoottss aaccrroossss TTaammiill NNaadduu.. TThhee ttuurrnnoovveerr ooff tthhee CCoommppaannyy wwaass oovveerr RRss..1100,,000000 ccrroorree aanndd tthhee CCoommppaannyy wwaass ppaayyiinngg vvaarriioouuss dduuttiieess,, ttaaxxeess,, ffeeee eettcc.. TToo hhaavvee bbeetttteerr iinnvveennttoorryy ccoonnttrrooll,, ddiisssseemmiinnaattee ttiimmeellyy iinnffoorrmmaattiioonn ttoo tthhee mmaannaaggeemmeenntt,, ssuuppppllyy cchhaaiinn mmaannaaggeemmeenntt aanndd ttoo eennssuurree ssaaffeettyy ooff tthhee ddaattaa aatt ddeeppoottss,, tthhee CCoommppaannyy hhaadd ccoommppuutteerriisseedd ooppeerraattiioonnss ooff aallll tthhee 4411 ddeeppoottss iinn FFooxxPPrroo bbaasseedd aapppplliiccaattiioonn aanndd tthhee ssuupppplliieerrss bbiillll pprroocceessssiinngg aatt CCoorrppoorraattee ooffffiiccee iinn OOrraaccllee bbaasseedd aapppplliiccaattiioonn iinn 11999988.. TThhee CCoommppaannyy ddeecciiddeedd ttoo uuppggrraaddee tthhee hhaarrddwwaarree aanndd ssooffttwwaarree ttoo OOrraaccllee ppllaattffoorrmm iinn tthhrreeee pphhaasseess ((SSeepptteemmbbeerr 22000011)).. Planning TThhee CCoommppaannyy ddiidd nnoott ppllaann tthhee uupp--ggrraaddaattiioonn ttoo OOrraaccllee ppllaattffoorrmm iinn aa ssyynncchhrroonniisseedd mmaannnneerr aanndd tthheerree wweerree ddeellaayyss iinn ffiinnaalliissaattiioonn ooff tteennddeerr aanndd tthhee sseelleeccttiioonn ooff vveennddoorr iinn ffiirrsstt ttwwoo pphhaasseess.. TThhee CCoommppaannyy iiss yyeett ttoo ssttaarrtt PPhhaassee IIIIII ooff iimmpplleemmeennttaattiioonn aatt 1166 ddeeppoottss wwhhiicchh aarree ssttiillll wwoorrkkiinngg wwiitthh oolldd ssooffttwwaarree aapppplliiccaattiioonn.. SSttaattuuss ooff ccoommppuutteerriissaattiioonn Despite that there was no connectivity established between the depots & SRM offices and Company & Prohibition and Excise Department, the contractor was paid the full amount of contract.
SRM offices per force prepared their report and sent it to the corporate office in Excel sheets. The Company did not have trained personnel to man the system and was dependent on the software developers. SSyysstteemm ddeessiiggnn AAuuddiitt nnoottiicceedd ddeeffiicciieenncciieess iinn ssooffttwwaarree ddeessiiggnn lleeaaddiinngg ttoo nneecceessssiittyy ooff mmaannuuaall iinntteerrvveennttiioonnss bbyy ppaassssiinngg tthhee ssyysstteemm.. TThhee ddeeffiicciieenncciieess wweerree nnoottiicceedd iinn mmaappppiinngg ooff aaccccoouunnttiinngg ppoolliicciieess,, ttaaxx llaawwss aanndd lliinnkkiinngg ooff mmaasstteerr ssttoocckk rreeggiisstteerrss wwiitthh pphhyyssiiccaall ssttoocckk.. OOtthheerr ddeeffiicciieenncciieess TThhee ssooffttwwaarree wwaass ffoouunndd ddeeffiicciieenntt iinn tthhee aarreeaass ooff iinnppuutt,, pprroocceessss aanndd oouuttppuutt ccoonnttrroollss,, eennssuurriinngg ddaattee aanndd ttiimmee llooggiicc iinn tthhee iinnvvooiicceess,, ssttaannddaarrddiissaattiioonn ooff tthhee ccooddiinngg,, vvaalliiddaattiioonn aanndd iinntteeggrraattiioonn ooff ddaattaa.. TThhee CCoommppaannyy ddiidd nnoott hhaavvee lloonngg tteerrmm IITT ppllaann oorr ppoolliiccyy.. CCoonncclluussiioonn TThhee CCoommppaannyy ffaaiilleedd ttoo eevvoollvvee aa lloonngg tteerrmm IITT PPllaann wwiitthh dduullyy ddooccuummeenntteedd ppeerrffoorrmmaannccee iinnddiiccaattoorrss.. TThheerree wwaass nnoo iinn--hhoouussee eexxppeerrttiissee ttoo rreeccttiiffyy tthhee ddeeffiicciieenncciieess iinn tthhee ssooffttwwaarree.. TThhee CCoommppaannyy aaggrreeeedd ttoo ssttrreennggtthheenn tthhee ssyysstteemm
Introduction
2.3.1 Tamil Nadu State Marketing Corporation Limited (Company) was incorporated in 1983 under the Companies Act, 1956 with Registered Office at Chennai. The Company has been granted the exclusive privilege of wholesale and retail vending of IMFL for the entire State of Tamil Nadu. The Company procures IMFL (including Scotch whisky) and BEER from various manufacturers and distributes the stocks through 41 depots situated in different parts of the State.
Chapter-II Performance Reviews relating to Government companies
77
Organisational setup and business process
2.3.2 The Managing Director, assisted by three functional Chief General Managers/General Managers at Corporate Office, is the Chief Executive. In the field, there are five Senior Regional Managers (SRM) assisted by 33 District Managers (DM) managing 41 Depots. There were 6,706 retail vending shops under the control of DMs as on 31 March 2009. The procurement orders are processed centrally at Corporate Office and delivered by the suppliers at various depots which, in turn, distribute to the retail shops and directly sell to the clubs and hotels. The entire inventory management was monitored through specially designed software called Godown Monitoring System (GMS).
Development, Installation and Implementation
2.3.3 To connect all the depots with the SRM Offices as well as with the Corporate Office by a computerised network, the Company entered into an agreement with M/s Broadline Computer Systems in October 1997 to study the user requirement, suggest the required hardware, develop11, install and implement the software and train its employees within six months from the date of the agreement. The work was completed in 1998.
Later the Company decided (September 2001) to upgrade the existing hardware and software (in FoxPro) to Oracle in a phased manner to improve inventory management and ensure the data security at the depots. The same was endorsed by the Government vide its Policy Note of the Prohibition & Excise Department for the year 2002-2003.
Audit objectives
2.3.4 A comprehensive review of planning and implementation of Computerisation of the Company was taken up to check whether:
• computerisation was carried out as planned and catered to the requirements;
• the computerisation could achieve the projected objectives without errors;
• the controls were in place and working; • the integrity, security and confidentiality of the data was ensured; and • business continuity plan and disaster recovery management were in
place.
1 1. Ordering Processing System 2. Quality Monitoring System 3. Bill Processing
System 4. Stock Monitoring System 5. Regional Office Information System and 6. Financial Accounting System
Audit Report (Commercial) for the year ended 31 March 2009
78
Scope and Methodology
2.3.5 The focus was on conceptualisation and execution of the project with special reference to ‘Godown Monitoring System (GMS)’ for the period from April 2006 to March 2009. The methodology of audit involved:
• collection of background information about the system; • review of System documentation and processes; and • analysis of data – through CAATs;
Acknowledgement
2.3.6 Indian Audit and Accounts Department acknowledges the cooperation of the Prohibition and Excise Department and the Company in providing records and information. In the entry conference held on 16th February 2009, the Management was briefed of the audit objectives and methodology. On completion of audit, an exit conference was held on 20th October 2009 and the audit findings were discussed with the Management. The views expressed by the Management on the audit findings have been incorporated appropriately in this report.
Audit findings
Planning and implementation
2.3.7 Any system development includes a conceptual plan, detailed system study, formulation of system requirement specifications matching the user requirement specifications and a comprehensive system design document.
Lack of Planning
2.3.8 The Company decided (September 2001) to upgrade the existing software from FoxPro to Oracle platform in phased manner. However, the tenders for upgradation in 10 depots under Phase I was called for only in December 2002 and the orders were placed on M/s Broadline Computer Systems in March 2004 for supply of both hardware and software. This upgradation was completed in March 2005, after a delay of 42 months. Similarly, it was decided (April 2004) to upgrade the next 15 depots under Phase II. The orders were placed with M/s HCL for the supply and installation of hardware and M/s Broadline Computer Systems for software as late as in February and April 2007 respectively. The work in Phase II was completed in July 2008 after 51 months, mainly on account of delay in finalisation of tenders coupled with delay in procuring Oracle software. Phase III involving the remaining 16 depots is yet to be taken up and the process of upgradation remains incomplete. This indicated deficient planning and the Company had not laid down any road map and time frame for implementation of the upgradation programme. The Company is still working with dual software. The Company, while admitting (November 2009) the facts, attributed the
Chapter-II Performance Reviews relating to Government companies
79
delay to electrical related problems in depots and administrative delay to comply with the Government guidelines
The reply of the Company could not be accepted as the reasons were known and should have been dealt with even before the planning stage.
Computerisation at SRM Offices
2.3.9 It was envisaged in the agreement (October 1997) with M/s Broadline Computer Systems to develop and implement the software in 37 depots and 5 SRM offices in FoxPro platform. However, it was noticed that no such software was being used in the SRM Offices. There was no connectivity between Depots and SRM Offices (September 2009) also. The payment to M/s Broadline Computer Systems was made in full as there was no price break-up in the agreement for the computerisation component pertaining to SRM offices. In the absence of such software, the SRM Offices are preparing the required reports and forwarding them to Corporate Office in Excel sheets.
The Company, in its reply, stated (August/November 2009) that the FoxPro software was developed and installed at SRM Offices as well but was not in use since the computers had become outdated and necessary steps would be taken for installation of amended software. The reply of the Company is not acceptable as the same lot of computer systems are still working in FoxPro environment in 16 locations identified for Phase III upgradation. Also, test check in the SRM Office at Chennai did not indicate any such software or database having been used.
Continued dependence on software developer
2.3.10 The Company had not formulated any IT Policy and there was no separate wing in the Corporate Office supported by qualified personnel. Further it was noticed that the staff of the Company were not adequately trained to operate and maintain the system. This resulted in over dependence on the software developer and the Company could not ensure accountability for the deficiencies of the software as stated in the following paragraphs.
To overcome the problems faced by the depots, it was decided (June 1998) to deploy one programmer each in five SRM Offices through the software developer to guide and assist the depot staffs in operation of the computerised system for a period of three months. However, the engagement of the seven programmers was still (September 2009) continued. This indicated continued dependence on the software developer even after implementation.
The Company in its reply (August 2009) accepted the fact that it did not have the trained staff to operate the system and hence the dependence on the hired programmers. It is stated that the Company could have trained its staff instead of relying upon an outsider for its day-to-day operations for more than 11 years.
Connectivity between the Company and the Administrative Department
2.3.11 In order to modernise the excise administration, inter-connectivity between the Prohibition and Excise Department (P&E) and Company was considered essential. Hence a comprehensive plan of networking was
There was no connectivity of software between depots and SRM offices.
Audit Report (Commercial) for the year ended 31 March 2009
80
prepared in 2002. A payment of Rs.4.54 lakh was also made to M/s Broadline Computer Systems for developing software for inter-connectivity as well as for MIS purposes between the Company and the P&E Department at Secretariat along with tele-conferencing facility.
However, it was seen that there was no trace in the system for installation of such MIS software and the inter-connectivity was not supported by any data transmission during these years. In this context, it was also noticed that for this purpose, one programmer and one data entry operator were deputed to P&E Department (through outsourcing) by the Company from August 2002 onwards and the entire salary of these personnel was borne by the Company. In the absence of connectivity and flow of data from the Company to the department and vice versa for MIS purposes, the deployment of two personnel at P&E Department and payment of Rs.2.40 lakh annually from August 2002 by the Company lacked justification. Necessary action is to be taken for either establishing the connectivity or the Company should withdraw such support through outsourced personnel.
The Company stated (November 2009) that the payment to the software developer was not made for this purpose. The reply was, however, factually incorrect as the payment in this regard was made in two instalments of Rs.2.27 lakh each on 29.7.2002 and 9.1.2003 apart from incurring Rs.2.40 lakh annually for the outsourced personnel.
System Design
2.3.12 Deficiencies in the software design leading to manual interventions by-passing the ‘Godown Monitoring System (GMS)’ were noticed in the following cases:
Mapping of Accounting Policy
2.3.13 To support the accounting policy relating to inventory management on first in and first out, the batch number and date of manufacture must be entered at the receipt point in Goods Receipt Acknowledgement (GRA)22 and at the selling point (Invoices to Clubs and Hotels /Stock transfer invoices to retail vending shops). However, it was observed that:
• GRA module had a provision to capture details of only one batch for an item. It could not do so if there were multiple batches for a particular item.
• the sale invoices do not have the provision to capture the batch details as well as GRA Numbers
This indicated improper mapping of business processes. In the absence of this, the age wise inventory, demurrage collectable on stock over 90 days, sediment stock, if any, were not ascertainable through the system.
The Company (November 2009) stated that action would be taken to feed batch details in the system. Further, it stated that FIFO system is adopted in respect of physical movement of stock. However, the same could not be
2 Primary document to account for the receipt of goods at depots.
The software did not have the provision to capture the details of multiple batches of Goods receipt and despatch.
Chapter-II Performance Reviews relating to Government companies
81
substantiated through the system in the absence of GRA numbers and Batch numbers of the product in the invoices.
Lab report
2.3.14 As a part of Quality Monitoring System, the software was designed to capture the details of Quality Report either from the local Suppliers or the Government Lab in case of import of IMFL from other states/countries. It was seen that these details were not captured in the system. An attempt was made by audit to enter the relevant data in the system and the system showed “Run Time Error” which indicated bugs in the software. Due to this deficiency, the users could not make any entry in this regard.
The Company, in its reply (November 2009), stated that all the consignments were subjected to lab test at supplier’s point. It is, however, suggested that this fact may further be substantiated through a proper entry in the database, as envisaged, to ensure quality monitoring through the system.
Mapping of Tax Laws
2.3.15 As per the section 206C read with section 288B of Income Tax Act, the Company has to collect tax on sale of liquor to clubs and hotels and any amount payable under this Act should be rounded off to the nearest multiple of ten rupees.
It was, however, observed that the software rounded off the tax component to the next higher rupee instead of to the nearest multiple of ten rupees indicating incorrect mapping of tax laws in the software. This has resulted in excess collection of Rs. 91,753 through 25,896 invoices and short collection of Rs.22,138 through 11,446 invoices during the years 2007-08 to 2008-09 and the net amount has been remitted to the Income Tax Department.
The Company, while admitting the observation, stated (November 2009) that the software would be suitably modified.
Linking of Master Stock Register with Physical Verification module
2.3.16 The Closing stock at the end of the each day is generated through Master Stock Register (MSR). This has been linked with Physical Verification Excess Entry Module (PVEEM) as opening stock of the next day. Further, the PVEEM has an edit option whereby the excess stock found on physical verification, if any, could be accounted by directly updating the stock in the MSR. The software system design as stated above is not correct to ensure the independence in physical verification. This indicated deficiency in the system design. Incidentally, an attempt was made in audit to overwrite the opening stock through PVEEM and the system accepted the entry, thereby, indicating the possibility of tampering with the records in MSR.
Input Controls and validation checks
2.3.17 Input controls and validation checks ensure the completeness, accuracy and reliability of the data. The deficiencies in this regard are detailed below.
The software has an edit option to account for the excess stock of physical verification into the master stock register defeating the independence of physical verification.
Audit Report (Commercial) for the year ended 31 March 2009
82
Continuity in system generated numbers
2.3.18 The Indent numbers, GRA numbers and Invoice numbers were generated through the system automatically and hence the continuity of the numbers was required to be ensured. Data analysis showed that there was no continuity in such numbers during the years 2006-07 to 2008-09 as detailed below.
Name of the document No. of gaps Missing numbers
INDENTS 174 224
GRA 1,270 1,464
INVOICE 3,287 6,610
Apparently these were cancelled. There was no audit trail to watch the reason for such cancellation and no system was in place to prepare exception report to watch the correctness for such cancellation.
On this being pointed out, the Company stated that (November 2009) missing Indents/GRA/Invoices were due to the system failure and data entry error during preparation of invoices. It further stated that suitable instructions would be given to minimise the cancellation and also record the reasons thereon in the log book maintained for the purpose.
It is suggested that instead of resorting to cancellation and removal of the defective entries suitable indicators or flags may be added to such records by recording reasons thereon to have a fair audit trail through the system.
Breakage Loss
2.3.19 Losses due to breakages while handling the goods in the depot were collected from the contractors on real time basis. However, it was observed that the Company was accounting the breakage loss on ad-hoc basis. It is evident from the illustrative case mentioned below:
In a depot33, 600 cases of Day Night Brandy-Medium-180ml were taken into stock account through GRA No.G01047067 dated 08.11.2005. Being a fast moving item, the product was procured on 66 occasions between November 2005 and July 2007 and issues were made during the period in various lot quantities. However, 205 bottles, that broke while handling on various occasions (69 events) during the same period, were treated as “Breakage Loss” against the goods received on the above mentioned GRA which was dated in November 2005.
The Company admitted the fact (November 2009) and stated that the selection of GRA is optional and the data entry operator selected this GRA by mistake for the loss of same brand/pack size. This clearly indicated the deficient input control for the data (though optional) entered into the system while accounting for breakages.
3 Ambattur-I Depot
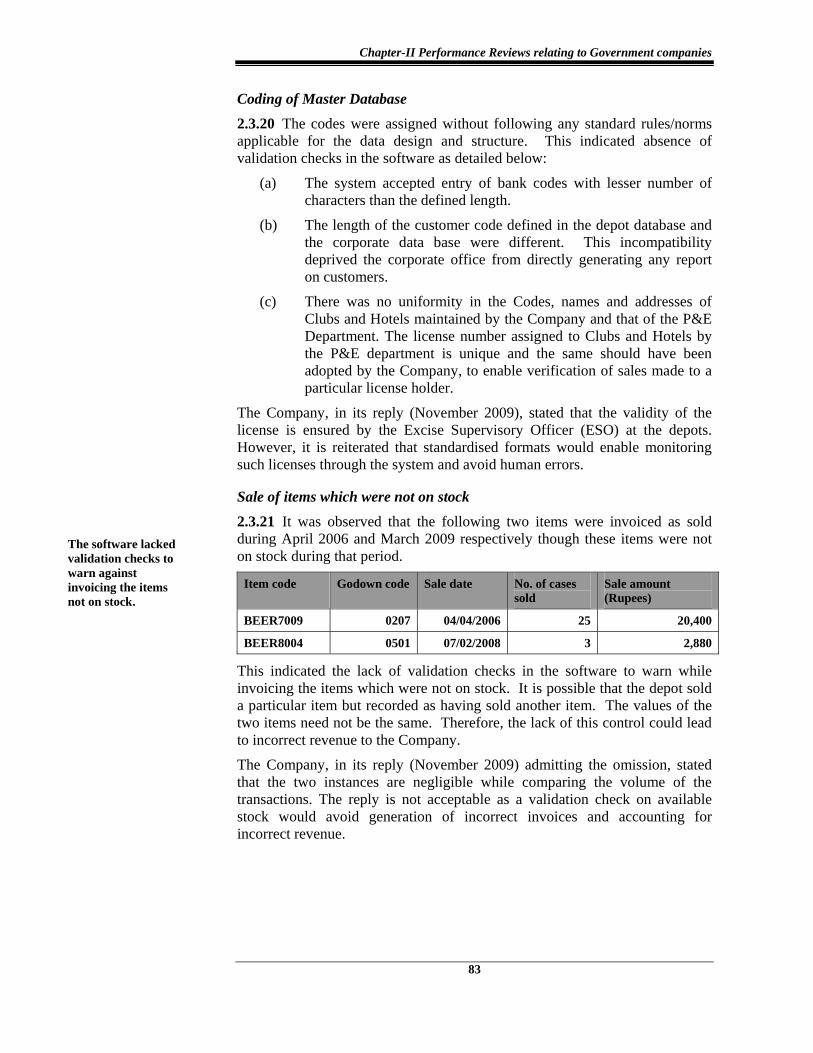
Chapter-II Performance Reviews relating to Government companies
83
Coding of Master Database
2.3.20 The codes were assigned without following any standard rules/norms applicable for the data design and structure. This indicated absence of validation checks in the software as detailed below:
(a) The system accepted entry of bank codes with lesser number of characters than the defined length.
(b) The length of the customer code defined in the depot database and the corporate data base were different. This incompatibility deprived the corporate office from directly generating any report on customers.
(c) There was no uniformity in the Codes, names and addresses of Clubs and Hotels maintained by the Company and that of the P&E Department. The license number assigned to Clubs and Hotels by the P&E department is unique and the same should have been adopted by the Company, to enable verification of sales made to a particular license holder.
The Company, in its reply (November 2009), stated that the validity of the license is ensured by the Excise Supervisory Officer (ESO) at the depots. However, it is reiterated that standardised formats would enable monitoring such licenses through the system and avoid human errors.
Sale of items which were not on stock
2.3.21 It was observed that the following two items were invoiced as sold during April 2006 and March 2009 respectively though these items were not on stock during that period.
Item code Godown code Sale date No. of cases sold
Sale amount (Rupees)
BEER7009 0207 04/04/2006 25 20,400
BEER8004 0501 07/02/2008 3 2,880
This indicated the lack of validation checks in the software to warn while invoicing the items which were not on stock. It is possible that the depot sold a particular item but recorded as having sold another item. The values of the two items need not be the same. Therefore, the lack of this control could lead to incorrect revenue to the Company.
The Company, in its reply (November 2009) admitting the omission, stated that the two instances are negligible while comparing the volume of the transactions. The reply is not acceptable as a validation check on available stock would avoid generation of incorrect invoices and accounting for incorrect revenue.
The software lacked validation checks to warn against invoicing the items not on stock.
Audit Report (Commercial) for the year ended 31 March 2009
84
Sales to the customers without verifying validity of licences
2.3.22 Invoices to the customers44 were generated through the Retail Invoice Module by linking with the customer details. During data analysis in the Chennai Region, it was observed that invoices were issued to 76 customers flagged as “Inactive” during the period from April 2006 to January 2009. Test check (September 2009) revealed that system generated invoice for a closed shop. This indicated absence of necessary validation checks. Further analysis showed that the details of renewal of licences had not been updated in the system.
The Company, in its reply (November 2009) admitting the fact, stated that it would modify the software suitably to give alert message while generating the invoices against expired licenses/ closed retail vending shops.
Bypassing the System Controls
Transport Permit
2.3.23 As per the extant rules, liquor cannot be transported without a proper transport permit indicating the quantity and item of liquor. Further, as per the procedure in vogue, only one invoice should be raised per customer per day. Hence, the software was designed in such a way that only one transport permit can be generated for one shop against one invoice on the same day. It was, however, observed that the system allowed generation of more than one invoice per retail vending shop on a given day indicating deficient business mapping.
In view of this, if more than one invoice was prepared as stated above, the quantities relating to second invoice were being written manually in the transport permit already generated by the system.
During data analysis of depots in Chennai Region for the years 2006-07 to 2008-09, it was found that in 22,490 out of 2,19,396 cases, no separate transport permits were issued through the system for the goods sent from the depots to Retail Vending Shops.
The Company, in its reply, admitted the omission and stated (November 2009) that such controls would be strictly implemented in future.
Output Controls
Vehicle unloading Report
2.3.24 In order to monitor the unloading process at the depots of the goods received from the suppliers, a report is generated through the system on daily basis. A review of the report revealed the following deficiencies:
(a) The space for displaying the vehicle number in the report was insufficient and as a result the vehicle numbers were not displayed correctly.
4 Retail Vending Shops, Clubs and Hotels
Data on renewal of licences had not been updated in the system.
Chapter-II Performance Reviews relating to Government companies
85
(b) The time taken to unload was indicated incorrectly. For instance, the time taken for unloading is shown as 4.80 hours instead of 2 hours in respect of a unloading that commenced at 17.00 hours and ended at 19.00 hours,
(c) The goods unloaded from one vehicle were clubbed with another vehicle resulting in incorrect report generation.
Thus this report could not be utilised for effective monitoring of the waiting time for each vehicle and the efficiency in unloading and reconciliation of stocks received supplier wise.
The Company admitted (November 2009) the facts and stated that it would carry out the necessary correction in the software.
Other Reports
2.3.25 The following discrepancies were also noticed.
(a) The dates in the report for monitoring the collection details from the licensee were incorrectly displayed. i.e., date “10/02/2008” in the format ‘dd/mm/yyyy’ was displayed as 2 October 2008 in the report.
(b) Totalling errors were noticed occasionally in exhibiting grand total while generating stock transfer invoices which were corrected later on by taking duplicate copies of invoices.
This clearly indicated lacunae in the output controls and required modifications in the present software. The Company, in its reply (November 2009), stated that the software would be modified accordingly.
Other Deficiencies
Comparison with annual accounts figures
2.3.26 In the GMS software, while receiving the goods at godowns, Goods Received Acknowledgement (GRA) was generated with the name of the supplier, indent number, invoice number, quantity received in good condition, etc. The payments to suppliers were processed based on this document. The total quantity purchased as per the system was compared with figures shown in the annual accounts for the years 2006-07 to 2008-09. The following differences were noticed in each year as detailed below which were yet to be reconciled.
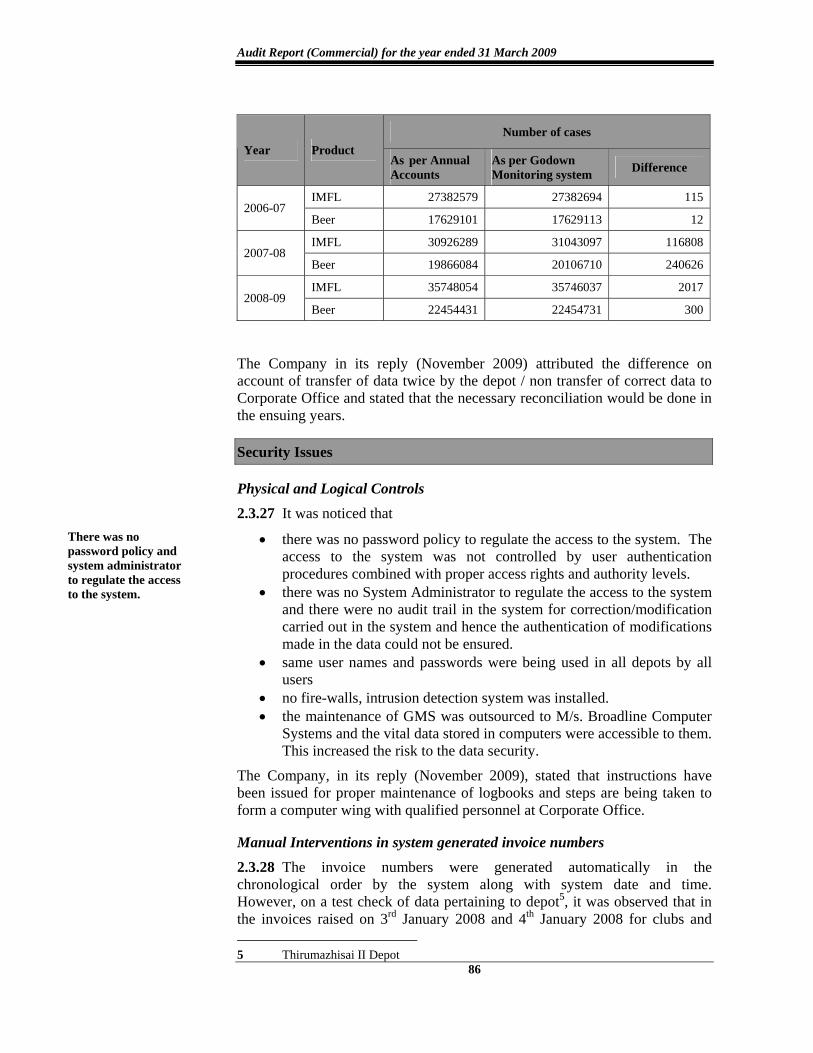
Audit Report (Commercial) for the year ended 31 March 2009
86
Number of cases Year Product
As per Annual Accounts
As per Godown Monitoring system Difference
IMFL 27382579 27382694 115 2006-07
Beer 17629101 17629113 12
IMFL 30926289 31043097 116808 2007-08
Beer 19866084 20106710 240626
IMFL 35748054 35746037 2017 2008-09
Beer 22454431 22454731 300
The Company in its reply (November 2009) attributed the difference on account of transfer of data twice by the depot / non transfer of correct data to Corporate Office and stated that the necessary reconciliation would be done in the ensuing years.
Security Issues
Physical and Logical Controls
2.3.27 It was noticed that
• there was no password policy to regulate the access to the system. The access to the system was not controlled by user authentication procedures combined with proper access rights and authority levels.
• there was no System Administrator to regulate the access to the system and there were no audit trail in the system for correction/modification carried out in the system and hence the authentication of modifications made in the data could not be ensured.
• same user names and passwords were being used in all depots by all users
• no fire-walls, intrusion detection system was installed. • the maintenance of GMS was outsourced to M/s. Broadline Computer
Systems and the vital data stored in computers were accessible to them. This increased the risk to the data security.
The Company, in its reply (November 2009), stated that instructions have been issued for proper maintenance of logbooks and steps are being taken to form a computer wing with qualified personnel at Corporate Office.
Manual Interventions in system generated invoice numbers
2.3.28 The invoice numbers were generated automatically in the chronological order by the system along with system date and time. However, on a test check of data pertaining to depot55, it was observed that in the invoices raised on 3rd January 2008 and 4th January 2008 for clubs and 5 Thirumazhisai II Depot
There was no password policy and system administrator to regulate the access to the system.
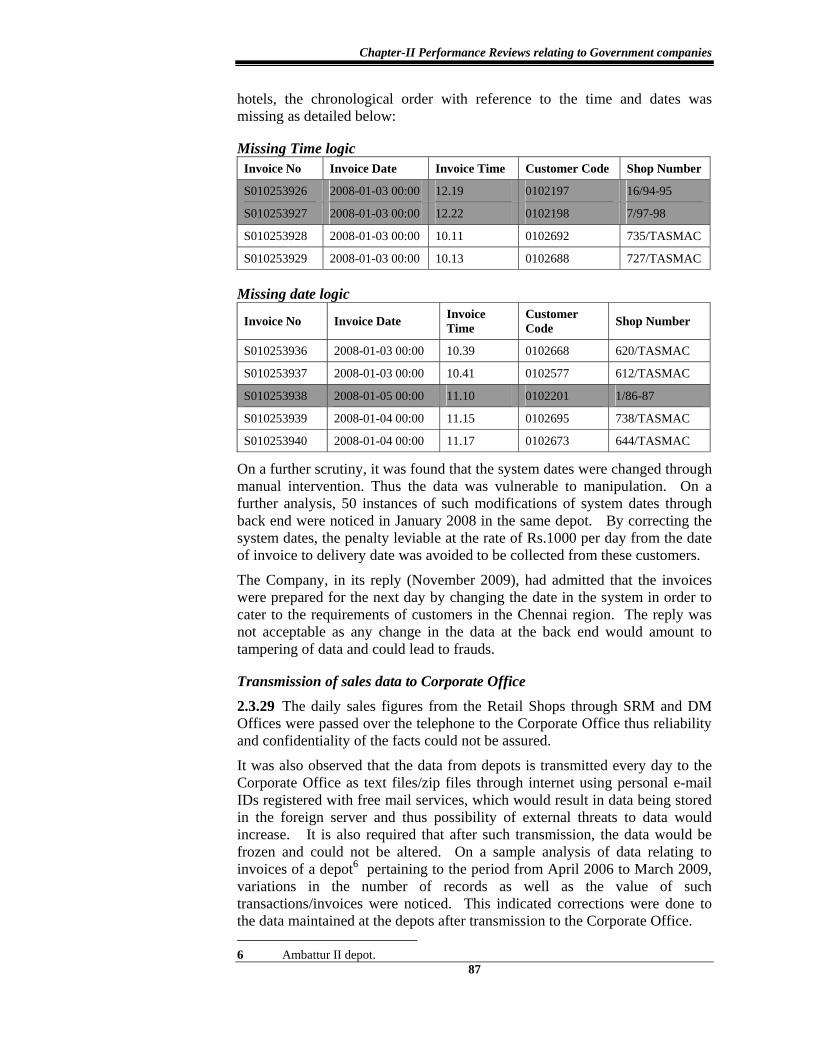
Chapter-II Performance Reviews relating to Government companies
87
hotels, the chronological order with reference to the time and dates was missing as detailed below:
Missing Time logic Invoice No Invoice Date Invoice Time Customer Code Shop Number
S010253926 2008-01-03 00:00 12.19 0102197 16/94-95
S010253927 2008-01-03 00:00 12.22 0102198 7/97-98
S010253928 2008-01-03 00:00 10.11 0102692 735/TASMAC
S010253929 2008-01-03 00:00 10.13 0102688 727/TASMAC
Missing date logic
Invoice No Invoice Date Invoice Time
Customer Code Shop Number
S010253936 2008-01-03 00:00 10.39 0102668 620/TASMAC
S010253937 2008-01-03 00:00 10.41 0102577 612/TASMAC
S010253938 2008-01-05 00:00 11.10 0102201 1/86-87
S010253939 2008-01-04 00:00 11.15 0102695 738/TASMAC
S010253940 2008-01-04 00:00 11.17 0102673 644/TASMAC
On a further scrutiny, it was found that the system dates were changed through manual intervention. Thus the data was vulnerable to manipulation. On a further analysis, 50 instances of such modifications of system dates through back end were noticed in January 2008 in the same depot. By correcting the system dates, the penalty leviable at the rate of Rs.1000 per day from the date of invoice to delivery date was avoided to be collected from these customers.
The Company, in its reply (November 2009), had admitted that the invoices were prepared for the next day by changing the date in the system in order to cater to the requirements of customers in the Chennai region. The reply was not acceptable as any change in the data at the back end would amount to tampering of data and could lead to frauds.
Transmission of sales data to Corporate Office
2.3.29 The daily sales figures from the Retail Shops through SRM and DM Offices were passed over the telephone to the Corporate Office thus reliability and confidentiality of the facts could not be assured.
It was also observed that the data from depots is transmitted every day to the Corporate Office as text files/zip files through internet using personal e-mail IDs registered with free mail services, which would result in data being stored in the foreign server and thus possibility of external threats to data would increase. It is also required that after such transmission, the data would be frozen and could not be altered. On a sample analysis of data relating to invoices of a depot66 pertaining to the period from April 2006 to March 2009, variations in the number of records as well as the value of such transactions/invoices were noticed. This indicated corrections were done to the data maintained at the depots after transmission to the Corporate Office. 6 Ambattur II depot.
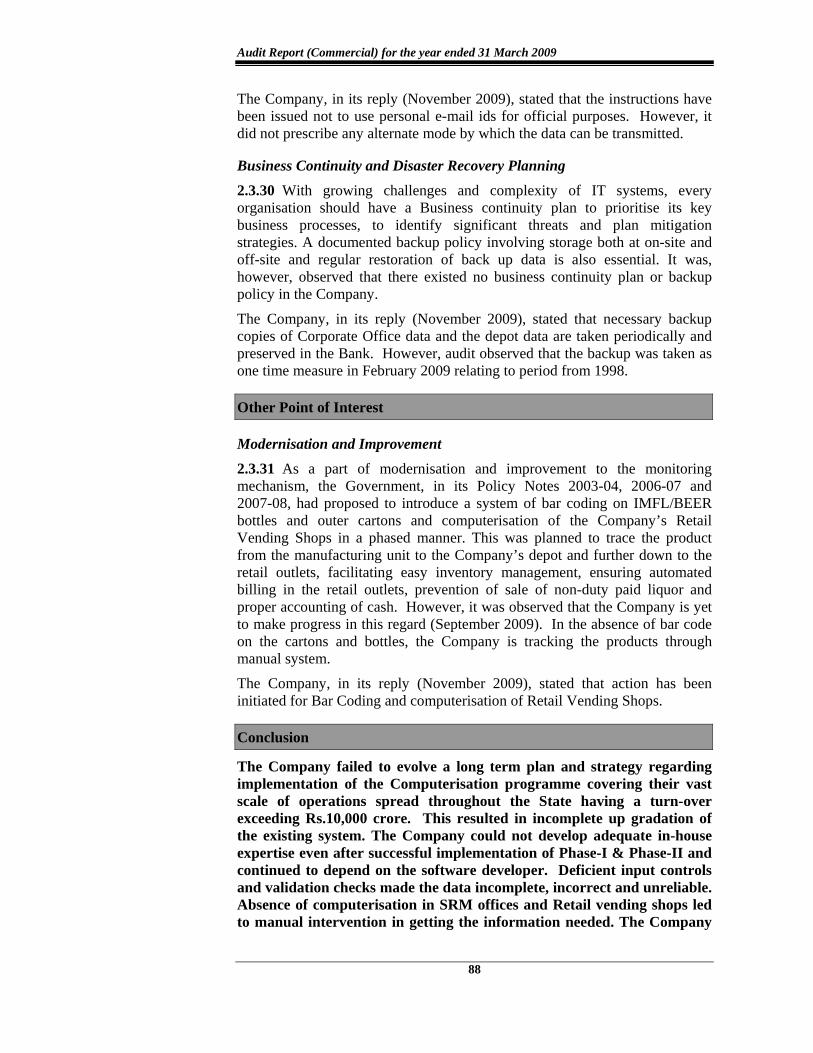
Audit Report (Commercial) for the year ended 31 March 2009
88
The Company, in its reply (November 2009), stated that the instructions have been issued not to use personal e-mail ids for official purposes. However, it did not prescribe any alternate mode by which the data can be transmitted.
Business Continuity and Disaster Recovery Planning
2.3.30 With growing challenges and complexity of IT systems, every organisation should have a Business continuity plan to prioritise its key business processes, to identify significant threats and plan mitigation strategies. A documented backup policy involving storage both at on-site and off-site and regular restoration of back up data is also essential. It was, however, observed that there existed no business continuity plan or backup policy in the Company.
The Company, in its reply (November 2009), stated that necessary backup copies of Corporate Office data and the depot data are taken periodically and preserved in the Bank. However, audit observed that the backup was taken as one time measure in February 2009 relating to period from 1998.
Other Point of Interest
Modernisation and Improvement
2.3.31 As a part of modernisation and improvement to the monitoring mechanism, the Government, in its Policy Notes 2003-04, 2006-07 and 2007-08, had proposed to introduce a system of bar coding on IMFL/BEER bottles and outer cartons and computerisation of the Company’s Retail Vending Shops in a phased manner. This was planned to trace the product from the manufacturing unit to the Company’s depot and further down to the retail outlets, facilitating easy inventory management, ensuring automated billing in the retail outlets, prevention of sale of non-duty paid liquor and proper accounting of cash. However, it was observed that the Company is yet to make progress in this regard (September 2009). In the absence of bar code on the cartons and bottles, the Company is tracking the products through manual system.
The Company, in its reply (November 2009), stated that action has been initiated for Bar Coding and computerisation of Retail Vending Shops.
Conclusion
The Company failed to evolve a long term plan and strategy regarding implementation of the Computerisation programme covering their vast scale of operations spread throughout the State having a turn-over exceeding Rs.10,000 crore. This resulted in incomplete up gradation of the existing system. The Company could not develop adequate in-house expertise even after successful implementation of Phase-I & Phase-II and continued to depend on the software developer. Deficient input controls and validation checks made the data incomplete, incorrect and unreliable. Absence of computerisation in SRM offices and Retail vending shops led to manual intervention in getting the information needed. The Company
Chapter-II Performance Reviews relating to Government companies
89
had failed to attach due importance to the data security and update the software, wherever malfunctions were noticed.
The Company, in its reply (November 2009) stated that the software is being updated as and when required and as a long term plan the Company would like to have a separate computer section with priority on data security. The Company also desired to take guidance from Audit on its future computerisation projects.
Recommendations
The Company should
• implement uniform software in all its 41 locations • computerise the SRM & DM Offices & Retail Vending Shops • build in necessary input and validation checks to ensure the
completeness, correctness and reliability of the data • develop in-house expertise to maintain the system • take necessary action to protect the privacy and confidentiality of
transfer of data through email • lay down well documented Business Continuity and Disaster Plan
Considering the volume and value of the transactions and to achieve its mission, goals and objectives effectively, the Company may consider an integrated system for their IT environment.