Do Joint Audits Improve Audit Quality? Evidence from Voluntary Joint Audits
Upload
khangminh22Category
view
0download
0
Chapter II – Performance Audit
17
Performance Audits
2.1 Promotion and Development of Micro, Small and Medium
Enterprises in Kerala
Executive Summary
Introduction
In Kerala, there were 2.57 lakh registered Micro, Small and Medium
Enterprises (MSMEs) as of September 2015, with total investment of
`17,986.46 crore and during 2014-15, MSMEs produced goods and services
worth `7,119.75 crore, which accounted for 1.37 per cent of the Gross State
Domestic Product. The total employment generated up to September 2015
was 13.19 lakh.
Implementation of policies and plans by Government of Kerala (GoK)
Measures outlined in the Industrial Policy, 2007 though not implemented were
not included in the amended Policy (2015). Compared to neighbouring States,
the industrial policy of Kerala fared poorly in terms of inclusion of specific
provisions. Average utilisation of amounts allocated in the budgets of
Directorate of Industries and Commerce (DI&C) for MSME development
programmes was 70.43 per cent. Rehabilitation package as recommended by
Government of India (GoI) was not implemented.
Promotion and Development programmes
Financial support
Kerala Financial Corporation (KFC) and Kerala State Industrial
Development Corporation Limited (KSIDC) could provide finance to a very
low number of MSMEs only. Rate of interest charged by KFC on loans to
MSME sector was high when compared to other State Financial Corporations
and commercial banks. Schemes for providing financial support to MSMEs
such as Interest Subvention Scheme, Receivable Finance Scheme and Kerala
State Entrepreneur Development Mission could not be implemented
successfully. Only 6.48 per cent of new MSMEs availed of the Entrepreneur
Support Scheme (ESS) of the DI&C due to exclusion of service sector and
complex documentation required. There were irregularities in the
implementation of the ESS as well.
Infrastructure Development
Delay in completion of multi-storeyed industrial estates deprived MSMEs of
much needed infrastructure. Progress achieved in establishing Common
Facility Centres under Micro and Small Enterprises-Cluster Development
Programme was negligible. Parks established by Kerala Industrial
Infrastructure Development Corporation (KINFRA) remained unutilised.
Actual utilisation of developed land in the Industrial Growth Centres
established by KSIDC was only 41.25 per cent. Scheme for modernisation of
infrastructure in Development Areas/ Development Plots under DI&C with
assistance of GoI remained unimplemented. The quality of infrastructure
CHAPTER II

Audit Report No.4 (PSUs) for the year ended 31 March 2016
18
provided in the industrial estates/ parks under Kerala Small Industries
Development Corporation Limited was not satisfactory.
Facilitation Services
The Single Window Clearance scheme instituted for ensuring speedy issue of
clearances required for establishing industrial units was not effective.
Marketing Support
Statutory provision regarding purchase of 20 per cent of requirements of
goods/ services from MSMEs was not being complied with by the State PSUs/
Departments/ Government agencies, etc. Effectiveness of the expenditure
incurred out of Government funds for conducting/participating in
fairs/exhibitions for marketing MSME products was not assessed.
Findings of beneficiary survey
Majority of MSMEs who participated in a beneficiary survey conducted by
Audit reported that they were not aided by the Single Window mechanism for
obtaining necessary clearances. They also responded that they were not
provided technical assistance such as assistance in preparing project reports,
training in skill development/ entrepreneurship, help in tiding over financial
crisis, quality raw material or marketing assistance. The quality of
infrastructure, especially roads and security in Industrial Parks/ Estates, etc.,
was also reported to be inadequate.
Introduction
2.1.1 According to the Micro, Small and Medium Enterprises, Development
Act, 2006 (MSME Act), Micro, Small and Medium Enterprises (MSMEs) are
classified as under:
Table 2.1: Criteria for classification of MSMEs.
Enterprise
(Type)
Investment in Plant and Machinery/ Investment in Equipment
Manufacturing Service
Micro Up to `25 lakh Up to `10 lakh
Small Above `25 lakh up to `5 crore Above `10 lakh up to `2 crore
Medium Above `5 crore up to `10 crore Above `2 crore up to `5 crore
In Kerala, there were 2.57 lakh registered MSMEs as of September 20151, all
promoted by individual investors/ firms in the private sector. Out of the total
Small Scale Industries/MSMEs, 3.84 per cent were promoted by entrepreneurs
belonging to Scheduled Castes, 0.72 per cent by Scheduled Tribes and 24.97
per cent by women entrepreneurs. The total investment in these 2.57 lakh
MSMEs was `17,986.46 crore. During 2014-15, these MSMEs produced
goods and services worth `7,119.75 crore which accounted for 1.37 per cent
of the Gross State Domestic Product. The total employment generated up to
September 2015 was 13.19 lakh (Source: Economic Review, 2016 published
by State Planning Board, GoK).
1 Figures as at 17 September 2015 have been taken since after September 2015, the filing of Entrepreneur‟s
Memorandum II (EMII) by newly registered MSMEs has been abolished and Udyog Aadhar Memorandum
(UAM) made mandatory for all (new and existing) MSMEs.

Chapter II – Performance Audit
19
Agencies involved in promotion of MSMEs in Kerala
2.1.2 Department of Industries, GoK formulates the industrial policy for
promotion and development of MSMEs. Schemes and projects for promotion
and development of MSMEs in the State are implemented by the Directorate
of Industries & Commerce (DI&C) and Public Sector Undertakings (PSUs) set
up with this objective.
One of the main objectives of the Kerala Industrial and Commercial Policy,
2015 was mobilising MSMEs, particularly in rural areas, to achieve
employment generation and utilisation of local resources. Kerala State
Industrial Development Corporation Limited (KSIDC), Kerala Small
Industries Development Corporation Limited (SIDCO), Kerala Financial
Corporation (KFC) and Kerala Industrial Infrastructure Development
Corporation (KINFRA) played major roles in the promotion and development
of medium and small scale industries in Kerala. While KFC and KSIDC were
primarily concerned with providing financial support in the form of equity
participation, term loans, working capital loans, etc., KINFRA and SIDCO
provided infrastructure and marketing support.
Other Government agencies involved in the promotion and development of
MSMEs were Kerala Bureau of Industrial Promotion (KBIP), Kerala
Academy for Skills Excellence, Kerala Institute for Entrepreneurship
Development, etc., as detailed in Appendix 3.
Audit Objectives
2.1.3 The main objectives of the Performance Audit were to assess whether:
policy for promotion and development of MSME sector in the State
was implemented effectively;
the activities of Government Departments/agencies and PSUs in
financing, protecting and promoting the interest of MSMEs in the
State were adequate, efficient and effective; and
the MSMEs promoted/ assisted by the Government Departments/
agencies and PSUs were functioning efficiently and contributing
significantly to the economic and industrial development of the State.
Audit Criteria
2.1.4 The following criteria were adopted for the Performance Audit:
• State Industrial and Commercial Policy, 2007, amended in 2015;
• Micro, Small and Medium Enterprises Development Act, 2006 of
Government of India (GoI);
• Guidelines issued by Central/ State Governments for various Schemes;
• Government Orders and Circulars;
• Memorandum and Articles of Association of the PSUs;
• Policies/ Plans/ Schemes formulated by PSUs;
• Best practices/ policies on MSMEs followed by other States;

Audit Report No.4 (PSUs) for the year ended 31 March 2016
20
• Norms of Reserve Bank of India on raising public finance by State
Financial Corporations;
• Stores Purchase Manual of GoK; and
• Guidelines of Central Vigilance Commission.
Scope and Methodology
2.1.5 The Performance Audit was conducted to assess effectiveness of
various activities, schemes and measures undertaken by GoK through its
functional arms, the DI&C and four PSUs (KSIDC, KFC, KINFRA and
SIDCO), for promotion and development of MSMEs in the State during the
five year period from 2011-12 to 2015-16.
Four2 out of fourteen District Industries Centres
3 (DICs) under the DI&C were
selected through random sampling for detailed scrutiny. With respect to KFC,
out of 5,268 units to whom loans were disbursed during 2011-12 to 2015-16,
1,054 (20 per cent) were selected on random basis for detailed review. In the
case of SIDCO, 8 (out of 14) Industrial Estates (IE) and 6 (out of 36) Mini
Industrial Estates were selected for joint inspection. Three out of ten Industrial
Parks developed by KINFRA and all three Industrial Growth Centres
promoted by KSIDC were inspected jointly.
A beneficiary survey amongst MSMEs located in IEs/ Industrial Parks of
GoK/ PSUs was conducted using the questionnaire method for evaluating the
effectiveness of the Government‟s initiatives in promotion and development of
MSMEs.
The Performance Audit commenced with an Entry Meeting held on 9 May
2016 which was attended by Additional Secretary, Industries Department,
GoK and the Managing Director, SIDCO. KFC was represented by Deputy
General Manager, KSIDC by Deputy Manager and KINFRA by Manager
(Technical).
The findings of the Performance Audit were issued to GoK and the PSUs in
October 2016. Audit findings were also discussed with Special Secretary,
Industries Department, GoK and Senior Management of the PSUs in an Exit
Conference held on 8 November 2016.
Reply of GoK to the audit findings was received in March 2017. Views
expressed by them have been duly considered while finalising the Report.
Audit Findings
2.1.6 The number of MSMEs registered annually in the country increased
from 2.82 lakh in 2011-12 to 4.25 lakh in 2014-15, rate of growth in
registration being 50.71 per cent. In Kerala, number of MSMEs registered had
increased from 0.11 lakh in 2011-12 to 0.15 lakh in 2014-15 with a rate of
2 Kottayam, Pathanamthitta, Palakkad and Kozhikode. 3 DICs are the functional units of the DI&C and operate at district level to promote and develop industrial
units.

Chapter II – Performance Audit
21
growth of 36.36 per cent. As per the fourth All India Census (2006-074) on
MSMEs, 26 per cent of registered MSMEs in Kerala had either closed down
or were non-traceable. This was mainly due to ineffective implementation of
policy on the part of GoK and absence of financial, infrastructural and
marketing assistance as discussed in succeeding paragraphs.
Implementation of policies and plans by Government of Kerala
2.1.7 The primary responsibility for promotion and development of MSMEs
rests with the State Governments. GoI, through various initiatives,
supplements efforts of the State Governments in encouraging entrepreneurship
and employment generation. GoK is responsible for formulating appropriate
policies and plans for the promotion and development of MSMEs in the State.
We noticed lapses in implementation of policies and plans on the part of GoK
in this regard as discussed below.
Non-implementation of initiatives outlined in GoK‟s Industrial Policy 2.1.7.1 With a view to achieving rapid strides in industrialisation and to make
Kerala a favoured destination for manufacturing, GoK suggested a slew of
measures in its Industrial and Commercial Policy, 2007. The Industrial policy
also contained many initiatives for the development of MSME sector. The
status of implementation of these initiatives is tabulated in Table 2.2.
Table 2.2: Status of implementation of State Industrial Policy
Sl.No. Objectives Status of implementation
1 Strengthening the DICs for enterprise
development in MSMEs.
Partially implemented by providing
infrastructure to DICs.
2
Promoting MSMEs by using the funds from
the decentralised plan devolved to the Local
Self Government Institutions.
Not implemented
3 Utilising unused land of Local Self
Government Institutions. Not implemented
4
Supporting SSI Units giving price preference,
exemption from EMD/ Security Deposit with
specific conditions.
Implemented
5
Providing all help and support to
entrepreneurs who seek financial assistance
from banks and other financial agencies.
Partially implemented by introducing
Kerala State Entrepreneur
Development Mission through KFC.
6
Mobilising MSMEs particularly in rural areas
to achieve employment generation and
utilisation of local resources.
No specific scheme drawn up or
implemented.
As can be seen from Table 2.2 above, the State Government only partially
implemented the steps outlined in its Industrial Policy for promotion and
development of MSMEs. The Industrial Policy was amended and re-notified
in 2015, the significant new measures included for promoting MSMEs being
the following:
4 Published in May 2011 by the Ministry of MSME, GoI.
Audit Report No.4 (PSUs) for the year ended 31 March 2016
22
Promoting “Made in Kerala” as an umbrella brand for all sectors.
Upgradation of infrastructure in industrial areas and facilitating “exit”
for industrial units located in such areas.
Setting up an MSME Equity Participation Fund for encouraging
start-ups in KSIDC and KFC.
Facilitation of skilled workers through Employability Centres.
We observed that the measures outlined in the Industrial and Commercial
Policy, 2007 though not implemented were not included in the amended
Policy. No alternate measures were proposed.
GoK replied (March 2017) that the model scheme drafted by the DI&C for
utilising the land available with LSGIs was under consideration.
Non-implementation of Central Schemes for MSMEs
2.1.7.2 Industrial and Commercial Policy, 2007 of GoK envisaged
development of a system to monitor proper and timely implementation of
Central Schemes and to tap maximum Central assistance for the development
of industries and commerce in the State.
Recognising the importance of MSMEs to the overall economic development
of the country, GoI introduced many schemes for development of MSME
sector to be implemented by the State Governments/State Government
Organisations. These schemes included International Co-operation, Assistance
to Training Institutions, Marketing Assistance, Micro & Small Enterprises
Cluster Development Programme (MSE-CDP), Building Awareness on
Intellectual Property Rights, Technology and Quality Upgradation Support to
MSMEs, Capital Goods Scheme, etc., as detailed in Appendix 4. Development
Commissioner (DC), MSME, GoI informed GoK of all Central Schemes.
Awareness campaigns/workshops for Central Schemes were also organised by
the DC, MSME.
We observed that other than MSE-CDP, the DI&C, which was primarily
responsible for promotion and development of MSMEs, had not implemented
any of the above schemes as GoK had not put in place a system for monitoring
the implementation of Central Schemes for MSMSEs in the State. Further, no
proposals were put up by the DI&C to GoK in respect of the schemes. Thus,
MSMEs in the State were deprived of the opportunity provided by GoI for
their development.
GoK while accepting (March 2017) the audit findings, assured that a nodal
agency for tapping assistance under Central Schemes and monitoring their
implementation was being designated.
Industrial policy for promotion and development of MSMEs of GoK
vis-a-vis other States
2.1.7.3 We compared the provisions in the industrial policy of the State for
promotion and development of MSMEs with those of neighbouring States of
Tamil Nadu and Karnataka. The findings are tabulated in Appendix 5.
Chapter II – Performance Audit
23
It can be seen from Appendix 5 that the industrial policies of Tamil Nadu and
Karnataka contained provisions on reservation of land and financial and
marketing assistance for the development of MSME sector. Compared to this,
the industrial policy of Kerala fared poorly in terms of inclusion of specific
provisions. The impact of this was borne out by the comparatively low rate of
increase in the number of new MSMEs registered as depicted in Table 2.3.
Table2.3: Details of average annual increase in MSMEs
State Average annual increase in number of new MSMEs
registered from 2010-11 to 2014-15 (per cent)
Kerala 8.08
Tamil Nadu 25.42
Karnataka 11.80
All India 15.60
GoK replied (March 2017) that the overall growth in number of MSMEs
registered from 2011-12 to 2014-15 was quite significant. The fact, however,
remains that the growth rate of MSMEs in the State was low when compared
to neighbouring States and the national average.
Non-utilisation of budget allocation for schemes for promotion and
development of MSMEs
2.1.7.4 The details of budget allocation and actual utilisation of funds by
DI&C in case of plan schemes is indicated in Table 2.4.
Table2.4: Details of budget allocation and utilisation of funds (` in crore)
2011-12 2012-13 2013-14 2014-15 2015-16 Total
Budget allocation 43.96 59.30 63.94 80.17 112.87 360.24
Actual utilisation
of funds 31.74 50.71 51.51 45.97 73.79 253.72
Surrender 12.22 8.59 12.43 34.20 39.08 106.52
Percentage of
utilisation 72.20 85.51 80.56 57.34 65.38 70.43
Source: Annual Budget and Finance Accounts
It can be observed that out of `360.24 crore allocated in the budgets from
2011-12 to 2015-16, utilisation was only `253.72 crore (70.43 per cent).
Surrender of funds ranged from `8.59 crore (2012-13) to `39.08 crore
(2015-16). Maximum underutilisation was in respect of schemes/ programmes
shown in Table 2.5.

Audit Report No.4 (PSUs) for the year ended 31 March 2016
24
Table 2.5: Scheme wise underutilisation of funds during 2011-12 to 2015-16 (` in crore)
Scheme Budget
allocation Utilisation
Percentage of
utilisation
Improving infrastructure in existing
Development Area/ Development Plots 6.65 3.44 51.73
Construction of multi-storeyed Industrial
Estate 79.30 32.50 40.98
Seed Fund to youth 11.00 0 0
Start-up subsidy for creation of employment
opportunities 4.00 0 0
Employment generation in traditional sector 10.00 2.00 20.00 Source: Annual Budget and Finance Accounts of GoK
We also observed that out of `79.30 crore provided against the scheme
„Construction of multi-storeyed Industrial Estates‟, released amount of `32.50
crore was shown as expenditure in the statements furnished by the DI&C to
GoK. However, `10 crore released (February 2013) for Multi-storeyed IE at
Kochuveli and `7.50 crore released (February 2014) for Multi-storeyed IE at
Puthussery to SIDCO remained unutilised. Thus, incorrect statement was
given to GoK in respect of `17.50 crore.
GoK accepted (March 2017) the audit findings and stated that the Department/
Organisations had been advised to be careful while reporting the expenditure.
The reply was not acceptable as corrective action had not been taken.
Non-commencement of rehabilitation package
2.1.7.5 A Task Force constituted under the chairmanship of the Principal
Secretary to the then Prime Minister to address the issues of the MSME sector
had recommended (January 2010) that State Governments should establish a
rehabilitation cell at the district level, in the DICs, to examine the viability of
sick units in coordination with banks and implement rehabilitation packages in
a time bound manner. The rehabilitation package should comprise, besides
additional lending by banks, of relief and concessions in statutory dues by the
State Governments/autonomous bodies, Power Supply Company, etc.
We observed that implementation of a rehabilitation package was especially
necessary in the State since as per the latest (2006-07) MSME Census, Kerala,
with 21.02 per cent sick MSMEs topped the Indian States. Yet, GoK had not
implemented the above recommendations so far (August 2016). Findings of
the beneficiary survey conducted as part of the Performance Audit revealed
that even though 48 per cent of the units surveyed faced financial crisis at one
time or the other, GoK did not provide any financial help to them to tide over
the crisis.
GoK assured (March 2017) that the matter would be considered while
formulating industrial policy for the MSME sector.
Recommendation No. 1: Industrial policy of the State should be revamped
with specific schemes and provisions for development of MSME sector,

Chapter II – Performance Audit
25
taking cue from the neighbouring States. Central assistance for MSME
Sector schemes should be tapped to the maximum.
Promotion and Development programmes
2.1.8 Growth of MSMEs is dependent on availability of cheap finance, better
Technology and Infrastructure, Marketing & Procurement support and Skill
Development & Training. Role played by GoK and its agencies in making
these available is discussed below.
Financial support
2.1.9 Cheap finance is a crucial input for promoting growth of MSME
sector, in view of its limited access to alternative sources of finance.
According to the Economic Census 20055, about 66.16 per cent of MSMEs in
Kerala were set up with their own finance, about 8.22 per cent by availing
loans from public and private institutions and a meagre 0.60 per cent with the
subsidy received from GoK. The Industrial and Commercial Policy 2007 of
GoK did not, however, include any specific scheme for providing financial
support to MSMEs.
In Kerala, KFC, KSIDC and DI&C were the major agencies financing MSME
sector. We noticed negligible share of GoK and its agencies in financing
MSMEs, improper implementation of financing schemes, etc., as discussed
below.
Share of agencies of GoK in financing MSMEs
2.1.9.1 As per Kerala Enterprise Development Report 2016 prepared by the
Institute of Small Enterprises and Development6 on behalf of DI&C, 92.03 per
cent of the MSMEs in Kerala had not availed any loans from any institution as
of March 2016. Among those that have availed loans, 73.89 per cent depended
on banks for loans while the balance was accounted for by Co-operatives
(10.67 per cent), private money lenders (5.75 per cent) and others7 (9.69 per
cent).
Of all MSMEs that availed loans, percentage of MSMEs that availed loans
from KFC and KSIDC was 0.80 and 0.40 respectively. Details of MSMEs
registered in Kerala from 2011-12 to 2015-16 and the financial assistance
provided by KFC to MSMEs for the period from 2011-12 to 2015-16 is
indicated in Table 2.6.
5 Published by the Ministry of Statistics and Programme Implementation, GoI in June 2006. 6 A Non-Governmental Organisation based in Ernakulam, Kerala. 7 Government departments (2.32 per cent), Kudumbasree (2.13 per cent), Local Self Government Institutions
(1.23 per cent), NGOs (1.18 per cent), KFC (0.8 per cent), KSIDC (0.40 per cent), Kerala State Development
Corporation for Scheduled Caste and Scheduled Tribes Limited (0.24 per cent), NBFC (0.24 per cent) and
others (1.15 per cent).

Audit Report No.4 (PSUs) for the year ended 31 March 2016
26
Table 2.6: Details of funding of MSME by KFC
Year
Annual Registration
of MSMEs
Assistance by
KFC8
Percentage of
assistance by KFC (Number)
2011-12 11,071 462 4.17
2012-13 13,551 309 2.28
2013-14 14,997 864 5.76
2014-15 15,455 1,241 8.03
2015-16 up to September 2015 7,705 1,414 18.35 Source: Annual Reports of KFC and Economic Review, GoK.
Percentage of MSME units set up with the financial assistance of KFC during
the period 2011-12 to 2015-16 ranged from 2.28 per cent to 18.35 per cent.
We noticed deficiencies in the implementation of financing schemes for
MSMEs as discussed below:
According to the Statement of Objects of the State Financial
Corporations Act, 1951, KFC will confine their activities to financing
medium and small scale industrial units. The scanty number of
MSMEs financed by KFC during the five years ended 31 March 2015
indicates that KFC had failed to fulfil its mandate and MSMEs had
been deprived of any substantial capital or financial support from KFC.
We observed that KFC had not carried out any study on the source of
financing for MSME units in the State or to assess the requirements of
the MSME sector for financing at reasonable cost. Such an analysis
would have enabled the Corporation to evolve suitable financial
products to fulfil the mandate for which it was established.
One of the reasons for the reluctance of MSMEs to avail finance from
KFC was the high rate of interest (14.50 per cent) charged by KFC on
loans. This rate was in fact, the highest among 11 State Financial
Corporations (SFCs)9 in the country. The rate charged by KFC (14.50
per cent) for loans to MSMEs was also significantly higher when
compared to that charged by commercial banks10
.
The need for finance at affordable rates was highlighted by the
stakeholders whose feedback was collected before formulating the
Industrial policy. The suggestion was, however, not incorporated in the
Industrial Policy, 2007/2015 or subsequent schemes except in Kerala
State Entrepreneur Development Mission (KSEDM).
8 Includes assistance to existing and newly registered MSMEs. 9 Andhra Pradesh State Financial Corporation (13 per cent), Rajasthan State Financial Corporation (12 per
cent), West Bengal State Financial Corporation (12.75 per cent), Karnataka State Financial Corporation (8 per
cent), Tamil Nadu Industrial Investment Corporation (13.50 per cent), Maharashtra State Financial
Corporation (13 per cent), Madhya Pradesh State Financial Corporation (12.75 per cent), Delhi State Financial
Corporation (12.75 per cent), Orissa State Financial Corporation (13.50 per cent) and Assam State Financial
Corporation (13 per cent). 10 Interest rate in per cent as on 31/3/2016 is given in brackets - State Bank of Travancore (12.35 to 13.85),
Union Bank of India (12.15 to 14.15), Federal Bank (12.12 to 13.62), Canara Bank (12.35 to 15.35).

Chapter II – Performance Audit
27
As per MSME Act, 2006, the maximum investment limit by a
manufacturing organisation in the MSME sector is `10 crore. As per
the provisions of SFC Act, 1951, KFC is authorised to provide
financial assistance to units with individual investment up to `10 crore
only.
During 2011-12 to 2015-16, the total amount of loan disbursed by KFC
was `4,163.46 crore (5,268 loanees). We observed that out of the
above, around 30 per cent (`1,248.01 crore) was given to non-MSMEs.
Further, `833.91 crore were distributed to 119 loanees with individual
investment above `10 crore against the provisions of the SFC Act,
1951. The assisted industrial units were not MSMEs.
Reserve Bank of India (RBI) granted (December 2012) in-principle
approval for accepting public deposits by KFC. In order to comply
with the guidelines of RBI for raising public deposits, KFC should not
have more than 4 per cent gross non-performing assets (NPA) on the
gross loans and advances as per its latest audited balance sheet. Since
the gross NPA of KFC was 19.72 per cent as on 29 February 2016,
KFC did not satisfy the above criterion and could not, therefore, accept
public deposits.
KFC had distributed `1,796.31 crore to the “Restaurant and Shopping
Complex” (1,972 loanees) sector during 2011-12 to 2015-16 without
adequate collateralisation. We observed that 32.75 per cent of the NPA
amount related to units belonging to the Hotel sector which was
affected adversely by closure of bar hotels by GoK in 2015. Since the
collateral security furnished by these units was later found to be of
negligible realisable value, the BoD of KFC decided (December 2015)
to extend special package for clearance of their loan dues. Pre-
dominance of a particular sector in the sanction of loans and non-
ensuring adequate security at the time of loan disbursement led to the
huge NPA percentage and subsequent ineligibility to accept public
deposits. Compared to KFC‟s weighted average cost of borrowing of
10.31 per cent and 9.72 per cent respectively during 2014-15 and
2015-16, the standard rate of interest for term deposits (3 to 5 years‟
maturity) was 7.63 per cent only for the above period. Thus, the
MSME sector lost the opportunity of obtaining finance at lower cost
from KFC.
GoK stated (March 2017) that the interest rates charged by KFC
depended on its borrowing costs. It was also stated that KFC is
adhering to the provisions of the SFC Act. The reply was not tenable as
it did not address the specific issues pointed out by Audit.
Implementation of State schemes for financing MSMEs
2.1.9.2 The schemes implemented by the State Government/ PSUs for
providing financial support by way of loans/subsidy to MSMEs are given in
Table 2.7.

Audit Report No.4 (PSUs) for the year ended 31 March 2016
28
Table 2.7: Schemes for providing financial support to MSMEs
Scheme Agency Budget outlay for the scheme
Sanctioned
amount
(` in crore)
Number of
MSMEs
benefitted
KSEDM KFC Not Available 190.46 1,714
Interest Subvention
Scheme KFC
The financial commitment of the
scheme was `300 crore for the
two years 2013-14 and 2014-15.
6.64 8
Receivable Finance
Scheme KFC Nil Nil Nil
Entrepreneur Support
Scheme DI&C `121.04 crore 114.56 3,352
Issues noticed in implementation of these financing schemes are discussed
below:
Interest subvention scheme
2.1.9.3 Interest subvention scheme was introduced in 2013-14 to provide
technological and financial support to youths from project report to
production. Assistance was available in areas such as food processing,
information technology, apparels, handicrafts, presentation articles, agro
processing, fish processing and packaging based on innovative technologies
developed by research institutions functioning under the auspices of Central
and State Government in Kerala. Under the scheme, MSMEs were eligible for
rebate on interest at the rate of 3 per cent for loans up to `1 crore and 2 per
cent for loans above `1 crore. KFC was selected as the implementing agency.
KFC proposed (January 2014) to disburse `300 crore during 2013-14 under
the scheme. GoK provided `10.14 crore to KFC for implementing the scheme.
As at 31 March 2016, KFC had disbursed a sum of `3.60 crore to eight
MSMEs against the sanctioned amount of `6.64 crore.
We observed that no targets were fixed in respect of the number of units to be
covered under the scheme. As a result, eight MSMEs engaged in one
particular activity, viz., neera11
extraction from coconut trees, only were
extended the benefit of the scheme.
GoK replied (March 2017) that KFC could sanction loans under the scheme to
only those units that had utilised technology developed by approved research
institutions.
Implementation of Kerala State Entrepreneur Development Mission
(KSEDM)
2.1.9.4 GoK introduced (December 2011) KSEDM with an outlay of `25 crore
for the financial year 2011-12. KFC was the nodal agency for implementing
KSEDM as well. KSEDM aimed at generating one lakh job opportunities and
building entrepreneurship culture among the youth of the State by setting up
10,000 enterprises over five years. After selection of groups/ industries,
11 A non-alcoholic, nutritious drink manufactured from the immature inflorescence of coconut tree.

Chapter II – Performance Audit
29
entrepreneurship training was to be organised in collaboration with various
training institutes like Entrepreneurship Development Institute, KITCO
Limited12
, Rural Self Employment Training Institutes (set up by NABARD)
and Centre for Management Development. Upon successful completion of
training, groups/ individuals would be eligible for interest free loans up to 90
per cent of the total project cost subject to the ceiling of `20 lakh. Interest on
the loans would be borne by the Government.
We noticed that:
As of March 2016, achievement against the scheme was poor as only
1,714 units were financed out of the targeted 10,000 units. Direct
employment generated was 8,50013
against the target of 1 lakh
employment opportunities.
We also noticed that out of 1,714 financed units, 363 units (sanctioned
`48.87 crore and disbursed `11.93 crore) were yet to commence
commercial operation (March 2016).
Interest burden incurred by KFC on loan disbursed to MSMEs under
KSEDM up to 31 March 2016 was `24.70 crore. An amount of `15
crore only was received from GoK.
A review of the arrear statement prepared by KFC revealed that as on
31 March 2016, 143 units had defaulted in repayment of loan
amounting to `1.94 crore.
According to Annexure III of the project report of KSEDM, stone
crusher units were ineligible for loan assistance under the scheme.
Further, as per the guidelines issued by the GoK for sanction of
subsidy under the Entrepreneur Support Scheme, Metal Crushers
including Granite Manufacturing units were ineligible for any financial
assistance/ loan/ exemption/ subsidy from the State Government.
Review of the KSEDM database revealed that `1.94 crore was
disbursed to 19 units under the category „stone crushing, non-metallic
mineral products‟, which was irregular.
GoK stated (March 2017) that the response to the scheme was encouraging as
demonstrated by the fact that 1,714 units availed of its benefits after it was
introduced. The reply is not acceptable since the actual achievement was only
17 per cent of the target. Further, the assisted units included ineligible units as
well.
Implementation of Receivable Finance Scheme
2.1.9.5 Board of Directors (BoD) of KFC approved (March 2014) introduction
of a Receivable Finance Scheme intended to discount the bills of MSMEs
supplying material to Public Sector Undertakings/ Government bodies. The
12 Foremerly Kerala Industrial and Technical Consultancy Organisation Limited. 13 2012-13: 681, 2013-14: 1735, 2014-15: 2706, 2015-16: 3378.
Audit Report No.4 (PSUs) for the year ended 31 March 2016
30
scheme envisaged a maximum repayment period of 180 days and margin of 15
per cent. The scheme was intended to finance only sale of finished goods of
MSMEs.
We observed that even though KFC had approached PSUs in the State for
enrolling them in the scheme, the PSUs failed to respond due to which the
scheme could not be implemented. We further observed that except Kerala
Minerals and Metals Limited (KMML), none of the major PSUs in the State
had complied with the statutory provision that the dues/ overdues to MSMEs
for goods/ services supplied should be separately disclosed in the Annual
Financial Statements.
GoK replied (March 2017) that the scheme did not take off because of lack of
interest by the PSUs. It was also assured by the Government that PSUs were
being advised to disclose the details regarding dues to MSMEs as required.
The reply is not acceptable since GoK could have ensured the participation of
PSUs under its administrative control in the scheme which was intended to
benefit MSMEs in the State.
Implementation of Entrepreneur Support Scheme by DI&C
2.1.9.6 Besides KFC, DI&C was also financing nine14
schemes of GoK since
1980 for the promotion and development of Small Scale Industries/ MSMEs.
Replacing all the above schemes, a new scheme called Entrepreneur Support
Scheme (ESS) was implemented from 1 April 2012 to provide one time
investment subsidy up to `0.30 crore to MSMEs. Though DI&C was the
implementing agency of ESS through its fourteen DICs, KFC and KSIDC
could also recommend MSMEs financed by them for grant of ESS.
During the period 2012-13 to 2015-16, DI&C and the DICs disbursed
assistance of `114.56 crore under ESS to 3,352 MSMEs. We reviewed the
implementation of ESS in three15
DICs and noticed that:
Out of 51,708 MSMEs units registered in the State from 2012-13 to
2014-15, only 6.48 per cent availed financial assistance under ESS.
The low percentage of utilisation of the scheme was primarily due to
the fact that the scheme excluded from its purview MSMEs belonging
to the service sector which constituted around 36 per cent of all
MSMEs registered in the State during the period
2011-12 to 2015-16. During the Exit Conference, GoK stated that the
complex documentation required for availing the scheme was one of
the factors that led to low percentage of utilisation and that the same
would be rectified as part of the „Ease of doing business‟ initiative.
14 Scheme for payment of grant under Women‟s Industries Programme (1980), Scheme for providing Margin
Money Loan to SSI Units (1993), Scheme for providing Margin Money Loan to SSI Units promoted by Non-
resident Keralites (1995), Scheme for providing State Investment Subsidy (2000), Scheme for subsidy under
Technology Development Fund (2003), Scheme for reimbursement of One Time Guarantee Fee and Annual
Service Fee remitted under CGTMSE (2011), Self Employment Scheme for Educated (2011), Women
Industries Scheme (2011), Scheme for providing Turnover Subsidy to Micro, Small and Medium Enterprises
engaged in the manufacture of Fruit and Vegetable based products (2011). 15 Palakkad, Pathanamthitta and Kozhikode.

Chapter II – Performance Audit
31
In its reply, GoK stated (March 2017) that a separate scheme for
providing assistance to MSME units in the service sector was being
formulated. It was also stated that the application filing was since made
online to simplify the process.
According to the Guidelines of ESS, entitlement under ESS shall be
limited to `30 lakh per applicant, to be availed once. The upper limit of
`30 lakh shall be enhanced by 5 per cent per annum during the period
of operation of the scheme to address the escalation of costs. As such,
the subsidy payable during 2012-13 to 2015-16 ranged between `30
lakh and `34.73 lakh16
.
We, however, observed that while sanctioning the subsidy under ESS
in the three test checked districts, the district centres had limited the
maximum subsidy to `30 lakh even during 2013-14 to 2015-16. As a
result of non-revision of maximum limit, there was short payment of
`0.71 crore to 17 eligible MSMEs.
DI&C replied (September 2016) that maximum limit was not enhanced
due to budgetary constraints and limited number of applicants for
assistance. The reply was not tenable as the enhancement of the
maximum limit was mandatory as per the Guidelines of ESS and non-
enhancement had the effect of depriving MSMEs of full quantum of
eligible assistance. Further, the actual utilisation of budget allotment to
DI&C was only 72.20 per cent during the period 2012-13 to 2015-16.
M/s Agritex, Kanjikode, a partnership firm promoted by Sri. Kuriakose
Philip and others, submitted an application for grant of investment
support under ESS on 9 July 2013 claiming a total investment of `1.33
crore. The General Manager, DIC Palakkad recommended (October
2013) not to process the application due to the following reasons:
i. the Partnership Deed produced by the firm mentioned that the firm
was operating from SIDCO Industrial Park, Angamaly, but there
was no mention of the factory at Kanjikode in the deed, and
ii. the investment said to have been made in plant and machinery was
made well before the firm had obtained the land and building.
The District Level Committee (DLC), however, delegated (November
2013) a sub-committee to re-verify the matter. Based on the report of
the sub-committee, the DLC decided to sanction investment support
amounting to `30 lakh. The amount was disbursed on 20 March 2014.
We observed that since the responsible officers of the DIC had already
submitted their report pointing out that the machinery had no markings
to prove the date of manufacture, decision of the DLC to send another
16 `30 lakh increased by 5 per cent during 2013-14 (`31.50 lakh), 2014-15 (`33.08 lakh) and 2015-16 (`34.73
lakh).
Audit Report No.4 (PSUs) for the year ended 31 March 2016
32
team of officers to conduct physical verification of the plant and
machinery was irregular and amounted to extending undue favour to
the firm. It was also not clear how on a subsequent visit by the sub-
committee, the markings had inexplicably appeared. The defects
pointed out by the DIC such as the bank loan having been drawn much
before the land allotment, the fact of bills having been issued prior to
19 January 2012, the age of the machinery, etc., were not explained by
the sub-committee.
Thus, sanction and disbursement of subsidy to M/s Agritex was
irregular and inadmissible and the members of the DLC did not
exercise due diligence in carrying out the duty entrusted to them.
GoK in its reply (March 2017) stated that the matter was being
inquired into and assured that suitable remedial action would be taken
on the basis of the inquiry.
The ESS Guidelines issued by GoK specified that MSMEs engaged in
manufacturing activities shall alone be eligible for ESS assistance. We
conducted a joint inspection (24 August 2016) along with Industrial
Extension Officer (DIC, Kozhikode) in the premises of industrial units
and noticed that subsidy of `0.40 crore was paid to four
non-manufacturing units which were functioning on job-work basis.
Recommendation No. 2: Financing schemes need to be implemented more
effectively and efficiently to reach out to more MSMEs. The ESS and the
KSEDM need to be strengthened to provide assistance to all eligible
MSMEs.
Infrastructure Development
2.1.10 As per the Industrial and Commercial Policy 2007, availability of
infrastructure facilities, such as roads, built up space, power, water, security,
etc., has been identified as one of the factors affecting growth of MSME
sector. Creation of new infrastructure and strengthening of existing
infrastructure was, therefore, necessary for the growth of the MSME sector in
Kerala. DI&C, SIDCO, KINFRA and KSIDC were tasked with the creation of
infrastructure in Kerala. These agencies implemented plan schemes of GoK
and schemes sanctioned by GoI under Additional/ Special Central Assistance
and Cluster Development Programme. We examined the implementation of
these schemes and noticed delays and improper execution as discussed in the
succeeding paragraphs.
Construction of multi-storeyed industrial estates
2.1.10.1 In order to overcome the shortage of land required for industrial
units, a scheme for constructing multi-storeyed industrial estates which would
provide built up space to industrial units is being implemented by the DI&C.
Details of sanctioned projects and status of their implementation are
summarised in Table 2.8.

Chapter II – Performance Audit
33
Table 2.8: Status of implementation of multi-storeyed industrial estates as
on 31 March 2016
Sl.
No.
Location Area/
Units
Estimated
cost
(` crore)
Date of
sanction
Target
date of
completion
Actual
expenditure
(` in crore)
Current
status
Delay as of
March
2016
1 Edayar,
Ernakulam.
85 Cents/ 15
Units
4.50 17/02/2010 October
2011
6.50 Completed
(January 2016)
4 years 4
months
2 Puzhakkalpa
dam,
Thrissur
75,000 sq.ft/
50 Units
15.00 19/07/2010 July 2015 10.00 Work in
progress
8 months
3 Kochuveli,
Thiruvanan-
thapuram
40,000 sq.ft 10.00 18/10/2012 February
2015
Nil Not
Commenced
1 year and 1
month
4 Puthussery,
Palakkad.
33,000 sq.ft/
22 Units
7.50 25/07/2012 January
2015
Nil Not
Commenced
1 year and 3
months
5 Manjeri,
Malappuram
60 Cents/45
Units
3.00 23/07/2012 August
2014
1.95 Work in
progress
1 year and 7
months
As evident from the above Table, only one out of the five projects was
completed and that too with a delay of four years and four months. The delay
in completion in respect of the four incomplete projects ranged from one year
and two months to four years. The DI&C had neither ascertained the reasons
for the delay in completion of the projects nor taken action to speed up the
execution. We observed the following:
There was extra expenditure of `2 crore due to extra works directly
attributable to the delay in execution of Edayar, Ernakulam project.
Even though the scheme was proposed to be implemented utilising
Additional Central Assistance from Government of India, the entire
expenditure was met by GoK. The reason for non-availing of
Additional Central Assistance was not on record.
Project initiation for Kochuveli project was done on the basis of the
order of the Hon‟ble High Court to resume possession of 141.545 cents
of land out of 270.325 cents allotted to a defunct company on hire
purchase basis and to issue title for remaining 128.78 cents in favour of
the official liquidator. Though the project was initiated and `10 crore
released (February 2013) to SIDCO, the implementing agency, the
DI&C did not take up the possession of the land as permitted by the
Court but filed an appeal demanding release of the entire land which
was pending. This resulted in blocking up of funds.
In reply, the GoK stated (March 2017) that the litigation had since
been cleared and the entire land was in the possession of the DI&C. It
was also stated that the work had been re-allotted to another agency.
The fact remains that releasing of funds without ensuring the
availability of land had resulted in blocking up of funds.
We further observed that 636 MSMEs were waiting for allotment of
land/ sheds in 14 Districts as of 31 March 2016. Thus, delay in
completion of multi-storeyed industrial estates affected the functioning
of these MSMEs.

Audit Report No.4 (PSUs) for the year ended 31 March 2016
34
GoK (March 2017) admitted that the operational problems in SIDCO,
to whom all the above works were assigned, had affected the execution
of the works. It was also stated that in all cases where SIDCO had not
started the work, other agencies had been assigned the work.
Implementation of Cluster Development Programme
2.1.10.2 Ministry of MSME, GoI has adopted cluster development
approach as a key strategy for enhancing productivity and competitiveness as
well as capacity building of Micro and Small Enterprises (MSEs) and their
clusters17
in the country. In October 2007, the erstwhile „Small Industries
Cluster Development Programme‟ was renamed as „Micro and Small
Enterprises – Cluster Development Programme (MSE-CDP)‟. Integrated
Infrastructural Development Scheme was also subsumed in MSE-CDP for
providing developed sites to new enterprises and upgradation of existing
industrial infrastructure.
GoI sanctioned (July 2010-October 2015) seven MSE-CDPs to Kerala. Kerala
Bureau of Industrial Promotion (KBIP), an autonomous body under the
Industries Department, GoK was the implementing agency of the Programme.
As per the guidelines of the scheme, the projects were to be completed within
two years of sanction. 70 per cent of the project cost would be financed
through grant of GoI, minimum 10 per cent of the project cost by the
beneficiary MSMEs and balance by GoK. Details of implementation of the
Programme in the State are tabulated in Table 2.9.
Table 2.9: Status of implementation of MSE-CDP
(Amount in ` crore)
17
Collectives of MSMEs with similar nature of activities and sharing common infrastructure facilities and
technology. 18 Revised approval. Original approval was in September 2013.
Sl.
No.
Name of project under
MSE-CDP
Month of
sanction
Sanct-
ioned
cost
Contribution Expenditure
till date
(March 2016)
Status as on
31 March
2016 GoI GoK
Cons-
ortium
1 Wood Processing Cluster
Kollam
January
2011 2.60 1.82 0.52 0.26 1.67
Not
completed
2 Furniture Cluster, Kannur August
2012 11.65 8.12 2.35 1.18 3.86
3 North Malabar Offset
Printers Cluster, Kannur May 2013 12.22 8.55 2.44 1.22 Nil
4 Zamorins Furniture
Cluster, Kozhikode
March
201418
14.35 9.00 2.87 2.47 Nil
5 Pala Ethnic Food Cluster,
Kottayam July 2010 3.98 2.78 0.80 0.40 Nil
6 Furniture Cluster,
Chevoor, Thrissur
October
2015 14.45 10.02 2.89 1.54 Nil
7
Agriculture Implements
Cluster, Shornur,
Palakkad
September
2013 5.37 3.67 1.07 0.63 Nil
Total
64.62 43.96 12.94 7.70 5.53

Chapter II – Performance Audit
35
We noticed that:
Against the total sanctioned project cost of `64.62 crore for seven
Common Facility Centres (CFC), MSE-CDP the total financial
progress achieved was 8.56 per cent (`5.53 crore) only up to March
2016.
In case of Agriculture Implements Cluster, Shornur, the contribution of
`1.07 crore released to KBIP by GoK was refunded (March 2016)
since the project did not take off due to interim stay on its
implementation granted by the Hon‟ble High Court of Kerala in
December 2014. Stay Order was granted in a Writ Petition filed by
Kerala Forging Products Manufacturers Association alleging that the
DIC Palakkad had changed the original proposal i.e., to revive a
defunct CFC owned by the Palakkad Municipality was ignored, and a
new diagnostic study commissioned by KBIP was used as the basis for
setting up a new CFC without utilising the existing one. We observed
that KBIP or GoK did not get the stay vacated or furnish replies to the
allegations raised in the petition so far (June 2016).
GoK stated (March 2017) that the projects at serial numbers 5 and 7
had since been cancelled by GoI. It was also stated that the delay in
completion of the projects was because they were dependent on
contribution by the beneficiaries. GoK also assured that the projects
were being regularly monitored by the DI&C. The reply is not
acceptable since two projects were cancelled by GoI due to delays,
resulting in loss of Central Assistance to the tune of `6.45 crore.
Further, the contention of GoK that completion of the project was
dependent on contribution by the beneficiaries was not acceptable
because the beneficiary share was only 10 per cent of the sanctioned
cost.
Establishment of infrastructure by PSUs for MSMEs
2.1.10.3 KINFRA, KSIDC and SIDCO are engaged in creation of
infrastructure for the promotion of industries in Kerala. These PSUs have,
accordingly, been developing Industrial Parks/ Townships/ Zones, Industrial
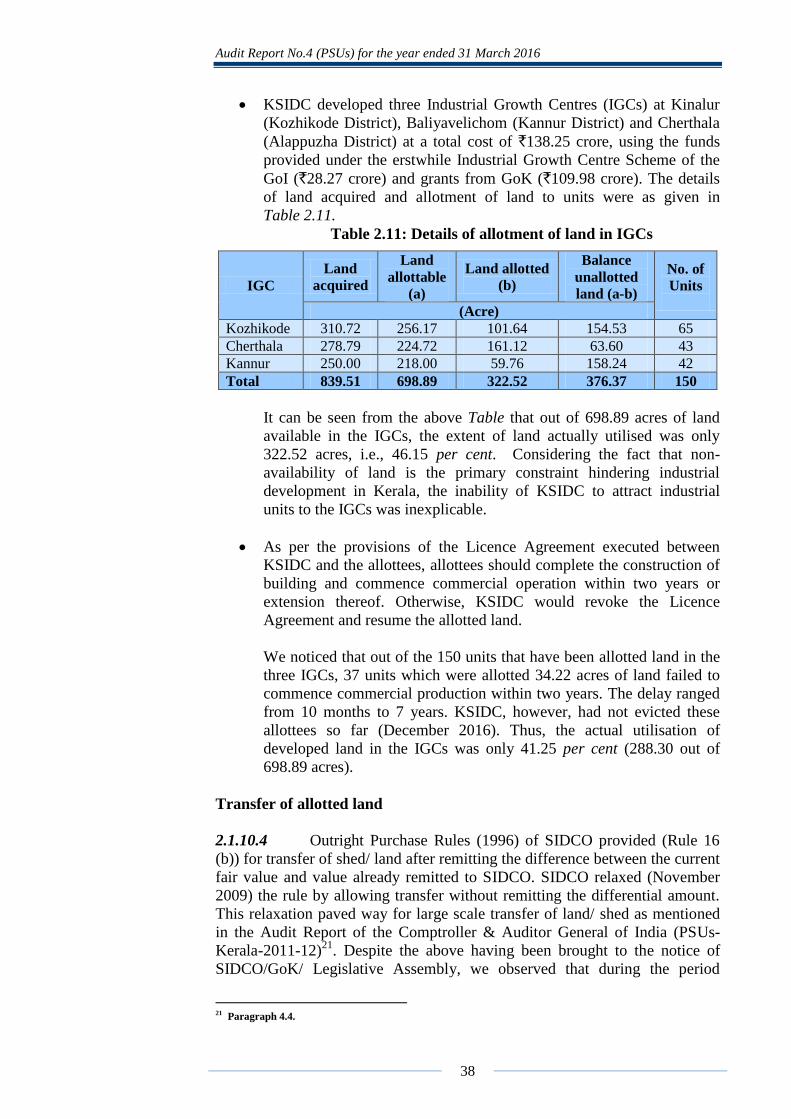
Growth Centres and Industrial Estates respectively. The details of the
Industrial Estates/ Parks, etc., maintained by the above PSUs as at 31 March
2016 are given in Table 2.10.
Table 2.10: Details of Industrial Estates/ Parks, etc., maintained by PSUs
Sl.
No. Agency
Industrial
Parks/
Estates, etc.
(Number)
Area
acquired
Allottable
area
Area
Allotted Units
established
(Number) (Acre)
1 SIDCO 60 324.28 262.63 253.33 1,367
2 KSIDC 7 1,305.81 973.78 575.64 83
3 KINFRA 21 1,804.17 1,489.36 884.24 638
Total 88 3,434.26 2,725.77 1,713.21 2,088
Audit Report No.4 (PSUs) for the year ended 31 March 2016
36
Allotment of area in Industrial Estates/ Parks, etc., maintained by the PSUs
was only 62.85 per cent of the total allottable area. We reviewed the activities
of these PSUs on promotion of MSMEs and findings are reported below.
According to the Project Implementation Manual of GoI,
implementation of projects should be preceded by feasibility studies to
ensure that the project was conceptually sound in terms of economic
benefits as well as financial returns.
KINFRA decided (July 2010) to establish rural apparel parks in
different panchayaths of the State to promote small/ micro/ medium
garment industries, thereby creating employment in rural areas. For
this purpose, GoK allotted (November 2010) 2.02 acres of land on 30
year-lease to KINFRA to set up a rural apparel park at Rajakumari,
Idukki. The rural apparel park with an estimated cost of `4.99 crore
aimed to provide employment to 1,200 rural women. The work was
completed in January 2012 at a total cost of `7.35 crore including
additional work. The space in the park was, however, not hired by
entrepreneurs till date (January 2017).
We observed that the management had failed to identify takers for the
Park due to the remoteness of the location and logistic costs. Thus, the
primary purpose for which the land was allotted i.e., employment
generation was not fulfilled as the feasibility of the park was not
adequately ascertained.
GoK stated (March 2017) that the facility was set up in Idukki as the
locality was a catchment area where apparel units sourced labour.
However, units could not be established so far and KINFRA was
continuing their efforts for utilisation of the building. The fact,
however, remains that the entire facility is lying unutilised and
KINFRA/ GoK should have identified prospective entrepreneurs for
the project before committing resources to it.
KINFRA set up (June 2006) an Agro Food Business Incubation Centre
at KINFRA Food Processing Park, Kakkancherry with technical
consultancy from Defence Food Research Laboratory (DFRL) at a cost
of `0.79 crore. The facilities at the centre included production line for
retort packing19
for ready-to-eat foods and convenience foods. As the
Food Business Incubation Centre was set up with the help of DFRL,
DFRL engaged FICCI20
for technology transfer to the operating
agency. FICCI demanded `0.03 crore as onetime fee and annual
royalty of two per cent on net domestic sales or five per cent on the net
export sales.
The operating agency, Inkal Ventures Private Limited (Inkal) informed
(August 2015) KINFRA its inability to operate the Business Incubation
19 Retort packing is a type of food packaging made from a laminate of flexible plastic and metal foils. 20 The Federation of Indian Chambers of Commerce and Industry.
Chapter II – Performance Audit
37
Centre as they failed to identify entrepreneurs willing to utilise the
Business Incubation Centre.
We observed that the project report submitted in September 2002 did
not contain any record relating to feasibility studies to determine the
viability of the project. The Food Business Incubation Centre
constructed during June 2006 at a cost of `0.79 crore has remained idle
for the past 10 years.
KINFRA in their reply (November 2016) admitted that it had not
conducted any feasibility study since the concept of food incubation
parks was an emerging technology. KINFRA further stated that the
prospective investors had backed out due to the global economic
recession and the project had not taken off due to the poor marketing
efforts by the selected operating agency. KINFRA also assured that all
efforts were being made to ensure the viability of the project.
GoK endorsed (March 2017) KINFRA‟s views and further stated that
since the Business Incubation Centre dealt with emerging technology,
developing sufficient business to sustain its operations would require
time.
KINFRA Food Processing Park, Adoor envisaged allotment of
developed land to 16 units. Effluent Treatment Plant (ETP) of 225
m3/day capacity was necessary to neutralise effluents emitted by these
units. Individual units were to perform preliminary treatment and
KINFRA was to conduct secondary treatment of the effluents in the
park. KINFRA awarded (May 2012) the work of „Design, Supply,
Construction, Erection and Commissioning of ETP including
operation and maintenance of the plant for three years to Aqua Designs
India Private Limited, Chennai at a lump sum contract value of `1.99
crore. The scheduled completion time was six months (December
2012).
Due to delay in cutting and removing trees, the site could be handed
over to the contractor only on 10 September 2012. Further, clearance
from Kerala State Pollution Control Board (KSPCB) was not obtained
to establish the plant. Hence, time extension was granted up to
November 2013. The work is yet to be completed (November 2016)
due to labour problems and defaults on the part of the contractor.
GoK in its reply (March 2017) stated that the work was still
progressing and the delays after the extension period were due to
labour issues and defaults on the part of contractor. Further, none of
the MSME units was affected on account of the non-commissioning of
the ETP facility. The reply is not acceptable since one unit is still to get
the clearance from KSPCB and two units had installed ETP at their
own cost to get the clearance.
Audit Report No.4 (PSUs) for the year ended 31 March 2016
38
KSIDC developed three Industrial Growth Centres (IGCs) at Kinalur
(Kozhikode District), Baliyavelichom (Kannur District) and Cherthala
(Alappuzha District) at a total cost of `138.25 crore, using the funds
provided under the erstwhile Industrial Growth Centre Scheme of the
GoI (`28.27 crore) and grants from GoK (`109.98 crore). The details
of land acquired and allotment of land to units were as given in
Table 2.11.
Table 2.11: Details of allotment of land in IGCs
IGC
Land
acquired
Land
allottable
(a)
Land allotted
(b)
Balance
unallotted
land (a-b)
No. of
Units
(Acre)
Kozhikode 310.72 256.17 101.64 154.53 65
Cherthala 278.79 224.72 161.12 63.60 43
Kannur 250.00 218.00 59.76 158.24 42
Total 839.51 698.89 322.52 376.37 150
It can be seen from the above Table that out of 698.89 acres of land
available in the IGCs, the extent of land actually utilised was only
322.52 acres, i.e., 46.15 per cent. Considering the fact that non-
availability of land is the primary constraint hindering industrial
development in Kerala, the inability of KSIDC to attract industrial
units to the IGCs was inexplicable.
As per the provisions of the Licence Agreement executed between
KSIDC and the allottees, allottees should complete the construction of
building and commence commercial operation within two years or
extension thereof. Otherwise, KSIDC would revoke the Licence
Agreement and resume the allotted land.
We noticed that out of the 150 units that have been allotted land in the
three IGCs, 37 units which were allotted 34.22 acres of land failed to
commence commercial production within two years. The delay ranged
from 10 months to 7 years. KSIDC, however, had not evicted these
allottees so far (December 2016). Thus, the actual utilisation of
developed land in the IGCs was only 41.25 per cent (288.30 out of
698.89 acres).
Transfer of allotted land
2.1.10.4 Outright Purchase Rules (1996) of SIDCO provided (Rule 16
(b)) for transfer of shed/ land after remitting the difference between the current
fair value and value already remitted to SIDCO. SIDCO relaxed (November
2009) the rule by allowing transfer without remitting the differential amount.
This relaxation paved way for large scale transfer of land/ shed as mentioned
in the Audit Report of the Comptroller & Auditor General of India (PSUs-
Kerala-2011-12)21
. Despite the above having been brought to the notice of
SIDCO/GoK/ Legislative Assembly, we observed that during the period
21 Paragraph 4.4.

Chapter II – Performance Audit
39
2011-12 to 2015-16, 12.50 acres of land (83 cases) in nine Industrial Estates
of SIDCO were allowed to be transferred to third parties. The assessable value
of the land so transferred was `15.30 crore as worked out by us based on the
latest value reported by the Revenue Department.
We also observed that:
in two cases (land value: `0.10 crore) irregular transfer effected by the
original allottee was regularised by SIDCO and in two other cases
(land value: `0.20 crore), transfer was allowed by the original allottees
after being served eviction notice for keeping the units inactive, which
was in violation of SIDCO‟s own rules.
During joint inspection of nine Industrial Estates, six Mini Industrial
Estates (MIE) and two Industrial parks of SIDCO, we further noticed
that 37 units which were allotted land/sheds in the IEs/ MIEs/ IPs were
not functioning/ had not started functioning. SIDCO had not taken
effective steps to evict the non-functional units and allot the land/
sheds to new applicants.
GoK stated (March 2017) that action was underway for evicting idling
units.
Modernisation of existing infrastructure
2.1.10.5 Modernisation of existing infrastructure was necessary for the
enhancement of overall competitiveness of the industries in the industrial
estates by bridging critical physical infrastructure gaps. Details of
Development Areas (DAs)/ Industrial Development Plots (DPs), Industrial
Growth centres and industrial estates under the control of various agencies of
GoK were as given in Table 2.12.
Table 2.12: Details of DA/ DP/ Mini Industrial Estates
Agency of
GoK
No. of DA/ DP/
MIEs
Land Area (acres) No. of
Industrial
units Acquired Allotted
DI&C 126 2,515.45 1,995.00 2,881
KSIDC 7 1,305.81 575.64 83
SIDCO 60 324.28 253.33 1,367
KINFRA 21 1,804.172 884.243 638
Total 214 5,949.712 3,708.213 4,969
We noticed following deficiencies in the modernisation process:
The DI&C directed (May-November 2012) KBIP to prepare and
submit Detailed Project Reports (DPR) for the modernisation of the
DAs and DPs including construction of compound walls, maintenance/
repairing/ re-tarring of all internal roads, construction of drainage,
providing water supply and street lights, etc. Accordingly, KBIP
prepared DPR for modernisation of DAs at Veli (Thiruvananthapuram)
Kanjikode (Palakkad) and DP at Poovanthuruthu (Kottayam). DPR

Audit Report No.4 (PSUs) for the year ended 31 March 2016
40
was submitted to GoK for matching contribution and thereafter, to GoI
for consideration and approval under MSE-CDP scheme. KBIP
submitted (November 2013) another proposal for preparing DPRs for
the remaining 35 DA/ DPs at a total cost of `1.05 crore (`3 lakh per
DA/ DP).
GoK sanctioned (February 2014) `18 lakh for the DPR preparation of
six DA/ DPs (`3 lakh per DA/DP). So far, DPRs for 9 DA/ DPs have
been prepared as per which the total project cost would be `88.35 crore
and in principle approval for three DPRs (total project cost- `30 crore)
received from Ministry of MSME. Remaining DPRs were under
consideration of Ministry of MSME.
GoK had earmarked an amount of `5 crore as token provision for up-
gradation and modernisation of existing DA/ DPs under DI&C for the
year 2014-15. No amount, however, was utilised so far (June 2016).
Promotion of start-ups
2.1.11 Kerala Technology Start-up Policy, 2014 envisaged to make Kerala the
number one destination in India for start-ups, attract `5,000 crore into the
incubation and start-up eco systems in Kerala and establish at least 10
technology business incubators/ accelerators in each of the different sectors in
the State. As per the policy, the State Government was to set up technology
incubation facilities in all the industrial parks and SME clusters. All the
incentives available to MSMEs would be made available to start-ups also.
We, however, observed that technology incubation facilities had not been
provided in any of the Industrial Parks/ Areas under DI&C, SIDCO, KINFRA
and KSIDC. None of the start-ups that had come up in the two Start-up
Villages established by Kerala Start-up Mission, availed of financial assistance
under schemes for MSMEs such as ESS or KSEDM.
Recommendation No. 3: Development of infrastructure schemes should be
completed in time to bridge gaps in the available developed land/ space.
Modernisation of existing parks/ industrial estates should be undertaken
immediately as many of them are in dilapidated condition. Infrastructure
scheme should be taken up only after conducting feasibility studies.
Marketing Support
2.1.12 MSMEs face several constraints in marketing and Government
agencies are expected to play the role of a facilitator to help the MSME sector
in this area. Issues noticed in marketing assistance provided by GoK are
discussed in the following paragraphs.
Public Procurement Policy for MSMEs
2.1.12.1 GoK adopted (September 2013) Public Procurement Policy for
MSMEs notified by GoI and made it mandatory on the part of State PSUs/

Chapter II – Performance Audit
41
Departments/ Government agencies, etc., to set an annual goal of procuring
minimum 20 per cent of their annual value of goods or services from MSMEs
working within the State, in a period of two years with effect from 2013-14.
From April 2015, overall procurement goal of 20 per cent was made
mandatory. The Stores Purchase Manual (SPM) of the State Government was
also amended to incorporate the above condition.
We observed that compliance with the Public Procurement Policy was not
being monitored by the DI&C, which was the Nodal Agency for
implementation of the Policy. Quantum of purchase made by State PSUs/
Departments/ Government agencies, etc., from MSMEs was not available with
the DI&C. Therefore, we collected information from 15 PSUs/ Autonomous
Bodies/ Departments of GoK and noticed that statutory provision regarding
purchase of 20 per cent of requirement from MSMEs was not being complied
with by any State PSUs/ Departments/ Government agencies, etc.
We also noticed that GoK, while adopting the Public Procurement Policy 2012
did not include provision on publication of annual requirement of material in
advance which would have been of immense use to the MSMEs in the State
for planning their production/ marketing strategy.
GoK replied (March 2017) that State PSUs/Departments/Government agencies
had since been directed to follow the guidelines for procurement from MSMEs
as laid down in the SPM. It was also assured that the DI&C had since been
instructed to effectively monitor the implementation of public procurement
policy.
Organisation of exhibitions and fairs for the promotion of MSMEs
2.1.12.2 KBIP entrusted with the task of conceiving and implementing
promotional activities for the MSMEs in the State, was to organise
promotional events of the DI&C. This included Business to Business Meets,
Workshops, Seminars, Training Programmes, holding proactive discussions
with entrepreneurs and organising facilitation meetings for them with the
policy makers of the State.
A review of the exhibitions and fairs organised by KBIP for the promotion of
MSMEs during the period 2011-12 to 2015-16 revealed the following:
During the period 2011-12 to 2015-16, KBIP organised/ participated in 43
exhibitions/ fairs incurring expenditure of `5.59 crore. The events ranged from
Dubai Shopping Festival to Kerala Bamboo Fest. The primary objective
behind organising/ participating in industrial exhibitions/ fairs was to benefit
MSME units by enabling them to improve their market, acquiring new
technology, etc.
We observed that KBIP had not put in place a system for verifying the benefits
accruing from such participation. In the absence of quantitative details, the
effectiveness of the expenditure incurred out of Government funds for the
above activities could not be assessed.
Audit Report No.4 (PSUs) for the year ended 31 March 2016
42
Since GoK, through KBIP, was bearing substantial portion of the expenditure
incurred for participating in/ organising the fairs/ exhibitions, a transparent
procedure was needed for selecting the MSMEs for participating in the events.
We, however, observed that the selection of participants was being done in an
arbitrary manner without any criteria.
We also observed that the contracts for event management in respect of the
events organised directly by KBIP and for setting up stalls/ display, etc., in
respect of events organised by other agencies were being awarded without
observing the provisions of the Stores Purchase Manual of the State
Government. The contracts for works costing `3.63 crore were awarded on the
basis of limited quotations instead of competitive tenders.
GoK in its reply (March 2017) assured that the effectiveness of facilitating the
participation of MSMEs in exhibitions/fairs would be assessed through
obtaining feedback.
Marketing Support to MSMEs by SIDCO
2.1.12.3 One of the primary objectives of SIDCO was to provide
assistance to SSI/ MSME units to market their products. In order to achieve
this objective, GoK permitted the Government Departments/ PSUs/ other
Government agencies to procure their requirements directly from SIDCO
without observing the procedure prescribed in the Stores Purchase Manual/
Rules of GoK. The Marketing Division of SIDCO, in turn, empanelled 846
MSMEs for procuring products on behalf of Government Departments/ PSUs/
other Government agencies.
We observed that:
Stores Purchase Manual/ Rules of GoK, applicable to SIDCO, required
procurement of products from the MSMEs in a transparent manner,
according equal opportunity to all sellers.
A review of the purchases effected by SIDCO during 2011-12 to 2015-
16 revealed that out of the 64,145 Purchase Orders (PO) issued, 26,090
POs i.e., 40.67 per cent were placed on 50 firms representing 5.91 per
cent of the total empanelled MSMEs. Similarly, out of the total order
value of `477.94 crore, these 50 firms bagged orders worth `200.39
crore (41.93 per cent of the total purchase). Purchase orders were
issued to these 50 firms without inviting tenders from among
empanelled MSMEs.
As per the conditions prescribed by SIDCO, only manufacturing units
were eligible for registration under marketing support scheme.
We, however, observed that 23 out of the above 50 firms were not
manufacturers of the products supplied by them as evidenced by cross
verification of the records at the Commercial Taxes Department, GoK.
Details of the top five firms are given in Table 2.13.

Chapter II – Performance Audit
43
Table 2.13: Details of procurement of SIDCO from five firms
SIDCO issued all POs on the basis of quotations irrespective of the
purchase value and tendering process was not followed. As such, the
benefit of the Government Order conferring special status on SIDCO
for supply of goods and services to Government Departments/ PSUs,
etc., was passed on only to a few MSMEs.
GoK accepted (March 2017) the audit observations and stated that the
procedures were by-passed due to the challenges faced by SIDCO in
terms of management capabilities and availability of staff. It was also
assured that corrective measures had since been initiated.
Recommendation No. 4: GoK may put in place an efficient mechanism for
providing marketing support to eligible MSMEs through strict enforcement
of Public Procurement Policy.
Facilitation Services
Clearances under Single Window Scheme
2.1.13 For speedy issue of various licences, clearances and certificates
required for setting up of industrial undertakings in the State, Kerala Industrial
Single Window Clearance Boards and Industrial Township Area Development
Act, 1999 (SWCB Act) was enacted. As per the provisions of the Act, for
setting up small scale industrial undertakings with capital investment of more
than `2 lakh in each district of the State, GoK constituted District Single
Window Clearance Boards (DSWCB) in each district. The Collector of the
district was the Chairman of the DSWCB while the General Manager, DIC
was the Convener. The DSWCB also included representatives from all
departments/ agencies involved in issuing clearances/ permits for
establishment/ operation of industrial units.
We examined applications received under the Single Window Clearance
(SWC) Scheme in Palakkad, Pathanamthitta and Kozhikode districts and
observed that out of 252 applications processed during the period 2011-12 to
2015-16 by the three DSWCBs, only 16 were cleared within the stipulated
period of 60 days. In respect of processing the remaining 236 applications,
there was delay up to 1 year in 178 cases, 1 to 3 years in 47 cases and above 3
years in 11 cases. We noticed that the inordinate delays were mainly due to:
Sl.
No. Name of firm Location (Products)
No. of
Orders
Amount
(`crore)
1 M S Communications
Karunagappally (Electrical Goods, Recharge
Coupons for mobile phones)
313 11.55
2 Vishnu Steel &
Wood Industries
Kollam (Mattress, Furniture, Pillows) 1,619 10.40
3 Sonet Enterprises Kalpetta (Hearing Aids, Furniture) 332 8.77
4 Pranavam Agencies Kollam (Furniture, Computer Systems) 1,864 8.76
5 Steel Vin Industries Thrissur (Furniture, Weighing Machines) 2,010 7.16
Total 6,138 46.64

Audit Report No.4 (PSUs) for the year ended 31 March 2016
44
i. Local Self Government Institutions (LSGIs) not issuing the
requisite consents (consent to establish, building permit, etc.) in
time, even for units located in industrial areas.
ii. DSWCBs meeting infrequently, resulting in piling up of
applications. The number of meetings held by the three DSWCBs
during the period from 2011-12 to 2015-16 was as given in
Table 2.14.
Table 2.14: Details of meetings held by three DSWCBs
District No. of meetings held
2011-12 2012-13 2013-14 2014-15 2015-16 Total
Palakkad 3 3 5 3 5 19
Pathanamthitta 2 3 2 2 0 9
Kozhikode 1 3 3 4 3 14
iii. The DSWCBs not exercising the authority conferred on them by
the SWCB Act, 1999 to issue deemed clearances if the agencies
concerned were unduly delaying their consent.
The DI&C stated in its reply (September 2016) that the delays in issue of
clearances under Single Window Scheme were mainly due to the delay on the
part of KSPCB22
which insisted that the application should be uploaded
directly in their Website. Similarly, the officials of DIC who conducted
preliminary appraisal of applications lacked knowledge of rules of other
Departments. Obtaining clearance from the Fire & Rescue Services
Department was a complicated process and consumed a lot of time, even for
Units which posed no fire hazard. The Town Planning Department accepted
applications attested by the LSGIs only. LSGIs took a lot of time to process
applications as the Secretaries were not exercising the powers delegated to
them and all applications were referred to the LSGI Boards which meet
infrequently.
GoK in its reply (March 2017) assured that the Single Window Scheme was
being reviewed and rules were being amended to ensure that statutory
clearances are given in a time bound and transparent manner.
Performance of MSMEs in the State
2.1.14 Monitoring the functioning of MSMEs by collecting and compiling
data on actual quantity of goods/ services produced, profit/ loss, financial
health, etc., was essential for assessing the performance of the sector and
providing assistance/ initiating remedial measures. GoK and its agencies such
as DI&C, KSIDC, KINFRA, SIDCO, etc., did not, however, put in place a
system for collecting, compiling and analysing data on the functioning of
MSMEs in the State except in case of units availing assistance under specific
schemes. In the absence of this, GoK was making policy decisions on the basis
of MSME Census conducted by GoI in 2006-07.
22 Kerala State Pollution Control Board.

Chapter II – Performance Audit
45
We, however, examined performance of MSMEs in parks developed by
KINFRA and noticed the following issues:
The KINFRA Integrated Industrial Textile Park (KIITP), Kanjikode,
Palakkad was established by KINFRA on 100 acres of land at a cost of
`30 crore. 89 industrial units were allotted plots in the Park from 2011
onwards. As per the schedule of the projects, the units coming up in
the Park were to be allotted power by January 2012. Power was,
however, made available to the units only by September 2013. The
delay in providing power was due to refusal of Kerala State Electricity
Board Limited (KSEBL) to supply power to Kinesco Power and
Utilities Limited (Kinesco), a joint venture set up by KINFRA and
National Thermal Power Corporation Limited.
We observed that out of the 89 units that had been allotted plots in the
Park, 28 Units with a total projected investment of `66.32 crore and
employment potential for 1,047 persons, could not commence
activities and had, therefore, abandoned the projects. Even the units
that had commenced production did so using DG sets till KSEBL
agreed to supply power and had to incur heavy losses on that account.
The failure of the above units to commence business was directly due
to KSEBL‟s refusal to supply power to Kinesco at the same rate at
which it was supplying power to other licensees in the State. This was
violative of GoK‟s policy that MSME units should be promoted.
GoK stated (March 2017) that the issues had since been resolved and
power is now being supplied to the units located in the Park by
KSEBL/Kinesco. The fact, however, remains that 28 units could not
commence activities as envisaged due to the failure of GoK in
coordinating the activities of various Departments/agencies under it.
Findings of beneficiary survey
2.1.15 We conducted a survey of 194 MSMEs23
in the State to assess how
they rated the various facilities provided by Government/Government agencies
to promote and develop MSMEs in the State. The responses obtained were
analysed and the major findings are given below:
64 per cent of the respondents were not aided by the Single Window
mechanism set up by the State Government for commencement/
registration of new units.
Technical assistance such as assistance in preparing project report, etc.,
was not provided by the State Government to 54 per cent of the units.
Training in skill development/entrepreneurship was not provided by
the State Government in the case of 65 per cent of the MSMEs.
While 48 per cent of the units surveyed faced financial crisis at one
time or the other, the State Government did not provide any financial
23 Chosen at random from the units located at IEs/MIEs of SIDCO, DAs/DPs of DI&C and IGCs of KSIDC.

Audit Report No.4 (PSUs) for the year ended 31 March 2016
46
help to them to tide over the crisis.
Government did not provide quality raw material to 51 per cent of the
units.
Marketing assistance was not provided to 80 per cent of the MSMEs.
Financial assistance was not provided to 53 per cent of the units.
The rating of infrastructure provided in the industrial areas developed
and maintained by Government/Government agencies was as shown in
Table 2.15.
Table 2.15: Rating of infrastructure provided in the industrial areas
Facility
Rating (Percentage of MSMEs)
Inadequate Satisfactory Good Did not
respond
Built up space 31 38 5 26
Power 35 50 4 11
Water 40 40 6 14
Roads 56 21 11 12
Security 55 27 6 12
As can be observed from the above, majority of the respondents were not
satisfied with the infrastructure provided in case of roads and security
arrangements.
SIDCO stated (December 2016) that it was not in a position to undertake
maintenance of infrastructure in its IEs, etc., due to lack of funding by GoK.
GoK, in its reply (March 2017) assured that SIDCO would initiate action to
improve the infrastructure in the IEs/IPs/MIEs.
Conclusion
The industrial policy of the State Government with regard to
promotion and development of MSMEs contained only general
objectives and specific schemes were not included in the policy to
achieve the major objectives.
The growth in number of new MSMEs was lower than the
neighbouring States and the all India average.
Government schemes for development of industrial infrastructure
were not implemented optimally resulting in poor quality of
infrastructure in industrial areas.
The Kerala Financial Corporation, which is the only agency under
the Government of Kerala providing finance to MSMEs failed in
substantially fulfilling its mandate.
The MSMEs were not provided adequate marketing support.

Chapter II – Performance Audit
47
2.2 Procurement and marketing of vegetables and fruits in the State
by Kerala State Horticultural Products Development Corporation
Limited
Executive Summary
Introduction
Kerala State Horticultural Products Development Corporation Limited
(Company) was incorporated in March 1989 as a fully owned State
Government company with the main objective to organise vegetable, fruit and
flower growers and to provide them with all supplies and services to augment
their income base by increased productivity and value addition through an
integrated system of production, procurement, grading, storage, processing,
marketing and exporting of horticultural products.
Procurement activities
During 2011-12 to 2015-16, the Company procured vegetables and fruits
ranging between 4,000 metric tonne (MT) and 18,000 MT from within the
State. This accounted for around two per cent of the total vegetables produced
in Kerala during 2011-12 to 2015-16.
Instead of procuring directly from farmers, world markets under the control of
Department of Agriculture, etc., as envisaged, the Company made 75.47 per
cent purchases valuing `53.74 crore from traders/ middlemen during 2014-15
to 2015-16. Selection of traders was not through transparent process. Though
the Company had empanelled nine suppliers, purchases amounting to `30.86
crore and `22.88 crore in 2014-15 and 2015-16 respectively were made from
the non-empanelled suppliers in the five District Procurement Centres
selected by Audit.
Non-procurement of vegetables from three districts
The Company did not have centres for procurement of vegetables in
Malappuram, Wayanad and Kasargod districts. As a result, vegetables
produced by farmers in these three districts were not procured by the
Company. During the period from 2012-13 to 2014-15, these districts had
produced 3.11 lakh MT of vegetables which accounted for 18.23 per cent of
the total vegetable production in the State.
Remunerative prices to farmers
Farmers did not receive remunerative prices for their produce. There was
undue delay in settlement of farmers’ bills.
Quality of vegetables and fruits
Even though a major chunk of the procurement of vegetables and fruits was
from the neighbouring States, the Company failed to ensure quality of
vegetables purchased.
The lab test conducted by the Food Safety Commissioner of GoK on the
samples selected from the Company revealed that some of the vegetables
supplied by the Company were unsafe to eat. Quality checking conducted at
the instance of Audit also revealed presence of pesticide residues in vegetables
beyond permissible limits.

Audit Report No.4 (PSUs) for the year ended 31 March 2016
48
Absence of consistent marketing policy
The Company did not have a consistent procurement/ marketing policy. The
purchase and selling prices were fixed arbitrarily.
Subsidy sale during festive seasons
The Company did not comply with the directions of the Government of Kerala
(GoK) with regard to the fixation of selling price during subsidy period and
made incorrect subsidy claim with the GoK.
Regional imbalances in sales outlets
Sales outlets of the Company were established without considering the
regional balances and 79 per cent of the sales outlets were in seven districts in
southern part of the State, thereby majority of the people were deprived of the
benefits of low or subsidised price offered by the Company.
Introduction
2.2.1 Department of Agriculture, Government of Kerala (GoK) analysed the
problems associated with the development of fruits and vegetables and
ascertained that these were caused by the non-availability of good quality seeds
and planting materials, lack of processing facilities to absorb seasonal surplus
of fruits and vegetables and lack of efficient marketing system to ensure a
larger share of the consumer‟s rupee to the producer. In order to address this,
Kerala State Horticultural Products Development Corporation Limited
(Company) was incorporated in March 1989 as a fully owned State
Government company with the aim to organise vegetable, fruit and flower
growers and to provide them with all supplies and services to augment their
income base by increased productivity and value addition through an integrated
system of production, procurement, grading, storage, processing, marketing and
exporting of horticultural products. The activities of the Company include
procurement of vegetables and fruits from farmers and distributing them to the
public at discounted rates below the market price through retail outlets located
in different parts of the State.
Organisational set-up
2.2.2 The registered office of the Company is located in
Thiruvananthapuram. The Company has eleven District Procurement Centres
(DPCs) in Thiruvananthapuram, Kollam, Kottayam, Ernakulam, Kannur,
Kozhikode, Alappuzha, Pathanamthitta, Thrissur, Palakkad and Idukki districts;
three Sub Regional Procurement Centres at Haripad, Chadayamangalam and
Poojapura; one Beekeeping Consortium and Training Centre at Mavelikkara
and one Strawberry Processing Centre at Munnar. The Company operates 77
own and 293 licensed stalls.
Audit Objectives
2.2.3 The main objectives of the Performance Audit were to ascertain
whether:
The Company was able to procure horticultural products from farmers
to the extent envisaged and ensure remunerative prices to them; and

Chapter II – Performance Audit
49
Marketing of horticultural products of the farmers in the State was
carried out economically and efficiently.
Audit Criteria
2.2.4 The following criteria were adopted:
Guidelines, norms/ policies prescribed by GoK/Company;
Cold Chain Scheme of the Company;
Government Orders;
Agreements/contracts with franchisees/ farmers‟ associations;
Minutes of the Board meetings; and
Agricultural Development Policy-2015 of Government of Kerala.
Weekly price trend reports of AGMARKNET24
.
Scope of Audit and Audit methodology
2.2.5 The Performance Audit covered the activities of the Company during
the period 2011-12 to 2015-16 in respect of procurement and distribution of
vegetables and fruits. The methodology adopted for attaining the Audit
Objectives with reference to the Audit Criteria was review of files/records
maintained by the Company/ Department of Agriculture in six selected
districts viz., Thiruvananthapuram, Kollam, Kottayam, Idukki, Malappuram
and Palakkad. We also conducted joint surveys with 46 farmers/ farmers‟
associations, Secretaries of five world markets25
and 30 licensed stalls.
The Audit Objectives, Audit Criteria and scope of the Performance Audit were
discussed with the Management and Government in an Entry Conference held
on 06 May 2016. The audit was conducted during June 2016 to September
2016.
Audit findings were issued to Management/ Government on 04 November
2016. Audit findings were also discussed with Department of Agriculture,
GoK and Management of the Company in an Exit Conference held on 23
November 2016. Their replies and views have been given due consideration
while finalising the report.
Audit Findings
2.2.6 Audit findings on procurement and marketing of vegetables and fruits
by the Company are discussed below:
Procurement of vegetables and fruits
2.2.7 One of the main objectives of the Company is to provide a marketing
avenue to the farmers of the State. Details of production of vegetables in the
State and procurement by the Company during the last five years ended 2015-
16 were as given in Table 2.16.
24An e-governance portal by National Informatics Centre which facilitates web-based information flow of daily
arrivals and prices of commodities in the agricultural produce markets. 25 Urban/ Rural Agriculture World Markets.

Audit Report No.4 (PSUs) for the year ended 31 March 2016
50
Table 2.16: Details of production of vegetables in the State vis-a-vis
procurement by the Company
Year 2011-12 2012-13 2013-14 2014-15 2015-16 Total
Production of vegetables in the
State ( Lakh MTs) 5.55 5.51 5.57 5.98 6.28 28.89
Procurement by the Company
from within the State (Lakh MTs) 0.04 0.06 0.18 0.12 0.09 0.49
Percentage of procurement to
total production 0.72 1.09 3.23 2.01 1.43 1.70
Source: Data furnished by Directorate of Agriculture and the Company.
As evident from the above table, procurement of vegetables by the Company
from the farmers of the State hovered around a meagre two per cent of the
total production. This was mainly due to lack of coordination among different
Government agencies, inconsistent procurement policy, etc., as discussed in
the succeeding paragraphs.
Lack of planning
2.2.7.1 Effective procurement demands preparation of realistic targets
considering the quantity of vegetables and fruits anticipated to be produced in
the State. Targets for procurement should be backed by financial budgets/
working capital assessment.
We observed that the Company did not set any targets for procurement of
vegetables and fruits by the DPCs during 2011-12 to 2015-16. Financial
budgets/ working capital requirement were also not prepared/ assessed during
the above period. In the absence of targets and budgets, the Company procured
vegetables and fruits on routine and ad hoc basis. The value of procurement
declined sharply by 32.64 per cent in 2015-16 as compared to 2014-15 as
given in Table 2.17 due to working capital constraints.
Table 2.17: Value of procurement of vegetables and fruits by the Company
Year 2011-12 2012-13 2013-14 2014-15 2015-16
Value of procurement (` in crore) 13.85 37.62 76.17 77.12 51.95
Increase / (decrease) over
previous year (` in crore) ... 23.77 38.55 0.95 (25.17)
Percentage of increase/ (decrease)
over previous year … 171.62 102.47 1.25 (32.64)
Accepting the audit observation, GoK replied (January 2017) that the
Company had decided to fix targets for all DPCs with respect to procurement
of vegetables and fruits from 2017-18 onwards.
Recommendation No. 1: The Company may prepare a realistic financial
budget to ascertain the working capital requirements for procurement,
based on the harvest schedule.

Chapter II – Performance Audit
51
Lack of coordination among various agencies
2.2.7.2 The Company is the sole Public Sector Undertaking (PSU) for
marketing of vegetables and fruits in the State. It is dependent on Government
agencies like Department of Agriculture, Vegetables and Fruits Promotion
Council Keralam26
(VFPCK) and State Horticulture Mission (SHM) for
procurement because these agencies oversee the cultivation of vegetables and
fruits in the State. Therefore, coordination among these agencies was essential
for maximum procurement by the Company.
We, however, noticed lack of coordination in the following cases leading to
non-procurement of fruits and vegetables by the Company:
GoK directed (November 2001)27
the Company to establish
procurement centres at block level to procure vegetables directly from
farmers/ farmers‟ self help groups at reasonable rates. Department of
Agriculture of GoK was to coordinate the activities in order to bring
the vegetables to the procurement centres. In order to review and
monitor the activities of the Company and the Department of
Agriculture and to make these activities more efficient, GoK decided
to constitute a review committee in each district consisting of the
Deputy Director and Assistant Director (Marketing) of Department of
Agriculture and the Regional Manager of the Company.
We observed that the review committee was not constituted in any of
the districts selected for audit even though the review committee was
to be constituted in each district.
GoK sanctioned (June 2008) 1,000 Organic Vegetable Village
Programme by coordinating the activities of Department of
Agriculture, SHM, VFPCK, Kerala Agricultural University, voluntary
organisations, Grama Panchayats, Kudumbashree28
, educational
institutions, Self Help Groups, etc. The Company was identified as the
most significant agency which was supposed to participate in the
programme by procuring and marketing the vegetables produced under
the programme.
During 2010-11, GoK sanctioned (Mach 2010) `5 crore under Haritha
Vipananam Project (HVP) to the Company for procurement of
vegetables produced under the 1,000 Organic Vegetable Village
Programme. As per HVP, Grama Panchayaths should formulate the
production programme with the technical assistance of the Department
of Agriculture. The Agricultural Officer of Department of Agriculture
should prepare the harvest schedule for each Grama Panchayat and
intimate the same to the Company and Regional Manager of the DPCs
concerned. The Regional Manager, in turn, should prepare a
procurement schedule for each Grama Panchayat and vegetables
should be procured from the pooling centres. The quantity available
26 A company registered under Section 25 of the Companies Act, 1956. 27 G.O. (M.S) No.227/2001/Agriculture dated 05/11/2001. 28Kudumbashree is a poverty eradication and women empowerment programme implemented by State
Poverty Eradiction Mission of GoK..

Audit Report No.4 (PSUs) for the year ended 31 March 2016
52
and required at each DPC should be intimated to the head office three
days in advance and the surplus quantity should be transported to the
place of demand.
We observed that the Company diverted the amount sanctioned under
HVP for working capital due to financial crisis. Further, Agriculture
Officers of Department of Agriculture did not intimate the harvest
schedule to the Company. Ultimately, the Company did not utilise
these funds for the intended purpose.
GoK accepted the audit observation about lack of coordination among
various agencies involved in the production and marketing of
vegetables in the State. GoK also stated that the Company would take
steps for preparing crop calendar for vegetables with the support of
Agriculture Department. This would help to fulfil the objectives of the
Company in a better manner.
Recommendation No. 2: There should be close coordination among
the Company, Department of Agriculture, VFPCK, SHM, etc., for
more efficient procurement of vegetables and fruits from the farmers.
Non-assignment of specific role to the Company
2.2.7.3 The Vegetable Development Programme (VDP) implemented (2012-
13 onwards) by the Directorate of Agriculture aimed at increasing production
of vegetables in the State. The VDP did not envisage any marketing assistance
and hence, overlooked the role of procurement by the Company.
The Agriculture Development Policy of Kerala, 2015, also did not assign any
role to the Company in the development or marketing of agricultural products,
even though it was the only PSU in the State involved in these activities. The
annual plans formulated by the Department of Agriculture for promoting
agricultural production during the audit period also ignored the aspect of
procurement and marketing of vegetables and fruits by the Company.
Thus, GoK did not give due importance to the procurement and marketing of
vegetables by the Company. As a result, vegetable growers of the State did not
get desired marketing assistance from the Company. No specific reply was
received from GoK in this regard.
Absence of DPCs in three districts
2.2.7.4 The Company did not have DPCs in three districts, viz., Malappuram,
Wayanad and Kasargod. Malappuram was the third highest producer of
vegetables in the State. Details of production of vegetables in these three
districts during the period from 2012-13 to 2014-15 were as given in
Table 2.18.
Table-2.18:Production of vegetables in Malappuram, Wayanad and Kasaragod
Sl. No. District Production (MT) Procurement (MT)
1 Malappuram 1,98,478 Nil
2 Wayanad 66,555 Nil
3 Kasargod 46,299 Nil
Total 3,11,332 Nil Source: Data furnished by Directorate of Agriculture and the Company.

Chapter II – Performance Audit
53
In the absence of DPCs, the Company did not procure vegetables from these
districts. In order to assess how the farmers marketed the vegetables produced
by them in the absence of marketing assistance from the Company, we
conducted a joint survey in 5 out of 21 clusters29
and 4 out of 18 Swasraya
Karshaka Samithis30
(SKS) in Malappuram along with the officials of the
Department of Agriculture. The representatives of all five clusters and four
SKS responded that their products were sold to traders at low rates in the
absence of procurement by the Company.
Since the Company did not have procurement centres in these districts, the
Company could not make any impact on marketing of 3.11 lakh MT
vegetables produced by farmers in these three districts, which accounted for
18.23 per cent of the total vegetable production in the State during the period
from 2012-13 to 2014-15.
Accepting the audit observation, GoK replied (January 2017) that the
Company had opened a new DPC at Wayanad in November 2016 and was
planning to open new DPCs in Malappuram and Kasargod districts.
Procurement of bulk quantity of vegetables from traders
2.2.7.5 Agricultural Department, GoK operates District Procurement Centres/
wholesale markets/ Urban/ Rural Agriculture World Markets (UAWMs and
RAWMs). These markets were developed by GoK with the support of
European Economic Committee to provide better marketing opportunities to
farmers by promoting direct marketing through auction. The Government
ordered (March 2012) that the Company should participate in wholesale
markets of Agriculture Department for ensuring remunerative price to the
farmers who bring their produce to these markets. The details of procurement
of vegetables and fruits by the Company from DPCs of GoK/ UAWMs and
RAWMs, traders/ middlemen and farmers in the five districts selected for
audit are shown in Table 2.19.
Table 2.19: Details of procurement of vegetables by five DPCs of the
Company
As could be seen from the Table, bulk of the procurement during 2014-15 and
2015-16 was from the traders/ middlemen (75.47 per cent) while procurement
from farmers was only 24.53 per cent during this period. Though the GoK
directed the Company to participate in the auctions held in the world markets,
participation of the Company was not satisfactory as reported (October 2013)
by the Director of Agriculture to GoK. Further, it was also stated that non-
participation, irregular and delayed participation by the Company in the
29Association of farmers. 30A self-help group of farmers.
Year Total
Traders/
Middlemen
Farmers (including procurement
from world markets and VFPCK)
(Figures ` in crore)
2014-15 42.64 30.86 11.78
2015-16 28.57 22.88 5.69
Total 71.21 53.74 17.47

Audit Report No.4 (PSUs) for the year ended 31 March 2016
54
auctions had resulted in collusion of traders to lower the price causing loss to
the farmers.
We noticed that the procurement from traders/ middlemen was due to absence
of a consistent procurement policy as discussed below:
The Company had formulated (March 1993) a Haritha Marketing
Strategy which was never implemented. Subsequently, a new Cold
Chain Scheme was proposed. According to this scheme approved (July
1997) by GoK, procurement of fruits and vegetables was to be made
from the collection centres of VFPCK31
and distribution was to be
done through sale outlets of the Company. As it was impossible to
meet the entire requirements of vegetables from within the State in the
first phase, procurement on a daily basis was proposed from outside
the State through agents as well. A new procurement policy was again
adopted (July 2006) under the Central Scheme of Operation revamping
the Cold Chain Scheme. Further in January 2008, a new Centralised
purchase policy for procurement from primary source viz. directly
from farmers, farmers‟ groups, Government agencies like VFPCK and
farmers‟ markets was envisaged. Agents/ suppliers were not to be
engaged on any account. However, Board of Directors (BoD) of the
Company (December 2010) decided to purchase vegetables from
wholesale agents at Thirunelveli32
or Chalai, Thiruvananthapuram. It
was also suggested by the BoD to constitute a purchase committee to
oversee the purchase of vegetables from the panel of suppliers. Finally,
in a meeting of suppliers with the Managing Director (May 2013), it
was decided that purchases would be made only from the panel
consisting of nine suppliers which was formed after giving wide
publicity through newspaper advertisements.
We observed that the decision of the Company to procure from traders
was against the main objective of the Company, viz., augmentation of
income base of the farmers by increased productivity and value
addition through an integrated system of production, procurement,
grading, storage, processing and marketing of horticultural products.
Thus, absence of a consistent policy to procure vegetables and fruits
from farmers/ farmers‟ groups resulted in non-procurement of
vegetables at source from farmers and consequent bulk purchase of
vegetables from traders, etc.
Accepting the audit observation that the Company had no procurement
policy, GoK replied (January 2017) that a procurement policy would
be formulated soon.
Though the Company decided to procure vegetables and fruits from a
panel of nine suppliers, purchases amounting to `30.86 crore and
`22.88 crore respectively for two years 2014-15 and 2015-16 were
31Erstwhile Kerala Horticultural Development Programme. 32 A district in Tamil Nadu.

Chapter II – Performance Audit
55
made from non-empanelled suppliers in five selected DPCs
(Appendix 6). For instance, DPC Thiruvananthapuram had purchased
items worth `4.34 crore (21.34 per cent) in 2014-15 and `4.93 crore
(37.32 per cent) in 2015-16 from a single non-empanelled supplier.
Similarly, in DPC Kottayam, 77.90 per cent of the total purchases for
the year 2014-15 and 74.71 per cent for the year 2015-16 were made
from a single non-empanelled supplier. No records were maintained at
the DPCs to verify that the suppliers were selected through a
transparent process and had quoted the lowest rates.
GoK replied (January 2017) that it would issue directions to the
Company regarding purchase, price fixation, etc. in respect of
purchases from traders.
Recommendation No. 3: Direct procurement from farmers should be
encouraged. Clear-cut procurement policy emphasising procurement of
vegetables and fruits from farmers/ farmers’ markets like UAWM/ RAWM
should be formulated at the earliest.
Recommendation No. 4: When procurement from traders is inevitable, the
same should be done through a transparent process.
Delay in payment to farmers
2.2.7.6 GoK directed (September 2010)33
that payments to the farmers should
be made immediately on procurement of vegetables. In order to make
payments to the farmers on the very same day of auction in UAWMs and
RAWMs, GoK sanctioned (September 2010) `0.50 crore to the Company to
set up a revolving fund. Further, the Company received `0.50 crore in March
2012 from GoK to settle all the pending payments to farmers in UAWMs and
RAWMs.
We noticed that:
no revolving fund was created by the Company to make payments to
the farmers on time.
there were delays ranging from four months to three years in effecting
payments to the farmers as shown in Table 2.20.
33 GO (Rt) No.1643/19/AD dated 14/09/2010.

Audit Report No.4 (PSUs) for the year ended 31 March 2016
56
Table 2.20: Details of pending payment to the farmers
Name of the Unit Location Amount due
(` in lakh)
Due as at the
end of:
Range of
delay up to:
World market Anayara 24.97 April 2016 5 months
Nedumangad 25.98 April 2016 5 months
DPC under the Department
of Agriculture Thodupuzha 12.74 July 2016 3 years
VFPCK Thiruvananthapuram 6.71 July 2016 4 months
Kozhikode 0.69 July 2016 4 months
Sheethakala Pachakari
Vipanana Sangham (SPVS)
Kanthalloor 1.05 July 2016 4 months
Vattavada 7.56 July 2016 1 year
Total 79.70
The Director of Agriculture reported (October 2013) to GoK that
undue delay by the Company in making payment for the produce
procured during auction in the UAWMs and RAWMs had caused great
resentment among farmers forcing them to sell their produce elsewhere
at a loss. Delay in payment was confirmed by the Secretaries of the
world markets as well as the farmers who were interviewed by Audit.
Due to delay in payments coupled with lack of active participation by
the Company in world markets as discussed in Paragraph 2.2.7.5, the
quantity of vegetables brought for auction by the farmers to the world
markets and vegetables offered to the Company by SPVS had reduced
drastically as shown in Table 2.21.
Table 2.21: Quantity of vegetables brought by farmers to world markets
and offered by SPVS to the Company
Year
Quantity of vegetables
brought by farmers to
world markets (MT)
Quantity of vegetables offered
by SPVS and procured by the
Company (MT)
2013-14 2,833 1,077.11
2014-15 2,717 724.23
2015-16 1,886 547.24
Accepting the audit observation, GoK replied (January 2017) that the
Company had since cleared 99 per cent of the dues and it had also been
decided to open a revolving fund for procurement from farmers.
Absence of ancillary facilities for processing
2.2.8 In order to provide ancillary facilities for the processing and marketing
of horticultural produces and their derivatives as envisaged in the objectives of
the Company, a Strawberry Processing Unit was set up (February 2014) at
Munnar with the financial assistance of State Horticulture Mission (SHM).
The Strawberry Processing Unit costing `75 lakh was set up specifically for
safeguarding the interest of farmers of Idukki district involved in the
cultivation of strawberry.
The project proposal envisaged a yield of 1,250 MT of strawberry fruits per
year in Idukki district. SHM supplied 8,33,001 strawberry runners34
to the
34Strawberry runner is a shoot, branch, or twig springing from the root. Most of the commonly cultivated
varieties of strawberry plants will produce “runners” as a means of propagating themselves.

Chapter II – Performance Audit
57
farmers during 2014-15 to achieve the targeted yield.
We, however, noticed that the Company could procure only 1,035 kg of
strawberry during 2014-15. The unit was not operated further due to non-
availability of strawberry for processing in 2015-16 as the Company did not
coordinate with SHM to ensure that strawberry runners were provided to the
farmers for cultivation in time. Thus, the investment of `75 lakh became
infructuous due to idling of the unit.
GoK replied (January 2017) that the Company would take efforts to make the
Strawberry Processing Unit a viable one from 2017-18 onwards.
Non-utilisation of storage facilities
2.2.9 In order to achieve an annual procurement/ sales target of one lakh MT
of vegetables, the Company proposed and GoK approved (July 1997)
implementation of a Cold Chain Scheme comprising establishment of nine
cold storages, 140 vegetable super markets, 500 mini vegetable stores, nine
refrigerated trucks and six air conditioned sales units. Out of various schemes
envisaged under Cold Chain Scheme, the Company constructed (January
2001) two cold storages at Munnar (Idukki) and Eruthiampathy (Palakkad) at
a cost of `61.22 lakh.
We observed that both cold storages remained idle due to defects in
construction like variation in temperature of cold storage from one portion to
another, high electricity charges/ cost of operation, exorbitant cost of
transportation, etc. The construction was carried out without proper feasibility
study. These issues were highlighted in the C&AG‟s Audit Report
(Commercial), 2004, Government of Kerala. Based on the findings in the
Audit Report, Committee on Public Undertakings had directed (February
2009) the Company to take action against the erring officials of the Company.
Action was, however, yet to be taken (March 2017).
Non-implementation of Cold Chain Scheme led to non-procurement of one
lakh MT vegetables as envisaged in the project proposal and wasteful
expenditure of `61.22 lakh.
Marketing of vegetables and fruits
2.2.10 One of the main activities of the Company is to provide vegetables and
fruits to the public at reasonable prices. The Company sells vegetables and
fruits procured from farmers and traders through its 408 sales outlets35
(77
own stalls, 293 licensed stalls and 38 own mobile vans) under the DPCs.
Details of procurement and marketing of vegetables and fruits by the
Company during the five year period ending 2015-16 were as given in
Table 2.22.
35 Position as on 31 March 2016.
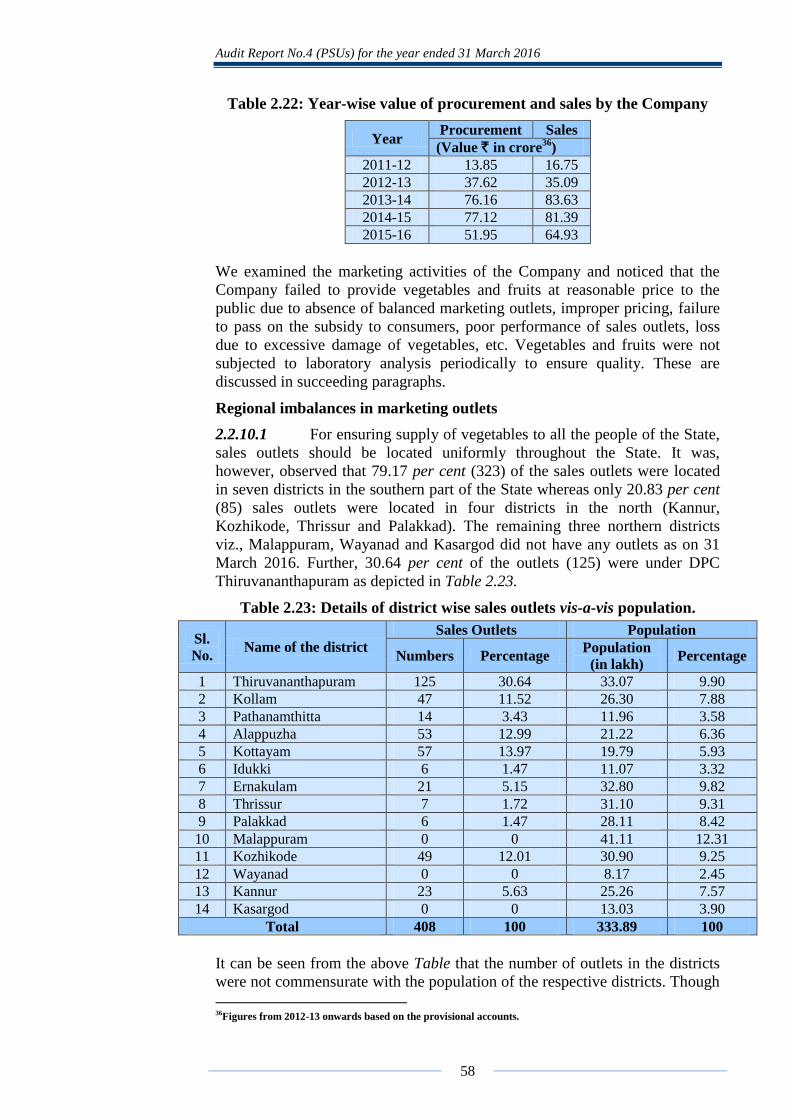
Audit Report No.4 (PSUs) for the year ended 31 March 2016
58
Table 2.22: Year-wise value of procurement and sales by the Company
Year Procurement Sales
(Value ` in crore36
)
2011-12 13.85 16.75
2012-13 37.62 35.09
2013-14 76.16 83.63
2014-15 77.12 81.39
2015-16 51.95 64.93
We examined the marketing activities of the Company and noticed that the
Company failed to provide vegetables and fruits at reasonable price to the
public due to absence of balanced marketing outlets, improper pricing, failure
to pass on the subsidy to consumers, poor performance of sales outlets, loss
due to excessive damage of vegetables, etc. Vegetables and fruits were not
subjected to laboratory analysis periodically to ensure quality. These are
discussed in succeeding paragraphs.
Regional imbalances in marketing outlets
2.2.10.1 For ensuring supply of vegetables to all the people of the State,
sales outlets should be located uniformly throughout the State. It was,
however, observed that 79.17 per cent (323) of the sales outlets were located
in seven districts in the southern part of the State whereas only 20.83 per cent
(85) sales outlets were located in four districts in the north (Kannur,
Kozhikode, Thrissur and Palakkad). The remaining three northern districts
viz., Malappuram, Wayanad and Kasargod did not have any outlets as on 31
March 2016. Further, 30.64 per cent of the outlets (125) were under DPC
Thiruvananthapuram as depicted in Table 2.23.
Table 2.23: Details of district wise sales outlets vis-a-vis population.
Sl.
No. Name of the district
Sales Outlets Population
Numbers Percentage Population
(in lakh) Percentage
1 Thiruvananthapuram 125 30.64 33.07 9.90
2 Kollam 47 11.52 26.30 7.88
3 Pathanamthitta 14 3.43 11.96 3.58
4 Alappuzha 53 12.99 21.22 6.36
5 Kottayam 57 13.97 19.79 5.93
6 Idukki 6 1.47 11.07 3.32
7 Ernakulam 21 5.15 32.80 9.82
8 Thrissur 7 1.72 31.10 9.31
9 Palakkad 6 1.47 28.11 8.42
10 Malappuram 0 0 41.11 12.31
11 Kozhikode 49 12.01 30.90 9.25
12 Wayanad 0 0 8.17 2.45
13 Kannur 23 5.63 25.26 7.57
14 Kasargod 0 0 13.03 3.90
Total 408 100 333.89 100
It can be seen from the above Table that the number of outlets in the districts
were not commensurate with the population of the respective districts. Though
36Figures from 2012-13 onwards based on the provisional accounts.

Chapter II – Performance Audit
59
Malappuram is the most populated district in the State, there was no sales
outlet of the Company in the district. Thiruvananthapuram accounted for only
9.90 per cent of total population, but 30.64 per cent of the total sales outlets
were functioning there.
Accepting the audit observation, GoK replied that (January 2017) the
Company had decided to start new outlets throughout the State to reduce the
regional imbalance in the marketing outlets.
Absence of uniform pricing policy
2.2.10.2 An efficient marketing system is vital for ensuring the twin
objectives of remunerative prices to farmers and reasonable prices to
consumers. As per the Cold Chain Scheme, the selling price of vegetables and
fruits are to be fixed at 30 per cent above the procurement price. The
Managing Director (March 2016) confirmed that 30 per cent was added to
cover handling charges like loading, unloading, damage, manpower cost,
transportation, small margin, etc.
We noticed that the Company did not follow a consistent policy for fixing of
selling price of vegetables and fruits. There was lack of uniformity in fixation
of selling price and each DPC earned different percentage of margin.
Vegetables were supplied at the godown of each DPC at a rate which was
inclusive of transportation cost. As such, the percentage of margin adopted by
all DPCs should be the same. Some of the instances where the same items
were sold at different rates adding varied margin on the same date are given in
Table 2.24.
Table 2.24: Details of sale of same item at different margins
Date 22/08/2015 26/08/2015
Item Ladies finger Onion
District
Procure-
ment
price/ kg
(`)
Selling
price/ kg
(`)
Percentage
of margin
Procure-
ment
price/ kg
(`)
Selling
price/ kg
(`)
Percentage
of margin
Thiruvananthapuram 6.60 16.00 142.42 67.00 65.00 (-) 2.99
Kollam 7.50 16.00 113.33 59.40 64.00 7.74
Kottayam 13.00 15.00 15.38 63.00 62.00 (-) 1.59
Palakkad 10.00 12.00 20.00 68.00 60.00 (-) 11.76
Idukki 12.00 20.00 66.67 32.00 65.00 103.13
Accepting the audit observation, GoK agreed (January 2017) that a market
intelligence system would be set up for fixing fair price of vegetables and
fruits.
Fixation of higher prices for inter district sale
2.2.10.3 According to the Cold Chain Scheme, retail selling price of the
Company would be fixed at 10 per cent less than the average retail selling
price prevailing in the market. The procurement price will be 30 per cent less
than the retail price fixed as above.
The Company opened DPC at Palakkad in April 2013 and at Idukki (Munnar)

Audit Report No.4 (PSUs) for the year ended 31 March 2016
60
in February 2014. Procurement of vegetables from farmers by these two
DPCs, distribution of the same to DPC Thiruvananthapuram and
corresponding sales by this DPC through its sales outlets for a period of one
month (July 2016) was reviewed by Audit.
We noticed that these DPCs accounted for transfer of the procured items to
DPC Thiruvananthapuram as sales by adding a margin to the procurement
price. DPC Thiruvananthapuram in turn accounted for the same as purchases
and ultimately sold them to the public by adding its own margin. The
Company was permitted to add a margin of 30 per cent only to cover handling
charges like loading, unloading, damage, manpower cost, transportation, small
margin, etc. As against this, it earned an overall margin varying from 50.77
per cent to 241.11 per cent (Appendix 7).
We also noticed that the farmers were not paid remunerative price as
illustrated below:
On 25 July 2016, the AGMARKNET price at Palakkad for
padavalam37
was `18/kg. According to the Cold Chain Scheme, the
Company was to procure padavalam at `11.34/kg38
. The Company,
however, procured 2,240 kg of padavalam from Palakkad district (on
25 July 2016) at `9/kg. Thus, the farmers were denied remunerative
price. Palakkad DPC distributed padavalam to DPC
Thiruvananthapuram at `12.50/kg, taking a margin of `3.5/kg and this
was finally sold by DPC Thiruvananthapuram for `30.70/kg adding a
further profit of `18.20/kg. Ultimately, the Company earned a profit of
241.11 per cent in this transaction whereas the farmer received only 29
paise of each rupee paid by the consumer as shown in Chart 2.1:
Chart 2.1: Share received by the farmers from each rupee paid by the
consumer in the illustrative case.
GoK accepted (January 2017) the audit observations and agreed to give
suitable directions to the Company to treat inter DPC transfers as stock
transfer and not as sales. GoK also stated that the system of adding abnormal
margin as pointed out by Audit would be avoided in future.
37Snake gourd. 38AGMARKNET price -`18/kg less 10 per cent (`1.80/kg) = `16.20/kg less 30 per cent (`4.86/kg) = `11.34/kg.
Farmers'
share
(29 per cent)
Company's
share
(71 per cent)
Chapter II – Performance Audit
61
Failure to pass on the subsidy to consumers and irregular claim of
subsidy from GoK
2.2.10.4 During festive seasons, GoK intervenes in the market through
the Company with the objective of stabilising the prices of vegetables and
fruits. According to the directions of GoK, the Company was to sell vegetables
at 30 per cent subsidy during the festive season (subsidy period). The GoK
gives necessary subsidy to the Company every year for making good the loss
incurred on account of subsidised sales to the public. During the period
2011-12 to 2015-16, GoK allotted `44.61 crore to the Company towards
market intervention activities.
On a review of the market intervention activities in five DPCs during the
Onam season, 2015-16 (17/08/2015 to 27/08/2015), we noticed that:
While fixing the selling price in four DPCs during the above festive
season, the Company did not adhere to the directions of the GoK on
fixation of selling price. In 167 out of 176 cases verified, the Company
fixed selling price without reducing 30 per cent from the prevailing
market price.
The Regional Managers of the DPCs concerned replied that the selling
prices were fixed below the local market rates during the subsidy
period. The reply was factually incorrect as the local market rates in
the website of (AGMARKNET) Government of India were less than
the rates adopted by the Company. We also noticed that the Company
did not have a system or defined guidelines to assess the market rate.
The Company was eligible to receive subsidy on sale of vegetables at
prices lower than the market price. Even though the Company did not
sell vegetables at subsidised rate during the above festive season, the
Company claimed subsidy from Government by reckoning wrong
market price for the vegetables sold.
We compared the market rate reckoned by the Company for claiming
subsidy for six vegetables during this period with their maximum retail
price (MRP) in the website of (AGMARKNET) Government of India.
On comparison of the prices of these items for 11 days individually,
we observed that the market rates reckoned by the Company for
claiming subsidy were higher than the MRP published in
AGMARKNET in 138 out of 176 cases as shown in Table 2.25.

Audit Report No.4 (PSUs) for the year ended 31 March 2016
62
Table 2.25: Instances where non-compliance of directions of GoK in fixing selling price
and reckoning of market rates in excess of AGMARKNET price.
Sl.
No. Name of the DPC
Total
number of
cases
reviewed
Number of cases
where selling price
exceeded the price to
be fixed as per
directions of GoK
Number of cases where
the market price reckoned
for claiming subsidy was
higher than
AGMARKNET rate
1 Thiruvananthapuram 54 52 49
2 Kollam 48 46 42
3 Kottayam 24 23 24
4 Palakkad 50 46 23
Total 176 167 138
The Government in its reply (January 2017) confirmed that, for controlling
price hike in open market during festive seasons, it gives directions to the
Company to sell the items below the market price. Further, as no hard and fast
rule regarding subsidy was in existence, GoK directed the Company to furnish
necessary proposals for taking further action.
The reply was not acceptable as the intention of providing subsidy was to
compensate any loss incurred by the Company due to price stabilisation
activities during festive seasons. Further, we noticed that the Company was
making abnormal profit during subsidy period and preferring incorrect claim
for subsidy with the Government.
Recommendation No. 5: A marketing policy which prescribes the method of
fixation of selling price should be adopted and it should be ensured that this
policy is strictly followed by the Regional Managers while fixing selling
price. The Company should pass on the benefit of subsidy received from the
Government to the public.
Inefficient operation of sales outlets
2.2.10.5 The Company markets its products through its own stalls and
licensed stalls. As on 31 March 2016, the Company had 293 licensed and 77
own stalls in the State. The position of stalls during the last five years
(2011-12 to 2015-16) is given in Table 2.26.
Table 2.26: Position of licensed and own stalls
Year Licensed stalls Own stalls
(Number)
2011-12 73 42
2012-13 115 72
2013-14 309 85
2014-15 365 79
2015-16 293 77
Performance of the licensed stalls and own stalls is discussed below:
The licensed stalls are working on the basis of a written agreement
entered into with the Company. The agreement stipulated that (a) In

Chapter II – Performance Audit
63
case the licensee takes supply of vegetables for less than 20 days or for
less than `3,000 per day, `50 per supply will be recovered from the
licensee as service charge and the total of the above amount will be
debited from the licensee‟s account at the end of each month, (b) The
licensee shall not display, advertise or sell any items other than those
supplied by the Company for sale through the retail stall except with
the written permission of the Company, (c) All sales shall be made at
the price fixed by the Company and intimated to the licensee from time
to time and licensee will maintain proper accounts. Price list should be
exhibited compulsorily; and (d) The stalls shall be compulsorily kept
open from 7 am to 7 pm every day.
We observed that only 46 out of 144 licensed stalls (March 2016) in
three DPCs (Thiruvananthapuram, Kollam, Kottayam) had lifted
vegetables for 20 days or more per month. We examined the reasons
for poor lifting of vegetables by conducting a joint physical
verification with the officials of the Company in 30 out of 144 stalls
functioning under these DPCs. Result of joint physical verification was
as discussed in Table 2.27.
Table 2.27: Details of result of joint physical verification
Sl.
No. Observation Conclusion
1 73.33 per cent (22
stalls) licensees replied
that the Company was
not able to supply
items in time. Supply
was normally provided
only after 11 am.
Failure to supply in time adversely affects fresh supply of
vegetables to the public. During the survey, it was revealed
that 19 stalls (63.33 per cent) procured items from open
market. Sale of items procured from open market under the
brand name of the Company would adversely affect the
goodwill of the Company, as the quality of these items cannot
be ensured. Selling with the Company caption (“Safe to eat
vegetables procured from farmers of Kerala is available here”)
is also tantamount to deceiving the general public.
2 25 stalls (83.33 per
cent) did not exhibit
the selling price on the
price board.
Collection of excess price from consumers cannot be ruled out
as the consumers are unaware of the daily price.
For own stalls, the Company fixed (July 2015) sales target of minimum
`5,000 per day per employee. It was also decided to close its own
stalls, which failed to meet the target.
On a review of sales made by Company‟s own stalls in the selected
DPCs for the month of March 2016, we observed that the daily target
was `6 lakh per day (120 staff in 42 own stalls), while the average
actual achievement was only `3.22 lakh i.e., a shortfall of 46.33 per
cent. Further, 33 out of 42 stalls did not achieve the target of
minimum `5,000 per day per employee. While 80 per cent of stalls in
DPC Kottayam and 10 per cent of stalls in DPC Kollam achieved the
target, none of the stalls in other three DPCs achieved the target.
Audit Report No.4 (PSUs) for the year ended 31 March 2016
64
We noticed that 17 own stalls of DPC Thiruvananthapuram were
concentrated in 4 Panchayaths and in Corporation area while there was
no own stall in the remaining 79 Panchayaths in the district which may
also have contributed to the poor performance of its own stalls.
Regarding poor performance of licensed stalls, GoK replied (January
2017) that it was planning to convene a meeting with the licensees to
formulate a policy for upgrading the performance of the licensed
outlets and to cut down non-profitable ones. However, GoK did not
give any reasons for the poor performance of Company‟s own stalls.
Availability of quality vegetables at reasonable price to the general public in
the State could not be ensured by the Company due to inefficient monitoring
of licensed stalls and own stalls.
Recommendation No.6: Specific targets should be fixed for both own and
licensed stalls and their performance should be closely monitored.
Loss due to excessive damage of vegetables
2.2.11 Vegetables and fruits are prone to damage during transportation and
storage at DPCs and sale in licensed stalls and own stalls. As per Cold Chain
Scheme, eight per cent average weight loss was permissible during
transportation and storage. The Company, however, had not fixed any limit of
permissible damage for vegetables and fruits during various stages of
procurement and sales.
We noticed that:
The Company did not have a uniform policy for controlling and
minimising damage in the sales outlets. The licensed stalls were
allowed damage up to two per cent of the gross value of vegetables
supplied to them. However, no such limits were prescribed for its own
stalls. Only DPC Thiruvananthapuram had fixed five per cent ceiling
as permissible damage for its own stalls.
Scrutiny of the procurement and sales of 21 vegetables/ fruits at DPCs
in Thiruvananthapuram, Kollam and Kottayam for 2014-15 and
2015-16 revealed that the damage in excess of eight per cent allowable
weight loss on transportation and storage was `3.49 crore. Major
reason for excess damage was purchase (13,980 MT39
) in excess of the
indented quantity (11,138 MT). Further, the Company did not have
adequate marketing outlets for selling and storage facilities for storing
the vegetables procured in excess of indented quantity.
Excess damage was also noticed in respect of items which are not
quickly perishable like banana, ginger, drumstick and onion for the
same period as shown in Table 2.28.
39Indented quantity in respect of DPC Kottayam was not available. Hence, figures of DPCs
Thiruvananthapuram and Kollam were taken.

Chapter II – Performance Audit
65
Table 2.28: Details of percentage of damage on selected items
Sl.
No. Item
Total procurement
during 2014-16
Total damage
during 2014-16 Percentage
of damage (in MT)
1 Banana 2059 360 17.48
2 Ginger 341 65 19.06
3 Drumstick 374 63 16.84
4 Onion (small) 847 136 16.06
The DPCs failed to monitor the damage at its own stalls and no
recovery was made from the stall-in-charges concerned. As a result, in
four DPCs, value of excess damage after providing for five per cent
allowable damage worked out to `87.10 lakh as given in Table 2.29.
Table 2.29: Details of excess damage in own stalls
Name of DPC Sales Damage
Allowable
damage
Excess
damage Period40
(` in lakh)
Thiruvananthapuram 412.94 25.65 20.65 5.00 October 2015 to
March 2016
Kollam 1,295.74 126.29 64.79 61.50 2011-12 to2015-16
Kottayam 880.16 63.92 44.01 19.91 2013-14 to 2015-16
Palakkad 15.28 1.45 0.76 0.69 December 2015 to
March 2016
Total 2,604.12 217.31 130.21 87.10
Thus, inefficient management led to excess damage and non-recovery of
consequent loss from the delinquent officials.
Accepting the audit observation, the Company agreed to fix the maximum
allowable limit of damage and to fix responsibility on the staff concerned for
excess damage in future. This was also endorsed (January 2017) by GoK.
Recommendation No. 7: The Company may fix norms for maximum
permissible percentage of damage for each category of vegetables and fruits.
The staff concerned should be held responsible if damage happens above the
permissible limit.
Quality of vegetables sold as „Safe to eat‟
2.2.12 GoK implemented Annual Plan scheme (2012-13), „Production and
marketing Safe to Eat vegetables‟ through Government outlets with the
objective of monitoring pesticide residues in vegetables and fruits. The
Company was selling vegetables and fruits under the banner „Safe to eat‟.
We observed that the Company did not monitor pesticide residue in vegetables
and fruits for selling the same under the banner „Safe to eat‟. Examination of
pesticide residues in vegetables and fruits in Company‟s outlets by
independent agencies disclosed the following facts.
40 Period for which records were made available to Audit.

Audit Report No.4 (PSUs) for the year ended 31 March 2016
66
The lab test done on vegetable samples collected from two outlets of
the Company in Thiruvananthapuram during the period from January
to December 2013 by Kerala Agricultural University revealed that 26
out of 48 samples were unsafe to eat due to high pesticide content.
Similarly, nine out of 20 samples collected during the period from
January to December 2014 were found unsafe to eat.
At the instance of Audit, the Assistant Commissioner of Food Safety
collected eight samples from DPC Thiruvananthapuram and two
samples from Company‟s own stall at Kowdiar and found that two
items viz., salad cucumber and chilli contained pesticides above the
permissible limit as shown in Table 2.30.
Table 2.30: Details of pesticides found in vegetables
Name of the
item
Name of
pesticide found
Permissible limit
of the pesticide Result
Salad cucumber Acephate 0.050 mg/kg-1
0.769 mg/kg-1
Chilli
Profen
Acephate
Thiamethoxam
0.050 mg/kg-1
0.050 mg/kg-1
0.050 mg/kg-1
2.170 mg/kg-1
0.520 mg/kg-1
0.053 mg/kg-1
We observed two instances of food poisoning after consumption of
vegetables purchased from the Company as discussed below:
During June 2014, students and teachers of Government Higher
Secondary School for Girls, Cotton Hill, Thiruvananthapuram were
hospitalised due to food poisoning after consuming vegetables (yam)
supplied by the Company. The Kerala State Commission for Protection
of Child Rights had directed (February 2015) the Company to ensure
the quality of vegetables supplied. Further, in July 2016, the Director
General of Prisons and Correctional Services informed that tapioca
supplied by the Company to Special Sub-Jail, Thiruvananthapuram had
caused stomach ailments to the jail inmates. The Superintendent of the
Jail also appraised (July 2016) the Company regarding the poor quality
of tapioca supplied to them.
While accepting the audit observation, GoK informed that directions had
already been given to the Company to furnish necessary proposals for starting
chemical test laboratories in all the districts.
Lapses in Internal Control system
Lapses in accounting of procurement and damage
2.2.13 The following Internal Control lapses were noticed:
The Company collected indents on a daily basis from the stalls and
institutions to ascertain their requirement of vegetables and fruits on
the next day. However, these indents were not properly tabulated and
purchases regulated in accordance with indented quantity. We

Chapter II – Performance Audit
67
observed excess procurement of vegetables and fruits in two DPCs as
shown in Table 2.31:
Table 2.31: Excess procurement of vegetables and fruits
Excess procurement led to abnormal damage of vegetables and fruits
as stated in Paragraph 2.2.11.
At Sub-Centre Poojapura, DPC Kottayam and DPC Kollam, we
noticed that purchases were made from one person, but payments were
made to a different person. Illustrative cases of such irregularities for
the settlement of purchase bills are given in Appendix 8.
Payment vouchers were prepared and passed by a temporary Accounts
Assistant instead of a permanent staff authorised by the MD of the
Company. As the payments were made in cash and details of
purchases, sales, closing stock and damage were not recorded in the
stock register, the possibility of payment based on bogus bills could
not be ruled out. The situation was more alarming at the Sub Centre
Poojappura as it recorded purchases showing only the amount and
name of suppliers in Tally Software while more specific details like,
name of item, quantity procured, rate/kg, etc., were not recorded.
Stock register was not maintained at DPC Kollam while it was not
properly maintained at DPC Thiruvananthapuram and Sub-Centre Poojappura;
Cash Book was not updated at DPC Thiruvananthapuram and Sub-Centre Poojappura;
In the absence of such primary records, fraudulent practices could not be ruled
out. It is also pertinent to mention that the Finance Inspection Wing of GoK
found blank bill books of two suppliers from the Company‟s head office and
Sub-DPC Chadayamangalam.
The Company/GoK accepted the audit observations and agreed to issue proper
directions to all DPCs for proper maintenance of records. It also agreed to give
directions to the managers to procure vegetables from the farmers‟ cluster with
proper bills duly countersigned by the agriculture officer concerned.
Name of the DPC Year
Indented
quantity
Procured
quantity
Excess
quantity
(MT)
Thiruvananthapuram 2014-15 6,423 7,059 636
2015-16 2,803 4,067 1,264
Kollam 2014-15 893 1,618 725
2015-16 1,019 1,236 217
Total 11,138 13,980 2,842
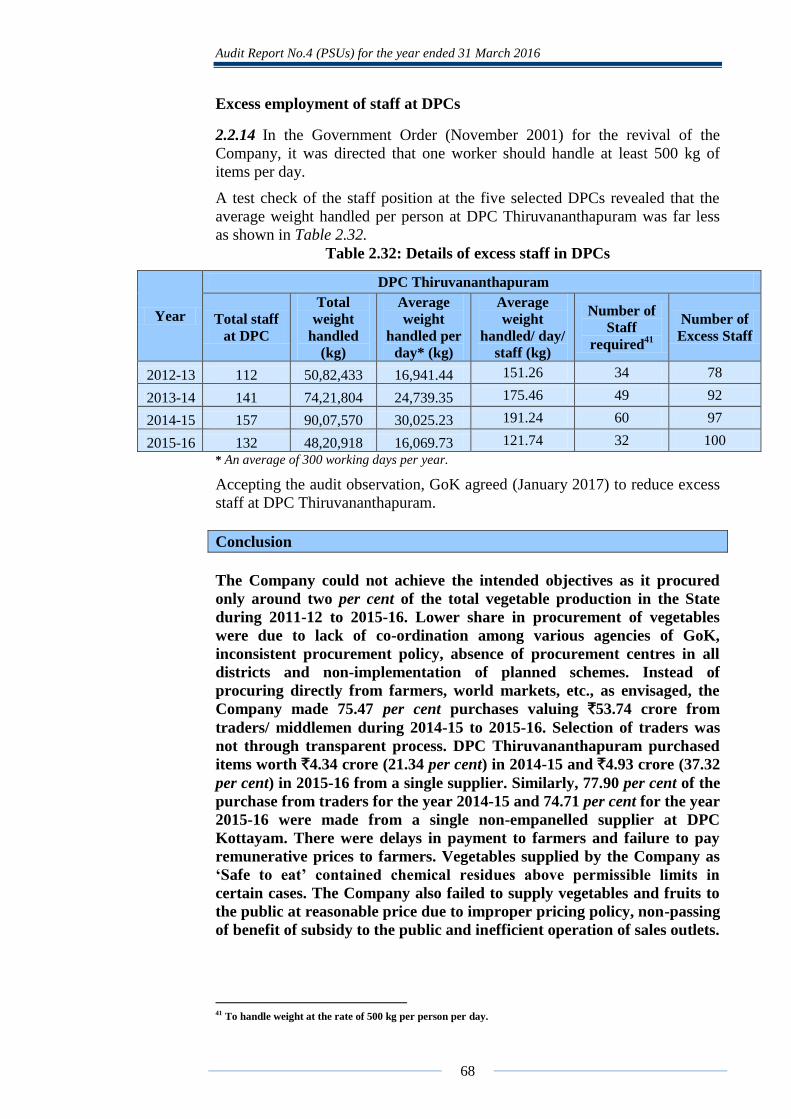
Audit Report No.4 (PSUs) for the year ended 31 March 2016
68
Excess employment of staff at DPCs
2.2.14 In the Government Order (November 2001) for the revival of the
Company, it was directed that one worker should handle at least 500 kg of
items per day.
A test check of the staff position at the five selected DPCs revealed that the
average weight handled per person at DPC Thiruvananthapuram was far less
as shown in Table 2.32.
Table 2.32: Details of excess staff in DPCs
Year
DPC Thiruvananthapuram
Total staff
at DPC
Total
weight
handled
(kg)
Average
weight
handled per
day* (kg)
Average
weight
handled/ day/
staff (kg)
Number of
Staff
required41
Number of
Excess Staff
2012-13 112 50,82,433 16,941.44 151.26 34 78
2013-14 141 74,21,804 24,739.35 175.46 49 92
2014-15 157 90,07,570 30,025.23 191.24 60 97
2015-16 132 48,20,918 16,069.73 121.74 32 100
* An average of 300 working days per year.
Accepting the audit observation, GoK agreed (January 2017) to reduce excess
staff at DPC Thiruvananthapuram.
Conclusion
The Company could not achieve the intended objectives as it procured
only around two per cent of the total vegetable production in the State
during 2011-12 to 2015-16. Lower share in procurement of vegetables
were due to lack of co-ordination among various agencies of GoK,
inconsistent procurement policy, absence of procurement centres in all
districts and non-implementation of planned schemes. Instead of
procuring directly from farmers, world markets, etc., as envisaged, the
Company made 75.47 per cent purchases valuing `53.74 crore from
traders/ middlemen during 2014-15 to 2015-16. Selection of traders was
not through transparent process. DPC Thiruvananthapuram purchased
items worth `4.34 crore (21.34 per cent) in 2014-15 and `4.93 crore (37.32
per cent) in 2015-16 from a single supplier. Similarly, 77.90 per cent of the
purchase from traders for the year 2014-15 and 74.71 per cent for the year
2015-16 were made from a single non-empanelled supplier at DPC
Kottayam. There were delays in payment to farmers and failure to pay
remunerative prices to farmers. Vegetables supplied by the Company as
„Safe to eat‟ contained chemical residues above permissible limits in
certain cases. The Company also failed to supply vegetables and fruits to
the public at reasonable price due to improper pricing policy, non-passing
of benefit of subsidy to the public and inefficient operation of sales outlets.
41 To handle weight at the rate of 500 kg per person per day.

Chapter II – Performance Audit
69
2.3 Information System Audit of HT and EHT Billing and Accounting
software used by Kerala State Electricity Board Limited
Executive Summary
Introduction
Kerala State Electricity Board Limited (Company), incorporated in January
2011, is engaged in generation, transmission and distribution of electricity in
Kerala. The electricity consumers of the Company are divided into Low
Tension (LT), High Tension (HT) and Extra High Tension (EHT) categories.
HT/EHT Billing Process
The electricity consumption of HT/EHT consumers was assessed for billing by
the Assistant Engineers at Electrical Section offices through meter reading.
Meter reading data along with other details were thereafter sent to Special
Officer-Revenue (SOR) at the Corporate Office. The authorised staff at SOR
uploaded the data into the billing software and bills were generated.
Software development and implementation
Tata Consultancy Services Limited (TCS) was awarded the work of providing
and implementing HT/EHT billing system and web enabled services (Phase 1)
and providing and implementing Automated Meter Reading System for
HT/EHT consumers (Phase 2).
We observed delay in framing of System Requirement Specification,
incomplete development of software, lack of planning in implementation and
non-implementation of Automated Meter Reading System.
Mapping of business rules
All business processes relating to billing, collection and accounting of
HT/EHT consumption had to be mapped correctly in the application software.
Further, the business processes mapped in the software had to be compliant
with the applicable laws, rules and regulations with all the necessary controls
to ensure that the amount billed and collected conformed to the prescribed
rules and regulations.
We observed that relevant business rules had not been fully and correctly
mapped into the application, which had an impact on the revenue realisation.
General IT controls
General controls are concerned with the organisation’s IT infrastructure, IT
related policies and working practices. We observed issues in Data migration,
password policy, etc.
Application controls
Application controls include input control and validation control. Application
controls are used in a computer system to provide assurance that all
transactions are valid, authorised and complete. We noticed lack of proper
input controls and validation controls.

Audit Report No.4 (PSUs) for the year ended 31 March 2016
70
Generation of reports
The application software must be capable of generation of quality reports on
various data coming under its purview. Further, the application should be
designed to generate reports on regular basis as and when required by the
stakeholders.
We noticed that incorrect and incomplete data were stored and processed in
the billing software and consequently inaccurate and unreliable reports were
generated.
Introduction
2.3.1 Kerala State Electricity Board Limited (Company), incorporated in
January 201142
, is engaged in generation, transmission and distribution of
electricity in Kerala. The electricity consumers of the Company are divided
into Low Tension43
(LT), High Tension44
(HT) and Extra High Tension45
(EHT) categories.
As of March 2016, the Company had 1.17 crore LT consumers, 5020 HT
consumers46
and 53 EHT consumers47
. These consumers had been billed for
consumption of electricity at rates approved as per the Tariff Orders of the
Kerala State Electricity Regulatory Commission (KSERC). The billing of
consumers was also subject to the provisions of Kerala State Electricity
Supply Codes (Supply Code) 2005 and 2014.
With a view to automate key revenue billing and collection activities in
respect of HT/EHT consumers and to improve customer satisfaction, the
Board of Directors (BoD) of the Company decided (July 2008) to implement a
comprehensive and fully automated computerised system consisting of
HT/EHT billing application software, Automated Meter Reading (AMR)48
system and web enabled services for the HT/EHT consumers. The Company
introduced the billing and accounting software, Enterprise Related Generalised
Information System (ENRGISE) developed by Tata Consultancy Services
Limited (TCS) in September 2010. ENRGISE was based on Linux operating
system and used Postgres Plus Advanced Server for database management.
Details of revenue from HT/EHT consumers and the total revenue from sale of
power during the last five years ending 2015-16 are given in Table 2.33.
42The Company was formed after unbundling the erstwhile Kerala State Electricity Board in accordance with
the provisions of Electricity Act, 2003. 43Low Tension consumers are those consumers who avail supply of electricity at a voltage not exceeding 1,000
volts under normal conditions subject to the percentage variation as may be specified by the Central Electricity
Authority (CEA) from time to time. 44High Tension consumers are those consumers who avail supply of electricity at voltage higher than 1000 volts
but do not exceed 33,000 volts under normal conditions subject to the percentage variation as may be specified
by the CEA from time to time. 45Extra High Tension consumers are those consumers who avail supply of electricity at voltage higher than
33,000 volts under normal conditions subject to the percentage variation as may be specified by the CEA from
time to time. 46 Excluding dismantled service connections. 47 Excluding dismantled service connections. 48The main objective of AMR system is to acquire meter data from HT/EHT consumer meters automatically
from remote avoiding any human intervention.
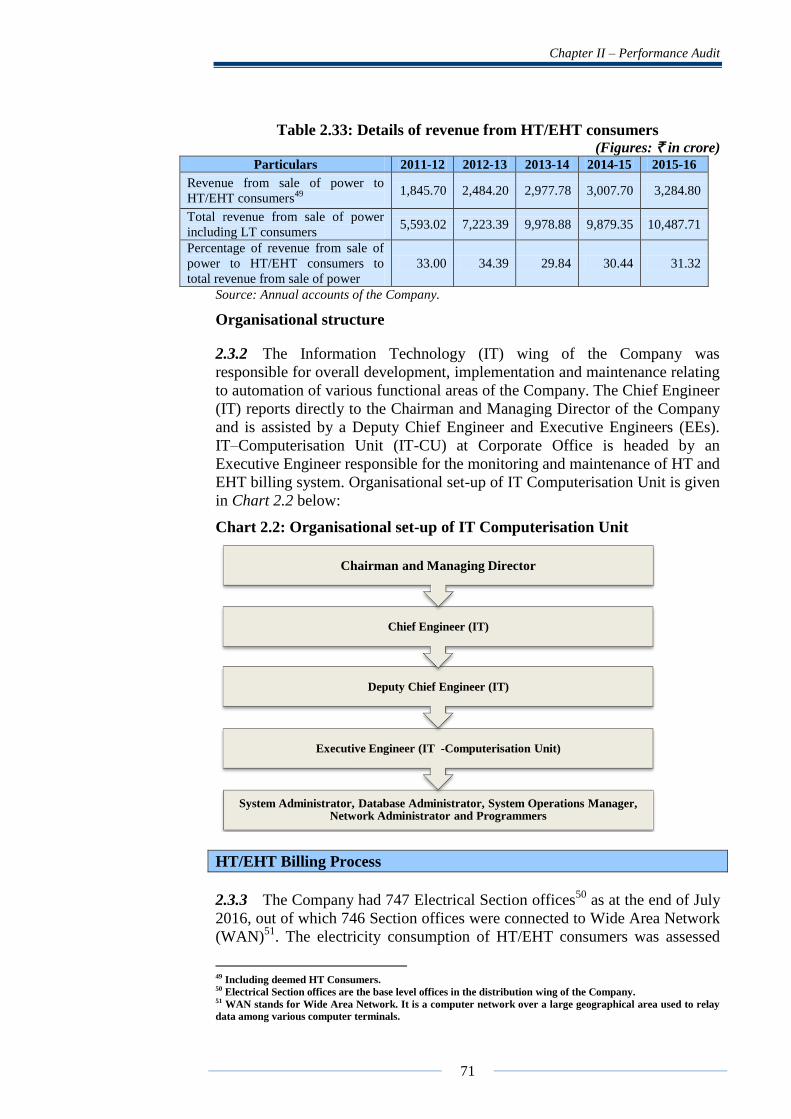
Chapter II – Performance Audit
71
Table 2.33: Details of revenue from HT/EHT consumers (Figures: ` in crore)
Particulars 2011-12 2012-13 2013-14 2014-15 2015-16
Revenue from sale of power to
HT/EHT consumers49
1,845.70 2,484.20 2,977.78 3,007.70 3,284.80
Total revenue from sale of power
including LT consumers 5,593.02 7,223.39 9,978.88 9,879.35 10,487.71
Percentage of revenue from sale of
power to HT/EHT consumers to
total revenue from sale of power
33.00 34.39 29.84 30.44 31.32
Source: Annual accounts of the Company.
Organisational structure
2.3.2 The Information Technology (IT) wing of the Company was
responsible for overall development, implementation and maintenance relating
to automation of various functional areas of the Company. The Chief Engineer
(IT) reports directly to the Chairman and Managing Director of the Company
and is assisted by a Deputy Chief Engineer and Executive Engineers (EEs).
IT–Computerisation Unit (IT-CU) at Corporate Office is headed by an
Executive Engineer responsible for the monitoring and maintenance of HT and
EHT billing system. Organisational set-up of IT Computerisation Unit is given
in Chart 2.2 below:
Chart 2.2: Organisational set-up of IT Computerisation Unit
HT/EHT Billing Process
2.3.3 The Company had 747 Electrical Section offices50
as at the end of July
2016, out of which 746 Section offices were connected to Wide Area Network
(WAN)51
. The electricity consumption of HT/EHT consumers was assessed
49 Including deemed HT Consumers. 50 Electrical Section offices are the base level offices in the distribution wing of the Company. 51 WAN stands for Wide Area Network. It is a computer network over a large geographical area used to relay
data among various computer terminals.
System Administrator, Database Administrator, System Operations Manager, Network Administrator and Programmers
Executive Engineer (IT -Computerisation Unit)
Deputy Chief Engineer (IT)
Chief Engineer (IT)
Chairman and Managing Director

Audit Report No.4 (PSUs) for the year ended 31 March 2016
72
for billing by the Assistant Engineers (AEs) at Electrical Section offices
through meter reading52
taken manually. Meter reading data along with other
details were thereafter sent53
to Special Officer-Revenue (SOR) at the
Corporate Office. The authorised staff at SOR uploaded the data into the
billing software and bills were generated. The bills were then issued to the
consumers for making payments.
Audit Objectives
2.3.4 The audit objectives were to assess whether:
there existed a proper plan and procedure to develop and implement
the system to achieve the Company‟s objectives and requirements;
the system efficiently supported the business process and ensured
compliance of applicable rules and regulations and the bills were
generated accordingly;
adequate security controls were in place in the system; and
the system provided complete, reliable and authorised information for
management use.
Audit Criteria
2.3.5 Audit adopted the following criteria:
Business rules, regulations and procedures of the Company;
Information security policy and password policy of the Company;
Orders/ circulars/ notifications issued by Government of India,
Government of Kerala and Board of Directors of the Company from
time to time;
Tender documents and request for proposal and System Requirement
Specification; and
Best practices for IT development and implementation.
Audit scope and methodology
2.3.6 The scope of IT Audit included the evaluation of the software used for
computerised HT/EHT billing and the effectiveness of the software in
generating correct billing for the Company. The scope also included review of
records at IT-CU and office of the SOR at Corporate office. The data of bills
maintained in the central server, located at Corporate Office of the Company
at Thiruvananthapuram, in respect of all HT/EHT consumers pertaining to the
period April 2011 to July 2016 was selected for checking and evaluation with
a view to ascertain completeness, regularity, integrity and consistency of data.
The entire data of the above period was obtained in the form of a database
dump and was analysed using Computer Assisted Audit Techniques. The
adequacy of IT controls was evaluated to identify loss/omission/excess
collection of revenue and to ensure comprehensiveness of the billing software.
52The meter readings were taken at every billing cycle normally at the end of a month. 53 From July 2016 onwards, AEs of all Electrical Section offices were allowed to upload the meter reading data
directly to the billing system.

Chapter II – Performance Audit
73
Audit Findings
2.3.7 Audit findings on the computerisation of HT/EHT billing system are
discussed in succeeding paragraphs.
2.3.8 Software development and implementation
Delay in framing of System Requirement Specifications
2.3.8.1 As per the work order, system study and design and coding had to be
completed by Tata Consultancy Services Limited (TCS) by November 2009.
System Requirement Specifications54
(SRS) which is vital for development of
the software should have been submitted before November 2009. We observed
that the SRS was submitted by the TCS in April 2010 after a delay of four
months and the BoD of the Company approved the SRS only in November
2010 after parallel running and system testing. The system development and
implementation was, thus, done by TCS without a formally approved and
mutually agreed SRS.
GoK replied (January 2017) that a functional committee having domain
experts had approved the SRS in June 2010.
The reply was not acceptable since the SRS had to be approved before the
completion of software development and system integration. The SRS was,
however, approved (November 2010) only after the completion of software
development and system integration in June 2010.
Incomplete development
2.3.8.2 A tender was invited (September 2008) for the computerisation of the
HT/EHT billing system and the work was awarded (June 2009) to TCS who
quoted the lowest price of `3.99 crore. The scope of the work included
providing and implementing HT/EHT billing system and web enabled services
(Phase 1) and providing and implementing AMR system for HT/EHT
consumers (Phase 2).
TCS completed the software development and the system integration55
of
HT/EHT Billing Application (Phase 1) in June 2010 and the software was
tested on pilot basis (parallel run) for two months (July and August 2010) by
generating bills of five months, April to August 2010. The billing software
was rolled out in September 2010 and monthly bills for all HT/EHT
consumers for the month of September 2010 were generated and sent to the
consumers. Thereafter, the new software was being used for bill generation of
all HT/ EHT consumers. The web enabled services were commissioned in July
2011.
The functionalities like Reports on revenue loss due to theft of power, Security
Deposit (SD) assessment, Consumer Personal Ledger (CPL) and Unauthorised
54 A System Requirements Specification is a description of a software system to be developed. It lays out
various requirements of a system. 55 System integration is the process of bringing together the sub-systems into one system.

Audit Report No.4 (PSUs) for the year ended 31 March 2016
74
Additional Load (UAL) billing and Audit are indispensable for correct and
timely billing of consumers, timely revenue collection, proper and correct
review of SD, proper accounting of collections, billing/ levying of penalty for
UAL, etc. Though these were included in the System Requirement
Specification (SRS), functionalities like SD assessment and CPL were
incorporated or implemented after rolling out of the software. We also noticed
that the implementation of these functionalities were defective as discussed in
Paragraphs 2.3.9 and 2.3.12. The functionalities like Reports on revenue loss
due to theft of power, UAL billing and Audit were yet to be incorporated
(January 2017).
Government of Kerala (GoK) replied (January 2017) that SD assessment,
detection of theft and UAL were done at field offices (Electrical Section
offices) and provision was given in the application for capturing these details
as per the SRS. The reply was not acceptable as the functionalities like
Reports on revenue loss due to theft of power, UAL billing and Audit were yet
to be incorporated (January 2017) and implemented. Functionalities like SD
assessment and CPL were defective.
Non-implementation of Automated Meter Reading system
2.3.8.3 Even though the computerised billing (Phase 1: cost `1.93 crore) was
rolled out in September 2010, the Company had not awarded the work order
for implementing the AMR system (Phase 2) as of September 2016 as the
Company claimed that none of the bidders had proven experience in
implementation of AMR system in India. In the absence of bidders with
experience in AMR system, the Company had decided to implement AMR in
a phased manner. Subsequently, the Company decided (January 2010) to
implement AMR system under RAPDRP56
scheme announced by Government
of India (GoI) in which financial assistance was available for implementation
of AMR. However, AMR system under RAPDRP had not been implemented
so far (January 2017).
Due to non-implementation of AMR system, SOR/IT-CU wings at Corporate
Office were deprived of direct access to the meter data of the consumers and
therefore, meter readings were being done manually. Data transfer from
Electrical Section offices to the central server was, therefore, subjected to
human interventions.
GoK stated (January 2017) that the implementation of AMR system was
excluded as the Company decided to implement it under RAPDRP scheme
announced by GoI during the same period in which financial assistance for the
same was available. The fact, however, remained that the Company could not
implement the AMR even under RAPDRP so far (January 2017).
Mapping of business rules
2.3.9 HT/EHT billing process was a mission critical system, which directly
impacts the revenue collection of the Company. Therefore, all business
56 Restructured Accelerated Power Development and Reforms Programme was a power reforms scheme
introduced by GoI.

Chapter II – Performance Audit
75
processes relating to billing, collection and accounting of HT/EHT
consumption had to be mapped correctly in the application software. Further,
the business processes mapped in the software had to be compliant with the
applicable laws, rules and regulations with all the necessary controls to ensure
that the amount billed and collected conformed to the prescribed rules and
regulations.
We observed that relevant business rules had not been fully and correctly
mapped into the application, which had an impact on the revenue realisation as
discussed in succeeding paragraphs.
Short collection of energy charges from deemed HT consumers
2.3.9.1 As per the Supply Codes, 2005/ 2014, electricity connections with
contract demand (CD) 100 kVA or below were allowed to draw electricity
from LT distribution lines. KSERC, however, allowed a few consumers who
were drawing electricity at LT voltage with CD above 100 kVA before the
introduction of Supply Code, 2005 to continue this facility. These consumers
were classified by the Company as Deemed HT consumers with effect from
March 2005. As per the schedule of tariff issued by KSERC with effect from
May 2013, the deemed HT consumers were to be charged57
under HT and LT
tariff for demand and energy charges, respectively. The Company had 64
deemed HT consumers as of August 2016.
We, however, noticed that billing procedure mapped in the system for deemed
HT consumers was not as per the above schedule of tariff issued by KSERC
but same as applied for HT consumers with an additional three per cent energy
charges. The additional three per cent was charged since the billing of both
demand and energy charges of deemed HT consumers under the HT Tariff
would result in revenue loss to the Company. However, this three per cent was
not sufficient to make good the revenue loss in the case of deemed HT
consumers except industrial and agricultural consumers. This resulted in short
collection of energy charges amounting to `1.44 crore from 22 deemed HT
consumers for the period from May 2013 to July 2016.
GoK replied (January 2017) that there was no clear classification of deemed
HT consumers in Supply Code 2014. GoK also stated that the matter had been
taken up with KSERC and was being implemented in the system.
The reply was not acceptable since the Company had classified these
consumers as deemed HT consumers since March 2005 and could be
separately identified from the database. Further, the failure to charge deemed
HT consumers as per the Schedules of Tariff resulted in revenue loss to the
Company.
Non-collection of increased demand charge from seasonal consumers
2.3.9.2 As per the tariff order, seasonal consumers58
are billed for the period of
actual use of power under appropriate tariff category. The monthly minimum
57 Charges for electricity mainly include two components (1) Demand charge on the connected load/ contract
demand and (2) Energy charges based on the units consumed. 58 Seasonal consumers are those consumers who are registered as seasonal consumers with the Company and
intend to avail electricity only during a season in a year under HT Tariff. They will not be billed for the idling
period.

Audit Report No.4 (PSUs) for the year ended 31 March 2016
76
charges for the billing period shall be 75 per cent of the Contract Demand59
as
increased by a formula i.e., 5(12-N) % where „N‟ is the number of months
during which the consumer registers himself to utilise the power in a year.
There were three seasonal customers as noticed from the database.
We observed that this business rule of charging increased minimum charges
was not mapped into the system. As a result, the system failed to collect
increased demand charges amounting to `5.08 lakh from these three
consumers60
during April 2011 to March 2016.
GoK replied (January 2017) that action had been taken for realising the short
collection.
Non-mapping of business rule with regard to annual review of contract
demand
2.3.9.3 As per Regulation 101 of the Electricity Supply Code 2014, if the
recorded Maximum Demand (MD) of HT/EHT consumer exceeded the
contract demand61
(CD) in any three billing periods during the previous
financial year, the Company shall issue a notice of 30 days to the consumer to
submit an application for enhancement of contract demand within the notice
period. If there was no response from the consumer within the notice period,
the Company shall enhance the contract demand of the consumer to the extent
of average three top readings of MD during the previous financial year. If the
distribution system is not adequate to meet the enhanced demand, the
consumer shall be directed to restrict the demand to the permissible limit, till
necessary augmentation/upgradation/uprating works are done in the
distribution system.
We observed that the above business rule was not incorporated effectively in
the system as detailed below:
During 2014-15, recorded MD in respect of 803 consumers exceeded the
CD in three or more billing periods. 640 of these consumers did not,
however, enhance the CD during the year 2015-16 as required by the
Supply Code 2014.
Distribution system of the Company was sufficient to meet the enhanced
demand of 616 consumers out of the above 640 consumers. Had the
Company enhanced the CD as per the requirements of
Supply Code 2014, the demand charges could have been charged on
these 616 consumers on the enhanced CD from May 2015 onwards
(taking into account the notice period of 30 days). The enhanced demand
charges foregone, for the period from May 2015 to March 2016 worked
out to `2.43 crore. Supply Code 2014
62 provided for review of security deposit of
consumers on enhancement of contract demand by adopting a
59Contract demand means the maximum demand of energy agreed to be supplied by the licensee (Company). 60 Consumers Numbers: 1365040000096 (`0.76 lakh), 1365040002974 (`0.97 lakh) and 1366750003726 (`3.35
lakh). 61 Contract demand means the maximum demand of energy agreed to be supplied by the licensee (Company). 62Regulation 68.

Chapter II – Performance Audit
77
methodology63
for determining the security deposit. We, however,
observed that this provision to review the adequacy of security deposit
on enhancement of contract demand was not mapped in the system.
GoK replied (January 2017) that appropriate action would be taken to
regularise contract demand and further stated that there was no financial
loss as the Company had been charging 50 per cent extra over the
normal demand charges whenever MD exceeded CD.
The reply was not correct as the enhanced demand charge foregone had
been worked out after considering the excess demand charges levied by
the Company during the month in which the actual consumption
exceeded the CD.
Mapping of wrong tariff
2.3.9.4 Tariffs were determined on the basis of the purpose for which
electricity was used by consumers. Prior to August 2014, banking and
financial institutions, Government guest houses, insurance and
telecommunication companies drawing electricity at high tension voltage were
billed under „HT IV Commercial tariff‟. As per the schedule of tariff which
came into effect from August 2014, banking and financial institutions and
Government guest houses were classified under „HT II A (General)‟ tariff and
insurance and telecommunication companies were classified under „HT II B
(General)‟ tariff. Under the revised tariff order, the tariff rates applicable to
HT II A and HT II B consumers were lower than that of HT IV consumers.
We observed that the revised categorisation of consumers and their tariffs
were not updated/ mapped into ENRGISE. Consequently, 11 banking
companies, three guest houses, three insurance companies and three
telecommunication companies continued to be billed under the pre-revised
tariffs. This resulted in excess collection of energy charges amounting to
`87.23 lakh from the above consumers during August 2014 to March 2016.
GoK replied (Janaury 2017) that report from the agreement authority64
concerned was required for assigning new purposes based on the new tariff
order and the change of tariff would be effected based on such reports. The
reply, however, was silent on the above mentioned consumers.
Excess collection of meter rent
2.3.9.5 Until September 2014, the applicable meter rent per month for energy
meters with Availability Based Tariff (ABT)/ Time of the Day (TOD)
facilities supplied by the Company was `5,000 for the first month of
electricity connection and `6,000 thereafter. The KSERC had revised
(September 2014) the meter rent for ABT/ TOD meters as `1,000 with effect
from October 2014. BoD of the Company had also adopted the revised meter
rent in November 2014.
63 In the case of enhancement of load, cash deposit shall be collected by adopting the formula- Load * Load
Factor of the category in which consumer falls * Period taken for determination of security deposit * Current
tariff in which load factor is the percentage value varying from 40 to 100 per cent depending upon the tariff of
the consumer as given in the Annexure 3 to Supply Code 2014. 64 Agreement authorities are Deputy Chief Engineers/ Chief Engineers who enter into agreement with
consumers for electricity connection.

Audit Report No.4 (PSUs) for the year ended 31 March 2016
78
We observed that the change in the meter rent was not properly incorporated
in the system and as a result, the Company continued to collect meter rent at
higher rates from 22 consumers during the period from October 2014 to
August 2016 resulting in excess collection of meter rent amounting to `9.86
lakh.
While accepting the observation, GoK stated (January 2017) that modification
in the application was being done for implementing the same.
Penal interest on belated payment
2.3.9.6 As per the Regulation 131 of Supply Code 2014, if a consumer failed
to remit the bill amount on or before the due date, the Company shall recover
interest on the amount of the bill at the rate of 12 per cent per annum for delay
up to 30 days and thereafter, at the rate of 18 per cent per annum for the entire
period of delay.
We noticed that the above provision in the Supply Code 2014 was not mapped
in the system. Due to this, there was shortfall in collection of interest of
`14.72 lakh from 349 consumers who had paid the electricity bill belatedly
during the period from April 2014 to March 2016.
GoK replied (January 2017) that the errors were due to wrong calculation of
arrear and a separate team had been formed for correcting the errors identified.
Collection of electricity duty
2.3.9.7 As per the Kerala Electricity Duty Act, 1963, consumers were liable to
pay electricity duty at specified rate to the State Government for consumption
of energy. Section 12 of the Act, however, exempted institutions of
Government of India from payment of electricity duty.
We observed that the Company had not effectively mapped this rule into the
system which resulted in:
Collection of electricity duty amounting to `17.16 lakh from five
institutions of Government of India. Though consumers were being
tagged as „Central Government‟ in the system, Electricity Duty was
collected from them. This indicated that the charging of the Electricity
Duty was not automated in the system and was subjected to human
intervention.
Non-collection of electricity duty amounting to `4.81 lakh from three
consumers during the period from April 2011 to July 2016.
GoK intimated that exemption field for five „Central Government‟ consumers
identified by Audit was updated and electricity duty field of other three
consumers was made applicable and bills were revised accordingly. It was also
assured that the software would be modified to charge electricity duty from all
consumers except the specified categories.
Deficiencies in determination and collection of Security Deposit (SD)
2.3.9.8 As per the Supply Code 2014, consumers were required to provide SD
at the rates approved by the KSERC for availing electricity connection. The

Chapter II – Performance Audit
79
amount of SD was determined by adopting a formula65
. This formula was also
adopted for calculating the amount of SD at the time of addition of connected
load. Further, all HT consumers were required to maintain SD equivalent to
two times the average monthly bill amount throughout the period of service
connection. If it was found that the SD available with the Company was more
than required, the excess amount shall be refunded to the consumer by way of
adjustment in the ensuing two electricity bills.
We reviewed the tables pertaining to SD in the system and observed the
following deficiencies:
The processes to determine the SD was not mapped in the system.
Therefore, the adequacy of SD at the time of connection and on further
enhancement of load could not be ensured and checked in the system.
GoK stated (January 2017) that the methodology to determine the SD
would be automated while implementing the workflow based new
connection.
As per the SRS, the interest payable on SD was to be calculated on
periodic basis as defined by the Company from time to time. We
observed that the interest rate applied for the financial year 2012-13 was
8 per cent though the bank rate effective as on 01/04/2012 was 9.5 per
cent. This resulted in short payment of interest of `2.50 crore to
consumers.
GoK replied (January 2017) that a mechanism would be established to
get the bank rate for each year promptly so as to update the same in the
system.
Initial SDs were collected from the consumers before effecting service
connections. The amount of deposits collected from all the consumers
were entered into an account of dummy consumer (1355460009367)
created for this purpose. After effecting service connections, the SDs
were transferred to respective consumer‟s account. We noticed that an
amount of `14.80 crore was pending (August 2016) allocation from the
account of dummy consumer to the respective consumer‟s account.
GoK stated (January 2017) that steps had been taken to reduce the
collections in the dummy consumer account. It was further stated that
the amount transferred to actual consumer had not been deducted from
the dummy consumer in some cases and hence, the figures were not
actual.
The fact, however, remained that these consumers were deprived of
interest on SD due to delay in allocation of SD to their account. Further,
data integrity in respect of SD could not be ensured.
65
Load * Load Factor of the category in which consumer falls * Period taken for determination of
security deposit *Current tariff.

Audit Report No.4 (PSUs) for the year ended 31 March 2016
80
During 2015-16, an excess interest of `0.19 crore on SD for the period
2014-15 was credited to 56 consumers which had to be revised and
adjusted later (March 2016) manually. GoK stated that the excess
interest credited has been recovered and adjusted.
Collection of income tax at source
2.3.9.9 As per the Income Tax Act, 1961 the Company was required to deduct
income tax at source (TDS) on the interest (where interest exceeded `5000 in
a year) on the security amount deposited by the consumers. The Permanent
Account Number (PAN) of consumers containing 10 digit alpha-numeric
codes had to be correctly mapped in the system for correct deduction and
deposit of amount of tax.
A review of the database revealed that:
Control for ensuring correct combination of alpha numeric code was
absent which resulted in wrong entry of PAN in respect of eight
consumers. Status of the consumer such as corporate, non-corporate,
etc., was also not linked to the PAN.
GoK replied (January 2017) that these errors happened during initial
migration and PAN validation had been rectified. It was also stated that
appropriate PAN validation based on the above classification would be
implemented.
TDS was deducted in respect of 121 consumers (Central Government,
State Government, local bodies, etc.) who were exempted from income
tax.
GoK stated (January 2017) that „not applicable field‟ of exempted
consumers had been updated and „TDS applicable field‟ was made
mandatory.
General IT controls
2.3.10 IT controls in a computer system are all the manual and programmed
methods, policies and procedures that ensure the protection of the entity‟s
assets, the accuracy and reliability of its records and the operational adherence
to the management standards. It includes General controls and Application
controls. General controls are concerned with the organisation‟s IT
infrastructure, IT related policies and working practices.
Issues in data migration
2.3.10.1 Prior to implementation of ENRGISE, the Company was using
an application software for billing of HT/ EHT consumers since December
1999. This software was based on Linux Operating System and Oracle
database. The data migration to new software was carried out by the SOR.
Data which was not available in the old software was captured manually. The
data in the new system was verified to determine whether data was accurate,
complete and was supported in the new system.

Chapter II – Performance Audit
81
We observed that critical data fields in the new database were incorrectly
migrated due to lack of input controls in the new software and data was not
properly checked during data migration as brought out below.
In respect of nine consumers whose details were migrated from the old
application software, date of connection was mentioned as „0001-09-22,
0007-08-31, 0096-12-13‟ instead of meaningful date format.
One of the functionalities envisaged in the billing system was to inform
consumers regarding new bill over the email/ mobile phone. For this
purpose, correct email ids and mobile phone numbers (having 10 digits)
of the consumers were to be entered in the system.
We noticed that email id of 119 consumers were incorrect. Email id of
another 308 consumers were entered as "[email protected]” which was the
default email id assigned by the Company during the migration.
Similarly, in the case of 329 consumers, mobile numbers with more than
10 digits were entered in the system indicating absence of control for
checking the format of phone numbers.
GoK stated (January 2017) that efforts were being made for correcting
data and providing validation for checking length of mobile number.
Out of the 15,918 meters (as at March 2016) in the master table for
meters, meter ownership id in respect of 3,385 meters were null,
indicating ambiguity in ownership of the meters. Further, the connection
status of 1,533 meters out of these 3,385 was recorded in the database as
„working‟. The above facts indicated active usage of these meters even
though the ownership details were incomplete.
GoK stated (January 2017) that steps had been taken for rectifying
errors. The fact, however, remained that the ownership of the meters
pointed out could not be verified from the system. As such collection of
meter rent for all the meters owned by the Company could not be
ensured by the system.
Password policy
2.3.10.2 An organisation should have a good password policy to ensure
security of data.
We observed that:
The Company had a documented password policy which was
implemented in February 2015 after a period of more than five years
from the date of implementation of computerised billing software.
Even though, the IT-CU Department could chalk out the Password
policy, it was not approved by any competent authority including the
BoD of the Company even as of October 2016.
As per the Password policy of the Company, all the user level
passwords shall be changed periodically at least once every three

Audit Report No.4 (PSUs) for the year ended 31 March 2016
82
months. We analysed the compliance of this provision in the Password
policy and noticed that out of 1,055 users given access to ENRGISE up
to 10 August 2016, 730 employees had not adhered to the policy of the
Company. These employees logged into the system using passwords,
which were more than three months old. The age of the passwords
ranged up to six years.
As on 10 August 2016, there were 906 active users. Out of these, 99
users never logged into the system while 76 users had not logged into
the system during the last six months. In some of the cases, the users
had last logged into the system four years ago.
The GoK replied (January 2017) that individual logins had been
removed as part of implementation of Single Sign On and employees
could log into Company portal using their employee id and password.
Login and password management of all users to the portal are now
handled by a user management application, which is in compliance
with the password policy of the Company.
Application controls
2.3.11 Application controls are used in a computer system to provide
assurance that all transactions are valid, authorised and complete. Application
controls include input controls and validation controls. We reviewed the
adequacy of general and application controls in the Company and noticed lack
of proper input controls and validation controls as discussed below.
Lack of input control
2.3.11.1 The objectives of the input controls are to validate source data,
authorisation and entry so that accurate, reliable and complete data is accepted
by the application in a timely manner. While data input can be manual or
system interface driven, errors and omissions can be minimised through good
input design, adequate segregation of duties, etc. Review of the ENRGISE
database revealed lack of input controls as detailed below:
As per Regulation 70 of the Supply Code 2014, consumers were
required to provide security deposit (SD) for availing electricity
connection and 50 per cent of the SD may be in the form of bank
guarantee (BG). BGs have unique numbers and name of issuing bank. We observed that in respect of 11 consumers
66, the same BG number
was used and in respect of four consumers67
, name of the bank was not mentioned.
GoK stated (January 2017) that proper validation for preventing entry of
same BG number and drop down list for selecting bank would be
incorporated.
66Consumer Numbers - 1355040002327, 1355150003426, 1365620001002, 1366070002202, 1356780003111,
1356780000856, 1355040002327, 1346340003239, 1345160001680, 1355460003571 and 1346460001901. 67Four consumers- Consumer Numbers 1355200003256, 1366630003269, 1346300000606 and 1365020001905.
Chapter II – Performance Audit
83
As per Regulations 99 and 100 of the Supply Code 2014, an HT/EHT
consumer could change the contract demand within a specified period
after the date of connection. We observed that the date of connection in
respect of six consumers was later than the date of contract demand
change.
GoK replied (January 2017) that errors were rectified and control
mechanism implemented.
The purpose for which electricity was proposed to be used and the
product proposed to be manufactured by the consumer were the basic
criteria for assigning tariff to industrial and commercial consumers. The
product and purpose had to be entered in the system for correct billing.
We observed that in respect of 2,119 consumers, neither purpose nor
product was entered in the system and as such, the correctness of tariff
assigned to these consumers could not be ensured.
Correct and useful data is essential for any computer application. We
noticed that date of application was recorded as later than the date of
connection or date of receipt of security deposit in respect of 2,331
consumers.
GoK stated (January 2017) that application date was created by the
system and other dates were entered based on the documents received
from the agreement authority.
The fact, however, remained that there was a mismatch of dates in the
system.
Lack of validation controls
2.3.11.2 Adequate validation controls should be incorporated in the
billing software for correct and prompt billing of consumers. As per
Regulation 125 of the Supply Code 2014, in case of defective/ damaged
meters, the Company shall collect energy charges from consumers based on
average consumption only for a maximum period of two billing cycles during
which time the Company shall replace the defective/ damaged meter with a
correct meter.
We noticed that the system allowed billing based on the average consumption
for connections with defective meters for longer periods which ranged up to
37 months.
GoK stated (January 2017) that cases cited were not those of faulty meters but
were cases of multiplication factor or PT voltage missing which was shown as
meter faulty. However, GoK assured that the application would be modified
for identifying such errors in multiplication factor and capturing voltage
details during meter reading entry.

Audit Report No.4 (PSUs) for the year ended 31 March 2016
84
The reply was not acceptable since the SRS contained provision for mapping
of status of meters in the system which was not done.
Generation of reports
2.3.12 The application software must be capable of generation of quality
reports on various data coming under its purview as and when required by the
stakeholders.
We noticed that the software was capable of generating reports relating to all
modules in user defined formats. Apart from reports on regular information
such as revenue, collection and arrears, the system generated customised
reports as per the requirement of the management and operational staff.
We noticed cases, where incorrect and incomplete data were stored and
processed in the billing software and consequent generation of inaccurate and
unreliable reports as explained below. Consumer Personal Ledger (CPL)
2.3.12.1 As per the SRS, a Consumer Personal Ledger (CPL) report was
to be designed to display all relevant billing and payment details and
outstanding details, if any, for a particular consumer. The SRS envisaged CPL
as a statement of a consumer‟s consumption, billing and payment history.
Audit analysed the database and noticed the following deficiencies relating to
CPL:
The Company incorporated the CPL module in the system only in
December 2014. The tables in the database relating to CPL did not
contain any details of transaction that occurred prior to March 2014.
Though relevant fields were available in the CPL table for opening
balance of outstanding energy charges, demand for the month,
cumulative balances, etc., we noticed differences in respect of total
demand as per the actual demand table and CPL table. We also noticed
that there were substantial differences between the total realised amount
in collection table and total amount in the CPL table during the period
from April 2015 to March 2016. Due to above deficiencies, the
Company could not put to use the CPL module for MIS and reporting
purposes.
GoK stated (January 2017) that deficiencies identified were since
rectified and demand, collection and consumption details in CPL of
consumers showed correct figures. The fact, however, remained that
though CPL was one of the vital functionalities as given in the SRS and
Work Order, it was not properly built into the system.
Inadequate information on the bills
2.3.12.2 As per the provisions of the Supply Code 2005/ 2014, the bill
issued for sale of power to HT/EHT consumers shall mandatorily include

Chapter II – Performance Audit
85
information pertaining to the consumer, tariff, payment modes available,
meters used, etc.
We, however, noticed that the bills generated through ENRGISE did not
include mandatory details such as meter number and identification details of
meter, status of meter (OK/ defective/ not available), billing status (regular/
assessed/ provisional bill/ special bill with reason), etc. The absence of vital
details/ status of meters not only made the bills less transparent but also
inconsistent with Supply Code 2005/ 2014.
GoK stated (January 2017) that all the details of meter would be provided to
consumer if there was any meter replacement. Further, all the information
were also available in HT/EHT Web Enabled Customers Portal.
The reply was not acceptable since as per the provisions in the Supply Code
2005/ 2014, the bill issued for sale of power to HT/EHT consumers shall
mandatorily include information pertaining to the consumer, tariff, payment
modes available, meters used, etc.
Conclusion
Absence of a mutually agreed system requirement specification in
development of the system resulted in deficient billing application
software. Though the system was envisaged as a comprehensive billing
system, many of the features originally envisaged were not built into the
system software. Absence of adequate input controls resulted in
processing of incomplete, inaccurate and unreliable data and consequent
generation of incorrect bills. The business rules in many cases were found
to be improperly incorporated into the system along with insufficient
application controls and validation checks. In many cases, the system
failed to generate accurate and reliable reports for Management
Information System due to storing and processing incorrect and
incomplete data in the database.
Recommendation
The Company should:
1. incorporate all functionalities and modules which were originally
envisaged in the system without delay;
2. ensure that all business rules are suitably incorporated in ENRGISE.
Efforts should be made to build adequate input control mechanism
in the system to ensure that genuine, accurate and reliable data are
processed; and
3. incorporate validation controls in the software to prevent loss of
revenue.
Copyright © 2022 FDOKUMEN