C:\06 Audits\BVSD\06bvsd.nts.wpd
128
TABLE OF CONTENTS PAGE INTRODUCTORY SECTION Letter of Transmittal i - vi Board of Education Members vii Organizational Chart viii - ix List of Principal Officials x FINANCIAL SECTION Independent Auditors' Report Management’s Discussion and Analysis a - l Basic Financial Statements Statement of Net Assets 1 Statement of Activities 2 Balance Sheet - Governmental Funds 3 Statement of Revenues, Expenditures and Changes in Fund Balances - Governmental Funds 4 Reconciliation of the Statement of Revenues, Expenditures and Changes in Fund Balances of Governmental Funds to the Statement of Activities 5 Balance Sheet - Proprietary Funds 6 Statement of Revenues, Expenses and Changes in Fund Net Assets - Proprietary Funds 7 Statement of Cash Flows - Proprietary Funds 8 Statement of Fiduciary Net Assets 9 Statement of Changes in Fiduciary Net Assets 10 Notes to Financial Statements 11 - 26
-
Upload
khangminh22 -
Category
Documents
-
view
0 -
download
0
Transcript of C:\06 Audits\BVSD\06bvsd.nts.wpd

TABLE OF CONTENTS
PAGEINTRODUCTORY SECTION
Letter of Transmittal i - vi
Board of Education Members vii
Organizational Chart viii - ix
List of Principal Officials x
FINANCIAL SECTION
Independent Auditors' Report
Management’s Discussion and Analysis a - l
Basic Financial Statements
Statement of Net Assets 1
Statement of Activities 2
Balance Sheet - Governmental Funds 3
Statement of Revenues, Expenditures and Changes in Fund Balances - Governmental Funds 4
Reconciliation of the Statement of Revenues, Expenditures and Changes in Fund Balances of Governmental Funds to the Statement of Activities 5
Balance Sheet - Proprietary Funds 6
Statement of Revenues, Expenses and Changes in Fund Net Assets - Proprietary Funds 7
Statement of Cash Flows - Proprietary Funds 8
Statement of Fiduciary Net Assets 9
Statement of Changes in Fiduciary Net Assets 10
Notes to Financial Statements 11 - 26

TABLE OF CONTENTS(Continued)
PAGEFINANCIAL SECTION (Continued)
Required Supplementary Information
Budgetary Comparison Schedule - General Fund 27
Notes to Required Supplementary Information 28 - 29
Combining and Individual Fund Statements and Schedules
Combining Balance Sheet - General Fund 30
Combining Statement of Revenues, Expenditures and Changes in Fund Balances - General Fund 31
Combining Balance Sheet - Nonmajor Governmental Funds 32
Combining Statement of Revenues, Expenditures and Changes in Fund Balances - Nonmajor Governmental Funds 33
Budgetary Comparison Schedule - Grants Fund 34
Budgetary Comparison Schedule - Transportation Fund 35
Budgetary Comparison Schedule - Capital Reserve Fund 36
Budgetary Comparison Schedule - Bond Redemption Fund 37
Budgetary Comparison Schedule - Food Services Fund 38
Combining Balance Sheet - Internal Service Funds 39
Combining Statement of Revenues, Expenses and Changes in Fund Net Assets - Internal Service Funds 40
Combining Statement of Cash Flows - Internal Service Funds 41
Budgetary Comparison Schedule - Insurance Reserve Fund 42
Combining Statement of Fiduciary Net Assets - Private Purpose Trust Funds 43
Statement of Change in Assets and Liabilities - Agency Fund 44

TABLE OF CONTENTS(Continued)
PAGE
FINANCIAL SECTION (Continued)
Combining and Individual Fund Statements and Schedules (Continued)
Combining Statement of Net Assets - Component Units 45
Combining Statement of Activities - Component Units 46
Combining Balance Sheet - Component Units 47
Combining Statement of Revenues, Expenditures and Changes in Fund Balances - Component Units 48
STATISTICAL SECTION (Unaudited)
Table of Contents 49
Financial Trends
Table 1 - Net Assets by Component 50
Table 2 - Changes in Net Assets 51
Table 3 - Fund Balances, Governmental Funds 52
Table 4 - Changes in Fund Balances - Governmental Funds 53
Revenue Capacity
Table 5 - Assessed Value and Estimated Actual Value of Taxable Property 54
Table 6 - Property Tax Levies and Collections 55
Table 7 - Property Tax Rates - Direct and Overlapping Governments 56
Debt Capacity
Table 8 - Ratios of Outstanding Debt by Type 57
Table 9 - Legal Debt Margin Information 58
Demographic and Economic Information
Table 10 - Demographic and Economic Statistics 59
Table 11 - Computation of Direct and Overlapping Debt 60

TABLE OF CONTENTS(Continued)
PAGESTATISTICAL SECTION (Unaudited) (Continued)
Demographic and Economic Information (Continued)
Table 12 - Principal Property Taxpayers 61
Table 13 - District Employees - Full Time Equilivents 62
Table 14 - Principal Employers 63
Operating Information
Table 15 - School Building Information 64 - 68
Table 16 - Enrollment Data 69
COMPLIANCE SECTION
Single Audit
Independent Auditors’ Report on Internal Control Over Financial Reporting and on Compliance and Other Matters Based on an Audit of Financial Statements Performed in Accordance with Government Auditing Standards 70
Independent Auditors’ Report on Compliance with Requirements Applicable to Each Major Program and on Internal Control Over Compliance in Accordance with OMB Circular A-133 71 - 72
Schedule of Findings and Questioned Costs 73
Independent Auditors’ Report on Schedule of Expenditures of Federal Awards 74
Schedule of Expenditures of Federal Awards 75
Notes to Schedule of Expenditures of Federal Awards 76
State Compliance
Independent Auditors’ Report on Auditor’s Integrity Report 77
Auditor’s Integrity Report 78
i
November 14, 2006 Members of the Board of Education Dr. George F. García, Superintendent of Schools Boulder Valley School District RE-2 Boulder, Colorado It is our pleasure to submit the Comprehensive Annual Financial Report of the Boulder Valley School District RE-2 for the fiscal year ended June 30, 2006. State law requires that all local governments publish within six months of the close of each fiscal year a complete set of financial statements presented in conformity with generally accepted accounting principles and audited in accordance with generally accepted auditing standards by a firm of licensed certified public accountants. This report is being formally submitted to the Board of Education in fulfillment of those requirements. This extensive document was prepared by the District’s Finance and Accounting Services Department, and to the best of our knowledge and belief, the enclosed data is accurate in all material respects and is reported in a manner to present fairly the financial position and results of operations of the school district. The responsibility for both the accuracy of the data and the completeness and fairness of the presentation, including all disclosures, rests with the management of the District. The 2006 Comprehensive Annual Financial Report (CAFR) presentation is in compliance with the governmental financial reporting model established by the Governmental Accounting Standards Board (GASB) Statement No. 34 titled Basic Financial Statements – and Management’s Discussion and Analysis – for State and Local Governments. Accounting and financial reporting for state and local governments previously focused on funds to demonstrate fiscal accountability. The GASB No. 34 reporting model parallels private sector reporting by consolidating fund-based presentations into government-wide financial statements designed to ensure and demonstrate fiscal and operational accountability. Swanhorst & Company LLC, Certified Public Accounts, have issued an unqualified (“clean”) opinion on the Boulder Valley School District RE-2’s financial statements for the year ended June 30, 2006. The independent auditor’s report is located at the front of the financial section of this report. Management’s discussion and analysis (MD&A) immediately follows the independent auditor’s report and provides a narrative introduction, overview, and analysis of the basic financial statements. MD&A complement this letter of transmittal and should be read in conjunction with it.
Finance and Accounting

ii
The Comprehensive Annual Financial Report is presented in four sections: 1. Introductory Section: This section contains the letter of transmittal introducing
the District’s financial statements, a listing of Board of Education members, an organization chart and list of principal officials.
2. Financial Section: This section contains the independent auditor’s report, management’s discussion and analysis, the basic financial statements, notes to the financial statements, required supplementary information, notes to required supplementary information, and combining and individual fund statements and schedules.
3. Statistical Section: This section contains various tables containing financial trends, revenue capacity, debt capacity, and demographic and economic information.
4. Compliance Section: The section contains the independent auditor’s report on federal awards, the schedule of federal awards, reports on compliance and internal controls, as required by the Federal Office of Management and Budget, Circular A-133. This section also contains the District’s automated data exchange (ADE) report of electronic financial data integrity check figures for fiscal year 2005/06 as required by the Colorado Department of Education.
Profile of the Government
Boulder Valley School District RE-2 is a public school district, organized and existing under the School District Organization Act of 1965, Article 30, Title 22, and Colorado Revised Statutes. It was originally organized in 1860 and was reorganized in 1961 to include numerous smaller districts. A seven member Board of Education elected by the citizens of Boulder, Broomfield and Gilpin Counties governs the District. The District is in the foothills of the Rocky Mountains thirty miles northwest of Denver. Boulder Valley’s boundaries encompass approximately 500 square miles in Boulder, Broomfield and Gilpin Counties and contain a population of approximately 211,000. The communities of Boulder, Louisville, Lafayette, Erie, Superior, Broomfield, Nederland, Ward, Jamestown and Gold Hill are served. The District’s enrollment in the fall of 2005 was 27,922. The District provides a full and challenging range of educational programs and services authorized by Colorado State Statute including basic kindergarten through grade twelve education in elementary, middle and high schools, special education for special needs students, vocational education, English as a second language education and numerous other educational and support programs. In addition, the District offers preschool programs through the Colorado Preschool and Kindergarten Program, Community Montessori focus school and the Special Education program. Four charter schools are included as component units of the Boulder Valley School District RE-2 for the 2006 CAFR: Boulder Preparatory High School, Horizons K-8 Alternative School, Peak to Peak K-12 Charter School, and Summit Charter School.
Economic Conditions and Outlook
The state economic picture is important to the District because a major source of funding for the District’s General Operating Fund is received through the State’s School Finance Act established by the state legislature. Also strong local economy combined

iii
with a stable or growing population are factors critical to the health of a school district. Boulder Valley School District RE-2 residents, particularly in the more densely settled urban areas where most of the population resides, participate in the large and increasingly diverse front-range economy, which includes the Cities of Denver, Boulder and Longmont and the growing communities in between. While the economy is still strong, this area has been impacted by the recent recession, particularly in the developing high-tech and telecommunications sector, which became an increasingly prominent piece of the local economy and drove growth during much of the late 1990s. Boulder County, where the school district is centered, is roughly twenty miles northwest of Denver. The City of Boulder is home to the University of Colorado, Boulder Campus, and a significant stabilizing force for the local economy. Other major employers in the area include IBM Corporation, Sun Microsystems Inc, Level 3 Communications, Wild Oats Market and numerous other smaller software, research, manufacturing and pharmaceutical firms. According to U.S. Bank’s Colorado Economic Forecast 2006, the outlook for the U.S. and Colorado economies is dependant on a number of variable factors, and economists are reporting a mixed outlook for the near future. “The U.S. economy began 2006 propelled by a great deal of positive momentum. The economy is in the fifth year of the expansion phase of the business cycle.” Colorado’s unemployment rate dropped to 5.0% in 2005 from 5.6% in 2004 and is forecasted to drop another 0.2% in 2006. However, employment growth slowed throughout 2005 from 2.6% in the first quarter to 1.9% in the fourth. “Two sectors of the Colorado economy are particularly strong, tourism and mining. Mining, primarily oil and gas, has replaced tourism as the state’s second largest industry (after manufacturing), with an estimated $10.3 billion in mineral production in 2005, up from a record $8.5 billion in 2004. However, its impact is localized, particularly in Garfield, Mesa and Weld counties.” “The Denver-Boulder inflation rate, which averaged 0.1% in 2004, increased to 2.1% in 2005, still well below the national level. The primary factor in Denver’s better inflation performance was housing prices, which fell 0.5% in the second half of the year. Transportation soared 11.0% and medical care increased 4.9%.” As public school funding is directly tied to the Denver-Boulder inflation rate, these data are concerning. While the inflation rate is suppressed by housing prices, this factor does not impact the cost of operating a school district. On the other hand, the cost of transportation and medical care directly impacts the operations of a school district. This confirms that at the present time, costs are increasing more significantly in areas that are directly tied to school operations than indicated by the inflation rate and funded by the Colorado School Finance Act.
Financial Information
Internal Control District management is responsible for establishing and maintaining internal controls designed to ensure that the assets of the District are protected from loss, theft or misuse. Adequate accounting data must also be compiled to allow for the preparation of financial statements in conformity with generally accepted accounting principles (GAAP). The internal controls are designed to provide reasonable, but not absolute, assurance that these objectives are met. The concept of reasonable assurance recognizes that: (1) the cost of a control should not exceed the benefits likely to be

iv
derived and (2) the valuation of costs and benefits requires estimates and judgments by management. Single Audit As a recipient of federal, state and local financial assistance, the school district is responsible for ensuring that adequate internal controls are in place to ensure compliance with applicable laws and regulations related to these programs. As a part of the District’s single audit, tests are made to determine the adequacy of internal control, including that portion related to federal award programs, as well as to determine that the District has complied with applicable laws and regulations, contracts and grants. The results of the District’s single audit for the fiscal year ended June 30, 2006 provided no instances of material weaknesses or reportable conditions in internal control or material violations of applicable laws, regulations, contracts and grants. Budgeting Controls The District maintains numerous budgetary controls. The objective of these controls is to ensure compliance with legal provisions embodied in the annual appropriated budget adopted by the Board of Education. Budgetary controls include an encumbrance accounting system, expenditure control and position control. The District’s financial system provides budget managers with on-line capabilities to view outstanding orders and available funds for all accounts in their department or school. Encumbered amounts lapse at year end and are generally re-established in the following year as an obligation against that year’s appropriated budget. As demonstrated by the statements and schedules included in the financial section of this report, the District continues to meet its responsibility for sound financial management. Fund Balance Requirements On April 13, 2004, the Board of Education revised Policy DB-Annual Operating Budget which requires maintaining a minimum level of year-end fund balance in order to ensure the District’s ongoing financial health. The policy’s five key requirements are outlined as follows:
• The General Operating Fund budget will be developed so that the total of annual ongoing expenditures, transfers, and incremental increase in required reserves does not exceed annual revenues.
• If the General Operating Fund ends any fiscal year with a surplus of revenues beyond expenditures, this amount can only be used for one-time operating expenditures in subsequent years.
• In addition, the General Operating Fund budget will be developed containing an ending fund balance equal to or greater than the required TABOR reserve on a generally accepted accounting principles (GAAP) basis.
• The budgets for all other funds will be developed to include, at a minimum, the required TABOR reserve.
• The General Operating Fund budget will be developed on a generally accepted accounting principles (GAAP) basis.
At June 30, 2006, the District is in compliance with all provisions of this policy.

v
Transportation Override Election On November 1, 2005, voters approved a mill levy override to pay for excess transportation costs not reimbursed by the State of Colorado. The ballot question includes a maximum levy of $7.3 million to allow for a projected 10 years of growth. For the 2005-06 fiscal year, only $4.2 million is eligible for reimbursement through the state formula. Of this amount, $2.5 million will be used to establish a four-year replacement cycle for the district’s 8,700 computers; most of which are located in classrooms and schools. The balance of funds, $1.7 million, will be used for other high value needs and critical programs as determined by the Board of Education. Cash Management The cash management and investment practices of the District follow the Board of Education Investment Policy and state law. The District’s investments are managed in a manner that optimizes the return on investments and minimizes risk while providing needed liquidity. The Board of Education receives a quarterly investment portfolio report as a part of the regular quarterly financial reports. Investment earnings for all funds for the year ended June 30, 2006, totaled $1,192,940. In order to meet its cash flow requirements, the District participated in the State of Colorado’s Interest Free Loan Program. This program allows the District to borrow funds from the State Treasury as needed to fund its operations. For the year ended June 30, 2006, the District borrowed a total of $58,725,788 from this program. All funds were repaid to the State Treasury by May 11, 2006. Risk Management The District participates in two self-insurance pools, one for property/liability insurance and one for workers’ compensation. The property/liability insurance for the District is provided through the Colorado School Districts Self-Insurance Pool, which is comprised of over 100 school districts. The workers’ compensation coverage for the District is provided through the Joint School Districts Pool for Workers’ Compensation. This pool is comprised of four large Denver-metro school districts: Aurora, Boulder Valley, Cherry Creek, and Littleton. The pools rely upon actuarial reviews to determine appropriate funding and reserve levels. Excess insurance is in place for amounts above the retention. Audit Committee On September 28, 2004, the Board of Education adopted Policy DIEA-District Audit Committee which established an Audit Committee. The Committee is made up of five members, two Board of Education members, one being the Board of Education treasurer who shall serve as chair of the District Audit Committee, and the other member appointed by the Board for a two year term; the District’s Chief Operations Officer; the District’s Finance and Accounting Services Director; and a community member with expertise in governmental accounting and financial management. The community member will be selected by the District Audit Committee and recommended to the Board of Education for a two year term.

The primary responsibilities of the committee are as follows:• Recommend the selection of an external auditor, considering independence,
qualifications and cost of services . .Review the scope, plan and coordination ofthe independent audit efforts. Consider the auditor's findings andrecommendations for appropriate actions.
• Review quarterly financial reports provided by the District.• Review district financial policies and procedures.• Review any new debt issuance.• Encourage continuous improvement of district financial policies and procedures.
Other Information
AwardsThe Government Finance Officers Association (GFOA) awarded a Certificate ofAchievement for Excellence in Financial Reporting to the Boulder Valley School DistrictRE-2 for its comprehensive annual financial report (CAFR) for the fiscal year endedJune 30, 2005. In order to be awarded a Certificate of Achievement, the governmenthad to publish an easily readable and efficiently organized CAFR that satisfied bothgenerally accepted accounting principles and applicable legal requirements.
In addition, the Boulder Valley School District RE-2 also received the GFOA'sDistinguished Budget Presentation Award for its annual budget document for the fiscalyear beginning July 1, 2005. In order to qualify for the Distinguished BudgetPresentation Award, the government's budget had to be judged proficient as a policydocument, a financial plan, an operations guide, and a communications device.
AcknowledgmentsThe preparation of this report on a timely basis was made possible by the dedicatedservice of the entire staff of the Finance and Accounting Services Department. Wewould like to express our sincere appreciation to all members of the department for thecontributions made in the preparation of this report. We also thank the District'sindependent auditors, Swanhorst & Company llC, for the professional manner in whichthey accomplished the audit and for their work to publish this Comprehensive AnnualFinancial Report. We would also like to thank Dr. George Garda, Superintendent,Robert Hammond, Chief Operations Officer, and the Board of Education for theirinterest in and support of the finance and accounting operations of the Boulder ValleySchool District RE-2.
Respectfully Submitted,
~0~leslie A. Stafford, CPAFinance & Accounting Services Director
Charles R. McElwain, CPAFinance & Accounting Services Assistant Director
VI

vii
BOULDER VALLEY SCHOOL DISTRICT RE-2
BOARD OF EDUCATION MEMBERS The registered electors of the District elect the seven members of the Board at successive biennial elections to staggered four-year terms of office. The Board is a policy-making body whose primary functions are to establish policies for the District; provide for the general operation and personnel of the district; and oversee the property, facilities, and financial affairs of the District. Members of the Board serve without compensation. The present Board members, their office on the Board, lengths of service, and terms of office are as follows: Name Office Years of Service Term Expires Helayne Jones, Ed.D. President 3 2007 Angelika Schroeder, Ph.D. Vice-President 7 2007 Teresa Steele Treasurer 7 2007 Jean Paxton Director 5 2009 Ken Roberge Director 3 2007 Lesley Smith, Ph.D. Director 1 2009 Patti J. Smith Director 1 2009

viii
BOARD OF EDUCATION
President – Helayne Jones, Ed.D. Vice President – Angelika Schroeder, Ph.D.
Treasurer – Teresa Steele Members – Jean Paxton, Ken Roberge,
Lesley Smith, Ph.D., Patti Smith
SUPERINTENDENT
OF SCHOOLS George F. García, Ed.D.
DEPUTY SUPERINTENDENT FOR EDUCATIONAL PROGRAMS
Chris King, Ph.D.
DIVISION OF LEARNING SERVICES
ASSISTANT
SUPERINTENDENT Judy
Skupa. Ph.D.
DIRECTOR OF SCHOOL
LEADERSHIP/ ELEMENTARY
Sheri
Williams, Ed.D.
DIRECTOR OF
CURRICULUM/ READING &
TITLE I
Judy Slinger, Ph.D.
DIRECTOR OF ATHLETICS, ACTIVITIES
AND SCHOOL DISCIPLINE
Michele Deberry
DIRECTOR OF SCHOOL
LEADERSHIP/ MIDDLE
LEVEL & K-8’s
Ellen Miller-
Brown, Ph.D.
DIRECTOR OF SPEICAL
EDUCATION
Andrea Kutinsky, Ph.D.
DIRECTOR INSTITUTIONAL
EQUITY & MULTICULTURAL
EDUC.
Pam Duran
ELEMENTARY PRINCIPALS
AND SCHOOLS
MIDDLE LEVEL & K-8’s PRINCIPALS
AND SCHOOLS
CHIEF OF PLANNING
AND ASSESSMENT
Jonathan
Dings, Ph.D.
COMMUNICATIONS
DIRECTOR Briggs Gamblin
LEGAL COUNSEL
Darci Mohr
DEPTMENT OF LITERACY
AND LANGUAGE
DIRECTOR
Jorge García
CHARTER SCHOOLS
DIRECTOR OF SCHOOL
LEADERSHIP/ ELEMENTARY
Sandy
Ripplinger
HIGH SCHOOL PRINCIPALS,
ALTERNATIVE PROGRAMS
AND SCHOOLS
DIRECTOR CAREER &
TECH EDUC.
Mike Rask, Ph.D.
DIRECTOR OF
CURRICULUM/ MATHEMATICS
Timothy Stoelinga
Boulder Valley School District

ix
SUPERINTENDENT
OF SCHOOLS George F. García, Ed.D.
CHIEF OPERATIONS OFFICER FOR ADMINISTRATION AND OPERATIONS
Robert Hammond
DEPARTMENT OF OPERATIONS & ENVIRONMENTAL SERVICES
DIRECTOR Dale Hobbs
DEPARTMENT OF MAINTENANCE
DIRECTOR
Michael Cuskelly
DEPARTMENT OF FOOD SERVICE
DIRECTOR Nancy Paluh
DEPARTMENT OF TRANSPORTATION
DIRECTOR Bob Young
DIVISION OF HUMAN
RESOURCES
Executive Director Rebecca McClure
DEPARTMENT OF PLANNING, ENGINEERING, AND
CONSTRUCTION
DIRECTOR Don Orr
DEPARTMENT OF BUDGET SERVICES
DIRECTOR Bill Sutter
DEPARTMENT OF COMMUNITY
SCHOOLS
DIRECTORS Gail Casella
Susan Riederer
DEPARTMENT OF FINANCE &
ACCOUNTING SERVICES
DIRECTOR
Leslie Stafford
DIVISION OF INFORMATION TECHNOLOGY
CHIEF
INFORMATION OFFICER
David Williamson
DEPARTMENT OF PROCUREMENT &
MATERIALS MANAGEMENT
DIRECTOR
Sharon Meyer
DIRECTORS
Ruth Anderson,
Ed.D.
Jeanne Aguilar
Bob
Jamieson
DIVISION OF OPERATIONAL
SERVICES
EXECUTIVE DIRECTOR Joe Sleeper
DEPARTMENT OF INSTRUCTIONAL TECHNOLOGY
DIRECTOR Len Scrogan
DEPARTMENT OF ENTERPRISE TECHNOLOGY
DIRECTOR
Kevin Cubillas

x
BOULDER VALLEY SCHOOL DISTRICT RE-2
LIST OF PRINCIPAL OFFICIALS The Board is empowered to employ a chief executive officer, the Superintendent, who is responsible to the Board for the daily operations of the District. Other principal administrative officers of the District include a Deputy Superintendent for Educational Programs and a Chief Operations Officer for Administration and Operations. In the absence of the Superintendent, the Deputy Superintendent serves as the Superintendent. George F. Garcia, Ed.D., Superintendent Dr. Garcia was appointed Superintendent for the district in August 2000, after serving as Superintendent for Tucson Unified School District since 1991. Dr. Garcia received a Bachelor of Science degree in secondary education from Northwest Missouri State University; a Master’s Degree in history from University of Iowa; and a Doctorate in educational administration from Drake University, Des Moines Iowa. Dr. Garcia has won numerous national and state honors for excellence in leadership. He was selected 1998 Arizona Superintendent of the Year by the American Association of School Administrators. In 1998, he received the University of Arizona Distinguished Service Award and the League of United Latin American Citizen (LULAC) National Presidential Award of Outstanding Leadership in Education. In 1997, he received the prestigious American-Israel Friendship League Partners for Democracy Award. In 1996, Dr. Garcia received the Distinguished Administrator Award from the Arizona School Administrators. In 1994, he received the Dr. Martin Luther King Distinguished Leadership Award. In 1993, Executive Educator magazine identified Dr. Garcia as one of the 100 best educational administrators in North America – similar to the Fortune 500 listing for business and industry. He has been president of the Large City School Superintendents organization and served on the executive committee of the Council of Great City Schools. Christopher D. King, Deputy Superintendent For Educational Programs Dr. King has served as Deputy Superintendent for Educational programs in Boulder Valley School District RE-2 since July 2005. Previously he served for four years as an assistant superintendent in the District, and for four years prior to that as the principal of Boulder High School. Dr. King received his Ph.D. from the University of Colorado-Denver in Educational Leadership in 1996; his M.A., from CU-Boulder, is in Journalism and Mass Communications, and his B.A. is from Fort Lewis College in English. Robert B. Hammond, Chief Operations Officer Mr. Hammond joined Boulder Valley School District RE-2 as Chief Operations Officer for Administration and Operations in January 2001, after serving as Associate Superintendent for Administration and Operations with the Wichita Public School District in Wichita, Kansas for many years. Mr. Hammond also held positions as Senior Vice President of Farm Credit Services, Assistant City Manager of Norman, Oklahoma, and City Manager of Oskaloosa, Iowa before joining the public education arena. He received a Bachelor of Arts in psychology and sociology at Baker University, Baldwin, Kansas, in 1972. Mr. Hammond also holds a Master’s Degree in Public Administration, Urban Management from the University of Kansas, Lawrence, Kansas, 1977.

1DQSHEHDC 9TAKHB /BBNTMS@MSR
0N@QC NE 3CTB@SHNM0NTKCDQ >@KKDX ;BGNNK 2HRSQHBS :3&)0NTKCDQ% 1NKNQ@CN
INDEPENDENT AUDITORS' REPORT
?D G@UD @TCHSDC SGD @BBNLO@MXHMF EHM@MBH@K RS@SDLDMSR NE SGD FNUDQMLDMS@K @BSHUHSHDR% SGD ATRHMDRR&SXOD @BSHUHSHDR% D@BG L@INQ ETMC%@MC SGD @FFQDF@SD CHRBQDSDKX OQDRDMSDC BNLONMDMS TMHSR @MC QDL@HMHMF ETMC HMENQL@SHNM NESGD 0NTKCDQ >@KKDX ;BGNNK 2HRSQHBS :3&)%@R NE @MC ENQ SGD XD@Q DMCDC 7TMD *(% )((+% VGHBG BNKKDBSHUDKX BNLOQHRD SGD A@RHB EHM@MBH@K RS@SDLDMSR NE SGD 2HRSQHBS% @R KHRSDC HMSGD S@AKD NE BNMSDMSR' <GDRD EHM@MBH@K RS@SDLDMSR @QD SGD QDRONMRHAHKHSX NE SGD 0NTKCDQ >@KKDX ;BGNNK 2HRSQHBS :3&)IR L@M@FDLDMS'8TQ QDRONMRHAHKHSX HR SN DWOQDRR NOHMHNMR NM SGDRD EL@MBH@K RS@SDLDMSR A@RDC NM NTQ @TCHS'
?D BNMCTBSDC NTQ @TCHS HM @BBNQC@MBD VHSG @TCHSHMF RS@MC@QCR FDMDQ@KKX @BBDOSDC HM SGD =MHSDC ;S@SDR NE /LDQHB@ @MC SGD RS@MC@QCR@OOKHB@AKD SN EL@MBH@K @TCHSR BNMS@HMDC HM Government Auditing Standards, HRRTDC AX SGD 1NLOSQNKKDQ 4DMDQ@K NE SGD =MHSDC ;S@SDR'<GNRD RS@MC@QCR QDPTHQD SG@S VD OK@M @MC ODQENQL SGD @TCHS SN NAS@HM QD@RNM@AKD @RRTQ@MBD @ANTS VGDSGDQ SGD EHM@MBH@K RS@SDLDMSR@QD EQDD NE L@SDQH@K LHRRS@SDLDMS' /M @TCHS HMBKTCDR DW@LHMHMF% NM @ SDRS A@RHR% DUHCDMBD RTOONQSHMF SGD @LNTMSR @MC CHRBKNRTQDRHM SGDEL@MBH@K RS@SDLDMSR' /M @TCHS @KRN HMBKTCDR @RRDRRHMF SGD @BBNTMSHMF OQHMBHOKDR TRDC @MC RHFMHEHB@MS DRSHL@SDR L@CD AXL@M@FDLDMS% @R VDKK @R DU@KT@SHMF SGD NUDQ@KK EL@MBH@K RS@SDLDMS OQDRDMS@SHNM' ?D ADKHDUD SG@S NTQ @TCHS OQNUHCDR @ QD@RNM@AKD A@RHRENQ NTQ NOHMHNMR'
In NTQ NOHMHNM% SGD EHM@MBH@K RS@SDLDMSR QDEDQQDC SN @ANUD OQDRDMS E@HQKX% HM @KK L@SDQH@K QDRODBSR% SGD QDRODBSHUD EHM@MBH@K ONRHSHNM NESGD FNUDQMLDMS@K @BSHUHSHDR% SGD ATRHMDRR&SXOD @BSHUHSHDR% D@BG L@INQ ETMC% @MC SGD @FFQDF@SD CHRBQDSDKX OQDRDMSDC BNLONMDMS TMHSR@MC QDL@HMHMF ETMC HMENQL@SHNM NE SGD 0NTKCDQ >@KKDX ;BGNNK 2HRSQHBS :3&)% @R NE 7TMD *(% )((+% @MC SGD QDRODBSHUD BG@MFDR HMEHM@MBH@K ONRHSHNM @MC B@RG EKNVR% VGDQD @OOKHB@AKD% ENQ SGD XD@Q SGDM DMCDC HM BNMENQLHSX VHSG @BBNTMSHMF OQHMBHOKDR FDMDQ@KKX@BBDOSDC HM SGD =MHSDC ;S@SDR NE /LDQHB@'
<GD L@M@FDLDMSIR CHRBTRRHNM @MC @M@KXRHR @MC QDPTHQDC RTOOKDLDMS@QX HMENQL@SHNM KHRSDC HM SGD S@AKD NE BNMSDMSR @QD MNS @ QDPTHQDCO@QS NE SGD A@RHB EHM@MBH@K RS@SDLDMSR ATS @QD RTOOKDLDMS@QX HMENQL@SHNM QDPTHQDC AX SGD 4NUDQMLDMS@K /BBNTMSHMF ;S@MC@QCR 0N@QC'?D G@UD @OOKHDC BDQS@HM KHLHSDC OQNBDCTQDR VGHBG BNMRHRSDC OQHMBHO@KKX NE HMPTHQHDR NE L@M@FDLDMS QDF@QCHMF SGD LDSGNCR NELD@RTQDLDMS @MC OQDRDMS@SHNM NESGD RTOOKDLDMS@QX HMENQL@SHNM' 5NVDUDQ% VD CHC MNS @TCHS SGD HMENQL@SHNM @MC DWOQDRR MN NOHMHNMNM HS'
In @BBNQC@MBD VHSG Government Auditing Standards, VD G@UD @KRN HRRTDC NTQ QDONQS C@SDC 8BSNADQ +% )((+% NM NTQ BNMRHCDQ@SHNMNESGD 0NTKCDQ >@KKDX ;BGNNK 2HRSQHBS :3&) IR HMSDQM@K BNMSQNK NUDQ EL@MBH@K QDONQSHMF @MC NM NTQ SDRSR NE HSR BNLOKH@MBD VHSG BDQS@HMOQNUHRHNMR NE K@VR% QDFTK@SHNMR% BNMSQ@BSR% FQ@MS @FQDDLDMSR @MC NSGDQ L@SSDQR' <GD OTQONRD NESG@S QDONQS HR SN CDRBQHAD SGD RBNODNE NTQ SDRSHMF NESGD HMSDQM@K BNMSQNK NUDQ EL@MBH@K QDONQSHMF @MC BNLOKH@MBD @MC SGD QDRTKSR NESG@S SDRSHMF% @MC MNS SN OQNUHCD @MNOHMHNM NM SGD HMSDQM@K BNMSQNK NUDQ EL@MBH@K QDONQSHMF NQ NM BNLOKH@MBD' <G@S QDONQS HR @M HMSDFQ@K O@QS NE @M @TCHS ODQENQLDC HM@BBNQC@MBD VHSG Government Auditing Standards @MC RGNTKC AD BNMRHCDQDC HM @RRDRRHMF SGD QDRTKSR NE NTQ @TCHS'
8TQ @TCHS V@R BNMCTBSDC ENQ SGD OTQONRD NE ENQLHMF NOHMHNMR NM SGD EHM@MBH@K RS@SDLDMSR SG@S BNKKDBSHUDKX BNLOQHRD SGD 0NTKCDQ>@KKDX ;BGNNK 2HRSQHBS :3&)IR A@RHB EHM@MBH@K RS@SDLDMSR' <GD BNLAHMHMF @MC HMCHUHCT@K ETMC RS@SDLDMSR @MC RBGDCTKDR KHRSDC HM SGDS@AKD NE BNMSDMSR @QD OQDRDMSDC ENQ OTQONRDR NE @CCHSHNM@K @M@KXRHR @MC @QD MNS @ QDPTHQDC O@QS NE SGD A@RHB EHM@MBH@K RS@SDLDMSR' ;TBGHMENQL@SHNM G@R ADDM RTAIDBSDC SN SGD @TCHSHMF OQNBDCTQDR @OOKHDC HM SGD @TCHS NESGD A@RHB EHM@MBH@K RS@SDLDMSR @MC% HM NTQ NOHMHNM%HR E@HQKX RS@SDC HM @KK L@SDQH@K QDRODBSR HM QDK@SHNM SN SGD A@RHB EHM@MBH@K RS@SDLDMSR S@JDM @R @ VGNKD'
<GD HMSQNCTBSNQX @MC RS@SHRSHB@K HMENQL@SHNM G@R MNS ADDM RTAIDBSDC SN SGD @TCHSHMF OQNBDCTQDR @OOKHDC SN SGD @TCHS NE SGD A@RHBEL@MBH@K RS@SDLDMSR @MC% @BBNQCHMFKX% VD DWOQDRR MN NOHMHNM NM HS'
~I0 /:h-J.8BSNADQ +% )((+ '''&&& 7~?t<;.,
-( 666 . V,)($ V,)($

a
Management’s Discussion and Analysis
As management of the Boulder Valley School District RE-2, we offer readers of the District’s Comprehensive Annual Financial Report this narrative and analysis of the financial activities of the District for the fiscal year ended June 30, 2006. We encourage readers to consider the information presented here in conjunction with additional information that can be found in the letter of transmittal on pages i – vi of this report. Financial Highlights At June 30, 2006:
The primary government has government-wide net assets of $95,542,255. .
Governmental activities have an unrestricted net assets surplus of $18,100,286.
Business-type activities have an unrestricted net assets surplus of $483,950.
Fund balance of the District’s governmental funds increased by $6,046,820 resulting in an ending fund balance of $42,416,962.
The Combined General Fund ending balance increased by $4,540,549 to $23,549,239
primarily because of funding increases in state categorical revenues, increases in local property tax collections due to the passage of the transportation mill levy override election, decreases in salary and benefit costs compared to budget amounts, and unexpended budget amounts identified for carryover into the 2006-07 fiscal year.
The District’s long-term general obligation debt decreased by $7,060,000 to
$133,250,000 as a result of current year principal and interest payments on the outstanding debt.
Overview of the Financial Statements Management’s discussion and analysis is intended to serve as an introduction to the District’s basic financial statements. The Boulder Valley School District’s basic financial statements are comprised of three components: 1) Government-wide financial statements, 2) Fund financial statements, and 3) Notes to the basic financial statements. This report also contains other supplementary information in addition to the basic financial statements themselves. Government-wide Financial Statements The government-wide financial statements are designed to provide readers a broad overview of the District’s financial activities in a manner similar to a private sector business. The statement of net assets presents information on all of the District’s assets and liabilities. The difference between assets and liabilities is reported as net assets. Over time, changes in net assets may serve as a useful indicator of whether the financial position of the District is improving or deteriorating. The statement of activities presents information showing how the net assets of the District changed during the current fiscal year. Changes in net assets are recorded in the statement of activities when the underlying event occurs, regardless of the timing of related cash flows. Thus, revenues and expenses are reported in this statement for some items that will result in cash flows in future fiscal periods (example: levied but uncollected property taxes and earned but unused employees’ vacation leave).

b
The government-wide financial statements consolidate governmental and internal service activities that are principally supported by taxes and intergovernmental revenues from business-type activities that are intended to recover all or most of their costs through user fees and charges. Governmental activities consolidate all of the following District funds: General Fund, Risk Management Fund, Technology Fund, Athletics Fund, Community Schools Fund, Tuition Preschool Fund, Colorado Preschool Fund, Governmental Designated-Purpose Grants Fund, Transportation Fund, Capital Reserve Fund, Insurance Reserve Fund, Dental Insurance Fund and Bond Redemption Fund. Business-type activities include only the Food Service Fund. The government-wide financial statements include not only the District itself (known as the primary government), but also information about the District’s four charter schools (known as component units). Financial information for the charter schools is presented separately from the primary government because the charter schools are legally separate from the District but are financially accountable to the District and provide service to the District’s students. The government-wide financial statements can be found on pages 1-2 of this report. Fund Financial Statements Fund financial statements are designed to demonstrate compliance with finance-related legal requirements. A fund is a grouping of related accounts that is used to maintain control over resources that have been segregated for specific activities or objectives. The District, like other governments, uses fund accounting to ensure and demonstrate compliance. All of the funds of the District have been divided into three categories: governmental funds, proprietary funds and fiduciary funds. Governmental Funds Governmental funds are used to account for essentially the same functions reported as governmental activities in the government-wide financial statements. However, unlike the government-wide statements, governmental fund financial statements focus on near-term financial resources and fund balances (which are spendable resources available at the end of the fiscal year). Such information may be useful in evaluating the District’s near-term financing requirements. Because the focus of governmental funds is narrower than that of the government-wide financial statements, it is useful to compare the information presented for governmental funds with similar information presented for governmental activities in the government-wide financial statements. By doing so, readers may better understand the long-term impact of the District’s near-term financing decisions. Both the governmental fund balance sheet and the governmental fund statement of revenue, expenditures, and changes in fund balances provide a reconciliation to facilitate this comparison between governmental funds and governmental activities. The District maintains two governmental funds called major funds: the General Fund (which combines the District’s General Operating Fund, Risk Management Fund, Technology Fund, Athletics Fund, Community Schools Fund, Tuition Preschool Fund and the Colorado Preschool Fund) and the Bond Redemption Fund. They are presented separately in the fund financial statements with the remaining governmental funds (combined into a single aggregated presentation labeled other governmental funds). Other governmental funds, called non-major funds, include the Governmental Designated-Purpose Grants Fund, the Transportation Fund and the Capital Reserve Fund. Individual fund information for the non-major funds is presented as other supplemental information after the notes section of this report.

c
The District adopts an annual appropriated budget for each of the individual governmental funds. A budgetary comparison schedule for the General Fund is included in the fund financial statements to demonstrate compliance with the adopted budget. The remaining governmental funds budgetary comparisons are reported as other supplemental information and can be found after the notes section of this report. Proprietary Funds The District maintains two types of proprietary funds. One of the proprietary fund types is an enterprise fund. Enterprise funds are used to present the same functions as the business-type activities presented in the government-wide financial statements. The District uses an enterprise fund to account for its food service operation. The other type of proprietary fund is an internal service fund. Internal service funds are used to accumulate and allocate costs internally among the District’s various functions. The District uses an internal service fund to account for the insurance activities related to the District’s liability, property and workers’ compensation insurance needs and the overall risk management activities of the District and another internal service fund to account for dental insurance premiums. Fiduciary Funds Fiduciary funds are used to account for resources held for the benefit of parties outside the government. Fiduciary funds are not reflected in the government-wide financial statements because these sources of funds are not available to support the District’s direct educational programs. The accounting method used for fiduciary funds is much like that used for proprietary funds. Notes to the Financial Statements The notes to the financial statements provide additional information that is essential to a full understanding of the data provided in the government-wide and fund financial statements. Other Information In additional to the financial statements and accompanying notes, this report also contains other supplemental information concerning the District’s non-major governmental funds. The combining statements of the non-major governmental funds are presented after the notes to the financial statements. Government-wide Financial Analysis Government-wide Net Assets The assets of the District are classified as current assets and capital assets. Cash, investments, receivables, inventories and prepaid expenditures are considered current assets. These assets are available to provide resources for the near-term operations of the District. The majority of current assets are the result of the property tax collection process. The District receives over 60% of the annual property tax assessment in May and June. Capital assets are used in the operations of the District. These assets include land, buildings, equipment and vehicles. As noted earlier, net assets may serve over time as a useful indicator of a government’s financial position. The assets of the primary government exceed liabilities by $95,542,255 with an unrestricted balance of $18,584,236 at June 30, 2006.

d
54.3% of the District’s net assets represent its investment in capital assets (e.g. land, land improvements, buildings, equipment, and vehicles), less related debt used to acquire these assets. The District uses these capital assets to provide services to its constituents; consequently these assets are not available for future spending. Also the resources needed to repay the debt associated with these assets must be provided from other sources, since the capital assets cannot be liquidated to pay the debt. 26.2% of the District’s net assets are subject to external restrictions on how they may be used. The remaining 19.5% of net assets are available to fund the District’s ongoing programs.
Boulder Valley School District RE-2 Net Assets
Governmental Activities Business-type Activities Total 2006 2005 2006 2005 2006 2005
Current and other assets
$73,040,490
$66,715,302
$818,594
$972,426 $73,859,084 $67,687,728
Capital assets
190,418,179
195,994,219
241,459
249,763
190,659,638
196,243,982
Total Assets
263,458,669
262,709,521
1,060,053
1,222,189
264,518,722
263,931,710
Long-term liabilities
140,760,614
147,823,206
-
-
140,760,614
147,823,206
Other liabilities
28,037,577
27,094,571
178,276
168,787
28,215,853
27,263,358
Total Liabilities
168,798,191
174,917,777
178,276
168,787
168,976,467
175,086,564 Net assets Investment in capital assets
net of related debt
51,647,224
49,692,959
241,459
249,763
51,888,683
49,942,722 Restricted for:
Debt Service
16,089,932
15,807,548
-
-
16,089,932
15,807,548
Capital Projects
2,310,761
1,575,024
-
-
2,310,761
1,575,024
Multiple Year Obligations
200,000
200,000
-
-
200,000
200,000
Preschool Expenditures
60,112
-
-
-
60,112
-
Emergencies
6,252,163
6,107,910
156,368
160,179
6,408,531
6,268,089
Unrestricted
18,100,286
14,408,303
483,950
643,460
18,584,236
15,051,763
Total Net Assets
$94,660,478
$87,791,744
$881,777
$1,053,402
$95,542,255
$88,845,146 The District’s net assets increased by $6,697,109 primarily because of funding increases in state categorical revenues, increases in property tax revenues for debt service purposes, increases in property tax revenues due to the passage of the transportation mill levy override election, decreases in salary and benefit costs compared to budget amounts, and unexpended budget amounts identified for carryover into the 2006-07 fiscal year.

e
Government–wide Activities Governmental activities increased the District’s net assets by $6,868,734. Key elements of this increase are as follows:
Boulder Valley School District RE-2 Changes in Net Assets
Governmental Activities Business-type Activities Total 2006 2005 2006 2005 2006 2005
Revenues
Charges For Services $9,226,204
$8,480,417
$3,371,042
$3,370,264
$8,453,109
$11,850,681 Operating Grants/Contributions 19,442,789 19,563,313 1,669,144 1,533,700 20,906,700 21,097,013 General Revenues: Taxes: Local Property Taxes 154,646,048 148,506,345 - - 154,646,048 148,506,345 Specific Ownership Taxes 10,887,850 11,254,363 - - 10,887,850 11,254,363 State Equalization 51,919,871 49,628,580 - - 51,919,871 49,628,580 Other Revenues 2,263,535 1,890,512 - - 6,612,904 1,890,512
Investment Earnings 1,192,940 555,174 - - 1,192,940 555,174 Total Revenue 249,579,236 239,878,704 5,040,186 4,903,964 254,619,422 244,782,668 Expenses
Instruction 159,937,412 156,019,891 - - 159,937,412 156,019,891 Supporting Services 76,041,071 70,880,775 - - 76,041,071 70,880,775 Interest Expense 6,732,020 7,041,788 - - 6,732,020 7,041,788
Food Services - - 5,211,811 4,968,538 5,211,811 4,968,538 Total Expenses 242,710,503 233,942,454 5,211,811 4,968,538 247,922,314 238,910,992 Change in net assets 6,868,734 5,936,250 (171,625) (64,574) 6,697,109 5,871,676
Net Assets - Beginning 87,791,744 81,855,494 1,053,402 1,117,976 88,845,146 82,973,470
Net Assets - Ending $94,660,478
$87,791,744
$881,777
$1,053,402
$95,542,255 $88,845,146 Governmental Activities
• Revenues from Governmental Activities increased by $9,700,532 or 4.0%. Increases in local property taxes were the result of the passage of the transportation mill levy override election. Revenues provided by the School Finance Act (including local property taxes) were flat due to a small increase in enrollment. Increases in state categorical revenues and investment earnings were offset by decreases in specific ownership tax revenues.
• Expenditures from Governmental Activities increased by $8,768,047 or 3.75%. This increase is due primarily to pay increases given to District employees, increase expenditures for technology upgrades, and one-time capital reserve expenditures.
Enterprise Activities
• The $171,625 decrease in net assets from Enterprise Activities is due to declining participation from enrollment shifts, changes in middle level start times, and changes in choices offered in elementary and middle school snack lines.

f
Financial Analysis of the Government’s Funds The District uses fund accounting to ensure and demonstrate compliance with finance-related legal, federal and state requirements. The focus of the District’s governmental funds is to provide information on near-term inflows, outflows and balances of spendable resources. Such information is useful in assessing the District’s financing requirements. In particular, unreserved fund balance may serve as a useful measure of the District’s net resources available for spending at the end of the fiscal year. The Combined General Fund is the major governmental fund of the District. The Combined General Fund under GASB 34 reporting requirements includes the General Operating Fund, Risk Management Fund, Technology Fund, Athletics Fund, Community Schools Fund, Tuition Preschool Fund, and the Colorado Preschool Fund. As of June 30, 2006, the Combined General Fund shows an ending fund balance of $23,549,239 up from the combined fund balance of $19,008,690 for the prior year. The General Operating Fund is the core of operations for the District. At the end of the fiscal year, the fund balance had increased by $3,527,610 to a balance of $21,079,617. This increase is due primarily to increased state categorical revenues, increased investment earnings, lower than anticipated salary and benefit costs and unexpended budget amounts identified for carry over into the 2006-07 fiscal year. The Capital Projects Fund had an increase in fund balance at the end of the year of $791,432 to $2,575,484 due primarily to capital projects started but not completed during 2005-06. The Bond Redemption Fund ended the fiscal year with a balance of $15,912,470 which will carry forward into 2006-07 to fund the District’s long-term debt principal and interest payments. General Operating Fund Budgetary Highlights The Boulder Valley School District RE-2 began the 2005-06 budget process with the development of a calendar as presented to the Board of Education in December of 2004.
The Superintendent conducted budget information forums at selected schools sites in January and February, 2005. A publication entitled “Budget Perspectives” was developed jointly by the Budget Services and Communications departments as a centerpiece for these information sessions. A video presentation by the Superintendent of the “Budget Perspectives” document was also distributed to schools to assist in communicating to staff and parent groups the issues facing the Boulder Valley School District in the coming year.
During the months of February and March 2005, the Superintendent conducted budget input sessions with all schools. Meetings were also held with select central departments to discuss critical District issues. The major topics to come forward in these meetings were central themes in developing the 2005-06 Proposed Budget. Major topics of the budget input sessions included:
What programs/services are essential?
• Maintain the programs we have. Do not start new programs we cannot sustain.
What are the impacts of past reductions?
• Previous cuts to central and support services have had a negative impact on schools. Examples include literacy coaches, custodians and maintenance services.
What improvements are necessary?

g
• Additional literacy support at the secondary level for the implementation of the Colorado Basic Literacy Act. Support for math instruction; keeping technology current is critical, particularly at the high schools; and a desire to maintain small class sizes at all levels.
A budget work session was held with the Board of Education on April 7, 2005. This work session reviewed the assumptions and projections for 2005-06 and identified the issues facing the District, which include:
• Maintain Student Achievement • Close Achievement Gap • Employee Compensation • Critical District Needs • Computer Replacement Program • Colorado Legislative Actions
After reviewing the input from the Board of Education, the school budget discussions, the enrollment projections prepared by the Planning Department and the most current revenue assumptions, the Superintendent and his senior staff prepared a preliminary budget guided by the priorities outlined in the BVSD Strategic Plan. The preliminary budget was presented to the Board of Education on April 12, 2005. A public input session, hosted by the District Accountability Committee was conducted on April 20, 2005 at Platt Middle School. This meeting provided an opportunity for the general public to listen to a presentation by the Superintendent on the preliminary budget and ask questions regarding budget development and provide input.
The Board of Education meetings between April and June provided an opportunity for the general public to contribute direct input to the Board regarding the budget as Agenda item IV at each meeting is set aside for public participation. Each speaker is allotted two minutes to discuss topics of interest to the individual. The Board of Education takes public comments into consideration during the budget development process. The 2005-06 Proposed Budget was presented on May 24, 2005 and the Board of Education continued discussions at the scheduled Board meetings until adoption of the budget on June 14, 2005.
The final phase of budget development was the modification of the June adopted budget based on final 2004-05 financial data and updated enrollment information gained from the first month of school. This budget development process is consistent with current Colorado statutes that require a proposed budget be presented to the Board of Education by June 1, with budget adoption by June 30. The law provides the opportunity for the Board to adjust revenues and expenditures through October 15, as well as adopt a supplemental budget to cover the portion of the fiscal year following a referendum election. The Board of Education adopted a Revised Budget based on the new information as described above on October 11, 2005 and a Supplemental Budget on December 13, 2005 as a result of the successful passage of the Transportation mill levy on November 1, 2005. The budget document incorporated all changes adopted on both October 11 and December 13. General Operating Fund Expenditure Highlights General operating fund spending in 2005-06 provided for the continuation of district programs and services. General Operating Fund expenditures by function is shown in the following chart. 76.68% of expenditures are instruction related; regular program instruction, special program instruction, and direct instructional support; 16.01% of expenditures are for school administration, operations and maintenance of District facilities and 7.32% of expenditures are for District wide services and community obligations.

h
Spending Your Boulder Valley School District RE-2 Dollar
Function June 30, 2006 Percent Regular Instruction
Regular Instruction
$103,586,556 53.29% Special Instruction Special Education 24,101,358 Vocational Education 2,866,739 Co-curricular Education 1,080,470 Literacy & Language Support Services 3,944,418 Talented and Gifted Education 1,127,897 Sub-Total Special Instruction 33,120,882 17.04% Instructional Support Student Services 5,164,787 Instructional Staff Support 7,161,980 _______ Sub-Total Instructional Support 12,326,767 6.34%
Sub-Total Instruction
$149,034,205 76.67% School Administration and Operations School Administration 14,377,908 Operations and Maintenance 16,731,373 Sub-Total School Administration and Operations 31,109,281 16.01% District Wide/Community Services General Administration 2,774,532 Business Services 2,016,893 Central Services 8,603,948 Community Services 126,291 Debt Services 704,507 Sub-Total District Wide/Community Services 14,226,171 7.32%
Total General Operating Fund Expenditures
$194,369,657 100.00%
2006 Expenditures By Function
Instructional Support6.34%
School Administration and Operations
16.01%
Special Instruction
17.04%
Regular Instruction
53.29%
District Wide/Community
Services7.32%

i
General Operating Fund expenditures by object is shown in the following chart. 80.47% of expenditures are for salary and benefit costs, 12.23% are for non-personnel costs and 7.30% are for allocations to District charter schools. Object June 30, 2006 Percent Personnel Costs: Salaries $ 130,864,139 67.33% Employee Benefits 25,549,318 13.14% Subtotal $ 156,413,457 80.47% Non-Personnel Costs: Purchased Services $ 8,428,228 4.34% Supplies 9,864,904 5.08% Property 930,092 .48% Other 1,298,461 .67% Allocation to Insurance Reserve 3,243,572 1.67% Subtotal $ 23,765,257 12.23% Operating Expenditures $ 180,178,712 92.70% Allocations to Charters $ 14,190,943 7.30% Total Expenditures $ 194,369,657 100.00%
2006 Expenditures By Object
Salaries67.33%
Property0.48%
Supplies5.08%
Purchased Services4.34%
Employee Benefits13.14%
Other0.67% Allocation to Insurance
Reserve1.67%
Allocations to Charter Schools7.30%

j
Combined General Fund Fund Balance Analysis An analysis of the District’s Combined General Fund fund balance is shown in the following chart. The $23,549,239 fiscal year 2005-06 fund balance is at the highest level in the past 10 years.
Ten Year Analysis of Combined General Fund Fund Balance
-5.00
0.00
5.00
10.00
15.00
20.00
25.00
1997 1998 1999 2000 2001 2002 2003 2004 2005 2006
Year
Mill
ions
For the year ending June 30, 2006, the Combined General Fund includes the General Operating Fund, Risk Management Fund, Technology Fund, Athletics Fund, Community Schools Fund, Tuition Preschool Fund, and Colorado Preschool Fund and excludes the Charter School Fund. For the years ending after June 30, 2002 through June 30, 2005, the Combined General Fund includes the General Operating Fund, Summer School Fund, Athletics Fund, Community Schools Fund, Tuition Preschool Fund, and Colorado Preschool Fund and excludes the Charter School Fund. For the years ending June 30, 2001 and prior, the Combined General Fund includes the General Operating Fund, Summer School Fund, Athletics Fund, Community Schools Fund, and the Charter School Fund. Fund Balance Policy In May 2004 the District revised Board Policy DB. The purpose of this revision was to ensure the District’s ongoing financial health by maintaining a minimum level of year end fund balance. Key provisions of this policy are: 1. The General Operating Fund budget will be developed so that the total of annual ongoing expenditures, transfers, and incremental increase in required reserves does not exceed annual revenues.

k
2. If the General Operating Fund ends any fiscal year with a surplus of revenue beyond expenditures, this amount can only be used for one-time operating expenditures in subsequent years.
3. The General Operating Fund budget will be developed containing an ending fund balance equal to or greater than the required TABOR reserve on a generally accepted accounting principles (GAAP) basis.
4. The budgets for all other funds will be developed to include, at a minimum, the
required TABOR reserve.
5. Beginning with the 2005-06 fiscal year, the General Operating Fund budget will be developed on a generally accepted accounting principles (GAAP) basis.
The 2005-06 budget was developed in accordance with all provisions of this policy. Capital Assets and Debt Administration The District’s investment in capital assets for its governmental and business-type activities as of June 30, 2006 amounts to $190,659,638.
Boulder Valley School District RE-2 Capital Assets (net of accumulated depreciation)
June 30, 2006 June 30, 2005
Land $2,802,833 $2,802,833 Construction in Progress - 105,762Land Improvements 5,434,850 5,756,245Buildings 175,992,742 182,412,085Equipment 1,015,729 1,119,830Vehicles 5,413,484 4,047,227 Total $190,659,638 $196,243,982
Additional information on the District’s capital assets can be found in Note 4 of this report. At June 30, 2006, the District had total bonded debt outstanding of $133,250,000 backed by the full faith and credit of the District. Additionally, the District had long-term debt obligations for certificates of participation and compensated absences in the amount of $5,805,000 and $1,781,616 respectively, outstanding at the end of the current fiscal year. The Certificates of participation are collateralized by specific buildings owned by the District.
Boulder Valley School District RE-2 Long-Term Debt
June 30, 2006 June 30, 2005 General Obligation Bonds And Bond Premium $133,311,790 $140,396,577 Certificates of Participation 5,805,000 6,300,000Compensated Absences 1,781,616 1,279,731Loss on Debt Refunding (137,792) (153,102) Total $140,760,614 $147,823,206
Additional information on the District’s long-term obligations can be found in Note 7 of this report.

l
Economic Factors and Next Year’s Budget Over 80% of the General Operating Fund revenues come from state level decisions. The Colorado State Legislature approved School Finance Act (SFA) funding that increased the statewide base by 3.1%. This included an inflationary increase of 2.1% plus 1%. This funding level reflects the mandate approved in November of 2000 with the passage of Amendment 23 to the Colorado Constitution. Amendment 23 guarantees annual funding increases of inflation plus one percent for ten years and increases to equal inflation thereafter. Minor adjustments to the factors within the School Finance Act formula slightly increased funding for at-risk students. The projected School Finance Act per pupil revenue for 2006-07 for the District is $6,315. Total Program funding, as defined by the School Finance Act is projected to be $168,887,188, however the timing of tax collections over two fiscal years will result in approximately $700,000 less revenue in 2006-07. Enrollment projections indicate an overall slight decline in 2006-07 of 0.57% across the District. Charter School growth of 9.37% is driven by continued growth at all four existing charter schools and the opening of a fifth new charter school. Subsequently, non-charter schools are expected to decline by 1.34%, or 331 FTE when compared to the 2005-06 budgeted student FTE. It should be noted that the District continues to attract a significant number of students from outside its boundaries, almost 7% for the 2005-06 year. This enrollment cannot be guaranteed in the future as neighboring districts grow and build new school facilities.
The total number of District students is projected to decrease by 87 from the October 1, 2005 pupil count. For the Funded Pupil Count, half-time students are counted as 0.5 FTE. In 2006-07, the Total Student FTE is expected to decrease by 92.5 FTE, a 0.35% decrease. Colorado Statute 22-54-103(7) allows districts to average up to three years' pupil counts with the current year's pupil count to soften enrollment declines. For 2006-07 this averaging rule allows the BVSD an additional 95.3 FTE for a total Funded Pupil Count of 26,742.3 Requests for Information This financial report is designed to provide a general overview of the Boulder Valley School District RE-2’s finances for all those with an interest in the District. Questions concerning any of the information provided in this report or requests for additional information should be addressed to:
Leslie A. Stafford, CPA, Finance & Accounting Services Director Boulder Valley School District RE-2
6500 East Arapahoe Boulder, Colorado 80301

BASIC FINANCIAL STATEMENTS

BOULDER VALLEY SCHOOL DISTRICT RE-2
STATEMENT OF NET ASSETSJune 30, 2006
COMPONENTPRIMARY GOVERNMENT UNITS
GOVERNMENTAL BUSINESS-TYPE CHARTERACTIVITIES ACTIVITIES TOTAL SCHOOLS
ASSETS Cash and Investments $ 62,275,952 $ 357,715 $ 62,633,667 $ 4,610,659 Restricted Cash and Investments 816,264 - 816,264 2,708,275 Accounts Receivable 536,067 - 536,067 29,562 Taxes Receivable 6,413,849 - 6,413,849 - Grants Receivable 2,384,704 355,514 2,740,218 - Inventories 389,834 105,365 495,199 13,500 Prepaid Expenses and Deposits 15,777 - 15,777 36,134 Debt Issuance Costs, Net of Accumulated Amortization 208,043 - 208,043 642,455 Capital Assets, Not Being Depreciated 2,802,833 - 2,802,833 1,103,000 Capital Assets, Net of Accumulated Depreciation 187,615,346 241,459 187,856,805 12,752,425
TOTAL ASSETS 263,458,669 1,060,053 264,518,722 21,896,010
LIABILITIES Accounts Payable 3,967,382 - 3,967,382 2,357 Accrued Liabilities 4,221,188 144,813 4,366,001 52,444 Accrued Salaries and Benefits 19,416,255 - 19,416,255 579,229 Accrued Interest Payable - - - 426,278 Deferred Revenues 432,752 33,463 466,215 64,032 Noncurrent Liabilities Due Within One Year 7,880,000 - 7,880,000 400,000 Due in More Than One Year 132,880,614 - 132,880,614 17,878,767
TOTAL LIABILITIES 168,798,191 178,276 168,976,467 19,403,107
NET ASSETS Invested in Capital Assets, Net of Related Debt 51,647,224 241,459 51,888,683 (3,780,887) Restricted for Debt Service 16,089,932 - 16,089,932 2,708,275 Restricted for Capital Projects 2,310,761 - 2,310,761 - Restricted for Multiple Year Obligations 200,000 - 200,000 - Restricted for Colorado Preschool Program 60,112 - 60,112 - Restricted for Emergencies 6,252,163 156,368 6,408,531 369,255 Unrestricted 18,100,286 483,950 18,584,236 3,196,260
TOTAL NET ASSETS $ 94,660,478 $ 881,777 $ 95,542,255 $ 2,492,903
The accompanying notes are an integral part of the financial statements.
1

BOULDER VALLEY SCHOOL DISTRICT RE-2
STATEMENT OF ACTIVITIESYear Ended June 30, 2006
PROGRAM REVENUESOPERATING
CHARGES FOR GRANTS ANDFUNCTIONS/PROGRAMS EXPENSES SERVICES CONTRIBUTIONS
PRIMARY GOVERNMENTGovernmental Activities Instruction $ 159,937,412 $ 1,071,875 $ 14,169,989 Supporting Services 76,041,071 8,154,329 5,272,800 Interest Expense 6,732,020 - -
Total Governmental Activities 242,710,503 9,226,204 19,442,789
Business-Type Activities Food Services 5,211,811 3,371,042 1,669,144
Total Business-Type Activities 5,211,811 3,371,042 1,669,144
TOTAL PRIMARY GOVERNMENT $ 247,922,314 $ 12,597,246 $ 21,111,933
COMPONENT UNITS Charter Schools 16,496,865 803,677 758,595
TOTAL COMPONENT UNITS $ 16,496,865 $ 803,677 $ 758,595
GENERAL REVENUES Local Property Taxes Specific Ownership Taxes State Equalization Capital Construction Funding Investment Earnings Other Revenues
TOTAL GENERAL REVENUES
CHANGE IN NET ASSETS
NET ASSETS, Beginning
NET ASSETS, Ending
The accompanying notes are an integral part of the financial statements.
2

NET (EXPENSE) REVENUE AND CHANGES IN NET ASSETSPRIMARY GOVERNMENT COMPONENT
UNITSGOVERNMENTAL BUSINESS-TYPE CHARTER
ACTIVITIES ACTIVITIES TOTAL SCHOOLS
$ (144,695,548) $ - $ (144,695,548) $ - (62,613,942) - (62,613,942) -
(6,732,020) - (6,732,020) -
(214,041,510) - (214,041,510) -
- (171,625) (171,625) -
- (171,625) (171,625) -
(214,041,510) (171,625) (214,213,135) -
- - - (14,934,593)
- - - (14,934,593)
154,646,048 - 154,646,048 2,254,11010,887,850 - 10,887,850 - 51,919,871 - 51,919,871 -
- - - 188,8151,192,940 - 1,192,940 162,7602,263,535 - 2,263,535 13,134,767
220,910,244 - 220,910,244 15,740,452
6,868,734 (171,625) 6,697,109 805,859
87,791,744 1,053,402 88,845,146 1,687,044
$ 94,660,478 $ 881,777 $ 95,542,255 $ 2,492,903

BOULDER VALLEY SCHOOL DISTRICT RE-2
BALANCE SHEETGOVERNMENTAL FUNDS
June 30, 2006
OTHER TOTALBOND GOVERNMENTAL GOVERNMENTAL
GENERAL REDEMPTION FUNDS FUNDSASSETS Cash and Investments $ 42,857,425 $ 15,557,338 $ 3,236,560 $ 61,651,323 Restricted Cash and Investments 816,264 - - 816,264 Accounts Receivable 463,595 52,472 20,000 536,067 Taxes Receivable 5,781,935 480,622 151,292 6,413,849 Grants Receivable - - 2,384,704 2,384,704 Due from Other Funds 1,112,883 - - 1,112,883 Inventories 389,834 - - 389,834 Prepaid Items 15,597 - 180 15,777
TOTAL ASSETS $ 51,437,533 $ 16,090,432 $ 5,792,736 $ 73,320,701
LIABILITIES AND FUND BALANCESLIABILITIES Accounts Payable $ 3,722,808 $ 500 $ 9,393 $ 3,732,701 Accrued Liabilities 3,764,702 - 456,486 4,221,188 Accrued Salaries and Benefits 18,427,960 - 988,295 19,416,255 Due to Other Funds - - 1,112,883 1,112,883 Deferred Revenues 162,326 - 270,426 432,752 Deferred Property Taxes 1,810,498 177,462 - 1,987,960
TOTAL LIABILITIES 27,888,294 177,962 2,837,483 30,903,739
FUND BALANCES Reserved for Inventories 389,834 - - 389,834 Reserved for Prepaid Items 15,597 - - 15,597 Reserved for Multiple Year Obligations 200,000 - - 200,000 Reserved for Colorado Preschool Program 60,112 - - 60,112 Reserved for Emergencies 5,750,909 - 501,254 6,252,163 Unreserved, Reported in General Fund 17,132,787 - - 17,132,787 Debt Service Fund - 15,912,470 - 15,912,470 Special Revenue Fund - - 143,238 143,238 Capital Projects Fund - - 2,310,761 2,310,761
TOTAL FUND BALANCES 23,549,239 15,912,470 2,955,253 42,416,962
TOTAL LIABILITIES ANDFUND BALANCES $ 51,437,533 $ 16,090,432 $ 5,792,736
Amounts reported for governmental activities in the statement of net assets are different because:
Capital assets used in governmental activities are not current financial resources and therefore, are not reported in the funds. 190,418,179
Other long-term assets are not available to pay for current year expenditures and therefore, are deferred in the funds. 1,987,960
Internal service funds are used by management to charge the costs of insurance to individual funds. The assets and liabilities of the internal service funds are included in governmental activities in the statement of net assets. 389,948
Long-term liabilities, including bonds payable ($133,250,000), bond premium ($61,790), certificates of participation ($5,805,000), compensated absences ($1,781,616), debt issuance costs $208,043, and loss on refunding $137,792 are not due and payable in the current year and therefore, are not reported in the funds. (140,552,571)
Net assets of governmental activities $ 94,660,478
The accompanying notes are an integral part of the financial statements.
3

BOULDER VALLEY SCHOOL DISTRICT RE-2
STATEMENT OF REVENUES, EXPENDITURESAND CHANGES IN FUND BALANCES
GOVERNMENTAL FUNDSYear Ended June 30, 2006
OTHER TOTALBOND GOVERNMENTAL GOVERNMENTAL
GENERAL REDEMPTION FUNDS FUNDSREVENUES Local Sources $ 159,742,346 $ 13,927,060 $ 5,764,158 $ 179,433,564 State Sources 59,409,079 - 699,254 60,108,333 Federal Sources - - 10,875,250 10,875,250
TOTAL REVENUES 219,151,425 13,927,060 17,338,662 250,417,147
EXPENDITURES Current Instruction 139,904,230 - 9,108,674 149,012,904 Supporting Services 63,304,262 - 11,058,755 74,363,017 Capital Outlay - - 7,171,042 7,171,042 Debt Service Principal 495,000 7,060,000 - 7,555,000 Interest and Fiscal Charges 209,507 6,531,990 - 6,741,497
TOTAL EXPENDITURES 203,912,999 13,591,990 27,338,471 244,843,460
EXCESS OF REVENUES OVER (UNDER) EXPENDITURES 15,238,426 335,070 (9,999,809) 5,573,687
OTHER FINANCING SOURCES (USES) Transfers In 473,133 - 11,171,010 11,644,143 Transfers Out (11,171,010) - - (11,171,010)
TOTAL OTHER FINANCING SOURCES (USES) (10,697,877) - 11,171,010 473,133
NET CHANGE IN FUND BALANCES 4,540,549 335,070 1,171,201 6,046,820 FUND BALANCES, Beginning 19,008,690 15,577,400 1,784,052 36,370,142
FUND BALANCES, Ending $ 23,549,239 $ 15,912,470 $ 2,955,253 $ 42,416,962
The accompanying notes are an integral part of the financial statements.
4

BOULDER VALLEY SCHOOL DISTRICT RE-2
RECONCILIATION OF THE STATEMENT OF REVENUES,EXPENDITURES AND CHANGES IN FUND BALANCES OF GOVERNMENTAL FUNDS
TO THE STATEMENT OF ACTIVITIESYear Ended June 30, 2006
Amounts reported for governmental activities in the statement of activities are different because:
Net change in fund balances, governmental funds $ 6,046,820
Capital outlays to purchase or build capital assets are reported in governmental funds asexpenditures. However, for governmental activities those costs are shown in the statementof net assets and allocated over their estimated useful lives as annual depreciation expense inthe statement of activities. This is the amount by which depreciation expense ($7,985,021)and loss on disposal ($30,665) exceeded capital outlay $2,439,646 in the current year. (5,576,040)
Revenues that do not provide current financial resources are deferred in the governmental fundfinancial statements but are recognized in the government-wide financial statements.This amount represents property taxes not available at year end. (837,910)
Repayments of debt principal $7,555,000 and increases in compensated absences ($501,885)are expenditures in the governmental funds, but they reduce long-term liabilities in thestatement of net assets and do not affect the statement of activities. 7,053,115
Bond proceeds provide current financial resources to governmental funds, but issuing debt increaseslong-term liabilities in the statement of net assets. This amount is the net effect of these differencesin the treatment of long-term debt and related items: amortization of bond issuance costs ($34,172),amortization of bond premium $24,787, and amortization of loss on refunding ($15,310). (24,695)
Internal service funds are used by management to charge the costs of insurance to individualfunds. The net revenue of the internal service funds is included in governmental activities in thestatement of activities. 207,444
Change in net assets of governmental activities $ 6,868,734
The accompanying notes are an integral part of the financial statements.
5

BOULDER VALLEY SCHOOL DISTRICT RE-2
BALANCE SHEETPROPRIETARY FUNDS
June 30, 2006
BUSINESS-TYPE GOVERNMENTALACTIVITIES ACTIVITIESENTERPRISE INTERNAL SERVICE
FUNDS FUNDSASSETS Current Assets Cash and Investments $ 357,715 $ 624,629 Grants Receivable 355,514 - Inventories 105,365 -
Total Current Assets 818,594 624,629
Noncurrent Assets Equipment 1,105,215 - Accumulated Depreciation (863,756) -
Total Noncurrent Assets 241,459 -
TOTAL ASSETS 1,060,053 624,629
LIABILITIESCurrent Liabilities Claims Payable - 234,681 Accrued Liabilities 144,813 - Deferred Revenues 33,463 -
TOTAL LIABILITIES 178,276 234,681
NET ASSETS Invested in Capital Assets 241,459 - Restricted for Emergencies 156,368 - Unrestricted 483,950 389,948
TOTAL NET ASSETS $ 881,777 $ 389,948
The accompanying notes are an integral part of the financial statements.
6

BOULDER VALLEY SCHOOL DISTRICT RE-2
STATEMENT OF REVENUES, EXPENSES, AND CHANGES IN FUND NET ASSETSPROPRIETARY FUNDSYear Ended June 30, 2006
BUSINESS-TYPE GOVERNMENTALACTIVITIES ACTIVITIESENTERPRISE INTERNAL SERVICE
FUNDS FUNDSOPERATING REVENUES Regular School Lunch $ 1,546,054 $ - Sandwich Line 1,812,688 - Premiums and Services - 3,633,520 Other Revenue 12,300 7,278
TOTAL OPERATING REVENUES 3,371,042 3,640,798
OPERATING EXPENSES Salaries 2,016,498 885,478 Benefits 507,343 199,602 Purchased Food 2,133,336 - USDA Donated Commodities 160,996 - Nonfood Supplies 148,529 - Purchased Services 58,001 1,827,729 Depreciation 40,157 - Indirect Costs 122,755 - Other 24,196 47,412
TOTAL OPERATING EXPENSES 5,211,811 2,960,221
OPERATING INCOME (LOSS) (1,840,769) 680,577
NONOPERATING REVENUES USDA Donated Commodities 204,659 - Federal Reimbursements 1,410,753 - State Matching Funds 53,732 -
TOTAL NONOPERATING REVENUES 1,669,144 -
NET INCOME (LOSS) BEFORE TRANSFERS (171,625) 680,577
TRANSFERS Transfers Out - (473,133)
CHANGE IN NET ASSETS (171,625) 207,444
NET ASSETS, Beginning 1,053,402 182,504
NET ASSETS, Ending $ 881,777 $ 389,948
The accompanying notes are an integral part of the financial statements.
7

BOULDER VALLEY SCHOOL DISTRICT RE-2
STATEMENT OF CASH FLOWSPROPRIETARY FUNDS
Increase (Decrease) in CashYear Ended June 30, 2006
BUSINESS-TYPE GOVERNMENTALACTIVITIES ACTIVITIES ENTERPRISE INTERNAL SERVICE
FUND FUNDSCash Flows From Operating Activities Contributions $ - $ 3,633,520 Cash Received from Operations 3,559,877 - Other Operating Receipts 12,300 7,278 Cash Payments for Premiums and Claims - (1,593,048) Cash Paid to Employees (2,507,608) (1,105,569) Cash Paid to Suppliers (2,640,939) (47,412)
Net Cash Provided (Used) by Operating Activities (1,576,370) 894,769
Cash Flows From Noncapital Financing Activities Cash Received from Federal Reimbursements 1,396,387 - Cash Received from State Matching Funds 53,732 - Transfers to Other Funds - (473,133)
Net Cash Provided (Used) by Noncapital Financing Activities 1,450,119 (473,133)
Cash Flows From Capital and Related Financing Activities Purchases of Equipment (31,853) -
NET INCREASE (DECREASE) IN CASH (158,104) 421,636
CASH, Beginning 515,819 202,993
CASH, Ending $ 357,715 $ 624,629
RECONCILIATION OF OPERATING INCOME (LOSS) TO NET CASH PROVIDED (USED) BY OPERATING ACTIVITIES Operating Income (Loss) $ (1,840,769) $ 680,577 Adjustments to Reconcile Operating Income (Loss) to Net Cash Provided (Used) by Operating Activities Depreciation 40,157 - Donated Commodities 204,659 - Changes in Assets and Liabilities Related to Operations Accounts Receivable 2,755 - Inventories 7,339 - Accounts Payable (465) - Claims Payable - 234,681 Accrued Liabilities 16,233 (20,489) Deferred Revenues (6,279) -
Total Adjustments 264,399 214,192
Net Cash Provided (Used) by Operating Activities $ (1,576,370) $ 894,769 NON-CASH TRANSACTIONS Commodities Received $ 204,659 $ -
The accompanying notes are an integral part of the financial statements.
8

BOULDER VALLEY SCHOOL DISTRICT RE-2
STATEMENT OF FIDUCIARY NET ASSETSJune 30, 2006
PRIVATEPURPOSE AGENCY
TRUST FUNDS FUNDASSETS Cash and Investments $ 248,632 $ 3,193,059
TOTAL ASSETS 248,632 3,193,059
LIABILITIES Due to Student Groups - 3,193,059
TOTAL LIABILITIES - 3,193,059
NET ASSETS Restricted for Scholarships 248,632 -
TOTAL NET ASSETS $ 248,632 $ -
The accompanying notes are an integral part of the financial statements.
9

BOULDER VALLEY SCHOOL DISTRICT RE-2
STATEMENT OF CHANGES IN FIDUCIARY NET ASSETSYear Ended June 30, 2006
PRIVATEPURPOSE
TRUST FUNDSADDITIONS Contributions $ 13,672
TOTAL ADDITIONS 13,672
DEDUCTIONS Scholarships and Awards 11,713
CHANGE IN NET ASSETS 1,959
NET ASSETS, Beginning 246,673
NET ASSETS, Ending $ 248,632
The accompanying notes are an integral part of the financial statements.
10

BOULDER VALLEY SCHOOL DISTRICT RE-2
NOTES TO FINANCIAL STATEMENTSJune 30, 2006
11
NOTE 1: SUMMARY OF SIGNIFICANT ACCOUNTING POLICIES
The accounting policies of Boulder Valley School District RE-2 (the “District”) conform togenerally accepted accounting principles as applicable to governmental units. The GovernmentalAccounting Standards Board (“GASB”) is the accepted standard-setting body for establishinggovernmental accounting and financial reporting principals. Following is a summary of the moresignificant policies.
Reporting Entity
The financial reporting entity consists of the District and organizations for which the District isfinancially accountable. All funds, organizations, institutions, agencies, departments and officesthat are not legally separate are part of the District. In addition, any legally separate organizationsfor which the District is financially accountable are considered part of the reporting entity.Financial accountability exists if the District appoints a voting majority of the organization’sgoverning board and is able to impose its will on the organization, or if the organization providesbenefits to, or imposes financial burdens on the District.
Based upon the application of this criteria, the District includes four charter schools within itsreporting entity. The charter schools are public schools authorized by State statutes to providealternatives for parents, pupils and teachers. The charter schools are fiscally dependent on theDistrict and their exclusion would render the District’s financial statements incomplete. Since thecharter schools have separately elected boards, the balances and transactions of the charter schoolsare discretely presented in the financial statements. Separate financial statements for the Peak toPeak Charter School may be obtained by contacting the School at 800 Merlin Drive, Lafayette,Colorado 80026. Separate financial statements for the remaining charter schools are not available.
Government-Wide and Fund Financial Statements
The government-wide financial statements (i.e., the statement of net assets and the statement ofactivities) report information on all nonfiduciary activities of the District and its component units.For the most part, the effect of interfund activity has been removed from these statements.Exceptions to this general rule are charges for interfund services that are reasonably equivalent tothe services provided. Governmental activities, which normally are supported by taxes andintergovernmental revenues, are reported separately from business-type activities, which rely toa significant extent on fees and charges for support. Likewise, the primary government is reportedseparately from certain legally separate component units for which the District is financiallyaccountable.
The statement of activities demonstrates the degree to which the direct expenses of the givenfunction or segment are offset by program revenues. Direct expenses are those that are clearlyidentifiable with a specific function or segment. Program revenues include 1) charges to studentsor other customers who purchase, use, or directly benefit from goods, services, or privileges

BOULDER VALLEY SCHOOL DISTRICT RE-2
NOTES TO FINANCIAL STATEMENTSJune 30, 2006
12
NOTE 1: SUMMARY OF SIGNIFICANT ACCOUNTING POLICIES (Continued)
Government-Wide and Fund Financial Statements (Continued)
provided by a given function or segment and 2) grants and contributions that are restricted tomeeting the operational or capital requirements of a particular function or segment. Taxes andother items not properly included among program revenues are reported instead as generalrevenues. Internally dedicated resources are reported as general revenues rather than as programrevenues.
Separate financial statements are provided for governmental funds, proprietary funds, andfiduciary funds, even though the latter are excluded from the District’s government-wide financialstatements.
Measurement Focus, Basis of Accounting, and Financial Statement Presentation
The government-wide financial statements are reported using the economic resources measurementfocus and the accrual basis of accounting, as are the proprietary fund financial statements.Revenues are recorded when earned and expenses are recorded when the liability is incurred,regardless of the timing of related cash flows. Property taxes are recognized as revenues in theyear for which they are levied. Grants and similar items are recognized as revenue as soon as alleligibility requirements imposed by the provider have been met. Fiduciary funds utilize theaccrual basis of accounting.
Governmental fund financial statements are reported using the current financial resourcesmeasurement focus and the modified accrual basis of accounting. Revenues are recognized assoon as they are both measurable and available. Revenues are considered to be available whenthey are collected within the current year or soon enough thereafter to pay liabilities of the currentyear. For this purpose, the District considers revenues to be available if they are collected within60 days of the end of the current fiscal period.
Property taxes, specific ownership taxes, grants, and interest associated with the current year areconsidered to be susceptible to accrual and so have been recognized as revenues of the currentyear. All other revenues are considered to be measurable and available only when cash is receivedby the District.
Expenditures generally are recorded when a liability is incurred, as under accrual accounting.However, debt service expenditures, as well as expenditures related to compensated absences, arerecorded only when payment is due.

BOULDER VALLEY SCHOOL DISTRICT RE-2
NOTES TO FINANCIAL STATEMENTSJune 30, 2006
13
NOTE 1: SUMMARY OF SIGNIFICANT ACCOUNTING POLICIES (Continued)
Measurement Focus, Basis of Accounting, and Financial Statement Presentation (Continued)
Private-sector standards of accounting and financial reporting issued prior to December 1, 1989,generally are followed in both the government-wide and proprietary (enterprise and internalservice) fund financial statements to the extent that those standards do not conflict with orcontradict guidance of the Governmental Accounting Standards Board. Governments also havethe option of following subsequent private-sector guidance for their business-type activities andenterprise funds, subject to this same limitation. The District has elected not to follow subsequentprivate-sector guidance.
Proprietary funds distinguish operating revenues and expenses from nonoperating items.Operating revenues and expenses generally result from providing services and producing anddelivering goods in connection with the fund’s principal ongoing operations. Operating expensesfor enterprise funds and internal service funds include the cost of sales and services, administrativeexpenses, and depreciation on capital assets. All revenues and expenses not meeting this definitionare reported as nonoperating revenues and expenses.
When both restricted and unrestricted resources are available for use, it is the District’s practiceto use restricted resources first, then unrestricted resources as they are needed.
In the fund financial statements, the District reports the following major governmental funds:
The General Fund is the District’s primary operating fund. It accounts for all financial resourcesof the District, except those required to be accounted for in another fund.
The Bond Redemption Fund accounts for resources accumulated for, and payments made on, long-term debt obligations of the District.
Additionally, the District reports the following fund types:
The Food Services Enterprise Fund accounts for the financial activities associated with theDistrict’s school lunch program.
The Insurance Reserve Internal Service Fund and the Dental Insurance Internal Service Fundaccount for the activities related to the District’s liability, property, workers compensation anddental insurance needs, and for providing overall risk management activities for the District.
The Private-Purpose Trust Funds account for the activities of various scholarship accounts. TheDistrict holds all resources in a purely custodial capacity.
The Agency Fund is used to account for resources used to support each school’s student andfundraising activities. The District holds all resources in a purely custodial capacity.

BOULDER VALLEY SCHOOL DISTRICT RE-2
NOTES TO FINANCIAL STATEMENTSJune 30, 2006
14
NOTE 1: SUMMARY OF SIGNIFICANT ACCOUNTING POLICIES (Continued)
Assets, Liabilities and Fund Balances/Net Assets
Cash and Investments - The District utilizes the pooled cash concept whereby cash balances ofeach of the District’s funds and component units are pooled and invested by the District. It is theintention of the investment pool to maximize interest income, and securities are selected accordingto their risk, marketability, and diversification. Investments are reported at fair value.
For purposes of the statement of cash flows, the District considers all highly liquid investmentswith an original maturity of three months or less to be cash equivalents.
Receivables - All receivables are reported at their gross value and, where appropriate, are reducedby the estimated portion that is expected to be uncollectible. Property taxes levied in the currentyear but not received at year end are identified as property taxes receivable and are presented netof an allowance for uncollectible taxes of 1% of the total levy. Any taxes not collected withinsixty days after year end are recorded as deferred revenue in the fund financial statements.
Interfund Receivables and Payables - During the course of operations, numerous transactionsoccur between individual funds. The resulting receivables and payables are classified on thebalance sheet as due from other funds and due to other funds because they are short-term in nature.
Inventories - Materials and supplies inventories are stated at average cost. Food Service Fundinventories consist of purchased and donated commodities. Purchased inventories are stated ataverage cost. Donated inventories, received at no cost under a program supported by the federalgovernment, are valued based upon the cost furnished by the federal government.
Inventory is recorded as an asset when individual items are purchased and as an expenditure whenconsumed.
Prepaid Expenses - Payments made to vendors for services that will benefit periods beyond yearend are recorded as prepaid items using the consumption method. A current asset for the prepaidamount is recorded at the time of payment, and an expenditure/expense is reported in the year inwhich the services are consumed.
Capital Assets - Capital assets, which include property and equipment, are reported in theapplicable governmental or business-type activities columns in the government-wide financialstatements and the proprietary funds in the fund financial statements. Capital assets are definedby the District as assets with an initial, individual cost of more than $5,000 and an estimated usefullife in excess of one year. Such assets are recorded at historical cost or estimated historicalcost if purchased or constructed. Donated capital assets are recorded at estimated fair market valueat the date of donation.
The costs of normal maintenance and repairs that do not add to the value of the asset or materiallyextend assets lives are not capitalized.

BOULDER VALLEY SCHOOL DISTRICT RE-2
NOTES TO FINANCIAL STATEMENTSJune 30, 2006
15
NOTE 1: SUMMARY OF SIGNIFICANT ACCOUNTING POLICIES (Continued)
Assets, Liabilities and Fund Balances/Net Assets (Continued)
Property and equipment of the District and its component units is depreciated using the straightline method over the following estimated useful lives.
Land Improvements 25 yearsBuildings 50 yearsEquipment and Vehicles 5 to 20 years
Deferred Revenues - Deferred revenues include grant funds that have been collected but thecorresponding expenditures have not been incurred. Property taxes earned but not available arealso recorded as deferred revenue in the fund financial statements.
Compensated Absences - District policy allows unlimited accumulation of sick time andaccumulation of vacation time to a maximum of 40 days for certain personnel classifications.Accrued vacation is paid to those eligible employees upon termination of employment. Paymentfor unused sick time is made upon an employee’s retirement at varying rates based upon longevityand classification. The payment of unused sick leave at the time of retirement is made in a lumpsum or over a period of up to five years.
These compensated absences are recognized as current salary costs when earned in the proprietaryfunds and when due in the governmental funds. A long-term liability has been recorded in thegovernment-wide financial statements for the accrued compensated absences.
Long-Term Debt - In the government-wide financial statements, and proprietary funds in the fundfinancial statements, long-term debt and other long-term obligations are reported as liabilities inthe applicable governmental activities, business-type activities, or proprietary fund statement ofnet assets. Debt premiums and discounts, as well as issuance costs, are deferred and amortizedover the life of the debt using the straight-line method.
In the fund financial statements, governmental funds recognize debt premiums and discounts, aswell as issuance costs, during the current period. The face amount of debt issued is reported asother financing sources. Premiums received on debt issuances are reported as other financingsources while discounts on debt issuances are reported as other financing uses. Issuance costs,whether or not withheld from the actual debt proceeds received, are reported as currentexpenditures.
Net Assets/Fund Balances - In the government-wide financial statements, net assets are restrictedwhen constraints placed on the net assets are externally imposed. In the fund financial statements,governmental funds report reservations of fund balance for amounts that are not available forappropriation or are legally restricted by outside parties for use for a specific purpose.

BOULDER VALLEY SCHOOL DISTRICT RE-2
NOTES TO FINANCIAL STATEMENTSJune 30, 2006
16
NOTE 1: SUMMARY OF SIGNIFICANT ACCOUNTING POLICIES (Continued)
Revenues
Property Taxes - Under State statutes, all property taxes become due and payable on January 1 inthe year following that in which they are levied. Payments are due in full on April 30, or in twoinstallments on February 28 and June 15. When taxes become delinquent, the property is sold onthe tax sale date of September 30.
State Equalization - The District receives unrestricted State equalization revenues as required byState statutes.
Interest Income - Interest income earned on pooled cash is recorded as revenue in the GeneralFund. Interest income from the Bond Redemption Fund and certain Trust and Agency Fundaccounts is recorded when earned in the related fund.
NOTE 2: CASH AND INVESTMENTS
At June 30, 2006, the District had the following cash and investments:
Cash on Hand $ 20,045 Deposits 3,730,142 Investments 66,220,637
Total $ 69,970,824
Cash and investments are reported in the financial statements as follows:
Primary Government Cash and Investments $ 62,633,667Primary Government Restricted Cash and Investments 816,264 Fiduciary Funds Cash and Investments 3,441,691 Charter School Cash Held by District 3,079,202
Total $ 69,970,824
Deposits
The Colorado Public Deposit Protection Act (PDPA) requires that all units of local governmentdeposit cash in eligible public depositories. Eligibility is determined by State regulations. At June30, 2006, the State regulatory commissioners had indicated that all financial institutions holdingdeposits for the District are eligible public depositories. Amounts on deposit in excess of federalinsurance levels must be collateralized by eligible collateral as determined by the PDPA. PDPAallows the financial institution to create a single collateral pool for all public funds held. The poolis to be maintained by another institution, or held in trust for all the uninsured public deposits asa group. The market value of the collateral must be at least equal to 102% of the uninsureddeposits. At June 30, 2006, the District had bank deposits of $5,365,982 collateralized withsecurities held by the financial institutions’ agents but not in the District’s name.

BOULDER VALLEY SCHOOL DISTRICT RE-2
NOTES TO FINANCIAL STATEMENTSJune 30, 2006
17
NOTE 2: CASH AND INVESTMENTS (Continued)
Investments
The District is required to comply with State statutes and District policy which specify investmentinstruments meeting defined rating, maturity, custodial and concentration risk criteria in whichlocal governments may invest, which include:
• Obligations of the United States and certain U.S. Agency securities• Certain international agency securities• General obligation and revenue bonds of U.S. local government entities• Bankers' acceptances of certain banks• Commercial paper• Written repurchase agreements collateralized by certain authorized securities• Certain money market funds• Guaranteed investment contracts• Local government investment pools
The District had the following investments at June 30, 2006:
Investment Maturity Fair Value
FNMA Note 10/15/13 $ 703,311JPMorgan Chase Money Market Fund NA 15,557,338Wells Fargo Money Market Fund NA 39,238Local Government Investment Pool NA 49,920,750
Total $ 66,220,637
Interest Rate Risk - State statutes limit investments in U.S. Agency securities to an originalmaturity of five years unless the governing board authorizes the investment for a period in excessof five years.
Credit Risk - State statutes limit investments in U.S. Agency securities to the highest rating issuedby nationally recognized statistical rating organizations (“NRSROs”). At June 30, 2006, theDistrict’s investment in the Federal National Mortgage Association was rated AAA by Standard& Poor’s and Fitch Ratings.
State statutes limit investments in money market funds to those with the highest rating issued byNRSROs and with a constant share price, or to money market funds that invest only in specifiedsecurities. As of June 30, 2006, the District’s investment in the Wells Fargo money market fundwas rated AAA by Moody’s Investor Services and AAAm by Standard & Poor’s. The JPMorganChase money market fund was rated AAAm by Standard & Poor’s and Aaa by Moody’s InvestorServices.
Concentration of Credit Risk - State statutes do not limit the amount the District may invest in oneissuer.

BOULDER VALLEY SCHOOL DISTRICT RE-2
NOTES TO FINANCIAL STATEMENTSJune 30, 2006
18
NOTE 2: CASH AND INVESTMENTS (Continued)
Investments (Continued)
Local Government Investment Pool - At June 30, 2006, the District had invested in the ColoradoLocal Government Liquid Asset Trust (Colotrust), an investment vehicle established for localgovernment entities in Colorado to pool surplus funds. The State Securities Commissioneradministers and enforces the requirements of creating and operating Colotrust. Colotrust operatessimilarly to a money market fund with each share equal in value to $1.00. Colotrust is ratedAAAm by Standard and Poor’s. Investments of Colotrust are limited to those allowed by Statestatutes. A designated custodial bank provides safekeeping and depository services in connectionwith the direct investment and withdrawal functions. Substantially all securities owned are heldby the Federal Reserve Bank in the account maintained for the custodial bank. The custodian'sinternal records identify the investments owned by the participating governments.
Restricted Cash and Investments
Cash and investments of $741,194, representing required reserves for the Certificates ofParticipation, have been restricted in the General Fund. In addition, $75,070 has been restrictedin the General Fund for employee flexible spending benefits.
NOTE 3: INTERFUND BALANCES AND TRANSFERS
Due from Other Funds Due to Other Funds Balance
General Fund Grants Fund $ 1,112,883
The General Fund has temporarily covered the negative cash balance of the Grants Fund.
Transfers In Transfers Out Balance
Capital Reserve Fund General Fund $ 7,149,754Transportation Fund General Fund 4,021,256General Fund Insurance Reserve Fund 473,133
Total $ 11,644,143
The General Fund is required by State statute to allocate a portion of its funding to the CapitalReserve Fund to be used for capital purposes. During the year June 30, 2006, the Districtestablished the Transportation Fund with a transfer from the General Fund. In addition, theInsurance Reserve Internal Service Fund was closed and the residual balances were transferred tothe General Fund.

BOULDER VALLEY SCHOOL DISTRICT RE-2
NOTES TO FINANCIAL STATEMENTSJune 30, 2006
19
NOTE 4: CAPITAL ASSETS
Capital asset activity for the year ended June 30, 2006, is summarized below.
Balances Balances 6/30/05 Additions Deletions 6/30/06
Governmental ActivitiesCapital Assets, Not Being Depreciated
Land $ 2,802,833 $ - $ - $ 2,802,833Construction in Progress 105,762 - (105,762) -
Total Capital Assets, Not Being Depreciated 2,908,595 - (105,762) 2,802,833
Capital Assets, Being DepreciatedLand Improvements 6,313,816 - - 6,313,816Buildings 262,921,017 20,876 - 262,941,893Equipment 3,005,795 136,374 (19,302) 3,122,867Vehicles 13,972,374 2,388,158 (737,023) 15,623,509
Total Capital Assets, Being Depreciated 286,213,002 2,545,408 (756,325) 288,002,085
Less Accumulated Depreciation ForLand Improvements 557,571 321,395 - 878,966Buildings 80,508,932 6,440,219 - 86,949,151Equipment 2,135,728 225,851 (12,982) 2,348,597Vehicles 9,925,147 997,556 (712,678) 10,210,025
Total Accumulated Depreciation 93,127,378 7,985,021 (725,660) 100,386,739
Total Capital Assets, Being Depreciated, Net 193,085,624 (5,439,613) (30,665) 187,615,346
Governmental Activities Capital Assets, Net $ 195,994,219 $ (5,439,613) $ (136,427) $ 190,418,179
Business-Type ActivitiesCapital Assets, Being Depreciated Equipment $ 1,073,362 $ 31,853 $ - $ 1,105,215Less Accumulated Depreciation For
Equipment 823,599 40,157 - 863,756
Business-Type Activities Capital Assets, Net $ 249,763 $ (8,304) $ - $ 241,459
Charter Schools Capital Assets, Not Being Depreciated
Land $ 1,103,000 $ - $ - $ 1,103,000 Capital Assets, Being Depreciated
Land Improvements 745,712 - - 745,712Buildings 13,974,460 35,058 - 14,009,518Equipment 24,761 - - 24,761
Total Capital Assets, Being Depreciated 14,744,933 35,058 - 14,779,991
Less Accumulated Depreciation ForLand Improvements 223,713 74,571 - 298,284Buildings 1,243,287 471,139 - 1,714,426Equipment 9,904 4,952 - 14,856
Total Accumulated Depreciation 1,476,904 550,662 - 2,027,566
Total Capital Assets, Being Depreciated, Net 13,268,029 (515,604) - 12,752,425
Charter Schools Capital Assets, Net $ 14,371,029 $ (515,604) $ - $ 13,855,425

BOULDER VALLEY SCHOOL DISTRICT RE-2
NOTES TO FINANCIAL STATEMENTSJune 30, 2006
20
NOTE 4: CAPITAL ASSETS (Continued)
Depreciation expense was charged to programs of the District as follows.
Governmental ActivitiesInstruction $ 6,816,006Supporting Services 1,169,015
Total $ 7,985,021
Business-Type ActivitiesFood Services $ 40,157
NOTE 5: ACCRUED SALARIES AND BENEFITS
Salaries and benefits of certain contractually employed personnel are paid over a twelve monthperiod from September to August, but are earned during a school year of approximately nine to tenmonths. The salaries and benefits earned, but unpaid, as of June 30, 2006, were $19,416,255 and$579,229 for the District and charter schools, respectively. This accrued compensation is reflectedas a liability in the accompanying financial statements.
NOTE 6: SHORT-TERM DEBT
During the year ended June 30, 2006, the District borrowed $58,725,788 from the State-sponsoredinterest-free loan program to provide cash flow throughout the fiscal year. The loan was paid infull by June 30, 2006, from property taxes received primarily from February through June.
NOTE 7: LONG-TERM DEBT
Following is a summary of long-term debt transactions of the District for the year ended June 30,2006.
Balances Balances Due Within 6/30/05 Additions Payments 6/30/06 One Year
Governmental ActivitiesGeneral Obligation Bonds $ 140,310,000 $ - $ 7,060,000 $ 133,250,000 $ 7,375,000Bond Premium 86,577 - 24,787 61,790 - Certificates of Participation 6,300,000 - 495,000 5,805,000 505,000Loss on Refunding (153,102) - (15,310) (137,792) - Compensated Absences 1,279,731 501,885 - 1,781,616 -
Total $ 147,823,206 $ 501,885 $ 7,564,477 $ 140,760,614 $ 7,880,000
The liability for compensated absences is expected to be liquidated with resources of the GeneralFund.

BOULDER VALLEY SCHOOL DISTRICT RE-2
NOTES TO FINANCIAL STATEMENTSJune 30, 2006
21
NOTE 7: LONG-TERM DEBT (Continued)
General Obligation Bonds
General obligation bonds payable at June 30, 2006, are comprised of the following issues.
$24,230,000 General Obligation Bonds, Series 2001.Issued to refund certain general obligation bonds.Principal payments due on December 1 andinterest payments due on December 1 and June 1,through 2008. Interest accrues at rates ranging from3% to 3.75%. $ 11,345,000
$63,655,000 General Obligation Bonds, Series 1999.Issued to implement a District-wide capital improvementprogram. Principal payments due on December 1 andinterest payments due on December 1 and June 1,through 2018. Interest accrues at rates ranging from4% to 5.125%. 58,735,000
$68,810,000 General Obligation Bonds, Series 1997.Issued to refund certain general obligation bonds.Principal payments due on December 1 andinterest payments due on December 1 and June 1,through 2014. Interest accrues at rates ranging from 3.75% to 5.00%. 63,170,000
Total $ 133,250,000
Bond payments, to maturity, are as follows:
Year Ended June 30, Principal Interest Total
2007 $ 7,375,000 $ 6,227,721 $ 13,602,7212008 7,715,000 5,902,340 13,617,3402009 8,080,000 5,561,010 13,641,0102010 8,770,000 5,183,293 13,953,2932011 9,190,000 4,757,731 13,947,7312012 - 2016 53,300,000 16,378,030 69,678,0302017 - 2018 38,820,000 2,921,597 41,741,597
Total $ 133,250,000 $ 46,931,722 $ 180,181,722

BOULDER VALLEY SCHOOL DISTRICT RE-2
NOTES TO FINANCIAL STATEMENTSJune 30, 2006
22
NOTE 7: LONG-TERM DEBT (Continued)
Certificates of Participation
On November 1, 2003, the District issued $7,275,000 Certificates of Participation, Series 2003.Principal payments are due annually on June 1 and interest payments are due on June 1 andDecember 1, through 2016. Interest accrues at rates ranging from 2.5% to 4%. Proceeds of theCertificates were used to currently refund the District’s outstanding Certificates of Participationand to finance the installation of artificial turf on the athletic fields at various District facilities. Future debt service requirements of the Certificates of Participation are as follows.
Year Ended June 30, Principal Interest Total
2007 $ 505,000 $ 193,633 $ 698,633 2008 515,000 181,007 696,0072009 530,000 168,133 698,1332010 545,000 153,557 698,557 2011 565,000 137,207 702,207 2012 - 2016 3,145,000 372,938 3,517,938
Total $ 5,805,000 $ 1,206,475 $ 7,011,475
Component Units
The Peak to Peak Charter School has entered into a capital lease agreement with Prairie View, Inc.,a component unit, to construct facilities. The Colorado Educational and Cultural FacilitiesAuthority (“CECFA”) has issued Charter School Revenue and Refunding Bonds on behalf ofPrairie View, Inc. The School makes monthly payments to Prairie View, Inc., and Prairie View,Inc., makes similar payments to CECFA. Changes in long-term debt of the Peak to Peak CharterSchool for the year ended June 30, 2006, and bond payments to maturity, are as follows:
Balances Balances Due Within 6/30/05 Additions Payments 6/30/06 One Year
2004 Capital Lease $ 23,300,000 $ - $ 390,000 $ 22,910,000 $ 400,000Premium 511,513 - 17,741 493,772 - Loss on Refunding (5,309,136) - (184,131) (5,125,005) -
Total $ 18,502,377 $ - $ (223,610) $ 18,278,767 $ 400,000

BOULDER VALLEY SCHOOL DISTRICT RE-2
NOTES TO FINANCIAL STATEMENTSJune 30, 2006
23
NOTE 7: LONG-TERM DEBT (Continued)
Component Units (Continued)
Year Ended June 30, Principal Interest Total
2007 $ 400,000 $ 1,130,743 $ 1,530,7432008 415,000 1,118,517 1,533,5172009 425,000 1,105,918 1,530,9182010 440,000 1,092,942 1,532,9422011 455,000 1,077,015 1,532,0152012 - 2016 2,555,000 5,081,971 7,636,9712017 - 2021 3,235,000 4,375,744 7,610,7442022 - 2026 4,175,000 3,408,432 7,583,4322027 - 2031 5,385,000 2,159,718 7,544,7182032 - 2035 5,425,000 587,605 6,012,605
Total $ 22,910,000 $ 21,138,605 $ 44,048,605
NOTE 8: RISK MANAGEMENT
The District is exposed to various risks of loss related to torts; theft of, damage to, and destructionof assets; injuries to employees; and natural disasters. The District plans to provide for or restorethe economic damages of those losses through risk retention and risk transfer.
Joint School District Workers’ Compensation Self-Insurance Pool
The District, along with Aurora, Cherry Creek, and Littleton School Districts, combined to formthe Joint School District Pool for Workers’ Compensation (the JSD Pool) which is a public entityrisk pool currently operating as a common risk management and insurance program for the schooldistrict members noted above. The JSD Pool is administered by a Board of Directors consistingof one individual from each of the four school districts, generally the District’s chief financialofficer.
The Board exercises control over the Pool and has contracted the management of the Pooloperations to third parties. The participating districts make annual contributions to the JSD Poolbased on the size of their respective payrolls. The contributions are retroactively adjusted basedon the districts’ actual loss experience.
Each member of the JSD Pool is responsible for the first $100,000 of each loss. Losses between$100,000 and $300,000 are pooled between the member districts, and losses in excess of $300,000are reinsured for up to $5,000,000 per occurrence.
There is no current or long-term debt associated with the JSD Pool. The contributions aredetermined on an actuarial basis and are sufficient to provide for the estimated claims and lossesas determined by the actuarial computation. No settlements exceeded insurance coverage for eachof the past three fiscal years.

BOULDER VALLEY SCHOOL DISTRICT RE-2
NOTES TO FINANCIAL STATEMENTSJune 30, 2006
24
NOTE 8: RISK MANAGEMENT (Continued)
Colorado School Districts Self-Insurance Pool
The Colorado School Districts Self-Insurance Pool (CSDSIP), sponsored by the ColoradoAssociation of School Boards, operates as a self-insurance pool comprised of various schooldistricts and other related public educational entities within the State of Colorado. The CSDSIPis administered by the Pool Board which is comprised of eight members. The eight membersinclude the president, vice president, and executive director of the Colorado Association of SchoolBoards (CASB), with the remaining five members being appointed by the Board of Directors ofCASB. The District pays an annual premium to the CSDSIP for various types of property andliability insurance coverage. The Pool Agreement provides that the CSDSIP will be self-sustainingthrough member premiums and will reinsure through a duly authorized insurer. The reinsurancecovers claims against the CSDSIP in excess of specific claim amounts and in the aggregate in anamount and at limits determined by the CSDSIP to be adequate to protect the solvency of theCSDSIP.
Dental Self-Insurance
Under the District’s employee dental insurance plan, the District provides coverage for itsemployees. Claims liabilities are reported in the Dental Insurance Internal Service Fund ifinformation available prior to the issuance of the financial statements indicates that it is probablethat the liability has been incurred at the date of the financial statements and the amount of loss canbe reasonably estimated. At June 30, 2006, the District established the Dental Insurance InternalService Fund with a transfer from the General Fund. Changes in claims payable for the employeedental insurance plan were as follows:
Claims Payable, June 30, 2005 $ - Claims Incurred and Adjustments 1,824,787 Payments (1,590,106)
Claims Payable, June 30, 2006 $ 234,681
NOTE 9: DEFINED BENEFIT PENSION PLAN
Plan Description - The District contributes to the Combined State and School Division Trust Fund(CSSDTF), a cost-sharing multiple-employer defined benefit pension plan administered by thePublic Employees’ Retirement Association of Colorado (PERA). CSSDTF provides retirementand disability, annual increases, and death benefits for members or their beneficiaries. Allemployees of the District are members of the CSSDTF. Title 24, Article 51 of the ColoradoRevised Statutes (CRS), as amended, assigns the authority to establish benefit provisions to theState Legislature.
PERA issues a publicly available annual financial report that includes financial statements andrequired supplementary information for CSSDTF. That report may be obtained by writing toPERA of Colorado, 1300 Logan Street, Denver, Colorado 80203 or by calling PERA at 303-832-9550 or 1-800-759-PERA (7372).

BOULDER VALLEY SCHOOL DISTRICT RE-2
NOTES TO FINANCIAL STATEMENTSJune 30, 2006
25
NOTE 9: DEFINED BENEFIT PENSION PLAN (Continued)
Funding Policy - Plan members and the District are required to contribute at a rate set by statute.The contribution requirements of plan members and the District are established under Title 24,Article 51, Part 4 of the CRS, as amended. The contribution rate for members was 8% of coveredsalaries and for the District was 10.15% from July 1, 2005, to December 31, 2005, and 10.65%thereafter. A portion of the District's contribution (1.02% of covered salary) is allocated to theHealth Care Trust Fund (See Note 10). The District's contributions to CSSDTF for the years endedJune 30, 2006, 2005, and 2004 were $16,222,359, $14,652,484, and $13,182,312, respectively,equal to the required contributions for each year.
NOTE 10: POSTEMPLOYMENT HEALTHCARE BENEFITS
Plan Description - The District contributes to the Health Care Trust Fund (HCTF), a cost-sharingmultiple-employer postemployment healthcare plan administered by the PERA. The HCTFprovides a health care premium subsidy to PERA participating benefit recipients and their eligiblebeneficiaries. Title 24, Article 51, Part 12 of the CRS, as amended, assigns the authority toestablish the HCF benefit provisions to the State Legislature. PERA issues a publicly availableannual financial report that includes financial statements and required supplementary informationfor the HCF. That report may be obtained by writing to PERA of Colorado, 1300 Logan Street,Denver, Colorado 80203 or by calling PERA at 303-832-9550 or 1-800-759-PERA (7372).
Funding Policy - The District was required to contribute at a rate of 1.02% of covered salary forall PERA members as set by statute. No member contributions are required. The contributionrequirements for the District are established under Title 24, Article 51, Part 4 of the CRS, asamended. The apportionment of the contributions of the HCTF is established under Title 24,Article 51, Section 208 of the Colorado Revised Statutes, as amended. The District's contributionsto the HCTF for the years ended June 30, 2006, 2005, and 2004 were $1,537,198, $1,472,466, and$1,571,751, respectively, equal to the required contributions for each year.
NOTE 11: COMMITMENTS AND CONTINGENCIES
Claims and Judgments
The District participates in a number of federal and state programs that are fully or partially fundedby grants received from other governmental units. Expenditures financed by grants are subject toaudit by the appropriate grantor government. If expenditures are disallowed due to noncompliancewith grant program regulations, the District may be required to reimburse the grantor government.At June 30, 2006, significant amounts of grant expenditures have not been audited by the grantoragency, but the District believes that disallowed expenditures, if any, based on subsequent auditswill not have a material effect on the overall financial position of the District.

BOULDER VALLEY SCHOOL DISTRICT RE-2
NOTES TO FINANCIAL STATEMENTSJune 30, 2006
26
NOTE 11: COMMITMENTS AND CONTINGENCIES (Continued)
Litigation
Several claims are presently pending against the District, but District management believes thefinal settlements of these matters will not have a materially adverse effect on the financial positionof the District.
Tabor Amendment
In November 1992, Colorado voters passed Article X, Section 20 (the “Amendment”) to the StateConstitution which limits state and local government tax powers and imposes spending limitations.The District is subject to the Amendment.
Fiscal year 1993 provides the basis for limits in future years to which may be applied allowableincreases for inflation and student enrollment. In November, 1999, voters within the Districtauthorized the District to collect, retain, and expend all excess revenues and other funds receivedfrom every source, without limitation, in the 1999-2000 budget year and each subsequent budgetyear thereafter without future voter approval, notwithstanding the limitations of the Amendment.
The Amendment is subject to many interpretations, but the District believes it is in substantialcompliance with the Amendment.
The Amendment requires the District to establish a reserve for emergencies. At June 30, 2006, netassets in the amount of $6,408,531 were restricted to satisfy the reserve requirement.

REQUIRED SUPPLEMENTARY INFORMATION

BOULDER VALLEY SCHOOL DISTRICT RE-2
BUDGETARY COMPARISON SCHEDULEGENERAL FUND
Year Ended June 30, 2006
VARIANCEORIGINAL FINAL PositiveBUDGET BUDGET ACTUAL (Negative)
REVENUES Taxes $ 147,808,505 $ 147,839,893 $ 148,555,112 $ 715,219 Tuition 1,208,683 1,265,917 697,547 (568,370) Investment Earnings 200,000 200,000 755,265 555,265 Other Local Revenue 5,052,822 5,257,405 9,734,422 4,477,017 State Equalization 51,300,942 51,331,658 51,919,871 588,213 State Reimbursement Programs 2,813,573 2,998,040 2,776,201 (221,839) Special Education 3,777,418 3,727,357 4,624,160 896,803 English Language Proficiency Act 85,000 85,000 88,847 3,847
TOTAL REVENUES 212,246,943 212,705,270 219,151,425 6,446,155
EXPENDITURES Current Instruction - Regular Programs 92,245,390 103,042,410 103,703,215 (660,805) Instruction - Special Programs 37,545,636 38,317,634 36,201,015 2,116,619 Student Support Services 4,959,648 7,469,447 5,280,696 2,188,751 Instructional Staff Services 7,130,634 7,555,602 7,161,980 393,622 General Administration 2,602,276 2,753,413 2,828,488 (75,075) School Administration 14,547,844 14,969,212 14,377,908 591,304 Business Services 2,139,029 2,199,977 2,016,893 183,084 Operations and Maintenance 15,699,847 16,003,922 16,731,373 (727,451) Student Transportation 7,091,321 - - - Central Support Services 5,214,896 5,720,773 7,528,469 (1,807,696) Community Services 3,803,354 4,295,129 4,134,883 160,246 Adult Education 347,789 - - - Emergency Reserves 5,825,620 5,750,909 - 5,750,909 Reserves 9,627,899 7,118,805 - 7,118,805 Debt Service Principal 1,580,665 946,915 495,000 451,915 Interest - - 209,507 (209,507)
TOTAL EXPENDITURES 210,361,848 216,144,148 200,669,427 15,474,721
EXCESS OF REVENUES OVER (UNDER) EXPENDITURES 1,885,095 (3,438,878) 18,481,998 21,920,876
OTHER FINANCING SOURCES (USES) Transfers In - - 473,133 473,133 Transfers Out - (14,414,582) (14,414,582) -
TOTAL OTHER FINANCING SOURCES (USES) - (14,414,582) (13,941,449) 473,133
NET CHANGE IN FUND BALANCE 1,885,095 (17,853,460) 4,540,549 22,394,009
FUND BALANCE, Beginning 15,953,373 18,268,260 19,008,690 740,430
FUND BALANCE, Ending $ 17,838,468 $ 414,800 $ 23,549,239 $ 23,134,439
See the accompanying Independent Auditors' Report.
27

28
BOULDER VALLEY SCHOOL DISTRICT RE-2
NOTES TO REQUIRED SUPPLEMENTARY INFORMATIONJune 30, 2006
NOTE 1: STEWARDSHIP, COMPLIANCE AND ACCOUNTABILITY
Budgets
The District follows the following procedures in establishing the budgetary data reflected in thefinancial statements:
• In March, the Superintendent submits to the Board of Education a preliminary proposedbudget for the period commencing the following July 1. The budget includes proposedexpenditures and the means of financing them.
• Public hearings are conducted at regular Board of Education meetings to obtain taxpayercomments.
• In June, the budget is legally adopted by the Board of Education.
• In October, a revised budget is legally adopted by the Board of Education.
Colorado Budget Law requires that all funds have legally adopted budgets and appropriations.Total expenditures for each fund may not exceed the amount appropriated. Appropriations for afund may be increased provided they are offset by unanticipated revenue. All appropriations lapseat the end of each fiscal year. Authorization to transfer budget amounts between programs and/ordepartments within any fund and the reallocation of budget line items within any program and/ordepartment rests with the Superintendent. Revisions and/or supplemental appropriations that alterthe total expenditures of any fund must be approved by the Board of Education.
The budget is used as a management control device for all funds. For the year ended June 30,2006, no budget was adopted for the Dental Insurance Fund because the fund had no expenditures.Budgets for all funds were adopted on a basis consistent with generally accepted accountingprinciples (“GAAP”) except that payments from the General Fund to the Insurance Reserve andDental Insurance Funds were treated as transfers for budgetary purposes and as revenues andexpenditures for GAAP purposes. Budget to GAAP differences for these funds are as follows:
Insurance Reserve Fund
RevenuesRevenues, GAAP Basis $ 3,250,850 Premiums and Services (3,243,572)
Revenues, Budgetary Basis $ 7,278
General Fund ExpendituresExpenditures, GAAP Basis $ 203,912,999 Transfers to Insurance Reserve Fund (3,243,572)
Expenditures, Budgetary Basis $ 200,669,427

29
BOULDER VALLEY SCHOOL DISTRICT RE-2
NOTES TO REQUIRED SUPPLEMENTARY INFORMATIONJune 30, 2006
NOTE 1: STEWARDSHIP, COMPLIANCE AND ACCOUNTABILITY (Continued)
Budgets (Continued)Insurance
General Fund Reserve Fund TransfersTransfers, GAAP Basis $ (10,697,877) $ - Premiums and Services (3,243,572) 3,243,572
Transfers, Budgetary Basis $ (13,941,449) $ 3,243,572

COMBINING AND INDIVIDUAL FUND STATEMENTS AND SCHEDULES

GENERAL FUND

BOULDER VALLEY SCHOOL DISTRICT RE-2
COMBINING BALANCE SHEETGENERAL FUND
June 30, 2006
RISKGENERAL MANAGEMENT TECHNOLOGY ATHLETICS
FUND FUND FUND FUNDASSETS Cash and Investments $ 40,231,092 $ 502,526 $ 221,497 $ 174,729 Restricted Cash and Investments 816,264 - - - Accounts Receivable 463,595 - - - Taxes Receivable 5,781,935 - - - Due from Other Funds 1,112,883 - - - Inventories 389,834 - - - Prepaid Items and Deposits 9,544 - - -
TOTAL ASSETS $ 48,805,147 $ 502,526 $ 221,497 $ 174,729
LIABILITIES AND FUND BALANCESLIABILITIES Accounts Payable $ 3,722,808 $ - $ - $ - Accrued Liabilities 3,709,277 29,393 5,499 - Accrued Salaries and Benefits 18,427,960 - - - Deferred Revenues 54,987 - - - Deferred Property Taxes 1,810,498 - - -
TOTAL LIABILITIES 27,725,530 29,393 5,499 -
FUND BALANCES Reserved for Inventories 389,834 - - - Reserved for Prepaid Items 9,544 - - - Reserved for Multiple Year Obligations 200,000 - - - Reserved for Colorado Preschool Program - - - - Reserved for Emergencies 5,472,760 - 72,816 75,905 Unreserved 15,007,479 473,133 143,182 98,824
TOTAL FUND BALANCES 21,079,617 473,133 215,998 174,729
TOTAL LIABILITIES AND FUND BALANCES $ 48,805,147 $ 502,526 $ 221,497 $ 174,729
See the accompanying Independent Auditors' Report.
30

COMMUNITY TUITION COLORADO CHARTER TOTALSCHOOLS PRESCHOOL PRESCHOOL SCHOOLS GENERAL
FUND FUND FUND UNALLOCATED FUND
$ 852,301 $ 68,723 $ 66,128 $ 740,429 $ 42,857,425- - - - 816,264- - - - 463,595- - - - 5,781,935- - - - 1,112,883- - - - 389,834
6,053 - - - 15,597
$ 858,354 $ 68,723 $ 66,128 $ 740,429 $ 51,437,533
$ - $ - $ - $ - $ 3,722,80815,687 1,910 2,936 - 3,764,702
- - - - 18,427,96083,074 21,185 3,080 - 162,326
- - - - 1,810,498
98,761 23,095 6,016 - 27,888,294
- - - - 389,8346,053 - - - 15,597
- - - - 200,000- - 60,112 - 60,112
115,780 13,648 - - 5,750,909637,760 31,980 - 740,429 17,132,787
759,593 45,628 60,112 740,429 23,549,239
$ 858,354 $ 68,723 $ 66,128 $ 740,429 $ 51,437,533

BOULDER VALLEY SCHOOL DISTRICT RE-2
COMBINING STATEMENT OF REVENUES, EXPENDITURESAND CHANGES IN FUND BALANCES
GENERAL FUNDYear Ended June 30, 2006
RISKGENERAL MANAGEMENT TECHNOLOGY ATHLETICS
FUND FUND FUND FUNDREVENUES Local Sources $ 153,855,478 $ - $ - $ 858,154 State Sources 59,409,079 - - -
TOTAL REVENUES 213,264,557 - - 858,154
EXPENDITURESCurrent Instruction - Regular Programs 103,586,556 - - - Instruction - Special Programs 33,120,882 - - 2,424,762 Student Support Services 5,164,787 - 115,909 - Instructional Staff Services 7,161,980 - - - General Administration 2,774,532 - - 53,956 School Administration 14,377,908 - - - Business Services 2,016,893 - - - Operations and Maintenance 16,731,373 - - - Central Support Services 8,603,948 - 2,168,093 - Community Services 126,291 - - - Debt Service Principal 495,000 - - - Interest and Fiscal Charges 209,507 - - -
TOTAL EXPENDITURES 194,369,657 - 2,284,002 2,478,718
EXCESS OF REVENUES OVER (UNDER) EXPENDITURES 18,894,900 - (2,284,002) (1,620,564)
OTHER FINANCING SOURCES (USES) Transfers In 633,750 473,133 2,500,000 1,625,968 Transfers Out (16,001,040) - - -
TOTAL OTHER FINANCING SOURCES (USES) (15,367,290) 473,133 2,500,000 1,625,968
NET CHANGE IN FUND BALANCES 3,527,610 473,133 215,998 5,404 FUND BALANCE, Beginning 17,552,007 - - 169,325
FUND BALANCES, Ending $ 21,079,617 $ 473,133 $ 215,998 $ 174,729
See the accompanying Independent Auditors' Report.
31

COMMUNITY TUITION COLORADO CHARTER TOTALSCHOOLS PRESCHOOL PRESCHOOL SCHOOLS GENERAL
FUND FUND FUND UNALLOCATED FUND
$ 4,558,520 $ 470,194 $ - $ - $ 159,742,346- - - - 59,409,079
4,558,520 470,194 - - 219,151,425
- 116,659 - - 103,703,215- - 655,371 - 36,201,015- - - - 5,280,696- - - - 7,161,980- - - - 2,828,488- - - - 14,377,908- - - - 2,016,893- - - - 16,731,373- - - - 10,772,041
3,696,727 311,865 - - 4,134,883
- - - - 495,000- - - - 209,507
3,696,727 428,524 655,371 - 203,912,999
861,793 41,670 (655,371) - 15,238,426
- - 704,062 - 5,936,913(633,750) - - - (16,634,790)
(633,750) - 704,062 - (10,697,877)
228,043 41,670 48,691 - 4,540,549
531,550 3,958 11,421 740,429 19,008,690
$ 759,593 $ 45,628 $ 60,112 $ 740,429 $ 23,549,239

NONMAJOR FUNDS
Special Revenue Funds
Governmental Designated-Purpose Grants Fund
This fund is provided to account for monies received from various federal, state and local grant programs.
Transportation Fund
This fund accounts for a mill levy dedicated by election to the District’s transportation needs.
Capital Projects Fund
Capital Reserve Fund
This fund is authorized by Colorado School Law and is used to fund ongoing capital needs such as site acquisition,building additions, and equipment purchases.

BOULDER VALLEY SCHOOL DISTRICT RE-2
COMBINING BALANCE SHEETNONMAJOR GOVERNMENTAL FUNDS
June 30, 2006
CAPITALSPECIAL REVENUE PROJECTS
CAPITALGRANTS TRANSPORTATION RESERVE
FUND FUND FUND TOTALASSETS Cash and Investments $ - $ 680,933 $ 2,555,627 $ 3,236,560 Accounts Receivable - - 20,000 20,000 Taxes Receivable - 151,292 - 151,292 Grants Receivable 2,384,704 - - 2,384,704 Prepaid Items 180 - - 180
TOTAL ASSETS $ 2,384,884 $ 832,225 $ 2,575,627 $ 5,792,736
LIABILITIES AND FUND BALANCESLIABILITIES Accounts Payable $ 9,393 $ - $ - $ 9,393 Accrued Liabilities 56,753 399,590 143 456,486 Accrued Salaries and Benefits 988,295 - - 988,295 Due to Other Funds 1,112,883 - - 1,112,883 Deferred Revenues 217,560 52,866 - 270,426
TOTAL LIABILITIES 2,384,884 452,456 143 2,837,483
FUND BALANCES Reserved for Emergencies - 236,531 264,723 501,254 Unreserved, Reported in Special Revenue Fund - 143,238 - 143,238 Unreserved, Reported in Capital Projects Fund - - 2,310,761 2,310,761
TOTAL FUND BALANCES - 379,769 2,575,484 2,955,253
TOTAL LIABILITIES AND FUND BALANCES $ 2,384,884 $ 832,225 $ 2,575,627 $ 5,792,736
See the accompanying Independent Auditors' Report.
32

BOULDER VALLEY SCHOOL DISTRICT RE-2
COMBINING STATEMENT OF REVENUES, EXPENDITURESAND CHANGES IN FUND BALANCES
NONMAJOR GOVERNMENTAL FUNDSYear Ended June 30, 2006
CAPITALSPECIAL REVENUE PROJECTS
CAPITALGRANTS TRANSPORTATION RESERVE
FUND FUND FUND TOTALREVENUES Local Sources $ 379,077 $ 4,572,361 $ 812,720 $ 5,764,158 State Sources 699,254 - - 699,254 Federal Sources 10,875,250 - - 10,875,250
TOTAL REVENUES 11,953,581 4,572,361 812,720 17,338,662
EXPENDITURESCurrent Instruction - Regular Programs 2,834,103 - - 2,834,103 Instruction - Special Programs 5,658,841 615,730 - 6,274,571 Student Support Services 456,833 - - 456,833 Instructional Staff Services 2,038,029 - - 2,038,029 General Administration 3,574 - - 3,574 School Administration 590,410 - - 590,410 Operations and Maintenance - 158,898 - 158,898 Student Transportation - 7,439,220 - 7,439,220 Central Support Services 41,171 - - 41,171 Community Services 238,357 - - 238,357 Adult Education 92,263 - - 92,263Capital Outlay - - 7,171,042 7,171,042
TOTAL EXPENDITURES 11,953,581 8,213,848 7,171,042 27,338,471
EXCESS OF REVENUES OVER (UNDER) EXPENDITURES - (3,641,487) (6,358,322) (9,999,809)
OTHER FINANCING SOURCES Transfers In - 4,021,256 7,149,754 11,171,010
NET CHANGE IN FUND BALANCES - 379,769 791,432 1,171,201 FUND BALANCES, Beginning - - 1,784,052 1,784,052
FUND BALANCES, Ending $ - $ 379,769 $ 2,575,484 $ 2,955,253
See the accompanying Independent Auditors' Report.
33

BOULDER VALLEY SCHOOL DISTRICT RE-2
BUDGETARY COMPARISON SCHEDULEGRANTS FUND
Year Ended June 30, 2006
ORIGINAL VARIANCEAND FINAL Positive
BUDGET ACTUAL (Negative)REVENUES Local Sources $ - $ 379,077 $ 379,077 State Sources - 699,254 699,254 Federal Sources 19,500,000 10,875,250 (8,624,750)
TOTAL REVENUES 19,500,000 11,953,581 (7,546,419)
EXPENDITURES Current Instruction - Regular Programs 19,500,000 2,834,103 16,665,897 Instruction - Special Programs - 5,658,841 (5,658,841) Student Support Services - 456,833 (456,833) Instructional Staff Services - 2,038,029 (2,038,029) General Administration - 3,574 (3,574) School Administration - 590,410 (590,410) Central Support Services - 41,171 (41,171) Community Services - 238,357 (238,357) Adult Education - 92,263 (92,263)
TOTAL EXPENDITURES 19,500,000 11,953,581 7,546,419
NET CHANGE IN FUND BALANCE - - -
FUND BALANCE, Beginning - - -
FUND BALANCE, Ending $ - $ - $ -
See the accompanying Independent Auditors' Report.
34

BOULDER VALLEY SCHOOL DISTRICT RE-2
BUDGETARY COMPARISON SCHEDULETRANSPORTATION FUND
Year Ended June 30, 2006
VARIANCEORIGINAL FINAL PositiveBUDGET BUDGET ACTUAL (Negative)
REVENUES Property Taxes $ - $ 4,336,170 $ 4,327,311 $ (8,859) Other Local Revenue - - 245,050 245,050
TOTAL REVENUES - 4,336,170 4,572,361 236,191
EXPENDITURES Instruction - Special Programs - 369,608 615,730 (246,122) Operations and Maintenance - 180,013 158,898 21,115 Student Transportation - 7,334,743 7,439,220 (104,477) Emergency Reserves - 236,531 - 236,531 Reserves - 236,531 - 236,531
TOTAL EXPENDITURES - 8,357,426 8,213,848 143,578
EXCESS OF REVENUES OVER (UNDER) EXPENDITURES - (4,021,256) (3,641,487) 92,613
OTHER FINANCING SOURCES Transfers In - 4,021,256 4,021,256 -
NET CHANGE IN FUND BALANCES - - 379,769 379,769
FUND BALANCE, Beginning - - - -
FUND BALANCE, Ending $ - $ - $ 379,769 $ 379,769
See the accompanying Independent Auditors' Report.
35

BOULDER VALLEY SCHOOL DISTRICT RE-2
BUDGETARY COMPARISON SCHEDULECAPITAL RESERVE FUND
Year Ended June 30, 2006
VARIANCEORIGINAL FINAL PositiveBUDGET BUDGET ACTUAL (Negative)
REVENUES Local Sources $ 135,000 $ 155,000 $ 812,720 $ 657,720
EXPENDITURES Capital Outlay Salaries and Benefits 642,200 722,200 757,404 (35,204) Building Improvements 660,000 1,605,000 1,230,496 374,504 Instructional Technology 550,000 1,050,000 532,888 517,112 Operating Departments 1,449,800 2,964,800 2,217,876 746,924 School Projects 1,821,467 2,482,083 2,432,378 49,705 Emergency Reserves 153,704 264,723 - 264,723
TOTAL EXPENDITURES 5,277,171 9,088,806 7,171,042 1,917,764
EXCESS OF REVENUES OVER (UNDER) EXPENDITURES (5,142,171) (8,933,806) (6,358,322) 2,575,484
OTHER FINANCING SOURCES Transfers In 3,789,296 7,149,754 7,149,754 -
NET CHANGE IN FUND BALANCE (1,352,875) (1,784,052) 791,432 2,575,484
FUND BALANCE, Beginning 1,352,875 1,784,052 1,784,052 -
FUND BALANCE, Ending $ - $ - $ 2,575,484 $ 2,575,484
See the accompanying Independent Auditors' Report.
36

BOULDER VALLEY SCHOOL DISTRICT RE-2
BUDGETARY COMPARISON SCHEDULEBOND REDEMPTION FUND
Year Ended June 30, 2006
VARIANCEORIGINAL FINAL PositiveBUDGET BUDGET ACTUAL (Negative)
REVENUES Property Taxes $ 13,466,625 $ 13,515,376 $ 13,489,385 $ (25,991) Investment Earnings 125,000 200,000 437,675 237,675
TOTAL REVENUES 13,591,625 13,715,376 13,927,060 211,684
EXPENDITURES Debt Service Principal 7,060,000 7,060,000 7,060,000 - Interest and Fiscal Charges 6,549,990 6,549,990 6,531,990 18,000
TOTAL EXPENDITURES 13,609,990 13,609,990 13,591,990 18,000
NET CHANGE IN FUND BALANCE (18,365) 105,386 335,070 229,684
FUND BALANCE, Beginning 15,393,051 15,577,400 15,577,400 -
FUND BALANCE, Ending $ 15,374,686 $ 15,682,786 $ 15,912,470 $ 229,684
See the accompanying Independent Auditors' Report
37

BOULDER VALLEY SCHOOL DISTRICT RE-2
BUDGETARY COMPARISON SCHEDULEFOOD SERVICES FUNDYear Ended June 30, 2006
VARIANCEORIGINAL FINAL PositiveBUDGET BUDGET ACTUAL (Negative)
OPERATING REVENUES Regular School Lunch $ 1,684,424 $ 1,684,424 $ 1,546,054 $ (138,370) Sandwich Line 1,858,665 1,858,665 1,812,688 (45,977) Other Revenue 2,600 2,600 12,300 9,700
TOTAL OPERATING REVENUES 3,545,689 3,545,689 3,371,042 (174,647)
OPERATING EXPENSES Salaries 2,010,115 2,033,464 2,016,498 16,966 Benefits 525,145 527,956 507,343 20,613 Purchased Food 2,029,106 2,029,106 2,133,336 (104,230) USDA Donated Commodities 174,824 174,824 160,996 13,828 Nonfood Supplies 190,864 190,864 148,529 42,335 Purchased Services 38,205 38,205 58,001 (19,796) Depreciation 70,000 50,000 40,157 9,843 Indirect Costs 122,755 122,755 122,755 - Other 45,083 45,083 24,196 20,887 Emergency Reserves 156,183 156,368 - 156,368
TOTAL OPERATING EXPENSES 5,362,280 5,368,625 5,211,811 156,814
OPERATING INCOME (LOSS) (1,816,591) (1,822,936) (1,840,769) (17,833)
NONOPERATING REVENUES USDA Donated Commodities 222,183 222,183 204,659 (17,524) Federal Reimbursement 1,373,252 1,373,252 1,410,753 37,501 State Matching Funds 53,000 53,000 53,732 732
TOTAL NONOPERATING REVENUES 1,648,435 1,648,435 1,669,144 20,709
NET INCOME (LOSS) (168,156) (174,501) (171,625) 2,876
NET ASSETS, Beginning 1,174,936 1,028,937 1,053,402 24,465
NET ASSETS, Ending $ 1,006,780 $ 854,436 $ 881,777 $ 27,341
See the accompanying Independent Auditors' Report.
38

BOULDER VALLEY SCHOOL DISTRICT RE-2
COMBINING BALANCE SHEETINTERNAL SERVICE FUNDS
June 30, 2006
INSURANCE DENTAL RESERVE INSURANCE
FUND FUND TOTALASSETS Current Assets Cash and Investments $ - $ 624,629 $ 624,629
TOTAL ASSETS - 624,629 624,629
LIABILITIESCurrent Liabilities Claims Payable - 234,681 234,681
TOTAL LIABILITIES - 234,681 234,681
NET ASSETS Unrestricted - 389,948 389,948
TOTAL NET ASSETS $ - $ 389,948 $ 389,948
See the accompanying Independent Auditors' Report.
39

BOULDER VALLEY SCHOOL DISTRICT RE-2
COMBINING STATEMENT OF REVENUES, EXPENSES, AND CHANGES IN FUND NET ASSETSINTERNAL SERVICE FUNDS
Year Ended June 30, 2006
INSURANCE DENTAL RESERVE INSURANCE
FUND FUND TOTALOPERATING REVENUES Premiums and Services $ 3,243,572 $ 389,948 $ 3,633,520 Other Revenue 7,278 - 7,278
TOTAL OPERATING REVENUES 3,250,850 389,948 3,640,798
OPERATING EXPENSES Salaries 885,478 - 885,478 Benefits 199,602 - 199,602 Purchased Services 1,827,729 - 1,827,729 Other 47,412 - 47,412
TOTAL OPERATING EXPENSES 2,960,221 - 2,960,221
OPERATING INCOME 290,629 389,948 680,577
TRANSFERS Transfers Out (473,133) - (473,133)
CHANGE IN NET ASSETS (182,504) 389,948 207,444
NET ASSETS, Beginning 182,504 - 182,504
NET ASSETS, Ending $ - $ 389,948 $ 389,948
See the accompanying Independent Auditors' Report.
40

BOULDER VALLEY SCHOOL DISTRICT RE-2
COMBINNG STATEMENT OF CASH FLOWSINTERNAL SERVICE FUNDS
Increase (Decrease) in CashYear Ended June 30, 2006
INSURANCE DENTAL RESERVE INSURANCE
FUND FUND TOTALCash Flows From Operating Activities Contributions $ 3,243,572 $ 389,948 $ 3,633,520 Other Operating Receipts 7,278 - 7,278 Cash Payments for Premiums and Claims (1,827,729) 234,681 (1,593,048) Cash Paid to Employees (1,105,569) - (1,105,569) Cash Paid to Suppliers (47,412) - (47,412)
Net Cash Provided by Operating Activities 270,140 624,629 894,769
Cash Flows From Noncapital Financing Activities Transfers to Other Funds (473,133) - (473,133)
NET INCREASE (DECREASE) IN CASH (202,993) 624,629 421,636
CASH, Beginning 202,993 - 202,993
CASH, Ending $ - $ 624,629 $ 624,629
RECONCILIATION OF OPERATING INCOME TO NET CASH PROVIDED BY OPERATING ACTIVITIES Operating Income $ 290,629 $ 389,948 $ 680,577 Adjustments to Reconcile Operating Income to Net Cash Provided by Operating Activities Changes in Assets and Liabilities Related to Operations Claims Payable - 234,681 234,681 Accrued Liabilities (20,489) - (20,489)
Net Cash Provided by Operating Activities $ 270,140 $ 624,629 $ 894,769
See the accompanying Independent Auditors' Report.
41

BOULDER VALLEY SCHOOL DISTRICT RE-2
BUDGETARY COMPARISON SCHEDULEINSURANCE RESERVE FUND
Year Ended June 30, 2006
VARIANCEORIGINAL FINAL PositiveBUDGET BUDGET ACTUAL (Negative)
OPERATING REVENUES Other Revenue $ 10,000 $ 10,000 $ 7,278 $ (2,722)
OPERATING EXPENSES Salaries 867,492 910,854 885,478 25,376 Benefits 252,378 237,005 199,602 37,403 Property Insurance Premiums 950,000 850,000 842,107 7,893 Workers Compensation Premiums 1,087,268 1,087,268 893,616 193,652 Deductible Reserves 200,000 200,000 92,006 107,994 Other 32,000 50,869 47,412 3,457 Emergency Reserves 101,674 100,080 - 100,080
TOTAL OPERATING EXPENSES 3,490,812 3,436,076 2,960,221 475,855
OPERATING LOSS (3,480,812) (3,426,076) (2,952,943) 473,133
TRANSFERS Transfers In 3,325,816 3,243,572 3,243,572 - Transfers Out - - (473,133) (473,133)
CHANGE IN NET ASSETS (154,996) (182,504) (182,504) 473,133
NET ASSETS, Beginning 154,996 182,504 182,504 -
NET ASSETS, Ending $ - $ - $ - $ -
See the accompanying Independent Auditors' Report.
42

BOULDER VALLEY SCHOOL DISTRICT RE-2
COMBINING STATEMENT OF FIDUCIARY NET ASSETSPRIVATE PURPOSE TRUST FUNDS
Year Ended June 30, 2006
Balances Balances6/30/05 Additions Deductions 6/30/06
SCHOLARSHIP FUNDParmerlee Greiner Scholarship $ 8,943 $ 297 $ 1,918 $ 7,322Hoelscher Scholarship 1,645 54 50 1,649TEC Scholarships 1,221 41 500 762CASB Scholarship Hilty Award 672 9 681 - Cameron Memorial Fund 62 2 - 64Jerry Buck Scholarship 3,124 104 325 2,903Armijo Memorial Fund 1,364 41 250 1,155Hamilton Scholarship Fund 10,131 336 500 9,967Banman Memorial Scholarship 137 4 - 141Armstrong Tech Theater Award 4,602 153 1,000 3,755Urquidez Scholarship 1,676 56 - 1,732CASB Scholarship Sandstead Award 1,702 24 1,726 - Baldwin Memorial Scholarship 37 - - 37Taylor Memorial Scholarship 8,887 295 100 9,082CASB Scholarship Young Award 161 2 163 - E. Scates Scholarship 22,331 686 3,000 20,017Monarch HS Class of 2001 18,075 5,740 700 23,115
Total Scholarship Fund 84,770 7,844 10,913 81,701
TRUST FUNDCarlson Scholarship 14,815 488 - 15,303Bostrom Scholarship Fund 16,009 549 500 16,058Japanese Exchange 131,079 4,791 300 135,570
Total Trust Fund 161,903 5,828 800 166,931
TOTAL $ 246,673 $ 13,672 $ 11,713 $ 248,632
See the accompanying Independent Auditors' Report.
43

BOULDER VALLEY SCHOOL DISTRICT RE-2
STATEMENT OF CHANGES IN ASSETS AND LIABILITIESAGENCY FUND
Year Ended June 30, 2006
Balances Balances6/30/05 Additions Deductions 6/30/06
Angevine Middle Student Activities $ 21,589 $ 93,037 $ 100,421 $ 14,205Arapahoe Ridge High Student Activities 11,760 15,698 9,172 18,286Aspen Creek K-8 Student Activities 36,489 164,140 146,554 54,075Boulder High Student Activities 222,033 1,145,266 1,135,327 231,972Boulder TEC Student Activities 25,715 52,756 43,848 34,623Broomfield Heights Middle Student Activities 55,466 140,694 125,920 70,240Broomfield High Student Activities 163,614 892,147 882,414 173,347Casey Middle Student Activities 35,769 119,389 118,403 36,755Centaurus High Student Activities 209,927 649,143 631,948 227,122Centennial Middle Student Activities 44,855 125,618 128,835 41,638Community Schools Student Activities 1,208 17,043 14,603 3,648Douglass Elementary Student Activities 11,054 22,361 26,179 7,236Eldorado K-8 Student Activities 37,444 101,223 101,593 37,074Fairview High Student Activities 421,152 1,398,103 1,481,847 337,408Foothills Elementary Student Activities 11,923 103,676 96,682 18,917Heatherwood Elementary Student Activities 2,038 1,312 498 2,852Louisville Middle Student Activities 83,024 177,050 185,566 74,508Manhattan Middle Student Activities 37,833 137,341 138,732 36,442Mesa Elementary Student Activities 31,293 101,787 107,277 25,803Monarch High Student Activities 227,584 1,053,943 981,013 300,514Monarch K-8 Student Activities 49,969 139,957 146,593 43,333Nederland Middle/Sr. Student Activities 41,388 199,639 196,039 44,988Nevin Platt Middle Student Activities 40,115 246,158 232,713 53,560New Vista High Student Activities 29,792 124,648 124,786 29,654Southern Hills Middle Student Activities 27,149 102,620 90,846 38,923
Subtotal 1,880,183 7,324,749 7,247,809 1,957,123
Angevine Middle School 1,052 3,362 2,519 1,895Arapahoe Ridge High School 2,376 5,210 3,273 4,313Bear Creek Elementary School 1,991 18,767 19,950 808Birch Elementary School 14,219 57,776 50,090 21,905Boulder Community School of Integrated Studies 1,658 21,571 8,631 14,598Boulder High School 173 22,229 30,539 (8,137)Boulder TEC 41 600 600 41Broomfield Heights Middle School 1,023 275 275 1,023Broomfield High School 3,938 18,047 27,097 (5,112)Casey Middle School 2,666 93,281 7,560 88,387Centaurus High School 718 25,037 20,011 5,744Centennial Middle School 1,588 4,645 3,785 2,448Coal Creek Elementary School 2,248 13,714 14,722 1,240
See the accompanying Independent Auditors' Report.
44

Balances Balances6/30/05 Additions Deductions 6/30/06
Columbine Elementary School 7,468 17,314 17,911 6,871Community Montessori School (10,528) 78,991 95,147 (26,684)Creekside at Martin Park Elementary School 30,194 35,010 36,376 28,828Crest View Elementary School 5,041 22,246 22,370 4,917Douglass Elementary School 16,291 50,894 60,207 6,978Eisenhower Elementary School 14,793 91,823 77,628 28,988Eldorado K-8 School (3,508) 16,789 26,672 (13,391)Emerald Elementary School 17,691 29,288 26,475 20,504Fairview High School (12,497) 153,121 167,923 (27,299)Fireside Elementary School 13,332 27,022 27,226 13,128Flatirons Elementary School 32,569 96,093 83,500 45,162Foothill Elementary School 25,591 - 19,922 5,669Gold Hill Elementary 643 2,738 1,690 1,691Halcyon 57 20 - 77Heatherwood Elementary School 23,374 45,837 62,370 6,841High Peaks Elementary School 7,265 19,187 18,762 7,690Jamestown Elementary 708 1,973 1,753 928Kohl Elementary School 16,190 34,095 30,697 19,588Lafayette Elementary School 26,546 64,580 235,726 (144,600)Louisville Elementary School 14,061 17,793 17,607 14,247Louisville Middle School 8,567 11,340 7,609 12,298Manhattan Middle School for the Arts and Academics (7,388) 14,843 6,824 631Mesa Elementary School (371) 40,860 37,747 2,742Monarch High School (4,077) 17,592 15,920 (2,405)Monarch K-8 School (627) - - (627)Nederland Elementary School 15,368 54,182 46,078 23,472Nederland Middle/Senior High School 6,414 15,286 14,418 7,282Nevin Platt Middle School 425 4,000 1,883 2,542New Vista High School 20,360 11,300 11,576 20,084Other Departments 932,539 460,833 495,613 897,759Pioneer Elementary School (3,024) 14,868 6,615 5,229Ryan Elementary School 10,665 28,988 31,656 7,997Sanchez Elementary School 42,883 38,097 29,311 51,669Superior Elementary School 25,900 64,536 55,752 34,684University Hill Elementary School 35,390 16,786 11,052 41,124Whittier Elementary School (109) 17,667 15,389 2,169
Subtotal 1,341,887 1,900,506 2,006,457 1,235,936
TOTALS $ 3,222,070 $ 9,225,255 $ 9,254,266 $ 3,193,059

BOULDER VALLEY SCHOOL DISTRICT RE-2
COMBINING STATEMENT OF NET ASSETSCOMPONENT UNITS
June 30, 2006
TOTALBOULDER PEAK TO COMPONENT
PREP HORIZONS PEAK SUMMIT UNITSASSETS Cash and Investments $ 37,563 $ 520,987 $ 3,557,414 $ 494,695 $ 4,610,659 Restricted Cash and Investments - - 2,708,275 - 2,708,275 Accounts Receivable - - 29,562 - 29,562 Inventories - - 13,500 - 13,500 Prepaid Expenses 7,374 - 28,760 - 36,134 Debt Issuance Costs, Net of Accumulated Amortization - - 642,455 - 642,455 Capital Assets, Not Being Depreciated - - 1,103,000 - 1,103,000 Capital Assets, Net of Accumulated Depreciation 9,905 - 12,698,892 43,628 12,752,425
TOTAL ASSETS 54,842 520,987 20,781,858 538,323 21,896,010
LIABILITIES Accounts Payable - - 2,357 - 2,357 Accrued Liabilities - 1,790 46,572 4,082 52,444 Accrued Salaries and Benefits - 194,927 276,743 107,559 579,229 Accrued Interest Payable - - 426,278 - 426,278 Deferred Revenues - 21,865 19,971 22,196 64,032 Noncurrent Liabilities Due Within One Year - - 400,000 - 400,000 Due in More Than One Year - - 17,878,767 - 17,878,767
TOTAL LIABILITIES - 218,582 19,050,688 133,837 19,403,107
NET ASSETS Invested in Capital Assets, Net of Related Debt 9,905 - (3,834,420) 43,628 (3,780,887) Restricted for Debt Service - - 2,708,275 - 2,708,275 Restricted for Emergencies 16,225 49,942 249,950 53,138 369,255 Unrestricted 28,712 252,463 2,607,365 307,720 3,196,260
TOTAL NET ASSETS $ 54,842 $ 302,405 $ 1,731,170 $ 404,486 $ 2,492,903
See the accompanying Independent Auditors' Report.
45

BOULDER VALLEY SCHOOL DISTRICT RE-2
COMBINING STATEMENT OF ACTIVITIESCOMPONENT UNITS
Year Ended June 30, 2006
TOTALBOULDER PEAK TO COMPONENT
PREP HORIZONS PEAK SUMMIT UNITSEXPENSES Instruction - Regular Programs $ 356,684 $ 1,331,249 $ 3,528,497 $ 1,063,010 $ 6,279,440 Instruction - Special Programs 99,868 372,944 1,291,145 323,586 2,087,543 Student Support Services 201,274 450,014 24,350 63,473 739,111 Instructional Staff Services 67,485 55,588 261,243 146,392 530,708 General Administration 39,809 28,872 188,941 29,838 287,460 School Administration 78,248 171,354 1,882,306 326,883 2,458,791 Business Services 31,725 29,889 122,466 29,496 213,576 Operations and Maintenance 95,696 221,108 671,266 245,331 1,233,401 Central Support Services 25,901 - 312,194 81,292 419,387 Other Support Services 1,192 75,995 773,682 - 850,869 Community Services - - 91,984 - 91,984 Principal and Interest - - 1,304,595 - 1,304,595
TOTAL EXPENSES 997,882 2,737,013 10,452,669 2,309,301 16,496,865
PROGRAM REVENUES Charges for Services - 202,071 590,422 11,184 803,677 Operating Grants and Contributions 70,810 167,622 520,163 - 758,595
TOTAL PROGRAM REVENUES 70,810 369,693 1,110,585 11,184 1,562,272
NET (EXPENSE) REVENUE 927,072 2,367,320 9,342,084 2,298,117 14,934,593
GENERAL REVENUES Per Pupil Revenues 645,666 1,909,952 7,498,301 1,882,914 11,936,833 Mill Levy Override 111,890 374,199 1,436,354 331,667 2,254,110 Capital Construction Funding 14,945 189 173,605 76 188,815 Investment Earnings - 3,163 159,597 - 162,760 Other Revenues 124,395 247,227 716,789 109,523 1,197,934
TOTAL GENERAL REVENUES 896,896 2,534,730 9,984,646 2,324,180 15,740,452
CHANGE IN NET ASSETS (30,176) 167,410 642,562 26,063 805,859 NET ASSETS, Beginning 85,018 134,995 1,088,608 378,423 1,687,044
NET ASSETS, Ending $ 54,842 $ 302,405 $ 1,731,170 $ 404,486 $ 2,492,903
See the accompanying Independent Auditors' Report.
46

BOULDER VALLEY SCHOOL DISTRICT RE-2
COMBINING BALANCE SHEETCOMPONENT UNITS
June 30, 2006
TOTALBOULDER PEAK TO COMPONENT
PREP HORIZONS PEAK SUMMIT UNITSASSETS Cash and Investments $ 37,563 $ 520,987 $ 3,557,414 $ 494,695 $ 4,610,659 Restricted Cash and Investments - - 2,708,275 - 2,708,275 Accounts Receivable - - 29,562 - 29,562 Inventories - - 13,500 - 13,500 Prepaid Items 7,374 - 28,760 - 36,134
TOTAL ASSETS $ 44,937 $ 520,987 $ 6,337,511 $ 494,695 $ 7,398,130
LIABILITIES AND FUND BALANCESLIABILITIES Accounts Payable $ - $ - $ 2,357 $ - $ 2,357 Accrued Liabilities - 1,790 46,572 4,082 52,444 Accrued Salaries and Benefits - 194,927 276,743 107,559 579,229 Deferred Revenues - 21,865 19,971 22,196 64,032
TOTAL LIABILITIES - 218,582 345,643 133,837 698,062
FUND BALANCES Reserved for Inventories - - 13,500 - 13,500 Reserved for Prepaid Items 7,374 - 28,760 - 36,134 Reserved for Debt Service - - 2,708,275 - 2,708,275 Reserved for Emergencies 16,225 49,942 249,950 53,138 369,255 Unreserved 21,338 252,463 2,991,383 307,720 3,572,904
TOTAL FUND BALANCES 44,937 302,405 5,991,868 360,858 6,700,068
TOTAL LIABILITIES AND FUND BALANCES $ 44,937 $ 520,987 $ 6,337,511 $ 494,695 $ 7,398,130
Amounts reported in the statement of net assets are difference because:
Fund Balances $ 44,937 $ 302,405 $ 5,991,868 $ 360,858 $ 6,700,068
Capital Assets 9,905 - 13,801,892 43,628 13,855,425 Long-Term Debt - - (22,910,000) - (22,910,000) Accrued Interest Payable - - (426,278) - (426,278) Debt Premium - - (493,772) - (493,772) Loss on Refunding - - 5,125,005 - 5,125,005 Debt Issuance Costs - - 642,455 - 642,455
Net Assets $ 54,842 $ 302,405 $ 1,731,170 $ 404,486 $ 2,492,903
See the accompanying Independent Auditors' Report.
47

BOULDER VALLEY SCHOOL DISTRICT RE-2
COMBINING STATEMENT OF REVENUES, EXPENDITURESAND CHANGES IN FUND BALANCES
COMPONENT UNITSYear Ended June 30, 2006
TOTALBOULDER PEAK TO COMPONENT
PREP HORIZONS PEAK SUMMIT UNITSREVENUES Local Sources $ 915,431 $ 2,864,234 $ 10,910,099 $ 2,335,224 $ 17,024,988 State Sources 50,420 40,189 173,618 140 264,367 Federal Sources 1,855 - 11,514 - 13,369
TOTAL REVENUES 967,706 2,904,423 11,095,231 2,335,364 17,302,724
EXPENDITURESCurrent Instruction - Regular Programs 351,732 1,331,249 3,528,497 1,063,010 6,274,488 Instruction - Special Programs 99,868 372,944 1,291,145 323,586 2,087,543 Student Support Services 201,274 450,014 24,350 63,473 739,111 Instructional Staff Services 67,485 55,588 261,243 146,392 530,708 General Administration 39,809 28,872 188,941 29,838 287,460 School Administration 78,248 171,354 1,882,306 320,651 2,452,559 Business Services 31,725 29,889 122,466 29,496 213,576 Operations and Maintenance 95,696 221,108 671,266 245,331 1,233,401 Central Support Services 25,901 - 312,194 81,292 419,387 Other Support Service 1,192 75,995 81,433 - 158,620 Community Services - - 91,984 - 91,984Capital Outlay - - 164,747 - 164,747Debt Service Principal - - 390,000 - 390,000 Interest and Fiscal Charges - - 1,142,593 - 1,142,593
TOTAL EXPENDITURES 992,930 2,737,013 10,153,165 2,303,069 16,186,177
NET CHANGE IN FUND BALANCES (25,224) 167,410 942,066 32,295 1,116,547 FUND BALANCES, Beginning 70,161 134,995 5,049,802 328,563 5,583,521
FUND BALANCES, Ending $ 44,937 $ 302,405 $ 5,991,868 $ 360,858 $ 6,700,068
Amounts reported in the statement of activities are different because:
Net Change in Fund Balances $ (25,224) $ 167,410 $ 942,066 $ 32,295 $ 1,116,547
Capital Outlay - - 35,058 - 35,058 Depreciation Expense (4,952) - (539,478) (6,232) (550,662) Repayment of Debt Principal - - 390,000 - 390,000 Accrued Interest - - 4,388 - 4,388 Amortization of Debt Premium - - 17,741 - 17,741 Amortization of Loss on Refunding - - (184,131) - (184,131) Amortization of Debt Issuance Costs - - (23,082) - (23,082)
Change in Net Assets $ (30,176) $ 167,410 $ 642,562 $ 26,063 $ 805,859
See the accompanying Independent Auditors' Report.
48

./'/*./*('+ .)(/*-,

-).)J()J/.h -:/)J'&
Pden naVoeji jb oda CjpgWamRSggat OVdjjg EenomeVoMF)0'n Djhkmadaineqa BiipSgGeiSiVeSg Makjmo kmanaion WaoSegaWWSoS Sn S Vjioaso bjm piWamnoSiWeic odaeibjmhSoeji ei oda beiSiVeSg noSoahaion( ijoa WenVgjnpman( SiW malpemaWnpkkgahaioSmt eibjmhSoeji,
Djioaion PSTgan
GeiSiVeSgPmaiWnPdana oSTganVjioSeggomaiWeibjmhSoeji oj dagk oda maSWampiWamnoSiWdjr oda EenomeVo'nbeiSiVeSgVjiWeoeji dSn VdSicaWjqam oeha, .)1
Maqaipa DSkSVeotPdana oSTganVjioSei eibjmhSoeji oj dagk oda maSWamSnnannoda EenomeVo'ngSmcanomaqaipa njpmVa( kmjkamotoSsa&, 2)5
EaToDSkSVeotPdana oSTgankmanaio eibjmhSoeji oj dagk oda maSWamSnnannoda SbbjmWSTegeotjboda,,EenomeVo'nVpmmaiogaqagnjb jponoSiWeicWaToSiW oda EenomeVo'nSTegeotoj ennpa SWWeoejiSgWaToei odabpopma, :)A
EahjlmSkdeV SiW FVjijheV HibjmhSoejiPdana nVdaWpganjbbamWahjcmSkdeV SiW aVjijheV eiWeVSojmnoj dagk oda maSWampiWamnoSiWoda aiqemjihaio reodei rdeVdoda EenomeVo'nbeiSiVeSgSVoeqeoeanoSfa kgSVa, .-).1
IkamSoeil HibjmhSoejiPdana oSTgan VjioSei namqeVaWSoS oj dagk oda maSWampiWamnoSiWdjr oda eibjmhSoeji ei oda beiSiVeSgmakjmomagSoanoj oda namqeVanoda EenomeVokmjqeWanSiW oda SVoeqeoeaneokambjmhn, .2).3
49
JScan
$0~$I
$V~$%
25)2:
$&~%I
31)3A

BOULDER VALLEY SCHOOL DISTRICT RE-2Net Assets by Component
Last 5 Fiscal Years (1)
(Unaudited)
Table 1
June 30, 2002 June 30, 2003 June 30, 2004 June 30, 2005 June 30, 2006
Governmental ActivitiesInvested in capital assets
net of related debt $ 44,667,102 $ 46,192,989 $ 47,637,046 $ 49,692,959 $ 51,647,224 Restricted 19,165,987 24,918,797 25,332,313 23,690,482 24,912,968 Unrestricted 255,061 66,032 8,886,135 14,408,303 18,100,286
Total Governmental Activities 64,088,150 71,177,818 81,855,494 87,791,744 94,660,478
Business-type ActivitiesInvested in capital assets
net of related debt 491,286 335,512 295,298 249,763 241,459 Restricted 151,437 155,041 154,940 160,179 156,368 Unrestricted 442,559 440,902 667,738 643,460 483,950
Total Business-type Activities 1,085,282 931,455 1,117,976 1,053,402 881,777
Primary GovernmentInvested in capital assets
net of related debt 45,158,388 46,528,501 47,932,344 49,942,722 51,888,683 Restricted 19,317,424 25,073,838 25,487,253 23,850,661 25,069,336 Unrestricted 697,620 506,934 9,553,873 15,051,763 18,584,236
Total Primary Government $ 65,173,432 $ 72,109,273 $ 82,973,470 $ 88,845,146 $ 95,542,255
Note: (1) Years after the implementation of GASB 34
50

Table 2
June 30, 2002 June 30, 2003 June 30, 2004 June 30, 2005 June 30, 2006Primary GovernmentExpenses
Governmental Activities128,103,261 138,634,470 152,350,470 156,019,891 159,937,412
Supporting Services 64,674,994 64,857,565 67,708,814 70,880,775 76,041,071 Unallocated Depreciation 7,571,955 7,350,240 - - - Interest Expense 8,551,499 7,717,201 7,251,857 7,041,788 6,732,020
Total Governmental Activities 208,901,709 218,559,476 227,311,141 233,942,454 242,710,503
Business-type ActivitiesFood Services 5,123,170 5,052,501 4,951,365 4,968,538 5,211,811
Total Business-type Activities 5,123,170 5,052,501 4,951,365 4,968,538 5,211,811
Total Primary Government Expenses 214,024,879 223,611,977 232,262,506 238,910,992 247,922,314
Program RevenuesGovernmental Activities
Charges for Services 4,515,968 4,804,335 4,633,203 5,049,089 9,226,204 Operating Grants and Contributions 17,238,877 16,163,107 17,157,713 19,381,843 19,442,789
Total Governmental Activities 21,754,845 20,967,442 21,790,916 24,430,932 28,668,993
Business-type ActivitiesCharges for Services 3,666,920 3,473,272 3,592,297 3,370,264 3,371,042 Operating Grants and Contributions 1,380,737 1,425,402 1,545,589 1,533,700 1,669,144
Total Business-type Activities 5,047,657 4,898,674 5,137,886 4,903,964 5,040,186
Total Primary Government Program Revenues 26,802,502 25,866,116 26,928,802 29,334,896 33,709,179
Net (Expense) RevenueGovernmental Activities (187,146,864) (197,592,034) (205,520,225) (209,511,522) (214,041,510) Business-type Activities (75,513) (153,827) 186,521 (64,574) (171,625)
Total Primary Government Net (Expense) (187,222,377) (197,745,861) (205,333,704) (209,576,096) (214,213,135)
General RevenuesGovernmental Activities
Property Taxes 132,987,761 146,454,502 152,701,086 148,506,345 154,646,048 Specific Ownership Taxes 12,221,725 11,605,270 11,551,266 11,254,363 10,887,850 State Equalization 35,352,777 42,286,795 45,499,801 49,628,580 51,919,871 Unrestricted Grant Revenue - 1,635,693 - - - Investment Earnings 1,012,088 487,225 230,215 555,174 1,192,940 Other Revenues 2,148,195 2,212,217 6,215,533 5,503,310 2,263,535
Total General Revenues 183,722,546 204,681,702 216,197,901 215,447,772 220,910,244
Change in Net Assets (3,499,831) 6,935,841 10,864,197 5,871,676 6,697,109
Net Assets, July 1 68,673,263 65,173,432 72,109,273 82,973,470 88,845,146
Net Assets, June 30 $ 65,173,432 $ 72,109,273 $ 82,973,470 $ 88,845,146 $ 95,542,255
Note: (1) Years after the implementation of GASB 34
Instruction
BOULDER VALLEY SCHOOL DISTRICT RE-2Changes in Net AssetsLast 5 Fiscal Years (1)
(Unaudited)
51

1997 1998 1999 2000 2001
General FundReserved $ 4,294,871 $ 4,421,295 $ 4,935,923 $ 5,322,111 $ 704,703 Unreserved (6,687,657) (6,400,627) 2,704,146 524,622 3,980,357 Sub total (2,392,786) (1,979,332) 7,640,069 5,846,733 4,685,060
Other Governmental FundsReserved 33,622,614 12,955,631 68,097,352 29,421,887 5,380,672 Unreserved, reported in
Debt Service Fund 12,601,563 13,211,548 14,467,115 14,172,985 14,952,229 Capital Projects Fund 1,803,473 2,533,415 2,635,732 2,360,889 2,990,232 Special Revenue Fund 290,064 50,838 57,322 5,285 52,367
Sub total 48,317,714 28,751,432 85,257,521 45,961,046 23,375,500
Total Governmental Funds $ 45,924,928 $ 26,772,100 $ 92,897,590 $ 51,807,779 $ 28,060,560
Source: Boulder Valley School District RE-2
52
BOULDER VALLEY SCHOOL DISTRICT RE-2Fund Balances, Governmental Funds
Last 10 Fiscal Years
(Unaudited)

Table 3
2002 2003 2004 2005 2006
$ 482,630 $ 5,836,698 $ 6,088,567 $ 6,452,971 $ 6,416,452 (586,897) 273,456 8,310,252 12,555,719 17,132,787 (104,267) 6,110,154 14,398,819 19,008,690 23,549,239
191,684 170,609 286,639 209,028 501,254
14,973,430 15,131,986 17,075,783 15,577,400 15,912,470 4,000,873 4,001,547 2,141,390 1,575,024 143,238
- - - - 2,310,761 19,165,987 19,304,142 19,503,812 17,361,452 18,867,723
$ 19,061,720 $ 25,414,296 $ 33,902,631 $ 36,370,142 $ 42,416,962

1997 1998 1999 2000 2001
Primary GovernmentRevenues
Local sourcesCurrent Property taxes $ 99,240,366 $ 103,737,541 $ 119,431,628 $ 122,447,267 $ 125,932,588 Specific ownership taxes 8,187,509 8,839,059 9,961,118 11,324,836 11,936,063 Deliquent property taxes 117,529 221,044 102,255 296,456 847,037 Grants 378,858 35,833 210,153 293,698 193,593 Tuition 2,499,455 3,490,031 3,582,710 3,352,704 3,275,045 Interest 4,264,770 3,897,873 2,675,461 3,897,555 2,462,192 Miscellaneous 2,312,775 1,198,548 3,834,003 2,903,105 2,296,818
Sub total local sources 117,001,262 121,419,929 139,797,328 144,515,621 146,943,336
State sourcesEqualization 23,664,149 24,506,373 27,821,878 29,110,241 31,174,893 Special education 2,771,485 2,939,892 2,956,640 3,005,528 3,076,734 Transportation 1,562,182 1,448,265 1,353,305 1,534,018 1,605,018 Vocational education 782,306 927,638 697,546 729,487 997,821 Grants 349,667 155,033 132,833 186,802 356,145 Medicaid - - - - - Miscellaneous 251,213 330,697 340,482 149,359 127,057
Sub total state sources 29,381,002 30,307,898 33,302,684 34,715,435 37,337,668
Federal SourcesGrants 3,584,807 4,574,645 4,300,278 5,540,810 6,210,931 Miscellaneous - 6,075 17,086 - -
Sub total federal sources 3,584,807 4,580,720 4,317,364 5,540,810 6,210,931
Total revenues 149,967,071 156,308,547 177,417,376 184,771,866 190,491,935
ExpensesGovernmental Activities
67,105,862 68,701,845 72,059,525 78,960,052 80,856,556 17,685,385 22,355,449 26,111,880 28,343,878 30,563,735
- Student Services 4,419,936 3,496,064 3,930,627 4,643,640 5,031,435 Instructional Staff Support 4,366,712 4,449,319 5,197,693 7,311,116 7,528,597
- School Administration 9,931,867 9,716,871 11,449,223 13,312,533 13,505,416 Operations and Maintenance 11,609,303 10,715,296 11,474,154 12,633,683 14,358,773 Student Transportation 4,194,773 4,325,552 4,619,472 5,394,059 5,531,612
- General Administration 1,416,781 1,859,501 1,933,175 1,814,839 2,445,908 Business Services 2,428,544 1,422,046 1,476,452 1,613,363 1,856,336 Central Services 2,779,635 3,226,278 3,546,228 4,129,184 4,051,061 Enterprise Operations - 114,840 58,564 31,897 34,677 Community Services 2,753,712 3,067,927 2,456,675 2,337,352 2,485,765 Adult Basic Education 104,771 64,997 35,267 49,644 32,242 Debt Services - Payments on Debt 12,590,668 12,561,027 14,729,983 16,016,637 15,190,567 Capital outlay 41,071,324 27,674,914 14,301,645 48,199,794 29,448,348
Total Expenitures 182,459,273 173,751,926 173,380,563 224,791,671 212,921,028
Other financing sources (uses) 34,291 (304,195) 64,040,039 602,963 87,428
Net change in fund balances (33,868,811) (19,152,828) 66,125,490 (41,089,811) (23,974,663)
Fund Balance, Beginning 78,330,016 45,924,928 26,772,100 92,897,590 51,807,779
Prior Period Adjustment 1,463,723 - - - -
Fund Balance, Ending $ 45,924,928 $ 26,772,100 $ 92,897,590 $ 51,807,779 $ 27,833,116
53
BOULDER VALLEY SCHOOL DISTRICT RE-2Changes in Fund Balances-Governmental Funds
Last 10 Fiscal Years
(Unaudited)
District Wide/Community Services
Regular InstructionSpecial InstructionInstructional Support
School Administration and Operations

Table 4
2002 2003 2004 2005 2006
$ 131,277,327 $ 145,992,818 $ 151,789,396 $ 146,875,553 $ 155,286,194 12,221,725 11,605,270 11,588,140 11,254,363 10,887,850
940,528 420,203 336,249 154,876 197,766 637,603 609,678 891,361 625,824 379,077
4,893,573 5,310,851 5,416,755 4,178,361 5,856,936 1,000,511 444,693 826,866 314,937 1,192,940 1,770,591 1,519,558 4,639,448 6,369,584 5,632,801
152,741,858 165,903,071 175,488,215 169,773,498 179,433,564
35,352,777 42,286,795 45,510,703 49,628,580 51,919,871 3,253,442 3,458,753 3,562,820 3,580,231 4,382,998 1,641,720 1,740,381 1,666,126 1,817,823 1,812,163 1,093,446 836,724 740,919 863,334 745,959 1,905,909 1,911,065 1,283,960 1,708,940 699,254
- 211,016 195,883 181,471 205,233 861,089 322,123 298,318 299,121 342,855
44,108,383 50,766,857 53,258,729 58,079,500 60,108,333
7,845,668 8,920,076 8,703,306 10,486,570 10,875,250 - - - - -
7,845,668 8,920,076 8,703,306 10,486,570 10,875,250
204,695,909 225,590,004 237,450,250 238,339,568 250,417,147
91,734,901 99,197,958 101,172,110 103,615,622 106,537,319 36,374,276 39,416,453 41,407,709 43,141,666 42,475,585
4,701,396 5,170,891 5,332,767 5,332,346 5,737,529 7,616,595 7,910,443 7,340,550 7,943,077 9,200,010
12,909,374 11,116,837 14,119,765 14,292,469 14,968,318 13,788,472 14,307,963 15,338,688 15,759,700 16,890,272 6,050,831 6,262,799 6,611,788 6,887,504 7,439,219
2,701,597 2,756,668 2,607,570 2,715,598 2,832,062 1,764,119 1,923,562 1,934,280 2,694,665 2,016,893 7,479,615 7,851,084 8,495,520 9,338,785 10,813,212
107,008 - 3,509,275 3,688,237 4,061,211 4,042,492 4,373,239
38,758 40,793 41,195 179,308 92,263 15,227,481 14,631,948 14,541,483 14,296,265 14,296,497 9,786,473 4,961,792 7,713,867 5,525,552 7,171,042
213,683,163 219,237,428 230,718,503 235,872,057 244,843,460
215,858 - 1,756,588 - 473,133
(8,771,396) 6,352,576 8,488,335 2,467,511 6,046,820
27,833,116 19,061,720 25,414,296 33,902,631 36,370,142
- - - - -
$ 19,061,720 $ 25,414,296 $ 33,902,631 $ 36,370,142 $ 42,416,962

EstimatedFiscal Residential Commercial All ActualYear Property Property Other Total Value
1996 1,170,755,697 846,175,564 181,137,419 2,198,068,680 14,847,596,357 1997 1,216,914,610 937,699,680 188,553,490 2,343,167,780 16,388,753,557 1998 1,263,315,530 1,003,816,211 176,126,430 2,443,258,171 16,807,482,051 1999 1,437,867,352 1,180,454,562 245,450,462 2,863,772,376 19,668,035,517 2000 1,483,630,811 1,291,614,707 262,615,286 3,037,860,804 20,601,038,329 2001 1,864,943,092 1,550,515,234 357,373,542 3,772,831,868 27,110,806,850 2002 1,894,344,086 1,594,437,769 355,916,948 3,844,698,803 27,573,225,209 2003 1,952,680,540 1,667,504,239 352,499,975 3,972,684,754 31,624,551,624 2004 1,974,598,660 1,681,144,196 319,779,595 3,975,522,451 31,834,021,863 2005 2,064,990,490 1,766,828,760 322,566,613 4,154,385,863 33,273,880,826
Source: Boulder County, Broomfield County, and Gilpin County Assessor's Office
54
Taxable Assessed Value
BOULDER VALLEY SCHOOL DISTRICT RE-2Assessed Value and Estimated Actual Value of Taxable Property
(Unaudited)
Last 10 Fiscal Years

Table 5
Ratio of EstimatedActual Value toAssessed Value Residential All Other
6.7548 9.71% 29.00%6.9943 9.74% 29.00%6.8791 9.74% 29.00%6.8679 9.74% 29.00%6.7814 9.15% 29.00%7.1858 9.15% 29.00%7.1718 9.15% 29.00%7.9605 7.96% 29.00%8.0075 7.96% 29.00%8.0093 7.96% 29.00%
Assessment Rate

BOULDER VALLEY SCHOOL DISTRICT RE-2Prroperty Tax Levies and Collections
Last 10 Fiscal Years
(Unaudited)
Table 6
Total Current Percent of DeliquentLevy Collection Tax Tax Current Tax Tax PercentYear Year Levy Collections Collected Collections Amount of Levy
2005 1997 101,016,769 100,124,058 99.12% 171,986 100,296,044 99.29%1997 1998 104,343,774 103,476,460 99.17% 194,817 103,671,277 99.36%1998 1999 120,618,953 119,967,464 99.46% 93,653 120,061,117 99.54%1999 2000 123,278,175 123,084,709 99.84% 142,920 123,227,629 99.96%2000 2001 127,106,029 126,382,188 99.43% 356,068 126,738,256 99.71%2001 2002 131,684,926 130,756,272 99.29% 71,953 130,828,225 99.35%2002 2003 148,091,114 147,139,163 99.36% 387,790 147,526,953 99.62%2003 2004 152,358,541 151,722,942 99.58% 336,249 152,059,191 99.80%2004 2005 149,047,366 147,225,944 98.78% 139,537 147,365,481 98.87%2005 2006* 156,558,031 154,164,623 98.47% 180,929 154,345,552 98.59%
* Collections through July 31, 2006
Source: Boulder County, Broomfield County, and Gilpin County Assessor's Office
Total Collections
55

1996 1997 1998 1999Boulder Valley School District RE-2
General Fund School Finance Act 37.109 36.750 36.750 32.424 Budget Election 3.267 3.069 7.374 6.304 Abatements and Refunds 0.061 0.706 0.232 0.250 Subtotal General Fund 40.437 40.525 44.356 38.978
Transportation Fund - - - - Bond Redemption Fund 6.306 4.819 6.000 5.022
Total Boulder Valley School District RE-2 46.743 45.344 50.356 44.000
Boulder County 21.447 21.243 21.762 19.682
Cities and TownsBoulder 9.666 11.428 11.438 10.502Broomfield 13.894 13.894 13.894 13.894Lafayette 13.009 13.817 13.034 11.352Louisville 5.246 5.246 5.184 4.643Jamestown 12.621 13.390 12.320 13.289Nederland 14.440 15.486 16.210 14.982Superior 2.737 2.727 2.727 2.279Ward 5.416 4.807 5.481 4.232
77.029 80.795 80.288 75.173
Special Districts (Ranges) .696 to 27.240 .668 to 24.270 .676 to 30.000 .583 to 41.000
Fire Districts (Ranges) 2.300 to 14.007 1.776 to 13.367 1.776 to 13.431 1.776 to 12.147
Water/Sanitation Districts (Ranges) 3.680 to 11.480 .351 to 18.136 .357 to 18.350 .328 to 18.050
Note: Overlapping rates are those of governments that apply to property owners within the Boulder Valley School District RE-2 boundries. Not all overlapping rates apply to all District property owners (e. g. the rates for Special Districts apply only to the District's property owners whose property is located within the geographic boundries of the Special District.
Source: Boulder County, Broomfield County and Gilpin County Assessor's Office
56
BOULDER VALLEY SCHOOL DISTRICT RE-2Property Tax Rates - Direct and Overlapping Governments
Last 10 Fiscal Years
(Unaudited)

Table 7
2000 2001 2002 2003 2004 2005
31.972 26.412 26.412 26.049 26.049 25.023 5.960 4.669 8.469 8.201 8.193 7.862 0.259 0.193 0.125 0.128 0.176 0.461
38.191 31.274 35.006 34.378 34.418 33.346
- - - - - 1.065 4.699 3.533 3.518 3.877 3.005 3.274
42.890 34.807 38.524 38.255 37.423 37.685
19.835 17.621 20.087 20.088 21.267 21.867
10.908 9.301 9.640 9.860 10.005 9.64313.894 28.986 28.986 28.986 28.986 28.96811.860 11.130 10.994 10.832 10.710 11.8484.767 5.292 5.184 6.710 6.710 6.710
13.289 12.343 14.843 14.680 21.400 21.40015.546 15.408 15.455 14.462 14.765 14.5722.144 1.836 1.906 8.805 8.805 8.8054.230 3.662 3.474 2.616 2.709 2.300
76.638 87.958 90.482 96.951 104.090 104.246
.594 to 41.000 .521 to 43.000 .531 to 98.746 .533 to 84.319 .538 to 89.500 .538 to 99.000
1.776 to 12.432 1.090 to 11.023 2.500 to 11.715 2.500 to 11.434 2.500 to 11.433 2.500 to 11.325
.303 to 19.364 .258 to 16.462 .245 to 16.795 .243 to 17.365 .230 to 17.957 .222 to 18.141

BOULDER VALLEY SCHOOL DISTRICT RE-2Ratios of Outstanding Debt by Type
Last 10 Fiscal Years
(Unaudited)
Table 8
General Total PercentageFiscal Obligation Certificates of Capital Primary of Personal Per Year Bonds Participation Leases Government Income* Capita*
1997 $ 119,515,000 $ 10,215,000 $ 53,964 $ 129,783,964 1.63% $ 5161998 119,015,000 9,425,000 646,640 129,086,640 1.62% 5131999 176,270,000 8,695,000 531,919 185,496,919 2.32% 7372000 170,405,000 7,925,000 404,185 178,734,185 2.24% 7102001 165,070,000 7,115,000 271,922 172,456,922 2.16% 6852002 159,500,000 6,255,000 139,784 165,894,784 2.08% 6592003 153,515,000 5,350,000 - 158,865,000 1.99% 6312004 147,065,000 6,790,000 - 153,855,000 1.93% 6112005 140,310,000 6,300,000 - 146,610,000 1.84% 5832006 133,250,000 5,805,000 - 139,055,000 1.74% 553
* Personal Income and Population data may be found on Table 10
Source: Boulder Valley School District RE-2
Governmental Activities
57
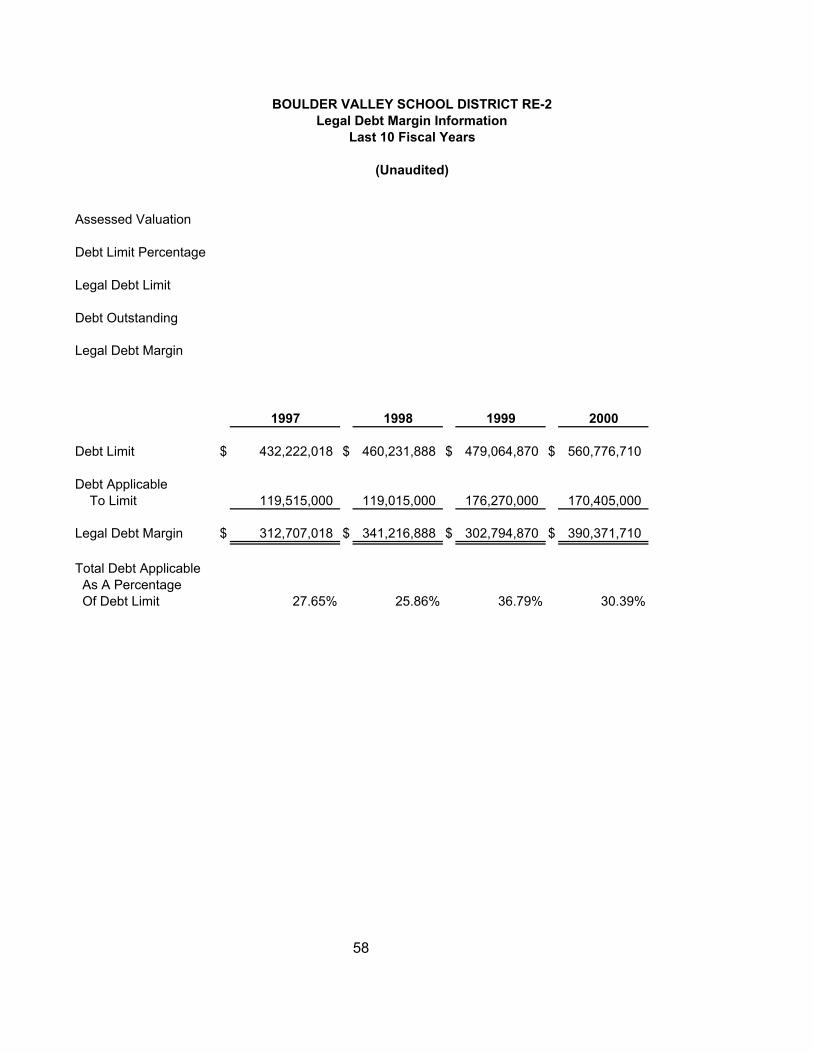
Assessed Valuation
Debt Limit Percentage
Legal Debt Limit
Debt Outstanding
Legal Debt Margin
1997 1998 1999 2000
Debt Limit $ 432,222,018 $ 460,231,888 $ 479,064,870 $ 560,776,710
Debt Applicable To Limit 119,515,000 119,015,000 176,270,000 170,405,000
Legal Debt Margin $ 312,707,018 $ 341,216,888 $ 302,794,870 $ 390,371,710
Total Debt Applicable As A Percentage Of Debt Limit 27.65% 25.86% 36.79% 30.39%
58
BOULDER VALLEY SCHOOL DISTRICT RE-2Legal Debt Margin Information
Last 10 Fiscal Years
(Unaudited)

Table 9
$ 4,154,385,863
20.00%
830,877,173
133,250,000
$ 697,627,173
2001 2002 2003 2004 2005 2006
$ 592,707,062 $ 756,657,718 $ 771,327,974 $ 796,541,845 $ 796,554,878 $ 830,877,173
165,070,000 159,500,000 153,515,000 147,065,000 140,310,000 133,250,000
$ 427,637,062 $ 597,157,718 $ 617,812,974 $ 649,476,845 $ 656,244,878 $ 697,627,173
27.85% 21.08% 19.90% 18.46% 17.61% 16.04%

BOULDER VALLEY SCHOOL DISTRICT RE-2Demographic and Economic Statistics
Last 10 Fiscal Years
(Unaudited)
Table 10
*Personal *Per CapitaFiscal *Estimated Income(1) Personal **Enrollment *Unemployment Year Population(1) (millions) Income(1) (Student FTE) Rate(1)
1997 251,609 7,979 31,711 24,582.0 2.961%1998 257,901 8,734 33,866 25,073.5 3.106%1999 264,927 9,610 36,269 25,732.5 2.812%2000 271,815 11,062 40,695 25,942.5 2.345%2001 276,711 11,312 40,883 26,311.5 3.495%2002 278,048 11,230 40,390 26,703.0 5.885%2003 277,813 11,399 41,034 26,629.5 5.809%2004 279,227 11,994 42,955 26,643.5 4.924%2005 281,195 12,765 45,394 26,789.5 4.402%2006 283,644 13,550 47,770 26,739.5 4.009%
Source: * Global Insight Inc.** Boulder Valley School District RE-2
Note: (1) Amounts are for the Boulder, CO Metropolitan Statistical Area
59

BOULDER VALLEY SCHOOL DISTRICT RE-2Computation of Direct and Overlapping Debt
June 30, 2006
(Unaudited)
Table 11
Percentage Amount ofOutstanding Applicable Outstanding Debt
General to the Applicable toObligation Debt District the District
Direct Debt (1)Boulder Valley School District RE-2 133,250,000$ 100.00% 133,250,000$
Overlapping Debt (2)City of Louisville 12,790,000 100.00% 12,790,000 City of Lafayette 13,930,000 100.00% 13,930,000 City and County of Broomfield 3,130,000 15.00% 469,500 Boulder Central Area General Improvement District 24,955,000 100.00% 24,955,000 Colorado Tech Center Metropolitan District 10,390,000 100.00% 10,390,000 Lafayette City Center Improvement District 2,040,000 100.00% 2,040,000 Lafayette Corporate Campus 2,660,000 100.00% 2,660,000 Lafayette Tech Center Improvement District 700,000 100.00% 700,000 Mountain View Fire Protection District 520,000 10.00% 52,000 Nederland Fire Protection District 1,490,000 100.00% 1,490,000 Pine Brook Water District 5,260,000 100.00% 5,260,000 Superior/McCaslin Interchange District 5,200,000 100.00% 5,200,000 Superior Metropolitan District #1 33,315,000 100.00% 33,315,000 Superior Metropolitan District #2 6,740,000 100.00% 6,740,000 Superior Metropolitan District #3 3,215,000 100.00% 3,215,000 Town of Nederland 2,030,687 100.00% 2,030,687
(1) Balance as of June 30, 2006
(2) Balances as of December 31, 2005
Source: Boulder Vallley School District RE-2 and individual entities
60

BOULDER VALLEY SCHOOL DISTRICT RE-2Principal Property Taxpayers
January 1, 2006 and 9 Years Ago
(Unaudited)
Table 12
Percentage of Percentage ofAssessed Total Assessed Assessed Total Assessed
Taxpayer Rank Valuation Valuation Rank Valuation Valuation
Xcel Energy 1 64,779,350$ 1.56%
Flatirons Holding LLC 2 45,037,420 1.08%
Roche Colorado Corporation 3 31,664,380 0.76%
Level 3 Communications 4 31,253,737 0.75%
IBM Corp. 5 29,541,870 0.71% 3 35,764,980$ 1.68%
Qwest Communications 6 27,575,700 0.66%
Sun Microsystems Inc. 7 16,981,740 0.41%
DDR Flatirons LLC 8 14,214,820 0.34%
Storage Technology Corp. 9 13,289,280 0.32% 1 40,016,090 1.88%
Flatirons Property Holding LLC 10 13,192,940 0.32%
Public Service Company of Colorado 2 39,331,350 1.85%
U.S. West Communications 4 28,851,400 1.36%
Macerich Partnership 5 16,850,610 0.79%
Ball Corp. 6 11,269,580 0.53%
Syntex Chemical Inc. 7 10,442,760 0.49%
Valleylab Inc. 8 8,936,110 0.42%
Connecticut National 9 8,246,900 0.39%
STC Real Estate Co. 10 8,017,060 0.38%Sub-total 26,482,220 0.64% 171,961,860 8.09%
Remaining Assessed Valuation 4,127,903,643 99.36% 1,953,383,250 91.91%
Total Assessed Valuation 4,154,385,863$ 100.00% 2,125,345,110$ 100.00%
61
2006 1997

Table 13
2001 2002 2003 2004 2005 2006Administrators
Superintendent 1.00 1.00 1.00 1.00 1.00 1.00Assistant Superintendent 6.00 8.00 7.00 7.70 6.80 5.00Non-Instructional Director 16.70 18.30 17.60 18.70 18.20 21.40Instructional Director 11.30 11.00 11.40 10.00 9.00 13.90Principal 46.40 51.80 55.20 49.40 49.60 53.60Assistant Principal 32.40 33.70 35.60 35.90 37.60 35.60Instructional Program Coord. 0.00 0.00 0.00 6.80 1.00 2.40
Sub-total 113.80 123.80 127.80 129.50 123.20 132.90
Professional-InstructionalTeacher, Regular 1,367.50 1,472.20 1,482.10 1,420.50 1,465.40 1,460.20Teacher, Special Education 201.10 211.10 204.40 189.40 199.40 199.00Teacher, Title I 20.90 22.10 25.70 19.50 11.80 15.40Counselor 49.60 46.10 54.20 54.80 55.40 56.40Curriculum Specialist Consultant 6.40 8.60 7.80 8.00 6.50 7.80Dean 1.00 0.00 1.30 2.10 1.60 3.40Instructional Program Consultant 0.00 0.00 0.00 8.70 1.00 0.80Librarian/Media Consultant 38.60 36.00 38.10 39.30 40.10 41.70Teacher Mentor 41.10 32.20 30.70 36.40 40.60 45.70Audiologist 2.00 2.00 2.60 2.00 2.00 2.00Registered Nurse 10.20 9.40 11.00 10.90 13.50 13.40Occupational Therapist 12.40 12.10 13.50 14.90 14.60 14.10Physical Therapist 1.40 1.80 1.80 1.80 1.80 1.90Psychologist 18.80 17.90 20.60 20.70 21.10 23.30Social Worker 18.70 17.70 20.30 20.60 22.00 22.30Speech-Language Pathologist 28.60 31.50 32.70 31.70 34.00 34.90
Sub-total 1,818.30 1,920.70 1,946.80 1,881.30 1,930.80 1,942.30
Professional-Other 66.80 94.20 85.30 97.80 87.60 107.10
Paraprofessionals 533.70 522.50 542.80 666.90 666.40 674.60
Office/Administrative Support 274.20 289.20 297.90 261.30 261.80 265.10
Crafts, Trades, and ServicesBus Driver 128.80 123.00 128.50 133.50 163.20 152.10Food Service Worker 63.80 79.90 72.00 48.60 55.70 44.60Custodian 147.90 159.20 165.60 152.70 152.60 155.70Mantenenace Workers 128.00 107.80 109.40 136.20 131.30 125.60
Sub-total 468.50 469.90 475.50 471.00 502.80 478.00
Total 3,275.30 3,420.30 3,476.10 3,507.80 3,572.60 3,600.00
* Amounts prior to 2001 are not available
SOURCE: Boulder Valley School District RE-2
62
BOULDER VALLEY SCHOOL DISTRICT RE-2District Employees-Full Time Equilivents
Last 6 Fiscal Years*
(Unaudited)

BOULDER VALLEY SCHOOL DISTRICT RE-2Principal Employers
January 1, 2006 and 9 Years Ago
(Unaudited)
Table 14
Percentage of Percentage ofNumber of Total County Number of Total County
Employer Rank Employees Employment Rank Employees Employment
University of Colorado Boulder Campus 1 7,500 4.61% 1 5,657 3.66%
Sun Microsystems, Inc. 2 4,700 2.89% 0.00%
IBM Corp. 3 4,200 2.58% 4 2,900 1.87%
Boulder Valley School District RE-2 4 4,200 2.58% 3 3,062 1.98%
Level 3 Communications, Inc. 5 2,000 1.23% 0.00%
Ball Corp. 6 3,100 1.90% 7 1,500 0.97%
Walmart 7 1,340 0.82%
Seagate Technology 8 1,300 0.80% 0.00%
Safeway 9 1,245 0.76%
Valleylab Inc. 10 1,100 0.68% 10 900 0.58%
Storage Technology Corp. 0.00% 2 3,400 2.20%
Neodata Services 0.00% 5 2,700 1.74%
Boulder Community Hospital 0.00% 6 1,600 1.03%
Boulder County 0.00% 8 1,200 0.78%
City of Boulder 0.00% 9 1,120 0.72%
Sub Total 30,685 18.85% 24,039 15.53%
Other Employers 132,117 81.15% 130,702 84.47%
Total 162,802 100.00% 154,741 100.00%
Source: Boulder County Business Report and Individual Entities
63
2006 1997

-6:4/07 ;,440< 8.2664 /38973.9 70:'8@EJJG -NFGAFID 3ICJKH>MFJI
4>LM &h 1FL@>G <B>KL
.:I>NAFMBA/
=8=@E=J=J=& =&+=+=) =&+=+=* =&+=+=+ ='h=h=h ='h=h=&0GBHBIM>KP 8@EJJGLDZyvyhA &glhy'
bxZhyl Ill• 5.)325 5.)325 5.)325 5.)325 .Fhwhjp•] I> uh uh 33B .Huyvsstlu• 1A5 12B 1A. 23A .
Elhy Fyllr &glhy'bxZhyl Ill• 2C)53C 2C)53C 2C)53C 2C)53C 2C)53CFhwhjp•] uh uh uh 3.2 3.5Huyvsstlu• 213 23C 23A 230 2:1
Epyjo&glhy'bxZhyl Ill• 31):C3 31):C3 31):C3 31):C3 33)A03Fhwhjp•] uh uh uh 520 520Huyvsstlu• 3A3 3A3 351 35. 320
EFbOb&glhy'bxZhyl Ill• . . 3)AC0 5)B0: 15)C11Fhwhjp•] . . uh 022 0C.Huyvsstlu• . . 001 01B 0:.
Fvhs Fyllr &glhy'bxZhyl Ill• 52)C0: 52)C0: 52)C0: 52)C0: 52)C0:Fhwhjp•] uh uh uh 5B: 55CHuyvsstlu• 5C2 5:0 530 5:0 552
FvsZtipul &glhy'bxZhyl Ill• 3B).AB 3B).AB 3B).AB 3B).AB 3B).ABFhwhjp•] uh uh uh 2CA 2C5Huyvsstlu• 2B3 2A2 2A3 23B 250
FvttZup•] Tvu•lzzvyp &glhy'bxZhyl Ill• 31)5B2 31)5B2 31)5B2 31)5B2 31)5B2Fhwhjp•] uh uh uh 001 0.3Huyvsstlu• 0.2 01. 01: 02: 03C
Fyllrzpkl &glhy'bxZhyl Ill• . . . . 3:)CA:Fhwhjp•] . . . . 3.1Huyvsstlu• . . . . 21A
Fylz• epl\ &glhy'bxZhyl Ill• 52)B20 52)B20 52)B20 52)B20 55)..AFhwhjp•] uh uh uh ::A :03Huyvsstlu• 3A. 500 55. 52B 50A
GvZnshzz&glhy'bxZhyl Ill• 3C)32B 3C)32B 3C)32B 3C)32B 53)AA1Fhwhjp•] uh uh uh 3A5 3A5Huyvsstlu• 2:1 30A 350 332 352
Hpzluov\ly &glhy'bxZhyl Ill• 51)51: 51)51: 51)51: 51)51: 52):.0Fhwhjp•] uh uh uh :00 :00Huyvsstlu• 5.B 3C3 3C0 33A 351
Htlyhsk &glhy'bxZhyl Ill• 5:)2.. 5:)2.. 5:)2.. 5:)2.. 5:)2..Fhwhjp•] uh uh uh :05 55AHuyvsstlu• 5B: :03 :.A 5:1 3:3
Ipylzpkl&glhy'bxZhyl Ill• :.)2.A :.)2.A :.)2.A :.)2.A :.)2.AFhwhjp•] uh uh uh 555 55AHuyvsstlu• ::3 522 51: 3C1 520
:3

9>?GB &(
OA'O'OA V0~V~I OA'O'OE OA'O'OI OA'O'ON
. . . . .
. . . . .
. . . . .
2C)53C 2C)53C 2C)53C 2C)53C 2C)53C2A: 2AC 20. 25. 2A.230 22: 232 22A 23B
33)A03 33)A03 33)A03 33)A03 33)A03520 5.1 33. 32B 3:22AB 2C0 3.. 3.2 3.C
15)C11 15)C11 15)C11 15)C11 15)C11110 100 10. 12. 12.1.. 10A 11C 15C 1B5
52)C0: 52)C0: 52)C0: 52)C0: 52)C0:55A 555 3A2 3:. 3:.52C 513 52A 500 3C0
3B).AB 3B).AB 3B).AB 3B).AB 3B).AB3CC 3CC 230 251 302225 2.5 201 23: 2B3
31)5B2 31)5B2 31)5B2 31)5B2 31)5B2033 033 01: 03. 0B.053 052 03B 03B 0C2
3:)CA: 3:)CA: 3:)CA: 3:)CA: 3:)CA:35. 30: 2.B 1BC 20:251 2.C 1C2 1B5 1:C
55)..A 55)..A 55)..A 55)..A 55)..A3C2 3C2 2B5 3B5 50.5.0 3A2 3C1 3C3 5.0
53)AA1 53)AA1 53)AA1 53)AA1 53)AA1350 350 30. 325 32533A 3:C 3A: 3B1 3:C
52):.0 52):.0 52):.0 52):.0 52):.0:00 :00 53B 53B 5..31: 311 31. 32: 33C
5:)2.. 5:)2.. 5:)2.. 5:)2.. 5:)2..55A 5B5 31. 2B3 2AA350 300 2B1 2B3 2A:
:.)2.A :.)2.A :.)2.A :.)2.A :.)2.A555 5.3 33. 3:5 3:.3C1 332 30: 353 33C

-6:4/07 ; ,440< 8.2664 /38973.9 70:'8@EJJG -NFGAFID 3ICJKH>MFJI
4>LM &h 1FL@>G <B>KL
.:I>NAFMBA/
=8=@E=J=J=& =&+=+=) =&+=+=* =&+=+=+ ='h=h=h ='h=h=&Ish•pyvuz &glhy'
bxZhyl Ill• 22)3:C 22)3:C 22)3:C 22)3:C 22)3:CFhwhjp•] uh uh uh 211 1:3Huyvsstlu• 152 15A 155 1:5 1:.
Ivv•opss &glhy'bxZhyl Ill• 5A)B0C 5A)B0C 5A)B0C 5A)B0C 5A)B0CFhwhjp•] uh uh uh 503 3B5Huyvsstlu• 531 500 3CC 3:5 321
Jvsk 2FGG &glhy'bxZhyl Ill• 2)20: 2)20: 2)20: 2)20: 2)20:Fhwhjp•] uh uh uh 50 50Huyvsstlu• 23 1A 2. 23 2.
Mlh•oly\vvk &glhy'bxZhyl Ill• 50).C1 50).C1 50).C1 50).C1 51).0:Fhwhjp•] uh uh uh 515 3:CHuyvsstlu• 3A0 330 32: 30A 2BA
2FDE Wlhrz &glhy'bxZhyl Ill• 00)3CA 00)3CA 00)3CA 00 )3CA 13)510Fhwhjp•] uh uh uh 1:3 21:Huyvsstlu• 051 10: 12: 15C 1B0
Phtlz•v\u &glhy'bxZhyl Ill• 5).2. 5).2. 5).2. 5).2. 5).2.Fhwhjp•] uh uh uh 2A 1AHuyvsstlu• 2. 1C 11 25 0A
Rvos &glhy'bxZhyl Ill• 51)A35 51)A35 51)A35 51)A35 53)002Fhwhjp•] uh uh uh ::3 5.3Huyvsstlu• :A1 A.5 :C: :A: 3A.
Shmh]l••l &glhy'bxZhyl Ill• 50)0.C 50)0.C 50)0.C 50)0.C 5:)A:3Fhwhjp•] uh uh uh 5AC 3.BHuyvsstlu• 3:C 3A. 3C. 3B0 310
SvZpz[pssl &glhy'bxZhyl Ill• 3:)5A5 3:)5A5 3:)5A5 3:)5A5 5A).0BFhwhjp•] uh uh uh 5:1 5:1Huyvsstlu• 551 5A3 :.. 5A. 3BA
Thqlz•pj Mlpno•z &glhy'bxZhyl Ill• 1C)BC3 1C)BC3 1C)BC3 1C)BC3 .Fhwhjp•] uh uh uh 0:. .Huyvsstlu• 12C 133 05A 002 .
Thwsl•vu &glhy'bxZhyl Ill• 10)2BA 10)2BA 10)2BA 10)2BA 10)2BAFhwhjp•] uh uh uh 0BC 0B3Huyvsstlu• 0A3 0:A 053 05B 053
Thy•pu Whyr &glhy'bxZhyl Ill• 35)::5 35)::5 35)::5 35)::5 .Fhwhjp•] uh uh uh 115 .Huyvsstlu• 130 0CA 0B. 02A .
Tlzh &glhy'bxZhyl Ill• 35):A. 35):A. 35):A. 35):A. 35):A.Fhwhjp•] uh uh uh 3.2 23CHuyvsstlu• 23. 22C 20A 23C 25A
:5

9>?GB &(.@JIMFINBA/
OA'O'OA OA'O'OD OA'O'OE OA'O'OI OA'O'ON
22)3:C 22)3:C 22)3:C 22)3:C 22)3:C123 12A 2.. 1C5 20515A 130 2.A 1CA 1CB
5A)B0C 5A)B0C 5A)B0C 5A)B0C 5A)B0C5.3 5.3 325 33. 3B530: 30C 32. 3:2 3B:
2)20: 2)20: 2)20: 2)20: 2)20:50 50 30 30 3023 22 2A 23 1:
51).0: 51).0: 51).0: 51).0: 51).0:313 310 20: 201 20C2:2 221 25. 221 212
13)510 13)510 13)510 13)510 13)5102.A 13B 13. 13. 1BA1AA 1AB 1AC 1C: 1CC
5).2. 5).2. 5).2. 5).2. 5).2.1A 1A 0B 0B 0B0A 0B 11 01 05
53)002 53)002 53)002 53)002 53)0025.C 5.C 3B. 3B. 3:.3:A 335 32A 331 3:A
5:)A:3 5:)A:3 5:)A:3 5:)A:3 5:)A:33.B 2B0 1C: 1CB 1CB2C3 2BA 220 222 252
5A).0B 5A).0B 5A).0B 5A).0B 5A).0B5:. 5.3 3:. 3:. 3:.35B 32. 33. 321 3.3
. . . . .
. . . . .
. . . . .
10)2BA 10)2BA . . .0B3 0B3 . . .033 01B . . .
. . . . .
. . . . .
. . . . .
35):A. 35):A. 35):A. 35):A. 35):A.23C 23C 20. 22. 20525A 23A 23B 23: 20C

-6:4/07 ;,440< 8.2664 /38973.9 70:'8@EJJG -NFGAFID 3ICJKH>MFJI
4>LM &h 1FL@>G <B>KL
.:I>NAFMBA/
=8@=E=J=JG =&+=+=) =&+=+=* =&+=+=+ ='h=h=h ='h=h=&Vlklyshuk &glhy'
bxZhyl Ill• :0)3A. :0)3A. :0)3A. :0)3A. :0)3A.Fhwhjp•] uh uh uh 3:B 333Huyvsstlu• 35B 3.. 252 2:2 1BC
Wpvully &glhy'bxZhyl Ill• A1)2CB A1)2CB A1)2CB A1)2CB A1)2CBFhwhjp•] uh uh uh 310 2A3Huyvsstlu• 2.: 1C0 1BA 203 1C.
a]hu &glhy'bxZhyl Ill• 3C)0A: 3C)0A: 3C)0A: 3C)0A: 3C)0A:Fhwhjp•] uh uh uh 5B3 5.3Huyvsstlu• 5.2 3CB 521 5.2 3AB
bhujol^ &glhy'bxZhyl Ill• 3C)BBA 3C)BBA 3C)BBA 3C)BBA 3C)BBAFhwhjp•] uh uh uh 2CC 3.2Huyvsstlu• 21: 21B 2.C 21. 255
bZwlypvy &glhy'bxZhyl Ill• :C)A:5 :C)A:5 :C)A:5 :C)A:5 :C)A:5Fhwhjp•] uh uh uh 5AA 552Huyvsstlu• 3.. 55: :B2 ::: :.2
dup[lyzp•] Mpss&glhy'bxZhyl Ill• :3)CC2 :3)CC2 :3)CC2 :3)CC2 :B):C:Fhwhjp•] uh uh uh 30: 3:1Huyvsstlu• 2C1 3.0 2C: 2B3 2CA
fhzopun•vu &glhy'bxZhyl Ill• 1C)C5C 1C)C5C 1C)C5C 1C)C5C 1C)C5CFhwhjp•] uh uh uh 233 233Huyvsstlu• 1B5 1BA 1B2 1C0 1CC
fop••ply &glhy'bxZhyl Ill• 25)011 25)011 25)011 25)011 25)011Fhwhjp•] uh uh uh 21. 1:3Huyvsstlu• 1B. 1A5 1:. 12: 121
5FAAGB 8@EJJGLDunl[pul &glhy'
bxZhyl Ill• 010):A: 010):A: 010):A: 010):A: 010):A:Fhwhjp•] uh uh uh C.1 C1:Huyvsstlu• AA: A05 A11 A55 A21
Ehzspul &glhy'bxZhyl Ill• A5).30 A5).30 A5).30 A5).30 A:)::BFhwhjp•] uh uh uh 3BB 51AHuyvsstlu• 32C 31: 333 3A3 3B3
Eyvvtmplsk Mlpno•z &glhy'bxZhyl Ill• 0.A)2B5 0.A)2B5 0.A)2B5 0.A)2B5 0.A)2B5Fhwhjp•] uh uh uh BC0 BC0Huyvsstlu• C55 0.0. C:. C:: :1C
EZyihur &glhy'bxZhyl Ill• B2)5A1 B2)5A1 B2)5A1 B2)5A1 B2)5A1Fhwhjp•] uh uh uh 3C3 3C3Huyvsstlu• 3B3 2B3 23C 23C 2.3
Fhzl] &glhy'bxZhyl Ill• B3)..A B3)..A B3)..A B3)..A B3)..AFhwhjp•] uh uh uh 5:2 5:2Huyvsstlu• 3B1 30. 2AB 22A 223
::

9>?GB &(.@JIMFINBA/
OA'O'OA OA'O'OD OA'O'OE OA'O'OI OA'O'ON
:0)3A. :0)3A. :0)3A. :0)3A. :0)3A.30B 2C. 235 221 23520. 201 2.1 220 20A
A1)2CB A1)2CB A1)2CB A1)2CB A1)2CB332 332 255 21C 230211 22C 25: 2C: 3.3
3C)0A: 3C)0A: 3C)0A: 3C)0A: 3C)0A:5.: 3AC 2:C 2:2 25.310 300 2C. 2B2 2C.
3C)BBA 3C)BBA 3C)BBA 3C)BBA 3C)BBA2A0 311 2.0 1AB 20:23: 1C: 1BB 1:1 1B.
:C)A:5 :C)A:5 :C)A:5 :C)A:5 :C)A:53C5 513 3B. 5.. 5..5AA 5A. 5BC :.. :1C
:B):C: :B):C: :B):C: :B):C: :B):C:3:A 3:A 50. 3C1 20323: 22: 5.2 2C0 2.A
1C)C5C 1C)C5C . . .233 233 . . .1C0 1B5 . . .
25)011 25)011 25)011 25)011 25)0111C0 1C0 2.. 21. 2..13A 12C 2.2 21B 20C
010):A: 010):A: 010):A: 010):A: 010):A:CA0 CA0 B:1 C.1 B:2A.C :5. ::B :0: 5BA
A:)::B A:)::B . . .525 552 . . .355 30: . . .
0.A)2B5 0.A)2B5 0.A)2B5 0.A)2B5 0.A)2B5C25 C25 C25 C03 C035A0 5A1 550 5:1 555
B2)5A1 B2)5A1 . . .5.2 5.2 . . .201 15B . . .
B3)..A B3)..A B3)..A B3)..A B3)..A:2: 5B1 5B1 :01 :0125A 20A 230 2:0 2::

-6:4/07 ;,440< 8.2664 /38973.9 70:'8@EJJG -NFGAFID 3ICJKH>MFJI
4>LM &h 1FL@>G <B>KL
.:I>NAFMBA/
=8@=E=J=JG =&+=+=) =&+=+=* =&+=+=+ ='h=h=h ='h=h=&Flu•luuphs &glhy'
bxZhyl Ill• B:)5:3 B:)5:3 CC)55: CC)55: CC)55:Fhwhjp•] uh uh uh A51 A.BHuyvsstlu• :.2 :11 :3B :A5 :BB
Mhsj]vu &glhy'bxZhyl Ill• B)A2: B)A2: B)A2: B)A2: B)A2:Fhwhjp•] uh uh uh uh uhHuyvsstlu• 1. 0B 02 05 05
SvZpz[pssl&glhy'bxZhyl Ill• B3)C02 B3)C02 B3)C02 B3)C02 BB)BBAFhwhjp•] uh uh uh 5:2 :30Huyvsstlu• B20 5C2 :C2 :AA :5:
Thuoh••hu( &glhy'bxZhyl Ill• . . . . .Fhwhjp•] . . . . .Huyvsstlu• . . . . .
Wsh••&glhy'bxZhyl Ill• 00A)5A2 00A)5A2 00A)5A2 00A)5A2 00A)5A2Fhwhjp•] uh uh uh A:C B02Huyvsstlu• :55 :1C :3. :15 :12
bvZ•olyu Mpssz&glhy'bxZhyl Ill• A1)1:. A1)1:. A1)1:. A1)1:. A1)1:.Fhwhjp•] uh uh uh 3.5 535Huyvsstlu• 25A 2B2 3.2 31. 3:5
2F-&E 8@EJJGLEvZskly &glhy'
bxZhyl Ill• 112):05 112):05 112):05 112):05 11C)1B0Fhwhjp•] uh uh uh 1..B 1.01Huyvsstlu• 0C23 0BA: 0B2A 0ABC 0B.:
Eyvvtmplsk &glhy'bxZhyl Ill• 1.2)5B. 1.2)5B. 1.2)5B. 1.2)5B. 10B)0:2Fhwhjp•] uh uh uh 05A2 05B2Huyvsstlu• 010C 01CA 0220 021. 0235
Flu•hZyZz &glhy'bxZhyl Ill• 0BA)3:: 0BA)3:: 0BA)3:: 0BA)3:: 0C.):0.Fhwhjp•] uh uh uh 0:0: 0A12Huyvsstlu• 0B.: 0AAB 032A 01B2 0001
Ihpy[pl\ &glhy'bxZhyl Ill• 15:)2C1 15:)2C1 15:)2C1 15:)2C1 15:)2C1Fhwhjp•] uh uh uh 0CA3 0C31Huyvsstlu• 0ABB 0C23 0C52 0C.2 0C23
Tvuhyjo &glhy'bxZhyl Ill• . . 11B)B1A 11B)B1A 11B)B1AFhwhjp•] . . uh 0A0: 0A5CHuyvsstlu• . . :11 0.35 031A
Vl\ epz•h &glhy'bxZhyl Ill• 31)5B2 31)5B2 31)5B2 31)5B2 31)5B2Fhwhjp•] uh uh uh 231 231Huyvsstlu• 200 225 22A 230 230
:A

9>?GB &(.@JIMFINBA/
OA'O'OA OA'O'OD OA'O'OE OA'O'OI OA'O'ON
CC)55: CC)55: CC)55: CC)55: CC)55:A5. A5. A5. A5. A5.:AA :3B :30 5C: 5BB
B)A2: B)A2: B)A2: B)A2: B)A2:#" #" #" #" #"
0: 02 05 01 03
BB)BBA BB)BBA BB)BBA BB)BBA BB)BBA:AA :C5 :A2 :50 :50:.0 5A5 53A 530 53:
. . B2)5A1 B2)5A1 B2)5A1
. . 5C. 5AC :.5
. . 5BA 33C 332
00A)5A2 00A)5A2 00A)5A2 00A)5A2 00A)5A2B01 AC. A1C A1C A.A5:: 52. 51C 513 520
A1)1:. A1)1:. A1)1:. A1)1:. A1)1:.52C 52C 5.2 5.2 5.23A: 3B. 512 52A 5.2
11C)1B0 11C)1B0 11C)1B0 11C)1B0 11C)1B01.05 1.05 1.05 1.05 0CC30BA: 0C0C 0C1C 0CA. 0C21
10B)0:2 10B)0:2 10B)0:2 10B)0:2 10B)0:205:5 05:5 05C2 05CC 05CC0212 022A 0210 02A5 0302
0C.):0. 0C.):0. 0C.):0. 0C.):0. 0C.):0.0:51 0:2B 0:0: 052. 0:.A00.B 0.:. 0..2 CC. CC:
15:)2C1 15:)2C1 15:)2C1 15:)2C1 15:)2C10BBC 0BBC 0B:0 0B:0 0B:00C2A 0C0: 0BB. 0BC0 0BA0
11B)B1A 11B)B1A 11B)B1A 11B)B1A 11B)B1A0A1B 0A1B 0A1B 0A1B 0A1B05:2 05A: 0:1: 0:AC 0:22
31)5B2 31)5B2 A:)::B A:)::B A:)::B231 231 235 :2A :5C225 233 221 230 22C

-6:4/07 ;,440< 8.2664 /38973.9 70:'8@EJJG -NFGAFID 3ICJKH>MFJI
4>LM &h 1FL@>G <B>KL
.:I>NAFMBA/
=8=@E=J=J=& =&+=+=) =&+=+=* =&+=+=+ ='h=h=h ='h=h=&
.JH?FI>MFJI 8@EJJGDzwlu Fyllr R,B &glhy'
bxZhyl Ill• . . . . 003)3ABFhwhjp•] . . . . 00CCHuyvsstlu• . . . . A01
HskvyhkvR,B &glhy'bxZhyl Ill• . . . . 00A)22:Fhwhjp•] . . . . 00:0Huyvsstlu• . . . . 511
Tvuhyjo R,B &glhy'bxZhyl Ill• . 0.3)A33 0.B)B.1 0.B)B.1 0.B)B.1Fhwhjp•] . B1C B1C B1C B52Huyvsstlu• . :C. B.2 BC2 A51
Vlklyshuk Tpkksl-blupvy &glhy'bxZhyl Ill• CA).B. CA).B. CA).B. CA).B. CA).B.Fhwhjp•] uh uh uh ::2 55AHuyvsstlu• 2BB 2A3 2B. 25A 2CB
;J@>MFJI>GJ9B@EIF@>G 8@EJJGLDzyhwhovl apknl huk cljoupjhs HkZjh•pvu Flu•ly &glhy'
bxZhyl Ill• 01C)5AC 01C)5AC 01C)5AC 01C)5AC 01C)5ACFhwhjp•] uh uh uh CB0 C.3Huyvsstlu• 0.0 01C 0B0 0A. 02C
.E>KMBK 8@EJJGLEvZskly WylwMpnobjovvs &glhy'
bxZhyl Ill• . . 2)5.. 2)5.. 2)5..Fhwhjp•] . . uh uh uhHuyvsstlu• . . 21 30 33
Mvyp^vuzR,B bjovvs &glhy'bxZhyl Ill• 2.)B03 2.)B03 2.)B03 2.)B03 2.)B03Fhwhjp•] uh uh uh 202 202Huyvsstlu• 1AB 1B3 2.A 1CA 2.:
Wlhr cv Wlhr R,01 bjovvs &glhy'bxZhyl Ill• . . . . C)...Fhwhjp•] . . . . uhHuyvsstlu• . . . . 0C5
bZttp• Tpkksl bjovvs &glhy'bxZhyl Ill• A)0:5 A)0:5 A)0:5 A)0:5 1C)BC3Fhwhjp•] uh uh uh 10A 1A0Huyvsstlu• 150 1A. 153 152 15B
bvqvZyuly R,B &glhy'bxZhyl Ill• . . . uh uhFhwhjp•] . . . uh uhHuyvsstlu• . . . 25 :.
49

OA'O'OA OA'O'OD OA'O'OE OA'O'OI
9>?GB &(.@JIMFINBA/
OA'O'ON
003)3AB 003)3AB 003)3AB 003)3AB 003)3ABCAB CC5 C3B C:C C:CAC0 ABA B0A BA. BA5
00A)22: 00A)22: 00A)22: 00A)22: 00A)22:C3: C:: BCC C31 BA:AC: B:C C5: C2B C25
0.B)B.1 0.B)B.1 0.B)B.1 0.B)B.1 0.B)B.1B.B AB1 A3: A52 A52:AA :A0 A0C A.C :C:
CA).B. CA).B. CA).B. CA).B. CA).B.:5. :5. :5. :5. :5.3.A 311 2BA 2BA 2C0
01C)5AC 01C)5AC 01C)5AC 01C)5AC 01C)5ACC.3 C.3 BB1 BA: B1.02B 02B 2.B 1B0 1AC
:)... :)... :)... :)... :)...#" #" #" #" #"
:A AB B3 BB 0.2
2.)B03 2.)B03 2.)B03 2.)B03 2.B033.2 3.2 22. 250 205202 21. 2.C 2.C 210
20)... 0.3)2:5 0.3)2:5 00:):AC 00:):AC#" #" #" #" #":.: 0.1A 00.A 00A5 012:
1C)BC3 1C)BC3 1C)BC3 1C)BC3 1C)BC321. 21. 1AB 22A 22A2.3 2.2 2.B 2.C 2.A
#" #" . . .#" #" . . .
52 23 . . .

1997 1998 1999 2000 2001Student Full Time Equivalent
Elementary 10,977.0 11,162.0 11,362.5 11,196.5 11,211.5 Middle 6,142.0 6,264.0 6,404.0 6,529.0 6,647.5 Senior 7,279.0 7,480.5 7,764.0 8,002.5 8,256.5 Other 184.0 167.0 202.0 214.5 196.0
Total 24,582.0 25,073.5 25,732.5 25,942.5 26,311.5
Total EnrollmentK-12 Enrollment 25,440.0 25,964.0 26,618.0 26,729.0 27,204.0 Pre-K Enrollment 256.0 246.0 300.0 311.0 296.0
Total 25,696.0 26,210.0 26,918.0 27,040.0 27,500.0
Source: Boulder Valley School District RE-2
69
Boulder Valley School District RE-2Enrollment Data
Last 10 School Years
(Unaudited)

Table 16
2002 2003 2004 2005 2006
11,218.0 11,019.5 10,888.5 10,950.0 10,921.5 6,800.0 6,733.5 6,731.0 6,528.5 6,420.5 8,451.0 8,643.0 8,811.0 9,102.5 9,146.0
234.0 233.5 213.0 208.5 251.5 26,703.0 26,629.5 26,643.5 26,789.5 26,739.5
27,609.0 27,493.0 27,604.0 27,651.0 27,593.0 315.0 314.0 256.0 271.0 329.0
27,924.0 27,807.0 27,860.0 27,922.0 27,922.0

'$&V%I ~)0$(

5MZ\QN;MLA]JTQK 3KKW]V\IV\[
4WIZL WN7L]KI\QWV4W]TLMZGITTMa DKPWWT 6Q[\ZQK\ C7%)4W]TLMZ$5WTWZILW
;?67A7?67?E 3F6;E@CD0 C7A@CE @? ;?E7C?3= 5@?EC@= @G7C8;?3?5;3=C7A@CE;?9 3?6 @? 5@>A=;3?57 3?6 @E:7C >3EE7CD43D76 @? 3?3F6;E @8 8;?3?5;3=DE3E7>7?ED A7C8@C>76 ;?
355@C63?57 H;E: SitGngeGgr <sAaragS or<gA<nAo
HM PI^M I]LQ\ML\PM NQVIVKQIT [\I\MUMV\[ WN \PM WN \PM 4W]TLMZGITTMa DKPWWT 6Q[\ZQK\ C7%) I[ WN IVLNWZ \PM aMIZMVLML<]VM*'$ )''-$ IVL PI^M Q[[]ML W]Z ZMXWZ\ \PMZMWV LI\ML @K\WJMZ -$ )''-& HM KWVL]K\ML W]Z I]LQ\ QVIKKWZLIVKM _Q\P I]LQ\QVO[\IVLIZL[OMVMZITTaIKKMX\ML QV\PM FVQ\ML D\I\M[ WN3UMZQKI IVL\PM [\IVLIZL[ IXXTQKIJTM\W NQVIVKQIT I]LQ\[ KWV\IQVML QVS?E8A>=8>C <D7;C;>: oCu>7uA7B~ Q[[]ML Ja \PM 5WUX\ZWTTMZ 9MVMZIT WN \PM FVQ\MLD\I\M[&
;V\MZVIT5WV\ZWT@^MZ 8QVIVKQITCMXWZ\QVO;VXTIVVQVOIVLXMZNWZUQVO W]Z I]LQ\$ _M KWV[QLMZML\PM 4W]TLMZGITTMa DKPWWT 6Q[\ZQK\ C7% )0[ QV\MZVITKWV\ZWT W^MZNQVIVKQITZMXWZ\QVO QVWZLMZ\W LM\MZUQVM W]Z I]LQ\QVO XZWKML]ZM[ NWZ \PM X]ZXW[M WN M`XZM[[QVO W]Z WXQVQWV[WV\PMNQVIVKQIT[\I\MUMV\[ IVLVW\\W XZW^QLM IV WXQVQWVWV\PM QV\MZVITKWV\ZWT W^MZ NQVIVKQIT ZMXWZ\QVO& @]Z KWV[QLMZI\QWVWN \PM QV\MZVITKWV\ZWT W^MZ NQVIVKQIT ZMXWZ\QVO _W]TLVW\VMKM[[IZQTa LQ[KTW[M ITTUI\\MZ[ QV\PM QV\MZVITKWV\ZWT \PI\UQOP\ JM UI\MZQIT _MISVM[[M[& 3 UI\MZQIT _MISVM[[ Q[ I ZMXWZ\IJTM KWVLQ\QWVQV_PQKP \PM LM[QOVWZ WXMZI\QWV WNWVMWZ UWZM WN\PM QV\MZVITKWV\ZWT KWUXWVMV\[ LWM[VW\ZML]KM \W I ZMTI\Q^MTa TW_TM^MT\PM ZQ[S \PI\ UQ[[\I\MUMV\[ KI][MLJa MZZWZ WZ NZI]L QVIUW]V\[ \PI\ _W]TLJM UI\MZQIT QVZMTI\QWV \W \PM NQVIVKQIT [\I\MUMV\[ JMQVO I]LQ\MLUIa WKK]ZIVLVW\JM LM\MK\ML_Q\PQV I \QUMTa XMZQWLJa MUXTWaMM[ QV\PM VWZUIT KW]Z[M WNXMZNWZUQVO \PMQZ I[[QOVMLN]VK\QWV[&HM VW\MLVWUI\\MZ[ QV^WT^QVO\PM QV\MZVITKWV\ZWT W^MZ NQVIVKQIT ZMXWZ\QVO IVLQ\[ WXMZI\QWV \PI\ _M KWV[QLMZ\W JMUI\MZQIT _MISVM[[M[&
5WUXTQIVKM IVL@\PMZ >I\\MZ[3[ XIZ\ WN WJ\IQVQVO ZMI[WVIJTM I[[]ZIVKM IJW]\ _PM\PMZ \PM 4W]TLMZ GITTMa DKPWWT 6Q[\ZQK\ C7%)0[ NQVIVKQIT[\I\MUMV\[ IZM NZMMWN UI\MZQIT UQ[[\I\MUMV\$ _M XMZNWZUML \M[\[ WN Q\[ KWUXTQIVKM _Q\P KMZ\IQV XZW^Q[QWV[ WN TI_[$ZMO]TI\QWV[$ KWV\ZIK\[ IVLOZIV\ IOZMMUMV\[$ VWVKWUXTQIVKM _Q\P _PQKP KW]TLPI^M I LQZMK\ IVLUI\MZQIT MNNMK\ WV\PM LM\MZUQVI\QWV WN NQVIVKQIT [\I\MUMV\ IUW]V\[& :W_M^MZ$ XZW^QLQVO IV WXQVQWV WV KWUXTQIVKM _Q\P \PW[MXZW^Q[QWV[ _I[ VW\ IV WJRMK\Q^M WN W]Z I]LQ\ IVL$IKKWZLQVOTa$ _M LWVW\ M`XZM[[ []KP IV WXQVQWV&EPM ZM[]T\[ WN W]Z\M[\[ LQ[KTW[MLVW QV[\IVKM[ WN VWVKWUXTQIVKM WZ W\PMZ UI\\MZ[ \PI\ IZM ZMY]QZML \W JM ZMXWZ\ML ]VLMZS?E8A>=8>C<D7;C;>: oCu>7uA7B.
EPQ[ ZMXWZ\ Q[ QV\MVLML[WTMTaNWZ \PM QVNWZUI\QWV IVL][M WN\PM 4WIZL WN 7L]KI\QWV$ UIVIOMUMV\$ NMLMZITI_IZLQVOIOMVKQM[ IVLXI[[%\PZW]OP MV\Q\QM[$ IVL Q[ VW\ QV\MVLML\W JM IVL [PW]TLVW\ JM ][ML Ja IVaWVM W\PMZ \PIV \PM[M[XMKQNQMLXIZ\QM[&
@K\WJMZ -$ )''-
KW (((2 ,)/%+*'- 8I`0I.)'V

5MZ\QNTKL A]JTQK 3KKW]V\IV\[
4WIZL WN7L]KI\QWV4W]TLMZGITTMa DKPWWT 6Q[\ZQK\ C7%)4W]TLMZ$5WTWZILW
;?67A7?67?E 3F6;E@CD0 C7A@CE @? 5@>A=;3?57 H;E: C7BF;C7>7?ED3AA=;534=<~Q0E@ 735: >3<@C AC@9C3> 3?6 @? ;?E7C?3= 5@?EC@= @G7C
5@>A=;3?57 ;?355@C63?57 H;E: @>4 5;C5F=3C 3%(**
5WUXTQIVKMHM PI^M I]LQ\ML \PM KWUXTQIVKM WN \PM 4W]TLMZ GITTMa DKPWWT 6Q[\ZQK\ C7%) _Q\P \PM \aXM[ WN KWUXTQIVKMZMY]QZMUMV\[ LM[KZQJML~ QV \PM F& D& @NNQKM WN >IVIOMUMV\ IVL 4]LOM\ I@>4V ?;AvD<uA <,7;; ??=@<;u>v8oD@@<8=8>C \PI\ IZM IXXTQKIJTM \W MIKP WN Q\[ UIRWZ NMLMZITXZWOZIU[ NWZ \PM aMIZ MVLML<]VM*'$ )''-& EPM 4W]TLMZGITTMa DKPWWT 6Q[\ZQK\ C7%)0 [ UIRWZ NMLMZITXZWOZIU[ IZM QLMV\QNQMLQV\PM []UUIZa WN I]LQ\WZ[0 ZM[]T\[ [MK\QWV WN\PM IKKWUXIVaQVO [KPML]TMWNNQVLQVO[IVLY]M[\QWVMLKW[\[& 5WUXTQIVKM _Q\P \PM ZMY]QZMUMV\[ WNTI_[$ ZMO]TI\QWV[$KWV\ZIK\[$ OZIV\ IOZMMUMV\[ IVLW\PMZ UI\\MZ[ IXXTQKIJTM \W MIKP WN Q\[ UIRWZ NMLMZITXZWOZIU[ Q[ \PM ZM[XWV[QJQTQ\aWN\PM 4W]TLMZGITTMa DKPWWT 6Q[\ZQK\ C7%)0[ UIVIOMUMV\& @]Z ZM[XWV[QJQTQ\a Q[ \W M`XZM[[ IV WXQVQWVWV\PM 4W]TLMZGITTMa DKPWWT 6Q[\ZQK\ C7%)0[ KWUXTQIVKM JI[ML WV W]Z I]LQ\&
HM KWVL]K\MLW]Z I]LQ\ WNKWUXTQIVKM QVIKKWZLIVKM _Q\P I]LQ\QVO [\IVLIZL[ OMVMZITTaIKKMX\ML QV\PM FVQ\MLD\I\M[WN3UMZQKI1 \PM [\IVLIZL[ IXXTQKIJTM \W NQVIVKQIT I]LQ\[ KWV\IQVML QVS?E8A>=8>C <D7;C;>: oCu>7uA7B~ Q[[]MLJa \PM5WUX\ZWTTMZ 9MVMZIT WN\PM FVQ\ML D\I\M[1 IVL@>4 5QZK]TIZ 3%(**$ <D7;CB ?9 oCuC8B~ d?vu< S?E8A>=8>CB~ u>7 g?>,mA?9;C iA:u>;FuC;?>B. EPW[M [\IVLIZL[ IVL@>4 5QZK]TIZ 3%(** ZMY]QZM \PI\ _M XTIV IVLXMZNWZU \PM I]LQ\ \W WJ\IQVZMI[WVIJTM I[[]ZIVKM IJW]\ _PM\PMZ VWVKWUXTQIVKM _Q\P \PM \aXM[ WNKWUXTQIVKM ZMY]QZMUMV\[ ZMNMZZML\W IJW^M \PI\KW]TLPI^M I LQZMK\ IVLUI\MZQIT MNNMK\ WVI UIRWZ NMLMZITXZWOZIU WKK]ZZML& 3V I]LQ\ QVKT]LM[M`IUQVQVO$ WVI \M[\JI[Q[$ M^QLMVKMIJW]\ \PM 4W]TLMZGITTMa DKPWWT 6Q[\ZQK\ C7%)0 [ KWUXTQIVKM _Q\P \PW[M ZMY]QZMUMV\[ IVLXMZNWZUQVO[]KP W\PMZ XZWKML]ZM[ I[ _M KWV[QLMZMLVMKM[[IZa QV \PM KQZK]U[\IVKM[& HM JMTQM^M \PI\ W]Z I]LQ\ XZW^QLM[ IZMI[WVIJTM JI[Q[ NWZW]Z WXQVQWV&@]Z I]LQ\ LWM[VW\XZW^QLM I TMOITLM\MZUQVI\QWV WV4W]TLMZGITTMa DKPWWT 6Q[\ZQK\C7%)0[ KWUXTQIVKM _Q\P \PW[M ZMY]QZMUMV\[&
;VW]Z WXQVQWV$\PM 4W]TLMZGITTMa DKPWWT 6Q[\ZQK\ C7%) KWUXTQML$ QVITTUI\MZQIT ZM[XMK\[$ _Q\P \PM ZMY]QZMUMV\[ZMNMZZML\W IJW^M \PI\ IZM IXXTQKIJTM \W MIKP WN Q\[ UIRWZ NMLMZITXZWOZIU[ NWZ \PM aMIZ MVLML<]VM*'$ )''-&
;V\MZVIT5WV\ZWT@^MZ 5WUXTQIVKMEPM UIVIOMUMV\ WN\PM 4W]TLMZGITTMa DKPWWT 6Q[\ZQK\ C7%) Q[ ZM[XWV[QJTMNWZ M[\IJTQ[PQVO IVLUIQV\IQVQVO MNNMK\Q^MQV\MZVITKWV\ZWT W^MZ KWUXTQIVKM _Q\P ZMY]QZMUMV\[ WN TI_[$ ZMO]TI\QWV[$ KWV\ZIK\[ IVLOZIV\[ IXXTQKIJTM \W NMLMZITXZWOZIU[& ;VXTIVVQVOIVLXMZNWZUQVO W]Z I]LQ\$ _M KWV[QLMZML\PM 4W]TLMZGITTMa DKPWWT 6Q[\ZQK\ C7%)0[ QV\MZVITKWV\ZWT W^MZ KWUXTQIVKM _Q\P ZMY]QZMUMV\[ \PI\ KW]TL PI^M I LQZMK\ IVLUI\MZQIT MNNMK\ WV I UIRWZ NMLMZITXZWOZIUQVWZLMZ\W LM\MZUQVM W]Z I]LQ\QVO XZWKML]ZM[ NWZ \PM X]ZXW[M WN M`XZM[[QVO W]Z WXQVQWVWV KWUXTQIVKM IVL\W \M[\IVLZMXWZ\ WV QV\MZVITKWV\ZWT W^MZ KWUXTQIVKM QVIKKWZLIVKM _Q\P @>4 5QZK]TIZ 3%(**&
/' F 2 I.)'V

@]Z KWV[QLMZI\QWVWN \PM QV\MZVITKWV\ZWT W^MZ KWUXTQIVKM _W]TLVW\ VMKM[[IZQTa LQ[KTW[M ITTUI\\MZ[ QV\PM QV\MZVITKWV\ZWT \PI\ UQOP\ JM UI\MZQIT _MISVM[[M[& 3 UI\MZQIT _MISVM[[ Q[ I ZMXWZ\IJTM KWVLQ\QWV QV_PQKP \PM LM[QOVWZWXMZI\QWV WN WVMWZ UWZM0WN \PM QV\MZVITKWV\ZWT KWUXWVMV\[ LWM[VW\ ZML]KM \W I ZMTI\Q^MTa TW_ TM^MT\PM ZQ[S \PI\VWVKWUXTQIVKM _Q\P IXXTQKIJTM ZMY]QZMUMV\[ WNTI_[$ ZMO]TI\QWV[$ KWV\ZIK\[ IVLOZIV\[ KI][ML Ja MZZWZ WZ NZI]L\PI\_W]TLJM UI\MZQIT QVZMTI\QWV \W I UIRWZ NMLMZITXZWOZIU JMQVO I]LQ\MLUIa WKK]Z IVLVW\ JM LM\MK\ML_Q\PQVI \QUMTaXMZQWLJa MUXTWaMM[ QV\PM VWZUIT KW]Z[M WN XMZNWZUQVO\PMQZ I[[QOVML N]VK\QWV[& HM VW\MLVW UI\\MZ[ QV^WT^QVO\PM QV\MZVITKWV\ZWT W^MZ KWUXTQIVKM IVL Q\[ WXMZI\QWV \PI\ _M KWV[QLMZ \W JM UI\MZQIT _MISVM[[M[&
EPQ[ ZMXWZ\ Q[ QV\MVLML[WTMTaNWZ \PM QVNWZUI\QWV IVL][M WN\PM 4WIZL WN7L]KI\QWV$ UIVIOMUMV\$ NMLMZITI_IZLQVOIOMVKQM[ IVLXI[[%\PZW]OP MV\Q\QM[ IVL Q[ VW\ QV\MVLML\W JM IVL [PW]TLVW\ JM ][ML Ja IVaWVM W\PMZ \PIV \PM[M[XMKQNQMLXIZ\QM[&
~ft~uc.@K\WJMZ -$ )''-
'&

73
BOULDER VALLEY SCHOOL DISTRICT RE-2
SCHEDULE OF FINDINGS AND QUESTIONED COSTSYear Ended June 30, 2006
Summary of Auditors’ ResultsFinancial StatementsType of auditors’ report issued: unqualified
Internal control over financial reporting:• Material weaknesses identified? yes x no
• Reportable conditions identified that are notconsidered to be material weaknesses? yes x none reported
Noncompliance material to financialstatements noted? yes x no
Federal AwardsInternal control over major programs:• Material weaknesses identified? yes x no
• Reportable conditions identified that are notconsidered to be material weaknesses? yes x none reported
Type of auditors’ report issued on compliance for major programs: unqualified
Any audit findings disclosed that arerequired to be reported in accordancewith section 510(a) of OMB Circular A-133? yes x no
Identification of major programs:
84.027 Special Education84.173 Special Education Preschool84.184 Safe and Drug Free Schools and Communities84.367 Improving Teacher Quality
Dollar threshold used to distinguishbetween type A and type B programs: $370,074
Auditee qualified as low-risk auditee? x yes no
Financial Statement FindingsThe audit of the financial statements did not disclose reportable conditions in internal control that would be consideredmaterial weaknesses, and did not disclose fraud, illegal acts, violations of provisions of contracts and grantagreements, or abuse that were material to those financial statements.
Federal Awards Findings and Questioned Costs The audit of federal awards did not disclose reportable conditions in internal control that would be considered materialweaknesses, and did not disclose instances of noncompliance or abuse that were material to those federal awards.

1DQSHEHDC 9TAKHB /BBNTMS@MSR
0N@QC NE 3CTB@SHNM0NTKCDQ >@KKDX ;BGNNK 2HRSQHBS :3%)0NTKCDQ$ 1NKNQ@CN
PSEIUISEIS. A/EP.Tn-' nIUTn. TS -DOIE/RI TNI0UISEP./nI- TN NIEInAR /?/:2;
?D G@UD @TCHSDC SGD EHM@MBH@K RS@SDLDMSR NE SGD 0NTKCDQ >@KKDX ;BGNNK 2HRSQHBS :3%)$ @R NE @MC ENQ SGD XD@Q DMCDC6TMD *'$ )''+$ @MC G@UD HRRTDC NTQ QDONQS SGDQDNM C@SDC 8BSNADQ +$ )''+& <GDRD EHM@MBH@K RS@SDLDMSR @QD SGDQDRONMRHAHKHSX NE SGD 0NTKCDQ >@KKDX ;BGNNK 2HRSQHBS :3%)0R L@M@FDLDMS& 8TQ QDRONMRHAHKHSX HR SN DWOQDRR NOHMHNMRNM SGDRD EHM@MBH@K RS@SDLDMSR A@RDC NM NTQ @TCHS&
?D BNMCTBSDC NTQ @TCHS HM @BBNQC@MBD VHSG @TCHSHMF RS@MC@QCR FDMDQ@KKX @BBDOSDC HM SGD =MHSDC ;S@SDR NE /LDQHB@$?v;m7utmu9 <:ir9ruo d9euie7i8. HRRTDC AX SGD 1NLOSQNKKDQ 4DMDQ@K NE SGD =MHSDC ;S@SDR$ @MC SGD OQNUHRHNMR NE 8EEHBDNE 7@M@FDLDMS @MC 0TCFDS 1HQBTK@Q /%0*$ <:ir98 vn d9e9m8. Avges ?v;m7utmu98. eui Gvu7a7vnr9 S7oeur<e9rvu8;<GNRD RS@MC@QCR @MC 870 1HQBTK@Q /%5** QDPTHQD SG@S VD OK@M @MC ODQENQL SGD @TCHS SN NAS@HM QD@RNM@AKD @RRTQ@MBD@ANTS VGDSGDQ SGD EHM@MBH@K RS@SDLDMSR @QD EQDD NE L@SDQH@K LHRRS@SDLDMS& /M @TCHS HMBKTCDR DW@LHMHMF$ NM @ SDRSA@RHR$ DUHCDMBD RTOONQSHMF SGD @LNTMSR @MC CHRBKNRTQDR HM SGD EHM@MBH@K RS@SDLDMSR& /M @TCHS @KRN HMBKTCDR @RRDRRHMFSGD @BBNTMSHMF OQHMBHOKDR TRDC @MC RHFMHEHB@MS DRSHL@SDR L@CD AX L@M@FDLDMS$ @R VDKK @R DU@KT@SHMF SGD NUDQ@KKEHM@MBH@K RS@SDLDMS OQDRDMS@SHNM& ?D ADKHDUD SG@S NTQ @TCHS OQNUHCDR @ QD@RNM@AKD A@RHR ENQ NTQ NOHMHNMR&
8TQ @TCHS V@R BNMCTBSDC ENQ SGD OTQONRD NE ENQLHMF NOHMHNMR NM SGD EHM@MBH@K RS@SDLDMSR SG@S BNKKDBSHUDKX BNLOQHRDSGD 0NTKCDQ >@KKDX ;BGNNK 2HRSQHBS :3%)0R A@RHB EHM@MBH@K RS@SDLDMSR& <GD @BBNLO@MXHMF RBGDCTKD NE DWODMCHSTQDRNE EDCDQ@K @V@QCR HR OQDRDMSDC ENQ OTQONRDR NE @CCHSHNM@K @M@KXRHR @R QDPTHQDC AX 870 1HQBTK@Q /%0* @MC HR MNS @QDPTHQDC O@QS NESGD A@RHB EHM@MBH@K RS@SDLDMSR& <GD HMENQL@SHNM HM SGHR RBGDCTKD G@R ADDM RTAIDBSDC SN SGD @TCHSHMFOQNBDCTQDR @OOKHDC HM SGD @TCHS NE SGD A@RHB EHM@MBH@K RS@SDLDMSR @MC$ HM NTQ NOHMHNM$ HR E@HQKX RS@SDC HM @KK L@SDQH@KQDRODBSR HM QDK@SHNM SN SGD A@RHB EHM@MBH@K RS@SDLDMSR S@JDM @R @ VGNKD&
8BSN~I ~,77 =1%%
-'(( . I,)'V

BOULDER VALLEY SCHOOL DISTRICT RE-2
SCHEDULE OF EXPENDITURES OF FEDERAL AWARDSYear Ended June 30, 2006
Accrued AccruedFederal (Deferred) (Deferred)CFDA Revenue Disburse- Revenue
Federal Grantor/Pass-Through Grantor / Program Title Number 6/30/05 Receipts ments 6/30/06
U.S. Department of Education Direct Programs
Indian Education 84.060 $ 4,488 $ 21,239 $ 19,499 $ 2,748Bilingual Education 84.290 18,466 253,417 283,616 48,665Gaining Early Awareness and Readiness for Undergraduate Programs 84.334 - 50,264 50,264 -
Passed Through State Department of EducationAdult Education 84.002 22,570 111,244 117,123 28,449Title I 84.010 645,912 2,351,241 2,093,080 387,751Special Education 84.027 1,037,580 4,860,310 4,967,019 1,144,289Special Education Preschool 84.173 2,114 119,678 150,688 33,124Safe and Drug Free Schools and Communities 84.184 - 366,086 428,308 62,222Safe and Drug Free Schools and Communities 84.186 33,042 132,898 103,540 3,684Even Start 84.213 37,723 168,345 209,838 79,21621st Century Community Learning Centers 84.287 39,743 211,532 214,641 42,852Innovative Education Program Strategies 84.298 14,963 265,213 285,946 35,696Education Technology 84.318 306 40,308 33,416 (6,586)Comprehensive School Reform Demonstration 84.332 22,541 156,677 183,085 48,949English Language Aquisition 84.365 59,706 348,836 322,335 33,205Mathematics and Science Partnerships 84.366 - - 30,790 30,790Improving Teacher Quality 84.367 327,205 940,598 753,522 140,129Emergency Impact Aid for Displaced Students 84.938 - 120,437 162,034 41,597
Passed Through State Department of Human ServicesVocational Rehabilitation 84.126 41,923 172,556 154,864 24,231
Passed Through State Community College SystemVocational Education 84.048 34,751 34,505 125,034 125,280
TOTAL U.S. DEPARTMENT OF EDUCATION 2,343,033 10,725,384 10,688,642 2,306,291
U.S. Department of AgriculturePassed Through State Department of Human Services
Food Donation 10.550 (39,742) 198,380 204,659 (33,463)Passed Through State Department of Education
National School Lunch Program 10.555 304,467 1,237,648 1,244,138 310,957School Breakfast Program 10.553 36,681 158,739 166,615 44,557
TOTAL U.S. DEPARTMENT OF AGRICULTURE 301,406 1,594,767 1,615,412 322,051
U.S. Department of Health and Human ServicesPassed Through State Department of Education
Refugee and Entrant Assistance 93.576 4,162 12,065 7,903 - TOTAL U.S. DEPARTMENT OF HEALTHAND HUMAN SERVICES 4,162 12,065 7,903 -
Corporation for National and Community ServicePassed Through State Department of Education
Learn and Serve America 94.004 - 23,842 23,842 - TOTAL CORPORATION FOR NATIONALAND COMMUNITY SERVICE - 23,842 23,842 -
TOTAL FEDERAL FINANCIAL ASSISTANCE $ 2,648,601 $ 12,356,058 $ 12,335,799 $ 2,628,342
See the accompanying Independent Auditors' Report.
75

459- $(
*5:2,-7 ;)22-> 8+/552 ,08970+9 7-0%
459-8 95 8+/-,:2- 5.-=6-4,09:7-8 5..-,-7)2 ) <)7,8>B?M-IABA 1PIB &V~ %VV'
*)808 5.67-8-49)9054
9EB(?@@JHK?ISFID N@EBAPGB JCBRKBIAFOPMBN JCCBABM?G?Q?MANFNKMBNBIOBA FI ?@@JMA?I@BQFOE OEBMBLPFMBHBION JC 53* +FM@PG?M)0$&&~ 78en7v ti S7a7gv~ <tdao ;t9gusrgs7v~ ase ?ts,Gutin7Aumasn:a7ntsv. 9EBMBCJMB~ NJHB ?HJPION KMBNBIOBA FI OEFN N@EBAPGB H?S AFCCBMCMJH ?HJPIONKMBNBIOBA FI OEB CFI?I@F?GNO?OBHBIONI
'&

STATE COMPLIANCE
This report includes information required by the Colorado Department of Education.

I0CRTIFICD 9UBLIC /CCOUNTANTS
0OARD OF3DUCATION0OULDER>ALLEY;CHOOL2ISTRICT:3%)0OULDER$1OLORADO
5723937237< /=25<8:;0:398:< 87 /=25<8:0;57<34:5<@ :398:<
?E HAVE AUDITED THE FINANCIALSTATEMENTS OFTHE 0OULDER >ALLEY;CHOOL2ISTRICT :3%)$ AS OF AND FOR THE YEAR ENDED6UNE *'$ )''+$ AND HAVE ISSUED OUR REPORT THEREON DATED 8CTOBER +$ )''+& <HESE FINANCIALSTATEMENTS ARE THERESPONSIBILITY OFTHE 0OULDER >ALLEY;CHOOL2ISTRICT:3%)0S MANAGEMENT& 8UR RESPONSIBILITY IS TO EXPRESS OPINIONSON THESE FINANCIALSTATEMENTS BASED ON OUR AUDIT&
?E CONDUCTED OUR AUDIT IN ACCORDANCE WITH AUDITING STANDARDS GENERALLYACCEPTED IN THE =NITED ;TATES OF/MERICAAND THE STANDARDS APPLICABLETO FINANCIALAUDITS CONTAINED IN .dn?eaS?ai ,m<GiGaA7i;a<;e<g~ ISSUED BY THE1OMPTROLLER4ENERAL OF THE =NITED ;TATES& <HOSE STANDARDS REQUIRE THAT WE PLANAND PERFORM THE AUDIT TO OBTAINREASONABLE ASSURANCE ABOUT WHETHER THE FINANCIALSTATEMENTS ARE FREE OF MATERIAL MISSTATEMENT& /N AUDIT INCLUDESEXAMINING$ ON A TEST BASIS$ EVIDENCE SUPPORTING THE AMOUNTS AND DISCLOSURES IN THE FINANCIALSTATEMENTS& /N AUDITALSOINCLUDES ASSESSING THE ACCOUNTING PRINCIPLES USED AND SIGNIFICANT ESTIMATES MADE BY MANAGEMENT$ AS WELLASEVALUATINGTHE OVERAL5FINANCIALSTATEMENT PRESENTATION& ?E BELIEVE THATOUR AUDIT PROVIDES A REASONABLE BASIS FOROUROPINIONS&
8UR AUDIT WAS CONDUCTED FORTHE PURPOSE OF FORMING OPINIONS ON THE FINANCIALSTATEMENTS THAT COLLECTIVELYCOMPRISETHE 0OULDER>ALLEY;CHOOL2ISTRICT:3%)0S BASIC FINANCIALSTATEMENTS& <HE ACCOMPANYING AUDITOR0S INTEGRITY REPORTIS PRESENTED FORPURPOSES OF ADDITIONALANALYSIS AS REQUIRED BY ;TATEOF 1OLORADO STATUTES AND IS NOT A REQUIRED PARTOF THE BASIC FINANCIALSTATEMENTS& <HE INFORMATION IN THIS SCHEDULE HAS BEEN SUBJECTED TO THE AUDITING PROCEDURESAPPLIED IN THE AUDIT OF THE BASIC FINANCIALSTATEMENTS AND$ IN OUR OPINION$ IS FAIRLYSTATED IN AL5MATERIALRESPECTS INRELATIONTOTHE BASIC FINANCIALSTATEMENTS TAKEN AS A WHOLE&
8CTO~I ~ ~.
18 -'((( . I,)'V
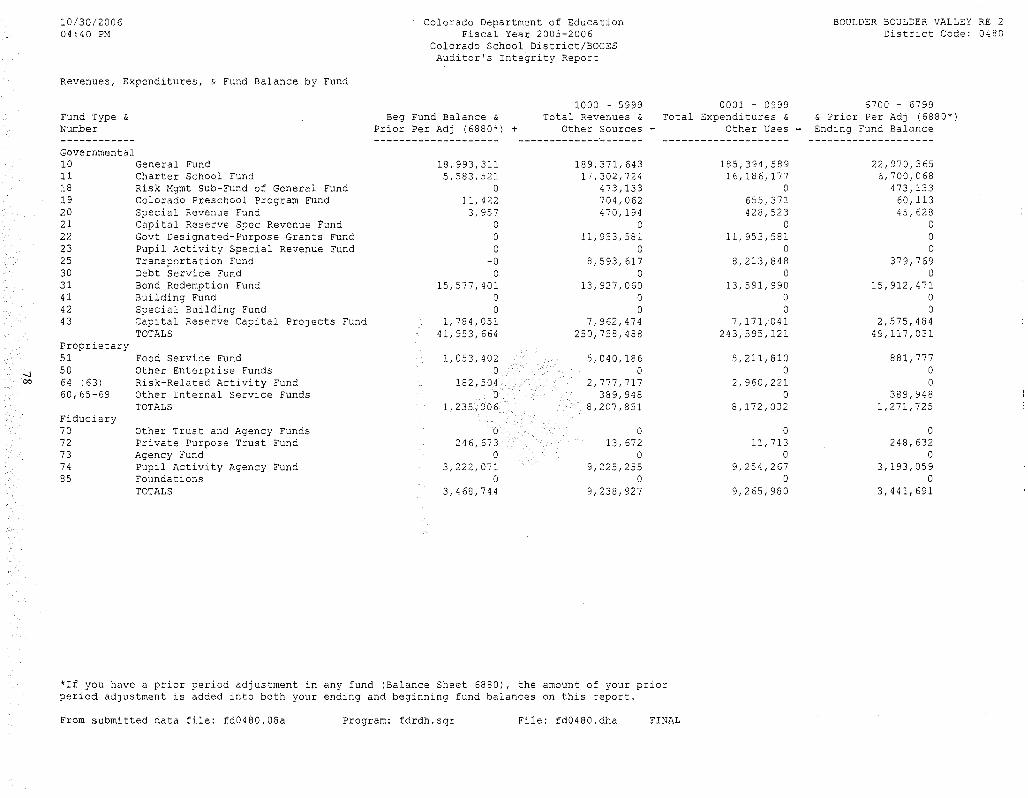
OP33
V)(
dlCk
EDrr
V,h-
31)5)3
31)5;
&22Cn
>BE
33
1IJ
,J-j,h
-I
Lf)OO(V)MroooOmOrlQo..::::t<rlr-OOCOLf)
>O
80
/-+J''&&-
dlCT
,J-()T
I\.D\.D(Y)...-IN
)(l1
kkM
l1)(
OM
Ti
jV
1l'
l11PB
I2
.?
<?<6
l1)(
I0>
l1j
l1)(
>)(
k)11)
)(DTI
22222222222222211
1k1)I1IJ
1(M
IO
Q(
'Y
)O
Lf
)j
OTil1
Mj
M33
Mlg
mBET-
I)3
DTI
1$$01$$.%+4l1
Ml1
lg33
lkl1
)(j
)(P1l'
(CD5-I
3-l1
)(M
jTilg
33
MO
Oli
-D5-3
>I
3)11))3
IO
)(Ti
Oj
liM
MdlC
l1,h-3BI
Olg
)(V
)(R0&
3,I0
31)5
I''ImBE
;mJE
q1l'3B
D5-
)11)1l'
R0)P3B
()VI
II
,J-)(
T-I
mr--OrlMOrloroOQOO.--!rlD
On
ON
>V<$>
+'>>
,J-
,h-I
lkl1
l1O
33
)(j
)(O
liO
Mli
)(lk
jT-T-I
Tili
MTi
Ti
lkj
>lg
lkO
>l1
Oj
P,h-mBE
I1
'1I''I
I)()(
()33
MM
lglg
Ti
li>
Oli
)(Ti
I&
I''II
,J-33
TiO
Ti
lij
l1j
lg)(
l1li
Ti
)(1IJ,h-I
Mli
()))),J-
OTi
liTi
O,J-
liO
O43
&'&&-'''2*
Ik)P1IJ
ITi)(
lg33
Ml1M
Ti
Olk
,J-
j33B3
I33M
liM
)(>
,h-
0M
O,i0WVliDT
1IJ
I31)5
;I
((0e12
II''I
a;
H1l'
,I0
I''I,J-)(
T-I
(Y)o:::rMNo::pOrlOr-OOQOo:::rool..Dor-OOrl
c7c
5:$kl11
,i0j
,h-I
pBCfD7
V<$=(386
lkli
)(l1
lklk
GD0I,0mf-
l1Ti
Oj
T-T
I\Or--rlOr-l
Ti
)(>
I0
-li
l1j
33
)(O
j)11)1IJ
3B
Ti,h-)11) I
11'0
'&
I''I;
T-
&&
Ili
OV<$22BBBBl
cM
Ml1
Olk
>l1jl1
MTi
33
;;
DT
1l'
VI
3B;
Ir-or-or--
Ti
jO
)(Ti
)(l1lkk
liO
ME0,i0
0//
1IJ
T,h-T-I
V<$V<$F///GG''
)DCJ)(,J-
T(-
j,J-l1
>l1MO
OO
,h-
)3DT
P1IJ
>BE
I:15)11)
;=(3?9~
>,h-)11) I
,J-l1
li33
Ml1>
Ti
O33
j,J-
;>
**)(
'''''''''''
0kdlC,h-
I33M
lilg
Ti
T-
33
)PP1IJ,i0
lg2dBI
MO
1IJ1l'
)(&O
T,o-
M1IJ
I3BCBB>
I1l'dlC
DTP
I&1IJ
)3:1ITi)11)
1IJ
I;
:15
>>
%6/2&
;I
S*((
PT-1IJ
e12
IDT;
'6'6/
6'''''&)P
?AI
GJ
3B
k)11)
I86
V)$lg
,h-)11)
mJE
I2dB,h-
t(SDTlgGJ
I1IJT
,I01IJ,h-c1IJ
.3B
)11)ED;
3B
1DT
DT
2dBH
&M
k2li
T)(&
IrlrlONr--OOOQDrlQOrl"<:f'
OP
>GD>
F///CIA>
DT
Ib-
E+f
T-
>I
MO
O()
I>
Ti)(
>l1
)(lkkP
kT
,h-j
IM
Ti
)(,J-
)(3)(
)(3
l1kk
T-;.77.
Tj
I''
'())3
S@
RR
RR
RR
01
S3B)(
IM
Mli
Ml1
)(M
MO
lk3B
)P,I0Dn1IJ
DT10
,J-33
lil1
kkTi
Ti
O)(
1IJ&
DT
)11)1l'
MI
,J-Ti
Ti
l1j
>O
-,h-:1I
I''I3)3
?>P=-
1'1
,h-
I''I;
li&
D5-)3
IjTi
Ti
lili
lgli
MM
2dBmJE
mJ)
li0";
((0 0M
li-
T-
*((T-
;T
)3I
1l'
T3B)11) I
GJ3B
2dB
&GJI
T3B
)3,I0'i2
I*((1l'
I''II
lnmJE
)3mJE)11) I
lg,h-
:15
,h-;
IlnkP
D5-1l'I
D5-
I''II
1)3
S'i2
I3B
ln)3
lnI''I
)3*((
mJE
*((&mJE
;)3)3
&:153B
I''I)3
)33B
*((,I0
1l'
'i23B
*(()3
&&
E))3
&&
3B,I0
,I0T-
*((3B
,I0,I0
)3&
1IJ
ln,h-
*((VB&T-,h-
nE0
M&
1IJ&
,h-
*((9$$9
2R
DT,I0
,h-*((
*(('0
T-
T-
t(~
I''I&
lnGJ
;)3
)3;
,h-
,h-S
*((9$$9
BE
I''I)3
*((3B)3
)31IJE0
T3Bln
GJm)JGJ
'i2*((
44
*((3B
*((*((
,h-)11)
BE
dlC
&,I0
,I0&
&,h-2dB
lnln
m)JmJE
,h-,h-
M,I0
,I0,I0
S1IJ
lkM
;dlCT-li
lnT-
GJ
E0
1IJ;
3ln
:15)11)
;ln
)P1IJ
)PE0n
T1IJ
E0
T-2R
D5-
c'i2)Pnk21O
)3*((1l'
?/O1
&'''''&-3BT-
T&
3)3
PBGJ)11)T)P
*((&
32
&1l'BE
,h-&
3B
7,;
33
)3PB)PM&k2&,h-PB
&,I0
ln,I0
BE)11)
mJE)11),h-
)P1IJ
)(3B
&3Bc,I0T-'i2
32&)P,I0
n)3
1l',h-
00Ce12
mJE
ln3B
3&
,I0&;
IT-,I0
PB
mJE
C:<V4-JU)((0
1l'
)3,I0
,I02dB,h-R-)P
4*((
3B,h-
&T-T
13,h-
)3:15
liI
T&BE,h-E)PB,I0c
1l'BE
,'''P?PA'
GD
3BT-
E0
3)3
)(8&((9
H$~~%6((C((681l')3
)3)11)
I''Iln
ln;
1IJ
t(,h-
(33
&,i-
gii
9$0
5P
?<P
?;4
N''5
.***?<
:-J
,h-32)3
*((32
1l'
)11)13
,h-
3B2dBT-)11)BET-
*((BE1IJT
32&1l'T-
F&$$'
"/#&$$$&
1IJ)11))PBEn-
R-)P
liT-
&T
R0,h-,h-mJE1l'ln
t(S
,I0&
,h-
P?<;<<
P0P14
NIIJ
//+~
P?<
:Uk2ln
1l'
,h-
,I0T-1IJ
dlCdlC1l'1IJ1IJBE,h-
D5-dlC
BE1IJln1IJ
&R0&1IJc
:15
I''ISP
T-T)11))11))PkE
)11)3Blg
*((I''I
'3
P?<
)11)T-
&GD~~I@GDGD
9$~>
gii
nT1-U
?<?<-#4-#,
e12,h-
(C1IJ
;t(
ln1IJ
ln,h-BADnlnlnk
~V5$?
G//'(''5
G@G@H$T-
dlC
T-
1IJE0
lnTJ
1l'
1IJ
t()11)1IJ
/P
?<'5
liT-
E5
P?<O
1/
I''II
)11)31)5
HrdUrl"'d....:l)11)1IJ
ln)3
Ib-H
&3
1&'''''&-
h.
-rls:::..•....•
D9rl
1&4&.-
c)*f~*f.&
*fBE3Bt(
*((%%)
323B
)33B
*((ln
T-li
GJ32BE
k2lnkP
'uut(
GJ32F11D
cCBBT-2dBe12
2dB1l'R-32&F11D
,h-
*f
,h-2dB1O;
k2ln
;~
.77.*f;
~k2lnq
0h.
&4&-
h.
01IJ)11)3E&
00
lnS
)332
m)JndlCnT-Tm)J'i2F11DPDIhDIhTJTF11D
,I03dlC3F11D
kR0(C'i2,I0F11D
1IJ
*f
W5M
*fT-
1IJ
V)(
0ln
E0
BE&
1IJ
)(I1IJ
I''Iln1(
t(3
GJ
I3B
lnE0
2dB)P
S3BA
T-
32
IGJ
1IJ
jI''I
ln**
OR0
*f
E0
IS
*f
&)(
ln&
('''
0F11D)11) I
3B
1l'
MI
t(3)3
lJ-33
3B
465I''I
I''I)(
Ti
T>'0
M)(
GJ
)P&)
GJ
32
1)(
&1l'
S'''
''BE
*((I
BE
;)3
:15)11)
;3)(
46(
IQOriOOffiOrlN(Y)lf)OrlriNM
HrlQ'<;f'Q-rl
aN
I7N
EnUU1EI.f)H
*f
I''I&'''1>
dlC
,I0a
I0r---1.....-irlr-iNNNNN[Y)(")....,.qt'<;J'
P-Ilf)LJ)I.D\..Ofx-Ir--r--r--r--ro
&32
,I0
-.