Detection of Individual Specimens in Populations Using Contour Energies
Upload
independentCategory
view
1download
0
BioMed CentralFrontiers in Zoology
ss
Open AcceResearchDNA damage in preserved specimens and tissue samples: a molecular assessmentJuergen Zimmermann1, Mehrdad Hajibabaei2, David C Blackburn3, James Hanken3, Elizabeth Cantin1, Janos Posfai1 and Thomas C Evans Jr*1Address: 1New England Biolabs Inc., 240 County Rd., Ipswich, MA, 01938, USA, 2Canadian Centre for DNA Barcoding, Biodiversity Institute of Ontario, University of Guelph, Guelph, Canada and 3Department of Organismic and Evolutionary Biology and Museum of Comparative Zoology, Harvard University, 26 Oxford Street, Cambridge, MA 02138, USA
Email: Juergen Zimmermann - [email protected]; Mehrdad Hajibabaei - [email protected]; David C Blackburn - [email protected]; James Hanken - [email protected]; Elizabeth Cantin - [email protected]; Janos Posfai - [email protected]; Thomas C Evans* - [email protected]
* Corresponding author
AbstractThe extraction of genetic information from preserved tissue samples or museum specimens is afundamental component of many fields of research, including the Barcode of Life initiative, forensicinvestigations, biological studies using scat sample analysis, and cancer research utilizingformaldehyde-fixed, paraffin-embedded tissue. Efforts to obtain genetic information from thesesources are often hampered by an inability to amplify the desired DNA as a consequence of DNAdamage.
Previous studies have described techniques for improved DNA extraction from such samples orfocused on the effect of damaging agents – such as light, oxygen or formaldehyde – on freenucleotides.
We present ongoing work to characterize lesions in DNA samples extracted from preservedspecimens. The extracted DNA is digested to single nucleosides with a combination of DNase I,Snake Venom Phosphodiesterase, and Antarctic Phosphatase and then analyzed by HPLC-ESI-TOF-MS.
We present data for moth specimens that were preserved dried and pinned with no additionalpreservative and for frog tissue samples that were preserved in either ethanol, or formaldehyde,or fixed in formaldehyde and then preserved in ethanol. These preservation methods represent themost common methods of preserving animal specimens in museum collections. We observechanges in the nucleoside content of these samples over time, especially a loss of deoxyguanosine.We characterize the fragmentation state of the DNA and aim to identify abundant nucleosidelesions. Finally, simple models are introduced to describe the DNA fragmentation based on nicksand double-strand breaks.
Published: 23 October 2008
Frontiers in Zoology 2008, 5:18 doi:10.1186/1742-9994-5-18
Received: 13 May 2008Accepted: 23 October 2008
This article is available from: http://www.frontiersinzoology.com/content/5/1/18
© 2008 Zimmermann et al; licensee BioMed Central Ltd. This is an Open Access article distributed under the terms of the Creative Commons Attribution License (http://creativecommons.org/licenses/by/2.0), which permits unrestricted use, distribution, and reproduction in any medium, provided the original work is properly cited.
Page 1 of 13(page number not for citation purposes)

Frontiers in Zoology 2008, 5:18 http://www.frontiersinzoology.com/content/5/1/18
IntroductionPreserved tissue samples and museum specimens are avast repository of genetic information of interest to bio-logical and medical researchers. These samples are impor-tant to cancer biopsy tissue research, forensicinvestigations and phylogenetic studies based onmuseum specimens, including extinct species. A recentreview outlines important considerations and guidelineswhen working with specimens from museums and othernatural history collections [1].
DNA is repaired with great efficiency in living cells [2], butthis repair ceases upon death of the organism or preserva-tion of a sample. Depending on the conditions of storage,the DNA in such samples degrades more or less stronglyover time and often becomes inaccessible to genetic stud-ies [3-6] (but see also [7,8]).
Formaldehyde is a commonly used preservative for fieldcollected specimens and cancer biopsy tissue [9,10]. Tis-sue biopsies are typically stored as so-called formalde-hyde-fixed paraffin-embedded (FFPE) samples. FFPE's areprepared by "dipping" the sample in a 3.7% formalde-hyde solution for up to 24 h. In recent years, it has becomecommon practice to use a formaldehyde solution bufferedto pH 7.0 [11]. The unbuffered solution has a pH of ~4.5.Such a drop in pH would lead to an increased rate of DNAdepurination. Samples will then be embedded in paraffinfor storage.
The reaction of formaldehyde with nucleic acids has beenstudied in great detail. One of the earliest reports was pub-lished by Feldman in 1973 [12]. A number of reactionproducts were reported but the main adduct observed isthe addition of a hydroxymethyl-substituent to primaryand secondary amine groups of the respective base. Theseinvestigations were continued in a series of papers by vonHippel and coworkers who describe the reactions of for-maldehyde with free bases and a number of aromaticamines, both for exocyclic amino and for endocyclicimino groups [13-16]. Again, the hydroxymethyl-adductwas reported to be the main reaction product. The reac-tion mechanism was investigated ab initio by Chang et al.and found to be most likely base-catalyzed [17]. The con-sequences of tissue preservation with formaldehyde onthe integrity of the extracted DNA have been described ina number of studies, see for example Lit. [18-21]
Many museum specimens, particularly insects, are storedpinned and are not subjected to any further preservationtreatment [22]. While the exoskeleton of the insects is sta-ble over many years, the soft tissue soon dries out anddecomposes. In a recent study, the effect of differentmethods of killing and specimen storage on mitochon-drial DNA content and PCR success from Drosophila simu-
lans specimens was described [23]. The study showed asignificant impact of storage time on PCR success,whereas the method of killing and the investigated storageconditions had no marked effect. Main factors affectingDNA during storage are expected to be partial dehydrationand exposure to air and light, all potentially leading todiverse types of damage. The deamination of cytidine res-idues has been identified as a common miscoding lesionin studies of ancient DNA [24].
In this study, our goal was to characterize on the molecu-lar level the damage present in DNA samples from tissuesof preserved animal specimens. We use PCR-based assaysto some extent as a measure of usability of samples, butmainly focus on the molecular characterization of theDNA composition and the characterization of individuallesions from genuine DNA samples.
Furthermore, we have developed two models to describeDNA fragmentation by nicks and double-strand breaksand compare our data to these models.
Materials and methodsSpecimensAll moth specimens belong to the species Euxoa messoria.They were collected over a 45-year period (Table 1) andwere preserved pinned with no additional preservative.Specimens of three different frog species (Table 2) werecollected as part of ongoing research unrelated to thisstudy and preserved using standard methods (e.g., Lit.[25]). Frogs were killed using an aqueous solution of chlo-retone and, for adult frogs, a sample of liver tissue was pre-served in 95% ethanol. Adult specimens were then fixedin 3.7% neutral-buffered formaldehyde overnight andthen transferred to 70% ethanol for long-term storage. Inlarge specimens (e.g., Astylosternus), a small volume (~1milliliter) was injected into the body cavity during fixa-tion. For tadpoles, a small piece of tail (mostly muscle)was excised and stored in 95% ethanol; following com-mon practice, the remaining specimen was fixed andstored in 3.7% formaldehyde. Animal care procedures areapproved by the Harvard University/Faculty of Arts andSciences Standing Committee on the use of Animals inResearch and Teaching. An Animal Welfare Assurancestatement is on file with the university's Office for Labora-tory Welfare (OLAW).
After returning from the field, tissue samples in 95% eth-anol were stored at -80°C. For this study, another piece ofthe same tissue (i.e., liver or tail) was excised from thewhole preserved specimens; these tissue samples weretransferred to 95% ethanol. To qualitatively evaluate theeffect of storage time and reduce the effect of species ordevelopmental stage on our results, we analyzed tissuesfrom adults collected over two different years, as well as
Page 2 of 13(page number not for citation purposes)

Frontiers in Zoology 2008, 5:18 http://www.frontiersinzoology.com/content/5/1/18
tadpoles of the same species. Those samples that werestored or fixed using formaldehyde will be referred to asexposed to formaldehyde.
DNA extractionSmall aliquots of frog tissue (1–3 mg) were obtained fromthe preserved specimens in March 2007. The tissue waslysed and DNA was purified using the DNeasy kit (Qia-gen) following the manufacturer's protocol. ExtractedDNA was stored in TE buffer at 4°C.
A leg from each moth specimen was used for DNA extrac-tion, using the NucleoSpin96 kit (Macherey-Nagel). Elu-tion was performed with 40 μl water. The eluate wasstored at -20°C.
Fragment analysis by capillary electrophoresisAn aliquot of 1–5 μl of extracted DNA was labeled withFluorescein-12-ddATP (PerkinElmer, Boston, MA) usingTerminal Transferase (NEB, Ipswich, MA) according to theaccompanying protocol, resulting in a 10 μL reaction vol-ume. The reaction was incubated at 37°C for 1 h, thenapplied to a Centri-Sep column (Princeton Separations)[26].
For the removal of terminal phosphates on the DNA frag-ments, aliquots of 3 μl DNA were treated with 5U Antarc-tic Phosphatase (NEB) in a total reaction volume of 10 μl.The reaction was incubated at 37°C for 1 h, followed byinactivation of the phosphatase at 65°C for 5 min. Thiswas followed by labeling with TdT as described above.
An aliquot of 1–2 μl of the eluate was mixed with 9 μl Hi-Di (Applied Biosystems) and 0.5 ml GENESCAN LIZ1200size standard (Applied Biosystems). Samples were ana-lyzed on a 3130xl Genetic Analyzer (Applied Biosystems),using a 36 cm array, POP7 polymer, an injection time of10 s and a total run time of 6200 s. An example of the raw
Table 1: Origin and preservation of frog tissue samples
No. Frog: Order and Species MCZ No. Stage Preservation Date Location
1a Leptodactylodon axillaris 136883 adult E 25-Sep-04 Mt. Bamboutos, Cameroon1b 136883 F, E
2a Astylosternus rheophilus 136934 adult E 25-Sep-04 Mt. Manengouba, Cameroon2b 136934 F, E
3a Afrana angolensis 136997 adult E 16-Jan-05 Lukhubula River, Malawi3b 136997 F, E
4a Afrana angolensis 136998 adult E 16-Jan-05 Lukhubula River, Malawi4b 136998 F, E
5a Astylosternus rheophilus 137937 adult E 13-Jul-06 Mt. Manengouba, Cameroon5b 137937 F, E
6a Astylosternus rheophilus not acc. tadpole E 13-Jul-06 Mt. Manengouba, Cameroon6b not acc. F
7a Leptodactylodon axillaris 137972 adult E 08-Aug-06 Mt. Bamboutos, Cameroon7b 137972 F, E
8a Leptodactylodon axillaris not acc. tadpole E 08-Aug-06 Mt. Bamboutos, Cameroon8b not acc. F
(not acc.: not accessioned)
Table 2: Collection date of moth specimens
Moth specimens
Sample No. Collection date
1–4 August 20055–9 August 2000
10–13 September 199514–17 September 199018–19 September 198420–23 August 198024–27 September 197728–31 August 197432–37 September 197038–42 September 196543–47 August 1960
Page 3 of 13(page number not for citation purposes)
Frontiers in Zoology 2008, 5:18 http://www.frontiersinzoology.com/content/5/1/18
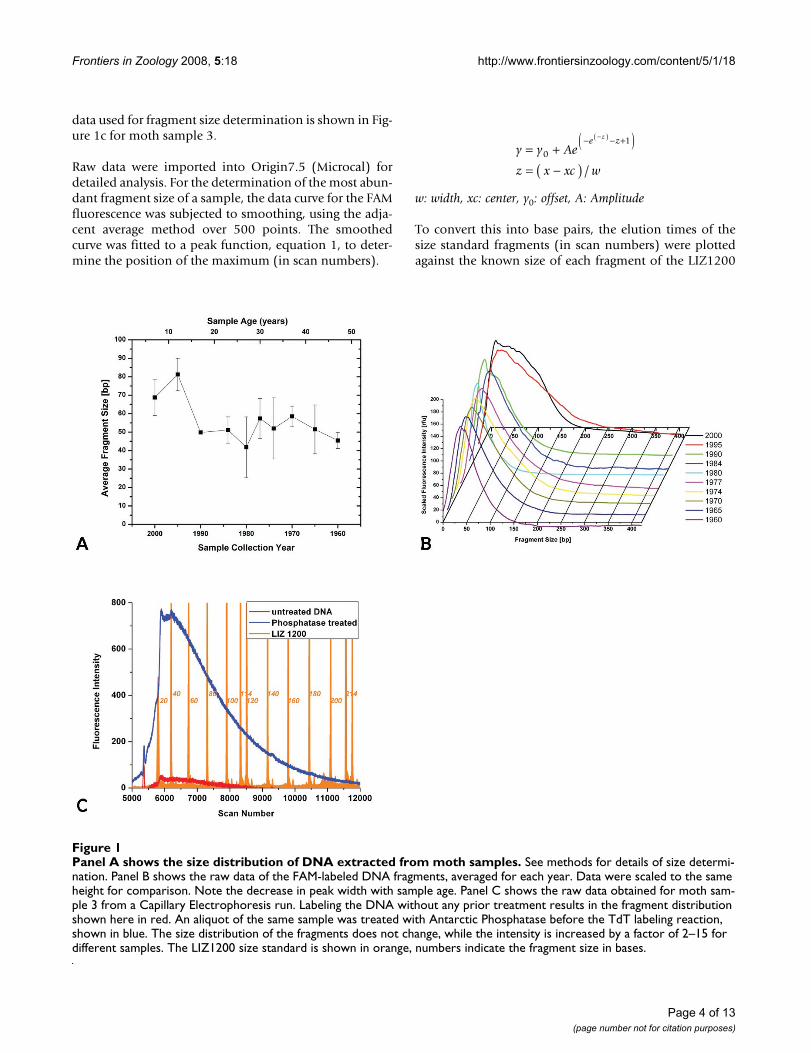
data used for fragment size determination is shown in Fig-ure 1c for moth sample 3.
Raw data were imported into Origin7.5 (Microcal) fordetailed analysis. For the determination of the most abun-dant fragment size of a sample, the data curve for the FAMfluorescence was subjected to smoothing, using the adja-cent average method over 500 points. The smoothedcurve was fitted to a peak function, equation 1, to deter-mine the position of the maximum (in scan numbers).
w: width, xc: center, y0: offset, A: Amplitude
To convert this into base pairs, the elution times of thesize standard fragments (in scan numbers) were plottedagainst the known size of each fragment of the LIZ1200
y y Ae
z x xc w
e zz
= += −( )
− − +( )−( )
0
1
/
Panel A shows the size distribution of DNA extracted from moth samplesFigure 1Panel A shows the size distribution of DNA extracted from moth samples. See methods for details of size determi-nation. Panel B shows the raw data of the FAM-labeled DNA fragments, averaged for each year. Data were scaled to the same height for comparison. Note the decrease in peak width with sample age. Panel C shows the raw data obtained for moth sam-ple 3 from a Capillary Electrophoresis run. Labeling the DNA without any prior treatment results in the fragment distribution shown here in red. An aliquot of the same sample was treated with Antarctic Phosphatase before the TdT labeling reaction, shown in blue. The size distribution of the fragments does not change, while the intensity is increased by a factor of 2–15 for different samples. The LIZ1200 size standard is shown in orange, numbers indicate the fragment size in bases.
Page 4 of 13(page number not for citation purposes)

Frontiers in Zoology 2008, 5:18 http://www.frontiersinzoology.com/content/5/1/18
standard and fitted to a sigmoidal growth curve, equation2.
A1: initial value, A2: final value, x0: center, dx: time constant
The fitting result for the size standard together with thepeak of the FAM fluorescence were used to determine themost abundant size of DNA fragments in a given sample.For the distribution of fragment sizes, the peak width (fullwidth at half height) was used, as determined from the fitof equation 1.
For quantitation of total DNA content, a baseline was fit-ted to the total FAM signal, the signal was then integratedusing this baseline. As a test for the linearity of detectionin our CE, we used the Φ X174 DNA ladder (NEB) in aserial dilution. We found a linear correlation betweendata integral and sample concentration in the range of 2–20 ng/μl (R = 0.997, data not shown).
DNA digestionExtracted DNA was digested using a published method[27] with modifications. Aliquots of 1–10 μl of extractedDNA were incubated with 1 μl DNase I (2U/μl, NEB), 10μl Snake Venom Phosphodiesterase (0.26 mU/μl, Sigma-Aldrich) and 2 μl Antarctic Phosphatase (5U/μl, NEB) at37°C overnight. Using this procedure, unmodified DNAwas completely digested to the mononucleoside level asjudged by HPLC (data not shown).
HPLC separationDigested DNA samples were analyzed on an Agilent 1100HPLC system equipped with a Develosil RP-Aqueous C30column (Nomura Chemical Co.). Solvent A was MilliQwater containing 1% (v/v) formic acid and solvent B wasgradient grade methanol containing 0.25% (v/v) formicacid. An elution profile was used of 2–20% B over 30 minincreasing to 98% over another 20 min then 98% B for 10min and finally returning to 2% B over 20 min. The flowrate was set to 20 μl/min and the eluate monitored at 254nm. Typically, 4 μl of each sample were injected using thewell-plate sampler.
Mass spectrometric analysisFor mass spectrometric analysis the HPLC systemdescribed above was connected directly to the sampleinlet of an Agilent ESI-TOF mass spectrometer. Mass spec-tral data were recorded in positive ion mode over theentire duration of the HPLC run. Data were analyzedusing Analyst QS (Agilent).
Pulsed field agarose gel electrophoresisFor the detection of large DNA fragments, aliquots of thefrog DNA were loaded on a 1% agarose gel and separatedover 15 h with a switch time from 1–12 s and a voltage of6 V/cm. The marker was PFG marker N0350 (NEB).
PCRA 500 bp piece of the Euxoa messoa barcode sequence wasamplified using primers pJZ-moth1-se TTAGGTAATC-CAGGATCTTTAATTG and pJZ-moth1-as ATGA-TAATAATAATAAAAATGCAGT. Amplification wasperformed with Taq DNA polymerase (NEB), with an ini-tial denaturation at 95°C for 2 min., then 30 cycles of95°C for 15 s, 55°C for 10 s, 72°C for 30 s, and a finalextension at 72°C for 5 min.
Primer sequences for the PCR of frog mitochondrial 16Sribosomal RNA correspond to those of Darst and Can-natella [28]. The primers for the first exon of the nucleargene for rhodopsin are ACGGAACAGAAGGTCCCAAC (5'primer) and AGCGAAGAAGCCTTCAAAGT (3' primer).PCR reactions were carried out with Phusion DNApolymerase (NEB), with initial denaturation at 98°C for30 s, then 30 cycles of 98°C for 10 s, 60°C for 10 s, 72°Cfor 45 s, and a final extension at 72°C for 10 min.
Modeling of DNA nickingAn algorithm was written in C to simulate fragmentationof double-stranded DNA by repeated nicking events. Thesimulation required four input parameters: simulatedtime period length (t) in years, DNA size (L) in mega-bases, nick rate (n) in nicks per megabase per day, andproximity of opposite strand nicks (p) that result in a dou-ble-stranded break given in bases. The program initiatesthe C library random number generator function so thatrepeated calls to the generator will return uniformly dis-tributed random integers between 1 and 2*L*106. Ran-dom number r will represent a nick on the rth position ofthe forward strand if r <L*l06, otherwise the programassigns the nick at position rc = r - L*l06 on the reversestrand. The imaginary sequence is "nicked" n*L*365*ytimes at positions indicated by the random numbersreturned from consecutive calls to the random numbergenerator. Next the program identifies where opposite-strand nicks occur within p bases, and records double-stranded breaks. Distances between consecutive breaks,measured on the forward strand of DNA, give fragmentlengths. These are tabulated and reported in a size-sortedlist. The simulation is run with different combinations ofinput parameters.
Results and discussionI. Moth specimensThe analyzed moth specimens all belonged to the speciesEuxoa messoria, a native of North America. The specimens
yA A
e x x dxA= −
+ −( ) +1 2
1 02/
Page 5 of 13(page number not for citation purposes)

Frontiers in Zoology 2008, 5:18 http://www.frontiersinzoology.com/content/5/1/18
were preserved pinned and not exposed to other preserva-tives prior to DNA extraction.
The fragmentation state of the extracted DNA was evalu-ated by Capillary Electrophoresis. There is a general corre-lation between the age of the sample and the fragmentsize, which gets smaller with increasing age of the sample(Figure 1).
The samples from 2000 show a most abundant fragmentsize of ~70 bp. The raw data show a considerable spreadof sizes, ranging from approximately 20 to 170 bp. Allsamples from 1990 and older have a most abundant frag-ment size of approximately 50 bp. The distribution offragment sizes becomes narrower with sample age (seeFigure 1b) and is in the range of 20–100 bp for the oldestsamples from 1960. Within the storage period investi-gated here, this appears to be a semi-stable fragment size.Notably, there is a small increase in fragment size for thesamples between 30 and 40 years of age (collected around1970). The reason for this slight deviation from the gen-eral trend is not clear.
We were not able to determine the size distribution for theyoungest samples from 2005. We assume that DNA inthese samples is too big to enter the capillary or elutewithin the observed time. On the other hand, the DNAconcentration was too low to be visualized by Pulsed FieldAgarose gel electrophoresis. The successful PCR amplifica-tion from these young samples (see below) corroboratesour assumption of the presence of large fragments. Frag-ments too small to be detected by capillary electrophore-sis or a general lack of DNA would not lead to a PCRproduct.
Analysis by fluorescent labeling followed by CapillaryElectrophoresis will only show the more abundant frag-ments. While the most abundant fragment size lies withinthe range described above, there may be larger fragmentspresent in amounts sufficient for PCR amplification, buttoo low for detection with this methodology. This seemsto be the case for the samples from 2000, for which a frag-ment distribution of 20–170 bp is observed, yet a 500-bpproduct can be amplified from these samples. Alterna-tively, the 500-bp amplicon may be assembled duringPCR from smaller template fragments. This seems moreunlikely in light of the unsuccessful amplification fromolder samples, which contain fragments of comparablesize to the year 2000 samples.
The CE setup used in this study is limited to fragment sizesfrom 20 to ~1500 bp. Larger fragments would escapedetection. While the presence of large fragments cannotbe excluded based on our experiments, the accumulationof two fragment populations that are very distinct in size
appears unlikely and to our knowledge has not beenreported before. Hence we conclude that the fragmentsizes observed via CE give an appropriate representationof the DNA recovered from the moth tissue.
The fragment analysis is based on DNA labeling withFAM-ddATP and Terminal Transferase. This reactionrequires the presence of a free 3'-hydroxyl group on thefragments. If fragmentation occurred after formation of anabasic site, two main mechanisms were described for theensuing chain break, either a β-elimination or the forma-tion of a 3'-4'-cyclic phosphate [29,30], neither resultingin a free 3'-hydroxyl. However, more complex mecha-nisms have been suggested [31], and the successful labe-ling is proof of the existence of such groups. It is possiblethat only a small portion of the fragments present in theDNA extract have a free 3'-hydroxyl group, but we assumethe underlying mechanisms of fragmentation to besequence independent, but see for example Ref. [32], andhence yield a statistical representation of fragment sizesresulting from different mechanisms. We found that treat-ment of the DNA samples with Antarctic Phosphataseprior to labeling improved the amount of labeled DNA bya factor of 2–10. (Figure 1C)
PCR amplification of a 500-bp segment of the cytochromeoxidase I (coxI) gene was successful for the youngest sam-ples, dating from 2005 and 2000 (Figure 2). However, noamplicon was obtained for the older samples. We found aseven-fold decrease in the amount of extractable DNA asthe samples increase in age (data not shown). Further-more, as discussed above there is a decrease in averageextracted DNA size. A third possible issue is the presenceof base lesions that interfere with PCR.
We attempted to address whether base lesions could be aproblem in DNA amplification from these museum sam-ples by using the LC-MS analytical technique. The mothDNA was digested to nucleosides and applied to an LC-
PCR of a 500-bp part of the moth barcode sequenceFigure 2PCR of a 500-bp part of the moth barcode sequence. An amplicon was only obtained for the samples collected in 2005 and weakly for samples from 2000. All other reactions show only primer dimers.
Page 6 of 13(page number not for citation purposes)

Frontiers in Zoology 2008, 5:18 http://www.frontiersinzoology.com/content/5/1/18
MS. Figure 3 shows the UV chromatogram for the digest ofa sample collected in 1974, sample 30. In the chromato-gram the four deoxynucleosides can be readily identifiedbased on their elution times and masses. There is alsosome indication of the presence of deoxyuracil. This maybe due to the presence of a cytosine deaminase in theDNase I preparation and hence would be an artifact ofsample preparation [Zimmermann J: unpublishedresults]. Four other significant peaks have been labeled 1,2, 3 and 4 with exact masses of 245.07(5), 380.03(4),367.17(6) and 355.18(7) Da, respectively. Based on theirmass alone it has so far not been possible to identify thesecompounds with confidence. Work to identify them usingMS/MS techniques is in progress.
Interestingly, when comparing the UV chromatograms forall the moth samples, it became apparent that the peak fordG became smaller for the older samples, while peaks forthe other nucleosides remained largely similar in inten-sity. The dG peak can only be detected in the UV chroma-tograms of the youngest samples. The dG ion can beextracted from the Total Ion Current of the mass spec-trometry run for each sample as an Extracted Ion Chroma-togram (XIC), to give a more accurate picture. In this way,dG can be detected in all but the samples older than 1970.No peak for dG is detectable in the mass spectra of theoldest samples from 1965 and 1960.
The absolute area of the individual peaks depends on thesample concentration, which differs between the differentextracts of moth DNA. A determination of the concentra-tion by measuring the A260 values was not attempted dueto the small available sample amounts. This makes itimpossible to compare dG contents of different samplesby a direct comparison of peak areas. We therefore con-sider the ratios of peak areas within each sample, namelythe area ratios of dA/dT and of dG/dC. While the numeri-cal value of these ratios has no physical meaning, it isexpected to remain constant if the base composition ofthe different samples remains the same. This is expectedfor DNA samples from the same species, assuming noDNA degradation.
We do observe a reasonably constant value for the dA/dTratio (Figure 4a). There is some variation between years,and a relatively large bandwidth of values within samplesfrom a given year, nonetheless the ratio stays mainlyaround a value of ~0.10. In contrast, the dG/dC ratiodeclines rapidly from a value of ~6 to ~1 during the first15 years of sample preservation and remains low for theolder samples (Figure 4b). As seen above for DNA frag-mentation (Figure 1a), there is a small increase in the ratiofor the samples from around 1970.
Taken together, the observation of the diminishing peakfor dG in the mass spectrometric analysis, the persistence
UV-Chromatogram of Moth specimen 30, collected in 1974Figure 3UV-Chromatogram of Moth specimen 30, collected in 1974. Digest of a moth sample, showing the four standard deoxynucleosides and several additional components. The numbers 1, 2, 3, 4 (exact masses 245.07(5), 380.03(4), 367.17(6) and 355.18(7) Da, respectively) label components of the DNA preparation not yet identified. These are poten-tial lesions preventing PCR amplification from these samples. They are not present in the youngest specimens.
Estimate of dG content in moth DNAFigure 4Estimate of dG content in moth DNA. All moth sam-ples were subjected to LC-MS analysis. For the software analysis, ions of the four deoxynucleosides were extracted from the total ion currents and resulting peaks were inte-grated. The plot shows the ratios of integrals for dA/dT and dG/dC, respectively. While the dA/dT ratio stays fairly con-stant over time, the dG/dC ratio drops very much. Indeed, dG cannot be detected in the oldest moth samples.
Page 7 of 13(page number not for citation purposes)

Frontiers in Zoology 2008, 5:18 http://www.frontiersinzoology.com/content/5/1/18
of peaks for the three other nucleosides, and the decreas-ing ratio of the dG/dC peak areas show a striking effect ofstorage time on the dG content of DNA in these samples.The fate of the dG residues is currently under investiga-tion. At this point we do not know whether the loss of dGis due to depurination and the creation of an abasic site,or to a specific base modification. A combination of thetwo processes seems possible, in which certain chemicalmodifications of the base lead to an increased rate ofdepurination of the modified residue versus normal dG.The resulting abasic site is prone to hydrolysis and wouldthus facilitate fragmentation of the DNA. A commonlyobserved oxidative lesion is 8-oxo-deoxyguanosine. Weanalyzed selected samples for this compound by creatingan XIC from the ESI-TOF data, searching for ions with amass of 284 – 285 m/z (exact mass of 8-oxo-dG: 283.09Da). We did not find the compound with this strategy andconclude that, if present, the amounts of 8-oxo-deoxygua-nosine in the extracted and digested DNA samples mustbe too low to be detected in this way. Using the sameapproach, we also searched for 7-Hydro-8-oxo-deoxygua-nosine (Fapy-desoxyguanosine, exact mass: 285.11 Da), acompound sometimes found in samples containing 8-oxo-dG and a possible reaction product of 8-oxo-deoxy-guanosine. Again, we did not find this compound.
II. Frog specimensAt the turn of the last century, formaldehyde came intowide usage for preservation of biological material. Expos-ing or simply maintaining a specimen in formaldehydehad the benefit of preserving sample morphology muchmore effectively than ethanol alone. Unfortunately, for-maldehyde inhibits modern genetic analytical techniquessuch as PCR and DNA sequencing. This may be due to for-maldehyde-induced crosslinks or adducts or to the factthat formaldehyde solutions need to be periodically buff-ered with phosphate buffer to prevent a precipitous dropin pH due to formic acid formation. Although these for-maldehyde effects are all problematic, work is on-going todetermine the specific problem. We therefore chose toanalyze actual museum specimens that had been exposedto formaldehyde during preservation. Because of an unre-lated research project, it was possible to obtain tissue sam-ples from individual specimens that had been preservedusing different combinations of formaldehyde treatmentand ethanol (Table 2). For two species, samples wereavailable that were collected during different field seasonsthus enabling us to evaluate at the short term effect of stor-age in ethanol or formaldehyde. For tissues from a givenspecimen, all samples were of the same tissue (liver or tailmusculature), approximately equal size, and prepared bythe same person (DCB). The result of the tissue lysis andconcentrations of extracted DNA (as determined from theA260) are given in table 3. As was later found by LC analy-sis (see below), the samples contain significant amounts
of RNA. The concentrations given in the table hence arethe sum of DNA and RNA in each extract. Samples werefirst characterized by Pulsed Field Gel electrophoresis(Figure 5). The average fragment size from specimens pre-served only in ethanol is approximately 18 Kbp, with arange from approximately 11 to 23 Kbp. DNA extractsfrom formaldehyde-exposed specimens show no detecta-ble DNA on this gel, with the exception of sample 7b,which shows a weak smear.
Pulsed Field Agarose Gel of extracted frog DNAFigure 5Pulsed Field Agarose Gel of extracted frog DNA. Only the samples preserved in ethanol alone show detecta-ble levels of DNA in this gel. The average size of the frag-ments is ~18 kbp. For the formaldehyde preserved samples, only sample 7b shows a detectable smear of DNA.
Table 3: Concentration of extracted frog DNA
No. Preservation DNA conc. [ng/μl]
1a E 93.42a E 58.13a E 19.14a E 93.75a E 36.96a E 25.17a E 127.38a E 36.46b F 2.88b F 1.61b F, E 11.62b F, E 21.13b F, E 18.64b F, E 18.65b F, E 10.77b F, E 61.9
Page 8 of 13(page number not for citation purposes)

Frontiers in Zoology 2008, 5:18 http://www.frontiersinzoology.com/content/5/1/18
The samples were used as templates for the PCR amplifi-cation of one mitochondrial and one nuclear gene frag-ment. Amplification of the mitochondrial 16S ribosomalRNA gene was successful for all samples preserved only inethanol (Figure 6, panel A). The same experiment showedmixed results for the formaldehyde-exposed samples.Samples 1b-4b yielded a very low amount of product,barely visible on the gel. Samples 5b and 7b yielded amuch higher amount of product and were collected morerecently. Samples 6b and 8b show no detectable producton the gel; both specimens are tadpoles that were storedin 3.7% formaldehyde for approximately a year before tis-sues were excised and transferred to 95% ethanol for theseanalyses.
The formaldehyde-exposed samples giving small to goodproduct amounts were only fixed in formaldehyde andthen transferred to ethanol. Of these, the youngest twosamples 5b and 7b (i.e., those preserved for the shortesttime) yield the largest amount of product. Samples 6b and8b were preserved only in formaldehyde since their collec-tion and no product can be obtained from them. As wasdescribed previously [33], there is a clear negative correla-tion between exposure time to formaldehyde and successof PCR.
Amplifications of the nuclear rhodopsin gene were moredifficult to achieve from these samples. This is clearly dueto the abundance of the mitochondrial gene at severalhundred or thousand copies per cell, as opposed to onlytwo copies for each nuclear gene.
The rhodopsin sequence can be amplified for samples 1a,2a, 5a, 6a and 8a, but not for the remaining samples 3a,
4a and 7a. As there is no obvious correlation between theability to amplify this nuclear gene and the preservation,sample age, or developmental stage, the variation in theseresults is most likely stochastic in nature. They may reflectsmall differences in the actual process of sample preserva-tion, tissue morphology (i.e., ease or difficulty of tissuelysis and DNA extraction from different tissues) and vari-ations in DNA yields during the extraction process.
In our hands it was not possible to amplify the rhodopsintarget sequence from the formaldehyde-exposed tissues.
Aliquots of the frog DNA were digested to the nucleosidelevel, separated by HPLC, and components identified byESI-TOF-MS. A representative UV chromatogram is shownin Figure 7 for sample 1a. The four standard deoxynucleo-sides can readily be identified based on their retentiontime and mass. This chromatogram also shows significantamounts of ribonucleosides, showing that RNA was notdigested completely before DNA purification and inad-vertently copurified in the DNA extraction process. Figure8 shows comparisons of UV chromatograms for the etha-nol-preserved samples as well as for the formaldehyde-exposed samples. There is some variation in the overallamount of extracted DNA in each of the two groups. Incomparison, the amount of DNA extracted from the for-maldehyde-exposed specimens is strikingly lower thanthat from ethanol-preserved specimens. New peaks, hint-ing at the formation of adducts in either group, are notapparent. It is currently unclear whether the DNA iscrosslinked within the tissue and cannot be extracted, or isdegraded heavily by the formaldehyde treatment, in par-
PCR using extracted frog DNAFigure 6PCR using extracted frog DNA. Panel A shows amplifica-tion of a 1,000-bp segment of the mitochondrial 16S gene from ethanol preserved samples. (sample 1a-8a). Panel B shows the same amplification from formaldehyde-exposed samples (sample 1b-8b). Panel C shows the amplification of a 500-bp segment of the nuclear rhodopsin gene (sample 1a-8a) from ethanol preserved samples. No product was observed for the rhodopsin gene with samples 1b-8b, which were exposed to formaldehyde during preservation.
UV-Chromatogram of digested frog DNA, sample 1aFigure 7UV-Chromatogram of digested frog DNA, sample 1a. RNA had not been completely removed before digestion, "r" denotes ribo-nucleosides, "d" denotes deoxy-nucleosides.
Page 9 of 13(page number not for citation purposes)

Frontiers in Zoology 2008, 5:18 http://www.frontiersinzoology.com/content/5/1/18
ticular the concomitant drop in pH, which leads to anincreased rate of depurination/depyrimidination.
As expected, differences between the different frog speciesor between different developmental stages were notobserved in these experiments.
The main obstacle in obtaining DNA from formaldehyde-preserved samples appears to be the early stage of DNAextraction, rather than specific lesions that inhibit PCRamplification. We performed tests with mouse liver tissue,
which was preserved in formaldehyde for different lengthsof time, mechanically homogenized and then lysed bytreatment with a standard lysis buffer and Proteinase K at55°C. This treatment leads to complete solubilization offresh tissue within one hour for a piece of tissue of ~100mg. In contrast, tissue fixed with formaldehyde for asshort as a few minutes will not dissolve completely evenafter several days of incubation at 55°C, repeated spikingwith Proteinase K or use of increased concentrations ofchaotropic agents, such as 8 M guanidinium. We suggestthat most of the DNA in samples preserved in formalde-hyde is crosslinked intricately to the surrounding tissuecomponents and cannot be extracted by standard DNAextraction methods.
Numerous lesions in DNA exposed to formaldehyde havebeen described in studies using nucleotides or isolatedDNA [34,35]. Presumably, similar lesions occur in wholetissue. This was recently demonstrated for the first time forDNA from rats [36]. The animals were treated with N-nitrosodimethylamine or 4-(methylnitrosamino)-1-(3-pyridyl)-1-butanone. Both compounds release formalde-hyde in vivo after they have been modified by enzymes ofthe P450 family. While this shows the formation of for-maldehyde-induced crosslinks in vivo for the first time,concentrations of free formaldehyde in the study werevery much lower than those encountered in formaldehydepreservation of tissues, therefore apparently crosslinkingsome DNA bases while not preventing DNA extraction.The effective formaldehyde concentration during stand-ard tissue fixation is considered to be much higher, andhence lead to much more extensive crosslinking.
The very nature of the crosslinks formed in the process offormaldehyde fixation seems to prevent the DNA frombeing extracted from the tissue. While we assume suchcrosslinks to be present, we have not yet been able toextract DNA with such modifications from the tissue andmake it available for further analysis.
III. Modeling DNA fragmentationIn order to better understand the observed fragmentationpattern of the moth DNA samples, we considered twomain sources of fragmentation, simultaneous double-strand breaks and nicking, and applied simple mathemat-ical models for the two processes. We make no assump-tions as to the cause of nicks and strand breaks in thismodel, and do not account for changes in the rate of DNAdegradation over the storage time.
These models were first motivated by our findings fromthe moth DNA samples. The change in average fragmentsize from 70 bp in seven-year-old samples to 45 bp in 40-year-old samples seemed surprisingly small, and the frag-mentation in the youngest samples very high. We first
UV-Chromatograms of all frog samplesFigure 8UV-Chromatograms of all frog samples. Panel A shows those samples preserved only in ethanol. The overall concen-tration of extracted DNA varies somewhat, but no extra peaks are detected in these samples. Panel B shows those samples preserved using formaldehyde. The overall yield of DNA is considerably lower, using tissue samples of compara-ble weight. Additional peaks, which would indicate potential lesions or formaldehyde adducts, are not apparent.
Page 10 of 13(page number not for citation purposes)

Frontiers in Zoology 2008, 5:18 http://www.frontiersinzoology.com/content/5/1/18
used a simple approach to model fragmentation patternsresulting from double-strand breaks. Such a model cangive some insight into the observed fragment sizes of themoth DNA, to be complemented by a model based onnicking, see below. We assumed a correlation for the sizedistribution of a DNA strand affected by a certain numberof strand breaks per time as shown in equation 3:
l0: initial length of DNA
B: number of strand breaks per day
t: time in days
lt: average fragment size after time t
The resulting development of the average fragment sizeover a period of forty years is shown in Figure 9A. For astarting length of 1 Mbp, a fast drop in the first five yearsis followed by a much more gradual change. After reach-ing an average size of 200 bp after 7 years, it would takeanother 63 years for the average fragment size to go downto 20 bp, always assuming a constant rate of introductionof strand breaks. Accordingly, starting from 10 Mbp, itwould take 700 years to get to 20 bp pieces. This model isan approximate reproduction of the observed change infragment size as described above, in that we observe thesame gradual change over an extended age range of sam-ples, after an (assumed) initial fast drop.
Trying to fit this model to our data was not successful, pri-marily due to the lack of experimental data for very earlystages of fragmentation. Also, double-strand breaks willnot be the only source of DNA fragmentation, so that itmay not be feasible to describe the experimental databased on this process alone.
llB tt =
×0
Figure 9
Modeling of DNA fragmentationFigure 9Modeling of DNA fragmentation. Two models of DNA fragmentation were analyzed. Model 1 is based on double-strand breaks. Panel A.1 shows the resulting average frag-ment sizes that occur over time for an initial fragment length of 1 Mbp, assuming different rates of strand breaks per day. Panel A.2 shows fragment sizes resulting from different initial lengths of DNA, for a rate of two strand breaks per day. Model 2 is based on nicking of single strands in double-stranded DNA. Panel B shows the distribution of fragments resulting from a starting size of 1 Mbp, at a rate of 18 nicks per day.
Page 11 of 13(page number not for citation purposes)

Frontiers in Zoology 2008, 5:18 http://www.frontiersinzoology.com/content/5/1/18
Therefore, we modeled the accumulation of nicks, e.g.,single-strand breaks, over time. Assuming that two nickson opposing strands of DNA will lead to a double-strandbreak if they are separated by ten or fewer base pairs, wecalculated the resulting distribution of fragment sizes andthe change of this distribution over time. This can lead toa prediction of longer fragments of DNA in samples thatare overall dominated by shorter fragments. This in turnmay determine the feasibility of amplifications of largersequence stretches from older samples.
The results are shown in Figure 9B. We assumed a rate ofnicking of 18 nicks per day, based on previously reportedestimates [37]. Starting from an initial size of 1 Mbp, thepredicted fragment size drops rapidly and is below 2 Kbpafter only five years even for the remaining larger frag-ments. After 15 years, most fragments are predicted to besmaller than 300 bp.
In combination, the two models of double-strand breaksand nicking highlight the scope and limitations associatedwith the amplification of DNA from stored and aged sam-ples. The trends observed in the models correspond wellwith our findings from moth DNA samples. Fresh DNAsamples pose practically no limit to the length of amplifi-able DNA stretches, yet the amplifiable fragment length inpreserved tissues declines very rapidly, and fragmentationappears to be the main reason for failure of amplificationof longer sequences, more deleterious than the accumula-tion of specific base lesions.
Both models are based on the accumulation of a certainnumber of lesions after a given time and make no assump-tions on the rate of introduction of such lesions. This ratemay well be variable in real samples over time, dependingon sample composition and storage/preservation condi-tions.
ConclusionWe investigated the molecular properties of DNA samplesextracted from museum specimens. DNA extracted fromindividual moth specimens stored between 5 and 40 yearswas subjected to fragment analysis and HPLC-MS analy-sis. We showed the degree and progress of fragmentationin these samples and corroborated the observed fragmentsizes by two models of fragmentation. These findings mayaid in the design of studies utilizing such samples, andhelp researchers to make educated guesses about theamplicon size that may reasonably be expected from asample of a given age stored under comparable condi-tions. In particular, we found that a 500 bp amplicon canreadily be obtained from samples up to ten years in age,whereas shorter sequences need to be targeted in oldersamples. With respect to using such samples to obtain
DNA barcodes, a longer barcode sequence can only beconcatenated from shorter subsequences of 100 bp or less.
Our investigation of DNA extraction and characterizationof frog tissue preserved in ethanol or formaldehyde cor-roborates many findings reported previously by otherresearchers. Tissue lysis is the main obstacle in obtainingDNA from formaldehyde-exposed tissues. The DNA yieldis low, but extractable DNA does not exhibit major baselesions, suggesting that crosslinked DNA was not extract-able.
This study should guide future projects in a) the choice ofpreservation: Combined with a wealth of research in thepast, our study reinforces that samples must not beexposed to formaldehyde if the contained DNA is to beutilized in any kind of downstream process; and b) thedesign of sequencing projects on stored insect and tissuesamples, with regard to amplicon length and expectedfragmentation.
AbbreviationsLC-MS: Liquid-Chromatography Mass Spectrometry;HPLC: High Performance Liquid Chromatography; ESI:Electrospray Ionization; TOF: Time Of Flight; CE: Capil-lary Electrophoresis.
Competing interestsThe authors declare that they have no competing interests.
Authors' contributionsJZ extracted DNA from frog specimens, ran PFGE and PCRexperiments, analyzed the capillary electrophoresis data,performed the LC-MS analysis and drafted the manu-script. MH provided moth DNA samples. DB designed thesampling of frog tissues and collected frog specimens inthe field. EC ran the capillary electrophoresis experiments.JP devised and implemented the program for fragmenta-tion modeling. TE conceived of the study and participatedin its ongoing design. All authors read, edited andapproved the final manuscript.
AcknowledgementsThe authors wish to thank Jean-François Landry for providing moth tissue.
References1. Wandeler P, Hoeck PE, Keller LF: Back to the future: museum
specimens in population genetics. Trends Ecol Evol 2007,22:634-642.
2. Stivers JT, Kuchta RD: DNA Damage and Repair. ChemicalReviews 2006, 106(2):.
3. Lehmann U, Kreipe H: Real-time PCR analysis of DNA andRNA extracted from formalin-fixed and paraffin-embeddedbiopsies. Methods 2001, 25:409-418.
4. Lindahl T: Instability and decay of the primary structure ofDNA. Nature 1993, 362:709-715.
5. Paabo S, Poinar H, Serre D, Jaenicke-Despres V, Hebler J, Rohland N,Kuch M, Krause J, Vigilant L, Hofreiter M: Genetic analyses fromancient DNA. Annu Rev Genet 2004, 38:645-679.
Page 12 of 13(page number not for citation purposes)

Frontiers in Zoology 2008, 5:18 http://www.frontiersinzoology.com/content/5/1/18
Publish with BioMed Central and every scientist can read your work free of charge
"BioMed Central will be the most significant development for disseminating the results of biomedical research in our lifetime."
Sir Paul Nurse, Cancer Research UK
Your research papers will be:
available free of charge to the entire biomedical community
peer reviewed and published immediately upon acceptance
cited in PubMed and archived on PubMed Central
yours — you keep the copyright
Submit your manuscript here:http://www.biomedcentral.com/info/publishing_adv.asp
BioMedcentral
6. Wandeler P, Smith S, Morin PA, Pettifor RA, Funk SM: Patterns ofnuclear DNA degeneration over time–a case study in his-toric teeth samples. Mol Ecol 2003, 12:1087-1093.
7. Golenberg EM: Antediluvian DNA research. Nature 1994,367:692.
8. Hagelberg E, Thomas MG, Cook CE Jr, Sher AV, Baryshnikov GF,Lister AM: DNA from ancient mammoth bones. Nature 1994,370:333-334.
9. McDowell EM, Trump BF: Histologic fixatives suitable for diag-nostic light and electron microscopy. Arch Pathol Lab Med 1976,100:405-414.
10. Puchtler H, Meloan SN: On the chemistry of formaldehyde fix-ation and its effects on immunohistochemical reactions. His-tochemistry 1985, 82:201-204.
11. Zsikla V, Baumann M, Cathomas G: Effect of buffered formalin onamplification of DNA from paraffin wax embedded smallbiopsies using real-time PCR. J Clin Pathol 2004, 57:654-656.
12. Feldmann MY: Reactions of nucleic acids and nucleoproteinswith formaldehyde. Prog Nucleic Acid Res Mol Biol 1973, 13:1-49.
13. McGhee JD, von Hippel PH: Formaldehyde as a probe of DNAstructure. I. Reaction with exocyclic amino groups of DNAbases. Biochemistry 1975, 14:1281-1296.
14. McGhee JD, von Hippel PH: Formaldehyde as a probe of DNAstructure. II. Reaction with endocyclic imino groups of DNAbases. Biochemistry 1975, 14:1297-1303.
15. McGhee JD, von Hippel PH: Formaldehyde as a probe of DNAstructure. 3. Equilibrium denaturation of DNA and syntheticpolynucleotides. Biochemistry 1977, 16:3267-3276.
16. McGhee JD, von Hippel PH: Formaldehyde as a probe of DNAstructure. 4. Mechanism of the initial reaction of Formalde-hyde with DNA. Biochemistry 1977, 16:3276-3293.
17. Chang Y-T, Loew GH: Reaction Mechanisms of Formaldehydewith Endocyclic Imino Groups of Nucleic Acid Bases. J AmChem Soc 1994, 116:3548-3555.
18. Coombs NJ, Gough AC, Primrose JN: Optimisation of DNA andRNA extraction from archival formalin-fixed tissue. NucleicAcids Res 1999, 27:e12.
19. Srinivasan M, Sedmak D, Jewell S: Effect of fixatives and tissueprocessing on the content and integrity of nucleic acids. AmJ Pathol 2002, 161:1961-1971.
20. Tokuda Y, Nakamura T, Satonaka K, Maeda S, Doi K, Baba S, SugiyamaT: Fundamental study on the mechanism of DNA degrada-tion in tissues fixed in formaldehyde. J Clin Pathol 1990,43:748-751.
21. Williams C, Ponten F, Moberg C, Soderkvist P, Uhlen M, Ponten J, Sit-bon G, Lundeberg J: A high frequency of sequence alterations isdue to formalin fixation of archival specimens. Am J Pathol1999, 155:1467-1471.
22. Dick M, Bridge DM, Wheeler WC, DeSalle R: Collection and stor-age of invertebrate samples. Methods Enzymol 1993, 224:51-65.
23. Dean MD, Ballard JW: Factors affecting mitochondrial DNAquality from museum preserved Drosophila simulans. Entom-ologia Experimentalis et Applicata 2001, 98:279-283.
24. Mitchell D, Willerslev E, Hansen A: Damage and repair of ancientDNA. Mutation Research/Fundamental and Molecular Mechanisms ofMutagenesis 2005, 571:265-276.
25. Simmons JE: Herpetological collecting and collections management Soci-ety for the Study of Amphibians and Reptiles; 2002.
26. Figeys D, Renborg A, Dovichi NJ: Labeling of double-strandedDNA by ROX-dideoxycytosine triphosphate using terminaldeoxynucleotidyl transferase and separation by capillaryelectrophoresis. Anal Chem 1994, 66:4382-4383.
27. Jaruga P, Theruvathu J, Dizdaroglu M, Brooks PJ: Complete releaseof (5'S)-8,5'-cyclo-2'-deoxyadenosine from dinucleotides, oli-godeoxynucleotides and DNA, and direct comparison of itslevels in cellular DNA with other oxidatively induced DNAlesions. Nucleic Acids Res 2004, 32:e87.
28. Darst CR, Cannatella DC: Novel relationships among hyloidfrogs inferred from 12S and 16S mitochondrial DNAsequences. Mol Phylogenet Evol 2004, 31:462-475.
29. Brown DM, Todd AR: Nucleic acids. Annu Rev Biochem 1955,24:311-338.
30. Tamm C, Chargaff E: Physical and chemical properties of theapurinic acid of calf thymus. J Biol Chem 1953, 203:689-694.
31. Bayley CR, Brammer KW, Jones AS: 368. The nucleotidesequence in deoxyribonucleic acids. Part V. The alkaline deg-radation of apurinic acids. J Chem Soc 1961:1903-1907.
32. Amosova O, Coulter R, Fresco JR: Self-catalyzed site-specificdepurination of guanine residues within gene sequences. ProcNatl Acad Sci USA 2006, 103:4392-4397.
33. Masuda N, Ohnishi T, Kawamoto S, Monden M, Okubo K: Analysisof chemical modification of RNA from formalin-fixed sam-ples and optimization of molecular biology applications forsuch samples. Nucleic Acids Res 1999, 27:4436-4443.
34. Huang H, Hopkins PB: DNA interstrand cross-linking by formal-dehyde: nucleotide sequence preference and covalent struc-ture of the predominant cross-link formed in syntheticoligonucleotides. J Am Chem Soc 1993, 115:9402-9408.
35. Huang H, Solomon MS, Hopkins PB: Formaldehyde preferentiallyinterstrand cross-links duplex DNA through deoxyadenosineresidues at the sequence 5'-d(AT). J Am Chem Soc 1992,114:9240-9241.
36. Wang M, Cheng G, Villalta PW, Hecht SS: Development of LiquidChromatography Electrospray Ionization Tandem MassSpectrometry Methods for Analysis of DNA Adducts of For-maldehyde and Their Application to Rats Treated with N-Nitrosodimethylamine or 4-(Methylnitrosamino)-1-(3-pyri-dyl)-1-butanone. Chem Res Toxicol 2007, 20:1141-1148.
37. Lindahl T, Nyberg B: Rate of depurination of native deoxyribo-nucleic acid. Biochemistry 1972, 11:3610-3618.
Page 13 of 13(page number not for citation purposes)
Copyright © 2022 FDOKUMEN