
microgrid intelligent management system based on a multi ...
416
i µGIM microgrid intelligent management system based on a multi-agent approach and the active participation of end-users Luis Filipe de Oliveira Gomes Computer Engineering Doctoral Programme of University of Salamanca June 2020
-
Upload
khangminh22 -
Category
Documents
-
view
1 -
download
0
Transcript of microgrid intelligent management system based on a multi ...
i
µGIM microgrid intelligent management system
based on a multi-agent approach and the active
participation of end-users
Luis Filipe de Oliveira Gomes
Computer Engineering Doctoral Programme of University of Salamanca
June 2020

ii
© Luis Gomes, 2020
µGIM – microgrid intelligent management
system based on a multi-agent approach and
the active participation of end-users
Student: Luis Filipe de Oliveira Gomes
Supervisor: Zita Maria Almeida do Vale
Co-supervisor: Juan Manuel Corchado Rodríguez

iii
µGIM
Scan me


v
Acknowledgements
This work it would not be possible without the opportunities and collaborations along the PhD. Therefore, I would like to express my gratitude to the Fundação para a Ciência e a Tecnologia (FCT) that give me a scholarship grant that allowed me to apply and take my PhD, the Research Group on Intelligent Engineering and Computing for Advanced Innovation and Development (GECAD) where I did my work and that always demonstrate availability and support to my ideas, the University of Salamanca that allowed me to have an amazing PhD experience, my supervisor Professor Juan Corchado that always proved available, and a special thank must be given to my supervisor Professor Zita Vale that guide me, help me and motivate me along these years, and for that reason I thank you.
I would also like to thank GECAD’s team for the support, special to Omid Abrishambaf and Pedro Faria that voluntarily accepted the challenge to install the main PhD solution (S4E) in their homes. And because the PhD is a journey, I would also like to thank everyone that in one way or the other help me or who did part of this journey.
Personally, I would like to thank all the people that, directly or indirectly, turned this experience possible. Without people to support us, nothing makes sense and some people make all the difference in our life. I really like to thank those that shared their time with me, especially those who unfortunately cannot share more time in this world.

vii
Abstract Power and energy systems are changing their traditional paradigm, from centralized systems to
decentralized systems. The emergence of smart grids allows the integration of decentralized energy resources and promotes inclusive management involving the end-users, driven by demand-side management, transactive energy, and demand response. In this new paradigm of smart grids, the stability and quality of the service provided by the grid are harder to get because there is no single centralized operation room where all decisions are made. To successfully implement smart grids, it is necessary to combine efforts between electrical engineering and computer engineering. Electrical engineering must ensure the right physical operation of the smart grids and of their components, establishing the basis for adequate monitoring, control, management, and operation methods. Computer engineering plays a major role in providing the right computational models and tools to manage and operate the smart grid and its constituent parts, adequately representing all the different players that are involved. These models must consider the players’ individual and common goals that provide the foundations for ensuring competitive and cooperative interactions able to satisfy the individual players as well as meeting common requirements regarding the technical, environmental, and economic sustainability of the system.
The distributed nature of smart grids enables, incentivises, and highly benefits from the active participation of end-users, from large players to smaller players, such as residential consumers. One of the main issues in electric grids planning and operation is the variation of energy demand, which often more than doubles during on-peak hours when compared with off-peak demand. Traditionally, this variation resulted in the construction of power generation plants, and in high investments in network lines and substations. The massive use of renewable energy sources brings volatility to the generation-side, making it harder to balance consumption and generation. The active participation of smart grid players, enabled by transactive energy and demand response, can provide flexibility on the demand side, easing the system operation and coping with the increasing renewables share.
In the scope of smart grids, it is possible to build and operate smaller grids, named microgrids. Those are geographically bounded grids with local management and operation. They can be seen as restricted geographical areas for which the electric grid usually operates physically connected to the main grid but can also operate in islanded mode, providing independence from the main grid.
This PhD research, conducted under the Computer Engineering Doctoral Programme of the University of Salamanca, addressed the study and analysis of microgrid management, considering the active participation of end-users, and the energy management of end-users’ electrical loads and energy resources. This PhD research studied the use of computer engineering concepts, particularly from the field of artificial intelligence, to support the management of microgrids, proposing a microgrid intelligent management system (µGIM) based on a multi-agent approach and on the active participation of end-users. This solution is composed of three systems, combining hardware and software: the virtual to reality (V2R) emulator, the internet of things environmental awareness smart plug (EnAPlug), and the agent-based single-board computer for energy (S4E) to enable demand-side management and transactive energy. These systems were conceived, developed, and tested to enable the validation of microgrid management methodologies, namely for the active participation of end-users, and for the intelligent resource optimization.
This document presents the major models and results obtained during this PhD research, regarding state-of-the-art analysis, systems conception, systems development, experimentation results, and main findings. The systems were tested in real scenarios, from laboratory to pilot sites. In total, this PhD research accounted for twenty published papers, of which nine in journals. This PhD research made contributions to two H2020 projects (DOMINOES, and DREAM-GO), two ITEA projects (M2MGrids, and SPEAR), three Portuguese projects (SIMOCE, NetEffiCity, and AVIGAE), and one H2020 cascade funding project (Eco-Rural-IoT).
Keywords: Deep learning, Demand-side management, Internet of things, Microgrids, Multi-agent systems, Transactive energy


ix
Resumen Los sistemas de potencia y energía están cambiando su paradigma tradicional, de sistemas
centralizados a sistemas descentralizados. La aparición de redes inteligentes permite la integración de recursos energéticos descentralizados y promueve la gestión inclusiva que involucra a los usuarios finales, impulsada por la gestión del lado de la demanda, la energía transactiva y la respuesta a la demanda. Garantizar la escalabilidad y la estabilidad del servicio proporcionado por la red, en este nuevo paradigma de redes inteligentes, es más difícil porque no hay una única sala de operaciones centralizada donde se tomen todas las decisiones. Para implementar con éxito redes inteligentes, es necesario combinar esfuerzos entre la ingeniería eléctrica y la ingeniería informática. La ingeniería eléctrica debe garantizar el correcto funcionamiento físico de las redes inteligentes y de sus componentes, estableciendo las bases para un adecuado monitoreo, control, gestión, y métodos de operación. La ingeniería informática desempeña un papel importante al proporcionar los modelos y herramientas computacionales adecuados para administrar y operar la red inteligente y sus partes constituyentes, representando adecuadamente a todos los diferentes actores involucrados. Estos modelos deben considerar los objetivos individuales y comunes de los actores que proporcionan las bases para garantizar interacciones competitivas y cooperativas capaces de satisfacer a los actores individuales, así como cumplir con los requisitos comunes con respecto a la sostenibilidad técnica, ambiental y económica del Sistema.
La naturaleza distribuida de las redes inteligentes permite, incentiva y beneficia enormemente la participación activa de los usuarios finales, desde actores grandes hasta actores más pequeños, como los consumidores residenciales. Uno de los principales problemas en la planificación y operación de redes eléctricas es la variación de la demanda de energía, que a menudo se duplica más que durante las horas pico en comparación con la demanda fuera de pico. Tradicionalmente, esta variación dio como resultado la construcción de plantas de generación de energía y grandes inversiones en líneas de red y subestaciones. El uso masivo de fuentes de energía renovables implica mayor volatilidad en lo relativo a la generación, lo que hace que sea más difícil equilibrar el consumo y la generación. La participación de los actores de la red inteligente, habilitada por la energía transactiva y la respuesta a la demanda, puede proporcionar flexibilidad en desde el punto de vista de la demanda, facilitando la operación del sistema y haciendo frente a la creciente participación de las energías renovables.
En el ámbito de las redes inteligentes, es posible construir y operar redes más pequeñas, llamadas microrredes. Esas son redes geográficamente limitadas con gestión y operación local. Pueden verse como áreas geográficas restringidas para las cuales la red eléctrica generalmente opera físicamente conectada a la red principal, pero también puede operar en modo isla, lo que proporciona independencia de la red principal.
Esta investigación de doctorado, realizada bajo el Programa de Doctorado en Ingeniería Informática de la Universidad de Salamanca, aborda el estudio y el análisis de la gestión de microrredes, considerando la participación activa de los usuarios finales y la gestión energética de lascarga eléctrica y los recursos energéticos de los usuarios finales. En este trabajo de investigación se ha analizado el uso de conceptos de ingeniería informática, particularmente del campo de la inteligencia artificial, para apoyar la gestión de las microrredes, proponiendo un sistema de gestión inteligente de microrredes (µGIM) basado en un enfoque de múltiples agentes y en la participación activa de usuarios. Esta solución se compone de tres sistemas que combinan hardware y software: el emulador de virtual a realidad (V2R), el enchufe inteligente de conciencia ambiental de Internet de las cosas (EnAPlug), y la computadora de placa única para energía basada en el agente (S4E) para permitir la gestión del lado de la demanda y la energía transactiva. Estos sistemas fueron concebidos, desarrollados y probados para permitir la validación de metodologías de gestión de microrredes, es decir, para la participación de los usuarios finales y para la optimización inteligente de los recursos.
Este documento presenta todos los principales modelos y resultados obtenidos durante esta investigación de doctorado, con respecto a análisis de vanguardia, concepción de sistemas, desarrollo de sistemas, resultados de experimentación y descubrimientos principales. Los sistemas se han evaluado en escenarios reales, desde laboratorios hasta sitios piloto. En total, se han publicado veinte artículos científicos, de los cuales nueve se han hecho en revistas especializadas. Esta investigación de doctorado realizó contribuciones a dos proyectos H2020 (DOMINOES y DREAM-GO), dos proyectos ITEA (M2MGrids y SPEAR), tres proyectos portugueses (SIMOCE, NetEffiCity y AVIGAE) y un proyecto con financiación en cascada H2020 (Eco-Rural -IoT).
Palabras claves: Aprendizaje profundo, gestión del lado de la demanda, Internet de las cosas, microrredes, sistemas de agentes, energía transactiva.


xi
Resumo O paradigma tradicional dos sistemas de energia tem sofrido alterações relevantes, passando de
um sistema centralizado para um sistema descentralizado. O aparecimento das redes inteligentes veio permitir a integração de recursos de energia descentralizados e promover a gestão inclusiva envolvendo os utilizadores finais, através da gestão no lado da procura (demand-side management), da energia transitiva (transactive energy) e de programas de gestão ativa de carga (demand response). Neste novo paradigma de redes inteligentes, a garantia de estabilidade e qualidade do serviço é dificultada pela ausência de um local de operação central onde todas as decisões sejam tomadas. O sucesso da implementação das redes inteligentes exige a combinação de esforços entre engenharia eletrotécnica e engenharia informática. A engenharia eletrotécnica deverá garantir a operação correta das redes inteligentes e dos seus componentes, estabelecendo as bases para monitorização, controlo, gestão e operação adequadas. A engenharia informática desempenha um papel fundamental, fornecendo os modelos e ferramentas computacionais necessários para a gestão e operação da rede inteligente e das suas partes constituintes, com modelos adequados de todas as entidades envolvidas. Esses modelos devem considerar os objetivos individuais e coletivos dessas entidades e permitir as interações competitivas e cooperativas necessárias para atingir os objetivos coletivos relacionados com a sustentabilidade técnica, ambiental e económica do sistema.
A natureza distribuída das redes inteligentes permite, incentiva e beneficia a participação ativa dos utilizadores finais, de grande e pequena dimensão, tais como os consumidores residenciais. Um dos maiores desafios na gestão das redes de energia é a variação da procura, que muitas vezes mais do que duplica durante os períodos de cheia, quando comparada com a procura nos períodos de vazio. Tradicionalmente, essa variação resulta na construção de centrais adicionais de geração de energia e em investimentos elevados em linhas e subestações. O uso massivo de energias renováveis conduz a uma maior volatilidade no lado da geração, dificultando assim o equilíbrio entre consumo e geração. A participação ativa das entidades envolvidas nas redes inteligentes, viabilizada pela energia transitiva e pela gestão ativa de carga, fornece flexibilidade no lado da procura, facilitando a operação do sistema e permitindo o uso intensivo de energias renováveis.
No âmbito das redes inteligentes, é possível surgirem redes de menor dimensão, denominadas micro-redes. Estas são redes geograficamente delimitadas e com gestão e operação locais. As micro-redes podem ser vistas como áreas geográficas restritas que normalmente operam ligadas à rede principal, mas que permitem também a operação em ilha, desconectadas da rede principal.
A investigação realizada no âmbito da presente tese de doutoramento, a qual decorreu enquadrada no Programa de Doutoramento em Engenharia Informática da Universidade de Salamanca, abordou o estudo e a análise da gestão de micro-redes, considerando a participação ativa dos utilizadores finais e a gestão dos recursos destes utilizadores. Este doutoramento estudou o uso de conceitos de engenharia informática, nomeadamente da área da inteligência artificial, para apoiar a gestão de micro-redes, propondo um sistema de gestão inteligente de micro-redes (µGIM) baseado numa abordagem multiagente e na participação ativa dos utilizadores finais. Esta solução é composta por três sistemas que combinam hardware e software: o emulador virtual to reality (V2R), a tomada inteligente environmental awareness smart plug (EnAPlug) e a solução baseada em agentes single-board computer for energy (S4E) que permite a gestão no lado da procura e energia transitiva. Estes sistemas foram concebidos, desenvolvidos e testados para permitir a validação de metodologias de gestão de micro-redes, nomeadamente para a participação ativa dos utilizadores finais e para a otimização inteligente de recursos.
Este documento apresenta os principais modelos e resultados obtidos durante os trabalhos de doutoramento, particularmente o estado da arte, conceção de sistemas, desenvolvimento de sistemas, resultados de experimentação e principais conclusões. Os sistemas foram testados em cenários reais em laboratório e em instalações piloto. A investigação realizada no âmbito deste doutoramento deu origem à publicação de vinte artigos científicos, dos quais nove em revistas internacionais. A investigação realizada contribuiu para dois projetos H2020 (DOMINOES e DREAM-GO), dois projetos ITEA (M2MGrids e SPEAR), três projetos Portugueses (SIMOCE, NetEffiCity e AVIGAE) e um projeto com financiamento em cascata do H2020 (Eco-Rural -IoT).
Palavras-chave: Aprendizagem em profundidade, Energia transitiva, Gestão no lado da procura, Internet das coisas, Micro-redes, Sistemas multiagente

xiii
Index ACKNOWLEDGEMENTS ...................................................................................................................... V
ABSTRACT.......................................................................................................................................... VII
RESUMEN ............................................................................................................................................ IX
RESUMO .............................................................................................................................................. XI
INDEX ................................................................................................................................................. XIII
INDEX OF TABLES ............................................................................................................................. XV
INDEX OF FIGURES ......................................................................................................................... XVII
ACRONYMS ........................................................................................................................................... 1
CHAPTER I INTRODUCTION................................................................................................................. 1
I.1. MOTIVATION ..................................................................................................................................... 2
I.2. RESEARCH QUESTIONS ..................................................................................................................... 4
I.3. PHD CONTEXT ................................................................................................................................. 4
I.4. THESIS ORGANIZATION .................................................................................................................... 10
CHAPTER II CONTEXT ........................................................................................................................ 11
II.1. DEMAND-SIDE MANAGEMENT .......................................................................................................... 12
II.2. TRANSACTIVE ENERGY AND DEMAND RESPONSE ............................................................................... 13
II.3. MICROGRIDS................................................................................................................................. 16
II.4. MULTI-AGENT SYSTEMS APPLICATIONS IN ENERGY MANAGEMENT SYSTEMS .......................................... 20
II.5. INTERNET OF THINGS APPLIED IN ENERGY MANAGEMENT SYSTEMS ...................................................... 23
II.6. SINGLE-BOARD COMPUTERS ........................................................................................................... 25
II.7. COMPETITOR ANALYSIS .................................................................................................................. 26
dEF-Pi and EF-Pi ................................................................................................................ 26
VOLTTRON ......................................................................................................................... 27
RIAPS ................................................................................................................................. 28
II.8. SOFTWARE LICENSES..................................................................................................................... 29
CHAPTER III PROPOSED SYSTEMS .................................................................................................. 31
III.1. INTRODUCTION ............................................................................................................................. 32
III.2. VIRTUAL TO REALITY (V2R) EMULATOR ........................................................................................... 32
V2R architecture ................................................................................................................ 33
V2R discrete simulation ..................................................................................................... 34
V2R variable simulation ..................................................................................................... 35
V2R graph emulation ......................................................................................................... 35
V2R contextual emulation .................................................................................................. 35
V2R mirroring representation ............................................................................................. 36
V2R OPAL-RT representation ............................................................................................ 36
Interaction with V2R ........................................................................................................... 36
V2R configuration parameters ........................................................................................... 38
III.3. ENVIRONMENTAL AWARENESS SMART PLUG (ENAPLUG) ................................................................... 39
Market analysis .................................................................................................................. 40
EnAPlug AM architecture (microcontroller) ........................................................................ 42
EnAPlug SB architecture (single-board computer) ............................................................. 43
EnAPlug SB deep learning ................................................................................................. 47
EnAPlug SB shared knowledge ......................................................................................... 48
EnAPlug SB printable product ............................................................................................ 50
III.4. SINGLE-BOARD COMPUTER FOR ENERGY (S4E)............................................................................... 51
S4E domain model ............................................................................................................. 52
S4E architecture ................................................................................................................ 54
S4E ready-to-use energy strategies ................................................................................... 66
S4E transactive energy ...................................................................................................... 73
S4E configuration and execution ....................................................................................... 75
S4E code structure............................................................................................................. 81
S4E licenses ...................................................................................................................... 83
S4E single-board computers compatibility ......................................................................... 84
S4E special agent for microgrid visualization ..................................................................... 87
Luis Gomes
xiv
CHAPTER IV DEPLOYMENTS AND CASE STUDIES ........................................................................ 88
IV.1. INTRODUCTION ............................................................................................................................ 89
IV.2. V2R EXPERIMENTATIONS .............................................................................................................. 89
Simulation and emulation experimentation ........................................................................ 90
SCADA integration experimentation .................................................................................. 91
SOICAM microgrid case study ........................................................................................... 94
IV.3. ENAPLUG EXPERIMENTATIONS ...................................................................................................... 97
Energy management system integration experimentation with EnAPlug AM ..................... 97
Monitoring and learning experimentation with EnAPlug SB ............................................. 101
Residential air conditioner management using the shared knowledge of Enaplug SB..... 106
IV.4. S4E EXPERIMENTATIONS ............................................................................................................ 111
Office deployment case study .......................................................................................... 112
Microgrid with transactive energy case study .................................................................. 117
Multi-building deployments .............................................................................................. 125
CHAPTER V CONCLUSIONS ............................................................................................................ 131
V.1. MAIN CONCLUSIONS AND CONTRIBUTIONS ...................................................................................... 132
Research questions .......................................................................................................... 133
Proposed solutions ........................................................................................................... 134
V.2. LOOKING FORWARD ..................................................................................................................... 136
V2R emulator .................................................................................................................... 137
EnAPlug ............................................................................................................................ 137
S4E ................................................................................................................................... 138
REFERENCES .................................................................................................................................... 139
ANNEXES ........................................................................................................................................... 167

xv
Index of tables TABLE 1. V2R REGISTER MAP ----------------------------------------------------------------------------------------------- 37 TABLE 2. SMART PLUG’S MARKET ANALYSIS ------------------------------------------------------------------------------- 41 TABLE 3. ENAPLUG’S KNOWLEDGE QUESTIONS -------------------------------------------------------------------------- 47 TABLE 4. ROOM’S KNOWLEDGE QUESTIONS ------------------------------------------------------------------------------- 49 TABLE 5. BALANCING ENERGY STRATEGY’S CONTEXTUAL CONFIGURATION ------------------------------------------- 72 TABLE 6. LICENCES USED IN S4E ------------------------------------------------------------------------------------------ 84 TABLE 7. RNN CONFIGURATIONS FOR THE REFRIGERATOR ENAPLUG FORECAST -------------------------------- 102 TABLE 8. RNN CONFIGURATIONS FOR THE DESK LAMP ENAPLUG FORECAST ------------------------------------- 103 TABLE 9. ENAPLUG'S FORECASTING RESULTS -------------------------------------------------------------------------- 104 TABLE 10. CONFIGURATION 1.1.2 WITH 20 HIDDEN NEURONS --------------------------------------------------------- 105 TABLE 11. CONFIGURATION 1.2.2 WITH 10 HIDDEN NEURONS ---------------------------------------------------------- 105 TABLE 12. CONFIGURATION 1.2.4 WITH 5 HIDDEN NEURONS ----------------------------------------------------------- 105 TABLE 13. CONFIGURATION 2.1 WITH 20 HIDDEN NEURONS ------------------------------------------------------------ 105 TABLE 14. ENAPLUG'S CONTROLLABLE LOAD DESCRIPTION ------------------------------------------------------------ 107 TABLE 15. ACU ENAPLUG STEP ACTIONS -------------------------------------------------------------------------------- 108
TABLE 16. 𝛽𝑟𝑜𝑜𝑚1 FOR EACH ROOM AT 20:00 -------------------------------------------------------------------------- 109 TABLE 17. TWO-BEDROOM APARTMENT MONTHLY RESULT --------------------------------------------------------------- 110 TABLE 18. RESOURCES DESCRIPTION INTEGRATED IN S4E ------------------------------------------------------------- 113 TABLE 19. SENSORS DESCRIPTION INTEGRATED IN S4E ----------------------------------------------------------------- 113 TABLE 20. S4E OVERALL RESULTS FOR THE THREE-DAY EXPERIMENTATION IN THE OFFICE DEPLOYMENT -------- 117 TABLE 21. MICROGRID’S OVERALL WEEKLY RESULTS -------------------------------------------------------------------- 124

xvii
Index of figures FIGURE 1. ENERGY MANAGEMENT MATRIX PROPOSED IN (KOK, 2016) ------------------------------------------------ 14 FIGURE 2. MICROGRID CHARACTERIZATION -------------------------------------------------------------------------------- 19 FIGURE 3. MAS ORGANIZATIONS -------------------------------------------------------------------------------------------- 22 FIGURE 4. µGIM UMBRELLA SOLUTIONS ------------------------------------------------------------------------------------ 32 FIGURE 5. V2R SOFTWARE ARCHITECTURE -------------------------------------------------------------------------------- 33 FIGURE 6. V2R HARDWARE: A) COMPONENTS DETAIL, B) V2R FINAL ASSEMBLY -------------------------------------- 34 FIGURE 7. V2R HARDWARE MANUAL USER INTERACTION ---------------------------------------------------------------- 37 FIGURE 8. V2R MANUAL EMULATOR MENU --------------------------------------------------------------------------------- 37 FIGURE 9. µGIM CONTROL PANEL WEBSITE -------------------------------------------------------------------------------- 38 FIGURE 10. V2R CONFIGURATION BLOCK ----------------------------------------------------------------------------------- 39 FIGURE 11. ARCHITECTURE OF ENAPLUG AM ----------------------------------------------------------------------------- 42 FIGURE 12. OVERVIEW OF ENAPLUG SB ----------------------------------------------------------------------------------- 44 FIGURE 13. SOFTWARE ARCHITECTURE OF ENAPLUG SB ---------------------------------------------------------------- 44 FIGURE 14. SHARED KNOWLEDGE PROCESS -------------------------------------------------------------------------------- 48 FIGURE 15. ENAPLUG'S REQUESTING PEER'S KNOWLEDGE -------------------------------------------------------------- 48 FIGURE 16. ENAPLUG 3D MODEL: A) 3D MODEL; B) PRINTED PROTOTYPE --------------------------------------------- 51 FIGURE 17. S4E AGENTS’ DOMAIN MODEL ---------------------------------------------------------------------------------- 53 FIGURE 18. S4E AGENTS’ ARCHITECTURE ---------------------------------------------------------------------------------- 54 FIGURE 19. S4E'S DEFAULT GUI --------------------------------------------------------------------------------------------- 58 FIGURE 20. MAX485 CIRCUIT USED IN S4E -------------------------------------------------------------------------------- 61 FIGURE 21. S4E'S NOTATION FOR PERIODIC ACTIONS --------------------------------------------------------------------- 64 FIGURE 22. HOUR-AHEAD CONSUMPTION FORECAST RESULTS FOR ONE WEEK ---------------------------------------- 68 FIGURE 23. LIGHT PRIORITY FOR 𝑠𝑚𝑜𝑜𝑡ℎ = 70 ---------------------------------------------------------------------------- 70
FIGURE 24. HVAC PRIORITY (𝑠𝑚𝑜𝑜𝑡ℎ = 2) -------------------------------------------------------------------------------- 71 FIGURE 25. S4E'S P2P TRANSACTIONS FLOW ----------------------------------------------------------------------------- 76 FIGURE 26. SINGLE-BOARD COMPUTER CONFIGURATION ----------------------------------------------------------------- 75 FIGURE 27. S4E CONNECTIVETY CONFIGURATION: JGROUPS AND JADE ---------------------------------------------- 77 FIGURE 28. STORAGE CONFIGURATION: LOCAL AND REMOTE ------------------------------------------------------------- 77 FIGURE 29. RESOURCE’S INTEGRATION CONFIGURATION: AN HTTP API EXAMPLE ----------------------------------- 78 FIGURE 30. BUILDING’S ZONES CONFIGURATION --------------------------------------------------------------------------- 79 FIGURE 31. ENERGY STRATEGIES CONFIGURATION ------------------------------------------------------------------------ 79 FIGURE 32. OPENADR CONFIGURATION ------------------------------------------------------------------------------------ 80 FIGURE 33. TRANSACTIVE ENERGY CONFIGURATION: AUCTIONEER-SIDE ----------------------------------------------- 80 FIGURE 34. TRANSACTIVE ENERGY CONFIGURATION: PARTICIPANT-SIDE------------------------------------------------ 81 FIGURE 35. JAVA'S PACKAGE STRUCTURE ----------------------------------------------------------------------------------- 82 FIGURE 36. SBC BOARD'S SIZE ----------------------------------------------------------------------------------------------- 86 FIGURE 37. MICROGRID'S CONSUMPTION AND GENERATION -------------------------------------------------------------- 87 FIGURE 38. DISCRETE EMULATION WITHOUT RANDOM DEVIATION -------------------------------------------------------- 90 FIGURE 39. DISCRETE EMULATION WITH 2 % RANDOM DEVIATION ------------------------------------------------------- 90 FIGURE 40. GRAPH EMULATION OF A REFRIGERATOR WITHOUT RANDOM DEVIATION (SIMULATED-TIME) ------------ 91 FIGURE 41. GRAPH EMULATION OF A REFRIGERATOR WITH 2 % RANDOM DEVIATION (REAL-TIME) ------------------ 91 FIGURE 42. V2R DEPLOYMENT CONFIGURATION --------------------------------------------------------------------------- 92 FIGURE 43. V2R DEPLOYMENT INSTALLATION (CONNECTION SCHEMA) ------------------------------------------------- 92 FIGURE 44. V2R DEPLOYMENT INSTALLATION (PHOTOGRAPH) (GOMES, 2016) --------------------------------------- 93 FIGURE 45. V2R MAX485 CIRCUIT ------------------------------------------------------------------------------------------ 93 FIGURE 46. THEORETICAL CONSUMPTION OF V2R HEATER (GOMES, 2016) ------------------------------------------- 93 FIGURE 47. TOTAL CONSUMPTION OF THE ALT LABORATORY (GOMES, 2016)----------------------------------------- 94 FIGURE 48. STRUCTURAL REPRESENTATION OF MASGRIP WITH SOICAM AND V2R (GOMES, 2019A) ---------- 95 FIGURE 49. MONITORING RESULTS ------------------------------------------------------------------------------------------- 95 FIGURE 50. DR EVENT IN BUILDING N AGENT ------------------------------------------------------------------------------- 96 FIGURE 51. DR EVENT IN EMULATED BUILDING AGENT -------------------------------------------------------------------- 96 FIGURE 52. S4E DEPLOYMENT FOR MONITORING PROPOSES, USING V2R AND ENAPLUGS ------------------------- 98 FIGURE 53. ENAPLUGS AM DEPLOYMENT ---------------------------------------------------------------------------------- 99 FIGURE 54. ENAPLUG REFRIGERATOR DEPLOYMENT: A) INSIDE SENSORS; B) ENAPLUG; C) C2C ----------------- 99 FIGURE 55. ENAPLUG MONITORING RESULTS, FROM 14:00 TO 15:00 ------------------------------------------------ 100 FIGURE 56. ENAPLUG REFRIGERATOR READINGS ----------------------------------------------------------------------- 100 FIGURE 57. ENAPLUG WATER HEATER READINGS ------------------------------------------------------------------------ 100 FIGURE 58. RNN CONFIGURATIONS' NOTATION --------------------------------------------------------------------------- 101 FIGURE 59. TWO-BEDROOM APARTMENT BLUEPRINT -------------------------------------------------------------------- 107 FIGURE 60. ACU ENAPLUG CONTROL DECISION ------------------------------------------------------------------------ 108 FIGURE 61. 𝛽𝑟𝑜𝑜𝑚1 FOR EACH ROOM AT EACH TIME (0 %-100 %) -------------------------------------------------- 109 FIGURE 62. TWO-BEDROOM APARTMENT HOURLY CONSUMPTION ------------------------------------------------------ 109

Luis Gomes
xviii
FIGURE 63. WORKPLACE SENSOR HUB ------------------------------------------------------------------------------------- 112 FIGURE 64. OFFICE'S ZONES AND RESOURCES LOCATION ---------------------------------------------------------------- 113 FIGURE 65. OFFICE PROFILE DURING THE SUMMER DAY ------------------------------------------------------------------ 114 FIGURE 66. OFFICE PROFILE DURING THE WINTER DAY ------------------------------------------------------------------- 114 FIGURE 67. OFFICE PROFILE DURING THE CLOUDY DAY ------------------------------------------------------------------ 115 FIGURE 68. OFFICE PROFILE DURING THE CLOUDY DAY (CLOSEUP) ----------------------------------------------------- 115 FIGURE 69. OFFICE HEATER PROFILE DURING THE SUMMER DAY -------------------------------------------------------- 115 FIGURE 70. OFFICE HEATER PROFILE DURING THE WINTER DAY --------------------------------------------------------- 115 FIGURE 71. OFFICE HEATER PROFILE DURING THE CLOUDY DAY -------------------------------------------------------- 116 FIGURE 72. GECAD'S BUILDING N ----------------------------------------------------------------------------------------- 118 FIGURE 73. BUILDING N SCADA SYSTEM HARDWARE ------------------------------------------------------------------- 119 FIGURE 74. BUILDING N SBCS DEPLOYMENT ---------------------------------------------------------------------------- 120 FIGURE 75. Z.0 AGENT WEEK METERING ---------------------------------------------------------------------------------- 121 FIGURE 76. L.1 AGENT WEEK METERING ----------------------------------------------------------------------------------- 121 FIGURE 77. L.2 AGENT WEEK METERING ----------------------------------------------------------------------------------- 121 FIGURE 78. L.3 AGENT WEEK METERING ----------------------------------------------------------------------------------- 121 FIGURE 79. R.2 AGENT WEEK METERING ---------------------------------------------------------------------------------- 121 FIGURE 80. MICROGRID’S WEEKLY ENERGY PROFILE (NOT CONSIDERING P2P TRANSACTIONS) ------------------ 122 FIGURE 81. MICROGRID’S WEEKLY ENERGY PROFILE -------------------------------------------------------------------- 122 FIGURE 82. AGENT’S WEEKLY CONSUMPTION AND ENERGY COST (NOT CONSIDERING P2P TRANSACTIONS) ---- 122 FIGURE 83. AGENT’S WEEKLY CONSUMPTION AND ENERGY COST ------------------------------------------------------ 123 FIGURE 84. WEEKLY WRONG P2P TRANSACTIONS PERFORMED BY AGENTS, AND FORECAST MAPE ERRORS -- 123 FIGURE 85. WEEKLY ENERGY TRANSACTED IN WRONG P2P TRANSACTIONS ----------------------------------------- 124 FIGURE 86. DEPLOYMENT OF S4E IN RESIDENTIAL BUILDINGS --------------------------------------------------------- 126 FIGURE 87. POWER CONSUMPTION FOR ONE WEEK ---------------------------------------------------------------------- 127 FIGURE 88. POWER CONSUMPTION IN HOUSE 1 FOR ONE WEEK ------------------------------------------------------- 127 FIGURE 89. ENERGY CONSUMPTION FOR ONE WEEK --------------------------------------------------------------------- 127 FIGURE 90. HOUSE 1 HOUR-AHEAD FORECAST --------------------------------------------------------------------------- 127 FIGURE 91. HOUSE 2 HOUR-AHEAD FORECAST --------------------------------------------------------------------------- 128 FIGURE 92. HOUSE 3 HOUR-AHEAD FORECAST --------------------------------------------------------------------------- 128

1
Acronyms
AC alternating current
ACL agent communication language
ACU air-conditioner unit
AI artificial intelligence
AMQP advanced message queuing protocol
ANN artificial neural networks
API application programming interface
C2C click to control
CAGR compound annual growth rate
CSP curtailment service providers
DALI digital addressable lighting interface
DC direct current
DDS data distribution service
dEF-Pi distributed energy flexibility platform and interface
DF directory facilitator
DL4J deep learning for Java
DLC direct load control
DLT distributed ledger technology
DR demand response
DSM demand-side management
EF-Pi energy flexibility platform and interface
EMS energy management system
EnAPlug environmental awareness smart plug
EPRI Electric Power Research Institute
FAN Flexible Power Alliance Network
FIFO first in first out
FIPA Foundation for Intelligent Physical Agents
FM frequency modulation
GECAD Research Group on Intelligent Engineering and Computing for Advanced Innovation and Development
GHE Global Himalayan Expedition
GLPK GNU linear programming kit
GPIO general-purpose input/output
GVE Green Village Electricity
HDMI high-definition multimedia interface
HIL hardware-in-the-loop
HTTP hypertext transfer protocol
Luis Gomes
2
HVAC heating, ventilation, and air conditioning
IoT internet of things
IP internet protocol
ISO independent system operator
JADE Java agent development framework
JOM Java optimization modeler
JSON JavaScript object notation
LAN local area network
LP linear programming
LSTM long short-term memory units
MAS multi-agent system
MASGriP multi-agent smart grid simulation platform
MIP mixed integer programming
MQTT message queuing telemetry transport
NIC network interface controller
OpenADR automated demand response
OS operating system
P2P peer-to-peer
PHIL power hardware-in-the-loop
PLC programmable logic controller
PREC Puerto Rico Energy Commission
RES renewable energy sources
RF radio frequency
RIAPS resilient information architecture platform for smart grid
RMA remote monitoring agent
RNN recurrent neural network
RPC remote procedure call
RTC real-time clock
RT-DRP real-time demand response program
RTDS real-time digital simulators
S4E single-board computer for energy
SBC single-board computers
SCADA supervisory control and data acquisition
SD decure digital
SMB server message block
SoC system-on-a-chip
SOICAM scada office intelligent context awareness management
SPIDERS Smart Power Infrastructure Demonstration for Energy Reliability and Security
SQL structured query language
SSH secure shell

3
STOMP streaming text oriented messaging protocol
TE transactive energy
UART universal asynchronous receiver-transmitter
UCSD University of California in San Diego
UPS uninterruptible power supply
URI uniform resource identifier
V2R virtual to reality
VEN virtual end node
VPN virtual private network
VPP virtual power plants
VTN virtual top nodes
WLAN wireless local area network


1
Chapter I
I. Introduction
CHAPTER INDEX
I.1. MOTIVATION ..................................................................................................................................... 2
I.2. RESEARCH QUESTIONS ..................................................................................................................... 4
I.3. PHD CONTEXT ................................................................................................................................. 4
I.4. THESIS ORGANIZATION .................................................................................................................... 10

Luis Gomes
2
I.1. Motivation
Power and energy systems are under significant changes and are evolving from centralized management systems to distributed management systems. The smart grid concept drives power and energy systems decentralization by promoting renewable energy sources and distributed energy resources. The decentralization enables the appearance of small communities that should join forces to participate in the smart grid. Microgrids are small communities (when compared to smart grids) where individual and independent players can interact among them considering their own needs and the microgrid needs. A microgrid is able to manage its own energy resources and loads, generate its own energy, and possibly operate in islanded-mode, without connection to the main grid.
The development of microgrids brings advantages to both the microgrids’ end-users and for the smart grid (Hosseini, 2018)(Srivastava, 2018a). There are several international and national-level projects for the development of microgrids, demonstrating their advantages in operation, management and reliability (Marnay, 2014). However, the functionalities currently considered for microgrids are not yet sufficiently exploited, and there is a clear need for innovative and efficient methodologies for energy management (Strasser, 2015). The current state-of-the-art includes important contributions to microgrid’s equipment and resources, but it lacks individual representation of players and collective management models. Although a microgrid can be seen as a single player in the smart grid, the individual players/end-users that compose the microgrid must be considered when managing the microgrid. The context, needs, and goals of each end-user must not be disregarded.
The development of microgrids is a growing market. In 2017, the microgrid market was evaluated
in USD 17 billion, and in 2023 the expected evaluation is USD 33 billion (IMARC Group, 2018),
representing an annual growth of 11.5 %. The solid grow of this market puts microgrids in the spot
of new companies and research and development projects, trying to explore this emerging market.
The development of microgrids is also a key factor for the integration of distributed energy generators
and renewable energy sources. The wide use of renewable sources creates challenges that the
current management models are not ready to give answer to (Muruganantham, 2017).
There are several players interacting with a microgrid, such as the microgrid operator, consumers,
producers, prosumers, and aggregators (Faria, 2014). Players have individual goals and collective
goals that they try to reach using their internal energy resources and loads or by interacting with
other players. For instance, a consumer in a microgrid can have the individual goal of finding the
lowest energy price possible to fulfill his needs and the collective goal of having a stable microgrid.
Microgrids and smart grids can be computationally represented using multi-agent systems (MAS) (Coelho, 2017)(Vale, 2011). Some examples can be seen in (Khan, 2016a), (Anvari-Moghaddam, 2017), and (Pinto, 2018). MAS are an artificial intelligence solution that enables the individual representation of agents/players with individual goals that can work together and communicate with each other's to achieve global goals. According to (Wooldridge, 2009), “An agent is a computer system
that is situated in some environment, and that is capable of autonomous action in order to meet its
delegated objectives”. By using MAS, it is possible to have a distributed system regarding computational processing (Bychkov, 2017) and management (Khan, 2016a). Agents can be deployed in multiple machines and each agent can represent a player in a microgrid and/or smart grid.
One of the main changes in the smart grid, relative to conventional power grids, is the active participation of end-users (Pitt, 2017)(Bourazeri, 2018). The involvement of end-users in the smart grid improves demand management by enabling the bidirectional interaction among smart grid’s players. This allows the shift and management of energy demand in end-users-side. The interaction among players can be provided by transactive energy that can balance energy supply and energy demand (GridWise, 2015). Energy prices changes encourage end-users to change their energy profiles, enabling the efficient use of renewable resources and distributed resources, and allowing the decrease of energy costs and increase of grid stability and reliability (Khan, 2016b)(Eid, 2016).

3
Transactive energy comes with benefits for the grid and for the users by enabling a decrease in energy costs, it increases the fast response of end-users, and their ability to change the energy profile. By integrating energy management systems in end-users, it is possible to provide demand-side management and demand response solutions that can automatically and autonomously manage end-users energy loads to produce changes in the energy consumption (Hayn, 2018). This way, business models can be implemented, in smart grids and microgrids, for end-user participation without requiring manual actuation from end-users.
The energy management system (EMS) market is expected to have a compound annual growth rate (CAGR) of 13.5 % between 2017 and 2023 (Yadav, 2018). According to the Allied Market Research, the market will evolve from USD 25.8 billion in 2016 to 62.3 billion by 2023 (Yadav, 2018). In this report it is mentioned that EMS market for monitoring and control will triplicate from 2016 until 2023 and that EMS for buildings will have a CAGR of 14.8 % during the period from 2016 to 2023. According to Navigant Research, utilities will be forced to increase their energy usage reductions targets for grid stabilization and carbon emission reductions, promoting growth in the demand-side management (DSM) market (Nhede, 2016). By 2025, DSM market will reach USD 1.2 billion, where the U.S.A market alone will reach USD 405 million (Nhede, 2016).
The conceptual definition and the proposed architectures and solutions for DSM and EMS exist in the literature for some time now. However, their implementation in our homes raises some issues, such as the lack of retrofitting and affordable solutions. Most of these issues can be overcome by using internet of things (IoT) devices, that can provide remote monitoring and control of electrical loads (Pocero, 2017). The IoT market is growing fast, worthying USD 235 billion in 2017 and with an expected worth of USD 520 billion by 2021 (Columbus, 2018). By using market available IoT products, it is now possible to develop EMS capable of changing the energy profile (Mashima, 2016). By combining IoT hardware and solutions proposed for EMS, DSM, ambient intelligent systems, and smart homes, it is possible to change how people interact with their homes, energy loads, and energy resources (Mano, 2016)(Al-Ali, 2017)(De Silva, 2018). IoT devices are great enablers for physical development; the use and integration of such devices in energy-related solutions bring vast advantages and enable the deployment of solutions in today's homes.
The last day of February 2012 marked the announcement of the first Raspberry Pi (Lawler, 2012). This single-board computer (SBC) was one of the first to provide a system-on-a-chip (SoC) and is maybe the most mediatic and known SBC in the world. They completely changed the way how software can be deployed, allowing the merge of high-end software and low-end hardware. An SBC provides users with an operating system (OS) combined with general-purpose input/output (GPIO) pins (Peytchev, 2016). According to (Global Market Insights, 2019), in 2018 the market for SBC was USD 600 million and it is expected to reach USD 1 billion in 2025. The growth of this market explains why more and more SBC are emerging in the market. This PhD research does not contribute to SBC, but it uses SBC as deployment units, taking advantage of their features and capabilities.
The main purpose of this PhD research is to analyse, model, and represent end-users in a microgrid context with transactive energy, and conceive, develop, and test a multi-agent system for the intelligent management of a microgrid considering the end-user representation. The proposed solution uses IoT devices and single-board computers to enable transactive energy and the active participation of end-users in the microgrid. The representative agents should also enable the energy management for the buildings they represent. The topics and main purpose of this PhD research have been highly motivated by the growing markets, mentioned above, and the emergence and proliferation of smart grids. The main purpose of this PhD research can be expressed as the following PhD’s statement:
The energy management of microgrids benefits from the end-users’ active participation.
The individual energy management of each end-user potentiates the increased efficiency of
the microgrid energy management. Microgrid’s end-users must be seen as independent
players with individual goals joint by the greater good of the microgrid as a whole.
Luis Gomes
4
I.2. Research questions
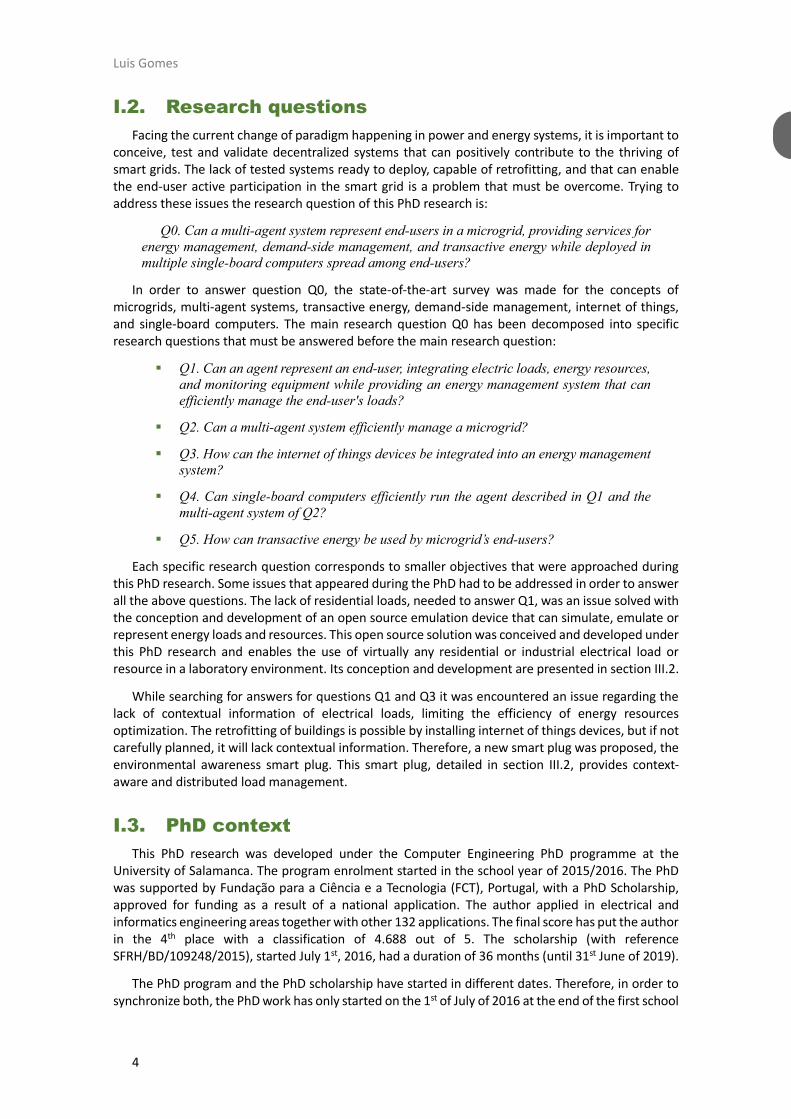
Facing the current change of paradigm happening in power and energy systems, it is important to conceive, test and validate decentralized systems that can positively contribute to the thriving of smart grids. The lack of tested systems ready to deploy, capable of retrofitting, and that can enable the end-user active participation in the smart grid is a problem that must be overcome. Trying to address these issues the research question of this PhD research is:
Q0. Can a multi-agent system represent end-users in a microgrid, providing services for
energy management, demand-side management, and transactive energy while deployed in
multiple single-board computers spread among end-users?
In order to answer question Q0, the state-of-the-art survey was made for the concepts of microgrids, multi-agent systems, transactive energy, demand-side management, internet of things, and single-board computers. The main research question Q0 has been decomposed into specific research questions that must be answered before the main research question:
▪ Q1. Can an agent represent an end-user, integrating electric loads, energy resources,
and monitoring equipment while providing an energy management system that can
efficiently manage the end-user's loads?
▪ Q2. Can a multi-agent system efficiently manage a microgrid?
▪ Q3. How can the internet of things devices be integrated into an energy management
system?
▪ Q4. Can single-board computers efficiently run the agent described in Q1 and the
multi-agent system of Q2?
▪ Q5. How can transactive energy be used by microgrid’s end-users?
Each specific research question corresponds to smaller objectives that were approached during this PhD research. Some issues that appeared during the PhD had to be addressed in order to answer all the above questions. The lack of residential loads, needed to answer Q1, was an issue solved with the conception and development of an open source emulation device that can simulate, emulate or represent energy loads and resources. This open source solution was conceived and developed under this PhD research and enables the use of virtually any residential or industrial electrical load or resource in a laboratory environment. Its conception and development are presented in section III.2.
While searching for answers for questions Q1 and Q3 it was encountered an issue regarding the lack of contextual information of electrical loads, limiting the efficiency of energy resources optimization. The retrofitting of buildings is possible by installing internet of things devices, but if not carefully planned, it will lack contextual information. Therefore, a new smart plug was proposed, the environmental awareness smart plug. This smart plug, detailed in section III.2, provides context-aware and distributed load management.
I.3. PhD context
This PhD research was developed under the Computer Engineering PhD programme at the University of Salamanca. The program enrolment started in the school year of 2015/2016. The PhD was supported by Fundação para a Ciência e a Tecnologia (FCT), Portugal, with a PhD Scholarship, approved for funding as a result of a national application. The author applied in electrical and informatics engineering areas together with other 132 applications. The final score has put the author in the 4th place with a classification of 4.688 out of 5. The scholarship (with reference SFRH/BD/109248/2015), started July 1st, 2016, had a duration of 36 months (until 31st June of 2019).
The PhD program and the PhD scholarship have started in different dates. Therefore, in order to synchronize both, the PhD work has only started on the 1st of July of 2016 at the end of the first school

5
year at University of Salamanca. Along this document, PhD years will be mentioned as being the scholarship years (i.e., three in total), and school years will be mentioned as academic years in which the author was enrolled at the University of Salamanca (i.e., five in total).
The University of Salamanca is the oldest University of the Iberian Peninsula and one of the oldest in the world, being in the top 3 of the oldest Universities in the world. The history of the University brings a rewarding learning experience difficult to find anywhere else. The PhD research was proposed in 2015 to the Academic Committee of the Computer Engineering’s doctoral program. Later that year, it was approved, and supervisors were officialised: Professor Zita Vale, and Professor Juan M. Corchado. This PhD research falls under the doctoral program areas, namely: intelligent systems, software engineering, knowledge engineering, and intelligent control.
The PhD program demanded the completion of seven activities, listed below, promoting the learning and growing of the student. These activities allowed the author to collaborate with three research centres, five European projects, and six Portuguese national projects. The activities where the following:
▪ Seventeen hours of seminars regarding advances in research lines of the PhD – the original Spanish activity title is: seminarios sobre avances en las líneas de investigación del PD;
▪ More than twelve hours of meetings regarding projects, research work or research results – the original Spanish activity title is: reuniones de seguimiento de proyectos, de trabajos o de resultados de investigación;
▪ The conclusion of the course “Understanding Research Methods” for the activity regarding methodological, specialized or practical training courses – in its original Spanish name: cursos de formación metodológicos, especializados o prácticos;
▪ Participation in ten conferences – the original Spanish activity title is: Asistencia a Congresos Nacionales o Internacionales:
▪ International Conference on Autonomous Agents and Multi-Agent Systems (AAMAS) 2020, hosted online;
▪ International Conference on Electromagnetics in Advanced Applications (IEEE ICEAA) 2019, in Granada, Spain;
▪ EPIA Conference on Artificial Intelligence 2019, in Vila Real, Portugal;
▪ IEEE Wireless Communications and Networking Conference (WCNC) 2019, in Marrakesh, Morocco;
▪ Encontro de Ciência e Tecnologia in Portugal 2018, in Lisbon, Portugal
▪ IEEE 87th Vehicular Technology Conference 2018, in Porto, Portugal;
▪ EPIA Conference on Artificial Intelligence 2017, in Porto, Portugal;
▪ Distributed Computing and Artificial Intelligence (DCAI) 2017, in Porto, Portugal;
▪ Practical Applications of Agents and Multi-Agent Systems (PAAMS) 2017, in Porto, Portugal;
▪ Global Information Infrastructure and Networking Symposium (GIIS) 2016, in Porto, Portugal;
▪ Seven journal publications as the first author and with Journal Citation Reports (JCR) impact factors of 3.301, 3.347, 2.707, 6.395, 4.624, 2.791, and 4.098 – the Spanish activity title is: Publicaciones científicas;

Luis Gomes
6
▪ More than the necessary 150 hours in a research centre outside the University of Salamanca, in the GECAD (ISEP/IPP, Portugal) research centre – the original Spanish activity title is: Estancias en otros centros de investigación;
▪ A total of three months in the Intelligent Systems Lab (ISLab) from the University of Minho in Portugal; this activity was mandatory to provide the international mention to this PhD.
Regarding the participation in conferences, the author made public presentations in eight of the mentioned conferences: AAMAS 2020, IEEE ICEAA 2019, EPIA 2019, WCNC 2019, IEEE 87th Vehicular Technology 2018, EPIA 2017, DCAI 2017, and PAAMS 2017.
During the third school year of this PhD research (2017/2018), the author had the opportunity to participate in the 3-minute thesis challenge. This is an interactional challenge where the University of Salamanca is part of. This participation brought a new perspective that enabled the author to grow and be more focused. The defence of a PhD thesis within a three-minute presentation is not easy and demands presentation skills that the author at the time did not possess.
This PhD research has been mainly done in the Research Group on Intelligent Engineering and Computing for Advanced Innovation and Development (GECAD). This research centre accepted this PhD research plan and provided its facilities, equipment, and availability to the researcher. The availability demonstrated by the research centre was outstanding and enabled the results that are shown in this document. The GECAD research centre is located in the School of Engineering (ISEP) of the Polytechnic Institute of Porto (IPP), Portugal. GECAD combines in a seamless and efficient way concepts from artificial intelligence and smart grids. Therefore, this was the perfect environment for this PhD research. Since 2013, GECAD has been involved in a total of 41 projects (17 internationals, 5 of which Horizon 2020 EC), had partnerships with more than 100 companies from 14 countries, and had 18 concluded PhD works. Currently, it has 17 PhD works undergoing. Moreover, GECAD has also brought an advantage for this PhD research, since it made their laboratories and office building available, facilitating the deployment of this PhD research results in a real office building.
The integration of this PhD research in GECAD research centre allowed the participation, collaboration, and contribution with international projects and Portuguese projects. The 9 projects that had the collaboration of the author are the following:
▪ (2017-2020) (execution) DOMINOES – the result of this PhD research contributed to DOMINOES regarding the energy management of communities and the design of new business models for peer-to-peer energy transactions;
▪ (2015-2019) (execution) DREAM-GO – this project main focus was the application of demand response business models to leverage demand flexibility and renewable energy generation. The author contributed to the execution of this project by providing a load emulator to test demand response and an indoor location framework for an energy management system;
▪ (2018-2019) (proposal and execution) Eco-Rural-IoT – small project with the main goal of providing an energy management system for farming irrigation. This is a problem affecting more and more countries due to climate changes. The participation in the proposal and in its execution gave the opportunity to gain awareness of this new line of action – energy management in agriculture – and allowed the opportunity to go to the field and study a real problem;
▪ (2014-2018) (execution) M2MGrids – this was an international ITEA project to build a machine-to-machine framework focusing on streaming data. During its execution, from 2016 till 2018, it has provided support in the developed and coordination of this project. Close collaboration with Empower, TNO and Nokia Labs enabled the developed of a conjoint case study used in the project. The concepts behind the developed case study and machine-to-machine framework empowered the developed of this PhD research, due to the insight provided by the close collaboration with such important partners;

7
▪ (2016-2018) (execution) SIMOCE – this project was the national project under M2MGrids ITEA project; ITEA demands national funding from the partners. During its execution it was provided support in the developed and coordination of this project, in an equal manner than M2MGrids;
▪ (2016-2018) (execution) NetEffiCity – this was a Portuguese national project that involved three villages. The project developed a community energy management system where energy sharing among private and public buildings were possible. During its execution, it was provided support in the developed and coordination of the project. The close work with end-users given important insight on the end-user’s point-of-view and their feedback regarding energy management systems and their difficulties to understand the real benefits of such systems;
▪ (2018) (proposal) TIOCPS – this is an ITEA project resulted from the participation of the ITEA PO days 2018. The idea behind this international project is the creating of a machine-to-machine platform for device negotiation. The thesis author contributed to the energy case scenario and know-how;
▪ (2018) (proposal and execution) SPEAR – this was a Portuguese national proposal that integrates an ITEA international project. The goal of the proposal was the monitoring and control of factory floors. The proposal used single-board computers to monitor factory machines, measuring real-time energy and providing vital information regarding the machine. The project will be able to optimize production lines according to energy costs and machine’s availability. The thesis author contributed to writing of the proposal and also to the execution of the national and the international projects, by providing expertise in single-board computers and resource optimization based on genetic algorithms;
▪ (2015-2017) (execution) AVIGAE – this project aimed at the development of an intelligent system for building energy efficiency. During its execution, from 2016 till 2017, it was provided support in the developed and coordination of this project.
During the three years of this PhD research, the author published 20 papers, 11 conference papers and 9 journal papers. The list of published and submitted publications is the following, the Mx indicates the month of publication where M0 is the first month of the PhD scholarship (1st of July of 2016). Papers where the thesis author is not the first author are justified regarding context and contributions, journal papers are in colour green:
▪ (M2) Luis Gomes, Omid Abrishambaf, Pedro Faria, Zita Vale, “Retrofitting Approach for an Automated Load Testbed”, in Proceedings of the Final ELECON Workshop Federal Institute of Santa Catarina (IFSC), 12-14 Sep. 2016;
▪ (M7, IF: 2.707) Omid Abrishambaf, Pedro Faria, Luis Gomes, João Spínola, Zita Vale, Juan M. Corchado, “Implementation of a Real-Time Microgrid Simulation Platform Based on Centralized and Distributed Management”, in Energies, vol. 10, pp. 806, 26 Fev. 2017. Doi: 10.3390/en10060806 – this work allowed the thesis author to have a small contribution in the real-time simulator platform, giving technical support in the platform configuration and parameterization, the close collaboration with Omid Abrishambaf a fresh insight into the importance of distributed systems and real-time simulators for microgrids;
▪ (M11) Luis Gomes, Zita Vale, “Computational Platform for Household Simulation and Emulation to Test and Validate Energy Management Methodologies”, in: Demazeau Y., Davidsson P., Bajo J., Vale Z. (eds) Advances in Practical Applications of Cyber-Physical Multi-Agent Systems: The PAAMS Collection. PAAMS 2017. Lecture Notes in Computer Science, vol 10349. Springer, Cham. Doi: 10.1007/978-3-319-59930-4_29;
▪ (M11) Luis Gomes, Zita Vale, “Energy Analyzer Emulation for Energy Management Simulators”. In: Omatu S., Rodríguez S., Villarrubia G., Faria P., Sitek P., Prieto J. (eds) Distributed Computing and Artificial Intelligence, 14th International Conference. DCAI

Luis Gomes
8
2017. Advances in Intelligent Systems and Computing, vol 620. Springer, Cham. Doi: 10.1007/978-3-319-62410-5_26;
▪ (M11) Ricardo A. S. Fernandes, L. O. Deus, Luis Gomes, Zita Vale, “Statistics-Based Approach to Enable Consumer Profile Definition for Demand Response Programs”, in: Omatu S., Rodríguez S., Villarrubia G., Faria P., Sitek P., Prieto J. (eds) Distributed Computing and Artificial Intelligence, 14th International Conference. DCAI 2017. Advances in Intelligent Systems and Computing, vol 620. Springer, Cham. Doi: 10.1007/978-3-319-62410-5_8 – this work enabled the thesis author to have a clear insight on how the user profile can be made and how it can be used in demand response, the author was able to test methodologies in this collaborative work;
▪ (M11) Eugénia Vinagre, Tiago Pinto, Isabel Praça, Luis Gomes, João Soares, Zita Vale, "Shared intelligence platform for collaborative simulations using sequences of algorithms: An electricity market participation case study", in Proceedings of the 2017 IEEE Manchester PowerTech, Manchester, 2017, pp. 1-6. Doi: 10.1109/PTC.2017.7981228 – this collaborative work enabled the test of a centralized platform for knowledge that was later used in the environmental awareness smart plug proposed in this PhD research;
▪ (M12) Luis Gomes, Zita Vale, “µGIM – Microgrids Intelligent Management System Based on a Multi-agent Approach and the Active Participation on Demand Response”, in: De la Prieta F. et al. (eds) Trends in Cyber-Physical Multi-Agent Systems. The PAAMS Collection - 15th International Conference, PAAMS 2017. PAAMS 2017. Advances in Intelligent Systems and Computing, vol 619. Springer, Cham. Doi: 10.1007/978-3-319-61578-3_37;
▪ (M13) Luis Gomes, Filipe Sousa, Zita Vale, “EnAPlug – An Environmental Awareness Plug to Test Energy Management Solutions for Households”, in: Oliveira E., Gama J., Vale Z., Lopes Cardoso H. (eds) Progress in Artificial Intelligence. EPIA 2017. Lecture Notes in Computer Science, vol 10423. Springer, Cham. Doi: 10.1007/978-3-319-65340-2_21;
▪ (M18) Luis Gomes, Zita Vale, “Virtual to Reality Emulator for Electrical Loads”, in Proceedings of the Intelligent load management in local and wholesale demand response markets – Third DREAM-GO Workshop, 23-24 Jan. 2018. Doi: 10.5281/zenodo.2677528;
▪ (M23) Luis Gomes, Filipe Sousa, Zita Vale, "An Agent-Based IoT System for Intelligent Energy Monitoring in Buildings", in Proceedings of the 2018 IEEE 87th Vehicular Technology Conference (VTC Spring), Porto, 2018, pp. 1-5. Doi: 10.1109/VTCSpring.2018.8417868;
▪ (M28, IF: 3.031) Luis Gomes, Filipe Sousa, Zita Vale, “An Intelligent Smart Plug with Shared Knowledge Capabilities”, in Sensors, vol. 18, pp. 3961, 15 Nov. 2018. Doi: 10.3390/s18113961;
▪ (M30) David Silva, Luis Gomes, Filipe Sousa, Zita Vale, “Indoor Real-Time Locating System comparison: Polaris vs FIND3”, in Proceedings of the Demand response approach for real-time renewable energy integration – Fourth DREAM-GO Workshop, 16-17 Jan. 2019. Doi: 10.5281/zenodo.2672914 – this work is a direct result from the supervision of the undergraduate student David Silva, that applied an indoor location system used for energy management systems;
▪ (M30, IF: 3.347) Luis Gomes, Pedro Faria, Zita Vale, Jorge Silva, "Energy Analyzer Emulator for Microgrid Implementation and Demonstration and Respective Gateway", in IEEE Transactions on Industry Applications, vol. 55, no. 1, pp. 134-144, Jan.-Feb. 2019. Doi: 10.1109/TIA.2018.2866451;
▪ (M32) Luis Gomes, Carlos Ramos, Aria Jozi, Bruno Serra, Lucas Paiva, Zita Vale, “IoH: A Platform for the Intelligence of Home with a Context Awareness and Ambient Intelligence Approach”, in Future Internet, vol. 11, pp. 58, 22 March 2019. Doi: 10.3390/fi11030058;

9
▪ (M33) Bruno Serra, Luis Gomes, Zita Vale, “Lightweight Architecture for IoT Devices with Context-aware Autonomous Control”, in Proceedings of the IEEE Wireless Communications and Networking Conference, 15-19 Apr. 2019. Doi: 10.1109/WCNCW.2019.8902882 – this work is a direct result from the supervision of the undergraduate student Bruno Serra, that proposed a lightweight architecture for IoT devices that is able to control energy loads according to the building’s context;
▪ (M33, IF: 2.707) Luis Gomes, Filipe Sousa, Tiago Pinto, Zita Vale, “A Residential House Comparative Case Study Using Market Available Smart Plugs and EnAPlugs with Shared Knowledge”, in Energies, vol. 9, pp. 1647, 30 April 2019. Doi: 10.3390/en12091647;
▪ (M41, IF: 6.395) Luis Gomes, João Spínola, Zita Vale, Juan M. Corchado, “Agent-based Architecture for Demand Side Management using Real-Time Resources’ Priorities and a Deterministic Optimization Algorithm”, Journal of Cleaner Production, vol. 241, 118154, 20 December 2019. Doi: 10.1016/j.jclepro.2019.118154;
▪ (M42, IF: 4.624) Gabriel Santos, Zita Vale, Pedro Faria, Luis Gomes, “BRICKS: Building’s reasoning for intelligent control knowledge-based system”, Sustainable Cities and Society, vol. 52, 101832, January 2020. Doi: 10.1016/j.scs.2019.101832 – this work allowed the thesis author to have a small contribution in the knowledge-based energy management system, giving an insight in knowledge-based systems and how they can be implemented in energy management systems;
▪ (M44, IF: 2.791) Luis Gomes, Zita Vale, Juan M. Corchado, “Microgrid Management System Based on a Multi-Agent Approach: an Office Building Pilot”, Measurement, vol. 154, 107427, 15 March 2020. Doi: 10.1016/j.measurement.2019.107427;
▪ (M45, IF: 4.098) Luis Gomes, Zita Vale, Juan M. Corchado, “Multi-Agent Microgrid Management System for Single-Board Computers: A Case Study on Peer-to-Peer Energy Trading", in IEEE Access, vol. 8, pp. 64169-64183, 02 April 2020, Doi: 10.1109/ACCESS.2020.2985254.
Besides the mentioned publications, the author also had the opportunity to review 11 papers during his PhD program. The revision process helped the author to better understand the side of reviewers and how the review process is conducted. This insight enabled professional growth on how a publication should be written and presented. The revisions done are lists as follows:
▪ (2020, IF: 3.343) one manuscript revision for the International Journal of Energy Research;
▪ (2019, IF: 3.456) one manuscript revision for the Sustainable Energy Technologies and Assessments journal;
▪ (2019, IF: 8.426) one manuscript revision for the Applied Energy journal;
▪ (2019, IF: 3.022) four manuscript revisions for the Electric Power Systems Research journal (special issue for the XXI Power Systems Computation Conference 2020);
▪ (2019, IF: 5.768) one manuscript revision for the Future Generation Computer Systems journal;
▪ (2019, IF: 4.495) one manuscript revision for the Energy and Buildings journal;
▪ (2019, IF: 2.707) one manuscript revision for the Energies journal;
▪ (2019, IF: 0.757) one manuscript revision for the Discrete Dynamics in Nature and Society journal;
▪ (2017) one manuscript revision for the International Federation of Automatic Control (IFAC) 2017 conference.

Luis Gomes
10
The described context allowed the author to grow as a researcher, but that was not all the contact the author had with academic and research fields. The author also had the incredible opportunity to supervise and co-supervise 21 undergraduate students and teach two courses in the ISEP’s computer engineering degree, from 2017 to 2019. All these experiences, by themselves, made this PhD an amazing and successful journey.
I.4. Thesis organization
The present document is divided into five chapters that describe the work conducted during the PhD. Chapter I, the current chapter of “Introduction”, does the needed introduction of the work, detailing the motivations, research questions, and the PhD context. In the PhD context section are detailed the main research contributions and the university requirements for the PhD conclusion.
Chapter II, “Context”, is dedicated to the state-of-the-art, where the main concepts addressed in the PhD are explained. Besides the research state-of-the-art, it is provided, when applicable, a market analysis, identifying development opportunities. The addressed concepts are: microgrids, multi-agent systems, transactive energy, demand-side management, internet of things, single-board computers, competitor analyses, and open source and software licenses. The concepts were described according to their applicability in microgrids. The open source and software licenses were included because of their relevance for software systems.
Chapter III, “Proposed Systems”, presents the conception and development of the three solutions proposed in this PhD, and that were conceived, developed, and tested during the PhD research. As introductory section, all three systems are described according to their motivation. The described systems are: virtual to reality (V2R) emulator, environmental awareness smart plug (EnAPlug), and the single-board computer for energy (S4E).
Chapter IV, “Deployment and Case Studies”, describe, present and analyse the results of multiple use cases applied to the three systems described in Chapter III. The chapter is divided into three sections that describe the use cases of each proposed systems. In each section present three use cases. Most of these results already have been published in papers and/or open access datasets.
To conclude this document, Chapter V presents the “Conclusions” of the PhD work. It also includes, a looking forward section detailing the next steps for the three proposed systems.
11
Chapter II
II. Context
Chapter index
II.1. DEMAND-SIDE MANAGEMENT ----------------------------------------------------------------------------------------- 12
II.2. TRANSACTIVE ENERGY AND DEMAND RESPONSE ------------------------------------------------------------------ 13
II.3. MICROGRIDS ------------------------------------------------------------------------------------------------------------ 16
II.4. MULTI-AGENT SYSTEMS APPLICATIONS IN ENERGY MANAGEMENT SYSTEMS ----------------------------------- 20
II.5. INTERNET OF THINGS APPLIED IN ENERGY MANAGEMENT SYSTEMS --------------------------------------------- 23
II.6. SINGLE-BOARD COMPUTERS ----------------------------------------------------------------------------------------- 25
II.7. COMPETITOR ANALYSIS------------------------------------------------------------------------------------------------ 26
dEF-Pi and EF-Pi ---------------------------------------------------------------------------------------------- 26
VOLTTRON ----------------------------------------------------------------------------------------------------- 27
RIAPS ------------------------------------------------------------------------------------------------------------ 28
II.8. SOFTWARE LICENSES ------------------------------------------------------------------------------------------------- 29

Luis Gomes
12
II.1. Demand-side management
The continuous grow of consumption and distributed energy resources, namely from renewable energy sources, has great impact on the electrical grid. To avoid high consumption peaks, the concept of demand-side management (DSM) was introduced to enable an energy demand decrease in the end-user side. In 1985, the IEEE Terminology Task Force defined DSM as:
“The planning and implementation of those utility activities designed to influence
customer use of electricity in ways that will produce desired changes in the utility’s load shape, i.e., changes in the pattern and magnitude of a utility’s load. Demand-side
management encompasses the entire range of management function associates with
directing demand-side activities, including program planning, evaluation, implementation, and monitoring. Opportunities for demand-side management can be found in all customer
classes, including residential, commercial, industrial, and wholesale.” (IEEE Terminology Task Force, 1985)
In the literature, there is not a consensus classification of DSM types, with multiple authors defending different types. In (Hungerford, 2015), there are three major application types: energy efficiency, energy conservation, and demand response. Other three types are proposed in (Riaz, 2017): energy efficiency, demand response, and dynamic demand. In (Palensky, 2011), four types are defined: energy efficiency, time-of-use, demand response, and spinning reserve. Although different characterization is proposed, it is consensual that DSM can be grossly divided in energy efficiency and demand response. The demand response concept in DSM can be seen as end-user’s participation in smart grid. In this PhD research, because energy efficiency is out of scope, DSM will be focused on the ability of end-users to make changes in their energy demand considering smart grid participation, such as demand response programs or peer-to-peer (P2P) energy transactions.
The application of DSM has an impact on end-users’ energy profile, and it can result in rebound peaks. This is a direct result of end-users consumption shifting from on-peak periods to off-peak periods, creating new on-peak periods (Zhang, 2019). This issue can be solved by individualizing demand response programs by areas, avoiding collective shift of end-users (Hayes, 2017).
The developments and implementation of DSM methodologies can be divided in two groups (Barbato, 2012)(Gomes, 2013b): online, and offline. If a methodology is executed prior to control signals, it is considered offline, being the case of scheduling algorithms. If the execution matches the control signals, it is considered working in online, being the case of real-time optimization algorithms.
To not impact, in a negative way, the users’ comfort, DSM must take into consideration the users’ preferences (Gomes, 2013a). In (Mahmood, 2015), a survey have been made regarding DSM applications that considers and benefits the user’s comfort, eight publications were analysed: demand response management via real-time electricity price control in smart grids (DRM) (Qian, 2013), intelligent home energy management system to improve demand response (IMEM) (Ozturk, 2013), modelling for residential electricity optimization in dynamic pricing environments (MREODP) (Hubert, 2012), optimal power scheduling methods for demand response in home energy management system (OPSMDR) (Zhao, 2013), genetic-algorithm-based optimization approach for energy management (GABOAEM) (Arabali, 2013), algorithm for intelligent home energy management and demand response analysis (AIHEMDR) (Pipattanasomporn, 2012), demand-side management in smart grid using heuristic optimization (DSMSGH) (Logenthiran, 2012b), and optimal power scheduling for smart grids considering controllable loads and high penetration of photovoltaic generation (OPSSG) (Ziadi, 2014). Solutions for DSM and energy management systems must be tested and validate using proper tools, such as the household simulator proposed in (Gomes, 2017a).
The users’ comfort can be modelled by attributing priorities to energy loads. The prioritisation of loads is usually done using individual weights representing the priority of the user. This can be seen in several published works, such as in (Liu, 2012) where the forecast of renewable resources and market prices is used in a resource optimization algorithm. In (Yang, 2018), it is proposed a resource
13
optimization algorithm to maximize users’ comfort. In contrast, in (Joo, 2017) is proposed the minimization of discomfort and energy costs, while complaint with the used resources constraints.
Currently in Europe, the CROSSBOW project, involving eight South-Eastern European countries is creating an aggregation platform for the use of DSM, renewable energy resources, and electrical energy storage (Hasan, 2018). In this project, a survey in which nine operators of the eight countries participated, concluded that the size of DSM is not enough when compared to the total generation and consumption. In (Mehra, 2018), the main conclusion is that DSM can reduce the microgrid need of solar panels and storage units if a real-time management and control is implemented.
DSM can be found in literature in multiple implementations using demand response programs. However, there are implementations of DSM that are implemented in the level of energy management systems, managing the demand in the user-side even without the application of demand response programs. In (Sobhani, 2019), a distributed DSM enables the end-user’s individually optimization of energy consumption and storage, while achieving the convergence of end-users’ profiles. A game theoretic model for DSM is proposed in (Noor, 2018), where storage units are considered and used in load shedding hours – periods when users are incentivised to reduce their energy demand from the grid. In the School of Renewable Energy Technology at Naresuan University, a DSM algorithm for storage units was implemented (Mansiri, 2018). The university’s microgrid has 540 kWh of storage capacity and it is used for consumption (i.e., charging mode) and generation (i.e., discharging mode) when needed.
The application of DSM is an opportunity to naturally reduce energy cost, by optimizing resources’ consumption, as well as it is an opportunity for end-users to actively participate in transactive energy, namely demand response programs. However, this opportunity can vanish if not well implemented. The users’ comfort must be taken into consideration.
II.2. Transactive energy and demand response
Transactive energy (TE) is a relatively new concept that promotes distributed economic benefits for end-users in order to control the balance between energy demand and energy supply. There are two main definitions of TE, one from the GridWise Architecture Council, and another from the Smart Grid Dictionary, respectively:
“A system of economic and control mechanisms that allows the dynamic balance of
supply and demand across the entire electrical infrastructure using value as a key
operational parameter.” (GridWise, 2015)
“A software-defined grid managed via market-based incentives to ensure grid reliability
and resiliency. This is done with software applications that use economic signals and operational information to coordinate and manage devices’ production and/or consumption
of electricity in the grid. Transactive energy describes the convergence of technologies,
policies, and financial drivers in an active prosumer market where prosumers are buildings,
EVs, microgrids, VPPs or other assets.” (Hertzog, 2013)
TE is the broader concept that integrates several end-user participation mechanisms and methodologies, such as local markets and demand response (Abrishambaf, 2019). They can be applied in any level of the smart grid, from transmission to distribution. The distributed operation of a smart grid and its high penetration of RES and distributed generation makes the balance between consumption and generation an issue that must be addressed (Tchuisseu, 2019)(Shirzeh, 2015)(Mukhopadhyay, 2013). TE can manage this balance by promoting economic-based models to smart grid players. This includes small and medium players, such as buildings and homes, enabling these end-users to participate in market trades, based on prices and energy blocks (i.e., quantities), in a two-way negotiation model (Kok, 2016). The energy is seen as a transactable product among smart grid players.

Luis Gomes
14
A characterization of TE is proposed by (Kok, 2016), where TE is divided in four quadrants: top-down switching, centralized optimization, price-reactive systems, and transactive control and coordination. Figure 1 is an adaptation from the energy management matrix proposed in (Kok, 2016).
Figure 1. Energy management matrix proposed in (Kok, 2016)
The top-down switching quadrant consists of the traditional demand response programs that
relay on signal flowing in the grid to remotely switch end-user's loads (Kok, 2016). The control,
allowed in this quadrant, does not take into consideration the user’s comfort, and the result of the
control relies on estimations of the end-user baselines. Because only switching control is provided,
the end-user potential is not entirely used. In (Zhu, 2015), the demand response program of direct
load control is used to provide a remote control over end-users’ loads. A direct load control program
for distributions system operator and aggregators using teletraffic tools is proposed in (Neglia, 2018).
The centralized optimization approach comprises two-way communication between end-users
and the centralized optimizer that will optimize all resources, as a whole, and control/schedule them
(Kok, 2016). Being a centralized system, it suffers from the same disadvantages of a centralized MAS,
the scalability becomes an issue and changes in the end-user's loads usually demand changes in the
centralized optimization algorithm. The centralized optimization approach can be seen in the
literature, in publications, such as in (Wang, 2018) where a scheduling model for end-users’ resources
is proposed, and (Silva, 2014) where a centralized optimization algorithm is used to apply demand
response programs to maximize the grid profit and minimize the costs.
Although difficult to predict the result, price-reactive approach is easy, private and give to end-
users the responsibility of managing his/her loads as they like (Kok, 2016). The signalling of prices to
the end-users transfer to the end-user the responsibility to manage the loads or pay more for his/her
consumption. Lower prices will stimulate end-users to increase consumption while high prices will
result in a decrease of the consumption, and/or increase of generation (Faria, 2011). In demand
response there are a several programs priced-based that can be used for price-reactive systems, such
as in (Liu, 2017) where price signals are used for grid’s stability and reliability, or in (Ramdaspalli,
2016) where a real-time market for price-based control is done in heating, ventilation, and air-
conditioning (HVAC).
The last quadrant of transactive control and coordination enables all the benefits from the others
by promoting a market-based approach where end-users are represented by agents or energy
15
management systems capable to communicate, interact, and negotiate with smart grid players (Kok,
2016). End-users can communicate their energy bids by using bid curves, and these bids are
aggregated in each level until they reach the market, this way, privacy over end-user's data are saved
(Pinto, 2016). (Fuller, 2011) defines that to be able to participate in transactive control, end-users
need to have three abilities: “change its energy consumption based on the cleared market price”,
“determine the price it is willing to pay for electricity”, and “bid its desired demand”. Examples of
transactive control can be found in (Gazafroudi, 2019) where end-users submit bidding curves, or in
(Katipamula, 2015), where a methodology is proposed for transactive control which can be integrated
in building automation systems.
Currently, there are several methodologies and practical implementations of TE. In (Liu, 2017) the authors present a state-of-the-art review on transactive energy. The Clean Energy and Transactive Campus Project, developed in the U.S.A., by the Pacific Northwest National Laboratory with the U.S. Department of Energy is using the open source solution VOLTTRON to deploy transactive energy using a local market within buildings (Hao, 2013). In Europe, the Flexiblepower Alliance Network uses the open source EF-Pi for demand-side management (DSM) and the open source PowerMatcher to enable transactive energy to balance distributed energy loads (Kok, 2013).
TE allows P2P transactions among end-users, potentiating the decrease of energy cost and the active participation of end-users. In (Forfia, 2016), a P2P market is proposed, where grid operator supervises P2P markets. A broader review of existing projects using P2P trading can be seen in (Zhang, 2016a). Simulations of P2P transactions can be found in the literature in works, such as (Zhang, 2018) where a non-cooperative P2P auction model using Nash equilibrium is proposed, (Alam, 2019) where an algorithm to coordinate P2P trading and DSM is proposed, and (Morstyn, 2019) where price adjustments are applied in P2P auctions trading.
The blockchain enables a fully distributed market without any centralization. This concept is compatible with smart grids and specially with P2P transactions. The PeerEnergyCloud project, in Germany, uses a cloud-based approach for P2P market (Brandherm, 2012). End-users, participation in this project use optical fibre connection to the cloud and cloud-based forecasting services in order to participate in the cloud-based P2P market. The T77 project, in Bangkok, did its first P2P trade in 22nd August 2018 but it keeps growing (Fry, 2018). When finished, the project will have a total peak of 400 kW photovoltaic generation that can be trade among end-users, having a generation peak higher than the community’s energy demand.
The Brooklyn project, in the U.S.A., is maybe the best known microgrid with P2P transactions using the distributed ledger of blockchain (LO3ENERGY, 2018). Brooklyn microgrid enables the willing participation of end-users, allowing end-users to transact energy among them by specifying the maximum price to pay for energy source. This model facilitates end-users to prioritize the energy source that they want, freeing them from using non-renewable sources. This project was able to integrate around fifty end-users, where Transactive Grid elements (a.k.a. TAG-e meters) were deployed (Cardwell, 2017). In Brooklyn it is used a virtual microgrid that uses public transmission lines, the end-users do not share a private network independent from end-users that are not part of the microgrid. Therefore, transactions are made in a contractual level.
Energy P2P trading can be implemented in under-developed countries to improve the quality of lives in communities. The trading of energy can be achieved by applying several business models and market models (Pinto, 2016). A different energy trading project was implemented in Rampur and Manpur, in India (Singh, 2018). In each village, were distributed solar panels among chosen people, while rechargeable resources, such as LED bulbs, were distributed among the community. The community can trade uncharged LED bulbs with charged LED bulbs or rent solar panels to charge the LED bulbs. The payment of transactions is defined and agreed between buyers and sellers. The project results showed that between 27 % and 45 % of payments were made without using cash.

Luis Gomes
16
Demand response (DR) programs can be seen as part of TE, providing mechanisms to enable the active participation of end-users in smart grids. The U.S. Department of Energy defined DR as:
“Changes in electric usage by end-use customers from their normal consumption
patterns in response to changes in the price of electricity over time, or to incentive payments
designed to induce lower electricity use at times of high wholesale market prices or when
system reliability is jeopardized.” (U.S. Department of Energy, 2006)
The differentiation among transactive energy and DR is not clear. Both can use price variations to promote the change of consumption profiles in the end-user-side. By analysing both definitions, DR can be used for grid stability while transactive energy is used to balance demand and generation.
DR programs can be price- or incentive-based (Faria, 2016a)(Yan, 2018). Price-based programs fall into the definition of transactive energy (Li, 2019), they use price variations to promote changes in end-user consumption profiles. Incentive-based programs reward end-users that changed their consumption by request (Yu, 2017), they need previous communication and usually an opt-in or opt-out action from the end-user. There are several DR programs that can be used in a microgrid, and some required a minimum of participation (i.e., a reduction of 20 MWh). End-users are usually below the minimum participation and they cannot directly participate in such programs. The participation of end-users is enabled by aggregators that create end-user collectives to achieve the minimum required by the DR program (Hansen, 2016).
The use of transactive energy and DR programs have a major impact on how end-users participate in the smart grid context. In this PhD research, a P2P transactive market for microgrid was conceived and developed. Also, the work on this PhD research did not limit the solution to a P2P market, enabling future developments and integration of new TE models. Regarding the end-user participation in DR programs, the solution conceived in this PhD research integrated energy loads optimization mechanisms that can be used to reduce the end-user energy demand and participate in DR programs.
II.3. Microgrids
Power systems paradigm is evolving into a decentralized system over the old centralized system. The smart grid is the new key concept that will transform how energy is produced, distributed and consumed (Farhangi, 2010)(Fang, 2012). This will have a significant impact in larger players, such as distribution utilities, but also in end-users. The end-users, including small and medium players, will be requested to be part of the smart grid (Bayat, 2015)(Wei, 2016)(Steriotis, 2018). The decentralization of power systems potentiates the rise smart grids and microgrids (Mendes, 2011)(Tian, 2016)(Long, 2018).
There is not a unique conceptual description of microgrid, but two definitions are commonly used: one from the United State Department of Energy Microgrid Exchange Group, and another from the CIGRÉ Working Group C6.22 Microgrids Evolution Roadmap, respectively:
“A microgrid is a group of interconnected loads and distributed energy resources within clearly defined electrical boundaries that acts as a single controllable entity with respect to
the grid. A microgrid can connect and disconnect from the grid to enable it to operate in
both grid-connected or island-mode.” (Ton, 2012)
“Microgrids are electricity distribution systems containing loads and distributed energy
resources, (such as distributed generators, storage devices, or controllable loads) that can be operated in a controlled, coordinated way either while connected to the main power
network or while is landed.” (Marnay, 2015)
The CIGRÉ Working Group C6.22 Microgrids Evolution Roadmap also provides important definitions for generators, storage devices, and controlled loads. These resources are important

17
enablers for microgrids and smart grids, allowing future applications of transactive energy, demand-response programs and demand-side management.
Although renewable energy sources (RES) are common in microgrids, they are not mandatory. Therefore, CIGRÉ C6.22 Working Group currently defines generators as being “all sources possible at
the scales and within the context of a microgrid”. The use of RES is important to combat the climate change that it is a reality and must be addressed (Quéré, 2018). However, the use of RES brings generation volatility impacting the amount of generation and energy prices. Trying to solve this issue, end-users are called to actively participate in the smart grid and microgrid contexts by adjusting their energy demand according to energy prices and available generation (Rintamäki, 2017).
The active participation of end-users enables a high penetration of RES in the grid. In (Nwulu, 2017) it is proposed an advanced interactive multidimensional modelling system to minimize the cost of fuel generators by maximizing RES use and by applying demand response. A microgrid’s load dispatch considering wind turbines and electrical vehicles is proposed in (Shi, 2018), by applying a multi-objective optimal model. A day-ahead scheduling and intraday dispatch model for the grid of Hainan Island, in China, is proposed in (Chen, 2016).
The definitions from the United State Department of Energy Microgrid Exchange Group and the CIGRÉ Working Group C6.22 Microgrids Evolution Roadmap are not clear regarding the geographical extension that a microgrid may have. They state that a microgrid is a “group of interconnected loads
[…] within clearly defined electrical boundaries” and that they are “electricity distribution systems
containing […] resources”. These definitions do not clarify the size of a microgrid, that can vary from a single building, as seen in (Jin, 2017), to extensive local areas, as presented in (Anderson, 2011), where a microgrid with about 14,000 residents, a peak of 2 MW photovoltaic generation, and 3 MW of diesel generation is presented.
A microgrid can use direct current (DC) or alternating current (AC) (Justo, 2013). In the main grid, the standard is AC, providing AC at end-users’ buildings. But, in a microgrid with DC resources, it is possible to create an entire DC network. The majority of our home appliances convert AC to DC, usually using inefficient converters. If a microgrid with DC energy sources, near end-users, uses an AC network, it will have DC-AC-DC conversions for most of our consumption (Justo, 2013). DC microgrids avoid the current conversion but also make it impossible to connect the microgrid to the main grid, unless a DC-AC invertor is used. Hybrid microgrids, using both DC and AC, are also a possibility (Eghtedarpour, 2014).
The microgrid can have the possibility to be disconnected from the main grid, allowing its current operation even when the main grid is down. This capability is important when natural disasters happen. In 2012, the hurricane Sandy left downtown Manhattan without power, but the New York University microgrid disconnected itself from the main grid and provided energy using the islanded operation mode (Wald, 2012). Also, in Japan, during the massive earthquake of 9.0 magnitude on 11th May 2011, followed by a tsunami, the Sendai Microgrid demonstrated its value by supplying energy to one hospital and one nursing facility during the three-day blackout (Hirose, 2013).
As seen in Sendai Microgrid and New York University, microgrids can be very reliable during disasters. By operating in islanded mode, they can provide energy to end-users and even save lives. After the hurricane Maria reach Porto Rico in 2017, the island took eleven months to restore the energy in the entire island (Campbell, 2018). The Puerto Rico Energy Commission (PREC) understood the crises and new legislation for microgrids’ developments on the island were passed. PREC specified that microgrids must have at least 75 % of their energy supplied from renewable sources, and three types of microgrids were specified: personal, cooperative, and third-party microgrids (Runyon, 2018).
When operating in islanded mode, the microgrid is responsible for its grid frequency (Bevrani, 2016). To connect to the main grid, the microgrid first needs to synchronize its frequency with the main grid (Choi, 2019). However, it is not mandatory for a microgrid to provide connectivity to the main grid. There are off-grid/remote microgrids that cannot be connected to the main grid (Chalise,
Luis Gomes
18
2016), because they do not have a physical electrical connection. This is the case of several microgrids developed in islands or remote areas.
The involvement of people in a microgrid is an important feature. Microgrids can be developed everywhere and are for everyone, including people without any knowledge of power and energy systems. This is especially true in cases of off-grid microgrids developed in remote communities, such as villages and islands. The inclusion of these people in microgrid’s management can increase the efficiency of resources use and provide continuous support and maintenance of equipment and resources (Jimenez-Estevez, 2014). Not different from the main grid, microgrids also have stability issues that must be addressed (Farrokhabadi, 2019). Therefore, the need of operational training is necessary for the continuous microgrid operation.
As referred before, the New York University microgrid can operate in islanded mode, avoiding main grid blackouts. Besides this capability, the main advantages of this microgrid are the annual energy savings, between 5 and 8 million dollars, the 68 % decrease in pollutants (according to the United States Environmental Protection Agency, EPA, criteria), and the 23 % decrease in greenhouse gas emission (Overton, 2014). Still in the United States of America, the University of California in San Diego (UCSD) developed a campus microgrid, enabling annually savings of 8 million dollars and generating 92 % of its annual consumed energy (Washom, 2013). This enables UCSD to participate in demand response programs, being the largest end-user participating in demand response programs of San Diego Gas & Electric (Francklyn, 2018). In China, the University of Hangzhou Dianzi has the first microgrid to achieve a photovoltaic generation penetration of 50 %, while diesel generators provide the remaining 50 % (Zeng, 2014). Storage units are used to store the surplus energy generated by the photovoltaic panels, so it can be used during periods without enough photovoltaic generation. The use of microgrids in University campuses is common as they enable energy cost reduction and enable the University staff to interact and conduct research over microgrids, acting as real-size testbeds for the university’s research centres. Some, such as the GECAD microgrid, enable the combination between real, simulated and emulated buildings and resources (Gomes, 2019a).
A microgrid for transactive energy has been developed in Brooklyn. This is a virtual microgrid that uses the existing electrical lines available without being able to operate in islanded mode. More information about this microgrid is included in section II.2. Because microgrids provide independency from the main grid, microgrids are often used in military premises. One of the pioneer military projects was the Smart Power Infrastructure Demonstration for Energy Reliability and Security (SPIDERS) (SPIDERS, 2015), that developed three microgrids in military bases (Anderson, 2011). The biggest microgrid, developed under project SPIDERS, is located in Fort Carson base in Colorado, U.S.A., that is the house of about 14,000 people. Smaller developments can also be seen, such as in Wheeler Army Airfield and Schofield Barracks East Range (Skowronska-Kurec, 2012).
Remote and off-grid locations can benefit from microgrids, enabling high penetration of RES and easing the management of grid and energy transmission. Natural off-grid remote locations, such as islands or remote villages, are perfect to developed microgrids that can change the live of people, providing continuous energy distribution, boosting local economy, and improving life quality. The Isle of Eigg microgrid was completed in 2008 (Chmiel, 2015). Before its development, the island was dependent on private individual generators, that were used inside people. With the microgrid, the island started using renewable generation with a peak capacity of 197 kW – 119 kW of hydro power, 24 kW wind power, and 54 kW photovoltaic power – and a 160 kW backup diesel generator (Chmiel, 2015). In Chile, the Huatacondo microgrid enables and enhances the participation of end-users using a social SCADA where end-users manage the microgrid (Jimenez-Estevez, 2014). The social SCADA monitors the microgrid and provides decision support to end-users (Palma-Behnke, 2011). In Canada, a microgrid was developed in the remote bay of Hartley Bay, resulting in annual savings of 77,000 litters of diesel (Wrinch, 2012). This microgrid uses demand response programs, targeting commercial buildings, to reduce peak demands (Wrinch, 2012).
The use of microgrids in remote areas brings new opportunities to communities. Since 2010, IEEE Smart Village is creating partnerships to develop microgrids in poor and remote locations (IEEE Smart
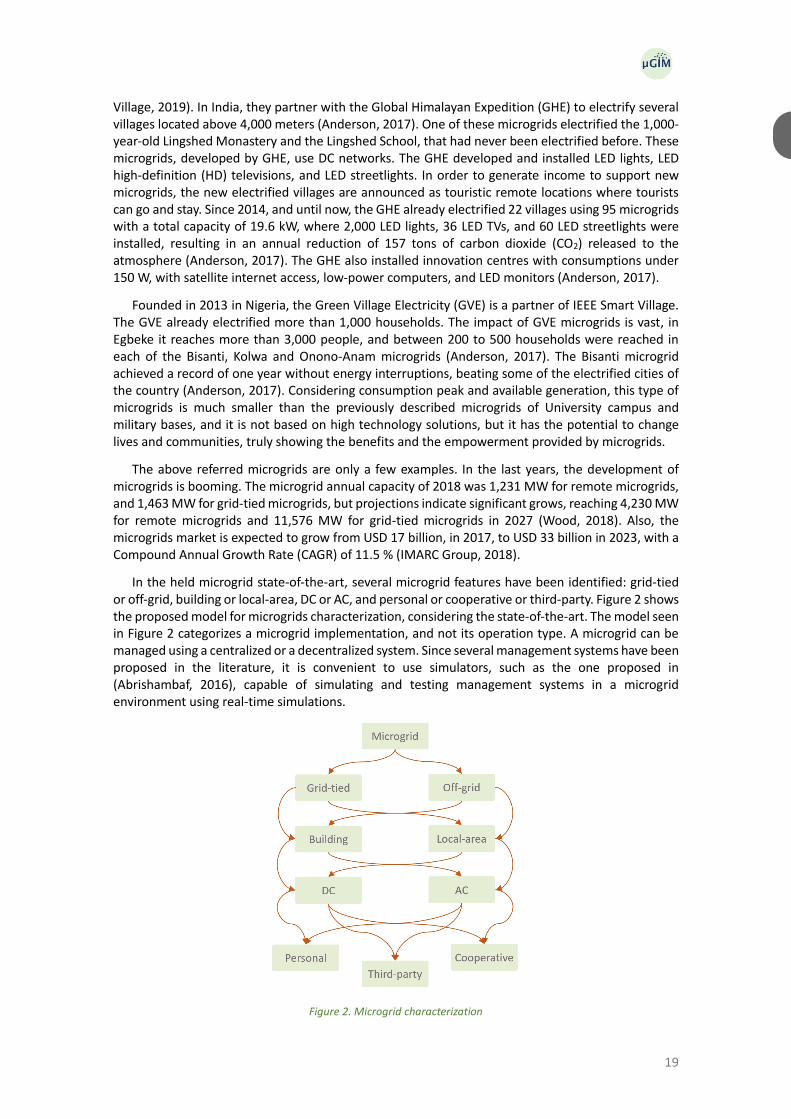
19
Village, 2019). In India, they partner with the Global Himalayan Expedition (GHE) to electrify several villages located above 4,000 meters (Anderson, 2017). One of these microgrids electrified the 1,000-year-old Lingshed Monastery and the Lingshed School, that had never been electrified before. These microgrids, developed by GHE, use DC networks. The GHE developed and installed LED lights, LED high-definition (HD) televisions, and LED streetlights. In order to generate income to support new microgrids, the new electrified villages are announced as touristic remote locations where tourists can go and stay. Since 2014, and until now, the GHE already electrified 22 villages using 95 microgrids with a total capacity of 19.6 kW, where 2,000 LED lights, 36 LED TVs, and 60 LED streetlights were installed, resulting in an annual reduction of 157 tons of carbon dioxide (CO2) released to the atmosphere (Anderson, 2017). The GHE also installed innovation centres with consumptions under 150 W, with satellite internet access, low-power computers, and LED monitors (Anderson, 2017).
Founded in 2013 in Nigeria, the Green Village Electricity (GVE) is a partner of IEEE Smart Village. The GVE already electrified more than 1,000 households. The impact of GVE microgrids is vast, in Egbeke it reaches more than 3,000 people, and between 200 to 500 households were reached in each of the Bisanti, Kolwa and Onono-Anam microgrids (Anderson, 2017). The Bisanti microgrid achieved a record of one year without energy interruptions, beating some of the electrified cities of the country (Anderson, 2017). Considering consumption peak and available generation, this type of microgrids is much smaller than the previously described microgrids of University campus and military bases, and it is not based on high technology solutions, but it has the potential to change lives and communities, truly showing the benefits and the empowerment provided by microgrids.
The above referred microgrids are only a few examples. In the last years, the development of microgrids is booming. The microgrid annual capacity of 2018 was 1,231 MW for remote microgrids, and 1,463 MW for grid-tied microgrids, but projections indicate significant grows, reaching 4,230 MW for remote microgrids and 11,576 MW for grid-tied microgrids in 2027 (Wood, 2018). Also, the microgrids market is expected to grow from USD 17 billion, in 2017, to USD 33 billion in 2023, with a Compound Annual Growth Rate (CAGR) of 11.5 % (IMARC Group, 2018).
In the held microgrid state-of-the-art, several microgrid features have been identified: grid-tied or off-grid, building or local-area, DC or AC, and personal or cooperative or third-party. Figure 2 shows the proposed model for microgrids characterization, considering the state-of-the-art. The model seen in Figure 2 categorizes a microgrid implementation, and not its operation type. A microgrid can be managed using a centralized or a decentralized system. Since several management systems have been proposed in the literature, it is convenient to use simulators, such as the one proposed in (Abrishambaf, 2016), capable of simulating and testing management systems in a microgrid environment using real-time simulations.
Figure 2. Microgrid characterization

Luis Gomes
20
There is a clear opportunity in microgrids. They have the potential to grow in near future and solutions for microgrid management must be ready to be deployed in heterogenous locations. This PhD research takes this opportunity and conceived, developed and promoted a dynamic and distributed microgrid management system that can be easily deployed almost everywhere.
II.4. Multi-agent systems applications in energy
management systems
An energy management system (EMS) enables the management of energy loads and energy resources with, or without, interaction with other players. In a microgrid, there is a combination of players, such as consumers, producers and prosumers, that share a physical location and grid – they should be physically connect among them. The energy management system of a microgrid, centralized or distributed, must take into consideration that there are individual end-users in the microgrid. The use of multi-agent systems (MAS) enables the modelling of microgrids, having into consideration the individually goals of end-users and the main goal of the microgrid.
MAS belong to artificial intelligence field and have an efficient fit in the smart grid context, and microgrids can also benefit with MAS (Dou, 2013)(Malik, 2016). In the microgrid context, each end-user can manage its own energy and can interact with other end-users and the microgrid operator. The end-users’ individual representation in the microgrid, as well as other agents, such as the microgrid operator, can be done using agents in a MAS. According to (Wooldridge, 2009), each agent must have the following abilities:
▪ Reactivity – to environment changes that happen in the physical world and in the computational world;
▪ Pro-activeness – to achieve the agent’s individual goals, agents must act and change their behaviour to pursuit the individual goals;
▪ Social – to enable the interaction with other agents, enabling discovery of new agents and build direct communications to collaborate, cooperate or compete with other agents.
In a microgrid context, MAS can be used for operation and end-user representation. Agents in a microgrids can use the abilities proposed by (Wooldridge, 2009) as follows: reactivity can be used to allow end-users to react to grid events and energy loads and resources changes, pro-activeness can be used to allow end-users to pursuit their individual goals that can be aligned, or not, to the microgrid’s goals, and social ability can be used to enable end-users to exchange information and energy among them and with external players (e.g., aggregators).
The operation of microgrids can be centralized and/or decentralized, and this can be model by MAS. In a centralized MAS, the decision is made in a single centralized/control agent responsible to manage all the system (Colson, 2011). The centralization of management demands all agents to send data and reply to the control agent (Karavas, 2015), meaning that the minimum needed communications is equal to the number of agents in the MAS (Colson, 2011). To allow a centralized MAS, there should be a synchronized mechanism for all communications (Yorino, 2015), usually provided by the control agent (Colson, 2011). The communications from all agents to the control agent, and vice-versa, can be compared to a star topology, where the control agent is in the centre and all the other agents are directly connected to it.
Centralized MAS applied to EMS can be found in literature. An EMS to ensure the continuity of power supply, using an agent-based controller is proposed in (Digra, 2013). A microgrid with a centralized MAS operation system was developed in the island of Kythnos, in Greece (Chatzivasiliadis, 2008). A day-ahead, hour-ahead and near real-time EMS is proposed in (Silva, 2014) using a centralized MAS. A mixed-integer nonlinear programming algorithm is proposed in (Marzband, 2013) for the centralized management of microgrids in islanded mode. The centralized approach minimizes decision conflicts among agents (Karavas, 2015). However, it lacks enough reliability, because all
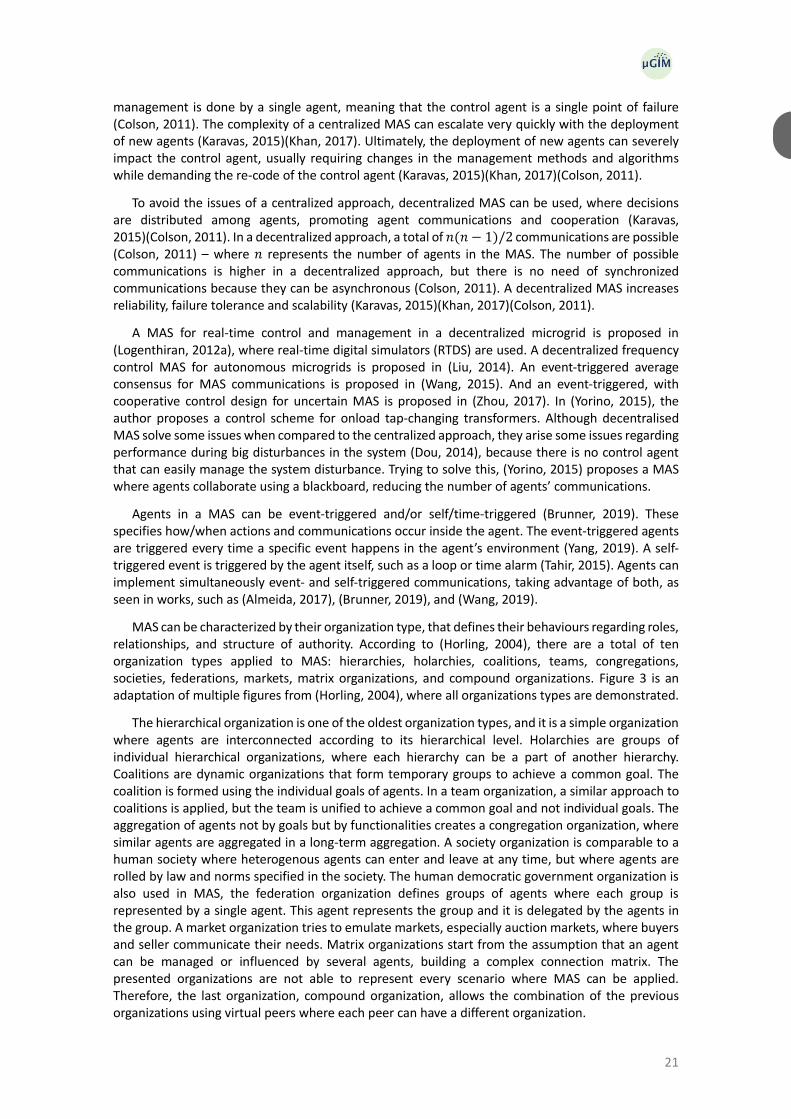
21
management is done by a single agent, meaning that the control agent is a single point of failure (Colson, 2011). The complexity of a centralized MAS can escalate very quickly with the deployment of new agents (Karavas, 2015)(Khan, 2017). Ultimately, the deployment of new agents can severely impact the control agent, usually requiring changes in the management methods and algorithms while demanding the re-code of the control agent (Karavas, 2015)(Khan, 2017)(Colson, 2011).
To avoid the issues of a centralized approach, decentralized MAS can be used, where decisions are distributed among agents, promoting agent communications and cooperation (Karavas, 2015)(Colson, 2011). In a decentralized approach, a total of 𝑛(𝑛 − 1)/2 communications are possible (Colson, 2011) – where 𝑛 represents the number of agents in the MAS. The number of possible communications is higher in a decentralized approach, but there is no need of synchronized communications because they can be asynchronous (Colson, 2011). A decentralized MAS increases reliability, failure tolerance and scalability (Karavas, 2015)(Khan, 2017)(Colson, 2011).
A MAS for real-time control and management in a decentralized microgrid is proposed in (Logenthiran, 2012a), where real-time digital simulators (RTDS) are used. A decentralized frequency control MAS for autonomous microgrids is proposed in (Liu, 2014). An event-triggered average consensus for MAS communications is proposed in (Wang, 2015). And an event-triggered, with cooperative control design for uncertain MAS is proposed in (Zhou, 2017). In (Yorino, 2015), the author proposes a control scheme for onload tap-changing transformers. Although decentralised MAS solve some issues when compared to the centralized approach, they arise some issues regarding performance during big disturbances in the system (Dou, 2014), because there is no control agent that can easily manage the system disturbance. Trying to solve this, (Yorino, 2015) proposes a MAS where agents collaborate using a blackboard, reducing the number of agents’ communications.
Agents in a MAS can be event-triggered and/or self/time-triggered (Brunner, 2019). These specifies how/when actions and communications occur inside the agent. The event-triggered agents are triggered every time a specific event happens in the agent’s environment (Yang, 2019). A self-triggered event is triggered by the agent itself, such as a loop or time alarm (Tahir, 2015). Agents can implement simultaneously event- and self-triggered communications, taking advantage of both, as seen in works, such as (Almeida, 2017), (Brunner, 2019), and (Wang, 2019).
MAS can be characterized by their organization type, that defines their behaviours regarding roles, relationships, and structure of authority. According to (Horling, 2004), there are a total of ten organization types applied to MAS: hierarchies, holarchies, coalitions, teams, congregations, societies, federations, markets, matrix organizations, and compound organizations. Figure 3 is an adaptation of multiple figures from (Horling, 2004), where all organizations types are demonstrated.
The hierarchical organization is one of the oldest organization types, and it is a simple organization where agents are interconnected according to its hierarchical level. Holarchies are groups of individual hierarchical organizations, where each hierarchy can be a part of another hierarchy. Coalitions are dynamic organizations that form temporary groups to achieve a common goal. The coalition is formed using the individual goals of agents. In a team organization, a similar approach to coalitions is applied, but the team is unified to achieve a common goal and not individual goals. The aggregation of agents not by goals but by functionalities creates a congregation organization, where similar agents are aggregated in a long-term aggregation. A society organization is comparable to a human society where heterogenous agents can enter and leave at any time, but where agents are rolled by law and norms specified in the society. The human democratic government organization is also used in MAS, the federation organization defines groups of agents where each group is represented by a single agent. This agent represents the group and it is delegated by the agents in the group. A market organization tries to emulate markets, especially auction markets, where buyers and seller communicate their needs. Matrix organizations start from the assumption that an agent can be managed or influenced by several agents, building a complex connection matrix. The presented organizations are not able to represent every scenario where MAS can be applied. Therefore, the last organization, compound organization, allows the combination of the previous organizations using virtual peers where each peer can have a different organization.
Luis Gomes
22
Figure 3. MAS organizations
Smart grids can be perceived as compound organizations where each virtual peer represents a player or group of players, and where each virtual peer can have multiple representative agents. For instance, the energy market can use the market organization, a microgrid can use a society, coalition or team organization, depending on its business model, and a building can use a hierarchical organization to represent zones and energy loads and resources.
The study of MAS for microgrids reveals that it is common to divide the system by layers that separate agents by functionalities. In (Vaahedi, 2017), a five-layer architecture is presented: physical equipment layer, system protection and control layer, automation and control layer, “monitoring, scheduling, optimization, and dispatch” layer, and “energy market, grid, and transactive operations” layer. A hierarchical three-layer control system is proposed in (Azevedo, 2017): a distributed energy resource layer with real-time control, a microgrids global control layer with near real-time control (reacting in few seconds), and a microgrid optimization layer with delayed control (reacting in minutes). Another MAS with hierarchical organization using a three-layer solution is proposed in (Mao, 2014) with layers for: local control, central control, and system control. More layered MAS for microgrids can be found in (Dou, 2016), (Logenthiran, 2015), (Yazdanian, 2014), and (Nunna, 2013). In MAS applied in microgrids, layers are used to separate operation levels, aggregating agents by their

23
energy management operation level (e.g., microgrids, energy markets, building optimization), or control levels, aggregating agents by control speed and priority.
Moreover, it is common to develop MAS that represent different players, end-users, or resources. In (Azevedo, 2017), five types of agents are proposed: load agent, renewable distributed energy resource agent, conventional distributed energy resource agent, energy storage agent, and utility grid agent. Ten more agent types are proposed in (Mao, 2014): distributed generation agent, load agent, storage agent, SCADA agent, generation coordination control agent, economic dispatch control agent, energy forecast agent, system operator agent, and static switch agent. More agent types can be found in (Dou, 2016), (Yazdanian, 2014), (Wang, 2012), (Colson, 2011), (Amicarelli, 2016), and (Nagata, 2014). Agent types are usually developed and proposed to perform a single and specific task in the microgrid context.
In this PhD research, it was conceived a MAS for microgrid operation using a distributed approach with agents combining event- and self-triggered communications. The proposed solution uses a compound organization. The use of MAS in microgrids is shown to be efficient and advantageous, as seen in previous works. In the MAS, conceived in this PhD research, each agent represents an individual consumer, producer or prosumer, and where each agent has an energy management system capable of handling the end-user’s loads, resources, and needs.
II.5. Internet of things applied in energy management
systems
The internet of things (IoT) concept is not new, the first known IoT device was a Coke machine in
1982 (Teicher, 2018). This machine was installed in the Carnegie Mellon University and enabled
remote monitoring using an internet connection. According to (Gubbi, 2013), IoT can be seen as an
ecosystem where all physical devices, such as smart machines and objects, are all connected.
Nowadays, this concept expands to connect almost everything to the web, from smartwatches to
washing machines. For instance, our smartphones are IoT devices with several sensors embed
(Zanella, 2014). Because they are everywhere, and the market is still growing, IoT devices must be
considered in energy-related solutions. By 2022 it is expected to have at least one IoT device installed
in 216.9 million homes worldwide (Statista, 2018).
The concept of smart homes facilitates the control over electrical equipment located inside end-
user’s building/home (Li, 2018)(Fernandes, 2014). The control over energy loads and resources
enables the application of demand-side management (Paudyal, 2019)(Gomes, 2014). This results in
end-users capable of remotely managing their energy and have an active participation in the smart
grid context. In (Correa-Florez, 2018), it is demonstrated how smart homes can be aggregated to
participate in the day-ahead energy market. In (Erdinc, 2015), a home energy management system
(EMS) able to participate in dynamic-pricing-based demand response program is proposed. The
active participation, demand-side management, and smart homes are beneficial for the smart grid
and end-users (Alquthami, 2018)(Liu, 2015). And this can be achieved by using IoT devices. In
(Mashima, 2016), IoT devices are applied to enable the end-users’ participation in demand response
programs using a novel mobile app that centralizes IoT devices. A context-aware autonomous control
lightweight IoT device is proposed in (Serra, 2019).
The use of IoT devices is important, and one key device used for EMS is the smart plug. In 2008,
Woods proposed the first “intelligent” plug for energy efficiency and savings (Daily, 2008); this was
the first publication able to be tracked regarding smart plugs. Smart plugs are key devices, because
they enable the retrofitting of electrical loads, providing remote monitoring and control over a
controllable load (i.e., the load connected to the smart plug) (Lee, 2014)(Alquthami, 2018)(Liu, 2015).
Therefore, it is possible to find, in the literature, smart plugs proposed for EMS. In (Morsali, 2012)
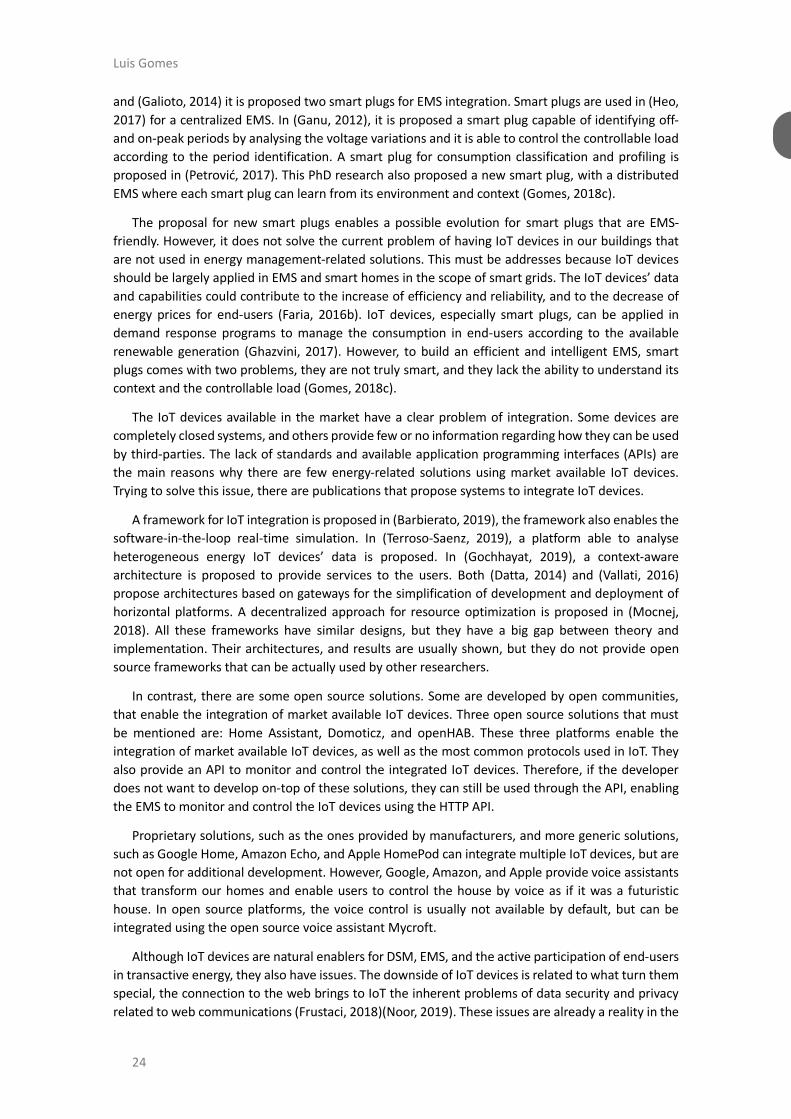
Luis Gomes
24
and (Galioto, 2014) it is proposed two smart plugs for EMS integration. Smart plugs are used in (Heo,
2017) for a centralized EMS. In (Ganu, 2012), it is proposed a smart plug capable of identifying off-
and on-peak periods by analysing the voltage variations and it is able to control the controllable load
according to the period identification. A smart plug for consumption classification and profiling is
proposed in (Petrović, 2017). This PhD research also proposed a new smart plug, with a distributed
EMS where each smart plug can learn from its environment and context (Gomes, 2018c).
The proposal for new smart plugs enables a possible evolution for smart plugs that are EMS-
friendly. However, it does not solve the current problem of having IoT devices in our buildings that
are not used in energy management-related solutions. This must be addresses because IoT devices
should be largely applied in EMS and smart homes in the scope of smart grids. The IoT devices’ data
and capabilities could contribute to the increase of efficiency and reliability, and to the decrease of
energy prices for end-users (Faria, 2016b). IoT devices, especially smart plugs, can be applied in
demand response programs to manage the consumption in end-users according to the available
renewable generation (Ghazvini, 2017). However, to build an efficient and intelligent EMS, smart
plugs comes with two problems, they are not truly smart, and they lack the ability to understand its
context and the controllable load (Gomes, 2018c).
The IoT devices available in the market have a clear problem of integration. Some devices are
completely closed systems, and others provide few or no information regarding how they can be used
by third-parties. The lack of standards and available application programming interfaces (APIs) are
the main reasons why there are few energy-related solutions using market available IoT devices.
Trying to solve this issue, there are publications that propose systems to integrate IoT devices.
A framework for IoT integration is proposed in (Barbierato, 2019), the framework also enables the
software-in-the-loop real-time simulation. In (Terroso-Saenz, 2019), a platform able to analyse
heterogeneous energy IoT devices’ data is proposed. In (Gochhayat, 2019), a context-aware
architecture is proposed to provide services to the users. Both (Datta, 2014) and (Vallati, 2016)
propose architectures based on gateways for the simplification of development and deployment of
horizontal platforms. A decentralized approach for resource optimization is proposed in (Mocnej,
2018). All these frameworks have similar designs, but they have a big gap between theory and
implementation. Their architectures, and results are usually shown, but they do not provide open
source frameworks that can be actually used by other researchers.
In contrast, there are some open source solutions. Some are developed by open communities,
that enable the integration of market available IoT devices. Three open source solutions that must
be mentioned are: Home Assistant, Domoticz, and openHAB. These three platforms enable the
integration of market available IoT devices, as well as the most common protocols used in IoT. They
also provide an API to monitor and control the integrated IoT devices. Therefore, if the developer
does not want to develop on-top of these solutions, they can still be used through the API, enabling
the EMS to monitor and control the IoT devices using the HTTP API.
Proprietary solutions, such as the ones provided by manufacturers, and more generic solutions,
such as Google Home, Amazon Echo, and Apple HomePod can integrate multiple IoT devices, but are
not open for additional development. However, Google, Amazon, and Apple provide voice assistants
that transform our homes and enable users to control the house by voice as if it was a futuristic
house. In open source platforms, the voice control is usually not available by default, but can be
integrated using the open source voice assistant Mycroft.
Although IoT devices are natural enablers for DSM, EMS, and the active participation of end-users
in transactive energy, they also have issues. The downside of IoT devices is related to what turn them
special, the connection to the web brings to IoT the inherent problems of data security and privacy
related to web communications (Frustaci, 2018)(Noor, 2019). These issues are already a reality in the

25
energy field due to the large deployment of smart meters. In the U.S.A, the data privacy issue was
taken to the court and was ruled out that the energy data must remain private to comply with the
Fourth Amendment of the U.S.A. Constitution (Naperville Smart Meter Awareness v. City of
Naperville, 2018). Therefore, it is mandatory to protect user data to prevent the leakage and
exposure of sensitive data, such as home consumption.
Weighting all the advantages and disadvantages of IoT devices, the conclusion can be only one:
IoT devices are here to stay and grow and cannot be ignored nor disregarded by energy management
solutions. IoT devices are important enablers that provide retrofitting and allow the current
development of smart homes and EMS. Therefore, this PhD research takes advantage of such devices
and use them to enhance the final solution. In the author opinion, IoT devices and EMS paths should
be brought together in order to join forces and create new and novel solutions. To do so, this PhD
research proposes an evolution for context-awareness smart plugs with learning capabilities.
II.6. Single-board computers
Single-board computers (SBC) do not have a standard definition, although, most definitions agree that they are computers built in a single board, comprising a microprocessor. A few years ago, in 2005, Arduino project changed the way designers, developers and hobbyists work with low-level hardware (Barrett, 2013). The Arduino board completely changed the normal person’s perspective towards hardware, and now it is used almost everywhere, especially in education. This changed and the fast adoption of such development board led, in 2006, a group based in the University of Cambridge’s Computer Laboratory to address the need of a low-cost computing platform (Ortmeyer, 2014). In 2012, the result was announced, and Raspberry Pi was born (Lawler, 2012). This system-on-a-chip (SoC) changed the market and started being used everywhere. Four years separates the release of Raspberry Pi Model B and Raspberry Pi 3 Model B, but these four years make Raspberry Pi 3 Model B ten times faster, than the first model.
Currently, there are a vast variety of SBC available in the market, assuming multiple forms, sizes, specifications, and prices. In 2018 the market size was USD 600 million, but by 2025 it is expected a size of USD 1 billion (Global Market Insights, 2019). These values are great accomplishments for a new technology with less than ten years. Almost every month appears a new SBC in the market, targeting specific fields and publics. For instance, the NVIDIA Jetson Nano Developer Kit targets the development of artificial neural networks (NVIDIA, 2019).
The ability to have a full operating system, enables the use of high-level software, while the small size, low-price, and low consumption bring new possibilities of system deployment (Johnston, 2014). There are some solutions for energy management systems that are able to run in SBC, such as VOLTTRON (VOLTTRON, 2019a), RIAPS (RIAPS, 2019), and dEF-Pi (dEF-Pi, 2019). Even not providing a direct support, other EMS can be run in SBC, for example the Open-ADR VEN and VTN open source version developed by the Electric Power Research Institute (EPRI) (Johnson, 2014).
The available general-purpose input/output (GPIO) pins in an SBC allows the integration of sensors, actuators and communication protocols. This opens the possibility of having high-level programming languages running in the SBC’s operating system connected to external hardware. In (Vujović, 2015), a fire-safety web-based sensor was developed and deployed in a Raspberry Pi, communications use the onboard RJ45 connector to connect to the Ethernet. In a more recent publication, a MAS for microgrid complying with IEC 61850 standard, FIPA specifications, and data distribution service (DDS) standard was deployed in SBC (Cintuglu, 2018).
SBC have been used in energy-related scientific publications and research and development projects. In (Drakontaidis, 2018) and (Matthews, 2017), the detection of grid anomalies in phasor measurement units was executed by multiple Raspberry Pi units. In (Zhang, 2016b), the multi-level microgrid control proposed in (Xiao, 2016) was deployed in multiple BeagleBone Black.

Luis Gomes
26
Besides punctual solutions, the use of SBC in energy-related solutions is not yet well disseminated. The real potential of SBC in microgrids and end-user’s buildings are yet to be achieved. The hardware cost has decreased, allowing the emergence of more powerful SBC that can perform demand-side management and transactive energy. The microgrid management system proposed in this PhD research was conceived for SBC, enabling the easy deployment in end-user’s buildings.
II.7. Competitor analysis
This section identifies and analyses three available solutions for energy management systems in
end-user's buildings. The features of these solutions partially match the goals and objectives of this
PhD research. Therefore, understanding them is essential. This section addresses three open source
platforms that can be installed in SBC: VOLTTRON (VOLTTRON, 2019a), the resilient information
architecture platform for smart grid (RIAPS) (RIAPS, 2019), and the distributed energy flexibility
platform and interface (dEF-Pi) (dEF-Pi, 2019).
dEF-Pi and EF-Pi
The information detailed in this section is the result of the analysis of the available documentation
of dEF-Pi1, in (FAN, 2019). It is the successor of the energy flexibility platform and interface (EF-Pi),
f.K.a FPAI, and it was developed by the Flexible Power Alliance Network (FAN). The idea behind dEF-
Pi was creating an interoperable platform for DSM. dEF-Pi is an open source platform, available in
GitHub, licensed under Apache License (Versions 2.0). This platform can integrate several electrical
resources, allowing monitor and control over them. In the dEF-Pi specifications, resource types are
categorized by the Energy Flexibility Interface (EFI): inflexible, shiftable, adjustable, and storage. EFI
is a common language for energy flexibility, developed by the Netherlands Organisation for Applied
Scientific Research (TNO), one of the key members of FAN. The integration of resources can be
integrated using one of the available communication protocols, such as Zigbee, Z-Wave, IEEE 802.11
(i.e., Wi-Fi), and TCP/IP.
In dEF-Pi, an inflexible resource is a load that cannot be controlled, therefore, does not have flexibility. Inflexible resources are also monitored, and its data can be used for other services, such as forecasting algorithms. A shiftable resource is a controllable load that can be reallocated in time according to the system needs, such as a washing machine. An adjustable resource provides a range of control and flexibility, and it can be a generation resource or a consumption load without having many control restrictions. Storage resources are adjustable resources with some type of storage (e.g., energy, heat, or cooling). These resources are usually associated with constraints, i.e. storage levels.
The previous EF-Pi was divided in the application driver, and the energy app. The application driver
was able to dynamically define the control limits of each load considering the user’s comfort. While
the energy app tried to monetize the end-user’s flexibility (i.e., difference between current
consumption and the minimum possible consumption). EF-Pi’s energy app was able to search, in local
area or in smart grid, all players and find the best way to monetize the end-user’s flexibility. The dEF-
Pi completely changed this paradigm, creating a distributed system using Docker images. All images
are controlled and instantiate by the orchestrator. dEF-Pi allows the integration of services that are
deployed in Docker images.
In the old version, EF-Pi, it was stated that it could run in an SBC and it was able to communicate
with external players in order to monetize end-user's flexibility. However, there is lack of information
regarding the new dEF-Pi. For instance, the official website of FAN only presents EF-Pi as a solution
developed by the alliance. Therefore, it is not entirely clear on how this platform operates in real
scenarios. Unfortunately, it was not possible to find publications regarding the deployment of dEF-Pi.
1 https://github.com/flexiblepower/defpi-core

27
However, according to (Waaij, 2015), EF-Pi was deployed in a German pilot during ESC project to
control heating clusters with combined heat and power units.
The dEF-Pi and EF-Pi solutions were studied, and they were coherent in their separation between
the integration of resources and the energy-related management. The possibility of adding new
integration protocols as well as new energy-related services provides a dynamic system that can grow
as needed.
VOLTTRON
VOLTTRON2 was developed by the Pacific Northwest National Laboratory (PNNL), and it is a
platform for distributed sensing and control (Akyol, 2016). In 2012 was released the 1st version and
in 2014 was released the 2nd version VOLTTRON as an open source platform under Apache License
(Version 2.0). VOLTTRON is in its 4th version, released in late 2016. In the official website of
VOLTTRON, appears one statement identifying the main goal and functionality of the platform, the
statement is from Terry Herr, from Intellimation company, and states that “We're [they are] working
to deploy VOLTTRON™ in a big way in buildings, where it will collect and send building automation
system data to the cloud for further analysis in order to optimize building system operations”. The
platform was conceived for retrofitting, allowing old buildings to become smart.
VOLTTRON is an agent-based platform developed in Python 2.7 and that can be deployed in SBC,
such as the small Raspberry Pi Zero W. The platform uses a distributed approach where no centralized
nodes are required. However, they can exist and be part of the system. Centralized agents are used
for service deployment, such as weather forecasting and monitor services. The platform also has a
Central Agent that provides a web service that works as a system graphical interface. In VOLTTRON
platform, there are three types of agents that can be used (VOLTTRON, 2019b): platform agents,
cloud agents, and control agents. The platform agents provide services that can be used by other
agents. The cloud agents provide the cloud connection and are able to store data in remote servers.
The control agents provide control over loads and resources. All agents can communicate with each
other’s and perform more than one role simultaneously.
VOLTTRON control agents integrate loads and resources using drivers, similar to dEF-Pi. There are
some ready-to-use drives that can be used, such as building automation and control networks
(BACnet), distributed network protocol (DNP3), Modbus/RTU, Modbus/TCP, Obix RESTful, Rainforest
Emu2 (an energy monitoring unit), and smart energy profile 2.0 (SEP2, IEEE 2030.5). VOLTTRON also
provides a driver compatible with ChangePoint’s charge stations; the largest company in U.S.A.
operating independent owned electrical vehicle charging networks. By being an open source
platform, it is possible to develop more drivers, such as the Zigbee driver developed in (Karami, 2018).
Agents, from VOLTTRON platform, use topic-based communication messages that allows the
agent to trade messages within itself and with the outside world (i.e., other agents). The exchange is
possible among agents in the same platform, but also with agents among different platforms. This
ability enables the use of transactive energy in the platform(s). Also, VOLTTRON is compliant with
OpenADR 2.0b. This interface considers agents as being virtual end nodes (VEN). The OpenADR
standard enables the autonomous response of end-users to demand response programs. The ability
of agents to participate in transactive energy and be compliant with OpenADR, transforms the
VOLTTRON into a complete system that is not only to be used as an EMS, but also allows DSM and
the active participation of end-users in the smart grid context.
VOLTTRON was already used and deployed in some projects and publications (Katipamula, 2016).
In (Huang, 2018) is proposed a two variable-air-volume fan control implemented in VOLTTRON and
2 https://github.com/VOLTTRON

Luis Gomes
28
using a hardware-in-the-loop (HIL) real-time simulator. In (Huang, 2019), is proposed a transactive
control over a rooftop air conditioner unit using two demand response programs: demand limiting,
and real-time pricing control. This transactive control uses information regarding building occupancy,
and it was deployed in Washing State, in U.S.A., using SBC (there is no more detail regarding building
characteristics). A consensus-based distributed algorithm, for energy price between consumers and
producers, is proposed in (Pourbabak, 2018). This algorithm was tested using a Linux desktop, for
VOLTTRON platform, and sixteen independent agents deployed in sixteen Cubietruck boards. To
prove the scalability of this algorithm, is was also conducted a simulation using 1.400 agents. A
transactive energy scenario, using VOLTTRON agents, can be seen in (Raker, 2017) and (Raker, 2018),
using eight independent agents deployed in Raspberry Pi boards. These agents were deployed in six
buildings, in one 1 MW photovoltaic array (one), and in one energy storage unit of 130 kWh. The
deployment was made in the Scott Park Campus of the University of Toledo. VOLTTRON is regularly
tested in PNNL campus, where it is deployed and continuously controlling the heating, ventilation
and air-conditioners (HVAC) systems using a market-based transactive controls (Corbin, 2016).
The VOLTTRON platform allows the creation of a multi-agent community. It also enables the
communication among communities and provide drivers for resource integration. The topic-based
message communication is simple and provides interoperability throughout the entire platform.
VOLTTRON seems to be the most complete solution, providing a multi-agent system and enabling the
deployment of EMS, DSM, transactive energy and demand response in today’s buildings.
RIAPS
In the middle of 2018, the Linux Foundation (LF) launched the LF Energy, that is an international coalition involving multi-vendor collaboration and open source projects regarding energy and electricity sectors (The Linux Foundation, 2018). At its launch, the LF Energy integrated four open source projects that were already in the development stage, one of which is the Resilient Information Architecture Platform for Smart Grid (RIAPS3). The RIAPS is a software platform for real-time embedded applications targeting buildings and microgrids (Eisele, 2017a). Ehen compared to VOLTTRON and dEF-Pi, RIAPS is the newest platform, and all three share the same open source license, Apache License (Version 2.0).
The RIAPS was developed based on F6COM computation model proposed in (Otte, 2013) and (Dubey, 2011). The distributed platform uses nodes that can join and leave groups at any time. As discovery service, RIAPS uses the open distributed hash table (OpenDHT) library (Eisele, 2017a). OpenDHT is an open source library under GNU General Public License (Version 3). To avoid the OpenDHT license, RIAPS can also be executed using Redis as discovery service. Redis is an open source in-memory data structure store under Berkeley Software Distribution (BSD) license.
Inside the RIAPS platform, there are two types of nodes that can be used: control node, and target node. The control node is responsible to control the platform and should be placed in the grid’s control room, this node is mandatory in each deployment of RIAPS platform. The target nodes can be deployed in SBC and spread across the grid. These are the nodes that integrate energy loads and resources. The system also deploys service target, such as the timesencctl target agent that is responsible for the time synchronization service.
In its public repository, the RIAPS provides ready-to-use images of a control node running in a virtual machine with the amd64 Xubuntu 18.04, and a target node running in the SBC BeagleBone Black with the armhf Ubuntu 18.04. The RIAPS team also provide software documentation, published publications, and demonstration videos.
In (Xie, 2017), the RIAPS is used as a distributed under-frequency load shedding scheme, taking into consideration the IEEE 39-bus grid. The use of HIL real-time simulations with the RIAPS nodes
3 https://github.com/RIAPS

29
deployed in BeagleBone Blacks is demonstrated in (Du, 2018). This work achieved phase and frequency synchronization in a distributed microgrid where RIAPS nodes were connected to two real-time simulators (i.e., OPAL-RT 5031 and OPAL-RT 5607) simulating a microgrid electrical grid. The RIAPS was also used to implement an interleaving multi-converter system that can minimize the harmonics in a DC bus (Tu, 2018). A simple demonstration of transactive energy is demonstrated in (Eisele, 2017b) using a single consumer and a single generator. Other examples non energy-related can be found, such as a traffic controller exemplified in (Eisele, 2017a).
The RIAPS does not provide, until this moment, publications regarding its implementation in real buildings. Furthermore, this platform is not multi-agent and does not show how two platform instances can collaborate or communicate, the nodes used are not agents in a multi-agent system. Besides being the newest platform, the RIAPS demonstrations appear to be very promising. Its focus in equipment and grid technical management standout from the others. However, the functionalities of energy management systems seem to have a lower focus in the RIAPS.
II.8. Software licenses
The use of open source software is growing and companies developing or supporting open source solutions are being bought with record breaking values (Myers, 2018). In 2018, GitHub, with more than 29 million public repositories, was acquired by Microsoft for USD 7.5 billion (Microsoft News Center, 2018). Open source software enables developers to access the code of a software and contribute to improve the code or to create new functionalities. This concept has been expanded and copied by other areas and now it is possible to see a movement for open hardware and open access publications. The open of content potentiates a fast grow and provides the engagement of development communities.
There are several licenses that enable and promote open source solutions. In this section, eleven licenses are presented, some with more than 20 years. These are the most popular licenses and the licenses with the strongest communities, according to the Open Source Initiative (OSI, 2019):
▪ GNU General Public License, Version 2 (GPL-2.0 or GPLv2) (1991) (GNU, 1991): was one of the most popular licenses, it provides access to the code and the possibility to change the code, however, if a software uses a part of code under GPLv2, the software must be released also under the same license, meaning it must be open source and publicly available (at least for three years);
▪ GNU General Public License, Version 3 (GPL-3.0 or GPLv3) (2007) (GNU, 2007a): it protects users regarding patent license, and it is compatible with other licenses, any change on the code must the publicly published under GPLv3, or any compatible license, however, using software under GPLv3 as a part of a system, does not demand the release of the new-developed software under GPLv3, or compatible license;
▪ GNU Lesser General Public License, Version 2.1 (LGPL-2.1) (1999) (GNU, 1999): this license allows the use of software, however, if the developer wants to keep his/her code closed, it must use the software as a linked library where the client/users can change or update without compromising the new-developed software, otherwise, the new-developed software must be publicly available for at least three years;
▪ GNU Lesser General Public License, Version 3.0 (LGPL-3.0) (2007) (GNU, 2007b): similar to LGPL-2.1 but with the text amended to provide improvements, such as multiple the compatibility with other open source licenses;
▪ 2-Clause BSD License (1999) (SPDX, 2019a): this is an open source license that does not have too much restrictions, a developer can freely use and modify the software;
▪ 3-Clause BSD License (1999) (SPDX, 2019b): similar to 2-Clause BSD but it forbids the use the endorsement of the software by using the organizations or the developers’ names without the specific prior written permission;

Luis Gomes
30
▪ Common Development and Distribution License 1.0 (CDDL-1.0) (2004) (SPDX, 2019c): is based on the Mozilla Public License and it was created by Sun for OpenSolaris. It is a friendly license where files are protected, if those files are changed, then they should be released under the same license, however, it allows developers to add new files that can have other non-open source licenses, it also protects the users from patents involving the code licensed under CDDL-1.0;
▪ Mozilla Public License Version 2.0 (MPL-2.0) (2012) (Mozilla, 2009): it is similar to CDDL-1.0, files are protected, it allows the addition of new files that are protected with licenses that are not open source;
▪ Eclipse Public License - v 2.0 (EPL-2.0) (2017) (Eclipse Foundation, 2019): it is similar to CDDL-1.0 and MPL-2.0, but it allows the compatibility with GPL licenses;
▪ Apache License, Version 2.0 (2004) (Apache, 2004): compatible with GPLv3, it is a license that does not impact the license of the new-developed software, it allows the use and modification of the software, including its use in patents, but if the software is not modified, then the Apache license must prevail for that part of code;
▪ MIT License (unknown) (MIT, 2019): the release of this license is not known, but (Haff, 2019) points to be around 1987, it is a license that enables developers to freely use, modify or even sell the software as they want without limitations, being the only restriction the attachment of the MIT license into the new-developed software (attachment only, the new software does not need to be licensed under MIT).
In open source, the term copyleft is used to describe licenses that allows the free use of a software
but demands the same rights over the new-developed code. The copyleft demands the opening of
the code produced on top of the available open source code. This is the case of GPL-2.0, GPL-3.0,
LGPL-2.1, LGPL-3.0, CDDL-1.0, MPL-2.0, and EPL-2.0. Copyleft is commonly divided in two: weak
copyleft, and strong copyleft. The weak copyleft enforces the copyleft to some derived works,
allowing the linkage of libraries, while the strong copyleft enforces the copyleft to all the derived
works. In the above licenses, strong copylefts are GPL-2.0, and GPL-3.0. The license 2-Clause BSD, 3-
Clause BSD, Apache 2.0, and MIT licenses are not copyleft nor copyright.
There are multiple open source licenses for software, they must be carefully read and analyzed in
order to define if an open source software should be added in a solution. Nowadays, it is very
common to use third-party software in our developments, and this was the case of this PhD research.
Therefore, the analysis of licenses is important to enable the development of software that can be
released as open source or as a closed solution. Also, the compatibility of licenses is important, and
must be addressed during the development and before the software release. In this PhD research,
the priority was given to licenses that are not copyleft, meaning that can be freely used without
significant restrictions.

31
Chapter III
III. Proposed Systems
CHAPTER INDEX
III.1. INTRODUCTION ............................................................................................................................. 32
III.2. VIRTUAL TO REALITY (V2R) EMULATOR ........................................................................................... 32
V2R architecture ................................................................................................................ 33
V2R discrete simulation ..................................................................................................... 34
V2R variable simulation ..................................................................................................... 35
V2R graph emulation ......................................................................................................... 35
V2R contextual emulation .................................................................................................. 35
V2R mirroring representation ............................................................................................. 36
V2R OPAL-RT representation ............................................................................................ 36
Interaction with V2R ........................................................................................................... 36
V2R configuration parameters ........................................................................................... 38
III.3. ENVIRONMENTAL AWARENESS SMART PLUG (ENAPLUG) ................................................................... 39
Market analysis .................................................................................................................. 40
EnAPlug AM architecture (microcontroller) ........................................................................ 42
EnAPlug SB architecture (single-board computer) ............................................................. 43
EnAPlug SB deep learning ................................................................................................. 47
EnAPlug SB shared knowledge ......................................................................................... 48
EnAPlug SB printable product ............................................................................................ 50
III.4. SINGLE-BOARD COMPUTER FOR ENERGY (S4E)............................................................................... 51
S4E domain model ............................................................................................................. 52
S4E architecture ................................................................................................................ 54
S4E ready-to-use energy strategies ................................................................................... 66
S4E transactive energy ...................................................................................................... 73
S4E configuration and execution ....................................................................................... 75
S4E code structure............................................................................................................. 81
S4E licenses ...................................................................................................................... 83
S4E single-board computers compatibility ......................................................................... 84
S4E special agent for microgrid visualization ....................................................... 87

Luis Gomes
32
III.1. Introduction
After surveying the state of the art, this PhD conceived, developed and tested three systems that implement multiple concepts and technologies: the virtual to reality (V2R) emulator, the intelligent environmental awareness smart plug (EnAPlug), and the multi-agent system of single-board
computer for energy (S4E). These three systems were conceived and developed under GIM solution.
The GIM is the short name of the work behind this PhD research: microgrid intelligent management system based on a multi-agent approach and the active participation of end-users. Figure 4 identifies the systems that will be presented and discussed in this chapter. In the course of this PhD research,
a control centre website was also developed, the GIM Control Panel Website. All three systems were integrated in this website to perform reading and writing actions.
Figure 4. µGIM umbrella solutions
The GIM solution comprises the three systems presented in this chapter. Each system responds to a specific problem that was addressed in order to enable the development and testing of a microgrid solution. The S4E system is responsible for the management of a microgrid considering a multi-agent approach. The EnAPlug provides vital information for the energy management system that is inside each agent of the S4E system. The V2R emulators allow testing and validating all the other systems by providing simulation, mirroring, and emulation of energy resources.
In this section and forward, a resource is defined as any energy load, distributed generator, or storage unit that can be remotely monitored, and optionally controlled. This definition is inline with the microgrid definition proposed in (Marnay, 2015).
III.2. Virtual to reality (V2R) emulator
The Virtual to Reality (V2R) emulator was conceived in order to enable the simulation, emulation, and remote representation of unavailable electrical resources (Gomes, 2017b). The inability to bring theoretical management solutions to real implementations is responsible for the abandonment of such solutions that end up not being applied in real scenarios and will only live inside the academic community. The lack of real implementations should be overcome by using feasible proof of concepts, i.e., near to real deployments on end-users in the case here addresses.
To allow testing and validating the microgrid management system that was conceived and developed in this PhD research, there was a need of available electrical resources. Fortunately, the GECAD R&D centre, where the research of this PhD was made, had a previous supervisory control and data acquisition (SCADA) system enabling monitoring and partial control of the building and its resources. However, the need of residential loads was an issue that had to be overcome to enable the test and validation of the microgrid management solution.
Although the main focus of this PhD research is not the conception of such solution, the conception and development of V2R would create a positive impact in the outcome of this work and
33
represent a contribution to other research works. Therefore, the V2R is an enabler that allows the
test and validation of energy management systems as a simulator and emulator under the GIM umbrella. The V2R is open source software used inside an open hardware developed board. The public repository can be found in GitHub4 under MIT license. This means that V2R is a free to use and open source solution that can be used anywhere by anyone. The idea and novelty behind this emulator are to capacitate power system research groups with a simulator and emulator of electrical resources. In fact, as it will be explained, the V2R is itself an emulator that provides emulation, simulation, and mirroring.
Energy analysers are commonly used to provide energy monitoring in buildings and large resources. They are usually installed in electrical boards and monitor an entire section of the building. However, the provided information can be enough to identify which individual loads are turned on in that section of the building (Fernandes, 2017). Energy analysers enable the easy monitoring of physical resources while providing one, or more, communication protocols. One of the most used protocol is Modbus/RTU running on top of a RS485 network. The Modbus protocol also has a Modbus/TCP version that can run on top of a TCP/IP network, usually used in high-end equipment with RJ45 Ethernet connection.
The V2R emulator is an emulator of an energy analyser with Modbus/RTU protocol. The V2R uses a proprietary TCP/IP protocol that enables the connection of this emulator to an TCP/IP network, using an Ethernet cable.
V2R architecture
The software architecture of V2R is presented in Figure 5. A V2R emulator can simulate, emulate or replicate energy data using, at least, one of its six available modes: discrete simulation, variable simulation, graph emulation, contextual emulation, mirroring representation, and OPAL-RT representation.
Figure 5. V2R software architecture
The V2R emulator uses a multi-layer architecture running in a unique single-thread microcontroller. Therefore, the simplification of code is a restriction that must be considered. The bottom layer, RS485, is the controlling layer for the RS485 network. This layer is responsible for integrating the needed hardware to enable the microcontroller to communicate, using serial communication, with a RS485 network. On top of this layer, is the Modbus/RTU layer that deals with the same named protocol. This layer provides the ability to communicate with other Modbus/RTU compliant equipment available in the RS485 network.
4 V2R: https://github.com/lufog-gecad/v2r
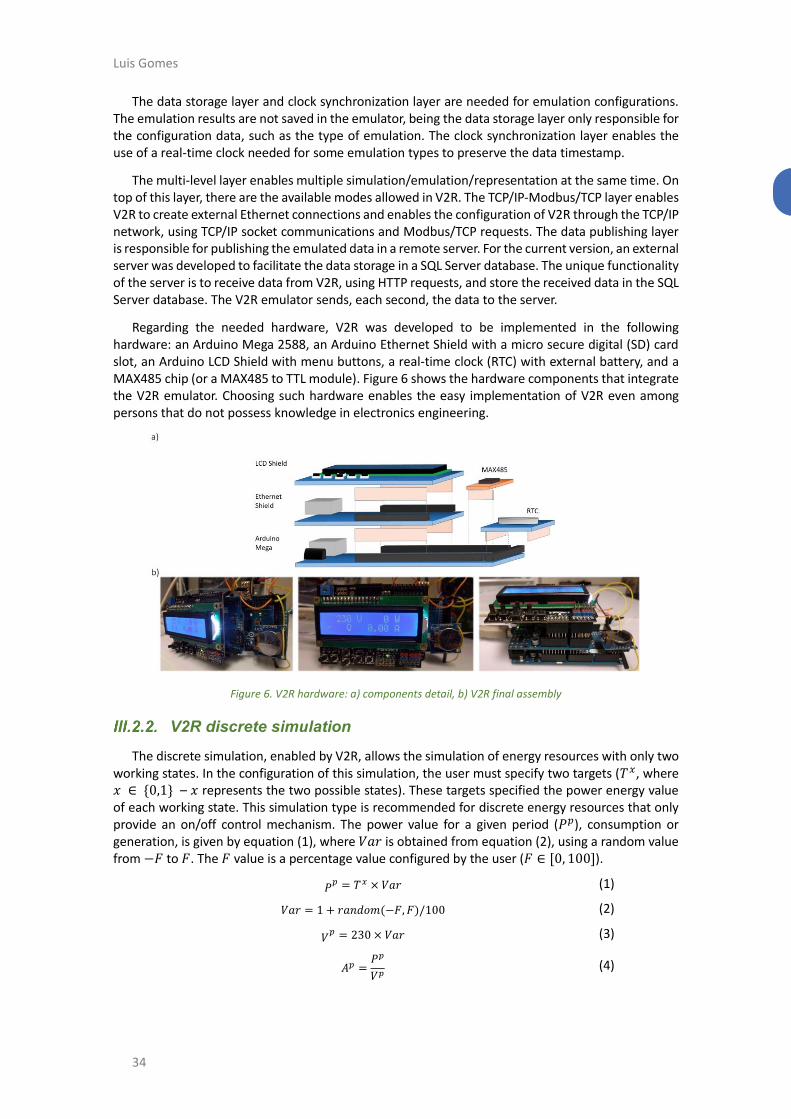
Luis Gomes
34
The data storage layer and clock synchronization layer are needed for emulation configurations. The emulation results are not saved in the emulator, being the data storage layer only responsible for the configuration data, such as the type of emulation. The clock synchronization layer enables the use of a real-time clock needed for some emulation types to preserve the data timestamp.
The multi-level layer enables multiple simulation/emulation/representation at the same time. On top of this layer, there are the available modes allowed in V2R. The TCP/IP-Modbus/TCP layer enables V2R to create external Ethernet connections and enables the configuration of V2R through the TCP/IP network, using TCP/IP socket communications and Modbus/TCP requests. The data publishing layer is responsible for publishing the emulated data in a remote server. For the current version, an external server was developed to facilitate the data storage in a SQL Server database. The unique functionality of the server is to receive data from V2R, using HTTP requests, and store the received data in the SQL Server database. The V2R emulator sends, each second, the data to the server.
Regarding the needed hardware, V2R was developed to be implemented in the following hardware: an Arduino Mega 2588, an Arduino Ethernet Shield with a micro secure digital (SD) card slot, an Arduino LCD Shield with menu buttons, a real-time clock (RTC) with external battery, and a MAX485 chip (or a MAX485 to TTL module). Figure 6 shows the hardware components that integrate the V2R emulator. Choosing such hardware enables the easy implementation of V2R even among persons that do not possess knowledge in electronics engineering.
Figure 6. V2R hardware: a) components detail, b) V2R final assembly
V2R discrete simulation
The discrete simulation, enabled by V2R, allows the simulation of energy resources with only two working states. In the configuration of this simulation, the user must specify two targets (𝑇𝑥, where 𝑥 ∈ {0,1} – 𝑥 represents the two possible states). These targets specified the power energy value of each working state. This simulation type is recommended for discrete energy resources that only provide an on/off control mechanism. The power value for a given period (𝑃𝑝), consumption or generation, is given by equation (1), where 𝑉𝑎𝑟 is obtained from equation (2), using a random value from −𝐹 to 𝐹. The 𝐹 value is a percentage value configured by the user (𝐹 ∈ [0, 100]).
𝑃𝑝 = 𝑇𝑥 × 𝑉𝑎𝑟 (1)
𝑉𝑎𝑟 = 1 + 𝑟𝑎𝑛𝑑𝑜𝑚(−𝐹, 𝐹)/100 (2)
𝑉𝑝 = 230 × 𝑉𝑎𝑟 (3)
𝐴𝑝 =𝑃𝑝
𝑉𝑝 (4)

35
For discrete electrical loads, with on/off control, 𝑇0 specifies the consumption target of the off state, in this case it will be considered the value zero (0 W). For the on state, 𝑇1 is used – for instance, if we want to simulate a fan heater, a 2000 W target can be configured.
The V2R has four readable registers through Modbus/RTU: power, voltage, current, and state. The power is calculated by equation (1). The voltage and current for each simulation period are calculated by equations (3) and (4), respectively. The load state is given by the current value of 𝑥 (i.e., zero or one). From these registers, only the state register is writable.
V2R variable simulation
The variable simulation allows the simulation of discrete energy resources with multiple states. In this case, the energy resource has more than the previous two states allowed in the distributed simulation. The user must specify the available states and their individual consumption/generation. The power emulated in V2R is calculated using equation (5).
𝑃𝑝 = 𝑇𝑦 × 𝑉𝑎𝑟 (5)
where 𝑦 is the state of the energy resource being simulated. The states are sequential, i.e., every change of state will make the simulated resource to go to the next state. For instance, if the state is 𝑦 = 1 then the next state will be 𝑦 = 2. Equations (2), (3), and (4) are still valid for this simulation type. This type of simulation is useful for energy resources that provide more than on/off control. For instance, a dimmable lamp or a heater with more than one heating mode.
V2R graph emulation
The use of discrete and variable simulations is not suitable for energy resources with consumption or generation profiles mutable in time. For instance, a refrigerator cannot be represented using the two previous types. To overcome this issue, the graph emulation was developed. This is in fact an emulation because real energy profiles from real energy resources are used.
The graph emulation uses a 24-hour graph that indicates values for power (𝑇𝑃𝑖 ), voltage (𝑇𝑉
𝑖 ) and
current (𝑇𝐴𝑖), where 𝑖 is the array index of the time period. The graph emulation index indicates which
row of input data V2R must be read in order to emulate those values. The index can be used in two modes: simulation-time, and real-time. The simulation-time sets 𝑖 = 0 when the simulation starts and then adds 1 every period. The real-time adds the same value (1) every period, but it uses equation (6) to initiate the 𝑖 value, where ℎ𝑜𝑢𝑟, 𝑚𝑖𝑛𝑢𝑡𝑒 and 𝑠𝑒𝑐𝑜𝑛𝑑 are the current time. The real-time mode will execute the chart values using the real timestamp – the values of 13:15 will appear in V2R at 13:15. The power, voltage and current are calculated using equations (7), (8), and (9), respectively.
𝑖 = ℎ𝑜𝑢𝑟 × 60 × 60 + 𝑚𝑖𝑛𝑢𝑡𝑒 × 60 + 𝑠𝑒𝑐𝑜𝑛𝑑 (6)
𝑃𝑝 = 𝑇𝑃
𝑖 × 𝑉𝑎𝑟 (7)
𝑉𝑝 = 𝑇𝑉
𝑖 × 𝑉𝑎𝑟 (8)
𝐴𝑝 = 𝑇𝐴
𝑖 × 𝑉𝑎𝑟 (9)
This emulation uses the real-time clock for the clock synchronization in order to support the real-time mode of graph emulation. This emulation is capable to follow a consumption/generation profile during 24-hours. When the index 𝑖 reaches the end of the array, it is automatically set to 𝑖 = 0.
V2R contextual emulation
The contextual emulation is very similar to the graph emulation but it allows the control of cyclical energy profiles, such as washing machines. It uses the same equations for energy values: equations (7), (8), and (9), and both use graphs with energy profiles. The difference between them are the

Luis Gomes
36
control capabilities. While the graph emulation uses a 24-hour profile – not allowing interaction and control by the user – the contextual emulation uses a time limited graph where the time of the profile is variable. This emulation type was developed having in mind the emulation of resources that are not discrete nor variable. Resources, such as washing machines, with a well-known energy profile that it is started manually and stopped automatically when it reaches the end of the energy profile, i.e. a washing cycle.
The contextual emulation also enables to turn off the resource during the profile execution. If this happens, the profile will start from 𝑖 = 0 next time the resource is turned on. In the contextual emulation, the simulation-time and real-time modes are not applied. The index will start at zero every time the resource is turned on.
V2R mirroring representation
In V2R, representation means that the V2R emulator will not simulate or emulate any resource. Using the representation capability, the V2R will mimic the energy values that are presented in a remote system. The mirroring representation uses Modbus/TCP to query a remote energy analyser and then mimic its energy values in the V2R. This facilitates bringing remote energy resources to a local RS485 network, meaning that a remote load or building can be put inside a local microgrid, where it is not physically in.
For the mirroring representation configuration, the user must specify the update period and the Modbus/TCP requests needed to retrieve the voltage, current and power. For this mode, the user must ensure the existence of a TCP/IP connection between V2R and the mirrored resource. The user can enable the control of a mirroring representation, but this is only possible if the remote energy resource allows control over Modbus/TCP.
V2R OPAL-RT representation
OPAL-RT Technologies5 is a world leader in PC/FPGA-based real-time simulations, enabling the use of hardware-in-the-loop (HIL) and power hardware-in-the-loop (PHIL). Their solutions facilitate the use of Matlab Simulink and allow the simulation of energy resources and equipment, allowing validation of power energy systems using simulated scenarios. In (Abrishambaf, 2016), an energy management system is tested in OPAL-RT using HIL with consumed emulated resources. Grid-level simulations are also possible, as can be seen in (Bhandakkar, 2018) where the entire IEEE-5-bus network is simulated in OPAL-RT.
The V2R enables the integration with OPAL-RT using Modbus/TCP in order to mirroring real-time simulated resources. For instance, it is possible to have a simulated wind turbine in OPAL-RT and, on using the V2R emulator, inject its generation values in a physical SCADA system integrated in a building or microgrid. The SCADA system will query the V2R emulator as being a normal energy analyser and will behave as if an actual wind turbine was installed in the building/microgrid.
Internally in V2R, there is not any differentiation between the mirroring and the OPAL-RT representations, both use Modbus/TCP to mirroring energy resources. In V2R they are separated only for organizational proposes, separating real resources and real-time simulated resources.
Interaction with V2R
V2R emulators are installed in RS485 networks using Modbus/RTU protocol. The emulators operate in slave-mode in the Modbus/RTU protocol, using the registers presented in Table 1. The SCADA system will query each emulator and will be able to read the energy values, meaning that, a V2R emulator can be monitored and controlled using the Modbus/RTU protocol.
5 https://www.opal-rt.com/

37
Table 1. V2R register map
Address (hex) Size (bytes) Data Type Description
0x01 4 IEEE 754 Voltage 0x05 4 IEEE 754 Current 0x09 4 IEEE 754 Power consumption 0x0D 4 IEEE 754 Controllable load status
Additionally, the emulator provides two interaction types: manual, and remote. For manual interaction, buttons on the LCD Shield are used as inputs and the LCD itself is used for user feedback. Figure 7 shows the top view of V2R and details the available information displayed in the emulator. The visual data enables an understanding of the energy resource. The figure also details the buttons’ functions and available icons.
Figure 7. V2R hardware manual user interaction
Figure 8 shows the available menus as well as the information, configuration and how to access and control the menu using the buttons on the LCD shield. Similar to an energy analyser, the V2R provides a menu where the energy values can be read. The menu, as seen in Figure 8, also provides information regarding the type of simulation, emulation, or representation that is running. Information regarding the RS485 network, IP address and V2R ID are also presented in the menu.
Figure 8. V2R manual emulator menu
Besides the visualization capability, the menu provides some editable configurations (Figure 8), such as the Modbus/RTU slave ID. The energy resource, if controllable, can be manually controlled using a button in the LCD Shield. For on/off resources, the manual control button (Figure 7) will change the resource status from on, to off, and back to on. For variable simulations, the controlled

Luis Gomes
38
button will change the status of the resource to the next status, e.g., if a fan heater with modes off, medium and maximum is simulated, the controlled button will change from off, to medium, to maximum and back to off.
V2R also allows remote interaction in GIM control website using TCP/IP protocol. The simulated and emulated resources can be remotely controlled from this website, in a similar manner they are
controlled in the LCD Shield. The GIM control website also provides remote monitoring of the V2R, enabling the near real-time graphical visualization of the energy values emulated, simulated or represented in the V2R.
Since data is precious, V2R enables the storage of all data in a remote SQL Server. This functionality
can be activated manually in the V2R menu or using the remote control through the GIM website.
This functionality will force the V2R emulator to send the data to the GIM website, using a special uniform resource identifier (URI) provided by the website. All data sent to this URI are stored in a database. Currently, it is used SQL Server, but other connection strings can be used.
V2R configuration parameters
All configurations of V2R are made in the GIM website running outside the V2R’s hardware. The website, developed as a control centre in the scope of the PhD research, has the ability to configure V2R simulations, emulations, and representations and then send this configuration to the V2R
hardware using a TCP/IP connection. A V2R configuration panel of GIM website can be seen in Figure
9. The GIM website uses bootstrap and enables a responsive web interface built by blocks, specified by div tags in the HTML document.
Figure 9. µGIM control panel website
The website uses computational sockets to connect to the V2R emulator. The configuration information is sent to the emulator and stored in the SD card placed in the Ethernet Shield. The configuration of discrete simulation, variable simulation, mirroring representation, and the OPAL-RT

39
representation is a simple encoded string that characterizes the energy resource and how the V2R will emulate the energy values. For graph and contextual emulations, the configuration demands a
dataset of energy values with the proper timestamp. The datasets are sent from GIM website to V2R emulator and stored in the SD card.
Figure 10 shows the HTML block for uploading data to the V2R emulator. Some options shown in Figure 10 are only applied in some of the V2R simulations, emulations, and representation – this is represented in the figure using comment boxes listing where those options are used. To make the upload possible, the user needs to specify the V2R IP address, that can be seen when V2R initiates or in its menu. The user must also provide information regarding the application of random values and the deviation of this randomness, equation (2). For instance, if the application of random values in a discrete simulation is desired, the user must activate the random checkbox and input the deviation value to be applied.
The “start in ON” checkbox, shown in Figure 10, identifies if the V2R emulator will start with the energy resource turned on or off. The controllable checkbox identifies if the energy resource is controllable, and if so, the V2R will activate its Modbus/RTU for remote control. The starting-point option is only applied in graph emulation and indicates if the dataset of energy values will be read using the simulation-time or in real-time. The simulation-time mode reads the resource dataset using incremental values, from first line to the last line. The real-time mode uses the resource dataset according to its timestamp, meaning that at 17h15 the V2R will emulate the values of dataset corresponding to the 17h15 measurements.
Figure 10. V2R configuration block
III.3. Environmental awareness smart plug (EnAPlug)
The V2R emulator fulfils the lack of available resources for laboratory and/or experimental microgrids and energy management systems. However, the lack of available resources is not the only issue. The use of old energy resources demands the use of retrofitting techniques to enable its remote monitoring and control. The massification of internet of things (IoT) devices, namely smart plugs, in our buildings – homes and commerce – can be used in energy management systems for remote monitoring and control. The issue with this approach is the lack of information provided by the IoT devices. During this PhD research, the lack of information has been identified as a problem because it limits the efficiency of energy management systems. If the system is not able to understand its context and the resource usage, then the energy management can compromise the users’ comfort.
The proposed environmental awareness smart plug (EnAPlug) is a solution for energy resources monitoring and control. The EnAPlug is an upgrade of conventional smart plugs, being able to

Luis Gomes
40
understand the context and environment of the controllable energy resource. Conventional smart plugs only provide status data and energy monitoring measurements, while EnAPlug monitors environmental sensor data and understands the controllable energy resource’s context using artificial intelligence learning algorithms. This context awareness provides additional data for energy management systems, that can be used to increase the user’s comfort while decreasing energy consumption and/or costs. It is the author opinion that IoT devices can and should be used in energy management systems. Therefore, IoT devices and energy management systems should trace a joint path that can benefit both. The EnAPlug is an IoT device proposed for energy management systems.
During the PhD research period, two versions of EnAPlug have been proposed: a version with a microcontroller (i.e., EnAPlug AM), and a version with a single-board computer (i.e., EnAPlug SB). The software for the EnAPlug AM is an open source solution available in GitHub6 under MIT license. The EnAPlug AM uses the microcontroller Arduino Mega 2560. The concept behind this version is a light-weight solution for monitoring sensor data and control the resource’s status. In the EnAPlug AM, no decision nor processing is done inside the microcontroller. All data are read by the microcontroller and sent to the cloud. Control signals also use the cloud connection. The use of a cloud demands a centralized system with a unique control point. Although this is a common approach in IoT solutions, this was not the ideal solution for EnAPlug. Therefore, the EnAPlug SB version uses a single-board computer smaller than an Arduino Mega 2560, capable of locally processing data and taking decisions. This improves the EnAPlug processing and enables a fully distributed solution where each EnAPlug can take decisions while exchanging information with other EnAPlugs installed in the same room and/or building. The EnAPlug SB can learn from its data using machine learning, enabling the identification of contexts, the forecasting of the resource usage, the forecasting of the resource consumption, and the sharing of all this information with its peers.
While the EnAPlug AM can be seen as an IoT device to support energy management systems, the EnAPlug SB can act as an intelligent and fully distributed energy management system. Because of its preliminary development, EnAPlug SB is not yet available as an open source solution. Being a wider system, more tests are required to create a stable 24/7 working system without significant bugs.
Market analysis
The IoT market is growing rapidly and the proposal of a new IoT device should considered the devices already available on the market. Therefore, a detailed market analysis regarding smart plugs has been conducted. This analysis took into consideration smart plugs from every continent and market. The exclusion criteria were: lack of official information by the manufacturer and official sellers, smart plugs that do not provide energy metering, and smart plugs that were not in the market until the end of 2018.
A total of 42 smart plugs were analysed, and 25 were later excluded because no official information was available. Being a commercial product for end-users, the lack of official information was a surprise, even among worldwide manufacturers, such as Samsung, have market available smart plugs without sufficient information/documentation. One of the common missing information is the maximum power that a smart plug can handle. This is in fact a problem because smart plugs with a type F connection sometimes cannot handle the standard 16 amps of the type F connector.
Table 2 shows the functionalities of the smart plugs that have been analysed. The price column was filled using prices available in the Spanish and German Amazon websites during the first semester of 2019, with the exception of the iSocket price that was taken from the official website. From the presented analysis of 17 smart plugs, only iSocket allows the integration of external sensors, enabling the reading of context and environment data. However, the price is, by far, the highest. It is important to note that the price of the proposed EnAPlug considers the prototype price and not a selling price.
6 https://github.com/lufog-gecad/enaplug
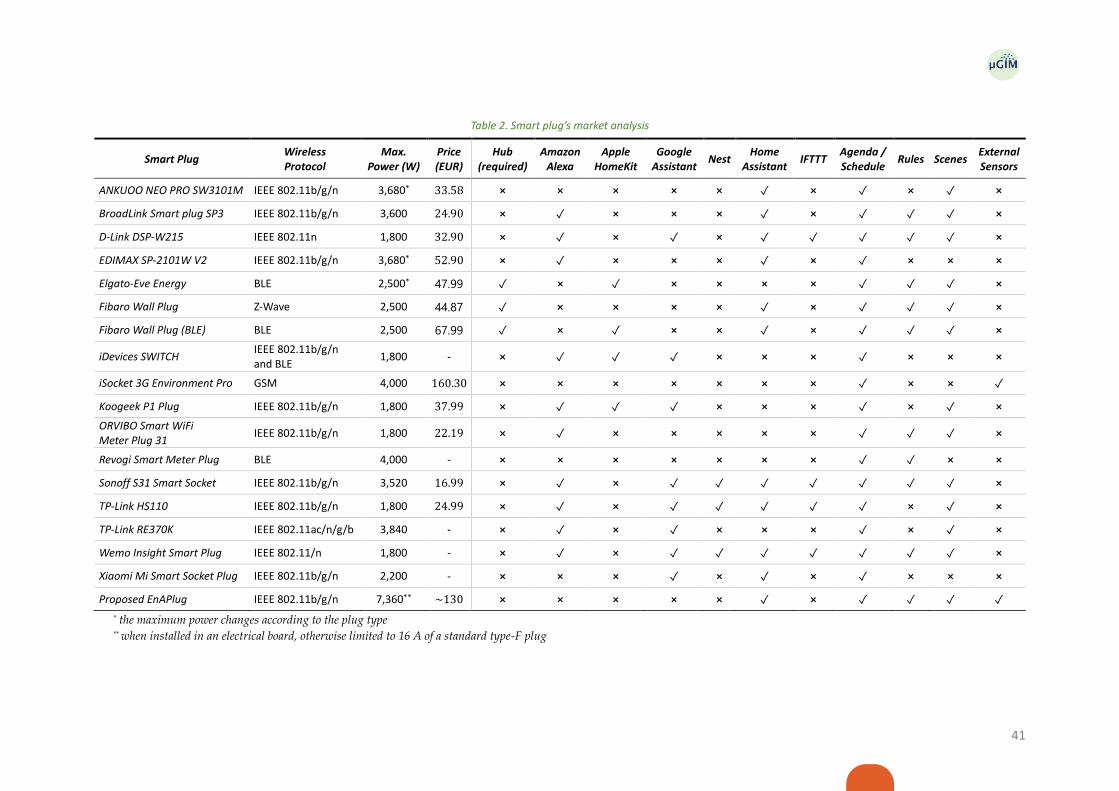
41
Table 2. Smart plug’s market analysis
Smart Plug Wireless Protocol
Max. Power (W)
Price (EUR)
Hub (required)
Amazon Alexa
Apple HomeKit
Google Assistant
Nest Home
Assistant IFTTT
Agenda / Schedule
Rules Scenes External Sensors
ANKUOO NEO PRO SW3101M IEEE 802.11b/g/n 3,680* 33.58 ⨯ ⨯ ⨯ ⨯ ⨯ ✓ ⨯ ✓ ⨯ ✓ ⨯
BroadLink Smart plug SP3 IEEE 802.11b/g/n 3,600 24.90 ⨯ ✓ ⨯ ⨯ ⨯ ✓ ⨯ ✓ ✓ ✓ ⨯
D-Link DSP-W215 IEEE 802.11n 1,800 32.90 ⨯ ✓ ⨯ ✓ ⨯ ✓ ✓ ✓ ✓ ✓ ⨯
EDIMAX SP-2101W V2 IEEE 802.11b/g/n 3,680* 52.90 ⨯ ✓ ⨯ ⨯ ⨯ ✓ ⨯ ✓ ⨯ ⨯ ⨯
Elgato-Eve Energy BLE 2,500* 47.99 ✓ ⨯ ✓ ⨯ ⨯ ⨯ ⨯ ✓ ✓ ✓ ⨯
Fibaro Wall Plug Z-Wave 2,500 44.87 ✓ ⨯ ⨯ ⨯ ⨯ ✓ ⨯ ✓ ✓ ✓ ⨯
Fibaro Wall Plug (BLE) BLE 2,500 67.99 ✓ ⨯ ✓ ⨯ ⨯ ✓ ⨯ ✓ ✓ ✓ ⨯
iDevices SWITCH IEEE 802.11b/g/n and BLE
1,800 - ⨯ ✓ ✓ ✓ ⨯ ⨯ ⨯ ✓ ⨯ ⨯ ⨯
iSocket 3G Environment Pro GSM 4,000 160.30 ⨯ ⨯ ⨯ ⨯ ⨯ ⨯ ⨯ ✓ ⨯ ⨯ ✓
Koogeek P1 Plug IEEE 802.11b/g/n 1,800 37.99 ⨯ ✓ ✓ ✓ ⨯ ⨯ ⨯ ✓ ⨯ ✓ ⨯
ORVIBO Smart WiFi Meter Plug 31
IEEE 802.11b/g/n 1,800 22.19 ⨯ ✓ ⨯ ⨯ ⨯ ⨯ ⨯ ✓ ✓ ✓ ⨯
Revogi Smart Meter Plug BLE 4,000 - ⨯ ⨯ ⨯ ⨯ ⨯ ⨯ ⨯ ✓ ✓ ⨯ ⨯
Sonoff S31 Smart Socket IEEE 802.11b/g/n 3,520 16.99 ⨯ ✓ ⨯ ✓ ✓ ✓ ✓ ✓ ✓ ✓ ⨯
TP-Link HS110 IEEE 802.11b/g/n 1,800 24.99 ⨯ ✓ ⨯ ✓ ✓ ✓ ✓ ✓ ⨯ ✓ ⨯
TP-Link RE370K IEEE 802.11ac/n/g/b 3,840 - ⨯ ✓ ⨯ ✓ ⨯ ⨯ ⨯ ✓ ⨯ ✓ ⨯
Wemo Insight Smart Plug IEEE 802.11/n 1,800 - ⨯ ✓ ⨯ ✓ ✓ ✓ ✓ ✓ ✓ ✓ ⨯
Xiaomi Mi Smart Socket Plug IEEE 802.11b/g/n 2,200 - ⨯ ⨯ ⨯ ✓ ⨯ ✓ ⨯ ✓ ⨯ ⨯ ⨯
Proposed EnAPlug IEEE 802.11b/g/n 7,360** ~130 ⨯ ⨯ ⨯ ⨯ ⨯ ✓ ⨯ ✓ ✓ ✓ ✓
* the maximum power changes according to the plug type ** when installed in an electrical board, otherwise limited to 16 A of a standard type-F plug

Luis Gomes
42
As it can be seen in Table 2, the majority of the analysed smart plugs are compatible with at least one voice assistant, or system with voice assistant: Amazon Alexa, Apple HomeKit, or Google Home. Some of these companies are studying the implementation of energy management systems but none of them is available yet. Nonetheless, their ability to integrate multi-vendor IoT devices gives an advantage regarding the management of energy resources.
Home Assistant is an open source platform that enables the integration of multiple IoT devices as well as multiple IoT-used protocols, enabling the possibility to integrate tailor made solutions, as the ones developed in research centres. The possibility to integrate each smart plug in Home Assistant is also indicated in Table 2. Home Assistant also allows the integration of the open source voice assistant software, MyCroft, and the proprietary voice assistants Amazon Alexa and Google Assistant. While there are several smart plugs on the market, they were not built to be efficiently used in energy management systems.
EnAPlug AM architecture (microcontroller)
The EnAPlug was initially proposed using centralized approach, with an Arduino Mega 2560 able to send and receive data from and to the cloud (Gomes, 2017d). The proposed EnAPlug has the same monitoring and control capabilities of a typical smart plug. Still, it allows the integration of external sensors able to read and “see” the context where the controllable load is located. Within the scope of this PhD research, it is considered that a controllable load is an electrical resource that is directly connected to the EnAPlug.
Figure 11 shows the overall architecture of EnAPlug AM, presenting the needed hardware and its connections. The software is not detailed in this figure. Simple software is used to read all the sensors’ data, publish the data using hypertext transfer protocol (HTTP) requests, receive HTTP requests, and control the controllable load accordingly to the received HTTP requests. Ahead, Figure 11 contents are described from left to right.
Figure 11. Architecture of EnAPlug AM
The controllable load is a 230 V AC electrical resource, usually a load. This is the target of EnAPlug. A mono-phase energy analyser is used to read, with precision, all energy data. Usually, smart plugs do not provide an accurate energy measurement. Though EnAPlug was built for energy management systems, real-time accurate monitoring data are needed. Therefore, despite compromising its size, a mono-phase energy analyser is used in EnAPlug AM and EnAPlug SB.
The actuator is also connected to the controllable load and should provide discrete or variable control over the controllable load. In conventional smart plugs only an on/off control is available. In EnAPlug, the control type can be fit to the controllable load. The simplest actuator that can be used is a relay for 230 V AC with a 5 V DC control. When choosing the energy analyser and the relay, it must be taken into consideration the maximum and recommended current they can handle.
The microcontroller is the processing unit and the core of EnAPlug AM, all data flows through the microcontroller. In EnAPlug AM, an Arduino Mega 2560 board is used. The open source software was developed for this board. However, it is still possible to change the microcontroller and still keep the

43
EnAPlug concept. The microcontroller must provide the ability to handle GPIO signals, RS485 Modbus/RTU protocol, and HTTP requests. Those communications are vital for EnAPlug and are used to interact with all the connected hardware and the exterior world.
The integration of external sensors is the main innovation and advantage of EnAPlug. They allow monitoring the controllable load environment and context. The resource’s context is a key feature to provide an efficient control over the resource. For instance, if we want to manage a fan heater according to the room’s temperature we can easily connect it to a conventional smart plug, but we will lack the temperature reading – using only IoT devices this scenario needs a smart plug and a temperature sensor, also in most cases a centralizer/gateway is also needed for the temperature sensor. With EnAPlug we can simply add a temperature sensor and any other sensor that the energy management system’s needs. By integrating sensors in EnAPlug, it is possible to capture the controllable load context using a single device connected to the cloud. Moreover, the EnAPlug SB will not even need the cloud to manage resources.
The integration of new sensors must follow the ideology that they must be needed to provide a more efficient control over the controllable load. Consequently, only sensors that are used and/or needed for the resource management should be integrated in EnAPlug. EnAPlug should not integrate unnecessary sensors.
The control signal allows the direct control over the controllable load using the actuator. Control signals are sent in HTTP requests. However, an IoT-oriented protocol should be used instead of HTTP, such as message queuing telemetry transport (MQTT), advanced message queuing protocol (AMQP) or streaming text-oriented messaging protocol (STOMP).
The use of a microcontroller simplifies the architecture and deployment of EnAPlug AM, but it also brings some limitations and disadvantages. As seen in Figure 11, the Arduino is responsible for reading all the data from the energy analyser and sensors, reading all data from the HTTP requests (i.e control signals), and also send the reading data to the Storage application programming interface (API). By using a single core microcontroller to perform these tasks, it is a challenge in its own.
EnAPlug SB architecture (single-board computer)
After testing EnAPlug AM, inspired by a cloud-based IoT approach, it was found that EnAPlug could be much more than a conventional IoT device. Several single-board computers (SBC) in the market have been analysed, such as NanoPi NEO-LTS, Raspberry Pi Zero W, and Orange Pi Zero Plus2, with dimensions of 40x40 mm, 65x30 mm and 46x48 mm, respectively. It has been concluded that by using an SBC, it is possible to reduce EnAPlug’s overall size while improving the processing capabilities (Gomes, 2018c). In this new version, four goals were pursuit:
▪ integrate wireless sensors;
▪ use SBC to replace the microcontroller;
▪ provide local management capacity inside EnAPlug;
▪ provide fully distributed energy management system.
The main architecture of EnAPlug SB can be seen in Figure 12. The EnAPlug SB allows the integration of wireless sensors, shown as dashed green lines in Figure 12. The integration of RF wireless sensors easy the installation of EnAPlugs and enables the placement of sensors in the controllable load surroundings without demanding a special location for the EnAPlug. For example, if an EnAPlug is used to control a bedside table’s light, the clarity sensor should be placed in the bedside tabletop and not under the bedside table near the power plug.

Luis Gomes
44
Figure 12. Overview of EnAPlug SB
In EnAPlug SB, the connectivity to the cloud is not mandatory, but it is recommended to enable the usual IoT device features. By using SBC, the new EnAPlug stops using the cloud for decision making and resource management centralizer. The cloud layer still exists, but it will mainly be used for data storage and energy-related web services. In EnAPlug SB, a software architecture was conceived, using the new options given by the use of SBC. Figure 13 shows the software architecture of EnAPlug. The following sections will describe each architecture’s module regarding its functionalities and usage.
Figure 13. Software architecture of EnAPlug SB
III.3.3.1. JADE framework module
In order to provide a fully distributed energy management system using only EnAPlugs, an agent-based approach was implemented, turning each EnAPlug into an agent. This enables the pursuit of individual goals and the collaboration between agents. Consequently, in the base of EnAPlug’s

45
architecture is the Java agent development (JADE7) framework. The use of this framework enables an easy implementation of a multi-agent system (MAS) that is compliant with Agent Communication Language (ACL), from the Foundation for Intelligent Physical Agents (FIPA), and where some of generic agents are already implemented, such as yellow pages that in JADE context is denominated as Directory Facilitator (DF).
Although EnAPlug is based on a MAS, standalone installation can be done. A single EnAPlug smart plug can manage its controllable load and, in its limit, it will work as an IoT device where the user can remotely monitor and control the controllable load. The MAS will empower EnAPlug performance and enable sharing of knowledge among agents to perform a fully distributed and collaborative resource optimization (see section III.3.5).
III.3.3.2. Persistence and historic module
To avoid data storage limitations, recent data, of EnAPlug SB, is stored locally in the SBC, while past data is sent to a cloud server. The EnAPlug is able to manage the data storage according to its needs. Several databases can be used to store data locally. Nonetheless, PostgreSQL so far it was used because it is a fully open source solution with free licenses – database in licensed under PostgreSQL License, that is similar to BSD and MIT licenses, and the database connection driver is licensed under BSD-2-Clause license.
In the persistence and historic module, the EnAPlug agent will read and store all sensor data, actuator state and internal agent data. The periodicity of storage can be freely designed by the developer, having into account other modules’ needs. For instance, a resource optimization algorithm can demand a higher rate of data.
This module is also responsible for sending the local data to the remote storage unit. The module has a synchronization mechanism to send/receive data to/from the remote storage. The synchronization has into consideration the local storage size available in the SBC. The module also provides an internal interface for the other modules, enabling the publication and reading of data. A seamless internal interface is provided regarding real-time, local data and remote data. Modules querying the persistence and historic module will not know where the data comes from.
III.3.3.3. Awareness module
The awareness module has the responsibility of monitoring and interacting the controllable load and its context. All the context-relevant data is read with this module. The data will then be shared with the knowledge module and with the persistence and historic module. The awareness module works as an abstraction layer between the system and the physical sensors and actuators.
III.3.3.4. Knowledge module
The knowledge module can read the EnAPlug’s data and give it meaning. This module includes artificial intelligence (AI) algorithms that will transform information into knowledge. The module will be better described in section III.3.4.
To avoid processing limitations in the SBC, the knowledge module is also able to work in a similar way as the persistence and historic module. The knowledge module is able to send tasks that have a higher processing demand to an external server in the cloud where the AI algorithms can process the data. Usually, this capability is needed for algorithms that require training. The training process is highly demanding in terms of processing capabilities, and they can have long execution periods. Processing the training in the SBC can damage the system performance. Therefore, external servers can help and make the system more efficient. Although external servers are used for AI algorithms
7 https://jade.tilab.com/

Luis Gomes
46
training purposes, the already trained algorithms can be executed inside the SBC. After the training, the algorithm can be executed almost anywhere demanding a lower processing capacity.
III.3.3.5. Energy metering module
The energy metering module is responsible for reading data from the energy analyser using Modbus/RTU protocol. The reading period is set to one second, where in each second the module will query the energy analyser. This module read the energy analyser data and make it available for the awareness module.
III.3.3.6. Sensors and actuators module
The sensors and actuators module is similar to the energy metering module, but applied to sensors and actuators. This module is responsible for integrating all sensors and actuators in the SBC. Each sensor and actuator will start a thread in this module. The thread will communicate with the sensor/actuator using the appropriate protocol and will make the data available to other modules. The actuator thread will also receive control signals to activate/deactivate the actuator.
III.3.3.7. Resource safety control module
The resource safety control module is a novelty in EnAPlug SB. This module prevents any damage on the controllable load provoked by the user and EnAPlug control. The need for this improvement was raised during the tests of EnAPlug AM when the refrigerator was tuned off during a Friday afternoon and was kept turned off until Monday morning without anyone noticing.
The resource safety control module uses simple rules that prevent damage in the controllable load or degradation of its usage. In the refrigerator example, the safety control can monitor the inside
temperature, and if the temperature rises above 10 ̊ C, then the actuator will be activated and control
signals are disabled, not allowing any external control. The resource safety control can disable and enable the capability of EnAPlug to perform control actions over the controllable load. If a dangerous situation is detected by this module, the control actions of EnAPlug are disabled until the dangerous situation ends. The rules in the safety control have access to the data of sensors and actuator. In future developments, the safety control can be implemented closer to the hardware, within a microcontroller connected to the sensors and actuator. This will enable a faster response from EnAPlug and will eliminate problems regarding the SBC operating system (OS).
III.3.3.8. Cloud connection module
The cloud connection module is responsible for the establishment of connections with external servers. This module will be used for the knowledge module and the persistence and historic module to send/receive data to/from external servers. For instance, the algorithms available in the shared intelligence platform firstly proposed in (Vinagre, 2017) can be accessed and used by EnAPlug using the cloud connection module.
III.3.3.9. Shared knowledge module
The shared knowledge module enables EnAPlug to share its knowledge with its peers. This module is the most important novel characteristic of EnAPlug SB and it is the enabler that allows the achievements of the two last points presented as the four goals that EnAPlug SB should implement, mentioned in section III.3.3. More on this module will be presented in section III.3.5.
III.3.3.10. Modbus/RTU and Modbus/TCP module
In the energy field, Modbus protocol is widely used in its two variations: Modbus/RTU, and Modbus/TCP. The Modbus/RTU is used on top of an RS485 network while the Modbus/TCP is used

47
on top of a TCP/IP network. Energy analysers are often sold with Modbus/RTU compatibility that enable the query of registers to read and write. However, usually the write function is not available in energy analysers. This module is responsible for coordinating the integration of a MAX485 connected to the EnAPlug’s SBC using serial communication.
III.3.3.11. General purpose input/output pins module
Using the full capabilities of the SBC, the general purpose input/output (GPIO) pins can be used to directly connect sensors and/or actuators. This module is represented in EnAPlug agent to control the access of the SBC GPIO pins. The number of available GPIO pins vary according to the chosen SBC, as well as, the GPIO pin types. Not all GPIO pins can perform the same tasks, its functionalities are specified in the SCB datasheet and schema.
III.3.3.12. Radio frequency module
The radio frequency module is responsible for the integration of wireless sensors. The wireless sensors are a novelty of EnAPlug SB and can be integrated using multiple frequencies. In our tests, a 433 MHz frequency was used.
III.3.3.13. Transmission control protocol/internet protocol module
The TCP/IP module is only responsible for requesting and receiving data from and to the EnAPlug agent. This module can be used by sensors and actuators to integrate sensors using RESTful APIs or other HTTP requests, by the cloud connection module to connect with external servers, and by the shared knowledge module to communicate with other EnAPlug agents.
EnAPlug SB deep learning
EnAPlug SB uses deep learning algorithms to acquire knowledge regarding the context of the controllable load. The concept behind EnAPlug SB is a context-aware smart plug that can share with its peers the individual knowledge. Therefore, each EnAPlug has learning mechanisms to understand the controllable load context and usage profile.
In EnAPlug SB, it was defined a set of questions that each EnAPlug must answer. Table 3 shows these questions and how EnAPlug can answer them. The use of real-time contextual data enables EnAPlug to respond to the two first questions that are related to real-time events. The deep learning algorithms are used to answer questions iii and iv that are related to future events. The last two questions are answered using historical data.
Table 3. EnAPlug’s knowledge questions
Nº Question How to answer
i Is the controllable load being used? Contextual data ii Are there users near the controllable load? Contextual data iii Will the controllable load be used in the next hour? Learning algorithms iv Will there be users near the controllable load in the next hour? Learning algorithms v What is the average consumption time of the controllable load? Historical data vi What is the average user presence time near the controllable load? Historical data
EnAPlug agents use the Deep Learning for Java (DL4J) library as the deep learning enabler (DL4J, 2019a). This library enables the easy use of artificial neural networks (ANN) in Java code. In this PhD research, long short-term memory units (LSTM) networks were used to forecast the usage and consumption of the controllable load enabling EnAPlug to reply to questions iii and iv. LSTM networks are artificial recurrent neural network (RNN) that potentiate continuous learning (Zhifeng, 2018)(Hu, 2018)(Srivastava, 2018b).
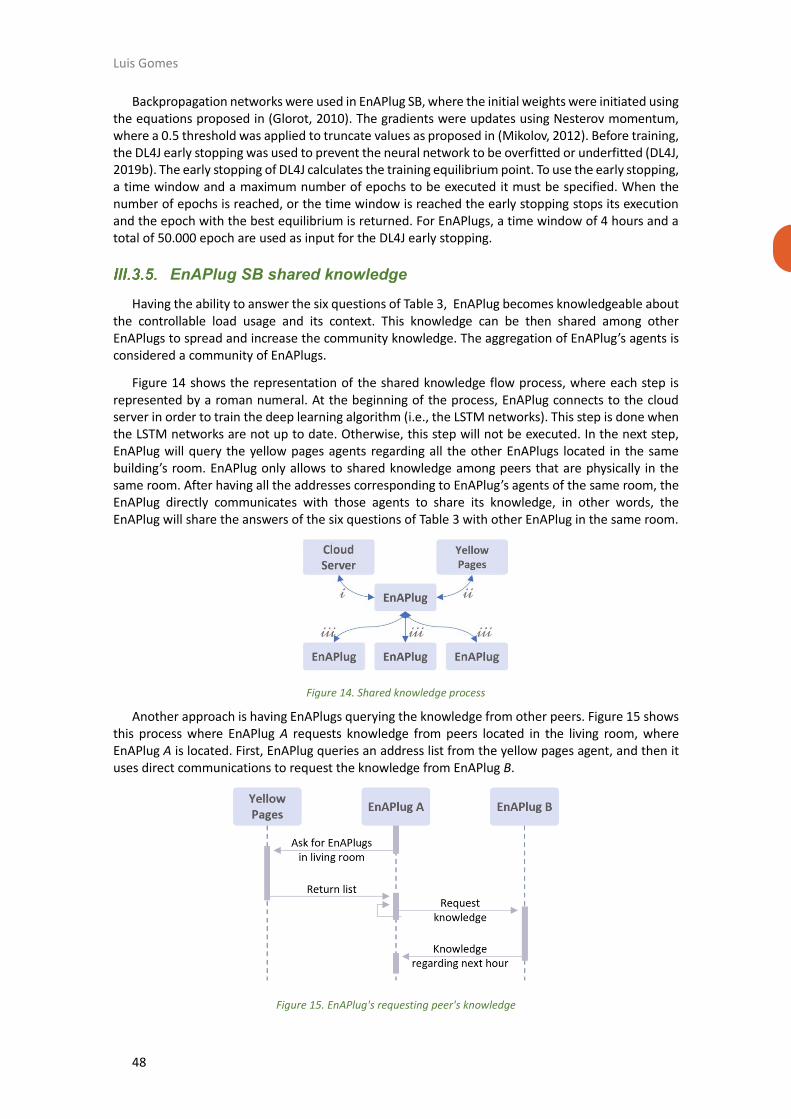
Luis Gomes
48
Backpropagation networks were used in EnAPlug SB, where the initial weights were initiated using the equations proposed in (Glorot, 2010). The gradients were updates using Nesterov momentum, where a 0.5 threshold was applied to truncate values as proposed in (Mikolov, 2012). Before training, the DL4J early stopping was used to prevent the neural network to be overfitted or underfitted (DL4J, 2019b). The early stopping of DL4J calculates the training equilibrium point. To use the early stopping, a time window and a maximum number of epochs to be executed it must be specified. When the number of epochs is reached, or the time window is reached the early stopping stops its execution and the epoch with the best equilibrium is returned. For EnAPlugs, a time window of 4 hours and a total of 50.000 epoch are used as input for the DL4J early stopping.
EnAPlug SB shared knowledge
Having the ability to answer the six questions of Table 3, EnAPlug becomes knowledgeable about the controllable load usage and its context. This knowledge can be then shared among other EnAPlugs to spread and increase the community knowledge. The aggregation of EnAPlug’s agents is considered a community of EnAPlugs.
Figure 14 shows the representation of the shared knowledge flow process, where each step is represented by a roman numeral. At the beginning of the process, EnAPlug connects to the cloud server in order to train the deep learning algorithm (i.e., the LSTM networks). This step is done when the LSTM networks are not up to date. Otherwise, this step will not be executed. In the next step, EnAPlug will query the yellow pages agents regarding all the other EnAPlugs located in the same building’s room. EnAPlug only allows to shared knowledge among peers that are physically in the same room. After having all the addresses corresponding to EnAPlug’s agents of the same room, the EnAPlug directly communicates with those agents to share its knowledge, in other words, the EnAPlug will share the answers of the six questions of Table 3 with other EnAPlug in the same room.
Figure 14. Shared knowledge process
Another approach is having EnAPlugs querying the knowledge from other peers. Figure 15 shows this process where EnAPlug A requests knowledge from peers located in the living room, where EnAPlug A is located. First, EnAPlug queries an address list from the yellow pages agent, and then it uses direct communications to request the knowledge from EnAPlug B.
Figure 15. EnAPlug's requesting peer's knowledge

49
Sharing knowledge can increase the knowledge of the entire community. Individually, each EnAPlug does not have enough knowledge to understand the building, the room, and the users. By sharing knowledge, EnAPlugs can increase their knowledge and provide good quality resource optimization. Equation (10) represents the knowledge of the room (𝛼𝑟𝑜𝑜𝑚)
𝛼𝑟𝑜𝑜𝑚 =∑𝛼𝐸𝑛𝐴𝑃𝑙𝑢𝑔𝑖
𝑛
𝑖=0
, 𝑤ℎ𝑒𝑟𝑒{𝑛 ∈ 𝑍} (10)
where 𝛼𝐸𝑛𝐴𝑃𝑙𝑢𝑔𝑖 represents the individual knowledge of 𝐸𝑛𝐴𝑃𝑙𝑢𝑔𝑖 and the 𝑛 is the total number of
EnAPlugs inside the same room.
Each EnAPlug must have answers to the six questions identified in Table 3. Still, using the shared knowledge it can combine individual answers and create global/room answers to the questions identified in Table 4. Questions from vii to xii are derived from questions i to vi, but for the room’s perspective. The first four questions of Table 4 are binary, meaning that the answer is one of two types: positive, or negative. These answers can be formulated using the values one and zero, respectively.
Table 4. Room’s knowledge questions
Nº Question How to answer
vii Are there controllable loads being used inside the room? Contextual data viii Are there users inside the room? Contextual data ix Will controllable loads be used in the next hour? Learning algorithms x Will there be users inside the room during the next hour? Learning algorithms xi What is the average consumption time inside the room? Historical data xii What is the average user presence time inside the room? Historical data
To answer the questions vii, viii, ix and x equation (11) is used. The room’s answer is represented by 𝐴𝑟𝑜𝑜𝑚, where a negative answer is achieved only if all EnAPlug answers (𝐴𝑖) are negative, or a positive answer is achieved if at least one EnAPlug answer is positive. To answer questions xi and xii, it is used equation (12) for induvial EnAPlug answers to questions v and vi, respectively.
𝐴𝑟𝑜𝑜𝑚 =
{
0, 𝑖𝑓∑𝐴𝑖
𝑛
𝑖=𝑜
= 0
1, 𝑖𝑓∑𝐴𝑖
𝑛
𝑖=𝑜
> 0
(11)
𝐴𝑟𝑜𝑜𝑚 =∑ 𝐴𝑖𝑛𝑖=𝑜
𝑛 (12)
Questions vii, viii, xi and xii are answered using real-time and historic data, meaning that there is no uncertainty in the answers. However, questions ix and x use the individual EnAPlug forecast results that are not 100 % accurate, meaning that the forecast accuracy must be considered.
Regarding questions ix and x, the forecast accuracy rate is more important than the actual forecast result. The accuracy of a room is calculated combining all the individual EnAPlug forecast accuracy and answers. Equation (13) calculates the probability of a given forecasted answer being positive (i.e., 𝑎 = 1) or negative (i.e., 𝑎 = 0), by using all the EnAPlugs accuracy rates. The 𝑎 defines the type of answer to calculate the probability. The 𝐴 is the actual answer of EnAPlug, that can be positive (i.e., 𝐴 = 1) or negative (i.e., 𝐴 = 0). The accuracy of the forecast algorithm is represented by 𝑦. The accuracy is retrieved from the test result during the train of the algorithm. Using equation (13), it is possible to calculate the probability of positive and negative answers without looking at the forecast itself. For example, with this equation it is possible to now the probability of having persons near the controllable load during the next hour (𝐸1) and the probability of not having persons (𝐸0).
𝑎 = (1 − 𝛾)|𝑎−𝐴|𝛾|1−𝑎−𝐴| (13)
For instance, using an EnAPlug to forecast if a person will be near the controllable load during the next hour, with a forecasting LSTM network with 80 % of accuracy, considering a negative answer was
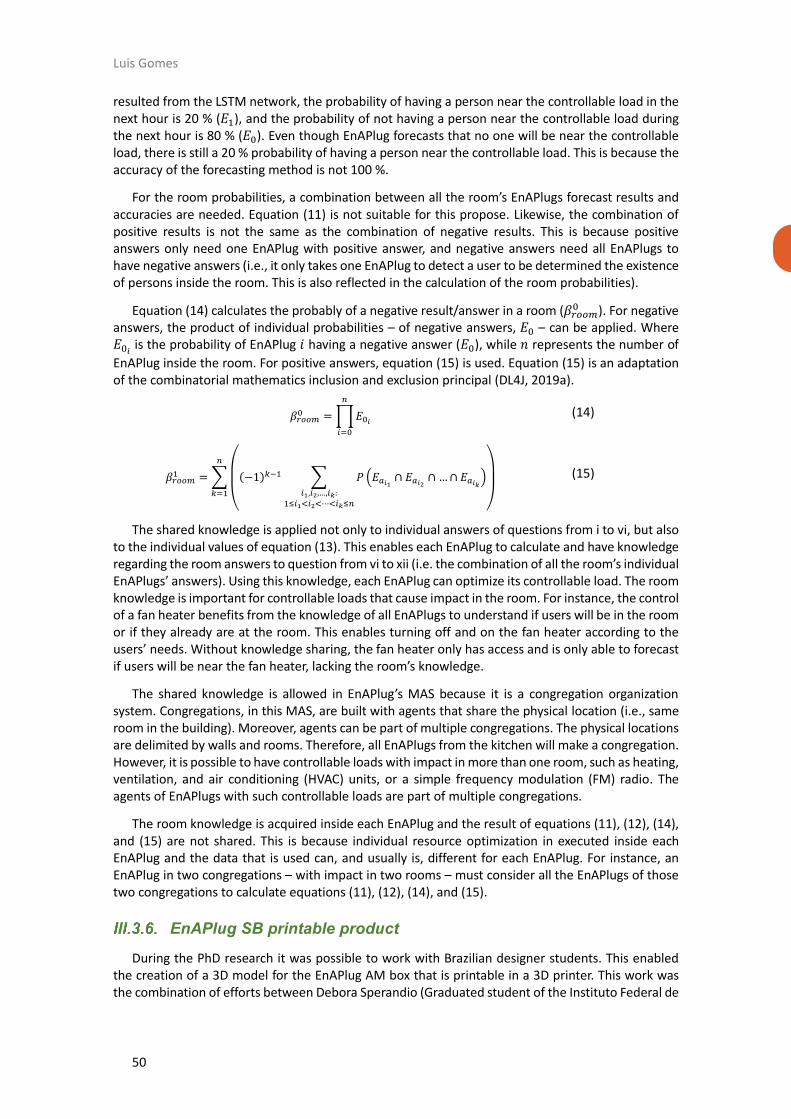
Luis Gomes
50
resulted from the LSTM network, the probability of having a person near the controllable load in the next hour is 20 % (𝐸1), and the probability of not having a person near the controllable load during the next hour is 80 % (𝐸0). Even though EnAPlug forecasts that no one will be near the controllable load, there is still a 20 % probability of having a person near the controllable load. This is because the accuracy of the forecasting method is not 100 %.
For the room probabilities, a combination between all the room’s EnAPlugs forecast results and accuracies are needed. Equation (11) is not suitable for this propose. Likewise, the combination of positive results is not the same as the combination of negative results. This is because positive answers only need one EnAPlug with positive answer, and negative answers need all EnAPlugs to have negative answers (i.e., it only takes one EnAPlug to detect a user to be determined the existence of persons inside the room. This is also reflected in the calculation of the room probabilities).
Equation (14) calculates the probably of a negative result/answer in a room (𝛽𝑟𝑜𝑜𝑚0 ). For negative
answers, the product of individual probabilities – of negative answers, 𝐸0 – can be applied. Where 𝐸0𝑖 is the probability of EnAPlug 𝑖 having a negative answer (𝐸0), while 𝑛 represents the number of
EnAPlug inside the room. For positive answers, equation (15) is used. Equation (15) is an adaptation of the combinatorial mathematics inclusion and exclusion principal (DL4J, 2019a).
𝛽𝑟𝑜𝑜𝑚0 =∏𝐸0𝑖
𝑛
𝑖=0
(14)
𝛽𝑟𝑜𝑜𝑚1 = ∑
(
(−1)𝑘−1 ∑ 𝑃(𝐸𝑎𝑖1 ∩ 𝐸𝑎𝑖2 ∩ …∩ 𝐸𝑎𝑖𝑘
)𝑖1,𝑖2,…,𝑖𝑘:
1≤𝑖1<𝑖2<⋯<𝑖𝑘≤𝑛 )
𝑛
𝑘=1
(15)
The shared knowledge is applied not only to individual answers of questions from i to vi, but also to the individual values of equation (13). This enables each EnAPlug to calculate and have knowledge regarding the room answers to question from vi to xii (i.e. the combination of all the room’s individual EnAPlugs’ answers). Using this knowledge, each EnAPlug can optimize its controllable load. The room knowledge is important for controllable loads that cause impact in the room. For instance, the control of a fan heater benefits from the knowledge of all EnAPlugs to understand if users will be in the room or if they already are at the room. This enables turning off and on the fan heater according to the users’ needs. Without knowledge sharing, the fan heater only has access and is only able to forecast if users will be near the fan heater, lacking the room’s knowledge.
The shared knowledge is allowed in EnAPlug’s MAS because it is a congregation organization system. Congregations, in this MAS, are built with agents that share the physical location (i.e., same room in the building). Moreover, agents can be part of multiple congregations. The physical locations are delimited by walls and rooms. Therefore, all EnAPlugs from the kitchen will make a congregation. However, it is possible to have controllable loads with impact in more than one room, such as heating, ventilation, and air conditioning (HVAC) units, or a simple frequency modulation (FM) radio. The agents of EnAPlugs with such controllable loads are part of multiple congregations.
The room knowledge is acquired inside each EnAPlug and the result of equations (11), (12), (14), and (15) are not shared. This is because individual resource optimization in executed inside each EnAPlug and the data that is used can, and usually is, different for each EnAPlug. For instance, an EnAPlug in two congregations – with impact in two rooms – must consider all the EnAPlugs of those two congregations to calculate equations (11), (12), (14), and (15).
EnAPlug SB printable product
During the PhD research it was possible to work with Brazilian designer students. This enabled the creation of a 3D model for the EnAPlug AM box that is printable in a 3D printer. This work was the combination of efforts between Debora Sperandio (Graduated student of the Instituto Federal de

51
Santa Catarina, Brazil), Filipe Sousa (researcher in GECAD) and the author of this thesis. The 3D model was designed for EnAPlug AM, enabling an easy deployment.
Figure 16 shows the modulation of EnAPlug AM, and its component parts, and the printed prototype that has been deployed. The top cover was printed in white with the EnAPlug logo. The logo is actually a hole to prevent the heating of the components. As a transparent cover is used in this case, the perforated MAX485 board, the Arduino Mega 2560, the Ethernet Shield, the mono-phase energy analyser, the 5 V DC power supply, and the control relay can be seen inside the box.
Figure 16. EnAPlug 3D model: a) 3D model; b) printed prototype
The printable prototype has the dimensions of 180x150 mm to accommodate all the necessary components. However, using SBC, the size of the prototype can be drastically reduced. A new 3D model focusing on the EnAPlug’s sensors and how can they be deployed and interact with the smart plug is being prepared. This is undergoing work and will enable the easy addition and removal of sensors, in a similar way to the mounting of LEGO blocks.
At this moment, EnAPlug is used for research proposes and it is been applied in several projects. A go-to-market strategy was not designed and interested companies were not contacted at this point. EnAPlug is still evolving and a plan is being traced to use it to implement transactive energy, energy internet, and energy virtualization.
III.4. Single-board computer for energy (S4E)
The main focus of this PhD research is a microgrid intelligent management system. After analysing the state-of-the-art solutions, it was noticed that there is no consensus regarding the representation of microgrids players and how they can efficiently communicate and interact. There is still room for new approaches that can go further, by offering a solution that embraces and potentiates new energy management methodologies, supporting the integration of energy resources, the integration of sensors, the representation of players, the real-time prioritization of resources according to sensor data and user needs, the real-time optimization of resources, the participation of demand response programs, etc.
The single-board computer for energy (S4E) was conceived, developed and tested during under this PhD research (Gomes, 2017c)(Gomes, 2020b)(Gomes, 2020c). The S4E enables the easy deployment of the system, by using single-board computers (SBC) that can be placed almost anywhere in the building. The S4E is focused on the building’s energy management and it was built from the building to the smart grid. This resulted in a feasible solution that can manage the building’s electrical resources. Nevertheless, the S4E can communicate, interact and participate in microgrids and smart grids, if they are available.
The S4E is a solution deployed in an SBC. The S4E can be deployed individually, without the need of a MAS. However, it can assume agent functionalities and integrate a µGIM MAS to take advantages of the communication with other agents in the system. When assuming agent functionalities, S4E can

Luis Gomes
52
be named S4E agent. The MAS composed by multiple S4E agents is called µGIM MAS. A µGIM MAS can represent a smart grid, microgrid, or energy community. The S4E agents represent different players, are able to pursuit their individual goals, and can communicate among then.
The main goal and challenge behind the S4E is the creation of an agent-based solution that can be deployed individually inside a building, but when in a MAS, the S4E can represent players of energy communities, microgrids, and/or smart grids. For this to be possible, the system must provide a dynamic architecture where energy management methodologies can be added. The system uses abstraction layers that enable adding energy resources and energy management methodologies in a seamless way. It is impossible to know ahead in time what type of resources are available in a building. Therefore, the S4E allows the integration of multiple resource’s types. A resource can be electrical loads, energy sources or sensors.
The S4E was developed to enable the deployment of the solution in today’s buildings, but also to provide a testing and validation solution for energy management methodologies. These methodologies can be placed inside a single S4E agent or in the µGIM MAS. In S4E, energy management methodologies are defined as energy strategies, and they were a priority during the development of the S4E solution. The easy integration, testing and validation of energy strategies benefits the S4E solution, enhance its use, and benefit the research and development of such energy management methodologies, creating a win-win situation.
The use of SBC promotes the easy deployment of S4E, but it brings some limitations and disadvantages: the computer processing power is low when compared with computers and servers, the local storage is limited and makes it impossible to use large databases, and there is no hardware redundancy to prevent component failures. None of these limitations occurs when using servers. The main benefits of using SBC are: easy deployment, low-cost, and the possibility to connect hardware directly to the SBC.
The architecture of S4E was conceived having in mind the limitations of SBC. The development board used was the Raspberry Pi 3 Model B. However, the S4E solution was intended to be used in others SBC, computers or servers. Therefore, to avoid compatibility issues, Java programming language was chosen. Software developed in Java is executed in the Java Virtual Machine, making it operating system independent. This means that a Java software can be executed in any operating system that has the Java Virtual Machine. However, this is not entirely true in the S4E agents, simply because of the integration of hardware. The use of serial communication and the network interface controller (NIC) demands an adaptation in the software-side to allow the use of S4E agents inside other machines.
The S4E was conceived for the research community, namely the power and energy systems community. To facilitate its configuration and use, the S4E system is entirely configures using a text file. The S4E uses a JavaScript object notation (JSON) file that allows the configuration of the S4E agent, regarding all its aspects, as it will be seen in section III.4.5. A JSON file can be open in any text editor and has a friendly readable format. This section will detail the development, use and deployment of the S4E solution. In chapter, some implementations, tests, and results will be presented. The S4E, unlike V2R and EnAPlug AM, is not currently an open source solution. The steps to open the solution to the public are being arranged and studied.
S4E domain model
The S4E solution is a multi-agent system where all agents are equal in their architecture. The S4E agents are equal in code but different in their configurations. The domain model of Figure 17 is applied to all S4E agents.
In the centre of the domain model it is the agents/building domain object, represented in blue. This is the main conceptual class that represents the core and central of the S4E agent operation. Domain objects associated with the physical building’s infrastructure and resources are presented in light orange, are presented. A resource is located in a zone, while a zone can be part of another zone.
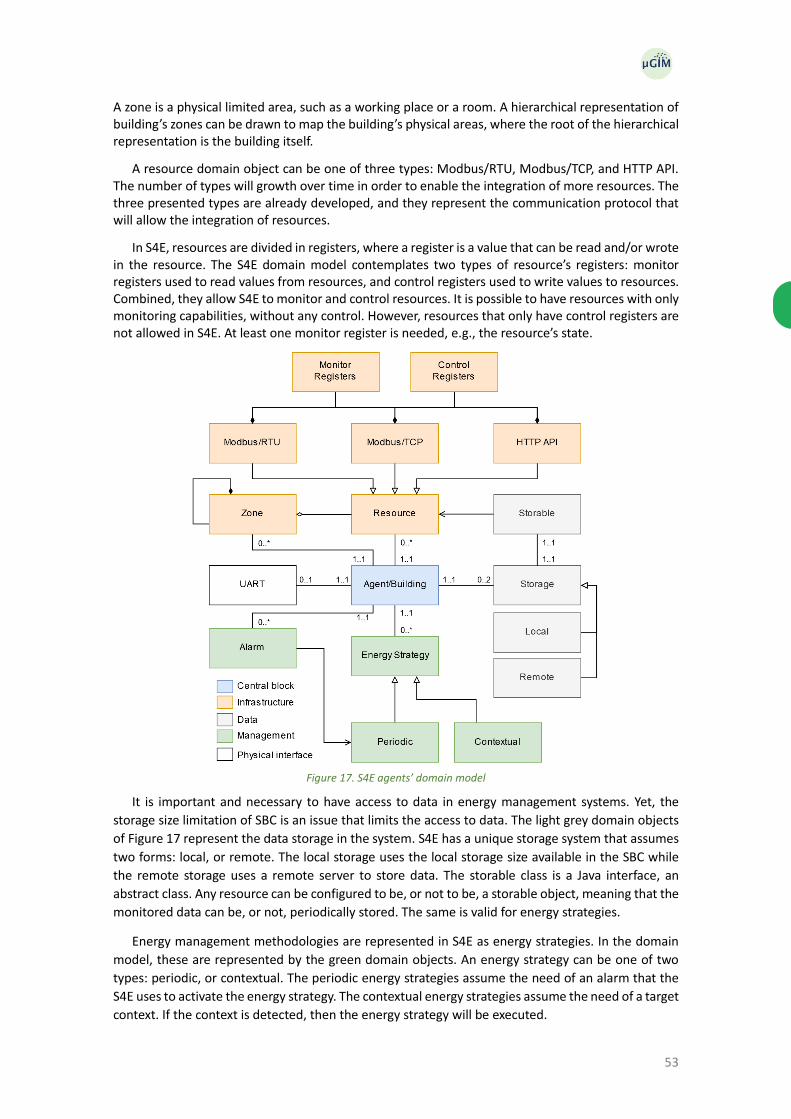
53
A zone is a physical limited area, such as a working place or a room. A hierarchical representation of building’s zones can be drawn to map the building’s physical areas, where the root of the hierarchical representation is the building itself.
A resource domain object can be one of three types: Modbus/RTU, Modbus/TCP, and HTTP API. The number of types will growth over time in order to enable the integration of more resources. The three presented types are already developed, and they represent the communication protocol that will allow the integration of resources.
In S4E, resources are divided in registers, where a register is a value that can be read and/or wrote in the resource. The S4E domain model contemplates two types of resource’s registers: monitor registers used to read values from resources, and control registers used to write values to resources. Combined, they allow S4E to monitor and control resources. It is possible to have resources with only monitoring capabilities, without any control. However, resources that only have control registers are not allowed in S4E. At least one monitor register is needed, e.g., the resource’s state.
Figure 17. S4E agents’ domain model
It is important and necessary to have access to data in energy management systems. Yet, the
storage size limitation of SBC is an issue that limits the access to data. The light grey domain objects
of Figure 17 represent the data storage in the system. S4E has a unique storage system that assumes
two forms: local, or remote. The local storage uses the local storage size available in the SBC while
the remote storage uses a remote server to store data. The storable class is a Java interface, an
abstract class. Any resource can be configured to be, or not to be, a storable object, meaning that the
monitored data can be, or not, periodically stored. The same is valid for energy strategies.
Energy management methodologies are represented in S4E as energy strategies. In the domain
model, these are represented by the green domain objects. An energy strategy can be one of two
types: periodic, or contextual. The periodic energy strategies assume the need of an alarm that the
S4E uses to activate the energy strategy. The contextual energy strategies assume the need of a target
context. If the context is detected, then the energy strategy will be executed.
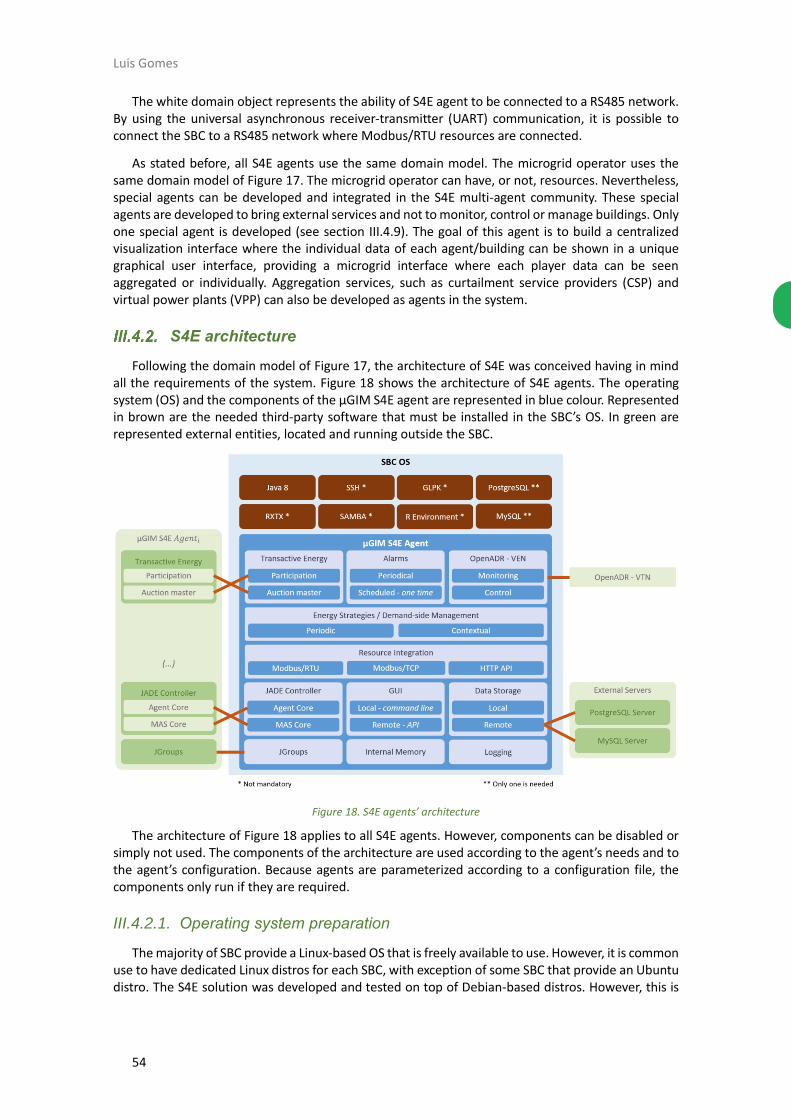
Luis Gomes
54
The white domain object represents the ability of S4E agent to be connected to a RS485 network. By using the universal asynchronous receiver-transmitter (UART) communication, it is possible to connect the SBC to a RS485 network where Modbus/RTU resources are connected.
As stated before, all S4E agents use the same domain model. The microgrid operator uses the same domain model of Figure 17. The microgrid operator can have, or not, resources. Nevertheless, special agents can be developed and integrated in the S4E multi-agent community. These special agents are developed to bring external services and not to monitor, control or manage buildings. Only one special agent is developed (see section III.4.9). The goal of this agent is to build a centralized visualization interface where the individual data of each agent/building can be shown in a unique graphical user interface, providing a microgrid interface where each player data can be seen aggregated or individually. Aggregation services, such as curtailment service providers (CSP) and virtual power plants (VPP) can also be developed as agents in the system.
S4E architecture
Following the domain model of Figure 17, the architecture of S4E was conceived having in mind all the requirements of the system. Figure 18 shows the architecture of S4E agents. The operating system (OS) and the components of the µGIM S4E agent are represented in blue colour. Represented in brown are the needed third-party software that must be installed in the SBC’s OS. In green are represented external entities, located and running outside the SBC.
Figure 18. S4E agents’ architecture
The architecture of Figure 18 applies to all S4E agents. However, components can be disabled or simply not used. The components of the architecture are used according to the agent’s needs and to the agent’s configuration. Because agents are parameterized according to a configuration file, the components only run if they are required.
III.4.2.1. Operating system preparation
The majority of SBC provide a Linux-based OS that is freely available to use. However, it is common use to have dedicated Linux distros for each SBC, with exception of some SBC that provide an Ubuntu distro. The S4E solution was developed and tested on top of Debian-based distros. However, this is

55
not a constraint, and other distros can be used even without being Debian-based. If Java 88 is installed and if the necessary software for S4E compatibility is installed, then the SBC is ready to be used and ready to receive an S4E agent. For the experimentations presented in this document, all operating systems were used without graphical interface and only terminal was available. This made the OS lighter and faster, with more free memory.
According to Figure 18, the only mandatory software is Java 8. The Java 8 JRE must be installed in the SBC to enable the execution of the S4E’s Java files. Currently, S4E is not compatible with Java versions above Java 8. This limitation is the result of some used libraries. The installation of Java 8 JDK is not needed but it is recommended for users with intention to modify the S4E agent’s code.
As stated before, the S4E agent can be part of an RS845 network. This integration enables the agent to exchange Modbus/RTU messages with equipment. The integration of S4E in RS485 networks is only possible if the network uses Modbus/RTU and if there is no master in the network. In a RS485 network, only one message can be sent at a single time. Only one master should be available because the use of multiple masters can crash the network by creating simultaneous messages. The S4E agents work as masters only, they cannot be configured to work as slaves.
To enable the agent to work as a Modbus/RTU equipment, the S4E agent demands the use of RXTX library and RXTX binary files. This enables Java to use the serial communication of the SBC OS. The RXTX library is added to the S4E agent and will use the binaries if Modbus/RTU resources are configured in the agent’s configuration file. The binaries must be added to the SBC OS. If no Modbus/RTU resources are configured, then the use of RXTX is not mandatory.
The secure shell (SSH) protocol and Samba software are optional but are very handy to use the SBC. The SSH protocol enables the remote access and control of the SBC, using a remote terminal. The Samba software uses the server message block (SMB) protocol, enabling folder sharing in the computer network. While SSH protocol provides fully control of the SBC, the Samba software enables the exchange of files and folder to/from the SBC. The lack of both will increase the complexity and difficulty of handling the S4E agent.
The GNU linear programming kit (GLPK9) provides a solver for large-scale linear programming (LP) and mixed integer programming (MIP). The main advantage of GLPK is its ability to be integrated in Java. The installation of GLPK in the SBC enables the use of its solvers and provides S4E with LP and MIP solvers. The installation of GLPK is only necessary if S4E is configured with an energy strategy that depends on GLPK. The R project10 provides an environment for statistical computing. Instead, or additionally, to the use of the GLPK, the S4E can use R programming language as energy strategies. The R project provides an interface for Java, enabling Java code to execute R commands and scripts. Similar to GLPK, the R environment is only necessary if is used an energy strategy that depends on R.
The S4E agents will use a local database and a remote database. Currently, these databases can be one of two: PostgreSQL11, or MySQL12. Both databases are open source. The local database can be PostgreSQL and the remote MySQL, and vice versa, but locally only one can be used. Therefore, it is only needed to have one. However, the MySQL driver has a hard copyleft licence. The software licenses will be detailed in section III.4.7.
Another software that is recommended and that was commonly used during this PhD research, is the version control software Git. This enables the easy creation of software versions, server backup, and the propagation of updates throughout all the SBC available in the laboratory. Currently, S4E is available in the open source Gitblit13 repository located in the research centre where the research
8 https://java.com/en/download/faq/java8.xml 9 https://www.gnu.org/software/glpk/ 10 https://www.r-project.org/ 11 https://www.postgresql.org/ 12 https://www.mysql.com/ 13 https://gitblit.github.io/gitblit/

Luis Gomes
56
work has been developed, and in one free to use Bitbucket account. The Git repositories were used to track software versions and software backups. All agents cloned the Gitblit repository. If a decision is made to publicly publish the S4E as an open source software, a new GitHub repository will be created and the Gitblit and Bitbucked14 repositories will be terminated.
III.4.2.2. Logging
The S4E is under development, and bugs are normal. Therefore, one of the base architectural blocks of the S4E agents, is the logging. The system logging will redirect all warnings and errors to files or to the screen, depending on the current configuration. Another option enables the complete hide of errors and warnings, but this is not recommended. The redirection of errors to files takes into account the SBC storage limitation, and log files above 10 MB will be deleted. Also, once the agent starts, previous files are erased. This prevents the overloaded of the system.
The log files are divided in two: S4E logs, and JADE logs. The JADE logs are the logs of JADE framework, that cannot be turned off. These logs are redirected to a file, away from the terminal interface. Both log files are located in the Samba folder available in the computer network, enabling an easy access.
Future developments can improve the logging block by providing external storage for logs. This will avoid the auto deletion of files above 10MB. Another issue with the use of logs is the number of threads and the real-time execution of the S4E agent. For instance, if a resource (e.g., energy analyser) is disconnected from the network, the S4E will generate an error when trying to read values from the resource. If a 1-second monitoring period is set, the system will generate 86.400 log entrances per day for a single resource. The logging system should be able to detect log repetition and avoid its storage. For instance, instead of having 86.400 logs the system should only report one.
III.4.2.3. Internal memory
The architectural blocks are usually individual threads permanently running. The internal memory block was conceived to work similarly to a memory system, where threads can store/read data to/from memory addresses. The S4E does not implement permission rules, all system’s threads have permission to create, update, and read all internal memory positions.
The internal memory uses a pair of values: a key, and a value. The constructor of this class receives a String and an Object and store it in memory. All S4E’s threads have access to the internal memory and can use it. Also, a memory position can be linked to the graphical interface, this will enable the automatic update of the graphical interface every time the memory value changes.
When setting a value to an internal memory position key, during its construction or during an update, it is possible to send a persistence request. The persistence request will demand that the database stores this value alongside its key. Every time there is a need to save the value, it must be sent a persistence request.
III.4.2.4. JGroups
The JGroups15 toolkit enables the one-to-many communication, and it is used in S4E for registration and discovery. The JGroups solves the issue resulted from the inability to know where the µGIM MAS is running. The S4E agents can work individually, managing the building’s resources, or in a community of agents, managing the building’s resources while actively participating in the microgrid and smart grid. However, to enable the connection with a MAS, the S4E needs to know the IP address and port where the MAS is running. The JGroups can provide this needed MAS discovery mechanism.
14 https://bitbucket.org/ 15 http://www.jgroups.org/

57
The JGroups works as a shared tunnel in the computer network, enabling software to connect to this tunnel and share information. The software does not need to know the address of others, they just publish information and it is automatically shared among others. The JGourps toolkit can be used with UDP and with TCP. The UDP enables a full distributed solution, while TCP demand the use of a centralized JGroups software, where all agents must to connect.
Using the UDP configuration, the S4E agent will publish its information in JGroups and reads the information of the already connected agents. If a µGIM MAS is detected, then the S4E agents can connect to it using the connection configuration shared in the JGroups. This means that, in S4E solution, the software runs independently and is able to manage the resources independently, and only when a µGIM MAS is detected, does the JADE agent is executed.
III.4.2.5. JADE controller
The java agent development framework (JADE) controller block represented the used framework for the multi-agent system. This block enables the integration of S4E in a multi-agent community. This block is only enabled if the S4E software discovers a MAS in the JGourps shared information tunnel. Depending on the S4E configuration, the architectural block of JADE controller can be executed as: agent core, and MAS core. Both, agent core and MAS core, can be executed in the same S4E.
The choice of JADE framework gives the system the ability to develop an agent-based software without higher concern in the agent development, being able to focus on the building management. The framework is FIPA Agent Communication Language (ACL) compliant and provides ready to use agents that are needed for MAS. The available directory facilitator (DF) provides yellow pages services without the need of any development. The DF agent is important for agents to discover other agents inside the MAS. The framework also makes available a remote monitoring agent (RMA) that monitors all the agents of the MAS. The DF is used in the S4E solution, but not RMA because it requires a graphical interface that it is not available in the OS used in the SBC.
The MAS core is used for the SBC that will execute and run the µGIM MAS. The DF agent will run in this SBC, and all other S4E agents will be connected to it. Therefore, the µGIM MAS itself runs in a S4E agent, this makes the system not dependent on external services. In a deployment, if ten buildings are used, then only ten SBC are needed, and one of them will execute the µGIM MAS core. At this moment, the µGIM MAS core is invariable during the execution of the agents. To change the MAS core from one SBC to another, the system must be stopped and them start again.
The agent core block is used for all the S4E SBC. This block will be executed every time the S4E agent connects to a µGIM MAS. This will give S4E the needed agent functionalities, able to be part of a MAS and communicate with other agents. Internally, the agent core will enable the S4E to perform cooperative, collaborative and competitive actions in the µGIM MAS. Only one SBC, in a community, can be MAS core, while all SBC are agent cores.
The agents of S4E are both event- and self-triggered, meaning that they are able to react to events but are also able to periodically perform tasks and conduct actions/communications. The µGIM MAS uses a compound organization that combines teams, congregations, societies and federations (Figure 2). The organization types will differ according to the S4E implementation. For instance, a microgrid can be manage using a team organization where all players work for a common goal, or it can be seen as a congregation of similar agents. When connecting several microgrids, the system assumes a federation organization where each microgrid is represented by a leader – the microgrid operator.
III.4.2.6. Graphical user interface
The graphical user interface available by default in the S4E, uses the terminal to show vital and general information regarding the S4E. This interface was designed for 7-inch monitors. Figure 19, shows the interface layout, and how it is presented in a 7-inch high-definition multimedia interface (HDMI) monitor. The figure is divided by thirteen panels, where the information is distributed.
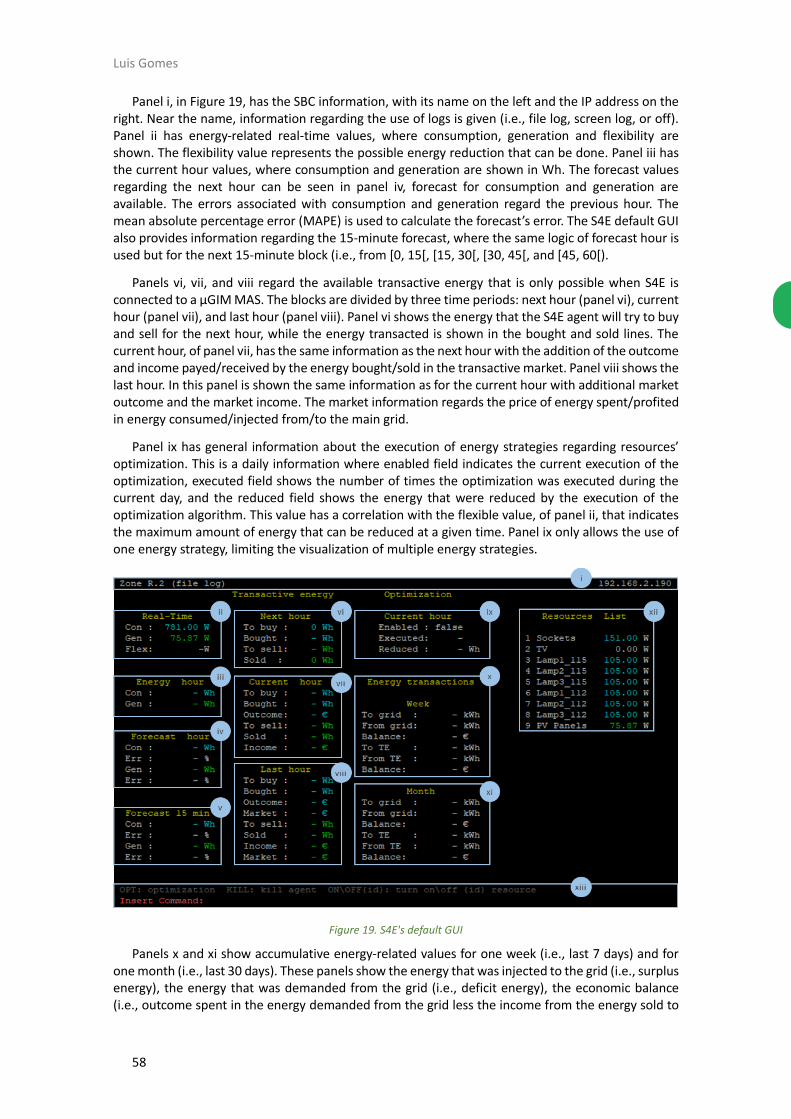
Luis Gomes
58
Panel i, in Figure 19, has the SBC information, with its name on the left and the IP address on the right. Near the name, information regarding the use of logs is given (i.e., file log, screen log, or off). Panel ii has energy-related real-time values, where consumption, generation and flexibility are shown. The flexibility value represents the possible energy reduction that can be done. Panel iii has the current hour values, where consumption and generation are shown in Wh. The forecast values regarding the next hour can be seen in panel iv, forecast for consumption and generation are available. The errors associated with consumption and generation regard the previous hour. The mean absolute percentage error (MAPE) is used to calculate the forecast’s error. The S4E default GUI also provides information regarding the 15-minute forecast, where the same logic of forecast hour is used but for the next 15-minute block (i.e., from [0, 15[, [15, 30[, [30, 45[, and [45, 60[).
Panels vi, vii, and viii regard the available transactive energy that is only possible when S4E is connected to a µGIM MAS. The blocks are divided by three time periods: next hour (panel vi), current hour (panel vii), and last hour (panel viii). Panel vi shows the energy that the S4E agent will try to buy and sell for the next hour, while the energy transacted is shown in the bought and sold lines. The current hour, of panel vii, has the same information as the next hour with the addition of the outcome and income payed/received by the energy bought/sold in the transactive market. Panel viii shows the last hour. In this panel is shown the same information as for the current hour with additional market outcome and the market income. The market information regards the price of energy spent/profited in energy consumed/injected from/to the main grid.
Panel ix has general information about the execution of energy strategies regarding resources’ optimization. This is a daily information where enabled field indicates the current execution of the optimization, executed field shows the number of times the optimization was executed during the current day, and the reduced field shows the energy that were reduced by the execution of the optimization algorithm. This value has a correlation with the flexible value, of panel ii, that indicates the maximum amount of energy that can be reduced at a given time. Panel ix only allows the use of one energy strategy, limiting the visualization of multiple energy strategies.
Figure 19. S4E's default GUI
Panels x and xi show accumulative energy-related values for one week (i.e., last 7 days) and for one month (i.e., last 30 days). These panels show the energy that was injected to the grid (i.e., surplus energy), the energy that was demanded from the grid (i.e., deficit energy), the economic balance (i.e., outcome spent in the energy demanded from the grid less the income from the energy sold to

59
the grid), the energy that was sold in transactive energy, the energy that was bought in the transactive energy, and the economic balance of transactive energy (i.e., the outcome spent in the transactive energy less the income profited in the transactive energy).
Panel xii lists energy resources integrated in the S4E that have consumption or generation. Resources, such as sensors, without energy values are not presented in this panel. The real-time values represent the consumption or generation of resources. If the resource is consuming, then a blue colour is used in the value. If the resource is generating energy, then a green colour is used. For values equal zero, the default white colour is used.
The last panel, xiii, located in the bottom of the interface, enables users to request actions to S4E. The actions allowed are: activate/deactivate the optimization energy strategy by using the OPT command, kill the agent by using the KILL command, and execute an on/off control in an energy resource by using ON{id} or OFF{id} commands – where {id} represents the resource ID displayed in panel xii. Because the default interface uses the OS terminal, it is possible to use the terminal shortcuts, such as ctrl+c to kill the S4E agent and software, or ctrl+z to execute S4E in background.
All the values shown in the default interface are in fact the contents memory positions, as described in section III.4.2.3, linked to a (x, y) position in the screen. Every time the value of these internal memory positions updates, the value that appears in the interface will also be updated. The link between internal memory positions and the graphical interface enables the real-time update of the displayed values.
III.4.2.7. Data storage
The data storage block enables the data persistence of S4E’s data. This block is responsible for storing storable objects and accessing stored data. Any Java object that needs to be stored must belong to a class implementing the storable interface. The user can identify, and filter which resources and energy strategies are stored in the database. The storage of resources data is highly recommended. Otherwise, it could make it impossible to execute some energy strategies. The storage of energy strategies is done every time the energy strategy is executed, and all the input and output data are stored in the database. The internal memory positions are stored when values update.
Each storable object results in a single table in the database. The table will have the same name as the object plus a creation time represented in milliseconds. Internal memory positions are all stored in a single table with the name of the memory plus a creation time represented in milliseconds. The use of the creation time in database’s tables allows the creation of multiple tables, meaning that it is possible to execute S4E with several configuration files without losing any previous data.
As seen in Figure 18, the data storage block is divided in two: local storage, and remote storage. Each block represents a different database and, more importantly, a different database location. Because of the already mentioned SBC storage limitation, there was the need to add external services to provide hardware capable of host large datasets. The local storage represents a local database (PostgreSQL or MySQL), installed and running inside the SBC. The remote storage unit represents a database (PostgreSQL or MySQL), installed and running in a server. The local and remote databases are independent and can be built using different technologies. The types of data used in S4E do not need any transformations to be stored in PostgreSQL or in MySQL, the same datatypes can be used in both databases.
The S4E manages the local and remote storage seamlessly. All threads can make structured query language (SQL) queries to select values, but only the storage thread can execute SQL queries to insert values in the databases. The S4E manages the data according to its timestamp. All data is inserted locally, using the local database. Local stored data older than a configurated time is sent to the remote storage database and erased from the local database.
To access stored data, the S4E has a seamless method that is able to detect the location of the requested data and return the data. In S4E architecture, two databases are used: a local database,
Luis Gomes
60
and a remote database. To access stored data, the S4E must firstly identify where the requested data are available: entirely in the local database, entirely in the remote database, or partially in the remote and in the local databases. The method, for accessing stored data, will query those databases according to the access request and built a single dataset to return.
The names of tables in the local database are not the same as the ones used in the remote database. As seen before, each table has in its name the creation time – represented in milliseconds stating from the Unix Epoch Time 1st January 1970. The local and remote storage use this name nomenclature, making it almost impossible to have the same table name in the local and remote sides. At the start-up, S4E analyses the local and remote databases to create a one-to-one relation among the local database tables and the remote database tables.
The table’s name matching is used in order to allow the existence of multiple table version in the same database. For instance, it is possible to create a table version for only two days and then instantiate a new version, without losing previous data and allowing the separation of data. Using the configuration file, the user must indicate if the last up-to-date table version will be used, or if a new version will be used. In each case, the S4E will map the tables to use (previously created or new tables) and match these names with the local and remote sides.
III.4.2.8. Resource integration
The resource integration in the S4E is one of the most important aspects of the system. Without the capability of integrating resources, the software would not be able to achieve its goals of providing energy management methods to the building. Therefore, the resource integration is a very important piece of the system.
In the S4E system, each resource is composed by multiple registers, as seen in Figure 17. These registers are values that are readable and writable. In the configuration of a resource, the user must specify what are the readable registers and identify them according to its type: energy consumption, resource state, temperature sensor, etc. The writable registers are used to control the resource. There are three possible control types applied to resources: none, discrete, and variable. The first, none, indicates that the resource does not allow any control. The discrete control enables the on and off control of a resource. The variable control enables a fine control from 0 % to 100 %.
For each resource defined in the configuration file of S4E, a new thread is launched. These threads, represented integrated resources, provide monitoring and control methods that can be used by energy strategies and other threads. The use of threads enables the close to real-time monitoring without damaging the S4E software performance. The thread will maintain the resource’s registers updated. The monitoring period is configurable, but no period less than 1 second should be used to prevent failures in the network and resources.
The resources’ monitoring time is set globally, meaning that all resources have the same monitoring period. The monitoring period defines the period for request. Every time a request is done, the period time starts counting, and a new request will be made after reaching the defined period. These requests do not depend on the replies from the resource. In the configuration file, a timeout period is also set, which defines the timeout to be used in each request. If a resource does not reply, or a bad reply is received, the resource value will preserve the last valid value.
The use of resource’s registers availability can raise some issues. If registers cannot be retrieved in a single request, it implies the need of multiple requests in order to update all the resource’s registers. This is a common problem in the Modbus protocol, in its RTU and TCP variants. If two registers in Modbus have opposite positions, then two requests in Modbus should be done. In S4E, the resource types of Modbus/RTU and Modbus/TCP manage the number of requests depending on the position of the configured resources. Registers close to each other will be aggregated in a single request. Otherwise, multiple requests will be made by the resource thread. Each request is done in parallel using threads, and replies are analysed by a single thread. If multiple replies arrive at the same time, Java will put them on hold using buffers.

61
Currently there are three integration protocols in S4E: Modbus/RTU, Modbus/TCP, and HTTP API. While Modbus is a single protocol, it has two possible implementations, the RTU and the TCP versions. The HTTP API is not a protocol per say, but it will be used in this document as an integration protocol that allows the integration of resources with HTTP APIs. The three implemented integration protocols will be described below.
The resource integration block of S4E architecture should and must be expanded during future developments, enabling the integration of new protocols, such as KNX, open platform communications (OPC), MQTT, AMQP and STOMP. This will allow the integration of more automation devices and IoT devices.
Modbus/RTU
The Modbus/RTU is a protocol that uses RS485 networks to exchange data among master and slaves. In S4E, the master is always the SBC while the slaves are all the resources integrated in the S4E. Because it uses a RS485 network, the SBC must provide UART pins. A UART was two pins, one for transmission (Tx) and other for receiving (Rx). These pins must be connected to a MAX485 in order to convert communications from UART to RS485, and vice-versa. The use of MAX485 is almost standard, the circuit used is shown in Figure 20. The Tx, Rx and RS485 activation pins will be connected to the SBC pins. The S4E access these pins using RXTX library and by executing shell commands to activate and deactivate the RS activation pin.
Figure 20. MAX485 circuit used in S4E
In some circuits available, the receiver enabled (𝑅𝐸̅̅ ̅̅ ) pin and the driver enabled (DE) pin are connected. The 𝑅𝐸̅̅ ̅̅ pin must be low to enable the read of RS485 messages and the DE pin must be high to enable the write of RS485 messages. Because, typically, there is no need to read while writing, both pins are showed interconnected in some circuits. In S4E, the pins cannot be interconnected, otherwise, the software will not be able to read the RS485 messages. The issue was detected during the development of the Modbus/RTU integration resource class. The activation of the RS485 activation pin in the SBC is slower than the sending of the Modbus/RTU request and the receiving of the reply from the resource. Meaning that when the SBC deactivates the RS485 activation pin, the resource already replied. Therefore, the RS485 activation pin cannot be interconnected with 𝑅𝐸̅̅ ̅̅ pin, otherwise it will not be able to read the resource’s replies.
The circuit of Figure 20 enables S4E to always read RS485 messages, this because of the connection of 𝑅𝐸̅̅ ̅̅ pin with the circuit ground. This results in the reading of its own requests. The S4E must discard these messages and only process the actual replies. In Modbus/RTU, messages do not have an identifier. Therefore, the S4E ignores all messages that match the request.
The Modbus protocol uses functions and registers, where masters can send messages to slaves using a function (e.g., reading, writing) and identifying the registers that will be read or wrote. The messages can manage a single register or an aggregation of sequential registers – registers from 10 to 20 can be requested in the same message. This document will not detail the Modbus protocol, but information regarding this protocol can be easily found.

Luis Gomes
62
As stated before, depending on the registers’ position, the S4E will try to aggregate registers in order to minimize the number of registers sent to the resource. The S4E uses a limitation of 100 registers per message, meaning that registers 10 and 120 cannot be aggregated, resulting in two requests. The reply of the resource will be interpreted and processed by S4E according to the requested message and the registers to monitor. For instance, if a resource uses registers 5, 10, 50, 100, 120, and 130, the S4E will create a request from 5 to 100, and a second request from 120 to 130. In the first request, the resource will send a total of 95 values, one for each register. However, the S4E will only read 4 values corresponding registers 5, 10, 50 and 100.
Modbus/TCP
The Modbus protocol also provides a version for TCP/IP networks. This protocol can be found in SCADA systems and high-end equipment for monitoring and control. The concept of Modbus/TCP is the same as Modbus/RTU. The differences are in the message package and the ability of asynchronized messages provided by the TCP/IP network. The use of registers is equal to Modbus/RTU. The S4E can communicate with Modbus/TCP resources by using the network interface controller (NIC): for the local area network (LAN), or for the wireless LAN (WLAN). So, there is no need of additional hardware.
The S4E will also aggregate resource’s registers to decrease the number of requests needed to update the resource’s values. In Modbus/TCP, an identifier of the message can be set on each request. The same identifier is later used in the response. The S4E creates identifiers for each request and when a reply is received, the software will match the request with the reply using the identifier. Requests in Modbus/TCP are sent all at the same time, using threads to send each request. In Modbus/RTU a second request could only be sent after receiving a reply from the first request, because messages were synchronized. In Modbus/TCP, messages are asynchronized and requests can be sent simultaneous to the same resource. The use of Modbus/TCP brings simplicity to the Modbus protocol. There is no need to specify the message’s data size nor the cyclic redundancy check (CRC). This is possible because the message uses the TCP/IP network with TCP/IP message packages that already provide size and error control to the messages.
HTTP API
The integration of IoT devices in the S4E software is a priority. The use of IoT devices is growing, and it is expected to grow even more in the near future. Therefore, S4E cannot disregard this type of devices. A Java resource class was developed to communicate using HTTP requests in order to enable the integration of IoT devices.
For an IoT device to be integrated in the S4E, a HTTP API needs to be implemented by the device’s manufactory. The availability of APIs in IoT devices is not general or even market standard. However, there are a vast offer of devices that provide such APIs. The S4E is able to integrate IoT devices that provide monitoring data with possible control options.
The S4E was conceived and developed with an energy focus. Therefore, the HTTP API resource integration uses a similar approach of Modbus/RTU and Modbus/TCP. An IoT device is divided by registers: readable, and writable. Those registers can be monitored and/or controlled in the API. For HTTP API resources, the registers are tags or paths and not memory addresses, such the one used in Modbus resources.
The integration of HTTP API resources uses the TCP/IP network available in the SBC’s NIC. The S4E can directly communicate with the resources without the need of additional hardware. Each resource should be configured with the URI of the API. Currently, the S4E is compatible with APIs that use JSON format for requests and responses.

63
Some IoT devices are harder to integrate in the system. In those cases, a home automation platform can be used to work as a gateway between IoT devices and S4E. Home automation platforms can handle the integration of multiple IoT devices in a single platform, independent of the IoT devices’ manufacturers. Open source solutions, such as OpenHab, Home Assistant, and Domoticz can be used. These three platforms are able to be executed in SBC and provide APIs. Depending on the IoT devices available in the building, they can be configured and integrated in a home automation platform, and then integrated in the S4E using the HTTP API. For instance, currently the S4E does not provide a MQTT interface for resource integration, but Home Assistant provides such interface. Therefore, MQTT IoT devices can be integrated in the Home Assistant platform and the API, provided by the Home Assistant, is used to integrate the MQTT IoT devices in the S4E. This demands the usage of third-party software, but it provides the advantage of integration.
III.4.2.9. Energy strategies
Energy strategies, in the S4E context, are energy-based methods that are executed in a given period or context. Energy strategies can assume multiple forms, such as resource optimization algorithms, energy-related forecasting algorithms, user energy profiling methodologies, and learning algorithms. Energy strategies are not mandatory in S4E, but they are used to produce all the energy-related management. Demand-side management (DSM) methodologies are deployed in the building using energy strategies.
Everyone can develop an energy strategy to be deployed and tested. Each energy strategy is defined by a single Java class with access to the storage system (i.e., databases), current state of the building resources, and the internal memory of S4E. Energy strategies can be implemented in Java or in third-party software: GLPK solvers, or R environment. However, additional third-party software can be installed by the developer or be added in future releases of S4E.
The GLPK solver enables the solving of linear programming and mixed integer programming. This solver is used in the S4E with the Java optimization modeler (JOM) library. The JOM library enables the use of GLPK using a mathematical approach, providing mathematical expressions, input parameters, decision variables, objective function, and constraints.
For the application of AI algorithms or complex solvers, energy strategies can be interconnected to R scripts. Java has an interface to R, where the exchange of data is possible. Therefore, an energy strategy can be developed in R. The Java class just need to send the input data and receive the output data. The control of the resources, if any, is done inside the Java code.
According to the domain model of Figure 17, there are two types of energy strategies in the S4E: periodic, and contextual. The types identify how the energy strategy is triggered by the S4E. If a periodic energy strategy is created, the user must specify a time period identifying when the energy strategy will be executed. To set periodic energy strategies, a notation based on the Unix cron software is used. Each periodic energy strategy executing in the S4E is set with the notation shown in Figure 21. This notation is compared with the OS clock, and if a match is verified, then the energy strategy is executed. In the used notation: ‘*’ character indicates any value, integers indicate exact values, and integers with percentual signal indicate values that are divisors of the integer. The last notation parameter is optional and indicates an adjustment to be made in the notation match validation. The last parameter is the number of minutes that should be added or subtracted to the time represented by the notation.
Using the notation of Figure 21, an energy strategy set with the notation “15 * * * *”, will be executed every month, day and hour when minutes are equal to fifteen (e.g., 00:15, 10:15, 23:15). If the notation is changed to “15% * * * *”, the energy strategy will be executed every month, day and hour when minutes are divisors of 15 (e.g., 00:00, 00:15, 00:30, 00:45, 1:00). In case of notation “15% * * * * -3”, the energy strategy will be executed every month, day and hour when minutes are divisors of 15 less 3 (e.g., 23:57, 00:12, 00:27, 00:42, 00:57).
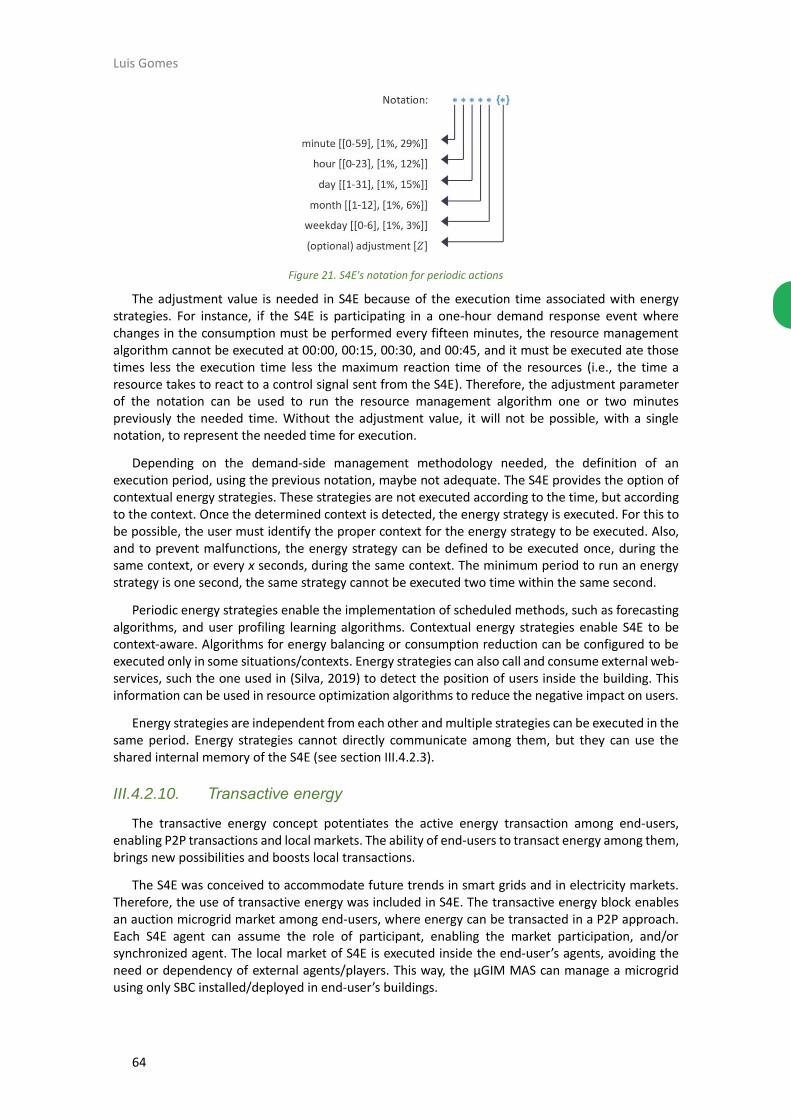
Luis Gomes
64
Figure 21. S4E's notation for periodic actions
The adjustment value is needed in S4E because of the execution time associated with energy strategies. For instance, if the S4E is participating in a one-hour demand response event where changes in the consumption must be performed every fifteen minutes, the resource management algorithm cannot be executed at 00:00, 00:15, 00:30, and 00:45, and it must be executed ate those times less the execution time less the maximum reaction time of the resources (i.e., the time a resource takes to react to a control signal sent from the S4E). Therefore, the adjustment parameter of the notation can be used to run the resource management algorithm one or two minutes previously the needed time. Without the adjustment value, it will not be possible, with a single notation, to represent the needed time for execution.
Depending on the demand-side management methodology needed, the definition of an execution period, using the previous notation, maybe not adequate. The S4E provides the option of contextual energy strategies. These strategies are not executed according to the time, but according to the context. Once the determined context is detected, the energy strategy is executed. For this to be possible, the user must identify the proper context for the energy strategy to be executed. Also, and to prevent malfunctions, the energy strategy can be defined to be executed once, during the same context, or every x seconds, during the same context. The minimum period to run an energy strategy is one second, the same strategy cannot be executed two time within the same second.
Periodic energy strategies enable the implementation of scheduled methods, such as forecasting algorithms, and user profiling learning algorithms. Contextual energy strategies enable S4E to be context-aware. Algorithms for energy balancing or consumption reduction can be configured to be executed only in some situations/contexts. Energy strategies can also call and consume external web-services, such the one used in (Silva, 2019) to detect the position of users inside the building. This information can be used in resource optimization algorithms to reduce the negative impact on users.
Energy strategies are independent from each other and multiple strategies can be executed in the same period. Energy strategies cannot directly communicate among them, but they can use the shared internal memory of the S4E (see section III.4.2.3).
III.4.2.10. Transactive energy
The transactive energy concept potentiates the active energy transaction among end-users, enabling P2P transactions and local markets. The ability of end-users to transact energy among them, brings new possibilities and boosts local transactions.
The S4E was conceived to accommodate future trends in smart grids and in electricity markets. Therefore, the use of transactive energy was included in S4E. The transactive energy block enables an auction microgrid market among end-users, where energy can be transacted in a P2P approach. Each S4E agent can assume the role of participant, enabling the market participation, and/or synchronized agent. The local market of S4E is executed inside the end-user’s agents, avoiding the need or dependency of external agents/players. This way, the µGIM MAS can manage a microgrid using only SBC installed/deployed in end-user’s buildings.

65
The communications among end-users is done using the agent core from JADE controller (Figure 18). The actions regarding to the transactive energy are triggered and coordinated by the synchronized agent. The synchronized agent is responsible to synchronize auctions among sellers. Auctions can assume one of four types:
▪ English – an ascending-bid type auction that enables all participants to bid over the price of the lot resulting in an ascending price scale over the lot, the price must overpass the last bid and the item is sold when the auctioneer stops receiving higher bids;
▪ Dutch – a descending-bid type auction that initiates at a high price and will slowly decrease over time, it can have one or multiple bidders depending on the lot auctioned, the bidders are ordered by descending price and this will indicate the priority of each bidder, the bidder with higher priority will be the first to select the items in the lot;
▪ Blind – a first-price sealed-bid auction where the lot is known by participants and where each participant can make a unique individual and sealed bid, then the auctioneer will open all sealed bids and the highest bidder will win the lot and will pay the bid;
▪ Vickrey – a second-price sealed-bid auction that is similar to the blind auction type, but where the highest bidder will pay the second higher bid and not his/her bid.
After specifying the auction type, it is needed to use the S4E’s notation for periodic actions to set the time to query sellers and start auctions. The first action in the auction is the requesting, to all end-users, of energy lots that they want to sell. A lot is identified by: seller, energy amount in Wh, and minimum acceptable price. Each end-user can put in auction the number of lots it desires. The announcement of lots should be sent within the specified duration – this duration is broadcast to all end-users in the message announcing the request for energy lots. In the bid requests action, the auctioneer (i.e., agent that is selling) will put the lots to bid. The type of bid depends on the type of auction and lots are auctioned using a first in first out (FIFO) approach.
Currently, an action-based solution is provided in S4E. However, more transactive energy methodologies should be developed in future releases. The use of real buildings, provided by the application of S4E, enables the testing and validation of transactive energy methodologies regarding business logic and energy management algorithms. Therefore, the S4E becomes an opportunity for transactive energy implementations.
III.4.2.11. Alarms
The internal alarm system enables the triggering of actions at a certain time. They are responsible to trigger periodic energy strategies and auction actions. Any class in S4E can implement the interface class of an alarm. The alarm action method is executed when the alarm time matchs the current time. The alarm system, similar to the internal memory system, is available to all threads running in the S4E software. Even energy strategies can set alarms if needed.
Alarms are divided into two types: periodic, and scheduled. In S4E, a periodic alarm is an alarm that is periodically executed, having multiple triggering times. A scheduled alarm is only executed a single time. Periodic energy strategies and auction actions are periodic alarms, but demand response participation actions are scheduled alarms – set to match the demand response event.
Periodic alarms use the S4E’s notation for periodic actions (Figure 21). However, the notation is not suitable for the scheduled alarms, that need an exact time representation. For scheduled alarms, a timestamp must be given. The alarm system verifies alarms every second and executes the ones that match the current time.
III.4.2.12. OpenADR
Automated demand response is the ability of end-users to participation on demand response programs using automated mechanisms that do not need end-user interaction (McParland, 2011).

Luis Gomes
66
The Open Automated Demand Response (OpenADR16) Alliance was formed to provide standards able to automatize the execution of demand response programs. The OpenADR defines two entities (Herberg, 2014): virtual top node (VTN), and virtual end node (VEN). A VTN is a node that transmits OpenADR signals to VENs or intermediary VTNs. A VEN represents a resource. This resource can be simple as individual loads or complex as energy management systems or end-users. The S4E implements a VEN that can receive signals from the VTN and participate in demand response programs. In OpenADR, there are typically two types of requests that can be made: monitor, and control. These two types of requests are usually combined, to provide monitoring during control signals. The S4E separates these two types of requests because of their unique characteristics.
In S4E, the allocation of resources in OpenADR is optional, the user must identify the integrated resources that are visible using OpenADR standard. Resources are allocated in OpenADR considering monitor and control. The integration of OpenADR in S4E was developed using the specifications of OpenADR 2.0b. According to OpenADR Alliance, a product can only be certified after being tested by them and after a mandatory membership. However, even without certification, the S4E can be used and tested with the open source VTN17 developed by the Electric Power Research Institute (Electric Power Research Institute, 2019).
S4E ready-to-use energy strategies
The use of energy strategies enables an abstraction layer between the S4E and energy management algorithms. The building’s monitoring, control, and data persistence are independent and therefore encoded in the S4E core. Energy strategies are blocks of code that can be added. Developers can at any time develop energy strategies using a periodic approach or a contextual approach, as seen in section III.4.2.9. Energy strategies are integrated in S4E using a Java interface class, but they do not need to be built entirely from Java, as also seen in III.4.2.9.
An energy strategy should implement the IEnergyStrategy Java interface that demands the implementation of the following methods:
▪ public void executeAlgo(Configuration config) – this method is called any time S4E identifies the target set for the energy strategy (a periodic trigger or a contextual trigger), the configuration input is the S4E’s configuration file;
▪ public Map<String, String> getFields() – this method must describe all the variables used in the energy strategy, all inputs and outputs should be described here and returned using a pair of its name and data type (e.g., varchar(20));
▪ public Map<String, Object> getFieldsValues() – this method must return the values of the variables described in the previous method, the object type must be compatible with the given description.
The first method receives the configuration class as input. Using the configuration class, the energy strategy can access everything in the S4E, such as resources, alarm system, and internal memory. This enables the exchange of data among energy strategies and between energy strategies and the S4E core.
The second and third mandatory methods are needed for data storage. As seen before, an energy strategy is a storable object in S4E, meaning that the data can be stored in the databases. Also, in the configuration file, it is possible to indicate if the energy storage will be set as a storable object in S4E. If the developer does not intend to store the energy strategy data, these methods can return empty map objects. However, being specified in the Java interface, the methods must be placed in the energy strategy class.
16 https://www.openadr.org/ 17 The VTN can be download in: https://github.com/epri-dev/OpenADR-Virtual-Top-Node/releases
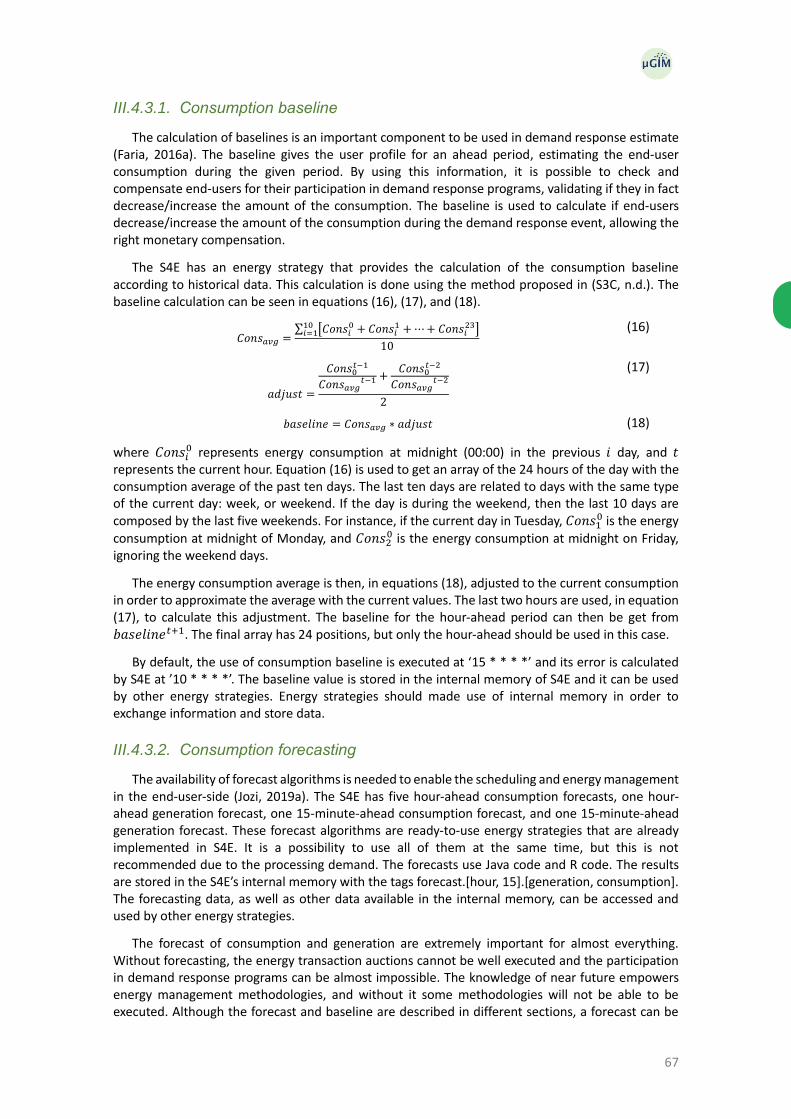
67
III.4.3.1. Consumption baseline
The calculation of baselines is an important component to be used in demand response estimate (Faria, 2016a). The baseline gives the user profile for an ahead period, estimating the end-user consumption during the given period. By using this information, it is possible to check and compensate end-users for their participation in demand response programs, validating if they in fact decrease/increase the amount of the consumption. The baseline is used to calculate if end-users decrease/increase the amount of the consumption during the demand response event, allowing the right monetary compensation.
The S4E has an energy strategy that provides the calculation of the consumption baseline according to historical data. This calculation is done using the method proposed in (S3C, n.d.). The baseline calculation can be seen in equations (16), (17), and (18).
𝐶𝑜𝑛𝑠𝑎𝑣𝑔 =∑ [𝐶𝑜𝑛𝑠𝑖
0 + 𝐶𝑜𝑛𝑠𝑖1 +⋯+ 𝐶𝑜𝑛𝑠𝑖
23]10𝑖=1
10
(16)
𝑎𝑑𝑗𝑢𝑠𝑡 =
𝐶𝑜𝑛𝑠0𝑡−1
𝐶𝑜𝑛𝑠𝑎𝑣𝑔𝑡−1 +
𝐶𝑜𝑛𝑠0𝑡−2
𝐶𝑜𝑛𝑠𝑎𝑣𝑔𝑡−2
2
(17)
𝑏𝑎𝑠𝑒𝑙𝑖𝑛𝑒 = 𝐶𝑜𝑛𝑠𝑎𝑣𝑔 ∗ 𝑎𝑑𝑗𝑢𝑠𝑡 (18)
where 𝐶𝑜𝑛𝑠𝑖0 represents energy consumption at midnight (00:00) in the previous 𝑖 day, and 𝑡
represents the current hour. Equation (16) is used to get an array of the 24 hours of the day with the consumption average of the past ten days. The last ten days are related to days with the same type of the current day: week, or weekend. If the day is during the weekend, then the last 10 days are composed by the last five weekends. For instance, if the current day in Tuesday, 𝐶𝑜𝑛𝑠1
0 is the energy
consumption at midnight of Monday, and 𝐶𝑜𝑛𝑠20 is the energy consumption at midnight on Friday,
ignoring the weekend days.
The energy consumption average is then, in equations (18), adjusted to the current consumption in order to approximate the average with the current values. The last two hours are used, in equation (17), to calculate this adjustment. The baseline for the hour-ahead period can then be get from 𝑏𝑎𝑠𝑒𝑙𝑖𝑛𝑒𝑡+1. The final array has 24 positions, but only the hour-ahead should be used in this case.
By default, the use of consumption baseline is executed at ‘15 * * * *’ and its error is calculated by S4E at ’10 * * * *’. The baseline value is stored in the internal memory of S4E and it can be used by other energy strategies. Energy strategies should made use of internal memory in order to exchange information and store data.
III.4.3.2. Consumption forecasting
The availability of forecast algorithms is needed to enable the scheduling and energy management in the end-user-side (Jozi, 2019a). The S4E has five hour-ahead consumption forecasts, one hour-ahead generation forecast, one 15-minute-ahead consumption forecast, and one 15-minute-ahead generation forecast. These forecast algorithms are ready-to-use energy strategies that are already implemented in S4E. It is a possibility to use all of them at the same time, but this is not recommended due to the processing demand. The forecasts use Java code and R code. The results are stored in the S4E’s internal memory with the tags forecast.[hour, 15].[generation, consumption]. The forecasting data, as well as other data available in the internal memory, can be accessed and used by other energy strategies.
The forecast of consumption and generation are extremely important for almost everything. Without forecasting, the energy transaction auctions cannot be well executed and the participation in demand response programs can be almost impossible. The knowledge of near future empowers energy management methodologies, and without it some methodologies will not be able to be executed. Although the forecast and baseline are described in different sections, a forecast can be

Luis Gomes
68
used for baseline. They are in different sections because the baseline uses an adjustment step and the forecast algorithms in S4E do not have adjustment. Therefore, baseline and forecast algorithms were described separately in this document.
The five forecasting algorithms are periodic energy strategies, where the hour-ahead algorithms are triggered using the notation ‘18 * * * *’ – every hour at 18 minutes – and the 15-minutes-ahead algorithms are executed at ‘15% * * * * -5’ – every hour at minutes 10, 25, 40, and 55. The algorithms for consumption and generation have the same periodic notation, meaning that the forecast of generation is executed at the same time as the forecast of the consumption.
For the hour-ahead consumption forecast for hour (ℎ + 1), one of the algorithms uses historic-based from the last three hours (i.e., ℎ − 1 , ℎ − 2, and ℎ − 3), where ℎ defines the current hour. Equation (19) is used for the historic-based algorithm. The remain four algorithms use support vector machine (SVM) implemented in an R script. One SVM algorithm uses the last 12 periods of 15-minutes consumption to forecast the hour-ahead consumption. One SVM algorithm uses the last 5 hours consumptions. One SVM algorithm uses data from the past 10 hours. And the last SVM uses consumption data for the forecast hour of the previous 10 consecutive days.
𝑓𝐶ℎ+1 = 0.5 × 𝐶ℎ−1 + 0.3 × 𝐶ℎ−2 + 0.2 × 𝐶ℎ−3 (19)
where ℎ represents the hour, and 𝐶𝑖 represents the consumption, in Wh, for hour 𝑖. As can be seen, the historic-based algorithm is a weighted arithmetic mean of the three last hours prioritized by their proximity to the forecasted hour.
The SVM algorithms are implemented in R using the e107118 library. The R script is executed by a Java energy strategy implemented in S4E. Due to limitation in Rengine, the SVM forecast cannot be executed simultaneously. By using Rengine, only one R instance can be executed at a given time.
Figure 22 shows the hour-ahead consumption forecast results for the working week between 3rd February 2020 and 7th February 2020. The results consider the five forecasting algorithms and the baseline. The SVM that uses the last 5 hours gives the worst results, having a 201.1 % of mean absolute percentage error (MAPE) and a lag of 6 periods when analysed using cross-correlation with the real value, meaning that has a shift in time of 6 periods. The baseline had an MAPE of 46.1 % and a lag value of 1.
The best forecast algorithm was the SVM that uses the data from the last 10 days, with and MAPE of 32,6 % and a lag of 0, meaning that it is the only algorithm that can correctly identify the consumption peaks without any shifting. The historic-based equation (19) achieved a 45.9 MAPE and a lag of 1. However, the historic-based forecast presents a result 100 times faster than the best SVM forecasting algorithm. The historic-based is able to calculate a forecast in less than 1 second while the best SVM takes near 1 minute to execute and requires more processing.
Figure 22. Hour-ahead consumption forecast results for one week
18 https://cran.r-project.org/web/packages/e1071/index.html

69
The results of the hour-ahead consumption forecasts indicate that the historic-based forecast algorithm presented quality results while requiring less processing from the SBC. Therefore, the hour-ahead generation forecast uses also a historic-based algorithm, according to equation (20). The forecast of generation does not use the same weighted arithmetic mean of equation (19), because generation has inclined increases and decreases that are not dependent on the last periods, depending on sunrise and sunset. The generation forecast algorithm uses the deviation between last periods and apply the same deviation for the next period.
𝑓𝐺ℎ =
{
𝐺ℎ−1 , 𝑖𝑓 𝐺ℎ−2 = 0 𝑎𝑛𝑑 𝐺ℎ−3 = 0
𝐺ℎ−1 (0.6 × 𝐺ℎ−1𝐺ℎ−2
+ 0.4) , 𝑖𝑓 𝐺ℎ−3 = 0
𝐺ℎ−1 (0.36 × 𝐺ℎ−1
𝐺ℎ−2+0.24 × 𝐺ℎ−2
𝐺ℎ−3+ 0.4)
(20)
where 𝐺𝑖 represents the generation, in Wh, for hour 𝑖. To prevent hours without generation, without sunlight, equation (20) is divided in three conditions: if the last hour had generation equal zero, if the last two hours had generation equal zero, or if the last hours had generation above zero.
For the 15-minutes-ahead forecasts, equations (21) and (22) are used for consumption and generation forecasting, respectively. The equations are similar to the ones used for the historic-based hour-ahead forecasts, being the results divided by 4, since the consumption values of 𝐶𝑖 are in Wh, considering one hour period, and it must be divided by four to achieve the desired 15 minutes period.
𝑓𝐶𝑞+1 =0.5 × 𝐶𝑞−1 + 0.3 × 𝐶𝑞−2 + 0.2 × 𝐶𝑞−3
4 (21)
𝑓𝐺𝑞+1 =
{
𝐺𝑞−1
4 , 𝑖𝑓 𝐺𝑞−2 = 0 𝑎𝑛𝑑 𝐺𝑞−3 = 0
𝐺𝑞−1 (0.6 × 𝐺𝑞−1𝐺𝑞−2
+ 0.4)
4 , 𝑖𝑓 𝐺𝑞−3 = 0
𝐺𝑞−1 (0.36 × 𝐺𝑞−1
𝐺𝑞−2+0.24 × 𝐺𝑞−2
𝐺𝑞−3+ 0.4)
4
(22)
The historic-based forecast algorithms provide a light, fast, and non-intelligent solution to solve the need of hour-ahead and 15-minutes-ahead forecasts. For hour-ahead consumption forecast the SVM that considers the last 10 days or the baseline can also be used, being the SVM forecast a more demanding process to the SBC limited hardware. The forecasts use previous stored data that can be located in the local storage system or in the remote storage system. Other algorithms are being implemented, such as the algorithms proposed in (Vinagre, 2015) and (Jozi, 2019b).
III.4.3.3. Consumption and generation balance
The S4E includes a balance algorithm that optimizes the resources consumption. This is a contextual energy strategy that is executed every time the consumption and generation are not balanced and only if a balance is possible. The energy strategy uses JOM library and GLPK solver. If the user wants to activate this energy strategy, then he/she must install the library and solver (this will be discussed in section III.4.7).
To enable the full capabilities of the consumption and generation balance energy strategy, the building must have sufficient sensor data. This is because the optimization uses dynamic prioritisation of energy resources, and this is only possible if the S4E can understand the resources’ environment. Otherwise, the system will not be able to efficiently calculate the resources’ dynamic priorities. The dynamic priorities are calculated in real-time using sensor data combined with the user’s preferences. In S4E, the building is divided in hierarchical zones where each can receive preferences regarding environment parameters, such as temperature and light intensity. The first step in the consumption and generation balance energy strategy is to calculate all the real-time resources priorities.

Luis Gomes
70
Lighting emitting loads
The lighting is a very important aspect that can impact the users’ comfort inside a building. Therefore, the present energy strategy can prioritize lighting emitting resources using light intensity sensors in the building. The building manage by S4E is divided in zones, where each zone must set the needed light intensity. For instance, National Optical Astronomy Observatory of United States of America identifies a need of 500 lux to perform office and computer works (National Optical Astronomy Observatory, 2019).
Equation (23) is used to calculate the lighting emitting resources’ priorities, depending on 𝑥. The 𝑥 is the combination between real-time context values and user preferences, and it is calculated with equation (24). The occupancy of the zone, where the resource it at, is represented by 𝑜𝑐𝑐𝑢𝑝𝑎𝑛𝑐𝑦. The 𝑠𝑚𝑜𝑜𝑡ℎ is a value set by the developer and defines the prioritization curve inclination. The elasticity of the user is presented by 𝑒𝑙𝑎𝑠𝑡𝑖𝑐𝑖𝑡𝑦. The elasticity is the percentual value that indicates how must the user is willing to shift from the set users preferences. The current light intensity value and the user’s light intensity preference are represented by 𝑐𝑢𝑟𝐿𝑢𝑚𝑒𝑛 and 𝑢𝑠𝑒𝑟𝑃𝑟𝑒𝑓𝐿𝑢𝑥 respectively.
𝑓(𝑥) = {1, 𝑥 < 0
𝑜𝑐𝑐𝑢𝑝𝑎𝑛𝑐𝑦 ×2
𝑒𝑥/𝑠𝑚𝑜𝑜𝑡ℎ×(1−𝑒𝑙𝑎𝑠𝑡𝑖𝑐𝑖𝑡𝑦) + 1, 𝑥 ≥ 0
(23)
𝑥 = 𝑐𝑢𝑟𝐿𝑢𝑚𝑒𝑛 − (𝑢𝑠𝑒𝑟𝑃𝑟𝑒𝑓𝐿𝑢𝑥 − 𝑢𝑠𝑒𝑟𝑃𝑟𝑒𝑓𝐿𝑢𝑥 × 𝑒𝑙𝑎𝑠𝑡𝑖𝑐𝑖𝑡𝑦) (24)
Figure 23 shows the result of equation (23) for 𝑥 ∈ [399, 950[. The equation uses a smooth value equal to 70 and two elasticity different values: 0 % (blue line), and 10 % (green line). The yellow area represents the user’s elasticity. The priority varies according to the room’s lux values. The users preference value in this example is set to 500 lux. As can be seen in blue line (0 % elasticity scenario) the resource’s priority is 1 (maximum value) when the room’s lux values are below 500, after this value it will decrease according to the value of the smooth parameter.
Figure 23. Light priority for 𝑠𝑚𝑜𝑜𝑡ℎ = 70
Heating and cooling loads
Heating and cooling resources are commonly used in buildings, and they intensively contribute to the building’s overall consumption. Although the priority of ventilation is different from resources that produce heat and cold, the formulation here proposed can be applied to heating, ventilation and air conditioning (HVAC) resources. This type of resources is vastly used for demand response programs participation because of its characteristics: being a resource with high consumption impact in the building, and enabling the control of the resource during an hour period without damaging the
users’ comfort. The simple control of changing the thermostat 1 ˚C can have a big impact in consumption. Some examples are the published works (Morsali, 2012) and (Heo, 2017) where HVAC are used for demand response participation.

71
Equations (25) and (26) are proposed for real-time prioritization using user preferences and contextual data provided by sensors placed in the building. Equation (25) enables the set of a 𝑠𝑚𝑜𝑜𝑡ℎ value that softens or hardens the curvature of the 𝑓(𝑥). The user’s elasticity is also represented by 𝑒𝑙𝑎𝑠𝑡𝑖𝑐𝑖𝑡𝑦, in an equal manner as the lighting emitting resources equations. Equation (26) calculates 𝑥, that is the combination between the current temperature (𝑐𝑢𝑟𝑟𝑒𝑛𝑡𝑇𝑒𝑚𝑝) and the user’s desired temperature (𝑢𝑠𝑒𝑟𝑃𝑟𝑒𝑓𝑒𝑟𝑒𝑛𝑐𝑒𝑇𝑒𝑚𝑝).
𝑓(𝑥) = 1 −4𝑒
𝑥×𝑠𝑚𝑜𝑜𝑡ℎ×(1−𝑒𝑙𝑎𝑠𝑡𝑖𝑐𝑖𝑡𝑦)2
(𝑒𝑥×𝑠𝑚𝑜𝑜𝑡ℎ×(1−𝑒𝑙𝑎𝑠𝑡𝑖𝑐𝑖𝑡𝑦)
2 + 1)2 (25)
𝑥 = 𝑐𝑢𝑟𝑟𝑒𝑛𝑡𝑇𝑒𝑚𝑝 − 𝑢𝑠𝑒𝑟𝑃𝑟𝑒𝑓𝑒𝑟𝑒𝑛𝑐𝑒𝑇𝑒𝑚𝑝 (26)
The application of equation (25) differs from the type of resource used. The equation, as it is, is only applied from resources that can produce heating and cooling. If the resource can only produce heat, then 𝑓(𝑥) is valid for 𝑥 𝜖 𝑍−. For positive numbers, then 𝑓(𝑥) = 0. Meaning, that equation (25) is only applied in resources that produce heat if the current temperature of the room is lower than the user’s desired temperature, otherwise, the priority is equal to zero. Resources that only produce cooling must apply equation (25) for 𝑥 𝜖 𝑍+, otherwise 𝑓(𝑥) = 0. Therefore, the implementation of equation (25) must be adequate to the type of resource.
Figure 24 illustrates the application of equation (25) for one HVAC system that provides heating and cooling. The blue line shows 𝑓(𝑥) without user elasticity (0 %), and the green line shows 𝑓(𝑥) with a 10 % user elasticity. The yellow area shows the elasticity of the user. The elasticity is important for unexpected or critical situations. An optimization algorithm should only use user’s elasticity as last resource to avoid affecting the user comfort.
Figure 24. HVAC priority (𝑠𝑚𝑜𝑜𝑡ℎ = 2)
Balancing algorithm
After calculating the resources priorities, according to building context and users preferences, it is possible to optimize the use of the building’s resources. The ready-to-used algorithm is a balancing algorithm that balances the local generation and local consumption. The algorithm uses equation (27) as the minimization objective function. GLPK is used as solver.
𝑚𝑖𝑛𝑖𝑚𝑖𝑧𝑒 = ∑|𝑃𝑖𝑣𝑎𝑟| ×𝑊𝑖
𝑣𝑎𝑟
𝑛𝑣𝑎𝑟
𝑖=1
+∑|𝑃𝑖𝑑𝑖𝑠| ×𝑊𝑖
𝑑𝑖𝑠
𝑛𝑑𝑖𝑠
𝑖=1
+
𝑤 × [𝑃𝐺𝑒𝑛 − 𝑃𝐶𝑜𝑛𝑠 + ∑ 𝑃𝑖𝑣𝑎𝑟
𝑛𝑣𝑎𝑟
𝑖=1
+∑𝑃𝑖𝑑𝑖𝑠
𝑛𝑑𝑖𝑠
𝑖=1
]
(27)
The objective function of equation (27) uses the on-site/local generation (𝑃𝐺𝑒𝑛) and current consumption (𝑃𝐶𝑜𝑛𝑠). Also, two demand response programs are considered in the algorithm: load
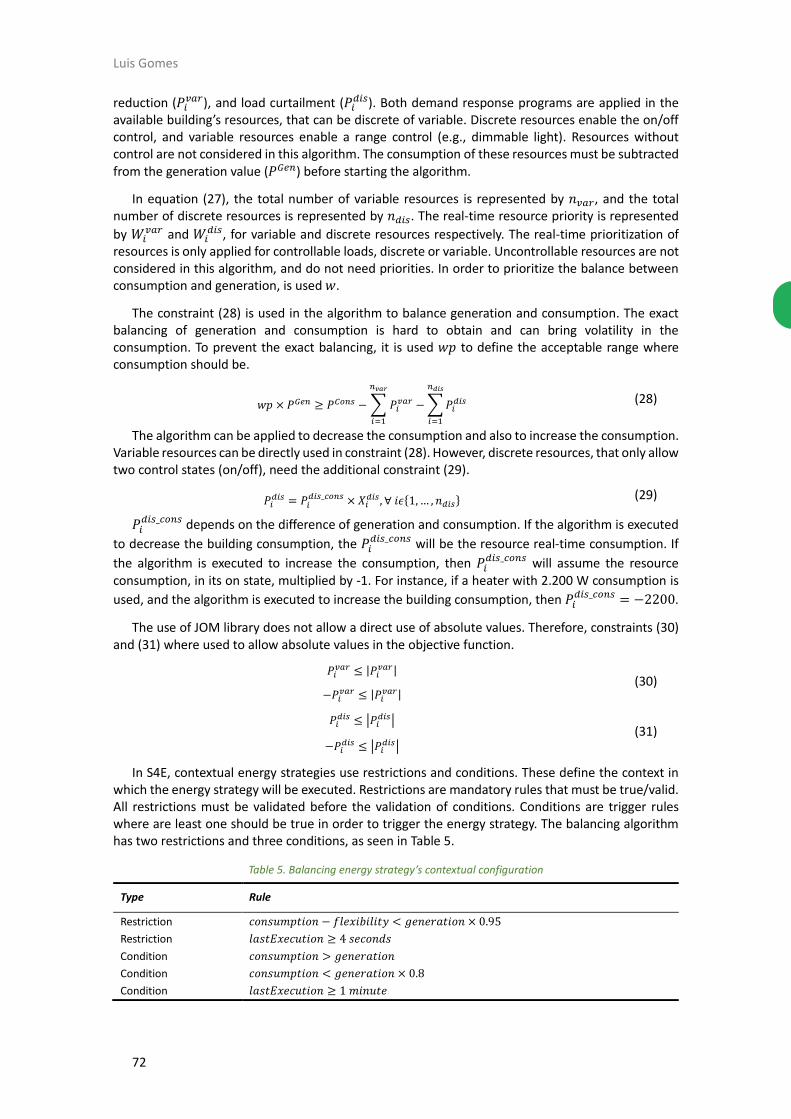
Luis Gomes
72
reduction (𝑃𝑖𝑣𝑎𝑟), and load curtailment (𝑃𝑖
𝑑𝑖𝑠). Both demand response programs are applied in the available building’s resources, that can be discrete of variable. Discrete resources enable the on/off control, and variable resources enable a range control (e.g., dimmable light). Resources without control are not considered in this algorithm. The consumption of these resources must be subtracted from the generation value (𝑃𝐺𝑒𝑛) before starting the algorithm.
In equation (27), the total number of variable resources is represented by 𝑛𝑣𝑎𝑟, and the total number of discrete resources is represented by 𝑛𝑑𝑖𝑠. The real-time resource priority is represented
by 𝑊𝑖𝑣𝑎𝑟 and 𝑊𝑖
𝑑𝑖𝑠, for variable and discrete resources respectively. The real-time prioritization of resources is only applied for controllable loads, discrete or variable. Uncontrollable resources are not considered in this algorithm, and do not need priorities. In order to prioritize the balance between consumption and generation, is used 𝑤.
The constraint (28) is used in the algorithm to balance generation and consumption. The exact balancing of generation and consumption is hard to obtain and can bring volatility in the consumption. To prevent the exact balancing, it is used 𝑤𝑝 to define the acceptable range where consumption should be.
𝑤𝑝 × 𝑃𝐺𝑒𝑛 ≥ 𝑃𝐶𝑜𝑛𝑠 −∑ 𝑃𝑖𝑣𝑎𝑟
𝑛𝑣𝑎𝑟
𝑖=1
−∑𝑃𝑖𝑑𝑖𝑠
𝑛𝑑𝑖𝑠
𝑖=1
(28)
The algorithm can be applied to decrease the consumption and also to increase the consumption. Variable resources can be directly used in constraint (28). However, discrete resources, that only allow two control states (on/off), need the additional constraint (29).
𝑃𝑖𝑑𝑖𝑠 = 𝑃𝑖
𝑑𝑖𝑠_𝑐𝑜𝑛𝑠 × 𝑋𝑖𝑑𝑖𝑠, ∀ 𝑖𝜖{1,… , 𝑛𝑑𝑖𝑠}
(29)
𝑃𝑖𝑑𝑖𝑠_𝑐𝑜𝑛𝑠 depends on the difference of generation and consumption. If the algorithm is executed
to decrease the building consumption, the 𝑃𝑖𝑑𝑖𝑠_𝑐𝑜𝑛𝑠 will be the resource real-time consumption. If
the algorithm is executed to increase the consumption, then 𝑃𝑖𝑑𝑖𝑠_𝑐𝑜𝑛𝑠 will assume the resource
consumption, in its on state, multiplied by -1. For instance, if a heater with 2.200 W consumption is
used, and the algorithm is executed to increase the building consumption, then 𝑃𝑖𝑑𝑖𝑠_𝑐𝑜𝑛𝑠 = −2200.
The use of JOM library does not allow a direct use of absolute values. Therefore, constraints (30) and (31) where used to allow absolute values in the objective function.
𝑃𝑖𝑣𝑎𝑟 ≤ |𝑃𝑖
𝑣𝑎𝑟|
−𝑃𝑖𝑣𝑎𝑟 ≤ |𝑃𝑖
𝑣𝑎𝑟| (30)
𝑃𝑖𝑑𝑖𝑠 ≤ |𝑃𝑖
𝑑𝑖𝑠|
−𝑃𝑖𝑑𝑖𝑠 ≤ |𝑃𝑖
𝑑𝑖𝑠| (31)
In S4E, contextual energy strategies use restrictions and conditions. These define the context in which the energy strategy will be executed. Restrictions are mandatory rules that must be true/valid. All restrictions must be validated before the validation of conditions. Conditions are trigger rules where are least one should be true in order to trigger the energy strategy. The balancing algorithm has two restrictions and three conditions, as seen in Table 5.
Table 5. Balancing energy strategy’s contextual configuration
Type Rule
Restriction 𝑐𝑜𝑛𝑠𝑢𝑚𝑝𝑡𝑖𝑜𝑛 − 𝑓𝑙𝑒𝑥𝑖𝑏𝑖𝑙𝑖𝑡𝑦 < 𝑔𝑒𝑛𝑒𝑟𝑎𝑡𝑖𝑜𝑛 × 0.95
Restriction 𝑙𝑎𝑠𝑡𝐸𝑥𝑒𝑐𝑢𝑡𝑖𝑜𝑛 ≥ 4 𝑠𝑒𝑐𝑜𝑛𝑑𝑠
Condition 𝑐𝑜𝑛𝑠𝑢𝑚𝑝𝑡𝑖𝑜𝑛 > 𝑔𝑒𝑛𝑒𝑟𝑎𝑡𝑖𝑜𝑛
Condition 𝑐𝑜𝑛𝑠𝑢𝑚𝑝𝑡𝑖𝑜𝑛 < 𝑔𝑒𝑛𝑒𝑟𝑎𝑡𝑖𝑜𝑛 × 0.8
Condition 𝑙𝑎𝑠𝑡𝐸𝑥𝑒𝑐𝑢𝑡𝑖𝑜𝑛 ≥ 1 𝑚𝑖𝑛𝑢𝑡𝑒

73
The two restrictions concern consumption and execution time. The first verifies if the building consumption, less the flexibility, is below 95 % of the building generation. If so, this indicates that it is possible to balance the consumption and generation. The second restriction uses the last execution timestamp to verify if the algorithm was executed more than 4 seconds ago. If these two restrictions are valid, then the S4E will verify the conditions.
The S4E software will check conditions by order and it will stop the verification when one is verified true or when no more conditions are to verify. The first condition will check if the building consumption is higher than generation, if so, the building is not in balance. The second condition checks if the building consumption is lower than 80 % of its generation, if so, the building can increase the consumption to allow balance between generation and consumption. If the building is balanced, meaning that first two conditions are not valid, the last condition will check if the algorithm was executed in the last minute. The last condition is important because of the real-time resource prioritization. Even with the generation and consumption balanced, this does not indicate that the resource optimization is well done. Therefore, each minute, the algorithm is executed to update the resources priorities and optimize the building consumption according to the new real-time priorities. Otherwise, the algorithm will not be able to adjust to changes in the building, such as temperature changes or user movements inside the building.
S4E transactive energy
The ability to transact energy among agents enables the collaborative, cooperative, and/or competitive communication and negotiation among end-users. S4E agents allow the P2P transaction of energy using auctions among neighbours where energy can be sold and bought (Gomes, 2020c).
The deployment of multiple S4E agents create a microgrid where agents are interconnected. In the P2P market available in S4E, agents are able to transact energy among them using decentralized auctions, where each agent can place its energy up for auction. The auction synchronization is done by a delegated agent in the community/microgrid. In S4E, energy is auctioned every hour in lots, and where the totality of available in an hour composes the auction catalogue. In an auction catalogue, the maximum energy that can be transactive in the P2P market is calculated using equation (32).
𝑀𝐸𝑎𝑐 = min (∑𝐸𝑎𝑎𝑐𝑠
𝑚
𝑎=1
,∑ 𝐸𝑎𝑎𝑐𝑏
𝑚
𝑎=1
) (32)
where the maximum energy is the minimum amount between the summation of the amount of energy that each agent 𝑎 has to sale (𝐸𝑎𝑎𝑐
𝑠 ) in auction catalogue 𝑎𝑐 and the summation of the amount
of energy that each agent (𝑎) will try to buy (𝐸𝑎𝑏) in auction catalogue 𝑎𝑐. The number of agents in
the system is represented by 𝑚. By using the maximum energy that is possible to be transacted (𝑀𝐸𝑎𝑐), it is possible to know the limits of the economic transactions related to energy transactions. Equation (33) represents the economic trading amount produced by the energy transactions in each auction catalogue.
0 ≤∑𝐿𝑖𝑎𝑐ℎ𝑏
𝑛
𝑖=1
≤ 𝑀𝐸𝑎𝑐 × max0≤𝑎≤𝑚
(𝑀𝑂𝑎𝑎𝑐) (33)
where ∑ 𝐿𝑖𝑎𝑐ℎ𝑏𝑛
𝑖=1 represents the summation of the highest bid of each lot (𝐿𝑖𝑎𝑐ℎ𝑏 ). The number of lots
available in auction is represented by 𝑛. The summation of the selling bid of each lot is the economic value that was trade during the P2P transaction auction. These values are equal or higher than zero and equal or smaller than the maximum energy available multiplied by the maximum possible offer among agents ( max
0≤𝑎≤𝑚(𝑀𝑂𝑎𝑎𝑐), where 𝑚 represents the number of agents participating in the
auctions. The selling price of lot 𝑖 is represented by 𝐿𝑖𝑎𝑐ℎ𝑏 . If a lot does not receive any bid, during the
defined period, then 𝐿𝑖𝑎𝑐ℎ𝑏 = 0.

Luis Gomes
74
Each agent is configured with a selling baseline that specifies the amount of energy that it will try to sell in the next P2P market (𝐸𝑎𝑎𝑐
𝑠 ). This baseline can be one of three values, demonstrated in
equation (34): none, surplus, and all.
𝐸𝑎𝑎𝑐𝑠 = {
0 𝑖𝑓 𝑏𝑎𝑠𝑒𝑙𝑖𝑛𝑒 = 𝑛𝑜𝑛𝑒 𝐹𝑔𝑒𝑛ℎ+1 − 𝐹𝑐𝑜𝑛𝑠ℎ+1 𝑖𝑓 𝑏𝑎𝑠𝑒𝑙𝑖𝑛𝑒 = 𝑠𝑢𝑟𝑝𝑙𝑢𝑠
𝐹𝑔𝑒𝑛ℎ+1 𝑖𝑓 𝑏𝑎𝑠𝑒𝑙𝑖𝑛𝑒 = 𝑎𝑙𝑙 (34)
If the baseline is defined as none, it indicates that no energy will go on sale, surplus indicates that the energy that will go on sale is the difference between the hour-ahead forecasted generation (𝐹𝑔𝑒𝑛ℎ+1) and the hour-ahead forecasted consumption (𝐹𝑐𝑜𝑛𝑠ℎ+1), and all indicates that all the hour-
ahead forecasted generation (𝐹𝑔𝑒𝑛ℎ+1) will go on sale.
Before stating the auctions, the synchronized agent queries all agents regarding available energy to be sold in auctions. This will provide the synchronized agent to order the sellers using a FIFO methodology. It is the synchronized agent that will synchronize the beginning of an auction. The auctions are done by the seller.
The number of lots that agent 𝑎 will try to sell is calculated in equation (35), where the amount of energy to be sold (𝐸𝑎𝑎𝑐
𝑠 ) is divided by the maximum lot size configured in that agent (𝑀𝐿𝑎𝑠 ). The
maximum lot size, it is a value that limits the lot size, if the amount of energy surpasses the maximum lot size, then multiple lots are announced for auction. The minimum price accepted for each lot is the same for all lots, and it is calculated according to equation (36). In the configuration of the agent, the user specifies the percentual value that is willing to receive for each lot (𝑚𝑃𝑎), taking into
consideration the current price for energy injected to the grid (𝑀ℎ𝑆).
𝐿𝑎𝑎𝑐𝑛𝑢𝑚𝑏𝑒𝑟 = ⌈
𝐸𝑎𝑎𝑐𝑠
𝑀𝐿𝑎𝑠 ⌉ (35)
𝐿𝑎𝑎𝑐𝑚𝑖𝑛 = 𝑚𝑃𝑎 × Mℎ
𝑆 (36)
During an auction, agents offer bids if constraint (37) is respected. The lot size is represented by
𝐿𝑖𝑎𝑐𝑠 , and 𝐸𝑎𝑎𝑐
𝑏 represents the energy buying target, and 𝐸𝑎𝑎𝑐𝑏𝑝
represents the energy already bought in
that auction catalogue. If the lot size is bigger than the energy needed by the agent, no bid will be made, independently on the current lot price.
𝐿𝑖𝑎𝑐𝑠 < 𝐸𝑎𝑎𝑐
𝑏 − 𝐸𝑎𝑎𝑐𝑏𝑝
(37)
If constraint (37) is true, then the agent uses equations (38), (39), and (40) to calculate the starting bid (𝑆𝑂𝑎𝑖𝑎𝑐) for lot 𝑖 in auction 𝑎, the incremented bid (𝐼𝑂𝑎𝑟𝑖𝑎𝑐
), and the maximum bid (𝑀𝑂𝑎𝑖𝑎𝑐). Each
agent is configured with start bidding price, incremental bidding price, and maximum bidding price. The multiplication of the starting bidding price (𝑆𝑃𝑎) with the market price for energy consumed from the main grid (𝑀ℎ
𝑏) in hour ℎ, results in the starting bid price (𝑆𝑂𝑎𝑖𝑎𝑐) – equation (38). The incremented
bid is calculated in equation (39) using the incremental bidding price (𝐼𝑃𝑎) multiplied by the current highest bid (𝐿𝑖𝑎𝑐
ℎ𝑏 ). The maximum bid price, of equation (40), is the multiplication of maximum bidding
price (𝑀𝑃𝑎) and market price of energy consumed from the main grid (𝑀ℎ𝑏).
𝑆𝑂𝑎𝑖𝑎𝑐 = 𝑆𝑃𝑎 ×𝑀ℎ𝑏 (38)
𝐼𝑂𝑎𝑟𝑖𝑎𝑐= 𝐿𝑖𝑎𝑐
ℎ𝑏 × 𝐼𝑃𝑎 (39)
𝑀𝑂𝑎𝑖𝑎𝑐 = 𝑀𝑃𝑎 ×𝑀ℎ𝑏 (40)
If constraint (37) and constrain (41) are true – meaning that the lot’s current highest bid is lower than the maximum bid price that agent 𝑎 is willing to make – then agent 𝑎 will bid according to equation (42). The constraint (37) does not allows agents to bid on lots higher than the energy they need. This results in situations where there are lots to sell and there are agents willing to buy, but not a single bid is made.

75
𝐿𝑖𝑎𝑐ℎ𝑏 < 𝑀𝑂𝑎𝑖𝑎𝑐 (41)
𝑂𝑎 = {
𝑆𝑂𝑎 𝑖𝑓 𝐿𝑖ℎ𝑏 < 𝑆𝑂𝑎
𝑀𝑂𝑎 𝑖𝑓 𝐿𝑖ℎ𝑏 ≥ 𝑆𝑂𝑎 𝑎𝑛𝑑 𝐼𝑂𝑎 > 𝑀𝑂𝑎
𝐼𝑂𝑎 𝑖𝑓 𝐿𝑖ℎ𝑏 ≥ 𝑆𝑂𝑎 𝑎𝑛𝑑 𝐼𝑂𝑎 ≤ 𝑀𝑂𝑎
(42)
The time periods of each auction are defined in the synchronized agent configuration file. An example of P2P transaction can be seen in Figure 26. The synchronizer agent queries other agents at ’30 * * * *’. It is considered that it is used a five minutes window to receive lots announcements and that the lot closes after fifteen seconds without new bids.
The synchronizer agent is responsible to broadcast the market prices – energy from the main grid to end-users, and energy from end-users to the main grid. At ’18 * * * *’, all agents run the forecast algorithms for generation and consumption. At ’30 * * * *’, the synchronizer agent queries other agents to create a list of sellers, and waits five minutes until it closes the registration of sellers.
At ’35 * * * *’ (i.e., every hour at 35 minutes) the synchronizer agent starts the auctions by giving a start signal to the first agent that wants to sell energy. The interaction with agents differs from the type of auction that is configured: English, Dutch, blind, or Vickrey. After finished the first auction, the synchronizer agent notifies the next seller to start a new auction. The English and Dutch auction types demand an interactive loop among the auctioneer and all other agents, while the blind and Vickrey types only need, from the auctioneer, an announcement and a selling notification.
It is not the focus of this PhD research to develop a secure transaction solution. This can be achieved using a distributed ledger technology (DLT) with a framework, such as Corda. Corda is an open source framework for blockchain for business. Corda provides distributed nodes that can be installed in SBC and register transactions among agents. The integration of such nodes in S4E enables the registration of transactions in a distributed approach where all transactions are validated in Corda nodes. The approach provided by Corda enables the register of the transaction among agents that are part of the transaction, in other words, if agents x and y made a transaction, Corda will validate the transaction at only agents x and y will register the transaction. Transactions in S4E can be added in Corda using the remote procedure call (RPC) client or the API.
S4E configuration and execution
All S4E agents are equal, they have the same structure, code and capabilities. Nevertheless, each one has its own configuration file. The configuration file is a JSON file that can be edited in a common text editor software. The JSON format can be easily interpreted and understood by users, and easily parsed by Java language. Everything in S4E can be configured in this JSON file.
The order of JSON data is not fixed, and it can be changed by the user. The presented order does not need to be following. Figure 25 shows the configuration of the SBC, concerning its hardware. The S4E is able to run in multiple SBC, but how this is done differs from SBC to SBC. Therefore, some hardware specifications must be identified in the configuration file, such as: the model of SBC, which NIC should be used, which UART port should be used, and the UART baudrate.
"machine" : {
"model" : "raspberry pi 3 model b",
"network" : {
"nic" : "eth0"
},
"uart" : {
"port" : "/dev/ttyS0",
"baudrate" : 9600
}
}
Figure 25. Single-board computer configuration

Luis Gomes
76
Figure 26. S4E's P2P transactions flow
The connectivity of S4E is also very important and it is represented in the configuration file using two key/value pairs: jgroups, and jade. Figure 27 shows a possible configuration of S4E, identifying the channel of JGroups, the JADE’s agent, and the JADEs multi-agent system. The JGroups library uses channels to create tunnels in the network. For the JADE configuration, the agent name and container must be identified, also the location of the MAS must be specified. If ‘localhost’ or ‘127.0.0.1’ addresses are used in the jade.mas.ip key, them the S4E will execute the MAS core, indicating that this agent will receive the MAS. If jade.mas.ip key is set to the value ‘jgourps’ and jade.mas.port key is set to 0, then the agent will search for this information in the JGroups network tunnel.
"jgroups" : {
"channel" : "uGIM_Channel"
},
"jade" : {
"agent" : {
"name" : "Building 1",
"container_name" : "Building.1 Container"
},

77
"mas" : {
"name" : "uGIM_MAS",
"ip" : "jgroups",
"port" : 0
}
}
Figure 27. S4E connectivety configuration: JGroups and JADE
Figure 28 shows the configuration of the local and remote databases. Both databases share the same configuration structure, with the exception of the dump_rate_hours key that indicates the period in hours that the data will be moved from the local database to the remote database. The connection key identifies the type of database and the connection parameters necessary to access the database. The three last keys of each storage identify: if S4E will use the previous tables or create new ones, if the previous tables will be deleted, and if S4E will delete the tables when it closes.
"storage" : {
"local" : {
"connection" : {
"type" : "PostgreSQL",
"server" : "localhost",
"port" : 5432,
"database" : "ugim_db",
"user" : "user",
"password" : "pass123"
},
"use_previous" : true,
"delete_previous" : false,
"delete_after" : false
},
"remote" : {
"connection" : {...},
"use_previous" : true,
"delete_previous" : false,
"delete_after" : false,
"dump_rate_hours" : 24
}
}
Figure 28. Storage configuration: local and remote
The resource’s integration is also configured in the configuration file using the resources key, as seen in Figure 29. For resources integration, a monitoring period and timeout must be specified. The timeout will be set to any communication made to resources. Lists of resources types are then set. In Figure 29, an example of an HTTP API resource is shown. All resources are decomposed by registers, where a register type and a data type are specified. Resources can have one of three possible controls: none, discrete or variable. The example shows a variable control where the on, off and range control are specified. In the control.variable.uri key is specified a string ‘**STATE**’ that S4E will replace by a value ∈ [0, 100]. The resource storage configuration is individual. Therefore, each resource must specify the store period and type. The types indicate how the values are aggregated: average (avg), instant power (instant), or sum of values (sum). The instant power will store only the last read value.
"resources" : {
"monitoring_period" : 1000,
"monitoring_timeout" : 400,
"http_api" : [
{
"name" : "Lights115",
"type" : "Lights",
"uri" : "http://192.168.0.5:8520/Light/P1_W",
"method" : "GET",
"body" : "",

Luis Gomes
78
"registers" : [
{
"type" : "total_power_consumption",
"tag" : "Analyzer115_V1.P1_W",
"data" : "DOUBLE"
}
],
"control" : {
"type" : "variable"
"on" : {
"uri" : "http://192.168.0.5:8520/Light/on",
"method" : "POST",
"body" : "",
},
"off" : {
"uri" : "http://192.168.0.5:8520/Light/off",
"method" : "POST",
"body" : "",
},
"variable" : {
"uri" : "http://192.168.0.5:8520/Light/**STATE**",
"method" : "POST",
"body" : "",
}
},
"store" : {
"period" : 10,
"type" : "avg"
}
}
],
"modbustcp" : [],
"modbusrtu" : []
}
Figure 29. Resource’s integration configuration: an HTTP API example
In order to perform high quality energy strategies, it is important to describe the building and resources location. Figure 30 shows how this definition is done in the configuration file. The building is divided by hierarchical zones representing geographic/physical divided zones. Each building’s zone can be composed by other zones. Using this configuration, energy strategies can correlate data and provide local, by zone, optimizations taking into consideration each zone’s context. The building’s description will also enable a future interface where the building blueprint can be displayed to users, providing better tools to use the S4E software.
"building" : {
"name" : "Building",
"resources" : [
"resource.PV_Panels"
],
"zones" : [
{
"name" : "Room 1",
"resources" : [
"resource.Light",
"resource.HUB1.temperature",
"resource.HUB1.humidity"
],
"preferences" : [
{
"type" : "lux",
"value" : 180
}

79
],
"zones" : []
},
{
"name" : "Room 2",
"resources" : [
"resource.Heater",
"resource.Refrigerator"
],
"zones" : []
}
Figure 30. Building’s zones configuration
Energy strategies are configured using a monitoring period that specifies the period when energy strategies are executed/validated. Each strategy is defined using four JSON keys: description, a list of restrictions, a list of conditions, the Java class of the energy strategy, and a flag indicating if it is a storable object – if the inputs and outputs will be stored in the database. Figure 31 shows the configuration of three energy strategies. The three energy strategies are the ready-to-use strategies detailed in section III.4.3. Periodical energy strategies use the time notation of Figure 21 in the restriction key. The action key identifies the Java’s class that has the energy strategy, for instance, algorithm.MatchGenCons_glpk_v1 defines the MatchGenCons_glpk_v1 class in the dsm.sbc.ugim.gecad.isep.ipp.pt package. "energy_strategy" : {
"monitoring_period" : 1000,
"strategies" : [
{
"description" : "Cons_below_Gen",
"restrictions" : [
"resources.total_power_consumption-flexibility <
resources.total_power_generation*0.95",
"lastExecution >= 4"
],
"conditions" : [
"resources.total_power_consumption > resources.total_power_generation",
"resources.total_power_consumption <
resources.total_power_generation*0.8",
"lastExecution >= 60000"
],
"action" : "algorithm.MatchGenCons_glpk_v1",
"store" : true
},
{
"description" : "forecastHourCons",
"restrictions" : [
"schedule: 18 * * * *"
],
"conditions" : [],
"action" : "algorithm.ForecastDummyHour_cons",
"store" : false
}
]
}
Figure 31. Energy strategies configuration
The OpenADR is also specified in the configuration file, as seen in Figure 32. The server key is the location of the VTN. As default, no resource is available for OpenADR. Therefore, each resource must be explicitly defined in this section to be available for OpenADR actions.
"openadr" : {
"server" : "http://192.168.3.39:8080/OpenADR2/Simple/2.0b",
"ven_name" : "test2",

Luis Gomes
80
"registerReports" : false,
"reports" : [
{
"id" : "test",
"duration" : "PT2H",
"type" : "telemetry_usage",
"resources" : [
{
"name" : "resource.Sockets.total_power_consumption",
"description" : "powerReal",
"min_period" : "PT1S",
"max_period" : "PT1M",
"on_change" : false
}
]
}
]
}
Figure 32. OpenADR configuration
To enable P2P energy transactions, it is necessary to have a synchronizer agent. In the S4E agent that will be the synchronizer agent, the configuration of Figure 33 must be added. The P2P market is specified by name, type (according to section III.4.2.10), closing time, and auctions. The closing time defines, in seconds, the time that a lot can wait without new bids until it closes. The auctions are defined by two keys, indicating the time when sellers will be queried, and the period during the synchronized agent will accept the registration of sellers.
"transactive_energy_sync" : {
"peer-to-peer_market" : {
"name" : "hourahead",
"type" : "english",
"closing_time" : 15,
"auctions" : [
{
"sellers_query" : "30 * * * *",
"sellers_query_duration" : 5
}
]
}
Figure 33. Transactive energy configuration: auctioneer-side
The configuration of Figure 34 must be added in agents that want to participate in the P2P energy
transaction auction. The synchronized agent can also have the configuration of Figure 34, also acting
as a participant. The calculation time indicates when the agent calculates the amount of energy that
will be exchanged in the P2P transaction. This is an individual target amount that the agent will try to
achieve. Regarding energy to be bought, the configuration must specify the baseline type (i.e., all,
deficit, surplus, none) and the percentual value that indicates the amount of energy that will be sold.
For instance, if baseline type is all and energy is set at 110, then if the forecast generation is 1 kW,
the agent will try to sell 1.1 kW. The maximum price and starting price are percentual values
concerning the price of energy bought from the grid. The increment is used to calculate a bid. For
energy to be sold, baseline and energy keys are used in an equal way as the energy to be bought. The
minimum price is a percentual value concerning the price payed by the main grid for energy injected.
The maximum lot size indicates how energy will be divided in energy lots.
"transactive_energy" : {
"peer-to-peer_market" : {
"calculations" : {
"at": "21 * * * *"
},
"buy" : {

81
"baseline" : "deficit",
"energy" : 110,
"max_price" : 80,
"starting_price" : 30,
"increment" : 10
},
"sell" : {
"baseline" : "surplus",
"energy" : 100,
"min_price" : 100,
"max_lot_size_wh" : 100
},
"store" : true
}
}
Figure 34. Transactive energy configuration: participant-side
To simplify the use of S4E commands, a bash script was created that allows the performance of several tasks using simple commands. The command as the name µGIM and has the following commands/options:
▪ -c: compiles all Java files;
▪ -r “conf_file”: runs the S4E software using the configuration file with named conf_file, this command also enables the configuration of logs, that can be displayed in the console (-debug), sent to files (-log) or ignored (-none), also, the command can receive a -noagent option in order to run S4E without JADE framework;
▪ -commit “comment”: this command enables the code to be committed to bitbucket and a local git server existing in the research centre, this prepared S4E to be developed by multiple persons and easily shared among SBC;
▪ -rep: this command will pull the last S4E stored version of Bitbucket.
The use of µGIM command enables the distributed development and easy deployment of new code among SBC. It is also possible to combine µGIM commands making it more efficient. For instance, if a new code version is available in git server, it is only necessary to run the following command: µGIM -rep -c -r “conf_file” -log
S4E code structure
The code of S4E is structured in multiple Java packages. Figure 35 shows the developed packages and their connections – this is a top-level representation of the software, for detail technical description it is recommended to read S4E documentation. The S4E is a multi-thread software where threads are created and removed in real-time depending on the software context. As a representation of possible threads, Figure 35 shows green dots in classes that are threads. The threads share the configuration class as well as the S4E’s internal memory. In green rectangles are represented classes, and in blue rectangles are represented interfaces. The Java packages are:
▪ Agent – this is the main package that can be represented in the centre of S4E, it has the main function in the JGroups starter class, and the Configuration class that reads the configuration file and has all the configuration parameters, the package also has the JADE agent and the MAS core classes;
▪ Agent behaviours – this package has all the JADE agent’s behaviours, that are methods that are triggered when JADE messages are received, it is the behaviour that must analyse the message and define if it will act or not;
▪ API – the S4E HTTP API is inside this package, there is a permanent thread waiting for clients and each client will be served using a dedicated thread;

Luis Gomes
82
Figure 35. Java's package structure
Agent Behaviours
Auction: market prices
Auction: request lots
Auction: inform lots
Auction: request bids
Auction: make offer
Auction: accept transaction
Agent
Configuration
JGroups starter
JADE controller
JADE agent
API
Web API
Web API controller
Web API helper
Data
Data starter
Faci lity memory
User preference
Zone
Quarter data ca lculation
Hour data calculation
DSM
Balancing algorithm
Hour-ahead consumption forecast
Quarter-ahead consumption forecast
Hour-ahead generation forecast
Quarter-ahead generation forecast
…
Energy Strategy
I . Energy s trategy
I . Optimization
Energy s trategy
Facility
I . Alarm
Alarm object
Faci lity alarm system
Faci lity monitoring
Faci lity storing
Energy s trategy monitoring
Faci lity set va lues
External
I . HTTP requester
HTTP request
I. Weather (real-time)
I . Weather (day-ahead forecast)
I . Weather (hour-ahead forecast)
Open weather map
…
Log
S4E log
OpenADR
HTTP connector
Parser
Simple HTTP
Message builder
Event response
Report
Report description
Report response
Resources
I . Resource
I . Register
Modbus RTU resource
Modbus TCP resource
Modbus RTU/TCP register
HTTP API resource
HTTP API register
Serial
I . Serial communication
Serial communication (raspberry pi model B)
Serial monitoring
Storage
I . Storable
I. Loca l s torage
I . Remote storage
Local MySQL
Remote MySQL
Local PostgreSQL
Remote PostgreSQL
…
Transactive
Master
Auction
Lot
Transactive energy
Transaction

83
▪ Facility – this package intends to monitor and control all the building and software, it will monitor data, store data, monitor alarms, monitor contextual energy strategies, and has the facility values. The I. Alarm is an interface that can be implemented by other classes, if they what to be triggered as alarms;
▪ Resources – this is a continuous under-development package that has the drivers that enable the integration of resources, each resource is an individual thread and it must implement the interface of resource and registers;
▪ External – the S4E is able to interact with the outside world, beyond the MAS, this package provides the means to enable this, as well as the integration of external weather services that can be used (this can be useful for energy forecasts);
▪ Serial – the Modbus/RTU protocol is only possible with serial communication, this package receives classes that enable the use of serial communication in different single-board computers;
▪ Storage – this package has the drivers for local and remote databases, the interface I. Storable must be implemented in every class that want to be stored in the database, this is the case of resources and energy strategies;
▪ Data – the data package has everything that works with the overall and building data, for instance, the facility memory positions that can be used by all threads and classes;
▪ Energy strategy – this is an abstract package that enables the use of energy strategies in S4E, it has the mandatory interfaces and the ability to validate, according to its restrictions and conditions, if an energy strategy is valid or not;
▪ Demand-side management (DSM) – this is an open and continuously under-development package that has all the energy strategies that the users want to integrate in the S4E;
▪ Transactive – the auctions for the P2P energy transactions are coded in this package, future transactive energy methodologies should be developed in this package;
▪ OpenADR – this package has all the classes needed to turn S4E compliant with OpenADR (at this moment, only reporting is available in S4E);
▪ Log – this package has connections to all other packages and threads and congregates all the logs in a single output format to be printed on the screen, to a file, or ignored.
The structure of packages represented in Figure 35 enables the conception of the domain model of Figure 17 and the architecture of Figure 18. All packages are related and have direct interactions with each other. Also, classes are also shared among packages using the Configuration class. For instance, energy strategies have access to the resources lists to be able to read resources values and control them.
S4E licenses
The S4E uses multiple software and libraries from third parties. These software and libraries were chosen according to their licenses. The S4E was conceived to be free for development but is not yet clear what type of license it will have and what part of the code will be made public. Therefore, the use of third-party’s code cannot limit future decisions. Table 6 shows all the licenses used in the S4E, regarding the third-party software identification, license applied, and restrictions that they represent in the S4E software.
Licenses, such as MIT, PostgreSQL and BSD-2 do not bring any restriction to S4E. The MIT license maybe is the softer license and allows the user to do everything with the code. Also, Apache 2.0 license does not bring any restriction rather than including the license in the S4E release. The LGPL demands the use of linked libraries, enabling users to update the libraries without these being encoded inside the S4E, meaning that the user must have access to perform the updates. To use LGPL

Luis Gomes
84
software without linked libraries, S4E must be released with LGPL and the code should be made public for at least 3 years. The main problem is GPL that demands the opening of source code and the release of the code using GPL.
Table 6. Licences used in S4E
Software License Restrictions
GLPK GPLv3 (GNU, 2007a) release S4E with GPL license
GSON Apache 2.0 (Apache, 2004) include license
JADE LGPL 2.1 (GNU, 1999) dynamic link
jamod Apache 2.0 (Apache, 2004) include license
Java 8 JDK Oracle Technology Network License Personal use
java-json MIT (MIT, 2019) none
jgroups LGPL 2.1 (GNU, 1999) dynamic link
JNA Apache 2.0 (Apache, 2004) include license
JOM LGPL 3.0 (GNU, 2007b) dynamic link
JRI LGPL 2.1 (GNU, 1999) dynamic link
MySQL GPLv2 (GNU, 1991) release S4E with GPL license
MySQL connector GPLv2 (GNU, 1991) release S4E with GPL license
Parallel Colt Multiple -
PostgreSQL PostgreSQL none
PostgreSQL JDBC Driver BSD-2-Clause License (SPDX, 2019a) none
R Environment GPLv2 (GNU, 1991) release S4E with GPL license
RxTx LGPL 2.1 (GNU, 1999) dynamic link
The main issues in S4E are GLPK, MySQL (database and driver) and R-project environment. The GLPK and R environment are needed for energy strategies, and because S4E is not dependent from energy strategies, the approach to work around the GPL is to release S4E without GLPK and R environment installed, passing to user the decision to install these software if he/she wants to use energy strategies that are dependent on GLPK solver or R environment. The MySQL can be available only on user installation. The S4E can be released only with PostgreSQL, leaving to the user the possibility to use MySQL.
The library Parallel Colt has multiple licenses depending on the used packages. However, this library is not directly used by S4E. The library is used inside JOM library, that has a LGPL 3.0 license. In its turn, JOM library is used only for GLPK solver. Therefore, JOM and Parallel Colt will have the same approach as GLPK, leaving the installation decision to the user. The GLPK can be used without JOM. Therefore, the user is not only free to choose the installation of GLPK, but also JOM. Parallel Colt is mandatory for JOM library as is released under LGPL 2.1 license.
As previously stated, the license of S4E is not yet defined. Depending on this decision, the use of LGPL and GPL can suffer changes. For instance, if a GPL is defined for S4E, then its release can be done with GLPK, MySQL, and R-project environment. Besides not being directly addressed in this section, software licences have compatibility issues, there are licences that are not compatible with others. Therefore, the license that will be attributed to S4E must be compatible with the licences of Table 6, taking into consideration the discussion presented in this section.
A viable option for S4E is to divide the internal software into libraries. As is was seen in section III.4.6, the S4E code structure is divided into packages. Each package can be compiled into a single library or multiple libraries. Each one of these libraries could have its own license, similar to what is found in the Parallel Colt. Also, S4E can have only some packages distributed in open source, leaving some of the packages protected and licensed compiled.
S4E single-board computers compatibility
The S4E software was conceived and developed to be executed inside SBC. Therefore, some tests and experimentations were conducted. The limitations inherent from SBC are mainly in the

85
computational hardware resources, such as processing power and storage size. However, the use of SBC brings three massive advantages: size, price, and hardware integration. The size enables the easy deployment, of the system, almost anywhere, demanding only one power connection. The network connectivity could be made by cable or wireless. SBC also enable hardware integration using the GPIO pins available in SBC board.
The use of SBC can, and it has always been, questioned when comparing this solution to a cloud-based approach. The cloud-based approach brings centralization, computational reliability and hardware redundancy. The computational power and storage size in a cloud system is not even compared with what is available in an SBC. However, when using a cloud-based system, all the system is dependent in a single connection, the internet connection between resources. This makes the cloud-based solution a single point of failure system. Regarding data privacy, this can also be questionable because all data will be stored in external servers. In the current implementation of S4E, all data is processed locally, and only storable data – defined by the users – it is sent to a remote storage server.
By having S4E running in an SBC, without external dependencies, it enables the building management even during a failure in the internet connection or in the case of a grid blackout, if the SBC and resources are powered by a local generator or an uninterruptible power supply (UPS). Also, the use of local processing enables the entire ownership and privacy over critical data.
There are a vast variety of SBC available in the market. Therefore, a decision had to be made on which SBCs will be S4E developed for. After analysing several SBC, it was noticed that manufacturers usually provide a Debian-based OS. Therefore, S4E was developed for Debian-based OSs with Java 8 JRE. During this PhD research, different sized SBC were tested (see Figure 36):
▪ Raspberry Pi Model B – a SBC with a 32-bit 700 MHz single-core (ARM1176JZF-S) with 512 MB of DDR3, it has an RJ45 connector, and it provides a SD card slot, the tested OS was the Debian-based Raspbian;
▪ Cubietruck (Cubieboard 3) – a SBC with a 32-bit 1 GHz dual-core (Allwinner A20) with 2 GB of DDR3 and an internal storage of 8 GB, it provides a SD card slot for memory extension and a SATA connector, the tested OS was the Debian-based Linaro;
▪ Intel Galileo Gen 2 – a SBC with a 32-bit 400 MHz single-core (Intel® Quark™ SoC X1000) with 256 MB of DDR3, it provides a SD card slot and has an Arduino Uno integrated in the board, the tested of S4E was done on top of the image provided by Intel;
▪ BeagleBone Black – a SBC with a 32-bit 1 GHz single-core (AM335x) with 512 MB of DDR3 and it provides a SD card slot, the tested OS was Debian;
▪ Raspberry Pi 3 Model B – a SBC with a 64-bit 1.2 GHz quad-core (Cortex-A53) with 1 GB of DDR3, it has an RJ45 connector and a built-in Wi-Fi card, and it provides a SD card slot, the tested OS was the Debian-based Raspbian;
▪ Raspberry Pi Zero W – a SBC with a 32-bit 1 GHz single-core (ARM1176JZF-S) with 512 MB of DDR3, it has a built-in Wi-Fi card, and it provides a SD card, the tested OS was the Debian-based Raspbian;
▪ NanoPi M1 Plus – a SBC with a 32-bit 1.2 GHz quad-core (Allwinner H3) with 1 GB of DDR3 and an internal storage of 8 GB, it has an RJ45 connector and built-in Wi-Fi card, and it provides a SD card slot for memory extension, the tested OS was the Debian-based FriendlyCore;
▪ NanoPi NEO Core – a SBC with a 32-bit 1.2 GHz quad-core (Allwinner H3) with until 512 MB of DDR3 and an internal storage until 32 GB, it provides a SD card slot for memory extension and GPIOs for a RJ45 connection (it does not provide a RJ45 connector), the tested OS was the Debian-based FriendlyCore;

Luis Gomes
86
▪ NanoPi NEO Core2 – a SBC with a 64-bit 1.4 GHz quad-core (Allwinner H5) with until 1 GB of DDR3 and an internal storage of until 32 GB, it provides a SD card slot for memory extension and GPIOs for a RJ45 connection (it does not provide a RJ45 connector), the tested OS was the Debian-based FriendlyCore.
Figure 36. SBC board's size
The S4E software was able to run in the listed SBC. Despite the hardware specifications being different, S4E was not affect by them. Some deployments achieved a faster computational speed, but all of them were able to execute a S4E agent. Nevertheless, the size of the used SBC is important because it will facilitate or harden the deployment of S4E in buildings. As can be seen in Figure 36, NanoPi NEO Core and NanoPi NEO Core2 have the smaller boards. The height of SBC is not represented, but they vary from 1.4 mm to 20 mm. Raspberry Pi Zero W, NanoPi NEO Core and NanoPi NEO Core2 are the boards with the lower height, with only 1.4 mm.
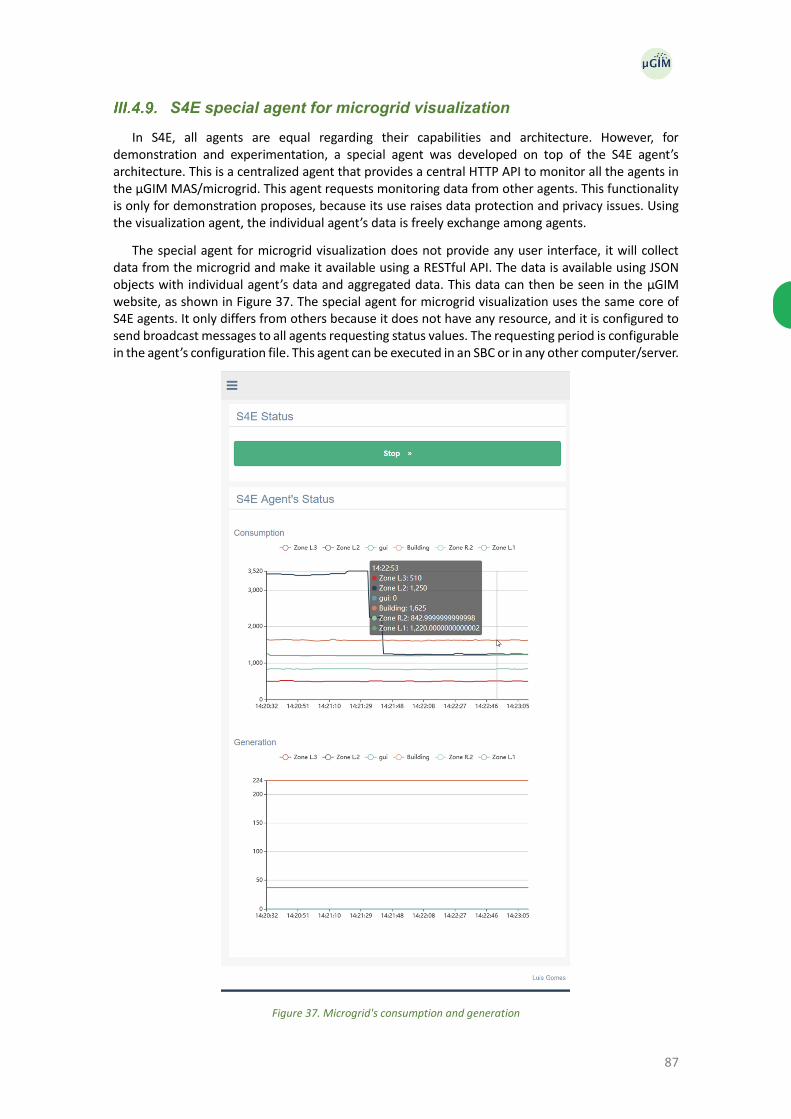
87
S4E special agent for microgrid visualization
In S4E, all agents are equal regarding their capabilities and architecture. However, for demonstration and experimentation, a special agent was developed on top of the S4E agent’s architecture. This is a centralized agent that provides a central HTTP API to monitor all the agents in the µGIM MAS/microgrid. This agent requests monitoring data from other agents. This functionality is only for demonstration proposes, because its use raises data protection and privacy issues. Using the visualization agent, the individual agent’s data is freely exchange among agents.
The special agent for microgrid visualization does not provide any user interface, it will collect data from the microgrid and make it available using a RESTful API. The data is available using JSON objects with individual agent’s data and aggregated data. This data can then be seen in the µGIM website, as shown in Figure 37. The special agent for microgrid visualization uses the same core of S4E agents. It only differs from others because it does not have any resource, and it is configured to send broadcast messages to all agents requesting status values. The requesting period is configurable in the agent’s configuration file. This agent can be executed in an SBC or in any other computer/server.
Figure 37. Microgrid's consumption and generation

Luis Gomes
88
Chapter IV
IV. Deployments and Case
Studies
CHAPTER INDEX
IV.1. INTRODUCTION ............................................................................................................................ 89
IV.2. V2R EXPERIMENTATIONS .............................................................................................................. 89
Simulation and emulation experimentation ........................................................................ 90
SCADA integration experimentation .................................................................................. 91
SOICAM microgrid case study ........................................................................................... 94
IV.3. ENAPLUG EXPERIMENTATIONS ...................................................................................................... 97
Energy management system integration experimentation with EnAPlug AM ..................... 97
Monitoring and learning experimentation with EnAPlug SB ............................................. 101
Residential air conditioner management using the shared knowledge of Enaplug SB..... 106
IV.4. S4E EXPERIMENTATIONS ............................................................................................................ 111
Office deployment case study .......................................................................................... 112
Microgrid with transactive energy case study .................................................................. 117
Multi-building deployments .............................................................................................. 125

89
IV.1. Introduction
This chapter will present experimentations conducted to the three proposed solutions: the virtual to reality (V2R) emulator, the environmental awareness smart plug (EnAPlug), and the single-board computer for energy (S4E). These experimentations use real deployments made in GECAD, the research centre where this PhD research took place. Building N was the main building used in this PhD research, being the building where the research work took place and the building where the energy laboratories are located. Nonetheless, the experimentation presented in section IV.2.3 used two additional buildings of GECAD, and the experimentation presented in section IV.4.3 used three residential houses.
Three experimentations are used to test and validate each proposed solution (i.e., V2R, EnAPlug, and S4E), taking into account different functionalities. In its turn, each experimentation is subdivided and presented using three sections: deployment, data collection, and data analyses. The deployment section describes the deployment made for that particular experimentation, considering the proposed solution and the context where it was deployed. The data collections section presents how the data was collect and shows the collected data. The data analyses section presents the discussion and the conclusion regarding the experimentation.
IV.2. V2R experimentations
V2R emulator was conceived and developed as an enabler for laboratorial validation and testing of energy management systems. Although it was part of the work behind this PhD research and was needed for validation and testing, it was not the main focus of this PhD research. Therefore, published work regarding V2R focuses on conferences and workshops. This enabled the wide dissemination of V2R emulators in the research community by showing and providing demonstrations. V2R has been also described in a journal publication as part of the demonstration scenario. The publications where V2R was published are:
▪ Luis Gomes, Zita Vale “Virtual to Reality Emulator for Electrical Loads”, in Proceedings of the Third DREAM-GO Workshop – Intelligent load management in local and wholesale demand response markets, 23-24 January, Porto, Portugal, 2018. Doi: 10.5281/zenodo.2677528 (Gomes, 2018a);
▪ Luis Gomes, Omid Abrishambaf, Pedro Faria, Zita Vale “Retrofitting Approach for an Automated Load Testbed”, in Proceedings of the Final ELECON workshop – Dissemination & Transfer of Knowledge, 12-14 September, Florianópolis, Brazil, 2016 (Gomes, 2016);
▪ Luis Gomes, Pedro Faria, Zita Vale, Jorge Silva, "Energy Analyzer Emulator for Microgrid Implementation and Demonstration and Respective Gateway" in IEEE Transactions on Industry Applications, vol. 55, no. 1, pp. 134-144, Jan.-Feb. 2019. Doi: 10.1109/TIA.2018.2866451 (IF. 3.347) (Gomes, 2019a);
▪ Luis Gomes, Zita Vale “Energy Analyzer Emulation for Energy Management Simulators”, in: Omatu S., Rodríguez S., Villarrubia G., Faria P., Sitek P., Prieto J. (eds) Distributed Computing and Artificial Intelligence, 14th International Conference. DCAI 2017. Advances in Intelligent Systems and Computing, vol 620. Springer, Cham. Doi: 10.1007/978-3-319-62410-5_26 (Gomes, 2017b).
The remain of this section demonstrates the application and results of V2R emulators. Three experimentations are presented: a deployment for unit tests where individual V2R emulators are tested, a deployment for laboratory integration tests where V2R is connected to a pre-installed SCADA system, and a deployment of V2R in a fully emulated building part of an microgrid. This section focuses on the V2R emulator solution, but an integration experimentation can be seen in section IV.3.1, where V2R emulators are used with EnAPlugs and S4E.

Luis Gomes
90
Simulation and emulation experimentation
IV.2.1.1. Deployment
The unit tests were conducted in the V2R emulator, without the integration in any SCADA system. The tests present in this section have been presented in the Third DREAM-GO Workshop at the beginning of 2018 (second year of the PhD) and published in the respective proceedings (Gomes, 2018a). This presentation was used for demonstration purposes.
The idea behind this deployment is the demonstration of V2R using the deviation parameter in a discrete simulation and in a graph emulation. The discrete simulation has been configured to simulate a load of 3.100 W when the resource is turned on, and a load of 0 W when the resource is turned off. The graph emulation has been configured using a 24-hour dataset of a refrigerator consumption where power was measured each minute.
IV.2.1.2. Data collection
The data has been collected using the publishing option of V2R emulator where all the data are sent to an external SQL Server database. Four executions were made in these tests: a discrete simulation of a 3.100 W load without random deviation (see Figure 38), a discrete simulation of a 3.100 W load with 2 % random deviation (see Figure 39), a graph emulation of a refrigerator without random deviation using simulated-time (see Figure 40), and a graph emulation of a refrigerator with 2 % random deviation using real-time (see Figure 41). The graph emulation was executed both in simulated- and real-time, where the simulated-time did not have any random deviation and where the real-time had a 2 % random deviation.
Figure 38. Discrete emulation without random deviation
Figure 39. Discrete emulation with 2 % random deviation
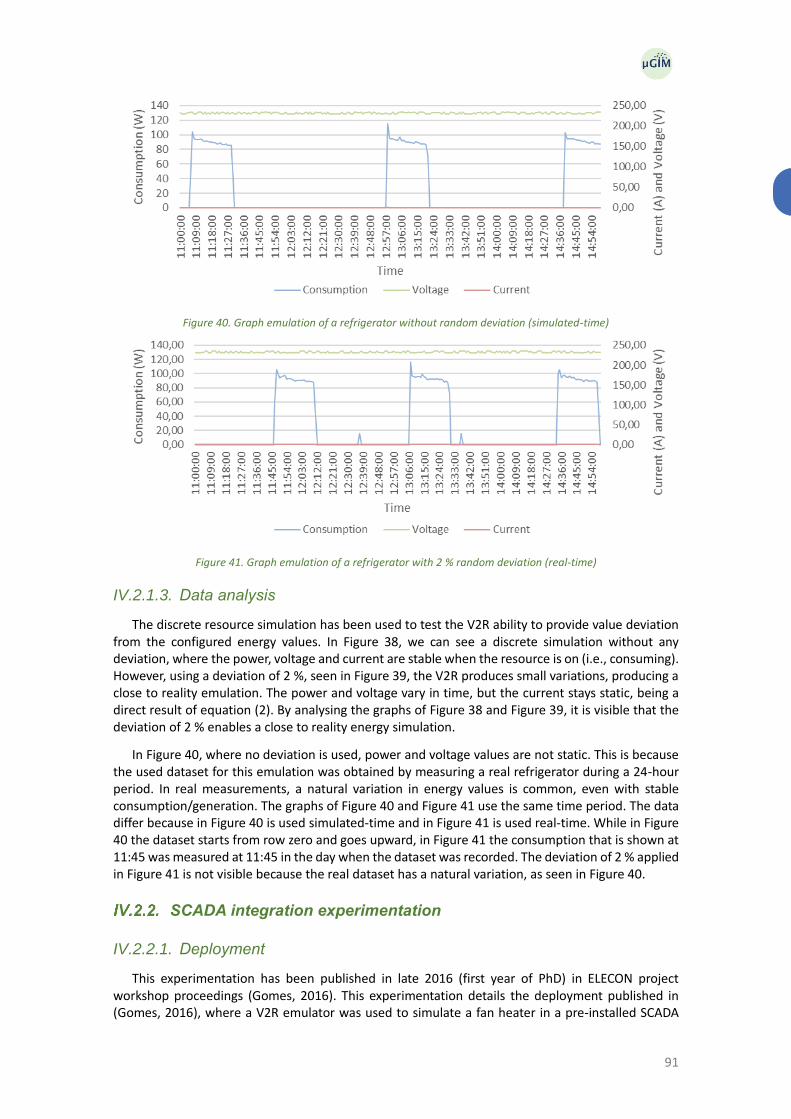
91
Figure 40. Graph emulation of a refrigerator without random deviation (simulated-time)
Figure 41. Graph emulation of a refrigerator with 2 % random deviation (real-time)
IV.2.1.3. Data analysis
The discrete resource simulation has been used to test the V2R ability to provide value deviation from the configured energy values. In Figure 38, we can see a discrete simulation without any deviation, where the power, voltage and current are stable when the resource is on (i.e., consuming). However, using a deviation of 2 %, seen in Figure 39, the V2R produces small variations, producing a close to reality emulation. The power and voltage vary in time, but the current stays static, being a direct result of equation (2). By analysing the graphs of Figure 38 and Figure 39, it is visible that the deviation of 2 % enables a close to reality energy simulation.
In Figure 40, where no deviation is used, power and voltage values are not static. This is because the used dataset for this emulation was obtained by measuring a real refrigerator during a 24-hour period. In real measurements, a natural variation in energy values is common, even with stable consumption/generation. The graphs of Figure 40 and Figure 41 use the same time period. The data differ because in Figure 40 is used simulated-time and in Figure 41 is used real-time. While in Figure 40 the dataset starts from row zero and goes upward, in Figure 41 the consumption that is shown at 11:45 was measured at 11:45 in the day when the dataset was recorded. The deviation of 2 % applied in Figure 41 is not visible because the real dataset has a natural variation, as seen in Figure 40.
SCADA integration experimentation
IV.2.2.1. Deployment
This experimentation has been published in late 2016 (first year of PhD) in ELECON project workshop proceedings (Gomes, 2016). This experimentation details the deployment published in (Gomes, 2016), where a V2R emulator was used to simulate a fan heater in a pre-installed SCADA

Luis Gomes
92
system. In this deployment, the V2R emulator was working in discrete simulation mode. Figure 42 shows the configuration of the used V2R. It was used a discrete simulation with a load of 2.109 W when the load is on, and 0 W when the load is off. A 2 % deviation was also configured.
Figure 42. V2R deployment configuration
After the initial configuration, the V2R was installed in the RS485 network of the SCADA system, as seen in Figure 43. The SCADA system measures two laboratories that share the same electrical board. Both of them have single-phase electrical installations. In this SCADA system, a Saia programmable logic controller (PLC) Series PCD3 is used to measure the consumption of the laboratories. A SATEC PM130EH Plus three-phase energy analyser is installed in the electrical board, enabling monitoring the energy consumption. Because the laboratories are single-phase and the energy analyser is three-phase, the analyser is used to measure different appliance sets: air-conditioners, electrical sockets, and lighting.
Figure 43. V2R deployment installation (connection schema)
In regard to V2R emulator installation, the only action needed was the definition of the Modbus/RTU ID in the emulator that cannot already be used by another Modbus/RTU slave. To complete the installation, the PLC was reprogrammed to request consumptions from the V2R emulator and consider them in the total consumption of the laboratories. Ultimately, the installation of the V2R emulator was the same as the installation of a new energy analyser. The major difference between these two installations was that V2R needs a 5 V DC (Volts in direct current) power supply to feed the Arduino and an energy analyser needs a 230 V AC (Volts in alternating current) power supply and the necessary energy connections that enable the energy monitoring. Figure 44 shows the V2R emulator connected to the Saia PLC using two wires for RS485 communication. The RTC module, not used in this emulation, can be seen on the right side of Arduino, while the MAX485 board is seen on the right side of the image.
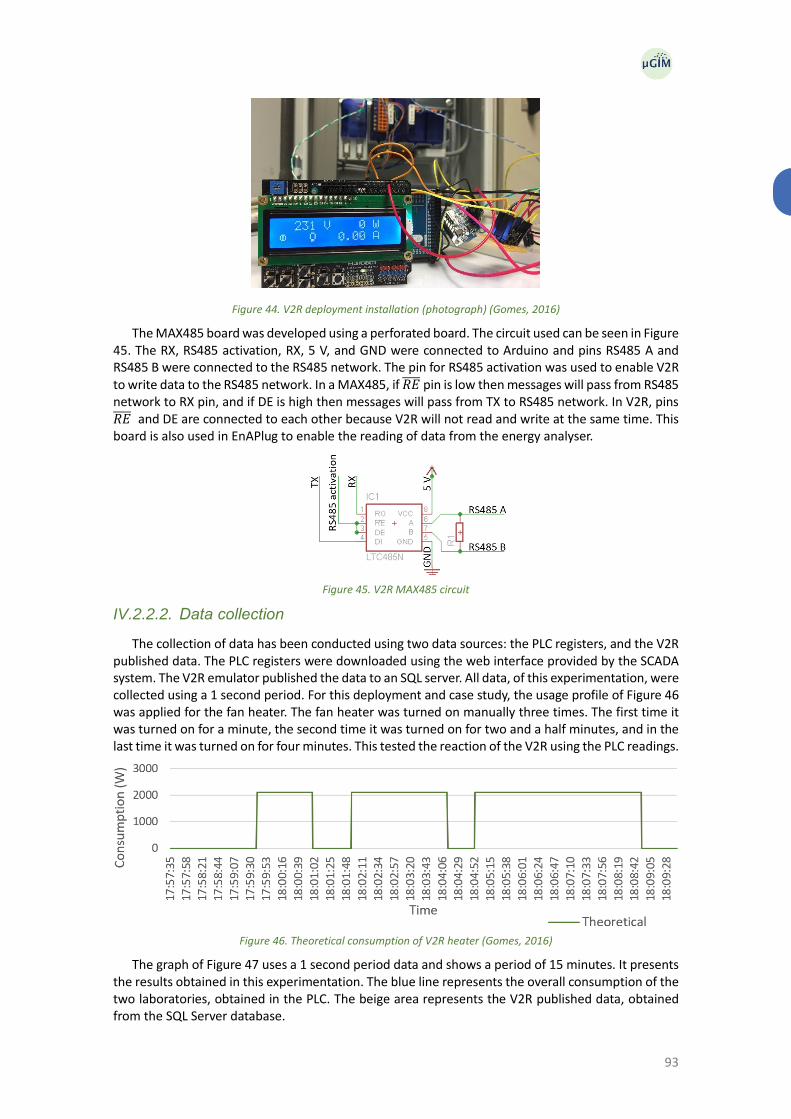
93
Figure 44. V2R deployment installation (photograph) (Gomes, 2016)
The MAX485 board was developed using a perforated board. The circuit used can be seen in Figure 45. The RX, RS485 activation, RX, 5 V, and GND were connected to Arduino and pins RS485 A and RS485 B were connected to the RS485 network. The pin for RS485 activation was used to enable V2R to write data to the RS485 network. In a MAX485, if 𝑅𝐸̅̅ ̅̅ pin is low then messages will pass from RS485 network to RX pin, and if DE is high then messages will pass from TX to RS485 network. In V2R, pins 𝑅𝐸̅̅ ̅̅ and DE are connected to each other because V2R will not read and write at the same time. This board is also used in EnAPlug to enable the reading of data from the energy analyser.
Figure 45. V2R MAX485 circuit
IV.2.2.2. Data collection
The collection of data has been conducted using two data sources: the PLC registers, and the V2R published data. The PLC registers were downloaded using the web interface provided by the SCADA system. The V2R emulator published the data to an SQL server. All data, of this experimentation, were collected using a 1 second period. For this deployment and case study, the usage profile of Figure 46 was applied for the fan heater. The fan heater was turned on manually three times. The first time it was turned on for a minute, the second time it was turned on for two and a half minutes, and in the last time it was turned on for four minutes. This tested the reaction of the V2R using the PLC readings.
Figure 46. Theoretical consumption of V2R heater (Gomes, 2016)
The graph of Figure 47 uses a 1 second period data and shows a period of 15 minutes. It presents the results obtained in this experimentation. The blue line represents the overall consumption of the two laboratories, obtained in the PLC. The beige area represents the V2R published data, obtained from the SQL Server database.

Luis Gomes
94
Figure 47. Total consumption of the ALT laboratory (Gomes, 2016)
IV.2.2.3. Data analysis
The results show the ability of V2R to work as energy analysers while emulating energy loads. In this experimentation, the V2R was connected to SCADA system using Modbus/RTU, where the SCADA system act as master and V2R as slave. The SCADA system was able to monitor the V2R consumption and interpret this consumption as being a real load in the system. This experimentation allowed the placement of an emulated load, using a V2R emulator, in a real SCADA system, leading the system to ‘think’ it was a real load.
The deviation with random values was also a success, providing the usual variation that is found in energy readings. The integration of V2R was able to emulate an energy analyser, providing a Modbus/RTU interface to connect to the SCADA system. This was the main goal of V2R, and the results show its successful implementation. By deploying V2R emulators, it is possible to fool SCADA systems and create testing environments for energy management systems.
SOICAM microgrid case study
IV.2.3.1. Deployment
The SOICAM Microgrid deployment has been published in the middle of 2018 (third year of PhD) in the IEEE Transactions on Industry Applications journal, with an impact factor of 3.347 (Gomes, 2019a). This section will detail the deployment, where V2R emulators were used to emulate air-conditioner units.
Multi-Agent Smart Grid Simulation Platform (MASGriP) is a microgrid simulation platform that enables the representation of multiple microgrid’s players using a multi-agent approach. The platform enables the testing and validation of microgrid operation algorithms and demand response programs. SCADA Office Intelligent Context Awareness Management (SOICAM) is a SCADA system for building monitoring and control that enables the integration of real, simulated and emulated energy resources, while integrating energy management algorithms.
The idea behind this deployment was a test of MASGriP using real buildings, where each building was monitored and controlled by a SOICAM software. However, there was a need for emulation of air-conditioners, and this was achieved using multiple V2R emulators. The work also included the proposal of ZigBee gateways that enabled the sending of the data, provided by energy analysers, to MASGriP. A total of four buildings were included: building I, building F, building N, and an emulated building. The three first buildings are real buildings, while the emulated building uses a set of multiple V2R emulators.

95
Each building was represented by an agent in MASGriP. In this experimentation, there were five agents representing: the microgrid operator, building I, building F, building N, and the emulated building. MASGriP used the same agent framework as S4E agents, JADE. This agent framework was used to provide communications and FIPA compliance in the multi-agent systems. Figure 48 shows the structural representation of SIOCAN and MASGriP in the used building of this experimentation – building N of Figure 48.
Figure 48. Structural representation of MASGriP with SOICAM and V2R (Gomes, 2019a)
The used gateways were initially used in the research leading to this thesis but later they were abandoned and replaced by Saia PLC units that provide a reliable solution for building monitoring and control. Therefore, until this point, the ZigBee protocol was not included in the S4E development.
After deployment, a demand response program was launched in the microgrid between 16:00 and 17:00. The used demand response program was a real-time demand response program (RTDRP) as described in (Gomes, 2014). Because no positive participation was achieved, the independent system operator (ISO) used direct load control (DLC) program to turn off all air-conditioner units.
IV.2.3.2. Data collection
The dataset for this experimentation used readings made every 10 seconds. The data were monitored and stored by MASGriP agents, where each agent was responsible to save its own data. Figure 49 shows data monitored by building N agent and the data regarding the generation units in building F, where a 1 kW wind turbine and a total of 1 kW photovoltaic were available.
Figure 49. Monitoring results
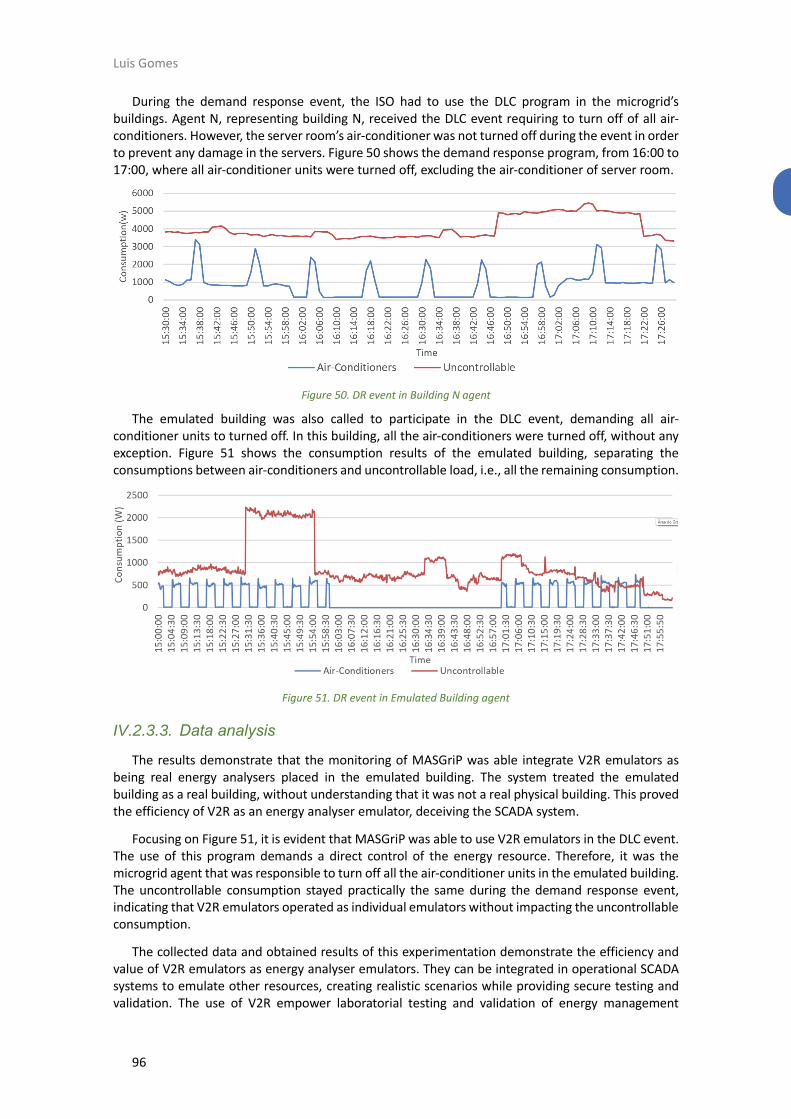
Luis Gomes
96
During the demand response event, the ISO had to use the DLC program in the microgrid’s buildings. Agent N, representing building N, received the DLC event requiring to turn off of all air-conditioners. However, the server room’s air-conditioner was not turned off during the event in order to prevent any damage in the servers. Figure 50 shows the demand response program, from 16:00 to 17:00, where all air-conditioner units were turned off, excluding the air-conditioner of server room.
Figure 50. DR event in Building N agent
The emulated building was also called to participate in the DLC event, demanding all air-conditioner units to turned off. In this building, all the air-conditioners were turned off, without any exception. Figure 51 shows the consumption results of the emulated building, separating the consumptions between air-conditioners and uncontrollable load, i.e., all the remaining consumption.
Figure 51. DR event in Emulated Building agent
IV.2.3.3. Data analysis
The results demonstrate that the monitoring of MASGriP was able integrate V2R emulators as being real energy analysers placed in the emulated building. The system treated the emulated building as a real building, without understanding that it was not a real physical building. This proved the efficiency of V2R as an energy analyser emulator, deceiving the SCADA system.
Focusing on Figure 51, it is evident that MASGriP was able to use V2R emulators in the DLC event. The use of this program demands a direct control of the energy resource. Therefore, it was the microgrid agent that was responsible to turn off all the air-conditioner units in the emulated building. The uncontrollable consumption stayed practically the same during the demand response event, indicating that V2R emulators operated as individual emulators without impacting the uncontrollable consumption.
The collected data and obtained results of this experimentation demonstrate the efficiency and value of V2R emulators as energy analyser emulators. They can be integrated in operational SCADA systems to emulate other resources, creating realistic scenarios while providing secure testing and validation. The use of V2R empower laboratorial testing and validation of energy management

97
systems in research centres. V2R emulators can be used not only to create buildings in laboratory, but also to create entire microgrids in laboratory composed by multiple resources
IV.3. EnAPlug experimentations
EnAPlug is a key contribution of this PhD research and its capabilities are beyond the state-of-the-art of smart plugs, both considering smart plug market and scientific community publications. Therefore, the results of EnAPlug were disseminated using the publication of scientific papers. The target of those publications were international conferences and journals with an impact factor. The list of publications where EnAPlug can be found are:
▪ Luis Gomes, Filipe Sousa, Zita Vale “EnAPlug – An Environmental Awareness Plug to Test Energy Management Solutions for Households” in: Oliveira E., Gama J., Vale Z., Lopes Cardoso H. (eds) Progress in Artificial Intelligence. EPIA 2017. Lecture Notes in Computer Science, vol 10423. Springer, Cham. Doi: 10.1007/978-3-319-65340-2_21 (Gomes, 2017d);
▪ Luis Gomes, Filipe Sousa, Zita Vale “An Agent-Based IoT System for Intelligent Energy Monitoring in Buildings” in Proceedings of 2018 IEEE 87th Vehicular Technology Conference (VTC Spring), Porto, Portugal, 2018, pp. 1-5. Doi: 10.1109/VTCSpring.2018.8417868 (Gomes, 2018b);
▪ Luis Gomes, Filipe Sousa, Zita Vale “An Intelligent Smart Plug with Shared Knowledge Capabilities” in Sensors, vol. 18, pp. 3961, 2018. Doi: 10.3390/s18113961 (IF. 3.031) (Gomes, 2018c);
▪ Luis Gomes, Filipe Sousa, Tiago Pinto, Zita Vale “A Residential House Comparative Case Study Using Market Available Smart Plugs and EnAPlugs with Shared Knowledge” in Energies, vol. 12, pp. 1647. Doi: 10.3390/en12091647 (IF. 2.707) (Gomes, 2019d).
This section demonstrates the application and results of EnAPlugs. A total of three deployments are presented: a deployment for integration tests where EnAPlugs were used as inputs for an energy management system, a deployment showing the ability of EnAPlug to learn for the resource context, and a deployment of multiple EnAPlugs that learn from context and share knowledge among them. This section focuses on the EnAPlug solution, but an integration experimentation can be seen in section IV.4.1, where EnAPlugs are used with S4E solution.
Energy management system integration experimentation with
EnAPlug AM
IV.3.1.1. Deployment
The integration tests of EnAPlug AM were performed using an initial S4E MAS development. The tests presented in this section were submitted and published in the 2018 IEEE 87th Vehicular Technology Conference in the middle of 2018 (end of the second year of the PhD) (Gomes, 2018b). For individual measurements, provided in this experimentation, older datasets were used. These datasets were published in the EPIA 2017 Lecture Notes in Computer Science in the middle of 2017 (second year of PhD) (Gomes, 2017d). The development of EnAPlug AM was finalized and deployed near the middle of 2017, but it was only integrated with third-party systems later that year.
On this deployment, the three systems developed in this PhD research were used: V2R, EnAPlug, and S4E. Additionally, were used conventional smart plugs. The S4E collects data from all resources using HTTP and Modbus/RTU requests, with the exception of V2R emulator that uses Modbus/RTU protocol. Figure 52 shows the representation of this experimentation, where four agents were used to represent four individual houses. These four houses represent a microgrid where S4E was installed.
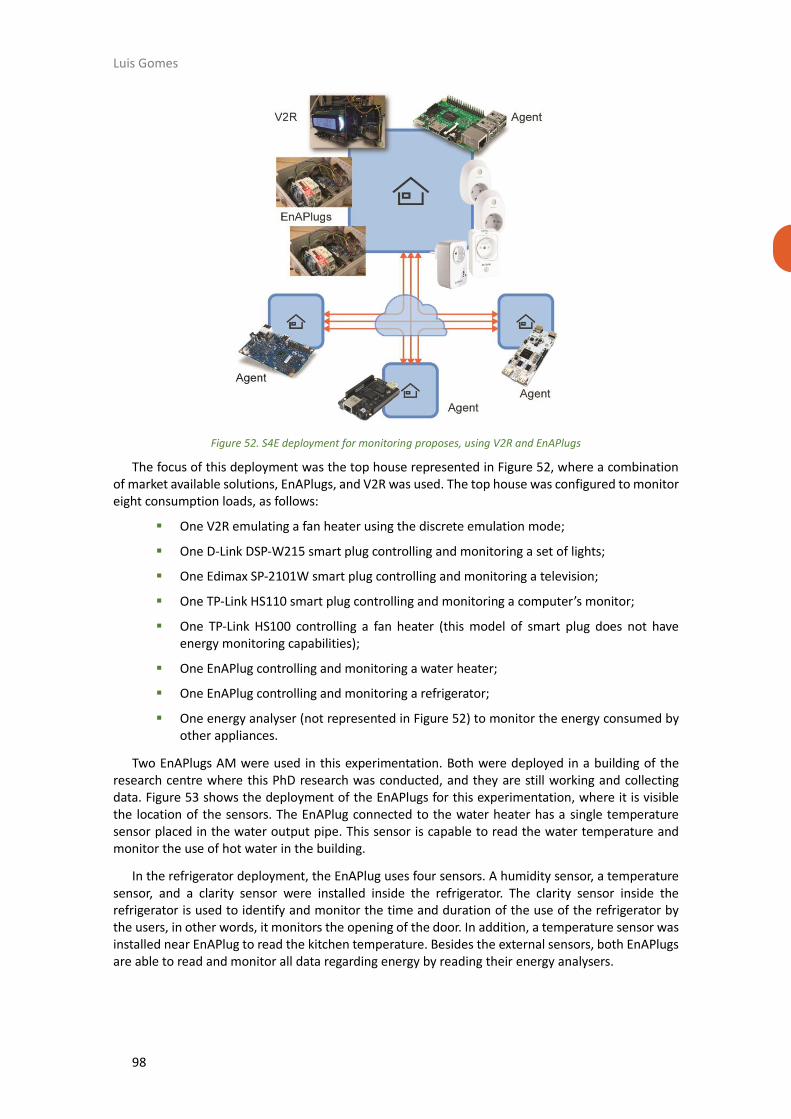
Luis Gomes
98
Figure 52. S4E deployment for monitoring proposes, using V2R and EnAPlugs
The focus of this deployment was the top house represented in Figure 52, where a combination of market available solutions, EnAPlugs, and V2R was used. The top house was configured to monitor eight consumption loads, as follows:
▪ One V2R emulating a fan heater using the discrete emulation mode;
▪ One D-Link DSP-W215 smart plug controlling and monitoring a set of lights;
▪ One Edimax SP-2101W smart plug controlling and monitoring a television;
▪ One TP-Link HS110 smart plug controlling and monitoring a computer’s monitor;
▪ One TP-Link HS100 controlling a fan heater (this model of smart plug does not have energy monitoring capabilities);
▪ One EnAPlug controlling and monitoring a water heater;
▪ One EnAPlug controlling and monitoring a refrigerator;
▪ One energy analyser (not represented in Figure 52) to monitor the energy consumed by other appliances.
Two EnAPlugs AM were used in this experimentation. Both were deployed in a building of the research centre where this PhD research was conducted, and they are still working and collecting data. Figure 53 shows the deployment of the EnAPlugs for this experimentation, where it is visible the location of the sensors. The EnAPlug connected to the water heater has a single temperature sensor placed in the water output pipe. This sensor is capable to read the water temperature and monitor the use of hot water in the building.
In the refrigerator deployment, the EnAPlug uses four sensors. A humidity sensor, a temperature sensor, and a clarity sensor were installed inside the refrigerator. The clarity sensor inside the refrigerator is used to identify and monitor the time and duration of the use of the refrigerator by the users, in other words, it monitors the opening of the door. In addition, a temperature sensor was installed near EnAPlug to read the kitchen temperature. Besides the external sensors, both EnAPlugs are able to read and monitor all data regarding energy by reading their energy analysers.

99
Figure 53. EnAPlugs AM deployment
In building N of ISEP (Porto, Portugal), where both EnAPlugs were deployed, a centralized website was already used to control and monitor the building, Click to Control (C2C). This C2C website uses HTTP requests to communicate with a previously installed SCADA system. And both EnAPlugs were integrated into C2C. The C2C website was developed by the thesis author, although outside of the PhD research.
Figure 54 shows the detailed implementation of EnAPlug in the refrigerator. In Figure 54.a) we can see the inside sensors that were glued near the refrigerator light, in order to have a better reading on the refrigerator light, allowing the detection of light when the door is open. In Figure 54.b), it is EnAPlug AM built in an electrical box (before the creation of the 3D printed model). In Figure 54.c), it is the C2C web interface in its mobile version.
Figure 54. EnAPlug refrigerator deployment: a) inside sensors; b) EnAPlug; c) C2C
In this deployment, the EnAPlug storage unit – located in the cloud – is not used. The S4E agent was directly connected to EnAPlug and read real-time data. The S4E agent was responsible to read and store EnAPlug data. This experimentation has been used to test the reliability of EnAPlug to be used in a third-party real-time monitoring and control software, such as S4E agents.
IV.3.1.2. Data collection
The data was collected and stored in a Raspberry Pi 3 Model B using one-second period readings. The data were stored in a PostgreSQL database and were later converted to an Excel file. Figure 55 shows the monitoring results from 14:00 to 15:00. The results contemplate all the resources measures. However, the consumption values are individually represented by different colours. The load consumption monitored by EnAPlugs is represented in grey.
Because EnAPlug is capable of reading sensor data and not only energy data, S4E agent stored sensor data as well. Figure 56 shows the detail measurements of the refrigerator from 00:00 to 23:59. Figure 57 shows the water heater data for the same period.
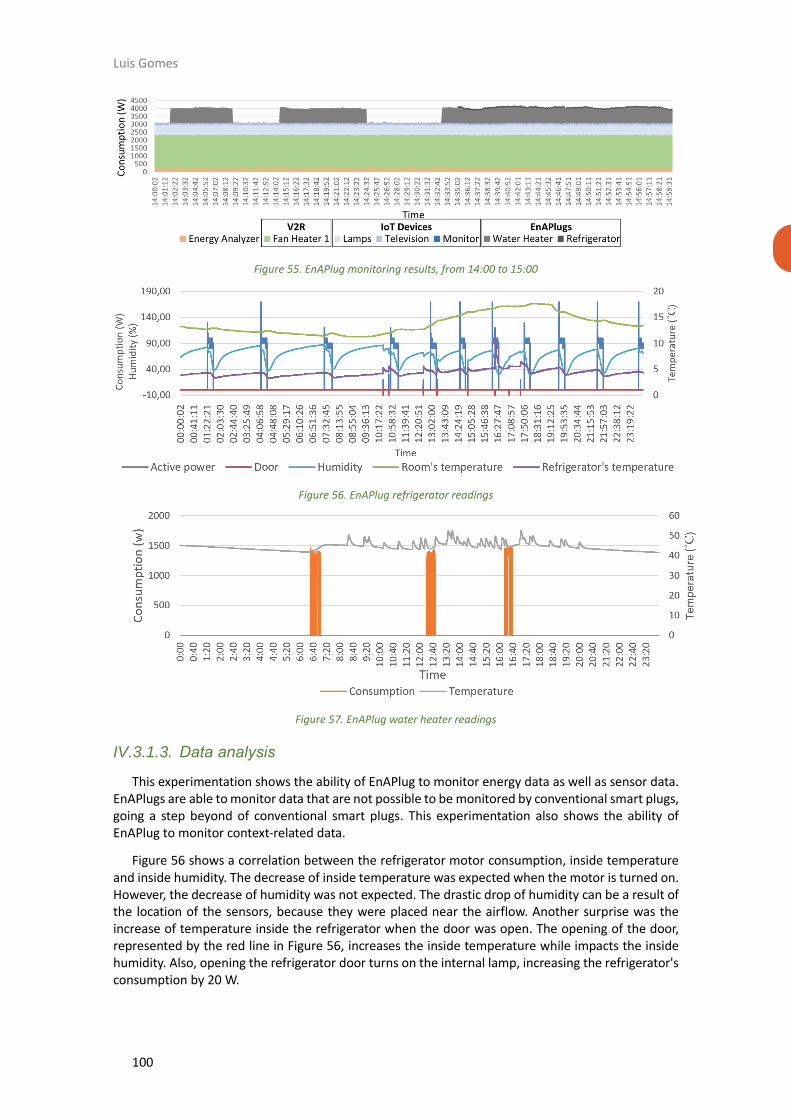
Luis Gomes
100
Figure 55. EnAPlug monitoring results, from 14:00 to 15:00
Figure 56. EnAPlug refrigerator readings
Figure 57. EnAPlug water heater readings
IV.3.1.3. Data analysis
This experimentation shows the ability of EnAPlug to monitor energy data as well as sensor data. EnAPlugs are able to monitor data that are not possible to be monitored by conventional smart plugs, going a step beyond of conventional smart plugs. This experimentation also shows the ability of EnAPlug to monitor context-related data.
Figure 56 shows a correlation between the refrigerator motor consumption, inside temperature and inside humidity. The decrease of inside temperature was expected when the motor is turned on. However, the decrease of humidity was not expected. The drastic drop of humidity can be a result of the location of the sensors, because they were placed near the airflow. Another surprise was the increase of temperature inside the refrigerator when the door was open. The opening of the door, represented by the red line in Figure 56, increases the inside temperature while impacts the inside humidity. Also, opening the refrigerator door turns on the internal lamp, increasing the refrigerator's consumption by 20 W.
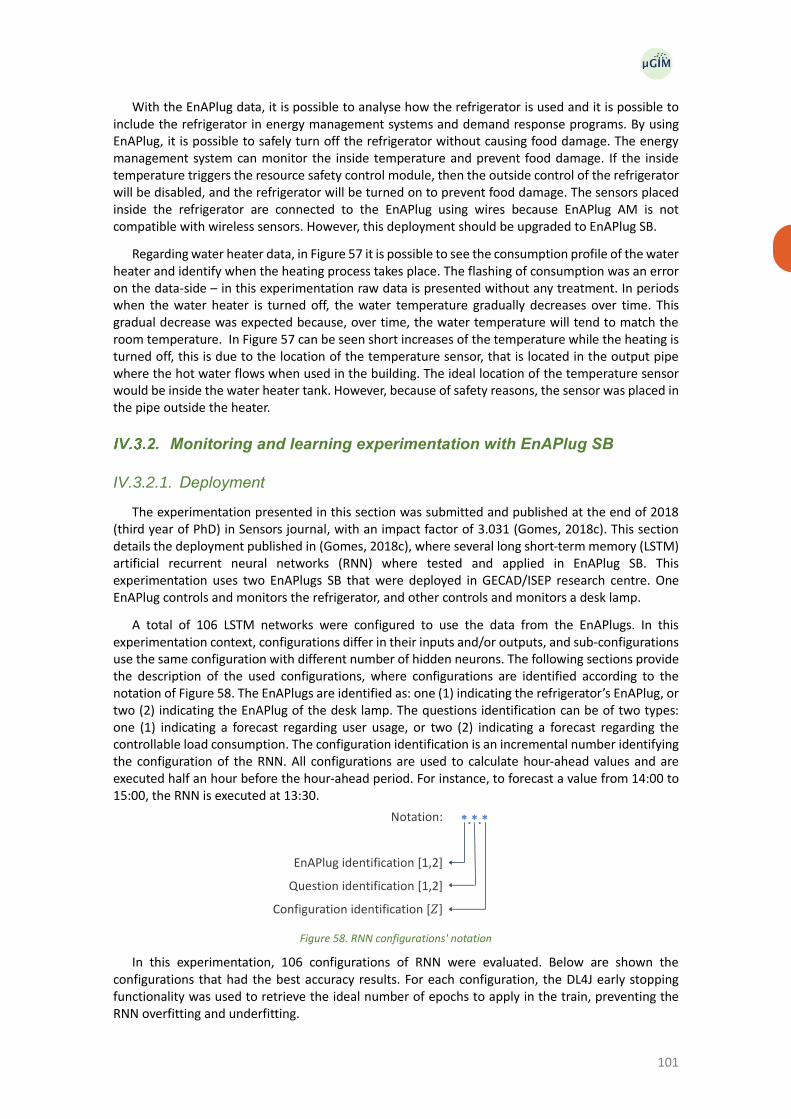
101
With the EnAPlug data, it is possible to analyse how the refrigerator is used and it is possible to include the refrigerator in energy management systems and demand response programs. By using EnAPlug, it is possible to safely turn off the refrigerator without causing food damage. The energy management system can monitor the inside temperature and prevent food damage. If the inside temperature triggers the resource safety control module, then the outside control of the refrigerator will be disabled, and the refrigerator will be turned on to prevent food damage. The sensors placed inside the refrigerator are connected to the EnAPlug using wires because EnAPlug AM is not compatible with wireless sensors. However, this deployment should be upgraded to EnAPlug SB.
Regarding water heater data, in Figure 57 it is possible to see the consumption profile of the water heater and identify when the heating process takes place. The flashing of consumption was an error on the data-side – in this experimentation raw data is presented without any treatment. In periods when the water heater is turned off, the water temperature gradually decreases over time. This gradual decrease was expected because, over time, the water temperature will tend to match the room temperature. In Figure 57 can be seen short increases of the temperature while the heating is turned off, this is due to the location of the temperature sensor, that is located in the output pipe where the hot water flows when used in the building. The ideal location of the temperature sensor would be inside the water heater tank. However, because of safety reasons, the sensor was placed in the pipe outside the heater.
Monitoring and learning experimentation with EnAPlug SB
IV.3.2.1. Deployment
The experimentation presented in this section was submitted and published at the end of 2018 (third year of PhD) in Sensors journal, with an impact factor of 3.031 (Gomes, 2018c). This section details the deployment published in (Gomes, 2018c), where several long short-term memory (LSTM) artificial recurrent neural networks (RNN) where tested and applied in EnAPlug SB. This experimentation uses two EnAPlugs SB that were deployed in GECAD/ISEP research centre. One EnAPlug controls and monitors the refrigerator, and other controls and monitors a desk lamp.
A total of 106 LSTM networks were configured to use the data from the EnAPlugs. In this experimentation context, configurations differ in their inputs and/or outputs, and sub-configurations use the same configuration with different number of hidden neurons. The following sections provide the description of the used configurations, where configurations are identified according to the notation of Figure 58. The EnAPlugs are identified as: one (1) indicating the refrigerator’s EnAPlug, or two (2) indicating the EnAPlug of the desk lamp. The questions identification can be of two types: one (1) indicating a forecast regarding user usage, or two (2) indicating a forecast regarding the controllable load consumption. The configuration identification is an incremental number identifying the configuration of the RNN. All configurations are used to calculate hour-ahead values and are executed half an hour before the hour-ahead period. For instance, to forecast a value from 14:00 to 15:00, the RNN is executed at 13:30.
Figure 58. RNN configurations' notation
In this experimentation, 106 configurations of RNN were evaluated. Below are shown the configurations that had the best accuracy results. For each configuration, the DL4J early stopping functionality was used to retrieve the ideal number of epochs to apply in the train, preventing the RNN overfitting and underfitting.

Luis Gomes
102
Refrigerator
The refrigerator deployment is the same as the one presented in the previous experimentation. The refrigerator is located inside the kitchen of one of the buildings of the research centre where this PhD research was conducted. The EnAPlug, beyond energy values, uses a total of four sensors: an outside temperature sensor to measure the kitchen temperature, an inside temperature sensor to measure the refrigerator temperature, an inside humidity sensor, and an inside clarity sensor. The clarity sensor data is converted inside the EnAPlug to result in a status value indicating if the door is open or not. The tracking of the door could also be provided by analysing the inside temperature or humidity sensors, but that would require a more complex data analysis.
Table 7 presents seven configurations tested in the refrigerator. They are separated in two types: RNN for user interaction forecast (from 1.1.1 to 1.1.3), and RNN for resource consumption (from 1.2.1 to 1.2.4). The user interaction forecast provides EnAPlug with an answer to question iv of Table 3: “will there be users near the controllable load in the next hour?”. The resource consumption forecast provides an answer to question iii of Table 3: “will the controllable load be used in the next hour?”. For the refrigerator, it is considered that a user is near the resource if the door is open. For question iii, it is considered that the refrigerator is used if the motor is consuming energy. The idea behind question iii is to understand if the controllable load will have consumption during the next hour.
The three first configurations of Table 7 have a binary output where the RNN results in a forecasted value indicating if the door will, or will not, be opened during the next hour (i.e., if the refrigerator will, or will not, be used by a person, two answer question iv). Configurations 1.2.1 and 1.2.2 also have a binary result indicating if the motor will, or will not, have consumption during the next hour. The last two configurations of Table 7 have an output with four possible values, indicating: if the motor will not have any consumption during the entire hour, if the motor will have consumption in the first half-hour, if the motor will have consumption in the second half-hour, and if the motor will have consumption in the first and second half-hour.
A total of eleven configurations were tested for the refrigerator. Table 7 shows the seven best configurations, according to their accuracy. All sensor data monitored by EnAPlug were used as inputs for the RNNs. Sensor data that are not shows, in the Table 7 configurations, means that their use did not improve the forecast accuracy.
Table 7. RNN configurations for the refrigerator EnAPlug forecast
Configuration 1.1.1 Inputs Output
• [0–23] – hour of the day • [1–7] – day of the week • [0,1] – if the door was opened in the previous
hour
• [0,1] – if the user will open, or not, the
refrigerator
Configuration 1.1.2
Inputs Output
• [0–23] – hour of the day • [0,1] – if week or weekend • [0,1] – if the door was opened in the previous
hour
• [0,1] - if the user will open, or not, the
refrigerator
Configuration 1.1.3
Inputs Output • [0–23] – hour of the day • [0,1] – if week or weekend
• [0,1] – if the user will open, or not, the
refrigerator
Configuration 1.2.1
Inputs Output
• kWh – consumption in last 30 min • °C – refrigerator’s temperature • °C – room temperature
• [0,1] – if refrigerator motor will have
consumption

103
Configuration 1.2.2
Inputs Output
• °C – refrigerator’s temperature • °C – room temperature
• [0,1] – if refrigerator motor will have
consumption
Configuration 1.2.3
Inputs Output
• [0–23] – hour of the day • [0,1] – if week or weekend • [0,1] – if the door was opened in the
last 15 min • kWh – consumption in last 15 min • kWh – consumptions in second to
last 15 min • °C – refrigerator temperature • % – refrigerator humidity • °C – room temperature
• [0–3] – if refrigerator motor will have
consumption in the first half hour or/and in
the second half hour (i.e., 0: will not have
consumption; 1: will have consumption in the
first half; 2: will have consumption in the
second half; 3 will have consumption in first
and second half)
Configuration 1.2.4
Inputs Output
• [0–23] – hour of the day • kWh – consumption in last 30 min • °C – refrigerator temperature • % – refrigerator humidity • °C – room temperature
• [0–3] – if refrigerator motor will have
consumption in the first half hour or/and in
the second half hour (i.e., 0: will not have
consumption; 1: will have consumption in the
first half; 2: will have consumption in the
second half; 3 will have consumption in first
and second half)
Desk lamp
In this experimentation, a dimmable desk lamp was connected in an EnAPlug. This EnAPlug was slightly modified to accommodate a HUB of sensors that were previously developed and deployed in the desk. The sensor HUB can measure light intensity, room temperature, and user presence. The user presence uses a combination of a movement sensor and usage of computer mouse and keyboard. In a desk, it is not feasible to have only movement sensors because of its precision/sensibility. More about this sensor HUB can be seen in the publication of Future Internet journal (Gomes, 2019c), made by the thesis author in early 2019 (third year of PhD).
In the desk lamp, the lamp is turned on if a person is there, and it is turned off when there is no person in the desk. Therefore, by answering question iii (if the controllable load will be used), it is possible to infer the answer of question iv (if there will be users near the controllable load). The configuration notation of the RNN of the desk lamp uses a zero (0) as question identification, to represent the answer to both questions. Five configurations were tested, and the top-three are presented in Table 8, according to their accuracy. The output of the tested configurations is a single binary value indicating if the user will, or will not, be using the controllable load.
Table 8. RNN configurations for the desk lamp EnAPlug forecast
Configuration 2.0.1
Inputs Output
• [0–23] – hour of the day • [0,1] – if week or weekend • lux – luminosity near the desk • °C – temperature • [0,1] – presence sensor in the last 30 min
• [0,1] – if the user will, or not, use the desk,
resulting in electrical consumption
Configuration 2.0.2
Inputs Output
• [0–23] – hour of the day • lux – luminosity near the desk • °C – temperature
• [0,1] – if the user will, or not, use the desk,
resulting in electrical consumption
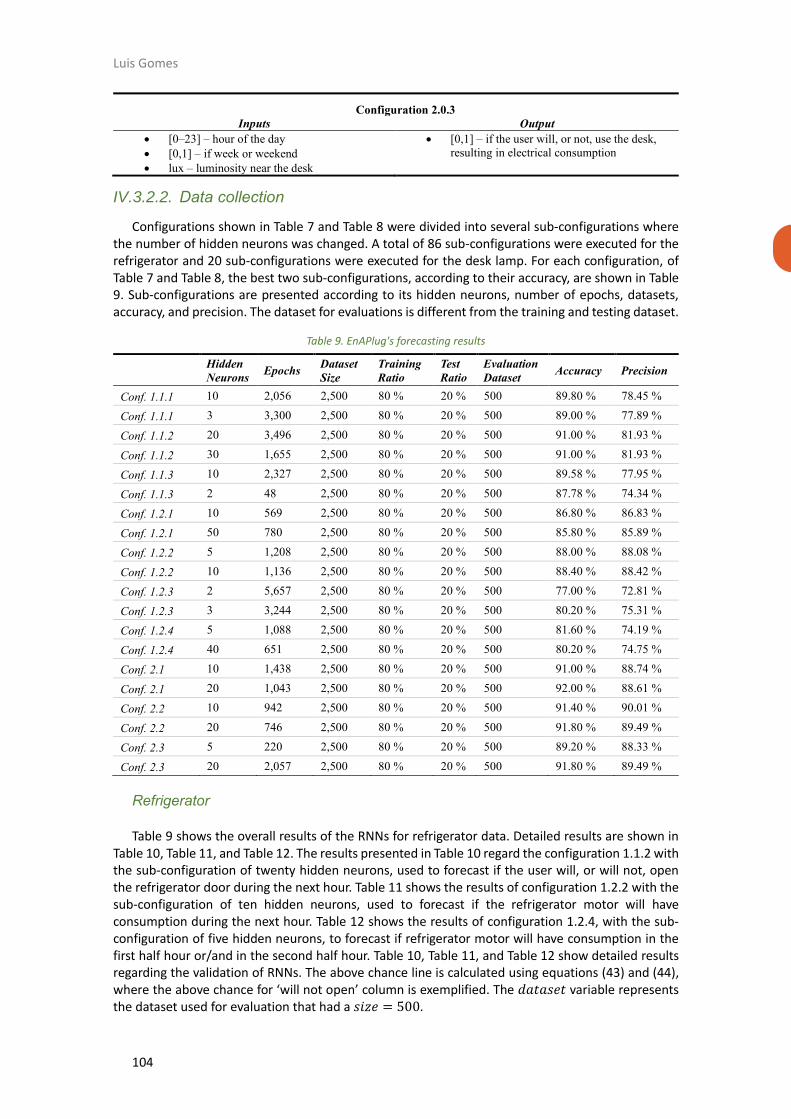
Luis Gomes
104
Configuration 2.0.3
Inputs Output
• [0–23] – hour of the day • [0,1] – if week or weekend • lux – luminosity near the desk
• [0,1] – if the user will, or not, use the desk,
resulting in electrical consumption
IV.3.2.2. Data collection
Configurations shown in Table 7 and Table 8 were divided into several sub-configurations where the number of hidden neurons was changed. A total of 86 sub-configurations were executed for the refrigerator and 20 sub-configurations were executed for the desk lamp. For each configuration, of Table 7 and Table 8, the best two sub-configurations, according to their accuracy, are shown in Table 9. Sub-configurations are presented according to its hidden neurons, number of epochs, datasets, accuracy, and precision. The dataset for evaluations is different from the training and testing dataset.
Table 9. EnAPlug's forecasting results
Hidden
Neurons Epochs
Dataset
Size
Training
Ratio
Test
Ratio
Evaluation
Dataset Accuracy Precision
Conf. 1.1.1 10 2,056 2,500 80 % 20 % 500 89.80 % 78.45 %
Conf. 1.1.1 3 3,300 2,500 80 % 20 % 500 89.00 % 77.89 %
Conf. 1.1.2 20 3,496 2,500 80 % 20 % 500 91.00 % 81.93 %
Conf. 1.1.2 30 1,655 2,500 80 % 20 % 500 91.00 % 81.93 %
Conf. 1.1.3 10 2,327 2,500 80 % 20 % 500 89.58 % 77.95 %
Conf. 1.1.3 2 48 2,500 80 % 20 % 500 87.78 % 74.34 %
Conf. 1.2.1 10 569 2,500 80 % 20 % 500 86.80 % 86.83 %
Conf. 1.2.1 50 780 2,500 80 % 20 % 500 85.80 % 85.89 %
Conf. 1.2.2 5 1,208 2,500 80 % 20 % 500 88.00 % 88.08 %
Conf. 1.2.2 10 1,136 2,500 80 % 20 % 500 88.40 % 88.42 %
Conf. 1.2.3 2 5,657 2,500 80 % 20 % 500 77.00 % 72.81 %
Conf. 1.2.3 3 3,244 2,500 80 % 20 % 500 80.20 % 75.31 %
Conf. 1.2.4 5 1,088 2,500 80 % 20 % 500 81.60 % 74.19 %
Conf. 1.2.4 40 651 2,500 80 % 20 % 500 80.20 % 74.75 %
Conf. 2.1 10 1,438 2,500 80 % 20 % 500 91.00 % 88.74 %
Conf. 2.1 20 1,043 2,500 80 % 20 % 500 92.00 % 88.61 %
Conf. 2.2 10 942 2,500 80 % 20 % 500 91.40 % 90.01 %
Conf. 2.2 20 746 2,500 80 % 20 % 500 91.80 % 89.49 %
Conf. 2.3 5 220 2,500 80 % 20 % 500 89.20 % 88.33 %
Conf. 2.3 20 2,057 2,500 80 % 20 % 500 91.80 % 89.49 %
Refrigerator
Table 9 shows the overall results of the RNNs for refrigerator data. Detailed results are shown in Table 10, Table 11, and Table 12. The results presented in Table 10 regard the configuration 1.1.2 with the sub-configuration of twenty hidden neurons, used to forecast if the user will, or will not, open the refrigerator door during the next hour. Table 11 shows the results of configuration 1.2.2 with the sub-configuration of ten hidden neurons, used to forecast if the refrigerator motor will have consumption during the next hour. Table 12 shows the results of configuration 1.2.4, with the sub-configuration of five hidden neurons, to forecast if refrigerator motor will have consumption in the first half hour or/and in the second half hour. Table 10, Table 11, and Table 12 show detailed results regarding the validation of RNNs. The above chance line is calculated using equations (43) and (44), where the above chance for ‘will not open’ column is exemplified. The 𝑑𝑎𝑡𝑎𝑠𝑒𝑡 variable represents the dataset used for evaluation that had a 𝑠𝑖𝑧𝑒 = 500.
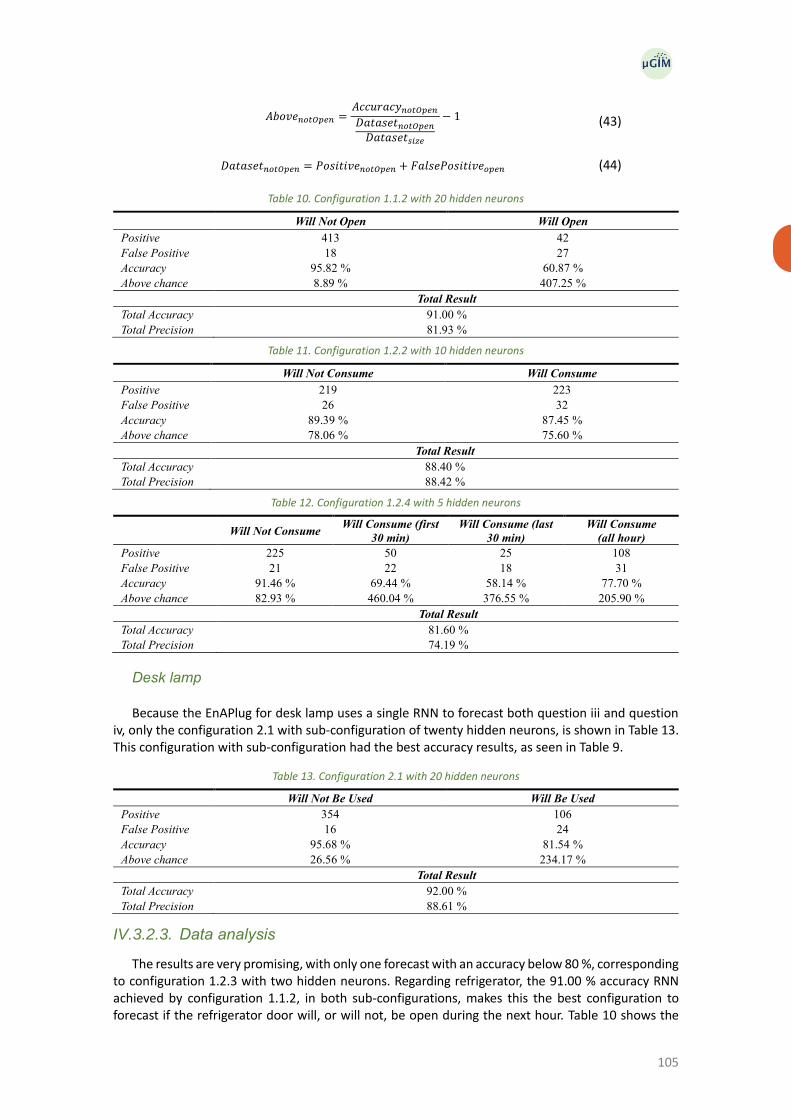
105
𝐴𝑏𝑜𝑣𝑒𝑛𝑜𝑡𝑂𝑝𝑒𝑛 =𝐴𝑐𝑐𝑢𝑟𝑎𝑐𝑦𝑛𝑜𝑡𝑂𝑝𝑒𝑛𝐷𝑎𝑡𝑎𝑠𝑒𝑡𝑛𝑜𝑡𝑂𝑝𝑒𝑛𝐷𝑎𝑡𝑎𝑠𝑒𝑡𝑠𝑖𝑧𝑒
− 1 (43)
𝐷𝑎𝑡𝑎𝑠𝑒𝑡𝑛𝑜𝑡𝑂𝑝𝑒𝑛 = 𝑃𝑜𝑠𝑖𝑡𝑖𝑣𝑒𝑛𝑜𝑡𝑂𝑝𝑒𝑛 + 𝐹𝑎𝑙𝑠𝑒𝑃𝑜𝑠𝑖𝑡𝑖𝑣𝑒𝑜𝑝𝑒𝑛 (44)
Table 10. Configuration 1.1.2 with 20 hidden neurons
Will Not Open Will Open
Positive 413 42 False Positive 18 27 Accuracy 95.82 % 60.87 % Above chance 8.89 % 407.25 %
Total Result
Total Accuracy 91.00 % Total Precision 81.93 %
Table 11. Configuration 1.2.2 with 10 hidden neurons
Will Not Consume Will Consume
Positive 219 223 False Positive 26 32 Accuracy 89.39 % 87.45 % Above chance 78.06 % 75.60 %
Total Result
Total Accuracy 88.40 % Total Precision 88.42 %
Table 12. Configuration 1.2.4 with 5 hidden neurons
Will Not Consume Will Consume (first
30 min) Will Consume (last
30 min) Will Consume
(all hour) Positive 225 50 25 108 False Positive 21 22 18 31 Accuracy 91.46 % 69.44 % 58.14 % 77.70 % Above chance 82.93 % 460.04 % 376.55 % 205.90 %
Total Result
Total Accuracy 81.60 % Total Precision 74.19 %
Desk lamp
Because the EnAPlug for desk lamp uses a single RNN to forecast both question iii and question iv, only the configuration 2.1 with sub-configuration of twenty hidden neurons, is shown in Table 13. This configuration with sub-configuration had the best accuracy results, as seen in Table 9.
Table 13. Configuration 2.1 with 20 hidden neurons
Will Not Be Used Will Be Used
Positive 354 106 False Positive 16 24 Accuracy 95.68 % 81.54 % Above chance 26.56 % 234.17 %
Total Result
Total Accuracy 92.00 % Total Precision 88.61 %
IV.3.2.3. Data analysis
The results are very promising, with only one forecast with an accuracy below 80 %, corresponding to configuration 1.2.3 with two hidden neurons. Regarding refrigerator, the 91.00 % accuracy RNN achieved by configuration 1.1.2, in both sub-configurations, makes this the best configuration to forecast if the refrigerator door will, or will not, be open during the next hour. Table 10 shows the
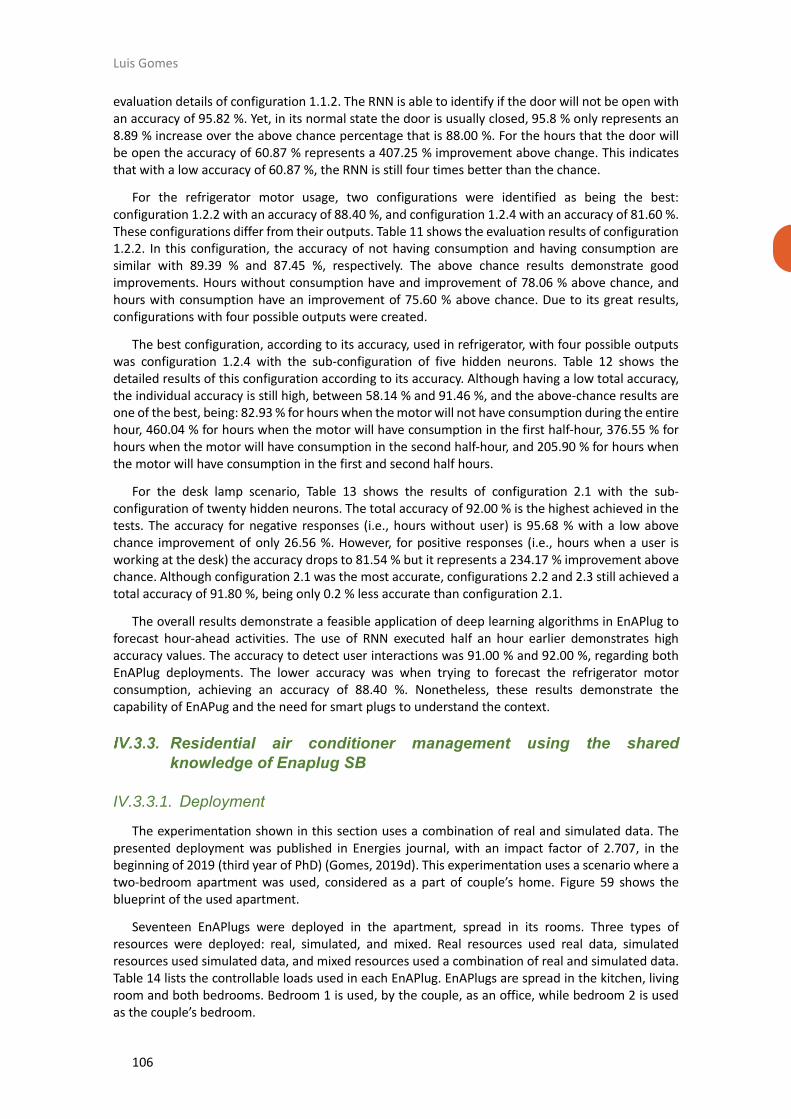
Luis Gomes
106
evaluation details of configuration 1.1.2. The RNN is able to identify if the door will not be open with an accuracy of 95.82 %. Yet, in its normal state the door is usually closed, 95.8 % only represents an 8.89 % increase over the above chance percentage that is 88.00 %. For the hours that the door will be open the accuracy of 60.87 % represents a 407.25 % improvement above change. This indicates that with a low accuracy of 60.87 %, the RNN is still four times better than the chance.
For the refrigerator motor usage, two configurations were identified as being the best: configuration 1.2.2 with an accuracy of 88.40 %, and configuration 1.2.4 with an accuracy of 81.60 %. These configurations differ from their outputs. Table 11 shows the evaluation results of configuration 1.2.2. In this configuration, the accuracy of not having consumption and having consumption are similar with 89.39 % and 87.45 %, respectively. The above chance results demonstrate good improvements. Hours without consumption have and improvement of 78.06 % above chance, and hours with consumption have an improvement of 75.60 % above chance. Due to its great results, configurations with four possible outputs were created.
The best configuration, according to its accuracy, used in refrigerator, with four possible outputs was configuration 1.2.4 with the sub-configuration of five hidden neurons. Table 12 shows the detailed results of this configuration according to its accuracy. Although having a low total accuracy, the individual accuracy is still high, between 58.14 % and 91.46 %, and the above-chance results are one of the best, being: 82.93 % for hours when the motor will not have consumption during the entire hour, 460.04 % for hours when the motor will have consumption in the first half-hour, 376.55 % for hours when the motor will have consumption in the second half-hour, and 205.90 % for hours when the motor will have consumption in the first and second half hours.
For the desk lamp scenario, Table 13 shows the results of configuration 2.1 with the sub-configuration of twenty hidden neurons. The total accuracy of 92.00 % is the highest achieved in the tests. The accuracy for negative responses (i.e., hours without user) is 95.68 % with a low above chance improvement of only 26.56 %. However, for positive responses (i.e., hours when a user is working at the desk) the accuracy drops to 81.54 % but it represents a 234.17 % improvement above chance. Although configuration 2.1 was the most accurate, configurations 2.2 and 2.3 still achieved a total accuracy of 91.80 %, being only 0.2 % less accurate than configuration 2.1.
The overall results demonstrate a feasible application of deep learning algorithms in EnAPlug to forecast hour-ahead activities. The use of RNN executed half an hour earlier demonstrates high accuracy values. The accuracy to detect user interactions was 91.00 % and 92.00 %, regarding both EnAPlug deployments. The lower accuracy was when trying to forecast the refrigerator motor consumption, achieving an accuracy of 88.40 %. Nonetheless, these results demonstrate the capability of EnAPug and the need for smart plugs to understand the context.
Residential air conditioner management using the shared
knowledge of Enaplug SB
IV.3.3.1. Deployment
The experimentation shown in this section uses a combination of real and simulated data. The presented deployment was published in Energies journal, with an impact factor of 2.707, in the beginning of 2019 (third year of PhD) (Gomes, 2019d). This experimentation uses a scenario where a two-bedroom apartment was used, considered as a part of couple’s home. Figure 59 shows the blueprint of the used apartment.
Seventeen EnAPlugs were deployed in the apartment, spread in its rooms. Three types of resources were deployed: real, simulated, and mixed. Real resources used real data, simulated resources used simulated data, and mixed resources used a combination of real and simulated data. Table 14 lists the controllable loads used in each EnAPlug. EnAPlugs are spread in the kitchen, living room and both bedrooms. Bedroom 1 is used, by the couple, as an office, while bedroom 2 is used as the couple’s bedroom.
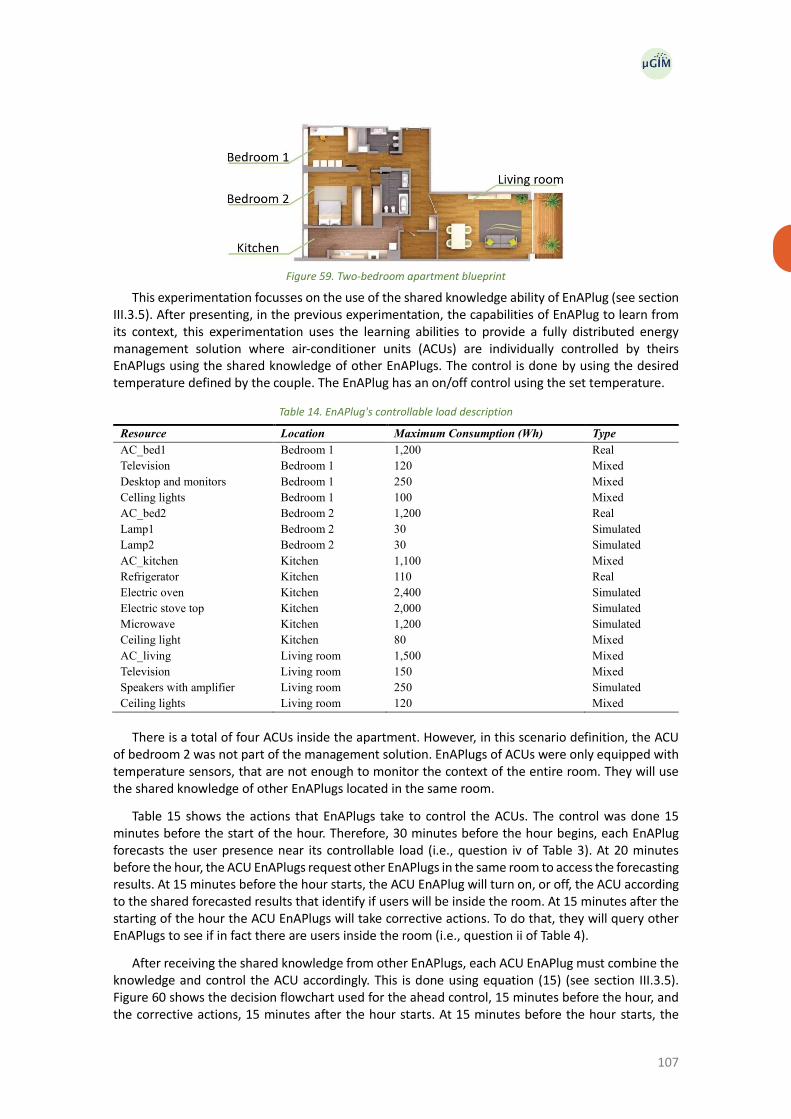
107
Figure 59. Two-bedroom apartment blueprint
This experimentation focusses on the use of the shared knowledge ability of EnAPlug (see section III.3.5). After presenting, in the previous experimentation, the capabilities of EnAPlug to learn from its context, this experimentation uses the learning abilities to provide a fully distributed energy management solution where air-conditioner units (ACUs) are individually controlled by theirs EnAPlugs using the shared knowledge of other EnAPlugs. The control is done by using the desired temperature defined by the couple. The EnAPlug has an on/off control using the set temperature.
Table 14. EnAPlug's controllable load description
Resource Location Maximum Consumption (Wh) Type
AC_bed1 Bedroom 1 1,200 Real
Television Bedroom 1 120 Mixed
Desktop and monitors Bedroom 1 250 Mixed
Celling lights Bedroom 1 100 Mixed
AC_bed2 Bedroom 2 1,200 Real
Lamp1 Bedroom 2 30 Simulated
Lamp2 Bedroom 2 30 Simulated
AC_kitchen Kitchen 1,100 Mixed
Refrigerator Kitchen 110 Real
Electric oven Kitchen 2,400 Simulated
Electric stove top Kitchen 2,000 Simulated
Microwave Kitchen 1,200 Simulated
Ceiling light Kitchen 80 Mixed
AC_living Living room 1,500 Mixed
Television Living room 150 Mixed
Speakers with amplifier Living room 250 Simulated
Ceiling lights Living room 120 Mixed
There is a total of four ACUs inside the apartment. However, in this scenario definition, the ACU of bedroom 2 was not part of the management solution. EnAPlugs of ACUs were only equipped with temperature sensors, that are not enough to monitor the context of the entire room. They will use the shared knowledge of other EnAPlugs located in the same room.
Table 15 shows the actions that EnAPlugs take to control the ACUs. The control was done 15 minutes before the start of the hour. Therefore, 30 minutes before the hour begins, each EnAPlug forecasts the user presence near its controllable load (i.e., question iv of Table 3). At 20 minutes before the hour, the ACU EnAPlugs request other EnAPlugs in the same room to access the forecasting results. At 15 minutes before the hour starts, the ACU EnAPlug will turn on, or off, the ACU according to the shared forecasted results that identify if users will be inside the room. At 15 minutes after the starting of the hour the ACU EnAPlugs will take corrective actions. To do that, they will query other EnAPlugs to see if in fact there are users inside the room (i.e., question ii of Table 4).
After receiving the shared knowledge from other EnAPlugs, each ACU EnAPlug must combine the knowledge and control the ACU accordingly. This is done using equation (15) (see section III.3.5). Figure 60 shows the decision flowchart used for the ahead control, 15 minutes before the hour, and the corrective actions, 15 minutes after the hour starts. At 15 minutes before the hour starts, the

Luis Gomes
108
ACU is turned on, or it is kept on, if the combined probability of having persons inside the room is higher than 80 %. For correction actions, no forecasted values were used, it was used question viii (Table 4) – if there are users inside the room – answered by equation (11).
Table 15. ACU EnAPlug step actions
Time (minutes) Action
ℎ − 30𝑚𝑖𝑛𝑡𝑢𝑒𝑠 Each EnAPlug forecasts user presence for the period between ℎ to h+1ℎ𝑜𝑢𝑟
ℎ − 20𝑚𝑖𝑛𝑡𝑢𝑒𝑠 ACU EnAPlugs requires the answers to question iv to each EnAPlug in their
location ℎ − 15𝑚𝑖𝑛𝑡𝑢𝑒𝑠 ACU EnAPlugs take on/off control actions
ℎ + 15𝑚𝑖𝑛𝑡𝑢𝑒𝑠 ACU EnAPlugs take corrective actions
where h is the hour to control {ℎ ∈ 𝑍: 0 ≤ ℎ ≤ 23}
This experimentation was created having in mind a working couple where at least one of them can lunch at home. The following routine profile was created as a case study for this experimentation:
▪ 08:00 – wake up;
▪ 09:00 – leave to work;
▪ 13:00 – getting home to cook and having lunch, taking approximately one hour;
▪ 18:00 – arriving at home;
▪ 20:00 – cooking and having dinner;
▪ 24:00 – go to bed.
Figure 60. ACU EnAPlug control decision
IV.3.3.2. Data collection
This experimentation resulted in three datasets representing the couple’s profile in three scenarios: normal profile without the use of smart plugs nor EnAPlugs, smart plug scenario using conventional smart plugs, and EnAPlug scenario using EnAPlugs with share knowledge. The rules of those scenarios are:
▪ Normal profile – daily consumption without the application of any smart plug nor EnAPlug, where all ACUs were turned on when there are people at one (with exception of lunch time), from 18:00 till 8:59;
▪ Smart plug scenario – scenario where smart plugs were connected to the ACU and where users can easily control them with voice commands, this helped the couple to turn on and off ACUs without much work, therefore, they can start turning the kitchen ACU during lunch time with simple voice routines, such as:

109
o Welcome home – turns on the ACU of bedroom 1 and living room;
o Mealtime – turns on the ACU of the kitchen;
o Close the kitchen – turns off the ACU of the kitchen;
o Bedtime – turns off the ACU of bedroom 1 and living room.
▪ EnAPlug scenario – scenario where EnAPlugs were deployed and where the ACU EnAPlugs controlled the ACU using share knowledge.
Figure 61 shows the 𝛽𝑟𝑜𝑜𝑚1 probabilities for the 24-hour period resulted from the EnAPlug
scenario. Values above 80 % resulted in the turning on of the room’s ACU, while values equal or below 80 % resulted in the turning off of the room’s ACU. The shared knowledge of the congregation is used to calculate the 𝛽𝑟𝑜𝑜𝑚
1 . The knowledge is only shared among EnAPlugs located in the same room.
Figure 61. 𝛽𝑟𝑜𝑜𝑚1 for each room at each time (0 %-100 %)
In Table 16 details how 𝛽𝑟𝑜𝑜𝑚1 was calculated inside bedroom 1, kitchen, and living room. The
forecasted result column shows the individual forecasted value of each EnAplug inside the room. 𝐸𝑖1
is the individual probability of each EnAPlug to have a person near its controllable load.
Table 16. 𝛽𝑟𝑜𝑜𝑚1 for each room at 20:00
Room Forecast result 1 𝐸𝑖1 𝛽𝑟𝑜𝑜𝑚
1
Bedroom 1 1, 1, 1 85 %, 85 %, 85 % 99.66 %
Kitchen 1, 1, 1, 0, 0 85 %, 85 %, 85 %, 15 %, 15 %, 15 % 99.76 %
Living room 0, 0, 1 15 %, 15 %, 85 % 89.16 %
1 0: forecasted that there will not be users near the controllable load;
1: forecasted that there will be users near the controllable load.
Figure 62 shows the results of the three scenarios regarding energy consumption. The total consumptions of the scenarios are represented in bars, and the ACUs’ consumption is represented in lines. In Figure 62, consumption is aggregated in hours (Wh).
Figure 62. Two-bedroom apartment hourly consumption

Luis Gomes
110
Using the results of Figure 62, it is possible to extrapolate a monthly cost for the three scenarios. Table 17 shows the monthly energy costs having into account the 2017 average price of 0.20 EUR per kWh in the European Union (Eurostat, 2018). The smart plugs relation column defines the increase or decrease of price having the smart plug scenario as the base.
Table 17. Two-bedroom apartment monthly result
Scenarios Monthly Energy Monthly Price Profile Relation Smart Plugs Relation
Profile 436 kWh 87.09 € 0.0 % -34.2 %
Smart Plugs 325 kWh 64.89 € 25.5 % 0.0%
EnAPlugs 280 kWh 56.07 € 35.6 % 13.6 %
IV.3.3.3. Data analysis
The data collection demonstrated the ability of EnAPlug to produce resource optimization that resulted in a decrease of consumption and therefore energy cost. Figure 62 shows a 24-hour graph comparing the normal profile, the use of conventional smart plugs and the use of EnAPlugs. Because EnAPlug starts 15 minutes before the hour, it has an early starting point that cannot be seen in the other scenarios. By analysing the lunch hour, at 13:00, it is possible to see the changes in the three scenarios. In the normal profile the users do not control the ACUs, but using the voice assistant control, users turn on the kitchen ACU when they arrive at house. Because EnAPlug is able to learn the users profile and forecast, using RNN, the user presence during lunchtime, it starts the ACU 15 minutes before 13:00 (i.e., at 12:45). The forecast for 14:00 indicates that no persons will be at the room and consequently the ACU is turned off at 13:45. The ability of EnAPlug to control the ACU 15 minutes ahead of time helps the ACU to reaches the couple desirable temperature before they arrive. Yet, from 12:45 and 14:00, the ACU time-of-use and energy consumption is the same in both scenarios of smart plugs and EnAPlugs.
In EnAPlug scenario, during the night, the forecast indicates no presence of users and all ACUs are turned off at 00:45. In the smart plug scenario, the ACUs are turned off at 00:59. Because the bedroom 2 ACU was not part of EnAPlug optimization and because it was not controllable using the voice control “bedtime”, it stays turned on until morning, when the couple leaves the house.
A closer look at 18:00, with the help of Figure 61 and Figure 62, allows a better differentiation between scenarios. At 17:30 all EnAPlugs forecast the presence of users near the controllable loads.
And at 17:45 the shared knowledge is aggregated and only bedroom 1 reaches a 𝛽𝑟𝑜𝑜𝑚1 of 98.09 %,
above the triggering value of 80 %, as seen in Figure 61. This results in turning on the ACU of bedroom 1. All others are kept turned off. At the same time, in the smart plug scenario, it was used the voice command “welcome home” that turns on the bedroom 1 and living room ACUs. At the same time, in the normal profile scenario, all ACUs were turned on.
Table 16 shows the 𝛽𝑟𝑜𝑜𝑚1 results for hour 20:00. In the kitchen, where five EnAPlugs were
deployed, only three forecasted the presence of users inside the room. Yet, because of their accuracy, the two EnAPlugs that forecasted that no user will be inside the room still have 15 % of probability of being wrong. This means that there is still 15 % probability of having a user inside the room. Even with two negative answers, the kitchen has 99,76 % probability of having users inside. This is a higher probability than the bedroom, 99.66 %, where all EnAPlugs forecasted the presence of users.
The monthly energy consumption and monthly energy cost indicate a clear benefit of using EnAPlugs. Table 17 shows the results for energy costs. Having the normal profile as a base, the smart plug profile represents a 25.5 % reduction of costs, while the EnAPlugs scenario represents a 35.6 % reduction, an improvement of 13.6 % relative to the smart plug scenario.
This experimentation shows very promising results in the deployment of EnAPlugs in buildings. However, as seen in the kitchen results of Table 16, the increase of EnAPlugs brings a problem in its
minimum value of 𝛽𝑟𝑜𝑜𝑚1 . Dealing with accuracy, equation (15) aggregates all errors in the accuracy
of each EnAPlug. Therefore, the minimum value of 𝛽𝑟𝑜𝑜𝑚1 will increase in locations where a high

111
concentration of EnAPlugs is deployed. Let’s demonstrate two examples that show this problem. Within a room with three EnAPlugs with 90 % accuracy, if all of them forecast that no user will be near the controllable loads, then there is still a probability of 27 % of a user actually appear inside the room. If three more EnAPlugs are added to this room, with the same 90 % accuracy, and now all six EnAPlugs forecast that no user will be near the controllable loads, this will result in a 𝛽1𝑟𝑜𝑜𝑚 =
47 %. The addition of EnAPlugs creates more noise and error. This issue was bypassed increasing the control target to turn on any ACU – that was 80 %. But future work should solve this issue to not harmful the use and deployment of EnAPlugs.
IV.4. S4E experimentations
S4E software is the main result of this PhD research. By deploying multiple S4E agents in buildings, it is possible to build a distributed microgrid management system capable of managing buildings and put them cooperating and competing to balance the microgrid. Because this was the main system of this PhD research, its conception, development, and implementation took more time than V2R and EnAPlug, and its results were only possible to obtain near the end of this PhD research. The target publications were exclusively international journals. The late results added to the journals response time culminated in a scenario where not all S4E results were able to be published in time. Some publications are still in the revision stage. The list of publications is:
▪ Luis Gomes, Pedro Faria, Zita Vale, Jorge Silva, "Energy Analyzer Emulator for Microgrid Implementation and Demonstration and Respective Gateway" in IEEE Transactions on Industry Applications, vol. 55, no. 1, pp. 134-144, Jan.-Feb. 2019. Doi: 10.1109/TIA.2018.2866451 (IF. 3.347) (Gomes, 2019a);
▪ Luis Gomes, João Spínola, Zita Vale, Juan M. Corchado, “Agent-based Architecture for Demand Side Management using Real-Time Resources’ Priorities and a Deterministic Optimization Algorithm”, Journal of Cleaner Production, vol. 241, 118154, 20 December 2019. Doi: 10.1016/j.jclepro.2019.118154 (IF. 6.395) (Gomes, 2019h);
▪ Luis Gomes, Zita Vale, Juan M. Corchado, “Microgrid Management System Based on a Multi-Agent Approach: an Office Building Pilot”, Measurement, vol. 154, 107427, 15 March 2020. Doi: 10.1016/j.measurement.2019.107427 (IF. 2.791) (Gomes, 2020b);
▪ Luis Gomes, Zita Vale, Juan M. Corchado, “Multi-Agent Microgrid Management System for Single-Board Computers: A Case Study on Peer-to-Peer Energy Trading," in IEEE Access, vol. 8, pp. 64169-64183, 02 April 2020, doi: 10.1109/ACCESS.2020.2985254 (IF. 4.098) (Gomes, 2020c).
Together with the listed publications, five datasets where published using the open access platform Zenodo. These datasets have data resulted from S4E, and they are the following:
▪ L. Gomes, “Dataset of µGIM deployed in an office building”, Zenodo, 14 February 2019. doi: 10.5281/zenodo.3237235 (Gomes, 2019b);
▪ L. Gomes, “µGIM: week monitorization data of a microgrid with five agents (10/04/19-16/04/19)”, Zenodo, 16 May 2019. doi: 10.5281/zenodo.2868129 (Gomes, 2019e);
▪ L. Gomes, “µGIM: a week with peer-to-peer transactions (03/06/2019 - 09/06/2019)”, Zenodo, 19 August 2019. doi: 10.5281/zenodo.3371222 (Gomes, 2019f);
▪ L. Gomes, “µGIM: week monitorization data of a microgrid with five agents (04/08/2019 - 10/08/2019)”, Zenodo, 19 August 2019. doi: 10.5281/zenodo.3371339 (Gomes, 2019g);
▪ L. Gomes, “µGIM: a week with peer-to-peer transactions (02/03/2020 - 08/03/2020)”. Zenodo, 12 March 2020. Doi: 10.5281/zenodo.3707578 (Gomes, 2020a).
Besides the experimentations of this section, the S4E was also integrated into another work. A single agent deployment was made in GECAD offices for light optimization. The S4E monitors and

Luis Gomes
112
controls the light system and implements the algorithm proposed in (Khorram, 2018) using an energy strategy with GLPK solver that is executed based on context. The context that triggers this energy strategy is the unbalance of generation and consumption.
Office deployment case study
IV.4.1.1. Deployment
In this experimentation, the S4E software was deployed in an office building using a Raspberry Pi 3 Model B (Gomes, 2019h). The office had already installed a light control system, using DALI protocol, two smart plugs, one energy analyser, and two workplace sensor hubs.
The workplace sensor hub was a simple solution conceived and implemented by the thesis author to monitor the use of a desk. The detection of persons using a working desk enables the management of resources in and near area. In this experimentation, S4E agents were deployed in office buildings, meaning that the detection of persons in working desks was essential to enable some of S4E functionalities. However, the task of know if a person is using a working desk is not trivial. Movement sensors are easy to find but they usually lack the ability to detect the normal small movements typical on a working desk. The solution reached using the combination of a movement sensor and software monitoring the usage of keyboard and mouse. A small board, based on an Arduino Nano, was built including a movement sensor (PIR), a temperature sensor and a light intensity sensor (LDR). This board reads the sensor data and sent it to the computer using an USB connection. The USB connection is also used as power supply (5 V/DC). Figure 63 shows the architecture of this workplace sensor hub and a photograph of the developed board.
Figure 63. Workplace sensor hub
The workplace sensor hub is not detailed in this thesis, but a more detailed description can be found in (Gomes, 2019c). The hub also enables the autonomous control of the celling light according to the user presence and the light intensity of the room. The use of the hub enables S4E to get information regarding the room, such as temperature.
The office where S4E was deployed, is divided into five zones. These zones are shown in Figure 64, where is also illustrated the location and description of each resource integrated into S4E. As seen in section III.4Chapter III, the building zones are hierarchical. In this deployment, zone 1 is the main/root/parent zone. Zone 2 and 3 are below zone 1, and zone 4 and 5 are below zone 3. The office had a total of 2.1 kW peak photovoltaic generation that could be used for auto-consumption. Zones 4 and 5 represent working desks, and zone 2 is a common area without permanent working desks. Zone 3 is a small hallway with a refrigerator. The refrigerator uses an EnAPlug with an outside temperature sensor and inside temperature sensor, humidity sensor, and door sensor.
A total of 10 resources were integrated into S4E. The description of sensors is listed in The use of the balancing energy strategy potentiated the maximization of auto-consumption and the minimization of the energy bought. In this experimentation, the S4E agent was able to buy and sell energy from/to the grid without restrictions. The selling price was considered to be half (50 %) of the
buying price. Regarding users’ preferences, this experimentation considers 24 ˚C as the desired
temperature for zone 4, this being the only zone with a heater resource. Zones 4 and 5 have defined

113
preferences for light intensity, set to 500 lux and 280 lux, respectively. These preferences were used to calculate the real-time prioritization of energy loads. For this experimentation, the fan heater was
configured to turn off automatically every time the temperature of zone 4 goes above 24 ˚C,
preventing the overheating of the room.
Table 19, where zone, name, and units are identified. These sensors were used to define real-time priorities to each resource of Erro! Autorreferência de marcador inválida.. This experimentation used the energy strategy that balances consumption and generation, as it is described in section III.4.3.3. The restrictions and conditions for the algorithm execution are detailed in Table 5. The used Raspberry Pi executed the algorithm locally and stores all its data.
Table 18 lists the resources that where individually integrated into S4E, the monitoring technology column identifies how the resource energy was measured, the control type column indicates the control that could be done in the resource, the control technology column identifies how the resource was controllable, and the power column shows the peak consumption of each resource. Besides these resources, the office also had an uncontrollable consumption monitored by an energy analyser. This uncontrollable consumption had a peak near 270 W. The uncontrollable consumption considers all the energy sockets that were not individually monitored (e.g., desktops, screens, and laptops).
Figure 64. Office's zones and resources location
The description of sensors is listed in The use of the balancing energy strategy potentiated the maximization of auto-consumption and the minimization of the energy bought. In this experimentation, the S4E agent was able to buy and sell energy from/to the grid without restrictions. The selling price was considered to be half (50 %) of the buying price. Regarding users’ preferences,
this experimentation considers 24 ˚C as the desired temperature for zone 4, this being the only zone
with a heater resource. Zones 4 and 5 have defined preferences for light intensity, set to 500 lux and 280 lux, respectively. These preferences were used to calculate the real-time prioritization of energy loads. For this experimentation, the fan heater was configured to turn off automatically every time
the temperature of zone 4 goes above 24 ˚C, preventing the overheating of the room.
Table 19, where zone, name, and units are identified. These sensors were used to define real-time priorities to each resource of Erro! Autorreferência de marcador inválida.. This experimentation used the energy strategy that balances consumption and generation, as it is described in section III.4.3.3. The restrictions and conditions for the algorithm execution are detailed in Table 5. The used Raspberry Pi executed the algorithm locally and stores all its data.
Table 18. Resources description integrated in S4E
Zone Resource Monitoring Technology Control Type Control Technology Power (W)
1 Photovoltaic Energy Analyzer none none 2,100
2 Lamp 2.1 Energy Analyzer variable DALI 100
Lamp 2.2 Energy Analyzer variable DALI 100

Luis Gomes
114
Lamp 2.3 Energy Analyzer variable DALI 100
3 Refrigerator EnAPlug none* EnAPlug 120
4 Lamp 2.4 Energy Analyzer variable DALI 100
Fan Heater TP-Link HS110 discrete TP-Link HS110 1,000
5
Lamp 4.1 Energy Analyzer variable DALI 100
Lamp 4.2 Energy Analyzer variable DALI 100
Television EDIMAX Smart Plug variable EDIMAX Smart Plug 135
* has on/off control but it is not used in this experimentation
The use of the balancing energy strategy potentiated the maximization of auto-consumption and the minimization of the energy bought. In this experimentation, the S4E agent was able to buy and sell energy from/to the grid without restrictions. The selling price was considered to be half (50 %) of
the buying price. Regarding users’ preferences, this experimentation considers 24 ˚C as the desired
temperature for zone 4, this being the only zone with a heater resource. Zones 4 and 5 have defined preferences for light intensity, set to 500 lux and 280 lux, respectively. These preferences were used to calculate the real-time prioritization of energy loads. For this experimentation, the fan heater was
configured to turn off automatically every time the temperature of zone 4 goes above 24 ˚C,
preventing the overheating of the room.
Table 19. Sensors description integrated in S4E
Zone Sensor Units
3
Refrigerator temperature ˚C
Refrigerator humidity %
Temperature ˚C
4
Ambient light Lux
Movement [0,1]
Keyboard [0,1]
Computer mouse [0,1]
5
Ambient light Lux
Movement [0,1]
Keyboard [0,1]
Computer mouse [0,1]
IV.4.1.2. Data collection
All data was collected by S4E agent and stored locally in the SBC. Remote storage was not used in this experimentation. The data was stored every 10 seconds. The complete dataset is published under open access in (Gomes, 2019b). S4E agent stored the data in a PostgreSQL database, that were converted to the published Excel file.
A total of three days was stored in this experimentation: a summer day, a winter day, and a cloudy day. The main difference between those three days is in the generation profile. Concerning the outside temperature, the difference is not significant. Figure 65, Figure 66, and Figure 67 show the overall results of the days according to consumption (blue line), generation (green line), energy bought from the grid (blue area), energy sold to the grid (green area), and zone’s 4 temperature sensor (orange line in the secondary vertical axis). Figure 68 shows a closeup between 11:00 to 18:00 during the cloudy day of Figure 67.
Figure 69, Figure 70, and Figure 71 show the zone 4 fan heater consumption, the building generation, and the zone 4 temperature sensor. The charts shown in this section are just an overview of the complete and detailed dataset. Downloading the (Gomes, 2019b) dataset, it is possible to obtain values for every 10 seconds during the three 24-hour days, as well as all the inputs and outputs of each time the energy strategy was executed.
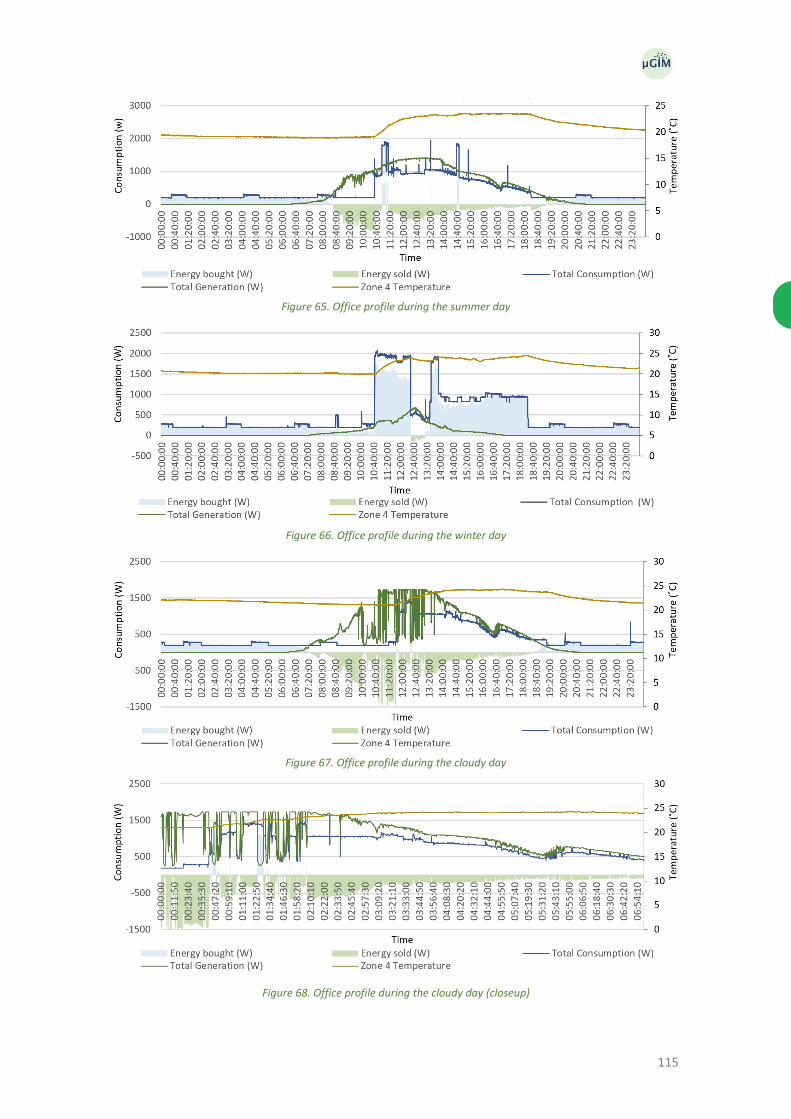
115
Figure 65. Office profile during the summer day
Figure 66. Office profile during the winter day
Figure 67. Office profile during the cloudy day
Figure 68. Office profile during the cloudy day (closeup)
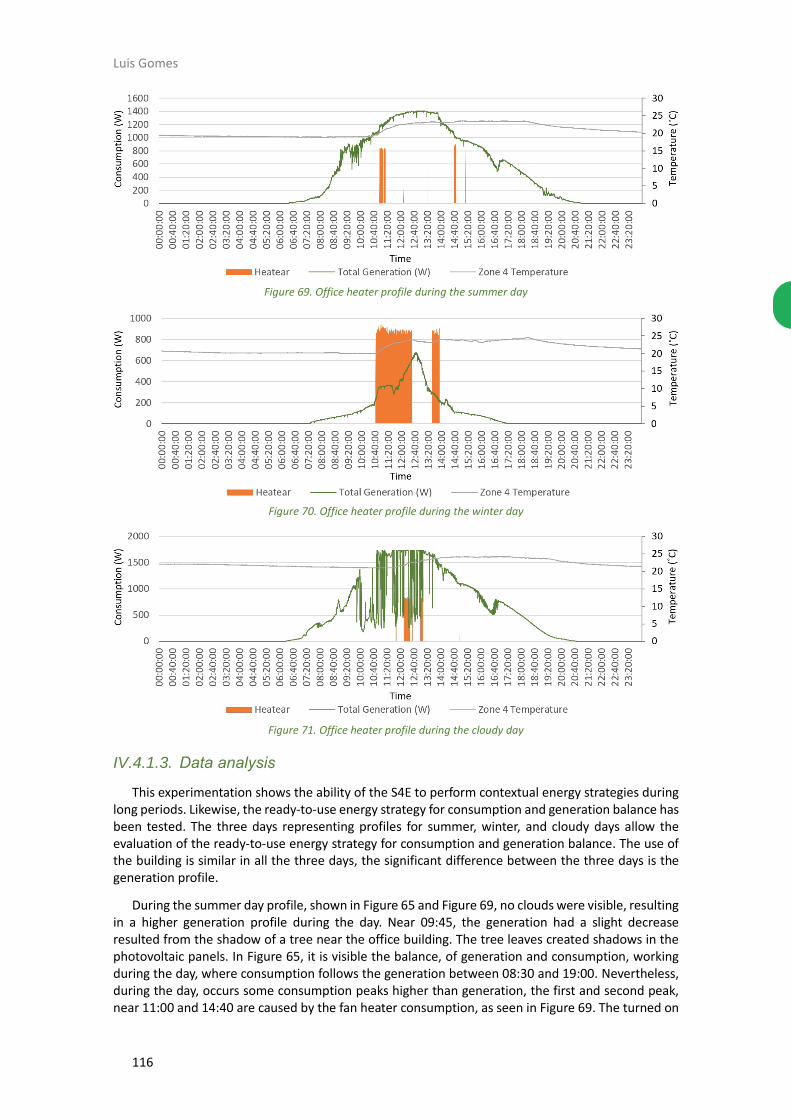
Luis Gomes
116
Figure 69. Office heater profile during the summer day
Figure 70. Office heater profile during the winter day
Figure 71. Office heater profile during the cloudy day
IV.4.1.3. Data analysis
This experimentation shows the ability of the S4E to perform contextual energy strategies during long periods. Likewise, the ready-to-use energy strategy for consumption and generation balance has been tested. The three days representing profiles for summer, winter, and cloudy days allow the evaluation of the ready-to-use energy strategy for consumption and generation balance. The use of the building is similar in all the three days, the significant difference between the three days is the generation profile.
During the summer day profile, shown in Figure 65 and Figure 69, no clouds were visible, resulting in a higher generation profile during the day. Near 09:45, the generation had a slight decrease resulted from the shadow of a tree near the office building. The tree leaves created shadows in the photovoltaic panels. In Figure 65, it is visible the balance, of generation and consumption, working during the day, where consumption follows the generation between 08:30 and 19:00. Nevertheless, during the day, occurs some consumption peaks higher than generation, the first and second peak, near 11:00 and 14:40 are caused by the fan heater consumption, as seen in Figure 69. The turned on

117
of the fan heater produced a higher consumption peak and during its turn on period the temperature of zone 4 increased. According to the scenario configuration, the fan heater is turned off when a
temperature of 24 ˚C is reached. Near 16:50, it is possible to see the balancing algorithm working according to the decrease and increase of generation. The energy strategy decreased the energy until 16:50 and then increased it before it decreased again minutes later, this is also visible in the cloudy day, in Figure 68.
The winter day provided a lower generation profile that did not allowed the continuous execution of the balancing energy strategy. The exception was seen during the period from 12:32 to 13:33, where the energy strategy was triggered. This was the period where consumption less flexibility was lower than the generation, allowing the optimization of resources. However, when the generation decreased, the energy strategy was not triggered again. The fan heater was used more during the winter day than the summer day. Although both days had the same starting point, and because of the building architecture and wall material, the heater decreased rapidly during the winter day (where an outside temperature was lower). In contrast, during the summer day, the building was able to stabilize the inside temperature and produced a slight increasing of temperature during the day, even without the use of the fan heater.
The winter profile and summer profile started the working day with the same zone 4 temperature
value of 20 ˚C. However, the fan heater stayed turned on for 15 minutes in the summer day and 50
minutes during the winter day. The fan heater has three possible controls: the manual control from the users, the control resulted from the execution of the energy strategy, and the S4E automatic
control when zone 4 temperature sensor reaches 24 ˚C.The first possible control, user control, was
not used during this experimentation, the users only turned on the fan heater and did not turned it off. In the summer day, the fan heater was turned on for 15 minutes because its priority was 1 (maximum priority that did not allowed the turned off of the resource). After 15 minutes, and
because the temperature of the zone increased to 21.2 ˚C, the priority of the fan heater decreased and allowed the energy strategy to turned it off. However, during the winter day, the energy strategy was not executed because the building flexibility was not enough to trigger the conditions of the energy strategy. Therefore, the fan heater was not controlled by the algorithm, and it was only turned
off automatically when the temperature reached 24 ˚C.
In the cloudy day profile, a different scenario is presented. This was the day with the highest solar radiation but with several generation interruptions. Nonetheless, energy strategy was still able to maintain the balance between generation and consumption when it was possible, as seen in Figure 68. It is possible to observe that consumption had the same drastic variations than generation. This shows the ability of the energy strategy to rapidly react to changes. However, this ability is also an issue, because during this day, the resources were turned on and off several times. This situation should not happen in order to prevent the rapidly degradation of resources. The real-time prioritization of resources enabled the energy strategy to not negatively affect users’ comfort. The lights and television near the users were continuously dimmed and turned on and off, which contributed to the dissatisfaction of users.
Table 20 shows the overall results of the three-day experimentation. These results show that the generation of winter day was around 20 % of the other days. Also, the consumption was higher during the winter day. The main aspect in Table 20 is the number of times the energy strategy was triggered/executed during the days: 4,929 times in the summer day, 154 times in the winter day, and 5,394 times in the cloudy day. By analysing the daily energy cost, it appears a correlation between the number of times energy strategy was triggered and the daily energy cost.
Table 20. S4E overall results for the three-day experimentation in the office deployment
Summer day Winter day Cloudy day
Generation (kWh) 10.053 1.910 10.347
Consumption (kWh) 9.945 12.364 9.302
Energy strategy executions 4,929 154 5,394

Luis Gomes
118
Daily outcome (EUR) 0.56 2.11 0.54
Daily income (EUR) 0.29 0.01 0.37
Energy costs (EUR) 0.27 2.10 0.16
The results clearly show the efficiency of the ready-to-use energy strategy for consumption and generation balance in a real office building. Energy costs can be reduced by balancing consumption and generation, and S4E is able to locally provide this solution. The cloudy day had a lower energy cost, of 0.16 EUR, but it was a severe and harsh experimentation that negatively affect the users comfort. The application of this energy strategy during cloudy days, where the sun comes and goes frequently, should be avoided and it is not recommended. The cloudy day was only tested because it represents an unstable scenario that pushes the energy strategy to its limit.
Microgrid with transactive energy case study
IV.4.2.1. Deployment
For this experimentation, has been used one of GECAD’s buildings located in ISEP (Porto, Portugal). The case study and results are published in (Gomes, 2020b) and (Gomes, 2020c). The GECAD’s building has a total of 10 kW peak photovoltaic generation and receives daily around 25 researchers and students. Internally, the building has nine electrical enclosers that control nine distinct areas/zones. In this experimentation, the building is considered to be an office building where the owner rents offices to renters. The renter can choose to manage its own energy or to buy energy from the building owner. If the renter chooses to manage its own energy, then it has access to 1 kW peak generation, shared from the 10 kW peak photovoltaic generation of the building.
The building is divided into nine zones, where zone L.1 is composed by rooms 1, 2, and 3, zone L.2 by rooms 4, 5, and 6, zone L.3 by rooms 7, 8, and 9, zone R.1 by rooms 13 and 14, zone R.2 by rooms 12 and 15, and zone R.3 by rooms 11 and 16. Figure 72 shows the layout of the building. Room 10 is the kitchen zone. The rest of the zones are the left hallway with the toilets and the right hallway. Zones L.1, L.2, L.3, and R.2 are rented with private energy management, and zone R.3 is rented without private management. Zone R.1 is not included because it lacks proper energy metering. Figure 72 shows the rented zones in colours green, blue, brown, and purple. In yellow colour are represented zones managed by the building owner – zone Z.0 – and in white is represented the zone that it is not considered in this experimentation.
Figure 72. GECAD's building N

119
The building owner shares 1 kW peak generation with each renter. Therefore, the renters of zones L.1, L.2, L.3, and R.2 receive 1 kW each, leaving the rest 6 kW of the building generation to be managed by the owner. Each renter and the owner have an SBC with an S4E agent. The five S4E agents make a microgrid with 5 end-users/prosumers.
This experimentation was only possible because the building already had a SCADA system that monitor all the energy-related data of each zone. S4E agents integrate parts of this SCADA system using HTTP requests. Each agent requests data for their respective zone. Additionally, to the SCADA system, smart plugs and EnAPlugs were also integrated into S4E agents.
Figure 73 shows the hardware previously deployed in the building. This is the hardware responsible to measure energy data and control the celling lights. Each zone has a PLC and at least one energy analyser. The building is mono-phase, but it was used three-phase energy analysers. The three-phase energy analysers were deployed to measure three consumption types: electrical sockets, celling lights, and HVAC systems. In the building, each room and hallway have an individual air-conditioner unit. The building owner, managing zone Z.0, has also the DC-AC inverter used in the photovoltaic generation. All the measuring units have the ability to communicate using Modbus/RTU protocol using a RS485 network. The celling lights of each zone are controlled using the digital addressable lighting interface (DALI) protocol. Although not represented in Figure 73, the building owner also has control over the celling lights of both hallways and rooms 10, 11, and 16.
Five SBC were used: one Raspberry Pi Zero W, one Raspberry Pi Model B, and three Raspberry Pi 3 Model B. Raspberry Pi Zero W and Model B have lower computational power than the Raspberry Pi 3 Model B. Furthermore, the model Zero W does not have an RJ45 connector, demanding the use of Wi-Fi. Figure 74 shows the SBCs deployed in the building as well as a representation of how they are interconnected among each other.
Figure 73. Building N SCADA system hardware
The building owner used the Raspberry Pi Zero W and zone L.1 renter used the Raspberry Pi Model B. In other zones (i.e., L.2, L.3, and R.2), it was uses Raspberry Pi 3 Model B. All SBC used an 8 GB SD

Luis Gomes
120
card with Raspbian OS without GUI. All the S4E third-party software were installed in each SBC. Because they are all Raspberry Pies, the installation of packages was done only in one SBC and then the SD card was cloned for the other four Raspberry Pies. All the SBC were deployed in a demonstration wall located in room 14 (Figure 74).
As shown in Figure 74, all SBCs were using the JGroups to enable discovery among them, inside this yellow circle, there was the MAS green circle, created by the MAS core, where all agents were connected using JADE framework. Inside the MAS circle, the agents built a connection among them for transactive energy, these connections allow the auctions among S4E agents. In this deployment, agent representing zone Z.0 implements the MAS core and it is the synchronized agent for the P2P energy transactions auctions.
All agents used the hour-ahead dummy forecast energy strategies, detailed in section III.4.3.2, at ‘18 * * * *’ – at all hours at minute 18. The difference between forecasted consumption and generation was put to sold/bought in the P2P transactive energy auctions. If the agent had more consumption than generation, then it tried to buy the difference. Otherwise, it tried to sell the difference. The exception is agent Z.0, the building owner was configured to only sell the surplus energy and did not tried to buy energy from other agents.
The synchronized agent queries sellers at ‘30 * * * *’ and auctions start at ‘35 * * * *’. The sellers were ordered using FIFO order. Agents used a maximum of 100 W lot size, meaning that energy lots were divided by 100 W blocks.

121
Figure 74. Building N SBCs deployment
IV.4.2.2. Data collection
This deployment used an office building with five S4E agents that were deployed for more than three months. This deployment enabled the testing, correction, and validation of S4E agents as a monitoring and management system. It was also tested the agent connectivity and the ability to transact energy. The S4E agents used local PostgreSQL storage databases for data measured in the last 24 hours, and remote PostgreSQL storage databases for data measured more than 24 hours ago.
The data presented in this section were retrieved from the remote databases, and its publicly available in two open access datasets that can be download in (Gomes, 2019f) and in (Gomes, 2020a). The monitoring data corresponds to seven days between 10 April 2019 (Wednesday) and 16 April 2019 (Tuesday). Figure 75, Figure 76, Figure 77, Figure 78, and Figure 79 show the total consumption and generation of each agent. The consumption is shown aggregated by individual resources consumption.

Luis Gomes
122
Figure 75. Z.0 agent week metering
Figure 76. L.1 agent week metering
Figure 77. L.2 agent week metering
Figure 78. L.3 agent week metering
Figure 79. R.2 agent week metering
The week between 03 March 2020 (Monday) and 09 March 2020 (Sunday) was used for the
transactive energy data, it was used. This experimentation applies P2P energy transactions among
agents using local auctions inside the microgrid. However, as a comparison point, it was calculated
the costs and energy profiles in the case where no P2P transactions were performed. Figure 80 shows
the week energy profile without considering P2P transactions. The figure shows the microgrid
consumption and generation, and the sum of the agents’ energy that was consumed/injected
from/to the main grid. Figure 81 shows the same data but considering P2P transactions.
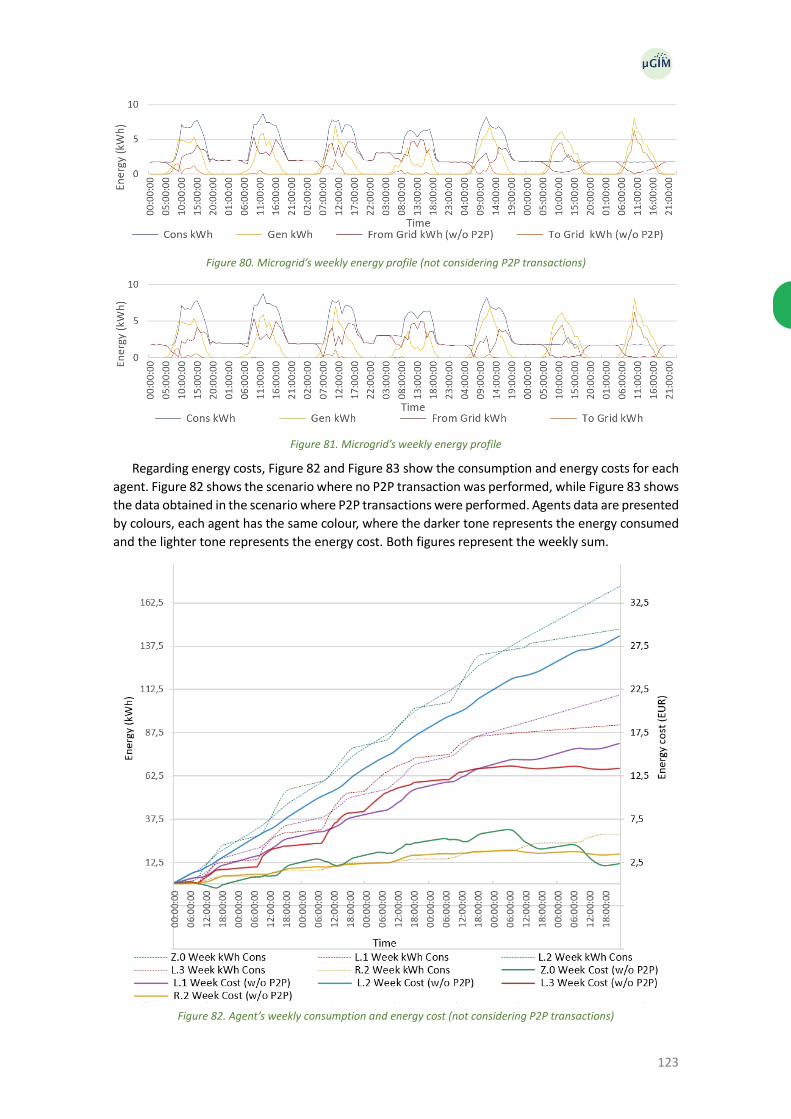
123
Figure 80. Microgrid’s weekly energy profile (not considering P2P transactions)
Figure 81. Microgrid’s weekly energy profile
Regarding energy costs, Figure 82 and Figure 83 show the consumption and energy costs for each
agent. Figure 82 shows the scenario where no P2P transaction was performed, while Figure 83 shows
the data obtained in the scenario where P2P transactions were performed. Agents data are presented
by colours, each agent has the same colour, where the darker tone represents the energy consumed
and the lighter tone represents the energy cost. Both figures represent the weekly sum.
Figure 82. Agent’s weekly consumption and energy cost (not considering P2P transactions)

Luis Gomes
124
Figure 83. Agent’s weekly consumption and energy cost
P2P transactions used forecast data to decide if energy needed to be bought or sold. During the
experimentation week, some wrong transactions were performed due to errors in forecast. These
transactions can assume one of four types: wrong sale, wrong purchase, sold too much, and bought
too much. Wrong sale and “wrong purchase” indicate that an agent performed the opposite
transaction, i.e., the forecast indicates that would be a surplus/deficit energy, but in fact, the real
values indicate the opposite scenario, a deficit/surplus energy. This led the agent to buy/sell energy
that in fact, needed to sell/buy. The sold too much and bought too many transactions indicate that
the agent was right in the P2P intension, but that bought/sold too much energy, that later was needed
to be injected/supplied to/from the main grid.
Wrong actions can lead agents to transact energy that they do not have or do not need, penalizing
the agent’s energy cost. Figure 84 shows the number of wrong transactions by type and hour of the
day. Figure 85 shows the weekly energy transacted in the wrong transactions.
Figure 84. Weekly wrong P2P transactions performed by agents, and forecast MAPE errors
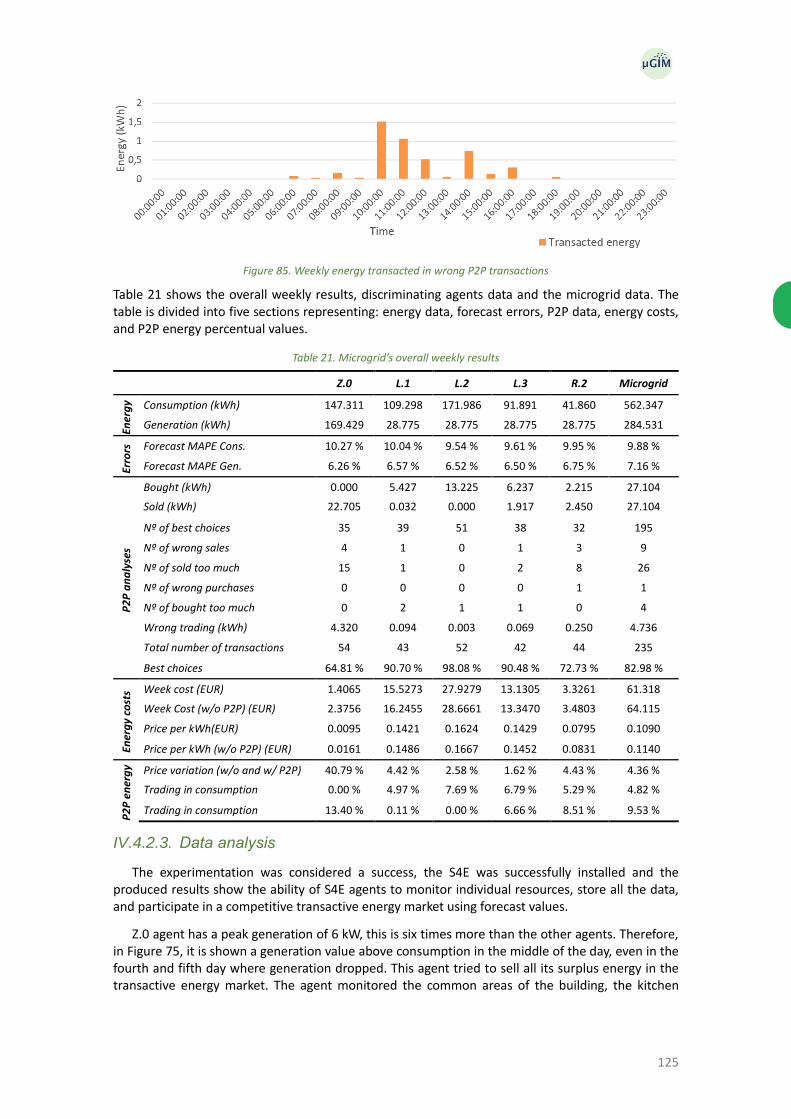
125
Figure 85. Weekly energy transacted in wrong P2P transactions
Table 21 shows the overall weekly results, discriminating agents data and the microgrid data. The table is divided into five sections representing: energy data, forecast errors, P2P data, energy costs, and P2P energy percentual values.
Table 21. Microgrid’s overall weekly results
Z.0 L.1 L.2 L.3 R.2 Microgrid
Ener
gy Consumption (kWh) 147.311 109.298 171.986 91.891 41.860 562.347
Generation (kWh) 169.429 28.775 28.775 28.775 28.775 284.531
Erro
rs Forecast MAPE Cons. 10.27 % 10.04 % 9.54 % 9.61 % 9.95 % 9.88 %
Forecast MAPE Gen. 6.26 % 6.57 % 6.52 % 6.50 % 6.75 % 7.16 %
P2
P a
na
lyse
s
Bought (kWh) 0.000 5.427 13.225 6.237 2.215 27.104
Sold (kWh) 22.705 0.032 0.000 1.917 2.450 27.104
Nº of best choices 35 39 51 38 32 195
Nº of wrong sales 4 1 0 1 3 9
Nº of sold too much 15 1 0 2 8 26
Nº of wrong purchases 0 0 0 0 1 1
Nº of bought too much 0 2 1 1 0 4
Wrong trading (kWh) 4.320 0.094 0.003 0.069 0.250 4.736
Total number of transactions 54 43 52 42 44 235
Best choices 64.81 % 90.70 % 98.08 % 90.48 % 72.73 % 82.98 %
Ener
gy
cost
s Week cost (EUR) 1.4065 15.5273 27.9279 13.1305 3.3261 61.318
Week Cost (w/o P2P) (EUR) 2.3756 16.2455 28.6661 13.3470 3.4803 64.115
Price per kWh(EUR) 0.0095 0.1421 0.1624 0.1429 0.0795 0.1090
Price per kWh (w/o P2P) (EUR) 0.0161 0.1486 0.1667 0.1452 0.0831 0.1140
P2
P e
ner
gy Price variation (w/o and w/ P2P) 40.79 % 4.42 % 2.58 % 1.62 % 4.43 % 4.36 %
Trading in consumption 0.00 % 4.97 % 7.69 % 6.79 % 5.29 % 4.82 %
Trading in consumption 13.40 % 0.11 % 0.00 % 6.66 % 8.51 % 9.53 %
IV.4.2.3. Data analysis
The experimentation was considered a success, the S4E was successfully installed and the produced results show the ability of S4E agents to monitor individual resources, store all the data, and participate in a competitive transactive energy market using forecast values.
Z.0 agent has a peak generation of 6 kW, this is six times more than the other agents. Therefore, in Figure 75, it is shown a generation value above consumption in the middle of the day, even in the fourth and fifth day where generation dropped. This agent tried to sell all its surplus energy in the transactive energy market. The agent monitored the common areas of the building, the kitchen

Luis Gomes
126
(included in the common right total consumption line) and zone R.3 that is rented but where the renter chooses not to manage his own energy.
Zone L.1 was composed by three offices and had a normal consumption near 600 W, this resulted in a continuous normal energy deficit where generation was usually below consumption. Figure 76 shows the ability of S4E to monitor the energy during long periods of time and manage the storage of the data in both local database and remote database.
The consumption of zone L.2, according to Figure 77, was very high and stable. This is due to zone L.2 having a server room where an HVAC unit was permanently turned on. The generation in this agent is badly noticed in Figure 77 because of its high consumption.
Figure 78 shows the monitoring values of zone L.3 agent. This zone had a stable consumption profile without significant peaks. Therefore, generation was able to surpass consumption and enabled the agent to try to sell energy. Although, days with less sun, as happened in the fourth and fifth day, could not provide enough energy to be sold.
Zone R.2 had the lowest residual consumption of all agents, and it had consumption peaks during working days, Figure 79. Depending on the day, the agent had surplus energy to sell, but there were periods where it tried to buy energy.
The use of P2P transactions resulted in a significant decrease in the energy cost, dropping 4.36 % in the microgrid. By comparing Figure 80 to Figure 81, it is visible a decrease of the consumed energy from the grid and the decrease of the energy injected to the main grid. This is a direct result of P2P transactions that enabled the local energy transaction among the agents/prosumers of the microgrid.
In Figure 82 and Figure 83, it is seen that the consumption of the agents stayed exactly the same. However, prices lightly differ. The energy price per kWh dropped 40.79 % for Z.0 agent, 4.42 % for L.1 agent, 2.58 % for L.2 agent, 1.62 % for L.3 agent, and 4.43 % for R.2 agent. Because P2P transactions were performed using the forecasted generation and consumption, in some occasions, agents were misled by the forecast, resulting in wrong P2P transactions that negatively impacted the energy cost. Figure 84 shows the hours with more wrong transactions. The amount of energy wrongly transacted can be seen in Figure 85. The number of wrong transactions and the amount of energy resulted from those wrong transactions appear to not have a direct correlation. For instance, at 10:00 and 11:00 are made almost the same number of wrong transactions but the energy that was wrongly transacted is significantly higher at 10:00.
Multi-building deployments
IV.4.3.1. Deployment
The S4E was also deployed in three residential houses. These houses are owned by three voluntaries that allowed the experimentation of S4E agents. This experimentation enabled the integration of uncontrollable environments where S4E was used to monitor data as a passive system. Although, S4E is capable of performing resources optimization and transactive energy, this was not yet tested in the residential houses. The only requirements for these deployments were: the house should have a Wi-Fi network with internet connection, and the user should be able to receive and install an energy analyser and a single-board computer.
The deployment of S4E in residential houses raised some issues that were not present in previous experimentations. For instance, there was not a SCADA system pre-installed. Also, the S4E agents were at different networks, without the ability to communicate with each other. The computer network can be solved using a virtual private network (VPN) or by opening the right ports in the residence router. However, the second option must be avoided because JADE framework, used for the multi-agent system, is not built for security and the opening of router ports can weaken the house network security. In this experimentation, the S4E was individually deployed and did not used a multi-agent system. Therefore, there was no need to build a VPN.
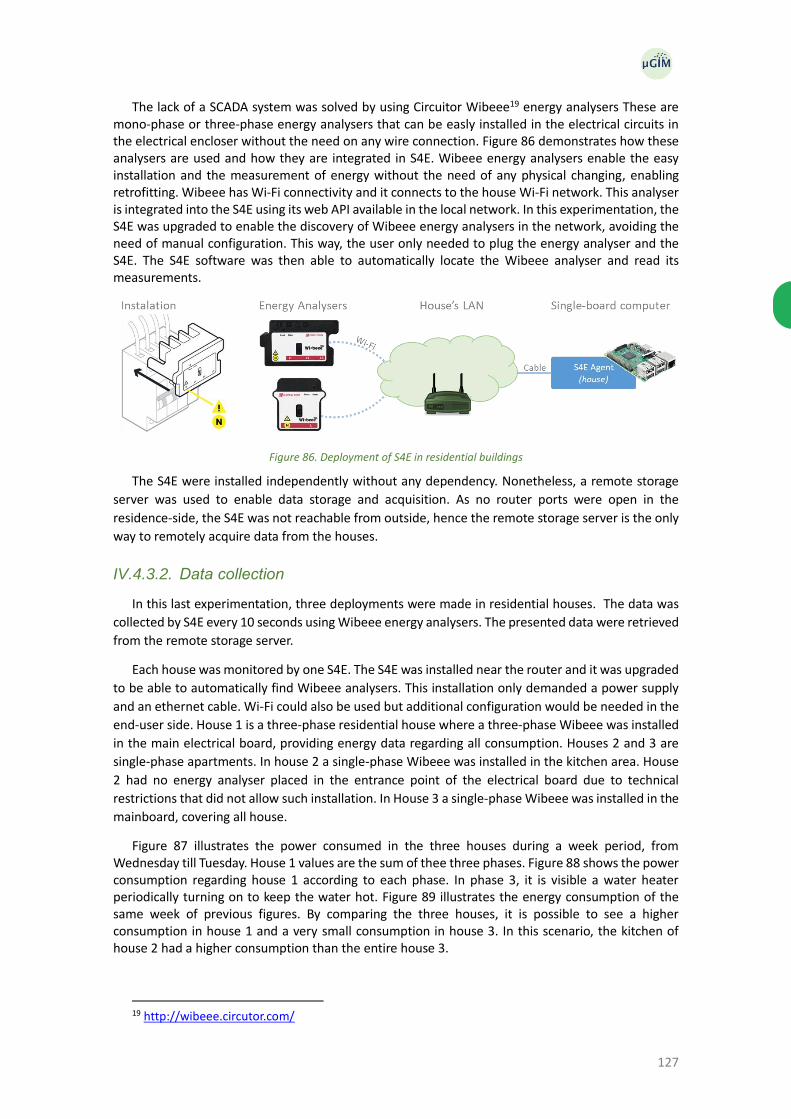
127
The lack of a SCADA system was solved by using Circuitor Wibeee19 energy analysers These are mono-phase or three-phase energy analysers that can be easly installed in the electrical circuits in the electrical encloser without the need on any wire connection. Figure 86 demonstrates how these analysers are used and how they are integrated in S4E. Wibeee energy analysers enable the easy installation and the measurement of energy without the need of any physical changing, enabling retrofitting. Wibeee has Wi-Fi connectivity and it connects to the house Wi-Fi network. This analyser is integrated into the S4E using its web API available in the local network. In this experimentation, the S4E was upgraded to enable the discovery of Wibeee energy analysers in the network, avoiding the need of manual configuration. This way, the user only needed to plug the energy analyser and the S4E. The S4E software was then able to automatically locate the Wibeee analyser and read its measurements.
Figure 86. Deployment of S4E in residential buildings
The S4E were installed independently without any dependency. Nonetheless, a remote storage
server was used to enable data storage and acquisition. As no router ports were open in the
residence-side, the S4E was not reachable from outside, hence the remote storage server is the only
way to remotely acquire data from the houses.
IV.4.3.2. Data collection
In this last experimentation, three deployments were made in residential houses. The data was
collected by S4E every 10 seconds using Wibeee energy analysers. The presented data were retrieved
from the remote storage server.
Each house was monitored by one S4E. The S4E was installed near the router and it was upgraded
to be able to automatically find Wibeee analysers. This installation only demanded a power supply
and an ethernet cable. Wi-Fi could also be used but additional configuration would be needed in the
end-user side. House 1 is a three-phase residential house where a three-phase Wibeee was installed
in the main electrical board, providing energy data regarding all consumption. Houses 2 and 3 are
single-phase apartments. In house 2 a single-phase Wibeee was installed in the kitchen area. House
2 had no energy analyser placed in the entrance point of the electrical board due to technical
restrictions that did not allow such installation. In House 3 a single-phase Wibeee was installed in the
mainboard, covering all house.
Figure 87 illustrates the power consumed in the three houses during a week period, from Wednesday till Tuesday. House 1 values are the sum of thee three phases. Figure 88 shows the power consumption regarding house 1 according to each phase. In phase 3, it is visible a water heater periodically turning on to keep the water hot. Figure 89 illustrates the energy consumption of the same week of previous figures. By comparing the three houses, it is possible to see a higher consumption in house 1 and a very small consumption in house 3. In this scenario, the kitchen of house 2 had a higher consumption than the entire house 3.
19 http://wibeee.circutor.com/

Luis Gomes
128
Figure 87. Power consumption for one week
Figure 88. Power consumption in house 1 for one week
Figure 89. Energy consumption for one week
Figure 90, Figure 91 and Figure 92 show the results of the dummy hour-ahead forecast algorithm included in S4E. These forecasts were done by S4E without the need of any configuration. The S4E software was capable to analyse the consumption data and provide hour-ahead and 15-minute-ahead forecasts. The used houses had no generation.
Figure 90. House 1 hour-ahead forecast

129
Figure 91. House 2 hour-ahead forecast
Figure 92. House 3 hour-ahead forecast
IV.4.3.3. Data analysis
In this experimentation, the S4E system was tested in real residential houses. This was a new challenge that provided a test and validation in uncontrollable environments. It was important to validate the system in uncontrollable environments to close the gap between academia and the real/physical world. The development in laboratory environments enabled the prototyping and proof of concept, but this type of environment is not enough to clear understand the reliability and stability of the system. This reality was experienced in this experimentation where working S4E agents were deployed, and after their installation in the residences, none worked without issues. The first two installations provided a list of bugs and problems that needed to be solved in order to accommodate S4E agents in residences.
Issues, such as stability and deployment were detected in this experimentation. For example, in house 2, the router blocked the autonomous search of Wibeee analysers, demanding a manual configuration. Another problem was the remote storage synchronization, that after some time was unable to periodically send data to the remote storage. These problems were detected and solved.
As previously seen, S4E agents can transact energy. However, this was not tested in this experimentation because of network limitations. The monitor functionality of S4E was tested and validated alongside with the execution of energy strategies and storage (local and remote). The network limitation could be solved using a virtual private network (VPN) to connect all S4E agents into the same network. Tests with VPN allowed agents to communicate within different physical networks as if they shared a common physical network. The VPN is configured in the operating system level, under S4E agent. Therefore, the application of a VPN does not affect nor change the operation of S4E agents, and it allows transactive energy among agents deployed in different networks and end-users. The experimentation regarding transactive energy, section IV.4.2, can in fact be extended to include the three new agents presented in this experimentation.
This experimentation also allowed a combination of S4E agents with Wibeee energy analysers. The S4E was conceived to be easy to install and deploy in end-users, and the Wibeee energy analyser is the easiest energy analyser that can be installed in an end-user-side. The combination of both

Luis Gomes
130
systems is a great achievement of this PhD research, providing a kit that can be easily installed and that can monitor the end-users building. The monitoring results can be seen in Figure 87, Figure 88, and Figure 89.
The control of resources was not included in this experimentation. This was the result of the inexistence of Home Assistant in the SBC of the S4E. The control of resources can be done using IoT devices, as seen in the office deployment experimentation (see section IV.4.1). However, smart plugs were included in the S4E using the Home Assistant home automation platform. The deployments made under this PhD research used Home Assistant running in a dedicated server outside the SBC of the S4E. In order to use smart plugs in this residential experimentation, one of two solutions were possible: it was needed a Home Assistant server in the residence, or it was needed to have Home Assistant installed in the SBC of the S4E. The first option was out of the question because it would demand the installation and configuration of a new server. The second option was the most correct, but it will also demand the manual and local configuration of smart plugs in order to put them available in Home Assistant software. To enable the easy installation of S4E in the resident buildings, this experimentation did not consider the control of resources.
During this experimentation, the S4E provided forecast algorithms, as seen in Figure 90, Figure 91 and Figure 92, using the dummy forecast detailed in section III.4.3.2. As can be seen in Figure 92, the forecast results are close to the real energy values, with a weekly average error of 20 %. The generation forecast was also executed, but because residences did not have generation, the result was always zero (with 100 % accuracy). Agents also calculate the energy consumption baselines in hour-ahead, as detailed in section III.4.3.1.
This experimentation is the first step to get S4E software and agents to residential houses, opening an entire new range of possibilities and issues that can be raised over time. The deployment in real uncontrollable environments is the definite proof that S4E has a lot of potential and still has a lot of space to grow.

131
Chapter V
V. Conclusions
CHAPTER INDEX
V.1. MAIN CONCLUSIONS AND CONTRIBUTIONS ......................................................................................... 132 Research questions ........................................................................................................... 133 Proposed solutions ............................................................................................................ 134
V.2. LOOKING FORWARD ....................................................................................................................... 136 V2R emulator .................................................................................................................... 137 EnAPlug ............................................................................................................................. 137 S4E .................................................................................................................................... 138

Luis Gomes
132
V.1. Main conclusions and contributions
This PhD research had the purpose of analysing, modelling, and representing end-users in a microgrid context using computer engineering concepts and methodologies. The models conceived, developed, and tested during the PhD research resulted in the proposal of three independent systems, constituted by hardware and software.
The proposed models and systems scientifically contribute to the area of computer engineering, particularly to the field of artificial intelligence with contributions to agent’s cooperative and competitive behaviours, deep learning using contextual-data, distributed management decisions supported by the community knowledge, and cyber-physical real-time optimization. The proposed models and systems also scientifically contribute to the area of power and energy systems, particularly to centralized and decentralized energy management systems for demand-side management, context-aware intelligent resource optimization, microgrid distributed management systems, and auction-based peer-to-peer energy transactions. Considering the research problem as a whole and addressing it both from the perspective of computer engineering and power and energy systems allowed to make hybrid scientific contributions that have impact on both areas. These contributions include energy players representation by means of agents and multi-agent systems, seamless integration of artificial intelligent models in energy decision and management models, real-time energy management models and systems supported by internet of things devices, and microgrid intelligent energy management models and systems based on the active participation of end-users.
The undertaken research addressed the thesis main research question (Q0) and the five specific research questions (Q1 to Q5) presented in section I.2. For that, three solutions were conceived, developed, and tested during the PhD research: the virtual to reality (V2R) emulator, the environmental awareness smart plug (EnAPlug), and the single-board computer for energy (S4E). The three solutions are a combination of hardware and software. They were conceived to address specific problems, overcoming in this way the barriers to the efficient conception, development, and testing of the main outcome of the research – the microgrid intelligent management system based on a multi-agent approach and the active participation of end-users (µGIM). The µGIM solution was used to integrate smaller contributions resulting from the PhD research, such as a context-aware cyber-physical real-time resource optimization algorithm for consumption and generation balance in the end-user-side, deep learning algorithms that use contextual-data and user interaction to gain knowledge regarding electrical loads and energy resources, a microgrid intelligent energy management system based on the active participation of end-users, a distributed energy management solution supported by the knowledge of an agent-based community, and auction-based peer-to-peer energy transaction models using cooperative and/or competitive agents’ behaviours.
In this PhD research, computer engineering tools, namely from artificial intelligence, have been proven to largely contribute to the efficient operation of microgrids, to the end-users representation, and to the end-user’s energy management, enabling the application of new concepts promoted by smart grids, such as the active participation of end-users. This PhD research contributed to the advancement of the state-of-the-art of computer engineering and power and energy systems.
Specific contributions were made to eight funded projects, as seen in section I.3. This PhD research actively contributed to two H2020 projects (DOMINOES, and DREAM-GO), two ITEA projects (M2MGrids, and SPEAR), three P2020 (Portugal) projects (SIMOCE, NetEffiCity, and AVIGAE), and one H2020 cascade funding project (Eco-Rural-IoT). The contributions made in the DOMINOES and DREAM-GO should be highlighted. This PhD research contributed to H2020 DOMINOES project with its microgrid solution and peer-to-peer energy transaction models, enabling the application of these models to local markets. The S4E solution has been used to integrate some of the DOMINOES project models enabling them to be tested in a project pilot site. Regarding DREAM-GO, this PhD research contributed with models for the active participation of end-users, with S4E enabling the end-users’ representation and participation in microgrids, and with means for testing and validating several project models.

133
Research questions
Section I.2 identified five specific research questions (Q1 to Q5) needed to be addressed in order to satisfactorily address the main research question, Q0. Therefore, each specific research question was addressed.
Regarding the specific research questions Q1, “Can an single agent represent an end-user, integrating electric loads, energy resources, and monitoring equipment while providing an energy management system that can efficiently manage the end-user's loads?”, it was addressed by the conceived, developed, and tested S4E agent-based solution. This system allows the integration of electrical loads, energy loads, and monitoring equipment, and the integration of a real-time energy management system. The system is able to efficiently execute energy management algorithms, such as the one presented in section III.4.3.3 that combines energy-related data, from electrical loads and energy resources, as well as sensor data that allows the characterization of the building spaces and the identification of the users’ needs. The test and validation of the S4E system to address this specific research question was done using the conceived, developed, and tested V2R emulators and EnAPlugs. V2R emulators add a particular significant positive impact on S4E testing because they allowed the easy testing and the creation of large scenarios without the need for physical electrical loads and energy resources.
The successful addressing of question Q1 proved that end-users can be managed by a single agent, part of a multi-agent system, that integrates energy resources and energy loads while providing energy management algorithms, such as load optimization, and energy balancing between energy consumption and local energy generation. The addressing of Q1 resulted in a cyber-physical real-time energy management system that uses the integrated sensors to enable the efficient balance between electric loads (i.e., consumption) and energy resources (i.e., generation) considering the users preferences and the building context.
The specific research question Q2, “Can a multi-agent system efficiently manage a microgrid?”, was addressed by S4E solution that promotes a microgrid intelligent energy management system based on the active participation of end-users. The architecture of S4E, shown in III.4.2, takes into account the multi-agent system, while the microgrid management is addressed in this PhD research using a distributed solution where agents share common goals. The thesis presents, in section III.4.4, the use of transactive energy auctions to promote the balance in the microgrid and to reduce the demand for grid energy.
Question Q2 was thus successfully addressed and the undertaken research proved that microgrids can be managed using distributed systems based on the active participation of end-users represented by cooperative or competitive agents in a multi-agent system.
The integration and use of internet of thigs (IoT) devices in energy management systems should be considered taking into account the market available devices and the already installed devices in our buildings. The specific research question Q3, “How can the internet of things devices be integrated into an energy management system?”, was addressed in this PhD research with EnAPlug and S4E solutions. The EnAPlug demonstrated that smart plugs can suffer a great evolution and provide significant information to EMS. The results of EnAPlug AM were so promising that it evolved to the EnAPlug SB that showed an outstanding performance, allowing the actual integration of a distributed EMS into IoT devices, eliminating the need of any external software or hardware, as it is shown in sections III.3.4 and III.3.5.
The S4E solution is able to integrate IoT devices for monitoring and controlling purposes, as can be seen in section III.4.2.8, proving that energy management systems can not only include IoT devices but can also benefit from this inclusion. The successfully addressing of question Q3 resulted in a real-time energy management system supported by IoT devices, and in a context-aware intelligent electric loads optimization.

Luis Gomes
134
The specific research question Q4, “Can single-board computers efficiently run the agent described in Q1 and the multi-agent system of Q2?”, was addressed by testing the S4E solution in nine different single-board computers (SBCs). The result was a success, even in the case where a single SBC was executing more than one agent. The list of SBCs is shown in section III.4.8. EnAPlug also used SBCs to create a multi-agent system connecting IoT devices.
Question Q4 was thus successfully addressed, and it has been proven that the agent deployed in an SBC can represent an end-user, integrate energy loads and energy resources, and efficiently manage the integrated loads and resources. It also has been proven that multiple SBC can manage a microgrid using a multi-agent system approach where each SBC accommodates a single agent.
The last specific research question Q5, “How can transactive energy be used by microgrid’s end-users?”, was addressed at the microgrid-level using the S4E solution. The S4E integrates peer-to-peer energy transaction models based on distributed auctions where agents can freely sell or buy energy among them, as described in section III.4.4. The auctions are fully distributed and do not demand external supervision, the auctions are carried out by the sellers.
Question Q5 was successfully addressed, and it has been proven that auction-based peer-to-peer energy transaction models can be implemented in a microgrid, promoting the balance between consumption and generation, increasing the use of local generation, decreasing the energy demanded from the main grid, and decreasing the microgrid and end-users’ energy costs.
Finally, the main research question, Q0, “Can a multi-agent system represent end-users in a microgrid, providing services for energy management, demand-side management, and transactive energy while deployed in multiple single-board computers spread among end-users?” has been fully addressed with the conceived, developed, and tested S4E solution. The S4E proves that a single SBC can efficiently manage the end-user’s energy loads and resources, and represent the end-user’s goals in a microgrid context. To prove its efficiency, a context-aware cyber-physical real-time resource optimization algorithm for consumption and generation balance in end-user-side was conceived and integrated into S4E, test results are presented in section IV.4.1. Also, several deployments of S4E were able to perform and test auction-based peer-to-peer energy transactions in a microgrid using cooperative and/or competitive agents’ behaviours, as presented in section IV.4.2. The test results on the pilot site were so promising that they allowed the S4E solution to go a step forward, being deployed in three residential houses. The deployment in residential houses and the performance of S4E agents are shown in section IV.4.3.
The successfully addressing and proven of the main research question, Q0, culminated in µGIM solution, a complete microgrid intelligent management system based on a multi-agent approach and the active participation of end-users.
Proposed solutions
Nowadays, there is a large gap between market available solutions and scientific developments regarding smart grids, namely in microgrids, energy management systems, and demand-side management solutions. This gap should be shortened or eliminated in order to deploy scientific breakthroughs in the real world, benefiting end-users. To shorten this gap, the advances proposed in the scientific community must be tested and validated using real scenarios and pilot sites. This PhD research went beyond the state-of-the-art by conceiving, developing, and testing three novel solutions that were able to bring the new scientifically models proposed in this PhD research to reality, such as auction-based peer-to-peer energy transaction models. The solutions were conceived to work beyond this PhD research as they allow the test and validation of many more concepts, shortening the gap between market solutions and scientific developments.
Together, V2R, EnAPlug, and S4E solutions create the GIM solution. These three solutions were conceived, developed, and tested to integrate energy-related methodologies focusing on end-users
and microgrids. They can be used together or separately. For instance, in a research laboratory, GIM enables the built of microgrids using V2R emulators and S4E for end-users’ representation and

135
microgrid management. Also, EnAPlugs can be deployed in buildings and be integrated into the microgrid using S4E agents.
With GIM, the new energy-related methodologies proposed in this PhD research can now be deployed in end-users. However, the main innovation brought by this PhD research is not limited to
the proposed methodologies, as, with the proposed GIM, it also reduces the gap between literature
proposed solutions and real implemented solutions. With GIM, it is also possible to test and validate new innovative energy-related methodologies, even if developed by third-parties, in pilot-sites. This contributes to the evolution of power and energy systems towards the successful implementation of smart grid concepts in practice.
V.1.2.1. Conclusions regarding V2R emulator
V2R is a solution that allows the emulation of energy analysers. The test and validation of energy management systems in a laboratory environment brings some issues, such as the lack of available residential electric loads and energy resources. The V2R makes it possible to bring unavailable and unreachable electric loads and energy resources to laboratories, enabling the efficient test and validation of energy management systems in laboratory environments. By integrating Modbus/RTU protocol, the V2R emulator can be used with supervisory control and data acquisition (SCADA) systems, and energy management systems (EMSs).
The V2R emulator emulates an energy analyser, but inside it provides energy resource/load simulation, emulation, and representation. Simulations are performed by software, emulations use real measured data, and representations mirror real remote loads or resources. The results of this open source solution, described and presented in this thesis, show the efficiency of V2R emulators. Three experimentations were performed to prove the capabilities of V2R emulators, demonstrating its capacity to simulate and emulated electrical loads, to be integrated into a SCADA system, and to be integrated into an EMS.
The V2R prototype was demonstrated in operational environment, reaching TRL 7 (technology readiness level20). During the PhD research, several V2R emulators were regularly used to create realistic scenarios that allowed the testing and validation of the proposed systems. The conception, development, and test of V2R emulator represented a contribution to the state-of-the-art by being the first low-cost do it yourself (DIY) energy analyser emulator that allows the easy testing and validation of EMS. The V2R emulator has, so far, resulted in four publications: two workshops, one conference, and one journal (IF: 3.347).
V.1.2.2. Conclusions regarding EnAPlug
EnAPlug is an IoT solution conceived and developed to be aware of its context, to learn from contexts and user interactions, and to share its knowledge, promoting distributed energy management systems. IoT devices can and should be used as enablers for EMSs and demand-side management solutions. The ability to be remotely monitored and controlled enables their use in smart homes and EMSs. In current buildings, especially residential ones, it is common to find IoT devices, such as smart televisions, smart lights, and smart plugs. However, these IoT devices are not able to provide contextual information. Therefore, EnAPlug was conceived, developed, and tested to enable a suitable, almost perfect, integration of IoT devices into EMSs. Not only are EnAPlugs able to provide contextual information, but they can also learn how and when users interact with the controllable load.
The learning abilities of EnAPlug showed to be very promising, achieving high values of accuracy. So much so, that it was possible to develop a distributed management system where EnAPlugs share knowledge among them and optimize the use of their controllable loads according to the community knowledge (i.e., knowledge from other EnAPlugs). During this PhD research, two versions of EnAPlugs
20 Nine-level maturity scale used in European Union Research and Innovation programme Horizon 2020

Luis Gomes
136
were conceived, developed, and tested. The EnAPlug AM is an open source solution that uses an Arduino board. The EnAPlug SB uses an SBC and it can learn and share its knowledge using a multi-agent system. The results of EnAPlug SB surpassed the expectations and showed the potential of future development around this context-aware solution. Three experimentations were performed with EnAPlug, demonstrating its capacity to monitor the controllable load context, to learn from the user interaction and historical data, and to share its knowledge to promote a distributed management system.
Two EnAPlug prototypes were successfully deployed in the research centre, been in operation ever since, putting EnAPlug solution at TRL 7. The conception, development, and test of EnAPlugs went beyond the state-of-the-art regarding smart plugs and IoT devices, by promoting context-aware devices capable of learning from the controllable electrical load and user interactions. The EnAPlugs has, so far, resulted in four publications: two conferences, and two journals (IF: 3.031, and 2.707).
V.1.2.3. Conclusions regarding S4E
The main solution of this PhD research was the conceived, developed, and tested S4E. This agent-based solution running in SBCs is low-cost and easy to install. The S4E is a complete solution that enables the test and validation of scientific energy-related models and methodologies in microgrids and end-users’ buildings. This distributed system is the only known state-of-the-art solution built from bottom-up, from the individual end-user to the microgrid.
The S4E is a multi-agent system, where each end-user is represented by an agent. Each agent of the S4E system enables the integration of electrical loads and energy resources, as well as any type of sensors. Agents are able to provide an energy management solution for demand-side management in the end-user-side. The proposed solution uses SBCs and IoT devices to boost the use of demand-side management models and transactive energy models.
The S4E is the only known solution able to be deployed in a single building, using a standalone agent, and in a microgrid, using a multi-agent system. The independency shown by S4E, enables the system to work as an independent EMS, disconnected from any multi-agent system. Inside a community of agents, the S4E can also participate in transactive energy programs. The deployment capabilities were tested during this PhD research, where S4E agents were deployed in a microgrid with five players, and in three residential houses. These experimentations showed the abilities of S4E and enabled the testing and validation of energy-related methodologies, such as forecasting algorithms, an algorithm for consumption and generation balance, and peer-to-peer energy transaction auctions. The S4E is the first complete solution for microgrid management and end-user representation conceived from the end-user to the microgrid.
The S4E solution was demonstrated in relevant environments, reaching the TRL 6. Three S4E agents, together with their SBCs, were deployed in three residential houses for two months, and five S4E agents were deployed in the research centre at M29, been in operation ever since with minor errors and bugs. The conception, development, and test of S4E contributed to the state-of-the-art by being the first end-user-centred system able to integrate and manage electrical loads, energy resources, and sensing, and one of the first agent-based complete solutions for microgrid management capable of handling pilot sites and unsupervised environments. The S4E has a significant contribution to the test and validation of energy-related concepts for end-users and microgrids, such as transactive energy models and demand response programs. The S4E has, so far, resulted in four journal publications (IF: 3.347, 6.395, 2.791, and 4.098). The deployments and tests of S4E, resulted in the publication of five datasets.
V.2. Looking forward
Several developments made in the scope of this PhD research had the goal of creating prototypes that would enable the test and validation of the conceived solutions. Therefore, V2R emulators,
137
EnAPlug, and S4E are not in their final stage of maturity and they can and should be improved and evolved. The below sections address some envisaged future developments for the three systems.
Beside future technological developments, this PhD research opens new opportunities for master thesis proposals, such as the modelling and validation of multiple peer-to-peer energy transaction models, the study and conception of distributed microgrid management methodologies, and the conception of a seamless integration of IoT devices in energy management systems. These research
works, supported by GIM solution, can result in major contributions to the power and energy field, providing new models and methodologies for microgrids, transactive energy, and energy
management systems. The GIM solution can also be the base of new PhD research works, such as the conception of self-explainable artificial intelligence methodologies based on contexts to manage microgrids using transactive energy, and the conception of a semantic reasoning end-user energy management system that can interact with other end-users to optimize energy use and reduce energy costs.
V2R emulator
Currently, the V2R emulators enable the simulation, emulation, and representation of electrical loads and energy resources, lacking the possibility of having emulation of storage units. This should be considered in future developments. The use of batteries brings advantages for buildings with renewable generation. However, the high cost of batteries is a barrier for laboratory experimentation that aims at demonstrating the benefits of these resources in energy management systems. The V2R emulator could remove the price barrier and provide battery emulation. Other simulation models can also be conceived to enable sensor simulations (e.g. a temperature sensor).
The V2R emulator uses the Modbus/RTU protocol, which is widely used. However, more protocols should be provided in V2R. In the future, there should be multiple versions of V2R emulators to address other protocols, such as BACNET, KNX, or MQTT.
Regarding the dissemination of V2R, new scientific publications should be made, and a white paper should be published. The use of V2R emulator should be promoted near research and development (R&D) projects, including funded projects, to help other researchers during the laboratory testing and validation.
EnAPlug
The EnAPlug was proposed in order to enable the availability of data and information regarding the context and usage of an electrical load. The proposed solution has two versions: a microcontroller version (EnAPlug AM), and an SBC version (EnAPlug SB). EnAPlug AM was released as an open source solution, while EnAPlug SB was not yet been released. The evolution of EnAPlugs, both AM and SB, requires the minimization of hardware and product design, promoting its easy installation. Currently, EnAPlug requires a large box to accommodate its hardware. The hardware must be minimized to use surface-mount device (SMD) components and a new box should be designed.
Regarding scientific contributions, EnAPlug can provide data to energy management systems, receive a distributed energy management system, or perform local context-aware control. The integration of SBCs places EnAPlugs ahead of current smart plugs. Future implementations could create EnAPlug intelligent communities that can even eliminate the need of centralized solutions in the end-user-side for energy management and end-user representation in the smart grid context, promoting a complete distributed approach where several IoT devices can manage the end-user’s electrical loads and energy resources while providing communication to other end-users and players.
The evolution of EnAPlug will improve the local computation capabilities and enable its easy installation. This solution can easily be used to test and validate energy management systems and its architecture can contribute to the development of new context-aware IoT devices. Additional scientific publications should be made considering new applications and the integration of new management and learning models.

Luis Gomes
138
S4E
The S4E system was conceived to enable the integration of multiple energy-related concepts, such as energy management systems, demand response programs, automated demand response, and transactive energy. The architecture of S4E enables its growth in several of its modules, such as resource integration, user graphical interface, energy management models, peer-to-peer energy transactions, and automated demand response.
The demonstrated capabilities of S4E shown promising results but fall short on its truly potential. The prototype developed during this PhD research can have significant improvements by using information and knowledge instead of raw data. As examples, energy management can use contextual information and learned user interactions to promote an intelligent energy management system, transactive energy decisions can be made using game theory, and ontology-based communications can be added to enable the end-user-agent exploitation of opportunities, such as new energy aggregators and available demand response programs.
Two key aspects of S4E are its versatility and simplicity. To increase its use, a new programming language is being conceived to enable the easy and fast creation of new energy strategies. This will enable the fast creation of new energy strategies by people without a programming background, promoting the massive implementation of energy-related models for end-users and microgrids. The S4E solution should also consider the integration of knowledge-based models using ontologies to describe the building, electrical loads, energy resources, communications, etc. The first step in this direction was made in (Santos, 2020) where collaboration was made to propose an energy management system supported by reasoning.
To simplify the use of third-party open source platforms for home automation, such as Home Assistant, an S4E connector for those platforms can be developed as a component/plug-in to enable an improved integration among systems. This benefits S4E solution, providing seamless integration with open source platforms for home automation. And it benefits home automation platforms, providing an energy management solution and enable the platform to have active participation in microgrids and smart grids.
To promote the S4E continued evolution, the S4E will be used regularly in GECAD research centre and it will be included in R&D projects and project proposals. The availability of S4E as an open source solution, similarly to RIAPS and VOLTTRON, is also being studied for future releases. New partnerships will also be pursuit and established in order to disseminate the S4E solution among stakeholders.
139
References
(Abrishambaf, 2016) O. Abrishambaf, M. A. F. Ghazvini, L. Gomes, P. Faria, Z. Vale and J. M. Corchado, "Application of a Home Energy Management System for Incentive-Based Demand Response Program Implementation," 2016 27th International Workshop on Database and Expert Systems Applications (DEXA), Porto, 2016, pp. 153-157. doi: 10.1109/DEXA.2016.043
(Abrishambaf, 2016) Omid Abrishambaf, Pedro Faria, Luis Gomes, João Spínola, Zita Vale, Juan M. Corchado, “Implementation of a Real-Time Microgrid Simulation Platform Based on Centralized and Distributed Management”, in Energies, vol. 10, pp. 806, 26 Fev. 2017. Doi: 10.3390/en10060806
(Abrishambaf, 2016a) Omid Abrishambaf, Fernando Lezama, Pedro Faria, Zita Vale, “Towards transactive energy systems: An analysis on current trends”, Energy Strategy Reviews, Volume 26, 2019, 100418. Doi: 10.1016/j.esr.2019.100418
(Akyol, 2016) B. Akyol, C.H. Allwardt, Z.W. Beech, J.B. Chapman, J.N. Haack, S. Katipamula, R.G. Lutes, K.E. Monson, “VOLTTRONtm 2016”, June 2016, PNNL-25499 (accessed 23/03/2019) https://volttron.org/sites/default/files/publications/PNNL-25499_VOLTTRON_2016.pdf
(Al-Ali, 2017) A. R. Al-Ali, I. A. Zualkernan, M. Rashid, R. Gupta and M. Alikarar, "A smart home energy management system using IoT and big data analytics approach," in IEEE Transactions on Consumer Electronics, vol. 63, no. 4, pp. 426-434, November 2017. doi: 10.1109/TCE.2017.015014
(Alam, 2019) Muhammad Raisul Alam, Marc St-Hilaire, Thomas Kunz, “Peer-to-peer energy trading among smart homes”, Applied Energy, Volume 238, 2019, pp. 1434-1443. doi: 10.1016/j.apenergy.2019.01.091
Luis Gomes
140
(Almeida, 2017) J. Almeida, C. Silvestre and A. Pascoal, "Synchronization of Multiagent Systems Using Event-Triggered and Self-Triggered Broadcasts," in IEEE Transactions on Automatic Control, vol. 62, no. 9, pp. 4741-4746, Sept. 2017. doi: 10.1109/TAC.2017.2671029
(Alquthami, 2018) Alquthami, T.; Meliopoulos, A.P.S. Smart House Management and Control Without Customer Inconvenience. IEEE Trans. Smart Grid 2018, 9, 2553–2562, doi:10.1109/TSG.2016.2614708
(Amicarelli, 2016) E. Amicarelli, Q. T. Tran and S. Bacha, "Multi-agent system for day-ahead energy management of microgrid," 2016 18th European Conference on Power Electronics and Applications (EPE'16 ECCE Europe), Karlsruhe, 2016, pp. 1-10. - http://ieeexplore.ieee.org/document/7695257/
(Anderson, 2011) Anderson, K., Markel, T., Simpson, M., Leahey, J., Rockenbaugh, C., Lisell, L., Burman, K., and Singer, M., “Targeting Net Zero Energy at Fort Carson: Assessment and Recommendations”, Technical report, United States, 2011, doi:10.2172/1027159.
(Anderson, 2017) A. Anderson et al., "Empowering Smart Communities: Electrification, Education, and Sustainable Entrepreneurship in IEEE Smart Village Initiatives," in IEEE Electrification Magazine, vol. 5, no. 2, pp. 6-16, June 2017. doi: 10.1109/MELE.2017.2685738
(Anvari-Moghaddam, 2017)
Amjad Anvari-Moghaddam, Ashkan Rahimi-Kian, Maryam S. Mirian, Josep M. Guerrero, “A multi-agent based energy management solution for integrated buildings and microgrid system”, Applied Energy, vol. 203, 2017, pp. 41-56, https://doi.org/10.1016/j.apenergy.2017.06.007
(Apache, 2004) The Apache Software Foundation, “Apache License, Version 2.0”, January 2004 (accessed on 25/06/2019) https://www.apache.org/licenses/LICENSE-2.0
(Arabali, 2013) A. Arabali, M. Ghofrani, M. Etezadi-Amoli, M. S. Fadali and Y. Baghzouz, "Genetic-Algorithm-Based Optimization Approach for Energy Management," in IEEE Transactions on Power Delivery, vol. 28, no. 1, pp. 162-170, Jan. 2013. doi: 10.1109/TPWRD.2012.2219598
(Azevedo, 2017) R. de Azevedo, M. H. Cintuglu, T. Ma and O. A. Mohammed, "Multiagent-Based Optimal Microgrid Control Using Fully Distributed Diffusion Strategy," in IEEE Transactions on Smart Grid, vol. 8, no. 4, pp. 1997-2008, July 2017. - http://ieeexplore.ieee.org/document/7505976/
(Barbato, 2012) A. Barbato and G. Carpentieri, "Model and algorithms for the real time management of residential electricity demand," 2012 IEEE International Energy Conference and Exhibition (ENERGYCON), Florence, 2012, pp. 701-706. doi: 10.1109/EnergyCon.2012.6348242
(Barbierato, 2019) L. Barbierato et al., "A Distributed IoT Infrastructure to Test and Deploy Real-Time Demand Response in Smart Grids," in IEEE Internet of Things Journal, vol. 6, no. 1, pp. 1136-1146, Feb. 2019. doi: 10.1109/JIOT.2018.2867511
141
(Barrett, 2013) Steven F. Barrett, "Arduino Microcontroller Processing for Everyone!: Third Edition," in Arduino Microcontroller Processing for Everyone!: Third Edition, Morgan & Claypool, 2013, 10.2200/S00522ED1V01Y201307DCS043
(Bayat, 2015) M. Bayat, K. Sheshyekani and A. Rezazadeh, "A Unified Framework for Participation of Responsive End-User Devices in Voltage and Frequency Control of the Smart Grid," in IEEE Transactions on Power Systems, vol. 30, no. 3, pp. 1369-1379, May 2015. doi: 10.1109/TPWRS.2014.2344133
(Bevrani, 2016) H. Bevrani, M. R. Feizi and S. Ataee, "Robust Frequency Control in an Islanded Microgrid:${H} _{\infty }$and$\mu $-Synthesis Approaches," in IEEE Transactions on Smart Grid, vol. 7, no. 2, pp. 706-717, March 2016. doi: 10.1109/TSG.2015.2446984
(Bhandakkar, 2018) Bhandakkar, A. A., & Mathew, L. (2018). Real-Time-Simulation of IEEE-5-Bus Network on OPAL-RT-OP4510 Simulator. IOP Conference Series: Materials Science and Engineering, 331(1), 12028.
(Bourazeri, 2018) Aikaterini Bourazeri, Jeremy Pitt, “Collective attention and active consumer participation in community energy systems, International Journal of Human-Computer Studies”, vol. 119, 2018, pp. 1-11, https://doi.org/10.1016/j.ijhcs.2018.06.001
(Brandherm, 2012) B. Brandherm, J. Baus and J. Frey, "Peer Energy Cloud -- Civil Marketplace for Trading Renewable Energies," 2012 Eighth International Conference on Intelligent Environments, Guanajuato, 2012, pp. 375-378. doi: 10.1109/IE.2012.46
(Brunner, 2019) Florian David Brunner, W.P.M.H. Heemels, Frank Allgöwer, “Event-triggered and self-triggered control for linear systems based on reachable sets”, Automatica, vol. 101, 2019, Pages 15-26. https://doi.org/10.1016/j.automatica.2018.11.035
(Bychkov, 2017) I. Bychkov, G. Oparin, A. Tchernykh, A. Feoktistov, V. Bogdanova, S. Gorsky, “Conceptual Model of Problem-oriented Heterogeneous Distributed Computing Environment with Multi-agent Management, Procedia Computer Science”, vol. 103, 2017, pp. 162-167, https://doi.org/10.1016/j.procs.2017.01.043
(Campbell, 2018) Alexia Fernández Campbell, Aug 15, 2018 https://www.vox.com/identities/2018/8/15/17692414/puerto-rico-power-electricity-restored-hurricane-maria
(Cardwell, 2017) Diane Cardwell, “Solar Experiment Lets Neighbors Trade Energy Among Themselves”, The New York Time, 13 March 2017 (accessed 23/03/2019) https://www.nytimes.com/2017/03/13/business/energy-environment/brooklyn-solar-grid-energy-trading.html
(Chalise, 2016) Santosh Chalise, Jason Sternhagen, Timothy M. Hansen, Reinaldo Tonkoski, “Energy management of remote microgrids considering battery lifetime”, The Electricity Journal, vol. 29, Issue 6, 2016, pp. 1-10, https://doi.org/10.1016/j.tej.2016.07.003

Luis Gomes
142
(Chatzivasiliadis, 2008)
S. J. Chatzivasiliadis, N. D. Hatziargyriou and A. L. Dimeas, "Development of an agent based intelligent control system for microgrids," 2008 IEEE Power and Energy Society General Meeting - Conversion and Delivery of Electrical Energy in the 21st Century, Pittsburgh, PA, 2008, pp. 1-6. - http://ieeexplore.ieee.org/document/4596481/
(Chen, 2016) H. Chen, P. Xuan, Y. Wang, K. Tan and X. Jin, "Key Technologies for Integration of Multitype Renewable Energy Sources—Research on Multi-Timeframe Robust Scheduling/Dispatch," in IEEE Transactions on Smart Grid, vol. 7, no. 1, pp. 471-480, Jan. 2016. doi: 10.1109/TSG.2015.2388756
(Chmiel, 2015) Z. Chmiel, and S. C. Bhattacharyya, “Analysis of off-grid electricity system at Isle of Eigg (Scotland): Lessons for developing countries,” Renewable Energy, vol. 81, pp. 578-588, Sep. 2015.
(Choi, 2019) Ki-Young Choi, Sang-Il Kim, Sang-Hyuk Jung, Rae-Young Kim, “Selective frequency synchronization technique for fast grid connection of islanded microgrid using prediction method”, International Journal of Electrical Power & Energy Systems, vol. 111, 2019, pp. 114-124, https://doi.org/10.1016/j.ijepes.2019.03.063
(Cintuglu, 2018) M. H. Cintuglu, T. Youssef and O. A. Mohammed, "Development and Application of a Real-Time Testbed for Multiagent System Interoperability: A Case Study on Hierarchical Microgrid Control," in IEEE Transactions on Smart Grid, vol. 9, no. 3, pp. 1759-1768, May 2018. doi: 10.1109/TSG.2016.2599265
(Coelho, 2017) Vitor N. Coelho, Miri Weiss Cohen, Igor M. Coelho, Nian Liu, Frederico Gadelha Guimarães, “Multi-agent systems applied for energy systems integration: State-of-the-art applications and trends in microgrids, Applied Energy”, vol. 187, 2017, pp. 820-832, https://doi.org/10.1016/j.apenergy.2016.10.056
(Colson, 2011) C. M. Colson and M. H. Nehrir, "Algorithms for distributed decision-making for multi-agent microgrid power management," 2011 IEEE Power and Energy Society General Meeting, San Diego, CA, 2011, pp. 1-8. - http://ieeexplore.ieee.org/document/6039764/
(Columbus, 2018) Louis Columbus, “IoT Market Predicted To Double By 2021, Reaching $520B”, Forbes, 16 August 2018 (accessed on 11/06/2019) https://www.forbes.com/sites/louiscolumbus/2018/08/16/iot-market-predicted-to-double-by-2021-reaching-520b/#5afa01361f94
(Corbin, 2016) C.D. Corbin, A. Makhmalbaf, S. Huang, V.V. Mendon, M. Zhao, S. Somasundaram, G. Liu, H. Ngo, S. Katipamula, “Transactive Control of Commercial Building HVAC Systems”, December 2016, PNNL-26083 (accessed 23/03/2019) https://www.pnnl.gov/main/publications/external/technical_reports/PNNL-26083.pdf
(Correa-Florez, 2018) C. A. Correa-Florez, A. Michiorri, G. Kariniotakis, “Robust optimization for day-ahead market participation of smart-home aggregators,”
143
Applied Energy, vol. 229, 2018, pp. 433-445. doi: 10.1016/j.apenergy.2018.07.120
(Daily, 2008) Daily, M. The New Smart Plug That Will Switch Off the TV If You Forget. 2 January 2008. Available online: https://www.dailymail.co.uk/sciencetech/article-505613/The-new-smart-plug-switch-TV-forget.html (accessed on 25 September 2018)
(Datta, 2014) Datta, S.K.; Bonnet, C.; Nikaein, N. An IoT gateway centric architecture to provide novel M2M services In Proceedings of the 2014 IEEE World Forum on Internet of Things (WF-IoT), Seoul, Korea, 6–8 March 2014; pp. 514–519, doi:10.1109/WF-IoT.2014.6803221
(De Silva, 2018) V. De Silva, J. Roche, X. Shi and A. Kondoz, "IoT Driven Ambient Intelligence Architecture for Indoor Intelligent Mobility," 2018 IEEE 16th Intl Conf on Dependable, Autonomic and Secure Computing, 16th Intl Conf on Pervasive Intelligence and Computing, 4th Intl Conf on Big Data Intelligence and Computing and Cyber Science and Technology Congress(DASC/PiCom/DataCom/CyberSciTech), Athens, 2018, pp. 451-456. doi: 10.1109/DASC/PiCom/DataCom/CyberSciTec.2018.00090
(dEF-Pi, 2019) dEF-Pi team, “dEF-Pi: Distributed Energy Flexibility Platform & Interface”, (accessed on 13/06/2019) https://fan-ci.sensorlab.tno.nl/builds/defpi-documentation/master/html/
(Digra, 2013) Rohit Kumar Digra and R. K. Pandey, "Multi-agent control coordination of Microgrid," 2013 Students Conference on Engineering and Systems (SCES), Allahabad, 2013, pp. 1-5. - http://ieeexplore.ieee.org/document/6547573/
(DL4J, 2019a) Deep Learning for Java, (accessed 18/06/2019) https://deeplearning4j.org
(DL4J, 2019b) Deep Learning for Java - Early Stopping, (accessed 18/06/2019) https://deeplearning4j.org/docs/latest/deeplearning4j-nn-early-stopping
(Dou, 2013) C. X. Dou and B. Liu, "Multi-Agent Based Hierarchical Hybrid Control for Smart Microgrid," in IEEE Transactions on Smart Grid, vol. 4, no. 2, pp. 771-778, June 2013. - http://ieeexplore.ieee.org/document/6416113/
(Dou, 2014) Chun-xia Dou, Da-wei Hao, Bao Jin, Wei-qian Wang, Na An, “Multi-agent-system-based decentralized coordinated control for large power systems,” International Journal of Electrical Power & Energy Systems, Volume 58, 2014, Pages 130-139. https://www.sciencedirect.com/science/article/pii/S0142061514000222
(Dou, 2016) C. Dou, D. Yue, X. Li and Y. Xue, "MAS-Based Management and Control Strategies for Integrated Hybrid Energy System," in IEEE Transactions on Industrial Informatics, vol. 12, no. 4, pp. 1332-1349, Aug. 2016. - http://ieeexplore.ieee.org/document/7470456/
Luis Gomes
144
(Drakontaidis, 2018) S. Drakontaidis, M. Stanchi, G. Glazer, J. Hussey, A. S. Leger and S. J. Matthews, "Towards Energy-Proportional Anomaly Detection in the Smart Grid," 2018 IEEE High Performance extreme Computing Conference (HPEC), Waltham, MA, 2018, pp. 1-7. doi: 10.1109/HPEC.2018.8547695
(Du, 2018) Y. Du, H. Tu, S. Lukic, A. Dubey and G. Karsai, "Distributed Microgrid Synchronization Strategy Using a Novel Information Architecture Platform," 2018 IEEE Energy Conversion Congress and Exposition (ECCE), Portland, OR, 2018, pp. 2060-2066. doi: 10.1109/ECCE.2018.8557695
(Dubey, 2011) A. Dubey, G. Karsai, and N. Mahadevan, “A Component Model for Hard Real-time Systems: CCM with ARINC-653,” Software: Practiceand Experience, vol. 41, no. 12, pp. 1517–1550, 2011.
(Eclipse Foundation, 2019)
Eclipse Foundation, “Eclipse Public License - v 2.0”, (accessed on 25/06/2019) https://www.eclipse.org/legal/epl-2.0/
(Eghtedarpour, 2014) N. Eghtedarpour and E. Farjah, "Power Control and Management in a Hybrid AC/DC Microgrid," in IEEE Transactions on Smart Grid, vol. 5, no. 3, pp. 1494-1505, May 2014. doi: 10.1109/TSG.2013.2294275
(Eid, 2016) Cherrelle Eid, Elta Koliou, Mercedes Valles, Javier Reneses, Rudi Hakvoort, “Time-based pricing and electricity demand response: Existing barriers and next steps”, Utilities Policy, vol. 40, 2016, pp. 15-25, https://doi.org/10.1016/j.jup.2016.04.001
(Eisele, 2017a) S. Eisele, I. Mardari, A. Dubey and G. Karsai, "RIAPS: Resilient Information Architecture Platform for Decentralized Smart Systems," 2017 IEEE 20th International Symposium on Real-Time Distributed Computing (ISORC), Toronto, ON, 2017, pp. 125-132. doi: 10.1109/ISORC.2017.22
(Eisele, 2017b) S. Eisele, A. Dubey, G. Karsai and S. Lukic, "WiP Abstract: Transactive Energy Demo with RIAPS Platform," 2017 ACM/IEEE 8th International Conference on Cyber-Physical Systems (ICCPS), Pittsburgh, PA, 2017, pp. 91-92.
(Electric Power Research Institute, 2019)
Electric Power Research Institute, “EPRI Product Abstract – OpenADR 2.0b Open Source Virtual Top Node (OADR2.0b VTN) Version 0.9.7.0”, (accessed 13/06/2019) https://www.epri.com/#/pages/product/3002007431/?lang=en-US
(Erdinc, 2015) O. Erdinc, N. G. Paterakis, T. D. P. Mendes, A. G. Bakirtzis and J. P. S. Catalão, "Smart Household Operation Considering Bi-Directional EV and ESS Utilization by Real-Time Pricing-Based DR," in IEEE Transactions on Smart Grid, vol. 6, no. 3, pp. 1281-1291, May 2015. doi: 10.1109/TSG.2014.2352650
(Eurostat, 2018) Eurostat, “Electricity price statistics”, 2018, (accessed on 20/02/2019) https://ec.europa.eu/eurostat/statistics-explained/index.php/Electricity_price_statistics
(FAN, 2019) FAN, “dEF-Pi: Distributed Energy Flexibility Platform & Interface documentation”, (accessed on 11/06/2019) https://fan-

145
ci.sensorlab.tno.nl/builds/defpi-documentation/master/html/index.html
(Fang, 2012) X. Fang, S. Misra, G. Xue and D. Yang, "Smart Grid — The New and Improved Power Grid: A Survey," in IEEE Communications Surveys & Tutorials, vol. 14, no. 4, pp. 944-980, Fourth Quarter 2012. doi: 10.1109/SURV.2011.101911.00087
(Farhangi, 2010) H. Farhangi, "The path of the smart grid," in IEEE Power and Energy Magazine, vol. 8, no. 1, pp. 18-28, January-February 2010. doi: 10.1109/MPE.2009.934876
(Faria, 2011) P. Faria, Z. Vale, “Demand response in electrical energy supply: An optimal real time pricing approach”, Energy, Volume 36, Issue 8, 2011, Pages 5374-5384. Doi: 10.1016/j.energy.2011.06.049
(Faria, 2014) P. Faria and Z. Vale, "Optimization of generation and aggregated consumption shifting for demand response programs definition," IEEE PES Innovative Smart Grid Technologies, Europe, Istanbul, 2014, pp. 1-6. doi: 10.1109/ISGTEurope.2014.7028926
(Faria, 2016a) Pedro Faria, “Decision support concerning demand response programs design and use in smart grids”, PhD thesis, Universidade de Trás-os-Montes e Alto Douro Escola de Ciências e Tecnologia, Portugal, 2016.
(Faria, 2016b) P. Faria, J. Spínola and Z. Vale, "Aggregation and Remuneration of Electricity Consumers and Producers for the Definition of Demand-Response Programs," in IEEE Transactions on Industrial Informatics, vol. 12, no. 3, pp. 952-961, June 2016. doi: 10.1109/TII.2016.2541542
(Fernandes, 2014) Filipe Fernandes, Hugo Morais, Zita Vale, Carlos Ramos, “Dynamic load management in a smart home to participate in demand response events”, Energy and Buildings, Volume 82, 2014, Pages 592-606. Doi: 10.1016/j.enbuild.2014.07.067
(Fernandes, 2017) Ricardo A. S. Fernandes, L. O. Deus, Luis Gomes, Zita Vale, “Statistics-Based Approach to Enable Consumer Profile Definition for Demand Response Programs”, in: Omatu S., Rodríguez S., Villarrubia G., Faria P., Sitek P., Prieto J. (eds) Distributed Computing and Artificial Intelligence, 14th International Conference. DCAI 2017. Advances in Intelligent Systems and Computing, vol 620. Springer, Cham. Doi: 10.1007/978-3-319-62410-5_8
(Forfia, 2016) Forfia D, Knight M, Melton R. The View from the Top of the Mountain: Building a Community of Practice with the GridWise Transactive Energy Framework. IEEE Power Energy Mag 2016; 14:25–33. doi:10.1109/MPE.2016.2524961
(Farrokhabadi, 2019) M. Farrokhabadi, C. A. Canizares, J. W. Simpson-Porco, E. Nasr, L. Fan, P. Mendoza-Araya, R. Tonkoski, U. Tamrakar, N. D. Hatziargyriou, D. Lagos, R. W. Wies, M. Paolone, M. Liserre, L. Meegahapola, M. Kabalan, A. H. Hajimiragha, D. Peralta, M. Elizondo, K. P. Schneider, F. Tuffner, J. T. Reilly, "Microgrid Stability Definitions, Analysis, and Examples," in IEEE Transactions on Power Systems. doi: 10.1109/TPWRS.2019.2925703
Luis Gomes
146
(Francklyn, 2018) Lili Francklyn, “Inside the World’s Most Advanced Microgrid: The University of California San Diego”, Homer Microgrid News, 12 November 2018, (accessed on 14/06/2019) https://microgridnews.com/inside-the-worlds-most-advanced-microgrid-university-of-california-san-diego/
(Frustaci, 2018) M. Frustaci, P. Pace, G. Aloi and G. Fortino, "Evaluating Critical Security Issues of the IoT World: Present and Future Challenges," in IEEE Internet of Things Journal, vol. 5, no. 4, pp. 2483-2495, Aug. 2018. doi: 10.1109/JIOT.2017.2767291
(Fry, 2018) Marrah Fry, “CASE STUDY: Learn more about our live project with BCPG in Bangkok, Thailand”, Medium, 20 November 2018 (accessed 29/03/2019) https://medium.com/power-ledger/case-study-learn-more-about-our-live-project-with-bcpg-in-bangkok-thailand-ab7a31c8b464
(Fuller, 2011) J. C. Fuller, K. P. Schneider and D. Chassin, "Analysis of Residential Demand Response and double-auction markets," 2011 IEEE Power and Energy Society General Meeting, San Diego, CA, 2011, pp. 1-7. doi: 10.1109/PES.2011.6039827
(Galioto, 2014) G. Galioto, N. Galioto, C. Giaconia, L. Giarré, G. Neglia,; I. Tinnirello, “Smart plugs: A low cost solution for programmable control of domestic loads”, in Proceedings of the 2014 AEIT Annual Conference—From Research to Industry: The Need for a More Effective Technology Transfer (AEIT), Trieste, Italy, 18–19 September 2014; pp. 1–6, doi: 10.1109/AEIT.2014.7002015
(Ganu, 2012) T. Ganu et al., "nPlug: A smart plug for alleviating peak loads," 2012 Third International Conference on Future Systems: Where Energy, Computing and Communication Meet (e-Energy), Madrid, 2012, pp. 1-10. doi: 10.1145/2208828.2208858
(Gazafroudi, 2019) Amin Shokri Gazafroudi, João Soares, Mohammad Ali Fotouhi, “Ghazvini, Tiago Pinto, Zita Vale, Juan Manuel Corchado, Stochastic interval-based optimal offering model for residential energy management systems by household owners”, International Journal of Electrical Power & Energy Systems, vol. 105, 2019, pp. 201-219. https://doi.org/10.1016/j.ijepes.2018.08.019
(Ghazvini, 2017) Mohammad Ali Fotouhi Ghazvini, João Soares, Omid Abrishambaf, Rui Castro, Zita Vale, “Demand response implementation in smart households”, Energy and Buildings, vol. 143, 2017, pp. 129-148, https://doi.org/10.1016/j.enbuild.2017.03.020
(Global Market Insights, 2019)
Global Market Insights, “Single Board Computer Market Share 2019-2025 Industry Size Report”, 2019
(Glorot, 2010) Glorot, X.; Bengio, Y. Understanding the difficulty of training deep feedforward neural networks. In Proceedings of the Thirteenth International Conference on Artificial Intelligence and Statistics, Sardinia, Italy, 13–15 May 2010; pp. 249–256

147
(GNU, 1991) GNU, “GNU General Public License: Version 2”, June 1991 (accessed on 25/06/2019) https://www.gnu.org/licenses/old-licenses/gpl-2.0.html
(GNU, 1999) GNU, “GNU Lesser General Public License: Version 2.1”, February 1999 (accessed on 25/06/2019) https://www.gnu.org/licenses/old-licenses/lgpl-2.1.html
(GNU, 2007a) GNU, “GNU General Public License: Version 3”, 29 June 2007 (accessed on 25/06/2019) https://www.gnu.org/licenses/gpl-3.0.html
(GNU, 2007b) GNU, “GNU Lesser General Public License: Version 3”, 29 June 2007 (accessed on 25/06/2019) https://www.gnu.org/licenses/lgpl-3.0.html
(Gochhayat, 2019) Prasad Gochhayat, S.; Kaliyar, P.; Conti, M.; Tiwari, P.; Prasath, V.B.S.; Gupta, D.; Khanna, A. LISA: Lightweight context-aware IoT service architecture. J. Clean. Prod. 2019, 212, 1345–1356. doi:10.1016/j.jclepro.2018.12.096
(Gomes, 2013a) Luis Gomes, F. Fernandes, P. Faria, Z. Vale, C. Ramos, H.Morais, “Contextual Intelligent Load Management Considering Real Time Pricing in a Smart Grid Environment”, Proceedings of 17th International Conference on Intelligent System Applications to Power Systems, Tokyo, Japan, 1-4 July, 2013
(Gomes, 2013b) Luis Gomes, “GAIC: Um sistema inteligente e flexível para simulação e apoio à participação de pequenos e médios consumidores na gestão ativa de cargas no âmbito de smart grids”, Master thesis, 2013
(Gomes, 2014) Luis Gomes, P. Faria, H. Morais, Z. Vale and C. Ramos, "Distributed, Agent-Based Intelligent System for Demand Response Program Simulation in Smart Grids," in IEEE Intelligent Systems, vol. 29, no. 1, pp. 56-65, Jan.-Feb. 2014. doi: 10.1109/MIS.2013.2
(Gomes, 2016) Luis Gomes, Omid Abrishambaf, Pedro Faria, Zita Vale, “Retrofitting Approach for an Automated Load Testbed”, in Proceedings of the Final ELECON Workshop Federal Institute of Santa Catarina (IFSC), 12-14 Sep. 2016.
(Gomes, 2017a) Luis Gomes, Zita Vale, “Computational Platform for Household Simulation and Emulation to Test and Validate Energy Management Methodologies”, in: Demazeau Y., Davidsson P., Bajo J., Vale Z. (eds) Advances in Practical Applications of Cyber-Physical Multi-Agent Systems: The PAAMS Collection. PAAMS 2017. Lecture Notes in Computer Science, vol 10349. Springer, Cham. Doi: 10.1007/978-3-319-59930-4_29
(Gomes, 2017b) Luis Gomes, Zita Vale, “Energy Analyzer Emulation for Energy Management Simulators”. In: Omatu S., Rodríguez S., Villarrubia G., Faria P., Sitek P., Prieto J. (eds) Distributed Computing and Artificial Intelligence, 14th International Conference. DCAI 2017. Advances in Intelligent Systems and Computing, vol 620. Springer, Cham. Doi: 10.1007/978-3-319-62410-5_26
(Gomes, 2017c) Luis Gomes, Zita Vale, “µGIM – Microgrids Intelligent Management System Based on a Multi-agent Approach and the Active Participation on Demand Response”, in: De la Prieta F. et al. (eds) Trends in Cyber-

Luis Gomes
148
Physical Multi-Agent Systems. The PAAMS Collection - 15th International Conference, PAAMS 2017. PAAMS 2017. Advances in Intelligent Systems and Computing, vol 619. Springer, Cham. Doi: 10.1007/978-3-319-61578-3_37
(Gomes, 2017d) Luis Gomes, Filipe Sousa, Zita Vale, “EnAPlug – An Environmental Awareness Plug to Test Energy Management Solutions for Households”, in: Oliveira E., Gama J., Vale Z., Lopes Cardoso H. (eds) Progress in Artificial Intelligence. EPIA 2017. Lecture Notes in Computer Science, vol 10423. Springer, Cham. Doi: 10.1007/978-3-319-65340-2_21.
(Gomes, 2018a) Luis Gomes, Zita Vale, “Virtual to Reality Emulator for Electrical Loads”, in Proceedings of the Intelligent load management in local and wholesale demand response markets – Third DREAM-GO Workshop, 23-24 Jan. 2018.
(Gomes, 2018b) Luis Gomes, Filipe Sousa, Zita Vale, "An Agent-Based IoT System for Intelligent Energy Monitoring in Buildings," in Proceedings of the 2018 IEEE 87th Vehicular Technology Conference (VTC Spring), Porto, 2018, pp. 1-5. Doi: 10.1109/VTCSpring.2018.8417868;
(Gomes, 2018c) Luis Gomes, Filipe Sousa, Zita Vale, “An Intelligent Smart Plug with Shared Knowledge Capabilities”, Sensors (Basel). 2018;18(11):3961. Published 2018 Nov 15. doi:10.3390/s18113961
(Gomes, 2019a) Luis Gomes, P. Faria, Z. A. Vale and J. Silva, "Energy Analyzer Emulator for Microgrid Implementation and Demonstration and Respective Gateway," in IEEE Transactions on Industry Applications, vol. 55, no. 1, pp. 134-144, Jan.-Feb. 2019. doi: 10.1109/TIA.2018.2866451
(Gomes, 2019b) Luis Gomes, “Dataset of uGIM deployed in an office building”, Zenodo, 14 Feb. 2019. doi: 10.5281/zenodo.3237235
(Gomes, 2019c) Luis Gomes, Carlos Ramos, Aria Jozi, Bruno Serra, Lucas Paiva, Zita Vale, “IoH: A Platform for the Intelligence of Home with a Context Awareness and Ambient Intelligence Approach”, in Future Internet, vol. 11, pp. 58, 22 March 2019. Doi: 10.3390/fi11030058
(Gomes, 2019d) Luis Gomes, Filipe Sousa, Tiago Pinto, Zita Vale, “A Residential House Comparative Case Study Using Market Available Smart Plugs and EnAPlugs with Shared Knowledge”, in Energies, vol. 9, pp. 1647, 30 April 2019. Doi: 10.3390/en12091647
(Gomes, 2019e) Luis Gomes, “uGIM: week monitorization data of a microgrid with five agents (10/04/19-16/04/19)”, Zenodo, 16 May 2019. doi: 10.5281/zenodo.2868129
(Gomes, 2019f) Luis Gomes, “uGIM: a week with peer-to-peer transactions (03/06/2019 - 09/06/2019)”, Zenodo, 19 Aug. 2019. doi: 10.5281/zenodo.3371222
(Gomes, 2019g) Luis Gomes, “uGIM: week monitorization data of a microgrid with five agents (04/08/2019 - 10/08/2019)”, Zenodo, 19 Aug. 2019. doi: 10.5281/zenodo.3371339
149
(Gomes, 2019h) Luis Gomes, João Spínola, Zita Vale, Juan M. Corchado, “Agent-based Architecture for Demand Side Management using Real-Time Resources’ Priorities and a Deterministic Optimization Algorithm”, Journal of Cleaner Production, vol. 241, 118154, 20 December 2019. Doi: 10.1016/j.jclepro.2019.118154
(Gomes, 2020a) Luis Gomes, “uGIM: a week with peer-to-peer transactions (02/03/2020 - 08/03/2020)”, (Version 0.1.0) [Data set). Zenodo, 12 March 2020. Doi: 10.5281/zenodo.3707578.
(Gomes, 2020b) Luis Gomes, Zita Vale, Juan M. Corchado, “Microgrid Management System Based on a Multi-Agent Approach: an Office Building Pilot”, Measurement, vol. 154, 107427, 15 March 2020. Doi: 10.1016/j.measurement.2019.107427
(Gomes, 2020c) Luis Gomes, Zita Vale, Juan M. Corchado, “Multi-Agent Microgrid Management System for Single-Board Computers: A Case Study on Peer-to-Peer Energy Trading," in IEEE Access, vol. 8, pp. 64169-64183, 02 April 2020, doi: 10.1109/ACCESS.2020.2985254
(GridWise, 2015) GridWise Architecture Council, “GridWise Transactive Energy Framework (Version 1.0)”, Report, January 2015, (accessed on 14/06/2019) https://www.gridwiseac.org/pdfs/te_framework_report_pnnl-22946.pdf
(Gubbi, 2013) Jayavardhana Gubbi, Rajkumar Buyya, Slaven Marusic, Marimuthu Palaniswami, “Internet of Things (IoT): A vision, architectural elements, and future directions”, Future Generation Computer Systems, vol. 29, Issue 7, 2013, pp. 1645-1660, https://doi.org/10.1016/j.future.2013.01.010
(Haff, 2019) Gordon Haff, “The mysterious history of the MIT License”, Opensource.com, 26 April 2019, (accessed on 25/06/2019) https://opensource.com/article/19/4/history-mit-license
(Hansen, 2016) T. M. Hansen, R. Roche, S. Suryanarayanan, A. A. Maciejewski and H. J. Siegel, "Heuristic optimization for an aggregator-based resource allocation in the smart grid," 2016 IEEE Power and Energy Society General Meeting (PESGM), Boston, MA, 2016, pp. 1-1, doi: 10.1109/PESGM.2016.7741095.
(Hao, 2013) H. Hao, C.D. Corbin, K. Kalsi, R.G. Pratt, Transactive Control of Commercial Buildings for Demand Response, IEEE Trans. Power Syst. 32 (2017) 774–783. doi:10.1109/TPWRS.2016.2559485
(Hasan, 2018) K. N. Hasan, M. Wang and J. V. Milanović, "A Survey on Demand Side Management Potential in South-East Europe to Support Transmission Network Flexibility," 2018 IEEE PES Innovative Smart Grid Technologies Conference Europe (ISGT-Europe), Sarajevo, 2018, pp. 1-6. doi: 10.1109/ISGTEurope.2018.8571693
(Hayes, 2017) B. Hayes, I. Melatti, T. Mancini, M. Prodanovic and E. Tronci, "Residential Demand Management Using Individualized Demand

Luis Gomes
150
Aware Price Policies," in IEEE Transactions on Smart Grid, vol. 8, no. 3, pp. 1284-1294, May 2017. doi: 10.1109/TSG.2016.2596790
(Hayn, 2018) Hayn, M., Zander, A., Fichtner, W. et al. Energy Syst (2018) 9: 759. https://doi.org/10.1007/s12667-018-0278-8
(Heo, 2017) S. Heo, W. Park and I. Lee, "Energy management based on communication of smart plugs and inverter for smart home systems," 2017 International Conference on Information and Communication Technology Convergence (ICTC), Jeju, 2017, pp. 810-812. doi: 10.1109/ICTC.2017.8190788
(Herberg, 2014) U. Herberg, D. Mashima, J. G. Jetcheva and S. Mirzazad-Barijough, "OpenADR 2.0 deployment architectures: Options and implications," 2014 IEEE International Conference on Smart Grid Communications (SmartGridComm), Venice, 2014, pp. 782-787. doi: 10.1109/SmartGridComm.2014.7007743
(Hertzog, 2013) Christine Hertzog, “Smart Grid Dictionary – 5th Edition”, Published by GreenSprint Marketing LLC, November 2013
(Hirose, 2013) K. Hirose, "Behavior of the Sendai Microgrid during and after the 311 Great East Japan Disaster," in Proc. 2013 35th International Telecommunications Energy Conference, SMART POWER AND EFFICIENCY, pp. 1-6.
(Horling, 2004) HORLING, B., & LESSER, V. (2004). A survey of multi-agent organizational paradigms. The Knowledge Engineering Review, 19(4), 281-316. doi:10.1017/S0269888905000317
(Hosseini, 2018) M. Hosseini Imani, Payam Niknejad, M.R. Barzegaran, “The impact of customers’ participation level and various incentive values on implementing emergency demand response program in microgrid operation”, International Journal of Electrical Power & Energy Systems, vol. 96, 2018, pp. 114-125, https://doi.org/10.1016/j.ijepes.2017.09.038
(Hu, 2018) Hu, Y.L.; Chen, L. A nonlinear hybrid wind speed forecasting model using LSTM network, hysteretic ELM and Differential Evolution algorithm. Energy Convers. Manag. 2018, 173, 123–142, doi:10.1016/j.enconman.2018.07.070
(Huang, 2018) Sen Huang, Weimin Wang, Michael R. Brambley, Siddharth Goyal, Wangda Zuo, “An agent-based hardware-in-the-loop simulation framework for building controls,” Energy and Buildings, Volume 181, 2018, Pages 26-37. doi:10.1016/j.enbuild.2018.09.038
(Huang, 2019) Sen Huang, Jianming Lian, He Hao, Srinivas Katipamula, “Transactive Control Design for Commercial Buildings to Provide Demand Response”, IFAC-PapersOnLine, Volume 51, Issue 34, 2019, Pages 151-156. doi: 10.1016/j.ifacol.2019.01.058
(Hubert, 2012) T. Hubert and S. Grijalva, "Modeling for Residential Electricity Optimization in Dynamic Pricing Environments," in IEEE Transactions

151
on Smart Grid, vol. 3, no. 4, pp. 2224-2231, Dec. 2012. doi: 10.1109/TSG.2012.2220385
(Hungerford, 2015) Z. Hungerford, A. Bruce and I. MacGill, "Review of demand side management modelling for application to renewables integration in Australian power markets," 2015 IEEE PES Asia-Pacific Power and Energy Engineering Conference (APPEEC), Brisbane, QLD, 2015, pp. 1-5. doi: 10.1109/APPEEC.2015.7381083
(IEEE Smart Village, 2019)
IEEE Smart Village, “About IEEE Smart Village”, (accessed on 11/06/2019) https://smartvillage.ieee.org/about-ieee-smart-village/
(IEEE Terminology Task Force, 1985)
IEEE Terminology Task Force, "Part I of II Parts Glossary of Terms Related to Load Management," in IEEE Transactions on Power Apparatus and Systems, vol. PAS-104, no. 9, pp. 2381-2386, Sept. 1985. doi: 10.1109/TPAS.1985.318980
(IMARC Group, 2018) Press release, IMARC Group, May 28, 2018. https://energymarkettrends.wordpress.com/2018/05/28/microgrid-market/
(Jimenez-Estevez, 2014)
G. A. Jimenez-Estevez, R. Palma-Behnke, D. Ortiz-Villalba, O. Nunez Mata, and C. Silva Montes, "It Takes a Village: Social SCADA and Approaches to Community Engagement in Isolated Microgrids," IEEE Power and Energy Magazine, vol. 12, pp. 60-69, July-Aug. 2014.
(Jin, 2017) Xiaolong Jin, Jianzhong Wu, Yunfei Mu, Mingshen Wang, Xiandong Xu, Hongjie Jia, “Hierarchical microgrid energy management in an office building”, Applied Energy, vol. 208, 2017, pp. 480-494, https://doi.org/10.1016/j.apenergy.2017.10.002
(Johnson, 2014) Walt Johnson, “Open Source OpenADR 2.0 Project”, online presentation, 14 November 2014 (accessed on 11/06/2019) https://www.openadr.org/assets/epri%20openadr%20demonstration.pdf
(Johnston, 2014) Steven J. Johnston, Philip J. Basford, Colin S. Perkins, Herry Herry, Fung Po Tso, Dimitrios Pezaros, Robert D. Mullins, Eiko Yoneki, Simon J. Cox, Jeremy Singer, “Commodity single board computer clusters and their applications,” Future Generation Computer Systems, Volume 89, 2018, Pages 201-212. doi: 10.1016/j.future.2018.06.048
(Joo, 2017) I. Joo and D. Choi, "Distributed Optimization Framework for Energy Management of Multiple Smart Homes With Distributed Energy Resources," in IEEE Access, vol. 5, pp. 15551-15560, 2017. doi: 10.1109/ACCESS.2017.2734911
(Jozi, 2019a) Jozi, A.; Pinto, T.; Praça, I.; Vale, Z. Decision Support Application for Energy Consumption Forecasting. Appl. Sci. 2019, 9, 699. Doi: 10.3390/app9040699
(Jozi, 2019b) Jozi A., Ramos D., Gomes L., Faria P., Pinto T., Vale Z. (2019) Demonstration of an Energy Consumption Forecasting System for Energy Management in Buildings. In: Moura Oliveira P., Novais P., Reis L. (eds) Progress in Artificial Intelligence. EPIA 2019. Lecture Notes in
Luis Gomes
152
Computer Science, vol 11804. Springer, Cham. Doi: 10.1007/978-3-030-30241-2_39
(Justo, 2013) Jackson John Justo, Francis Mwasilu, Ju Lee, Jin-Woo Jung, “AC-microgrids versus DC-microgrids with distributed energy resources: A review”, Renewable and Sustainable Energy Reviews, vol. 24, 2013, pp. 387-405. Doi: https://doi.org/10.1016/j.rser.2013.03.067
(Karami, 2018) Majid Karami, Gabrielle Viola McMorrow, Liping Wang, “Continuous monitoring of indoor environmental quality using an Arduino-based data acquisition system,” Journal of Building Engineering, Volume 19, 2018, Pages 412-419. doi: 10.1016/j.jobe.2018.05.014
(Karavas, 2015) Christos-Spyridon Karavas, George Kyriakarakos, Konstantinos G. Arvanitis, George Papadakis, “A multi-agent decentralized energy management system based on distributed intelligence for the design and control of autonomous polygeneration microgrids,” Energy Conversion and Management, Volume 103, 2015, Pages 166-179. https://www.sciencedirect.com/science/article/pii/S0196890415005610
(Katipamula, 2015) S. Katipamula, D.D. Hatley, D.J. Hammerstrom, D.P. Chassin RGP. Transactive Controls: Market-Based GridWiseTM Controls for Building Systems 2006
(Katipamula, 2016) S. Katipamula, J. Haack, G. Hernandez, B. Akyol and J. Hagerman, "VOLTTRON: An Open-Source Software Platform of the Future," in IEEE Electrification Magazine, vol. 4, no. 4, pp. 15-22, Dec. 2016. doi: 10.1109/MELE.2016.2614178
(Khan, 2016a) M. Reyasudin Basir Khan, Razali Jidin, Jagadeesh Pasupuleti, “Multi-agent based distributed control architecture for microgrid energy management and optimization”, Energy Conversion and Management, vol. 112, 2016, pp. 288-307, https://doi.org/10.1016/j.enconman.2016.01.011
(Khan, 2016b) Ahsan Raza Khan, Anzar Mahmood, Awais Safdar, Zafar A. Khan, Naveed Ahmed Khan, “Load forecasting, dynamic pricing and DSM in smart grid: A review”, Renewable and Sustainable Energy Reviews, vol. 54, 2016, pp. 1311-1322, https://doi.org/10.1016/j.rser.2015.10.117
(Khan, 2017) Muhammad Waseem Khan, Jie Wang, “The research on multi-agent system for microgrid control and optimization,” Renewable and Sustainable Energy Reviews, Volume 80, 2017, Pages 1399-1411. https://www.sciencedirect.com/science/article/pii/S1364032117309280
(Khorram, 2018) M. Khorram, P. Faria, O. Abrishambaf and Z. Vale, "Lighting Consumption Optimization in an Office Building for Demand Response Participation," 2018 Clemson University Power Systems Conference (PSC), Charleston, SC, USA, 2018, pp. 1-5. doi: 10.1109/PSC.2018.8664077
(Kok, 2013) Koen Kok, “The PowerMatcher: Smart Coordination for the Smart Electricity Grid”, PhD Thesis of Vrije Universiteit, 13 May, 2013
153
(Kok, 2016) K. Kok and S. Widergren, "A Society of Devices: Integrating Intelligent Distributed Resources with Transactive Energy," in IEEE Power and Energy Magazine, vol. 14, no. 3, pp. 34-45, May-June 2016. doi: 10.1109/MPE.2016.2524962
(Lawler, 2012) Richard Lawler, “”, Engadget, 2 February 2012, (accessed on 13/06/2019) https://www.engadget.com/2012/02/29/raspberry-pi-credit-card-sized-linux-pcs-are-on-sale-now-25-mo/?guccounter=1&guce_referrer=aHR0cHM6Ly9wdC53aWtpcGVkaWEub3JnLw&guce_referrer_sig=AQAAAI1Py-H-NJIb5B7gplbhaY_tUBD1_jnUrGW-0bSqpT8VlNPdiyOJAbyBY6zf4wYE7lpw6tbVEM7Roy2_z4MQoBfhWtCCWOSE-SosAUH--u5raUd_LpPKtnys3kZEiit68za6a1qA7dHFkdluslbYuUlpG4FrXDJNyyEBoEE_EcV5
(Lee, 2014) Lee, H.; Park, W.; Lee, I. A Home Energy Management System for Energy-Efficient Smart Homes. In Proceedings of the 2014 International Conference on Computational Science and Computational Intelligence, Las Vegas, NV, USA, 10–13 March 2014; pp. 142–145
(Li, 2018) Min Li, Wenbin Gu, Wei Chen, Yeshen He, Yannian Wu, Yiying Zhang, “Smart Home: Architecture, Technologies and Systems,” Procedia Computer Science, vol. 131, 2018, pp. 393-400. doi: 10.1016/j.procs.2018.04.219
(Li, 2019) Bei Li, Robin Roche, Damien Paire, Abdellatif Miraoui, “A price decision approach for multiple multi-energy-supply microgrids considering demand response”, Energy, Volume 167, 2019, Pages 117-135, doi: 10.1016/j.energy.2018.10.189
(Liu, 2012) X. Liu, L. Ivanescu, R. Kang and M. Maier, "Real-time household load priority scheduling algorithm based on prediction of renewable source availability," in IEEE Transactions on Consumer Electronics, vol. 58, no. 2, pp. 318-326, May 2012.
(Liu, 2014) W. Liu, W. Gu, W. Sheng, X. Meng, Z. Wu and W. Chen, "Decentralized Multi-Agent System-Based Cooperative Frequency Control for Autonomous Microgrids With Communication Constraints," in IEEE Transactions on Sustainable Energy, vol. 5, no. 2, pp. 446-456, April 2014. http://ieeexplore.ieee.org/document/6709671/
(Liu, 2015) Liu, Y.; Yuen, C.; Yu, R.; Zhang, Y.; Xie S. Queuing-Based Energy Consumption Management for Heterogeneous Residential Demands in Smart Grid. IEEE Trans. Smart Grid 2015, 7, 1650–1659, doi:10.1109/TSG.2015.2432571
(Liu, 2017) Liu Z, Wu Q, Huang S, Zhao H. Transactive energy: A review of state of the art and implementation. 2017 IEEE Manchester PowerTech, IEEE; 2017, p. 1–6. doi:10.1109/PTC.2017.7980892
(LO3ENERGY, 2018) LO3ENERGY, “EXERGY – Business Whitepaper”, 24 April 2018 (accessed 29/03/2019) https://lo3energy.com/wp-content/uploads/2018/04/Exergy-BIZWhitepaper-v11.pdf
Luis Gomes
154
(Logenthiran, 2012a) T. Logenthiran, D. Srinivasan, A. M. Khambadkone and H. N. Aung, "Multiagent System for Real-Time Operation of a Microgrid in Real-Time Digital Simulator," in IEEE Transactions on Smart Grid, vol. 3, no. 2, pp. 925-933, June 2012. - http://ieeexplore.ieee.org/document/6180026/
(Logenthiran, 2012b) T. Logenthiran, D. Srinivasan and T. Z. Shun, "Demand Side Management in Smart Grid Using Heuristic Optimization," in IEEE Transactions on Smart Grid, vol. 3, no. 3, pp. 1244-1252, Sept. 2012. doi: 10.1109/TSG.2012.2195686
(Logenthiran, 2015) T. Logenthiran, R. T. Naayagi, W. L. Woo, V. T. Phan and K. Abidi, "Intelligent Control System for Microgrids Using Multiagent System," in IEEE Journal of Emerging and Selected Topics in Power Electronics, vol. 3, no. 4, pp. 1036-1045, Dec. 2015. - http://ieeexplore.ieee.org/document/7120083/
(Long, 2018) Chao Long, Jianzhong Wu, Yue Zhou, Nick Jenkins, “Peer-to-peer energy sharing through a two-stage aggregated battery control in a community Microgrid”, Applied Energy, vol. 226, 2018, pp. 261-276, https://doi.org/10.1016/j.apenergy.2018.05.097
(Mahmood, 2015) A. Mahmood, A. Ahmad, H.T. Javed, Z. Mehmood, Z.A. Khan, U. Qasim, N. Javaid "A Survey of 'User Comfort' in Home Energy Management Systems in Smart Grid," 2015 IEEE 29th International Conference on Advanced Information Networking and Applications Workshops, Gwangiu, 2015, pp. 36-43. doi: 10.1109/WAINA.2015.124
(Malik, 2016) Farhan H. Malik, Matti Lehtonen, “A review: Agents in smart grids,” Electric Power Systems Research, Volume 131, 2016, Pages 71-79, https://doi.org/10.1016/j.epsr.2015.10.004
(Mano, 2016) Leandro Y. Mano, Bruno S. Faiçal, Luis H.V. Nakamura, Pedro H. Gomes, Giampaolo L. Libralon, Rodolfo I. Meneguete, Geraldo P.R. Filho, Gabriel T. Giancristofaro, Gustavo Pessin, Bhaskar Krishnamachari, Jó Ueyama, “Exploiting IoT technologies for enhancing Health Smart Homes through patient identification and emotion recognition”, Computer Communications, vol. 89–90, 2016, pp. 178-190, https://doi.org/10.1016/j.comcom.2016.03.010
(Mansiri, 2018) K. Mansiri, S. Sukchai and C. Sirisamphanwong, "Fuzzy Control Algorithm for Battery Storage and Demand Side Power Management for Economic Operation of the Smart Grid System at Naresuan University, Thailand," in IEEE Access, vol. 6, pp. 32440-32449, 2018. doi: 10.1109/ACCESS.2018.2838581
(Mao, 2014) M. Mao, P. Jin, N. D. Hatziargyriou and L. Chang, "Multiagent-Based Hybrid Energy Management System for Microgrids," in IEEE Transactions on Sustainable Energy, vol. 5, no. 3, pp. 938-946, July 2014. - http://ieeexplore.ieee.org/document/6803054/
(Marnay, 2014) C. Marnay, “Lessons Learned from Microgrid Demonstrations Worldwide”, Technical report, United States, 2014, doi: 10.2172/1210908

155
(Marnay, 2015) C. Marnay, S. Chatzivasileiadis, C. Abbey, R. Iravani, G. Joos, P. Lombardi, P. Mancarella, and J. von Appen, "Microgrid Evolution Roadmap," in Proc. 2015 International Symposium on Smart Electric Distribution Systems and Technologies (EDST), pp. 139-144.
(Marzband, 2013) Mousa Marzband, Andreas Sumper, José Luis Domínguez-García, Ramon Gumara-Ferret, “Experimental validation of a real time energy management system for microgrids in islanded mode using a local day-ahead electricity market and MINLP,” Energy Conversion and Management, Volume 76, 2013, Pages 314-322. https://www.sciencedirect.com/science/article/pii/S019689041300424X
(Mashima, 2016) D. Mashima and Wei-Peng Chen, "Residential demand response system framework leveraging IoT devices," 2016 IEEE International Conference on Smart Grid Communications (SmartGridComm), Sydney, NSW, 2016, pp. 514-520. doi: 10.1109/SmartGridComm.2016.7778813
(Matthews, 2017) S. J. Matthews and A. S. Leger, "Leveraging single board computers for anomaly detection in the smart grid," 2017 IEEE 8th Annual Ubiquitous Computing, Electronics and Mobile Communication Conference (UEMCON), New York, NY, 2017, pp. 437-443. doi: 10.1109/UEMCON.2017.8249031
(McParland, 2011) C. McParland, "OpenADR open source toolkit: Developing open source software for the Smart Grid," 2011 IEEE Power and Energy Society General Meeting, Detroit, MI, USA, 2011, pp. 1-7. doi: 10.1109/PES.2011.6039816
(Mehra, 2018) Varun Mehra, Reja Amatya, Rajeev J. Ram, “Estimating the value of demand-side management in low-cost, solar micro-grids”, Energy, vol. 163, 2018, pp. 74-87, https://doi.org/10.1016/j.energy.2018.07.204
(Mendes, 2011) Gonçalo Mendes, Christos Ioakimidis, Paulo Ferrão, “On the planning and analysis of Integrated Community Energy Systems: A review and survey of available tools”, Renewable and Sustainable Energy Reviews, vol. 15, Issue 9, 2011, pp. 4836-4854, https://doi.org/10.1016/j.rser.2011.07.067
(Microsoft News Center, 2018)
Microsoft News Center, “Microsoft to acquire GitHub for $7.5 billion”,
Microsoft, 4 June 2018 (accessed on 23/06/2019)
https://news.microsoft.com/2018/06/04/microsoft-to-acquire-
github-for-7-5-billion/
(Mikolov, 2012) Aš Mikolov, T. Statistical Language Models Based on Neural Networks. Ph.D. Thesis, Brno University of Technology, Brno, Czech Republic, 2012
(MIT, 2019) MIT License, “The MIT License (MIT)”, (accessed on 25/06/2019) https://mit-license.org/
(Mocnej, 2018) Mocnej, J.; Seah, W.K.G.; Pekar, A.; Zolotova, I. Decentralised IoT Architecture for Efficient Resources Utilisation. IFAC-PapersOnLine 2018, 51, 168–173. doi:10.1016/j.ifacol.2018.07.148

Luis Gomes
156
(Morsali, 2012) H. Morsali, S. M. Shekarabi, K. Ardekani, H. Khayami, A. Fereidunian, M. Ghassemian, H. Lesani, "Smart plugs for building energy management systems," Iranian Conference on Smart Grids, Tehran, 2012, pp. 1-5.
(Morstyn, 2019) T. Morstyn, A. Teytelboym and M. D. Mcculloch, "Bilateral Contract Networks for Peer-to-Peer Energy Trading," in IEEE Transactions on Smart Grid, vol. 10, no. 2, pp. 2026-2035, March 2019. doi: 10.1109/TSG.2017.2786668
(Mozilla, 2009) Mozilla, “Mozilla Public License: Version 2.0”, (accessed on 25/06/2019) https://www.mozilla.org/en-US/MPL/2.0/
(Mukhopadhyay, 2013)
S. Mukhopadhyay, S. K. Soonee, B. Singh and Y. K. Sehgal, "Opportunities and problems of Smart Grids with large penetration of renewable energy - Indian perspective," 2013 IEEE Power & Energy Society General Meeting, Vancouver, BC, 2013, pp. 1-5. doi: 10.1109/PESMG.2013.6672434
(Muruganantham, 2017)
B. Muruganantham, R. Gnanadass, N.P. Padhy, “Challenges with renewable energy sources and storage in practical distribution systems”, Renewable and Sustainable Energy Reviews, vol. 73, 2017, pp. 125-134, https://doi.org/10.1016/j.rser.2017.01.089
(Myers, 2018) Astasia Myers, “2018: The Biggest Year for Open Source Software
Ever!”, in Medium, 12 September 2018, (accessed on 23/06/2019)
https://medium.com/memory-leak/2018-the-biggest-year-for-open-
source-software-ever-68d01b4751a7
(Nagata, 2014) T. Nagata and K. Okamoto, "A multi-agent based optimal operation for microgrid," 2014 IEEE International Conference on Systems, Man, and Cybernetics (SMC), San Diego, CA, 2014, pp. 3791-3796. - http://ieeexplore.ieee.org/document/6974521/
(Naperville Smart Meter Awareness v. City of Naperville, 2018)
Naperville Smart Meter Awareness v. City of Naperville, No. 16-3766 (7th Cir. 2018). (accessed January 21, 2020) https://law.justia.com/cases/federal/appellate-courts/ca7/16-3766/16-3766-2018-08-16.html.
(National Optical Astronomy Observatory, 2019)
National Optical Astronomy Observatory, “Recommended Light Levels (Illuminance) for Outdoor and Indoor Venues”, (accessed on 13/06/2019) https://www.noao.edu/education/QLTkit/ACTIVITY_Documents/Safety/LightLevels_outdoor+indoor.pdf
(Neglia, 2018) G. Neglia, L. Giarré, I. Tinnirello, G. Di Bella, “Teletraffic engineering for direct load control in smart grids”, Sustainable Energy, Grids and Networks, vol. 16, 2018, pp. 167-176, https://doi.org/10.1016/j.segan.2018.07.007
(Nhede, 2016) Nicholas Nhede, “Energy reduction targets to drive demand-side management market”, Smart Energy International, 11 November 2016 (accessed on 11/06/2019) https://www.smart-energy.com/regional-news/north-america/demand-side-management-market-2016-2025/

157
(Noor, 2018) Sana Noor, Miao Guo, Koen H. van Dam, Nilay Shah, Xiaonan Wang, “Energy Demand Side Management with supply constraints: Game theoretic Approach”, Energy Procedia, vol. 145, 2018, pp. 368-373, https://doi.org/10.1016/j.egypro.2018.04.066
(Noor, 2019) Mardiana binti Mohamad Noor, Wan Haslina Hassan, “Current research on Internet of Things (IoT) security: A survey”, Computer Networks, vol. 148, 2019, pp. 283-294, https://doi.org/10.1016/j.comnet.2018.11.025
(Nunna, 2013) H. S. V. S. Kumar Nunna and S. Doolla, "Multiagent-Based Distributed-Energy-Resource Management for Intelligent Microgrids," in IEEE Transactions on Industrial Electronics, vol. 60, no. 4, pp. 1678-1687, April 2013. - http://ieeexplore.ieee.org/document/6179527/
(NVIDIA, 2019) NVIDIA Autonomous Machines, “Getting Started With Jetson Nano Developer Kit”, 2019
(Nwulu, 2017) Nnamdi I. Nwulu, Xiaohua Xia, “Optimal dispatch for a microgrid incorporating renewables and demand response”, Renewable Energy, vol. 101, 2017, pp. 16-28, https://doi.org/10.1016/j.renene.2016.08.026
(Ortmeyer, 2014) Cliff Ortmeyer, “Then and Now: A Brief History of Single Board Computers”, Electronic Design, issue 06, December 2014
(OSI, 2019) Open Source Initiative (OSI), “Open Source Licenses by Category”
(accessed on 12/06/20) https://opensource.org/licenses/category
(Otte, 2013) W. R. Otte, A. Dubey, S. Pradhan, P. Patil, A. Gokhale, G. Karsai, andJ. Willemsen, “F6COM: A Component Model for Resource-Constrained and Dynamic Space-Based Computing Environment,” in Proceedings of the 16th IEEE International Symposium on Object-oriented Real-time Distributed Computing (ISORC’13), Paderborn, Germany, Jun. 2013.
(Overton, 2014) T. W. Overton (Jan. 2014), “New York University Cogeneration Plant, New York City,” POWER magazine (Online). 07/08/2017, Available: http://www.powermag.com/new-york-university-cogeneration-plant-new-york-city
(Ozturk, 2013) Y. Ozturk, D. Senthilkumar, S. Kumar and G. Lee, "An Intelligent Home Energy Management System to Improve Demand Response," in IEEE Transactions on Smart Grid, vol. 4, no. 2, pp. 694-701, June 2013. doi: 10.1109/TSG.2012.2235088
(Palensky, 2011) P. Palensky and D. Dietrich, "Demand Side Management: Demand Response, Intelligent Energy Systems, and Smart Loads," in IEEE Transactions on Industrial Informatics, vol. 7, no. 3, pp. 381-388, Aug. 2011. doi: 10.1109/TII.2011.2158841
(Palma-Behnke, 2011)
R. Palma-Behnke, D. Ortiz, L. Reyes, G. Jiménez-Estévez, and N. Garrido, "A social SCADA approach for a renewable based microgrid — The Huatacondo project," in Proc. 2011 IEEE Power and Energy Society General Meeting, San Diego, pp. 1-7.
Luis Gomes
158
(Paudyal, 2019) P. Paudyal, Zhen Ni, “Smart home energy optimization with incentives compensation from inconvenience for shifting electric appliances,” International Journal of Electrical Power & Energy Systems, vol. 109, 2019, pp. 652-660. doi:10.1016/j.ijepes.2019.02.016
(Petrović, 2017) T. Petrović, H. Morikawa, “Active sensing approach to electrical load classification by smart plug”, in Proceedings of the 2017 IEEE Power & Energy Society Innovative Smart Grid Technologies Conference (ISGT), Washington, DC, USA, 23–26 April 2017; pp. 1–5, doi: 10.1109/ISGT.2017.8086053
(Peytchev, 2016) Evtim Peytchev, Mihail Lyaskov, Kostadin Popovski, and Grisha Spasov. 2016. Home Energy Monitoring System based on Open Source Software and Hardware. In Proceedings of the 17th International Conference on Computer Systems and Technologies 2016 (CompSysTech '16), Boris Rachev and Angel Smrikarov (Eds.). ACM, New York, NY, USA, 145-150. DOI: https://doi.org/10.1145/2983468.2983504
(Pinto, 2016) Tiago Pinto, “Decision support for the strategic behaviour of electricity market players”, PhD thesis, Universidade de Trás-os-Montes e Alto Douro Escola de Ciências e Tecnologia, Portugal, 2016.
(Pinto, 2018) Pinto T., Vale Z., Praça I., Gomes L., Faria P. (2018) Multi-agent Electricity Markets and Smart Grids Simulation with Connection to Real Physical Resources. In: Lopes F., Coelho H. (eds) Electricity Markets with Increasing Levels of Renewable Generation: Structure, Operation, Agent-based Simulation, and Emerging Designs. Studies in Systems, Decision and Control, vol 144. Springer, Cham
(Pipattanasomporn, 2012)
M. Pipattanasomporn, M. Kuzlu and S. Rahman, "An Algorithm for Intelligent Home Energy Management and Demand Response Analysis," in IEEE Transactions on Smart Grid, vol. 3, no. 4, pp. 2166-2173, Dec. 2012. doi: 10.1109/TSG.2012.2201182
(Pitt, 2017) J. Pitt, A. Diaconescu and A. Bourazeri, "Democratisation of the SmartGrid and the active participation of prosumers," 2017 IEEE 26th International Symposium on Industrial Electronics (ISIE), Edinburgh, 2017, pp. 1707-1714. doi: 10.1109/ISIE.2017.8001505
(Pocero, 2017) Lidia Pocero, Dimitrios Amaxilatis, Georgios Mylonas, Ioannis Chatzigiannakis, “Open source IoT meter devices for smart and energy-efficient school buildings”, HardwareX, vol. 1, 2017, pp. 54-67, https://doi.org/10.1016/j.ohx.2017.02.002
(Pourbabak, 2018) H. Pourbabak, J. Luo, T. Chen and W. Su, "A Novel Consensus-Based Distributed Algorithm for Economic Dispatch Based on Local Estimation of Power Mismatch," in IEEE Transactions on Smart Grid, vol. 9, no. 6, pp. 5930-5942, Nov. 2018. doi: 10.1109/TSG.2017.2699084
(Qian, 2013) L. P. Qian, Y. J. A. Zhang, J. Huang and Y. Wu, "Demand Response Management via Real-Time Electricity Price Control in Smart Grids," in IEEE Journal on Selected Areas in Communications, vol. 31, no. 7, pp. 1268-1280, July 2013. doi: 10.1109/JSAC.2013.130710

159
(Quéré, 2018) Le Quéré, C., Andrew, R. M., Friedlingstein, P., Sitch, S., Hauck, J., Pongratz, J., Pickers, P. A., Korsbakken, J. I., Peters, G. P., Canadell, J. G., Arneth, A., Arora, V. K., Barbero, L., Bastos, A., Bopp, L., Chevallier, F., Chini, L. P., Ciais, P., Doney, S. C., Gkritzalis, T., Goll, D. S., Harris, I., Haverd, V., Hoffman, F. M., Hoppema, M., Houghton, R. A., Hurtt, G., Ilyina, T., Jain, A. K., Johannessen, T., Jones, C. D., Kato, E., Keeling, R. F., Goldewijk, K. K., Landschützer, P., Lefèvre, N., Lienert, S., Liu, Z., Lombardozzi, D., Metzl, N., Munro, D. R., Nabel, J. E. M. S., Nakaoka, S.-I., Neill, C., Olsen, A., Ono, T., Patra, P., Peregon, A., Peters, W., Peylin, P., Pfeil, B., Pierrot, D., Poulter, B., Rehder, G., Resplandy, L., Robertson, E., Rocher, M., Rödenbeck, C., Schuster, U., Schwinger, J., Séférian, R., Skjelvan, I., Steinhoff, T., Sutton, A., Tans, P. P., Tian, H., Tilbrook, B., Tubiello, F. N., van der Laan-Luijkx, I. T., van der Werf, G. R., Viovy, N., Walker, A. P., Wiltshire, A. J., Wright, R., Zaehle, S., and Zheng, B.: Global Carbon Budget 2018, Earth Syst. Sci. Data, 10, 2141-2194, https://doi.org/10.5194/essd-10-2141-2018, 2018.
(Raker, 2017) D. Raker, A. Sellers, R. Kini, M. Green, T. Stuart, R. Ellingson, R. Khanna, M. Heben, "Grid Integration of Building Systems and 1 MW Photovoltaic Array using VOLTTRON," 2017 IEEE 44th Photovoltaic Specialist Conference (PVSC), Washington, DC, 2017, pp. 2926-2930. doi: 10.1109/PVSC.2017.8520928
(Raker, 2018) D. Raker, R. Kini, R. Huntsman, M. Green, O. Spaci, T. Stuart, R. Ellingson, R. Khanna, M. Heben, "Transactive Mitigation Of Variability In The Output Of 1 MW Photovoltaic Array Using VolttronTM," 2018 IEEE 7th World Conference on Photovoltaic Energy Conversion (WCPEC) (A Joint Conference of 45th IEEE PVSC, 28th PVSEC & 34th EU PVSEC), Waikoloa Village, HI, 2018, pp. 1462-1467. doi: 10.1109/PVSC.2018.8548242
(Ramdaspalli, 2016) Ramdaspalli S, Pipattanasomporn M, Kuzlu M, Rahman S. Transactive control for efficient operation of commercial buildings. 2016 IEEE PES Innov. Smart Grid Technol. Conf. Eur., IEEE; 2016, p. 1–5. doi:10.1109/ISGTEurope.2016.7856173
(RIAPS, 2019) RIAPS Platform Information , “Welcome to the RIAPS documentation!”, (accessed on 13/06/2019) https://riaps.github.io/
(Riaz, 2017) M. H. Riaz, M. Zeeshan, Hasan-ul-Banna, T. Kamal and S. A. H. Shah, "Demand side management using different energy conservation techniques," 2017 International Multi-topic Conference (INMIC), Lahore, 2017, pp. 1-4. doi: 10.1109/INMIC.2017.8289460
(Rintamäki, 2017) Tuomas Rintamäki, Afzal S. Siddiqui, Ahti Salo, “Does renewable energy generation decrease the volatility of electricity prices? An analysis of Denmark and Germany”, Energy Economics, vol. 62, 2017, Pages 270-282, https://doi.org/10.1016/j.eneco.2016.12.019
(Runyon, 2018) Jennifer Runyon “Puerto Rico Gives Green Light to Microgrid Developers; Could Become a “Model of Sustainability””, May 21, 2018 https://www.renewableenergyworld.com/2018/05/21/puerto-rico-gives-green-light-to-microgrid-developers-could-become-a-model-of-sustainability
Luis Gomes
160
(S3C, n.d.) S3C project, “Guideline How To Create A Consumption Baseline”, n.d., https://www.smartgrid-engagement-toolkit.eu/fileadmin/s3ctoolkit/user/guidelines/GUIDELINE_HOW_TO_CREATE_A_CONSUMPTION_BASELINE.pdf
(Santos, 2020) Gabriel Santos, Zita Vale, Pedro Faria, Luis Gomes, “BRICKS: Building’s reasoning for intelligent control knowledge-based system”, Sustainable Cities and Society, vol. 52, 101832, January 2020. Doi: 10.1016/j.scs.2019.101832
(Serra, 2019) Bruno Serra, Luis Gomes, Zita Vale, “Lightweight Architecture for IoT Devices with Context-aware Autonomous Control”, in Proceedings of the IEEE Wireless Communications and Networking Conference, 15-19 Apr. 2019. Doi: 10.1109/WCNCW.2019.8902882
(Shi, 2018) Ruifeng Shi, Shaopeng Li, Changhao Sun, Kwang Y. Lee, “Multi-dispatch for Grid-connected Microgrid with Robust Optimization Algorithm”, IFAC-PapersOnLine, vol. 51, Issue 28, 2018, pp. 474-479, https://doi.org/10.1016/j.ifacol.2018.11.748
(Shirzeh, 2015) H. Shirzeh, F. Naghdy, P. Ciufo and M. Ros, "Balancing Energy in the Smart Grid Using Distributed Value Function (DVF)," in IEEE Transactions on Smart Grid, vol. 6, no. 2, pp. 808-818, March 2015. doi: 10.1109/TSG.2014.2363844
(Silva, 2014) Marco Silva, Tiago Sousa, Hugo Morais, Zita Vale, “Real-time Energy Resource Scheduling Considering a Real Portuguese Scenario”, IFAC Proceedings Volumes, Volume 47, Issue 3,2014, Pages 2267-2272, https://doi.org/10.3182/20140824-6-ZA-1003.02541
(Silva, 2019) David Silva, Luis Gomes, Filipe Sousa, Zita Vale, “Indoor Real-Time Locating System comparison: Polaris vs FIND3”, in Proceedings of the Demand response approach for real-time renewable energy integration – Fourth DREAM-GO Workshop, 16-17 Jan. 2019. Doi: 10.5281/zenodo.2672914
(Singh, 2018) Abhigyan Singh, Alex T. Strating, N.A. Romero Herrera, Debotosh Mahato, David V. Keyson, Hylke W. van Dijk, “Exploring peer-to-peer returns in off-grid renewable energy systems in rural India: An anthropological perspective on local energy sharing and trading”, Energy Research & Social Science, Volume 46, 2018, pp. 194-213. doi: 10.1016/j.erss.2018.07.021
(Skowronska-Kurec, 2012)
A. G. Skowronska-Kurec, S. T. Eick and E. T. Kallio, "Demonstration of Microgrid technology at a military installation," 2012 IEEE Power and Energy Society General Meeting, San Diego, CA, 2012, pp. 1-2. doi: 10.1109/PESGM.2012.6344923
(Sobhani, 2019) Seyed Omid Sobhani, Siamak Sheykhha, Mohammad Reza Azimi, Reinhard Madlener, “Two-Level Distributed Demand-Side Management Using the Smart Energy Hub Concept”, Energy Procedia, vol. 158, 2019, pp. 3052-3063, https://doi.org/10.1016/j.egypro.2019.01.990
161
(SPDX, 2019a) Software Package Data Exchange (SPDX), “BSD 2-Clause ‘Simplified’ License”, (accessed on 25/06/2019) https://spdx.org/licenses/BSD-2-Clause.html
(SPDX, 2019b) Software Package Data Exchange (SPDX), “BSD 3-Clause ‘New’ or ‘Revised’ License”, (accessed on 25/06/2019) https://spdx.org/licenses/BSD-3-Clause.html
(SPDX, 2019c) Software Package Data Exchange (SPDX), “Common Development and Distribution License 1.0”, (accessed on 25/06/2019) https://spdx.org/licenses/CDDL-1.0.html
(SPIDERS, 2015) Smart Power Infrastructure Demonstration for Energy Reliability and Security (SPIDERS), “Technology TransitionFinalPublicReport - Joint Capability Technology Demonstration (JCTD): Version 1.0”, 31 December 2015, (accessed on 14/06/2019) https://www.energy.gov/sites/prod/files/2016/03/f30/spiders_final_report.pdf
(Srivastava, 2018a) P. Srivastava, C. Chang and J. Cortés, "Participation of Microgrids in Frequency Regulation Markets," 2018 Annual American Control Conference (ACC), Milwaukee, WI, 2018, pp. 3834-3839. doi: 10.23919/ACC.2018.8431018
(Srivastava, 2018b) Srivastava, S.; Lessmann, S. A comparative study of LSTM neural networks in forecasting day-ahead global horizontal irradiance with satellite data. Sol. Energy 2018, 162, 232–247, doi:10.1016/j.solener.2018.01.005
(Statista, 2018) Statista. Smart Home Report 2018—Control and Connectivity; Statista: Hamburg, Germany, 2018
(Steriotis, 2018) Konstantinos Steriotis, Georgios Tsaousoglou, Nikolaos, Efthymiopoulos, Prodromos Makris, Emmanouel (Manos) Varvarigos, “A novel behavioral real time pricing scheme for the active energy consumers’ participation in emerging flexibility markets”, Sustainable Energy, Grids and Networks, vol. 16, 2018, pp. 14-27, https://doi.org/10.1016/j.segan.2018.05.002
(Strasser, 2015) Strasser, T.; Andren, F.; Kathan, J.; Cecati, C.; Buccella, C.; Siano, P.; Leitao, P.; Zhabelova, G.; Vyatkin, V.; Vrba, P.; Marik, V., "A Review of Architectures and Concepts for Intelligence in Future Electric Energy Systems," in IEEE Transactions on Industrial Electronics, vol. 62, no. 4, pp. 2424-2438, April 2015.
(Tahir, 2015) M. Tahir and S. K. Mazumder, "Self-Triggered Communication Enabled Control of Distributed Generation in Microgrids," in IEEE Transactions on Industrial Informatics, vol. 11, no. 2, pp. 441-449, April 2015. doi: 10.1109/TII.2015.2402616
(Tchuisseu, 2019) E.B. Tchawou Tchuisseu, D. Gomila, P. Colet, “Reduction of power grid fluctuations by communication between smart devices”, International Journal of Electrical Power & Energy Systems, vol. 108, 2019, pp. 145-152, https://doi.org/10.1016/j.ijepes.2019.01.004
Luis Gomes
162
(Teicher, 2018) Jordan Teicher, “The little-known story of the first IoT device”, in IBM Industries blog, 7 February 2018
(Terroso-Saenz, 2019) F. Terroso-Saenz, A. González-Vidal, A. P. Ramallo-González, A. F. Skarmeta, “An open IoT platform for the management and analysis of energy data,” Future Generation Computer Systems, vol. 92, 2019, pp. 1066-1079. doi: 10.1016/j.future.2017.08.046
(The Linux Foundation, 2018)
The Linux Foundation, The Linux Foundation Launches LF ENERGY, New Open Source Coalition, 12 July 2018. Available (accessed 12/04/2019): https://www.linuxfoundation.org/press-release/2018/07/the-linux-foundation-launches-lf-energy-new-open-source-coalition/
(Tian, 2016) P. Tian, X. Xiao, K. Wang and R. Ding, "A Hierarchical Energy Management System Based on Hierarchical Optimization for Microgrid Community Economic Operation," in IEEE Transactions on Smart Grid, vol. 7, no. 5, pp. 2230-2241, Sept. 2016.doi: 10.1109/TSG.2015.2470551
(Ton, 2012) Dan T. Ton, Merrill A. Smith, “The U.S. Department of Energy's Microgrid Initiative”, The Electricity Journal, vol. 25, Issue 8, 2012, pp. 84-94, https://doi.org/10.1016/j.tej.2012.09.013
(Tu, 2018) H. Tu, Y. Du, H. Yu, S. Likic, P. Volgyesi, M. Metelko, A. Dubey, G. Karsai, "An Adaptive Interleaving Algorithm for Multi-Converter Systems," 2018 9th IEEE International Symposium on Power Electronics for Distributed Generation Systems (PEDG), Charlotte, NC, 2018, pp. 1-7. doi: 10.1109/PEDG.2018.8447801
(U.S. Department of Energy, 2006)
U.S. Department of Energy, “Benefits Of Demand Response In Electricity Markets And Recommendations For Achieving Them”, Fevereiro de 2006, (acedido a 09/02/20), https://eetd.lbl.gov/sites/all/files/publications/report-lbnl-1252d.pdf
(Vaahedi, 2017) E. Vaahedi, K. Nodehi, D. Heim, F. Rahimi and A. Ipakchi, "The Emerging Transactive Microgrid Controller: Illustrating Its Concept, Functionality, and Business Case," in IEEE Power and Energy Magazine, vol. 15, no. 4, pp. 80-87, July-Aug. 2017. - http://ieeexplore.ieee.org/document/7947307/
(Vale, 2011) Z. Vale, T. Pinto, I. Praça and H. Morais, "MASCEM: Electricity Markets Simulation with Strategic Agents," in IEEE Intelligent Systems, vol. 26, no. 2, pp. 9-17, March-April 2011, doi: 10.1109/MIS.2011.3.
(Vallati, 2016) Vallati, C.; Mingozzi, E.; Tanganelli, G.; Buonaccorsi, N.; Valdambrini, N.; Zonidis, N.; Martínez, B.; Mamelli, A.; Sommacampagna, D.; Anggorojati, B.; et al. BETaaS: A Platform for Development and Execution of Machine-to-Machine Applications in the Internet of Things. Wirel. Pers. Commun. 2016, 87, 1071. doi:10.1007/s11277-015-2639-0
(Vinagre, 2015) E. Vinagre, L. Gomes and Z. Vale, "Electrical Energy Consumption Forecast Using External Facility Data," 2015 IEEE Symposium Series on Computational Intelligence, Cape Town, 2015, pp. 659-664, doi: 10.1109/SSCI.2015.101

163
(Vinagre, 2017) Eugénia Vinagre, Tiago Pinto, Isabel Praça, Luis Gomes, João Soares, Zita Vale, "Shared intelligence platform for collaborative simulations using sequences of algorithms: An electricity market participation case study," in Proceedings of the 2017 IEEE Manchester PowerTech, Manchester, 2017, pp. 1-6. Doi: 10.1109/PTC.2017.7981228
(VOLTTRON, 2019a) VOLTTRON, “VOLTTRON™ documentation!”, (accessed 13/06/2019) https://volttron.readthedocs.io/en/develop/index.html
(VOLTTRON, 2019b) VOLTTRON, “Agents in the Platform”, (accessed 12/04/2019) https://volttron.readthedocs.io/en/develop/overview/agents-overview.html
(Vujović, 2015) Vladimir Vujović, Mirjana Maksimović, “Raspberry Pi as a Sensor Web node for home automation,” Computers & Electrical Engineering, Volume 44, 2015, Pages 153-171. doi: 10.1016/j.compeleceng.2015.01.019
(Waaij, 2015) Bram van der Waaij, Wilco Wijbrandi, Mente Konsman, “How the developments in the Energy Flexibility Market can be accelerated by the Energy Flexibility Platform and Interface”, White paper Energy Flexibility Platform and Interface (EF-Pi) (accessed on 11/06/2019) https://github.com/flexiblepower/flexiblepower.github.io/raw/master/download/Whitepaper%20EF-Pi%20final%20june%201st%202015%20version.pdf
(Wald, 2012) M. L. Wald (Nov. 2012), “How N.Y.U. Stayed (Partly) Warm and Lighted,” The New York Times (Online). Visited at 07/08/2017, Available: https://green.blogs.nytimes.com/2012/11/05/how-n-y-u-stayed-partly-warm-and-lighted/
(Wang, 2012) L. Wang, Z. Wang and R. Yang, "Intelligent Multiagent Control System for Energy and Comfort Management in Smart and Sustainable Buildings," in IEEE Transactions on Smart Grid, vol. 3, no. 2, pp. 605-617, June 2012. - http://ieeexplore.ieee.org/document/6146507/
(Wang, 2015) Z. Wang, M. Fei, D. Du and M. Zheng, "Decentralized event-triggered average consensus for multi-agent systems in CPSs with communication constraints," in IEEE/CAA Journal of Automatica Sinica, vol. 2, no. 3, pp. 248-257, July 10 2015.http://ieeexplore.ieee.org/document/7152658/
(Wang, 2018) K. Wang, H. Li, S. Maharjan, Y. Zhang and S. Guo, "Green Energy Scheduling for Demand Side Management in the Smart Grid," in IEEE Transactions on Green Communications and Networking, vol. 2, no. 2, pp. 596-611, June 2018.doi: 10.1109/TGCN.2018.2797533
(Wang, 2019) Xin Wang, Housheng Su, “Consensus of hybrid multi-agent systems by event-triggered/self-triggered strategy”, Applied Mathematics and Computation, vol. 359, 2019, pp. 490-501, https://doi.org/10.1016/j.amc.2019.04.079
(Washom, 2013) B. Washom, J. Dilliot, D. Weil, J. Kleissl, N. Balac, W. Torre, and C. Richter, "Ivory Tower of Power: Microgrid Implementation at the

Luis Gomes
164
University of California, San Diego," IEEE Power and Energy Magazine, vol. 11, pp. 28-32, July-Aug. 2013.
(Wei, 2016) T. Wei, Q. Zhu and N. Yu, "Proactive Demand Participation of Smart Buildings in Smart Grid," in IEEE Transactions on Computers, vol. 65, no. 5, pp. 1392-1406, 1 May 2016. doi: 10.1109/TC.2015.2495244
(Wood, 2018) August 30, 2018 By Elisa Wood. https://microgridknowledge.com/microgrid-market-navigant/
(Wooldridge, 2009) Wooldridge, M. An Introduction to Multiagent Systems, 2nd ed.; Wiley Publishing: New Jersey, United States of America, 2009. ISBN:0470519460 9780470519462
(Wrinch, 2012) M. Wrinch, G. Dennis, T. H. M. EL-Fouly, and S. Wong, "Demand response implementation for improved system efficiency in remote communities," in Proc. 2012 IEEE Electrical Power and Energy Conference, pp. 105-110.
(Xiao, 2016) J. Xiao, P. Wang, L. Setyawan and Q. Xu, "Multi-Level Energy Management System for Real-Time Scheduling of DC Microgrids With Multiple Slack Terminals," in IEEE Transactions on Energy Conversion, vol. 31, no. 1, pp. 392-400, March 2016. doi: 10.1109/TEC.2015.2488639
(Xie, 2017) J. Xie, C. Liu and M. Sforna, "Agent-based distributed underfrequency load shedding," 2017 19th International Conference on Intelligent System Application to Power Systems (ISAP), San Antonio, TX, 2017, pp. 1-6. doi: 10.1109/ISAP.2017.8071393
(Yadav, 2018) Ankush Yadav, “Energy Management Systems Market by Offering (System, and Service), Component (Sensor, Controller, Software, and Others), Service (Monitoring & Control, Implementation & Integration, Maintenance, and Consulting & Training), Type (Home Energy Management System, Building Energy Management System, and Industrial Energy Management System), End User (Residential, and Commercial), and Market Vertical (Power & Energy, Telecom & IT, Manufacturing, Enterprise, Healthcare, and Others) - Global Opportunity Analysis and Industry Forecast, 2017-2023”, May 2018
(Yan, 2018) Xing Yan, Yusuf Ozturk, Zechun Hu, Yonghua Song, “A review on price-driven residential demand response”, Renewable and Sustainable Energy Reviews, Volume 96, 2018, Pages 411-419, doi: 10.1016/j.rser.2018.08.003
(Yang, 2018) Z. Yang, W. Xu, J. Shi, H. Xu and M. Chen, "Association and Load Optimization With User Priorities in Load-Coupled Heterogeneous Networks," in IEEE Transactions on Wireless Communications, vol. 17, no. 1, pp. 324-338, Jan. 2018. doi: 10.1109/TWC.2017.2765322
(Yang, 2019) Chao Yang, Wei Yao, Jiakun Fang, Xiaomeng Ai, Zhe Chen, Jinyu Wen, Haibo He, “Dynamic event-triggered robust secondary frequency control for islanded AC microgrid”, Applied Energy, vol. 242, 2019, pp. 821-836, https://doi.org/10.1016/j.apenergy.2019.03.139
165
(Yazdanian, 2014) M. Yazdanian and A. Mehrizi-Sani, "Distributed Control Techniques in Microgrids," in IEEE Transactions on Smart Grid, vol. 5, no. 6, pp. 2901-2909, Nov. 2014. - http://ieeexplore.ieee.org/document/6870484/
(Yorino, 2015) N. Yorino, Y. Zoka, M. Watanabe and T. Kurushima, "An Optimal Autonomous Decentralized Control Method for Voltage Control Devices by Using a Multi-Agent System," in IEEE Transactions on Power Systems, vol. 30, no. 5, pp. 2225-2233, Sept. 2015. http://ieeexplore.ieee.org/document/6937214/
(Yu, 2017) Mengmeng Yu, Seung Ho Hong, “Incentive-based demand response considering hierarchical electricity market: A Stackelberg game approach”, Applied Energy, Volume 203, 2017, Pages 267-279, doi: 10.1016/j.apenergy.2017.06.010
(Zanella, 2014) A. Zanella, N. Bui, A. Castellani, L. Vangelista and M. Zorzi, "Internet of Things for Smart Cities," in IEEE Internet of Things Journal, vol. 1, no. 1, pp. 22-32, Feb. 2014.doi: 10.1109/JIOT.2014.2306328
(Zeng, 2014) Z. Zeng, R. Zhao, H. Yang, and S. Tang, “Policies and demonstrations of micro-grids in China: A review,” Renewable and Sustainable Energy Reviews, vol. 29, pp. 701-718, Jan. 2014.
(Zhang, 2016a) Chenghua Zhang, Jianzhong Wu, Chao Long, Meng Cheng, “Review of Existing Peer-to-Peer Energy Trading Projects”, Energy Procedia, Volume 105, 2017, pp. 2563-2568. doi: 10.1016/j.egypro.2017.03.73
(Zhang, 2016b) L. Zhang, J. Xiao, P. Wang and X. Pan, "Design and implementation of communication network for modular microgrid based power park," 2016 IEEE Innovative Smart Grid Technologies - Asia (ISGT-Asia), Melbourne, VIC, 2016, pp. 160-165. doi: 10.1109/ISGT-Asia.2016.7796379
(Zhang, 2018) Chenghua Zhang, Jianzhong Wu, Yue Zhou, Meng Cheng, Chao Long, “Peer-to-Peer energy trading in a Microgrid”, Applied Energy, Volume 220, 2018, pp. 1-12. doi: 10.1016/j.apenergy.2018.03.010
(Zhang, 2019) Yue-Jun Zhang, Hua-Rong Peng, Bin Su, “Energy rebound effect in China's Industry: An aggregate and disaggregate analysis”, Energy Economics, vol. 61, 2017, pp. 199-208, https://doi.org/10.1016/j.eneco.2016.11.011
(Zhao, 2013) Z. Zhao, W. C. Lee, Y. Shin and K. Song, "An Optimal Power Scheduling Method for Demand Response in Home Energy Management System," in IEEE Transactions on Smart Grid, vol. 4, no. 3, pp. 1391-1400, Sept. 2013. doi: 10.1109/TSG.2013.2251018
(Zhifeng, 2018) Zhifeng, G; Zhou, K.; Zhang, X.; Yang, S. A deep learning model for short-term power load and probability density forecasting. Energy 2018, 160, 1186–1200, doi:10.1016/j.energy.2018.07.090
(Zhou, 2017) Feng Zhou, Zhiwu Huang, Yingze Yang, Jing Wang, Liran Li, Jun Peng, “Decentralized event-triggered cooperative control for multi-agent systems with uncertain dynamics using local estimators,” Neurocomputing, Volume 237, 2017, Pages 388-396.

Luis Gomes
166
https://www.sciencedirect.com/science/article/pii/S0925231217300607
(Zhu, 2015) L. Zhu, Z. Yan, W. Lee, X. Yang, Y. Fu and W. Cao, "Direct Load Control in Microgrids to Enhance the Performance of Integrated Resources Planning," in IEEE Transactions on Industry Applications, vol. 51, no. 5, pp. 3553-3560, Sept.-Oct. 2015. doi: 10.1109/TIA.2015.2413960
(Ziadi, 2014) Z. Ziadi, S. Taira, M. Oshiro and T. Funabashi, "Optimal Power Scheduling for Smart Grids Considering Controllable Loads and High Penetration of Photovoltaic Generation," in IEEE Transactions on Smart Grid, vol. 5, no. 5, pp. 2350-2359, Sept. 2014. doi: 10.1109/TSG.2014.2323969

Luis Gomes
167
Annexes

Luis Gomes
Retrofitting Approach for an Automated Load Testbed
Authors: Luis Gomes, Omid Abrishambaf, Pedro Faria, and Zita Vale
Published in: Proceedings of the Final ELECON Workshop Federal Institute of Santa Catarina (IFSC)
Published at: September 2016
PhD timeline: M2

www.elecon.ipp.pt
Dissemination & Transfer of knowledge
Final ELECON Workshop
Federal Institute of Santa Catarina - IFSC, Florianópolis, Brazil, September 12-14, 2016.
Retrofitting Approach for an Automated Load Testbed
Luis Gomes*, Omid Abrishambaf, Pedro Faria, Zita Vale
GECAD – Research Group on Intelligent Engineering and Computing for Advanced Innovation and Development, Institute of Engineering – Polytechnic of Porto (ISEP/IPP),
Rua Dr. António Bernardino de Almeida, 431, 4200-072 Porto, Portugal
Abstract
The application of algorithms and methodologies in the end-consumer side is difficult, making it almost
impossible for a research center to validate those kind of algorithms and methodologies. The use of closed
loads, that do not allowed any control and monitoring, and the existence of common house loads in the
laboratories, such as ovens, make the test and validation task very difficult. This paper will present a
laboratory that integrates retrofitting solutions for load control and monitoring. The paper also introduces
an emulator interface that replaces a common energy analyzer, enabling the use of common house loads
(such as, ovens and refrigerators) inside a laboratory. The case study presents the integration of the
emulator interface in an operating monitoring system.
Keywords: Energy analyzer, Load emulation, Retrofitting.
1. Introduction
The demand side management is an important piece in the new energy paradigm where the
end-consumer is called to actively participate in the energy management [1-3]. The application
of demand side management enables the autonomous and intelligence response of the end-
consumer in the energy grid activities [4 - 6].
However, the integration of demand side management systems in the end-consumer is
hardly achievable in today houses. The lack of autonomous controllable loads and a monitoring
system difficult the implementation of such systems. Scientists all over the world are
developed algorithms and methodologies for end-consumers, only to realize the difficulty†
inherent to the implementation of these algorithms and methodologies in a real normal house
of today.
* Corresponding author.
E-mail address: [email protected]
Final ELECON Workshop
The use of simulators and emulators in research centers are common in order to solve the
lack of unavailable loads that are usually present in end-consumer houses [7, 8]. However, the
common simulators and emulators fail to represent the communication with the energy
analyzers that measure the consumptions. The lack of communication demands the research
to build an interface to the emulator/simulator he/she wants to use, and then change that
interface to interact with real loads.
The use of retrofitting solutions are a good option for today houses, enabling the
autonomous control and monitoring of loads that were not created for that kind of control [9].
The retrofitting brings clear economic advantages to the end-consumer, when compared to the
replacement of equipment. Moreover, it makes possible to address the improvement of energy
efficiency and participation in demand response programs by electricity consumers,
transferring to the consumers the economic benefits of the participation in those programs.
This paper will present the Automated Load Testbed laboratory existing in GECAD
research center. This laboratory accommodates several retrofitting solutions for several loads.
These solutions enables the increase of user comfort while decreasing the energy consumption.
The paper will also present a new emulator (Virtual 2 Reality interface) for loads that cannot
be available in a laboratory, but are always available in end-consumer house.
After the introductory section, Section 2 presents the Automated Load Testbed laboratory,
with all the control and monitoring systems available. Then, in Section 3 the load emulator is
presented. A case study using the Automated Load Testbed laboratory and the Virtual 2 Reality
interface is presented in Section 4. Finally, Section 5 presents the main conclusions of the
paper.
2. Automated Load Testbed
Research group GECAD, located in Institute of Engineering - Polytechnic of Porto
(ISEP/IPP), dedicates one laboratory for automated load testbed using retrofitting solutions.
The idea of this laboratory is to explore and develop new solutions for retrofitting. These
solutions enables the execution of load optimization, load monitoring and the execution of
demand response programs with loads that were not built for this purpose [10]. At this moment,
the Automated Load Testbed (ALT) laboratory uses a combination of proprietary solutions
(available in the market) and costume made solutions.
The loads permanently available in the ALT laboratory are: ten 58 W fluorescent lamps,
grouped in groups of two lamps; one air-conditioner of 1000 W; and three shutter AC motors.
Beside the permanently loads, the laboratory can have consumption from laptops, desktops,
monitors, soldering iron, grinding wheel and a hot glue pistol.
The laboratory is accessible by all the researchers and students that work in GECAD
facilities.
2.1. Access control
The ALT laboratory is accessible using an inside door available in GECAD facility. In order
to prevent unauthorized accesses the ALT laboratory uses a costume-made solution that gives
access only to authorized people. This costume-made solution still enables the use of a key
door to open the laboratory (this is essential for security and cleaning accesses).
The system, shown in Figure 1, relays on an Arduino Uno, an LCD Shield, a Philips PN532
NFC reader and a GT511C1R fingerprint reader. The door lock is an E-S210M lock with fail
secure configuration.
There are two types of access in the access control system: admin access; and normal access.
The admin access is given to old researchers and enables the opening and close of the
laboratory. The normal access is for new personal and students and enables the open of the

Towards Efficient European and Brazilian Electricity Markets
door. The normal accesses only work during the opening period defined by an admin access.
If a normal access tried to open the door before an admin open the laboratory, the system will
not allow the opening of the door.
The admin access uses the GT511C1R fingerprint reader. The fingerprints database is
stored inside the GT511C1R and is not accessible or stored outside the module, this enables
the protection of users’ data. When the user uses the GT511C1R, it will compare the new
fingerprint with the stored data and identifies the user (if he/she exists in the GT511C1R
database). The user identification goes to the Arduino Uno that opens the laboratory, if the
user is an admin, or presents an error message in the LCD screen, if the user is not an admin.
The system has a blue LED that indicates if the laboratory is opened or closed.
The normal access uses the NFC reader and works with almost any NFC card. At GECAD,
all the researchers and students have a NFC card that can be used in the access control system.
The NFC reader reads the card ID and sends it to the Arduino Uno. Then, Arduino compares
the card ID with their database, to see if the card is register in the system. If the user exists, the
door will be open and a green LED is turned on, if the user does not exist, the system will
present an error message in the LCD and a red LED will be turned on.
Figure 1. Access control system
2.2. Shutter control
The ALT laboratory had three windows with electric shutters, controllable by three
independent wall switches. In order to automate the system, a costume-made solution was
implemented, enabling the control of the shutters using the wall switches (like in the original
configuration) and using an Arduino Mega. Figure 2 shows the three main components of the
shutter controller. Because the shutter motors use AC and the wall switches are also in AC,
the system uses two conversions: the AC to DC signal converter (Figure 2 switches board –
the board on bottom), this board is responsible to convert the AC signal coming from the wall
switches to a DC signal; and the DC to AC signal converter (Figure 2 windows board – the
board on top), this board is responsible to convert the signals from Arduino to AC signals that
controls the AC motors. The Arduino Mega is responsible for the control of the shutters
(middle board on Figure 2).

Final ELECON Workshop
Figure 2. Shutter control system mounted on the wall
The shutter control also enables the use of percentage to open and close the shutters. Figure
3 shows the three laboratory windows with three percentage numbers: the left window is open
75%; the window in the middle is open 50%; and the right window is open 25%.
Figure 3. Shutters of the ALT laboratory
2.3. Light control
The light of ALT laboratory is also controllable, having to types of control: manual mode;
and autonomous mode. The fluorescent lights have electronic controllable ballasts that receive
a signal between 0 and 10 volts. The retrofitting system developed for the lights (Figure 4)
uses an Arduino Mega, three PIR sensors, three LDR sensors, a MAX485, and five amplifiers
(in order to convert the Arduino signal from 0V to 5V to a signal from 0V to 10V).

Towards Efficient European and Brazilian Electricity Markets
Figure 4. Light control system
Figure 5 shows the lights and the three sensor boxes used for light controlling. Each box
has a LDR in order to read the luminosity in the box and a PIR sensor in order to detect
movement in a small region of the laboratory, the PIR sensor do not detect movement in the
entire laboratory, the sensor is measuring only a small portion of the laboratory. The boxes are
directly connect to the Arduino Mega.
Figure 5. Sensor boxes mounted on the celling
In the autonomous mode, the Arduino reads the PIR sensors to see if a person is inside the
laboratory. If so, the Arduino will turn the two lights closer to the PIR sensor that was
activated. The lights will be turned on according to the LDR measure (the LDR of the same
box of the PIR sensor). The use of three sensor boxes enables not only the detection of a person
inside the laboratory, but also the location inside the laboratory. Knowing the location of the
persons is possible to turn on only the lights that have impact in the persons activity, leaving
the other lights turned off. The use of LDRs also enables the optimization of energy to provide
a good quality light for work activities. The Arduino turn off the lights 7 minutes after detection
the last movement by the PIR sensor, this reduces the false negatives giving by the PIR sensors.
2.4. Laboratory monitoring
The control of the loads for energy programs participation is not useful without a monitoring
system that provides the consumption measures of the facility. For this reason the ALT
laboratory has a monitoring system using a Saia PLC PCD.M5340 (Figure 6) that reads the
data from three different energy analyzers. The use of energy analyzers enables the

Final ELECON Workshop
understanding of the energy spend on the laboratory and the analysis of this energy. The energy
measuring system divides the consumption in three main categories: celling light consumption;
air-conditioner consumption; and electrical socket consumption. Using these three categories,
is possible to have a better understanding on how the energy is spent and how people use the
laboratory. The consumption data is stored in a database, together with the consumption of the
building [11].
Figure 6. Saia PLC
Because the ALT laboratory is a testbed room, it has installed a TCP/IP camera on the
celling that can be controlled through the internet (Figure 5).
2.5. Control center
All the control systems implemented, as well as the monitoring system, are connected to
the Saia PLC. This centralization of systems enables the existence of a centralized control
panel where is possible to control every system independently. In order to do so, the ALT
laboratory has a touch screen 10’’ Saia console (Figure 7).

Towards Efficient European and Brazilian Electricity Markets
Figure 7. Saia Console
The console allows the control of the lights, the control of the lock, the control of the
windows and the visualization of the consumptions. In the control of the lights (Figure 8 a) the
users can activate or deactivate the autonomous control (‘Activate Arduino’ option in Figure
8 a). If the user chooses the manual light controller, he/she can, in the console, control each
light independent (on/off and intensity). In the ‘Security’ menu (Figure 8 b) the user can
activate the lock (unlock the door) for seven seconds and control the shutters (open/close and
percentage).
Figure 8. Saia Console menus
The consumptions can be seen using two types of data visualization. The console allows
the user to consult the consumptions using a numeric visualization or a char visualization. The
console interface is a web based interface. Therefore, the control interface is also available in
a browser format in any computer.
2.6. Communication network
The communication between systems are done using a RS485 network, implementing the
Modbus/RTU protocol. In this network the Saia PLC is the master and the energy analyzers

Final ELECON Workshop
and control systems are the network slaves. In energy, almost all the energy analyzers and even
other equipment (such as, invertors and battery systems) use RS485 communication and
Modbus/RTU protocol.
3. Virtual 2 Reality interface
The use of ALT laboratory is useful for develop, test and validate some retrofitting control
systems. However, there is a problem that a lot of research centers encounter when working
with load management and demand response program participation (in end-consumer side).
There is a lack some essential loads present in end-consumer households, such as, a
refrigerator, an oven, a microwave, a television, a washing machine, and more.
Without these kind of equipment is difficult for a research center to test and validate
optimization algorithm for end-consumers. The common solution is to simulate and work with
offline data that was record previously.
The Virtual 2 Reality (V2R) interface enables these kind of loads (described above) to be
integrated in a laboratory, without having these kind of loads. The energy is usually measured
using energy analyzers that use Modbus/RTU trough RS485 communication. V2R replaces
the energy analyzer with an emulator that represents a load that do not exist.
At this moment the V2R enables the representation of a load: using a real chart, for instance,
if you want to represent a refrigerator you can go to the configuration page and upload the
chart of a real refrigerator consumption; or using a discrete load parameters, where the user
specifies the on consumption and the off consumption of the desirable load.
Figure 9 shows the V2R module developed using an Arduino Mega, an Ethernet Shield
(with SD card), a LCD Shield, a real-time clock and a MAX485.
Figure 9. V2R connected to Saia PLC
The V2R is configurable using a webpage that send the configuration to the Arduino using
TCP/IP sockets. The Arduino stores the configuration parameters in their SD card and
represent the desirable load.
The V2R respond to Modbus/RTU requests, using RS485 network. During the emulation,
V2R sends the emulation values to a SQL Server database using a TCP/IP connection.
The biggest advantage of the V2R is the abstraction that it brings to the system. For instance,
if the goal is to develop a program that communicates with energy analyzers and optimize the
consumption, it can be used V2Rs to emulate loads. After the program is developed, is possible
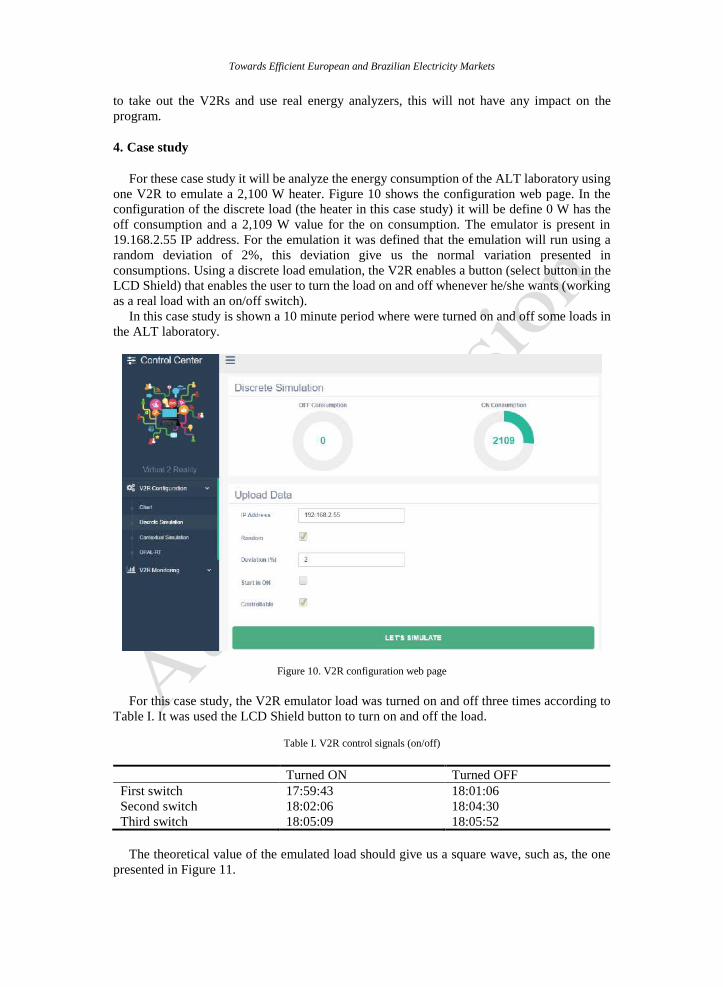
Towards Efficient European and Brazilian Electricity Markets
to take out the V2Rs and use real energy analyzers, this will not have any impact on the
program.
4. Case study
For these case study it will be analyze the energy consumption of the ALT laboratory using
one V2R to emulate a 2,100 W heater. Figure 10 shows the configuration web page. In the
configuration of the discrete load (the heater in this case study) it will be define 0 W has the
off consumption and a 2,109 W value for the on consumption. The emulator is present in
19.168.2.55 IP address. For the emulation it was defined that the emulation will run using a
random deviation of 2%, this deviation give us the normal variation presented in
consumptions. Using a discrete load emulation, the V2R enables a button (select button in the
LCD Shield) that enables the user to turn the load on and off whenever he/she wants (working
as a real load with an on/off switch).
In this case study is shown a 10 minute period where were turned on and off some loads in
the ALT laboratory.
Figure 10. V2R configuration web page
For this case study, the V2R emulator load was turned on and off three times according to
Table I. It was used the LCD Shield button to turn on and off the load.
Table I. V2R control signals (on/off)
Turned ON Turned OFF
First switch 17:59:43 18:01:06
Second switch 18:02:06 18:04:30
Third switch 18:05:09 18:05:52
The theoretical value of the emulated load should give us a square wave, such as, the one
presented in Figure 11.

Final ELECON Workshop
Figure 11. Theoretical consumption of V2R heater
Because the V2R was configured with a deviation value of 2%, the consumption that V2R
reproduced was the one showed in Figure 12.
Figure 12. Emulated consumption of V2R heater
The values from Figure 12 was the ones that were emulated and injected into the monitoring
system (section 2.4). Figure 13 shows the total consumption of the lab, for this case study it
was turned on the lights and the air-conditioner (that started two times during the case study).
The turning of the lights can be seen in the beginning of the chart. For this case study, all
the lights were turned on. The lights were turned on using the PIR sensors, this explains the
visible step at the beginning of the chart (because they only turn on after detecting a person).
The start of air-conditioner is visible at 18:00:32 and again at 18:06:37. The air-conditioner
only stays on during 3 minutes at each time.
As can be seen in Figure 13, the monitoring system was tricky to think that were a bigger
consumption in the ALT laboratory (the presence of the V2R).
0
1000
2000
3000
17
:57
:35
17
:57
:59
17
:58
:23
17
:58
:47
17
:59
:11
17
:59
:35
17
:59
:59
18
:00
:23
18
:00
:47
18
:01
:11
18
:01
:35
18
:01
:59
18
:02
:23
18
:02
:47
18
:03
:11
18
:03
:35
18
:03
:59
18
:04
:23
18
:04
:47
18
:05
:11
18
:05
:35
18
:05
:59
18
:06
:23
18
:06
:47
18
:07
:11
18
:07
:35
18
:07
:59
18
:08
:23
18
:08
:47
18
:09
:11
18
:09
:35
Theoretical
0
1000
2000
3000
17
:57
:35
17
:58
:00
17
:58
:25
17
:58
:50
17
:59
:15
17
:59
:40
18
:00
:05
18
:00
:30
18
:00
:55
18
:01
:20
18
:01
:45
18
:02
:10
18
:02
:35
18
:03
:00
18
:03
:25
18
:03
:50
18
:04
:15
18
:04
:40
18
:05
:05
18
:05
:30
18
:05
:55
18
:06
:20
18
:06
:45
18
:07
:10
18
:07
:35
18
:08
:00
18
:08
:25
18
:08
:50
18
:09
:15
18
:09
:40
Emulated

Towards Efficient European and Brazilian Electricity Markets
Figure 13. Total consumption of the ALT laboratory
In order to introduce the V2R to the monitoring system was not needed any change in the
system. It was only needed to integrate a new energy analyzer, with the RS485 ID and
Modbus/RTU registers of the V2R (similar to the steps taking for adding a new energy
analyzer).
5. Conclusions
The retrofitting of old and massed distributed loads, available in today houses, is a very
important issue that will enable the load control, load optimization and load monitoring.
Enabling the user to be ready for autonomous energy management systems that can react to
outside and inside changes. The atomization of loads also enables the users to participate in
demand response programs. For this reasons, GECAD research center dedicate a laboratory
that enables the test of retrofitting solutions that can be applied in load management systems.
The test and validation of new algorithms and methodologies to apply in the end-consumer
household are difficult to perform in a laboratory environment. Using the Autonomous Load
Testbed laboratory, presented in GECAD, is possible to test some of these algorithms. Making
this laboratory very important for researchers.
The inclusion of Virtual 2 Reality interface brings to the Autonomous Load Testbed
laboratory the advantage of emulation using loads that are not usually available in laboratories.
Using V2R is possible to build houses in the laboratory so researchers can test and validate
algorithms and methodologies for load management systems. This paper shows the clear
advantages of having V2R interfaces in a lab for emulation purposes. V2R will tricky the load
management system so it can see loads that are not there.
Acknowledgements
The research leading to these results has received funding from the People Programme
(Marie Curie Actions) of the European Union's Seventh Framework Programme FP7/2007-
2013/ under project ELECON - Electricity Consumption Analysis to Promote Energy
Efficiency Considering Demand Response and Non-technical Losses, REA grant agreement
No 318912.
This work is also supported by FEDER Funds through the “Programa Operacional Factores
de Competitividade – COMPETE” program and by National Funds through FCT “Fundação
para a Ciência e a Tecnologia” under the projects UID/EEA/00760/2013and
0
1000
2000
3000
4000
5000
6000
17
:57
:35
17
:58
:00
17
:58
:23
17
:58
:47
17
:59
:10
17
:59
:33
17
:59
:58
18
:00
:23
18
:00
:46
18
:01
:10
18
:01
:33
18
:01
:59
18
:02
:23
18
:02
:47
18
:03
:10
18
:03
:34
18
:03
:57
18
:04
:23
18
:04
:45
18
:05
:10
18
:05
:35
18
:05
:58
18
:06
:23
18
:06
:46
18
:07
:10
18
:07
:33
18
:07
:57
18
:08
:20
18
:08
:43
18
:09
:06
18
:09
:30
V2R Consumption
Total Consumption
Final ELECON Workshop
SFRH/BD/109248/2015.
References
[1] G. Tsagarakis, R. C. Thomson, A. J. Collin, G. P. Harrison, A. E. Kiprakis and S. McLaughlin, "Assessment of the Cost and Environmental Impact of Residential Demand-Side Management," in IEEE Transactions on
Industry Applications, vol. 52, no. 3, pp. 2486-2495, May-June 2016.
[2] E. Yao, P. Samadi, V. W. S. Wong and R. Schober, "Residential Demand Side Management Under High Penetration of Rooftop Photovoltaic Units," in IEEE Transactions on Smart Grid, vol. 7, no. 3, pp. 1597-1608,
May 2016.
[3] N. Kinhekar, N. P. Padhy, F. Li and H. O. Gupta, "Utility Oriented Demand Side Management Using Smart AC and Micro DC Grid Cooperative," in IEEE Transactions on Power Systems, vol. 31, no. 2, pp. 1151-1160, March
2016.
[4] P. Palensky and D. Dietrich, "Demand Side Management: Demand Response, Intelligent Energy Systems, and Smart Loads," in IEEE Transactions on Industrial Informatics, vol. 7, no. 3, pp. 381-388, Aug. 2011.
[5] L. Gomes, F. Fernandes, P. Faria, M. Silva, Z. Vale and C. Ramos, "Contextual and environmental awareness
laboratory for energy consumption management," Power Systems Conference (PSC), 2015 Clemson University, Clemson, SC, 2015, pp. 1-6.
[6] L. Gomes, P. Faria, H. Morais, Z. Vale and C. Ramos, "Distributed, Agent-Based Intelligent System for Demand
Response Program Simulation in Smart Grids," in IEEE Intelligent Systems, vol. 29, no. 1, pp. 56-65, Jan.-Feb. 2014.
[7] M. J. H. Rawa, D. W. P. Thomas and M. Sumner, "Experimental Measurements and Computer Simulations of
Home Appliances Loads for Harmonic Studies," Computer Modelling and Simulation (UKSim), 2014 UKSim-AMSS 16th International Conference on, Cambridge, 2014, pp. 340-344.
[8] C. Molitor, K. Togawa, S. Bolte and A. Monti, "Load Models for Home Energy System and micro grid
simulations," 2012 3rd IEEE PES Innovative Smart Grid Technologies Europe (ISGT Europe), Berlin, 2012, pp. 1-6.
[9] Luis Gomes, Haroldo L.M. Amaral, Filipe Fernandes, Pedro Faria, Zita Vale, Carlos Ramos, André N. de Souza,
Dynamic Approach and Testbed for Small and Medium Players Simulation in Smart Grid Environments, IFAC Proceedings Volumes, Volume 47, Issue 3, 2014, Pages 31-36
[10] O. Abrishambaf, L. Gomes, P. Faria, J. L. Afonso and Z. Vale, "Real-time simulation of renewable energy
transactions in microgrid context using real hardware resources," 2016 IEEE/PES Transmission and Distribution Conference and Exposition (T&D), Dallas, TX, 2016, pp. 1-5.
[11] L. Gomes, M. Lefrançois, P. Faria and Z. Vale, "Publishing real-time microgrid consumption data on the web
of Linked Data," 2016 Clemson University Power Systems Conference (PSC), Clemson, SC, 2016, pp. 1-8.

Luis Gomes
Implementation of a Real-Time Microgrid Simulation Platform Based on Centralized and
Distributed Management
Authors: Omid Abrishambaf, Pedro Faria, Luis Gomes, João Spínola, Zita Vale, and Juan M. Corchado
DOI: 10.3390/en10060806
Published in: Energies (IF: 2.707)
Published at: February 2017
PhD timeline: M7

Energies 2017, 10, x; doi: FOR PEER REVIEW www.mdpi.com/journal/energies
Article
Implementation of a Real-Time Microgrid Simulation Platform Based on Centralized and Distributed Management
Omid Abrishambaf 1, Pedro Faria 1,*, Luis Gomes 1, João Spínola 1, Zita Vale 1 and
Juan M. Corchado 2
1 GECAD—Research Group on Intelligent Engineering and Computing for Advanced Innovation and
Development, IPP—Polytechnic Institute of Porto, Rua DR. Antonio Bernardino de Almeida, 431, Porto
4200-072, Portugal; [email protected] (O.A.); [email protected] (L.G.); [email protected] (J.S.);
[email protected] (Z.V.) 2 BISITE—Bioinformatics, Intelligent Systems and Educational Technology Research Center, University of
Salamanca, Salamanca 37008, Spain; [email protected]
* Correspondence: [email protected] ; Tel.: +351-228-340-511; Fax: +351-228-321-159
Academic Editor: Chunhua Liu
Received: 26 February 2017; Accepted: 7 June 2017; Published:
Abstract: Demand response and distributed generation are key components of power systems.
Several challenges are raised at both technical and business model levels for integration of those
resources in smart grids and microgrids. The implementation of a distribution network as a test
bed can be difficult and not cost-effective; using computational modeling is not sufficient for
producing realistic results. Real-time simulation allows us to validate the business model’s impact
at the technical level. This paper comprises a platform supporting the real-time simulation of a
microgrid connected to a larger distribution network. The implemented platform allows us to use
both centralized and distributed energy resource management. Using an optimization model for
the energy resource operation, a virtual power player manages all the available resources. Then,
the simulation platform allows us to technically validate the actual implementation of the
requested demand reduction in the scope of demand response programs. The case study has 33
buses, 220 consumers, and 68 distributed generators. It demonstrates the impact of demand
response events, also performing resource management in the presence of an energy shortage.
Keywords: demand response; distributed generation; microgrid; real-time simulation
1. Introduction
The increment on the penetration of the distributed generation (DG) resources encounters the
current power grid with management and reliability challenges [1]. For overcoming these issues, the
entire power network can be distributed into several small power grids, which are the sub set of the
main power network. This solution is attainable via the concepts defined in smart grids, such as
microgrids [2]. The microgrid refers to a group of DG units, renewable energy resources (RERs), and
the local loads that can rely upon the main distribution network [3]. Basically, the RERs consist of
photovoltaic (PV) systems and wind turbines [4].
The real-time measurements of different nodes of a microgrid are an essential issue for
managing and controlling the grid through both the centralized and distributed methods. This can
be released by phasor measurement units (PMU). The PMU are synchronized time based
instruments, which collects highly precise phasor data of the power system [5]. The PMU plays a key
role in the real-time monitoring of the smartgrids and microgrids that utilizes the global positioning
system (GPS) to provide the concurrent measurements [6]. Typical PMU devices are able to provide
Energies 2017, 10, x FOR PEER REVIEW 2 of 15
30 samples per second [7]. This enables the grid operator to be informed from the synchronized time
based voltage and current phasor measurements in different nodes of the grid, in order to control
and manage the power stability and delivery [8].
Additionally, if the DG resources are integrated with demand response (DR) programs, the
microgrid conceptions can be fully addressed. DR programs are defined as altering the electricity
consumption profiles based on the incentives payment provided by the network operator due to
technical reasons or economic purposes. Incentive-based and price-based are two major
classifications of DR programs [9]. In this context, virtual power players (VPPs) play a key role for
aggregating the DG and DR small size resources, in order to be used in electricity markets as a large
scale resource [10].
In order to control and manage the resources available in the microgrid, two main methods can
be proposed: centralized and distributed control. In the centralized control method, a powerful
central controller unit is responsible to manage and control the microgrid, where communication
between this unit and each single component of the network is required [11]. However, in the
distributed control method, the decisions take place locally and are based on the real-time
information exchanged by the network components [12]. Both methods have several advantages and
disadvantages. For example, the centralized control requires high initial cost and needs a
widespread scheming; however, it provides better efficiency. In the meantime, the centralized
network can be implemented step by step from the bottom levels to the top levels [13].
This paper presents the development and implementation of a real-time microgrid simulation
platform managed by centralized and distributed controlling decision support. In this platform it is
attempted to provide a realistic microgrid implementation using real and laboratorial hardware
equipment. The microgrid players included in this platform consist of two renewable DG units (PV
and wind turbine), and a low and a medium consumer load (laboratorial equipment), which are
connected to each other as well as the main power grid through four power lines. The local demand
of the microgrid can be supplied from the energy provided by the DG and the grid as well. For the
centralized control method, a real-time simulator model has been employed in order to manage the
system, and for the distributed control manner, a local controller is associated for each player in
order to perform the decision making locally and achieve the microgrid goals.
There are several related research works, which implemented and surveyed the microgrid
models based on centralized or distributed decision support. In [13], the authors examined two
implemented microgrid topologies, one centralized and one distributed model, which combine solar
panels and batteries for 20 residential houses. In [14], the authors provided an optimal solution for
dispatching of the local resources in the medium voltage (MV) microgrids that temporary or
permanently operate in islanded mode. In the optimization problem, they considered that all the
power produced by renewable generators (PV and wind) is used, in order to minimize the microgrid
operation costs as well as the pollutant emissions of the programmable generators. In [15], a new
distributed controlling method was proposed for secondary frequency and voltage control and
stability in a microgrid while it is operating in islanded mode. In this method, the authors utilized
localized data as well as nearest-neighbor communication to implement the secondary control
operations while there is no necessity of information about the loads and microgrid methodology. In
[16], a unified controlling method is addressed for the cooperation of Distributed Energy Resource
(DERs) and the DR to support the voltage and frequency of an islanded microgrid in which it
minimized the overall operation costs of the grid through an optimization problem. In the proposed
algorithm, the frequency deviation was considered as a new state variable in the model. In this way,
the model enables us to calculate the required set points for the DERs and the amount of power that
should be curtailed by the controllable loads available in the grid. In [17], a simulation based
analysis of dynamical behavior of a residential DC microgrid laboratory setup in distributed and
centralized voltage control configurations is presented. In [18], the authors described the control
algorithm of a utility connected microgrid, based on independent control of active and reactive
power and operating in centralized and distributed operation mode. In addition to these works, a
Energies 2017, 10, x FOR PEER REVIEW 3 of 15
significant number of published works have been focused on the multi-agent based and distributed
control models for the energy management of the microgrids [19–21].
There are a lot of laboratories and test beds implemented for development and validation of the
capabilities of smartgrids and microgrids by utilizing the real-time simulation facilities [22].
Austrian Institute of Technology (AIT), Vienna, Austria, includes three configurable three-phase
low-voltage grids and the real-time simulation with hardware-in-the-loop (HIL) setups in order to
experiment with the real-time simulation platform for advanced power-HIL and controller-HIL
analysis, and the validation of energy management systems and distribution supervisory control
and data acquisition (SCADA). OFFIS—Institute for Information Technology, Oldenburg, Germany
has an automation laboratory, which includes OPAL-RT simulator for executing a highly detailed
and dynamic power grid. The OFFIS utilizes this laboratory for centralized and decentralized
controlling methods and parallel simulation. Laboratoire de Genie Electrique de Grenoble,
Grenoble, France, includes a real-time power-HIL simulation laboratory equipped with two
real-time multiprocessors digital simulators. This enables them to focus on power system protection
relays, testing different types of equipment, namely wind turbine emulator and hydro turbine, and
testing the industrial converters for PV systems. Commissariat A L´energie Atomique et AUX
Energies Alternatives, France, has a microgrid platform including several renewable and
conventional generators, energy storage systems, controllable loads, and electrical vehicles. The
main core of this platform is a HIL simulator, which enabled the facility to validate and examine the
microgrid operation and protection, voltage and frequency control, energy storage systems
management etc. Distribution Network and Protection Laboratory, Glasgow, UK, consists of a
three-phase power grid including several multiple controllable voltage supplies, flexible and
controllable loads. There are several real-time simulators in this laboratory, which are utilized for
surveying protection concepts, automation equipment, and new solutions for distributed power
system control.
The main objective of the present paper is to develop and implement a real-time microgrid
simulation platform using several real and laboratorial hardware equipment. Such a platform
supports real-time simulation skills and HIL means in order to address the validation of demand
response and distributed generation optimization. A microgrid accommodates such resources and is
managed by a VPP that aims at minimizing the operation costs, using both distributed and
centralized control methods. An upstream network is modeled in MATLAB/Simulink, using
mathematical and non-physical models. The use of real-time simulation and HIL scenarios brings
the ability of controlling and managing the real resources from the simulation environment with
non-real management scenarios, such as optimization models.
The problem statement is related to how a microgrid business model can be examined and
validated in terms of management and control, before massive implementation. Implementing a
completely realistic microgrid model only for testing and validating, would not be a cost-effective
solution. Furthermore, it would not be available for everyone, since only a limited number of
companies or research institutes could be equipped with that type of test bed. The microgrid
platform designed in this paper is flexible in terms of controlling methods and is up to the operator
to choose.
In this way, namely when comparing with [23], the contribution of the present paper relies on
the presented approach that integrates all the above referred aspects of the work, namely with
improved aspects as the optimization of resource use.
In both centralized and distributed control methods, the different nodes of the microgrid
(accommodating consumers and generators) will be measured through the several energy meters
mounted on the various locations of the grid. The sampling period of these energy meters are one
sample per second, which have enough accuracy for optimization problems and DR program
applications, and the high precision measurement devices, such as PMUs, may not be required for
these kinds of applications. This microgrid is also able to be configured in islanded or
grid-connected mode. Since the energy transaction between the microgrid and the main grid is
considered, the autonomous mode is out of the focus of the paper. Another topic out of the present

Energies 2017, 10, x FOR PEER REVIEW 4 of 15
work focus is the market congestion in the connection of the microgrid with the upstream network.
It is not included on the economic model since the main focus is given to minimize microgrid
operation costs. The considered VPP is selling electricity in the market and the network has enough
capacity for the energy transactions.
This paper is structured as follows: after this introductory section, the development and
implementation of the proposed microgrid simulation platform is described on Section 2. Then, a
case study is defined and executed with the presented model in Section 3 and its results are
described in Section 4. Finally, Section 5 clarifies the main conclusions of the work.
2. Real-Time Microgrid Simulation Platform
This section describes the real-time implementation of a microgrid simulation platform based
on two controlling methods: centralized and distributed. This system has been implemented in
GECAD laboratory [24]. In this model, several laboratorial hardware resources have been employed
in order to simulate a realistic microgrid. The present model is designed and implemented in a way
that the controlling methods can be selected by the user/operator. This enables the operator to
choose the centralized or distributed control method, depending on its application.
Since the proposed system employs the real-time simulator as well as several real hardware
equipment, it enables the systems or platforms that include network simulation models to use the
real data in their simulation models. Therefore, the present microgrid model will be used as a part of
a network simulation model used by DR program simulation platform developed in [25], called
SPIDER—simulation platform for the integration of demand response. This platform has been
designed to widely support the decision-making for different types of network players, which are
involved in the DR programs. As a general description of SPIDER, it surveys and specifies the
data-mining methods, which are appropriate for the consumers who intend to participate in DR
programs. Data-mining algorithms are applied in the module “model optimization” (with orange
highlights in Figure 1). In fact, this module includes several types of algorithms for DR
implementation, such as the energy resource optimization, data-mining for aggregation of resources,
forecasting online tools, etc. For example, if data-mining is applied, whenever a new scenario is
computed in the simulation, the system automatically includes the scheduling of resource results as
input to the aggregation of the resources. After the data-mining is computed, the simulation
proceeds to step “4” (as can be seen in Figure 1). A data-mining algorithm used for energy resource
aggregation and remuneration can be found in [26].
SPIDER is an essential instrument for validating and analyzing the business and economic
aspects of the DR programs, and surveying their influence in the electricity network. For this
purpose, SPIDER uses MATLAB/Simulink [27] tools in order to simulate the basis platform for the
grid simulation. Figure 1 illustrates the overall view of the SPIDER simulation platform with the
proposed microgrid simulation configuration using the centralized control method. In this system,
several softwares have been employed in order to exchange data between different sections.
The platform starts the process from network simulation in Simulink; afterward, JAVA
application programming interface (API) is used in order to transmit the information of the network
simulation to the optimization block. Then, TOMLAB [28] tool is used for the optimization in the
SPIDER, and its optimization results transfer to the network simulation block using JAVA API as
well. Full details about the SPIDER and its infrastructures can be found in [25].
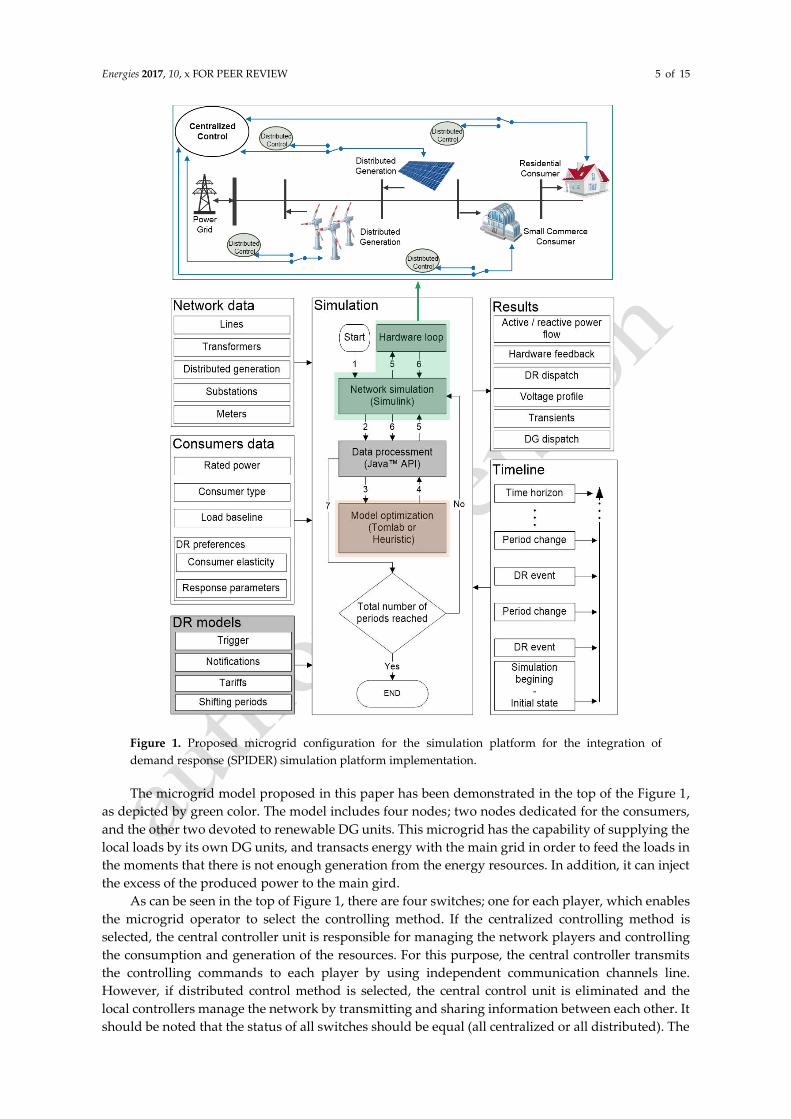
Energies 2017, 10, x FOR PEER REVIEW 5 of 15
Figure 1. Proposed microgrid configuration for the simulation platform for the integration of
demand response (SPIDER) simulation platform implementation.
The microgrid model proposed in this paper has been demonstrated in the top of the Figure 1,
as depicted by green color. The model includes four nodes; two nodes dedicated for the consumers,
and the other two devoted to renewable DG units. This microgrid has the capability of supplying the
local loads by its own DG units, and transacts energy with the main grid in order to feed the loads in
the moments that there is not enough generation from the energy resources. In addition, it can inject
the excess of the produced power to the main gird.
As can be seen in the top of Figure 1, there are four switches; one for each player, which enables
the microgrid operator to select the controlling method. If the centralized controlling method is
selected, the central controller unit is responsible for managing the network players and controlling
the consumption and generation of the resources. For this purpose, the central controller transmits
the controlling commands to each player by using independent communication channels line.
However, if distributed control method is selected, the central control unit is eliminated and the
local controllers manage the network by transmitting and sharing information between each other. It
should be noted that the status of all switches should be equal (all centralized or all distributed). The

Energies 2017, 10, x FOR PEER REVIEW 6 of 15
following sub sections describe how the microgrid is controlled by the centralized and the
distributed methods.
2.1. Centralized Control Model
In this section, the central controller unit, network players, and the controlling methods, will be
explained. The microgrid model proposed in this section is an improved and reformed version of the
model proposed in [23]. In the previous work, there were low and medium consumer units playing
the role of residential and small commerce facility consumers, and a wind turbine emulator playing
the role of a home-scale wind turbine. However, in this paper, a 7.5 kW PV system and four power
lines have been added to the system in order to implement a comprehensive laboratorial microgrid
model.
Figure 2 presents the centralized microgrid control model proposed in this paper. As can be
seen, the central controller unit is located at the top of the model and the other network players are
connected to this unit. This unit is OP5600, the real-time simulator machine [29], a powerful
instrument to produce real-time simulations even with a high complexity degree while enabling
HIL. OP5600 is based on the MATLAB/Simulink and indeed it runs the Simulink models in
real-time. Additionally, there are several Digital/Analog I/O slots embedded on the OP5600, which
enable the user to control real hardware devices from Simulink models and also receive feedback.
This is how HIL integrates the real data with the Simulink models.
Figure 2. Centralized microgrid model architecture.
The other network players consist of a 4 kVA and a 30 kW load playing the role of low and
medium consumer units, and a 1.2 kW wind turbine emulator and a 7.5 kW PV system as DG units
in the microgrid. All of these network players were not operating automatically in their factory
configuration. However, several automation projects have been implemented on them, in order to
control and manage them remotely and automatically [23,30]. For concentrating on the innovative
perspectives of the model, only the most related sections of the system are described here.
As shown in Figure 2, the first DG unit is referred to the 1.2 kW wind turbine emulator. This
emulator consists of an inductive three-phase generator coupled with a three phase asynchronous
motor with variable speed. The speed controller unit allows the variation of the wind speed and
consequently the speed variation of the wind turbine rotor. This emulator is controlled through the
analog outputs of the OP5600 (Simulink).
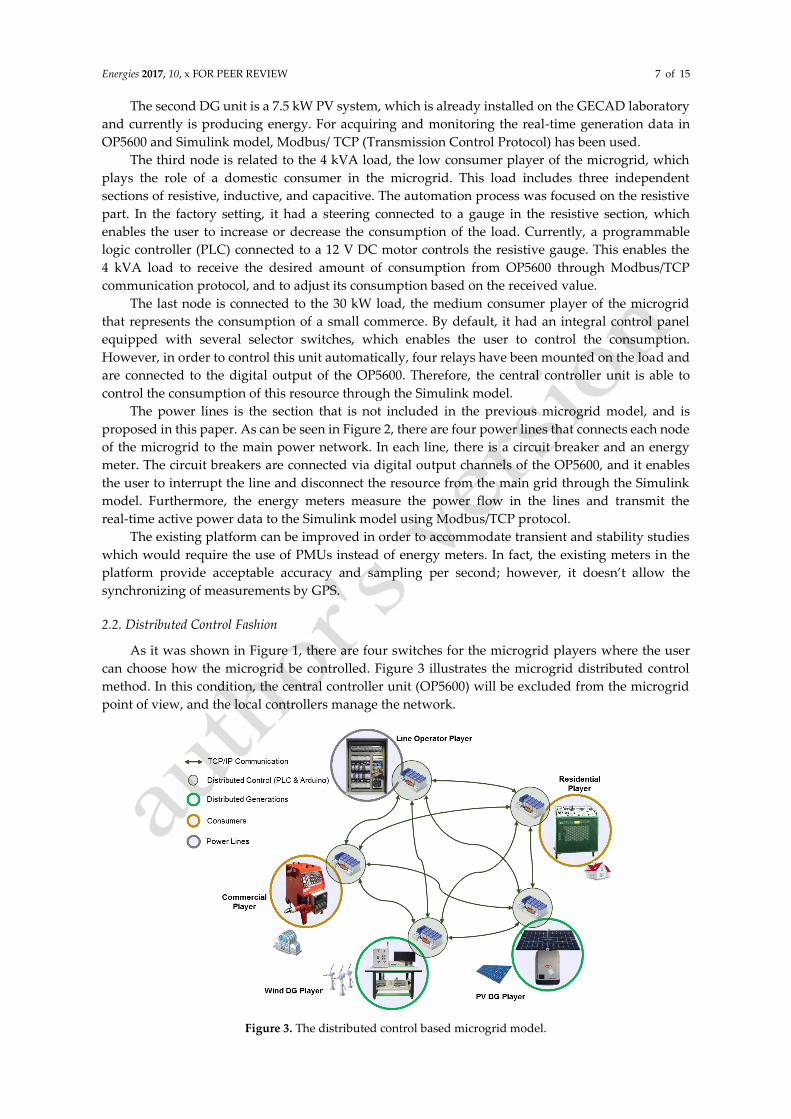
Energies 2017, 10, x FOR PEER REVIEW 7 of 15
The second DG unit is a 7.5 kW PV system, which is already installed on the GECAD laboratory
and currently is producing energy. For acquiring and monitoring the real-time generation data in
OP5600 and Simulink model, Modbus/ TCP (Transmission Control Protocol) has been used.
The third node is related to the 4 kVA load, the low consumer player of the microgrid, which
plays the role of a domestic consumer in the microgrid. This load includes three independent
sections of resistive, inductive, and capacitive. The automation process was focused on the resistive
part. In the factory setting, it had a steering connected to a gauge in the resistive section, which
enables the user to increase or decrease the consumption of the load. Currently, a programmable
logic controller (PLC) connected to a 12 V DC motor controls the resistive gauge. This enables the
4 kVA load to receive the desired amount of consumption from OP5600 through Modbus/TCP
communication protocol, and to adjust its consumption based on the received value.
The last node is connected to the 30 kW load, the medium consumer player of the microgrid
that represents the consumption of a small commerce. By default, it had an integral control panel
equipped with several selector switches, which enables the user to control the consumption.
However, in order to control this unit automatically, four relays have been mounted on the load and
are connected to the digital output of the OP5600. Therefore, the central controller unit is able to
control the consumption of this resource through the Simulink model.
The power lines is the section that is not included in the previous microgrid model, and is
proposed in this paper. As can be seen in Figure 2, there are four power lines that connects each node
of the microgrid to the main power network. In each line, there is a circuit breaker and an energy
meter. The circuit breakers are connected via digital output channels of the OP5600, and it enables
the user to interrupt the line and disconnect the resource from the main grid through the Simulink
model. Furthermore, the energy meters measure the power flow in the lines and transmit the
real-time active power data to the Simulink model using Modbus/TCP protocol.
The existing platform can be improved in order to accommodate transient and stability studies
which would require the use of PMUs instead of energy meters. In fact, the existing meters in the
platform provide acceptable accuracy and sampling per second; however, it doesn’t allow the
synchronizing of measurements by GPS.
2.2. Distributed Control Fashion
As it was shown in Figure 1, there are four switches for the microgrid players where the user
can choose how the microgrid be controlled. Figure 3 illustrates the microgrid distributed control
method. In this condition, the central controller unit (OP5600) will be excluded from the microgrid
point of view, and the local controllers manage the network.
Figure 3. The distributed control based microgrid model.

Energies 2017, 10, x FOR PEER REVIEW 8 of 15
In distributed control, there are five main players: a residential player, using a 4 kVA
controllable load; a commercial player, using a 30 kW controllable load; a line operator player, that
controls the power lines; a PV DG player; and wind DG player. A PLC is dedicated for each player.
This enables the microgrid to accomplish decision making locally and communicate with other
microgrid players, through TCP/IP (Internet Protocol) communication protocol, to achieve the
microgrid´s goals. The players are responsible for constantly exchanging messages in order to report
their latest status in the network.
The microgrid players have dedicated PLCs with several Digital/Analog I/O slots used for their
control and management. Residential player uses digital output slot to control the load motor. The
commercial player is equipped with digital output slot in order to control the relays, and wind DG
player employs an analog output slot for controlling the speed variation of the wind turbine rotor,
and finally the line operator player uses the digital output slot to control the status of the circuit
breakers of the lines.
The main task of the residential and commercial players are to control and adjust their
consumption based on the overall system´s goals. Furthermore, the PV DG player contains the data
regarding the PV production and is accountable for informing the other agents with the latest value
of the PV generation. Meanwhile, the wind DG player undertakes requesting the wind speed data
from an external resource, such as a local weather station, and generates power depending on the
received wind speed value. Finally, there are two main objectives for the line operator player since it
contains all of the energy meters and the circuit breakers employed in the power lines. As
mentioned, the first goal of the line operator player is to supervise the circuit breakers in the power
lines. The second purpose is to request the real-time amount of the active power measured by the
energy meter of each power line and transmit them to the other players. In this way, the other
players, namely residential player, commercial player, and wind DG player, will be aware of their
real-time amount of consumption or generation.
In the distributed control method, adaptability of the system is improved compared with the
centralized control, since the response time to any changes is reduced. Furthermore, the distributed
control method brings reconfigurability and flexibility features to the overall microgrid. Suppose
that, in a simple way, the PV DG player transmits a signal to the other players saying that its instant
amount of generation changed to 4500 W. The wind DG player also broadcasts a message saying that
there is wind generating energy. Therefore, the line operator player responds to the wind DG player
that their current output generation is supposedly 500 W. In the meantime, the residential and
commercial player reply that they are consuming energy with a certain value, and the line operator
player broadcasts their total amount of consumption, which is, supposedly 9500 W. Therefore, the
microgrid supplies the rest of the required power from the power grid; hence, there is not enough
energy production by DG units.
3. Case Study
In this section, a case study is presented and implemented by the microgrid model provided in
this paper in order to test and validate the system capabilities. In this case study, it is considered that
the user intends to use the centralized microgrid control model.
Figure 4 represents a 33 bus distribution network, including 220 consumers and 68 DG units.
The distribution network was implemented MATLAB/Simulink, being compatible with OP5600. The
microgrid model is a node connected to bus #10 of this network. Furthermore, the Simulink model
developed in OP5600 for real-time controlling of the microgrid players is shown in Figure 4.

Energies 2017, 10, x FOR PEER REVIEW 9 of 15
Figure 4. The microgrid model used in the 33 bus network.
In this case study, we consider that a VPP owns the microgrid and its resources containing the
consumers (with or without DR programs), and the energy generators. Therefore, the VPP
aggregates the DG and DR resources since in the proposed microgrid they are considered as small
size resources. Additionally, the VPP is capable to transact energy to the main grid, which means it
can absorb energy while it has high demand and low generation, or inject power to the grid while it
has more generation than consumption. This enables the VPP to have active participation in the
electricity markets.
VPP also can define several DR programs for the microgrid consumers in order to reduce or
shift the consumption to one or more specific periods based on incentives and/or the prices offered
to them. Technical or economic reasons can also be the motivation for the VPP to define DR
programs. While the DR programs defined reduction or shifting, the VPP can use an optimization
for the generation and demand resources in order to economically make a decision and execute the
load shifting scenarios. The number of DR programs that VPP executed is a fundamental matter,
which should be taken into account.
The shifting periods in this model are the amount of power that can be shifted from a period to
other periods. Additionally, the number of periods that the shifted consumption will be entered, and
also the amount of load reduction, which will not be shifted, should be considered.
The optimization problem used in this paper for the VPP has been adapted from [31], and only
the most applicable information has been mentioned in this part. The objective function of this
optimization is to minimize the operation costs of the VPP, considering the generation and shifting
costs in each period t for all periods in the defined time horizon T. Equation (1) demonstrates the
objective function of the optimization problem. The constraints of the model include:
• Balance equation containing the DR balance in each period of t, the energy production, and the
consumption demand, which contains the shifted load from period t to period i, and the
incoming consumption in period t shifted from period i. This is represented in Equation (2);
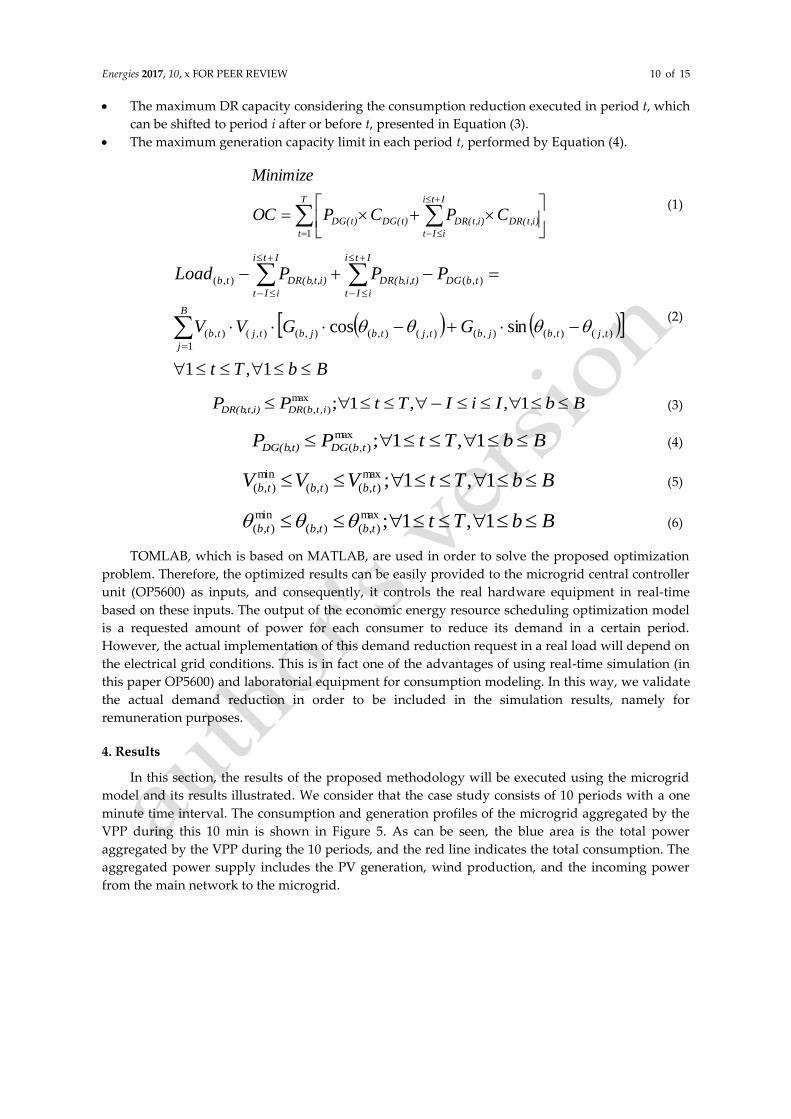
Energies 2017, 10, x FOR PEER REVIEW 10 of 15
• The maximum DR capacity considering the consumption reduction executed in period t, which
can be shifted to period i after or before t, presented in Equation (3).
• The maximum generation capacity limit in each period t, performed by Equation (4).
=
+
−
+=
T
t
Iti
iIt
DR(t,i)DR(t,i)DG(t)DG(t) CPCPOC
imizeMin
1
(1)
( ) ( )
BbTt
GGVV
PPPLoad
B
j
tjtbjbtjtbjbtjtb
tbDG
Iti
iIt
i,t)DR(b
Iti
iIt
t,i)DR(btb
−+−
=−+−
=
+
−
+
−
1,1
sincos1
),(),(),(),(),(),(),(),(
),(,,),(
(2)
BbIiITtPP itbDRt,i)DR(b − 1,,1;max
),,(, (3)
BbTtPP tbDGt)DG(b 1,1;max
),(, (4)
BbTtVVV tbtbtb 1,1;max
),(),(
min
),( (5)
BbTttbtbtb 1,1;max
),(),(
min
),( (6)
TOMLAB, which is based on MATLAB, are used in order to solve the proposed optimization
problem. Therefore, the optimized results can be easily provided to the microgrid central controller
unit (OP5600) as inputs, and consequently, it controls the real hardware equipment in real-time
based on these inputs. The output of the economic energy resource scheduling optimization model
is a requested amount of power for each consumer to reduce its demand in a certain period.
However, the actual implementation of this demand reduction request in a real load will depend on
the electrical grid conditions. This is in fact one of the advantages of using real-time simulation (in
this paper OP5600) and laboratorial equipment for consumption modeling. In this way, we validate
the actual demand reduction in order to be included in the simulation results, namely for
remuneration purposes.
4. Results
In this section, the results of the proposed methodology will be executed using the microgrid
model and its results illustrated. We consider that the case study consists of 10 periods with a one
minute time interval. The consumption and generation profiles of the microgrid aggregated by the
VPP during this 10 min is shown in Figure 5. As can be seen, the blue area is the total power
aggregated by the VPP during the 10 periods, and the red line indicates the total consumption. The
aggregated power supply includes the PV generation, wind production, and the incoming power
from the main network to the microgrid.
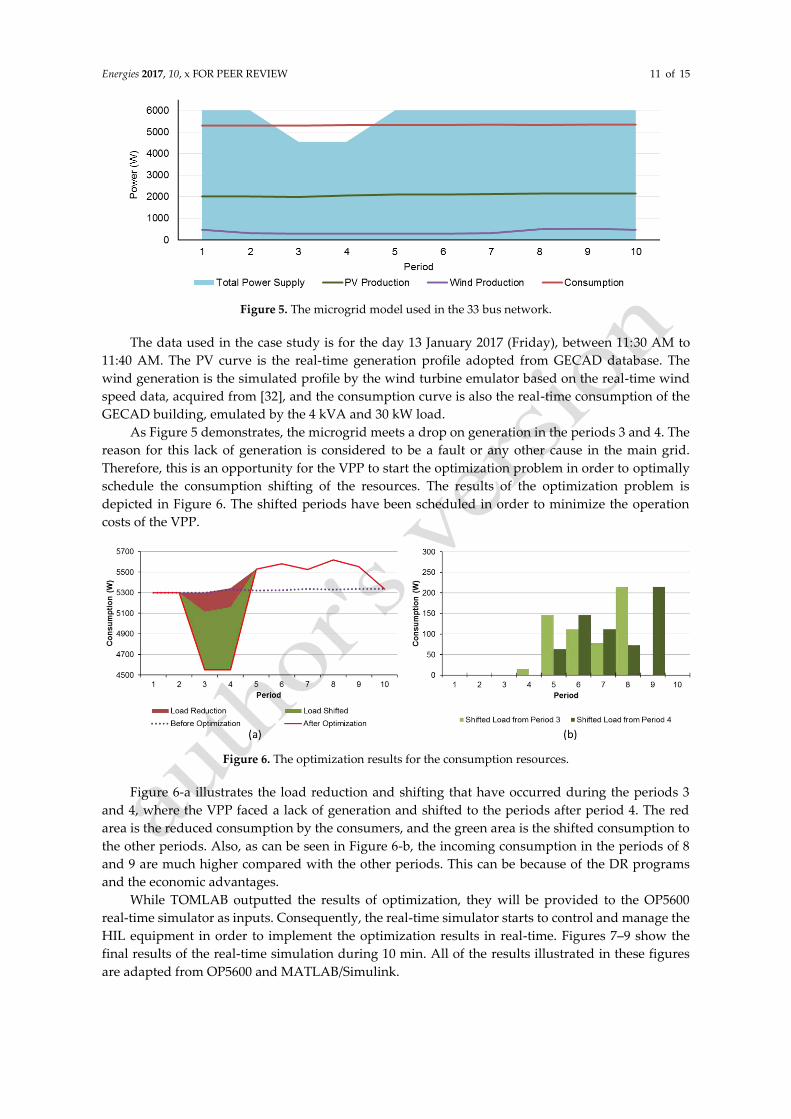
Energies 2017, 10, x FOR PEER REVIEW 11 of 15
Figure 5. The microgrid model used in the 33 bus network.
The data used in the case study is for the day 13 January 2017 (Friday), between 11:30 AM to
11:40 AM. The PV curve is the real-time generation profile adopted from GECAD database. The
wind generation is the simulated profile by the wind turbine emulator based on the real-time wind
speed data, acquired from [32], and the consumption curve is also the real-time consumption of the
GECAD building, emulated by the 4 kVA and 30 kW load.
As Figure 5 demonstrates, the microgrid meets a drop on generation in the periods 3 and 4. The
reason for this lack of generation is considered to be a fault or any other cause in the main grid.
Therefore, this is an opportunity for the VPP to start the optimization problem in order to optimally
schedule the consumption shifting of the resources. The results of the optimization problem is
depicted in Figure 6. The shifted periods have been scheduled in order to minimize the operation
costs of the VPP.
Figure 6. The optimization results for the consumption resources.
Figure 6-a illustrates the load reduction and shifting that have occurred during the periods 3
and 4, where the VPP faced a lack of generation and shifted to the periods after period 4. The red
area is the reduced consumption by the consumers, and the green area is the shifted consumption to
the other periods. Also, as can be seen in Figure 6-b, the incoming consumption in the periods of 8
and 9 are much higher compared with the other periods. This can be because of the DR programs
and the economic advantages.
While TOMLAB outputted the results of optimization, they will be provided to the OP5600
real-time simulator as inputs. Consequently, the real-time simulator starts to control and manage the
HIL equipment in order to implement the optimization results in real-time. Figures 7–9 show the
final results of the real-time simulation during 10 min. All of the results illustrated in these figures
are adapted from OP5600 and MATLAB/Simulink.
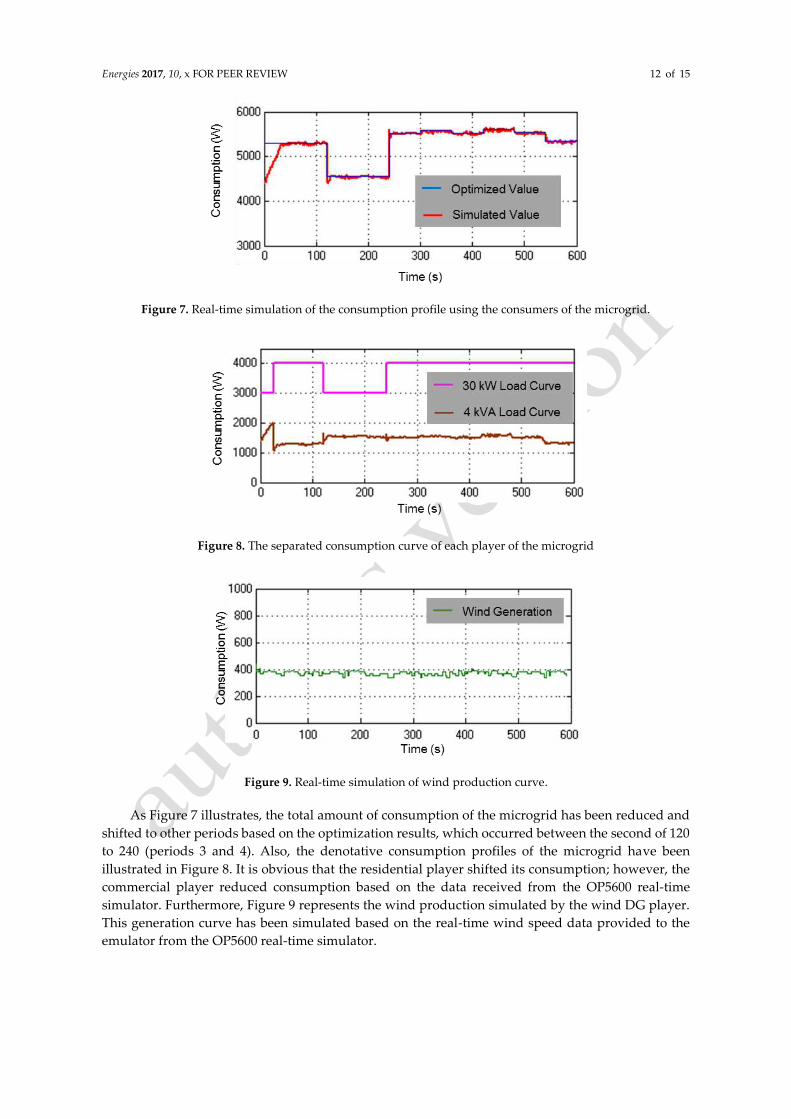
Energies 2017, 10, x FOR PEER REVIEW 12 of 15
Figure 7. Real-time simulation of the consumption profile using the consumers of the microgrid.
Figure 8. The separated consumption curve of each player of the microgrid
Figure 9. Real-time simulation of wind production curve.
As Figure 7 illustrates, the total amount of consumption of the microgrid has been reduced and
shifted to other periods based on the optimization results, which occurred between the second of 120
to 240 (periods 3 and 4). Also, the denotative consumption profiles of the microgrid have been
illustrated in Figure 8. It is obvious that the residential player shifted its consumption; however, the
commercial player reduced consumption based on the data received from the OP5600 real-time
simulator. Furthermore, Figure 9 represents the wind production simulated by the wind DG player.
This generation curve has been simulated based on the real-time wind speed data provided to the
emulator from the OP5600 real-time simulator.

Energies 2017, 10, x FOR PEER REVIEW 13 of 15
5. Conclusions
Microgrids are a particular case of distribution networks, namely in the context of smartgrids.
Demand response and distributed generation are very relevant resources in the scope of microgrids
and smartgrids. As discussed in the present paper, the realistic simulation of the impact of these
resources is very important in order to validate the technical and business model’s impact in
smartgrids management.
In this paper, important improvements have been added to SPIDER, a simulation platform that
accommodates real-time simulation skills adequate for demand response and distributed
generation. The innovative content provides details on the integration of both centralized and
distributed control approaches, and also includes the emulation of generation and load components
which allowed us to more realistically simulate the microgrid and validate the computational
models.
The case study presented here has briefly demonstrated the platform skills in order to validate a
business model for optimal resource scheduling in the microgrid, and its connection to the upstream
distribution network. A VPP managed the resources aiming at minimizing the operation costs. It has
been shown that the results obtained by the scheduling algorithm benefit with the integration in the
real-time simulation platform in order to check the actual simulated consumption and generation
values which include the variability of these resources. Moreover, the presented results are the ones
actually measured in the load, and generation emulation devices which are shown to have relevant
information that was not given by the electrical network simulation model. The main one is that
when the load schedule is changed, the actual consumption devices take some time in order to reach
the desired consumption.
Acknowledgments: The present work was done and funded in the scope of the following projects: H2020
DREAM-GO Project (Marie Sklodowska-Curie grant agreement No. 641794) and UID/EEA/00760/2013 funded
by FEDER Funds through COMPETE program and by National Funds through FCT.
Author Contributions: Omid Abrishambaf wrote and organized the paper, and discussed the work with the
rest of authors; Pedro Faria adapted the SPIDER platform and the network model used for the developed
approach; Luis Gomes implemented the simulation components interoperability and JAVA API; João Spínola
developed the energy resources optimization model; Zita Vale raised and developed the overall concept; Juan
M. Corchado contributed for the distributed control nature
Conflicts of Interest: The authors declare no conflict of interest.
References
1. Siano, P. Demand response and smart grids—A survey. Renew. Sustain. Energy Rev. 2014, 30, 461–478.
2. Gouveia, C.; Moreira, J.; Moreira, C.; Peças Lopes, J. Coordinating storage and demand response for
microgrid emergency operation. IEEE Trans. Smart Grid 2013, 4, 1898–1908.
3. Khatibzadeh, A.; Besmi, M.; Mahabadi, A.; Reza Haghifam, M. Multi-agent-based controller for voltage
enhancement in AC/DC hybrid microgrid using energy storages. Energies 2017, 10, 169.
4. Abrishambaf, O.; Gomes, L.; Faria, P.; Afonso, J.; Vale, Z. Real-time simulation of renewable energy
transactions in microgrid context using real hardware resources. In Proceedings of the 2016 IEEE/PES
Transmission and Distribution Conference and Exposition (T&D), Dallas, TX, USA, 3–5 May 2016; pp. 1–5.
5. Wen, M.H.F.; Li, V.O.K. Optimal phasor data compression unit installation for wide-area measurement
systems—An integer linear programming approach. IEEE Trans. Smart Grid 2016, 7, 2644–2653.
6. Albuquerque, R.J.; Paucar, V.L. Evaluation of the PMUs measurement channels availability for
observability analysis. IEEE Trans. Power Syst. 2013, 28, 2536–2544.
7. Chen, J.; Shrestha, P.; Huang, S.; Sarma, N.D.R.; Adams, J.; Obadina, D.; Ballance, J. Use of synchronized
phasor measurements for dynamic stability monitoring and model validation in ERCOT. In Proceedings
of the 2012 IEEE Power and Energy Society General Meeting, San Diego, CA, USA, 22–26 July 2012; pp.
1–7.
8. Ge, Y.; Flueck, A.J.; Kim, D.K.; Ahn, J.B.; Lee, J.D.; Kwon, D.Y. Power system real-time event detection and
associated data archival reduction based on synchrophasors. IEEE Trans. Smart Grid 2015, 6, 2088–2097.

Energies 2017, 10, x FOR PEER REVIEW 14 of 15
9. Faria, P.; Vale, Z. Demand response in electrical energy supply: An optimal real time pricing approach.
Energy 2011, 36, 5374–5384.
10. Gomes, L.; Faria, P.; Morais, H.; Vale, Z.; Ramos, C. Distributed, agent-based intelligent system for
demand response program simulation in smart grids. IEEE Intell. Syst. 2014, 29, 56–65.
11. Qiang, W.; Zhang, W.; Xu Y.; Khan, I. Distributed control for energy management in a microgrid. In
Proceedings of the 2016 IEEE/PES Transmission and Distribution Conference and Exposition (T&D),
Dallas, TX, USA, 3–5 May 2016; pp. 1–5.
12. Abrishambaf, R.; Hashemipour, M.; Bal, M. Structural modeling of industrial wireless sensor and actuator
networks for reconfigurable mechatronic systems. Int. J. Adv. Manuf. Technol. 2012, 64, 793–811.
13. Werth, A.; Kitamura, N.; Matsumoto, I.; Tanaka, K. Evaluation of centralized and distributed microgrid
topologies and comparison to open energy systems (OES). In Proceedings of the 2015 IEEE 15th
International Conference on Environment and Electrical Engineering (EEEIC), Rome, Italy, 10–13 June
2015; pp. 492–497.
14. Conti, S.; Nicolosi, R.; Rizzo, S.A.; Zeineldin, H.H. Optimal dispatching of distributed generators and
storage systems for MV islanded microgrids. IEEE Trans. Power Deliv. 2012, 27, 1243–1251.
15. Simpson-Porco, J.W.; Shafiee, Q.; Dörfler, F.; Vasquez, J.C.; Guerrero, J.M.; Bullo, F. Secondary frequency
and voltage control of islanded microgrids via distributed averaging. IEEE Trans. Ind. Electron. 2015, 62,
7025–7038.
16. Bayat, M.; Sheshyekani, K.; Hamzeh, M.; Rezazadeh, A. Coordination of distributed energy resources and
demand response for voltage and frequency support of MV microgrids. IEEE Trans. Power Syst. 2016, 31,
1506–1516.
17. Gulin, M.; Vasak, M.; Pavlovic, T. Dynamical behaviour analysis of a DC microgrid in distributed and
centralized voltage control configurations. In Proceedings of the 2014 IEEE 23rd International Symposium
on Industrial Electronics (ISIE), Istanbul, Turkey, 1–4 June 2014; pp. 2365–2370.
18. Colet-Subirachs, A.; Ruiz-Alvarez, A.; Gomis-Bellmunt, O.; Alvarez-Cuevas-Figuerola, F.;
Sudria-Andreu, A. Centralized and distributed active and reactive power control of a utility connected
microgrid using IEC61850. IEEE Syst. J. 2012, 6, 58–67.
19. Karavas, C.; Kyriakarakos, G.; Arvanitis, K.; Papadakis, G. A multi-agent decentralized energy
management system based on distributed intelligence for the design and control of autonomous
polygeneration microgrids. Energy Convers. Manag. 2015, 103, 166–179.
20. Zhao, J.; Dörfler, F. Distributed control and optimization in DC microgrids. Automatica 2015, 61, 18–26.
21. Basir Khan, M.; Jidin, R.; Pasupuleti, J. Multi-agent based distributed control architecture for microgrid
energy management and optimization. Energy Convers. Manag. 2016, 112, 288–307.
22. The ERIGrid European Project. Transnational Access Procedure and Rules. Available online:
https://erigrid.eu/resources/ (accessed on 16 April 2016).
23. Abrishambaf, O.; Gomes, L.; Faria, P.; Vale, Z. Simulation and control of consumption and generation of
hardware resources in microgrid real-time digital simulator. In Proceedings of the 2015 IEEE PES
Innovative Smart Grid Technologies Latin America (ISGT LATAM), Montevideo, Uruguay, 5–7 October
2015; pp. 799–804.
24. GECAD Website. Available online: www.gecad.isep.ipp.pt (accessed on 24 February 2017).
25. Faria, P.; Vale, Z.; Baptista, J. Demand response programs design and use considering intensive
penetration of distributed generation. Energies 2015, 8, 6230–6246.
26. Faria, P.; Spinola, J.; Vale, Z. Aggregation and remuneration of electricity consumers and producers for the
definition of demand-response programs. IEEE Trans. Ind. Inf. 2016, 12, 952–961.
27. Mathworks Website. Available online: www.mathworks.com (accessed on 24 February 2017).
28. TOMLAB Optimization Environment. Available online: www.tomopt.com/tomlab (accessed on 24
February 2017).
29. OPAL-RT Website. Available online: www.opal-rt.com (accessed on 24 February 2017).
30. Abrishambaf, O.; Ghazvini, M.; Gomes, L.; Faria, P.; Vale, Z.; Corchado, J. Application of a home energy
management system for incentive-based demand response program implementation. In Proceedings of
the 2016 27th International Workshop on Database and Expert Systems Applications (DEXA), Porto,
Portugal, 5–8 September 2016; pp. 153–157.

Energies 2017, 10, x FOR PEER REVIEW 15 of 15
31. Faria, P.; Vale, Z. Optimization of generation and aggregated consumption shifting for demand response
programs definition. In Proceedings of the IEEE PES Innovative Smart Grid Technologies, Istanbul,
Turkey, 12–15 October 2014; pp. 1–6.
32. Meteo ISEP Website. Available online: meteo.isep.ipp.pt (accessed on 24 February 2017).
© 2017 by the authors. Submitted for possible open access publication under the
terms and conditions of the Creative Commons Attribution (CC BY) license
(http://creativecommons.org/licenses/by/4.0/).

Luis Gomes
Computational Platform for Household Simulation and Emulation to Test and Validate Energy
Management Methodologies
Authors: Luis Gomes, and Zita Vale
Published in: Demazeau Y., Davidsson P., Bajo J., Vale Z. (eds) Advances in Practical Applications of Cyber-Physical Multi-Agent Systems: The PAAMS Collection. PAAMS 2017. Lecture Notes in Computer Science
DOI: 10.1007/978-3-319-59930-4_29
Published at: June 2017
PhD timeline: M11

Computational Platform for Household Simulation and
Emulation to Test and Validate Energy Management
Methodologies
Luis Gomes1, and Zita Vale1
1GECAD – Research Group on Intelligent Engineering and Computing for Advanced Innova-
tion and Development, Institute of Engineering – Polytechnic of Porto (ISEP/IPP), Rua Dr.
António Bernardino de Almeida, 431, 4200-072 Porto, Portugal
{lufog,zav}@isep.ipp.pt
Abstract. The integration of microgrids brings advantages for the end-
prosumers as well for the grid energy management. Small and medium players
became able to actively participate in microgrids. However, is needed a study
and the appearance of methodologies that can efficiently integrate these players.
The use of load optimization inside households is common in scientific re-
searches. This paper proposes a Java library that can simulate a household using
a combination between real and simulated loads. The library also enables the
execution of optimization algorithms, to be tested and validated. The paper will
present a small demonstration of the library capabilities.
Keywords: Households simulation · Load optimization · Smart homes
1 Introduction
The application of microgrids brings significant advantages to power systems [1], such
as, reduce the energy losses, improve the energy quality for the end-prosumers, and
bring the small and medium players to active rules [2].
The application of Demand Response (DR) programs in top of microgrids enables
an efficient way for small and medium players to interact and actively participate in
microgrid and smart grid [3]. These programs depend on the players’ response, for
this reason, the end-prosumers must have response mechanisms to successfully partic-
ipate in these programs.
The concept of Smart Homes brings intelligent to our households. This concept has
a clear fit with the DR participation, as can be seen in [4] and [5]. A Smart Home
The present work has been developed under the EUREKA - ITEA2 Project SEAS (ITEA-
12004), AVIGAE Project (P2020 - 3401), and has received funding from FEDER Funds
through COMPETE program and from National Funds through FCT under the project
UID/EEA/00760/2013 and SFRH/BD/109248/2015.

enables the energy management in our houses while providing intelligence to our
lives. The aggregation of IoT devices and energy intelligent management methodolo-
gies can be integrated in Smart Homes to provide autonomous and intelligence re-
sponses to DR programs.
This paper proposes a Java library capable of simulate a Smart Home using simu-
late and/or real devices (sensors and energy devices). The library was developed in
Java and provides the ability to create and manage loads, create living scenarios, and
execute load optimization algorithms.
For the demonstration, the library will be applied in a Multi-Agent System (MAS)
that simulates a microgrid. Their agents will use the Smart House Library (SHL) to
simulate loads and integrate real loads available in our laboratory. For testing the op-
timization capabilities, a continuous optimization algorithm will be executed. The
algorithm, presented in [6], allows a real-time load optimization during a given period.
The optimization complies with user preferences and house context, using environ-
mental variables to identify the house context.
After this introduction section, the paper will describe the library main purpose in
section 2. A demonstration scenario will be presented and analyzed in section 3, using
a load optimization algorithm. And in section 4 is presented the main conclusions.
2 Main purpose
The main purpose of this work was to build a Java library with house simulation capa-
bilities, using simulated energy devices and real energy devices. This library enables
the testing and validation of load optimization algorithm to be applied in households.
A previous version was presented in [7].
The proposed library can represent environmental aspects of the house, such as, the
number and location of the people inside the house, the outside and inside tempera-
ture, and the inside clarity. Regarding energy loads, the library is able to work with
simulated loads (simulated locally or externally) and real loads. The combination of
simulated and real devices powered the library to a more complete solution.
The library powers up Multi-Agent Systems (MAS), such as, MASGriP [8], ena-
bling the presence of simulated houses in the MAS. This brings highly advantages if
the MAS focus is, or depends on, the household energy optimization and management.
3 Demonstration
For this demonstration, it will be shown the advantages of the proposed library when
integrated with MASGriP. It will be used a continuous optimization algorithm for load
optimization [6]. The optimization will react to the users’ action.
Fig. 1 shows the android interface used as a library external interface. Using this in-
terface is possible to see general parameters of the house, as well as, monitor and con-
trol all the loads and execute optimization algorithms. The demonstrated house has the
following set of loads available for optimization:

• 1 set of lamps, in the living room (390 W) – this is a real variable load that can
range their consumption between 0 W to 390 W;
• 1 refrigerator, in the kitchen (120 W) – this is a simulated discrete load;
• 2 heaters, one in the living room and other in the room, (2.0 kW) – these are simu-
lated discrete loads;
• 1 water heater, in the attic (1.5 kW) – this is a simulated discrete load.
Fig. 1. Android interface for tablet
The house in configured in the library were is possible to add multiple loads, such as,
real loads controlled using Modbus/TCP (directly or through a Programmable Logic
Controller), simulated loads (discrete or variable) and continuous loads (simulated
loads that follow real load profiles).
The continuous optimization, available in SHL, is used for this demonstration scenar-
io. This optimization runs through a given period of time and reacts to the users ac-
tions, maintaining a limit consumption (offset) in the house overall consumption. The
optimization offset can be stablish for the user or received by the microgrid as part of
a DR program. For this demonstration the offset is: 3500 W. The actions of the user
during the algorithm execution are:
• Action 0 - in this action the optimization starts having a person in the bedroom. The
loads that are turned on are: Heater 1 and 2, the Lights and the Water Heater;
• Action 1 - the user enters the living room and turns on Heater 2 and the Lights;
• Action 2 - in the last action, the user turns off Heater 2.
Table 1 shows the results of the algorithm using the previous actions.
Table 1. Demonstration scenario
Rooms Loads Act. 0 Res Act. 1 Res Act. 2 Res
Bedroom Heater 1 2000 2000 2000 - -
Living
Room
Lights 333 355 360 365 375 370
Heater 2 2000 - 2000 2000 -
Kitchen Refrigerator - - - - -
Attic Water Heater 1500 - - - - 1500 5833 2355 4360 2365 375 1870

At the starting point, where the user is at the bedroom, the algorithm turns off Heat-
er 2 and the Water Heater. When the user moves to the living room the algorithm opts
to turn off Heater 1. In action 3, the user turns off Heater 2 and the algorithm takes the
reaction of turn on the Water Heater that previously was turned off.
4 Conclusions
The Smart House Library is a versatile and complete solution for house simulation
using a combination between real and simulated loads. Being a library, it is easy to
integrate with multi-agent systems that operate in smart grids and microgrids fields.
The dynamism of the library enables the creation of multiple houses using the same
library. The scenario, loads and environment can be determined by the user. The An-
droid interface enables the users to go ‘inside’ the house in real-time. The ability to
integrate real loads brings the reality to the simulation world.
The library includes several load optimization algorithms. This enables the load op-
timization for demand response participation and energy management. The algorithms
take into account the users preferences according to the house environment. Each
house, can choose a different algorithm to run, seeing the different results.
5 References
1. Fu, Q., Montoya, L. F., Solanki, A., Nasiri, A., Bhavaraju, V., Abdallah, T., Yu, D.C.: Mi-
crogrid Generation Capacity Design With Renewables and Energy Storage Addressing
Power Quality and Surety. In: IEEE Transactions on Smart Grid, vol. 3, no. 4, pp. 2019-
2027, (2012)
2. Gomes, L., Faria, P., Morais, H., Vale, Z., Ramos, C.: Distributed, Agent-Based Intelligent
System for Demand Response Program Simulation in Smart Grids. In: IEEE Intelligent
Systems, vol. 29, pp. 56-65 (2014)
3. Siano, P.: Demand response and smart grids - A survey. Renewable and Sustainable Ener-
gy Reviews, vol. 30, pp. 461-478 (2014)
4. Tsui, K.M., Chan, S.C.: Demand Response Optimization for Smart Home Scheduling Un-
der Real-Time Pricing. In: IEEE Transactions on Smart Grid, vol. 3, pp. 1812-1821 (2012)
5. Fernandes, F., Carreiro, A., Morais, H., Vale, Z., Gastaldello, D.S., Amaral, H.L.M., Sou-
za, A.N.: Management of Heating, Ventilation and Air Conditioning system for SHIM
platform. In: IEEE PES Innovative Smart Grid Technologies Latin America (ISGT
LATAM), Montevideo, pp. 275-280 (2015)
6. Gomes, L., Faria, P., Fernandes, F., Vale, Z., Ramos, C.: Domestic consumption simula-
tion and management using a continuous consumption management and optimization algo-
rithm. In: IEEE PES T&D Conference and Exposition, Chicago, IL, USA, pp. 1-5 (2014)
7. Gomes, L., Amaral, H.L.M., Fernandes, F., Faria, P., Vale, Z., Ramos, C.: Dynamic ap-
proach and testbed for small and medium players simulation in smart grid Environments.
In: IFAC Proceedings Volumes 47 (3), 31-36 (2014)
8. Morais, H., Vale, Z., Pinto, T., Gomes, L., Fernandes, F., Oliveira, P., Ramos, C.: Multi-
Agent based Smart Grid management and simulation: Situation awareness and learning in
a test bed with simulated and real installations and players. In: IEEE Power & Energy So-
ciety General Meeting, Vancouver, BC, 2013, pp. 1-5 (2013)

Luis Gomes
Energy Analyzer Emulation for Energy Management Simulators
Authors: Luis Gomes, and Zita Vale
Published in: Omatu S., Rodríguez S., Villarrubia G., Faria P., Sitek P., Prieto J. (eds) Distributed Computing and Artificial Intelligence, 14th International Conference. DCAI 2017. Advances in Intelligent Systems and Computing
DOI: 10.1007/978-3-319-62410-5_26
Published at: June 2017
PhD timeline: M11

Energy Analyzer Emulation for Energy Management
Simulators
Luis Gomes1, and Zita Vale1
1GECAD – Research Group on Intelligent Engineering and Computing for Advanced Innova-
tion and Development, Institute of Engineering – Polytechnic of Porto (ISEP/IPP),
Rua Dr. António Bernardino de Almeida, 431, 4200-072 Porto, Portugal
{lufog,zav}@isep.ipp.pt
Abstract. The simulation of microgrids to testing and validate energy manage-
ment methodologies are an important step to take before the massive implemen-
tation of microgrids. However, microgrids are usually unavailable for R&D
centers to perform tests and validations. To solve this issue is important to get
the simulations closer to the reality, using real energy analyzers and loads.
However, again, R&D centers lack from funding and space to buy and mount
several loads in their laboratories. To solve this issue, this paper proposes a
multi-agent system simulator for microgrids and an energy analyzer emulator
that can be used to emulate individual loads or entire houses, and therefore,
bringing the pure simulation closer to the reality.
Keywords: Energy analyzer emulator · Forecasting · Load emulation · Multi-
agent system
1 Introduction
The power systems have been changing their paradigm from a centralized system to a
decentralized system [1]. This has impact in the generation as well has in the energy
management. The appearance of a smart grids with microgrids and smart homes are, in
present day, becoming a reality, with more and more applications worldwide [2,3].
The application of microgrids in power system brings advantages for the majority
of players [4]. However, to achieve the massive implementation of microgrids some
steps are needed. There are a need of capable simulators that can represent microgrids
in a way that energy management methodologies can be tested and validated.
The present work has been developed under the EUREKA - ITEA2 Project M2MGrids
(ITEA-13011), Project SIMOCE (ANI|P2020 17690), and has received funding from FEDER
Funds through COMPETE program and from National Funds through FCT under the project
UID/EEA/00760/2013 and SFRH/BD/109248/2015.

The use of a Multi-Agent System (MAS) to analyze and improve microgrids behav-
ior, regarding the energy management, is a perfect fit [5,6]. The use of MAS allows
the representation microgrid players, where we have individual players cooperating
with each other (trying to combine their individual goals with the group goals).
The consumption forecasting is an important part of the energy management sys-
tems. Usually, in energy management system, we work in future periods [7], like day-
ahead or hour-ahead. It is only possible to manage energy for a future period if we
know what will happen, or at least have an idea about how the things will unfold.
Forecasting algorithms are necessary for in advance energy management solutions.
And therefore, there are several works concerning this issue [8,9].
Having the simulations and the methodologies, is necessary to go further, close to
the real implementation. This is a gap that most of works do not achieve. This paper
proposes an energy analyzer emulator that can be integrated in the simulations. The
emulator, named Virtual to Reality (V2R), works as a real analyzer and presents to the
system as one. This enables the system to test and work with, what it seems, a real
analyzer. The use of emulators brings advantages compared to the use of real analyz-
ers. With real analyzers, the R&D center must buy real controllable loads and is not a
scalable solution if we think in a simulation with 100 houses. Applying emulators, and
going closer to reality is possible to have better simulations than the pure simulations
existing today that do not deal with hardware [10,11], standing themselves far from
real implementations in pilots and/or microgrids.
The main contribution of this paper in the integration of V2R in a microgrid man-
agement multi-agent system. This integration will enable the efficient and realistic
simulation of microgrids in the multi-agent system. The paper presents the V2R and
the multi-agent system, which started as a simulator and now is running with real
buildings. The case study presents a consumption forecast of the microgrid, proving
V2R capabilities of working as an energy analyzer emulator.
After this introduction section, the paper will describe the multi-agent system used
for the microgrid implementation in section 2. A brief explanation of forecasting is
given in section 3. Section 4 presents the proposed energy analyzer emulator. The case
study is presented in section 5. And the main conclusions are presented in section 6.
2 Multi-Agent System for Microgrid Implementation
This paper will use the Multi-Agent Smart Grid Platform (MASGriP) to simulate a
microgrid. MASGriP is a complete platform used for studies along the years [12]. It
was developed in Java and can combine simulated agents (representing simulated
buildings) with real agents (representing real buildings).
In order to test a microgrid, our R&D center implemented a microgrid in our build-
ings [13][14]. Using MASGriP is possible to represent each of the microgrid players
in a computational platform. MASGriP was built using JADE framework, each player
is independent from the each other and work together using a cooperation approach.
The communication between agents are compliant to FIPA specifications. Fig. 1
shows the implementation used in this paper:
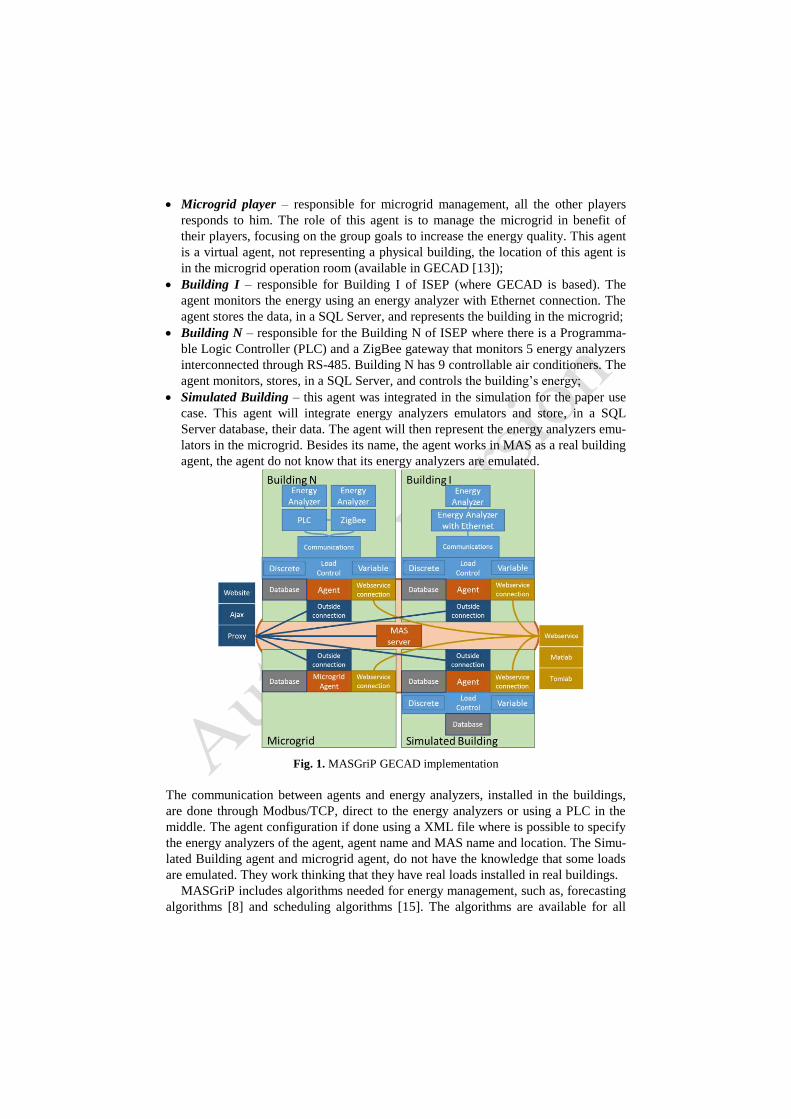
• Microgrid player – responsible for microgrid management, all the other players
responds to him. The role of this agent is to manage the microgrid in benefit of
their players, focusing on the group goals to increase the energy quality. This agent
is a virtual agent, not representing a physical building, the location of this agent is
in the microgrid operation room (available in GECAD [13]);
• Building I – responsible for Building I of ISEP (where GECAD is based). The
agent monitors the energy using an energy analyzer with Ethernet connection. The
agent stores the data, in a SQL Server, and represents the building in the microgrid;
• Building N – responsible for the Building N of ISEP where there is a Programma-
ble Logic Controller (PLC) and a ZigBee gateway that monitors 5 energy analyzers
interconnected through RS-485. Building N has 9 controllable air conditioners. The
agent monitors, stores, in a SQL Server, and controls the building’s energy;
• Simulated Building – this agent was integrated in the simulation for the paper use
case. This agent will integrate energy analyzers emulators and store, in a SQL
Server database, their data. The agent will then represent the energy analyzers emu-
lators in the microgrid. Besides its name, the agent works in MAS as a real building
agent, the agent do not know that its energy analyzers are emulated.
Fig. 1. MASGriP GECAD implementation
The communication between agents and energy analyzers, installed in the buildings,
are done through Modbus/TCP, direct to the energy analyzers or using a PLC in the
middle. The agent configuration if done using a XML file where is possible to specify
the energy analyzers of the agent, agent name and MAS name and location. The Simu-
lated Building agent and microgrid agent, do not have the knowledge that some loads
are emulated. They work thinking that they have real loads installed in real buildings.
MASGriP includes algorithms needed for energy management, such as, forecasting
algorithms [8] and scheduling algorithms [15]. The algorithms are available for all
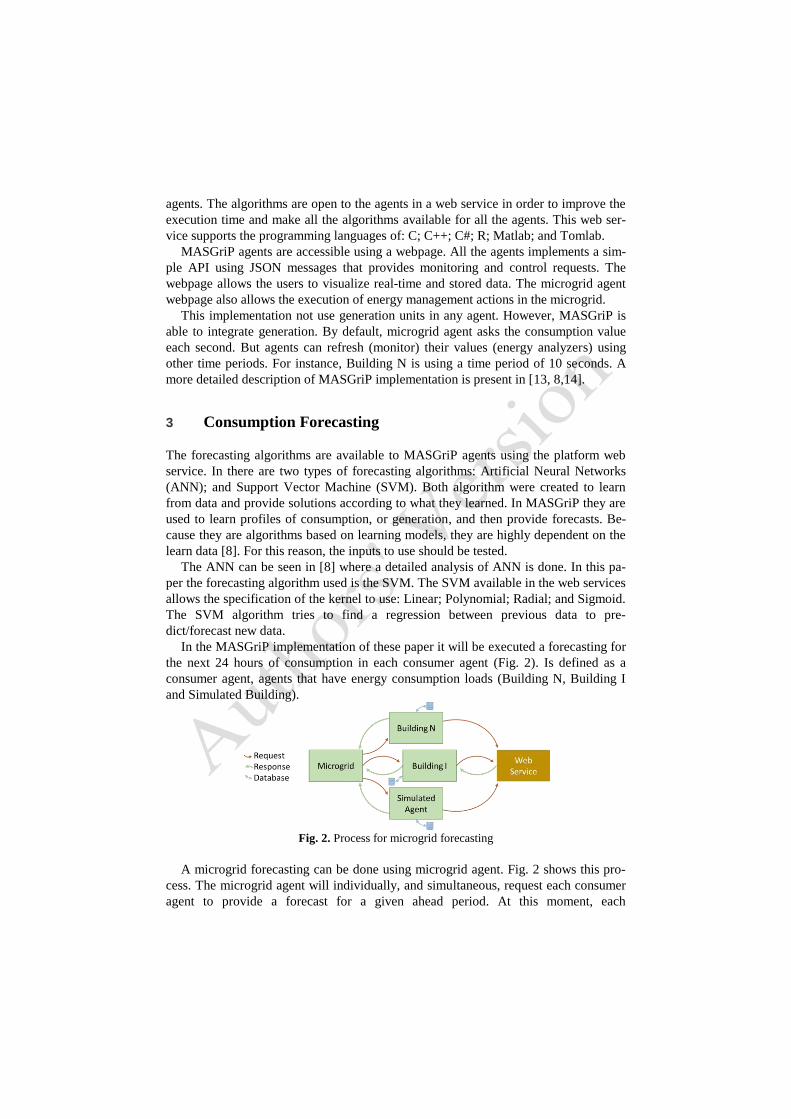
agents. The algorithms are open to the agents in a web service in order to improve the
execution time and make all the algorithms available for all the agents. This web ser-
vice supports the programming languages of: C; C++; C#; R; Matlab; and Tomlab.
MASGriP agents are accessible using a webpage. All the agents implements a sim-
ple API using JSON messages that provides monitoring and control requests. The
webpage allows the users to visualize real-time and stored data. The microgrid agent
webpage also allows the execution of energy management actions in the microgrid.
This implementation not use generation units in any agent. However, MASGriP is
able to integrate generation. By default, microgrid agent asks the consumption value
each second. But agents can refresh (monitor) their values (energy analyzers) using
other time periods. For instance, Building N is using a time period of 10 seconds. A
more detailed description of MASGriP implementation is present in [13, 8,14].
3 Consumption Forecasting
The forecasting algorithms are available to MASGriP agents using the platform web
service. In there are two types of forecasting algorithms: Artificial Neural Networks
(ANN); and Support Vector Machine (SVM). Both algorithm were created to learn
from data and provide solutions according to what they learned. In MASGriP they are
used to learn profiles of consumption, or generation, and then provide forecasts. Be-
cause they are algorithms based on learning models, they are highly dependent on the
learn data [8]. For this reason, the inputs to use should be tested.
The ANN can be seen in [8] where a detailed analysis of ANN is done. In this pa-
per the forecasting algorithm used is the SVM. The SVM available in the web services
allows the specification of the kernel to use: Linear; Polynomial; Radial; and Sigmoid.
The SVM algorithm tries to find a regression between previous data to pre-
dict/forecast new data.
In the MASGriP implementation of these paper it will be executed a forecasting for
the next 24 hours of consumption in each consumer agent (Fig. 2). Is defined as a
consumer agent, agents that have energy consumption loads (Building N, Building I
and Simulated Building).
Fig. 2. Process for microgrid forecasting
A microgrid forecasting can be done using microgrid agent. Fig. 2 shows this pro-
cess. The microgrid agent will individually, and simultaneous, request each consumer
agent to provide a forecast for a given ahead period. At this moment, each

agent/player should execute the forecast it wants (ANN or SVM). The agent uses the
stored data to feed the input of the forecasting and then waits for the web service re-
sponse. The forecasting are executed locally and in a distributed way throughout the
MAS. After processing the forecast, the agents send the data back to the microgrid
agent. Then, microgrid agent, will aggregate the forecasts and create a global forecast.
This process requires more process in the web service side, however, it maintains the
consumptions data in the consumer side (no stored data goes to the microgrid agent).
4 V2R - Energy Analyzer Emulator
Energy analyzers are a useful tool for energy monitoring in new and old buildings.
These products can be found on the market with a widely range of prices. There are
single-phase and three-phase. Some of them also allows the on/off control of an output
port. They can be mounted in the entire building, a single room or a single load.
The capability of measuring energy is important for power systems R&D centers
that have a need for build scenarios with real data. The protocol normally used for
communications is Modbus. This is a simple request-response protocol that works in
two communication standards: RS-485; and TCP/IP. Modbus/TCP is used through
TCP/IP using Ethernet, in order to use this protocol the energy analyzer need an
Ethernet connection or is needed a RS-485 to TCP/IP interface. Modbus/RTU is used
through RS-485 and is adopted by the majority of manufactures.
The energy analyzers work perfectly if the goal is to measure real loads with real
consumption. However, is not possible to use them to simulate loads. This is a prob-
lem for implemented and installed solutions that need to perform tests and validation
of various scenarios. To solve this issue, this paper proposes the use of Virtual to Re-
ality (V2R) emulator [16]. This is an emulator built to overpass the limitations of the
energy analyzers. V2R allows the simulation of loads using the installed infrastructure.
V2R is basically an energy analyzer for load emulation, which uses the same Mod-
bus/RTU communication as an energy analyzer. Fig. 3 shows the V2R components.
Fig. 3. V2R emulator (physical components)
V2R provides a LCD display to monitor and configure some parameters (Fig. 3). The
emulator allows six types of emulations:
• Chart Load – this type of emulation follows the data in a chart using the Real-Time
Clock (RTC) to mimic the input consumption using the data stamp. This is an un-
controlled load that follows a profile consumption, it is a good option for a refrig-
erator emulation without control;

• Discrete Load – this is a controllable load (using the LCD shield buttons), the con-
figuration defines the on state consumption and the off state consumption. Them
the emulator turns the load on and off according to the pressing of the button (by
the user or using a webpage interface). This can be indicated for heater;
• Variable Load – similar to the discrete load but the load is dimmable, this is a good
choice for a lamp;
• Contextual Load – this emulation is the combination of the chart load with the
discrete load. This load is controllable but follows a consumption profile when it is
on. For instance, this emulation can be used for a washing machine, that when is
turned on it will follow the consumption profile of a washing program;
• OPAL-RT Load – some loads cannot be easily emulated, for this reason V2R can
connects to OPAL-RT that is a real-time simulator able to simulate even the most
complex loads. V2R will connect to OPAL-RT and display the consumptions simu-
lated in OPAL-RT. This can be indicated for a wind turbine;
• Modbus/TCP Mirror Load – the mirror load enables the use of loads in a system
where they are not, this type reads the consumption of a distant load (using Mod-
bus/TCP), that can be in the other side of the world, and mirrors its’ consumptions.
5 Case Study
For this case study it will be used the MASGriP platform for the multi-agent system to
represent the implementation of Fig. 1. The user requests a forecast to the microgrid
agent. This request starts three new requests simultaneous where the microgrid agent
requests the other players (Building N, Building I and the Simulated Building) to exe-
cute a forecasting for next day consumptions.
Building N and Building I agent will use real data of the buildings. For the fore-
casting, it will be used the two last months for training. The forecast of one day is
composed by 24 values (one value of consumption per hour). The agents will execute
the forecasting using SVM algorithm, which are available in the web service and was
previously discussed in Section 3.
The Simulated Building was created using V2R. The agent, representing the Simu-
lated Building in MASGriP, don’t know it’s working with simulated loads, the V2R
loads are integrated as real loads. The V2R emulates the loads using chart emulation
that execute emulations using previous store data. The Simulated agent has three V2R
connected: one that emulates a refrigerator; on for a water heater emulation; and other
that represents the rest of the house. For the last V2R is used a data set available in the
Intelligent Data Mining and Analysis Working Group website1, identified with the
name Private Home 6. For the Simulated Building forecasting, it is used a two month
period for training, equal to the other agents.
The microgrid agent waits for the agents individual responses and then combine
them to obtain the microgrid forecast. Fig. 4 shows the microgrid forecast using the
1 http://sites.ieee.org/pes-iss

discrimination of the agents. Building N and Building I are offices with a high volume
of consumption, while the Simulated Building represents a single house.
Remember, that the Simulated Building agent don’t know that the loads it is read-
ing are emulated. The results shows that the V2R worked perfectly, given the system
the impression that the building was real with real energy analyzers reading real loads.
Fig. 4. Microgrid forecast by buildings
The forecasting algorithm result represents the forecast of the microgrid. The high-
est consumption during the day will be between 10 a.m. and 7 p.m.. In the opposite
side, in the Simulated Building, because is a residential house, the highest consump-
tion are at 8 a.m. and 10 p.m., these are the periods where people tend to have bigger
consumption inside their houses. Building I, because of their characteristics, do not
present significant changes of consumption through the entire day. In order to improve
the forecast, new inputs must be studied and analyzed.
6 Conclusions
The need for microgrids studies is a reality, the power system paradigm demands new
solutions involving distributed generation and distributed energy management sys-
tems. But in the other hand, the execution of tests and validations from the scientific
community is limit to the available hardware, in very uncommon for the R&D groups
to have an operational microgrid to test on.
The use of multi-agent systems and load emulation enables quick and efficient tests
and validation, regarding energy management methodologies (but not in a hardware
point of view). Multi-agent systems are already used for power systems, this paper
proposes the use of a multi-agent system with load emulators that can be used with
real systems, combining both worlds. The application of energy analyzers emulators,
bring the systems closer to reality. The case study shows exactly this capability. In the
case study the multi-agent system, which is implemented in real buildings, worked
also with a simulated building (built with load emulators) without knowing that the
building do not exist.
The combination between multi-agent systems, real buildings and emulators are an
important step towards the real implementation of energy management systems in
pilots’ sites and new microgrids’ sites.
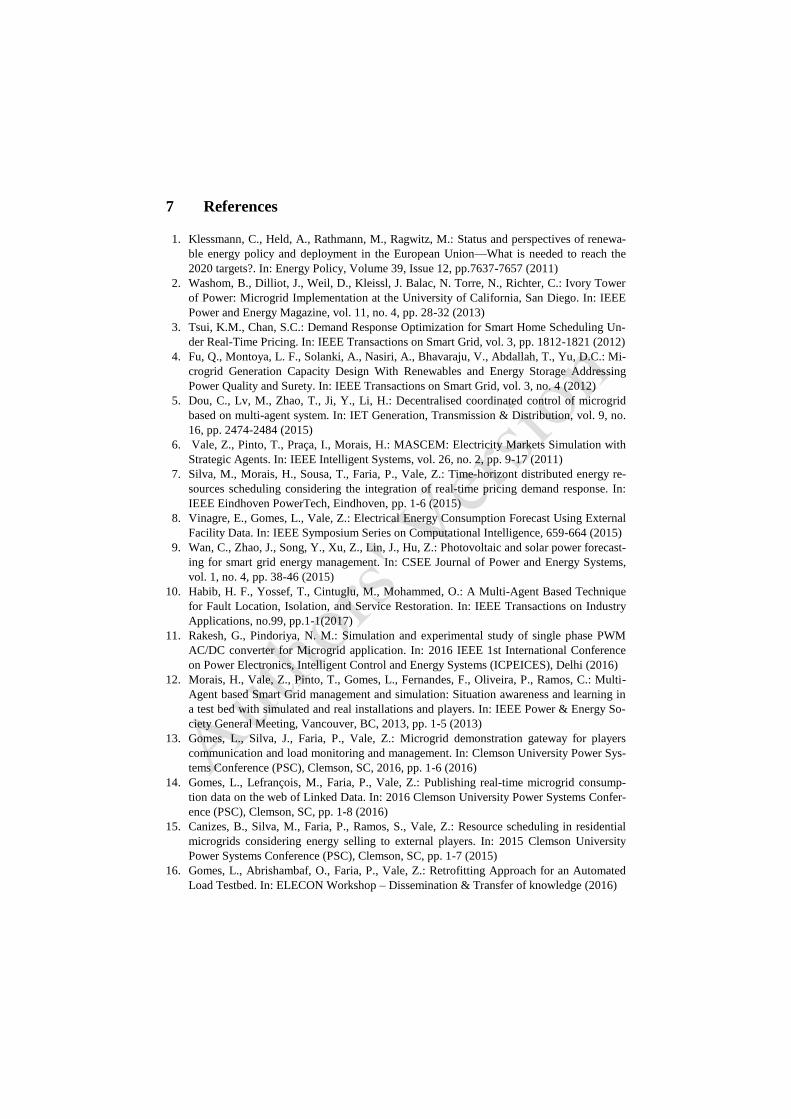
7 References
1. Klessmann, C., Held, A., Rathmann, M., Ragwitz, M.: Status and perspectives of renewa-
ble energy policy and deployment in the European Union—What is needed to reach the
2020 targets?. In: Energy Policy, Volume 39, Issue 12, pp.7637-7657 (2011)
2. Washom, B., Dilliot, J., Weil, D., Kleissl, J. Balac, N. Torre, N., Richter, C.: Ivory Tower
of Power: Microgrid Implementation at the University of California, San Diego. In: IEEE
Power and Energy Magazine, vol. 11, no. 4, pp. 28-32 (2013)
3. Tsui, K.M., Chan, S.C.: Demand Response Optimization for Smart Home Scheduling Un-
der Real-Time Pricing. In: IEEE Transactions on Smart Grid, vol. 3, pp. 1812-1821 (2012)
4. Fu, Q., Montoya, L. F., Solanki, A., Nasiri, A., Bhavaraju, V., Abdallah, T., Yu, D.C.: Mi-
crogrid Generation Capacity Design With Renewables and Energy Storage Addressing
Power Quality and Surety. In: IEEE Transactions on Smart Grid, vol. 3, no. 4 (2012)
5. Dou, C., Lv, M., Zhao, T., Ji, Y., Li, H.: Decentralised coordinated control of microgrid
based on multi-agent system. In: IET Generation, Transmission & Distribution, vol. 9, no.
16, pp. 2474-2484 (2015)
6. Vale, Z., Pinto, T., Praça, I., Morais, H.: MASCEM: Electricity Markets Simulation with
Strategic Agents. In: IEEE Intelligent Systems, vol. 26, no. 2, pp. 9-17 (2011)
7. Silva, M., Morais, H., Sousa, T., Faria, P., Vale, Z.: Time-horizont distributed energy re-
sources scheduling considering the integration of real-time pricing demand response. In:
IEEE Eindhoven PowerTech, Eindhoven, pp. 1-6 (2015)
8. Vinagre, E., Gomes, L., Vale, Z.: Electrical Energy Consumption Forecast Using External
Facility Data. In: IEEE Symposium Series on Computational Intelligence, 659-664 (2015)
9. Wan, C., Zhao, J., Song, Y., Xu, Z., Lin, J., Hu, Z.: Photovoltaic and solar power forecast-
ing for smart grid energy management. In: CSEE Journal of Power and Energy Systems,
vol. 1, no. 4, pp. 38-46 (2015)
10. Habib, H. F., Yossef, T., Cintuglu, M., Mohammed, O.: A Multi-Agent Based Technique
for Fault Location, Isolation, and Service Restoration. In: IEEE Transactions on Industry
Applications, no.99, pp.1-1(2017)
11. Rakesh, G., Pindoriya, N. M.: Simulation and experimental study of single phase PWM
AC/DC converter for Microgrid application. In: 2016 IEEE 1st International Conference
on Power Electronics, Intelligent Control and Energy Systems (ICPEICES), Delhi (2016)
12. Morais, H., Vale, Z., Pinto, T., Gomes, L., Fernandes, F., Oliveira, P., Ramos, C.: Multi-
Agent based Smart Grid management and simulation: Situation awareness and learning in
a test bed with simulated and real installations and players. In: IEEE Power & Energy So-
ciety General Meeting, Vancouver, BC, 2013, pp. 1-5 (2013)
13. Gomes, L., Silva, J., Faria, P., Vale, Z.: Microgrid demonstration gateway for players
communication and load monitoring and management. In: Clemson University Power Sys-
tems Conference (PSC), Clemson, SC, 2016, pp. 1-6 (2016)
14. Gomes, L., Lefrançois, M., Faria, P., Vale, Z.: Publishing real-time microgrid consump-
tion data on the web of Linked Data. In: 2016 Clemson University Power Systems Confer-
ence (PSC), Clemson, SC, pp. 1-8 (2016)
15. Canizes, B., Silva, M., Faria, P., Ramos, S., Vale, Z.: Resource scheduling in residential
microgrids considering energy selling to external players. In: 2015 Clemson University
Power Systems Conference (PSC), Clemson, SC, pp. 1-7 (2015)
16. Gomes, L., Abrishambaf, O., Faria, P., Vale, Z.: Retrofitting Approach for an Automated
Load Testbed. In: ELECON Workshop – Dissemination & Transfer of knowledge (2016)

Luis Gomes
Statistics-Based Approach to Enable Consumer Profile Definition for Demand Response Programs
Authors: Ricardo A. S. Fernandes, L. O. Deus, Luis Gomes, and Zita Vale
Published in: Omatu S., Rodríguez S., Villarrubia G., Faria P., Sitek P., Prieto J. (eds) Distributed Computing and Artificial Intelligence, 14th International Conference. DCAI 2017. Advances in Intelligent Systems and Computing
DOI: 10.1007/978-3-319-62410-5_8
Published at: June 2017
PhD timeline: M11

Statistics-Based Approach to Enable Consumer
Pro�le De�nition for Demand Response Programs
R. A. S. Fernandes1, L. Gomes2, and Z. Vale2
1 Department of Electrical Engineering, Federal University of Sao Carlos - UFSCar,Sao Carlos, Brazil
[email protected],2 Knowledge Engineering and Decision Support Research Center � GECAD,
Institute Polytechnic of Porto � IPP, Porto, [email protected]
Abstract. This paper presents a statistical analysis of a database gen-erated by voltage and current measurements acquired in a laboratorialenvironment, which simulates a residential kitchen. In this sense, datawere acquired during the month of January 2015 in order to verify boththe occurrence of errors as well as the possible identi�cation of the loads.Thus, it is intended that the statistical analysis allows the database tobe used to the purposes of Demand Response. However, at �rst, therewas an analysis by histograms in order to verify the occurrence of er-rors on the measurements and then the feature extraction stage. In thesequence, these features were used to de�ne decision rules that couldperform the identi�cation of loads. The results obtained demonstratedan average precision rate of more than 90%.
Keywords: statiscal analysis, non-intrusive load monitoring, con�denceintervals, demand response
1 Introduction
The methodologies aimed at the identi�cation of loads, also known as Non-Intrusive Load Monitoring (NILM) have gained visibility in recent years [1]-[4],mainly due to the programs of Demand Response. One of the concerns in thatarea is the idealization of methods to optimize the relationship between energydemand and their hourly prices [5]-[6]. In this way, it is important to de�ne anapproach that is e�cient, where many studies have been proposed for NILM,among which one may highlight [1], [2] and [4].
Hence, in [1], the authors propose a non-invasive method that can be usedboth for monitoring purposes and for the identi�cation of residential appliances.The meter used requires a sampling rate that ensures the acquisition of at least10 samples per second. It is worth mentioning that this method divides theappliances into three major categories that represent sets of appliances. However,it is noted that some of the appliances were represented by categories, probablybecause the appliance is on the edge between the two categories. Thus, the

authors used a Linear Discriminant that was possible to obtain a precision rateabove 80
At the work proposed by [2], the authors precisely show that data from smartmeters can be used in order to disaggregate the load consumptions and thenimprove the decisions to be taken by consumers to reduce their energy costs. Theproposed methodology was based on the veri�cation of events in data windowswhere the following tasks are performed: edge detection, trend signature, timesignature, and sequence signature. The decision is made based on the responsesobtained for each window. Using this method, the authors obtained a precisionrate above 90
In a recent method proposed by [4], the authors employ a temporal multi-label technique to identify the loads of residences in France, where the datawas sampling in 10, 30 and 60-minutes interval. Thus, the authors evaluate theidenti�cation of individual loads and combinations of two loads at the same time.
Following the above context, this paper proposes an analysis of a laboratorialdatabase through statistical tools, with two objectives. The �rst objective is thehistogram analysis in order to verify the occurrence of possible errors on themeasurements. The second objective is the proper identi�cation of loads throughdecision rules.
2 Laboratorial Database Composition
It is important to mention that the laboratorial database was implemented inSQL Server, where data could be obtained by remote queries. However, such adatabase could only be created by means of a laboratorial infrastructure whichis based on three-phase power analyzers from the Electrex (Femto D4 model).After obtaining the current and voltage signals, these are evaluated in order tocalculate some variables, such as: RMS voltage and current; power factor; appar-ent, reactive and real power; total harmonic distortion of voltage and current;and neutral current. Importantly, all these variables can be obtained for each ofthe three phases and a time stamp is assigned for each measurement. In addition,each set of measurements is available in 10-second intervals.
The generated variables are available via Modbus (RS-485) communicationchannel. Thus, a Programmable Logic Controller (PLC) receives the data andsends them through an Ethernet communication channel to the Database Server.In order to clarify this explanation, a block diagram representing this system isshown in Figure 1.
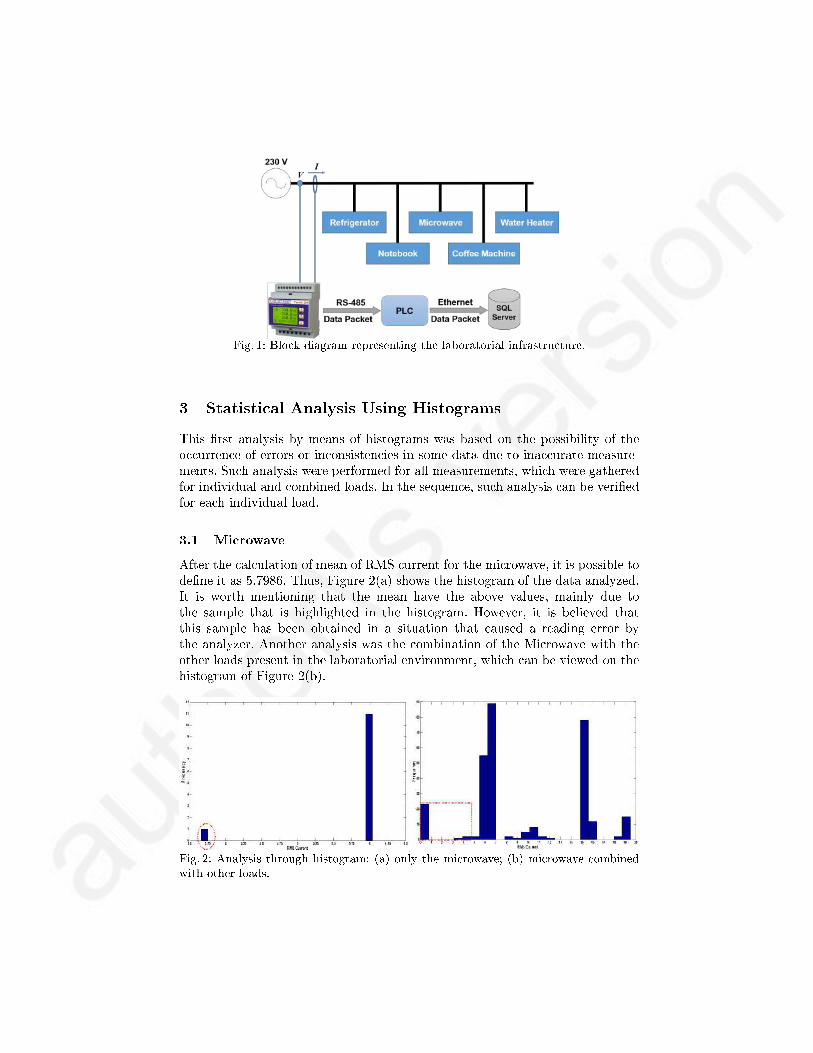
Fig. 1: Block diagram representing the laboratorial infrastructure.
3 Statistical Analysis Using Histograms
This �rst analysis by means of histograms was based on the possibility of theoccurrence of errors or inconsistencies in some data due to inaccurate measure-ments. Such analysis were performed for all measurements, which were gatheredfor individual and combined loads. In the sequence, such analysis can be veri�edfor each individual load.
3.1 Microwave
After the calculation of mean of RMS current for the microwave, it is possible tode�ne it as 5.7986. Thus, Figure 2(a) shows the histogram of the data analyzed.It is worth mentioning that the mean have the above values, mainly due tothe sample that is highlighted in the histogram. However, it is believed thatthis sample has been obtained in a situation that caused a reading error bythe analyzer. Another analysis was the combination of the Microwave with theother loads present in the laboratorial environment, which can be viewed on thehistogram of Figure 2(b).
Fig. 2: Analysis through histogram: (a) only the microwave; (b) microwave combinedwith other loads.
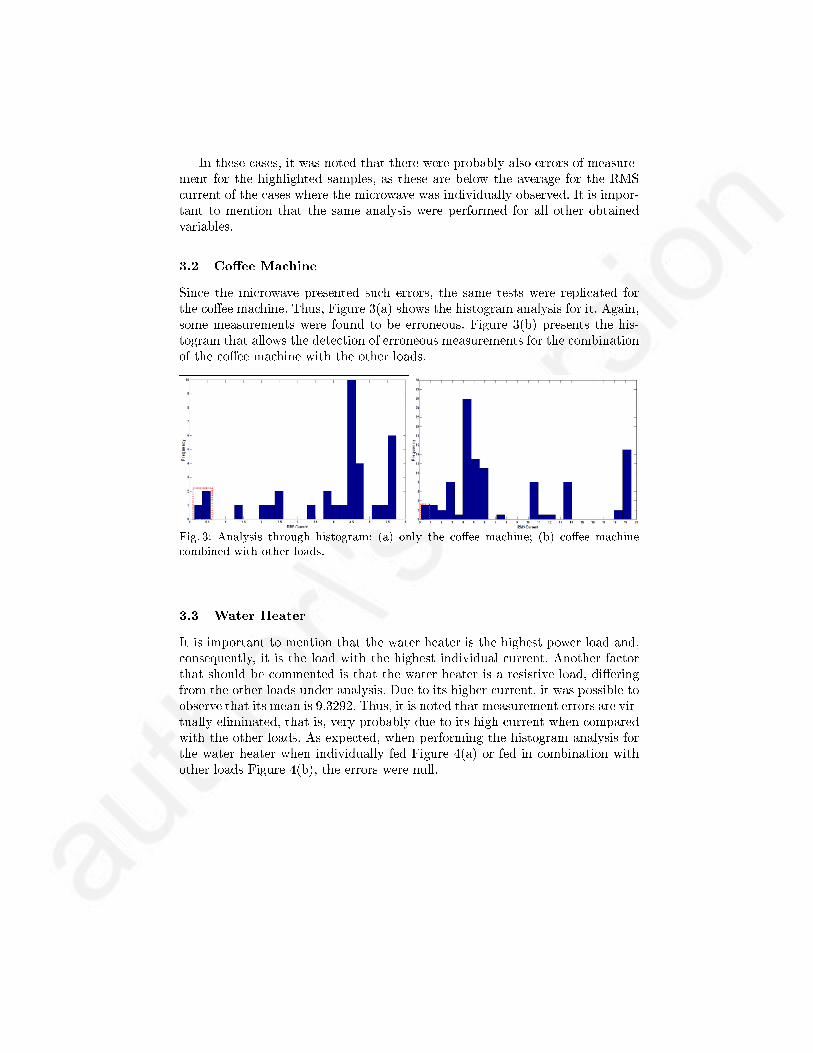
In these cases, it was noted that there were probably also errors of measure-ment for the highlighted samples, as these are below the average for the RMScurrent of the cases where the microwave was individually observed. It is impor-tant to mention that the same analysis were performed for all other obtainedvariables.
3.2 Co�ee Machine
Since the microwave presented such errors, the same tests were replicated forthe co�ee machine. Thus, Figure 3(a) shows the histogram analysis for it. Again,some measurements were found to be erroneous. Figure 3(b) presents the his-togram that allows the detection of erroneous measurements for the combinationof the co�ee machine with the other loads.
Fig. 3: Analysis through histogram: (a) only the co�ee machine; (b) co�ee machinecombined with other loads.
3.3 Water Heater
It is important to mention that the water heater is the highest power load and,consequently, it is the load with the highest individual current. Another factorthat should be commented is that the water heater is a resistive load, di�eringfrom the other loads under analysis. Due to its higher current, it was possible toobserve that its mean is 9.3292. Thus, it is noted that measurement errors are vir-tually eliminated, that is, very probably due to its high current when comparedwith the other loads. As expected, when performing the histogram analysis forthe water heater when individually fed Figure 4(a) or fed in combination withother loads Figure 4(b), the errors were null.

Fig. 4: Analysis through histogram: (a) only the water heater; (b) water heater com-bined with other loads.
3.4 Refrigerator
Finally, the refrigerator is a very complex case to have its measurement errorsassessed, as its RMS current is low when compared to other loads and, for thisreason, its mean is 0.42. Thus, by means of Figure 5(a), it was noted that somesamples had a rather inconsistent value for when the refrigerator was individuallyfed, because its RMS current went from a mean of 0.42 A to almost 5 A. Thus, itis concluded that such a measurement would only be possible due to the followingcauses: error by the CT transducer, a possible transient event occurred in theelectrical network or a transient event caused by the refrigerator compressor.
As for Figure 5(b), it shows the analysis performed for the refrigerator com-bined with other loads, where there is a di�culty in establishing possible erro-neous measurements, since the other loads have high currents when compared tothe refrigerator. Therefore, in these cases, no erroneous sample could be detected.
Fig. 5: Analysis through histogram: (a) only the refrigerator; (b) refrigerator combinedwith other loads.
After the histogram analysis, it was possible to detect samples that couldgenerate an incorrectly identi�cation by means of the decision rules. Thus, mea-surements that presented errors were excluded from the database so that the

statistical calculations were redone considering, for such purposes, only reliablemeasurements.
4 Decision Rules Based on Statistical Analysis
Based on the analysis performed through histograms, some errors in the mea-surements became evident, which were then eliminated from the database togenerate decision rules that might characterize the loads (individually and com-bined). Thus, in principle, it was analyzed the performance for the followingstatistical calculations:
µ =1
N
N∑i=1
xi, (1)
where µ represents the mean calculated for a set of data x that is limited betweenthe interval [1, N ];
σ =
√√√√ 1
N
N∑i=1
(xi − µ)2, (2)
where σ represents the standard deviation calculated for a set of data x;
y = max(x), (3)
where y represents the maximum value obtained for a set of data x;
z = min(x), (4)
where z represents the minimum value obtained for a set of data x;
P = µ±σ(yα/2)√
N, (5)
where P is the con�dence interval for a set of data with N samples and yα/2can be found from tables that is used to de�ne the con�dence level. So, in thispaper, it was used a con�dence level of 90%.
In this sense, decision intervals were generated for individual and combinedloads. However, it is important to mention that, to generate the decision rulesconsidering the mean, its respective standard deviation were used to de�ne theupper and lower limits and, for the rules generated from the con�dence intervals,their upper and lower limits were de�ned by the sum of the con�dence intervaland the standard deviation.
After an extensive analysis of the behavior of these three statistical analysis,it was observed that a hybrid approach would be more suitable to identify theloads where such method should combine the best characteristics of them. Thus,it appears that the combination of decision rules generated by maximum andminimum values and con�dence intervals could ensure better identi�cation formost loads and their combinations.
It is noteworthy that, during the implementation of the decision rules, it wasnoted that the most important feature to identify the loads were the apparent
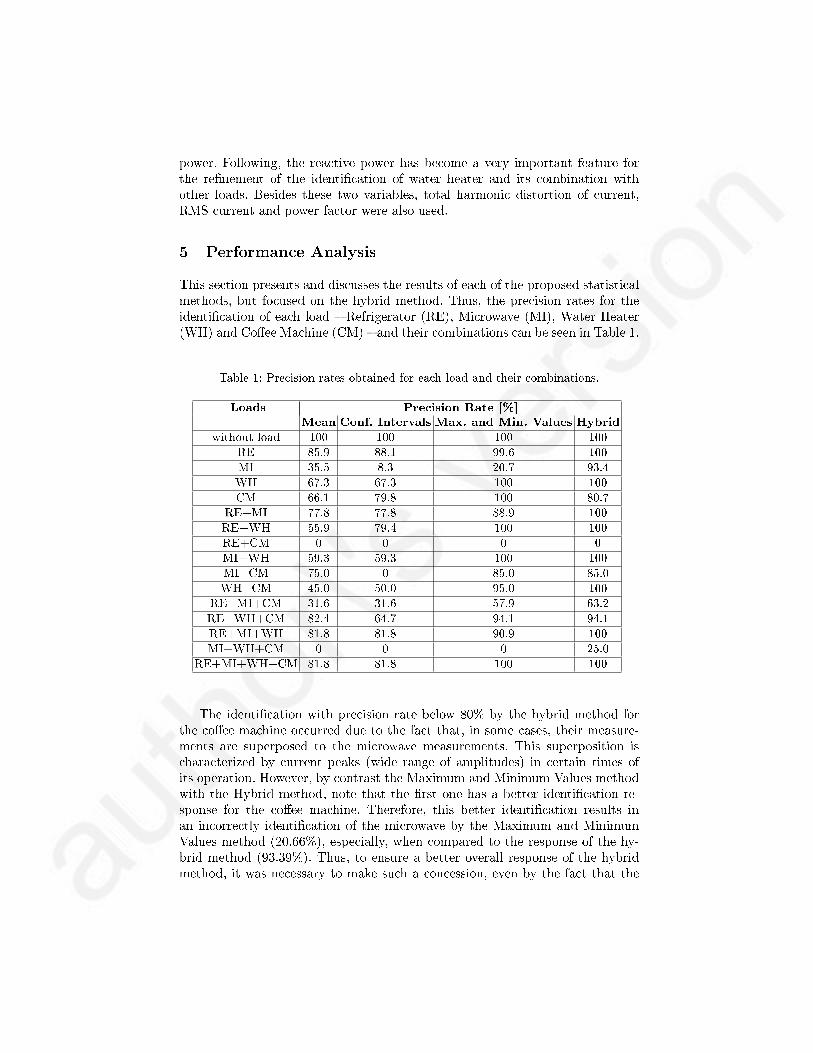
power. Following, the reactive power has become a very important feature forthe re�nement of the identi�cation of water heater and its combination withother loads. Besides these two variables, total harmonic distortion of current,RMS current and power factor were also used.
5 Performance Analysis
This section presents and discusses the results of each of the proposed statisticalmethods, but focused on the hybrid method. Thus, the precision rates for theidenti�cation of each load � Refrigerator (RE), Microwave (MI), Water Heater(WH) and Co�ee Machine (CM) � and their combinations can be seen in Table 1.
Table 1: Precision rates obtained for each load and their combinations.
Loads Precision Rate [%]Mean Conf. Intervals Max. and Min. Values Hybrid
without load 100 100 100 100
RE 85.9 88.1 99.6 100
MI 35.5 8.3 20.7 93.4
WH 67.3 67.3 100 100
CM 66.1 79.8 100 80.7
RE+MI 77.8 77.8 88.9 100
RE+WH 55.9 79.4 100 100
RE+CM 0 0 0 0
MI+WH 59.3 59.3 100 100
MI+CM 75.0 0 85.0 85.0
WH+CM 45.0 50.0 95.0 100
RE+MI+CM 31.6 31.6 57.9 63.2
RE+WH+CM 82.4 64.7 94.1 94.1
RE+MI+WH 81.8 81.8 90.9 100
MI+WH+CM 0 0 0 25.0
RE+MI+WH+CM 81.8 81.8 100 100
The identi�cation with precision rate below 80% by the hybrid method forthe co�ee machine occurred due to the fact that, in some cases, their measure-ments are superposed to the microwave measurements. This superposition ischaracterized by current peaks (wide range of amplitudes) in certain times ofits operation. However, by contrast the Maximum and Minimum Values methodwith the Hybrid method, note that the �rst one has a better identi�cation re-sponse for the co�ee machine. Therefore, this better identi�cation results inan incorrectly identi�cation of the microwave by the Maximum and MinimumValues method (20.66%), especially, when compared to the response of the hy-brid method (93.39%). Thus, to ensure a better overall response of the hybridmethod, it was necessary to make such a concession, even by the fact that the

co�ee machine can be regarded as a less relevant load on the Demand Responsecontext.
The most complex identi�cation to be performed is the combination of therefrigerator and the co�ee machine, because the amplitude variations of currentpeaks that the co�ee machine presents superpose the refrigerator measurementsgenerating a misclassi�cation by all methods. Therefore, the incorrectly iden-ti�cation can be a potential problem because the refrigerator is more relevantthan the co�ee machine and, for this reason, new features must be obtained andevaluated to improve the identi�cation.
Almost methods present an unknown response for the identi�cation of refrig-erator, microwave and co�ee machine when combined. This way, it is possibleto create new and specialized rules considering other variables to be analyzed.Finally, the precision rate about of 25% for the combination between microwave,water heater and co�ee machine, all methods present an erroneous response dueto consider a combination where the four analyzed loads are turned on.
6 Conclusions
This paper presented a methodology su�ciently e�ective, since it is based solelyon statistical calculations to set decision rules. Such rules could be embedded inhardware, because the proposed approach does not depend on high processingpower and also does not require large memory. Therefore, it is believed that thepresented method is suitable for applications that may use the load identi�cationto the purposes of Demand Response.
References
1. Z. Wang and G Zheng. Residential Appliances Identi�cation and Monitoring by aNonintrusive Method. IEEE Transactions on Smart Grid, 3(1):80�92, 2012.
2. M. Dong, P. C. M. Meira, W. Xu, and C. Y. Chung. Non-Intrusive SignatureExtraction for Major Residential Loads. IEEE Transactions on Smart Grid,4(3):1421�1430, 2013.
3. R. A. S. Fernandes, I. N. Silva, and M. Oleskovicz. Load Pro�le Identi�cationInterface for Consumer Online Monitoring Purposes in Smart Grids. IEEE Trans-
actions on Industrial Informatics, 9(3):1507�1517, 2013.4. K. Basu, V. Debusschere, S. Bacha, U. Maulik, and S. Bondyopadhyay. Non In-
trusive Load Monitoring: A Temporal Multi-Label Classi�cation Approach. IEEETransactions on Industrial Informatics, 11(1):262�270, 2015.
5. A. Anvari-Moghaddam, H. Monsef, and A. Rahimi-Kian. Optimal Smart HomeEnergy Management Considering Energy Saving and Comfortable Lifestyle. IEEETransactions on Smart Grid, 6(1):324�332, 2015.
6. C. Vivekananthan, Y. Mishra, G. Ledwich, and F. Li. Demand Response for Res-idential Appliances via Customer Reward Scheme. IEEE Transactions on Smart
Grid, 5(2):809�820, 2014.7. M. Dong, P. C. M. Meira, W. Xu, and W. Freitas. An Event Window Based
Load Monitoring Technique for Smart Meters. IEEE Transactions on Smart Grid,3(2):787�796, 2012.

Luis Gomes
Shared intelligence platform for collaborative simulations using sequences of algorithms: An
electricity market participation case study
Authors: Eugénia Vinagre, Tiago Pinto, Isabel Praça, Luis Gomes, João Soares, and Zita Vale
Published in: Proceedings of the 2017 IEEE Manchester PowerTech, Manchester, 2017
DOI: 10.1109/PTC.2017.7981228
Published at: June 2017
PhD timeline: M11
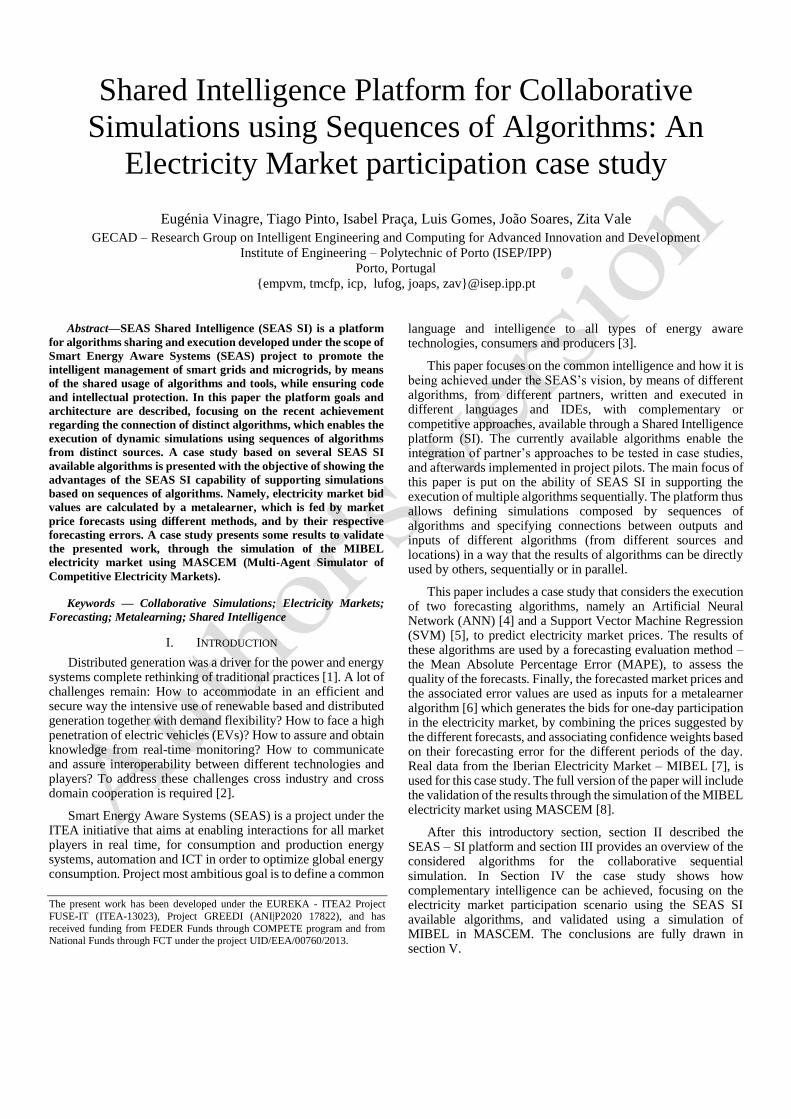
Shared Intelligence Platform for Collaborative
Simulations using Sequences of Algorithms: An
Electricity Market participation case study
Eugénia Vinagre, Tiago Pinto, Isabel Praça, Luis Gomes, João Soares, Zita Vale
GECAD – Research Group on Intelligent Engineering and Computing for Advanced Innovation and Development
Institute of Engineering – Polytechnic of Porto (ISEP/IPP)
Porto, Portugal
{empvm, tmcfp, icp, lufog, joaps, zav}@isep.ipp.pt
Abstract—SEAS Shared Intelligence (SEAS SI) is a platform
for algorithms sharing and execution developed under the scope of
Smart Energy Aware Systems (SEAS) project to promote the
intelligent management of smart grids and microgrids, by means
of the shared usage of algorithms and tools, while ensuring code
and intellectual protection. In this paper the platform goals and
architecture are described, focusing on the recent achievement
regarding the connection of distinct algorithms, which enables the
execution of dynamic simulations using sequences of algorithms
from distinct sources. A case study based on several SEAS SI
available algorithms is presented with the objective of showing the
advantages of the SEAS SI capability of supporting simulations
based on sequences of algorithms. Namely, electricity market bid
values are calculated by a metalearner, which is fed by market
price forecasts using different methods, and by their respective
forecasting errors. A case study presents some results to validate
the presented work, through the simulation of the MIBEL
electricity market using MASCEM (Multi-Agent Simulator of
Competitive Electricity Markets).
Keywords — Collaborative Simulations; Electricity Markets;
Forecasting; Metalearning; Shared Intelligence
I. INTRODUCTION
Distributed generation was a driver for the power and energy systems complete rethinking of traditional practices [1]. A lot of challenges remain: How to accommodate in an efficient and secure way the intensive use of renewable based and distributed generation together with demand flexibility? How to face a high penetration of electric vehicles (EVs)? How to assure and obtain knowledge from real-time monitoring? How to communicate and assure interoperability between different technologies and players? To address these challenges cross industry and cross domain cooperation is required [2].
Smart Energy Aware Systems (SEAS) is a project under the ITEA initiative that aims at enabling interactions for all market players in real time, for consumption and production energy systems, automation and ICT in order to optimize global energy consumption. Project most ambitious goal is to define a common
language and intelligence to all types of energy aware technologies, consumers and producers [3].
This paper focuses on the common intelligence and how it is being achieved under the SEAS’s vision, by means of different algorithms, from different partners, written and executed in different languages and IDEs, with complementary or competitive approaches, available through a Shared Intelligence platform (SI). The currently available algorithms enable the integration of partner’s approaches to be tested in case studies, and afterwards implemented in project pilots. The main focus of this paper is put on the ability of SEAS SI in supporting the execution of multiple algorithms sequentially. The platform thus allows defining simulations composed by sequences of algorithms and specifying connections between outputs and inputs of different algorithms (from different sources and locations) in a way that the results of algorithms can be directly used by others, sequentially or in parallel.
This paper includes a case study that considers the execution of two forecasting algorithms, namely an Artificial Neural Network (ANN) [4] and a Support Vector Machine Regression (SVM) [5], to predict electricity market prices. The results of these algorithms are used by a forecasting evaluation method – the Mean Absolute Percentage Error (MAPE), to assess the quality of the forecasts. Finally, the forecasted market prices and the associated error values are used as inputs for a metalearner algorithm [6] which generates the bids for one-day participation in the electricity market, by combining the prices suggested by the different forecasts, and associating confidence weights based on their forecasting error for the different periods of the day. Real data from the Iberian Electricity Market – MIBEL [7], is used for this case study. The full version of the paper will include the validation of the results through the simulation of the MIBEL electricity market using MASCEM [8].
After this introductory section, section II described the SEAS – SI platform and section III provides an overview of the considered algorithms for the collaborative sequential simulation. In Section IV the case study shows how complementary intelligence can be achieved, focusing on the electricity market participation scenario using the SEAS SI available algorithms, and validated using a simulation of MIBEL in MASCEM. The conclusions are fully drawn in section V.
The present work has been developed under the EUREKA - ITEA2 Project
FUSE-IT (ITEA-13023), Project GREEDI (ANI|P2020 17822), and has
received funding from FEDER Funds through COMPETE program and from National Funds through FCT under the project UID/EEA/00760/2013.
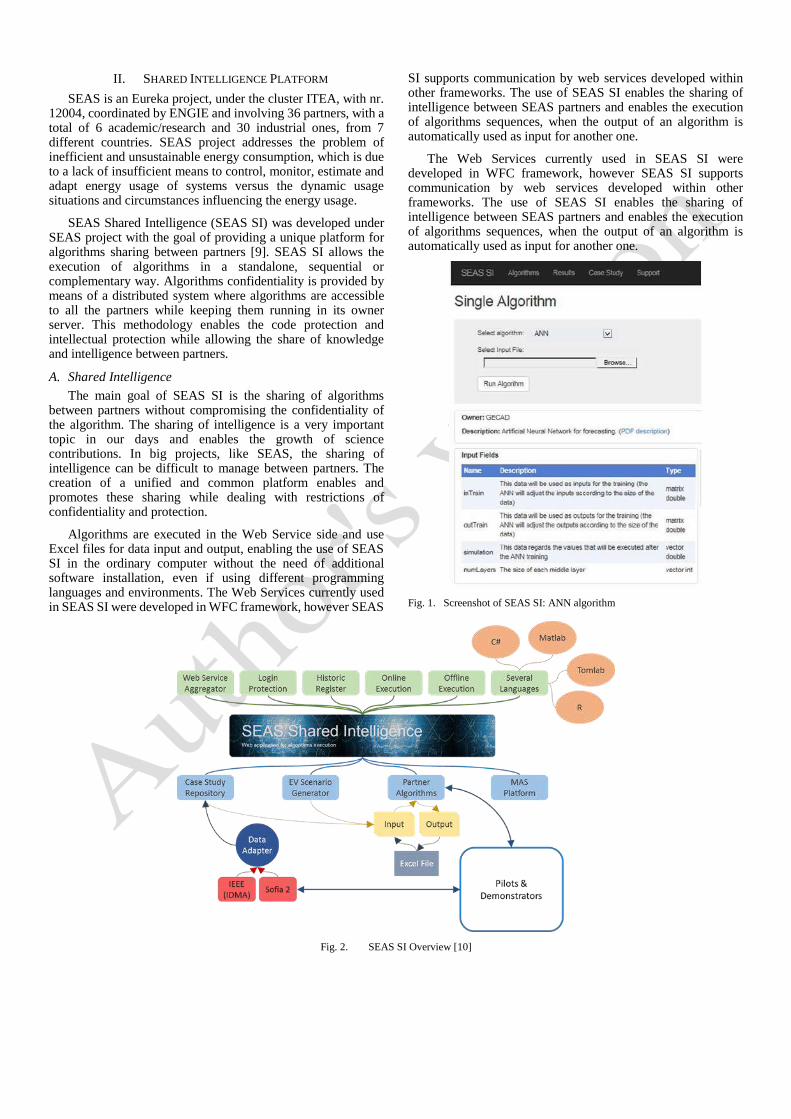
II. SHARED INTELLIGENCE PLATFORM
SEAS is an Eureka project, under the cluster ITEA, with nr. 12004, coordinated by ENGIE and involving 36 partners, with a total of 6 academic/research and 30 industrial ones, from 7 different countries. SEAS project addresses the problem of inefficient and unsustainable energy consumption, which is due to a lack of insufficient means to control, monitor, estimate and adapt energy usage of systems versus the dynamic usage situations and circumstances influencing the energy usage.
SEAS Shared Intelligence (SEAS SI) was developed under SEAS project with the goal of providing a unique platform for algorithms sharing between partners [9]. SEAS SI allows the execution of algorithms in a standalone, sequential or complementary way. Algorithms confidentiality is provided by means of a distributed system where algorithms are accessible to all the partners while keeping them running in its owner server. This methodology enables the code protection and intellectual protection while allowing the share of knowledge and intelligence between partners.
A. Shared Intelligence
The main goal of SEAS SI is the sharing of algorithms between partners without compromising the confidentiality of the algorithm. The sharing of intelligence is a very important topic in our days and enables the growth of science contributions. In big projects, like SEAS, the sharing of intelligence can be difficult to manage between partners. The creation of a unified and common platform enables and promotes these sharing while dealing with restrictions of confidentiality and protection.
Algorithms are executed in the Web Service side and use Excel files for data input and output, enabling the use of SEAS SI in the ordinary computer without the need of additional software installation, even if using different programming languages and environments. The Web Services currently used in SEAS SI were developed in WFC framework, however SEAS
SI supports communication by web services developed within other frameworks. The use of SEAS SI enables the sharing of intelligence between SEAS partners and enables the execution of algorithms sequences, when the output of an algorithm is automatically used as input for another one.
The Web Services currently used in SEAS SI were developed in WFC framework, however SEAS SI supports communication by web services developed within other frameworks. The use of SEAS SI enables the sharing of intelligence between SEAS partners and enables the execution of algorithms sequences, when the output of an algorithm is automatically used as input for another one.
Fig. 1. Screenshot of SEAS SI: ANN algorithm
Fig. 2. SEAS SI Overview [10]

For each algorithm available in SEAS SI, input and output variables, regarding the name, description and variable type are described, a downloadable file with detailed algorithms description and parameters is also available.
At this moment, algorithms are executed in four different programming languages: C#, MATLAB, TOMLAB and R. Additional programming languages can be used while sharing new algorithms. The number of different programming languages used by the developers does not compromise the platform availability or efficiency.
B. Architecture
The architecture and functionalities of SEAS SI can be seen in Figure 2. On the top of the figure platform characteristics are presented. SEAS SI is based on a Web Service Aggregator that combines all the Web Services distributed by the partners and present them as a unique and unified platform. SEAS SI is available as a website with an authentication service, to restrict algorithms availability only for SEAS partners [9].
Algorithms execution is available through online and offline modes. These modes are automatically chosen according to the execution time of each algorithm. For example, if an algorithm execution time is about 15 minutes it’s not convenient to freeze the user browser during for such a time. So, the algorithm will run in its server and, when finished data will be available on SEAS SI. Results provide a list with all, both online and offline, executed algorithms result. The online mode executes the algorithm in real-time and gives the result to the user afterwards. In the offline mode algorithms run in background, without hanging the user computer, and results will be available when processing finishes.
SEAS SI integrates not only the current algorithms but also a case study repository, a new EVs scenario generator and a multi-agent system platform. In the near future, the algorithms will have the ability to run using input data coming from the case
study repository and the EV scenario generator, using a seamless approach. The case study repository will receive data from an adapter that allows the conversion of data from the IEEE Intelligent Data Mining and Analysis (IDMA) [11] and Sofia 2 into the SEAS SI standard.
Built for the SEAS project, SEAS SI will also be used in SEAS pilots and demonstrators running in several European countries, such as: France, Finland, Portugal and Turkey. The pilots and demonstrators will use SEAS SI web services to execute algorithms. The data produced in the Pilots and demonstrators will be sent to Sofia 2 platform. These data can also be available in SEAS SI using data adapter to retrieve it from Sofia 2 and storage in the case study repository, where it becomes available for SEAS SI users input to execute SEAS SI algorithms or to be download.
C. Sequential execution of algorithms
The execution of sequences of algorithms can be defined and configured in SEAS SI. The definition of sequences has been designed in order to be flexible and allow the combination of different algorithms, at distinct stages (Figure 3).
Fig. 3. SEAS SI sequence of algorithms concept
Fig. 4. Selection of steps and algorithms

The configuration of a sequence of algorithms is composed by the following stages:
a) Definition of how many steps are necessary to execute the sequence of algorithms and which algorithms are part of each step, as shown in Figure 4.
b) Definition of the connectors between algorithms. A connector between two algorithms is composed by the outputs achieved by the execution of algorithms in the previous step, which type of object matches the type of object expected as input for the algorithms of the following step. The compatibility between objects is assessed by the interface.
c) Definition of the necessary inputs to execute the sequence. In this stage it is required that users upload all the inputs that do not derive directly from the output of other algorithms in the sequence. It is also necessary to specify the name and description of the algorithms’ sequence. Finally, the user will be able to save the sequence configuration for future use (self or by other partners). After submitting the configurations, if everything is correctly defined, the user will be able to consult the achieved results in the repository page. When the sequence execution is finished, the user is notified by email.
It is also possible to execute pre-configures sequences. The user is able to access the page where all configurations that have been defined and made available by partners are. In order to execute a pre-configured sequence, it is only necessary to download the template of the inputs required for running the sequence; fill it with the desired input data, and submit the execution of the sequence. Later, the user will be able to analyse the achieved results, by consulting the file made available in the repository.
III. ALGORITHMS
At this moment, 10 algorithms from 4 different partners are available in the platform. Some of them are briefly described as follows.
• Net_Profit_F_R_SB – calculates the annual profitability of frequency regulation service from the main grid for one EV battery used for frequency regulation;
• FreqRegSingleBat – calculates the profitability of one up/down request from the main grid for one EV battery used for frequency regulation;
• FreqRegScenarioSimul– simulates the dynamic behavior of an EV battery for frequency regulation. It predicts the vehicle availability, battery State of Charge (SOC) and calculates the net profit evolution per request
• IMT-TSP’s - approximation algorithms for EV charging scheduling in SEAS microgrids: optimizing peak and revenue;
From the available algorithms, those used in the work presented in this paper are described as follows:
• ANN – Artificial Neural Networks (ANN) are inspired on the human brain and their amount of neurons with high interconnectivity. ANNs are constituted by several nodes or
neurons, organized in different levels, and interconnected by numeric weights. They resemble to the human brain in two fundamental points: the knowledge being acquired from the surrounding environment, through a learning process; and the network’s nodes being interconnected by weights (synaptic weights), used to store the knowledge. Each neuron executes a simple operation, the weighted sum of its input connections, which originates the exit signal that is sent to the other neurons. The network learns by adjusting the connection weights, in order to produce the desired output - the output layer values [12]. Based on a large number of correct examples ANN are able to change their connection weights until they generate outputs that are coincident with the correct values. This way, ANN are able to extract basic rules from data [13].
• SVM – In 1936, R. A. Fisher [14] created the first algorithm for pattern recognition. The SVM algorithm is implemented by a generalization of the nonlinear algorithm Generalized Portrait that has been created by Vapnik and Lerner in the sequence of [15]. This was the first running kernel of SVM, only for classification and linear problems. The SVM concept can be tracked to when statistical learning theory was developed further with Vapnik, in 1979. However, the SVM approach in the current form was first introduced with a paper at the COLT conference, in 1992 [16]. The information to use in an SVM must follow the format suggested in (1):
( ) ( )1 1, ,..., , , , ni iy x y x x R y R (1)
where each example xi is a space vector example; yi has a corresponding value; n is the size of training data. For classification: yi assumes finite values; in binary classifications: yi ∈ {+1,-1}; in digit recognition : yi ∈ {1,2,3,4,5,6,7,8,9,0}; and for regression purposes, yi is a real number (yi ∈ R). The most applicable kernels for time series forecasting, as in the problem considered in this work, are the Radial Basis Function (RBF) and the exponential Radial Basis Function (eRBF). These two kernels are specifically directed to regression in time series data.
• Metalearner – provides a methodology that considers several different strategies’ outputs as basis to build the metalearner’s final output, depending on the confidence weight that the system has on each strategy [17]. This means that the better a strategy is performing, the higher its influence on this method’s results will be (see Fig.5). This is done through the application of a weighted average of the outputs of all strategies, using their confidence values in each context as weights. The confidence values on each strategy can be the result of a learning process. The generation of this output p is performed through a weighted average, using the reinforcement learning algorithm’s confidence values as weights p1, p2, p3, ..., pn for each strategy’s output’s x1, x2, x3, ..., xn contribution to the final metalearner’s solution. The procedure is expressed in (2).
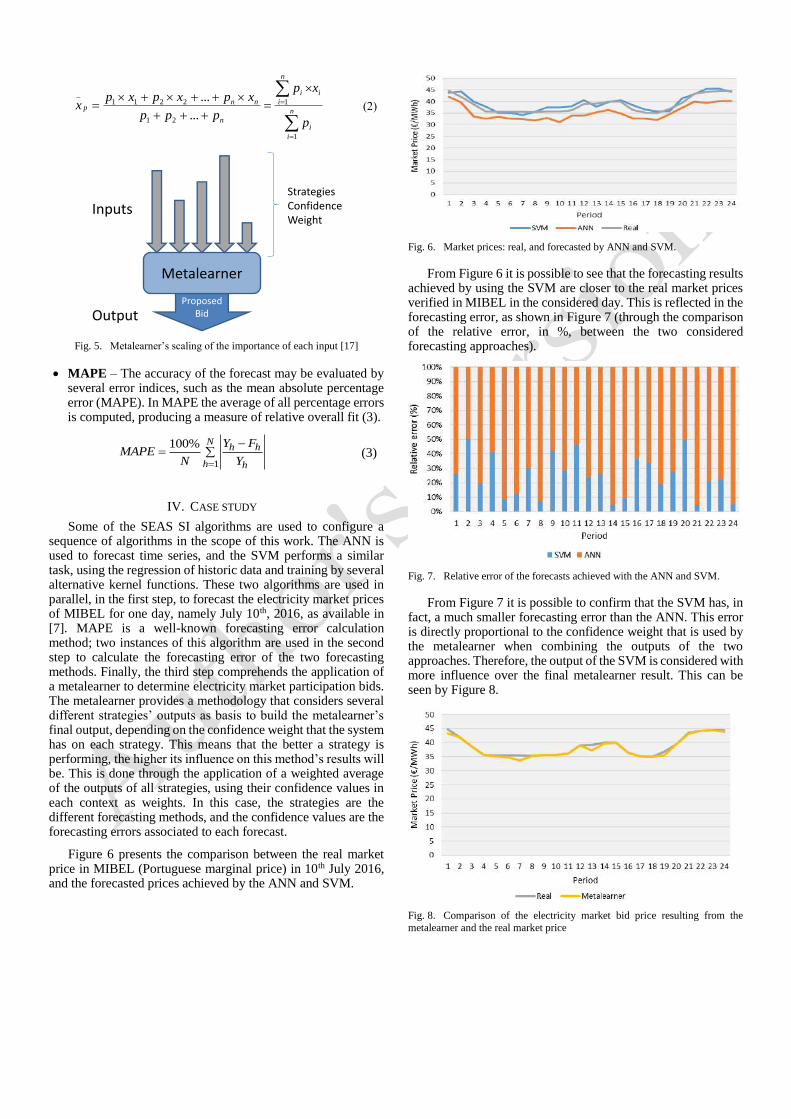
=
=
=+++
+++=
n
i
i
i
n
i
i
n
nnp
p
xp
ppp
xpxpxpx
1
1
21
2211_
...
... (2)
Fig. 5. Metalearner’s scaling of the importance of each input [17]
• MAPE – The accuracy of the forecast may be evaluated by several error indices, such as the mean absolute percentage error (MAPE). In MAPE the average of all percentage errors is computed, producing a measure of relative overall fit (3).
1
100% Nh h
h h
Y FMAPE
N Y=
−= (3)
IV. CASE STUDY
Some of the SEAS SI algorithms are used to configure a sequence of algorithms in the scope of this work. The ANN is used to forecast time series, and the SVM performs a similar task, using the regression of historic data and training by several alternative kernel functions. These two algorithms are used in parallel, in the first step, to forecast the electricity market prices of MIBEL for one day, namely July 10th, 2016, as available in [7]. MAPE is a well-known forecasting error calculation method; two instances of this algorithm are used in the second step to calculate the forecasting error of the two forecasting methods. Finally, the third step comprehends the application of a metalearner to determine electricity market participation bids. The metalearner provides a methodology that considers several different strategies’ outputs as basis to build the metalearner’s final output, depending on the confidence weight that the system has on each strategy. This means that the better a strategy is performing, the higher its influence on this method’s results will be. This is done through the application of a weighted average of the outputs of all strategies, using their confidence values in each context as weights. In this case, the strategies are the different forecasting methods, and the confidence values are the forecasting errors associated to each forecast.
Figure 6 presents the comparison between the real market price in MIBEL (Portuguese marginal price) in 10th July 2016, and the forecasted prices achieved by the ANN and SVM.
Fig. 6. Market prices: real, and forecasted by ANN and SVM.
From Figure 6 it is possible to see that the forecasting results achieved by using the SVM are closer to the real market prices verified in MIBEL in the considered day. This is reflected in the forecasting error, as shown in Figure 7 (through the comparison of the relative error, in %, between the two considered forecasting approaches).
Fig. 7. Relative error of the forecasts achieved with the ANN and SVM.
From Figure 7 it is possible to confirm that the SVM has, in fact, a much smaller forecasting error than the ANN. This error is directly proportional to the confidence weight that is used by the metalearner when combining the outputs of the two approaches. Therefore, the output of the SVM is considered with more influence over the final metalearner result. This can be seen by Figure 8.
Fig. 8. Comparison of the electricity market bid price resulting from the
metalearner and the real market price
ProposedBid
Metalearner
Inputs
Output
StrategiesConfidenceWeight

From Figure 8 it is possible to see that the bid price achieved by the metalearner reaches very similar values to those of the real market price. This reflects the metalearner’s ability in using the outputs of the forecasting methods appropriately in order to create its own, enhanced output. The SVM results have contributed with a larger weight to the final metalearner output, due to its better forecasting results. On the other hand, the smaller influence of the ANN results have been enough to complement the information gathered from the SVM, and thus help to reach values that are much closer to the real prices.
A simulation using MASCEM is used to assess the results of this algorithms sequence as decision support for electricity market participation. MASCEM is a multi-agent simulator of competitive electricity markets, which uses real data to create realistic simulation scenarios that represent the reality of different markets. Among the several market operators from which MASCEM has access to real data in order to create representative scenarios, is the Iberian electricity market operator – MIBEL, which is the scenario used for this experiment. A total of 60 days is simulated in MASCEM, considering the day-ahead spot market, and starting on July 1st, 2016. The participation of a subject player is evaluated under three market participation strategies: (i) using the market price forecast provided by the ANN, (ii) using the SVM for market price forecast; and (iii) using the metalearner’s results, as result of the presented sequence of algorithms using SEAS SI. Figure 9 shows the total incomes that have been achieved by the subject player in the end of the 60 considered simulated days, when using the three market participation approaches, for a constant hourly sale of 10 MW.
Fig. 9. Incomes achieved by the subject player in the total of the 60 simulated
days, using the three market participation approaches.
From Fig. 9 it is possible to see that by using the results from the sequence of algorithms provided by the SEAS SI platform, and benefiting from the more accurate market price forecasting results, the subject player is able to achieve higher incomes than when negotiating in the market using as basis the market price forecasts provided by both the ANN and SVM.
V. CONCLUSIONS
SEAS project has been promoting the intelligent
management of smart grids by means of collaborative usage of
algorithms and tools, while ensuring confidentiality and
interoperability. In this scope, SEAS SI has been developed and
presented in this paper, namely its features and architecture. A
case study involving several algorithms, written and executed
in different programming languages, illustrate SEAS SI
advantages to foster new and overwhelming scenarios that
cannot be studied using the algorithms independently.
The case study, using different algorithms to reach an
enhanced bid price for electricity market negotiations, shows
the advantage of the SEAS SI platform, which provides the
means for the sequential execution of different algorithms. The
electricity market simulation allows taking further conclusions
on the advantages of using such platform, in a scenario of
electricity market participation. From these results it can be
seen that using sequences of algorithms by means of SEAS SI,
better market price forecasting results can be achieved, which
leads to better market negotiation results.
REFERENCES
[1] Biggar, D.R. and Hesamzadeh, M.R. (Eds.), "The Economics of Electricity Markets", Wiley, 1st edition, September 22, 2014
[2] Lund, H., “Renewable Energy Systems, Renewable Energy Systems – A
Smart Energy Systems Approach to the Choice and Modeling of 100% Renewable Solutions”, Academic Press, 2nd Edition, May 2014
[3] Smart Energy Aware Systems, website. Available at: https://www.the-
smart-energy.com/. [Accessed: 04-Oct-2016] [4] Pinto, T., Sousa, T.M. and Vale, Z., “Dynamic artificial neural network
for electricity market prices forecast” IEEE 16th International Conference
on Intelligent Engineering Systems (INES), 13-15 June, 2012 [5] Pinto, T., Sousa, T.M., Praça, I., Vale, Z., Morais, H., “Support Vector
Machines for Decision Support in Electricity Markets' Strategic Bidding”,
Neurocomputing, Elsevier, in press, August, 2015 [6] Pinto, T., Barreto, J., Praça, I., Sousa, T.M., Vale, Z., Solteiro Pires, E.J.,
“Six Thinking Hats: A novel Metalearner for Intelligent Decision Support
in Electricity Markets”, Decision Support Systems, Elsevier, 79, 1-11 November, 2015
[7] MIBEL - Iberian Electricity Market Operator, website. Available:
http://www.mibel.com [Accessed: 26-Oct-2016] [8] Santos, G., Pinto, T., Praça, I. and Vale, Z. "MASCEM: Optimizing the
performance of a multi-agent system", Energy, vol. 111, pp. 513-524,
September 2016
[9] GECAD, “SEAS Shared Intelligence platform,” 2016. [Online].
Available: http://www.sip.gecad.isep.ipp.pt/. [Accessed: 04-Oct-2016].
[10] Praça, I. et al,"Shared Intelligence for smart grids management: An EVeSSi scenario for the Profitability of EV Frequency regulation in
France", IEEE CIASG 2016 of the IEEE SSCI 2016, December 6-9, 2016
ATHENS, GREECE [11] IEEE Working Group (WG) on Intelligent Data Mining and Analysis
(http://sites.ieee.org/psace-idma/). Public data sets are permanently available in http://sites.ieee.org/psace-idma/data-sets. [Accessed: 04-Oct-
2016]
[12] Pinto, T., Sousa, T. M., Vale, Z.,, “Dynamic Artificial Neural Network for Electricity Market Prices Forecast”, IEEE 16th International
Conference on Intelligent Engineering Systems (INES 2012), Costa de
Caparica, Portugal, 13-15 June, 2012 [13] Wilamowski, B. M. and Yu, H., “Neural network learning without
backpropagation.,” IEEE Trans. Neural Netw., vol. 21, no. 11, pp. 1793–
803, Nov. 2010. [14] Fisher, R., “The use of multiple measurements in taxonomic problems.
Annals of Eugenics”, 7, 111–132, 1936.
[15] Vapnik, V., A. Lerner, A., “Pattern recognition using generalized portrait
method. Automation and Remote Control”, 24, 774–780, 1963.
[16] Boser, B.E., Guyon, I.M., Vapnik, V.N., "A Training algorithm for
optimal margin classifiers", COLT conference, 1992. [17] Pinto, T. et al. “Metalearning to support competitive electricity market
players’ strategic bidding, Electric Power Systems Research, Volume
135, June 2016, Pages 27-34

Luis Gomes
µGIM – Microgrids Intelligent Management System Based on a Multi-agent Approach and the Active
Participation on Demand Response
Authors: Luis Gomes, and Zita Vale
Published in: De la Prieta F. et al. (eds) Trends in Cyber-Physical Multi-Agent Systems. The PAAMS Collection - 15th International Conference, PAAMS 2017. PAAMS 2017. Advances in Intelligent Systems and Computing
DOI: 10.1007/978-3-319-61578-3_37
Published at: July 2017
PhD timeline: M12

µGIM – Microgrids Intelligent Management System
Based on a Multi-agent Approach and the Active
Participation on Demand Response
Luis Gomes1, and Zita Vale1
1GECAD – Research Group on Intelligent Engineering and Computing for Advanced Innova-
tion and Development, Institute of Engineering – Polytechnic of Porto (ISEP/IPP),
Rua Dr. António Bernardino de Almeida, 431, 4200-072 Porto, Portugal
{lufog,zav}@isep.ipp.pt
Abstract. The present paper presents an overview of Luis Gomes PhD pro-
posal, focusing on the problem that will be solved and how it will be solved. In
the PhD, µGIM system will be developed for microgrid management and mi-
crogrid players’ energy management. The proposal also consists in study and
analysis of microgrids demand response programs.
Keywords: Demand response · Microgrid management · Multi-agent system ·
Player representation · Single-board computers
1 Problem statement
The non-existence of an open source microgrid management system operating in a
multi-agent approach that can represent each player inside the microgrid.
One of the biggest problems that microgrids are facing, is the lack of facilities able to
participate in them. Old facilities need retrofitting solutions to be integrated in a mi-
crogrid. An intelligent, easy to build and open solution is needed to virtually represent
facilities in microgrids. This virtual representative agent must talk, negotiate and act in
the microgrid while manage the facility’s energy consumption and generation.
2 Related work
Some researches only focus on the multi-agent systems for microgrid management,
such as [1,2]. However, they do not explore the hardware or even the feasibility to be
implement in real scenarios. For real implementations new problems arises, such as,
the computational processing limitation in the facility-side. Other related works are the
This work is supported by FEDER Funds through COMPETE program and by National
Funds through FCT under the project UID/EEA/00760/2013 and SFRH/BD/109248/2015.

study of Demand Response (DR) programs for microgrids [3,4]. However, mostly of
these works focus on the microgrid profit and do not make a proper analysis of the
end-consumers and how they should participate in DR.
3 Hypothesis and Proposal
The main hypothesis of µGIM proposal are the following: “Multi-agent systems for
energy players’ representation is a good approach”; “Households’ energy management
can be efficiently done with single-board computers (SBC)”; and “DR households’
intelligent and autonomous participation benefits the microgrid management”.
The proposal of µGIM defends the development of a multi-agent system on top of
SBC to manage a microgrid and their players. The system will have distributed com-
putational processing, the ability of participate in DR programs using an intelligent
and autonomous approach and the ability to negotiate with the microgrid agent and
with the other SBC agents (negotiate energy and computational processing). µGIM
will also test and validate several DR programs inside microgrids.
4 Preliminary Results and Reflections
µGIM proposal concluded the possibility to manage the energy in households using
four types of SBC: Intel Galileo Gen 2; Raspberry Pi Model B; Cubietruck; and Rasp-
berry pi 3 Model B. A multi-agent system is running on these SBC (one agent in each
SBC) that monitors energy using Modbus/RTU, Modbus/TCP and/or restful requests,
and stores these data in a local database. The communication between SBC are also
working (indispensable for negotiations).
µGIM will combine market validated solutions in order to create a system where
scientific contributions can be tested and validated. The use of SBC for a multi-agent
system will enable the real implementation of the system, to be tested and validated.
Also, the use of intelligent and autonomous DR participation in the end-consumer
side, compliant to openADR, will enable massive tests with all kind of scenarios.
5 References
1. Dimeas, A.L., Hatziargyriou, N.D.: Operation of a Multiagent System for Microgrid Con-
trol. In: Power Systems, IEEE Transactions on, vol.20, no.3, pp.1447,1455 (2005)
2. Foo Eddy, Y.S., Gooi, H.B., Chen, S.X.: Multi-Agent System for Distributed Management
of Microgrids. In: Power Systems, IEEE Transactions on, vol.30, no.1, pp.24,34 (2015)
3. Nguyen, D. T., Le, Le: Risk-Constrained Profit Maximization for Microgrid Aggregators
With Demand Response. In: IEEE Transactions on Smart Grid, vol. 6, pp. 135-146 (2015)
4. Faria, P., Vale, Z.: Optimization of generation and aggregated consumption shifting for
demand response programs definition. In: Innovative Smart Grid Technologies Conference
Europe (ISGT-Europe), 2014 IEEE PES, pp.1,6 (2014)
Luis Gomes
EnAPlug – An Environmental Awareness Plug to Test Energy Management Solutions for Households
Authors: Luis Gomes, Filipe Sousa, and Zita Vale
Published in: Oliveira E., Gama J., Vale Z., Lopes Cardoso H. (eds) Progress in Artificial Intelligence. EPIA 2017. Lecture Notes in Computer Science
DOI: 10.1007/978-3-319-65340-2_21
Published at: August 2017
PhD timeline: M13

EnAPlug – An Environmental Awareness Plug to Test
Energy Management Solutions for Households
Luis Gomes1, Filipe Sousa1, and Zita Vale1
1GECAD – Research Group on Intelligent Engineering and Computing for Advanced Innova-
tion and Development, Institute of Engineering – Polytechnic of Porto (ISEP/IPP),
Rua Dr. António Bernardino de Almeida, 431, 4249-015 Porto, Portugal
{lufog, ffeso, zav}@isep.ipp.pt
Abstract. The present paper presents a new kind of Smart Plug that covers the
needs of power systems R&D centers. EnAPlug, described in this paper, ena-
bles the monitor and control of loads, as a normal Smart Plug. However, it has a
great benefit in comparison with a normal Smart Plug, the EnAPlug allows the
integration of a variety of sensors so the user can understand the load and the
surrounding environment (using a set of sensors that better fit the load). The
sensors are installed in the load itself, and must have a clear fit to the load. The
paper presents a demonstration of an EnAPlug used in a refrigerator for a de-
mand response event participation, using the sensor capability to measure im-
portant values, such as, inside temperature.
Keywords: Demand response participation · Multi-agent system · Smart plug
1 Introduction
The power system paradigm has been changing in the last years and will continue to
change in future years, resulting in the appearance of smart grids [1]. The centraliza-
tion of generation will end, appearing decentralized generation [2]. The end-
consumers will be incentivized to actively participate in smart grids, in a win-win
situation, changing completely their roles in today’s paradigm [3]. One of the aspects
of smart grids is the integration of microgrids.
The proliferation of microgrids started using use cases around the world [4,5], and
now this concept can be seen and analyzed in real scenarios. The transaction from
scientific concepts towards real implementations, such as [6], is a positive step ena-
The present work has been developed under the EUREKA - ITEA2 Project M2MGrids
(ITEA-13011), Project SIMOCE (ANI|P2020 17690), and has received funding from FEDER
Funds through COMPETE program and from National Funds through FCT under the project
UID/EEA/00760/2013 and SFRH/BD/109248/2015.

bling the validation of theoretical methodologies in real and uncontrollable environ-
ments.
Other important aspect for smart grid successful implementations is the application
of Demand Response (DR) programs to give an active role to the small and medium
players (usually households or small offices) [7]. The use of DR programs brings clear
advantages to smart grids and microgrids [8]. Some use of DR can be found in [9].
Nevertheless, to increase DR dissemination and to promote the appearance of new
programs, automatic and intelligent responses must be implemented in the consumer
side, specially the small and medium players.
The application of Smart Homes such as in [10] and [11], brings advantages for en-
ergy management inside the households, but must important, can increase the DR
programs participation using intelligent response methodologies. The development
and application of autonomous and intelligent methodologies, for DR users’ response,
must consider the users impact (particularly the negative impact provoked).
2 Background of the Proposal
To implement a Smart Home, monitoring and controlling units are needed, such as,
Smart Plugs. At this moment is possible to find a significant number of Smart Plugs
available on the market. However, must of them had limitations, such as: not having
monitoring; or just monitors the current; or having a closed system without any API.
The use of Smart Plugs in R&D centers can be done using software like Home As-
sistant1. This is an open source software that aggregates various Internet of Things
(IoT) devices into a unique system, while provides a RESTFul interface to monitor
and control devices. However, if the R&D center intention is to study intelligent
methodologies in the energy management of the household (for instance, to participate
in DR programs), more data and new types of intelligent load control are needed. And
for this situation, there is not a suitable Smart Plug in the market.
This paper presents the Environmental Awareness Plug (EnAPlug), a Smart Plug
that can be easily developed in R&D centers fulfilling the center needs and proposes.
EnAPlug combines actuators to control the load, and sensors, to monitor not only the
load status and energy but also the environment that surrounds the load.
3 Environmental Awareness Plug
EnAPlug was idealized and developed for R&D centers that have a need to test energy
management solutions in households. The development of EnAPlug enables R&D
centers to overcome the limitations of the Smart Plugs available on the market, with a
costume made solution with context awareness capabilities. EnAPlug can also be used
outside R&D centers for load monitoring and control, enabling a context awareness
monitoring of a specific energy resource, for instance, our home kitchen oven.
1 https://home-assistant.io/

The premises of EnAPlug was to build a modular plug that can work with several
actuators and sensors while being open for other systems. For this reason, the control
and monitor of EnAPlug is open and can be accessible with GET and POST requests.
Fig. 1 shows EnAPlug overall architecture. The light blue block that identifies the
microcontroller was implemented using an Arduino Mega 2560 R3, nonetheless other
microcontrollers can be used. The microcontroller is the processing unit of EnAPlug
and has the following requirements: a serial communication port; at least 1 digital
output for the load control; the capability to have TCP/IP connection (using a compat-
ible module); and some digital and analog inputs for sensors (it can also provide
communication protocols, such as, I2C).
The yellow blocks are connected to the 230 V/AC. The Energy Analyzer must be
compatible with Modbus/RTU protocol. This requirement will enable the microcon-
troller to communicate with the energy analyzer using a simple MAX485 component
that converts serial communications into RS-485 communications, and vice-versa. The
Controller block can be a relay, providing on/off control, or other kind of control,
such as, a dimmer. For this paper, it will be used a relay with a 5V/DC coil. The or-
ange block represents the load that we want to monitor and control.
The green and red blocks are external blocks of EnAPlug and are connected using
the TCP/IP connection available in EnAPlug. The Control Signal is made using a
socket connection to the microcontroller IP on port 80. The Server block is an external
server that receives JSON messages and save them in a SQL Server database. The
period of storages is defined by EnAPlug.
The sensors blocks are the sensors connected to the Microcontroller that are suita-
ble for the measured load. The idea of the sensors is to give a better knowledge about
the measuring Load. For instance, if the intention is to monitor and control a lamp, it
is recommended to use a movement sensor and a clarity sensor. The sensors placed
must increase the knowledge regarding the load and its context. If we know the load
context is possible to perform an intelligent control.
Fig. 1. EnAPlug overall architecture
EnAPlug is a device that understand their environment, enabling an intelligent and
a more efficient control. However, the environment awareness capability is only pos-
sible with the right sensors. For instance, if the goal is to measure a television, a tem-
perature sensor is not adequate. Therefore, to understand a television more appropriat-
ed sensors should be chosen, such as, presence, clarity and noise sensors.
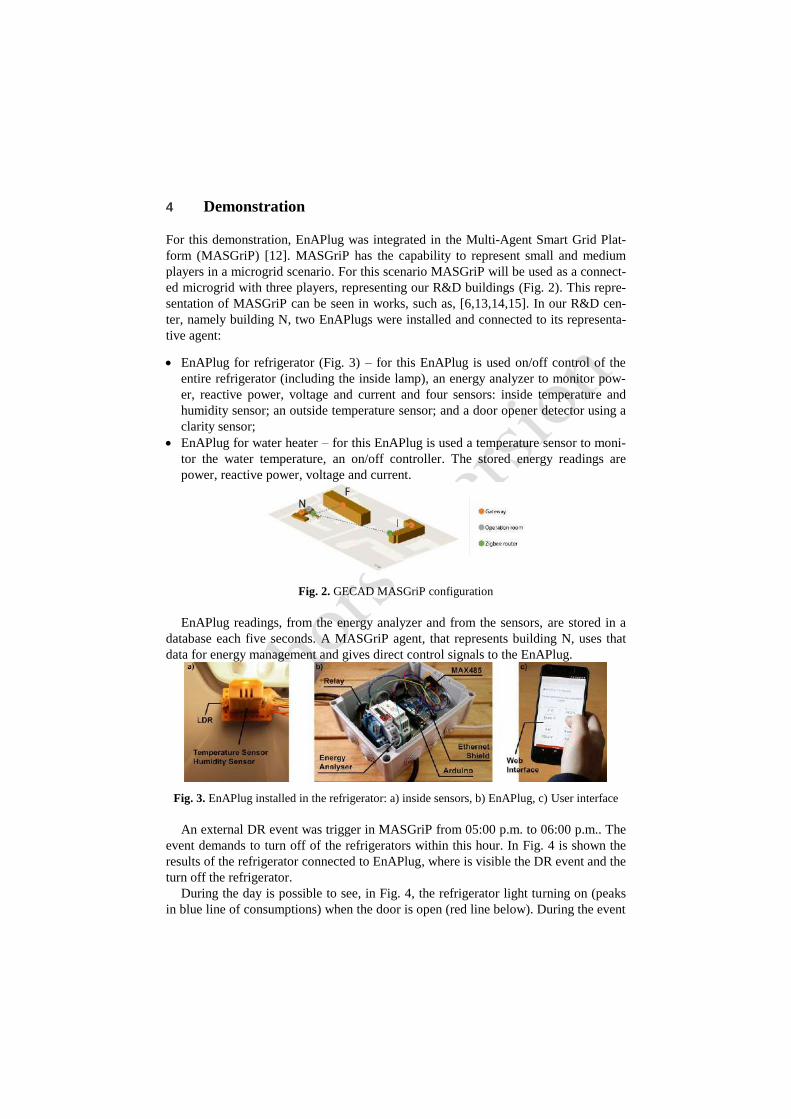
4 Demonstration
For this demonstration, EnAPlug was integrated in the Multi-Agent Smart Grid Plat-
form (MASGriP) [12]. MASGriP has the capability to represent small and medium
players in a microgrid scenario. For this scenario MASGriP will be used as a connect-
ed microgrid with three players, representing our R&D buildings (Fig. 2). This repre-
sentation of MASGriP can be seen in works, such as, [6,13,14,15]. In our R&D cen-
ter, namely building N, two EnAPlugs were installed and connected to its representa-
tive agent:
• EnAPlug for refrigerator (Fig. 3) – for this EnAPlug is used on/off control of the
entire refrigerator (including the inside lamp), an energy analyzer to monitor pow-
er, reactive power, voltage and current and four sensors: inside temperature and
humidity sensor; an outside temperature sensor; and a door opener detector using a
clarity sensor;
• EnAPlug for water heater – for this EnAPlug is used a temperature sensor to moni-
tor the water temperature, an on/off controller. The stored energy readings are
power, reactive power, voltage and current.
Fig. 2. GECAD MASGriP configuration
EnAPlug readings, from the energy analyzer and from the sensors, are stored in a
database each five seconds. A MASGriP agent, that represents building N, uses that
data for energy management and gives direct control signals to the EnAPlug.
Fig. 3. EnAPlug installed in the refrigerator: a) inside sensors, b) EnAPlug, c) User interface
An external DR event was trigger in MASGriP from 05:00 p.m. to 06:00 p.m.. The
event demands to turn off of the refrigerators within this hour. In Fig. 4 is shown the
results of the refrigerator connected to EnAPlug, where is visible the DR event and the
turn off the refrigerator.
During the day is possible to see, in Fig. 4, the refrigerator light turning on (peaks
in blue line of consumptions) when the door is open (red line below). During the event

EnAPlug detects an open door but there is no increase of consumption, meaning that
the light was off. The inside temperature (purple line) was stable and did not increase
beyond the refrigerator limit. The DR event was a success as we can see using the
consumption line and the inside temperature line. The EnAPlug can detect dangerous
situations, such as, the increase of inside temperature and turn the refrigerator back on
in an emergency. In this case, the situation was controlled and no damage was made.
The results show that after DR event, when the refrigerator was turned on again, the
motor started immediately to decrease the inside temperature.
Fig. 4. Refrigerator readings between 00:00 a.m. and 23:59 p.m.
In Fig. 5 is shown the water heater during 24 hours. The temperature sensor is
placed outside the water heater (for security reasons), glued in the water pipe. The
consumption and the temperature increases when the water heater turned on (06:45).
The temperature also increases when a person uses hot water (08:30).
Fig. 5. Water Heater readings between 00:00 a.m. and 23:59 p.m.
5 Conclusions
The use of smart plugs can be included in demand side management systems. Howev-
er, the information provided by the smart plugs, available on the market, are limited
because they don’t understand the load context, making it difficult to execute intelli-
gent energy management algorithms.
The use of EnAPlug brings advantages for R&D centers regarding load study and
analysis. For power systems, EnAPlug has the advantage of environmental and con-
textual awareness that can be used for intelligent algorithms. EnAPlug is dynamic and
easy to use in a R&D center, enabling the sensing, monitoring and control of energy
loads. It is a possibility, demonstrated in the present paper, to use EnAPlugs in a mul-
ti-agent system for power system simulation.
The main contribution of this paper is the demonstration of a truly smart plug with
environment awareness capabilities for energy management.
6 References
1. Dimeas, A. L., Hatziargyriou, N. D.: Operation of a Multiagent System for Microgrid Con-
trol. In: IEEE Transactions on Power Systems, vol. 20, pp. 1447-1455 (2005)
2. Kirschen, D.: Demand-side view of electricity markets. In: IEEE Transactions on Power
Systems, vol. 18, no. 2, pp. 520-527 (2003)
3. Ye Yan, Yi Qian, Sharif, H., Tipper, D.: A Survey on Smart Grid Communication Infra-
structures: Motivations, Requirements and Challenges. In: Communications Surveys &
Tutorials, IEEE, vol.15 no.1, pp.5-20 (2013)
4. Washom, B., Dilliot, J., Weil, D., Kleissl, J. Balac, N. Torre, N., Richter, C.: Ivory Tower
of Power: Microgrid Implementation at the University of California, San Diego. In: IEEE
Power and Energy Magazine, vol. 11, no. 4, pp. 28-32 (2013)
5. Stamp, J.: The SPIDERS project - Smart Power Infrastructure Demonstration for Energy
Reliability and Security at US military facilities. In: IEEE PES Innovative Smart Grid
Technologies (ISGT), Washington, DC, 2012, pp. 1-1 (2012)
6. Gomes, L., Silva, J., Faria, P., Vale, Z.: Microgrid demonstration gateway for players
communication and load monitoring and management. In: Clemson University Power Sys-
tems Conference (PSC), Clemson, SC, 2016, pp. 1-6 (2016)
7. Faria, P., Vale, Z.: Demand response in electrical energy supply: An optimal real time
pricing approach. In: Energy, vol. 36, no. 8, pp. 5374-5384 (2011)
8. Siano, P.: Demand response and smart grids - A survey. Renewable and Sustainable Ener-
gy Reviews, vol. 30, pp. 461-478 (2014)
9. Gomes, L., Faria, P., Fernandes, F., Vale, Z., Ramos, C.: Domestic consumption simula-
tion and management using a continuous consumption management and optimization algo-
rithm. In: IEEE PES T&D Conference and Exposition, Chicago, IL, USA, pp. 1-5 (2014)
10. Tsui, K.M., Chan, S.C.: Demand Response Optimization for Smart Home Scheduling Un-
der Real-Time Pricing. In: IEEE Transactions on Smart Grid, vol. 3, pp. 1812-1821 (2012)
11. Fernandes, F., Carreiro, A., Morais, H., Vale, Z., Gastaldello, D.S., Amaral, H.L.M., Sou-
za, A.N.: Management of Heating, Ventilation and Air Conditioning system for SHIM
plat-form. In: IEEE PES Innovative Smart Grid Technologies Latin America (ISGT
LATAM), Montevideo, pp. 275-280 (2015)
12. Morais, H., Vale, Z., Pinto, T., Gomes, L., Fernandes, F., Oliveira, P., Ramos, C.: Multi-
Agent based Smart Grid management and simulation: Situation awareness and learning in
a test bed with simulated and real installations and players. In: IEEE Power & Energy So-
ciety General Meeting, Vancouver, BC, 2013, pp. 1-5 (2013)
13. Gomes, L., Fernandes, F., Faria, P., Silva, M., Vale, Z., Ramos, C.: Contextual and envi-
ronmental awareness laboratory for energy consumption management. In: 2015 Clemson
University Power Systems Conference (PSC), pp. 1-6 (2015)
14. Gomes, L., Lefrançois, M., Faria, P., Vale, Z.: Publishing real-time microgrid consump-
tion data on the web of Linked Data. In: 2016 Clemson University Power Systems Confer-
ence (PSC), pp. 1-8 (2016)
15. Vinagre, E., Gomes, L., Vale, Z.: Electrical Energy Consumption Forecast Using External
Facility Data. In: 2015 IEEE Symposium Series on Computational Intelligence, pp. 659-
664 (2015)

Luis Gomes
Virtual to Reality Emulator for Electrical Loads
Authors: Luis Gomes, and Zita Vale
Published in: Proceedings of the Intelligent load management in local and wholesale demand response markets – Third DREAM-GO Workshop
DOI: 10.5281/zenodo.2677528
Published at: January 2018
PhD timeline: M18

www.dream-go.ipp.pt
56
Intelligent load management in local and wholesale
demand response markets Third DREAM-GO Workshop
Institute of Engineering - Polytechnic of Porto, Porto, Portugal, January 23-24, 2018
Virtual to Reality Emulator for Electrical Loads
Luis Gomes, Zita Vale
GECAD – Research Group on Intelligent Engineering and Computing for Advanced Innovation and Development, Institute of
Engineering - Polytechnic of Porto, Porto, Portugal
Abstract
The test and validation of demand side management systems are a priority before installing this systems in real
environments. This paper presents a load emulator that acts as an energy analyzer. This emulator enables its
installation in physical environments, fooling the metering systems. This capability allows the placement of the
emulator in a physical metering system while emulating a load that is not there. In a R&D center the emulator
can be used to create buildings by placing several emulators for load emulation and using a real and physical
metering system to read the consumption data while demand side management algorithms and techniques are
used. Using the proposed emulator, the gap between research and real implementations can be fulfill in the
laboratories to test and validate demand side management systems. The paper presents the emulator and its
results.
Keywords: energy analyser, load emulation, metering
1. Introduction
The change of paradigm in power systems enables the active participation of small and medium players
in the smart grid environment [1]. The integration of Demand Side Management (DSM) systems in end-
consumers is also enabled by the new paradigm and it will allow end-consumers to manage their energy
[2]. Therefore, the design, development, test and validation of DSM systems should be done fast in order
to implemented them, in near future, in end-consumers houses and buildings.
There are a vast variety of DSM research works that try to provide valid solutions for DSM systems,
some examples are [3], [4], [5], [6], [7] and [8]. However, the majority of these research works lack of real
implementations to test and validate their solutions in uncontrollable environments.
The main contribution of this paper is the load emulator proposed. The Virtual to Reality (V2R) emulator
enables the emulation of loads, in an hardware device, that can replace an energy analyser. This enables the
placement of V2R in a RS-485 network with other energy analysers, fooling the system.
By using the proposed load emulator, is possible to build a building in laboratory to test DSM systems.
The ability of V2R to work as an energy analyser enables the integration with real monitoring and control
systems. Therefore, the laboratory can build a building using three layers: load emulators, a physical
monitoring and control system, and the DSM solution to be tested and validated. With these three layers
the monitoring and control system and the DSM solution think that they are dealing with real loads,
approaching the solution to a real implementation.
After this first introductory section, the V2R emulator will be presented in Section 2. Section 3 will
present some of emulation results. While Section 4 will present the main conclusions of this work.
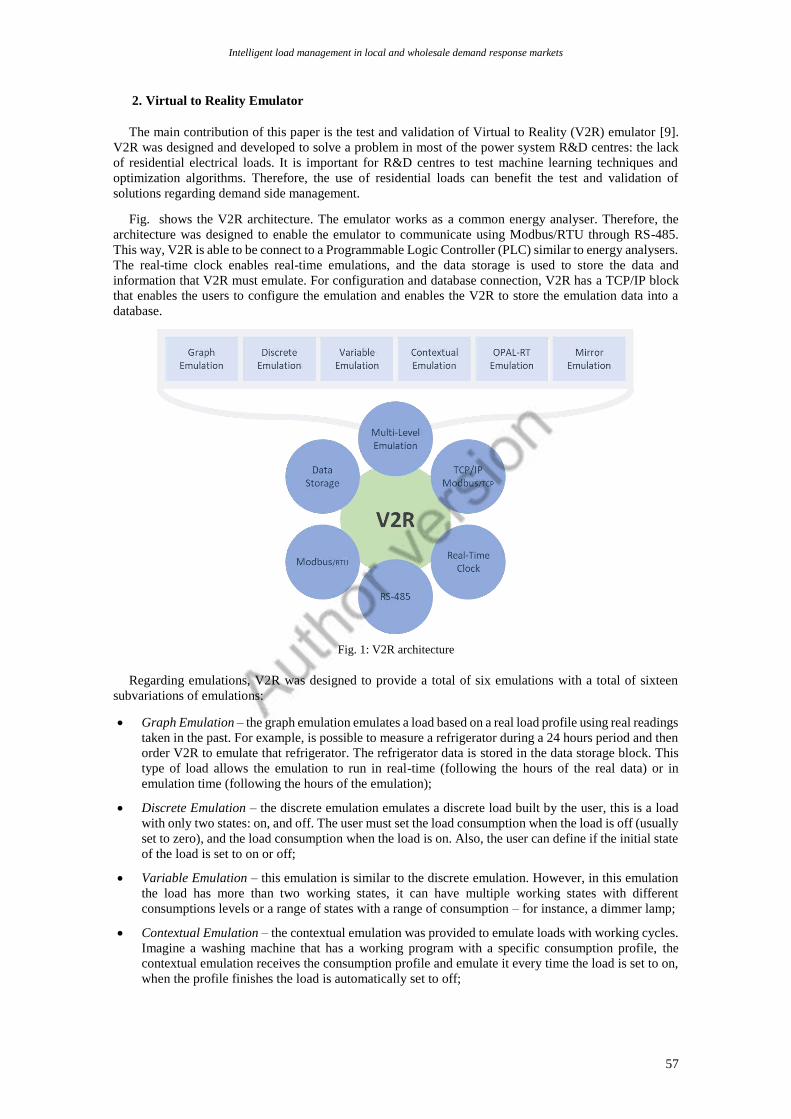
Intelligent load management in local and wholesale demand response markets
57
2. Virtual to Reality Emulator
The main contribution of this paper is the test and validation of Virtual to Reality (V2R) emulator [9].
V2R was designed and developed to solve a problem in most of the power system R&D centres: the lack
of residential electrical loads. It is important for R&D centres to test machine learning techniques and
optimization algorithms. Therefore, the use of residential loads can benefit the test and validation of
solutions regarding demand side management.
Fig. shows the V2R architecture. The emulator works as a common energy analyser. Therefore, the
architecture was designed to enable the emulator to communicate using Modbus/RTU through RS-485.
This way, V2R is able to be connect to a Programmable Logic Controller (PLC) similar to energy analysers.
The real-time clock enables real-time emulations, and the data storage is used to store the data and
information that V2R must emulate. For configuration and database connection, V2R has a TCP/IP block
that enables the users to configure the emulation and enables the V2R to store the emulation data into a
database.
Fig. 1: V2R architecture
Regarding emulations, V2R was designed to provide a total of six emulations with a total of sixteen
subvariations of emulations:
• Graph Emulation – the graph emulation emulates a load based on a real load profile using real readings
taken in the past. For example, is possible to measure a refrigerator during a 24 hours period and then
order V2R to emulate that refrigerator. The refrigerator data is stored in the data storage block. This
type of load allows the emulation to run in real-time (following the hours of the real data) or in
emulation time (following the hours of the emulation);
• Discrete Emulation – the discrete emulation emulates a discrete load built by the user, this is a load
with only two states: on, and off. The user must set the load consumption when the load is off (usually
set to zero), and the load consumption when the load is on. Also, the user can define if the initial state
of the load is set to on or off;
• Variable Emulation – this emulation is similar to the discrete emulation. However, in this emulation
the load has more than two working states, it can have multiple working states with different
consumptions levels or a range of states with a range of consumption – for instance, a dimmer lamp;
• Contextual Emulation – the contextual emulation was provided to emulate loads with working cycles.
Imagine a washing machine that has a working program with a specific consumption profile, the
contextual emulation receives the consumption profile and emulate it every time the load is set to on,
when the profile finishes the load is automatically set to off;

Proceedings of the Third DREAM-GO Workshop
58
• OPAL-RT Emulation – for more detailed emulations, V2R is able to work together with OPAL-RT
[10], using real-time simulations. The benefit of V2R with OPAL-RT is the ability to put the
consumption values generated by OPAL-RT into an energy analyser emulator;
• Mirror Emulation – the mirror emulation enables V2R to mirror the consumptions of another energy
analyser using Modbus/TCP communication between V2R and energy analyser. This enables to put
the consumption of on building or load in a different geographic region without the need of
dislocations.
Beside all the emulations available, V2R has the possibility to apply a random variation into emulations,
excluding only the OPAL-RT and Mirror emulations where this option is disabled. The randomness
emulates the variation of consumptions that occurs in energy analysers where the voltage, current and power
has small variations in time. The random variations in V2R are applied each second and according to the
user definition.
Fig. 2 shows the implementation of V2R used in this paper. The implementation used an Arduino and
Arduino Shields for the components in order to simplify its development. The only component that was not
used in a Shield format was the MAX485. The board of MAX485 was handmade following the connection
schema provided in the datasheet.
a)
b)
Fig. 2: V2R implementation using an Arduino: a) Used components, b) Final implementation
V2R has a simple architecture that enables the emulation of a common energy analyser. The emulation
is accomplished using Modbus/RTU protocol through RS-485 serial communication. It is possible to
connect the V2R to any RS-485 master device. Table shows the readable Modbus/RTU registers available
in the V2R. The values of registers are represented in IEEE Standard for Floating-Point Arithmetic (IEEE
754).
Table 1. V2R Registers Addresses
Address (hex) Size (bytes) Data Type Description
0x01 4 IEEE 754 Voltage
0x05 4 IEEE 754 Current
0x09 4 IEEE 754 Power consumption
Using a LCD Shield, basic information is displayed to the user. The buttons, available in the LCD Shield,
controls a menu with the following options: server IP, publishing status, RS-485 slave identifier, V2R IP
address, and V2R unique identifier.
Fig. 3 shows the configuration website of V2R for a discrete emulation. V2R integrates a TCP/IP
communication layer for remote configuration, monitoring and control. For configuration is needed the IP
address of V2R that can be found in the device menu.

Intelligent load management in local and wholesale demand response markets
59
Fig. 3: V2R configuration webpage for discrete load
During the configuration is possible to define a random value to be applied in the emulation. The value
is a percentage of randomness that will be applied to the consumption emulated by V2R. This gives the
illusion of the variation founded in real load measurements made by energy analysers. The random value
is applied each second during the emulation execution. The random variation is also applied when the
emulated load is turned off, in this case the random variation is applied in the voltage value.
The values of emulation can be sent to an external server to save de data in a database. For this work is
used a SQL Server database to store the data. The period of data storing was set to one second, and the
values stored are: arduino_id, date, voltage, current and consumption. The TCP/IP block of V2R also
enables the remote control of the emulation. Fig. 4 shows the webpage where is possible to remotely control
a V2R emulator, the IP address can be found in the emulator’s LCD menu.
Fig. 4: V2R remote control
The capability of V2R to mimic an energy analyser gives the possibility to place V2R in monitoring and
SCADA systems fooling the system. The SCADA will read V2R and see a consumption load, that do not
exist in reality. This enables the integration of unavailable loads in physical monitoring and SCADA
systems to test and validate the management of new loads. This feature of bringing emulations to physical
systems and the versatility of V2R provides the R&D centres with the means to build residential homes or
office buildings in their laboratories without the need of buying and acquiring consumption loads.
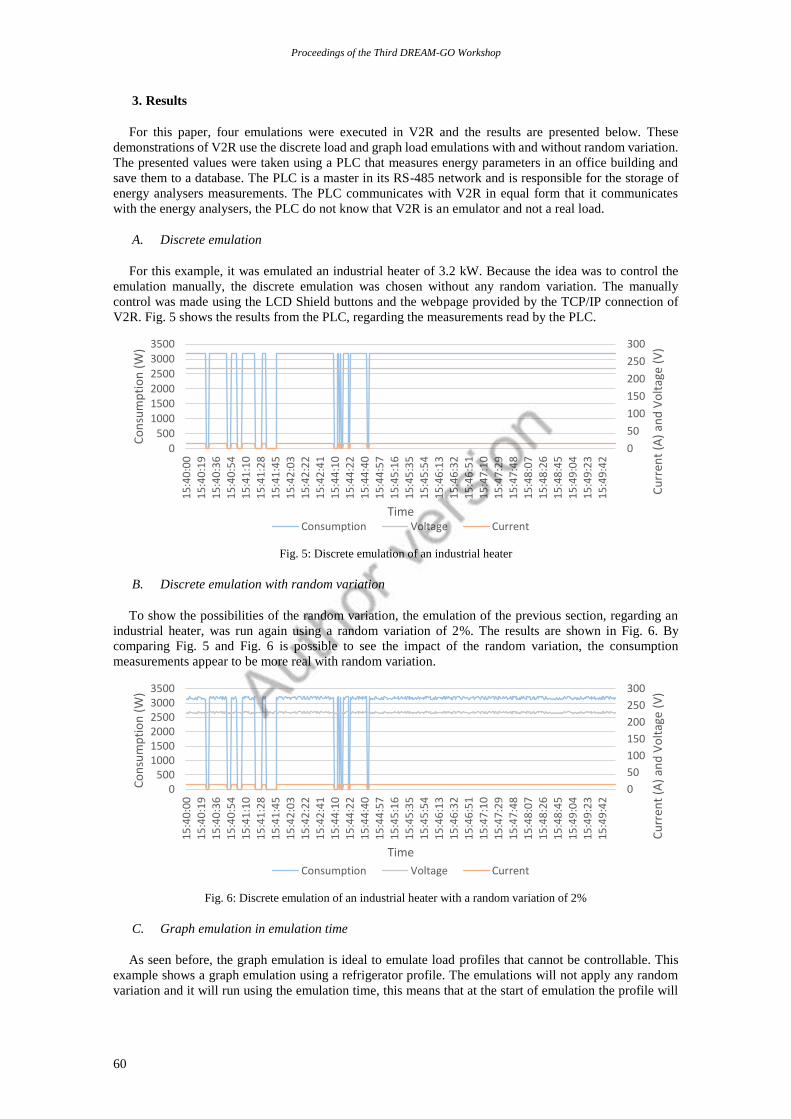
Proceedings of the Third DREAM-GO Workshop
60
3. Results
For this paper, four emulations were executed in V2R and the results are presented below. These
demonstrations of V2R use the discrete load and graph load emulations with and without random variation.
The presented values were taken using a PLC that measures energy parameters in an office building and
save them to a database. The PLC is a master in its RS-485 network and is responsible for the storage of
energy analysers measurements. The PLC communicates with V2R in equal form that it communicates
with the energy analysers, the PLC do not know that V2R is an emulator and not a real load.
A. Discrete emulation
For this example, it was emulated an industrial heater of 3.2 kW. Because the idea was to control the
emulation manually, the discrete emulation was chosen without any random variation. The manually
control was made using the LCD Shield buttons and the webpage provided by the TCP/IP connection of
V2R. Fig. 5 shows the results from the PLC, regarding the measurements read by the PLC.
Fig. 5: Discrete emulation of an industrial heater
B. Discrete emulation with random variation
To show the possibilities of the random variation, the emulation of the previous section, regarding an
industrial heater, was run again using a random variation of 2%. The results are shown in Fig. 6. By
comparing Fig. 5 and Fig. 6 is possible to see the impact of the random variation, the consumption
measurements appear to be more real with random variation.
Fig. 6: Discrete emulation of an industrial heater with a random variation of 2%
C. Graph emulation in emulation time
As seen before, the graph emulation is ideal to emulate load profiles that cannot be controllable. This
example shows a graph emulation using a refrigerator profile. The emulations will not apply any random
variation and it will run using the emulation time, this means that at the start of emulation the profile will
0
50
100
150
200
250
300
0500
100015002000250030003500
15
:40
:00
15
:40
:19
15
:40
:36
15
:40
:54
15
:41
:10
15
:41
:28
15
:41
:45
15
:42
:03
15
:42
:22
15
:42
:41
15
:44
:10
15
:44
:22
15
:44
:40
15
:44
:57
15
:45
:16
15
:45
:35
15
:45
:54
15
:46
:13
15
:46
:32
15
:46
:51
15
:47
:10
15
:47
:29
15
:47
:48
15
:48
:07
15
:48
:26
15
:48
:45
15
:49
:04
15
:49
:23
15
:49
:42
Cu
rren
t (A
) an
d V
olt
age
(V)
Co
nsu
mp
tio
n (
W)
TimeConsumption Voltage Current
0
50
100
150
200
250
300
0500
100015002000250030003500
15
:40
:00
15
:40
:19
15
:40
:36
15
:40
:54
15
:41
:10
15
:41
:28
15
:41
:45
15
:42
:03
15
:42
:22
15
:42
:41
15
:44
:10
15
:44
:22
15
:44
:40
15
:44
:57
15
:45
:16
15
:45
:35
15
:45
:54
15
:46
:13
15
:46
:32
15
:46
:51
15
:47
:10
15
:47
:29
15
:47
:48
15
:48
:07
15
:48
:26
15
:48
:45
15
:49
:04
15
:49
:23
15
:49
:42
Cu
rren
t (A
) an
d V
olt
age
(V)
Co
nsu
mp
tio
n (
W)
Time
Consumption Voltage Current
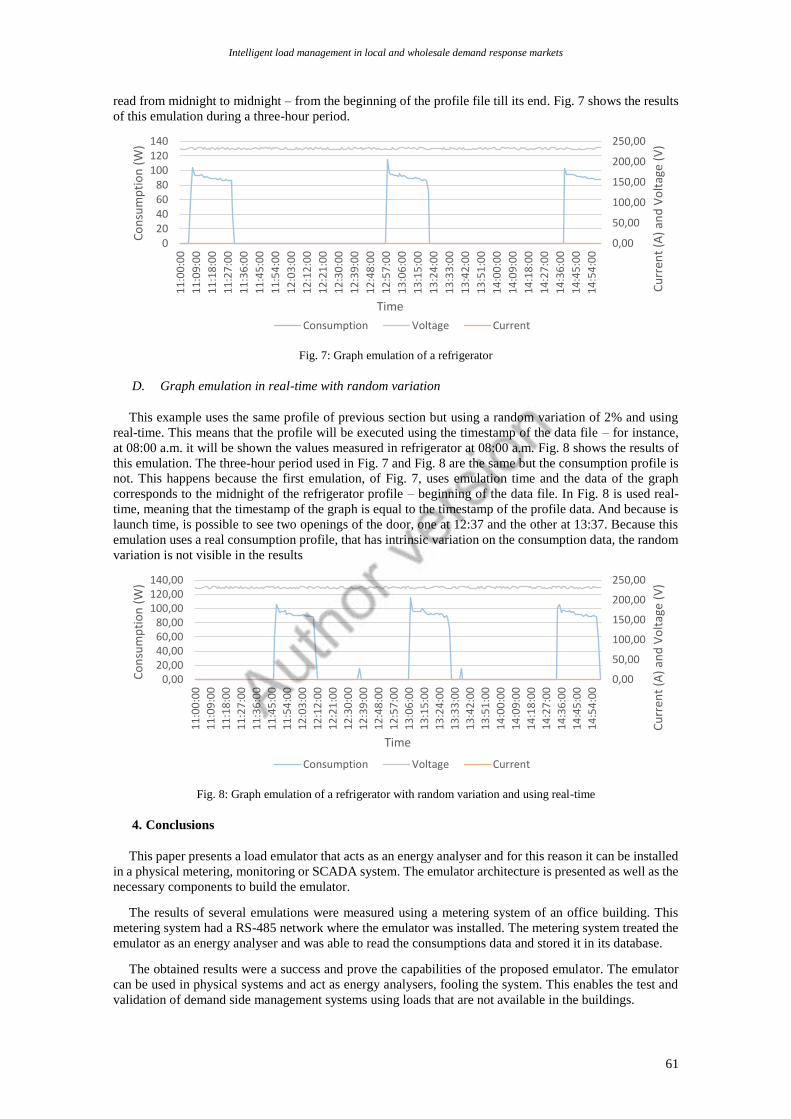
Intelligent load management in local and wholesale demand response markets
61
read from midnight to midnight – from the beginning of the profile file till its end. Fig. 7 shows the results
of this emulation during a three-hour period.
Fig. 7: Graph emulation of a refrigerator
D. Graph emulation in real-time with random variation
This example uses the same profile of previous section but using a random variation of 2% and using
real-time. This means that the profile will be executed using the timestamp of the data file – for instance,
at 08:00 a.m. it will be shown the values measured in refrigerator at 08:00 a.m. Fig. 8 shows the results of
this emulation. The three-hour period used in Fig. 7 and Fig. 8 are the same but the consumption profile is
not. This happens because the first emulation, of Fig. 7, uses emulation time and the data of the graph
corresponds to the midnight of the refrigerator profile – beginning of the data file. In Fig. 8 is used real-
time, meaning that the timestamp of the graph is equal to the timestamp of the profile data. And because is
launch time, is possible to see two openings of the door, one at 12:37 and the other at 13:37. Because this
emulation uses a real consumption profile, that has intrinsic variation on the consumption data, the random
variation is not visible in the results
Fig. 8: Graph emulation of a refrigerator with random variation and using real-time
4. Conclusions
This paper presents a load emulator that acts as an energy analyser and for this reason it can be installed
in a physical metering, monitoring or SCADA system. The emulator architecture is presented as well as the
necessary components to build the emulator.
The results of several emulations were measured using a metering system of an office building. This
metering system had a RS-485 network where the emulator was installed. The metering system treated the
emulator as an energy analyser and was able to read the consumptions data and stored it in its database.
The obtained results were a success and prove the capabilities of the proposed emulator. The emulator
can be used in physical systems and act as energy analysers, fooling the system. This enables the test and
validation of demand side management systems using loads that are not available in the buildings.
0,00
50,00
100,00
150,00
200,00
250,00
020406080
100120140
11
:00
:00
11
:09
:00
11
:18
:00
11
:27
:00
11
:36
:00
11
:45
:00
11
:54
:00
12
:03
:00
12
:12
:00
12
:21
:00
12
:30
:00
12
:39
:00
12
:48
:00
12
:57
:00
13
:06
:00
13
:15
:00
13
:24
:00
13
:33
:00
13
:42
:00
13
:51
:00
14
:00
:00
14
:09
:00
14
:18
:00
14
:27
:00
14
:36
:00
14
:45
:00
14
:54
:00
Time
Cu
rren
t (A
) an
d V
olt
age
(V)
Co
nsu
mp
tio
n (
W)
Consumption Voltage Current
0,00
50,00
100,00
150,00
200,00
250,00
0,0020,0040,0060,0080,00
100,00120,00140,00
11
:00
:00
11
:09
:00
11
:18
:00
11
:27
:00
11
:36
:00
11
:45
:00
11
:54
:00
12
:03
:00
12
:12
:00
12
:21
:00
12
:30
:00
12
:39
:00
12
:48
:00
12
:57
:00
13
:06
:00
13
:15
:00
13
:24
:00
13
:33
:00
13
:42
:00
13
:51
:00
14
:00
:00
14
:09
:00
14
:18
:00
14
:27
:00
14
:36
:00
14
:45
:00
14
:54
:00
Time
Cu
rren
t (A
) an
d V
olt
age
(V)
Co
nsu
mp
tio
n (
W)
Consumption Voltage Current

Proceedings of the Third DREAM-GO Workshop
62
Acknowledgements. This work has received funding from the European Union’s Horizon 2020 research
and innovation program under the Marie Sklodowska-Curie grant agreement No 641794 (project DREAM-
GO) and from FEDER Funds through COMPETE program and from National Funds through FCT, under
the project UID/EEA/00760/2013.
References
[9] P. Faria, J. Spínola, and Z. Vale, "Aggregation and Remuneration of Electricity Consumers and Producers
for the Definition of Demand-Response Programs," IEEE Transactions on Industrial Informatics, vol. 12, pp.
952-961, June 2016.
[10] L. Martirano, E. Habib, G. Parise, G. Greco, M. Manganelli, F. Massarella, and L. Parise, "Demand Side
Management in Micro-grids for Load Control in Nearly Zero Energy Buildings," IEEE Transactions on
Industry Applications, vol. PP, pp.1-1, Feb. 2017.
[11] A. Sheikhi, M. Rayati, S. Bahrami and A. Mohammad Ranjbar, "Integrated Demand Side Management
Game in Smart Energy Hubs," in IEEE Transactions on Smart Grid, vol. 6, no. 2, pp. 675-683, March 2015.
[12] C. Li, X. Yu, W. Yu, G. Chen and J. Wang, "Efficient Computation for Sparse Load Shifting in Demand
Side Management," in IEEE Transactions on Smart Grid, vol. 8, no. 1, pp. 250-261, Jan. 2017.
[13] H. K. Nguyen, J. B. Song and Z. Han, "Distributed Demand Side Management with Energy Storage in Smart
Grid," in IEEE Transactions on Parallel and Distributed Systems, vol. 26, no. 12, pp. 3346-3357, Dec. 1
2015.
[14] D. Manna, S. K. Goswami and P. K. Chattopadhyay, "Droop control for micro-grid operations including
generation cost and demand side management," in CSEE Journal of Power and Energy Systems, vol. 3, no.
3, pp. 232-242, Sept. 2017.
[15] K. Srikanth Reddy, L. Panwar, B. K. Panigrahi, R. Kumar and H. Yu, "Demand side management with
consumer clusters in cyber-physical smart distribution system considering price-based and reward-based
scheduling programs," in IET Cyber-Physical Systems: Theory & Applications, vol. 2, no. 2, pp. 75-83, 7
2017.
[16] Z. Cao, J. Lin, C. Wan, Y. Song, Y. Zhang and X. Wang, "Optimal Cloud Computing Resource Allocation
for Demand Side Management in Smart Grid," in IEEE Transactions on Smart Grid, vol. 8, no. 4, pp. 1943-
1955, July 2017.
[17] L. Gomes and Z. Vale, “Energy Analyzer Emulation for Energy Management Simulators,” in Distributed
Computing and Artificial Intelligence, 14th International Conference, pp. 215-222, 2017.
[18] OPAL-RT Technologies, “OP5600 off-the-shelf Hardware-in-the-Loop (HIL) simulator,” 2018, visited on
15th Janurary 2018 - www.opal-rt.com.
Luis Gomes
An Agent-Based IoT System for Intelligent Energy Monitoring in Buildings
Authors: Luis Gomes, Filipe Sousa, and Zita Vale
Published in: Proceedings of the 2018 IEEE 87th Vehicular Technology Conference (VTC Spring)
DOI: 10.1109/VTCSpring.2018.8417868
Published at: July 2018
PhD timeline: M23

An Agent-based IoT System for Intelligent Energy
Monitoring in Buildings
Luis Gomes, Filipe Sousa, Zita Vale
GECAD - Research Group on Intelligent Engineering and Computing for Advanced Innovation and Development
Institute of Engineering – Polytechnic of Porto (ISEP/IPP)
Porto, Portugal
[email protected], [email protected], [email protected]
Abstract—The new power system paradigm demands a more
active end-consumer participation in smart grids environment.
To achieve this participation, new demand side management
solutions should be developed and analyzed. Moreover, the mas-
sive dissemination of internet of things devices inside buildings
are a reality in nowadays. This paper proposes a multi-agent
system for microgrid representation that integrates internet of
thing devices to boost the energy management in today’s build-
ings. The paper will present the proposed multi-agent system as
well as an environmental awareness smart plug. The case study
in this paper will present the data acquisition from a real build-
ing using a combination of market internet of things smart plugs,
the proposed environmental awareness smart plug and a load
emulator.
Keywords—energy management; environmental awareness;
multi-agent system; smart plug
I. INTRODUCTION
The power system paradigm has been changing in the last years and will continue to change in future years, resulting in the dissemination of smart grids [1]. The centralization of gen-eration will end, appearing decentralized generation [2]. The end-consumers will be called to actively participate in the smart grids, changing completely their roles [3].
The use of Demand Response (DR) enables the end-consumer participation in smart grids. DR programs enable the direct participation of end-consumers, or through the aggrega-tion of end-consumers [4]. The end-consumer’s response to each program is defined by the user and contracts that he/she owns. DR programs intend to integrate the end-consumers using two types of remuneration [5]: incentive-based; and price-based.
The active participation of end-consumers requires actions and reactions from them. Therefore, Demand Side Manage-ment (DSM) is commonly used to respond and manage the consumption and generation balance in the end-consumers side [6][7]. DSM can act as smart and autonomous solutions that can manage entire facilities by optimizing electrical loads and generators [8].
To model this new paradigm with all the players involved is possible to use Multi-Agent Systems (MAS). These systems can model a microgrid or even a smart grid with all their play-ers [9][10]. A MAS is a good option to model the interaction between agents and the players of a smart grid; giving the indi-
vidual agents characteristics, such as, reactivity, pro-activeness and social abilities [11].
The devices inside a building are owned by the building us-ers and, in this paper, they will be seen as being properties of the building, without having individual goals.
The massive dissemination of Internet of Things (IoT) de-vices enables the control and monitoring of buildings. There-fore, the use of this devices in the energy management solu-tions can benefit the systems and avoid the acquisition of new loads and hardware.
The main contribution of this paper is the proposal of a MAS for microgrid representation that integrates IoT devices for energy management inside the buildings. The proposed MAS was developed for low-performance hardware, such as, single-board computers. These enables the installation of the agents in low-cost hardware and small enough to be placed inside the electrical switch board of the building. These fea-tures are similar to the VOLTTRON project [12]. However, the proposed MAS uses high penetration of IoT devices to perform energy management solution inside the buildings. This is the biggest contribution of this work.
This paper also presents an environmental awareness smart plug. This smart plug enables the systems to understand the environment where the load is. Giving more information to the system is possible to improve the energy management of a building.
After this first introductory section, the proposed MAS will be presented in Section II, with relevance to the overall archi-tecture and the communication protocols. Section III will de-scribe the IoT devices used in this work. Section IV will pre-sent an environmental awareness smart plug used in the MAS. The case study is presented in Section V, as well as its results. Finally, Section VI presents a brief of the results achieved.
II. MULTI-AGENT SYTEM
MAS can be used to model smart grids, where each agent is able to represent each smart grid player. The possibility of cooperative and competitive agents enables the representation of competitive players - multiple aggregator - and cooperative players - two members of the same microgrid. In this paper is proposed a MAS that models microgrids, using agents which interact with IoT devices for energy management.

The Microgrid Intelligent Management System (µGIM) is a MAS for microgrid management. It’s a system thought for low-power and low-cost single-board computers able to have a continuous operation, even without external connection. Each agent interacts with the others, but is responsible for the build-ing that it represents. Therefore, each agent has the capability to work in offline and provide energy management solutions for its building.
A. Overall Architecture
Fig. 1 shows the architecture of µGIM applied in a mi-crogrid environment. One of the µGIM priorities is the integra-tion of massive IoT devices to provide energy management solutions. In Fig.1 is possible to see the separation between the devices inside the building and the microgrid players repre-sented by the agents. The devices used in this work are one of three types: IoT device available on the market, EnAPlug that is a IoT smart plug with environment awareness capabilities [13], or Virtual to Reality (V2R) emulator that is able to emu-late electrical loads [14].
Fig. 1. µGIM architecture for microgrid
Each agent of µGIM represents an abstraction layer that separates the inside of the building from the outside. The loads of a building should be managed by the agent itself and should not be manage by external agents. However, this is not the case in Direct Load Control (DLC) events, where the agent makes some loads available to external players, such as, aggregators. The agent also deals with the communication to other players, such as, DSO and aggregators.
The agent of µGIM should be autonomous enough to pro-vide energy management to its building. However, the agent is controllable and configurable by the users of the building. The users can and should set the agent to represent their goals and beliefs. And the agent should understand them and provide the solution that most fit to the users’ desires.
The use of IoT devices gives eyes and hands to the agent. With these devices the agents can see the building and act on the building. The use of massive IoT devices in todays market
should be take into consideration in energy management sys-tems, because they can empower the systems and avoid the installation of specific hardware.
B. Communication Protocols
Each agent must be able to interact with external devices, such as, IoT devices. This interaction will provide the agent with data and means to act in their world – being its world the building that it represents. To provide enough information to the agent, multiple and suitable sensors should be integrated inside the building. For actuation and energy management is needed energy monitoring devices and actuators.
To provide the ability to integrate such devices and sensors, the agent must provide the appropriate communication proto-cols that are most common in the IoT world. In order to reduce develop work, for this paper it was used Home Assistant – that is an open-source home automation platform [15]. Home As-sistant already has multiple communication protocols and the ability to directly communicate with IoT devices commonly available on the market. It also provides a RESTful API for external communications. This allows the control of Home Assistant from a third party, like µGIM agents. The direct con-trol decreases the limitations of using the proprietary cloud services – usually large time period readings and lack of APIs.
Besides Home Assistant, µGIM uses RS-485 with Mod-bus/RTU protocol to enable the direct communication with energy analyzers and inverters. Each agent also has the ability to directly communicate using Modbus/TCP, that is handy for communications with Programmable logic controller (PLC). New protocols can be and should be developed because the number of protocols available are directly connected with the number of devices that can be connected to the agent. There-fore, the more the better.
III. IOT DEVICES USED
For this work, it was used some IoT devices that can be found on today’s market. They enable the integration of elec-trical loads in the µGIM system.
A. Smart plugs
The use of smart plugs, especially the ones with energy me-tering, are a good option for energy management systems. En-abling load control without the need of new controllable loads. This work uses four smart plugs: D-Link DSP-W215, Edimax SP-2101W, TP-Link HS100, and TP-Link HS110.
The most relevant parameters of the used smart plugs are presented and compared in Table I. In this analysis is consider the European market, and the prices available in the Spanish Amazon. This information was collected on January 15, 2018.
The switch control capability is common in all the present-ed smart plugs. Is possible turn on or off the load through a smartphone, using the manufacture mobile application. The wireless communication protocol used is barely the same, the adoption of Wi-Fi protocol is natural since its massive dissem-ination in buildings and residentials. The metering capability has a big impact on the price, in this case the lack of this capa-bility allows the HS100 to be the cheapest analyzed smart plug.

TABLE I. SMART PLUGS SPECIFICATIONS
Parameters Smart plugs
Brand D-Link Edimax TP-Link TP-Link
Model DSP-W215
SP-2101W
HS100 HS110
On/off control ✓ ✓ ✓ ✓
Metering ✓ ✓ ✘ ✓
Internal sensors ✓a ✘ ✘ ✘
External sensors ✘ ✘ ✘ ✘
Communication IEEE
802.11n
IEEE
802.11b/g/n
IEEE
802.11b/g/n
IEEE
802.11b/g/n
Voltage 100-240
VAC 100-240
VAC 100-240
VAC 100-240
VAC
Current 16 A 16 A 16 A 16 A
Priceb €38.22 €51.75 €23.99 €39.95 a. Only temperature sensor of the device.
b. From Spanish Amazon (https://www.amazon.es/).
B. Limitations
The main limitation of market available smart plugs, is the lack of sensors. Despite of switch control and metering, smart plugs do not have external sensors that could understand the environment around. Considering a desk lamp, if the user is not around, the lamp could be turned off. In other words, smart plugs could be smarter using external sensors to understand the load’s environment.
IV. ENAPLUG
To overcome the current limitations of smart plugs, this work integrates EnAPlugs for some of the electrical loads. EnAPlug is an environmental awareness smart plug composed by multiple sensors that enable the understanding of the envi-ronment [13]. This enables the system to understand the envi-ronment were a specific load is, and not only its consumptions or operation state – if it is on or off. EnAPlug is an open-source project that can be requested to the authors. At this moment, the code is only available through direct requests.
Using mainstream hardware, such as, Arduino and Arduino shields, is possible to build our own EnAPlug to use in labora-tory or in real scenarios. The concept of EnAPlug is simple, understand the environment of a load using suitable sensors that measure variables related to the load or load functionality. For instance, if a common smart plug is used in an energy management system, for residential use, the system is able to cut the heater consumption. But to do that there are some vari-ables that the system should know, such as, the temperature of the room where the heater is. Other variable that can be handy is the presence of people inside the room. These variables are not available in smart plugs available on the market today, to have these variables there is two options: buy IoT sensors that answers to our requirements, or build an EnAPlug with the sensors that we need.
Fig. 2 shows the architecture of EnAPlug. From left to right we have the following:
• Load – the load is the electrical appliance that EnAPlug will control and measure, it can be a discrete load
(on/off) or a variable load (with several consumptions levels);
• Metering – this block is responsible for the load meas-uring regarding electrical parameters, for this propose, the presented work uses a single phase energy analyzer, such as Circuitor CVM-1D Series that provides a total of 25 energy related parameters and allows loads until 31 A. The only requirement for this block is the usage of an energy analyzes with RS-485 and Modbus/RTU communications;
• Actuator – this block is the actuator that corresponds to our control desires, the simplest actuator is a relay that can turn on/off a load. However, more complex actua-tors can be used using communication protocols or in-frared emitters to control the load. Is also possible to accommodate more than one actuator in this block, for instance, a relay with an infrared emitter;
• Microcontroller – this is the ‘brain’ of EnAPlug, is re-sponsible for: read the energy analyzer, give the signals to the actuator, process all the signals from the sensors, receive and interpret the control signals and publish all these information in the server database. In this work it was used an Arduino Mega 2560 Rev3. However, other Arduinos or even other microcontrollers can be used. The Arduino was only used to simplify the implementa-tion of EnAPlug and the integration of sensors;
• Sensors – the number of these blocks are chosen by the developers. Theoretically, is possible to have a huge number of sensors measuring everything. However, the concept of EnAPlug dictates that the sensors should measure variables with impact on the work or workflow of the load, for instance, a refrigerator should not meas-ure the CO2, but it should be measure variables, such as, inside temperature, outside temperature and the time the door is open. The sensors to use depend on the goal that the developer has and the microcontroller capabili-ties regarding processing power, communications ports and libraries available;
• Control Signal – the control signal is sent using TCP/IP protocol (wired or wireless), that gives instructions to EnAPlug regarding the load state, for instance, to turn on or off the load;
• Server and Database – EnAPlug is connected to an online server; that can be in the user’s private network or in the public network. The server and database block is responsible to publish all the sensors data, the energy metering data and all the control signals that EnAPlug receive. For this work, the data was publish using a 5 second period. Similar to Control Signal block, it is used TCP/IP protocol, that can be used in wired or wire-less networks.
The integration of EnAPlug in µGIM gives a more detailed and complete understanding to the agents in comparison with IoT solution available on the market. This provides the agent with better data and therefore improves the energy manage-ment algorithms.

Fig. 2. EnAPlug architecture
V. CASE STUDY
For this case study it will be demonstrate the capabilities of a µGIM agent to acquire all the data from the smart plugs, EnAPlugs and the V2R – that are load emulators. All the data are acquired directly from the devices. It will not be used the cloud service of the IoT devices. This will speed up the com-munications with the IoT devices and enable the agent to con-trol the devices even without internet connection.
The presented work uses two EnAPlugs in an office build-ing: one for a refrigerator and other for a water heater. The EnAPlug installed in the water heater has a temperature sensor in the water pipe measuring the temperature of the water and give information regarding the time that the hot water was used. The EnAPlug installed in the refrigerator has an inside temperature and humidity sensor, an outside temperature sen-sor to measure the room’s temperature and a door sensor that provides information regarding the opening of the door
The case study presents the reading data from 02:00 p.m. to 03:00 p.m. using a reading period of five seconds. However, other reading periods can be chosen and used in µGIM. The presented agent is installed in an office building with:
• 1 V2R emulating a fan heater,
• 4 IoT smart plugs that measure the lamps, one fan heat-er, one television and one monitor. The fan heater do not have metering because it was used the TP-Link HS100 - a cheaper and common smart plug for residen-tials,
• 2 EnAPlugs measuring one water heater and one refrig-erator, using external sensors,
• 1 energy analyzer that measures all the sockets that do not have individual metering from EnAPlugs or IoT smart plugs.
The µGIM agent of the building reads all the data from the installed devices every 5 seconds. The collected data is pre-sented in Fig. 3. As can be seen, IoT devices can be used to perform metering in a building, enabling energy management solutions in the building.
Three major problems from using massive market available IoT devices are: the lack of direct communication with the device, the metering period, and the few information provided by the smart plugs. The presented work shows the possibility of direct communication with IoT devices and their capability to provide metering data in small periods. The lack of infor-mation provided by smart plugs cannot be easily solved, to overcome this issue, this work uses EnAPlugs.
Fig. 4 shows the metering provided by one EnAPlug con-nected to the refrigerator of the case study. The measurements were taken between 00:00 p.m. and 01:00 p.m. with a 5 sec-onds time period.
The use of EnAPlug provides a lot more data than a con-ventional smart plug. The Fig. 4 presents electrical measure-ments of voltage, active power and reactive power of the re-frigerator. Regarding the sensors, Fig. 4 shows the inside hu-midity in the refrigerator (that increases when the motor stops running, stopping the air ventilation), the inside temperature in the refrigerator (that decreases while the motor is consuming), the outside temperature and the door usage. These measure-ments enable the understanding of the load and the smart con-trol of the load for energy management methodologies [16].
Fig. 3. Metering from 02:00 p.m. to 03:00 p.m.

Fig. 4. EnAPlug metering (energy and sensors)
VI. CONCLUSIONS
This paper presents a multi-agent system that models mi-crogrid and management, using internet of things devices to provide the metering and control of the buildings. The case study presents the results of the integration of internet of things devices in an agent installed in an office building.
The case study was a success, providing metering every 5 seconds. Previous tests also work with 1 second period meas-urements. This enables the use of internet of things devices for energy management. This paper uses direct communication with the devices, avoiding the use of proprietary clouds owned by manufactures.
This paper also proposes and presents an energy awareness smart plug that can provide energy management systems with more information regarding the load environment. This feature enables a better understanding of the load and therefore, can improve the energy management algorithms and techniques.
ACKNOWLEDGMENT
The present work has been developed under the EUREKA - ITEA2 Project M2MGrids (ITEA-13011), Project SIMOCE (ANI|P2020 17690), and has received funding from FEDER Funds through COMPETE program and from National Funds through FCT under the project UID/EEA/00760/2013 and SFRH/BD/109248/2015.
REFERENCES
[1] D. Kirschen, “Demand-side view of electricity markets,” in IEEE Transactions on Power Systems, vol. 18, no. 2, pp. 520-527, May 2003.
[2] A. L. Dimeas, N. D. Hatziargyriou, “Operation of a Multiagent System for Microgrid Control,” in IEEE Transactions on Power Systems, vol. 20, pp. 1447-1455, August 2005.
[3] Ye Yan, Yi Qian, H. Sharif, D. Tipper, “A Survey on Smart Grid Communication Infrastructures: Motivations, Requirements and Challenges,” in Communications Surveys & Tu-torials, IEEE, vol.15 no.1, pp.5-20, First Quarter 2013.
[4] P. Siano, “Demand response and smart grids - A survey,” in Renewable and Sustainable Energy Reviews, vol. 30, pp. 461-478, February 2014.
[5] P. Faria, Z. Vale, “Demand response in electrical energy supply: An optimal real time pricing approach,” in Energy, vol. 36, no. 8, pp. 5374-5384, August 2011.
[6] N. Kinhekar, N. P. Padhy, F. Li, H. O. Gupta, “Utility Oriented Demand Side Management Using Smart AC and Micro DC Grid Cooperative,” in IEEE Transactions on Power Systems, vol. 31, no. 2, pp. 1151-1160, November 2016.
[7] E. Yao, P. Samadi, V. W. S. Wong, R. Schober, “Residential Demand Side Management Under High Penetration of Rooftop Photovoltaic Units,” in IEEE Transactions on Smart Grid, vol. 7, no. 3, pp. 1597-1608, 2016.
[8] L. Gomes, F. Fernandes, P. Faria, M. Silva, Z. Vale, C. Ramos, “Contextual and environmental awareness laboratory for energy consumption management,” in Power Systems Conference (PSC), 2015 Clemson University, Clemson, SC, pp. 1-6, March 2015.
[9] M. Mao, P. Jin, N. D. Hatziargyriou and L. Chang, "Multiagent-Based Hybrid Energy Management System for Microgrids," in IEEE Transactions on Sustainable Energy, vol. 5, no. 3, pp. 938-946, July 2014.
[10] C. Dou, D. Yue, X. Li and Y. Xue, "MAS-Based Management and Control Strategies for Integrated Hybrid Energy System," in IEEE Transactions on Industrial Informatics, vol. 12, no. 4, pp. 1332-1349, August 2016.
[11] M. Wooldridge, , G. Weiss, Ed., “Intelligent Agents,” in Multi-agent Systems. Cambridge, MA: MIT Press, Apr. 1999, pp. 3–51.
[12] VOLTTRON Project [Online]. Visited at 15/01/2018, Available: https://volttron.org/
[13] L Gomes, F Sousa, Z Vale, “EnAPlug–An Environmental Awareness Plug to Test Energy Management Solutions for Households,” in Portuguese Conference on Artificial Intelligence, pp. 253-259, September 2017.
[14] L. Gomes, Z. Vale, “Energy Analyzer Emulation for Energy Management Simulators,” in International Symposium on Distributed Computing and Artificial Intelligence, pp. 215-222, June 2017.
[15] Home Assistant Platgorm [Online]. Visited at 15/01/2018, Available: https://home-assistant.io/
[16] L. Gomes, H. L.M. Amaral, F. Fernandes, P. Faria, Z. Vale, C. Ramos, André N. de Souza, “Dynamic Approach and Testbed for Small and Medium Players Simulation in Smart Grid Environments,” IFAC Proceedings Volumes, Volume 47, Issue 3, pp. 31-36, 2014.

Luis Gomes
An Intelligent Smart Plug with Shared Knowledge Capabilities
Authors: Luis Gomes, Filipe Sousa, and Zita Vale
Published in: Sensors (IF: 3.031)
DOI: 10.3390/s18113961
Published at: November 2018
PhD timeline: M28

Sensors 2018, 18, x; doi: FOR PEER REVIEW www.mdpi.com/journal/sensors
Article 1
An Intelligent Smart Plug with Shared Knowledge 2
Capabilities 3
Luis Gomes1,*, Filipe Sousa1 and Zita Vale1 4
1 GECAD - Research Group on Intelligent Engineering and Computing for Advanced Innovation and 5 Development, Polytechnic of Porto (IPP), Porto, Portugal; {lufog, ffeso, zav}@isep.ipp.pt 6
* Correspondence: [email protected]; Tel.: +351 228 340 500 7
Abstract: The massive dissemination of smart devices in current markets provides innovative 8 technologies that can be used in energy management systems. Particularly, smart plugs enable 9 efficient remote monitoring and control capabilities of electrical resources at a low cost. However, 10 smart plugs, besides their enabling capabilities, are not able to acquire and communicate 11 information regarding the resource’s context. This paper proposes the EnAPlug, a new 12 environmental awareness smart plug with knowledge capabilities concerning the context of where 13 and how users utilize a controllable resource. This paper will focus on the abilities to learn and to 14 share knowledge between different EnAPlugs. The EnAPlug is tested in two different case studies 15 where user habits and consumption profiles are learned. A case study for distributed resource 16 optimization is also shown, where a central heater is optimized according to the shared knowledge 17 of five EnAPlugs. 18
Keywords: consumption forecast; distributed optimization; shared knowledge; smart plugs; user 19 interaction forecasts. 20
21
1. Introduction 22
Today’s market is filled with smart devices for our homes, selling the promise of smart control 23 and monitoring. However, what does this really mean? To implement a smart home, typically 24 multiple devices are required with a central system (using a centralized software with, or without, 25 hardware). By using single or independent devices the only thing we achieve is a remote control and 26 monitoring. Despite this preliminary limitation, this market is growing fast and it is expected that by 27 2022 there will be a total of 216.9 million homes worldwide with at least one smart device [1]. 28
One of the key smart devices available is the smart plug. The oldest news, tracked by the authors, 29 that presents the concept of the smart plug, is from 2008 where Dr John Woods presents an 30 ‘intelligent’ plug for energy savings and energy efficiency [2]. Smart plugs enable the retrofitting of 31 electrical resources and provide us with basic functionalities, such as scheduling or the creation of 32 rules and scenes. However, to achieve a complete futuristic smart home solution, similar to the one 33 seen in Smart House (1999) movie, is almost mandatory to have a virtual assistant with voice control 34 support – meaning, one more system is required. A big challenge for users is also the aggregation of 35 multiple systems and platforms from various brands, a job that can easily be overwhelming to the 36 ordinary user. 37
Besides the smart plugs available on the market, some scientific publications propose new 38 approaches and/or solutions. In [3] and [4], the authors propose smart plugs using Zigbee as a 39 communication protocol. A Bluetooth approach is proposed in [5]. In [6], a low-cost smart plug is 40 proposed using IEEE 802.11 for wireless communication. A more evolved smart plug is proposed in 41 [7], with the goal of detecting and act during on- and off-peak periods. 42
Smart plugs can be used in energy management systems as enablers, providing monitoring and 43 control capabilities. Smart plugs without monitoring are usually not suitable for energy management 44

Sensors 2018, 18, x FOR PEER REVIEW 2 of 17
because of the lack of information provided by the smart plug. The works presented in [8-10] are 45 examples where smart plugs were used as actuators in energy management systems. 46
In [11], a Message Queuing Telemetry Transport (MQTT) smart plug is integrated into an energy 47 management system for remote actuation. In [12], is proposed a smart plug dedicated for integration 48 with energy management systems. A centralized energy management system is also proposed in [13]. 49 In [14], smart plugs are used for resource classification, using their consumption profile. 50
The problem with smart plugs is that they are not very smart and all of them have a limitation 51 regarding resource and user information. An energy management system is highly dependent on the 52 data and information available about the building’s context. To be able to perform quality energy 53 optimizations, the system must somehow understand the building’s context, otherwise, it could 54 result in low-quality optimizations, putting in risk users’ comfort or even the building’s security. 55 Under these circumstances, this paper motivation aims to solve the lack of information regarding 56 smart plugs context, so that they can be efficiently used in energy management systems, and to show 57 the promising results of having a context awareness smart plug. 58
This paper proposes an evolution of Environmental Awareness Smart Plug (EnAPlug) that is 59 focused on the context. The previous version of EnAPlug was made using a microcontroller and 60 worked as a passive system [15][16]. The proposed evolution is not only able to understand the 61 controllable resource’s context but also to learn from the resource consumption history and from the 62 interaction between users and resources. The proposed EnAPlug has an agent-based architecture 63 using a cooperative approach, where the knowledge learned can be shared between its peers to 64 provide a decentralized resource optimization. The proposed methodology of shared knowledge is 65 presented and is the main innovation of this paper. 66
Moreover, the paper presents the EnAPlug architecture and knowledge capabilities. Two 67 physical installations of EnAPlugs are used as case studies: one in a refrigerator; and a second in a 68 desk lamp. In addition, multiple artificial neural network configurations were tested and evaluated 69 to provide knowledge to each EnAPlug. Finally, a distributed optimization scenario is presented 70 using the shared knowledge EnAPlug capability. 71
After this first introductory section, a market survey is presented in section 2. In section 3, the 72 proposed EnAPlug architecture is detailed, focusing on the shared knowledge and distributed 73 optimization capabilities. Section 4 shows the learning results using two controllable resources. After 74 that, section 5 presents the outcome of the distributed optimization using the learning results. Finally, 75 the discussion and main conclusions are presented in section 6. 76
2. Market Available Smart Plugs 77
Smart plugs are easily found in current markets and their dissemination in people homes is a 78 reality [1]. The first news regarding smart plugs appeared in 2008, showing devices that can be 79 remotely controlled and operated [2]. Since then, smart plugs had trivial evolutions, but the base 80 operation concept remains the same. 81
2.1. Smart Plugs Survey 82
The smart plugs market survey was conducted focusing only smart plugs with energy 83 monitoring. The reason behind this choice is because smart plugs without energy monitoring 84 capabilities cannot be used as unique elements in energy management systems, demanding external 85 energy monitoring systems. The information presented in Table 1 was collected using official 86 websites, datasheets, and manuals. If a certain functionality was not specified in any of those sources 87 of information, it was assumed that the smart plug did not have such functionality. The price column 88 was completed considering prices of official website and Amazon websites. The estimated price of 89 EnAPlug only considers the prototype stage where is used a Mean Well DR-15-5 5 V power supply 90 and a Circuitor CVM-1D energy analyzer, that represent more than 60% of the price. For a commercial 91 version, these two components should be replaced or eliminated. 92

Sensors 2018, 18, x FOR PEER REVIEW 3 of 17
It is worth noting that Table 1 excludes not only smart plugs without monitoring but also smart 93 plugs with monitoring that do not well describe their functionalities and capabilities (i.e. when 94 significant lack of information was identified, the smart plug was not included in Table 1). 95
2.2. Problems and Limitations 96
The conventional smart plugs presented in Table 1 are not truly smart in any aspect. For instance, 97 the smart plugs are enablers for retrofitting electrical resources but do not possess any smartness in 98 their core. The authors could not find a standard definition of smart plugs, but the survey indicates 99 the following definition: a smart plug is an electronic device for electrical outlets installation that can control 100 an electric resource and is able to communicate, also, it may, or may not, have the ability of energy monitoring. 101
The application of smart plugs enables the concept of smart homes. However, a smart plug is 102 only an enabler while the smartness and intelligence are in the smart home management system. If 103 smart plugs were truly smart and intelligent, new business models, opportunities and features could 104 appear on the market and in the open source community. 105
Nowadays, the clear disadvantage in the smart plug market is the lack of standardization or the 106 implementation of standards in the smart plugs. Standards like Z-Wave or NEST were developed for 107 home applications but are not the market standard for these products. This problem can affect the 108 users and creates friction in the usage of smart plugs with third-party smart homes or energy 109 management systems. 110
The use of multiple communication protocols, such as Z-Wave or Zigbee, demands the 111 installation of hubs that aggregate all the communications and work as an interface between Wi-Fi 112 or Ethernet network to the protocol used by the smart plugs. It is not unusual to have more than one 113 hub in homes, and this can be a problem for users, representing an increase in equipment and in 114 energy consumption. The application of Wi-Fi in smart plugs, although is more convenient, also 115 raises other concerns regarding smart plug’s energy consumption. 116
The last limitation that the authors want to point out, concerns the quality of information 117 measured by the current smart plugs. The values and parameters measured, if any, are overall related 118 to the electrical resource consumption giving few or no information regarding the resource context. 119 The inability to provide sufficient and quality information to a smart home or energy management 120 system will limit the system actuation. 121
Table 1. Overview of Market Smart Plugs and EnAPlug 122
Smart Plug Wireless
Protocol
Max.
Power
(W)
Price
(EUR)
Hu
b (
req
uir
ed)
Am
azo
n A
lexa
Ap
ple
Ho
meK
it
Go
og
le A
ssis
tan
t
Nes
t
Ho
me
Ass
ista
nt
IFT
TT
Ag
end
a /
Sch
edu
le
Ru
les
Sce
nes
Ext
ern
al S
enso
rs
ANKUOO NEO PRO
SW3101M IEEE 802.11b/g/n 3,680* 32.15 ⨯ ⨯ ⨯ ⨯ ⨯ ✓ ⨯ ✓ ⨯ ✓ ⨯
BroadLink Smart plug SP3 IEEE 802.11b/g/n 3,600 24.90 ⨯ ✓ ⨯ ⨯ ⨯ ✓ ⨯ ✓ ✓ ✓ ⨯
D-Link DSP-W215 IEEE 802.11n 1,800 36.12 ⨯ ✓ ⨯ ✓ ⨯ ✓ ✓ ✓ ✓ ✓ ⨯
EDIMAX SP-2101W V2 IEEE 802.11b/g/n 3,680* 56.82 ⨯ ✓ ⨯ ⨯ ⨯ ✓ ⨯ ✓ ⨯ ⨯ ⨯
Elgato - Eve Energy BLE 2,500* 49.99 ✓ ⨯ ✓ ⨯ ⨯ ⨯ ⨯ ✓ ✓ ✓ ⨯
Fibaro Wall Plug Z-Wave 2,500 58.78 ✓ ⨯ ⨯ ⨯ ⨯ ✓ ⨯ ✓ ✓ ✓ ⨯
Fibaro Wall Plug (BLE) BLE 2,500 75.13 ✓ ⨯ ✓ ⨯ ⨯ ✓ ⨯ ✓ ✓ ✓ ⨯
iDevices SWITCH IEEE 802.11b/g/n
and BLE 1,800 23.74 ⨯ ✓ ✓ ✓ ⨯ ⨯ ⨯ ✓ ⨯ ⨯ ⨯
iSocket Environment Pro GSM 4,000 143.20 ⨯ ⨯ ⨯ ⨯ ⨯ ⨯ ⨯ ✓ ⨯ ⨯ ✓

Sensors 2018, 18, x FOR PEER REVIEW 4 of 17
Koogeek P1 Plug IEEE 802.11b/g/n 1,800 22.07 ⨯ ✓ ✓ ✓ ⨯ ⨯ ⨯ ✓ ⨯ ✓ ⨯
ORVIBO Smart WiFi
Meter Plug 31 IEEE 802.11b/g/n 1,800 21.20 ⨯ ✓ ⨯ ⨯ ⨯ ⨯ ⨯ ✓ ✓ ✓ ⨯
Revogi Smart Meter Plug BLE 4,000 20.31 ⨯ ⨯ ⨯ ⨯ ⨯ ⨯ ⨯ ✓ ✓ ⨯ ⨯
Sonoff S31 Smart Socket IEEE 802.11b/g/n 3,520 14.54 ⨯ ✓ ⨯ ✓ ✓ ✓ ✓ ✓ ✓ ✓ ⨯
TP-Link HS110 IEEE 802.11b/g/n 1,800 32.90 ⨯ ✓ ⨯ ✓ ✓ ✓ ✓ ✓ ⨯ ✓ ⨯
TP-Link RE370K IEEE
802.11ac/n/g/b 3,840 62.48 ⨯ ✓ ⨯ ✓ ⨯ ⨯ ⨯ ✓ ⨯ ✓ ⨯
Wemo Insight Smart Plug IEEE 802.11/n 1,800 30.91 ⨯ ✓ ⨯ ✓ ✓ ✓ ✓ ✓ ✓ ✓ ⨯
Xiaomi Mi Smart Socket
Plug IEEE 802.11b/g/n 2,200 18.37 ⨯ ⨯ ⨯ ✓ ⨯ ✓ ⨯ ✓ ⨯ ⨯ ⨯
Proposed EnAPlug IEEE 802.11b/g/n 7,360** ~130 ⨯ ⨯ ⨯ ⨯ ⨯ ✓ ⨯ ✓ ✓ ✓ ✓
* the maximum power changes according to the plug type 123
** when installed in an electrical board, otherwise is limited to 16 A of a standard type-F plug 124
3. Proposed Architecture 125
Facing the limitations of current smart plugs, available in the market, the authors propose an 126 improved EnAPlug. The proposed improved EnAPlug differentiates itself from others because of its 127 ability to understand the context of the load and its ability to share knowledge. While the majority of 128 conventional smart plugs only provide consumption values, EnAPlug can collect more data that can 129 be transformed into knowledge. EnAPlug has a plug and play feature to integrate multiple sensors, 130 as shown in Figure 1. This enables the measurement of parameters that directly or indirectly have an 131 impact in the usage or operation of the electrical resource that EnAPlug controls. 132
133
Figure 1. EnAPlug sensors integration 134
The sensors of each EnAPlug should be chosen after the controllable resource is known. If the 135 control will be done in a lamp, EnAPlug could have a movement sensor, a room luminosity sensor, 136 and a noise sensor. These sensors will give a clear view about how and when the lamp is used. 137
The allocation of sensors in each EnAPlug should be thought out for each application. A sensor 138 should be installed if the measured value has a direct or indirect connection in when or how the 139 controllable resource will be used. The correct choice of sensors will increase the awareness capability 140 of EnAPlug. 141
The proposed EnAPlug uses a multi-agent system (MAS) approach, that according to [17] should 142 provide reactivity, pro-activeness and social abilities. These abilities allow the MAS to react to 143 changes happening in their environment, to have pro-activity to achieve their own goals and to be 144 social with other agents using direct communications to negotiate, collaborate or cooperate. The use 145 of MAS for energy management systems functionalities is not a novelty feature, some examples can 146 be seen in [18], [19] and [20]. 147
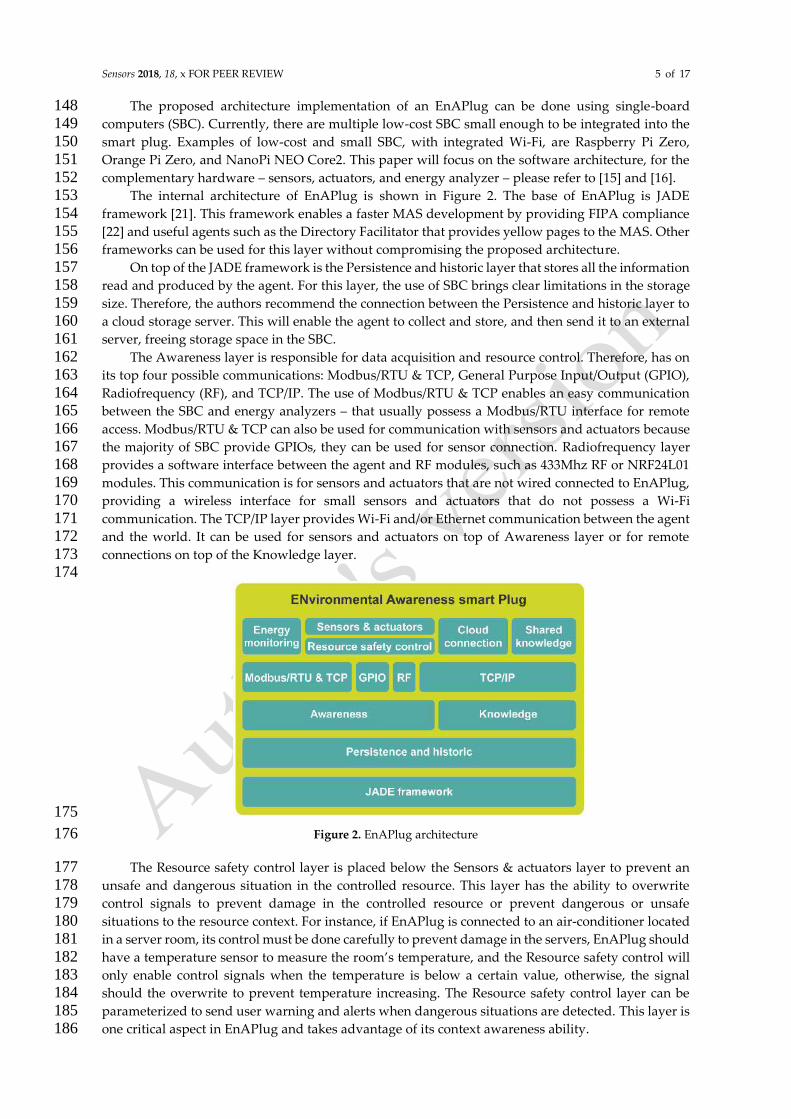
Sensors 2018, 18, x FOR PEER REVIEW 5 of 17
The proposed architecture implementation of an EnAPlug can be done using single-board 148 computers (SBC). Currently, there are multiple low-cost SBC small enough to be integrated into the 149 smart plug. Examples of low-cost and small SBC, with integrated Wi-Fi, are Raspberry Pi Zero, 150 Orange Pi Zero, and NanoPi NEO Core2. This paper will focus on the software architecture, for the 151 complementary hardware – sensors, actuators, and energy analyzer – please refer to [15] and [16]. 152
The internal architecture of EnAPlug is shown in Figure 2. The base of EnAPlug is JADE 153 framework [21]. This framework enables a faster MAS development by providing FIPA compliance 154 [22] and useful agents such as the Directory Facilitator that provides yellow pages to the MAS. Other 155 frameworks can be used for this layer without compromising the proposed architecture. 156
On top of the JADE framework is the Persistence and historic layer that stores all the information 157 read and produced by the agent. For this layer, the use of SBC brings clear limitations in the storage 158 size. Therefore, the authors recommend the connection between the Persistence and historic layer to 159 a cloud storage server. This will enable the agent to collect and store, and then send it to an external 160 server, freeing storage space in the SBC. 161
The Awareness layer is responsible for data acquisition and resource control. Therefore, has on 162 its top four possible communications: Modbus/RTU & TCP, General Purpose Input/Output (GPIO), 163 Radiofrequency (RF), and TCP/IP. The use of Modbus/RTU & TCP enables an easy communication 164 between the SBC and energy analyzers – that usually possess a Modbus/RTU interface for remote 165 access. Modbus/RTU & TCP can also be used for communication with sensors and actuators because 166 the majority of SBC provide GPIOs, they can be used for sensor connection. Radiofrequency layer 167 provides a software interface between the agent and RF modules, such as 433Mhz RF or NRF24L01 168 modules. This communication is for sensors and actuators that are not wired connected to EnAPlug, 169 providing a wireless interface for small sensors and actuators that do not possess a Wi-Fi 170 communication. The TCP/IP layer provides Wi-Fi and/or Ethernet communication between the agent 171 and the world. It can be used for sensors and actuators on top of Awareness layer or for remote 172 connections on top of the Knowledge layer. 173
174
175
Figure 2. EnAPlug architecture 176
The Resource safety control layer is placed below the Sensors & actuators layer to prevent an 177 unsafe and dangerous situation in the controlled resource. This layer has the ability to overwrite 178 control signals to prevent damage in the controlled resource or prevent dangerous or unsafe 179 situations to the resource context. For instance, if EnAPlug is connected to an air-conditioner located 180 in a server room, its control must be done carefully to prevent damage in the servers, EnAPlug should 181 have a temperature sensor to measure the room’s temperature, and the Resource safety control will 182 only enable control signals when the temperature is below a certain value, otherwise, the signal 183 should the overwrite to prevent temperature increasing. The Resource safety control layer can be 184 parameterized to send user warning and alerts when dangerous situations are detected. This layer is 185 one critical aspect in EnAPlug and takes advantage of its context awareness ability. 186

Sensors 2018, 18, x FOR PEER REVIEW 6 of 17
Knowledge layer gives meaning to the information of Awareness layer by creating knowledge 187 using deep learning. The training of deep learning algorithms can be a huge task for SBC. Therefore, 188 the training process of deep learning algorithms can be performed in the cloud, while the trained 189 model can be used inside EnAPlug’s SBC. The Cloud connection enables the interaction between 190 EnAPlug and a cloud where deep learning algorithms can be trained using EnAPlug’s data. 191
The Shared knowledge layer is described in detail in the next section (3.1). This layer enables the 192 share of knowledge directly between EnAPlugs to build a shared knowledge world where each 193 EnAPlug contributes with their knowledge. 194
3.1. Shared Knowledge 195
The Shared knowledge layer is one of the most important layers in EnAPlug’s architecture. The 196 ability to learn and share its knowledge is the main feature of EnAPlug and brings a new set of 197 possibilities to its application. 198
The control and monitoring of electrical resources are important enablers but is possible to turn 199 smart plugs in devices with knowledge regarding the usage and operation of a controllable resource. 200 For this to be possible, the proposed architecture presents a Knowledge layer that can use remote 201 deep learning algorithm for learning using the data of the Awareness layer (Figure 2). The Knowledge 202 layer brings knowledge to EnAPlug, while the Shared knowledge layer brings the ability to share this 203 knowledge with other EnAPlugs. 204
Knowledge layer is responsible to give meaning to data. The use of this layer can be vast and 205 different from each EnAPlug application, but for this paper it is considered that the Knowledge layer 206 should have answers to the following two questions: 207
• The resource will be used by the user in the next hour? 208 • The resource will have electrical consumption in the next hour? 209
Each EnAPlug should be able to answer those two questions in thirty minutes ahead. In some 210 cases, such as televisions and heaters, the answers of both questions can be the same – both positive 211 or negative – but in some cases, such as water heaters and refrigerators, the answers can differ. 212
EnAPlug should also understand its surroundings and context besides the knowledge provided 213 by the Knowledge layer. Therefore, each EnAPlug must be able to answer, at any time, to the 214 following two questions: 215
• The resource is being used? 216 • The resource is consuming electricity? 217
The shared knowledge feature enables EnAPlugs to interact with each other’s to build a 218 complete movement and presence mind map of the building where they are installed. An EnAPlug, 219 can, at any time, quiz others regarding their knowledge. Figure 3 shows the communication sequence 220 regarding knowledge acquisition. 221
In Figure 3, is presented an example where a heater’s EnAPlug, located in living room, wants to 222 optimize its consumption according to the usage of the living room. Therefore, it must ask every 223 EnAPlug in the living room if its resource is in used and if the resource will be used during the next 224 hour. In order to do that, the heater’s EnAPlug will inquire the yellow pages of the MAS, provided 225 by the Directory Facilitator agent of JADE framework, to request all the agents located in the living 226 room. Then, for each agent in the living room, the heater’s EnAPlug will inquire the agent knowledge. 227

Sensors 2018, 18, x FOR PEER REVIEW 7 of 17
228
Figure 3. Shared Knowledge procedure 229
The Shared knowledge layer enables the collaboration between EnAPlugs, all of them are 230 connected and can benefit from each other’s, as seen in Figure 4. Like in a society, the combination of 231 knowledge leverages the overall knowledge and can improve resource management. In the previous 232 example, regarding the heater’s EnAPlug, the heater should management its consumption using the 233 knowledge of every resource located inside the living room. 234
All EnAPlugs contribute to an overall shared knowledge that is available to all in a distributed 235 and decentralized way, avoiding the centralization of knowledge. However, energy and resource 236 centralized management solutions can be built on top of EnAPlug to use their context capabilities. 237
The questions that EnAPlug should answer can expand to include new ones. The proposed four 238 questions are used in our case study, but more can be included. 239
The Shared knowledge layer is built upon the Knowledge layer, while the Knowledge layer is 240 built upon the data from the Sensors & Actuators layer. Therefore, the application of sensors must 241 provide enough data to the Knowledge layer. The use of the right sensors in the EnAPlug is the most 242 important aspect, without the right sensors, the ability to transform data into knowledge and then 243 share it with the others is not possible. 244
245
Figure 4. EnAPlugs connection for shared knowledge 246
3.2. Distributed Optimization 247
EnAPlug can be integrated into an energy management system for centralized resource 248 optimization. However, EnAPlugs are able to run distributed optimizations, where each EnAPlug 249 optimizes their own resource consumption according to the shared knowledge provided by other 250 EnAPlugs. 251
The shared knowledge is very important for distributed optimizations. EnAPlug can use the 252 shared knowledge of all EnAPlugs located in the same room to identify if there will be persons in the 253 room during the next hour. 254
To use the shared knowledge for distributed optimization, equation 1 is used. Where A is the 255 EnAPlug’s answer – there will, or will not, be users/consumption during the next hour. The 256 aggregation of knowledge is calculated using equations 2 and 3. To know if there will be 257 users/consumption in the room, at least one EnAPlug should respond affirmatively. However, to 258

Sensors 2018, 18, x FOR PEER REVIEW 8 of 17
know if there will not be users/consumption in the room, all the EnAPlugs should respond 259 negatively. 260
Equation 2 calculates the probability of a negative room answer. Where E0i is the EnAPlug i 261 probability of not having users/consumption. Equation 3 calculates the probability of an affirmative 262 answer – adaptation from the principle of inclusion and exclusion for probability [23]. Where E1i is 263 the EnAPlug i probability of having users/consumption. 264
Equation 4 calculates the EnAPlug probability of having (E1) or not having (E0) 265 users/consumption. For this, the answer is given by EnAPlug, represented by A, and the accuracy of 266 its forecast, represented by γ, are used. For instance, if we have an EnAPlug, with an accuracy of 80%, 267 giving a negative answer, then E1 = 20% while E0 = 80%. This is only true because they are binary 268 answers. 269
(1)
(2)
(3)
(4)
4. Learning Results 270
The deep learning mechanism used in this paper case studies was executed in EnAPlug using a 271 trained model that was trained in the cloud – to avoid the low-processing of SBC. It was used Deep 272 Learning for Java (DL4J) library to run artificial neural networks (ANN) [24]. The ANN chosen were 273 the Long Short-Term Memory Units (LSTMs) because of their ability to continue learning [25-27]. It 274 was used backpropagation networks, where the weights are initialized using the equation proposed 275 in [28]. Gradients updates are calculated using Nesterov momentum. A threshold of 0.5 is applied to 276 truncate values, as it was proposed in [29]. 277
To avoid underfitting and overfitting, it was used the early stopping functionality available in 278 DL4J [30]. The early stopping analyzes an ANN using a time window and a maximum number of 279 epochs, and it is able to calculate the equilibrium point where the ANN is not underfitting or 280 overfitting, giving the best epoch number for training. 281
The dataset used for ANN uses real data collected using two physically installed EnAPlugs in 282 our research center. A total of 106 ANN were designed, trained and evaluated. For this paper, only 283 the best configurations were included. For each configuration is presented the two best sub-284 configurations. Where a configuration differs from each other by their inputs and outputs, while sub-285 configuration only varies according to their internal composition – hidden layers and number of 286 neurons. 287
4.1. Refrigerator 288
It was installed an EnAPlug in a refrigerator containing an energy analyzer, outside temperature 289 sensor, inside temperature sensor, inside a humidity sensor and a door sensor that detects the 290 opening of the door. The EnAPlug sensors were installed to gather enough context data from the 291 refrigerator usage. Data from this installation can be found in [16]. 292
The inside temperature sensor is used by the Resource Safety Control layer to prevent damage 293 in the refrigerator goods. If inside temperature exceeds more than 7º C, the safety control will turn 294 on the refrigerator and overwrite the resource remote control signals. 295
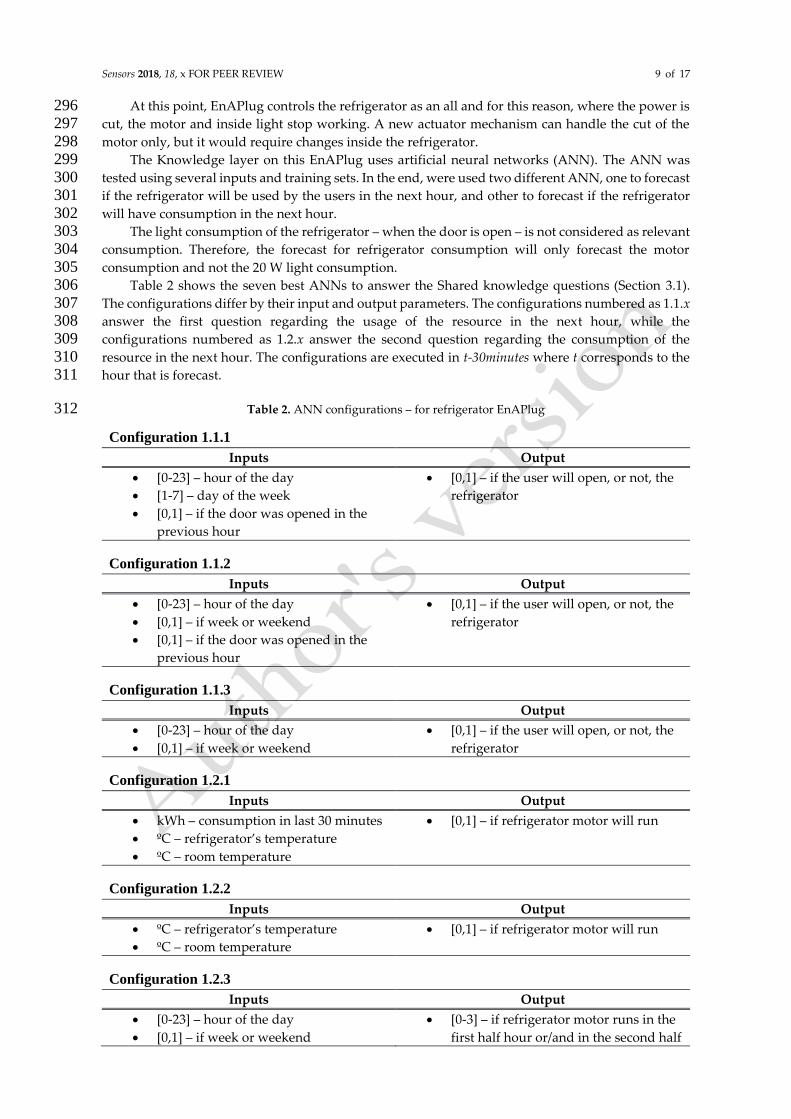
Sensors 2018, 18, x FOR PEER REVIEW 9 of 17
At this point, EnAPlug controls the refrigerator as an all and for this reason, where the power is 296 cut, the motor and inside light stop working. A new actuator mechanism can handle the cut of the 297 motor only, but it would require changes inside the refrigerator. 298
The Knowledge layer on this EnAPlug uses artificial neural networks (ANN). The ANN was 299 tested using several inputs and training sets. In the end, were used two different ANN, one to forecast 300 if the refrigerator will be used by the users in the next hour, and other to forecast if the refrigerator 301 will have consumption in the next hour. 302
The light consumption of the refrigerator – when the door is open – is not considered as relevant 303 consumption. Therefore, the forecast for refrigerator consumption will only forecast the motor 304 consumption and not the 20 W light consumption. 305
Table 2 shows the seven best ANNs to answer the Shared knowledge questions (Section 3.1). 306 The configurations differ by their input and output parameters. The configurations numbered as 1.1.x 307 answer the first question regarding the usage of the resource in the next hour, while the 308 configurations numbered as 1.2.x answer the second question regarding the consumption of the 309 resource in the next hour. The configurations are executed in t-30minutes where t corresponds to the 310 hour that is forecast. 311
Table 2. ANN configurations – for refrigerator EnAPlug 312
Configuration 1.1.1
Inputs Output
• [0-23] – hour of the day
• [1-7] – day of the week
• [0,1] – if the door was opened in the
previous hour
• [0,1] – if the user will open, or not, the
refrigerator
Configuration 1.1.2
Inputs Output
• [0-23] – hour of the day
• [0,1] – if week or weekend
• [0,1] – if the door was opened in the
previous hour
• [0,1] – if the user will open, or not, the
refrigerator
Configuration 1.1.3
Inputs Output
• [0-23] – hour of the day
• [0,1] – if week or weekend
• [0,1] – if the user will open, or not, the
refrigerator
Configuration 1.2.1
Inputs Output
• kWh – consumption in last 30 minutes
• ºC – refrigerator’s temperature
• ºC – room temperature
• [0,1] – if refrigerator motor will run
Configuration 1.2.2
Inputs Output
• ºC – refrigerator’s temperature
• ºC – room temperature
• [0,1] – if refrigerator motor will run
Configuration 1.2.3
Inputs Output
• [0-23] – hour of the day
• [0,1] – if week or weekend
• [0-3] – if refrigerator motor runs in the
first half hour or/and in the second half
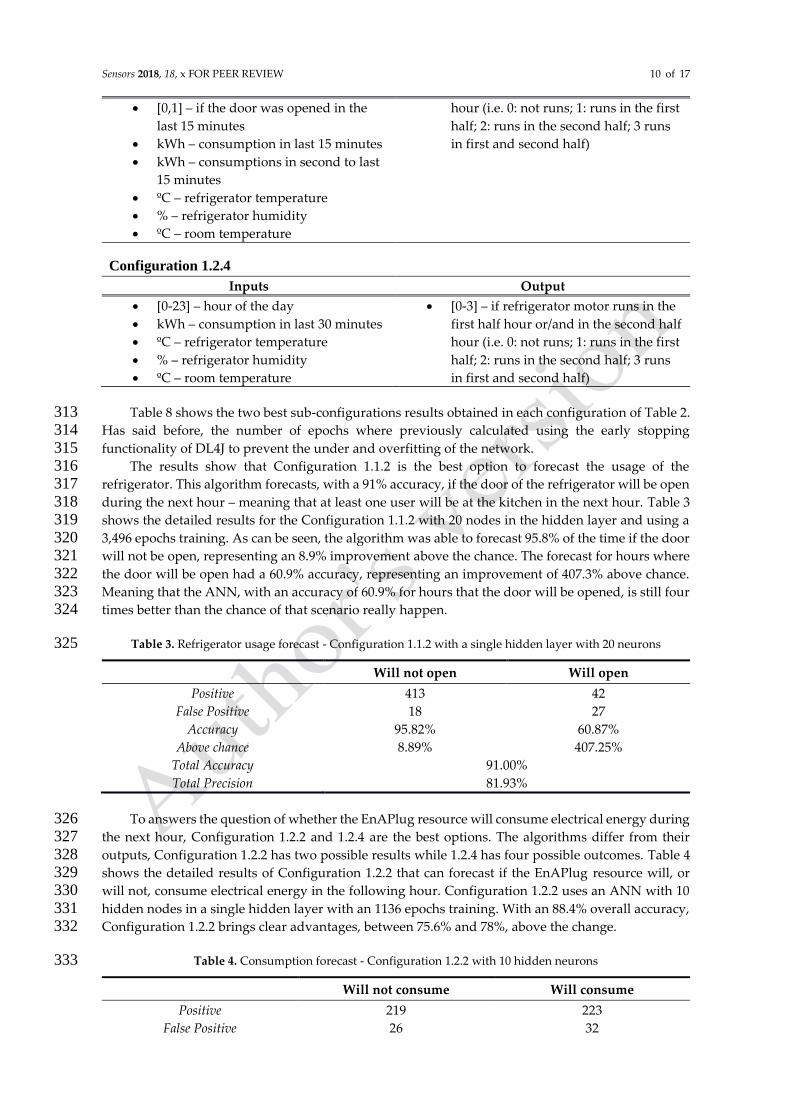
Sensors 2018, 18, x FOR PEER REVIEW 10 of 17
• [0,1] – if the door was opened in the
last 15 minutes
• kWh – consumption in last 15 minutes
• kWh – consumptions in second to last
15 minutes
• ºC – refrigerator temperature
• % – refrigerator humidity
• ºC – room temperature
hour (i.e. 0: not runs; 1: runs in the first
half; 2: runs in the second half; 3 runs
in first and second half)
Configuration 1.2.4
Inputs Output
• [0-23] – hour of the day
• kWh – consumption in last 30 minutes
• ºC – refrigerator temperature
• % – refrigerator humidity
• ºC – room temperature
• [0-3] – if refrigerator motor runs in the
first half hour or/and in the second half
hour (i.e. 0: not runs; 1: runs in the first
half; 2: runs in the second half; 3 runs
in first and second half)
Table 8 shows the two best sub-configurations results obtained in each configuration of Table 2. 313 Has said before, the number of epochs where previously calculated using the early stopping 314 functionality of DL4J to prevent the under and overfitting of the network. 315
The results show that Configuration 1.1.2 is the best option to forecast the usage of the 316 refrigerator. This algorithm forecasts, with a 91% accuracy, if the door of the refrigerator will be open 317 during the next hour – meaning that at least one user will be at the kitchen in the next hour. Table 3 318 shows the detailed results for the Configuration 1.1.2 with 20 nodes in the hidden layer and using a 319 3,496 epochs training. As can be seen, the algorithm was able to forecast 95.8% of the time if the door 320 will not be open, representing an 8.9% improvement above the chance. The forecast for hours where 321 the door will be open had a 60.9% accuracy, representing an improvement of 407.3% above chance. 322 Meaning that the ANN, with an accuracy of 60.9% for hours that the door will be opened, is still four 323 times better than the chance of that scenario really happen. 324
Table 3. Refrigerator usage forecast - Configuration 1.1.2 with a single hidden layer with 20 neurons 325
Will not open Will open
Positive 413 42
False Positive 18 27
Accuracy 95.82% 60.87%
Above chance 8.89% 407.25%
Total Accuracy 91.00%
Total Precision 81.93%
To answers the question of whether the EnAPlug resource will consume electrical energy during 326 the next hour, Configuration 1.2.2 and 1.2.4 are the best options. The algorithms differ from their 327 outputs, Configuration 1.2.2 has two possible results while 1.2.4 has four possible outcomes. Table 4 328 shows the detailed results of Configuration 1.2.2 that can forecast if the EnAPlug resource will, or 329 will not, consume electrical energy in the following hour. Configuration 1.2.2 uses an ANN with 10 330 hidden nodes in a single hidden layer with an 1136 epochs training. With an 88.4% overall accuracy, 331 Configuration 1.2.2 brings clear advantages, between 75.6% and 78%, above the change. 332
Table 4. Consumption forecast - Configuration 1.2.2 with 10 hidden neurons 333
Will not consume Will consume
Positive 219 223
False Positive 26 32

Sensors 2018, 18, x FOR PEER REVIEW 11 of 17
Accuracy 89.39% 87.45%
Above chance 78.06% 75.60%
Total Accuracy 88.40%
Total Precision 88.42%
Facing the good results of Configuration 1.2.2; Configuration 1.2.3 and 1.2.4 were designed using 334 four possible outcomes. Instead of forecasting only if the refrigerator motor will consume, these new 335 algorithms try to better understand when this consumption will happen. The possible outputs of 336 these algorithms are: there will not be any consumption during the forecasted hour; there will be 337 consumption only in the first half an hour; there will be consumption only in the last half an hour; or 338 there will be consumption during the entire hour. 339
Table 5 shows the detailed results of Configuration 1.2.4 using a network with 5 hidden nodes 340 and a 1088 epochs training. The results show a significant improvement in the above chance values. 341 The configuration can, with an accuracy between 58.1% and 91.5%, forecast if the refrigerator motor 342 will run in the first half an hour, in the last half an hour, in the full hour or if it will not run at all. 343 With an overall accuracy of 81.6% using four possible outcomes, the Configuration 1.2.4 is a good 344 option to forecast if the refrigerator will, or will not, consume electrical energy in the following hour 345 period. 346
Table 5. Consumption forecast - Configuration 1.2.4 with 5 hidden neurons 347
Will not
consume
Will consume
(first 30
minutes)
Will consume
(last 30 minutes)
Will consume
(all hour)
Positive 225 50 25 108
False Positive 21 22 18 31
Accuracy 91.46% 69.44% 58.14% 77.70%
Above chance 82.93% 460.04% 376.55% 205.90%
Total Accuracy 81.60%
Total Precision 74.19%
4.2. Desk Lamp 348
In this case study, the desk lamp is used for desk works, and it should be turned on every time 349 a person is working on the desk. This way, the electrical consumption is directly connected to the 350 presence of the user. By considering this, the forecast questions of Section 3.1 can be answered using 351 a unique configuration. The ANN that forecasts the user presence is also used for the consumption 352 forecast. This is only possible because this resource is dependent on user usage, and only has 353 consumption if the user is there. 354
The desk lamp’s EnAPlug was integrated with a luminosity sensor, a temperature sensor, and a 355 presence sensor. The presence sensor itself is the combination of a passive infrared sensor (PIR) that 356 is a movement sensor, a keyboard sensor, and a mouse sensor. The keyboard and mouse sensors are 357 purely software installed on the desktop computer. It is the combination of those three sensors that 358 provide the information of user presence. 359
Table 6 shows the three best configurations used for the forecast. Each configuration was then 360 executed with several hidden layer’s configurations. The better results can be seen in Table 8. The 361 ANN was built in DL4J using the early stopping functionality. 362
Table 6. Forecast configurations description – for desk lamp EnAPlug 363
Configuration 2.1
Inputs Output
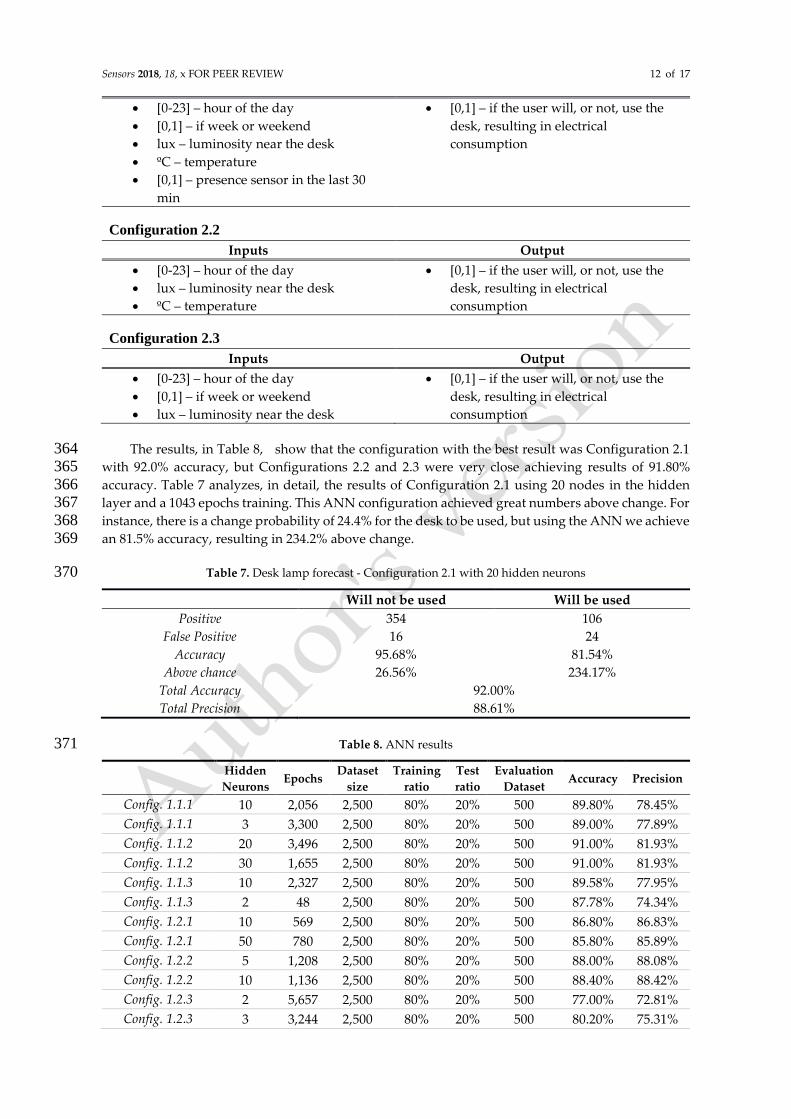
Sensors 2018, 18, x FOR PEER REVIEW 12 of 17
• [0-23] – hour of the day
• [0,1] – if week or weekend
• lux – luminosity near the desk
• ºC – temperature
• [0,1] – presence sensor in the last 30
min
• [0,1] – if the user will, or not, use the
desk, resulting in electrical
consumption
Configuration 2.2
Inputs Output
• [0-23] – hour of the day
• lux – luminosity near the desk
• ºC – temperature
• [0,1] – if the user will, or not, use the
desk, resulting in electrical
consumption
Configuration 2.3
Inputs Output
• [0-23] – hour of the day
• [0,1] – if week or weekend
• lux – luminosity near the desk
• [0,1] – if the user will, or not, use the
desk, resulting in electrical
consumption
The results, in Table 8, show that the configuration with the best result was Configuration 2.1 364 with 92.0% accuracy, but Configurations 2.2 and 2.3 were very close achieving results of 91.80% 365 accuracy. Table 7 analyzes, in detail, the results of Configuration 2.1 using 20 nodes in the hidden 366 layer and a 1043 epochs training. This ANN configuration achieved great numbers above change. For 367 instance, there is a change probability of 24.4% for the desk to be used, but using the ANN we achieve 368 an 81.5% accuracy, resulting in 234.2% above change. 369
Table 7. Desk lamp forecast - Configuration 2.1 with 20 hidden neurons 370
Will not be used Will be used
Positive 354 106
False Positive 16 24
Accuracy 95.68% 81.54%
Above chance 26.56% 234.17%
Total Accuracy 92.00%
Total Precision 88.61%
Table 8. ANN results 371
Hidden
Neurons Epochs
Dataset
size
Training
ratio
Test
ratio
Evaluation
Dataset Accuracy Precision
Config. 1.1.1 10 2,056 2,500 80% 20% 500 89.80% 78.45%
Config. 1.1.1 3 3,300 2,500 80% 20% 500 89.00% 77.89%
Config. 1.1.2 20 3,496 2,500 80% 20% 500 91.00% 81.93%
Config. 1.1.2 30 1,655 2,500 80% 20% 500 91.00% 81.93%
Config. 1.1.3 10 2,327 2,500 80% 20% 500 89.58% 77.95%
Config. 1.1.3 2 48 2,500 80% 20% 500 87.78% 74.34%
Config. 1.2.1 10 569 2,500 80% 20% 500 86.80% 86.83%
Config. 1.2.1 50 780 2,500 80% 20% 500 85.80% 85.89%
Config. 1.2.2 5 1,208 2,500 80% 20% 500 88.00% 88.08%
Config. 1.2.2 10 1,136 2,500 80% 20% 500 88.40% 88.42%
Config. 1.2.3 2 5,657 2,500 80% 20% 500 77.00% 72.81%
Config. 1.2.3 3 3,244 2,500 80% 20% 500 80.20% 75.31%
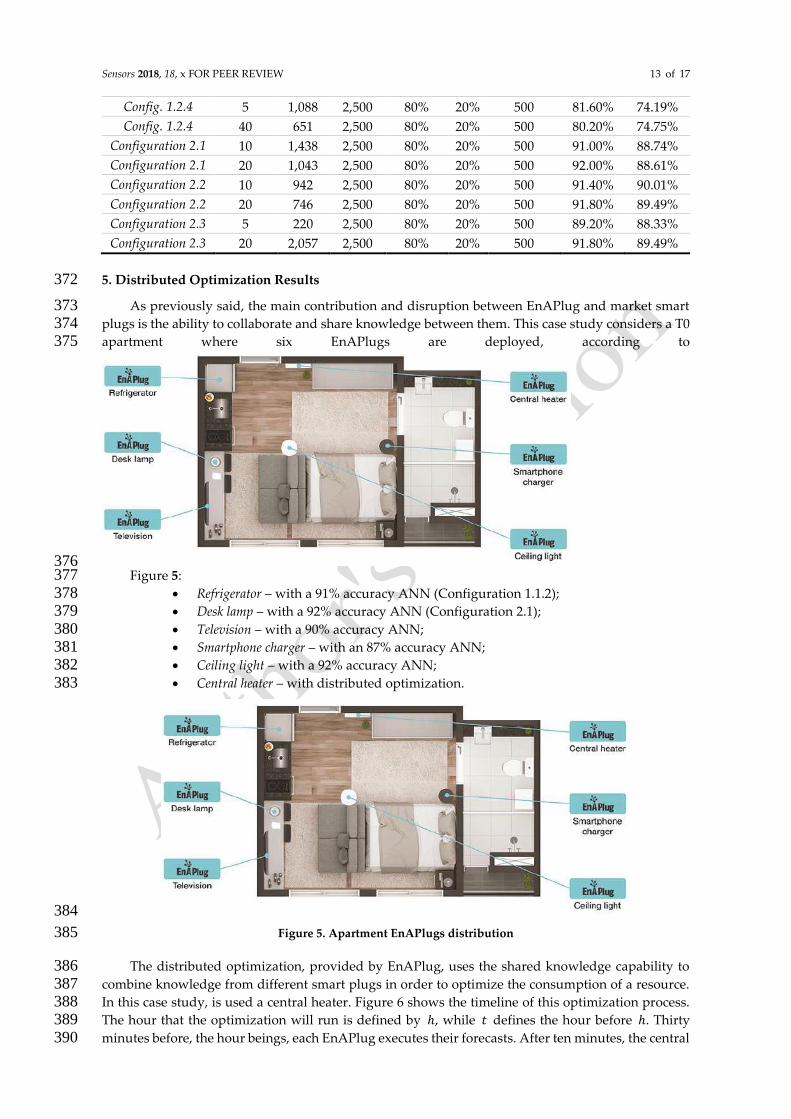
Sensors 2018, 18, x FOR PEER REVIEW 13 of 17
Config. 1.2.4 5 1,088 2,500 80% 20% 500 81.60% 74.19%
Config. 1.2.4 40 651 2,500 80% 20% 500 80.20% 74.75%
Configuration 2.1 10 1,438 2,500 80% 20% 500 91.00% 88.74%
Configuration 2.1 20 1,043 2,500 80% 20% 500 92.00% 88.61%
Configuration 2.2 10 942 2,500 80% 20% 500 91.40% 90.01%
Configuration 2.2 20 746 2,500 80% 20% 500 91.80% 89.49%
Configuration 2.3 5 220 2,500 80% 20% 500 89.20% 88.33%
Configuration 2.3 20 2,057 2,500 80% 20% 500 91.80% 89.49%
5. Distributed Optimization Results 372
As previously said, the main contribution and disruption between EnAPlug and market smart 373 plugs is the ability to collaborate and share knowledge between them. This case study considers a T0 374 apartment where six EnAPlugs are deployed, according to 375
376 Figure 5: 377
• Refrigerator – with a 91% accuracy ANN (Configuration 1.1.2); 378 • Desk lamp – with a 92% accuracy ANN (Configuration 2.1); 379 • Television – with a 90% accuracy ANN; 380 • Smartphone charger – with an 87% accuracy ANN; 381 • Ceiling light – with a 92% accuracy ANN; 382 • Central heater – with distributed optimization. 383
384
Figure 5. Apartment EnAPlugs distribution 385
The distributed optimization, provided by EnAPlug, uses the shared knowledge capability to 386 combine knowledge from different smart plugs in order to optimize the consumption of a resource. 387 In this case study, is used a central heater. Figure 6 shows the timeline of this optimization process. 388 The hour that the optimization will run is defined by ℎ, while 𝑡 defines the hour before ℎ. Thirty 389 minutes before, the hour beings, each EnAPlug executes their forecasts. After ten minutes, the central 390

Sensors 2018, 18, x FOR PEER REVIEW 14 of 17
heater’s EnAPlug uses the shared knowledge capability to request, to each EnAPlug, their 391 knowledge, and five minutes later, the central heater’s EnAPlug will control its resource – turning it 392 on if there will be users inside the house or turn it off otherwise. In this case study, the central heater 393 is turned on when a forecast has an equal or higher probability of 90% for having users. At ℎ:15, the 394 central heater’s EnAPlug requests the share knowledge once again, but this time, to ask if any 395 EnAPlug was used in the last fifteen minutes. The new request will detect, and correct false positives 396 or negatives resulted in the forecast action. 397
398
Figure 6. EnAPlug’s distributed optimization timeline 399
The use of forecast to control central heaters could improve users conform by eliminating the 400 starting time – the time between the heater is turned on and the time that the house starts increasing 401 its temperature. The heater can, in this way, be turned on ahead in time, leaving the house heated 402 before the user’s arrival. This case study uses the indicative ahead control time of fifteen minutes. 403 However, the ahead control time should be directly related to the starting time of the heater, varying 404 according to each heater. 405
Half an hour, previously the optimized hour, each EnAPlug uses its forecasts methods to 406 forecast if the user will use its controllable resource and if the controllable resource will consume 407 energy. This case study will only use the user usage forecast, unlike the previous case studies where 408 both forecasts were analyzed in detail. Table 9 shows the forecasts of each EnAPlug in this case study, 409 and the result of equation 4, for 𝐸1. 410
Table 9. EnAPlug’s results 411
Accuracy Forecast result E1
Refrigerator 91% There will be a user 91%
Desk lamp 92% There will not be users 8%
Television 90% There will be a user 90%
Smartphone charger 87% There will not be users 13%
Ceiling light 92% There will be a user 92%
When equations 3 and 4 are applied to the results of Table 9 the central heater’s EnAPlug gets 412 the following values: 413
• the probability of not having users in the next hour (equation 3): 0.058% 414 • the probability of having users in the next hour (equation 4): 99.938% 415
With a 99.94% probability of being someone home during the next hour, the central heater’s 416 EnAPlug turns on the heat of the house before the user’s arrival. This ahead action is also valid for 417 hours where the user will not be there – meaning, if the user is at home, but the central heater’s 418 EnAPlug receives the information that the user will not be there during the next hour, the heater will 419 be turned off before the end of the hour to avoid overheating in the last minutes of the hour. 420
The shared knowledge capability allows the combination of multiple knowledge, provided by 421 different EnAPlugs. This combination improves the overall forecast by minimizing the associated 422 error in the entire house. As seen, the individual certainty for 𝐸1, in each EnAPlug, results in the 423
𝑡:30 𝑡:40 𝑡:45 ℎ:00 ℎ:15
ℎ 𝑡 ℎ 𝑡 𝑡 ℎ ℎ
Each EnAPlug forecasts user presence for period between ℎ till ℎ
Central heater’s EnAPlug requests and collects shared knowledge from others
Central heater’s EnAPlug takes required actions (on/off)
Forecast correction
Sensors 2018, 18, x FOR PEER REVIEW 15 of 17
lowest values when compared to the house certainty of 99.94%. The ability to share their knowledge 424 improves the overall agent community knowledge in a local distributed system. 425
6. Discussion and Conclusion 426
The integration of smart plugs in energy management systems can serve as enablers for resource 427 monitoring and control, enabling retrofitting in today’s homes. However, this integration has clear 428 limitations regarding resource context information. 429
Contextual data can be read with sensors, and there are several approaches to where the sensors 430 should be placed and how the information should be collected. One possible approach is to use 431 market sensors for smart homes, this will enable the understanding of context regarding resources 432 and houses/buildings – on the basis that they are well placed. However, it will require the integration 433 of all these sensors and the development of a system that can read the sensors data and act on smart 434 plugs. Another possible approach is to use room sensors and remove the share knowledge ability. 435 However, this will not provide individual resource information and will generate only one forecast 436 result. The use of share knowledge allows the reduction of the forecast error inside a 437 room/house/building. The approach of EnAPlugs do not demand a cloud system and all the process 438 can be executed within the plugs, even when a cloud server is used for deep learning training, as seen 439 in this paper, the real-time data and forecasts, provided by the trained model, will not be sent to the 440 cloud, minimizing the user data exposure. 441
This paper proposes an intelligent smart plug with shared knowledge capabilities. The proposed 442 agent-based smart plug, named EnAPlug, is a context awareness smart plug that can learn some 443 aspects related to the controllable resource. The real-time context measurements and the learned 444 knowledge can be shared between other agents in a cooperative and open way, without any 445 restriction – taking the fact that all agents must belong to the same system. 446
The presented case study demonstrated the learning ability using as controllable resources: a 447 refrigerator, and a desk lamp. The learning methodology uses long short-term memory recurrent 448 neural networks. The case study also demonstrates the benefits of the shared knowledge 449 functionality, where the knowledge of five EnAPlugs are used to optimize the central heater 450 consumption according to users’ presence. The results show that the architecture of EnAPlug brings 451 clear advantages for energy management systems, mainly because of its context awareness 452 capabilities. 453
Acknowledgments: The present work has been developed under the EUREKA - ITEA2 Project M2MGrids 454 (ITEA-13011), Project SIMOCE (ANI|P2020 17690), and has received funding from FEDER Funds through 455 COMPETE program and from National Funds through FCT under the project UID/EEA/00760/2013 and 456 SFRH/BD/109248/2015. 457
References 458
1. Statista 2018. Smart Home Report 2018 - Control and Connectivity, Smart Home Report 2018 - Control and 459 Connectivity. 460
2. Daily Mail, The new smart plug that will switch off the TV if you forget, 2 January 2008, Available online: 461 https://www.dailymail.co.uk/sciencetech/article-505613/The-new-smart-plug-switch-TV-forget.html 462 (accessed on 25 September 2018). 463
3. A. Musleh, A. S.; Debouza, M.; and Farook, M. Design and implementation of smart plug: An Internet of 464 Things (IoT) approach. Proceedings of the 2017 International Conference on Electrical and Computing 465 Technologies and Applications (ICEC-TA), Ras Al Khaimah, United Arab Emirates, 21-23 November 2017; 466 pp-1-4. 467
4. Ahmed, M.; Mohamed, A.; Homod, R. Z.; Shareef, H.; Sabry, A. H.; and Bin Khalid, K. Smart plug prototype 468 for monitoring electrical appliances in Home Energy Management System. Proceedings of the 2015 IEEE 469 Student Conference on Research and Development (SCOReD), Kuala Lumpur, Malaysia, 13-14 December 470 2015; pp. 32-36. 471
5. Lukac, N.; Pavlovic, R.; Vukobrat, V.; and Teslic, N. Bluetooth Smart Plug. Proceedings of the 2015 IEEE 472 1st International Workshop on Consumer Electronics (CE WS), Novi Sad, Serbia, 11 March 2015, pp. 16-18. 473

Sensors 2018, 18, x FOR PEER REVIEW 16 of 17
6. Thongkhao Y.; and Pora, W. A low-cost Wi-Fi smart plug with on-off and Energy Metering functions. 474 Proceedings of the 2016 13th International Conference on Electrical Engineering/Electronics, Computer, 475 Telecommunications and Information Technology (ECTI-CON), Chiang Mai, Thailand, 28 June-1 July 2016, 476 pp. 1-5. 477
7. Ganu, T.; Hazra, J.; Seetharam, D. P.; Husain, S. A.; Arya, V.; Chandratilake De Silva, L.; Kunnath, R.; 478 Kalyanaraman, S. nPlug: A smart plug for alleviating peak loads. Proceedings in the 2012 Third 479 International Conference on Future Systems: Where Energy, Computing and Communication Meet (e-480 Energy), Madrid, Spain, 9-11 May 2012, pp. 1-10. 481
8. Alquthami, T.; and Meliopoulos, A. P. S. Smart House Management and Control Without Customer 482 Inconvenience. IEEE Transactions on Smart Grid 2018, 9, pp. 2553-2562, DOI: 10.1109/TSG.2016.2614708. 483
9. Lee, H.; Park, W.; and Lee, I. A Home Energy Management System for Energy-Efficient Smart Homes. 484 Proceedings of the 2014 International Conference on Computational Science and Computational 485 Intelligence, Las Vegas, Nevada, United States of America, 10-13 March 2014, pp. 142-145. 486
10. Liu, Y.; Yuen, C.; Yu, R.; Zhang, Y.; and Xie S. Queuing-Based Energy Consumption Management for 487 Heterogeneous Residential Demands in Smart Grid. IEEE Transactions on Smart Grid 2015, 7, pp. 1650-488 1659, DOI: 10.1109/TSG.2015.2432571. 489
11. Galioto, G.; Galioto, N.; Giaconia, C.; Giarré, L.; Neglia, G.; and Tinnirello, I. Smart plugs: A low cost 490 solution for programmable control of domestic loads. Proceedings of the 2014 AEIT Annual Conference - 491 From Research to Industry: The Need for a More Effective Technology Transfer (AEIT), Trieste, Italy, 18-492 19 September 2014, pp. 1-6. 493
12. Morsali, H.; Shekarabi, S.M.; Ardekani, K.; Khayamim, H.; Fereidunian, A.; Ghassemian, M.; and Lesani, 494 H. Smart plugs for building energy management systems. Proceedings of the Iranian Conference on Smart 495 Grids. Tehran, Iran, 24-25 May 2012, pp. 1-5. 496
13. Heo, S.; Park, W; and Lee, I. Energy management based on communication of smart plugs and inverter for 497 smart home systems. Proceedings of 2017 International Conference on Information and Communication 498 Technology Convergence (ICTC), Jeju, South Korea, 18-20 October 2017, pp. 810-812. 499
14. Petrović, T.; and Morikawa, H. Active sensing approach to electrical load classification by smart plug. 500 Proceedings of the 2017 IEEE Power & Energy Society Innovative Smart Grid Technologies Conference 501 (ISGT), Washington, District of Columbia, United States of America, 23-26 April 2017, pp. 1-5. 502
15. Gomes L., Sousa F., Vale Z. EnAPlug – An Environmental Awareness Plug to Test Energy Management 503 Solutions for Households. In Progress in Artificial Intelligence. EPIA 2017. Oliveira, E., Gama, J., Vale, Z., 504 Lopes Cardoso, H., Eds.; DOI: 10.1007/978-3-319-65340-2_21. 505
16. Gomes, L.; Sousa, F., Vale, Z. An Agent-Based IoT System for Intelligent Energy Monitoring in Buildings. 506 Proceedings of the 2018 IEEE 87th Vehicular Technology Conference (VTC Spring), Porto, Portugal, 3-6 507 June 2018, pp. 1-5. 508
17. Wooldridge, M. An Introduction to Multiagent Systems, 2nd ed.; Publisher: John Wiley & Sons Publishing, 509 2009. 510
18. González-Briones, A.; Prieto, J. De La Prieta, F. Herrera-Viedma, E.; Corchado, J. M. Energy Optimization 511 Using a Case-Based Reasoning Strategy. Sensors 2018, 18, DOI: 10.3390/s18030865. 512
19. Gomes, L.; Faria, P.; Vale, Z.; Silva, J. Energy Analyzer Emulator for Microgrid Implementation and 513 Demonstration and Respective Gateway. IEEE Transactions on Industry Applications 2018, Early Access, 514 DOI: 10.1109/TIA.2018.2866451. 515
20. Boudoudouh, S.; Maâroufi, M. Multi agent system solution to microgrid implementation. Sustainable Cities 516 and Society 2018, 39, pp. 252-261, DOI: 10.1016/j.scs.2018.02.020. 517
21. JAVA Agent DEvelopment Framework. Available online: http://jade.tilab.com (accessed on 25 September 518 2018). 519
22. The Foundation for Intelligent Physical Agents. Available online: http://www.fipa.org (accessed on 25 520 September 2018). 521
23. Orellana, R. Discrete Mathematics in Computer Science, 2 January 2003, Available online: 522 https://math.dartmouth.edu/archive/m19w03/public_html/Section6-2.pdf (accessed on 25 September 523 2018). 524
24. Deep Learning for Java. Available online: https://deeplearning4j.org/ (accessed on 25 September 2018). 525 25. Zhifeng, G; Zhou, K.; Zhang, X.; Yang, S. A deep learning model for short-term power load and probability 526
density forecasting. Energy 2018, 160, pp. 1186-1200, DOI: 10.1016/j.energy.2018.07.090. 527

Sensors 2018, 18, x FOR PEER REVIEW 17 of 17
26. Hu, YL; Chen, L. A nonlinear hybrid wind speed forecasting model using LSTM network, hysteretic ELM 528 and Differential Evolution algorithm. Energy Conversion and Management 2018, 173, pp. 123-142, DOI: 529 10.1016/j.enconman.2018.07.070. 530
27. Srivastava, S.; Lessmann, S. A comparative study of LSTM neural networks in forecasting day-ahead global 531 horizontal irradiance with satellite data. Solar Energy 2018, 162, pp. 232-247, DOI: 532 10.1016/j.solener.2018.01.005. 533
28. Glorot, X.; and Bengio, Y. Understanding the difficulty of training deep feedforward neural networks. 534 Proceedings of the Thirteenth International Conference on Artificial Intelligence and Statistics, Sardinia, 535 Italy, 13-15 May 2010, pp. 249-256. 536
29. Aš Mikolov, To. Statistical Language Models Based on Neural Networks, Doctoral Thesis, Brno University 537 of Technology, 2012. 538
30. Deep Learning for Java - Early Stopping. Available online: 539 https://deeplearning4j.org/docs/latest/deeplearning4j-nn-early-stopping (accessed on 25 September 2018). 540 541
© 2018 by the authors. Submitted for possible open access publication under the terms and 542 conditions of the Creative Commons Attribution (CC BY) license 543
(http://creativecommons.org/licenses/by/4.0/). 544

Luis Gomes
Indoor Real-Time Locating System comparison: Polaris vs FIND3
Authors: David Silva, Luis Gomes, Filipe Sousa, and Zita Vale
Published in: Proceedings of the Demand response approach for real-time renewable energy integration – Fourth DREAM-GO Workshop
DOI: 10.5281/zenodo.2672914
Published at: January 2019
PhD timeline: M30

www.dream-go.ipp.pt
3
Demand response approaches for real-time
renewable energy integration Fourth DREAM-GO Workshop
Institute of Engineering - Polytechnic of Porto, Porto, Portugal, January 16-17, 2019
Indoor Real-Time Locating System comparison:
Polaris vs FIND3
David Silva, Luis Gomes, Filipe Sousa, Zita Vale
IPP – Polytechnic of Porto, Porto, Portugal
Abstract
The use of real-time locating systems can be used in several fields, from security and health to building and
energy management. However, there is no consensus in what the better solution or technology is to be used in
an indoor location system. This paper presents a comparative study between a market real-time locating system
and an open source real-time locating system. The systems that will be compared are Polaris and FIND3. The
tests were performed in an office building.
Keywords: indoor location, real-time locating systems
1. Introduction
Real-Time Locating Systems (RTLS) are used to locate persons and objects inside an identified zone;
usually indoors. They can be used in multiple fields, such as security [1, 2] and health [3-5]. However, the
indoor location is not a trivial task and there are not, until now, a known technology that can, with efficiency
and effectiveness, provide high-resolution location with minimal delay. Therefore, there are several
solutions that use multiple techniques and technology to provide indoor locations.
In this paper, it will be deployed and compared two RTLS indoor solutions: Polaris [6], and FIND3 [7].
Polaris is a market solution that uses Zigbee protocol [8] and is able to identify the location of tags –
physical devices that need to be coupled to the person/object that we want to monitor. FIND3 (Framework
for Internal Navigation and Discovery 3) is an open source solution that combines Wi-Fi (IEEE 802.11) [9]
and Bluetooth [10] and enables the location of persons using the smartphone signal. This paper will present
the location results using these two systems.
After this introductory section, is presented in Section 2 the Polaris and FIND3 systems. Section 3
describes how these systems were deployed in an office building. Section 4 shows the results of the two
systems in the same office. The main conclusions are presented in Section 5.
2. Real-Time Locating Systems
In this section, it will be presented the two RTLS used system: Polaris and FIND3. The two used systems
differ from the technology that they use for indoor location but are similar in their operation and use. The
biggest operation differentiation is that Polaris provides a geographical location (i.e., with two axes) while
FIND3 only provides the identification of the zone where the user is.

Proceedings of the Fourth DREAM-GO Workshop
4
2.1 Polaris
Polaris is an RTLS, developed by the Spanish company Nebusens. This RTLS solution uses the n-Core
platform, provided by the same company, and it uses Zigbee standard in the communication between system
devices. The system uses 3 types of devices that must be used: collector, reader, and tag. The collector
device (e.g., n-Core Sirious A) is installed together with an RS-485 to Ethernet converted, it is responsible
to collect all Zigbee data, provided by the reader, and sent it to the Polaris server. The reader devices (e.g.,
n-Core Sirious D) are responsible to read the tag signals and send the signal strength to the collectors. In
readers can, it can be added a module for a relay control, this enables Polaris system to control physical
resources, such as door lockers and lights. Collectors also provide the reader functionalities and can read
tag signals. The tag devices (e.g., N-Core Sirious B or N-Core Sirious Quantum 2.0) are small devices that
should be with the person or object that we want to monitor. These tags also have the ability to send custom
signals to Polaris, each has two buttons that can be pressed by the user and their actions can be programmed
in the Polaris system.
Polaris system provides a web interface for system configuration and location monitor. Fig. 1 shows the
browser interface of Polaris. In the interface, an image is presented combining the satellite image of the
building, the building’s blueprint and the Polaris devices location; activated collectors, readers, and tags.
The real-time interface provides the location as well as information regarding the tags (i.e., if a tag button
was pressed). Polaris also provides an Application Programming Interface (API) using Simple Object
Access Protocol (SOAP). The API enables the use of Polaris by third-parties, that can query Polaris system
to check several parameters, such as tag positions.
Fig. 1: Polaris web interface.
2.2 FIND3
Framework for Internal Navigation and Discovery 3 (FIND 3) is an open source solution wish allows
locating people indoors based on Wi-Fi and Bluetooth technologies. In FIND3 there is no demand for
hardware installation, the system is able to work using only one smartphone. However, to improve the
location precision is recommended the installation of multiple devices. FIND3 uses the fingerprints of Wi-
Fi and Bluetooth wireless networks to identify locations. For this to be possible, the user must create zones
and train the system. The training is performed in a Wi-Fi and Bluetooth compatible device – can be a
smartphone – where the user must go to each zone and stay there for a while. The mobile application will
monitor Wi-Fi and Bluetooth networks signals and store this information in the server. By learning, the
system will be able to identify, according to real-time Wi-Fi and Bluetooth readings, the user’s location.
FIND3 provides a web interface where the real-time location values can be monitored. Moreover, the
system is able to perform accuracy results for each zone. Fig. 2 shows the FIND3 web interface with the
accuracy values for each zone created in the system: office N112, office N113, office N114, office N115,
and office N116. The server can be installed locally or remotely. Also, FIND3 provides an API for third-
parties to access the location data.

Demand response approaches for real-time renewable energy integration
5
Fig. 2: FIND3 web interface.
3. RTLS deployment in an Office Building
Polaris and FIND3 were partially deployed in building N of Research Group on Intelligent Engineering
and Computing for Advanced Innovation and Development (GECAD), Polytechnic of Porto (P.PORTO).
The offices used to deploy the system were N110, N111, N112, N113, N114, N115, N116 and the respective
corridor, as shown in Fig. 3, where these offices are marked with colors. For FIND3, offices N110 and
N111 were not considered.
Fig. 3: Offices where Polaris and FIND3 were deployed.
Fig. 4 shows the overall planning of Polaris deployment; where collectors are identified as pink
pentagons and readers are identified as yellow stars. However, Polaris was not deployed in the entire
building, as seen in Fig. 3. Each office has one reader and the corridor has two readers and one collector.
For FIND3 deployment, it was only used Wi-Fi networks. By default, the building has more than 20 Wi-
Fi networks provided by indoor access points and from other building’s access points. To decrease the
FIND3 error, new low-range access points were added to each room. It was used the ESP8266 module to
provide the new Wi-Fi signals.

Proceedings of the Fourth DREAM-GO Workshop
6
Fig. 4: Designated locations for the different types of Polaris devices.
The ESP8266 module has the ability to work as an access point. However, their wireless range was too
expressive; reaching the entire building. To solve this issue, the antennas were cut to decrease the Wi-Fi
signal; this enables the ESP8266 signal to stay only in the office and near the installation office. As seen in
Fig. 5, some experimental cuts were done.
Fig. 5: ESP8266 with antenna cut off.
All the devices, to support Polaris and FIND3, were placed in the locations specified in Fig. 4. There
was installed electrical boxes to accommodate each device, as can be seen in Fig. 6. In each installation,
box was included a power supply of 5 V/DC and a step-down regulator from 5 V/DC to 3.3 V/DC.
Fig. 6: Installation.
4. Location Results of Office N112
Several test positions were specified in office N112 to perform the comparative tests; these positions are
identified in Fig. 7. The central position, B1, is also the location of the Polaris reader and the FIND3
ESP8266. The positions from A1 to A4 are placed near the office’s corners. The A1-A2 wall (top of the
image) is the division from offices N112 and N111, while the A3-A4 wall (bottom of the image) is the
division from offices N112 and N113. All the measures were performed in the identified positions at a 95
centimeters height.
The 95 cm height was used to simulate a person; assuming that the Polaris tag and FIND3 smartphone
will be in the user’s pocket. The ordered of all the five positions were set clockwise and position A1 is
always located in lower left corner; to identify the lower left corner the user must be inside the office facing
its center and having his/her back pointing to office’s door.
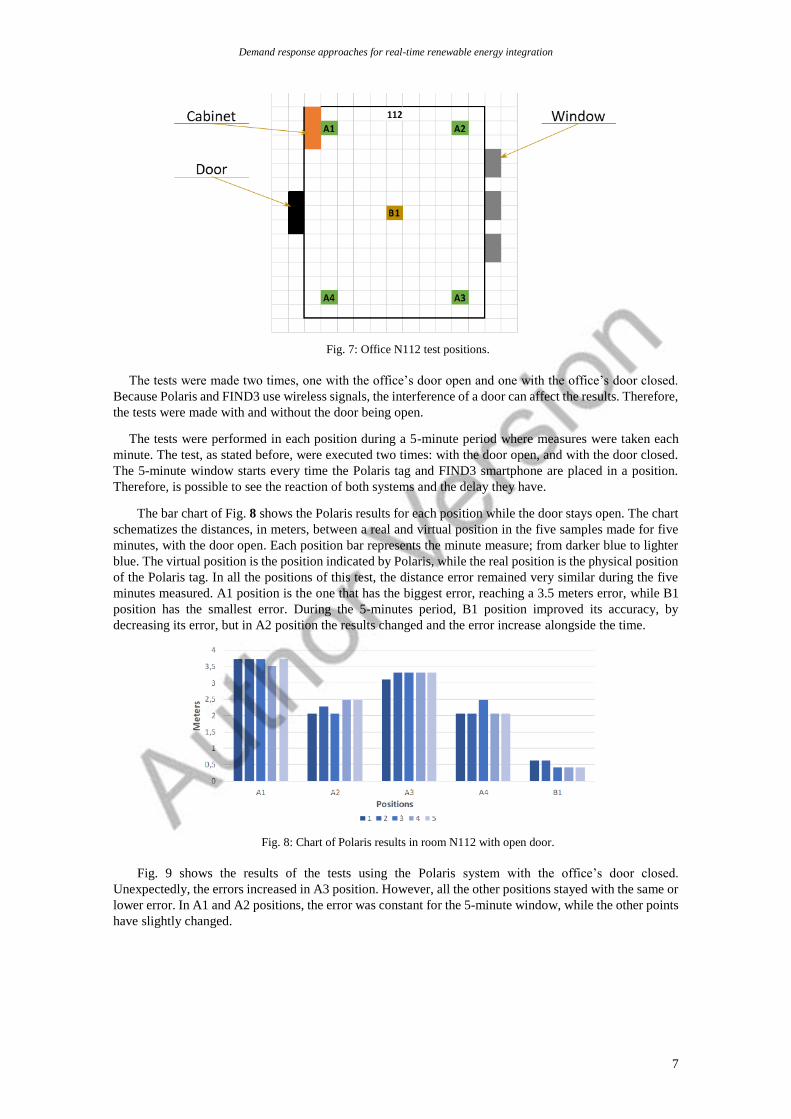
Demand response approaches for real-time renewable energy integration
7
Fig. 7: Office N112 test positions.
The tests were made two times, one with the office’s door open and one with the office’s door closed.
Because Polaris and FIND3 use wireless signals, the interference of a door can affect the results. Therefore,
the tests were made with and without the door being open.
The tests were performed in each position during a 5-minute period where measures were taken each
minute. The test, as stated before, were executed two times: with the door open, and with the door closed.
The 5-minute window starts every time the Polaris tag and FIND3 smartphone are placed in a position.
Therefore, is possible to see the reaction of both systems and the delay they have.
The bar chart of Fig. 8 shows the Polaris results for each position while the door stays open. The chart
schematizes the distances, in meters, between a real and virtual position in the five samples made for five
minutes, with the door open. Each position bar represents the minute measure; from darker blue to lighter
blue. The virtual position is the position indicated by Polaris, while the real position is the physical position
of the Polaris tag. In all the positions of this test, the distance error remained very similar during the five
minutes measured. A1 position is the one that has the biggest error, reaching a 3.5 meters error, while B1
position has the smallest error. During the 5-minutes period, B1 position improved its accuracy, by
decreasing its error, but in A2 position the results changed and the error increase alongside the time.
Fig. 8: Chart of Polaris results in room N112 with open door.
Fig. 9 shows the results of the tests using the Polaris system with the office’s door closed.
Unexpectedly, the errors increased in A3 position. However, all the other positions stayed with the same or
lower error. In A1 and A2 positions, the error was constant for the 5-minute window, while the other points
have slightly changed.

Proceedings of the Fourth DREAM-GO Workshop
8
Fig. 9: Chart of Polaris results in room N112 with closed door.
FIND3 did not provide a precise location of the smartphone. Instead, the system identifies, by
probability, the zone where the smartphone is. Fig. 10 shows the 5 samples measured for each position
when the door was open. The colors identify the probability of the smartphone being in each of the
offices/zones. With this representation, it is possible to see that in the 1st and 2nd minutes there is little
density of darker colors aligned with 112 (middle of the chart). But from the 3rd minute on, the darker
central color zone becomes more stable, even at position A2 (represented in Fig. 7); which is the one that
had the smallest accuracy. This means that initially, the office N112 is not well recognized in some of the
positions tested with the door open. However, the accuracy of the system, in this room, began to improve
significantly in the final minutes.
Fig. 10: Chart of FIND3 results in office N112 with open door.
In the closed-door scenario, the tests were also satisfactory as shown in Fig. 11. With the door closed,
the system reacted faster and even from the first minute is visible a darker central color indicating that the
system knew the smartphone was in office N112. However, similar to the previous test, the A2 position
presents the highest error.
Fig. 11: Chart of FIND3 results in Office N112 with closed door.
114
113
112
115
116
1 1 1 1 1 2 2 2 2 2 3 3 3 3 3 4 4 4 4 4 5 5 5 5 5
A1 A2 A3 A4 B1 A1 A2 A3 A4 B1 A1 A2 A3 A4 B1 A1 A2 A3 A4 B1 A1 A2 A3 A4 B1
Off
ice
s
Position / Sample
0%-20% 20%-40% 40%-60% 60%-80% 80%-100%
114
113
112
115
116
1 1 1 1 1 2 2 2 2 2 3 3 3 3 3 4 4 4 4 4 5 5 5 5 5
A1 A2 A3 A4 B1 A1 A2 A3 A4 B1 A1 A2 A3 A4 B1 A1 A2 A3 A4 B1 A1 A2 A3 A4 B1
Off
ice
s
Position / Sample
0%-20% 20%-40% 40%-60% 60%-80% 80%-100%

Demand response approaches for real-time renewable energy integration
9
5. Conclusions
This paper presents the analyses of two real-time locating systems: Polaris and FIND3. To provide
indoor location, Polaris uses Zigbee wireless signals while FIN3 uses Wi-Fi and Bluetooth wireless signals.
This paper describes the deployment of these two systems and their performance in the same scenario.
Polaris has the advantage ability to perform geographical locations, using two axes, while FIND3 is only
able to identify the zone where the person/object is. However, the use of Polaris demands the installation
of dedicated hardware and demands that the person/object carries one Polaris tag. Another advantage of
FIND3 is the ability to continuously learn; enabling the user to teach the system about new zones or simply
retrain existing zones to improve the system location accuracy.
Both systems have advantages and disadvantages, the decision of which one is better should depend on
the need and goal of the user. To identify if and who is inside an office, FIND3 should be considered the
best option because it does not demand the installation of hardware and uses the users’ smartphones.
However, if a precise location inside the building is needed, Polaris is the only option; between these two.
Acknowledgments. The present work was done and funded in the scope of the following projects: H2020
DREAM-GO Project (Marie Sklodowska-Curie grant agreement No 641794), from FEDER Funds through
COMPETE program and from National Funds through FCT under the project UID/EEA/00760/2019 and
SFRH/BD/109248/2015.
References
[1] S. M. H. Sharhan and S. Zickau, "Indoor mapping for location-based policy tooling using Bluetooth Low
Energy beacons," 2015 IEEE 11th International Conference on Wireless and Mobile Computing, Networking
and Communications (WiMob), Abu Dhabi, 2015, pp. 28-36. doi: 10.1109/WiMOB.2015.7347937
[2] K. Zhang, C. Shen, Q. Gao and H. Wang, "Research on similarity metric distance algorithm for indoor and
outdoor firefighting personnel precision wireless location system based on vague set on UWB," 2017 IEEE
17th International Conference on Communication Technology (ICCT), Chengdu, 2017, pp. 1162-1165.doi:
10.1109/ICCT.2017.8359817
[3] A. R. Jiménez, F. Seco, P. Peltola and M. Espinilla, "Location of Persons Using Binary Sensors and BLE
Beacons for Ambient Assitive Living," 2018 International Conference on Indoor Positioning and Indoor
Navigation (IPIN), Nantes, 2018, pp. 206-212. doi: 10.1109/IPIN.2018.8533714
[4] D. Kelly, S. McLoone, T. Dishongh, M. McGrath and J. Behan, "Single access point location tracking for in-
home health monitoring," 2008 5th Workshop on Positioning, Navigation and Communication, Hannover,
2008, pp. 23-29. doi: 10.1109/WPNC.2008.4510353
[5] S. de Miguel-Bilbao, J. Roldán, J. García, F. López, P. García-Sagredo and V. Ramos, "Comparative analysis
of indoor location technologies for monitoring of elderly," 2013 IEEE 15th International Conference on e-
Health Networking, Applications and Services (Healthcom 2013), Lisbon, 2013, pp. 320-323. doi:
10.1109/HealthCom.2013.6720693
[6] An award-winning Real-time Locating System (RTLS), [online]
http://nebusens.com/index.php/en/products/polaris (accessed January 05, 2019).
[7] The framework for internal navigation and discovery, [online] https://www.internalpositioning.com/ (accessed
January 05, 2019)
[8] Zigbee Allliance, [online] https://www.zigbee.org/ (accesses January 05, 2019)
[9] The working group for WLAN standards, [online] http://www.ieee802.org/11/ (accesses January 05, 2019)
[10] Bluetooth SIG, [online] https://www.bluetooth.com/ (accesses January 05, 2019)

Luis Gomes
Energy Analyzer Emulator for Microgrid Implementation and Demonstration and
Respective Gateway
Authors: Luis Gomes, Pedro Faria, Zita Vale, and Jorge Silva
Published in: EEE Transactions on Industry Applications (IF: 3.347)
DOI: 10.1109/TIA.2018.2866451
Published at: January 2019
PhD timeline: M30

Energy Analyzer Emulator for Microgrid Implementation and Demonstration and Respective Gateway
Luis Gomes, Pedro Faria, Zita Vale, Jorge Silva GECAD - Research Group on Intelligent Engineering and Computing for Advanced Innovation and Development
Polytechnic of Porto (IPP), Porto, Portugal
[email protected], [email protected], [email protected], [email protected]
Abstract — Microgrids have been implemented all over the world in the last years. Several benefits are known for consumers and power grid management. As part of microgrids, the local energy management of renewable energy sources can prevent energy loses and support microgrid operation in islanded modes. Besides the success of the current microgrid implementations, improved components and models are required. This paper proposes two tools that support the implementation of microgrid demonstrations, namely at laboratorial premises. Improved microgrid models implementation enables the development, test and validation of new energy management methodologies. The first proposed tool is a wireless gateway for energy monitoring and control. To implement complete microgrids, the second tool proposes an energy analyzer emulator, bringing unavailable loads to the microgrid, such as, residential loads usually unavailable in R&D centers. A real laboratory microgrid implementation using the proposed gateway and the proposed energy analyzer emulator is presented and discussed, demonstrating the actual capabilities of the developed tools.
Index Terms — communication protocols, gateway, energy analyzer emulator, load control, microgrids.
I. INTRODUCTION The integration of decentralized renewable energy sources and energy management systems are some of the applications enabled by smart grids [1].
The implementation of microgrids can enable the decentralization of energy management systems. “Microgrids are electricity distribution systems containing loads and distributed energy resources, (such as distributed generators, storage devices, or controllable loads) that can be operated in a controlled, coordinated way either while connected to the main power network or while islanded” [2]. The microgrid dissemination can benefit consumers and smart grid [3]. However, new improvements can be made while providing intelligence to the energy management of a microgrid, such as, improving the energy management awareness, consumers’ comfort, reaction to the market and reaction to grid failures.
Microgrids are a reality in some specific cases around the world. The majority of these implementations are result of necessity (i.e. island and isolated communities) and/or funded projects (i.e. research and military projects). As will be seen in the next section, of this paper, some implementations of
microgrids were extremely successful, proving their benefits and advantages [4].
Besides the previous successes, new methodologies can be studied and tested to improve the energy management of microgrids, making it into a more intelligent system. This will only be possible with adequate tools to support the development, test and validation of new methodologies [5]. For this reason it is necessary to provide adequate tools for microgrids implementation and demonstration.
The monitoring and control capabilities, in a microgrid, are essential for their success, without them the implementation of microgrids is impossible. The use of gateways enables the capability of monitoring and control loads in a microgrid environment. These gateways can be programmable logic controllers [6], smart meters [7] or dedicated hardware developed for microgrids [8].
This paper is based on the conference paper of [9], where is proposed a wireless gateway that enables the versatile implementation of microgrids. The proposed gateway is able to work with market monitoring solutions and market control solutions. The wireless communication provided by the gateway can use one of the following wireless protocols: IEEE 802.11 for TCP/IP; Dash7; and ZigBee. The simpler architecture of the gateway enables its use by R&D centers, without the need of expert staff.
The novelty of this paper, beyond the conference paper of [9], is the proposal of an energy analyzer emulator that enables the integration of loads that are not available in the microgrid. The study of residential microgrids is different from the study of a university campus microgrid. Some loads are required to test residential microgrids. The proposed energy analyzer emulator provides a feasible an open source solution that emulates several load types.
The paper presents a microgrid implementation using the proposed gateway and the proposed energy analyzer emulator. The microgrid implementation combines real loads with emulated loads, both of these types can also be controllable or uncontrollable. The combination of the proposed gateways and the proposed energy analyzer emulator provides a perfect combination for microgrid demonstrations (residential and nonresidential). The case study will show the monitoring capabilities of the gateway and the control capabilities using a demand response event which impacts the air-conditioners. The energy analyzer emulator is used to emulate loads that are treated, by the system, as real loads, proving the integration capability of the emulator in microgrid solutions.
The present work was done and funded in the scope of the following projects: H2020 DREAM-GO Project (Marie Sklodowska-Curie grant agreement No 641794); AVIGAE Project (P2020 - 3401), and UID/EEA/00760/2013 and SFRH/BD/109248/2015 funded by FEDER Funds through COMPETE program and by National Funds through FCT
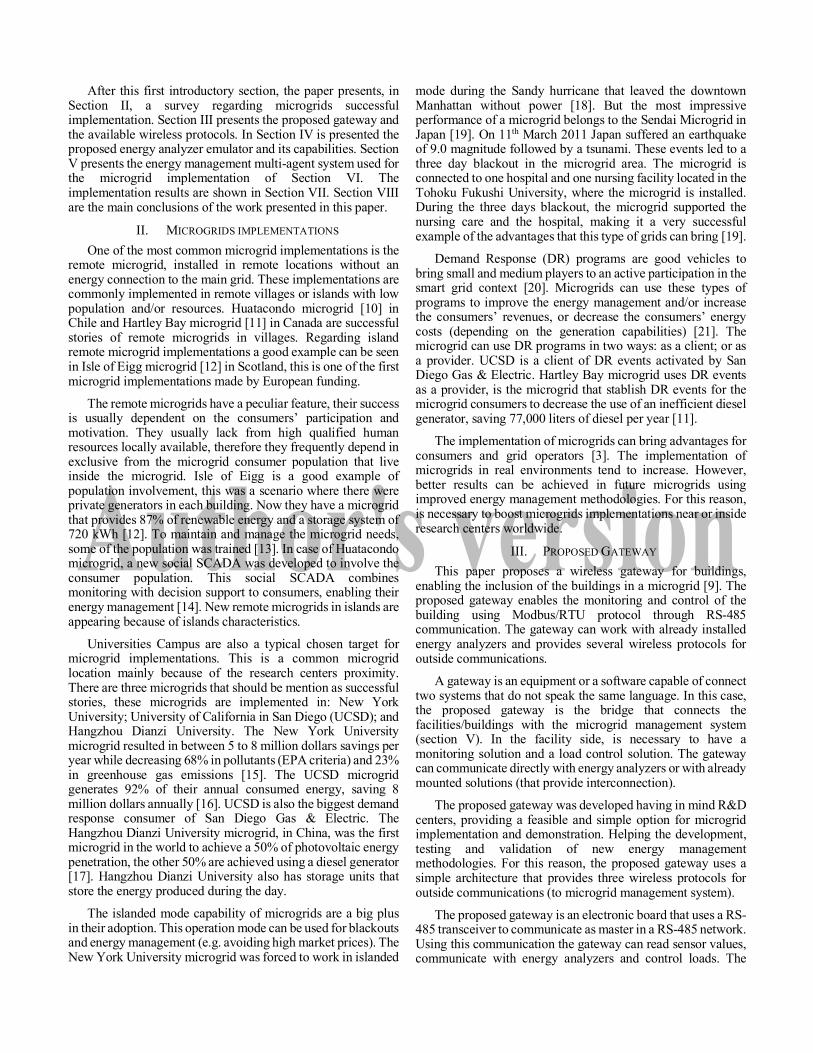
After this first introductory section, the paper presents, in Section II, a survey regarding microgrids successful implementation. Section III presents the proposed gateway and the available wireless protocols. In Section IV is presented the proposed energy analyzer emulator and its capabilities. Section V presents the energy management multi-agent system used for the microgrid implementation of Section VI. The implementation results are shown in Section VII. Section VIII are the main conclusions of the work presented in this paper.
II. MICROGRIDS IMPLEMENTATIONS One of the most common microgrid implementations is the
remote microgrid, installed in remote locations without an energy connection to the main grid. These implementations are commonly implemented in remote villages or islands with low population and/or resources. Huatacondo microgrid [10] in Chile and Hartley Bay microgrid [11] in Canada are successful stories of remote microgrids in villages. Regarding island remote microgrid implementations a good example can be seen in Isle of Eigg microgrid [12] in Scotland, this is one of the first microgrid implementations made by European funding.
The remote microgrids have a peculiar feature, their success is usually dependent on the consumers’ participation and motivation. They usually lack from high qualified human resources locally available, therefore they frequently depend in exclusive from the microgrid consumer population that live inside the microgrid. Isle of Eigg is a good example of population involvement, this was a scenario where there were private generators in each building. Now they have a microgrid that provides 87% of renewable energy and a storage system of 720 kWh [12]. To maintain and manage the microgrid needs, some of the population was trained [13]. In case of Huatacondo microgrid, a new social SCADA was developed to involve the consumer population. This social SCADA combines monitoring with decision support to consumers, enabling their energy management [14]. New remote microgrids in islands are appearing because of islands characteristics.
Universities Campus are also a typical chosen target for microgrid implementations. This is a common microgrid location mainly because of the research centers proximity. There are three microgrids that should be mention as successful stories, these microgrids are implemented in: New York University; University of California in San Diego (UCSD); and Hangzhou Dianzi University. The New York University microgrid resulted in between 5 to 8 million dollars savings per year while decreasing 68% in pollutants (EPA criteria) and 23% in greenhouse gas emissions [15]. The UCSD microgrid generates 92% of their annual consumed energy, saving 8 million dollars annually [16]. UCSD is also the biggest demand response consumer of San Diego Gas & Electric. The Hangzhou Dianzi University microgrid, in China, was the first microgrid in the world to achieve a 50% of photovoltaic energy penetration, the other 50% are achieved using a diesel generator [17]. Hangzhou Dianzi University also has storage units that store the energy produced during the day.
The islanded mode capability of microgrids are a big plus in their adoption. This operation mode can be used for blackouts and energy management (e.g. avoiding high market prices). The New York University microgrid was forced to work in islanded
mode during the Sandy hurricane that leaved the downtown Manhattan without power [18]. But the most impressive performance of a microgrid belongs to the Sendai Microgrid in Japan [19]. On 11th March 2011 Japan suffered an earthquake of 9.0 magnitude followed by a tsunami. These events led to a three day blackout in the microgrid area. The microgrid is connected to one hospital and one nursing facility located in the Tohoku Fukushi University, where the microgrid is installed. During the three days blackout, the microgrid supported the nursing care and the hospital, making it a very successful example of the advantages that this type of grids can bring [19].
Demand Response (DR) programs are good vehicles to bring small and medium players to an active participation in the smart grid context [20]. Microgrids can use these types of programs to improve the energy management and/or increase the consumers’ revenues, or decrease the consumers’ energy costs (depending on the generation capabilities) [21]. The microgrid can use DR programs in two ways: as a client; or as a provider. UCSD is a client of DR events activated by San Diego Gas & Electric. Hartley Bay microgrid uses DR events as a provider, is the microgrid that stablish DR events for the microgrid consumers to decrease the use of an inefficient diesel generator, saving 77,000 liters of diesel per year [11].
The implementation of microgrids can bring advantages for consumers and grid operators [3]. The implementation of microgrids in real environments tend to increase. However, better results can be achieved in future microgrids using improved energy management methodologies. For this reason, is necessary to boost microgrids implementations near or inside research centers worldwide.
III. PROPOSED GATEWAY This paper proposes a wireless gateway for buildings,
enabling the inclusion of the buildings in a microgrid [9]. The proposed gateway enables the monitoring and control of the building using Modbus/RTU protocol through RS-485 communication. The gateway can work with already installed energy analyzers and provides several wireless protocols for outside communications.
A gateway is an equipment or a software capable of connect two systems that do not speak the same language. In this case, the proposed gateway is the bridge that connects the facilities/buildings with the microgrid management system (section V). In the facility side, is necessary to have a monitoring solution and a load control solution. The gateway can communicate directly with energy analyzers or with already mounted solutions (that provide interconnection).
The proposed gateway was developed having in mind R&D centers, providing a feasible and simple option for microgrid implementation and demonstration. Helping the development, testing and validation of new energy management methodologies. For this reason, the proposed gateway uses a simple architecture that provides three wireless protocols for outside communications (to microgrid management system).
The proposed gateway is an electronic board that uses a RS-485 transceiver to communicate as master in a RS-485 network. Using this communication the gateway can read sensor values, communicate with energy analyzers and control loads. The

gateway also provides a sniffing operation mode for RS-485 networks that cannot allow the integration of a new master.
Using Modbus/RTU, through RS-485, enables the communication with the majority of energy analyzers on the market, as well as the majority of invertors on the market (AC/DC and DC/DC). The gateway enables the monitoring and control of loads and facilities, and builds a connection between them and microgrid management system. The microgrid uses SOICAM (Section V) for energy management [9].
For the outside communications, the gateway uses one of the following wireless protocols: TCP/IP (Wi-Fi), Dash7 or Zigbee. At this moment, the gateway do not allow the use of more than one wireless protocol at a time. However, it allows the change of protocols, enabling the test of different wireless protocols in the same system. Fig. 1 shows the block diagram used in the proposed gateway as well as the gateway implementation using ZigBee protocol.
Fig. 1. Gateway diagram and implementation
The implementation in Fig. 1 uses ZigBee protocol. In order to use another protocol the XBee module, mounted on the socket, needs to be replaced. The three main blocks present are: RS-485 Transceiver; Control Unit; and Wireless Transceiver.
RS-485 Transceiver enables the Control Unit to transmit and receive RS-485 messages. The black line connected to this module is the RS-485 communication while the top blue arrow is serial communication and a digital pin. The digital pin is necessary to activate the Driver Enable (DE) pin of MAX485 that enables the writing of messages in the RS-485 network. In this case, the DE pin is connected to Receiver Enable pin to disable the reading during the writing period. Meaning that Control Unit will not read what it’s writing.
Control Unit is a microcontroller that provides two serial port communications and enough processing power to deal with both communication ports. For demonstration of this paper was chosen a PIC18F25J11 that operates in 48 MHz (12MIPS) and provides 28 pins and 32 Kbytes of program memory.
For Wireless Transceiver is used one of three modules: RV-XV WiFly, for Wi-Fi TCP/IP; WizziMote, for Dash7; and XBee, for ZigBee. The module is chosen according to the protocol used in the microgrid implementation. Because each module uses serial communication, the integration of modules is the same, changing only the programmed communication functions inside Control Unit.
The use of other communication protocols, in the proposed gateway, is possible. The application of new communication protocols is straightforward in cases where the hardware
module uses serial communication. If the aim is to use a protocol that do not have a module with serial communication, then some changes need to be done in the gateway. The application of high speed protocols, such as IEC-61850, are not possible in the gateway because of hardware limitations. To overpass this issue a new microcontroller should be chosen.
A. RS-485 interface The RS-485 is commonly used in power energy equipment,
such as, energy analyzers, Programmable Logic Controllers (PLC), energy inverters and motor drivers.
RS-485 is a differential communication that needs 2 wires, for half-duplex, or 4 wires, for full-duplex. The maximum distance allowed is 1,200 meters, using several nodes along the network. RS-485 works as a master-slave communication allowing a total of 32 nodes in a single network. Slaves should only transmit data after master requests.
The proposed gateway uses RS-485 to communicate using Modbus/RTU protocol. This is a common protocol used in power energy systems. The protocol enables the master to perform readings and writings on memory registers in slaves’ memory. Each slave has their own unique identifier (ID). In order to read and write in a slave, the master needs to know the salve ID and the available registers. Each register has a position, type and size that are needed to build a Modbus request.
The proposed gateway works as a master or a sniffer in a RS-485 network. The sniffer is a slave that listens everything in the network. This is useful if the RS-485 network has already a master asking for monitoring requests. In this case the gateway should be a slave and operate in sniffer mode.
The RS-485 is an asynchronous communication protocol that can generate some errors, if not properly used [9]. In order to avoid collisions and data loss, is recommended to test the network response to several interval periods and speeds. This problem can be visible especially where is used hand-made solutions integrated with market solution (that usually work with short interval requests).
B. TCP/IP Protocol by IEEE 802.11 Standard This is one of the three external protocols allowed in the
proposed gateway. IEEE 802.11 is a wireless communication standard that uses TCP/IP protocol [22]. The gateway uses RV-XV WiFly module which is a certified Wi-Fi solution that provides a serial communication.
RV-XV module is based on RN-171 Wi-Fi module that incorporates 802.11 b/g radio with a 32 bit processor and a real-time clock. The module is composed by eight general purpose digital I/O and three analog sensor interfaces, however, these pins will not be used in the gateway. The communication between the module and the Control Unit uses UART, the module can handle baud rates until 460 kbps. This communication enables the Wi-Fi configuration and usage.
C. Dash7 protocol Dash7 is a new protocol that tries to overcome some of the
limitations that exists in the majority of the wireless communication protocols [23]. This protocol was developed for low consumption and to be able to operate underwater and

penetrate in heavy materials, such as, concrete walls and metallic objects. The operation of this protocol is 433 MHz. Each node of Dash7 network should be a member of one of the following classes: blinker; endpoint; gateway; and subcontroller. The topologies allowed are similar to ZigBee networks (Fig. 2), making it possible: star topology; tree topology; and mesh topology.
The module used in the proposed gateway is WizziMote, developed by Wizzilab. The modules integrate a TI CC430F5137 and an antenna matching circuit for the 433 MHz. The module has their own microcontroller with eight GPIOs and six ADIOs. For the proposed gateway, the module is used as a bridge between UART and Dash7, enabling the direct sending of data using the serial communication of Control Unit. There are three baud rates available: 9,600 bits/s; 57,600 bits/s; and 115,200 bits/s.
D. Zigbee protocol ZigBee is a low consumption wireless protocol that operates
with 2.4 GHz radio signals in most of the countries [24]. The game changing of ZigBee is the low consumption feature with the sleep capabilities, range distance, mesh topology and sensor and actuators connectivity without the need of microcontrollers. Besides mesh topology, ZigBee offers star and tree topologies (Fig. 2). In ZigBee protocol are three node types: end-devices; routers; and coordinators. Each node of the network should be one of those types. For a ZigBee network a single coordinator is mandatory. The maximum number of nodes allowed is 65,535 in a single network. In a ZigBee network, the end-devices can have cyclical sleep, while the coordinator and routers are always awake.
Fig. 2. ZigBee topologies
The module used for the proposed gateway is XBee Series 2 Pro developed by Digi. This module operates with a 2.4 GHz radio signal. Other modules can be used for gateway implementations, XBee Series 2 Pro was chosen because of its range distance (more than 1 kilometer). The module maximum rate is 250 Kbits/s. The modules have several pins that can be used directly by ZigBee protocol. However, for the proposed gateway, it will only be used the UART communication. The configuration of the module is done offline (before gateway installation). After configuration, the module works as a bridge between serial communication and ZigBee wireless signal, enabling the direct sending of data using Control Unit.
IV. PROPOSED ENERGY ANALYZER EMULATOR The integration of gateways enables the inclusion of
retrofitting facilities and new facilities in microgrids. However, it does not solve the problem of not having access to residential resources inside R&D centers. The access of residential electrical resources is necessary if the goal is the study of residential microgrids, otherwise is impossible to conduct a quality study and work. To solve this issue, is proposed an energy analyzer emulator named Virtual to Reality (V2R).
V2R is an energy analyzer emulator capable of preforming several types of emulations. Being an emulator, V2R can replace energy analyzers in a real or simulated microgrids [25]. V2R do not provides resources simulation because of hardware limitations and the need to work in real-time. However, V2R allows the integration of simulated resources using the real-time simulator OPAL-RT [26]. The use of a real-time simulator enables hardware-in-the-loop and power-hardware-in-the-loop to improve simulations [27].
The hardware architecture of V2R is composed by components and modules available on the market (Fig. 3). Generic modules where used to simplify the building of new V2R in research centers without an electronic background. The modules used are:
• Arduino Mega – this is the processing module where the code is located, the microcontroller is used to interact with the other modules and components and to process the energy analyzer emulation;
• Ethernet Shield – this module is necessary for V2R configuration, remote monitoring and remote control, it enables Ethernet connectivity and has a SD card reader;
• Real Time Clock (RTC) – this module is important for emulations, giving precision to the emulation, the clock set is done during the emulation configuration process, in background, without user’s interaction;
• MAX485 – this is the only component that must be built for V2R (the RS-485 communication circuit can be found in component datasheet), although, some modules are available on the market and can also be used, this component is the enabler of RS-485 communication;
• LCD Shield – this module is responsible for user interaction on location, presents the emulation values and menu (similar to a normal energy analyzer), this module also allows the control over the emulation, the user can turn on/off the emulation loads using the module switches.
Fig. 3. V2R modules
Software architecture of V2R is shown in Fig. 4. V2R uses an Atmega2560 microcontroller incapable of processing multi-

thread. However, the presented software architecture uses blocks to simplify the visualization of the used software.
Analyzing Fig. 4 from bottom to top, the RS-485 block is responsible to read and write Modbus/RTU messages using the RS-485 communication provided by the MAX485. The Modbus/RTU block is able to interpret and generate Modbus/RTU messages. The Data Storage block uses the V2R SD card to store the emulation configuration and monitoring values (if applied). The Clock Synchronization block manages the RTC of V2R, providing precise information during emulations. The Multi-level Emulation block enables the use of multiple emulations using the same V2R, it mimics an energy analyzer that measures several loads/resources. The TCP/IP block enables the Ethernet connection, mandatory for initial configuration and optional for remote monitoring, remote control and store emulation values. Between Multi-level Emulation and TCP/IP blocks are the blocks responsible for the emulations. These emulations can represent a consumption load or a generation resource:
• Graph Emulation – this emulation provides a resource that follows a profile, inserted by the user during the emulation configuration, the user is free to put the readings time period he/she wants (they just need to be the same during time), this can be a good option to emulate refrigerators;
• Discrete Emulation – discrete emulations are resources that can only be turned on or turned off, the control can be made locally (using the V2R switches in the LCD Shield) and remotely (using the Ethernet connection), to configure this type of emulation the user must configure the ‘on consumption’ and ‘off consumption’, this emulation can be used to emulate lamps;
• Variable Emulation – this emulation enables the emulation of variable resources, similar do Discrete Emulation but dimmable, this resources can be used to emulate heaters with more than one state;
• Contextual Emulation – some loads follows profiles of consumption when they are turned on, this emulation allows the user to define a run profile consumption to a given load, the profile of consumption starts when the load is putted to on and stops when the load is turned off or when the profile ends, this emulation can be used for washing machines;
• OPAL-RT Emulation – the capability of using resource simulation is important to produce realistic scenarios of resources that cannot be used in another way, V2R can be connected to OPAL-RT to bring the simulated measuring values to the real world using V2R emulator, this emulation type can be used for wind generators;
• Mirror Emulation – this emulation uses real resources located outside our working place, this type of emulation builds a Modbus/TCP connection (in the top block of Fig. 4) between V2R and a remote resource, the V2R will read the values through Modbus/TCP and repeat them using Modbus/RTU, this is a good option if is needed to include a facility that have a monitoring system already installed but is far from the microgrid’s location.
Besides the possible emulation types, Graph Emulation, OPAL-RT Emulation and Mirror Emulation can be set as controllable or uncontrollable. Making it a total of 9 possible
emulation types. V2R also allows each emulation to work with random values in the voltage to mimic the voltage variations present in real electricity grids.
Fig. 4. V2R software architecture
V2R is an open source solution for users with a need to simulate and emulate modules or entire microgrids. This is an ongoing project with constant updates. To know more, or to request the programming codes or schemas, feel free to contact the authors. For the configuration, of V2R, to be possible is necessary to have a PHP server in user side. This server must be populated with the server files available for V2R. The server can communicate to V2R devices. A SQL Server instance can also be installed in user side to store emulation values.
Fig. 5 shows the configuration webpage of a Graph Emulation, where the user inserts the resource profile. For the configuration proposes, the user must indicate V2R IP address, if the emulation should use a random value in the voltage, the number of deviation to use in random values, and which start point to use: beginning of graph, ignoring the timestamp; or in real-time, where the emulation follows the profile timestamps. After configuration and RS-485 connection, V2R is ready.
Fig. 5. V2R configuration webpage
V. SOICAM MULTI-AGENT SYSTEM A microgrid implementation should have an energy
management system. The main goal of the proposed gateway and the proposed energy analyzer emulator is to provide the tolls for researchers to test and validate energy management methodologies in their own microgrids that can be implemented in their facilities and laboratories.
The use of multi-agent systems for microgrid energy management have a clear fit [28]-[30]. Using a multi-agent system we provide autonomy and independency for each

microgrid player.For this paper it was used a variation of MASGriP [31] named SOICAM [9], [32] (Figure 6). SOICAM is a multi-agent system that operates in real facilities in GECAD, our R&D center. For this paper, SOICAM has a total of five agents:
• Microgrid Operator agent – which controls the entire microgrid, this is a virtual agent without a facility dependency;
• Building I agent – this agent represents building I of GECAD, this is a consumption building (12 kW peak) without generation and load control. Building I is composed by 1 classroom, 1 server room, 4 offices, 1 meeting room and 2 common areas; this building is daily used by 20 researchers and near 40 students. This building uses the proposed gateway (Section VI);
• Building F agent – this agent represents building F where it is a wind generator (1 kW), PV panels (2 tracking panels of 200 W each, plus 3 static panel of 200 W each) and a storage system (2 packs of batteries of 24 V and 190 Ah). Building F only has distributed generation without consumption and control. This building uses the proposed gateway (Section VI);
• Building N agent – this agent represents building N, a building with consumption (8 kW peak) and PV generation (7.5 kW), in this building the air-conditioners are controllable. Building N is composed by 7 offices, 1 server room, 1 meeting room, 1 kitchen and 1 common area; this building is daily used by 22 researchers. This building uses the proposed gateway (Section VI);
• Emulated Building agent – this is a new agent added for this work, the agent will be emulated using V2R emulators, the agent has some uncontrollable consumption (2.5 kW peak) and controllable air-conditioners (500 W) This building uses the proposed gateway (Section VI) connected to four V2R device (Section IV).
SOICAM agents are developed in Java using JADE framework. The agents’ communications are compliant with FIPA specifications [33]. By default, the microgrid agent sent, each second, two broadcast messages for the other agents: one asking the total consumption; and other asking the total generation. Besides these, standard and default communications, the agents are prepared to response communications regarding demand response programs, such as, real-time price. In MASGriP, and therefore SOICAM, the energy management algorithms, such as, forecasting and optimization, are outside the agents. The agents can use these algorithms using web services (yellow circles of Figure 6). Web services were chosen in order to facility the integration of new algorithms, once the algorithm is in the web service all the agents can see it and use it.
The agents communicate with the proposed gateways using ZigBee protocol. The ZigBee coordinator is placed in a XBee Explore USB module that when connected to the computer creates a COM port that enables serial communication. The agents, developed in Java, use this serial communication to receive and send data from the gateways [34]. The V2Rs used in Emulated Building are also connected to a gateway and not directly connected to an agent.
Figure 6. SOICAM MAS architecture
VI. MICROGRID IMPLEMENTATION The proposed gateways were installed in three buildings of
GECAD research center, located in Institute of Engineering -Polytechnic of Porto (ISEP/IPP). These buildings, used by research teams, were not prepared to accommodate an energy management system. In order to implement a microgrid in these buildings, a total of eleven energy analyzers (with controllable auxiliary ports) and two PLCs were installed [9], [35]. At this present moment, there is no direct power lines between those buildings. In this paper, SOICAM will be used to create a microgrid between physical Building I, Building F and Building N (the physical buildings of GECAD - Fig. 7) and an Emulated Building (that will use V2R devices – Section IV).
Fig. 7. Microgrid implementation gateways and layers
SOICAM system was used for the representation of the implemented microgrid. For this case study were used a total of five agents in SOICAM: one microgrid operational agent, which is responsible for the microgrid collaboration and microgrid outside communications (e.g. other microgrids connections and market connection); and four facility/building representative agents, representing each building that were integrated in this case study. A total of four gateways were used, one for each building. Each representative agent communicates
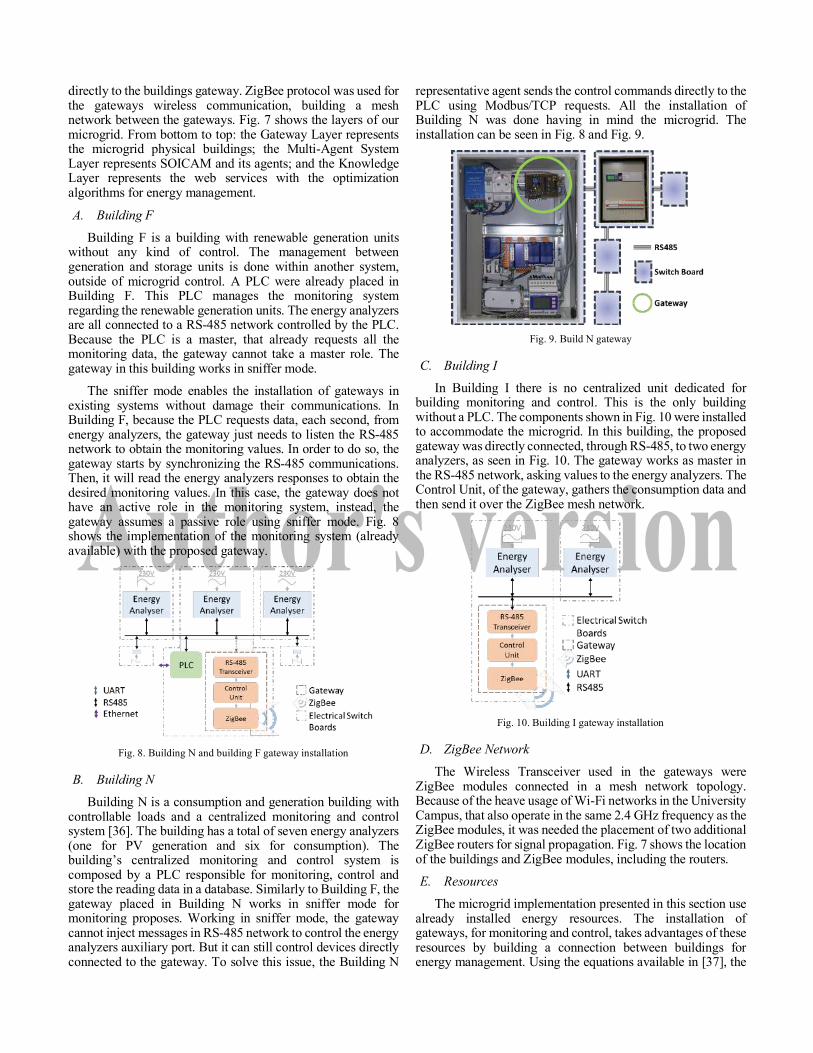
directly to the buildings gateway. ZigBee protocol was used for the gateways wireless communication, building a mesh network between the gateways. Fig. 7 shows the layers of our microgrid. From bottom to top: the Gateway Layer represents the microgrid physical buildings; the Multi-Agent System Layer represents SOICAM and its agents; and the Knowledge Layer represents the web services with the optimization algorithms for energy management.
A. Building F
Building F is a building with renewable generation units without any kind of control. The management between generation and storage units is done within another system, outside of microgrid control. A PLC were already placed in Building F. This PLC manages the monitoring system regarding the renewable generation units. The energy analyzers are all connected to a RS-485 network controlled by the PLC. Because the PLC is a master, that already requests all the monitoring data, the gateway cannot take a master role. The gateway in this building works in sniffer mode.
The sniffer mode enables the installation of gateways in existing systems without damage their communications. In Building F, because the PLC requests data, each second, from energy analyzers, the gateway just needs to listen the RS-485 network to obtain the monitoring values. In order to do so, the gateway starts by synchronizing the RS-485 communications. Then, it will read the energy analyzers responses to obtain the desired monitoring values. In this case, the gateway does not have an active role in the monitoring system, instead, the gateway assumes a passive role using sniffer mode. Fig. 8 shows the implementation of the monitoring system (already available) with the proposed gateway.
Fig. 8. Building N and building F gateway installation
B. Building N
Building N is a consumption and generation building with controllable loads and a centralized monitoring and control system [36]. The building has a total of seven energy analyzers (one for PV generation and six for consumption). The building’s centralized monitoring and control system is composed by a PLC responsible for monitoring, control and store the reading data in a database. Similarly to Building F, the gateway placed in Building N works in sniffer mode for monitoring proposes. Working in sniffer mode, the gateway cannot inject messages in RS-485 network to control the energy analyzers auxiliary port. But it can still control devices directly connected to the gateway. To solve this issue, the Building N
representative agent sends the control commands directly to the PLC using Modbus/TCP requests. All the installation of Building N was done having in mind the microgrid. The installation can be seen in Fig. 8 and Fig. 9.
Fig. 9. Build N gateway
C. Building I
In Building I there is no centralized unit dedicated for building monitoring and control. This is the only building without a PLC. The components shown in Fig. 10 were installed to accommodate the microgrid. In this building, the proposed gateway was directly connected, through RS-485, to two energy analyzers, as seen in Fig. 10. The gateway works as master in the RS-485 network, asking values to the energy analyzers. The Control Unit, of the gateway, gathers the consumption data and then send it over the ZigBee mesh network.
Fig. 10. Building I gateway installation
D. ZigBee Network
The Wireless Transceiver used in the gateways were ZigBee modules connected in a mesh network topology. Because of the heave usage of Wi-Fi networks in the University Campus, that also operate in the same 2.4 GHz frequency as the ZigBee modules, it was needed the placement of two additional ZigBee routers for signal propagation. Fig. 7 shows the location of the buildings and ZigBee modules, including the routers.
E. Resources
The microgrid implementation presented in this section use already installed energy resources. The installation of gateways, for monitoring and control, takes advantages of these resources by building a connection between buildings for energy management. Using the equations available in [37], the
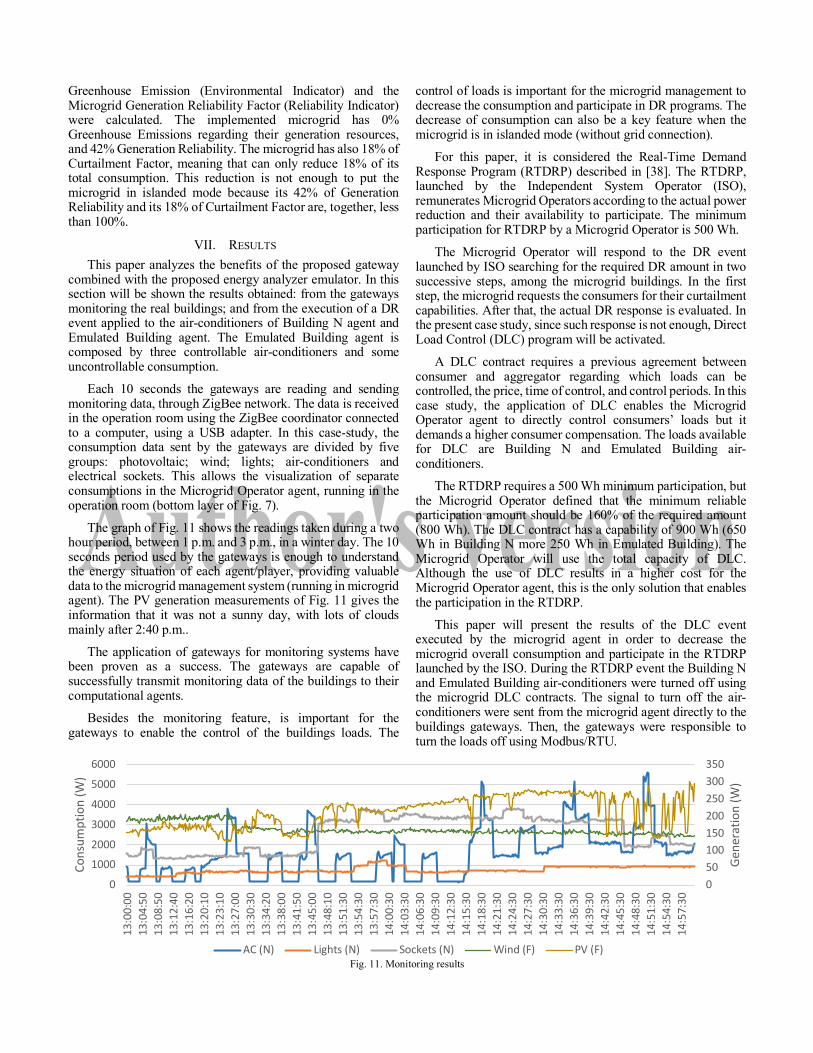
Greenhouse Emission (Environmental Indicator) and the Microgrid Generation Reliability Factor (Reliability Indicator) were calculated. The implemented microgrid has 0% Greenhouse Emissions regarding their generation resources, and 42% Generation Reliability. The microgrid has also 18% of Curtailment Factor, meaning that can only reduce 18% of its total consumption. This reduction is not enough to put the microgrid in islanded mode because its 42% of Generation Reliability and its 18% of Curtailment Factor are, together, less than 100%.
VII. RESULTS This paper analyzes the benefits of the proposed gateway
combined with the proposed energy analyzer emulator. In this section will be shown the results obtained: from the gateways monitoring the real buildings; and from the execution of a DR event applied to the air-conditioners of Building N agent and Emulated Building agent. The Emulated Building agent is composed by three controllable air-conditioners and some uncontrollable consumption.
Each 10 seconds the gateways are reading and sending monitoring data, through ZigBee network. The data is received in the operation room using the ZigBee coordinator connected to a computer, using a USB adapter. In this case-study, the consumption data sent by the gateways are divided by five groups: photovoltaic; wind; lights; air-conditioners and electrical sockets. This allows the visualization of separate consumptions in the Microgrid Operator agent, running in the operation room (bottom layer of Fig. 7).
The graph of Fig. 11 shows the readings taken during a two hour period, between 1 p.m. and 3 p.m., in a winter day. The 10 seconds period used by the gateways is enough to understand the energy situation of each agent/player, providing valuable data to the microgrid management system (running in microgrid agent). The PV generation measurements of Fig. 11 gives the information that it was not a sunny day, with lots of clouds mainly after 2:40 p.m..
The application of gateways for monitoring systems have been proven as a success. The gateways are capable of successfully transmit monitoring data of the buildings to their computational agents.
Besides the monitoring feature, is important for the gateways to enable the control of the buildings loads. The
control of loads is important for the microgrid management to decrease the consumption and participate in DR programs. The decrease of consumption can also be a key feature when the microgrid is in islanded mode (without grid connection).
For this paper, it is considered the Real-Time Demand Response Program (RTDRP) described in [38]. The RTDRP, launched by the Independent System Operator (ISO), remunerates Microgrid Operators according to the actual power reduction and their availability to participate. The minimum participation for RTDRP by a Microgrid Operator is 500 Wh.
The Microgrid Operator will respond to the DR event launched by ISO searching for the required DR amount in two successive steps, among the microgrid buildings. In the first step, the microgrid requests the consumers for their curtailment capabilities. After that, the actual DR response is evaluated. In the present case study, since such response is not enough, Direct Load Control (DLC) program will be activated.
A DLC contract requires a previous agreement between consumer and aggregator regarding which loads can be controlled, the price, time of control, and control periods. In this case study, the application of DLC enables the Microgrid Operator agent to directly control consumers’ loads but it demands a higher consumer compensation. The loads available for DLC are Building N and Emulated Building air-conditioners.
The RTDRP requires a 500 Wh minimum participation, but the Microgrid Operator defined that the minimum reliable participation amount should be 160% of the required amount (800 Wh). The DLC contract has a capability of 900 Wh (650 Wh in Building N more 250 Wh in Emulated Building). The Microgrid Operator will use the total capacity of DLC. Although the use of DLC results in a higher cost for the Microgrid Operator agent, this is the only solution that enables the participation in the RTDRP.
This paper will present the results of the DLC event executed by the microgrid agent in order to decrease the microgrid overall consumption and participate in the RTDRP launched by the ISO. During the RTDRP event the Building N and Emulated Building air-conditioners were turned off using the microgrid DLC contracts. The signal to turn off the air-conditioners were sent from the microgrid agent directly to the buildings gateways. Then, the gateways were responsible to turn the loads off using Modbus/RTU.
Fig. 11. Monitoring results
050100150200250300350
0
1000
2000
3000
4000
5000
6000
13:
00:0
0 1
3:04
:50
13:
08:5
0 1
3:12
:40
13:
16:2
0 1
3:20
:10
13:
23:1
0 1
3:27
:00
13:
30:3
0 1
3:34
:20
13:
38:0
0 1
3:41
:50
13:
45:0
0 1
3:48
:10
13:
51:3
0 1
3:54
:30
13:
57:3
0 1
4:00
:30
14:
03:3
0 1
4:06
:30
14:
09:3
0 1
4:12
:30
14:
15:3
0 1
4:18
:30
14:
21:3
0 1
4:24
:30
14:
27:3
0 1
4:30
:30
14:
33:3
0 1
4:36
:30
14:
39:3
0 1
4:42
:30
14:
45:3
0 1
4:48
:30
14:
51:3
0 1
4:54
:30
14:
57:3
0
Gene
ratio
n (W
)
Cons
umpt
ion
(W)
AC (N) Lights (N) Sockets (N) Wind (F) PV (F)

Fig. 12 presents the consumption of Building N during the DLC event (from 4:00 p.m. to 5:00 p.m.). In this graph is visible a decrease in the air-conditioner consumption during the DLC event. However, the consumption do not stays at 0 W due to one air-conditioner that were not turned off. This air-conditioner is placed in the server room and, for safety reasons, is not part of the DLC contract. After DLC event, at 5:00 p.m., the air-conditioners consumption starts a little higher than before to put the temperature as it was.
The graph of Fig. 13 presents the consumptions of the Emulated Building during the DLC event. The Emulated Building uses V2Rs running Contextual Emulations to emulate air-conditioners and uncontrollable loads. During the DLC event the air-conditioners consumption goes and stays in 0 W, because all the air-conditioners are in the DLC contract and for that reason can be controlled by the Microgrid Operator agent. At the end of the event, there is no peak of consumption, as seen in Building N. Nevertheless, the obtained results are acceptable and prove the ability of V2R to emulate loads for energy management demonstrations in microgrids context.
The use of V2R to test and validate DLC events and price-based events is a good option to see the consumption decrease in the end-consumers. In this paper the V2R is connected to the proposed gateway, however, the V2R can be used directly by the computational agents.
VIII. CONCLUSION In this paper is proposed two tools that enable the
implementation of microgrid demonstrators for development, testing and validation of innovative energy management methodologies. The proposed gateway has the capability to read a building data and send it to an energy management system. The gateway is also capable to pass on data from the energy management system to the building, enabling load
control. The proposed energy analyzer emulator works as an energy analyzer and enables the emulation of several types of loads.
The proposed tools are the main contribution of this paper. The gateway and the energy analyzer emulator were tested regarding the monitoring and control capabilities. The presented results show the ability to monitor measuring values in small time periods while providing the ability to execute remote load control, as seen in the air-conditioner resources controlled during the case study. The tools can benefit R&D centers all over the world, providing means to a successful and cheaper microgrid implementations for demonstration of energy management methodologies. Using the proposed gateways, the case study showed the execution of a demand response that resulted in an average energy reduction of 19% in Building N (one of the microgrid buildings), decreasing from 5.4 kWh to 4.4 kWh. From this reduction, 67.8% was due to the Direct Load Control (678 Wh), representing a 44% reduction in the air-conditioners consumption.
This paper proposes two tools that are able to combine real physical loads/facilities with emulated loads/facilities, in order to create complete microgrids for demonstration proposes. The combination of both tools increases the simulation and test flexibility, providing the combination between gateways of real physical facilities with gateways of emulated buildings. Such combination, enables the integration of unavailable loads and facilities in the microgrid. For instance, it is possible to create a microgrid, with the proposed gateway, while integrating unavailable loads or facilities, with the proposed emulator, such as, residential washing machines or wind farms. This combination is a key feature of our work. The emulation and simulation can fill the gaps that usually R&D centers encounter in their buildings, such as, the inexistence of residential loads.
Fig. 12. DR event in Building N agent
Fig. 13. DR event in Emulated Building agent
0200040006000
15:
30:0
0 1
5:33
:00
15:
36:0
0 1
5:39
:00
15:
42:0
0 1
5:45
:00
15:
48:0
0 1
5:51
:00
15:
54:0
0 1
5:57
:00
16:
00:0
0 1
6:03
:00
16:
06:0
0 1
6:09
:00
16:
12:0
0 1
6:15
:00
16:
18:0
0 1
6:21
:00
16:
24:0
0 1
6:27
:00
16:
30:0
0 1
6:33
:00
16:
36:0
0 1
6:39
:00
16:
42:0
0 1
6:45
:00
16:
48:0
0 1
6:51
:00
16:
54:0
0 1
6:57
:00
17:
00:0
0 1
7:03
:00
17:
06:0
0 1
7:09
:00
17:
12:0
0 1
7:15
:00
17:
18:0
0 1
7:21
:00
17:
24:0
0 1
7:27
:00
Cons
umpt
ion
(W)
Air-Conditioners Uncontrollable
0500
1000150020002500
15:
00:0
0 1
5:04
:30
15:
09:0
0 1
5:13
:30
15:
18:0
0 1
5:22
:30
15:
27:0
0 1
5:31
:30
15:
36:0
0 1
5:40
:30
15:
45:0
0 1
5:49
:30
15:
54:0
0 1
5:58
:30
16:
03:0
0 1
6:07
:30
16:
12:0
0 1
6:16
:30
16:
21:0
0 1
6:25
:30
16:
30:0
0 1
6:34
:30
16:
39:0
0 1
6:43
:30
16:
48:0
0 1
6:52
:30
16:
57:0
0 1
7:01
:30
17:
06:0
0 1
7:10
:30
17:
15:0
0 1
7:19
:30
17:
24:0
0 1
7:28
:30
17:
33:0
0 1
7:37
:30
17:
42:0
0 1
7:46
:30
17:
51:0
0 1
7:55
:50
Cons
umpt
ion
(W)
Air-Conditioners Uncontrollable

IX. REFERENCES [1] D. Kolokotsa, “The role of smart grids in the building sector,” Energy
and Buildings, vol. 116, pp. 703-708, Mar. 2016. [2] C. Marnay, S. Chatzivasileiadis, C. Abbey, R. Iravani, G. Joos, P.
Lombardi, P. Mancarella, and J. von Appen, "Microgrid Evolution Roadmap," in Proc. 2015 International Symposium on Smart Electric Distribution Systems and Technologies (EDST), pp. 139-144.
[3] Q. Fu, L. F. Montoya, A. Solanki, A. Nasiri, V. Bhavaraju, T. Abdallah, and D. C. Yu, “Microgrid Generation Capacity Design With Renewables and Energy Storage Addressing Power Quality and Surety,” IEEE Transactions on Smart Grid, vol. 3, pp. 2019-2027, Dec. 2012.
[4] E. Hossain, E. Kabalci, R. Bayindir, and R. Perez, “Microgrid testbeds around the world: State of art,” Energy Conversion and Management, vol. 86, pp. 132-153, Oct. 2014.
[5] O. Abrishambaf, P. Faria, L. Gomes, J. Spínola, Z. Vale and J. M. Corchado, “Implementation of a Real-Time Microgrid Simulation Platform Based on Centralized and Distributed Management,” Energies, vol. 10, n. 6, 2017.
[6] F. Delfino, M. Rossi, R. Minciardi, M. Robba, and M. Rossi, "An optimization based architecture for local systems managed by PLC devices," in Proc. 2015 IEEE International Symposium on Systems Engineering (ISSE), pp. 17-22.
[7] S. N. Islam, M. A. Mahmud, and A. M. T. Oo, "Relay aided smart meter to smart meter communication in a microgrid," in Proc. 2016 IEEE International Conference on Smart Grid Communications (SmartGridComm), pp. 128-133.
[8] T. Caldognetto, and P. Tenti, "Microgrids Operation Based on Master–Slave Cooperative Control," IEEE Journal of Emerging and Selected Topics in Power Electronics, vol. 2, pp. 1081-1088, Dec. 2014.
[9] L. Gomes, J. Silva, P. Faria, and Z. Vale, "Microgrid demonstration gateway for players communication and load monitoring and management," in Proc. 2016 Clemson University Power Systems Conference (PSC), pp. 1-6.
[10] G. A. Jimenez-Estevez, R. Palma-Behnke, D. Ortiz-Villalba, O. Nunez Mata, and C. Silva Montes, "It Takes a Village: Social SCADA and Approaches to Community Engagement in Isolated Microgrids," IEEE Power and Energy Magazine, vol. 12, pp. 60-69, July-Aug. 2014.
[11] M. Wrinch, G. Dennis, T. H. M. EL-Fouly, and S. Wong, "Demand response implementation for improved system efficiency in remote communities," in Proc. 2012 IEEE Electrical Power and Energy Conference, pp. 105-110.
[12] Z. Chmiel, and S. C. Bhattacharyya, “Analysis of off-grid electricity system at Isle of Eigg (Scotland): Lessons for developing countries,” Renewable Energy, vol. 81, pp. 578-588, Sep. 2015.
[13] “Isle of Eigg Heritage Trust / Islanders doing it for themselves,” Ashden UK Award, 2010. [Online]. 07/08/2017, Available: https://www.ashden.org/winners/isle-of-eigg-heritage-trust
[14] R. Palma-Behnke, D. Ortiz, L. Reyes, G. Jiménez-Estévez, and N. Garrido, "A social SCADA approach for a renewable based microgrid — The Huatacondo project," in Proc. 2011 IEEE Power and Energy Society General Meeting, San Diego, pp. 1-7.
[15] T. W. Overton (Jan. 2014), “New York University Cogeneration Plant, New York City,” POWER magazine [Online]. 07/08/2017, Available: http://www.powermag.com/new-york-university-cogeneration-plant-new-york-city
[16] B. Washom, J. Dilliot, D. Weil, J. Kleissl, N. Balac, W. Torre, and C. Richter, "Ivory Tower of Power: Microgrid Implementation at the University of California, San Diego," IEEE Power and Energy Magazine, vol. 11, pp. 28-32, July-Aug. 2013.
[17] Z. Zeng, R. Zhao, H. Yang, and S. Tang, “Policies and demonstrations of micro-grids in China: A review,” Renewable and Sustainable Energy Reviews, vol. 29, pp. 701-718, Jan. 2014.
[18] M. L. Wald (Nov. 2012), “How N.Y.U. Stayed (Partly) Warm and Lighted,” The New York Times [Online]. Visited at 07/08/2017, Available: https://green.blogs.nytimes.com/2012/11/05/how-n-y-u-stayed-partly-warm-and-lighted/
[19] K. Hirose, "Behavior of the Sendai Microgrid during and after the 311 Great East Japan Disaster," in Proc. 2013 35th International Telecommunications Energy Conference, SMART POWER AND EFFICIENCY, pp. 1-6.
[20] P. Faria, J. Spínola, and Z. Vale, "Aggregation and Remuneration of Electricity Consumers and Producers for the Definition of Demand-Response Programs," IEEE Transactions on Industrial Informatics, vol. 12, pp. 952-961, June 2016.
[21] L. Martirano, E. Habib, G. Parise, G. Greco, M. Manganelli, F. Massarella, and L. Parise, "Demand Side Management in Micro-grids for Load Control in Nearly Zero Energy Buildings," IEEE Transactions on Industry Applications, vol. PP, pp.1-1, Feb. 2017.
[22] IEEE 802.11TM Wireless Local Area Networks. [Online]. Visited at 07/08/2017, Available: http://www.ieee802.org/11
[23] DASH7 Alliance. [Online]. 07/08/2017, Available: www.dash7-alliance.org
[24] ZigBee Alliance. [Online]. 07/08/2017, Available: www.zigbee.org [25] L. Gomes and Z. Vale, “Energy Analyzer Emulation for Energy
Management Simulators,” in Distributed Computing and Artificial Intelligence, 14th International Conference, pp. 215-222, 2017.
[26] OPAL-RT Technologies, “OP5600 off-the-shelf Hardware-in-the-Loop (HIL) simulator,” 2013. [Online]. 07/08/2017, Available: www.opal-rt.com
[27] F. Huerta, J. K. Gruber, M. Prodanovic, and P. Matatagui, "Power-hardware-in-the-loop test beds: evaluation tools for grid integration of distributed energy resources," IEEE Industry Applications Magazine, vol. 22, pp. 18-26, March-April 2016.
[28] H. F. Habib, T. Yossef, M. Cintuglu, and O. Mohammed, "A Multi-Agent Based Technique for Fault Location, Isolation, and Service Restoration," IEEE Transactions on Industry Applications , vol. PP, pp.1-1, Feb. 2017.
[29] C. Dou, M. Lv, T. Zhao, Y. Ji, and H. Li, "Decentralised coordinated control of microgrid based on multi-agent system," IET Generation, Transmission & Distribution, vol. 9, pp. 2474-2484, March 2015.
[30] F. Z. Harmouch, N. Krami, D. Benhaddou, N. Hmina, E. Zayer, and E. H. Margoum, "Survey of multiagents systems application in Microgrids," in Proc. 2016 International Conference on Electrical and Information Technologies (ICEIT), pp. 270-275.
[31] H. Morais, Z. Vale, T. Pinto, L. Gomes, F. Fernandes, P. Oliveira, C. Ramos, "Multi-Agent based Smart Grid management and simulation: Situation awareness and learning in a test bed with simulated and real installations and players," in Proc. 2013 IEEE Power & Energy Society General Meeting, pp. 1-5.
[32] L. Gomes, F. Fernandes, P. Faria, M. Silva, Z. Vale and C. Ramos, "Contextual and environmental awareness laboratory for energy consumption management," in Proc. 2015 Clemson University Power Systems Conference (PSC), pp. 1-6.
[33] The Foundation for Intelligent Physical Agents. [Online]. 07/08/2017, Available: http://fipa.org
[34] L. Gomes, T. Pinto, P. Faria and Z. Vale, "Distributed intelligent management of microgrids using a multi-agent simulation platform," in Proc. 2014 IEEE Symposium on Intelligent Agents (IA), pp. 1-7.
[35] L. Gomes, M. Lefrançois, P. Faria and Z. Vale, "Publishing real-time microgrid consumption data on the web of Linked Data," in Proc. 2016 Clemson University Power Systems Conference (PSC), pp. 1-8.
[36] E. Vinagre, L. Gomes and Z. Vale, "Electrical Energy Consumption Forecast Using External Facility Data," in Proc. 2015 IEEE Symposium Series on Computational Intelligence, pp. 659-664.
[37] S. Hussain, H. A. Gabbar, F. Musharavati and S. Pokharel, "Key performance indicators (KPIs) for evaluation of energy conservation in buildings," in Proc. 2013 IEEE International Conference on Smart Energy Grid Engineering (SEGE), pp. 1-6, 2013.
[38] L. Gomes, P. Faria, H. Morais, Z. Vale, and C. Ramos, "Distributed, Agent-Based Intelligent System for Demand Response Program Simulation in Smart Grids," IEEE Intelligent Systems, vol. 29, pp. 56-65, Jan.-Feb. 2014.
Luis Gomes
IoH: A Platform for the Intelligence of Home with a Context Awareness and Ambient Intelligence
Approach
Authors: Luis Gomes, Carlos Ramos, Aria Jozi, Bruno Serra, Lucas Paiva, and Zita Vale
Published in: Future Internet
DOI: 10.3390/fi11030058
Published at: March 2018
PhD timeline: M32

Future Internet 2019, 11, Firstpage-Lastpage; doi: FOR PEER REVIEW www.mdpi.com/journal/futureinternet
Article 1
IoH – a Platform for the Intelligence of Home with a 2
Context Awareness and Ambient Intelligence 3
approach 4
Luis Gomes 1,*, Carlos Ramos 1, Aria Jozi 1, Bruno Serra 1, Lucas Paiva 2 and Zita Vale 1 5
1 GECAD - Research Group on Intelligent Engineering and Computing for Advanced Innovation and 6 Development, Polytechnic of Porto (P.PORTO), P-4200-465 Porto, Portugal; [email protected] (L.G.), 7 [email protected] (C.R.), [email protected] (A.J.), [email protected] (B.S.), [email protected] (Z.V.) 8
2 IFSC - Instituto Federal de Santa Catarina (Campus Florianópolis Centro), 88020-300 Florianópolis, Santa 9 Catarina, Brasil; [email protected] (L.P.) 10
* Correspondence: [email protected]; Tel.: +351 228 340 500 11 12
Received: date; Accepted: date; Published: date 13
Abstract: This paper presents IoH (Intelligence of Home), a platform developed to test some basic 14 intelligent behaviors in Home context. Internet of Things, Ambient Intelligence and Context 15 Awareness approaches motivated the development of IoH. The platform involves six layers, 16 responsible by connectivity, persistency, unification, Internet of Things integration, subsystems 17 integration, and user interface. The integrated subsystems involve intelligent systems for light 18 control, television brightness control, desk light control, persons counting, and air conditioner 19 control. The IoH platform is then tested for a real building, and results and conclusions are obtained. 20 Different intelligent methods and technologies are used, form the use of a diversity of sensors, 21 actuators, and controllers and processing units to a set of Artificial Intelligence approaches varying 22 from Machine Learning and Optimization algorithms to the use of Sensor Fusion and Computer 23 Vision. The use of IoH day-by-day demonstrated an intelligent performance for the real building 24 occupants. 25
Keywords: Internet of Things (IoT), Context Awareness; Ambient Intelligence (AmI); Intelligent 26 Homes; Sensing; Intelligent Control; Energy Efficiency 27
28
1. Introduction 29
Our homes can be better, regarding resources’ management and user interactions. The concept 30 of smart homes can change the way we interact with our homes. The home will stop being a static 31 aggregation of resources and will be an active asset that can help and support its users. A smart home 32 may have multiple purposes, such as home automation [1-2], energy management [3-6], security and 33 safety [7-9] or even assisted living [10-12]. However, regardless of its purpose, smart homes should 34 provide interoperability to enable the integration of multiple systems – from multiple brands and 35 manufactures. 36
In an energy point of view, there are some advantages in the smart home concept, where the 37 home has smart capabilities to manage energy resources [13]. This type of smart homes enables the 38 active participation of residential homes in the smart grid environment [15], bringing clear 39 advantages to the users. Moreover, energy management systems can use learning algorithms to better 40 understand the users’ preferences [14]. 41
DoMAIns [16], Vi-SMARt [17] and Smarter Smart Home [18] focus on user interactions with the 42 system using a residential context. These projects show the benefits and some of the possible 43

Future Internet 2019, 11 FOR PEER REVIEW 2
applications of ambient intelligence (AmI) systems. In [20] it is described an office and meeting room 44 using an AmI system to improve the user comfort and interaction. 45
The test of hardware and wireless sensors are a key feature in AmI systems, where sensoring 46 capabilities are mandatory. In [20] and [21] are proposed middleware architectures for sensor 47 networks applications. The architecture proposed in [20] also provides a testbed for AmI applications. 48
The use of domain models gives AmI the ability to understand the world. The domain can be 49 represented using open ontologies or closed world representations. DoMAIns system, [16], uses the 50 combination of ontologies to understand their surroundings. In [22] is used a set of ontologies to have 51 better world knowledge regarding the assisted living field. In [23] is proposed the CONSERT context 52 model to describe the situation of entities, regarding the interaction between persons, places, and 53 objects. 54
AmI systems can benefit from the integration of artificial intelligence (AI) techniques [24]. Vi-55 SMARt project, [17], integrates an artificial neural network (ANN) to support learning from patient 56 therapies. In [25] it is used a clustering algorithm to perform the classification of users’ health. In [24], 57 AmI is seen from the perspective of AI and different uses of AI methods and techniques are identified 58 for the following 7 different phases of the intelligent behavior: Interpreting the Environment’s State; 59 Representing the Information and Knowledge associated with the Environment; Modeling, 60 Simulating and Representing Entities in the Environment; Planning Decisions or Actions; Learning 61 about the Environment and associated aspects; Interacting with Humans; Acting on the Environment. 62
AmI solutions require the integration of several operation systems and communication protocols 63 [26]. The application of Single-Board Computers (SBC) to promote the heterogeneity of the system is 64 a viable solution while decreasing deployment costs, as seen in [25]. The application of SBC for smart 65 sensors in manufacturing area can be seen in [27]. 66
The Intelligent of Home (IoH) platform, described in this paper, for AmI and context awareness 67 management and support, is the main paper’s contribution. IoH main novelty and innovation it the 68 ability to integrate and combine the inputs of multiple internet of things (IoT) devices as well as 69 multiple smart home systems with contextual data. IoH is able to combine multiple data sources and 70 produce contextual decisions and act over home resources. The resources’ actuation is done through 71 integrated IoT devices and smart home systems. This paper details the proof of concept of IoH 72 platform, presenting a real deployment in an office building to show the advantages of IoH platform 73 as a context awareness system for smart homes. The IoH is deployed in one of our buildings. This 74 paper shows the IoH capabilities as well as integrated devices and systems. The IoH platform does 75 not have any associated hardware and exclusively uses third-party hardware. 76
After this first introductory section, this paper describes the IoH platform architecture in section 77 2. Section 3 details and presents the integrated subsystems that were integrated into IoH platform. 78 Section 4 describes the deployed building as well as the metadata associated with each integrated IoT 79 device and system. Section 5 presents the IoH results while section 6 presents the main conclusions 80 of this work. 81
2. IoH architecture 82
The IoH platform was developed for context awareness and ambient intelligence solution to 83 manage homes using a combination between market available smart devices and tailor-made 84 subsystems that want to be integrated into IoH platform. The platform will combine sensing data 85 with external data and user data to be able to manage the home according to its context and providing 86 to the user an efficient and intelligent home. The main motivation behind IoH is its application for 87 building’s management systems. IoH platform will enable the entire building’s control in the same 88 platform and will enable the decision support according to the building’s context. 89
Most of IoT proposed architectures works on a conceptual level using individual IoT devices, 90 while IoH will integrate full independent systems. In [28] is proposed an IoT architecture for context-91 aware to help users getting services. In [29] and [30] gateway-enabled architectures are used for IoT, 92 where gateways are used to simplify the development of horizontal platforms. In [31] a decentralized 93 architecture for resource utilization optimization. 94

Future Internet 2019, 11 FOR PEER REVIEW 3
The IoH architecture was designed for standalone applications. However, the integration of 95 multiple devices and subsystems are allowed as well as communication with other IoH platforms for 96 cooperative collaboration. Figure 1 presents the proposed architecture for IoH platform. The IoH 97 platform has an interconnected layer architecture to provide the final platform. 98
Each layer is responsible for a specific action and solves a part of the problem. The next 99 subsections, from 2.1 to 2.6, will describe in detail the motivation and functionality of each layer. For 100 our implementation, a Raspberry Pi 3 Model B was used to develop the IoH platform. The use of such 101 single-board computer enables a compact solution that is easily installed in a home without 102 demanding a dedicated server or the use of external servers – making it completely private solution, 103 by being a user-side platform. 104
105 Figure 1. IoH platform architecture 106
2.1. Connectivity Layer 107
The IoH platform was designed as a standalone solution that does not have any dependence on 108 other system or systems. The platform manages and takes actions without the necessary use of 109 external services. However, this is simply not possible in this type of platforms. The connectivity 110 layer is responsible for three things: connectivity with other IoH platforms to perform cooperative 111 building management, connectivity with devices and resources, and connectivity with external data 112 providers. 113
The need for collaboration with other IoH platforms appears for large buildings with multiple 114 IoH platforms managing independent zones. For instance, in a large office building with multiple 115 independent offices, where each office has its own IoH platform, and the building itself has an IoH 116 platform for external sensors, such as temperature and luminosity, the building’s IoH platform can 117 share the external sensor data with the offices’ IoH platforms. 118
The connectivity with devices and resources will be detailed in the descriptions of the IoT 119 integration layer and the subsystems integration layer. The connectivity with external data regards 120 public and subscription services, such as weather application programming interfaces (API) that can 121 give important data and information to the platform in order to perform an efficient and intelligent 122 building’s management. 123
2.2. Persistence Layer 124
All data is precious, and all data and actions should be stored. In IoH platform, the persistence 125 layer is the layer responsible for storing all the data resulted from sensors, platform activity, and user 126 actions. The persistence layer is responsible for storage mechanisms providing a storage class and 127 storable interface to be used in objective oriented storable classes in the IoH platform. 128
The persistence layer is composed of multiple database drivers that enable the use of multiple 129 databases technologies. The location of the database should be a combination of local and remote 130

Future Internet 2019, 11 FOR PEER REVIEW 4
databases. The local database is for near present data and metadata, while the remote database stores 131 the older historical data – also used for the backup and historical register. 132
Data needed for building’s management algorithms, such as forecasting, should be stored in the 133 local database to improve the speed of data access. Storage time periods should be chosen according 134 to each resource or device. 135
2.3. Unify Layer 136
The unify layer is responsible for the harmonization between the IoH platform and IoT devices 137 and subsystems. IoH platform does not include hardware resources, being a software platform that 138 uses third-party solutions to provide a context awareness and ambient intelligent platform for 139 buildings. Therefore, the efficient and robust unification of third-party resources is necessary, 140 providing integration and compatibility. 141
This layer is responsible to analyze and process the metadata of the integrated solutions and 142 match contextual data in order to perform context awareness decisions and user suggestions. The 143 integration will be more detailed in the next two subsections while the metadata description and 144 application are seen in section 4.1 and sections 5.3, 5.4 and 5.5. 145
2.4. IoT Integration Layer 146
IoH platform enables the integration of market IoT devices, such as smart plugs and sensors. 147 The use of IoT devices in today’s buildings is a reality. At 2022 it is expected that at least one smart 148 device is presented in 216.9 million homes worldwide [32]. Therefore, better than redesign the wheel 149 is to integrate market IoT devices that are capable to be used to produce the desired solution of IoH. 150
The integration of IoT devices is done by now by using Home Assistant1 open source solution. 151 Home Assistant enables the easy integration of multiple IoT devices while providing a RESTful API 152 to monitor and control each individual device. The access of this API is used in IoH to enable the IoT 153 devices integration. 154
In order to include IoT devices in the IoH platform, it is necessary to describe them in the IoH 155 configuration. Metadata is associated with each IoT device to classify the device. Metadata regarding 156 device location and associations – other devices that are connected to or affected by – also needs to 157 be set. For instance, the integration of a smart plug that controls a heater must specify the room’s 158 location. IoH platform will use and process the metadata to find correlations and context parameters. 159
2.5. Subsystems Integration Layer 160
Besides the integration of IoT devices, IoH platform also enables the integration of third-party 161 independent systems. This layer enables the inclusion of other works that are more than simple IoT 162 devices. Section 3 of this paper will describe some of the subsystems that were integrated. 163
In this paper, a subsystem is defined as an independent system that can be continuously 164 running. However, it is required that a subsystem allows remote connections to activate or deactivate 165 the subsystem. The integration of such subsystems is more difficult and must be manually done. The 166 metadata associated with the subsystem must be described like IoT device’s integration. 167
2.6. User Interface Layer 168
The user interface layer in the main bridge between users and IoH platform. Although the user 169 interface is one of the key features of an application to be accepted by users, this will not be the focus 170 of this paper. The main focus of this paper is the IoH platform and its contextual decisions. 171
This layer is at least one of two types: an API, or a graphical interface. The API implementation 172 will open the IoH platform to multiple graphical interfaces, such as mobile and web. The graphical 173 interface type is a local interface that runs only in the IoH platform, depending on the machine 174 hardware (i.e. screen size and interaction possibilities). 175
1 https://www.home-assistant.io/

Future Internet 2019, 11 FOR PEER REVIEW 5
The API solution is the most dynamic and recommended type because it will not close the 176 system to a unique interface located in a unique front panel. However, the local graphical interface 177 has advantages regarding the security, because it demands a user to the location. Therefore, a 178 combined solution can be implemented where some functionalities are only available locally while 179 others are available remotely (i.e. using an API). 180
3. Subsystems 181
IoH platform has been developed using the previous architecture discussed in section 2. This 182 section will now detail five subsystems that were developed for IoH platform integration. A 183 subsystem is an individual system contributing to the IoH knowledge and control. 184
3.1. Intelligent light control 185
The intelligent light control system was developed and implemented in one of our labs with a 186 clear idea: to have a contextual awareness and fully autonomous system resulting in a consumption 187 decrease. Because labs are used by multiple researchers and students, it was common to have the 188 lights turned on even though there were no persons inside. The lab includes a total of five lamps and 189 three windows. 190
Figure 2 shows the intelligent light control system with its components. Physically, the system 191 is divided into six boards: the light control hardware board were the system core is at, the outside 192 hardware board that is placed outside of the building to measure the sunlight, three-zone hardware 193 boards to measure each room zone, and the shutter hardware board that has a window’s shutter 194 system. The system has a total of 5 controllable lamps connected. 195
196 Figure 2. The intelligent light control system 197
For the system to be possible, the lights ballasts were changed to provide fine analog control 198 over the light intensity – this is done using an analog signal from 0 V/DC to 10 V/DC. The system 199 uses an amplifier circuit (Figure 2) to amplify the 0-5 V/DC Arduino’s signals to 0-10 V/DC for the 200 lamps control. The system also integrates three internal LDR to measure the light intensity in three 201 locations, three passive infrared (PIR) sensors to detect movement, and one LDR located in the 202 outside of the windows to measure the external light. 203
The control of the windows’ shutters implies a change in the room’s light. Therefore, the shutters 204 can be used to increase or decrease the external light entering into the room. For this, the shutter 205 control of the three lab’s windows was integrated into the intelligent light control to promote the use 206 of natural light. 207
The window’s shutters control, seen in the right side of Figure 2, uses an Arduino Mega 2560 R3 208 to control two relays, for each window, connected to a 230 V/AC motor. The Arduino controls the 209 relays according to commands provided by the wall switches or the Programmable Logic Controller 210 (PLC) – connected to the Arduino using Modbus/RTU protocol over RS485. To monitor the shutter’s 211 position, an encoder was placed in the shutters’ motor. The communication between light control and 212 shutter system is done using Modbus/RTU. 213
The room’s light control is done using a web interface with login, allowing the user to control 214 the room’s light. A total of five individually controlled dimmable lamps are available in the room. 215

Future Internet 2019, 11 FOR PEER REVIEW 6
Figure 3 shows the existed webpage where it is possible to control the lights. This webpage was 216 developed in PHP and allows the control of the building. 217
The system was built having assisted manual control and autonomous control. The assisted 218 control monitors the control actions and provides the user with information regarding the windows’ 219 shutters. For instance, every time a user wants to turn on the lights, the system will validate that 220 control with the external light value, and if there are light in the outside, then the system will suggest 221 the user to open the shutters before turning on the light, if the user agrees then the system will 222 automatically open the shutters, in the other hand, if there are not external light or the user do not 223 agree to open the shutters, then the system will turn on the lights. 224
225 Figure 3. N 114 laboratory light control interface 226
The lights autonomous control defines the individual control of three zones in the lab. Figure 4 227 shows and identifies the lab layout and the autonomous control zones. Each zone has two lamps and 228 three sensor boxes with one PIR sensor and one LDR sensor. Lamp 2 is shared by zone 1 and zone 2. 229 The PIR sensor provides information regarding heat movement inside a zone, and when this occurs 230 the zone’s lamps will be turned on. The LDR sensor will then adjust the intensity of the lamp to 231 provide a 1,000 lux intensity inside the zone. According to [33], a 1,000 lux value is recommended for 232 detailed mechanical workshops. If no movement is detected in the last seven minutes, the lamps 233 reduce their intensity to 400 lux, if no movement is detected in the next two minutes, then the lamps 234 will be turned off. The reduction of the light in the autonomous control enables the user reaction 235 when the system mistakenly assumes that there are no users inside a given zone. 236
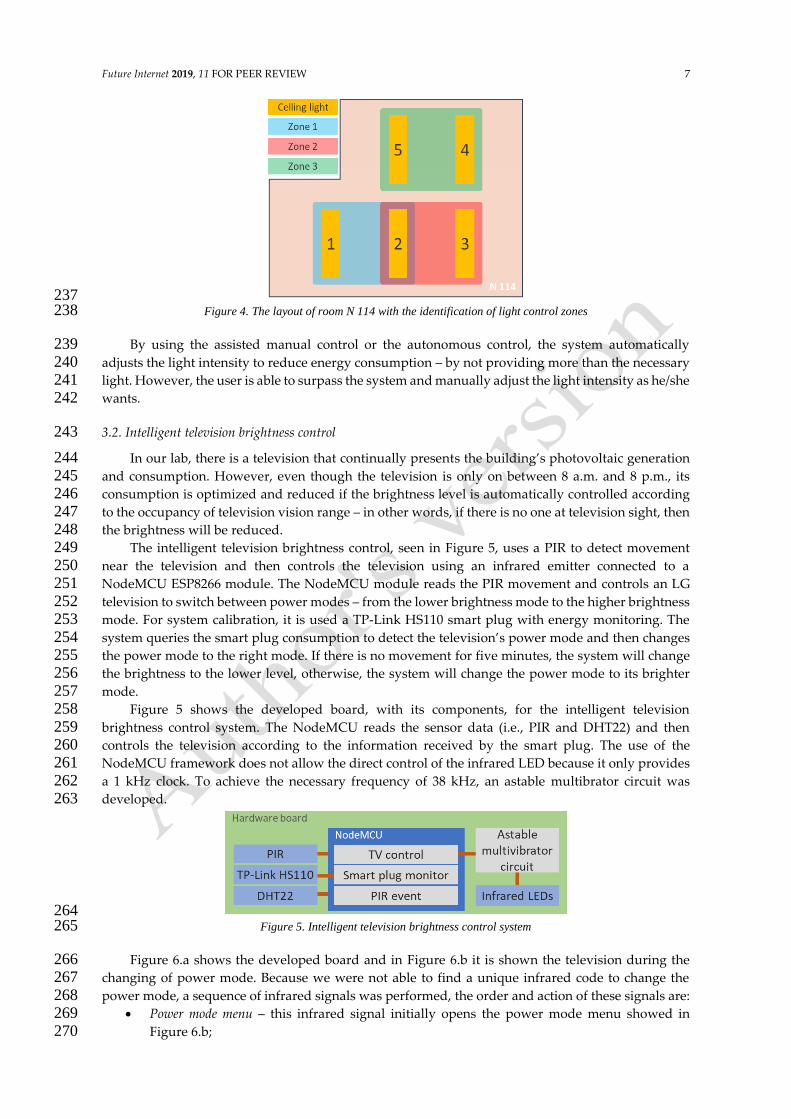
Future Internet 2019, 11 FOR PEER REVIEW 7
237 Figure 4. The layout of room N 114 with the identification of light control zones 238
By using the assisted manual control or the autonomous control, the system automatically 239 adjusts the light intensity to reduce energy consumption – by not providing more than the necessary 240 light. However, the user is able to surpass the system and manually adjust the light intensity as he/she 241 wants. 242
3.2. Intelligent television brightness control 243
In our lab, there is a television that continually presents the building’s photovoltaic generation 244 and consumption. However, even though the television is only on between 8 a.m. and 8 p.m., its 245 consumption is optimized and reduced if the brightness level is automatically controlled according 246 to the occupancy of television vision range – in other words, if there is no one at television sight, then 247 the brightness will be reduced. 248
The intelligent television brightness control, seen in Figure 5, uses a PIR to detect movement 249 near the television and then controls the television using an infrared emitter connected to a 250 NodeMCU ESP8266 module. The NodeMCU module reads the PIR movement and controls an LG 251 television to switch between power modes – from the lower brightness mode to the higher brightness 252 mode. For system calibration, it is used a TP-Link HS110 smart plug with energy monitoring. The 253 system queries the smart plug consumption to detect the television’s power mode and then changes 254 the power mode to the right mode. If there is no movement for five minutes, the system will change 255 the brightness to the lower level, otherwise, the system will change the power mode to its brighter 256 mode. 257
Figure 5 shows the developed board, with its components, for the intelligent television 258 brightness control system. The NodeMCU reads the sensor data (i.e., PIR and DHT22) and then 259 controls the television according to the information received by the smart plug. The use of the 260 NodeMCU framework does not allow the direct control of the infrared LED because it only provides 261 a 1 kHz clock. To achieve the necessary frequency of 38 kHz, an astable multibrator circuit was 262 developed. 263
264 Figure 5. Intelligent television brightness control system 265
Figure 6.a shows the developed board and in Figure 6.b it is shown the television during the 266 changing of power mode. Because we were not able to find a unique infrared code to change the 267 power mode, a sequence of infrared signals was performed, the order and action of these signals are: 268
• Power mode menu – this infrared signal initially opens the power mode menu showed in 269 Figure 6.b; 270

Future Internet 2019, 11 FOR PEER REVIEW 8
• Power mode menu – after the menu is open, the same signal is used to change the selected 271 power mode, therefore it is repeatedly sent to the television to choose the right power mode, 272 the number of repetitions is calculated according to the smart plug consumption that 273 identifies the current power mode; 274
• Ok – this is the signal of the Ok button in order to choose the selected power mode. 275
276 Figure 6. a) television control device; b) power mode menu 277
3.3. Intelligent desk light control 278
The control of illumination in an office environment has clear advantages regarding energy 279 efficiency and user comfort. However, this type of solution can also be implemented for residential 280 building in working computer desks. The intelligent desk light control system enables the automatic 281 control of the working light regarding environment light and user presence. 282
The biggest difficulty of such a system is the identification of persons, if the system can detect 283 persons then it is easy to control the light according to the environment light. To solve this issue, the 284 system was divided into two parts: the sensing hardware, and the processing software. Figure 7 285 shows the hardware and software of the intelligent desk light control system. The hardware connects 286 to the software using a serial interface. The software is responsible to read the hardware sensor data, 287 monitor the computer’s keyboard and mouse, controls the desk light and store all the system’s data. 288
289 Figure 7. Intelligent desk light control system 290
The hardware includes the majority of sensors used in the system. Figure 8.a shows the 291 developed board built with its components. The sensors used allows the measuring of temperature, 292 luminosity (LDR), and movement (PIR). The button on the board enables the user configuration when 293 it is pressed a website opens in the user’s browser to enable system configuration (Figure 8.b). An 294 Arduino Nano V3.0 is used to process sensors’ data and send them to the computer through a USB 295 cable – this cable is also used to feed the circuit with 5 V/DC. 296
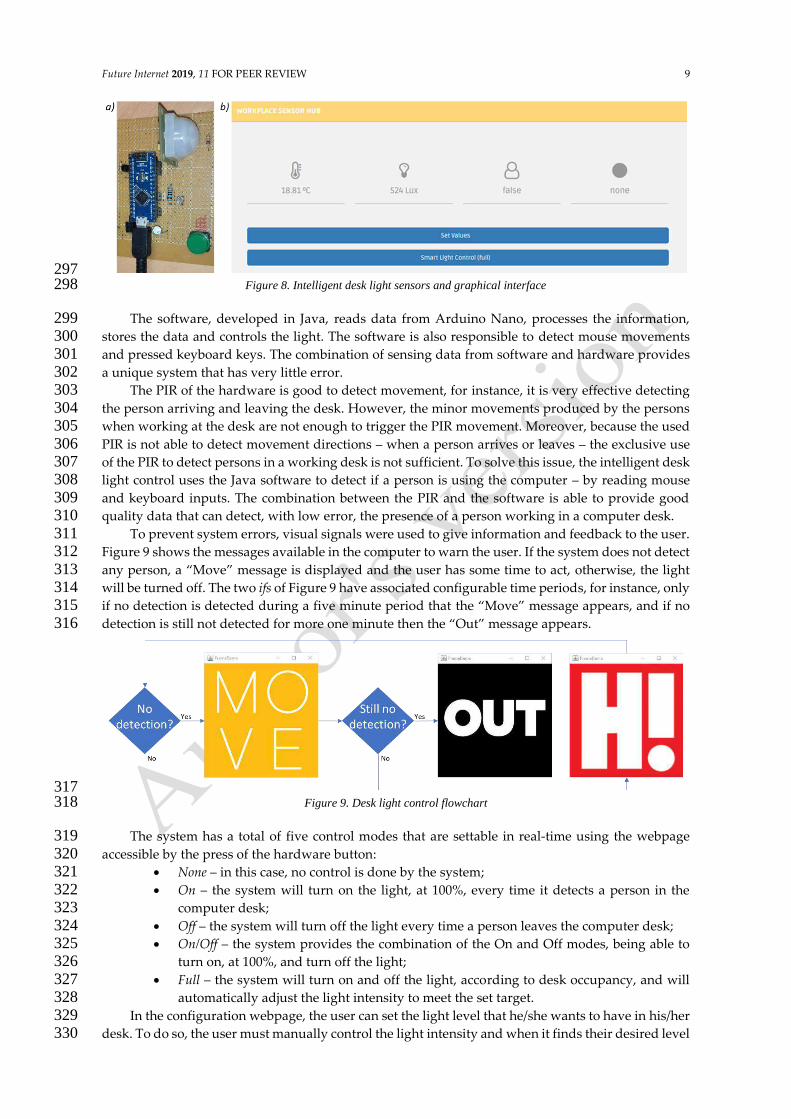
Future Internet 2019, 11 FOR PEER REVIEW 9
297 Figure 8. Intelligent desk light sensors and graphical interface 298
The software, developed in Java, reads data from Arduino Nano, processes the information, 299 stores the data and controls the light. The software is also responsible to detect mouse movements 300 and pressed keyboard keys. The combination of sensing data from software and hardware provides 301 a unique system that has very little error. 302
The PIR of the hardware is good to detect movement, for instance, it is very effective detecting 303 the person arriving and leaving the desk. However, the minor movements produced by the persons 304 when working at the desk are not enough to trigger the PIR movement. Moreover, because the used 305 PIR is not able to detect movement directions – when a person arrives or leaves – the exclusive use 306 of the PIR to detect persons in a working desk is not sufficient. To solve this issue, the intelligent desk 307 light control uses the Java software to detect if a person is using the computer – by reading mouse 308 and keyboard inputs. The combination between the PIR and the software is able to provide good 309 quality data that can detect, with low error, the presence of a person working in a computer desk. 310
To prevent system errors, visual signals were used to give information and feedback to the user. 311 Figure 9 shows the messages available in the computer to warn the user. If the system does not detect 312 any person, a “Move” message is displayed and the user has some time to act, otherwise, the light 313 will be turned off. The two ifs of Figure 9 have associated configurable time periods, for instance, only 314 if no detection is detected during a five minute period that the “Move” message appears, and if no 315 detection is still not detected for more one minute then the “Out” message appears. 316
317 Figure 9. Desk light control flowchart 318
The system has a total of five control modes that are settable in real-time using the webpage 319 accessible by the press of the hardware button: 320
• None – in this case, no control is done by the system; 321 • On – the system will turn on the light, at 100%, every time it detects a person in the 322
computer desk; 323 • Off – the system will turn off the light every time a person leaves the computer desk; 324 • On/Off – the system provides the combination of the On and Off modes, being able to 325
turn on, at 100%, and turn off the light; 326 • Full – the system will turn on and off the light, according to desk occupancy, and will 327
automatically adjust the light intensity to meet the set target. 328 In the configuration webpage, the user can set the light level that he/she wants to have in his/her 329
desk. To do so, the user must manually control the light intensity and when it finds their desired level 330

Future Internet 2019, 11 FOR PEER REVIEW 10
of light, he/she just need to press the ‘set values’ button available in the interface. This way, the system 331 will store the light level as the new target and will be able to provide that light level during the entire 332 day. The adjustment of light will use the LDR of the hardware; to read the existing light in the room, 333 and then increases or decreases the intensity of the artificial light. 334
During the development and implementation of this system in our offices, a problem appeared 335 during the use of the computer’s remote access. By using the remote access functionality to access the 336 computer of the monitored desk, the Java software was able to read the mouse and keyboard inputs, 337 even though the user was not physically there – because he/she were using a remote session. 338 Therefore, a new solution needed to be implemented. The change that solved our problem was the 339 use of the PIR to detect a person arriving at the desk and not to use the mouse or keyboard to detect 340 arrivals. The final solution uses the PIR to detect the arrival of a person and the PIR, mouse, and 341 keyboard to monitor if the person is still on the computer desk. Only when the PIR, mouse, and 342 keyboard stop detecting movement that the system assumes that no one is there, and when this 343 happens the system presents the “Move” message so the user can move if he/she is still there. 344
3.4. Intelligent persons counter system 345
The identification of occupancy and the number of persons inside a building is important for 346 energy management algorithms and building optimizations because the presence of people 347 drastically changes the optimization results. However, the simple counting of persons is a very 348 complex and difficult task. The intelligent persons counter system uses a webcam to detect the 349 movement of persons in the main hallway of our building. 350
Previous solutions were tried with infrared line sensors. However, they resulted in higher errors 351 and were not efficient enough to provide a precise counter system. Some types of clothes and the line 352 infrared sensor became problems that seemed impossible to overpass. The sensors also had some 353 false positives that mislead the system. The solution adopted uses a webcam and computer vision 354 algorithms to process the webcam image, this enables a more precise and stable system. 355
The system was developed in Python and runs on a desk computer where the webcam is 356 connected. The webcam is located in the hallway’s ceiling and reaches all the hallway in order to 357 detect any movement. Figure 10 shows the connections between the system modules. Beside the 358 webcam, the system uses another external connection to energy analyzers in order to execute the 359 system reset routine. 360
361 Figure 10. Intelligent persons counter system 362
The Python software is able to detect a person and trace their route. This tracing can be seen on 363 the left screen of Figure 11 where a person is detected and marked within a green rectangle and where 364 the person's route is represented by a green line. The blue and red lines are specified limits that trigger 365 events every time a person collides with it. 366

Future Internet 2019, 11 FOR PEER REVIEW 11
367 Figure 11. Software graphical interface: a) person leaving the building; b) person entering the building 368
Using the open source computer vision library (OpenCV) the system is able to read and process 369 the video feed of the USB webcam. Then the software separates and identifies the video background 370 from the moving objects, displaying a black and white frame where the background is represented 371 in black and moving objects are represented in white, this black and white frame can be seen in the 372 right side of Figure 11. To detect the background objects, the software compares previous frames, if 373 an object is still in a set number of previous frames, then it is identified as being part of the 374 background. 375
The entering of a person in the frame generates a white spot. The software uses frame filters to 376 avoid and decrease the amount of interference generated by reflections and other signal distortions 377 and noise. If the white spot is bigger than the defined target, the system assumes it is a person and 378 starts the identification of the spot, to delimitate its borders. These borders are defined by the green 379 line rectangle of Figure 11. With the limits delimitated, then the system starts the object tracking. 380
The tracing of an object is drawn in the graphical interface, as seen in Figure 11. Every time a 381 person passes a blue or red line, a trigger is activated. Using the blue and red line triggers sequence, 382 the software is able to detect the direction of a person – to detect if the person in entering or leaving. 383
During the implementation, new blue and red lines were added and experimented in order to 384 achieve a satisfactory result. The low ceiling of the hallway and the lack of natural light were a 385 problem that was solved using more blue and red lines and with artificial light that must be turned 386 on – otherwise, the webcam will not be able to see any person. One error that was not possible to 387 solve, was the error produced by two persons passing at the same time. Because the hallway is narrow 388 and the camera angle is too short, when two persons pass at the same time the software will see only 389 one person – as is the combination of both. This happens because the distance from both persons will 390 be too short for effective individual identification. This was not an easy problem to solve, however, 391 some solutions are: narrow down even more the hallway so only one person passes at a given time, 392 and/or use a high-resolution camera with a higher angle so more hallway can be filmed and 393 monitored. 394
To track errors and system’s actions, a logging mechanism was included. And because all 395 systems fail, a reset mechanism was implemented to correct counter errors. The building can have 396 persons at any time at any day, therefore an automatically hour reset (e.g. at 3 p.m.) was not a viable 397

Future Internet 2019, 11 FOR PEER REVIEW 12
solution. To solve this issue, the system uses the photovoltaic generation value and the individual 398 room’s consumptions values. If the electrical generation is equal to zero it means that there is no 399 sunlight – no sunlight or very close to none – and if so, if the rooms’ consumptions are low and the 400 light consumption of each room is equal to zero it means that there is no person inside the building. 401 With this information, the system resets itself if there is no sunlight and the building is totally dark. 402 The reset mechanism is activated every 5 minutes when the counter number is bigger than zero – it 403 is not possible to have negative numbers; the system not counts people leaving the building if the 404 counter is already set to zero. If a person is in the total dark inside the building the system will not 405 see him/her, this is a situation that was not considered in order to provide a reset mechanism to the 406 system. 407
3.5. Intelligent HVAC control 408
The control of heating, ventilation and air conditioning (HVAC) devices in buildings can have a 409 big impact on energy consumption. In our solution, it was integrated a system that enables the 410 autonomous control of an air conditioning unit by forecasting the room’s usage in the next time 411 period. To provide HVAC control, an infrared universal emitter device was built using open-source 412 hardware and software. 413
The infrared control device uses an Arduino Mega with an infrared emitter that accepts HTTP 414 GET requests in a similar way as a RESTful API. When receiving an HTTP request, the Arduino will 415 query a RESTful API, created in Node.js, that retrieves the infrared code that the Arduino needs to 416 emit. Arduino has memory limitations that do not allow the store of all possible infrared signals. The 417 use of external server overpasses this limitation and can store a huge number of signals. Moreover, 418 this solution provides easy system scalability – when a new signal is stored at the server, it will 419 immediately be accessible by all the Arduinos – and provides a single location for all systems that 420 use infrared signals to control resources, such as air conditioners, television sets, and projectors. 421 Figure 12 shows the infrared device and the sequence diagram for each control request. 422
423 Figure 12. Infrared signal emission diagram 424
With the control solved, the idea was to forecast the room’s usage in the next hour to control the 425 HVAC accordingly. Figure 13 shows the control actions used in the intelligent HVAC control system. 426
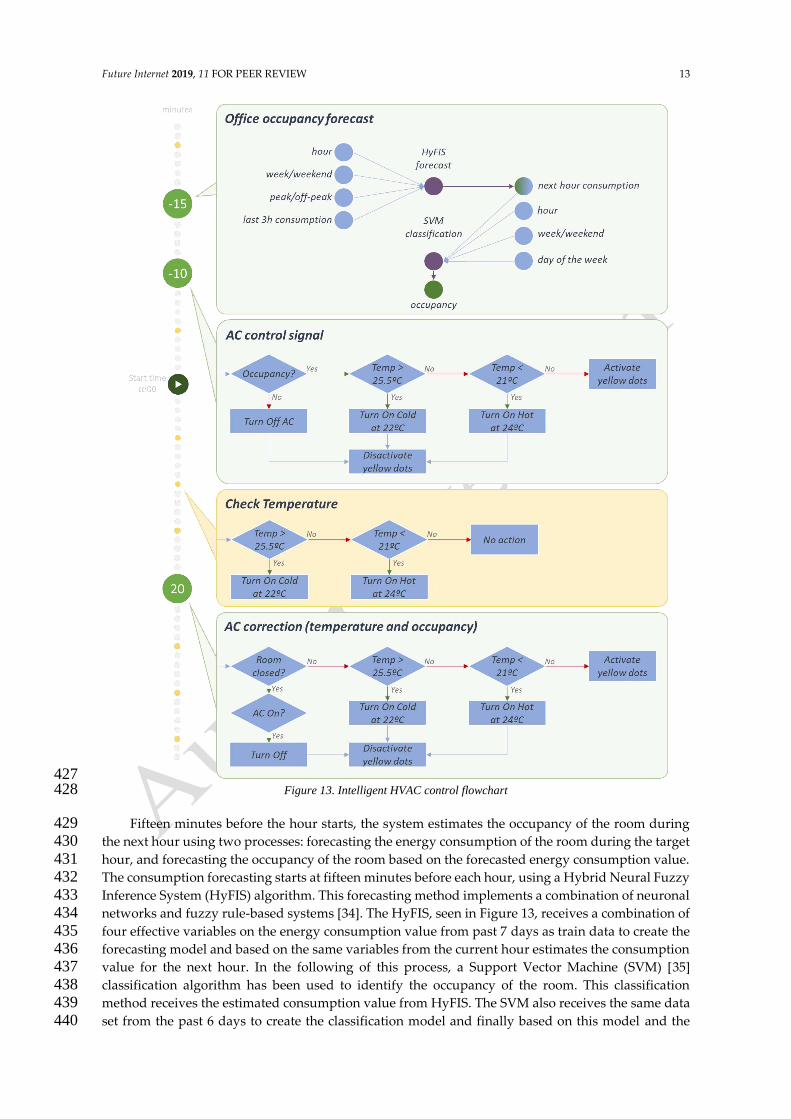
Future Internet 2019, 11 FOR PEER REVIEW 13
427 Figure 13. Intelligent HVAC control flowchart 428
Fifteen minutes before the hour starts, the system estimates the occupancy of the room during 429 the next hour using two processes: forecasting the energy consumption of the room during the target 430 hour, and forecasting the occupancy of the room based on the forecasted energy consumption value. 431 The consumption forecasting starts at fifteen minutes before each hour, using a Hybrid Neural Fuzzy 432 Inference System (HyFIS) algorithm. This forecasting method implements a combination of neuronal 433 networks and fuzzy rule-based systems [34]. The HyFIS, seen in Figure 13, receives a combination of 434 four effective variables on the energy consumption value from past 7 days as train data to create the 435 forecasting model and based on the same variables from the current hour estimates the consumption 436 value for the next hour. In the following of this process, a Support Vector Machine (SVM) [35] 437 classification algorithm has been used to identify the occupancy of the room. This classification 438 method receives the estimated consumption value from HyFIS. The SVM also receives the same data 439 set from the past 6 days to create the classification model and finally based on this model and the 440

Future Internet 2019, 11 FOR PEER REVIEW 14
input data, the method returns a 0 or 1 result. Which in this case, 1 means that during the next hour 441 at least one person will be in the room and 0 mean that the room during the next hour will be empty. 442 At ten minutes before each hour, the system will act according to the SVM classification result and 443 the real-time temperature value. At this moment the system will take one of four actions: 444
• Turn off the air conditioner unit – this action will be taken if there will be no expected occupancy 445 in the next hour period; 446
• Turn on the air conditioner unit at 22˚ C in cold mode – this action will be taken if occupancy is 447 expected and the room’s temperature is higher than 25.5˚ C; 448
• Turn on the air conditioner unit at 24˚ C in heat mode – this action will be taken if occupancy is 449 expected and the room’s temperature is below than 21˚ C; 450
• Turn on the 5 minutes monitoring (the yellow dots of Figure 13) – this action will be taken if 451 occupancy is expected and the room’s temperature is between 21˚ C and 25.5˚ C. 452
After the first control action, the intelligent HVAC control system runs an error check at twenty 453 minutes after the beginning of the hour. The system will use the light intensity sensor inside the room 454 to detect if the room is at use or closed. If the room is closed and the HVAC unit is turned on, then 455 the system will turn off the unit. Otherwise, it will take one of the last three actions presented before: 456 turn on at cold, turn on at heat or turn on the 5 minutes monitoring. 457
The 5 minutes monitoring system is activated every time occupancy is expected or the room is 458 open and when the temperature in between 21˚ C and 25.5˚ C. In these conditions the HVAC unit 459 will not be turned on. Therefore, a monitoring process is activated and run every 5 minutes to check 460 the room’s temperature and if the temperature overpasses or underpasses the range between 21˚ C 461 and 25.5˚ C, then the HVAC unit will be turned on. 462
4. Proposed architecture deployment 463
In this section will be described the subsystems deployment in our office building, as well as the 464 IoH work regarding metadata and users’ preferences. 465
4.1. Building’s description 466
The building’s layout where IoH was deployed is shown in Figure 14. There are no doors 467 between Entrance, Hall, and Hallway, the drawn walls between these zones only represent a logical 468 separation. The intelligent persons counter system is located in the border between the Hall and the 469 Hallway, meaning that people in Entrance, WCs, Hall, and Kitchen are not counted. The location of 470 the integrated IoT devices and other subsystems can be found in Table 1. 471
The building is daily used by around 15 persons, between researchers and students. The last two 472 rooms in the building, N 113 and N 114, are two working laboratories, while N 111, N 112, N 115 and 473 N 116 are researchers’ offices. 474
475
476 Figure 14. Building's layout, IoH subsystems, and devices deployment 477
4.2. Integration metadata 478
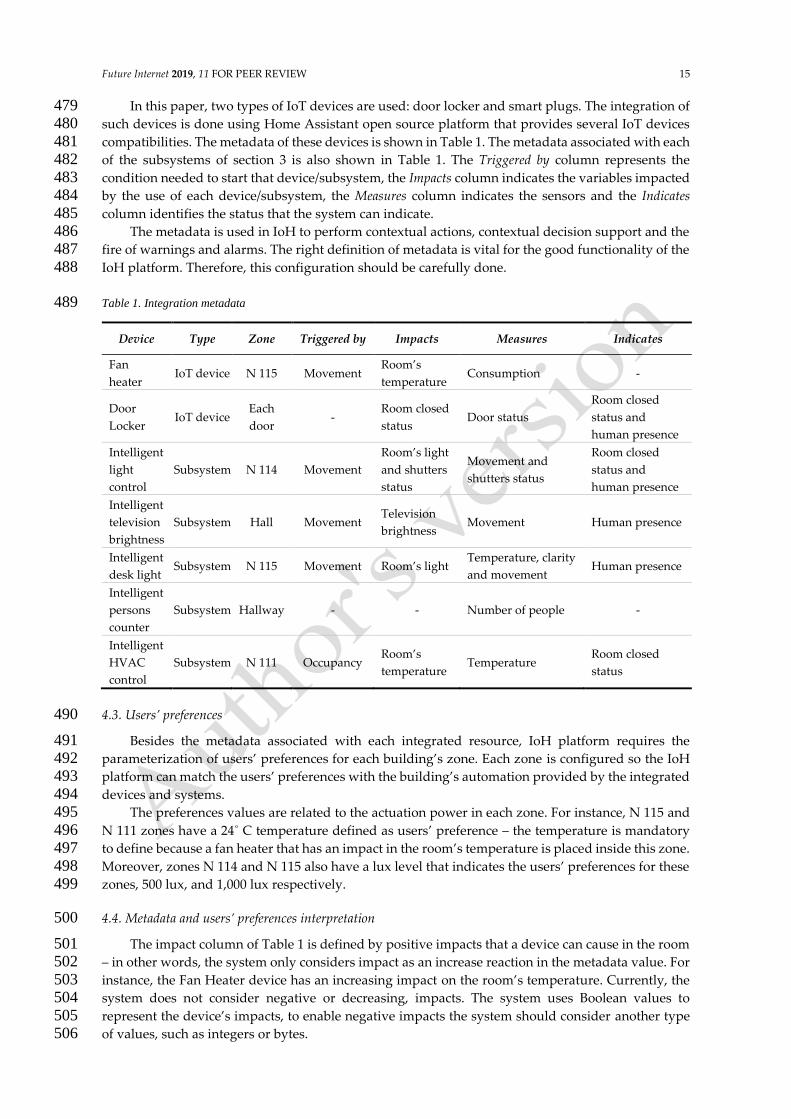
Future Internet 2019, 11 FOR PEER REVIEW 15
In this paper, two types of IoT devices are used: door locker and smart plugs. The integration of 479 such devices is done using Home Assistant open source platform that provides several IoT devices 480 compatibilities. The metadata of these devices is shown in Table 1. The metadata associated with each 481 of the subsystems of section 3 is also shown in Table 1. The Triggered by column represents the 482 condition needed to start that device/subsystem, the Impacts column indicates the variables impacted 483 by the use of each device/subsystem, the Measures column indicates the sensors and the Indicates 484 column identifies the status that the system can indicate. 485
The metadata is used in IoH to perform contextual actions, contextual decision support and the 486 fire of warnings and alarms. The right definition of metadata is vital for the good functionality of the 487 IoH platform. Therefore, this configuration should be carefully done. 488
Table 1. Integration metadata 489
Device Type Zone Triggered by Impacts Measures Indicates
Fan
heater IoT device N 115 Movement
Room’s
temperature Consumption -
Door
Locker IoT device
Each
door -
Room closed
status Door status
Room closed
status and
human presence
Intelligent
light
control
Subsystem N 114 Movement
Room’s light
and shutters
status
Movement and
shutters status
Room closed
status and
human presence
Intelligent
television
brightness
Subsystem Hall Movement Television
brightness Movement Human presence
Intelligent
desk light Subsystem N 115 Movement Room’s light
Temperature, clarity
and movement Human presence
Intelligent
persons
counter
Subsystem Hallway - - Number of people -
Intelligent
HVAC
control
Subsystem N 111 Occupancy Room’s
temperature Temperature
Room closed
status
4.3. Users’ preferences 490
Besides the metadata associated with each integrated resource, IoH platform requires the 491 parameterization of users’ preferences for each building’s zone. Each zone is configured so the IoH 492 platform can match the users’ preferences with the building’s automation provided by the integrated 493 devices and systems. 494
The preferences values are related to the actuation power in each zone. For instance, N 115 and 495 N 111 zones have a 24˚ C temperature defined as users’ preference – the temperature is mandatory 496 to define because a fan heater that has an impact in the room’s temperature is placed inside this zone. 497 Moreover, zones N 114 and N 115 also have a lux level that indicates the users’ preferences for these 498 zones, 500 lux, and 1,000 lux respectively. 499
4.4. Metadata and users’ preferences interpretation 500
The impact column of Table 1 is defined by positive impacts that a device can cause in the room 501 – in other words, the system only considers impact as an increase reaction in the metadata value. For 502 instance, the Fan Heater device has an increasing impact on the room’s temperature. Currently, the 503 system does not consider negative or decreasing, impacts. The system uses Boolean values to 504 represent the device’s impacts, to enable negative impacts the system should consider another type 505 of values, such as integers or bytes. 506

Future Internet 2019, 11 FOR PEER REVIEW 16
The system uses metadata to combine same zone devices according to the measured values and 507 the impacted values. In this case, only two matches are found: 508
• The temperatures value measured by the Intelligent desk light are affected by the Fan heater; 509 • The shutters status measured by the Intelligent light control are affected by the same device; 510
Intelligent light control. 511 The users’ preferences enter the system as triggered values that are able to turn off subsystems. 512
For instance, if the temperature of room N 115 reaches 24˚ C, IoH will automatically turn off the 513 heating devices of that room (i.e., Fan heater). Moreover, IoH can manage subsystems according to 514 users’ preferences, as will be seen in section 5.3. To enable this control, the same mapping of 515 measured/impact is performed between users’ preferences and the devices’ impact values. The final 516 matches are: 517
• The Fan heater device has an impact in the temperature of office N 115, where the users’ 518 preference is established for 24˚ C; 519
• Intelligent HVAC control subsystem has an impact in the temperature of office N 111, where 520 the users’ preference is established for 24˚ C; 521
• Intelligent light control subsystem has an impact in the light of office N114, that is defined 522 for 500 lux in the users’ preferences; 523
• Intelligent desk light subsystem has an impact in the light of office N115, that is defined for 524 1,000 lux in the users’ preferences. 525
The mapping between measured values and impact values, and the mapping between measured 526 values and users’ preferences enable the smart control of IoH using third-party devices and 527 subsystems. IoH will actuate on top of these devices and subsystems to provide a top-level control to 528 improve users’ comfort. IoH is also able to produce security warnings and alarms, as will be seen in 529 sections 5.4 and 5.5. 530
5. Results 531
The presented results of this section take into account the deployment of the IoH platform in one 532 of our buildings. The building layout and description are presented in section 4. 533
5.1. Intelligent persons counter system results 534
The intelligent persons counter system, as previously explained, uses a webcam feed to detect 535 persons and movements. The system also uses generation and inside light measures to conduct a 536 counting reset. The presented results report a working day with 15 persons at the building. Because 537 there is no official schedule, people usually start their work between 9:00 a.m. and 10:30 a.m. and 538 finish it between 5:30 p.m. and 6:30 p.m. 539
The presented results, shown in Figure 15, represents the values read from 6:00 a.m. and 9:30 540 p.m. The chosen day presents a counting error where the system was not able to rightly count the left 541 of the people, resulting in a counting error after everyone is leaving. This enables us to see the reset 542 working. The reset mechanism is performed every five minutes and it was triggered at 9:10 p.m. 543 when the generation reaches 0 W, inside light was 0 lux and the counter was different than 0. 544
545 Figure 15. Persons counter chart 546
5.2. Intelligent television brightness control results 547

Future Internet 2019, 11 FOR PEER REVIEW 17
The intelligent television brightness control works 24 hours a day. However, the television smart 548 plug has an internal schedule that turns on the television between 8:00 a.m. and 8:00 p.m. The results 549 of Figure 16 chart disregard the night period – where the television is off – and only considers values 550 from 7:30 a.m. to 8:30 p.m. The television consumption varies from 35 W, in its lowest brightness, and 551 95 W, in its highest brightness. 552
At 8:00 a.m., the smart plug turns on the television and by default, the television will use the 553 power mode where the brightness is highest. However, the intelligent television brightness control 554 will read the smart plug’s consumption and detect that the television is in its highest brightness mode 555 even though there was no movement in the last five minutes. As result, the system will change the 556 television power mode to the lowest brightness, resulting in a consumption reduction. The power 557 mode with the highest brightness will be used every time the system detects movement. 558
559 Figure 16. Television consumption chart 560
As can be seen in Figure 14, the hall – where the television is placed – is near the persons 561 intelligent counting system. Therefore, the detection of movement near television will almost result 562 in a passage of people in the counter system. And for that reason, the movement shown in Figure 16 563 chart can be overlapped in the counter system chart of Figure 15. 564
5.3. IoH zone heater control results 565
IoH platform enables the combination between the integrated devices and subsystems using 566 their metadata. This section will show how IoH can control an IoT device using the data feeding from 567 a subsystem. 568
In this case, a smart plug is connected to a fan heater in the same room where the intelligent desk 569 light control system is located. The metadata of the fan heater smart plug indicates an impact in the 570 temperature while the intelligent desk light control system is defined in its metadata as having a 571 temperature sensor. Metadata of both also defined the same room as their building’s position. 572 Moreover, the metadata of the fan heater indicates movement as the actuator signal. By combining 573 their metadata with the users’ preferences set in IoH platform, it is possible to automatically control 574 the fan heater to provide the user’s desired room’s temperature in an autonomous and contextual 575 way. 576
Figure 17 shows the IoH control over the fan heater. The user of this room passes in the counter 577 system at 10:14 a.m., as can be seen in Figure 15, and is detected close to the television system at the 578 same time, as can be seen in Figure 16. When the user is detected in the desk light control system, the 579 IoH checks the room’s temperature and matches the real-time value with the user’s preference of 24˚ 580 C. If the real-time temperate falls under the desired temperature, then the fan heater’s smart plug is 581 turned on. The heater consumption, after it is turned on, is shown in the Figure 17 chart at 10:15 a.m. 582 When the temperature reaches the user’s preference temperature, the fan heater is turned off. After 583 the fan heater is turned off the room’s temperature slightly decreases because the air flow was 584 stopped. 585

Future Internet 2019, 11 FOR PEER REVIEW 18
586 Figure 17. IoH heater control 587
The zone heater control was performed entirely by the IoH platform using the metadata of the 588 integrated IoT device – smart plug – and the intelligent desk light control subsystem. The user only 589 needed to set the room’s temperature preference and the system was able to automatically control 590 the heater according to the room’s context. 591
5.4. IoH building’s “not secure” warning system 592
IoH platform is also able to fire warnings and alarms using the metadata of the integrated 593 devices and subsystems. In this section, the IoH capability of firing warnings regarding dangerous 594 situations is described. By default, IoH checks if the building is closed when there is no person inside 595 and fires a warning if the security check did get some unclosed zone/room. 596
The building’s not secure warning system monitors the number of persons inside the building. 597 The warning is fired locally in the IoH graphical interfaces and if the user does not overwrite or solve 598 the problem, then IoH will send an email warning all IoH building’s administrators. 599
The warning uses the metadata from the intelligent persons counter system to read the number 600 of persons inside the building and then will check the building’s status using the “room closed” 601 indication in metadata from: 602
• Doors’ lockers – this IoT resource provides information regarding the doors’ status (i.e. if open 603 or closed); 604
• Intelligent light control – this subsystem provides the current status of the windows; 605 • Intelligent HVAC control – this subsystem provides information regarding the current status 606
of the air conditioner. 607 Using the chart of Figure 15, IoH will check if the building is closed at 9:10 p.m., when the people 608
counter goes to zero. At this time, the IoH platform will check the defined “room closed” indication 609 metadata to see if there is something open, and if so, it will show a warning in the graphical interfaces. 610
5.5. IoH building’s intrusion alarm system 611
The building’s intrusion alarm system detects unexpected intrusions in the building when it 612 should be closed. The IoH building’s intrusion alarm system is an event-driven monitoring process 613 that is running when the persons counter is equal to zero. Unlike the previous warning system, the 614 alarm system listens to the building’s status changes that represent human activity. The alarm system 615 uses email to communicate with the IoH administrator users. 616
When the person counter is zero, the IoH platform will monitor changes in the “human presence” 617 indication metadata and the alarm will be the trigger if some change is detected. The integrated 618 devices and subsystems that will be monitor are: 619
• Doors’ lockers – these devices are able to detect the opening of the door when no one was 620 supposed to be inside the building; 621
• Intelligent light control – the PIR sensors provide the movement detection inside the room; 622 • Intelligent desk light control – this subsystem can detect a person in the desk. 623 The PIR sensor of the intelligent television brightness control subsystem is not used because it is 624
placed before the intelligent persons counter system. Therefore, this PIR is always triggered before 625 the first person enters the building, and because of that, the PIR is not monitored in the building’s 626 intrusion alarm system. 627

Future Internet 2019, 11 FOR PEER REVIEW 19
6. Conclusions 628
This paper proposes a new Intelligent of Home (IoH) platform architecture. The IoH platform 629 does not provide the development and specification of hardware, enabling the exclusive use of third-630 party hardware. The platform enables the integration of third-party devices – sensors and/or 631 actuators – and systems. The use of integrated devices and systems is done by describing each 632 integration with metadata that will be matched and used in IoH platform. 633
The main goal of this paper is the proof of concept of IoH platform regarding the context 634 awareness capabilities. The results of the IoH zone heater control, the IoH building’s warning system, 635 and the IoH building’s intrusion alarm system proves the ability of IoH to combine multiple third-636 party devices and systems to achieve a contextual awareness solution. The combination of such 637 systems enables the interoperability and scalability of the system. 638
IoH is also oriented for considering ambient intelligence. Considering the 7 different phases of 639 the intelligent behavior in AmI Scenarios proposed in [24], we observe that they are all considered in 640 IoH, namely: 641
• Interpreting the Environment’s State (by using different types of raw sensors to detect 642 temperature, luminosity, and movement; or cameras); 643
• Representing the Information and Knowledge associated with the Environment (namely the 644 knowledge related with each subsystem presented in section 3); 645
• Modeling, Simulating and Representing Entities in the Environment (representation of all 646 systems in the home); 647
• Planning Decisions or Actions (planning the changes in different devices in a coordinated 648 mode); 649
• Learning about the Environment and associated aspects (the forecast of the room’s usage for 650 the HVAC system is a good example); 651
• Interacting with Humans (in the User Interface Layer available in the IoH subsystems); 652 • Acting on the Environment (by actuation in different systems like the lights, air conditioning, 653
windows shutters, and television brightness control). 654 The IoH platform will not replace hardware or software. IoH platform is a new layer for smart 655
homes that goes on top of the existing systems to provide contextual awareness am ambient 656 intelligence management. 657
Author Contributions: Conceptualization, L.G., C.R. and Z.V.; Methodology, L.G., C.R. and Z.V.; Software, L.G., 658 A.J., B.S. and L.P; Validation, L.G. and C.R.; Formal analysis, L.G.; Investigation, L.G., C.R., A.J., B.S., L.P. and 659 Z.V.; Resources, C.R. and Z.V.; Data curation, L.G. and C.R.; Writing-original draft, L.G. and C.R.; Writing-660 review & editing, L.G., C.R., A.J., B.S., L.P. and Z.V.; Visualization, L.G. and C.R.; Supervision, C.R. and Z.V.; 661 Project administration, C.R. and Z.V.; Funding acquisition, C.R. and Z.V.; 662
Funding: The present work has been developed under the EUREKA - ITEA2 Project M2MGrids (ITEA-13011), 663 Project SIMOCE (ANI|P2020 17690), and has received funding from FEDER Funds through COMPETE program 664 and from National Funds through FCT under the project UID/EEA/00760/2019 and SFRH/BD/109248/2015. 665
Conflicts of Interest: The authors declare no conflict of interest. The funders had no role in the design of the 666 study; in the collection, analyses, or interpretation of data; in the writing of the manuscript, or in the decision to 667 publish the results. 668
References 669
1. Vujović, V.; Maksimović, M. Raspberry Pi as a Sensor Web node for home automation. Computers & 670 Electrical Engineering 2015, 44, 153-171. Doi: 10.1109/TASE.2018.2789658 671
2. Gomes, L.; Sousa, F.; Vale, Z. An Intelligent Smart Plug with Shared Knowledge Capabilities. Sensors 2018, 672 18, 3961.; Doi: 10.3390/s18113961 673
3. Khalid, R.; Javaid, N.; Hassan Rahim, M.; Aslam, S.; Sher, A. Fuzzy energy management controller and 674 scheduler for smart homes. Sustainable Computing: Informatics and Systems 2019, 21, 103-118. Doi: 675 10.1016/j.suscom.2018.11.010 676
Future Internet 2019, 11 FOR PEER REVIEW 20
4. Joo; Choi, D. Distributed Optimization Framework for Energy Management of Multiple Smart Homes With 677 Distributed Energy Resources. IEEE Access 2017, 5, 15551-15560. Doi: 10.1109/ACCESS.2017.2734911 678
5. Wu, X.; Hu, S.; Yin, X.; Moura, S. J. Stochastic Optimal Energy Management of Smart Home With PEV 679 Energy Storage. IEEE Transactions on Smart Grid 2018, 9, 2065-2075. Doi: 10.1109/TSG.2016.2606442 680
6. Gomes, L.; Faria, P.; Fernandes, F.; Vale Z.; Ramos, C. Domestic consumption simulation and management 681 using a continuous consumption management and optimization algorithm., Proceedings of the 2014 IEEE 682 PES T&D Conference and Exposition, Chicago, IL, 14-17 April 2014; 1-5. 683 doi: 10.1109/TDC.2014.6863204 684
7. Heartfield, R.; Loukas, G.; Budimir, S.; Bezemskij, A.; Fontaine, J.R.J.; Filippoupolitis, A.; Roesch, E. A 685 taxonomy of cyber-physical threats and impact in the smart. Computers & Security 2018, 78, 398-428. Doi: 686 10.1016/j.cose.2018.07.011 687
8. Al-Ali, R.; Zualkernan, I.A.; Lasfer, A.; Chreide, A.; Abu Ouda, H. GRPS-based distributed home-688 monitoring using internet-based geographical information system. IEEE Transactions on Consumer 689 Electronics 2011, 57, 1688-1694,. Doi: 10.1109/TCE.2011.6131142 690
9. Yared, R.; Abdulrazak, B. Adaptable Context-Aware Cooking-Safe System. IEEE Transactions on Services 691 Computing 2018, 11, 236-248. Doi: 10.1109/TSC.2017.2662941 692
10. Demir, E.; Köseoğlu, E.; Sokullu, R.; Şeker, B. Smart Home Assistant for Ambient Assisted Living of Elderly 693 People with Dementia. Procedia Computer Science 2017, 113, 609-614. Doi: 10.1016/j.procs.2017.08.302 694
11. Rafferty, J.; Nugent, C. D.; Liu, J.; Chen, L. From Activity Recognition to Intention Recognition for Assisted 695 Living Within Smart Homes. IEEE Transactions on Human-Machine Systems 2017, 7, 368-379. Doi: 696 10.1109/THMS.2016.2641388 697
12. Ghayvat, H.; Liu, J.; Mukhopadhyay, S. C.; Gui, X. Wellness Sensor Networks: A Proposal and 698 Implementation for Smart Home for Assisted Living. IEEE Sensors Journal 2015, 15, 7341-7348. Doi: 699 10.1109/JSEN.2015.2475626 700
13. Fernandes, F.; Morais, H.; Vale, Z.; Ramos, C. Dynamic load management in a smart home to participate in 701 demand response events, Energy and Buildings 2014, 82, 592-606. Doi: 10.1016/j.enbuild.2014.07.067 702
14. Gomes, L.; Fernandes, F.; Vale, Z.; Faria, F.; Ramos, C. A learning algorithm and system approach to 703 address exceptional events in domestic consumption management., Proceedings of the 2014 IEEE 704 Symposium on Computational Intelligence Applications in Smart Grid (CIASG), Orlando, FL,9-12 705 December 2014; 1-7. Doi: 10.1109/CIASG.2014.7011564 706
15. Faria, P.; Vale, Z. Demand response in electrical energy supply: An optimal real time pricing approach. 707 Energy 2011, 36, 5374-5384. Doi: 10.1016/j.energy.2011.06.049 708
16. Bonino, D.; Corno, F.; DoMAIns: Domain-based modeling for Ambient Intelligence. Pervasive and Mobile 709 Computing 2012, 8, 614-628. Doi: 10.1016/j.pmcj.2011.10.009 710
17. Roda, C.; Rodríguez, A.C.; López-Jaquero, V.; Navarro, E.; González, P. A Multi-Agent System for 711 Acquired Brain Injury rehabilitation in Ambient Intelligence environments. Neurocomputing 2017, 231, 712 Pages 11-18. Doi: 10.1016/j.neucom.2016.04.066 713
18. Makonin, S.; Bartram, L.; Popowich, F. A Smarter Smart Home: Case Studies of Ambient Intelligence. IEEE 714 Pervasive Computing 2012, 12, 58-66. Doi: 10.1109/MPRV.2012.58 715
19. Ramos, C.; Marreiros, G.; Santos, R.; Freitas, C.F. Smart Offices and Intelligent Decision Rooms. In Handbook 716 of Ambient Intelligence and Smart Environments; Hideyuki Nakashima, Hamid Aghajan, Hamid Aghajan; 717 Springer: Boston, MA, United Stated of America, 2010, 851-880. Doi: 10.1007/978-0-387-93808-0_32 718
20. Paola, A.; Gaglio, S.; Lo Re, G.; Ortolani, M. Sensor9k : A testbed for designing and experimenting with 719 WSN-based ambient intelligence applications. Pervasive and Mobile Computing 2012, 8, 448-466. Doi: 720 10.1016/j.pmcj.2011.02.006 721
21. Alex, H.; Kumar, M.; Shirazi, B. MidFusion: An adaptive middleware for information fusion in sensor 722 network applications. Information Fusion 2008, 9, 332-343. Doi: 10.1016/j.inffus.2005.05.007 723
22. Machado, A.; Maran, V.; Augustin, I.; Krug Wives, L.; Moreira de Oliveira, J.P. Reactive, proactive, and 724 extensible situation-awareness in ambient assisted living. Expert Systems with Applications 2017, 76, 21-35. 725 Doi: 10.1016/j.eswa.2017.01.033 726
23. Sorici, A.; Picard, G.; Boissier, O.; Zimmermann, A.; Florea, A. CONSERT: Applying semantic web 727 technologies to context modeling in ambient intelligence. Computers & Electrical Engineering 2015, 44, 280-728 306. Doi: 10.1016/j.compeleceng.2015.03.012 729

Future Internet 2019, 11 FOR PEER REVIEW 21
24. Ramos, C.; Augusto, J.C.; Shapiro, D. Ambient Intelligence—the Next Step for Artificial Intelligence. IEEE 730 Intelligent Systems 2008, 23, 15-18. Doi: 10.1109/MIS.2008.19 731
25. Obukata, R.; Oda, T.; Elmazi, D.; Barolli, L.; Matsuo, K.; Woungang, I. Performance Evaluation of an 732 Ambient Intelligence Testbed for Improving Quality of Life: Evaluation Using Clustering Approach., 733 Proceedings of the 2016 10th International Conference on Complex, Intelligent, and Software Intensive 734 Systems (CISIS), Fukuoka, 6-8 July 2016; 484-487. Doi: 10.1109/CISIS.2016.59 735
26. Hui, T.K.L.; Sherratt, R.S.; Díaz Sánchez, D. Major requirements for building Smart Homes in Smart Cities 736 based on Internet of Things technologies. Future Generation Computer Systems 2016, 76, 358-369. Doi: 737 10.1016/j.future.2016.10.026 738
27. Gómez, A.; Cuiñas, D.; Catalá, P.; Xin, L.; Li, W.; Conway, S.; Lack, D. Use of Single Board Computers as 739 Smart Sensors in the Manufacturing Industry. Procedia Engineering 2015, 132, 153-159. Doi: 740 10.1016/j.proeng.2015.12.461 741
28. Prasad Gochhayat, S.; Kaliyar, P.; Conti, M.; Tiwari, P.; Prasath, V.B.S.; Gupta, D.; Khanna, A. LISA: 742 Lightweight context-aware IoT service architecture. Journal of Cleaner Production 2019, 212, 1345-1356. Doi: 743 10.1016/j.jclepro.2018.12.096 744
29. Datta, S. K.; Bonnet, C.; Nikaein, N. An IoT gateway centric architecture to provide novel M2M services, 745 Proceedings of the 2014 IEEE World Forum on Internet of Things (WF-IoT), Seoul, South Korea, 6-8 March 746 2014, 514-519. Doi: 10.1109/WF-IoT.2014.6803221 747
30. Vallati, C.; Mingozzi, E.; Tanganelli, G.; Buonaccorsi, N.; Valdambrini, N.; Zonidis, N.; Martínez, B.; 748 Mamelli, A.; Sommacampagna, D.; Anggorojati, B.; Kyriazakos, S.; Prasad, N.; Javier Nieto, F.; Barreto 749 Rodriguez, O. BETaaS: A Platform for Development and Execution of Machine-to-Machine Applications 750 in the Internet of Things. In Wireless Personal Communications (2016) 87: 1071. 751 https://doi.org/10.1007/s11277-015-2639-0 752
31. Mocnej, J.; Seah, W.K.G.; Pekar, A.; Zolotova, I. Decentralised IoT Architecture for Efficient Resources 753 Utilisation. IFAC-PapersOnLine 2018, 51, 168-173. Doi: 10.1016/j.ifacol.2018.07.148 754
32. Statista. Smart Home Report 2018—Control and Connectivity; Statista: Hamburg, Germany, 2018. 755 33. Recommended Light Levels (Illuminance) for Outdoor and Indoor Venues, Available online: 756
https://www.noao.edu/education/QLTkit/ACTIVITY_Documents/Safety/LightLevels_outdoor+indoor.pd757 f (accessed on 31 December 2018). 758
34. Jozi, A.; Pinto, T.; Praça, I.; Silva, F.; Teixeira B.; Vale, Z. Energy consumption forecasting based on Hybrid 759 Neural Fuzzy Inference System., Proceedings of the 2016 IEEE Symposium Series on Computational 760 Intelligence (SSCI), Athens, 6-9 December 2016, pp. 1-5. Doi: 10.1109/SSCI.2016.7849859 761
35. Jozi, A.; Pinto, T.; Praça, I.; Z. Vale, Z. Day-ahead forecasting approach for energy consumption of an office 762 building using support vector machines., Proceedings of the 2018 IEEE Symposium Series on 763 Computational Intelligence (SSCI), Bengaluru, India, 18-21 November 2018, pp. 1-6. 764
765
© 2018 by the authors. Submitted for possible open access publication under the terms
and conditions of the Creative Commons Attribution (CC BY) license
(http://creativecommons.org/licenses/by/4.0/).
766

Luis Gomes
Lightweight Architecture for IoT Devices with Context-aware Autonomous Control
Authors: Bruno Serra, Luis Gomes, and Zita Vale
Published in: Proceedings of the IEEE Wireless Communications and Networking Conference
DOI: 10.1109/WCNCW.2019.8902882
Published at: April 2019
PhD timeline: M33
XXX-X-XXXX-XXXX-X/XX/$XX.00 ©20XX IEEE
Lightweight Architecture for IoT Devices with
Context-aware Autonomous Control
Bruno Serra
GECAD
Polytechnic of Porto (ISEP/IPP)
Porto, Portugal
Luis Gomes
GECAD
Polytechnic of Porto (ISEP/IPP)
Porto, Portugal
https://orcid.org/0000-0002-8597-3383
Zita Vale
GECAD
Polytechnic of Porto (ISEP/IPP)
Porto, Portugal
https://orcid.org/0000-0002-4560-9544
Abstract—The integration of the Internet of Things (IoT)
devices in our buildings is already a reality and the
dissemination of such devices would grow in the future.
However, much of these devices deal with remote monitoring
and/or control without an intrinsic context-aware control. This
paper proposes hardware and software architectures for the
development of IoT devices with context-aware autonomous
control. The efficient and effective control, of the proposed
architectures, is demonstrated using two scenarios where one
television and one air conditioner unit are controlled according
to their contexts. The context-aware control can increase users’
comfort while decreases the use of appliances and resources,
resulting in a decrease in energy consumption.
Keywords — Internet of things, context awareness,
autonomous control
I. INTRODUCTION
Internet of Things (IoT) devices are spreading in our homes, buildings, and cities, creating the opportunity to have smart homes, smart buildings and smart cities. In the current market is easy to find a vast application of IoT devices from door lockers to garden monitoring devices. However, these devices mainly provide remote monitoring and control.
The word ‘smart’ was been placed in front of old, and usually common, names, such as smart homes [1]. This concept promises to revolutionize our homes and the way we interact with them. Smart homes can improve, between others, home automation, living, and energy management. In [2] an environmental awareness smart plug with shared knowledge is proposed to decrease the energy consumption in a fully distributed system using resource automation. In [3] a system is proposed for elderly tracking, supporting people with dementia. In [4] an ontology is proposed as part of a constraint satisfaction problem for resource optimization in a smart home.
As stated before, the current market is full of these relatively new products that can bring a new life to our homes and pave the way to smart homes. Is expected that by 2022 a total of 216.9 million homes will have at least one smart device [5]. This is a market in expansion and therefore it is easy to find the biggest companies trying to get their piece. From the conventional smart plugs to smart rice machine of Xiaomi, almost everything is getting smarter.
The IoT devices in the market are many and increasingly cheaper. However, they have a problem regarding compatibility with each other. The current solution is the integration of all our devices in a centralized system. This demands another centralized system and does not guarantee
the integration of all IoT devices. Smart voice control systems, like Google Home, Amazon Alexa, and Apple HomePod can usually do the job of aggregating multiple IoT devices from several manufacturers.
If an open source solution is required, is possible to use the Home Assistant platform that enables the integration of multiple devices and communication protocols [6]. Home Assistant does not provide voice control, but it allows the integration of Google Assistant and Amazon Alexa. An open source solution for voice assistant is also possible using Mycroft AI [7].
Another option to integrate several IoT devices is by buying everything from the same manufacturer, limiting the available market offer. By integrating several IoT devices, is possible to have context-aware control over some devices. For instance, is possible to turn off a heater’s smart plug if the room’s temperature rises above a set value. Using IFTTT service (If This Then That) is also possible to define some actions regarding context. However, all these solutions are centralized and somewhat limited, being basically if actions.
Context-Aware control and ambient intelligent systems can change the way we see systems. The ability to change their status according to its context provide a better fit within its environment. Moreover, systems with such capabilities can improve users’ comfort and experience. An example of that is presented in [8] where an energy management system is proposed to minimize energy consumption by solving an optimization problem with multiple comfort constraints to maintain the multiuser comfort. In [9], is proposed a top-level architecture for IoT devices to provide services to users. Gateway-enabled architectures are proposed in [10] and [11], simplifying the development of horizontal platforms. Another approach is proposed in [12], where a decentralized architecture is used for resources’ utilization optimization.
This paper proposes a hardware architecture for an IoT device with context-aware autonomous control over an electrical appliance/resource. The proposed architecture focus on simplicity and efficiency regarding context-aware control. This paper also presents the software architecture that should be implemented inside the processing unit of the hardware architecture. The software architecture provides the necessary layers to enable context-aware autonomous control. The main contribution of this paper is the proposal of a lightweight, functional and complete solution for an IoT device with context-aware autonomous control over an individual electrical resource.
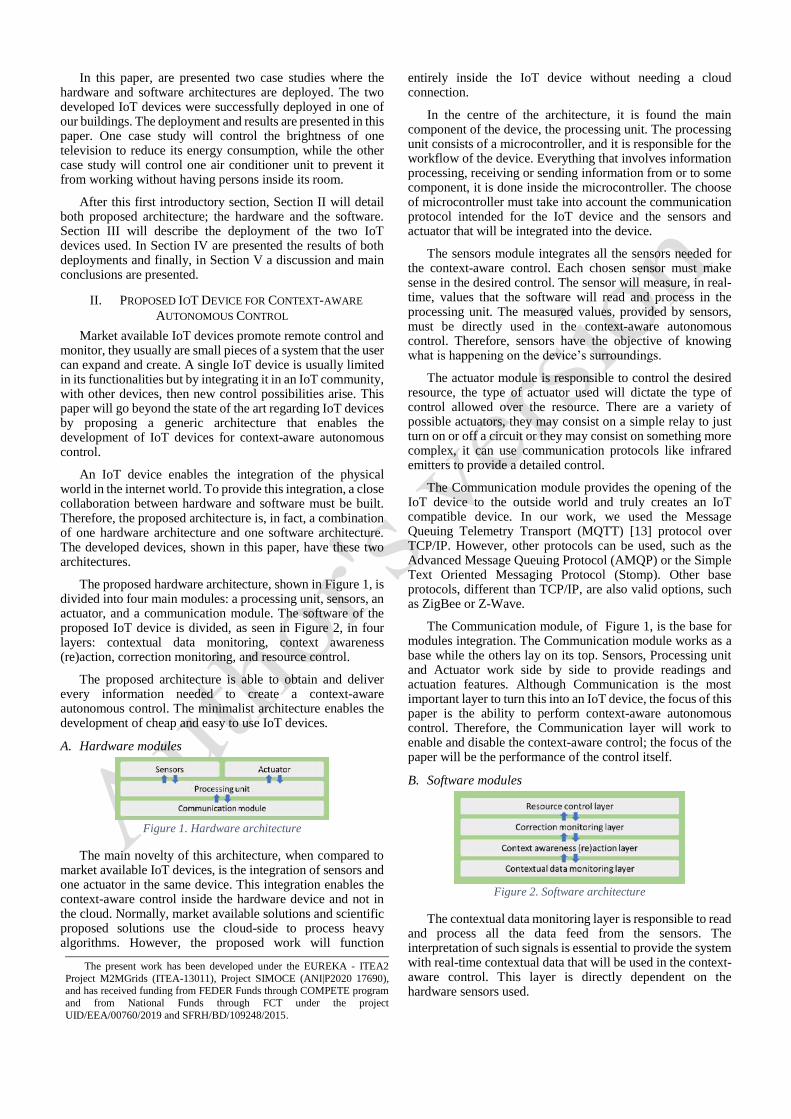
In this paper, are presented two case studies where the hardware and software architectures are deployed. The two developed IoT devices were successfully deployed in one of our buildings. The deployment and results are presented in this paper. One case study will control the brightness of one television to reduce its energy consumption, while the other case study will control one air conditioner unit to prevent it from working without having persons inside its room.
After this first introductory section, Section II will detail both proposed architecture; the hardware and the software. Section III will describe the deployment of the two IoT devices used. In Section IV are presented the results of both deployments and finally, in Section V a discussion and main conclusions are presented.
II. PROPOSED IOT DEVICE FOR CONTEXT-AWARE
AUTONOMOUS CONTROL
Market available IoT devices promote remote control and monitor, they usually are small pieces of a system that the user can expand and create. A single IoT device is usually limited in its functionalities but by integrating it in an IoT community, with other devices, then new control possibilities arise. This paper will go beyond the state of the art regarding IoT devices by proposing a generic architecture that enables the development of IoT devices for context-aware autonomous control.
An IoT device enables the integration of the physical world in the internet world. To provide this integration, a close collaboration between hardware and software must be built. Therefore, the proposed architecture is, in fact, a combination of one hardware architecture and one software architecture. The developed devices, shown in this paper, have these two architectures.
The proposed hardware architecture, shown in Figure 1, is divided into four main modules: a processing unit, sensors, an actuator, and a communication module. The software of the proposed IoT device is divided, as seen in Figure 2, in four layers: contextual data monitoring, context awareness (re)action, correction monitoring, and resource control.
The proposed architecture is able to obtain and deliver every information needed to create a context-aware autonomous control. The minimalist architecture enables the development of cheap and easy to use IoT devices.
A. Hardware modules
Figure 1. Hardware architecture
The main novelty of this architecture, when compared to market available IoT devices, is the integration of sensors and one actuator in the same device. This integration enables the context-aware control inside the hardware device and not in the cloud. Normally, market available solutions and scientific proposed solutions use the cloud-side to process heavy algorithms. However, the proposed work will function
entirely inside the IoT device without needing a cloud connection.
In the centre of the architecture, it is found the main component of the device, the processing unit. The processing unit consists of a microcontroller, and it is responsible for the workflow of the device. Everything that involves information processing, receiving or sending information from or to some component, it is done inside the microcontroller. The choose of microcontroller must take into account the communication protocol intended for the IoT device and the sensors and actuator that will be integrated into the device.
The sensors module integrates all the sensors needed for the context-aware control. Each chosen sensor must make sense in the desired control. The sensor will measure, in real-time, values that the software will read and process in the processing unit. The measured values, provided by sensors, must be directly used in the context-aware autonomous control. Therefore, sensors have the objective of knowing what is happening on the device’s surroundings.
The actuator module is responsible to control the desired resource, the type of actuator used will dictate the type of control allowed over the resource. There are a variety of possible actuators, they may consist on a simple relay to just turn on or off a circuit or they may consist on something more complex, it can use communication protocols like infrared emitters to provide a detailed control.
The Communication module provides the opening of the IoT device to the outside world and truly creates an IoT compatible device. In our work, we used the Message Queuing Telemetry Transport (MQTT) [13] protocol over TCP/IP. However, other protocols can be used, such as the Advanced Message Queuing Protocol (AMQP) or the Simple Text Oriented Messaging Protocol (Stomp). Other base protocols, different than TCP/IP, are also valid options, such as ZigBee or Z-Wave.
The Communication module, of Figure 1, is the base for modules integration. The Communication module works as a base while the others lay on its top. Sensors, Processing unit and Actuator work side by side to provide readings and actuation features. Although Communication is the most important layer to turn this into an IoT device, the focus of this paper is the ability to perform context-aware autonomous control. Therefore, the Communication layer will work to enable and disable the context-aware control; the focus of the paper will be the performance of the control itself.
B. Software modules
Figure 2. Software architecture
The contextual data monitoring layer is responsible to read and process all the data feed from the sensors. The interpretation of such signals is essential to provide the system with real-time contextual data that will be used in the context-aware control. This layer is directly dependent on the hardware sensors used.
The present work has been developed under the EUREKA - ITEA2
Project M2MGrids (ITEA-13011), Project SIMOCE (ANI|P2020 17690),
and has received funding from FEDER Funds through COMPETE program
and from National Funds through FCT under the project
UID/EEA/00760/2019 and SFRH/BD/109248/2015.
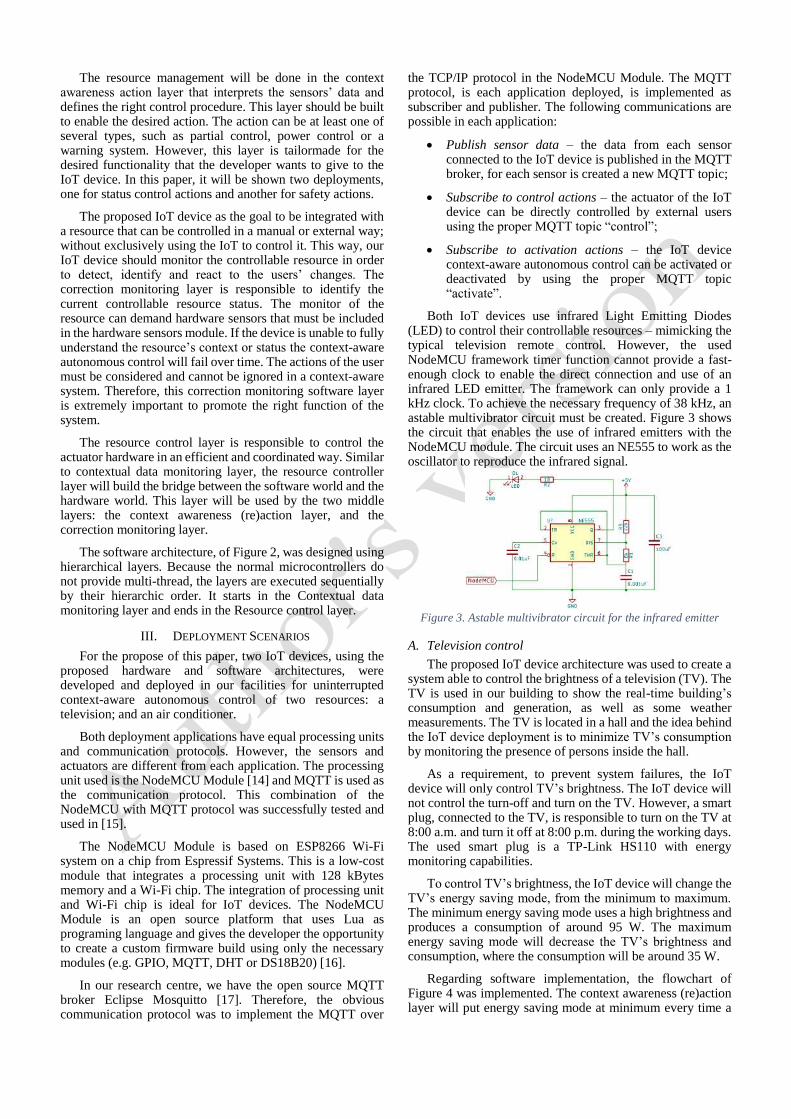
The resource management will be done in the context awareness action layer that interprets the sensors’ data and defines the right control procedure. This layer should be built to enable the desired action. The action can be at least one of several types, such as partial control, power control or a warning system. However, this layer is tailormade for the desired functionality that the developer wants to give to the IoT device. In this paper, it will be shown two deployments, one for status control actions and another for safety actions.
The proposed IoT device as the goal to be integrated with a resource that can be controlled in a manual or external way; without exclusively using the IoT to control it. This way, our IoT device should monitor the controllable resource in order to detect, identify and react to the users’ changes. The correction monitoring layer is responsible to identify the current controllable resource status. The monitor of the resource can demand hardware sensors that must be included in the hardware sensors module. If the device is unable to fully understand the resource’s context or status the context-aware autonomous control will fail over time. The actions of the user must be considered and cannot be ignored in a context-aware system. Therefore, this correction monitoring software layer is extremely important to promote the right function of the system.
The resource control layer is responsible to control the actuator hardware in an efficient and coordinated way. Similar to contextual data monitoring layer, the resource controller layer will build the bridge between the software world and the hardware world. This layer will be used by the two middle layers: the context awareness (re)action layer, and the correction monitoring layer.
The software architecture, of Figure 2, was designed using hierarchical layers. Because the normal microcontrollers do not provide multi-thread, the layers are executed sequentially by their hierarchic order. It starts in the Contextual data monitoring layer and ends in the Resource control layer.
III. DEPLOYMENT SCENARIOS
For the propose of this paper, two IoT devices, using the proposed hardware and software architectures, were developed and deployed in our facilities for uninterrupted context-aware autonomous control of two resources: a television; and an air conditioner.
Both deployment applications have equal processing units and communication protocols. However, the sensors and actuators are different from each application. The processing unit used is the NodeMCU Module [14] and MQTT is used as the communication protocol. This combination of the NodeMCU with MQTT protocol was successfully tested and used in [15].
The NodeMCU Module is based on ESP8266 Wi-Fi system on a chip from Espressif Systems. This is a low-cost module that integrates a processing unit with 128 kBytes memory and a Wi-Fi chip. The integration of processing unit and Wi-Fi chip is ideal for IoT devices. The NodeMCU Module is an open source platform that uses Lua as programing language and gives the developer the opportunity to create a custom firmware build using only the necessary modules (e.g. GPIO, MQTT, DHT or DS18B20) [16].
In our research centre, we have the open source MQTT broker Eclipse Mosquitto [17]. Therefore, the obvious communication protocol was to implement the MQTT over
the TCP/IP protocol in the NodeMCU Module. The MQTT protocol, is each application deployed, is implemented as subscriber and publisher. The following communications are possible in each application:
• Publish sensor data – the data from each sensor connected to the IoT device is published in the MQTT broker, for each sensor is created a new MQTT topic;
• Subscribe to control actions – the actuator of the IoT device can be directly controlled by external users using the proper MQTT topic “control”;
• Subscribe to activation actions – the IoT device context-aware autonomous control can be activated or deactivated by using the proper MQTT topic “activate”.
Both IoT devices use infrared Light Emitting Diodes (LED) to control their controllable resources – mimicking the typical television remote control. However, the used NodeMCU framework timer function cannot provide a fast-enough clock to enable the direct connection and use of an infrared LED emitter. The framework can only provide a 1 kHz clock. To achieve the necessary frequency of 38 kHz, an astable multivibrator circuit must be created. Figure 3 shows the circuit that enables the use of infrared emitters with the NodeMCU module. The circuit uses an NE555 to work as the oscillator to reproduce the infrared signal.
Figure 3. Astable multivibrator circuit for the infrared emitter
A. Television control
The proposed IoT device architecture was used to create a system able to control the brightness of a television (TV). The TV is used in our building to show the real-time building’s consumption and generation, as well as some weather measurements. The TV is located in a hall and the idea behind the IoT device deployment is to minimize TV’s consumption by monitoring the presence of persons inside the hall.
As a requirement, to prevent system failures, the IoT device will only control TV’s brightness. The IoT device will not control the turn-off and turn on the TV. However, a smart plug, connected to the TV, is responsible to turn on the TV at 8:00 a.m. and turn it off at 8:00 p.m. during the working days. The used smart plug is a TP-Link HS110 with energy monitoring capabilities.
To control TV’s brightness, the IoT device will change the TV’s energy saving mode, from the minimum to maximum. The minimum energy saving mode uses a high brightness and produces a consumption of around 95 W. The maximum energy saving mode will decrease the TV’s brightness and consumption, where the consumption will be around 35 W.
Regarding software implementation, the flowchart of Figure 4 was implemented. The context awareness (re)action layer will put energy saving mode at minimum every time a

person is detected in the hall and after 7 minutes without movement, the IoT device will change the TV to its maximum energy saving mode. When the PIR sensor detects someone in the hall, the IoT device sends a signal to change the energy saving mode, making it go to the maximum brightness mode (i.e. energy saving at minimum).
The correction monitoring layer will use the external energy sensor provided by the TP-Link HS110 smart plug. Using the TV’s consumption, the IoT device can detect the current TV’s energy saving mode and if the energy saving is not the desired, the IoT device can correct the TV’s energy saving mode. The correction monitor layer checks TV’s consumption every minute.
Figure 4. IoT device for television with the software layers
Figure 5 shows the TV’s menu where energy saving is chosen. In our system, only two energy saving modes are used. The LG TV used did not provide a direct infrared signal to switch from the energy saving mode.
Figure 5. Television's energy-saving menu
To change the energy saving mode, the following sequence of signals are needed to be emitted by the IoT device:
i. Open the energy saving menu – this infrared signal, opens the energy saving menu (Figure 5);
ii. Energy saving signal – after the menu is open, the same infrared signal is sent repeatedly to change the selected energy saving mode, the IoT device will use the data from the smart plug to identify the current energy saving mode and then calculate the necessary repetitions to achieve the desired energy saving mode;
iii. Ok signal – after the right selection, it is sent the ok signal to activate the selected energy saving mode.
B. Air conditioner control
The IoT device for air conditioner control was developed for security reasons to prevent unnecessary consumption while protecting the air conditioner unit from continuous use. In our laboratories, the air conditioner units are old and sometimes students and researchers let the units working through the night, weekends and holidays. For more than once, problems with the units appear because of the continuous operation. To prevent future problems, an IoT device was developed and deployed to detect if the room is closed and then turn off the air conditioner unit.
The IoT device is only able to turn off the air conditioner unit when it is operating in the context-aware autonomous control. If the room is empty and dark for 7 minutes, and if there is some consumption produced by the air conditioner unit, then the IoT device will send the turn-off infrared signal. The IoT device uses the room’s light to detect if the room is dark – meaning that the room was closed and there is not artificial or natural light. The IoT device also has a PIR sensor to detect movement in the room. Figure 6 shows the developed board used to control the air conditioner.
Figure 6. IoT device for the air conditioner unit
Because the hardware board for the television is similar to the air conditioner – only differentiate themselves because the use of DHT22 – the same board can be used in both case studies. However, the software is entirely different from each case study.
Following the modules of Figure 1, the air conditioner IoT device has: as processing unit a NodeMCU, as integrated sensors a PIR and a Light Dependent Resistor (LDR), as actuator four infrared LED, and has communication protocol MQTT.
To take the right advantages of such an IoT device, the board also included a DHT22 temperature and humidity module. All the sensor data is published in MQTT topics. Also, besides the turning off signal used in the context-aware autonomous control, the IoT device is able to send a complete set of signals to allow the entire remote control of the air conditioner unit.
Because NodeMCU has a limit flash memory size of 4 Mbytes; in its default version, the storage of all the air conditioner infrared signals was simply not possible. The solution was to use an external server to store all the infrared signals. Figure 7 shows the sequence diagram of the IoT device when receiving an MQTT message for air conditioner control, where the IoT device will query the external server for the right infrared code and then will emit the signal using the infrared LED. The external server was developed in Node.js using the Express module for a fast and easy implementation of a RESTful server.

Figure 7. Infrared signal request
The IoT device for the air conditioner was built for security and energy saving. It differs from the previous TV IoT device that demands a continuous operation. The air conditioner IoT device uses an alarm logic of detecting a specific situation and then act. The context awareness (re)action layer will identify the moment when the room is dark and without movement for more than 7 minutes and then it will turn the air conditioner off if it has consumption.
For this IoT device, the correction monitoring layer was not implemented. This layer is for continuous control in order to correct failures along the controlled period. Because the air conditioner IoT device assumes an alarm logic, there is no need for having a correction monitoring layer.
IV. DEPLOYMENT RESULTS
This section presents the results in each deployed IoT device. As will be seen, the proposed architecture was successfully developed, and the results demonstrate the efficiency of context-aware autonomous control in the television and the air conditioner unit.
A. Television deployment
As stated before, the television smart plug imposes a schedule from 8:00 a.m. to 8:00 p.m. Figure 8 shows the television consumption between 7:30 a.m. and 8:30 p.m. When the television is turned on using the smart plug scheduled control, their consumption goes to the maximum of 95 W. However, the IoT device’s correction monitoring layer will automatically detect the wrong consumption and change the energy saving to the minimum consumption of 35 W.
During the day, is visible the movement of the people inside the building. The chart in Figure 8 also presents, in green bars, the movement sensor activation. The researches arrive near 9:00 a.m. and have a clear impact on television consumption. Because the television is located near the kitchen, the movement sensor is triggered every time a
researcher arrives or leaves the kitchen, goes for a coffee, goes to stores his/her food or have some lunch or snack.
In Figure 8, is visible the 7 minutes that the IoT device waits until the end of the last movement to act on television. Therefore, every time a movement is detected the television stays at the highest brightness mode for 7 minutes straight.
The deployed of the IoT device enabled the context-aware autonomous control resulting in a decrease of consumption energy of 56% – from 1.14 kWh/day to 0.64 kWh/day. Previously the consumption of television was the same during the day – from 8:00 a.m. to 8:00 p.m. – using the lowest energy saving mode.
B. Air conditioner deployment
The air conditioner unit goal is to detect and prevent situations where the air conditioner was left on. Figure 9 shows the results of the air conditioner control in a day that the unit was left on. The chart of Figure 9 shows the air conditioner consumption, the lux intensity inside the room and the movement sensor between 3:00 p.m. and 7:00 p.m.
Has can be seen in Figure 9, the air conditioner unit works nearly every 10 minutes. The PIR sensor only detects significant heating movements. Therefore, the movement sensor is usually not triggered even though there are users inside the room. At 3:45 p.m. all but one lamp inside the room are turned off, living only the external light and a single lamp turned on. At this moment, the room only had a person working inside. The lux sensor is in one wall of the room.
At 6:28 p.m., the last person leaves the room and the last lamp is turned off. At this moment, the PIR sensor detects the person movement and stays triggered until 6:30 p.m. After the light is zero and there is no movement inside, the IoT device waits 7 minutes to see if the room remains closed – during this time the air conditioner has energy consumption because the IoT device did not yet detect that the room is closed. At 6:39, when the IoT device detects that the room is closed, there is no air conditioner consumption, and because of that, the system does not perform any action, being in the monitoring mode. When at 6:39 p.m. the air conditioner starts its motor and produces energy consumption, the system detects it and send right away a turn off infrared signal. Therefore, at 6:39 p.m. the air conditioner starts consuming but it is almost immediately stopped.
Figure 8. Television context-aware autonomous control
Client Node.jsAPI
HTTPGETrequest HTTPGETIRsignal
IRsignal
HTTP204 EmitIRsignal
IoT device
012345
020406080
100120
07:3
0:00
07:5
0:00
08:1
0:00
08:3
0:00
08:5
0:00
09:1
0:00
09:3
0:00
09:5
0:00
10:1
0:00
10:3
0:00
10:5
0:00
11:1
0:00
11:3
0:00
11:5
0:00
12:1
0:00
12:3
0:00
12:5
0:00
13:1
0:00
13:3
0:00
13:5
0:00
14:1
0:00
14:3
0:00
14:5
0:00
15:1
0:00
15:3
0:00
15:5
0:00
16:1
0:00
16:3
0:00
16:5
0:00
17:1
0:00
17:3
0:00
17:5
0:00
18:1
0:00
18:3
0:00
18:5
0:00
19:1
0:00
19:3
0:00
19:5
0:00
20:1
0:00
20:3
0:00
Mov
emen
t
Cons
umpt
ion
(W)
Hours
Persons movement TV consumption

Figure 9. Air conditioner contextual actuation
V. DISCUSSION AND CONCLUSIONS
The use of IoT products in our homes are more and more normal. These products take several forms and functionalities, from smart televisions to smart pots passing by the smart plugs. They allow users to have a better understand and control over their home’s appliances and resources. They also enable the dissemination of concepts such as smart homes and energy management demand response programs.
However, much of IoT devices have the intention to produce remote monitoring and/or control. They, by themselves, are not able to autonomously control a resource or area according to its context. They have some functionalities for autonomous control and they can interact with other IoT devices to produce a contextual control but are unable to have efficient and good quality context-aware autonomous control.
The current approach in IoT devices for home control to achieve contextual control demands multiple IoT devices with a centralized point where the contextual control is performed. This centralized architecture is debatable and demands the users to buy multiple devices. This paper proposes a distributed solution where each IoT device has its own context-aware autonomous control without needing external hardware.
This paper proposed hardware and software architectures for a context-aware autonomous IoT device. The simple architecture demonstrated to be very effective for the two different case studies presented. Both IoT devices deployments use the MQTT protocol for remote control and monitor. They can be integrated with Home Assistant to work with market solutions such as TP-Link HS110 smart plug.
The proposed architecture was used in television and in an air conditioner unit. In the television case, the IoT device monitors the brightness according to the users’ position. In case of the air conditioner, the IoT device is able to prevent the unit from work during the night and during periods where the room is closed and without anyone.
The proposed approach has the advantage of the context-aware autonomous control being inside the IoT device without the need for a centralized solution. However, the IoT architecture gives the possibility to remotely (de)activate the contextual control, control the actuator and monitor the connected sensors. Other advantages are its simplicity and modularity that enables the use of the proposed architectures in multiple situations where a context-aware autonomous control is desired or necessary. As a disadvantage, the proposed architectures required more hardware and should be tailor-made for each situation.
The main concern that should be considered is the security of communications and data. The users’ data must be
protected to maintain security and privacy. The presented work was developed and deployed in a research building where no outside server connection was used. The data was stored locally in the research group network. Nonetheless, future implementation of the proposed architectures must consider security and privacy issues in each development.
The proposed hardware and software architectures can provide, as proven in this work, context-aware autonomous control using a unique IoT device in an efficient and effective control.
REFERENCES
[1] Min Li, Wenbin Gu, Wei Chen, Yeshen He, Yannian Wu, Yiying
Zhang, “Smart Home: Architecture, Technologies and Systems,” Procedia Computer Science, vol. 131, pp. 393-400, 2018. Doi: 10.1016/j.procs.2018.04.219
[2] L. Gomes, F. Sousa, Z. Vale, “An Intelligent Smart Plug with Shared Knowledge Capabilities,” Sensors, vol. 18, 2018. Doi: 10.3390/s18113961
[3] E. Demir, E. Köseoğlu, R. Sokullu, B. Şeker, “Smart Home Assistant for Ambient Assisted Living of Elderly People with Dementia,” Procedia Computer Science, vol. 113, pp. 609-614, 2017. Doi: 10.1016/j.procs.2017.08.302
[4] V. Vujović, M. Maksimović, “Raspberry Pi as a Sensor Web node for home automation,” Computers & Electrical Engineering, vol. 44, pp. 153-171, 2015. Doi: 10.1109/TASE.2018.2789658
[5] Statista. Smart Home Report 2018 – Control and Connectivity; Statista: Hamburg, Germany, 2018.
[6] Home Assistant documentation. [Online] Available: https://www.home-assistant.io/docs/ (access on 9 January 2019)
[7] Mycroft AI documentation. [Online] Available: https://mycroft.ai/documentation/ (access on 9 January 2019)
[8] C. Lu, C. Wu, M. Weng, W. Chen and L. Fu, "Context-Aware Energy Saving System With Multiple Comfort-Constrained Optimization in M2M-Based Home Environment," IEEE Transactions on Automation Science and Engineering, vol. 14, pp. 1400-1414, July 2017. Doi: 10.1109/TASE.2015.2440303
[9] S. Prasad Gochhayat, P. Kaliyar, M. Conti, P. Tiwari, V.B.S. Prasath, D. Gupta, A. Khanna, “LISA: Lightweight context-aware IoT service architecture,” Journal of Cleaner Production, vol. 212, 2019. Doi: 10.1016/j.jclepro.2018.12.096
[10] S. K. Datta, C. Bonnet and N. Nikaein, "An IoT gateway centric architecture to provide novel M2M services," 2014 IEEE World Forum on Internet of Things (WF-IoT), Seoul, 2014, pp. 514-519. Doi: 10.1109/WF-IoT.2014.6803221
[11] Vallati, C., Mingozzi, E., Tanganelli, G. et al. Wireless Pers Commun, vol. 87, 2016, pp. 1071-1091. Doi: 10.1007/s11277-015-2639-0
[12] J. Mocnej, W. K.G. Seah, A. Pekar, I. Zolotova, “Decentralised IoT Architecture for Efficient Resources Utilisation,” IFAC-PapersOnLine, vol. 51, 218, pp. 168-173. Doi: 10.1016/j.ifacol.2018.07.148
[13] MQTT protocol specification. [Online] Available: http://public.dhe.ibm.com/software/dw/webservices/ws-mqtt/mqtt-v3r1.html (access on 9 January 2019)
[14] NodeMcu documentation [Online]. Available: https://nodemcu.readthedocs.io/en/master/ (access on 9 January 2019)

[15] M. Kashyap, V. Sharma, N. Gupta, “Taking MQTT and NodeMcu to IOT: Communication in Internet of Things,” Procedia Computer Science, vol. 132, pp. 1611-1618, 2018. Doi: 10.1016/j.procs.2018.05.126
[16] NodeMCU custom builds [Online] Available: https://nodemcu-build.com/ (access on 9 January 2019)
Mosquitto MQTT broker [Online] Available: https://mosquitto.org/ (access on 9 January 2019

Luis Gomes
A Residential House Comparative Case Study Using Market Available Smart Plugs and EnAPlugs with
Shared Knowledge
Authors: Luis Gomes, Filipe Sousa, Tiago Pinto, and Zita Vale
Published in: Energies (IF: 2.707)
DOI: 10.3390/en12091647
Published at: April 2019
PhD timeline: M33

Energies 2019, 12, x; doi: FOR PEER REVIEW www.mdpi.com/journal/energies
Article 1
A Residential House Comparative Case Study Using 2
Market Available Smart Plugs and EnAPlugs with 3
Shared Knowledge 4
Luis Gomes 1,*, Filipe Sousa 1, Tiago Pinto 1 and Zita Vale 1 5
1 GECAD-Research Group on Intelligent Engineering and Computing for Advanced Innovation and 6 Development, Polytechnic of Porto (P.PORTO), P-4200-465 Porto, Portugal; [email protected] (F.S.), 7 [email protected] (T.P.), [email protected] (Z.V.) 8
* Correspondence: [email protected]; Tel.: +351 228 340 500 9
Received: date; Accepted: date; Published: date 10
Abstract: Smart home devices currently available on the market can be used for remote monitoring 11 and control. Energy management systems can take advantage of this and deploy solutions that can 12 be implemented in our homes. One of the big enablers is smart plugs that allow the control of 13 electrical resources while providing a retrofitting solution, hence avoiding the need for replacing 14 the electrical devices. However, current so-called smart plugs lack the ability to understand the 15 environment where they are, or the electrical appliance/resource they are controlling. This paper 16 applies Environment Awareness Smart Plugs (EnAPlugs) able to provide enough data for energy 17 management systems or act on its own, via a multi-agent approach. A case study is presented, which 18 shows the application of the proposed approach in a house where 17 EnAPlugs are deployed. 19 Results show the ability to shared knowledge and perform individual resource optimizations. This 20 paper evidences that by integrating artificial intelligence on devices, energy advantages can be 21 observed and used in favor of users, providing comfort and savings. 22
Keywords: distributed optimization; energy management system; shared knowledge; smart plugs. 23 24
1. Introduction 25
The first mention of the smart plug in the news, dates the year of 2008, reporting a solution able 26 to remotely control a plug. Since then, a massive penetration of smart plugs and smart home devices 27 have been introduced on the market. In the United States alone, in 2017, 35.9 million smart home 28 devices have been sold; a number that does not include smart TVs [1]. Moreover, according to Statista, 29 by 2022 there will be 216.9 million homes worldwide, having at least one smart home device [2]. The 30 use of smart plugs enables retrofitting and the automation of our electrical resources. Therefore, 31 scientific publications report case studies where smart plugs are combined with energy management 32 systems [3-5]. In these cases, the smart plugs are used as actuators. 33
Smart plugs enhanced innovation and have opened the door to new possibilities, such as remote-34 control using energy management systems. In [6] is explored the possibilities of integrating smart 35 plugs for programmable control using the Message Queuing Telemetry Transport (MQTT) with local 36 and remote control. In [7], a smart plug for energy management is proposed where the controllable 37 resource is manually identified. And in [8], a centralized energy management system is proposed 38 using smart plugs data. However, they all lack intelligence and awareness. In [9] a smart plug for 39 classification is presented. However, it lacks peer-to-peer collaboration and energy management. 40
Smart plugs can control an electrical resource, but it knows nothing about it, which poses a 41 problem. This paper will apply Environmental Awareness Smart Plug (EnAPlug) [10] that are able to 42 understand the controllable resource’s context – the controllable resource is the resource that is 43

Energies 2019, 12, x FOR PEER REVIEW 2 of 13
controlled and monitored by EnAPlug. EnAPlugs are able to learn and share their knowledge. These 44 abilities are ideal to deploy effective energy optimization algorithms. In fact, distributed optimization 45 is facilitated by using the characteristics and advantages of a solution based on EnAPlugs. EnAPlugs 46 have their own perception of the context and they have their individual knowledge. The proposed 47 distributed optimization solution enables the knowledge and individual learning processes from all 48 EnAPlugs to be combined by a centralized decision-making approach. Using this combined learning 49 process, each EnAPlug is able to recommend the best decisions from its perspective, according to the 50 overall situation of all Plugs and to its individual awareness of the context. The individual responses 51 are then combined and used to reach a final decision that considers both the general situation and 52 individual perspective of each plug/device. Hence, the use of EnAPlugs avoids the main limitations 53 present in current smart plugs, available on the market, as well as the proposed smart plugs, 54 presented in scientific publications. The proposed solution takes the scientific community, especially 55 in the field of power and energy systems, one step further by combining distributed optimization 56 with context-aware learning, thus providing a novel adaptive solution that takes the most out of 57 different approaches. The energy management and automated energy resources control capabilities 58 are improved according to the current body of knowledge, by departing from current solutions which 59 are purely centralized or distributed towards a solution that takes the most from both. 60
This paper presents the first case study where several EnAPlugs are deployed in a residential 61 house, and where three air conditioner units are optimized using EnAPlugs’ shared knowledge. The 62 results compare and take into consideration three scenarios where: no smart plugs are used, market 63 available smart plugs are used, and EnAPlugs are used. 64
After this section, Section 2 shows a list of market available smart plugs. Then, Section 3 presents 65 EnAPlug as well as its architecture. Section 4 presents the mechanism of sharing knowledge. After 66 that, Section 5 describes the case study. In Section 6 are discussed the main results. The paper is 67 finalized with a discussion and conclusions in Section 7. 68
2. Available Smart Plugs on the Market 69
There is a vast variety of smart plugs available on the market, which can be aggregated into two 70 groups; with and without monitoring. For the purposes of this paper, only smart plugs with 71 monitoring are considered and analyzed. The smart ability, of these smart plugs, is the simple 72 capability of providing remote control. Beside their misleading name, they are not very smart. 73
Table 1 shows a set of relevant smart plugs available on today’s market, focusing on the electric 74 specs as well as, multiplatform communication and usage functionalities. All information of Table 1 75 was completed using official manufacturers websites, manuals and datasheets, if available. This 76 market smart plugs survey helps to better understand the current market state of the art and provides 77 a better insight into capabilities as well as limitations. 78
Fifty smart plugs were analyzed, Table 1 shows the six more relevant examples of multiple smart 79 plugs types. From those examples, only D-Link DSP-W215 and iSocket Environment Pro allow type 80 E and type F sockets used in their full range – allowing 16 A loads. The most common communication 81 protocol is IEEE 801.11, taking advantages of Wi-Fi routers. Other examples can be found using Z-82 Wave, Bluetooth or GSM. However, those who do not use IEEE 801.11, usually demands the need for 83 a hub. For solutions using IEEE 801.11, the hub is the building’s access point. 84
iSocket is the only smart plug that enables the direct integration of external sensors (through 85 jack wire). This is because it was built for environmental monitoring, and not with the purpose of 86 controlling equipment in our homes. 87
3. Environmental Awareness Smart Plug 88
Smart plugs available on the market are essential enablers for equipment retrofitting. They enable 89 remote control and can enable monitoring, the definition of rules and scheduling. However, improved 90 smart plugs can benefit users by providing context data and by integrating artificial intelligence. For 91 this reason, this paper uses EnAPlugs that have the ability to understand the resource's context and 92 learn from the data and user interactions. 93
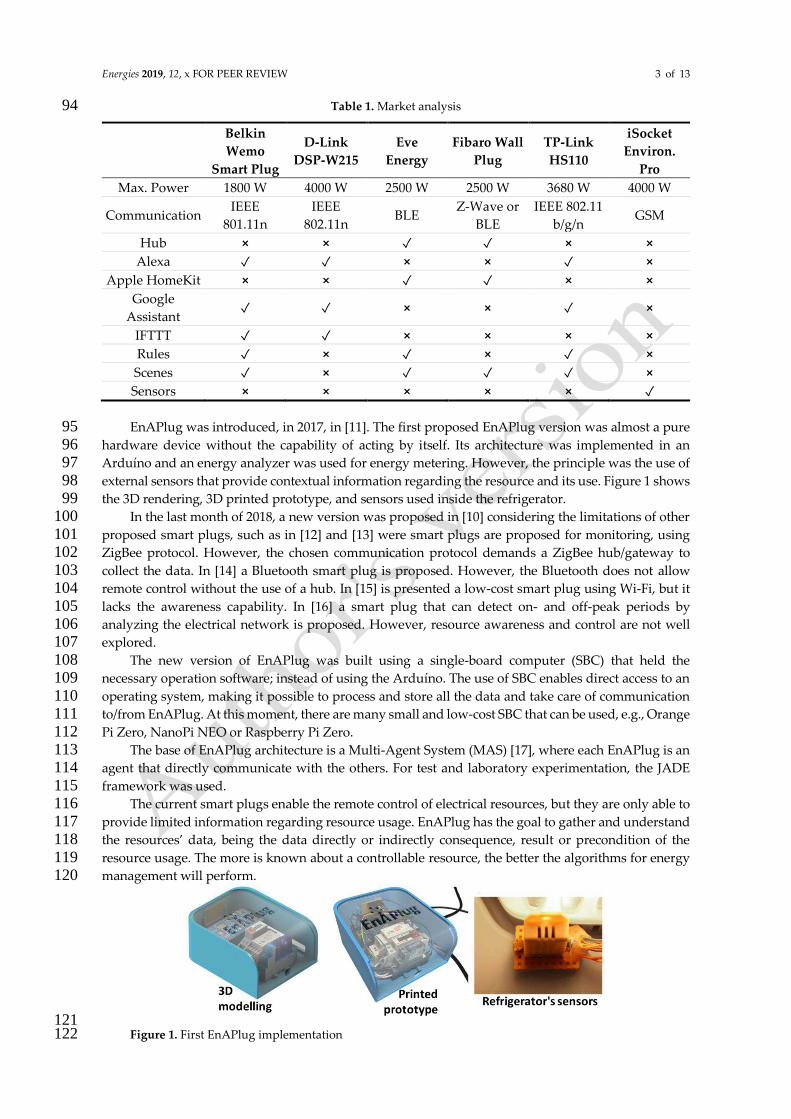
Energies 2019, 12, x FOR PEER REVIEW 3 of 13
Table 1. Market analysis 94
Belkin
Wemo
Smart Plug
D-Link
DSP-W215
Eve
Energy
Fibaro Wall
Plug
TP-Link
HS110
iSocket
Environ.
Pro
Max. Power 1800 W 4000 W 2500 W 2500 W 3680 W 4000 W
Communication IEEE
801.11n
IEEE
802.11n BLE
Z-Wave or
BLE
IEEE 802.11
b/g/n GSM
Hub ⨯ ⨯ ✓ ✓ ⨯ ⨯
Alexa ✓ ✓ ⨯ ⨯ ✓ ⨯
Apple HomeKit ⨯ ⨯ ✓ ✓ ⨯ ⨯
Assistant ✓ ✓ ⨯ ⨯ ✓ ⨯
IFTTT ✓ ✓ ⨯ ⨯ ⨯ ⨯
Rules ✓ ⨯ ✓ ⨯ ✓ ⨯
Scenes ✓ ⨯ ✓ ✓ ✓ ⨯
Sensors ⨯ ⨯ ⨯ ⨯ ⨯ ✓
EnAPlug was introduced, in 2017, in [11]. The first proposed EnAPlug version was almost a pure 95 hardware device without the capability of acting by itself. Its architecture was implemented in an 96 Arduíno and an energy analyzer was used for energy metering. However, the principle was the use of 97 external sensors that provide contextual information regarding the resource and its use. Figure 1 shows 98 the 3D rendering, 3D printed prototype, and sensors used inside the refrigerator. 99
In the last month of 2018, a new version was proposed in [10] considering the limitations of other 100 proposed smart plugs, such as in [12] and [13] were smart plugs are proposed for monitoring, using 101 ZigBee protocol. However, the chosen communication protocol demands a ZigBee hub/gateway to 102 collect the data. In [14] a Bluetooth smart plug is proposed. However, the Bluetooth does not allow 103 remote control without the use of a hub. In [15] is presented a low-cost smart plug using Wi-Fi, but it 104 lacks the awareness capability. In [16] a smart plug that can detect on- and off-peak periods by 105 analyzing the electrical network is proposed. However, resource awareness and control are not well 106 explored. 107
The new version of EnAPlug was built using a single-board computer (SBC) that held the 108 necessary operation software; instead of using the Arduíno. The use of SBC enables direct access to an 109 operating system, making it possible to process and store all the data and take care of communication 110 to/from EnAPlug. At this moment, there are many small and low-cost SBC that can be used, e.g., Orange 111 Pi Zero, NanoPi NEO or Raspberry Pi Zero. 112
The base of EnAPlug architecture is a Multi-Agent System (MAS) [17], where each EnAPlug is an 113 agent that directly communicate with the others. For test and laboratory experimentation, the JADE 114 framework was used. 115
The current smart plugs enable the remote control of electrical resources, but they are only able to 116 provide limited information regarding resource usage. EnAPlug has the goal to gather and understand 117 the resources’ data, being the data directly or indirectly consequence, result or precondition of the 118 resource usage. The more is known about a controllable resource, the better the algorithms for energy 119 management will perform. 120
121 Figure 1. First EnAPlug implementation 122

Energies 2019, 12, x FOR PEER REVIEW 4 of 13
The market available smart plugs, as well as other IoT devices, provide a centralized, cloud-based, 123 solution. This requires a large amount of data going from the device to the cloud – away from the home 124 and user location. According to [18], a centralized approach has the advantage to not be limited to the 125 device hardware, being thus able to process heavier energy management and learning algorithms. 126 However, centralized approaches are subjected to lower fault tolerances, where decentralized 127 approaches are a better choice [19]. For those reasons, and knowing that EnAPlug uses SBC, each 128 EnAPlug will be able to collaborate with each other in a decentralized solution; increasing fault 129 tolerance and data ownership (i.e. data stays within the device). 130
Figure 2 shows the internal software layers architecture of EnAPlug. The base layer is the MAS 131 framework. This paper uses the JADE framework, providing Foundation for Intelligent Physical Agents 132 (FIPA) compatibility. On top of this, is located the persistence and historic layer that is responsible to 133 store all the data regarding EnAPlug’s sensors and actions. EnAPlug will learn from historical data that 134 is stored in this layer. 135
The awareness and knowledge modules work side by side in the same layer; they represent the 136 main abilities and contributions of EnAPlug. The awareness module integrates all the needed hardware 137 used to understand the context of the controllable resourced – the resource controlled by the EnAPlug. 138 This module is responsible to read, write and control all the hardware resources, from sensors to the 139 actuator(s). The knowledge module integrates all the necessary components that provide knowledge to 140 EnAPlug’s agent. Learning algorithms and optimization algorithms are located in this module. 141
The Modbus/RTU and Modbus/TCP, GPIO (general purpose input/output), RF (radio frequency) 142 and TCP/IP modules form the communication layer. These modules are directly used by the awareness 143 and knowledge modules; but not in an equal manner. The awareness module can use the full 144 communication layer – it as access to all the communication modules. However, the knowledge module 145 can only use the TCP/IP module; all the other communication modules are not applied to the 146 requirements of the knowledge module. 147
The Modbus/RTU and Modbus/TCP module allows the easy integration of energy analyzers and 148 other sensors and actuators; these are vastly used protocols in energy equipment. The GPIO module 149 uses the pins available, if any, in the SBC to directly connect sensors and actuators. The RF module 150 enables the integration of wireless sensors and actuators. When integrating sensors in a smart plug, the 151 location where the smart plug is placed can be an issue; if placed in dark locations. Therefore, the 152 integration of wireless sensors is important, enabling the placement of sensors surrounding the 153 controllable resource. 154
The top-level modules represent interactions with external hardware or software. The energy 155 metering module is responsible to read data from the energy analyzer using Modbus/RTU or 156 Modbus/TCP. The cloud connection module is responsible to interact with the cloud. The cloud 157 connection is optional and is used to enable the training of deep learning algorithms outside EnAPlug’s 158 SBC. This module and the shared knowledge module are only able to use TCP/IP protocols. The shared 159 knowledge module, that will be detailed in Section 4, allows the sharing of EnAPlug’s knowledge with 160 other EnAPlugs. 161
Between energy metering and cloud connection modules, there are two small layers that represent 162 the sensors, actuators and the safety control. The hardware sensors should measure parameters that 163 have, or could have, a direct impact in the controllable resource usage or electrical consumption. If a 164 sensor does not have any impact and cannot be used for context-awareness nor learning algorithms, 165 then it should not be used. EnAPlug provides two types of actuators: discrete (i.e. on/off), or variable 166 (i.e. with a working range). These hardware actuators are integrated into the same module of sensors; 167 sensors and actuators module. Below the sensors and actuators module, is the resource safety control 168 module, which has simple and critical restrictions that prevent the controllable resource being damaged 169 by the agent or the remote control. For example, if the EnAPlug controls a freezer, the inside 170 temperature should not overpass a certain value. The resource safety control will include a restriction 171 that indicates that if the refrigerator goes over x ºC, then it should be turned on and the remote control 172 should be temporarily deactivated to prevent malfunctions. 173

Energies 2019, 12, x FOR PEER REVIEW 5 of 13
174
Figure 2. EnAPlug’s Architecture [10] 175
The EnAPlug’s MAS is a congregation organization system, where congregations are formed by 176 physical locations (i.e. all the living room’s EnAPlugs form a congregation) and agents can be part of 177 more than one congregation. The MAS used in EnAPlug uses event- and self-triggering 178 communications between agents. The event-triggering is used by agents to respond to other agents. The 179 self-triggering is used when an agent wants to manage their consumption and requests the knowledge 180 from other agents. 181
EnAPlug is not a commercial product. The concept is a context-aware smart plug used for data 182 acquisition and shared knowledge. Feel free to build your own EnAPlug version and/or improve our 183 concept. If you need support to build your own EnAPlug, please contact us; we are available to work 184 with you for improvement or simple developments of EnAPlugs. 185
4. EnAPlug’s Shared Knowledge 186
The ability to share EnAPlugs knowledge is one of the key features of EnAPlug; drastically 187 distancing oneself from current market solution. The ability to share information and knowledge is the 188 basis for the exponential expansion of knowledge in communities. This is possible because each 189 EnAPlugs is an agent in a congregation with the other EnAPlugs of the same room. Is the MAS that 190 provide the connection, communication, and share of knowledge between EnAPlugs. 191
EnAPlug has knowledge regarding the controllable resource connected to it. This knowledge 192 regards the resource usage and users’ interaction with that resource. The knowledge is acquired with 193 deep learning algorithms that will use the contextual data to learn the resources usage profile and the 194 users’ interaction profile. With this knowledge, EnAPlug will be able to answer the questions presented 195 in Table 2. The presented EnAPlug will combine learning and contextual data to answer those 196 questions, allowing the understanding of the controllable resource regarding usage and consumption 197 in real-time operation/usage and in forecast operation/usage. 198
Questions i and ii are answered by reading real-time contextual data regarding the controllable 199 resource; electrical consumption and EnAPlug sensors. Questions from iii to vi are answered using 200 learning algorithms trained in the cloud and used locally; in the SBC of EnAPlug. The data sent to the 201 cloud will not be tagged and cannot be traced back to the user/home, guaranteeing data anonymity and 202 preventing privacy issues. 203
As can be seen in [20], Artificial Neural Networks (ANN) can be used to forecast electrical 204 consumption. Therefore, they will be used in EnAPlug as learning algorithms; providing a forecast to 205 answer questions iii and iv. The Deep Learning for Java (DL4J) framework is used in the SBC and in the 206 cloud-side. ANN were configured and trained specifically to answer questions iii and iv of shared 207 knowledge section. For each ANN application, it was used a Long Short-Term Memory (LSTM) 208 Recurrent Neural Networks (RNN) with early stopping, to prevent the underfit and overfit [21]. The 209 used ANNs are a backpropagation network. The weights were initialized using the equation proposed 210 in [22]. The gradients are updated according to Nesterov momentum and a threshold of 0.5 is applied 211 to truncate values, as was proposed in [23]. The learning process of EnAPlugs can be seen in detail in 212 [10] where ANN are analyzed and tested according to different inputs, timesteps, and outputs. In this 213 paper, it will be described and tested the use of the shared knowledge mechanism over the EnAPlug’s 214 learning. 215

Energies 2019, 12, x FOR PEER REVIEW 6 of 13
Table 2. EnAPlug's shared knowledge question 216
Question Answering with
i. Is the controllable resource being used? Contextual data
ii. Are there users near the controllable resource? Contextual data
iii. Will the controllable resource be used in the next hour? Learning algorithms
iv. Will there be users near the controllable resource in the next hour? Learning algorithms
v. What is the average consumption time of the controllable resource? Historical data
vi. What is the average user's presence time near the controllable resource? Historical data
Figure 3 shows the shared knowledge process. At first (i), EnAPlug trains the ANN outside its 217 local processor to speed up the training time. After this process, EnAPlug is ready to share and request 218 knowledge with/from their peers. EnAPlug then requests, to the yellow pages agent, all the EnAPlugs 219 located in a specific room (ii). At last (iii), EnAPlug directly requests each peer for knowledge. This 220 process increases the individual knowledge using the community’s knowledge; provided by other 221 EnAPlugs. 222
ANN training can be done locally or remotely. The remote option, represented in Figure 3, is done 223 using a server that receives the ANN configuration, training dataset, and test dataset. Then, the 224 execution of ANN is done locally in the SBC. Using this methodology, each EnAPlug benefits from their 225 peers’ knowledge. This is seen in equation 1, where 𝛼𝑟𝑜𝑜𝑚 represents the room’s knowledge that is a 226
combination of the room’s EnAPlugs’ knowledge; represented by 𝛼𝐸𝑛𝐴𝑃𝑙𝑢𝑔𝑖 . The number of EnAPlugs 227
deployed in the room is represented by 𝑛. 228
𝛼𝑟𝑜𝑜𝑚 = ∑𝛼𝐸𝑛𝐴𝑃𝑙𝑢𝑔𝑖
𝑛
𝑖=0
, 𝑤ℎ𝑒𝑟𝑒 {𝑛 ∈ 𝑍} (1)
229 Regarding questions iii and iv, where learning algorithms are needed, the room’s answer, given 230
by 𝐴𝑟𝑜𝑜𝑚, is calculated using equation 2. Where 𝐴𝑖 is the individual answer of 𝐸𝑛𝐴𝑃𝑙𝑢𝑔𝑖. In order to 231 consider that a person will be near or will be using the controllable resource, at least one EnAPlug must 232 provide a positive forecast. To consider that not a single person will be near or will be using the 233 controllable resource, all EnAPlugs must provide negative answers (i.e. forecasting that will not have 234 persons near or using the controllable resource). 235
Since we are dealing with forecasting, equations 3 and 4 are needed to calculate the results 236 accuracy. Even though one EnAPlug forecasts that will be a person near or using the controllable 237 resource, the accuracy of forecast must be taken into account; the individual answers of EnAPlugs 238 cannot be taken as absolute truth. Therefore, the room’s answer (𝐴𝑟𝑜𝑜𝑚) is the combination of all the 239 room’s EnAPlugs answers and accuracy. Equation 3 calculates the probability of a negative room 240 answer. Where 𝐸0𝑖 is the probability of EnAPlug i to respond negatively (equation 5 for 𝑎 = 0). While 241
equation 4 calculates the probability of an affirmative room’s answer – adaptation from the principle of 242 inclusion and exclusion for probability [24]. 243
𝐴𝑟𝑜𝑜𝑚 = {0 , 𝑖𝑓 𝐴1 + 𝐴2 +⋯+ 𝐴𝑘 = 01 , 𝑖𝑓 𝐴1 + 𝐴2 +⋯+ 𝐴𝑘 > 0
(2)
𝛽0𝑟𝑜𝑜𝑚 =∏𝐸0𝑖
𝑛
𝑖=0
(3)
244
Figure 3. Shared Knowledge Process (agent representation) 245

Energies 2019, 12, x FOR PEER REVIEW 7 of 13
𝛽1𝑟𝑜𝑜𝑚 =∑
(
(−1)𝑘−1 ∑ 𝑃(𝐸𝑎𝑖1 ∩ 𝐸𝑎𝑖2 ∩ …∩ 𝐸𝑎𝑖𝑘
)𝑖1,𝑖2,…,𝑖𝑘∶
1≤𝑖1<𝑖2<⋯<𝑖𝑘≤𝑛 )
𝑛
𝑘=1
(4)
Equation 5 calculates the probability of answer 𝑎 being right, where 𝑎 ∈ [0,1] – negative/false or 246 positive/true. For this, the answer given by EnAPlug, represented by 𝐴, and the accuracy of its forecast, 247 represented by γ, are used. For instance, if we have an EnAPlug𝑖 , with an accuracy of 80%, giving a 248
negative answer (i.e. 𝐴 = 0), then 𝐸1𝑖 = 20% while 𝐸0𝑖 = 80% – meaning that there is 20% change 249
that in reality we will have a positive/true answer (i.e. 𝑎 = 0 ) and 80% change of having a 250 negative/false answer (i.e. 𝑎 = 0). Equation 5 is only possible because questions have binary answers. 251
𝐸𝑎𝑖 = (1 − 𝛾)|𝑎−𝐴|𝛾|1−𝑎−𝐴| (5)
252 Although there are multiple potential applications for the proposed concept; EnAPlugs and the 253
shared knowledge supported by them and by the proposed distributed optimization approach, were 254 idealized for energy management resources’ optimization. Energy management is usually based on 255 centralized approaches [25], considering the entire facility (e.g. room, house, building) as a whole and 256 reaching an optimal (or near optimal) energy resource management solution. However, as mentioned 257 before, such approaches are limited and do not consider the different perspectives and contexts of each 258 device. On the other hand, fully distributed energy management systems, by considering the individual 259 perspectives and preferences only, do not guarantee reaching good solutions from an overall 260 perspective (e.g. a decision to turn on all the lights in a living room may be great from the comfort point 261 of view of that single room; but highly damaging from the overall perspective of the house) [26]. 262 Therefore, combining both approaches in a dynamic, intelligent and context-aware way, as proposed 263 in this work, is a significant advance in the field of energy management. 264
5. Case Study 265
The case study considers a Portuguese 2-bedroom residential house where a couple lives in. Figure 266 4 shows the blueprint of the used apartment, where bedroom 1 is used as a working place while 267 bedroom 2 is used as a sleeping room. The case study’s residential house is a combination of real 268 resources; implemented in our offices and laboratories; and simulated resources; to build a complete 269 case study. 270
Table 3 lists the available resources in this case study according to location, consumption, and type. 271 The type indicates if the resource has an EnAPlug controlling it (i.e. Real), or if it is a simulated resource 272 (i.e. Simulated). The Mixed type resource indicates that real consumption and real sensor data are used 273 from our offices and laboratories but there is not an EnAPlug installed. 274
275
Figure 4. Case study house blueprint 276
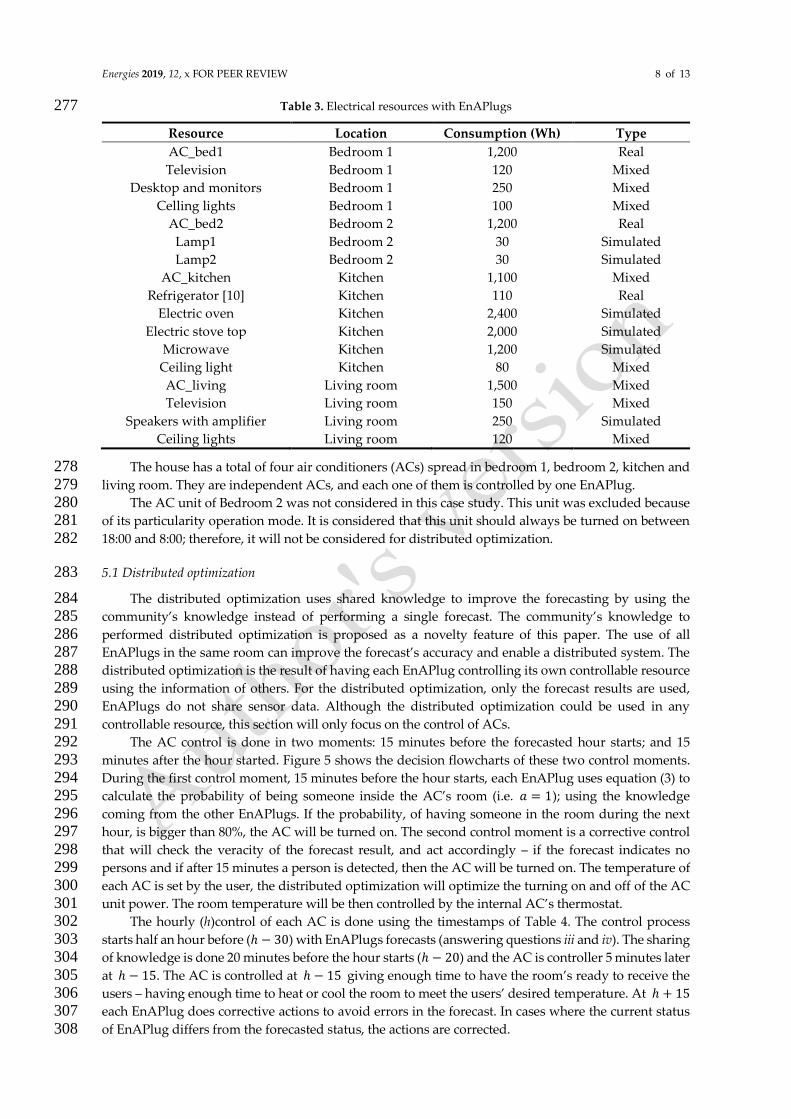
Energies 2019, 12, x FOR PEER REVIEW 8 of 13
Table 3. Electrical resources with EnAPlugs 277
Resource Location Consumption (Wh) Type
AC_bed1 Bedroom 1 1,200 Real
Television Bedroom 1 120 Mixed
Desktop and monitors Bedroom 1 250 Mixed
Celling lights Bedroom 1 100 Mixed
AC_bed2 Bedroom 2 1,200 Real
Lamp1 Bedroom 2 30 Simulated
Lamp2 Bedroom 2 30 Simulated
AC_kitchen Kitchen 1,100 Mixed
Refrigerator [10] Kitchen 110 Real
Electric oven Kitchen 2,400 Simulated
Electric stove top Kitchen 2,000 Simulated
Microwave Kitchen 1,200 Simulated
Ceiling light Kitchen 80 Mixed
AC_living Living room 1,500 Mixed
Television Living room 150 Mixed
Speakers with amplifier Living room 250 Simulated
Ceiling lights Living room 120 Mixed
The house has a total of four air conditioners (ACs) spread in bedroom 1, bedroom 2, kitchen and 278 living room. They are independent ACs, and each one of them is controlled by one EnAPlug. 279
The AC unit of Bedroom 2 was not considered in this case study. This unit was excluded because 280 of its particularity operation mode. It is considered that this unit should always be turned on between 281 18:00 and 8:00; therefore, it will not be considered for distributed optimization. 282
5.1 Distributed optimization 283
The distributed optimization uses shared knowledge to improve the forecasting by using the 284 community’s knowledge instead of performing a single forecast. The community’s knowledge to 285 performed distributed optimization is proposed as a novelty feature of this paper. The use of all 286 EnAPlugs in the same room can improve the forecast’s accuracy and enable a distributed system. The 287 distributed optimization is the result of having each EnAPlug controlling its own controllable resource 288 using the information of others. For the distributed optimization, only the forecast results are used, 289 EnAPlugs do not share sensor data. Although the distributed optimization could be used in any 290 controllable resource, this section will only focus on the control of ACs. 291
The AC control is done in two moments: 15 minutes before the forecasted hour starts; and 15 292 minutes after the hour started. Figure 5 shows the decision flowcharts of these two control moments. 293 During the first control moment, 15 minutes before the hour starts, each EnAPlug uses equation (3) to 294 calculate the probability of being someone inside the AC’s room (i.e. 𝑎 = 1); using the knowledge 295 coming from the other EnAPlugs. If the probability, of having someone in the room during the next 296 hour, is bigger than 80%, the AC will be turned on. The second control moment is a corrective control 297 that will check the veracity of the forecast result, and act accordingly – if the forecast indicates no 298 persons and if after 15 minutes a person is detected, then the AC will be turned on. The temperature of 299 each AC is set by the user, the distributed optimization will optimize the turning on and off of the AC 300 unit power. The room temperature will be then controlled by the internal AC’s thermostat. 301
The hourly (h)control of each AC is done using the timestamps of Table 4. The control process 302 starts half an hour before (ℎ − 30) with EnAPlugs forecasts (answering questions iii and iv). The sharing 303 of knowledge is done 20 minutes before the hour starts (ℎ − 20) and the AC is controller 5 minutes later 304 at ℎ − 15. The AC is controlled at ℎ − 15 giving enough time to have the room’s ready to receive the 305 users – having enough time to heat or cool the room to meet the users’ desired temperature. At ℎ + 15 306 each EnAPlug does corrective actions to avoid errors in the forecast. In cases where the current status 307 of EnAPlug differs from the forecasted status, the actions are corrected. 308

Energies 2019, 12, x FOR PEER REVIEW 9 of 13
309
Figure 5. AC EnAPlug control decision 310
Table 4. AC EnAPlugs action 311
Time (minutes) Action
ℎ − 30 mintues Each EnAPlug forecasts user presence for the period between ℎ to h+1ℎ𝑜𝑢𝑟
ℎ − 20 mintues AC EnAPlugs requires the answers to question iv to each EnAPlug in their
location
ℎ − 15 mintues AC EnAPlugs take on/off control actions
ℎ + 15 mintues AC EnAPlugs take corrective actions
where h is the hour to control {ℎ ∈ 𝑍 ∶ 0 ≤ ℎ ≤ 23} 312
5.2 Users’ routine and profile 313
The users’ routine inside the house is: 314 • 8:00 – wake up; 315 • 9:00 – leave to work; 316 • 13:00 – getting home to cook and having lunch; taking approximately one-hour having lunch; 317 • 18:00 – arriving at home; 318 • 20:00 – cooking and having dinner; 319 • 00:00 – go to bed. 320
The normal profile consumption of the house can be seen in Figure 7 (blue bars). All the AC are 321 turned off during the away time (i.e. from 9:00 to 17:59), but they are immediately turned on when the 322 users return home (at 18:00). The presented profile represents a spring period where ACs consumption 323 accounts for 72% of total consumption. 324
5.3 Use of market available smart plugs 325
Besides the integration of EnAPlugs, this case study also considers the use of market available 326 smart plugs to provide a comparative performance of resource optimization and usage. The scenario 327 considering market available smart plugs, shown in Figure 7 (orange bars), use standard monitoring 328 smart plugs without a distributed or centralized optimization. Only available functionalities are 329 considered. Therefore, the used smart plugs use the scheduling functionality and the improved user’s 330 interaction; where the user can easily turn on or off a set of smart plugs using voice commands. 331
6. Results 332
To test EnAPlug’s shared knowledge capability, it was run the scenario where the AC connected 333 to EnAPlugs optimize their consumptions using the shared knowledge regarding the user's location – 334

Energies 2019, 12, x FOR PEER REVIEW 10 of 13
question iv of Section 4. For result comparison, it will be used the normal consumption profile and the 335 scenario where the users use conventional smart plugs with scenes. Table 4 shows the timeframe actions 336 of AC’s EnAPlugs. 337
Figure 6 shows the values resulting from the application of equation 3 for each room at each hour. 338 These results consider an average forecast accuracy of 85%. As can be seen, the kitchen has a minimum 339 55.63% probability of having a person in during the next hour – even when all EnAPlugs say that no 340 one will be there. This is a consequence of equation 3 that adds each EnAPlug error meaning that, more 341 EnAPlugs will result in a higher minimum percentage. 342
During the dinner hour, at 08:00 p.m., a total of three rooms indicate the presence of persons inside: 343 bedroom 1 (99.66%), kitchen (99.76%), and living room (89.16%). Bedroom 1 has four EnAPlugs that all 344 indicate the presence of users inside the room. Kitchen has a total of six EnAPlugs but only three 345 indicate the presence of users. The living room has a total of four EnAPlugs and only one indicates the 346 presence of persons inside. The AC’s EnAPlugs will use the shared knowledge of the others. Therefore, 347 they will not be part of the equation 3 results. Table 5 summarizes the calculation of 𝛽1𝑟𝑜𝑜𝑚 for 348
bedroom 1, kitchen and living room, where the forecast of each room’s EnAPlug is indicated and the 349
𝐸0𝑖 indicates the probability of having persons inside the room during the next hour; a forecast 350
accuracy of 85% is considered. Note that even if an EnAPlug forecasts that will not be any user near 351 the controllable resource, the is still a 15% probability of having a person near the controllable 352
resource; as calculated in equation 5 (i.e. 𝐸0𝑖). Because Table 5 𝛽1𝑟𝑜𝑜𝑚 are bigger than 80%, the AC 353
units of bedroom 1, kitchen and living room are turned on at 07:45 p.m. (ℎ − 15); according to the 354 rules of Table 4. 355
Figure 7 shows the hourly consumption of the three approaches: profile, where is presented the 356 normal consumption; smart plugs, where conventional smart plugs are used to promote a better and 357 manual control; and EnAPlugs, where EnAPlugs are used without the need of user interaction. By 358 applying the actions, of Table 4, and the control decision, of Figure 5, to bedroom 1, kitchen and living 359 room, the EnAPlug’s distributed autonomous energy management is able to decrease the house overall 360 consumption. 361
362
Figure 6. 𝛽1𝑟𝑜𝑜𝑚 for each room at each hour (from 0% to 100%) 363
Table 5. 𝛽1𝑟𝑜𝑜𝑚 for each room at 08:00 p.m. 364
Room Forecast result 1 𝑬𝟎𝒊 𝜷𝟏𝒓𝒐𝒐𝒎
Bedroom 1 1, 1, 1 85%, 85%, 85% 99.66%
Kitchen 1, 1, 1, 0, 0 85%, 85%, 85%, 15%, 15%, 15% 99.76%
Living room 0, 0, 1 15%, 15%, 85% 89.16%
1 0 : will not be users near the controllable resource; 1 : will be users near the controllable resource 365
hours
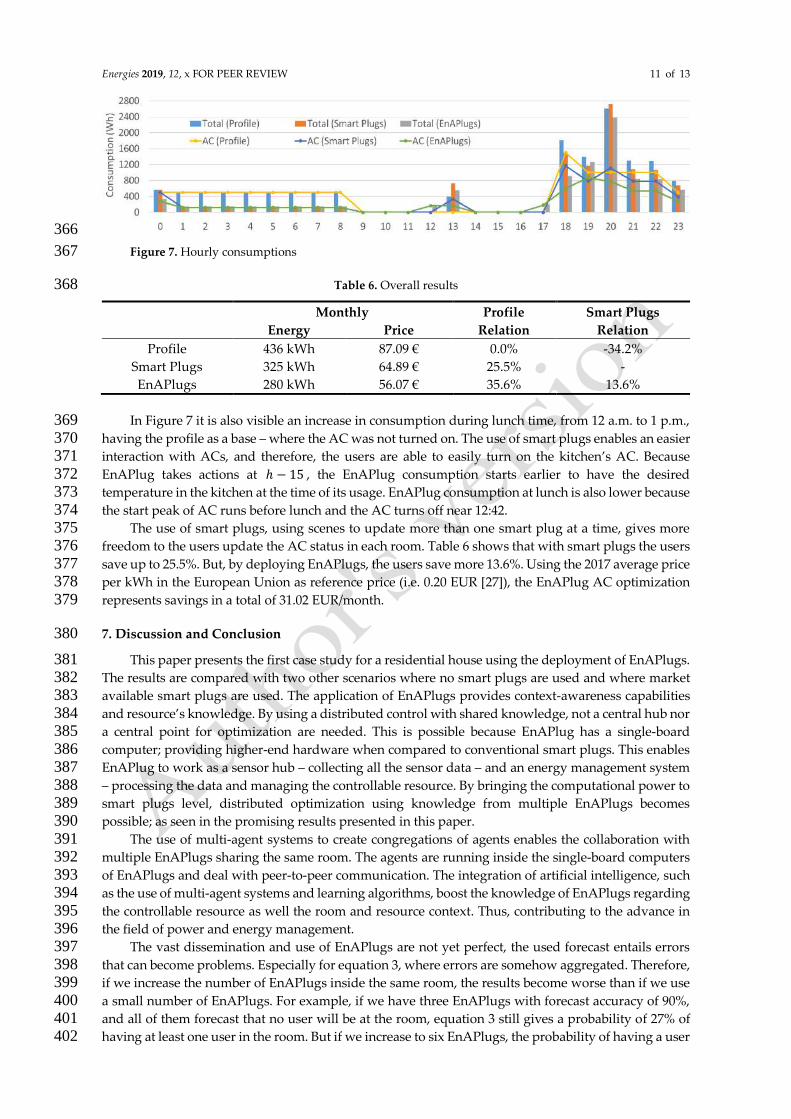
Energies 2019, 12, x FOR PEER REVIEW 11 of 13
366
Figure 7. Hourly consumptions 367
Table 6. Overall results 368
Monthly Profile
Relation
Smart Plugs
Relation Energy Price
Profile 436 kWh 87.09 € 0.0% -34.2%
Smart Plugs 325 kWh 64.89 € 25.5% -
EnAPlugs 280 kWh 56.07 € 35.6% 13.6%
In Figure 7 it is also visible an increase in consumption during lunch time, from 12 a.m. to 1 p.m., 369 having the profile as a base – where the AC was not turned on. The use of smart plugs enables an easier 370 interaction with ACs, and therefore, the users are able to easily turn on the kitchen’s AC. Because 371 EnAPlug takes actions at ℎ − 15 , the EnAPlug consumption starts earlier to have the desired 372 temperature in the kitchen at the time of its usage. EnAPlug consumption at lunch is also lower because 373 the start peak of AC runs before lunch and the AC turns off near 12:42. 374
The use of smart plugs, using scenes to update more than one smart plug at a time, gives more 375 freedom to the users update the AC status in each room. Table 6 shows that with smart plugs the users 376 save up to 25.5%. But, by deploying EnAPlugs, the users save more 13.6%. Using the 2017 average price 377 per kWh in the European Union as reference price (i.e. 0.20 EUR [27]), the EnAPlug AC optimization 378 represents savings in a total of 31.02 EUR/month. 379
7. Discussion and Conclusion 380
This paper presents the first case study for a residential house using the deployment of EnAPlugs. 381 The results are compared with two other scenarios where no smart plugs are used and where market 382 available smart plugs are used. The application of EnAPlugs provides context-awareness capabilities 383 and resource’s knowledge. By using a distributed control with shared knowledge, not a central hub nor 384 a central point for optimization are needed. This is possible because EnAPlug has a single-board 385 computer; providing higher-end hardware when compared to conventional smart plugs. This enables 386 EnAPlug to work as a sensor hub – collecting all the sensor data – and an energy management system 387 – processing the data and managing the controllable resource. By bringing the computational power to 388 smart plugs level, distributed optimization using knowledge from multiple EnAPlugs becomes 389 possible; as seen in the promising results presented in this paper. 390
The use of multi-agent systems to create congregations of agents enables the collaboration with 391 multiple EnAPlugs sharing the same room. The agents are running inside the single-board computers 392 of EnAPlugs and deal with peer-to-peer communication. The integration of artificial intelligence, such 393 as the use of multi-agent systems and learning algorithms, boost the knowledge of EnAPlugs regarding 394 the controllable resource as well the room and resource context. Thus, contributing to the advance in 395 the field of power and energy management. 396
The vast dissemination and use of EnAPlugs are not yet perfect, the used forecast entails errors 397 that can become problems. Especially for equation 3, where errors are somehow aggregated. Therefore, 398 if we increase the number of EnAPlugs inside the same room, the results become worse than if we use 399 a small number of EnAPlugs. For example, if we have three EnAPlugs with forecast accuracy of 90%, 400 and all of them forecast that no user will be at the room, equation 3 still gives a probability of 27% of 401 having at least one user in the room. But if we increase to six EnAPlugs, the probability of having a user 402

Energies 2019, 12, x FOR PEER REVIEW 12 of 13
in the room raises to 47%; even with all of the six EnAPlugs forecasting that no user will be in the room. 403 Therefore, the trigger value of 𝛽1𝑟𝑜𝑜𝑚 – that will indicate when the controllable resource will be 404
turned on – should be correlated with the number of deployed EnAPlugs in the same room; a higher 405 trigger for a higher density of deployments. Future developments should take this into consideration 406 when using the shared knowledge mechanism. 407
The paper shows the benefits that the integration of artificial intelligence can have if it is used in 408 our daily devices. The case study has shown that the proposed approach was able to decrease energy 409 costs. Also, the decisions and actions are taken away from the user to the system, saving the users’ time 410 and providing him with intelligent load control. 411
Author Contributions: Conceptualization, L.G., F.S., T.P. and Z.V.; Methodology, L.G., F.S., T.P. and Z.V.; 412 Software, L.G.; Validation, L.G., F.S., T.P. and Z.V.; Formal analysis, L.G., F.S. and Z.V; Investigation, L.G.; 413 Resources, Z.V.; Data curation, L.G.; Writing-original draft, L.G. and T.P.; Writing-review & editing, L.G., F.S., 414 T.P. and Z.V.; Visualization, L.G., F.S., T.P. and Z.V; Supervision, T.P. and Z.V.; Project administration, L.G. and 415 Z.V.; Funding acquisition, Z.V. 416
Funding: The present work has been developed under Project SIMOCE (ANI|P2020 17690), and has received 417 funding from FEDER Funds through COMPETE program and from National Funds through FCT under the 418 project UID/EEA/00760/2019 and SFRH/BD/109248/2015. 419
Conflicts of Interest: The authors declare no conflict of interest. 420
References 421
1. Consumer Technology Association, 2015. Digital America 2015, pp. 85. 422 2. Statista 2018. Smart Home Report 2018 - Control and Connectivity, Smart Home Report 2018 - Control and 423
Connectivity. 424 3. Alquthami, T.; and Meliopoulos, A. P. S. Smart House Management and Control Without Customer 425
Inconvenience. IEEE Transactions on Smart Grid 2018, 9(4), 2553-2562. doi: 10.1109/TSG.2016.2614708 426 4. Lee, H.; Park, W.; and Lee, I. A Home Energy Management System for Energy-Efficient Smart Homes. In 427
Proceedings of the 2014 International Conference on Computational Science and Computational 428 Intelligence, Las Vegas NV, United States of America, 10-13 March 2014, 142-145. doi: 429 10.1109/CSCI.2014.109 430
5. Liu, Y.; Yuen, C.; Yu, R.; Zhang, Y.; and Xie S. Queuing-Based Energy Consumption Management for 431 Heterogeneous Residential Demands in Smart Grid. IEEE Transactions on Smart Grid 2015, 7(3), 1650-1659. 432 doi: 10.1109/TSG.2015.2432571 433
6. Galioto, G.; Galioto, N.; Giaconia, C.; Giarré, L.; Neglia, G.; and Tinnirello, I. Smart plugs: A low cost 434 solution for programmable control of domestic loads. In Proceedings of the 2014 AEIT Annual Conference 435 - From Research to Industry: The Need for a More Effective Technology Transfer (AEIT), Trieste, Italy, 18-436 19 Sept. 2014, 1-6. doi: 10.1109/AEIT.2014.7002015 437
7. Morsali, H.; Shekarabi, S.M.; Ardekani, K.; Khayamim, H.; Fereidunian, A.; Ghassemian, M.; and Lesani, 438 H. Smart plugs for building energy management systems. In Proceedings of the Iranian Conference on 439 Smart Grids, Tehran, Iran, 24-25 May 2012, 1-5. 440
8. Heo, S.; Park, W; and Lee, I. Energy management based on communication of smart plugs and inverter for 441 smart home systems. In Proceedings of 2017 International Conference on Information and Communication 442 Technology Convergence (ICTC), Jeju, South Korea, 18-20 Oct. 2017, 810-812. 443
9. Petrović, T.; and Morikawa, H. Active sensing approach to electrical load classification by smart plug. In 444 Proceedings of the 2017 IEEE Power & Energy Society Innovative Smart Grid Technologies Conference 445 (ISGT), Washington DC, USA, 23-26 April 2017, 1-5. doi: 10.1109/ISGT.2017.8086053 446
10. Gomes, L.; Sousa, F.; Vale, Z. An Intelligent Smart Plug with Shared Knowledge Capabilities. Sensors 2018, 447 18, 3961. doi: 10.3390/s18113961 448
11. Gomes, L.; Sousa, F.; and Vale, Z. EnAPlug – An Environmental Awareness Plug to Test Energy 449 Management Solutions for Households. In: Oliveira E., Gama J., Vale Z., Lopes Cardoso H. eds Progress in 450 Artificial Intelligence. EPIA 2017. Lecture Notes in Computer Science, volume 10423. Springer, Cham. doi: 451 10.1007/978-3-319-65340-2_21 452
12. A. Musleh, A. S.; Debouza, M.; and Farook, M. Design and implementation of smart plug: An Internet of 453 Things (IoT) approach. In Proceedings of the 2017 International Conference on Electrical and Computing 454

Energies 2019, 12, x FOR PEER REVIEW 13 of 13
Technologies and Applications (ICECTA), Ras Al Khaimah, United Arab Emirates, 21-23 Nov. 2017, 1-4. 455 doi: 10.1109/ICECTA.2017.8252033 456
13. Ahmed, M.; Mohamed, A.; Homod, R. Z.; Shareef, H.; Sabry, A. H.; and Bin Khalid, K. Smart plug prototype 457 for monitoring electrical appliances in Home Energy Management System. In Proceedings of the 2015 IEEE 458 Student Conference on Research and Development (SCOReD), Kuala Lumpur, Malaysia, 13-14 Dec. 2015, 459 32-36. doi: 10.1109/SCORED.2015.7449348 460
14. Lukac, N.; Pavlovic, R.; Vukobrat, V.; Teslic, N. Bluetooth Smart Plug. In Proceedings of the 2015 IEEE 1st 461 International Workshop on Consumer Electronics (CE WS), Novi Sad, Serbia, 11-11 March 2015, 16-18. doi: 462 10.1109/CEWS.2015.7867143 463
15. Thongkhao Y.; and Pora, W. A low-cost Wi-Fi smart plug with on-off and Energy Metering functions. In 464 Proceedings of the 2016 13th International Conference on Electrical Engineering/Electronics, Computer, 465 Telecommunications and Information Technology (ECTI-CON), Chiang Mai, Thailand, 28 June-1 July 2016, 466 1-5. doi: 10.1109/ECTICon.2016.7561264 467
16. Ganu, T.; Hazra, J.; Seetharam, D. P.; Husain, S. A.; Arya, V.; Chandratilake De Silva, L.; Kunnath, R.; 468 Kalyanaraman, S. 2012. nPlug: A smart plug for alleviating peak loads. In Proceedings in the 2012 Third 469 International Conference on Future Systems: Where Energy, Computing and Communication Meet (e-470 Energy), Madrid, Spain, 9-11 May 2012, 1-10. doi: 10.1145/2208828.2208858 471
17. Wooldridge, M. An Introduction to Multiagent Systems, 2nd ed.; Wiley Publishing: New Jersey, United States 472 of America, 2009. ISBN:0470519460 9780470519462 473
18. Siebert, L. C.; Ferreira, L. R.; Yamakawa, E. K.; Custiódio, E. S.; Aoki, A. R.; Fernandes, T. S. P.; Cardoso, K. 474 H. Centralized and decentralized approaches to demand response using smart plugs. In Proceedings of the 475 2014 IEEE PES T&D Conference and Exposition, Chicago, United States of America, 14-17 April 2014, 1-5. 476 doi: 10.1109/TDC.2014.6863547 477
19. Khan, Z. A.; Shahid, S.; Ahmad, H. F.; Ali A.; Suguri, H. Decentralized architecture for fault tolerant multi 478 agent system. In Proceedings of the Autonomous Decentralized Systems, Chengdu, Jiuzhaigou, China, 4-8 479 April 2005, 167-174. doi: 10.1109/ISADS.2005.1452043 480
20. Wang, Z.; and Srinivasan, R. S. A review of artificial intelligence based building energy use prediction: 481 Contrasting the capabilities of single and ensemble prediction models. Renewable and Sustainable Energy 482 2017, 75, 796–808. doi: 10.1016/j.rser.2016.10.079 483
21. Early Stopping, Available online: https://deeplearning4j.org/docs/latest/deeplearning4j-nn-early-stopping 484 (accessed on 20 February 2019). 485
22. Glorot, X.; and Bengio, Y. Understanding the difficulty of training deep feedforward neural networks. In 486 Proceedings of the Thirteenth International Conference on Artificial Intelligence and Statistics, Sardinia, 487 Italy, 13-15 May 2010, 249-256. 488
23. Aš Mikolov, To. 2012. Statistical Language Models Based on Neural Networks, Doctoral Thesis. 489 24. Unions and Intersections - The probability of a union of events, Available online: 490
https://math.dartmouth.edu/archive/m19w03/public_html/Section6-2.pdf (accessed on 20 February 2019). 491 25. Almada, J.B.; Leão, R.P.S.; Sampaio, R.F.; Barroso, G.C. A centralized and heuristic approach for energy 492
management of an AC microgrid. Renewable and Sustainable Energy Reviews 2016, 60, 1396-1404. doi: 493 10.1016/j.rser.2016.03.002 494
26. Guodong Liu, Tao Jiang, Thomas B. Ollis, Xiaohu Zhang, Kevin Tomsovic, Distributed energy management 495 for community microgrids considering network operational constraints and building thermal dynamics, 496 Applied Energy 2019, 239, 83-95, ISSN 0306-2619. doi: 10.1016/j.apenergy.2019.01.210 497
27. Eurostat, 2018, Available online: https://ec.europa.eu/eurostat/statistics-498 explained/index.php/Electricity_price_statistics (accessed on 20 February 2019). 499 500
© 2019 by the authors. Submitted for possible open access publication under the terms
and conditions of the Creative Commons Attribution (CC BY) license
(http://creativecommons.org/licenses/by/4.0/).
501

Luis Gomes
Agent-based Architecture for Demand Side Management using Real-Time Resources’ Priorities
and a Deterministic Optimization Algorithm
Authors: Luis Gomes, João Spínola, Zita Vale, and Juan M. Corchado
Published in: Journal of Cleaner Production (IF: 6.395)
DOI: 10.1016/j.jclepro.2019.118154
Published at: December 2019
PhD timeline: M41
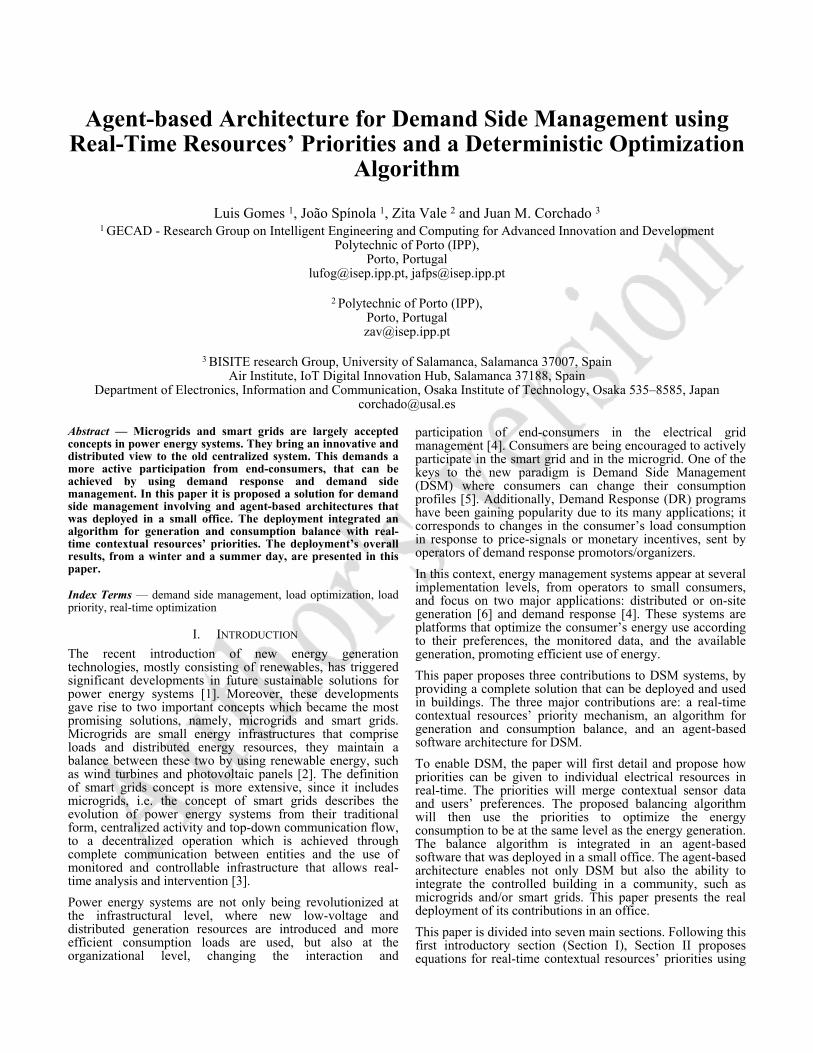
Agent-based Architecture for Demand Side Management usingReal-Time Resources’ Priorities and a Deterministic Optimization
Algorithm
Luis Gomes 1, João Spínola 1, Zita Vale 2 and Juan M. Corchado 3
1 GECAD - Research Group on Intelligent Engineering and Computing for Advanced Innovation and DevelopmentPolytechnic of Porto (IPP),
Porto, [email protected], [email protected]
2 Polytechnic of Porto (IPP),Porto, [email protected]
3 BISITE research Group, University of Salamanca, Salamanca 37007, SpainAir Institute, IoT Digital Innovation Hub, Salamanca 37188, Spain
Department of Electronics, Information and Communication, Osaka Institute of Technology, Osaka 535–8585, [email protected]
Abstract — Microgrids and smart grids are largely acceptedconcepts in power energy systems. They bring an innovative anddistributed view to the old centralized system. This demands amore active participation from end-consumers, that can beachieved by using demand response and demand sidemanagement. In this paper it is proposed a solution for demandside management involving and agent-based architectures thatwas deployed in a small office. The deployment integrated analgorithm for generation and consumption balance with real-time contextual resources’ priorities. The deployment’s overallresults, from a winter and a summer day, are presented in thispaper.
Index Terms — demand side management, load optimization, loadpriority, real-time optimization
I. INTRODUCTION
The recent introduction of new energy generationtechnologies, mostly consisting of renewables, has triggeredsignificant developments in future sustainable solutions forpower energy systems [1]. Moreover, these developmentsgave rise to two important concepts which became the mostpromising solutions, namely, microgrids and smart grids.Microgrids are small energy infrastructures that compriseloads and distributed energy resources, they maintain abalance between these two by using renewable energy, suchas wind turbines and photovoltaic panels [2]. The definitionof smart grids concept is more extensive, since it includesmicrogrids, i.e. the concept of smart grids describes theevolution of power energy systems from their traditionalform, centralized activity and top-down communication flow,to a decentralized operation which is achieved throughcomplete communication between entities and the use ofmonitored and controllable infrastructure that allows real-time analysis and intervention [3].
Power energy systems are not only being revolutionized atthe infrastructural level, where new low-voltage anddistributed generation resources are introduced and moreefficient consumption loads are used, but also at theorganizational level, changing the interaction and
participation of end-consumers in the electrical gridmanagement [4]. Consumers are being encouraged to activelyparticipate in the smart grid and in the microgrid. One of thekeys to the new paradigm is Demand Side Management(DSM) where consumers can change their consumptionprofiles [5]. Additionally, Demand Response (DR) programshave been gaining popularity due to its many applications; itcorresponds to changes in the consumer’s load consumptionin response to price-signals or monetary incentives, sent byoperators of demand response promotors/organizers.
In this context, energy management systems appear at severalimplementation levels, from operators to small consumers,and focus on two major applications: distributed or on-sitegeneration [6] and demand response [4]. These systems areplatforms that optimize the consumer’s energy use accordingto their preferences, the monitored data, and the availablegeneration, promoting efficient use of energy.
This paper proposes three contributions to DSM systems, byproviding a complete solution that can be deployed and usedin buildings. The three major contributions are: a real-timecontextual resources’ priority mechanism, an algorithm forgeneration and consumption balance, and an agent-basedsoftware architecture for DSM.
To enable DSM, the paper will first detail and propose howpriorities can be given to individual electrical resources inreal-time. The priorities will merge contextual sensor dataand users’ preferences. The proposed balancing algorithmwill then use the priorities to optimize the energyconsumption to be at the same level as the energy generation.The balance algorithm is integrated in an agent-basedsoftware that was deployed in a small office. The agent-basedarchitecture enables not only DSM but also the ability tointegrate the controlled building in a community, such asmicrogrids and/or smart grids. This paper presents the realdeployment of its contributions in an office.
This paper is divided into seven main sections. Following thisfirst introductory section (Section I), Section II proposesequations for real-time contextual resources’ priorities using
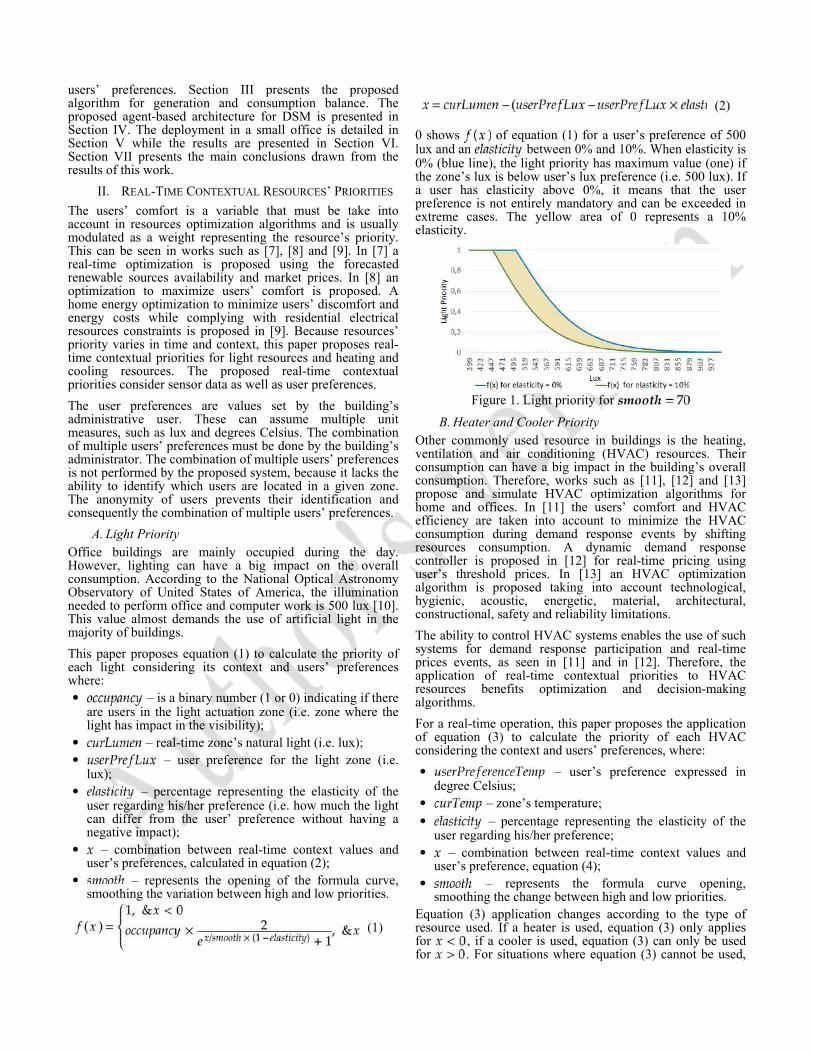
users’ preferences. Section III presents the proposedalgorithm for generation and consumption balance. Theproposed agent-based architecture for DSM is presented inSection IV. The deployment in a small office is detailed inSection V while the results are presented in Section VI.Section VII presents the main conclusions drawn from theresults of this work.
II. REAL-TIME CONTEXTUAL RESOURCES’ PRIORITIES
The users’ comfort is a variable that must be take intoaccount in resources optimization algorithms and is usuallymodulated as a weight representing the resource’s priority.This can be seen in works such as [7], [8] and [9]. In [7] areal-time optimization is proposed using the forecastedrenewable sources availability and market prices. In [8] anoptimization to maximize users’ comfort is proposed. Ahome energy optimization to minimize users’ discomfort andenergy costs while complying with residential electricalresources constraints is proposed in [9]. Because resources’priority varies in time and context, this paper proposes real-time contextual priorities for light resources and heating andcooling resources. The proposed real-time contextualpriorities consider sensor data as well as user preferences.
The user preferences are values set by the building’sadministrative user. These can assume multiple unitmeasures, such as lux and degrees Celsius. The combinationof multiple users’ preferences must be done by the building’sadministrator. The combination of multiple users’ preferencesis not performed by the proposed system, because it lacks theability to identify which users are located in a given zone.The anonymity of users prevents their identification andconsequently the combination of multiple users’ preferences.
A. Light Priority
Office buildings are mainly occupied during the day.However, lighting can have a big impact on the overallconsumption. According to the National Optical AstronomyObservatory of United States of America, the illuminationneeded to perform office and computer work is 500 lux [10].This value almost demands the use of artificial light in themajority of buildings.
This paper proposes equation (1) to calculate the priority ofeach light considering its context and users’ preferenceswhere:
· – is a binary number (1 or 0) indicating if thereare users in the light actuation zone (i.e. zone where thelight has impact in the visibility);
· – real-time zone’s natural light (i.e. lux);
· – user preference for the light zone (i.e.lux);
· – percentage representing the elasticity of theuser regarding his/her preference (i.e. how much the lightcan differ from the user’ preference without having anegative impact);
· – combination between real-time context values anduser’s preferences, calculated in equation (2);
· – represents the opening of the formula curve,smoothing the variation between high and low priorities.
(1)
(2)
0 shows of equation (1) for a user’s preference of 500lux and an between 0% and 10%. When elasticity is0% (blue line), the light priority has maximum value (one) ifthe zone’s lux is below user’s lux preference (i.e. 500 lux). Ifa user has elasticity above 0%, it means that the userpreference is not entirely mandatory and can be exceeded inextreme cases. The yellow area of 0 represents a 10%elasticity.
Figure 1. Light priority for
B. Heater and Cooler Priority
Other commonly used resource in buildings is the heating,ventilation and air conditioning (HVAC) resources. Theirconsumption can have a big impact in the building’s overallconsumption. Therefore, works such as [11], [12] and [13]propose and simulate HVAC optimization algorithms forhome and offices. In [11] the users’ comfort and HVACefficiency are taken into account to minimize the HVACconsumption during demand response events by shiftingresources consumption. A dynamic demand responsecontroller is proposed in [12] for real-time pricing usinguser’s threshold prices. In [13] an HVAC optimizationalgorithm is proposed taking into account technological,hygienic, acoustic, energetic, material, architectural,constructional, safety and reliability limitations.
The ability to control HVAC systems enables the use of suchsystems for demand response participation and real-timeprices events, as seen in [11] and in [12]. Therefore, theapplication of real-time contextual priorities to HVACresources benefits optimization and decision-makingalgorithms.
For a real-time operation, this paper proposes the applicationof equation (3) to calculate the priority of each HVACconsidering the context and users’ preferences, where:
· – user’s preference expressed indegree Celsius;
· – zone’s temperature;
· – percentage representing the elasticity of theuser regarding his/her preference;
· – combination between real-time context values anduser’s preference, equation (4);
· – represents the formula curve opening,smoothing the change between high and low priorities.
Equation (3) application changes according to the type ofresource used. If a heater is used, equation (3) only appliesfor , if a cooler is used, equation (3) can only be usedfor . For situations where equation (3) cannot be used,

will have the value 0; for example, when a heater isused and the heater’s priority will be 0.
(3)
(4)
0 shows of equation (3) using a user temperaturepreference of 24 ºC. The yellow area represents a 10%elasticity. 0 represents an air-conditioner that can heat andcool the room/zone. Otherwise, the chart should not besymmetric. The blue line represents que normal HVACpriority, while the green line represents the minimumpossible priority using a 10% elasticity.
Figure 2. HVAC priority for
III. PROPOSED ALGORITHM FOR GENERATION AND
CONSUMPTION BALANCE
The proposed algorithm for generation and consumptionbalance is an evolution of the algorithm present in [14] and[15]. The new proposed algorithm is able to run in real-timein a single-board computer, while the previous version wasbuilt to reduce energy consumption according to a target andwas not prepared to balance generation and consumption inreal-time.
The algorithm takes into consideration the software andhardware limitations of a single-board computer and thelimitation of the GNU Linear Programming Kit (GLPK).GLPK, used as solver, allows the solving of large-scale linearprogramming and mixed integer programming problems.Java Optimization Modeler (JOM) is also used to provide alayer between Java language and GLPK, simplifying thesolver usage and configuration.
The proposed approach considers two types of resources:discrete and variable. As to the mathematical formulationused for optimization, it considers the available on-sitegeneration ( ), the current consumption ( ) and twodemand response programs, load reduction ( ) and loadcurtailment ( ). The first is applied to dimmable controlledloads (i.e. variable), while the latter acts on loads that canonly be turned on/off (i.e. discrete). Equation (5) shows theobjective function used for balancing the consumption andgeneration and considering the minimization of impact onconsumer priorities. In equation (5), represents thenumber of loads capable of load reduction and representsthe number of loads capable of load curtailment. Userpriorities are represented by and . The is a
weight that prioritizes the balance between generation andconsumption.
(5)
The algorithm intends to minimize the gap betweengeneration and consumption, when the available generation islower than actual consumption. This ensures that even thoughit is not possible to supply all loads with on-site generation,the operational costs are only the necessary ones. In equation(6), the constraint related to the balancing is considered, bylooking at the available generation and demand responseprograms. Variable is a percentual weight given to thegenerated energy to avoid a match overfitting betweenconsumption and generation. The photovoltaic generation hasovertime fast fluctuations, if an overfitting match isperformed, there is no guarantee that the consumption will bekept below generation.
(6)
Equation (7) reflects the load curtailment program whereloads participating in it are turned on/off. The modeling ofthis program considers a binary variable ( ) that theoptimization uses to define if load will be turned on or turnoff. The can take two different values, if
consumption if bigger or equal than generation, then
is the real-time consumption of load, otherwise is
the possible consumption of the load represented with anegative number – in other words, if a load consumes 500 W,then .
(7)
Equations (8) and (9) are constraints implemented to ensureabsolute values for the load reduction variable ( ) and the
load curtailment variable ( ). These constraints are
needed because GLPK is used with JOM that do not providea syntax for absolute values in the objective function.
(8)
(9)
The proposed algorithm is light enough to run in a RaspberryPi 3 Model B in less than two seconds. This was the mainconcern and objective within the development of thisalgorithm. The load priorities, represented by and
, are achieved using Section II equations (1) and (3) forreal-time contextual resources’ priorities.
IV. PROPOSED AGENT-BASED ARCHITECTURE FOR
DEMAND SIDE MANAGEMENT
The use of Multi-Agent Systems (MAS) in microgridsappears to be a good fit, where each microgrid’s player is

represented by an agent of the MAS. This paper will focus onthe architecture of a building’s agent considering previousworks. The proposed agent-based architecture will be able tobe integrated in a MAS; of a microgrid or smart grid.However, the focus of this paper is to analyze the proposedagent-based architecture running in standalone to manage theelectrical resources of a building.
The proposed architecture, shown in 0, is divided into sixinterconnected layers that enable the full energy managementof a building. Depending on the agent goal and desiredfunctionalities, some layers can be left outside theimplementation scope. 0 also presents examples oftechnologies that can be used to implement each layer. Thenext subsections will describe the layers from the bottom-up.
Figure 3. Agent Architecture Layers
A. Multi-Agent Layer
The Multi-Agent Layer is implemented using a framework,such as JADE or Jadex. Agent communications areimplemented in this layer in order to allow it to communicatewith other agents. The registrations and connectivity in MASare also implemented in this layer.
The motivation of this layer comes from previous works wereenergy management systems for buildings were integrated inMAS for microgrids and smart grids players modeling [16-19]. In [16] a MAS for microgrid is proposed for distributedconsensual optimizations where communication delays areconsidered. A distributed cyber physical microgrid model forreal-time tasks is proposed in [17]. In [18] a MAS forislanded microgrids is simulated. A survey regarding thedeployment of MAS in smart grids is presented in [19] whereseveral agent layers are presented. This paper’s agent-basedarchitecture will be part of the Prosumer Agents layeridentified in [19].
B. Computational Layer
The computational capability of the agent is usually taken forgranted while using today’s computers. However, to deployagents in end-consumer’s buildings, smaller and cheapercomputational platforms should be taken into consideration,such as single-board computers that have smallercomputational power. The Computational Layer determines
the possibilities of the agent to process complex operations,for instance, forecasting algorithms.
The Computational Layer allows the usage of distributedcomputing, edge/FOG computing and cloud computing [20].A combination of computing technologies is used toempower the agent processing speed and quality. Theintegration of real-time data and IoT devices, in theIntegration Layer, demands significant computational powerto process everything. By using external computationalresources, more complex and efficient algorithms for energymanagement can be used. This layer will orchestrate localand remote data processing.
Security measures must be considered when dealing withexternal computation, this is a significant issue when dealingwith end-consumer data that can jeopardize user security andprivacy. The security of data passing from one side to theother must be addressed [21].
C.Persistence Layer
To build an efficient system for energy management andDSM, is important to store data. In energy managementsystems, is important the use of: forecasting algorithm asseen in [22], data analysis as seen in [23], and user profiles asseen in [24]. Therefore, the Persistence Layer is needed tofeed algorithms with historical data.
The Persistence Layer is divided into two levels: localstorage, and external storage. The local storage stores thedata in the same hardware where the agent is running, forinstance, in the same computer. The external storage usesexternal hardware to store the information of the agent, forinstance, a server in the cloud. The external storage is usedfor older data – freeing the local storage memory – and/or tostore data backups.
D.Energy Management Layer
Regarding building’s energy management, the mostimportant layer of the proposed architecture is the EnergyManagement Layer. This layer integrates algorithms forDSM [25], autonomous demand response [26], energyoptimization [27], scheduling algorithms [28], learningalgorithms [29] and all other methods that the developerwants to enable in the architecture. This layer willaccommodate the business logic of each agent and is seen asthe intelligent layer. For this paper, a DSM resourceoptimization (Section III) will be implemented in this layer.
E. Integration Layer
Internet of things (IoT) devices are almost anywhere, andthey can be used for energy management systems [30-32]. In[30] is demonstrated a human-in-the-loop (HiTL) system thatuses IoT devices to enable sensing, data transmission andsignal receivers for resources control. In [31] an energymanagement system using IoT devices is proposed usingREST communications and MQTT protocol. In [32] anenergy management system with IoT devices is proposed andsimulated. The proposed system of [32] uses OpenADR tobridge between grid- and facility-side. The integration of IoTdevices in our proposed energy management system is donein the Integration Layer.
The Integration Layer is responsible to communicate andintegrate IoT devices using multiple communicationprotocols. This layer will communicate to all the building’sresources and is responsible to monitor and control all ofthem.

The success of the Integration Layer depends on two mainaspects: the number of available and implementedcommunication protocols, and the number ofresources/devices with monitoring and/or control capabilitieson the building. The developer can take care of the firstaspect, by developing the appropriate protocols. Regardingthe second aspect, the end-consumer must provide enoughcontrollable resources.
F. Graphical User Interface Layer
The Graphical User Interface Layer is responsible for users’interactions. This layer responds to the need of having agraphical interface for users, as stated and analyzed in [33]and [34]. This layer enables the users’ real-time interactionwith the agent-based architecture. Users are considered to bethe persons that live/work/“are in” the building where thearchitecture is deployed. The interface complexity andcompatibilities depend on the functionalities that eachdeveloper makes available.
The interface can be made locally, using a screen to show theinterface of the agent, or externally, using an API consumedby an external device(s), such as a computer or a smartphone.
V. OFFICE DEPLOYMENT
For this case study, the proposed architecture of Section IVwas implemented using open-source libraries, with licensessuch as LGPL 2.1, Apache 2.0 and GPLv3. 0 shows the mainlibraries and technologies used for each layer of theimplemented system. It was used Java programminglanguage; for developing; and a Raspberry Pi 3 Model B; fordeployment. For this case study an SSH shell was used andno additional graphical user interface was developed. In theIntegration Layer were implemented: Modbus/TCP andRESTful; able to control 100% of the controllable resourcesavailable. The proposed algorithm for generation andconsumption balance; of Section III; was integrated in theEnergy Management Layer. The optimization runs locallyinside the Computational Layer (i.e. the Raspberry Pi 3Model B processing unit).
Figure 4. Case Study Implementation
For this case study was used an office with photovoltaicgeneration located in Portugal. The office has a total of 2.1kW photovoltaic generation that can be used for self-consumption. For the purposes of this case study, the officewas divided into 5 hierarchical zones; as seen in 0. 0 lists the
resources with individual monitoring in each zone as well astheir control type and consumption/generation power.Besides these resources with individual monitoring, the officehas a total of 270 W general uncontrollable consumption thatcorresponds to two desktop computers, four monitors and onelaptop. This consumption is measured in real-time using oneenergy analyzer in the office’s electrical board.
Table 1. Resources description
Zone ResourceMonitoringTechnology
ControlType
ControlTechnology
Power(W)
1 Photovoltaic Energy Analyzer none none 2,100
2
Lamp 2.1 Energy Analyzer variable DALI 100
Lamp 2.2 Energy Analyzer variable DALI 100
Lamp 2.3 Energy Analyzer variable DALI 100
3 Refrigerator EnAPlug [35] none* EnAPlug 120
4Lamp 2.4 Energy Analyzer variable DALI 100
Heater TP-Link HS110 discreteTP-LinkHS110
1,000
5
Lamp 4.1 Energy Analyzer variable DALI 100
Lamp 4.2 Energy Analyzer variable DALI 100
TelevisionEDIMAXSmart Plug
variableEDIMAXSmart Plug
135
* has on/off control but is not used in this case study
Many of the resources in 0 use energy analyzers forconsumption monitoring. These energy analyzers areconnected to a main programmable logic controller (PLC)located in the office’s electrical board. The communicationbetween the PLC and the energy analyzers is done usingModbus/RTU protocol. Despite this high cost installation, thecase study also uses smart plugs available on the market, suchas TP-Link HS110 and EDIMAX Smart Plug. TheEnvironment Awareness Smart Plug proposed in [35] is alsoused to combine energy metering with context data.
0 shows the representation of the office divided in 5 zoneswhere there are 2 working desks – Zone 4 and 5 – and 2common areas – Zone 2 and 3. Zone 1 represents themain/root zone with the generation resource. The zones arehierarchical where each one has a ‘parent’ zone and wherezone 1 is considered the root zone – i.e. without parent.
The resources’ priorities; represented by and inequation (5); are calculated in real-time using equations (1)and (3); depending on the resource type. Sensors wereinstalled in the office in order to provide data to be used inequations (1) and (3). 0 presents the sensors installed. Sensorsof zone 3 are the ones inside EnAPlug. The keyboard andmouse sensors used in zones 4 and 5 were developed in Java.This software uses a connection with an Arduíno Nano;installed in the working desk; that has a luminosity sensorand a movement sensor. The combination between keyboard,mouse and movement sensor identifies the use of the workingplace.
Table 2. Sensors description
Zone Sensor Units
3
Refrigerator temperature º C
Refrigerator humidity %
Temperature º C
4
Ambient light Lux
Movement [0,1]
Keyboard [0,1]
Computer mouse [0,1]

5Ambient light Lux
Movement [0,1]
Keyboard [0,1]
Computer mouse [0,1]
Figure 5. Office’s zones and loads
The sensors are used as inputs for the real-time contextualresources’ priorities defined in Section II which in turn areused as inputs for the balancing algorithm defined in SectionIII. The sensor integration, resource integration andoptimization are processed in a Raspberry Pi 3 Model Busing the agent-based architecture proposed in Section IV.
The real-time contextual resources’ priorities use users’preferences; that in this case study are divided by zones. Theusers’ preference for temperature is 24º C for Zone 4 – that isthe only zone with a heater. The users’ preference forambient light is 500 lux for Zones 4 and 5 and 280 lux forZone 2. The elasticity values are set to 0, meaning that all thepreferences should be strictly obeyed by the system.Regarding the smooth value, in this case study, a smoothvalue of 70 was used for light resources, and a smooth valueof 4 was used for heating and cooling resources.
To provide a real deployment of the system, some rules hadto be implemented. These rules aim the efficient deploymentof the optimization algorithm considering real-timeenvironments. 0 lists the restrictions and conditionsimplemented. In the scope of this paper, restrictions are rulesthat must be true for the algorithm to be executed, where allof them must be true – if at least one is false, then thealgorithm will not be executed. Conditions are, in the scopeof this paper, rules that when true activate the algorithm,where at least on of then must be true – if at least one is true,then the algorithm will be executed.
In 0, is the total office’s consumption, isthe total consumption of the controllable resources – the maximumconsumption that can be decreased –, is the totalphotovoltaic generation and the represents thealgorithm’s last execution timestamp.
Table 3. Rules for Algorithm Execution
Type Rule
Restriction
Restriction
Condition
Condition
Condition
The rules of 0 are verified each second. Therefore, thereaction of the algorithm to sudden generation and/orconsumption variations is not immediate. The algorithm cantake until 2.4 seconds to be executed – 1 second representingthe energy data reading period, 0.4 seconds representing thetimeout used in the energy data reading communications, and1 second for the agent’s verification of 0 rules. The executionof the algorithm also takes 2 seconds and then thecommunication to resources’ must be done – with a timeoutof 0.4 seconds. Making a maximum reaction time of 4.8between the generation and/or consumption variation and theoffice’s energy matching to be concluded.
During deployment, the users requested the inclusion of anew rule for the heater to turn off automaticity if its priorityis zero. In this case, the heater will be turned off whentemperature is equal or bigger than 24º C; regardless theoffice context.
VI. RESULTS AND DISCUSSION
This section will present the results of the deploymentdescribed in the previous section. Two days where chosen tobe presented in this paper. The complete data of these twodays, as well as an additional cloudy day, are publicly publishin Zenodo platform under record 2565289 [36]. 0 and 0 showthe results of total consumption (blue line), total generation(green line), energy bought from the grid (blue area), energysold to the grid (green area) and the temperature of Zone 3(yellow line); where the working desks are located – see 0.The days were chosen having in mind the difference in thephotovoltaic generation.The winter day has three distinct periods that stand out fromthe flat daily profile: from 10:42 to 12:32, from 12:32 to13:33, and from 13:33 to 13:55. The first and third periodshappen because of the heater. Has can be seen in 0, the heater

has a significant consumption when compared with theremaining loads. The second period, that stands out, happensbecause the system executes the balancing algorithmproposed in Section III. During this period the systemidentifies the possibility to balance the consumption andgeneration and therefore starts executing the algorithm ofSection III; turning off controllable loads that will not harmthe users’ comfort. As previously stated, in the firstrestriction of 0, the balancing algorithm will only be executed
in periods where is possible to have the total consumptionlower than the generation; otherwise, no control over theloads are executed.
During the summer day, presented in 0, the system is able tokeep the consumption balanced with the generation throughthe majority of the day; from 8:30 to 19:07. Around 16:50 ispossible to see the ability of the balancing algorithm todecrease and increase the office’s consumption, following thegeneration pattern.
Figure 6. Winter day (12th of December of 2018)
Figure 7. Summer day (9th of July of 2018)
The real-time resource optimization was a success, especiallyfor days where the generation was enough to support theoffice consumption demands – i.e. where generation washigher than consumption less flexibility. However, looking atthe presented days, there is a strange situation with thetemperature. Both days starts with temperatures near 20 ˚Cand both of them turn on the heater when the users arrive tothe office. However, in the winter day the heater stays on for50 minutes, achieving a 23.9 ˚C temperature, and in thesummer day the heater stays on for 15 minutes, achieving a21.2 ˚C temperature. The heater is turned off in three possibleconditions: manually by the user (this did not happen),automatically because the temperature achieves 24 ˚C (thisonly happens in the winter day at 13:55), and automaticallybecause the balancing algorithm decides to turn off the heater– if and only if the priority value of the heater allows thisaction. The reason the heater worked for 50 minutes, in thewinter day, was because none of the previous conditions havebeen fulfilled; the users did not turn off the heater, thetemperature did not achieve 24 ˚C and the algorithm was notexecuted because of the low generation value. And the reasonthe heater worked for 15 minutes, in the summer day, wasbecause the algorithm was executed, and the heater’s priorityvalue allowed the turned off of the heater.
The overall results of this case study can be seen in 0 wherefor each kWh bought from the grid was applied a 0.20 EURcost and for each kWh sold to the grid was applied a 0.10EUR profit; reflecting the current Portuguese consumer
market. Is also possible to see that in the summer day thealgorithm was executed 4,929 times; 3201% increase whencomparing to the winter day. In the winter day – where thealgorithm was executed 154 times – the energy cost for thebuilding was 2.10 EUR, while in the summer day the energycost dropped to 0.27 EUR. This was in fact a result incited bythe balancing algorithm implemented in the proposed agent-based architecture using real-time contextual resources’priorities.
Table 4. Overall results
Winter day Summer day
Generation (kWh) 1.910 10.053Consumption(kWh)
12.3649.945
Algorithmexecution
154 4,929
Outcome (EUR) 2.11 0.56Income (EUR) 0.01 0.29Daily energy(EUR)
2.100.27
VII. CONCLUSIONS
The application of demand side management and demandresponse programs in energy grids will enable theparticipation of small and medium players in the smart gridand microgrid contexts. However, this active participationwill demand from end-consumers the ability to manage theirown consumptions in an efficient, smart and autonomous

way. This paper proposes three key components that enablessmall and medium player participation: a real-time contextualresources’ priority mechanism enabling the prioritization ofindividual resources in a building, a balance algorithm forgeneration and consumption enabling the resourcesoptimization and reducing the energy bought from the gridwhile promoting auto-consumption, and an agent-basedarchitecture for demand side management enabling thenecessary means for an actual participation of end-consumers.
The proposed real-time contextual resources’ prioritizationmechanism was implemented together with the proposedbalance algorithm in the Energy Management Layer of theproposed agent-based architecture. The proposed architecturewas then deployed in a small office in Portugal. This paperpresents the main overall results of this deployment for awinter day and a summer day.
The proposed real-time contextual resources’prioritizations mechanism together with the proposed balancealgorithm were able to be executed in real-time using aRaspberry Pi 3 Model B. No issues were detected in thecontextual resources’ prioritizations mechanism, but they canoccur if sensor data is missed or unable to be read. During theexecution of the case study was noticed that the balancealgorithm sometimes fails when not a feasible solution wasfound. Yet, this algorithm failure is handled by the softwareagent.
The algorithm had a good performance, as shown in theresults. However, one issue found in the real-time algorithmmakes the execution of the algorithm unfeasible during sunnydays with heavy passage of clouds. These days have a bigimpact in the photovoltaic generation, producing highfluctuations that will be reflected in the consumption, makingthe office to go from full consumption to lower consumption,and vice-versa, in few moments. This issue makes itunfeasible the use of the proposed algorithm during sunnydays with heavy passage of clouds.
Because the proposed agent-based architecture wassuccessfully implemented in an office, new studies shouldfollow to create an agent community representing a microgridand/or a smart grid. This paper presents an individualdeployment in an office, but the agent-based architecturesupports community implementations where several agentscommunicate with each other in a cooperative or competitivemode.
ACKNOWLEDGEMENTS
The present work has been developed under the ProjectGREEDI (ANI|P2020 17822) co-funded by Portugal 2020“Fundo Europeu de Desenvolvimento Regional” (FEDER)through PO CI, and Project SIMOCE (ANI|P2020 17690),and has received funding from FEDER Funds throughCOMPETE program and from National Funds through FCTunder the project UID/EEA/00760/2019 andSFRH/BD/109248/2015.
REFERENCES
[1] D. Kolokotsa, “The role of smart grids in the building sector,” Energyand Buildings, vol. 116, pp. 703-708, Mar. 2016.
[2] T. Zhao and Z. Ding, "Distributed Agent Consensus-Based OptimalResource Management for Microgrids," in IEEE Transactions onSustainable Energy, vol. PP, no. 99, pp. 1-1.
[3] L. Gomes, T. Pinto, P. Faria, and Z. Vale, "Distributed intelligentmanagement of microgrids using a multi-agent simulation platform," inProc. 2014 IEEE Symposium on Intelligent Agents (IA), pp. 1-7.
[4] P. Faria, J. Spínola, and Z. Vale, "Aggregation and Remuneration ofElectricity Consumers and Producers for the Definition of Demand-Response Programs," IEEE Transactions on Industrial Informatics, vol.12, pp. 952-961, June 2016.
[5] L. Martirano, E. Habib, G. Parise, G. Greco, M. Manganelli, F.Massarella, and L. Parise, "Demand Side Management in Microgridsfor Load Control in Nearly Zero Energy Buildings," IEEE Transactionson Industry Applications, vol. PP, pp.1-1, Feb. 2017.
[6] J. Spínola, P. Faria, Z. Vale, “Photovoltaic Inverter Scheduler with theSupport of Storage Unit to Minimize Electricity Bill”, Trends in Cyber-Physical Multi-Agent Systems. The PAAMS Collection - 15thInternational Conference, pp. 63-71, 16 July 2017
[7] X. Liu, L. Ivanescu, R. Kang and M. Maier, "Real-time household loadpriority scheduling algorithm based on prediction of renewable sourceavailability," in IEEE Transactions on Consumer Electronics, vol. 58,no. 2, pp. 318-326, May 2012.
[8] Z. Yang, W. Xu, J. Shi, H. Xu and M. Chen, "Association and LoadOptimization With User Priorities in Load-Coupled HeterogeneousNetworks," in IEEE Transactions on Wireless Communications, vol.17, no. 1, pp. 324-338, Jan. 2018. doi: 10.1109/TWC.2017.2765322
[9] I. Joo and D. Choi, "Distributed Optimization Framework for EnergyManagement of Multiple Smart Homes With Distributed EnergyResources," in IEEE Access, vol. 5, pp. 15551-15560, 2017. doi:10.1109/ACCESS.2017.2734911
[10] Recommended Light Levels (Illuminance) for Outdoor and IndoorVenues, Available online:https://www.noao.edu/education/QLTkit/ACTIVITY_Documents/Safe-ty/LightLevels_outdoor+indoor.pdf (accessed on 31 December 2018).
[11] J. Vasudevan and K. S. Swarup, "Price based Demand Responsestrategy considering load priorities," 2016 IEEE 6th InternationalConference on Power Systems (ICPS), New Delhi, 2016, pp. 1-6.
[12] J. H. oon, R. Baldick and A. Novoselac, "Dynamic Demand ResponseController Based on Real-Time Retail Price for Residential Buildings,"in IEEE Transactions on Smart Grid, vol. 5, no. 1, pp. 121-129, Jan.2014.doi: 10.1109/TSG.2013.2264970
[13] Mieczysław Porowski, “The optimization method of HVAC systemfrom a holistic perspective according to energy criterion,” EnergyConversion and Management, Volume 181, 2019, Pages 621-644,https://doi.org/10.1016/j.enconman.2018.11.069.
[14] Gomes, L, Fernandes, F, Faria, P, Vale, Z, Ramos, C & Morais, H2013, Contextual Intelligent Load Management Considering Real TimePricing in a Smart Grid Environment. in Proceedings of 7thInternational Conference on Intelligent System Applications to PowerSystems. IEEE, 17th International Conference on Intelligent SystemsApplication to Power Systems, Tokyo, Japan, 01/07/2013
[15] L. Gomes, F. Fernandes, Z. Vale, P. Faria and C. Ramos, "A learningalgorithm and system approach to address exceptional events indomestic consumption management," 2014 IEEE Symposium onComputational Intelligence Applications in Smart Grid (CIASG),Orlando, FL, 2014, pp. 1-7. doi: 10.1109/CIASG.2014.7011564
[16] Y. Han, K. Zhang, H. Li, E. A. A. Coelho and J. M. Guerrero, "MAS-Based Distributed Coordinated Control and Optimization in Microgridand Microgrid Clusters: A Comprehensive Overview," in IEEETransactions on Power Electronics, vol. 33, no. 8, pp. 6488-6508, Aug.2018. doi: 10.1109/TPEL.2017.2761438
[17] Z. Li, C. Zang, P. Zeng, H. Yu and H. Li, "MAS based distributedautomatic generation control for cyber-physical microgrid system," inIEEE/CAA Journal of Automatica Sinica, vol. 3, no. 1, pp. 78-89, 10January 2016. doi: 10.1109/JAS.2016.7373765
[18] F. Chen, M. Chen, Q. Li, K. Meng, J. M. Guerrero and D. Abbott,"Multiagent-Based Reactive Power Sharing and Control Model forIslanded Microgrids," in IEEE Transactions on Sustainable Energy,vol. 7, no. 3, pp. 1232-1244, July 2016. doi:10.1109/TSTE.2016.2539213
[19] Farhan H. Malik, Matti Lehtonen, “A review: Agents in smart grids,”Electric Power Systems Research, Volume 131, 2016, Pages 71-79,https://doi.org/10.1016/j.epsr.2015.10.004
[20] Ipakchi, A.; Albuyeh, F., "Grid of the future," Power and EnergyMagazine, IEEE , vol.7, no.2, pp.52,62, March-April 2009
[21] S. Paul, A. Parajuli, M. R. Barzegaran and A. Rahman, "Cyber physicalrenewable energy microgrid: A novel approach to make thepowersystem reliable, resilient and secure," 2016 IEEE InnovativeSmart Grid Technologies - Asia (ISGT-Asia), Melbourne, VIC, 2016,pp. 659-664.
[22] E. Vinagre, L. Gomes and Z. Vale, "Electrical Energy ConsumptionForecast Using External Facility Data," 2015 IEEE Symposium Serieson Computational Intelligence, Cape Town, 2015, pp. 659-664.

[23] Vangelis Marinakis, Haris Doukas, John Tsapelas, Spyros Mouzakitis,Álvaro Sicilia, Leandro Madrazo, Sgouris Sgouridis, “From big data tosmart energy services: An application for intelligent energymanagement,” Future Generation Computer Systems, 2018,https://doi.org/10.1016/j.future.2018.04.062
[24] O. Y. Al-Jarrah, Y. Al-Hammadi, P. D. Yoo and S. Muhaidat, "Multi-Layered Clustering for Power Consumption Profiling in Smart Grids,"in IEEE Access, vol. 5, pp. 18459-18468, 2017. doi:10.1109/ACCESS.2017.2712258
[25] Ebby Thomas, Rahul Sharma, Yoni Nazarathy, “Towards demand sidemanagement control using household specific Markovian models,“Automatica, Volume 101, 2019, Pages 450-457,https://doi.org/10.1016/j.automatica.2018.11.057
[26] P. Palensky and D. Dietrich, "Demand Side Management: DemandResponse, Intelligent Energy Systems, and Smart Loads," in IEEETransactions on Industrial Informatics, vol. 7, no. 3, pp. 381-388, Aug.2011. doi: 10.1109/TII.2011.2158841
[27] R. H. Byrne, T. A. Nguyen, D. A. Copp, B. R. Chalamala and I. Gyuk,"Energy Management and Optimization Methods for Grid EnergyStorage Systems," in IEEE Access, vol. 6, pp. 13231-13260, 2018. doi:10.1109/ACCESS.2017.2741578
[28] M. A. A. Pedrasa, T. D. Spooner and I. F. MacGill, "CoordinatedScheduling of Residential Distributed Energy Resources to OptimizeSmart Home Energy Services," in IEEE Transactions on Smart Grid,vol. 1, no. 2, pp. 134-143, Sept. 2010. doi: 10.1109/TSG.2010.2053053
[29] Jui-Sheng Chou, Duc-Son Tran, “Forecasting energy consumption timeseries using machine learning techniques based on usage patterns ofresidential householders,” Energy, Volume 165, Part B, 2018, Pages709-726, https://doi.org/10.1016/j.energy.2018.09.144
[30] M. Bisadi, A. Akrami, S. Teimourzadeh, F. Aminifar, M. Kargahi andM. Shahidehpour, "IoT-Enabled Humans in the Loop for EnergyManagement Systems: Promoting Building Occupants' Participation inOptimizing Energy Consumption," in IEEE Electrification Magazine,vol. 6, no. 2, pp. 64-72, June 2018. doi: 10.1109/MELE.2018.2816844
[31] F. G. Brundu et al., "IoT Software Infrastructure for EnergyManagement and Simulation in Smart Cities," in IEEE Transactions onIndustrial Informatics, vol. 13, no. 2, pp. 832-840, April 2017. doi:10.1109/TII.2016.2627479
[32] Min Wei, Seung Ho Hong, Musharraf Alam, “An IoT-based energy-management platform for industrial facilities,” Applied Energy,Volume 164, 2016, Pages 607-619,https://doi.org/10.1016/j.apenergy.2015.11.107
[33] H. Xu and H. Schmeck, "State-of-the-art user interfaces for buildingoperating systems," 2017 IEEE International Conference on SmartGrid and Smart Cities (ICSGSC), Singapore, 2017, pp. 283-292. doi:10.1109/ICSGSC.2017.8038592
[34] Andrew D. Peacock, Joel Chaney, Kristin Goldbach, Guy Walker, PaulTuohy, Salvador Santonja, David Todoli, Edward H. Owens, “Co-designing the next generation of home energy management systemswith lead-users,” Applied Ergonomics, Volume 60, 2017, Pages 194-206, https://doi.org/10.1016/j.apergo.2016.11.016
[35] Gomes, L.; Sousa, F.; Vale, Z. An Intelligent Smart Plug with SharedKnowledge Capabilities. Sensors 2018, 18, 3961.https://doi.org/10.3390/s18113961
[36] L. Gomes, “Dataset of uGIM deployed in an office building,”, Zenodo,2019 doi: 10.5281/zenodo.2565289

Luis Gomes
BRICKS: Building’s reasoning for intelligent control knowledge-based system
Authors: Gabriel Santos, Zita Vale, Pedro Faria, and Luis Gomes
Published in: Sustainable Cities and Society (IF: 4.624)
DOI: 10.1016/j.scs.2019.101832
Published at: January 2020
PhD timeline: M42

BRICKS: Building’s Reasoning for Intelligent Control
Knowledge-based System
Abstract: Building energy management systems have been largely implemented, focusing on specific
domains. When installed together, they lack interoperability to make them work correctly and to achieve a
centralized user interface. The Building's Reasoning for Intelligent Control Knowledge-based System
(BRICKS) overcomes these issues by developing an interoperable building management system able to
aggregate different interest domains. It is a context-aware semantic rule-based system for intelligent
management of buildings' energy and security. Its output can be a set of alarms, notifications, or control
actions to take. BRICKS itself, and its features are the innovative contribution of the present paper. It is very
important for buildings' energy management, namely in the scope of demand response programs. In this
paper, it is shown how semantics is used to enable the knowledge exchange between different devices,
algorithms, and models, without the need for reprogramming the system. A scenario is deployed in a real
building for demonstration.
Keywords: Building Management Systems; Context-aware Knowledge-base Systems; Intelligent Control;
Interoperability; Semantic Reasoning; Semantic Rule-based Systems
Introduction
Over the last decades, the industry has been developing and presenting various solutions in the area of
energy management [1-14]. In particular, energy management systems for buildings have also undergone a
technological revolution with the emergence of different technologies, protocols, and standards. However, it
has been hard to find a solution that can integrate into a single system all the functionalities and decision
support that guarantee optimized management of the available energy resources [15].
In fact, buildings are key components of smart grids (SGs) [10,16] and a very relevant source of flexibility
in the context of demand response (DR) programs [1,5,6,8,17]. While in the past a building wasn't enough to
provide the minimum required reduction amount, nowadays an aggregator has a key role in collecting the
individual building contributions for DR events [3,6,18]. A building management system (BMS) can provide
an automated response to a DR event, improving the building's efficiency [8,14]. Moreover, smart contracts
techniques are also being applied in the power and energy sector [19-21], which may be included in future BMS
for a smarter ecosystem. The blockchain technology has proven to be resilient to tampering, which is very
appealing especially when dealing with money transfers that must respect certain previously agreed conditions
[21].
In what concerns energy efficiency, the limitations of BMS include the need for the detailed identification
of the various points of energy consumption in buildings and need for the effective retrofitting of systems and
equipment in buildings [3,6,22]. This aspect will be more relevant with the rise of the need for the dynamic and
intelligent management of a building, aggregating consumers and allowing them to participate actively in the
management of consumption, taking into account the criticality of the loads that are in the surrounding context
[22,23]. Comfort issues are also very relevant in this field. The work presented in [24] introduces a new concept
of comfort as a service, as a new energy supply paradigm for providing comfort to residential users.
Current systems rely on simplistic controls that require the user to enter information manually, such as
operating times or desirable temperatures, while truly intelligent systems should calculate and understand all

of these context variables autonomously. Moreover, solution developers continually redefine basic concepts
rather than reuse widely accepted knowledge due to the lack of consensus and functionality gaps [25].
Additionally, with the considerable increase of renewable energy sources in places close to the points of
consumption, BMS should be able to integrate such components, adopting a dynamic resource management
philosophy, taking into account several time horizons and functioning in isolated mode or connected to the
main network [26,27].
Critical buildings have a technological ecosystem replete with several closed systems that control various
equipment and functions of a specific domain. For example, ventilation control, access control or the control
and security of computer networks are likely to be carried out by different systems using different protocols
and therefore do not allow the exchange of information between them, enabling little or no capacity for
interoperability between them. It could be interesting to take advantage of different systems’ knowledge to
provide a more intelligent building management, such as controlling the windows shades and lights’ intensity
according to the available outside natural light; or using access control data to turn on the A/C and adjust the
office temperature for a given user’s preference. However, these systems are usually closed and do not allow
the interaction with other systems. Given these limitations, it is the decision of the building managers to keep
systems isolated by giving up interoperability, which results in increased manual tasks and possibly could lead
to more errors [28,29]. Additionally, these limitations also harden the adoption of such systems by residential
users.
BMSs also have strong security limitations. An example is the vulnerabilities in the architecture of cyber-
physical networks. The minimum level of structuring of cyber-physical networks should be the separation of
safety networks, and access control of the work networks. Nowadays, Supervisory Control And Data
Acquisition (SCADA) systems are not only subject to the inherent risks of personal computers, such as
Transmission Control Protocol/Internet Protocol (TCP/IP), WWW, mail and others, but are also subject to
threats which target personal computers such as viruses/worms, sabotage/hacking, and human failure [30,31].
Recent attacks were exploiting vulnerabilities in energy meters, loss of confidentiality, loss of integrity (by
manipulating data from the readability of the system), availability losses (by not guaranteeing the availability
of data in the necessary time intervals), fraud in consumer information and misuse as attack platforms [32,33].
Another important aspect to mention is the growing use of open-source tools (hardware/software) in the
installation and development of BMS [34,35]. The open-source movement promises high quality, flexibility,
reliability, and lower cost. A survey made by 2010 showed that open-source tools were being used by 98% of
the companies that responded to it [36]. This highlights the need to develop an intelligent and secure system
that integrates energy management, communication network security, and promotes interoperability of all
services. In this scope arises the ''Building's Reasoning for Intelligent Control Knowledge-based System''
(BRICKS). BRICKS main objective is to provide an intelligent, integrated, efficient, and optimized building
management and control. BRICKS is not a SCADA system. It is a platform developed to be at a higher level
where it can integrate different SCADA systems and/or smart appliances, and to apply rules composed by
knowledge from different sources for an intelligent building management. This contributes to the evolution of
the Smart Grid paradigm, as well as to the integration of renewable-based energy sources. It will optimize the
use of renewable energy, take advantage of the flexibility of loads and allow the buildings to become an active
player capable of reducing energy costs and even to adopt business models that allow obtaining profits through
real-time management of its resources [37]. BRICKS is modular and can easily be reused in many buildings,
significantly reducing development costs. BRICKS is supported by a semantic context-aware rule-based system
which is agnostic to the semantic model and rules; in this way, the model and rules may change without the
need of reprogramming the system.
The main objectives and contributions of this work are:
• to develop a flexible, configurable, and context-aware system for building management;
• to overcome the difficulty of interaction between heterogeneous devices in a building;
• to keep the system abstracted from the hardware installed and respective communication protocols in
order to avoid reprogramming the system every time a device is installed;
• to have a rule-based system agnostic to the rules and data, enabling advanced machine intelligence;
• to have a system that can be applied to different buildings by using it or parts of it in other buildings for
which the same semantic model, semantic converter, and/or semantic rules apply;

• to centralize the interface to manage the heterogeneous cross-domains' monitoring and alarms.
After this introductory section, section 2 presents the related work. Section 3 presents BRICKS, the context-
aware semantic rule-based system for building management. A case study is presented in section 4, and the
results are shown in section 5. The final conclusions and future work are stated in section 6.
Related semantic approaches
This section starts by introducing relevant work developed on building semantic models and concludes with
some discussion on semantic rule-based systems.
2.1. Buildings' semantic models
Several projects have been working on semantic models for building management, usually focusing on a
specific aspect of the building. Both Brick Schema [38] and Haystack [39] projects implement strong metadata
models aiming at providing intelligence to building equipment while helping the implementation of realistic
buildings descriptions considering energy management, Demand Response (DR), fault diagnosis, occupancy
model, among others. However, the ontologies developed by these projects are more taxonomies with weak
relationships between concepts, lacking the potential of actionable entities.
Regarding actionable entities, OneM2M's [40] base ontology is the most consensual reference from a
significant number of organizations. SAREF [41] ontology describes smart appliances control of energy
consumption, control devices (meter, switch, sensor), and actionable command and services. It uses strong
relations among its concepts and acts as a dynamic ontology with other ontologies such as DogOnt [42] and SSN
[43], which are relevant assets in the IoT context. SAREF is being extended to include alignments with IFC4 [44]
for building reference components and for energy management and DR capabilities with the support of
Energy@Home project [45] and EEBus [46].
Other relevant works have been done related to smart buildings. Examples of such are the SEAS (Smart
Energy Aware Systems) [47] and FSGIM (Facility Smart Grid Information Model) [48] ontologies. SEAS [47]
knowledge model has been developed as modular ontologies. It is an enabler for semantic interoperability within
SEAS ecosystem, covering different aspects of SGs while enabling the interaction between smart energy systems
to optimize the overall energy usage. FSGIM [48] has been developed for describing facilities and their assets,
using the Unified Modelling Language (UML), and it can be translated into an ontology format. It's worth
mentioning that it supports the participation of electrical energy consumers in SG networks.
Finally, the work developed in [49] aimed at defining a semantic framework to support operational building
management and has been extended in [50] to enable its use for advanced data analysis for the building operation.
Since the above-mentioned models only consider subsets of key domains relevant for FUSE-IT project
[51,52], none of the models, by itself, is sufficient to deal with the four key domains identified (Energy, Security,
Facility, and ICT). Therefore, FUSE-IT project built a reference model based on the gathering of some of the
ontologies identified above, making the extension as needed to reflect the necessary knowledge, aiming at
"describing metadata to have access to data and make them actionable in an interoperable context of interconnected systems
protected by secured services" [51,52].
2.2 Semantic rule-based systems
Semantic rule-based systems are being applied successfully in various distinct areas [50,52-57]. This
subsection overviews some of the most relevant that can be found in the literature.
The work presented in [50] concentrates efforts in the semantic representation of building systems'
information to support advanced data analytics algorithms trying to improve the building energy efficiency. It
extends the model developed in [49] and implements rules to find anomalies in the building monitoring data.
The rules are expressed as ontology concepts and are a conjunction of conditions and conclusions. In this
approach, functions must be developed to execute the rules when they are triggered, not taking advantage of
semantic reasoners.
In [53], the use of ontologies is proposed to describe automation and an architecture that provides contextual
services. The architecture is flexible to interconnect devices with web services, and the use of semantic vocabulary
enables semantic interoperability and expressiveness in the automation rules modelling and definition. The
architecture is implemented in a smart office scenario. However, the rules are written in JavaScript Object
Notation (JSON)1 and are saved in a MongoDB2 database. This means that they are not taking advantage of the
semantic rules potential. The semantics is only being used for describing and share knowledge. In turn, [54]
proposes a semantic mapping process to define the most prominent variables to reduce energy gap in near real-
time. It uses an artificial neural network (ANN) to learn the semantic mapping patterns. Then it is used as the
cost function of an optimization tool (genetic algorithm based) that generates the energy saving rules in multiple
objectives and constraints. An evaluation process has also been developed to evaluate the generated rules, their
limits, and underlying variables. In this work, the rules are written in the Semantic Web Rule Language (SWRL)3,
a declarative semantic rule language that can be written directly in OWL4 documents. The rules are then fired by
a semantic reasoner when the user requests it.
A different approach to implement semantic rules is presented in [55], using SPARQL Protocol and RDF
Query Language (SPARQL)5, a Resource Description Framework (RDF)6 query language for semantic databases.
This work describes research on semantic rule-based complex events processing for event-driven systems. The
idea is to use semantic rules to identify complex events from simple event notifications. SPARQL was used to
write queries to identify event patterns, resulting in a constructive view of the events in the system. This filter
allows to detect complex events derived from already existing events combined with knowledge already
gathered.
Also, in [56] is demonstrated a rule engine based on SPARQL queries for SemETAP, a semantic text analyser.
In addition, it implements a forward chaining algorithm for existential rules. SemETAP aims to accomplish deep
semantic analysis of natural language texts. It converts the original text into a graph of concepts from the ontology
and the relations between those concepts. After, the semantic rules are applied to infer new knowledge from the
implicit information, so that the semantic structure is able to answer questions. [57] uses semantic rule-based
reasoning in the management of functional rehabilitation processes. It presents a clinical decision support system
using SWRL and semantic annotations to reason on rehabilitation processes. The system is able to provide
personalized therapies and to deal with different characteristics of a rehabilitation scenario. The modelling
categories are based on well-accepted rehabilitation notions and the rule-based reasoner is used for the
representation of processes' semantics. The authors believe that the solution can be exported to other domains.
Finally, [52] introduces a rule-based model for smart buildings supervision and management. It is a proof of
concept to highlight the potential of using declarative rules to deal with building management and supervision.
A fragment of the logical framework has been implemented in two real-world use cases in the context of FUSE-
IT, using SWRL rules. It uses FUSE-IT core data model [51] to identify the concepts and relations of the FUSE-IT
four key domains. The use cases are focused on anomaly detection, but the authors argue that it can be extended
to diagnostic, healing, and recovery.
BRICKS
The “Building's Reasoning for Intelligent Control Knowledge-based System” is a context-aware semantic rule-
based system considering context-based profiles for intelligent management of buildings' energy and security.
It is one of the outcomes of projects with companies. The system is not open source, nor publicly available,
since it has been integrated as part of commercial products.
BRICKS is not a conventional BMS. It is a rule-based system that can integrate different BMSs, or devices,
data; providing a centralized interface for the building monitoring and alarms. It enables the definition of rules
that integrate data from different BMSs, devices or web services (such as weather data) to trigger alarms or
automatic control. It must be stressed that BRICKS itself does not operate the grid. It is a semantic rule-based
system using devices/sensors data to trigger alarms and automatic control, as defined by the system
administrator. The data read in the devices/sensors is translated into the semantic model at each time step, to
allow the use of the semantic rules. Moreover, the grid operation, such as DR events and/or smart contracts
1 http://www.json.org 2 https://www.mongodb.com/ 3 https://www.w3.org/Submission/SWRL/ 4 https://www.w3.org/OWL/ 5 https://www.w3.org/TR/rdf-sparql-query/ 6 https://www.w3.org/RDF/

between the aggregator and the aggregated player, is performed by other modules, that work with the raw
data read instead of using semantic models. However, it is being considered the update of these algorithms to
accept the use of semantic data as input and output, enabling semantic interoperability besides the already
existing syntactic one. For the moment, the system can communicate using both Modbus TCP/IP7 and HTTP
REST8 protocols, since those are the ones available in the researchers’ laboratory for testing. It can be integrated
with existing SCADA systems, such as the system introduced in [14], as well as with IoT smart appliances.
However, to be able to communicate with other higher-level facility/energy management systems such as the
ones presented in [10-13], these should provide REST communication interfaces to enable BRICKS to interact
with them.
Building automation and management has its pros and cons [28,29]. Taking a closer look at the cons, the
most pointed out are: equipment cost; installation cost; complexity; and compatibility. Besides the cons above,
when talking about rule-based systems for intelligent building management it is important to keep in mind
that the implementation of the rules at the automation level depend on the devices used, their configuration,
communications protocols, data types, etc. Meaning that every time the automation system needs to be
updated/upgraded, by adding new devices or removing/changing existing ones, it will be necessary to rewrite
the rules accordingly and recompile the system.
BRICKS tries to overcome these issues. Being a semantic rule-based system, BRICKS:
• uses semantic models, which enrich the information gathered by the different devices;
• is abstracted from the ontologies used and respective rules. In this way the knowledge model and/or the
rules may change without the need to reprogram the system;
• does not depend on the installed devices nor communication protocols, since it implements the rules at a
higher level, the software level.
Ontologies add semantic meaning to data, making it understandable by both humans and machines. The
use of semantics enables: the sharing of a common understanding of the exchanged information; to reuse the
domain knowledge; to make domain assumptions, and to separate domain from operational knowledge. In
computer science, ontologies are used for: communications between computational systems and/or humans;
knowledge reuse and organization; and computational inference [58]. Computational inference provides
deductive capabilities to add new knowledge to the already existing. Combining computational inference with
a rule language improves the deductive reasoning capabilities of reasoners.
BRICKS translates the knowledge implicit in the devices data to the semantic model. Besides the real-time
data, BRICKS also uses REST services of different algorithms to determine the correct profile at each time for a
given context, which are also converted to ontology instances. The result of these translations are the ontology
individuals or instances. Figure 1 illustrates this scenario.
In the left side of Figure 1 are identified different data sources that may be translated to semantic
individuals. The devices' measurement data may be read from online databases or directly from the smart
devices through REST requests. In the case of dummy devices, these may be read from a Programmable Logic
Controller (PLC) to which they are connected to. Figure 1It can be noticed that the rules are added in the
semantic model. BRICKS allows the use of both SWRL rules and SPARQL queries to trigger the alarms and/or
automatic control. The rules are also an input to the system.
7 http://www.modbus.org/
8 https://www.w3.org/TR/2004/NOTE-ws-arch-20040211/#relwwwrest

Figure 1. BRICKS translation from raw data to the semantic model.
BRICKS works in real-time depending on the time-step defined by the user. The devices' measurements,
the contexts and context-based profiles are translated to the semantic model resulting in ontology individuals
in the knowledge base. Then, the rules are applied by the rule engine, formalizing the system's output, as
illustrated by Figure 2.
Figure 2. BRICKS rule engine.
The readings may be achieved by two means: using Modbus protocol; or REST web services. Ideally,
BRICKS would use REST requests only for the devices real-time data, being agnostic to any hardware
communication protocol. However, considering the use of dummy devices connected to a PLC, the authors
decided to leave this option open once Modbus protocol is already available in the laboratory building of the
authors' research centre. In fact, Modbus protocol had a large widespread use in communications at industrial
level, which has motivated the authors to proceed with using it.
Currently, Open Platform Communications - Unified Architecture (OPC-UA) [59,60] is pointed as the most
promising protocol to standardize communications in scopes such as Industry 4.0, IoT or SGs, however its
specification is not straight forward, which results in incomplete implementations. In order to include OPC-
UA protocol in BRICKS, a semantic converter similar to the one developed for the Modbus protocol is required.
The context-based profiles are achieved by means of a REST request to a web service. The service returns
the adequate profile for each device in the current timestamp. The context is reached through a clustering
algorithm [61]. Using this context-based profiles algorithm, the system is able to respond to the costumers’
behaviour since it uses historic data from the past to adjust the profiles over time in different contexts, such as:
the current season, month, weekday or weekend, and time of day. In this way, the user does not have the need
to configure a custom profile, nor to use a predefined one, as the system will be able to learn from the
costumer’s behaviour. Given the real-time data and the context-based profiles, the rules are validated by
matching the devices readings against the profiles. BRICKS starts by executing SWRL rules first, if defined by
the user as input. After, it runs rules written as SPARQL queries. It is the responsibility of the system
administrator to write the rules properly, to ensure the desired sequence of rules. Given the order of execution
of the inference engines, a rule written in SWRL cannot wait for a result of a rule written in SPARQL, although
the opposite is valid. The idea of executing SWRL rules first relates to the fact that the SWRL engine infers
implicit knowledge from the available data which may be interesting to consider when executing SPARQL
rules.
BRICKS output can be a set of alarms, notifications, or control actions to take. In addition, monitoring
values are always output at each time-step to be presented by the BMS user interface as it is possible to observe
in the example Figure 3. In the case of automation control, this may also be achieved by means of REST requests
previously defined in the set of rules.
At each time step BRICKS: (i) performs the devices readings, updating the semantic data model; (ii)
requests the context-based profiles of each device to the predefined REST service; (iii) executes the semantic
rules to validate the devices' data read with the respective profiles; and (iv) instantiates the ''monitoring'' and
''alarms'' outputs. The monitoring output is useful for BMS user interfaces. In case of any alarm triggered by a
rule, BRICKS will act accordingly, i.e., depending on the rule. Rules can provide notification in the user
interface, send an email, or apply automatic control.
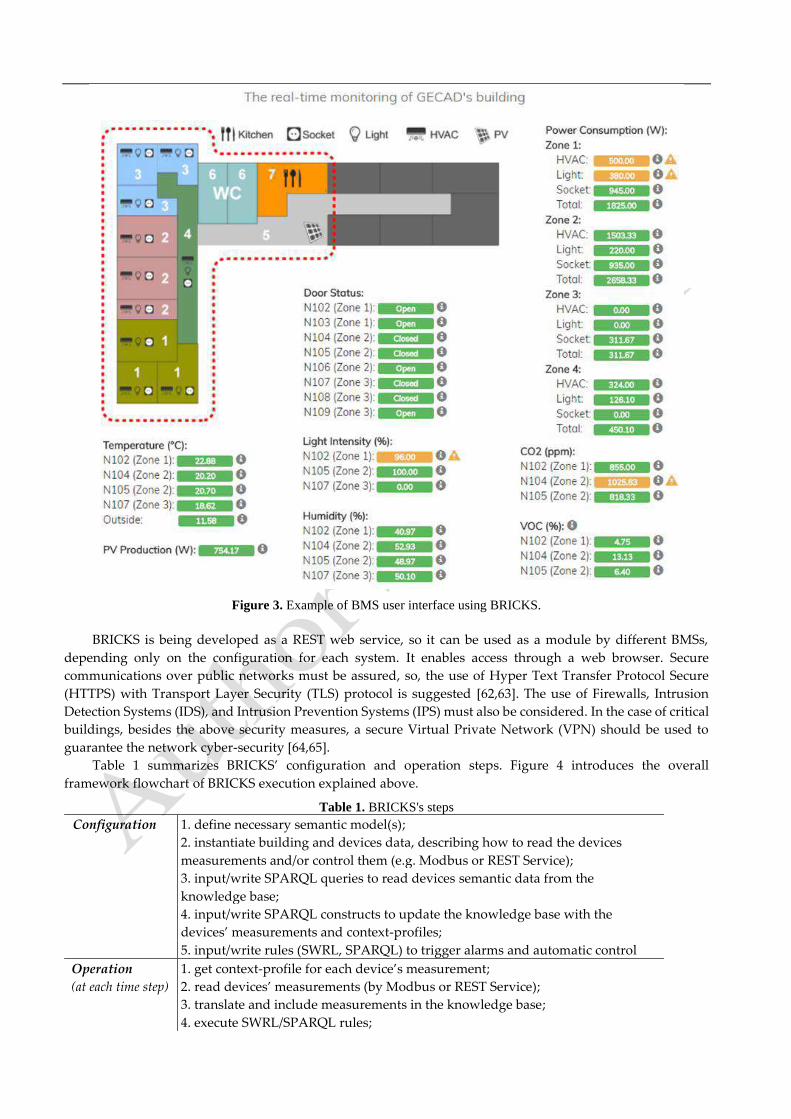
Figure 3. Example of BMS user interface using BRICKS.
BRICKS is being developed as a REST web service, so it can be used as a module by different BMSs,
depending only on the configuration for each system. It enables access through a web browser. Secure
communications over public networks must be assured, so, the use of Hyper Text Transfer Protocol Secure
(HTTPS) with Transport Layer Security (TLS) protocol is suggested [62,63]. The use of Firewalls, Intrusion
Detection Systems (IDS), and Intrusion Prevention Systems (IPS) must also be considered. In the case of critical
buildings, besides the above security measures, a secure Virtual Private Network (VPN) should be used to
guarantee the network cyber-security [64,65].
Table 1 summarizes BRICKS’ configuration and operation steps. Figure 4 introduces the overall
framework flowchart of BRICKS execution explained above.
Table 1. BRICKS's steps
Configuration 1. define necessary semantic model(s);
2. instantiate building and devices data, describing how to read the devices
measurements and/or control them (e.g. Modbus or REST Service);
3. input/write SPARQL queries to read devices semantic data from the
knowledge base;
4. input/write SPARQL constructs to update the knowledge base with the
devices’ measurements and context-profiles;
5. input/write rules (SWRL, SPARQL) to trigger alarms and automatic control
Operation 1. get context-profile for each device’s measurement;
(at each time step) 2. read devices’ measurements (by Modbus or REST Service);
3. translate and include measurements in the knowledge base;
4. execute SWRL/SPARQL rules;

5. execute automatic control (if a given rule is triggered).
Figure 4. Overall framework flowchart.
The main difficulty found in BRICKS development was to keep the system responsive when using both
SWRL and SPARQL rules. SWRL is a semantic rule language written in OWL and directly interpreted from
OWL reasoners, while SPARQL is a RDF query language that can only be interpreted by a SPARQL engine.
This means that each type of rule must be executed by a different inference engine. Input/output streams have
been implemented which do this process fast enough.
To implement BRICKS in a new site, the building can already have available smart appliances or PLCs to
communicate with the system. It can be integrated with existing SCADA systems already available in the
building. BRICKS will only be configured accordingly, ensuring the correct communication with the smart
appliances and/or the PLCs. The time needed to configure BRICKS depends on the number of resources to be
configured, and the rules that the administrator wants to write for triggering alarms and automatic control.
Currently, this configuration is made manually in text files, which is a costly job. The configuration of the
scenario present in the case study section in the present paper took about one week (5 business days). However,
it is already in study the development of an intuitive graphical user interface to abstract the user from all the
semantic configuration, i.e.: (i) building definition; (ii) devices instances; (iii) measurements individuals; (iv)
rules definition; etc.
Regarding its maintenance, in a typical SCADA system, whenever a new device or rule is added or
updated, the system must be reprogrammed and recompiled in order to function correctly. However, in

BRICKS this will not be necessary, since the semantic model is loosely coupled from the software. BRICKS will
only need to be reconfigured accordingly, saving time when compared to the typical SCADA.
Case Study
The present section presents a case study in which a BRICKS configuration is illustrated. It is inspired by
[37], using GECAD's facilities. This case study is only focused on the energy management scenario.
4.1 Scenario
The case study scenario considers a business building with three independent offices of three different
companies. The building is managed by an administrator who also aggregates the different tenants for energy
efficiency and DR programs. BRICKS is deployed for each entity (i.e., the administrator and the three offices).
Each platform runs an instance of BRICKS. The scenario has been deployed in the left-side of GECAD's N
building and uses real data gathered from the different devices through four PLCs [66]. Figure 55 illustrates
the left-side of GECAD's N building in the perspective of the building administrator.
Figure 5. Plant of the left side of building N of GECAD.
The building is divided into 4 zones. Zones 1 to 3 represent the three offices of different companies; zone
4 is the common area. The building's administrator manages the common area and knows the information
about each office's total consumption, for energy efficiency purposes and participation in DR programs. Table
2 shows the inputs installed in each zone, illustrated in Figure 5 in khaki, pink, light blue, and dark green,
respectively for Zone 1, Zone 2, Zone 3, and Zone 4. The locations of the devices, sensors and PLCs are
undisclosed for security and privacy reasons.
Table 2. Inputs installed
Input Zone 1 Zone 2 Zone 3 Zone 4
Photovoltaic (PV) panels with 7.5 kW rated power - - - √
Light intensity sensor 1 1 1 1
Indoor temperature sensor 1 2 1 1
Presence sensor 4 4 1 1
Humidity sensor 1 2 1 -
Outside temperature sensor - - - 1
Door locker (actuator/sensor) 3 3 3 -
Air-conditioning device (I/O control + energy monitoring) 3 3 3 1
Fluorescent lamps controlled by DALI9 6 4 5 4
Energy analyser for the lights’ total consumption 1 1 1 1
Energy analyser for the sockets’ total consumption 1 1 1 1
Energy analyser for the total consumption 1 1 1 1
The air-conditioning control was achieved by using an infra-red LED to send the control signals. It was
used an Arduino Mega 2560 with Ethernet Shield and the control is possible by HTTP requests. The Arduino
is able to receive HTTP GET requests that indicate the temperature and operation mode. This was a simpler
approach to provide control over the air-conditioners and integration with BRICKS. Figure 6 shows the
assembly of the components.
9 Digital Addressable Lighting Interface: http://www.dali-ag.org

Figure 6. Arduino with Ethernet Shield assembly.
It was also built a solution using the module NodeMCU that integrated Wi-Fi communication. In the
NodeMCU approach it was integrated a DHT22 for temperature and humidity sensor and MQTT protocol.
The MQTT protocol is used to publish the sensor data and subscribe to BRICKS control orders for the air-
conditioning units. Figure 7shows the implementation of the air-conditioning controller using a NodeMCU
module.
Figure 7. Implementation of the air-conditioning controller using a NodeMCU module.
4.2 Configuration
The first step in BRICKS configuration is to define which semantic models are going to be used to describe
the data models of each domain. To describe buildings and devices we defined an ontology10. To communicate
with Modbus protocol, we added the GECAD's PLC ontology 11 . For REST services, we have also used a
GECAD's preliminary Web Services' ontology12. Finally, for the context-based profiles, BRICKS uses by default
the Context-based Rules Matching Profile (CRMP) ontology13. The next step is to instantiate the building in each
BRICKS system accordingly, ensuring that the manager of each zone only has visibility of the device's data of
its responsibility. The administrator configures semantically the building identifying the 4 zones, and the
devices installed in the common area, namely zone 4. Each zone manager must define afterwards the devices
installed in its office. When defining the devices, each manager must also define semantically how to read/write
in it, using in this case the PLC or Web Services ontologies (since some devices accepts REST requests). In the
specific case of the building administrator, he requires the use of a meteorologist web service to get the solar
10 Publicly available at: http://www.gecad.isep.ipp.pt/ieso/greedi.ttl 11 Publicly available at: http://www.gecad.isep.ipp.pt/ieso/plc.ttl 12 Publicly available at: http://www.gecad.isep.ipp.pt/ieso/ws.ttl 13 Publicly available at: http://www.gecad.isep.ipp.pt/ieso/crmp.ttl

radiation value. This is important to check if the PV panels are working as expected, since PV energy generation
depends on solar radiation.
Afterwards, the user must input the SWRL/SPARQL rules. Another important step to take is to write
SPARQL queries to: (i) read the semantic configurations and instantiate the PLC/Web Services requests; and,
after each time-step, (ii) translate the data from the different readings (i.e. Modbus or REST service) into the
semantic model. In the former case, in order to ensure the correct functioning of the system and avoiding
reprogramming it, the queries must output a JSON string respecting a predefined schema, for each case (i.e.
Modbus/REST service). With those JSON objects BRICKS will be able to configure both Modbus and Web
Services access and make readings requests at each iteration. Examples of both JSON objects are shown in
Listing 1 and Listing 2. In the latter case, a JSON file must be filled to map the read values with the correct
ontology instances. For such, the SPARQL construct files must use tags, that must be identified in the JSON file
in order to replace them with the corresponding read values. An example of this file is presented in Listing 3,
and the corresponding SPARQL construct in Listing 4.
Listing 1. Example of Modbus JSON object.
{ "ind": "http://localhost/ieso/i/greedi-demo-indiv.ttl#photovoltaic-rooftop", "plc": { "id": 1, "name": "SAIA PCD", "ip": "192.168.2.25", "port": 502, "unitId": 2, "protocol": "TCP_IP", "readingTimeStep": 100, "resource": { "id": 1, "name": "Photovoltaic panels", "type": "GENERATOR", "status": "PRODUCTION", "register": { "number": 100, "name": "PV instant power generation", "type": "INTEGER", "count": 2, "dataArea": "SINGLE_REGISTER", "writable": false, "dataUnit": "W" } } }
}
The example of Listing 1 shows an example of output of a Modbus SPARQL query to the knowledge base,
in order to BRICKS communicates correctly with the PLC.
Listing 2. Example of Web Services JSON object.
{ "ind": "http://localhost/ieso/i/greedi-demo-indiv.ttl#solar-radiation", "ws": { "request": { "url": "https://meteo.isep.ipp.pt/ramdisk/json/realtimeparameterlist.txt", "method": "GET" }, "response": { "statusCode": 200, "contentType": "JSON", "parameter": "solarRad" } }
}
Likewise, Listing 2 presents an example of the output a SPARQL query for Web Services must return.
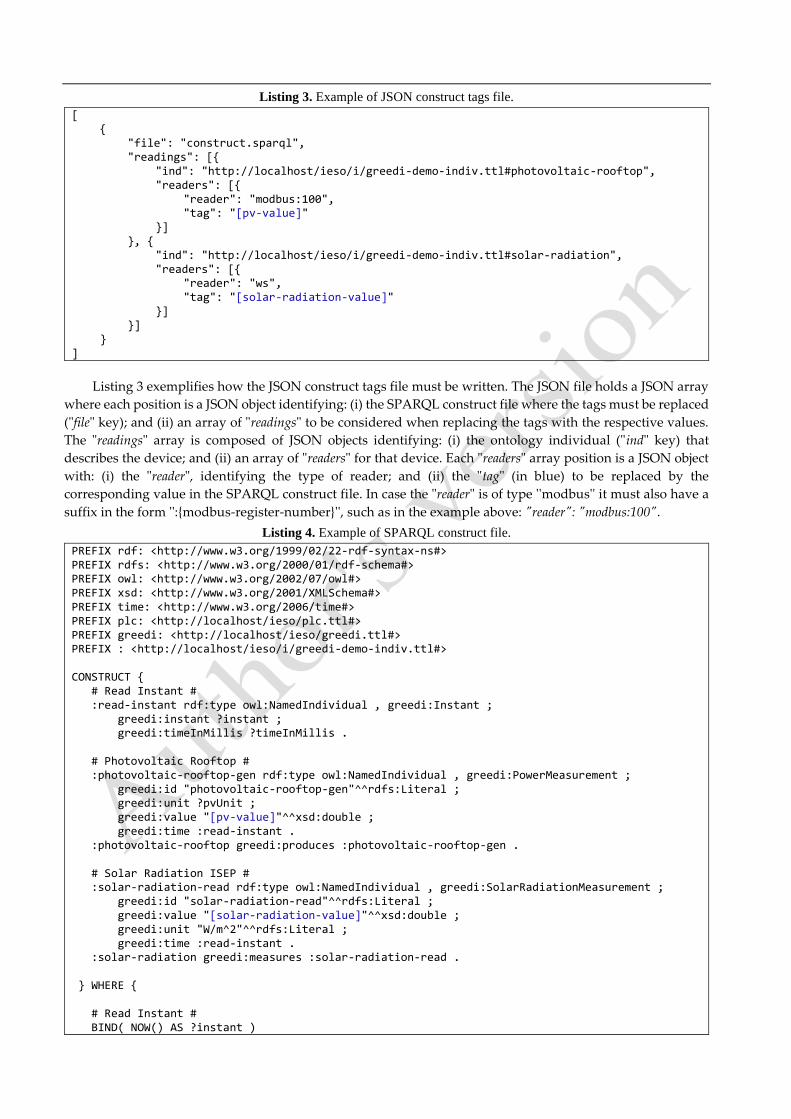
Listing 3. Example of JSON construct tags file.
[ {
"file": "construct.sparql", "readings": [{ "ind": "http://localhost/ieso/i/greedi-demo-indiv.ttl#photovoltaic-rooftop", "readers": [{ "reader": "modbus:100", "tag": "[pv-value]" }] }, { "ind": "http://localhost/ieso/i/greedi-demo-indiv.ttl#solar-radiation", "readers": [{ "reader": "ws", "tag": "[solar-radiation-value]" }] }] }
]
Listing 3 exemplifies how the JSON construct tags file must be written. The JSON file holds a JSON array
where each position is a JSON object identifying: (i) the SPARQL construct file where the tags must be replaced
("file" key); and (ii) an array of "readings" to be considered when replacing the tags with the respective values.
The "readings" array is composed of JSON objects identifying: (i) the ontology individual ("ind" key) that
describes the device; and (ii) an array of "readers" for that device. Each "readers" array position is a JSON object
with: (i) the "reader", identifying the type of reader; and (ii) the "tag" (in blue) to be replaced by the
corresponding value in the SPARQL construct file. In case the "reader" is of type ''modbus'' it must also have a
suffix in the form '':{modbus-register-number}'', such as in the example above: "reader": "modbus:100".
Listing 4. Example of SPARQL construct file.
PREFIX rdf: <http://www.w3.org/1999/02/22-rdf-syntax-ns#> PREFIX rdfs: <http://www.w3.org/2000/01/rdf-schema#> PREFIX owl: <http://www.w3.org/2002/07/owl#> PREFIX xsd: <http://www.w3.org/2001/XMLSchema#> PREFIX time: <http://www.w3.org/2006/time#> PREFIX plc: <http://localhost/ieso/plc.ttl#> PREFIX greedi: <http://localhost/ieso/greedi.ttl#> PREFIX : <http://localhost/ieso/i/greedi-demo-indiv.ttl#> CONSTRUCT { # Read Instant # :read-instant rdf:type owl:NamedIndividual , greedi:Instant ; greedi:instant ?instant ; greedi:timeInMillis ?timeInMillis . # Photovoltaic Rooftop # :photovoltaic-rooftop-gen rdf:type owl:NamedIndividual , greedi:PowerMeasurement ; greedi:id "photovoltaic-rooftop-gen"^^rdfs:Literal ; greedi:unit ?pvUnit ; greedi:value "[pv-value]"^^xsd:double ; greedi:time :read-instant . :photovoltaic-rooftop greedi:produces :photovoltaic-rooftop-gen . # Solar Radiation ISEP # :solar-radiation-read rdf:type owl:NamedIndividual , greedi:SolarRadiationMeasurement ; greedi:id "solar-radiation-read"^^rdfs:Literal ; greedi:value "[solar-radiation-value]"^^xsd:double ; greedi:unit "W/m^2"^^rdfs:Literal ; greedi:time :read-instant . :solar-radiation greedi:measures :solar-radiation-read . } WHERE { # Read Instant # BIND( NOW() AS ?instant )

BIND( HOURS( ?instant ) AS ?hour ) BIND( MINUTES( ?instant ) AS ?min ) BIND( SECONDS( ?instant ) AS ?sec ) BIND( ( ( ( ?hour * 3600000 ) + ( ?min * 60000 ) ) + ( ?sec * 1000 ) ) AS ?tmt ) BIND( STRBEFORE( STR( ?tmt ), "." ) AS ?temp ) BIND( STRDT( ?temp, xsd:integer ) AS ?timeInMillis ) # Photovoltaic Rooftop Unit # :photovoltaic-rooftop greedi:readThrough ?plc . ?plc plc:hasResource ?res . ?res plc:hasRegister ?reg . ?reg plc:dataUnit ?pvUnit . }
Listing 4 introduces an example of SPARQL construct file where the tags to be replaced by BRICKS are
highlighted in blue, accordingly to the example exposed in Listing 3.
Finally, the user needs to set up the REST service that will return BRICKS the context-based profiles. This
way BRICKS is flexible to change the service at any time. This configuration is also made using the Web Services'
ontology. In order to BRICKS works correctly the REST service output must comply with a predefined JSON
schema. Given this, BRICKS is able to translate the contextual profiles to the ontology, in the same way as the
in readings.
4.3 Results
This subsection analyses BRICKS's outputs. The output is updated at every time-step, as explained before.
For illustrative purposes a single iteration is analysed, where both ''monitoring'' and ''alarms'' outputs will be
detailed.
It must be stressed that BRICKS is able to execute each time step in less than 30 seconds. The system is
intended to be continuously in operation. It is error tolerant since if a reading fails at an iteration (e.g., because
of hardware communication failure), the system ignores it in order to avoid a runtime exception that may cause
the system to crash.
4.3.1 Monitoring output
As explained above, the monitoring output returns real time readings information to the BMS user
interface. It identifies the device and its measurement read. Some devices have more than one type of
measurement, as shown below. Listing 5 shows an example of the monitoring output for zone 4.
Listing 5. Example of monitoring output.
[ { "ind": "http://localhost/ieso/i/greedi-demo-indiv.ttl#ac-zone4", "measurement": { "unit": "W", "value": 0, "ind": "http://localhost/ieso/i/greedi-demo-indiv.ttl#ac-zone4-cons" } }, { "ind": "http://localhost/ieso/i/greedi-demo-indiv.ttl#ac-zone4", "measurement": { "value": false, "ind": "http://localhost/ieso/i/greedi-demo-indiv.ttl#ac-zone4-on-off" } }, { "ind": "http://localhost/ieso/i/greedi-demo-indiv.ttl#light-intensity-zone4", "measurement": { "unit": "%", "value": 0, "ind": "http://localhost/ieso/i/greedi-demo-indiv.ttl#light-intensity-zone4-read" } }, { "ind": "http://localhost/ieso/i/greedi-demo-indiv.ttl#light1-zone4", "measurement": {

"value": 0, "ind": "http://localhost/ieso/i/greedi-demo-indiv.ttl#light1-zone4-on-off-range" } }, { "ind": "http://localhost/ieso/i/greedi-demo-indiv.ttl#light2-zone4", "measurement": { "value": 0, "ind": "http://localhost/ieso/i/greedi-demo-indiv.ttl#light2-zone4-on-off-range" } }, { "ind": "http://localhost/ieso/i/greedi-demo-indiv.ttl#light3-zone4", "measurement": { "value": 0, "ind": "http://localhost/ieso/i/greedi-demo-indiv.ttl#light3-zone4-on-off-range" } }, { "ind": "http://localhost/ieso/i/greedi-demo-indiv.ttl#light4-zone4", "measurement": { "value": 0, "ind": "http://localhost/ieso/i/greedi-demo-indiv.ttl#light4-zone4-on-off-range" } }, { "ind": "http://localhost/ieso/i/greedi-demo-indiv.ttl#lights-zone4", "measurement": { "unit": "W", "value": 0, "ind": "http://localhost/ieso/i/greedi-demo-indiv.ttl#lights-zone4-cons" } }, { "ind": "http://localhost/ieso/i/greedi-demo-indiv.ttl#outside-temperature", "measurement": { "unit": "º C", "value": 18.7, "ind": "http://localhost/ieso/i/greedi-demo-indiv.ttl#outside-temperature-read" } }, { "ind": "http://localhost/ieso/i/greedi-demo-indiv.ttl#photovoltaic-rooftop", "measurement": { "unit": "W", "value": 0, "ind": "http://localhost/ieso/i/greedi-demo-indiv.ttl#photovoltaic-rooftop-gen" } }, { "ind": "http://localhost/ieso/i/greedi-demo-indiv.ttl#sockets-zone4", "measurement": { "unit": "W", "value": 0, "ind": "http://localhost/ieso/i/greedi-demo-indiv.ttl#sockets-zone4-cons" } }, { "ind": "http://localhost/ieso/i/greedi-demo-indiv.ttl#solar-radiation", "measurement": { "unit": "W/m^2", "value": 0, "ind": "http://localhost/ieso/i/greedi-demo-indiv.ttl#solar-radiation-read" } }, { "ind": "http://localhost/ieso/i/greedi-demo-indiv.ttl#total-zone4", "measurement": { "unit": "W", "value": 0, "ind": "http://localhost/ieso/i/greedi-demo-indiv.ttl#total-zone4-cons" } } ]

As it can be seen in the first lines of Listing 5, the first two measurements are for the air-conditioning of
zone 4. The first one is measuring its power consumption; while the second is reading its on/off state.
The monitoring output is a JSON array, where each element is a JSON object identifying: (i) the device
("ind" field); and (ii) the "measurement" in the ontology. The "measurement" is a JSON object consisting of: (i) the
measurement individual identification ("ind" field); (ii) its "value"; and, when applicable, (iii) its "unit".
4.3.2. Alarms output
Regarding the alarms output, they depend on the rules defined by the manager. The output is set by
querying the knowledge base in search of action individuals (crmp:Action class from CRMP ontology) and
respective devices, measurements, and profiles. A device may have more than one measurement, and each
measurement has its unique profile.
When using SWRL rules, due to the language limitations, crmp:Action individuals must be set before
starting the system, since SWRL is not able to instantiate classes that are not present in the left-side of the rule.
Otherwise the rule throws an exception. For this reason, the alarms output is always instantiated, so when a
rule is triggered, the "action" field is available. The alarms output is also useful to update the BMS's user
interface accordingly. Listing 6 presents a snippet of an alarm’s output example for zone 4, with these two
cases.
Listing 6. Snippet of alarms output. [ { "profile": { "profileUpperBound": 500, "type": "range", "profileLowerBound": 0 }, "ind": "http://localhost/ieso/i/greedi-demo-vtn-indiv.ttl#ac-zone4",
"measurement": { "value": 0,
"ind": "http://localhost/ieso/i/greedi-demo-vtn-indiv.ttl#ac-zone4-cons" }
}, { "profile": { "profileUpperBound": 7000, "type": "range", "profileLowerBound": 150 }, "ind": "http://localhost/ieso/i/greedi-demo-vtn-indiv.ttl#photovoltaic-rooftop", "measurement": { "value": 0, "ind": "http://localhost/ieso/i/greedi-demo-vtn-indiv.ttl#photovoltaic-rooftop-gen" },
"action": { "alertLevel": "warning", "message": "The photovoltaic generation is lower than expected.", "commandURL": "http://localhost/BRICKSWS/sendmail" }
} ... ]
Observing Listing 6 it can be seen that, in the case of the air-conditioning, no action is required. Moreover,
the PV generation is lower than expected given the context-based profile, and available solar radiation. In this
case, an action must be taken (highlighted in blue text). According to the rule defined, the zone manager will
receive an email alerting that the PV is not functioning correctly.
Analysing the alarms output JSON array, each element is a JSON object identifying: (i) the device
individual ("ind" field); (ii) its "measurement"; (iii) context-based "profile"; and, when a rule is triggered, (iv) the
"action" to take.
The SWRL rule that triggers the action seen above is shown in Listing 7. It searches for a generator device'
measurement and a solar radiation measurement of the same instant, and also for the lower bound of the

device's profile to check if the device's generation value is lower than the profile's lower bound while the solar
radiation is higher than zero. If both conditions are true the rule will be triggered, instantiating the
crmp:alertLevel, crmp:message, and crmp:commandURL properties of :a-photovoltaic-generation (crmp:Action).
Listing 7. SWRL rule that triggers alarm.
greedi:GeneratorDevice(?d) ^ greedi:measures(?d, ?pm) ^ greedi:PowerMeasurement(?pm) ^ greedi:time(?pm, ?t) ^ greedi:value(?pm, ?pv) ^ crmp:RangeProfile(?rp) ^ crmp:individual(?rp, ?d) ^ crmp:individual(?rp, ?pm) ^ crmp:profileLowerBound(?rp, ?lb) ^ swrlb:lessThan(?pv, ?lb) ^ greedi:SolarRadiationMeasurement(?srm) ^ greedi:time(?srm, ?t) ^ greedi:value(?srm, ?srv) ^ swrlb:greaterThan(?srv, 0) ^ crmp:Action(?a) ^ crmp:individual(?a, ?d) ^ crmp:individual(?a, ?pm) -> crmp:alertLevel(?a, "warning") ^ crmp:message(?a, "The photovoltaic generation is lower than expected.") ^ crmp:commandURL(?a, "https://localhost/BRICKSWS/sendmail")
Finally, Listing 8 introduces a rule to control the air-conditioning of zone 4 when someone forgets to shut
it down after a working day. It searches for load devices with boolean measurements (such as on/off) and the
value of the devices' boolean profiles to validate if the values are different. In case they are, it checks if the
boolean measurement is different from ''false'', and if true it triggers the rule, constructing the values for
crmp:message and crmp:commandURL properties.
Listing 8. SWRL rule that triggers automatic control.
greedi:LoadDevice(?d) ^ greedi:measures(?d, ?bm) ^ greedi:BooleanMeasurement(?bm) ^ greedi:value(?bm, ?bmv) ^ crmp:BooleanProfile(?bp) ^ crmp:individual(?bp, ?d) ^ crmp:individual(?bp, ?bm) ^ crmp:profileValue(?bp, ?bpv) ^ swrlb:booleanNot(?bmv, ?bpv) ^ swrlb:booleanNot(?bmv, false) ^ crmp:Action(?a) ^ crmp:individual(?a, ?d) ^ crmp:individual(?a, ?bm) ^ greedi:name(?d, ?dn) ^ swrlb:stringConcat(?tmp, "The ", ?dn) ^ swrlb:stringConcat(?msg, ?tmp, " should be shut down. Shutting it down...") ^ greedi:id(?d, ?did) ^ swrlb:stringConcat(?cmd, "https://localhost/BRICKSWS/shutdown/", ?did) -> crmp:alertLevel(?a, "notice") ^ crmp:message(?a, ?msg) ^ crmp:commandURL(?a, ?cmd)
This rule being triggered results in the alarm output presented in Listing 9.
Listing 9. Alarm output example for SWRL rule of Listing 8.
[ { "profile": { "type": "range", "profileValue": false }, "ind": "http://localhost/ieso/i/greedi-demo-vtn-indiv.ttl#ac-zone4", "measurement": { "value": true, "ind": "http://localhost/ieso/i/greedi-demo-vtn-indiv.ttl#ac-zone4-on-off" }, "action": { "alertLevel": "notice", "message": "The air-conditioning Zone 4 should be shut down. Shutting it down...", "commandURL": "https://localhost/BRICKSWS/shutdown/ac-zone4" } } ... ]
Table 33 illustrates Zone 4 devices' alarms results in four different possible scenarios. All scenarios are for
the same day, i.e., January 28th, 2019. Scenarios 1 and 2 demonstrate two possible occurrences around 10:00
o’clock, while scenarios 3 and 4 demonstrate other two possible situations around 22:00 o’clock. The light green
cells identify monitoring data that do not trigger alarms. The yellow ones identify notice alarms. And the orange
cells identify warning alarms.

Table 3. Zone 4 monitoring and alarms results per device.
Scenario 1 Scenario 2 Scenario 3 Scenario4
Before After Before After Before After Before After
Device \ Time 10:00 10:05 10:00 10:05 22:00 22:05 22:00 22:05
PV generation (W) 880.00 880.00 0.00 0.00 0.00 0.00 0.00 0.00
Solar Radiation
(W/m2) 144 144 144 144 0 0 50 50
Outside temp. (ºC) 13.50 13.50 13.50 13.50 8.55 8.55 8.55 8.55
Indoor temp. (ºC) 18.50 18.50 14.00 17.50 28.10 20.10 12.50 12.50
Air-conditioning On On Off On On Off Off Off
Presence sensor 1 1 1 1 1 1 0 0
Lights status Off Off Off On Off On On Off
Light intensity (%) 50 50 20 50 0 50 50 0
Air-conditioning
power (W) 1560.00 1560.00 0.00 1560.00 1560.00 1560.00 0.00 0.00
Lights power (W) 0.00 0.00 0.00 210.00 0.00 210.00 210.00 0.00
Sockets power (W) 0.00 0.00 0.00 0.00 0.00 0.00 0.00 0.00
Total power (W) 1560.00 1560.00 1560.00 1770.00 1560.00 1770.00 210.00 0.00
Analysing Table 3, scenario 1 demonstrates an example where no alarm is triggered, and all monitoring
values are within the expected intervals. Whereas scenario 2 triggers three different alarms: i) the PV generation
is 0 (zero) while there’s solar radiation; (ii) the A/C is off, and the area temperature is lower than previously
defined by the system’s administrator; and (iii) the light intensity drops to a lower than acceptable percentage.
In the first case, the PV was not producing energy due to tree leaves that were covering it. Regarding the A/C,
some user shut it down inappropriately, and the system was able to turn it on automatically, setting the
temperature according to the users’ preferences. In the case of the light intensity, a cloud covered sun light
coming from the windows and the system turned the lights on to respect the light intensity preferences defined
by the system’s administrator.
Looking at scenario 3, two alarms are triggered: i) the area temperature is higher than the acceptable
maximum value; and ii) the light intensity is too low, considering that the presence sensor identifies some
people in the building. The first alarm automatically corrects the A/C temperature to an acceptable value. The
second one, given the presence of some users in the building, automatically turns the lights on and adjusts the
light intensity according to the users’ preferences. It should be noticed that the system also produces a
notification in the presence sensor, since it is not expected to have someone in the building at that time.
Finally, scenario 4 triggers 1 alarm and 1 notification. The notification warns the system’s administrator
that the solar radiation value is incorrect given the time of the day. Since this value comes from an online
service, the system administrator can simply ignore it and try to find a new service to replace the current one.
The alarm identifies that the lights are still on when nobody is in the building (according to the presence
sensor), and in this case the system is able to turn the light off automatically.
Conclusions
Nowadays, building automation and BMS are more often used in new constructions and to improve
energy efficiency in older ones, through retrofitting. There are several solutions for the most varied domains,
such as: user comfort, building security, energy efficiency, among others. However, there are not yet in the
market affordable solutions which are able to aggregate different services in the same centralized platform, in
an interoperable way.
This paper presented BRICKS, a semantic rule-based system considering context-based profiles for
intelligent building energy and security management. BRICKS is made available as a REST service. It tries to
overcome the main building automation and management issues, such as: high costs, installation, complexity,
and compatibility. Being a semantic rule-based system, it is abstracted from the semantic model and rules, as
they are considered inputs for the system, and in this way the model and rules may change without the need
of reprogramming the system. The context-based profiles are also an input to the system as they are defined
externally. BRICKS matches the rules with the real-time measurements and the specific profiles. Being
implemented in the software level, it does not depend on the used devices nor communication protocols. It
uses a semantic model based on contexts for the validation of the rules according to the profiles to formalize
the system’s output.
BRICKS was designed to be an intelligent and secure system integrating both energy management and
secure communications, while promoting interoperability between all services. It can be reused completely or
partially in other buildings or parts of buildings for which the same semantic models, semantic converters,
and/or semantic rules apply. This is very important namely to reduce development costs as well as for the
feasibility of a possible product in the market. To keep the system abstracted from the semantic data model,
SPARQL queries are used to get the necessary data from the knowledge base. In this way, BRICKS enables the
user to define the ontologies to use that better fit the building needs. However, persistence is mandatory for
BRICKS to work properly. Such is achieved by using JSON schemas. These schemas are used to validate the
SPARQL queries’ output which must be a JSON string. If the JSON string is valid against the corresponding
schema, BRICKS will work properly, otherwise the system will ignore such knowledge. The use of JSON,
instead of the traditional programming languages’ data models, eases its update since the developer does not
need to reprogram the models every time the models change. In its turn, to add new knowledge to the
knowledge base, SPARQL constructs are used. To make this process automatic at each iteration, string tags are
used in the SPARQL constructs templates to be replaced by the corresponding measured values. This tags list
is also an input for the system and depends on the resources allocated to BRICKS.
In accordance with the objectives listed in the introduction, BRICKS is a flexible system since it is not
attached to any semantic data model. It is configurable to use any semantic model the user wants, which
facilitates the process of evolution and maintenance of the data models. It also uses a context-aware algorithm
to obtain the most adequate context profile for each iteration to validate the measurements in the rules. BRICKS
overcomes the lack of interoperability between heterogeneous systems by being at a higher level, where it is
able to aggregate different SCADA systems and/or smart appliances, and uses their measured data to trigger
the rules, as well as their control. This higher level also keeps the system abstracted from the hardware installed
and respective communication protocols, avoiding reprogramming the system every time a new device is
installed. The system is abstracted from the rules and semantic models used, meaning that the user can change
them at any time and the system does not need to be reprogrammed again. The richer the models, the better
the knowledge inferred. BRICKS can be installed in any building with little effort, being only necessary to
configure it accordingly. And finally, it centralizes heterogeneous cross-domains’ data sources in a single user
interface.
A case study explaining bricks configuration, execution, and outputs is also presented to clarify its
functioning. The case study details the scenario deployed at the left-side of GECAD's building N. The examples
presented only focus on the building's administrator perspective, and specifically in the energy management
field, to avoid over-extension. This work overcomes the difficulty of interoperability between heterogeneous
BMS in a building. The semantic rule-based system enables advanced machine intelligence. It is configurable
in order to facilitate its deployment in different buildings and has a centralized interface to manage the cross-
domains' monitoring and alarms. The use of SWRL rules have proven to be very costly in terms of performance
as the number of instances in the knowledge base increases. This is explained by the fact that SWRL inference
engines assert inferred facts to the knowledge base. The greater the number of facts, the more time it takes to
infer new knowledge about the existing facts. And since this process is done in RAM, the greater the number
of facts, the more memory is necessary for the inference, which can quickly result in the loss of performance,
and consequently in an out of memory error. Using only SPARQL rules may be the best option in terms of
performance, if no reasoner is used. In this case SPARQL engine will only use the RDF graph knowledge and
do not infer implicit knowledge.
BRICKS will be continuously improved in order to abstract the system’s user from the semantic models
and rules, facilitating the building management. SPARQL ”rules” will be explored to achieve more complex
and intelligent results, as well as developing and evaluating security related rules.
Funding:

Conflicts of Interest: The authors declare no conflict of interest. The founding sponsors had no role in the
design of the study; in the collection, analyses, or interpretation of data; in the writing of the manuscript, and
in the decision to publish the results.
References
1. Aduda, K.O.; Labeodan, T.; Zeiler W.; Boxem, G.; Zhao, Y. Demand side flexibility: Potentials and building
performance implications, SUSTAIN CITIES SOC 2016, 22, 146-163.
2. Zhou, K.; Fu, C.; Yang, S. Big data driven smart energy management: From big data to big insights, RENEW SUST
ENERG REV 2016, 56, 215-225.
3. Marzband, M.; Fouladfar, M.H.; Akorede, M.F.; Lightbody, G.; Pouresmaeil, E. Framework for smart transactive
energy in home-microgrids considering coalition formation and demand side management, SUSTAIN CITIES SOC
2018, 40, 136-154.
4. Su, H.; Zio, E.; Zhang, J.; Chi, L.; Li, X.; Zhang, Z. A systematic data-driven Demand Side Management method for
smart natural gas supply systems, ENERG CONVERS MANAGE 2019, 185, 368-383.
5. Yu, Z.; Haghighat, F.; Fung, B.C.M. Advances and challenges in building engineering and data mining applications
for energy-efficient communities, SUSTAIN CITIES SOC 2016, 25, 33-38.
6. Park, S.; Ryu, S.; Choi, Y.; Kim, J.; Kim, H. Data-driven baseline estimation of residential buildings for demand
response, ENERGIES 2015, 8.9, 10239-10259.
7. Marzband, M.; Alavi, H; Ghazimirsaeid, S.S.; Uppal, H.; Fernando, T. Optimal energy management system based on
stochastic approach for a home Microgrid with integrated responsive load demand and energy storage, SUSTAIN
CITIES SOC 2017, 28, 256-264.
8. Simmhan, Y.; Aman, S.; Kumbhare, A.; Liu, R.; Stevens, S.; Zhou, Q.; and Prasanna, V. Cloud-based Software Platform
for Data-Driven Smart Grid Management, IEEE/AIP COMPUT SCI ENG (CISE) 2013, Jul/Aug, 1-11.
9. Shakouri G., H.; Kazemi, A. Multi-objective cost-load optimization for demand side management of a residential area
in smart grids, SUSTAIN CITIES SOC 2017, 32, 171-180.
10. Calvillo, C.F.; Sánchez-Miralles, A.; Villar, J. Energy management and planning in smart cities, RENEW SUST ENERG
REV 2016, 55, 273-287.
11. Jajac, N.; Knezic, S.; Marovic, I. Decision support system to urban infrastructure maintenance management. OTMC
2009, 1 (2), 72-79.
12. Blaauwbroek, N.; Nguyen, H.P.; Konsman, M.J.; Shi, H.; Kamphuis, I.G.; Kling, W.L. Decentralized resource allocation
and load scheduling for multicommodity smart energy systems. IEEE T SUSTAIN ENERG 2015, 6(4), 1506-1514.
13. Brusco, G.; Burgio, A.; Menniti, D.; Pinnarelli, A.; Sorrentino, N. Energy Management System for an Energy District
With Demand Response Availability. IEEE T SMART GRID 2014, 5, 2385-2393.
14. Figueiredo, J.; Costa, J.S. A SCADA system for energy management in intelligent buildings. ENERG BUILDINGS 2012,
49, 85-98.
15. Lee, S.; Kwon, B.; Lee, S. Joint Energy Management System of Electric Supply and Demand in Houses and Buildings.
{IEEE} Trans. Power Syst. 2014, 29, 2804–2812.
16. Lawrence, T.M.; Boudreau, M.-C.; Helsen, L.; Henze, G.; Mohammadpour, J.; Noonan, D.; Patteeuw, D.; Pless, S.;
Watson, R.T. Ten questions concerning integrating smart buildings into the smart grid. BUILD Env. 2016, 108, 273–
283.
17. Faria, P.; Spinola, J.; Vale, Z. Aggregation and Remuneration of Electricity Consumers and Producers for the Definition
of Demand Response Programs. IEEE Trans. Ind. Informatics 2016, PP, 1–1.
18. Faria, P.; Vale, Z. Demand response in electrical energy supply: An optimal real time pricing approach. Energy 2011,
36, 5374–5384.
19. Wang, N.; Zhou, X.; Lu, X.; Guan, Z.; Wu, L.; Du, X.; Guizani, M. When Energy Trading Meets Blockchain in Electrical
Power System: The State of the Art, APPLIED SCIENCES-BASEL 2019, 9, 1561.
20. Andoni, M.; et al. Blockchain technology in the energy sector: A systematic review of challenges and opportunities,
RENEW SUST ENERG REV 2019, 100, 143-174.
21. Liu, C.; Chai, K.K.; Zhang, X.; Chen, Y. Peer-to-peer electricity trading system: smart contracts based proof-of-benefit
consensus protocol, WIREL NETW 2019.
22. Wijayasekara, D.; Linda, O.; Manic, M.; Rieger, C. Mining Building Energy Management System Data Using Fuzzy
Anomaly Detection and Linguistic Descriptions. {IEEE} Trans. Ind. Informat. 2014, 10, 1829–1840.
23. Figueiredo, J.; da Costa, J.S. A SCADA system for energy management in intelligent buildings. ENERG Build. 2012,
49, 85–98.

24. Gómez-Romero, J.; Molina-Solana, M.; Ros, M.; Ruiz, M.D.; Martin-Bautista, M.J. Comfort as a Service: A New
Paradigm for Residential Environmental Quality Control. Sustainability 2018, 10, 3053.
25. Domingues, P.; Carreira, P.; Vieira, R.; Kastner, W. Building automation systems: Concepts and technology review.
Comput. Stand. Interfaces 2016, 45, 1–12.
26. Wang, Y.; Wang, B.; Chu, C.-C.; Pota, H.; Gadh, R. Energy management for a commercial building microgrid with
stationary and mobile battery storage. ENERG Build. 2016, 116, 141–150.
27. Burmester, D.; Rayudu, R.; Seah, W.; Akinyele, D. A review of nanogrid topologies and technologies. RENEW SUST
ENERG REV 2017, 67, 760–775.
28. ThinkEnergy The Pros and Cons of Home Automation Systems.
29. Somfy Is Home Automation Right for You.
30. Nicholson, A.; Webber, S.; Dyer, S.; Patel, T.; Janicke, H. SCADA security in the light of Cyber-Warfare. Comput Secur
2012, 31, 418–436.
31. Leszczyna, R. Cybersecurity and privacy in standards for smart grids – A comprehensive survey. Comput STAND
INTER 2018, 56, 62–73.
32. Shang, W.; Ding, Q.; Marianantoni, A.; Burke, J.; Zhang, L. Securing building management systems using named data
networking. {IEEE} Netw. 2014, 28, 50–56.
33. Althunibat, S.; Wang, Q.; Granelli, F. Flexible channel selection mechanism for cognitive radio based last mile smart
grid communications. AD HOC NETW 2016, 41, 47–56.
34. Mejías, A.; Herrera, R.S.; Márquez, M.A.; Calderón, A.J.; González, I.; Andújar, J.M. Easy Handling of Sensors and
Actuators over TCP/IP Networks by Open Source Hardware/Software. Sensors 2017, 17.
35. Martinez, B.; Vilajosana, X.; Kim, I.H.; Zhou, J.; Tuset-Peiró, P.; Xhafa, A.; Poissonnier, D.; Lu, X. I3Mote: An Open
Development Platform for the Intelligent Industrial Internet. Sensors 2017, 17.
36. C|net Survey: 98 percent of enterprises using open source 2017.
37. GREEDi Project Homepage 2017.
38. Brick Schema Homepage 2018.
39. Project Haystack Homepage 2014.
40. Alaya, M.B.; Medjiah, S.; Monteil, T.; Drira, K. Toward semantic interoperability in oneM2M architecture. {IEEE}
Commun. Mag. 2015, 53, 35–41.
41. Daniele, L. SAREF: the Smart Appliances REFerence ontology 2016.
42. Bonino, D.; Corno, F. DogOnt - Ontology Modeling for Intelligent Domotic Environments. In Proceedings of the The
Semantic Web - ISWC 2008; Sheth, A., Staab, S., Dean, M., Paolucci, M., Maynard, D., Finin, T., Thirunarayan, K., Eds.;
Springer Berlin Heidelberg: Berlin, Heidelberg, 2008; pp. 790–803.
43. W3C Semantic Sensor Network Ontology Available online: https://www.w3.org/TR/vocab-ssn/ (accessed on May 15,
2018).
44. buildingSMART Homepage 2018.
45. Energy@home Homepage.
46. EEBus Homepage 2017.
47. Lefrançois, M.; Kalaoja, J.; Ghariani, T.; Zimmermann, A. SEAS Knowledge Model; 2016;
48. ASHRAE Project Committee 201 Facility Smart Grid Information Model 2018.
49. Schachinger, D.; Kastner, W. Semantics for smart control of building automation. In Proceedings of the 2016 IEEE 25th
International Symposium on Industrial Electronics (ISIE); 2016; pp. 1073–1078.
50. Petrushevski, F.; Gaida, S.; Beigelböck, B.; Sipetic, M.; Zucker, G.; Schiefer, C.; Schachinger, D.; Kastner, W. Semantic
Building Systems Modeling for Advanced Data Analytics for Energy Efficiency. In Proceedings of the Building
Simulation 2017; 2017; pp. 622–627.
51. Ahvar, S.; Santos, G.; Tamani, N.; Istasse, B.; Praça, I.; Brun, P.; Ghamri, Y.; Crespi, N. Ontology-based model for
trusted critical site supervision in FUSE-IT. In Proceedings of the 2017 20th Conference on Innovations in Clouds,
Internet and Networks (ICIN); 2017; pp. 313–315.
52. Tamani, N.; Ahvar, S.; Santos, G.; Istasse, B.; Praca, I.; Brun, P.; Ghamri, Y.; Crespi, N.; Becue, A. Rule-Based Model
for Smart Building Supervision and Management. In Proceedings of the 2018 IEEE International Conference on
Services Computing (SCC); 2018; pp. 9–16.
53. Muñoz López, S.; Fernández, A.; Coronado, M.; Iglesias, C.A. Smart Office Automation based on Semantic Event-
Driven Rules. In Proceedings of Workshop on Smart Offices and other Workplaces, colocated with 12th International
Conference on Intelligent Environments (IE’16); Novais, P., Konomi, S., Eds.; Ambient Intelligence and Smart
Environments; IOS Press, 2016; Vol. 21, pp. 33–42 ISBN 978-1-61499-690-3.

54. Yuce, B.; Rezgui, Y. An ANN-GA Semantic Rule-Based System to Reduce the Gap Between Predicted and Actual
Energy Consumption in Buildings. {IEEE} Trans. Autom. Sci. Eng. 2017, 14, 1351–1363.
55. Teymourian, K.; Paschke, A. Semantic Rule-Based Complex Event Processing. In Proceedings of the Rule Interchange
and Applications; Governatori, G., Hall, J., Paschke, A., Eds.; Springer Berlin Heidelberg: Berlin, Heidelberg, 2009; pp.
82–92.
56. Rygaev, I. Rule-based Reasoning in Semantic Text Analysis. In Proceedings of the RuleML+RR; 2017.
57. Subirats, L.; Ceccaroni, L.; Gómez-Pérez, C.; Caballero, R.; Lopez-Blazquez, R.; Miralles, F. On Semantic, Rule-Based
Reasoning in the Management of Functional Rehabilitation Processes. In Proceedings of the Management Intelligent
Systems; Casillas, J., Martínez-López, F.J., Vicari, R., la Prieta, F., Eds.; Springer International Publishing: Heidelberg,
2013; pp. 51–58.
58. Gruninger, M.; Lee, J. Ontology Applications and Design. Commun. ACM 2002, 45, 39–41.
59. OPC Foundation Unified Architecture 2018.
60. CAS Welcome to the OPC Unified Architecture e-book 2010.
61. Madureira, B.; Pinto, T.; Fernandes, F.; Vale, Z. Context analysis in energy resource management residential buildings.
In Proceedings of the 2017 IEEE Manchester PowerTech; 2017; pp. 1–6.
62. Herberg, U.; Mashima, D.; Jetcheva, J.G.; Mirzazad-Barijough, S. OpenADR 2.0 deployment architectures: Options
and implications. In Proceedings of the 2014 IEEE International Conference on Smart Grid Communications
(SmartGridComm); 2014; pp. 782–787.
63. Mohan, A.; Mashima, D. Towards Secure Demand-Response Systems on the Cloud. In Proceedings of the 2014 IEEE
International Conference on Distributed Computing in Sensor Systems; 2014; pp. 361–366.
64. GTM Innovari Wants to Make Demand Response the Same As an Independent Power Plant 2014.
65. Actility Veolia uses ThingPark Energy to monetize its flexible capacity through Demand Response.
66. Khorram, M.; Abrishambaf, O.; Faria, P.; Vale, Z. Office building participation in demand response programs
supported by intelligent lighting management. Energy Inf. 2018, 1, 9.

Luis Gomes
Microgrid Management System Based on a Multi-Agent Approach: an Office Building Pilot
Authors: Luis Gomes, Zita Vale, and Juan M. Corchado
Published in: Measurement (IF: 2.791)
DOI: 10.1016/j.measurement.2019.107427
Published at: March 2020
PhD timeline: M44

Microgrid Management System Based on a Multi-Agent
Approach: an Office Building Pilot
Luis Gomes 1, Zita Vale 2 and Juan M. Corchado 3
1 GECAD - Research Group on Intelligent Engineering and Computing for Advanced Innovation and Development
Polytechnic of Porto (IPP),
Porto, Portugal
[email protected], [email protected]
2 Polytechnic of Porto (IPP),
Porto, Portugal
3 BISITE research Group, University of Salamanca, Salamanca 37007, Spain
Air Institute, IoT Digital Innovation Hub, Salamanca 37188, Spain
Department of Electronics, Information and Communication, Osaka Institute of Technology, Osaka 535–8585, Japan
Abstract — Microgrids bring advantages to end-users and to the
smart grid environment. However, adequate management
software, enabling bringing to the field new energy management
concepts, is not available yet. Small, single-tasked, software is
usually proposed and tested while a clear overall system
architecture for microgrid management required to take full
advantage of the microgrids’ potential. Previous publications
usually focus on energy-related problems and do not provide an
efficient and viable solution for players’ representation and
microgrid operation. This paper proposes a complete
architecture for a microgrid management system based on a
multi-agent approach – µGIM – allowing the easy
implementation of different energy strategies. The µGIM agents
can independently manage local resources while able to
collaborate and/or compete with other agents. Designed to run in
single-board computers, µGIM agents are light-weighted and
easily deployed in buildings. To demonstrate these capabilities,
the paper details and presents a microgrid deployment using
µGIM solution.
Index Terms — microgrid deployment, microgrid management,
multi-agent systems, real-time energy management.
I. INTRODUCTION
The new paradigm of power energy systems enables and benefits small and medium players that have active participation roles in the smart grid context. These players can see their energy bill increased or decreased according to the efficiency of their participation towards common and/or global goals. The ways to participate in the smart grid are vast, complex, and time-consuming. Therefore, such participation must be enabled and seamless for the users.
In the new power energy system paradigm, Demand Side Management (DSM) can be used to eliminate grid peaks and to accommodate a higher penetration of renewable energies [1].
For this to be possible, new approaches must be researched to provide end-users with these abilities.
Microgrids appear in the smart grid context as “electricity distribution systems containing loads and distributed energy resources (such as distributed generators, storage devices, or controllable loads) that can be operated in a controlled, coordinated way either while connected to the main power network or while islanded” [2]. These smaller grids bring management advantages and are being deployed around the world, where some examples can be found in University of California in San Diego [3], in the Brooklyn area in New Jersey in the United States of America [4], in Sendai in Japan [5], and in the Nanji island in China [6].
Regarding energy management systems, single-board computers (SBC) can bring new possibilities for development and deployment [7]. Their capacity to integrate an operating system (OS) enables easy access to a high level of computation while providing input/output pins similar to a microcontroller. Therefore, some works use SBC for deployment. In [8], a fire-safety sensor is deployed in a Raspberry Pi enabling web services and a TCP/IP-based sensor communication. In a more recent work presented in [9], SBC are used to provide a hierarchical and distributed multi-agent system for microgrid control merging the standard IEC 61850, FIPA specifications and data distribution service (DDS) standards.
The main contributions of this paper are an agent-based architecture for end-user representation, a multi-agent system for microgrid management, and a light-weight solution that can be easily deployed in SBC. This work differs from others by providing a unique agent-architecture that can model any end-user, avoiding the development and deployment of multiple agents with different software; one agent can represent them all. Another key aspect of this proposed solution, it is the ability of agents to be executed as standalone systems. The standalone

implementation allows the proposed solution to manage the building resources without being a part of a multi-agent system.
This paper proposes a complete architecture for a microgrid management system based on a multi-agent approach. This architecture is focused on the end-user and enables the monitoring, management, and control of energy resources. The proposed architecture allows the integration of sensors to enable context-awareness and efficient resource optimization. The proposed platform architecture is named µGIM, from microgrid intelligent management. The proposed modular platform/architecture enables the integration of different energy strategies that provides users with efficient management, intelligence and active participation in the smart grid. This paper will present the proposed platform and will not focus on modular energy strategies.
The proposed architecture and platform were developed and implemented in SBC and deployed in an office building, where the platform is tested, and the data can be analyzed. Some of these data are shown in this paper. The complete dataset can be accessed in [10] and [11]. The office building where µGIM platform is deployed has offices rented; renters are responsible for their own energy management. The results show the ability of the µGIM platform to efficiently monitor and control an office microgrid.
This paper is divided into six main sections. After this Introduction section, Related Work is presented in section II. The proposed µGIM Platform is described in section III. The office building deployment is described in section IV, and the main results are presented in section V. Finally, section VI presents the main conclusions of this work.
II. RELATED WORK
MAS are commonly applied in the smart grid context, as seen in [12]. Their ability to individually manage a part of the system while integrating a community enables the smart grid’s players to be represented by agents; where each player has its own goals, but it also can collaborate or compete with other agents for common goals.
A MAS for smart grid management is proposed in [13, 14], integrating MASCEM [15] and MASGriP [16] – a MAS for competitive electricity market simulation and a MAS for smart grid simulation, respectively. Later, MASGriP was implemented in the Multi-Agent System Layer proposed in [17] to monitor and control a university campus microgrid. A MAS for microgrid balance between consumption and generation is proposed in [18], where day-ahead forecasts are used for market participation and 5 minutes forecasts are used to balance the energy. The system uses a real-time digital power system simulator (RTDS) for grid simulation and a MAS for grid/player representation and management. A distributed voltage control system using a MAS is proposed in [19]. The MAS uses blackboard service for agent collaboration reducing data’s communication between agents. Also, cooperative frequency control for islanded microgrids is proposed in [20], where a hierarchical MAS frequency control is used.
Although MAS are used for microgrids, they are usually applied in small and specific problems, not behind able to monitor and manage a player infrastructure. Also, it is common
to use MAS with multiple agent types where each agent is responsible for a part of the system, a special task, or an individual energy resource. In [21] and [22] a MAS is proposed for building representation in a microgrid where five agent types are used: central coordinator agent, building management agent, renewable energy resources agent, battery bank agent, and service agent. Five different types are also proposed in [23]: load agent, renewable distributed energy resource agent, conventional distributed energy resource agent, energy storage agent, and utility grid agent. A total of ten agents are proposed in [24]: distributed generation agent, load agent, storage agent, SCADA agent, generation coordination control agent, economic dispatch control agent, energy forecast agent, system operator agent, and static switch agent. More agent types are proposed in [25], [26] and [27]. This paper proposes a MAS with only one agent type that can represent any microgrid’s player. The use of the same agent type improves scalability and deployment of the system.
To improve the deployment of the proposed MAS, SBC are used, enabling the easy installation of devices in the players’ infrastructure. SBC can even be installed inside the electrical enclosure enabling efficient deployments in buildings. The use of SBC in the smart grid context is not a novelty; they are been applied to solve several tasks throughout the management layers of the smart grid. For instance, in [28], multiple Raspberry Pi are used to detect anomalies in phasor measurement units. BeagleBone Black SBC are used in [29] to implement the multi-level microgrid control proposed in [30]. In [29] RS485 and Controller Area Network (CAN) standards are used for resource integration, and the system is implemented in a Power Park with multiple microgrids.
To find complete solutions, using MAS and SBC, we need to look at broader projects, such as RIAPS and VOLTTRON. Currently, these are the two main solutions related to the system proposed in this paper.
The Linux Foundation launched in the middle of 2018 the LF Energy that is an open-source coalition for multi-vendor collaboration and open-source progress in the sectors of energy and electricity [31]. The LF Energy launched four open-source projects, and one of those projects is the Resilient Information Architecture Platform for Smart Grid (RIAPS) that provides core services for buildings and microgrids. The RIAPS is presented as a software platform for building distributed real-time embedded applications [32].
The RIAPS is based on an extension of F6COM computation model [33, 34]. It is a decentralized solution where nodes can join and leave groups anytime – using OpenDHT (open Distributed Hash Table) for discovery service [32].
The RIAPS platform has two node types: the control node, and the target node. The control node should be placed in the network control room and is mandatory in the RIAPS platform. For other deployments, the target node should be used. Each node is an actor (e.g. consumer or generator), and all of them are synchronized by time.
The platform provides an already set up control node running in an amd64 Xubuntu 18.04 virtual machine and a target node running in an armhf Ubuntu 18.04 for BeagleBone Black, a

single-board computer from the BeagleBoard.org Foundation. Both can be freely downloaded from their webpage1. Instructions are available for users that want to use RIAPS in other environments.
Some of RIAPS applications and demonstrations can be seen in [35, 12]. Particularly, in [12], RIAPS is used to implement a distributed under-frequency load shedding scheme. The implementation is tested in the IEEE 39-bus network using MATLAB software; in this case, the test is conducted outside RIAPS nodes. A distributed microgrid phase and frequency synchronization strategy is proposed in [35] and tested in a laboratory using real-time simulators (OPAL-RT 5031 and OPAL-RT 5607). In [36], RIAPS integrates an algorithm to interleaving multi-converter systems to minimize harmonics in the DC bus. This work was also tested using a real-time simulator (OPAL-RT 5607). A small transactive energy demonstration, using only one consumer and one generator is presented in [37].
VOLTTRON was firstly developed in 2012 by the Pacific Northwest National Laboratory, United States of America [38]. In 2014, VOLTTRON was released as an open source software under Apache License (Version 2.0), the same license as RIAPS platform. Currently, VOLTTRON is in its version 4. VOLTTRON is an agent-based platform running in Python 2.7. Agents can be deployed in single-board computers, such as Raspberry Pi Zero W.
VOLTTRON applications are distributed and centralized nodes are not needed. However, centralized agents can be deployed as service providers, such as weather services and VOLTTRON Central Agent – an agent that provides a web service working as a global interface for all platform’s agents. The main architecture defines three agent roles: platform agents, cloud agents, and control agents [39]. Each agent can perform one or several roles simultaneously. The platform agents provide services. The cloud agents are able to subscribe to local message topics and publish the data in remote servers. The control agent is able to control a resource while interacting with other resources.
VOLTTRON agents use drivers to connect to physical resources. Modbus and BACnet are two available drives. However, being an open source solution, it allows the development of other drivers, such as the Xbee driver developed in [40].
Some of the deployments and use cases developed and implemented in VOLTTRON can be seen in [41]. A hardware-in-the-loop (HIL) simulator for testing two variable-air-volume fan control is proposed in [42]. This HIL simulator was developed in the PNNL laboratories. A transactive control over rooftop air conditioning units using two demand response programs, demand limiting, and real-time pricing control, is proposed in [43]. The control is done using the building occupancy and the proposed solution was implemented in Washington State (United States of America) using single-board computers. In [44], VOLTTRON is implemented in a Linux desktop machine with sixteen agents deployed in Cubietruck boards for a consensus-based distributed algorithm
1 https://riaps.isis.vanderbilt.edu/rdownloads.html
for energy price between consumers and generators; this work presents a simulated test with 1.400 agents. A grid deployment for transactive energy using VOLTTRON agents can be seen in [45] and [46] where a total of eight Raspberry Pi boards are used – four deployed in buildings, one in the 1 MW photovoltaic array and one in a battery energy storage system. This deployment is made in the Scott Park Campus of the University of Toledo.
III. µGIM PLATFORM
The solutions analyzed in the previous section demonstrate the current state of the art regarding ready to install platforms that can be executed in single-board computers. Specially RIAPS and VOLTTRON are complete solutions that focus on energy management and can be easily deployed. The proposed µGIM platform will differ from the previous solutions regarding their focus and actuation target. The µGIM platform is focused in the end-user representation and can be installed as a standalone solution capable of providing energy management solutions to the end-user. One of the main novelties of µGIM is its capability of integrating energy strategies that can be executed on the end-users’ side.
While the previous solutions seemed to be built from the grid to end-users, µGIM is designed from end-users to the grid. This new approach puts µGIM closer to the end-user and enables the use of µGIM without having an agent community. The µGIM agents are designed to manage a smart building focusing on energy management, with external integration, participation, and negotiation capabilities. A µGIM agents are capable of participating in a smart grid context by responding to demand response programs and by transacting energy. However, they use these external interactions to improve the end-users’ buildings energy management, not needing or depending on these external agents. This shift of paradigm provides µGIM with a novel solution that can be used today in our residential and nonresidential buildings providing resource optimization algorithms, while previous solutions almost demand the existence of a community in order to improve end-users’ daily energy management.
Being end-user focused, µGIM agents are able to represent an entire building/home and not smart grid or building parts, as seen in the previously mentioned examples of RIAPS and VOLTTRON. The way µGIM is able to do this will be presented in this section, while the results of such representation will be shown in section V.
The examples mentioned in the previous section provided case studies that usually dealt with equipment synchronization, building monitoring or large equipment – such as Heating, Ventilation, and Air Conditioning (HVAC) systems. In the case of the µGIM platform, the priority is given to the management of small resources that are available in the end-users’ building. This paradigm raises new problems regarding users’ comfort, preferences, actions, and contexts.
The µGIM agents’ domain model can be seen in Figure 1, where different colors are used to identify conceptual classes regarding building’s agent, building’s infrastructure, data

management, management of the building, and physical interfaces. At its center is the agent/building that represents the end-user facility.
Figure 1. Agent domain model
Each agent is able to represent a building; therefore, the agent can be seen as a building (central block). The agent has all the resources directly connected to it. Resources can be of different types, such as sensors for context and environment identification. Using rooms is possible to independently identify contexts inside the room and to make room optimizations. The storage system enables data storage of all resources and agent actions – locally and remotely. The Universal Asynchronous Receiver-Transmitter (UART) enables the connection of µGIM agents in RS485 networks using Modbus/RTU protocol. Management strategies are encoded in algorithms that are executed inside the agent and that can have or not have an impact on the physical resources. Strategies can be of two types: periodic strategies are executed periodically in time, while context strategies are executed every time a particular context is met. Alarms are scheduled tasks inside the agent that execute actions; they are used for remote storage and scheduled strategies. All these aspects are explained in more detail below.
The authors developed the domain model of the µGIM agents in the architecture presented in Figure 2, using a component-based architecture methodology. The µGIM agents are built on top of the Raspbian operating system. The dark orange blocks represent third-party software that is needed for the µGIM platform but is not developed for/by µGIM. The µGIM agents are developed in Java 8 using the DevOps methodology for
software development. Each light blue block, represented in Figure 2, is, in fact, an individual thread that is executed in parallel. Internally, threads share data among them. The Java language was used because of the JADE framework and the ability to run in multiple operating systems. Not being the fastest programming language, Java is not the only language used in µGIM agents; energy strategies can be developed or use other frameworks running in faster programming languages, such as the use of C in the GNU Linear Programming Kit (GLPK) solver.
However, µGIM agents can use other languages for optimization and energy management, such as the case of C language used for is computational speed.
For network discovery, µGIM uses the JGroups block. This enables virtual tunneling in the network where agents can discover each other. In the JADE framework – the framework used for the proposed MAS – each agent must connect to the framework. JGroups enables the broadcast of the framework location, its Internet Protocol (IP) address, port, and name. The JADE Controller block can assume one of two modes per agent: Agent core, and MAS core. The agent core is assumed by default and indicates that that agent is part of a MAS. The MAS core mode indicates that that agent is also the provider of the MAS framework where other agents will connect to. JADE’s Agent Management System (AMS) and Directory Facilitator (DF) agent will be executed in the MAS core SBC. Per microgrid, only one MAS core must be used. If MAS core agent fails, the MAS will stop working because all agents will lose the connection AMS and DF agents. This JADE limitation should be overpassed to provide agent migration in case of failures; JGroups can be used to overcome JADE failures.
The Internal Memory block enables an agent memory unit that saves key/value objects where the key is a String and the value is an object. This block enables the sharing of data between threads that are not directly connected.
The Logging block is essential for development and logs all error and warning occurrences in the agent. In µGIM, the Logging block can be configured to show the logs directly in the command line or to save the logs in files. The use of files is needed to enable the creation of command-line user interfaces. The GUI block (Graphical User Interface) is designed to have two possible configurations: local, and remote. Both can be used simultaneously. The local GUI uses a command-line GUI – see Figure 3. The local GUI makes sense when a screen is available in the agent location. The remote GUI instantiates a µGIM RESTful API (Application Programming Interface) that provides the monitoring and control of the µGIM agent. From the design point-of-view, the remote GUI makes more sense because it provides a better visualization to users and enables the use of the interface in a web browser; mobile or in a computer.

Figure 2. µGIM Agent Architecture
Figure 3. Agent graphical user interface
The Data Storage is divided into two types; agents must have these two configuration types. The local storage uses a database installed in the localhost and uses the SBC internal memory. The remote storage uses an external server. The combination between the two types enables the existence of data inside the SBC – with a high-speed reading rate – and the existence of historical data in a server without the memory limitation of SBC. The µGIM agents can also read from the remote storage system.
The Resource Integration block is responsible for managing the integration of physical resources, such as electrical loads and sensors. In the µGIM agents, each physical resource is a thread that monitors and controls the configured resource; the control is not mandatory, and it depends on the resource configuration. Currently, µGIM provides drivers for Modbus/RTU,
Modbus/TCP, and RESTfull. Modbus is highly disseminated in energy equipment, such as energy analyzers and inverters. The possibility of including resources with RESTfull APIs enables the integration of the Internet of Things (IoT) devices.
The Energy Strategies block enables Demand-Side Management (DSM). Algorithms for DSM and energy-related algorithms are represented in this block. Strategies can be periodic or contextual. Each energy-related strategy is a computational instance of the Energy Strategy interface.
In the µGIM platform, agents can participate in Transactive Energy local auctions, enabling energy transactions between neighbors. Each agent can assume at least one of two modes: participant, and auction master. In a µGIM microgrid configuration, only one auction master is allowed. Section III.E details the agents’ participation in energy transactions.
The Alarms block enables internal alarms in the agent, where each alarm executes a specific function, such as the execution of a forecasting algorithm. Alarms can be Periodic or Scheduled, where periodic alarms are executed periodically (e.g. every hour), and scheduled alarms are executed at a certain time (e.g. a particular optimization algorithm can be executed every day at 10 a.m.).
OpenADR 2.0b [47] block implements a Virtual End Node (VEN) enabling Monitoring reports and the participation on demand response programs; using the Control block. This block is currently under development and more tests and validations must be made.

A. Multi-Agent Approach
The µGIM platform is designed for microgrid management with individual players representation. Therefore, a centralized solution is not suitable. The MAS approach is no novelty in the application of microgrids or smart grids, as seen in previous works, such as [48], [49] and [50]. A vast survey can also be seen in [51]. Therefore, the use of such approach seemed right to meet the goals of the µGIM platform.
The multi-agent approach used in the µGIM platform enables the agent representation of each microgrid player within an SBC. All agents have their internal and individual goals efficiently managing the players’/buildings’ energy. They can communicate and interact with the other microgrid players to achieve their goals.
The µGIM platform is FIPA compliant, in opposition to RIAPS and VOLTTRON solutions that are not FIPA compliant. This compliance is provided by the used JADE framework.
B. Single-Board Computers
SBC offers new possibilities for software deployment. The small size and computational power available in SBC are advantages that can be used for energy management systems. Besides the already mentioned RIAPS [32] and VOLTTRON [38], other solutions used SBC for energy solutions, such as dRF-Pi solution [52], and publications such as in [53], [54], and [55]. The versatility, low-price, low-size and proven used of SBC for energy solutions were the main motivations that support the choice of developing µGIM in SBC.
The µGIM platform was designed and developed for Raspberry Pi 3 Model B. The reason behind this decision regards the support and community size of Raspberry Pi as well as having all the necessary connections in the board (multiple USB, HDMI, and RJ45). However, other SBC were successfully tested and can be used, such as NanoPi M1 Plus and BeagleBone; some of them with great specification sets. For instance, NanoPi NEO Core 2 is a 40x40 mm board with 1 GB DDR3 RAM, 8 GB eMMC storage (which can be extended using an SD card), an Allwinner H5 64-bit 1.5 GHz quad-core processor, 68 General Purpose Input/Output (GPIO) pins and able to run Ubuntu Core operating system. The size, available GPIO, and the computation power enable the deployment of energy management systems in boards as small as 40x40 mm.
Even the card size of Raspberry Pi 3 Model B is small enough to enable its deployment almost anywhere. With 85x56 mm size, Raspberry Pi 3 can be deployed inside the electrical enclosure or near the electrical enclosure – minimizing the distance from energy analyzers that can be placed in the electrical enclosure and that can be integrated using Modbus/RTU protocol.
C. Resource Integration
The resource integration, in the µGIM agents, enables the monitoring and management of the players’ resources. Nowadays, IoT devices must be considered. Their massification makes them common devices in buildings. Also, they can be used in energy management systems, as seen in [56], [57] and [58]. Therefore, the integration of IoT devices must be taken into consideration.
In the µGIM agents, RESTfull resource type can be used to integrate IoT devices in the platform. For IoT devices that cannot be directly integrated, it is possible to install in the SBC one of the home automation systems available, some good choices being the following open-source systems: Home Assistant, Domoticz, and openHAB.
The protocols Modbus/RTU and Modbus/TCP are highly used in energy equipment, such as energy analyzers and photovoltaic inverters. For this reason, they are available in µGIM agents to enable a direct connection between the agent and energy equipment. Because µGIM is end-user focused, protocols such as IEC 61850 are not yet available.
D. Energy Strategies
To provide a suitable solution for end-users’ representation capable of managing energy resources, it is needed to integrate energy management solutions, such as demand side management [59], active participation in demand response programs [60], energy forecasting [61], scheduling algorithms [62] and learning algorithms [63]. Energy management related algorithms are seen in µGIM platform as Energy Strategies.
Energy strategies can assume one of two types: periodic, or contextual. Periodic strategies are strategies that are executed periodically without context relation; for instance, forecasting algorithms for consumption and/or generation. The contextual strategies are executed when a certain context occurs; for instance, energy balancing algorithms to match consumption and generation can be executed when the consumption and generation do not match.
For periodic strategies, the system uses a variation of Linux’s crontab schedule notation (Figure 4), where strategies can be configured to be executed at a certain time. The use of percental value, in the notation of Figure 4, indicates multiple values – for instance, the notation * 8% * * * is executed at 8 a.m., 4 p.m., and 12 p.m. The last value of the notation is an adjustment, in minutes, to be made in the time. For instance, the notation 15% * * * * -5 is executed every hour at the following minutes: 10, 25, 40, and 55.
Figure 4. Periodic strategies notation
Contextual strategies are associated with restrictions (mandatory) and conditions (optional). All the restrictions of a strategy must be fulfilled. If a strategy has conditions, then at least one of them must be fulfilled. The agents’ contextual strategies are only executed if all restrictions are fulfilled and at least one condition is fulfilled.
By default, µGIM agents do not provide energy strategies. Energy strategies were designed and developed as blank/empty

containers that can be created by any developer or user. Energy strategies are open to any developer and contribution. Currently, and to provide a range of options, the µGIM platform allows the use of several technologies that were tested and that can be used in energy strategies, such as GNU Linear Programming Kit (GLPK) solver, Java Optimization Modeler (JOM) library, R project, Deep Learning for Java (DL4J) and TensorFlow. The energy strategy described in section IV.B, of this paper, was developed using the JOM library and GLPK solver.
E. Smart Grid Participation
In the µGIM platform, players/agents can actively participate in the microgrid and smart grid. This is possible with the OpenADR and Transactive Energy blocks. The OpenADR block implements the VEN OpenADR 2.0b profile specifications [47]. A Virtual Top Node (VTN) can directly interact with the agent and with the agent’s resources, depending on the agent configuration. OpenADR is an important enabler for the end-user active participation in the smart grid [64].
Currently, µGIM also provides a simple peer-to-peer local auction for energy transactions. By using the agent’s configuration file, an agent can be configured to be a participant of transactive energy, participating in the local auction. The µGIM platform enables the use of one of the four available auction types: English, Dutch, Blind, and Vickrey. An agent uses energy strategies to participate in transactive energy (e.g. sell everything, sell nothing, do aggressive bids, buy at any cost). The peer-to-peer transactions are a µGIM feature that will not be handled in this work, begin under development and not finished.
Transactive energy participation is configured with periodic strategy notations. Therefore, it is possible to have several auctions running at different times and using different auctions types.
IV. MICROGRID DEPLOYMENT
This section presents the µGIM platform deployed in an office building where more than one entity is responsible to manage energy resources. The present section is divided in two: the building deployment where the deployment of the microgrid is detailed, and the Zone R.2 resource management in which a particular energy strategy placed in Zone R.2 agent is presented.
A. Building Deployment
The µGIM platform is deployed in an office building that already had a Supervisory Control and Data Acquisition (SCADA) system with several energy analyzers, Programmable Logic Controllers (PLCs), dimmable lamps using Digital Addressable Lighting Interface (DALI) protocol and one grid-connected photovoltaic inverter. Figure 5 shows the SCADA system existent in the building.
Figure 5. Hardware deployment for monitoring and control
The office building has sixteen offices that can be rented. The building has a total of forty photovoltaic panels with and individual peak of 250 W; totalizing a generation peak of 10 kW. The offices can only be rented in pairs or triples, because of electrical restrictions. Each renter has access/control to four photovoltaic panels, making each renter responsible for managing 1 kW of peak generation. The building’s manager manages the remaining photovoltaic panels – which are not rented. The building manager is noted as Z.0 and the four renters are noted as L.1, L.2, L.3, and R.2.
Figure 6 shows a satellite image of the office building with a top layer identifying the inside rooms and zones used. Each zone is managed by a unique µGIM agent. As can be seen, the two last right offices are not considered in this deployment. The common areas and toilets are managed by the building's manager/agent, as well as the kitchen (room 10) and rooms 11 and 16, which are not rented.
Figure 6. Building zones/agents deployment
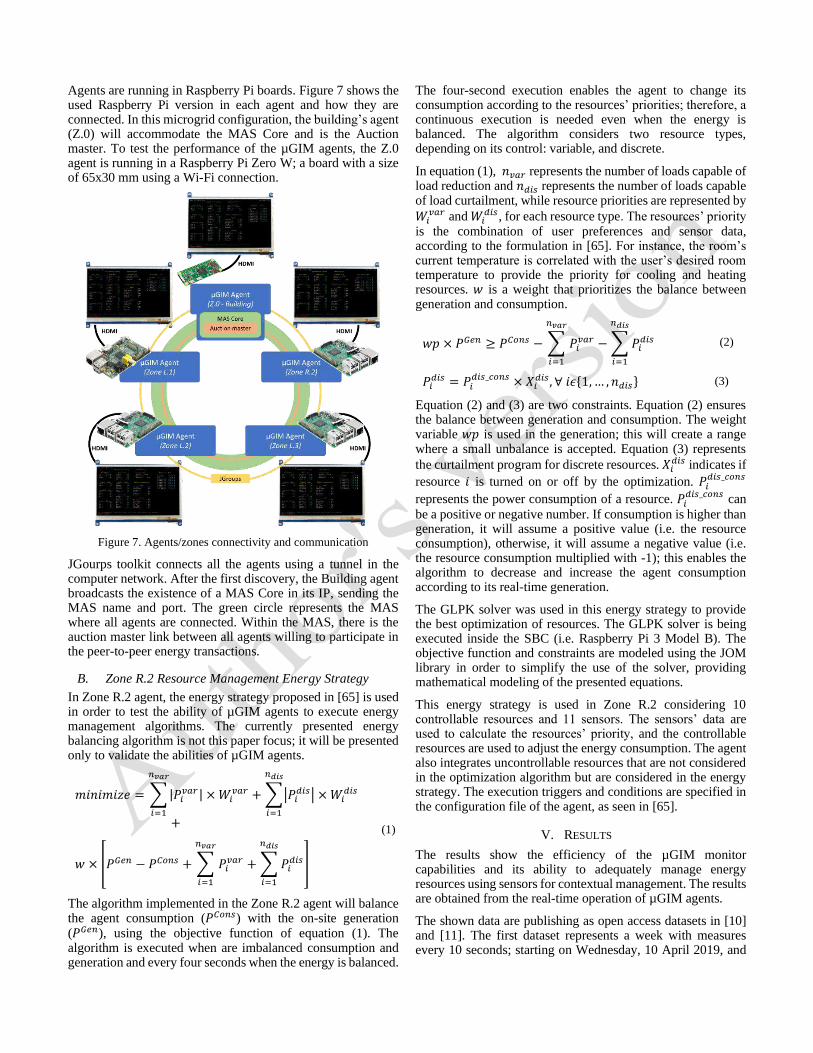
Agents are running in Raspberry Pi boards. Figure 7 shows the used Raspberry Pi version in each agent and how they are connected. In this microgrid configuration, the building’s agent (Z.0) will accommodate the MAS Core and is the Auction master. To test the performance of the µGIM agents, the Z.0 agent is running in a Raspberry Pi Zero W; a board with a size of 65x30 mm using a Wi-Fi connection.
Figure 7. Agents/zones connectivity and communication
JGourps toolkit connects all the agents using a tunnel in the computer network. After the first discovery, the Building agent broadcasts the existence of a MAS Core in its IP, sending the MAS name and port. The green circle represents the MAS where all agents are connected. Within the MAS, there is the auction master link between all agents willing to participate in the peer-to-peer energy transactions.
B. Zone R.2 Resource Management Energy Strategy
In Zone R.2 agent, the energy strategy proposed in [65] is used in order to test the ability of µGIM agents to execute energy management algorithms. The currently presented energy balancing algorithm is not this paper focus; it will be presented only to validate the abilities of µGIM agents.
𝑚𝑖𝑛𝑖𝑚𝑖𝑧𝑒 = ∑ |𝑃𝑖𝑣𝑎𝑟| × 𝑊𝑖
𝑣𝑎𝑟
𝑛𝑣𝑎𝑟
𝑖=1
+ ∑|𝑃𝑖𝑑𝑖𝑠| × 𝑊𝑖
𝑑𝑖𝑠
𝑛𝑑𝑖𝑠
𝑖=1+
𝑤 × [𝑃𝐺𝑒𝑛 − 𝑃𝐶𝑜𝑛𝑠 + ∑ 𝑃𝑖𝑣𝑎𝑟
𝑛𝑣𝑎𝑟
𝑖=1
+ ∑ 𝑃𝑖𝑑𝑖𝑠
𝑛𝑑𝑖𝑠
𝑖=1
]
(1)
The algorithm implemented in the Zone R.2 agent will balance the agent consumption (𝑃𝐶𝑜𝑛𝑠) with the on-site generation (𝑃𝐺𝑒𝑛), using the objective function of equation (1). The algorithm is executed when are imbalanced consumption and generation and every four seconds when the energy is balanced.
The four-second execution enables the agent to change its consumption according to the resources’ priorities; therefore, a continuous execution is needed even when the energy is balanced. The algorithm considers two resource types, depending on its control: variable, and discrete.
In equation (1), 𝑛𝑣𝑎𝑟 represents the number of loads capable of load reduction and 𝑛𝑑𝑖𝑠 represents the number of loads capable of load curtailment, while resource priorities are represented by
𝑊𝑖𝑣𝑎𝑟 and 𝑊𝑖
𝑑𝑖𝑠, for each resource type. The resources’ priority is the combination of user preferences and sensor data, according to the formulation in [65]. For instance, the room’s current temperature is correlated with the user’s desired room temperature to provide the priority for cooling and heating resources. 𝑤 is a weight that prioritizes the balance between generation and consumption.
𝑤𝑝 × 𝑃𝐺𝑒𝑛 ≥ 𝑃𝐶𝑜𝑛𝑠 − ∑ 𝑃𝑖𝑣𝑎𝑟
𝑛𝑣𝑎𝑟
𝑖=1
− ∑ 𝑃𝑖𝑑𝑖𝑠
𝑛𝑑𝑖𝑠
𝑖=1
(2)
𝑃𝑖𝑑𝑖𝑠 = 𝑃𝑖
𝑑𝑖𝑠_𝑐𝑜𝑛𝑠 × 𝑋𝑖𝑑𝑖𝑠, ∀ 𝑖𝜖{1, … , 𝑛𝑑𝑖𝑠} (3)
Equation (2) and (3) are two constraints. Equation (2) ensures the balance between generation and consumption. The weight variable 𝑤𝑝 is used in the generation; this will create a range where a small unbalance is accepted. Equation (3) represents
the curtailment program for discrete resources. 𝑋𝑖𝑑𝑖𝑠 indicates if
resource 𝑖 is turned on or off by the optimization. 𝑃𝑖𝑑𝑖𝑠_𝑐𝑜𝑛𝑠
represents the power consumption of a resource. 𝑃𝑖𝑑𝑖𝑠_𝑐𝑜𝑛𝑠
can
be a positive or negative number. If consumption is higher than generation, it will assume a positive value (i.e. the resource consumption), otherwise, it will assume a negative value (i.e. the resource consumption multiplied with -1); this enables the algorithm to decrease and increase the agent consumption according to its real-time generation.
The GLPK solver was used in this energy strategy to provide the best optimization of resources. The GLPK solver is being executed inside the SBC (i.e. Raspberry Pi 3 Model B). The objective function and constraints are modeled using the JOM library in order to simplify the use of the solver, providing mathematical modeling of the presented equations.
This energy strategy is used in Zone R.2 considering 10 controllable resources and 11 sensors. The sensors’ data are used to calculate the resources’ priority, and the controllable resources are used to adjust the energy consumption. The agent also integrates uncontrollable resources that are not considered in the optimization algorithm but are considered in the energy strategy. The execution triggers and conditions are specified in the configuration file of the agent, as seen in [65].
V. RESULTS
The results show the efficiency of the µGIM monitor capabilities and its ability to adequately manage energy resources using sensors for contextual management. The results are obtained from the real-time operation of µGIM agents.
The shown data are publishing as open access datasets in [10] and [11]. The first dataset represents a week with measures every 10 seconds; starting on Wednesday, 10 April 2019, and

ending on Tuesday, 15 April 2019. The charts have in the xx axis the hours of each day, the days can be identified by the generation peaks. The monitoring data are shown in Figures 8, 9, 10, 11, 12 and 13. The data showed a significant generation decrease in the weekend (fourth and fifth days in each chart).
The monitoring data were read from the PostgreSQL remote storage server. Meaning that the data were read in the agent, stayed in the local storage database in the agent, and then sent to the remote storage server.
Figure 8 shows the energy data from the Zone Z.0 agent. This agent is responsible for the building, managing the common areas as well as rooms 10, 11 and 16. Being the building’s owner, this agent is also responsible for managing a 6 kW photovoltaic panels array. From consumptions it is possible to observe the presence of persons even during the weekend (fourth and fifth days of the graphs). Only on Sunday the consumption of the common right area is smaller. Because it has a peak of photovoltaic of 6 kW, this agent has more generation than consumption during the middle of the day.
Zone L.1 data are shown in Figure 9. During the recorded week this agent is not self-sustainable, always demanding energy from the grid. The major consumption of this agent results from the electrical sockets (brown line). By matching the consumptions of the lamps with the weekend consumption of Figure 8 it is possible to see that the person(s) that used the building during the weekend was working in Zone L.1.
Figure 10 shows the energy data from the Zone L.2 agent, where a server room is placed. For the agent of Zone L.2, the main consumption comes from the HVAC system that is connected to the server room; ensuring a stable temperature along the days. The presented graphs represent power and not energy. By looking at the power, it is noticed that the agent has small periods of time that it has more generation than consumption, but looking at energy per hour, the agent always demands energy from the grid.
Figure 11 shows the data of the Zone L.3 agent. This agent has periods, during the middle of the day, where consumption is lower than generation. The consumption is stable, but it is visible the HVAC system left turned on during the first night, from the first day to the seconds day. A curiosity of this zone is the no use of lamps. The persons in this zone prefer not having artificial light while working.
The most self-sustainable agent is the Zone R.2 agent shown in Figure 12. With the lowest consumption, this agent has the champion of injecting energy into the grid. The use of the lights during the day reflects the use of the zone during the weekdays.
Zone R.2 has 11 sensors installed, some of these data can be seen in Figure 13. All sensors are available in the published dataset [10]. In the last two days (Monday and Tuesday) a shot-time peak of light occurs in the morning near 8:15. This light peak is caused by the cleaning services collecting the garbage. During the week, it is also visible a trend related to the increase of the temperature, above normal, when there are persons inside the room.
Figure 8. Energy data read in Zone Z.0 agent
Figure 9. Energy data read in Zone L.1 agent

Figure 10. Energy data read in Zone L.2 agent
Figure 11. Energy data read in Zone L.3 agent
Figure 12. Energy data read in Zone R.2 agent
Figure 13. Sensor data read in Zone R.2 agent
The data from Figure 14 are part of the dataset published in [11]. The dataset has data regarding the Zone R.2 agent during a 24-hour period with the balancing algorithm described in section IV.B of this paper. The measurements of the dataset were taken every 10 seconds, during the 24-hour period. Figure 14 shows the balancing algorithm working between 16:00 and 18:00 of a weekday. The consumption, represented by the blue line, follows the generation, represented by the green line. The algorithm, executed in GLPK solver using 10 resources and 11 sensors, is able to calculate the resources’ priorities according to the user’s preferences and optimize the consumption following the generation profile, decreasing the need for external energy supply. In Figure 14, the consumption decreases at the same rate as the generation, but near 16:50 the consumption increases because generation also increases, meaning that the algorithm is able to decrease and increase the consumption according to the generation available onsite. During the period shown in Figure 14, only at 17:11 it was necessary to buy energy from the grid to serve the high consumption peak, resulted from the fan heater; almost immediately turned off by the balancing algorithm.
Figure 14. Balance algorithm in Zone R.2 agent
VI. DISCUSSION AND CONCLUSION
The deployment and daily use of microgrids are a reality. They bring advantages for smart grids and have positive impacts in isolated areas. However, there is a lack of the offer of complete solutions for microgrid operation. There are in the market solutions for equipment synchronization and inverters that made microgrids possible, but management solutions are not easy to find and usually operate using centralized control. Currently, there is a significant gap between academic concepts and the physical implementations of microgrids; there are a few

microgrids that try to minimize this gap, but they are not yet commonly used in practice.
The proposed solution, µGIM, brings a layered and dynamic architecture that can serve the real implementations while keeping a door open for the integration and adoption of new and disruptive approaches. µGIM is a totally distributed agent approach solution that looks and treats a microgrid as a community of individual players that can collaborate and compete in the microgrid environment.
Similar solutions such as VOLTTRON and RIAPS are discussed in this paper. These open-source solutions are similar to µGIM regarding their ability to run in single-board computers, their multi-agent approach and their end-user participation in the microgrid. However, the µGIM platform is designed having the individual end-user as the central focus, providing better resource integration and individual operation inside a microgrid environment. The µGIM agents can be deployed as a standalone solution in an isolated building outside a microgrid and the user can take advantage of its management and optimization capabilities, while VOLTRRON and RIAPS were built for multi-agent systems only, not providing standalone solutions for a single end-user. The ability to work as a standalone solution allows the adoption of µGIM agents in end-users that are not yet integrated in a multi-agent µGIM microgrid. Otherwise, the dissemination of µGIM will be limited to the number of players in microgrids using the µGIM platform.
This paper shows the promising results of two open access datasets that use raw data from the µGIM platform. The third dataset regarding transactive energy can also be found in [66]. Detailed data and the capability of providing a balancing algorithm in real-time demonstrate clear evidence of the efficiency and potential of µGIM for player and microgrid operation. Collaborative and cooperative agent behavior is not discussed in this paper – because the focus is the µGIM platform architecture and how it can be deployed in real microgrids.
The µGIM platform is not, at this time, an open-source software because the code is not published for everyone. However, and following the VOLTTRON and RIAPS roadmap, the authors are planning to make µGIM platform also available for public access using an open source repository with the appropriate documentation for µGIM deployment. Making µGIM an open source software can also benefit its development; because more developers can contribute to µGIM, namely in what regards IoT resource integration, energy strategies, and transactive energy.
The novelty of the proposed µGIM platform and its capabilities are the main contributions of this paper. The shown results are highly promising. By using single-board computers, smaller as Raspberry Pi Zero W, the µGIM agents demonstrate to be very hardware efficient while capable to run 24/7 without significant issues. The small size of the hardware used allows the deployment of µGIM agents virtually anywhere.
ACKNOWLEDGMENTS
This work has received funding from the European Union's Horizon 2020 research and innovation programme under project DOMINOES (grant agreement No 771066) and from
FEDER Funds through COMPETE program and from National Funds through FCT under the project UID/EEA/00760/2019 and SFRH/BD/109248/2015.
REFERENCES
[1] L. Martirano, E. Habib, G. Parise, G. Greco, M. Manganelli, F. Massarella, and L. Parise, "Demand Side Management in Micro-grids for
Load Control in Nearly Zero Energy Buildings," IEEE Transactions on
Industry Applications, vol. PP, pp.1-1, Feb. 2017. [2] C. Marnay, S. Chatzivasileiadis, C. Abbey, R. Iravani, G. Joos, P.
Lombardi, P. Mancarella, and J. von Appen, "Microgrid Evolution
Roadmap," in Proc. 2015 International Symposium on Smart Electric Distribution Systems and Technologies (EDST), pp. 139-144.
[3] B. Washom, J. Dilliot, D. Weil, J. Kleissl, N. Balac, W. Torre, and C.
Richter, "Ivory Tower of Power: Microgrid Implementation at the University of California, San Diego," IEEE Power and Energy
Magazine, vol. 11, pp. 28-32, July-Aug. 2013.
[4] LO3ENERGY, “EXERGY – Business Whitepaper”, 24 April 2018
(accessed 29/03/2019) https://lo3energy.com/wp-
content/uploads/2018/04/Exergy-BIZWhitepaper-v11.pdf
[5] K. Hirose, "Behavior of the Sendai Microgrid during and after the 311 Great East Japan Disaster," in Proc. 2013 35th International
Telecommunications Energy Conference, SMART POWER AND
EFFICIENCY, pp. 1-6. [6] Bo Zhao, Jian Chen, Leiqi Zhang, Xuesong Zhang, Ruwen Qin,
Xiangning Lin, “Three representative island microgrids in the East China
Sea: Key technologies and experiences,” Renewable and Sustainable Energy Reviews, Volume 96, 2018, Pages 262-274. doi:
10.1016/j.rser.2018.07.051
[7] Steven J. Johnston, Philip J. Basford, Colin S. Perkins, Herry Herry, Fung Po Tso, Dimitrios Pezaros, Robert D. Mullins, Eiko Yoneki, Simon
J. Cox, Jeremy Singer, “Commodity single board computer clusters and
their applications,” Future Generation Computer Systems, Volume 89, 2018, Pages 201-212. doi: 10.1016/j.future.2018.06.048
[8] Vladimir Vujović, Mirjana Maksimović, “Raspberry Pi as a Sensor Web
node for home automation,” Computers & Electrical Engineering,
Volume 44, 2015, Pages 153-171. doi:
10.1016/j.compeleceng.2015.01.019
[9] M. H. Cintuglu, T. Youssef and O. A. Mohammed, "Development and Application of a Real-Time Testbed for Multiagent System
Interoperability: A Case Study on Hierarchical Microgrid Control," in
IEEE Transactions on Smart Grid, vol. 9, no. 3, pp. 1759-1768, May 2018. doi: 10.1109/TSG.2016.2599265
[10] L. Gomes, “uGIM: week monitorization data of a microgrid with five
agents (10/04/19-16/04/19)”, (Version 1.0) [Data set]. Zenodo, 2019. Doi: 10.5281/zenodo.2868129.
[11] L. Gomes, “Dataset of uGIM deployed in an office building,”, Zenodo,
2019 doi: 10.5281/zenodo.2565289 [12] Farhan H. Malik, Matti Lehtonen, “A review: Agents in smart grids,”
Electric Power Systems Research, Volume 131, 2016, Pages 71-79,
https://doi.org/10.1016/j.epsr.2015.10.004 [13] Pedro Oliveira, Zita Vale, Hugo Morais, Tiago Pinto, Isabel Praça, “A
multi-agent based approach for intelligent smart grid management,”
IFAC Proceedings Volumes, Volume 45, Issue 21, 2012, Pages 109-114.
doi: 10.3182/20120902-4-FR-2032.00021
[14] L. Gomes, P. Faria, H. Morais, Z. Vale and C. Ramos, "Distributed,
Agent-Based Intelligent System for Demand Response Program Simulation in Smart Grids," in IEEE Intelligent Systems, vol. 29, no. 1,
pp. 56-65, Jan.-Feb. 2014. doi: 10.1109/MIS.2013.2 [15] Z. Vale, T. Pinto, I. Praca and H. Morais, "MASCEM: Electricity
Markets Simulation with Strategic Agents," in IEEE Intelligent Systems,
vol. 26, no. 2, pp. 9-17, March-April 2011. doi: 10.1109/MIS.2011.3 [16] P. Oliveira, T. Pinto, H. Morais and Z. Vale, "MASGriP — A Multi-
Agent Smart Grid Simulation Platform," 2012 IEEE Power and Energy
Society General Meeting, San Diego, CA, 2012, pp. 1-8. doi: 10.1109/PESGM.2012.6345649
[17] L. Gomes, P. Faria, Z. A. Vale and J. Silva, "Energy Analyzer Emulator
for Microgrid Implementation and Demonstration and Respective Gateway," in IEEE Transactions on Industry Applications, vol. 55, no.
1, pp. 134-144, Jan.-Feb. 2019. doi: 10.1109/TIA.2018.2866451

[18] T. Logenthiran, D. Srinivasan, A. M. Khambadkone and H. N. Aung,
"Multiagent System for Real-Time Operation of a Microgrid in Real-
Time Digital Simulator," in IEEE Transactions on Smart Grid, vol. 3, no. 2, pp. 925-933, June 2012. doi: 10.1109/TSG.2012.2189028
[19] N. Yorino, Y. Zoka, M. Watanabe and T. Kurushima, "An Optimal
Autonomous Decentralized Control Method for Voltage Control Devices by Using a Multi-Agent System," in IEEE Transactions on Power
Systems, vol. 30, no. 5, pp. 2225-2233, Sept. 2015. doi:
10.1109/TPWRS.2014.2364193 [20] W. Liu, W. Gu, W. Sheng, X. Meng, Z. Wu and W. Chen, "Decentralized
Multi-Agent System-Based Cooperative Frequency Control for
Autonomous Microgrids With Communication Constraints," in IEEE Transactions on Sustainable Energy, vol. 5, no. 2, pp. 446-456, April
2014. doi: 10.1109/TSTE.2013.2293148 [21] A. Anvari-Moghaddam, A. Rahimi-Kian, M. S. Mirian, J. M. Guerrero,
“A multi-agent based energy management solution for integrated
buildings and microgrid system”, Applied Energy, Volume 203, 2017, Pages 41-56. doi: 10.1016/j.apenergy.2017.06.007.
[22] A. Anvari-Moghaddam, J. M. Guerrero, A. Rahimi-Kian and M. S.
Mirian, "Optimal real-time dispatch for integrated energy systems: An
ontology-based multi-agent approach," 2016 IEEE 7th International
Symposium on Power Electronics for Distributed Generation Systems
(PEDG), Vancouver, BC, 2016, pp. 1-7. doi: 10.1109/PEDG.2016.7526997
[23] R. de Azevedo, M. H. Cintuglu, T. Ma and O. A. Mohammed,
"Multiagent-Based Optimal Microgrid Control Using Fully Distributed Diffusion Strategy," in IEEE Transactions on Smart Grid, vol. 8, no. 4,
pp. 1997-2008, July 2017. doi: 10.1109/TSG.2016.2587741
[24] M. Mao, P. Jin, N. D. Hatziargyriou and L. Chang, "Multiagent-Based Hybrid Energy Management System for Microgrids," in IEEE
Transactions on Sustainable Energy, vol. 5, no. 3, pp. 938-946, July
2014. doi: 10.1109/TSTE.2014.2313882 [25] C. Dou, D. Yue, X. Li and Y. Xue, "MAS-Based Management and
Control Strategies for Integrated Hybrid Energy System," in IEEE
Transactions on Industrial Informatics, vol. 12, no. 4, pp. 1332-1349, Aug. 2016. doi: 10.1109/TII.2016.2569506
[26] M. Yazdanian and A. Mehrizi-Sani, "Distributed Control Techniques in
Microgrids," in IEEE Transactions on Smart Grid, vol. 5, no. 6, pp. 2901-2909, Nov. 2014. doi: 10.1109/TSG.2014.2337838
[27] E. Amicarelli, Q. T. Tran and S. Bacha, "Multi-agent system for day-
ahead energy management of microgrid," 2016 18th European Conference on Power Electronics and Applications (EPE'16 ECCE
Europe), Karlsruhe, 2016, pp. 1-10. doi: 10.1109/EPE.2016.7695257
[28] S. Drakontaidis, M. Stanchi, G. Glazer, J. Hussey, A. S. Leger and S. J. Matthews, "Towards Energy-Proportional Anomaly Detection in the
Smart Grid," 2018 IEEE High Performance extreme Computing
Conference (HPEC), Waltham, MA, 2018, pp. 1-7. doi: 10.1109/HPEC.2018.8547695
[29] L. Zhang, J. Xiao, P. Wang and X. Pan, "Design and implementation of
communication network for modular microgrid based power park," 2016 IEEE Innovative Smart Grid Technologies - Asia (ISGT-Asia),
Melbourne, VIC, 2016, pp. 160-165. doi: 10.1109/ISGT-
Asia.2016.7796379 [30] J. Xiao, P. Wang, L. Setyawan and Q. Xu, "Multi-Level Energy
Management System for Real-Time Scheduling of DC Microgrids With
Multiple Slack Terminals," in IEEE Transactions on Energy Conversion, vol. 31, no. 1, pp. 392-400, March 2016. doi:
10.1109/TEC.2015.2488639
[31] The Linux Foundation, The Linux Foundation Launches LF ENERGY, New Open Source Coalition, 12 July 2018. Available (accessed
12/04/2019): https://www.linuxfoundation.org/press-
release/2018/07/the-linux-foundation-launches-lf-energy-new-open-source-coalition/
[32] S. Eisele, I. Mardari, A. Dubey and G. Karsai, "RIAPS: Resilient Information Architecture Platform for Decentralized Smart Systems,"
2017 IEEE 20th International Symposium on Real-Time Distributed
Computing (ISORC), Toronto, ON, 2017, pp. 125-132. doi: 10.1109/ISORC.2017.22
[33] W. R. Otte, A. Dubey, S. Pradhan, P. Patil, A. Gokhale, G. Karsai, andJ.
Willemsen, “F6COM: A Component Model for Resource-Constrained and Dynamic Space-Based Computing Environment,” in Proceedings of
the 16th IEEE International Symposium on Object-oriented Real-time
Distributed Computing (ISORC’13), Paderborn, Germany, Jun. 2013.
[34] A. Dubey, G. Karsai, and N. Mahadevan, “A Component Model for Hard Real-time Systems: CCM with ARINC-653,” Software:
Practiceand Experience, vol. 41, no. 12, pp. 1517–1550, 2011.
[35] Y. Du, H. Tu, S. Lukic, A. Dubey and G. Karsai, "Distributed Microgrid Synchronization Strategy Using a Novel Information Architecture
Platform," 2018 IEEE Energy Conversion Congress and Exposition
(ECCE), Portland, OR, 2018, pp. 2060-2066. doi: 10.1109/ECCE.2018.8557695
[36] H. Tu et al., "An Adaptive Interleaving Algorithm for Multi-Converter
Systems," 2018 9th IEEE International Symposium on Power Electronics for Distributed Generation Systems (PEDG), Charlotte, NC,
2018, pp. 1-7. doi: 10.1109/PEDG.2018.8447801 [37] S. Eisele, A. Dubey, G. Karsai and S. Lukic, "WiP Abstract: Transactive
Energy Demo with RIAPS Platform," 2017 ACM/IEEE 8th International
Conference on Cyber-Physical Systems (ICCPS), Pittsburgh, PA, 2017, pp. 91-92.
[38] B. Akyol, C.H. Allwardt, Z.W. Beech, J.B. Chapman, J.N. Haack, S.
Katipamula, R.G. Lutes, K.E. Monson, “VOLTTRONtm 2016”, June
2016, PNNL-25499 (accessed 23/03/2019)
https://volttron.org/sites/default/files/publications/PNNL-
25499_VOLTTRON_2016.pdf [39] VOLTTRON team, “Agents in the Platform”, (accessed 12/04/2019)
https://volttron.readthedocs.io/en/develop/overview/agents-
overview.html [40] Majid Karami, Gabrielle Viola McMorrow, Liping Wang, “Continuous
monitoring of indoor environmental quality using an Arduino-based data
acquisition system,” Journal of Building Engineering, Volume 19, 2018, Pages 412-419. doi: 10.1016/j.jobe.2018.05.014
[41] S. Katipamula, J. Haack, G. Hernandez, B. Akyol and J. Hagerman,
"VOLTTRON: An Open-Source Software Platform of the Future," in IEEE Electrification Magazine, vol. 4, no. 4, pp. 15-22, Dec. 2016. doi:
10.1109/MELE.2016.2614178
[42] Sen Huang, Weimin Wang, Michael R. Brambley, Siddharth Goyal, Wangda Zuo, “An agent-based hardware-in-the-loop simulation
framework for building controls,” Energy and Buildings, Volume 181,
2018, Pages 26-37. doi: 10.1016/j.enbuild.2018.09.038 [43] Sen Huang, Jianming Lian, He Hao, Srinivas Katipamula, “Transactive
Control Design for Commercial Buildings to Provide Demand
Response”, IFAC-PapersOnLine, Volume 51, Issue 34, 2019, Pages 151-156. doi: 10.1016/j.ifacol.2019.01.058
[44] H. Pourbabak, J. Luo, T. Chen and W. Su, "A Novel Consensus-Based
Distributed Algorithm for Economic Dispatch Based on Local Estimation of Power Mismatch," in IEEE Transactions on Smart Grid,
vol. 9, no. 6, pp. 5930-5942, Nov. 2018. doi:
10.1109/TSG.2017.2699084 [45] D. Raker, A. Sellers, R. Kini, M. Green, T. Stuart, R. Ellingson, R.
Khanna, M. Heben, "Grid Integration of Building Systems and 1 MW
Photovoltaic Array using VOLTTRON," 2017 IEEE 44th Photovoltaic Specialist Conference (PVSC), Washington, DC, 2017, pp. 2926-2930.
doi: 10.1109/PVSC.2017.8520928
[46] D. Raker, R. Kini, R. Huntsman, M. Green, O. Spaci, T. Stuart, R. Ellingson, R. Khanna, M. Heben, "Transactive Mitigation Of Variability
In The Output Of 1 MW Photovoltaic Array Using VolttronTM," 2018
IEEE 7th World Conference on Photovoltaic Energy Conversion (WCPEC) (A Joint Conference of 45th IEEE PVSC, 28th PVSEC & 34th
EU PVSEC), Waikoloa Village, HI, 2018, pp. 1462-1467. doi:
10.1109/PVSC.2018.8548242 [47] U. Herberg, D. Mashima, J. G. Jetcheva and S. Mirzazad-Barijough,
"OpenADR 2.0 deployment architectures: Options and implications,"
2014 IEEE International Conference on Smart Grid Communications (SmartGridComm), Venice, 2014, pp. 782-787. doi:
10.1109/SmartGridComm.2014.7007743 [48] Y. Han, K. Zhang, H. Li, E. A. A. Coelho and J. M. Guerrero, "MAS-
Based Distributed Coordinated Control and Optimization in Microgrid
and Microgrid Clusters: A Comprehensive Overview," in IEEE Transactions on Power Electronics, vol. 33, no. 8, pp. 6488-6508, Aug.
2018. doi: 10.1109/TPEL.2017.2761438
[49] Z. Li, C. Zang, P. Zeng, H. Yu and H. Li, "MAS based distributed automatic generation control for cyber-physical microgrid system," in

IEEE/CAA Journal of Automatica Sinica, vol. 3, no. 1, pp. 78-89, 10
January 2016. doi: 10.1109/JAS.2016.7373765
[50] F. Chen, M. Chen, Q. Li, K. Meng, J. M. Guerrero and D. Abbott, "Multiagent-Based Reactive Power Sharing and Control Model for
Islanded Microgrids," in IEEE Transactions on Sustainable Energy, vol.
7, no. 3, pp. 1232-1244, July 2016. doi: 10.1109/TSTE.2016.2539213 [51] F. H. Malik, M. Lehtonen, “A review: Agents in smart grids”, Electric
Power Systems Research, vol. 131, 2016, pp. 71-79. doi:
10.1016/j.epsr.2015.10.004 [52] dEF-Pi team, “dEF-Pi: Distributed Energy Flexibility Platform &
Interface”, [accessed on 13/06/2019] https://fan-
ci.sensorlab.tno.nl/builds/defpi-documentation/master/html/ [53] S. Drakontaidis, M. Stanchi, G. Glazer, J. Hussey, A. S. Leger and S. J.
Matthews, "Towards Energy-Proportional Anomaly Detection in the Smart Grid," 2018 IEEE High Performance extreme Computing
Conference (HPEC), Waltham, MA, 2018, pp. 1-7. doi:
10.1109/HPEC.2018.8547695 [54] S. J. Matthews and A. S. Leger, "Leveraging single board computers for
anomaly detection in the smart grid," 2017 IEEE 8th Annual Ubiquitous
Computing, Electronics and Mobile Communication Conference
(UEMCON), New York, NY, 2017, pp. 437-443. doi:
10.1109/UEMCON.2017.8249031
[55] J. Xiao, P. Wang, L. Setyawan and Q. Xu, "Multi-Level Energy Management System for Real-Time Scheduling of DC Microgrids With
Multiple Slack Terminals," in IEEE Transactions on Energy Conversion,
vol. 31, no. 1, pp. 392-400, March 2016. doi: 10.1109/TEC.2015.2488639
[56] L. Gomes, P. Faria, F. Silva and Z. Vale, "Energy Resources
Management Enabled by Internet of Things Devices," 2019 IEEE-APS Topical Conference on Antennas and Propagation in Wireless
Communications (APWC), Granada, Spain, 2019, pp. 258-263. doi:
10.1109/APWC.2019.8870442 [57] M. Bisadi, A. Akrami, S. Teimourzadeh, F. Aminifar, M. Kargahi and
M. Shahidehpour, "IoT-Enabled Humans in the Loop for Energy
Management Systems: Promoting Building Occupants' Participation in Optimizing Energy Consumption," in IEEE Electrification Magazine,
vol. 6, no. 2, pp. 64-72, June 2018. doi: 10.1109/MELE.2018.2816844
[58] F. G. Brundu et al., "IoT Software Infrastructure for Energy Management and Simulation in Smart Cities," in IEEE Transactions on Industrial
Informatics, vol. 13, no. 2, pp. 832-840, April 2017. doi:
10.1109/TII.2016.2627479 [59] A. Mahmood, A. Ahmad, H.T. Javed, Z. Mehmood, Z.A. Khan, U.
Qasim, N. Javaid "A Survey of 'User Comfort' in Home Energy
Management Systems in Smart Grid," 2015 IEEE 29th International Conference on Advanced Information Networking and Applications
Workshops, Gwangiu, 2015, pp. 36-43. doi: 10.1109/WAINA.2015.124
[60] M. H. Riaz, M. Zeeshan, Hasan-ul-Banna, T. Kamal and S. A. H. Shah, "Demand side management using different energy conservation
techniques," 2017 International Multi-topic Conference (INMIC),
Lahore, 2017, pp. 1-4. doi: 10.1109/INMIC.2017.8289460 [61] Vinagreet al., 2015 E. Vinagre, L. Gomes and Z. Vale, "Electrical
Energy Consumption Forecast Using External Facility Data," 2015 IEEE
Symposium Series on Computational Intelligence, Cape Town, 2015, pp. 659-664. doi: 10.1109/SSCI.2015.101
[62] M. A. A. Pedrasa, T. D. Spooner and I. F. MacGill, "Coordinated
Scheduling of Residential Distributed Energy Resources to Optimize Smart Home Energy Services," in IEEE Transactions on Smart Grid, vol.
1, no. 2, pp. 134-143, Sept. 2010. doi: 10.1109/TSG.2010.2053053
[63] J.S. Chou, D.S. Tran, “Forecasting energy consumption time series using machine learning techniques based on usage patterns of residential
householders”, Energy, vol. 165, Part B, 2018, pp. 709-726. doi:
10.1016/j.energy.2018.09.144 [64] M. Wei, S. H. Hong, M. Alam, “An IoT-based energy-management
platform for industrial facilities”, Applied Energy, vol. 164, 2016, pp. 607-619. doi: 10.1016/j.apenergy.2015.11.107
[65] L. Gomes, J. Spínola, Z. Vale, J. M. Corchado, “Agent-based
architecture for demand side management using real-time resources’ priorities and a deterministic optimization algorithm”, Journal of Cleaner
Production, Volume 241, 2019. doi: 10.1016/j.jclepro.2019.118154.
[66] L. Gomes, “uGIM: a week with peer-to-peer transactions (03/06/2019 - 09/06/2019)”, (Version 0.1.0) [Data set]. Zenodo, 2019. Doi:
10.5281/zenodo.3371222.

Luis Gomes
Multi-Agent Microgrid Management System for Single-Board Computers: A Case Study on Peer-to-
Peer Energy Trading
Authors: Luis Gomes, Zita Vale, and Juan M. Corchado
Published in: IEEE Access (IF: 4.098)
DOI: 10.1109/ACCESS.2020.2985254
Published at: April 2020
PhD timeline: M45

VOLUME XX, 2017 1
Date of publication xxxx 00, 0000, date of current version xxxx 00, 0000.
Digital Object Identifier 10.1109/ACCESS.2017.Doi Number
Multi-Agent Microgrid Management System for Single-board Computers: A Case Study on Peer-to-Peer Energy Trading
Luis Gomes1, Zita Vale2 and Juan M. Corchado345 1GECAD - Research Group on Intelligent Engineering and Computing for Advanced Innovation and Development, Polytechnic of Porto (IPP), Porto,
Portugal 2Polytechnic of Porto (IPP), Porto, Portugal 3BISITE research Group, University of Salamanca, Salamanca 37007, Spain 4Air Institute, IoT Digital Innovation Hub, Salamanca 37188, Spain 5Department of Electronics, Information and Communication, Osaka Institute of Technology, Osaka 535–8585, Japan
Corresponding author: Luis Gomes (e-mail: [email protected]).
ABSTRACT Smart grids concept benefits and leverage distributed management systems while allowing its
players to actively participate in the smart grid. This paper merges the concepts of microgrid and transactive
energy. The proposed model is tested in an office building with multiple tenants. An agent-based platform,
running in single-board computers, for microgrid intelligent management with a peer-to-peer energy
transaction model is proposed in this paper. This paper describes the peer-to-peer transaction auction model
and the deployment of the platform in an office building. The results regard a one-week period where the use
of peer-to-peer transactions is compared with a scenario where no transactions among agents are performed.
The results are promising, showing the energy price inside the microgrid dropping for the majority of
players/agents. The presented work demonstrates how smart grid players can decrease their energy costs
using simple approaches that do not require load shifting, consumption optimization nor the acquisition of
new equipment.
INDEX TERMS local energy auctions, microgrids, peer-to-peer transactions, transactive energy
I. INTRODUCTION
Power systems are becoming more distributed in what
regards the management and the participation of consumers.
This enables the emergence of smaller communities such as
microgrids, where local energy management is performed
using local energy demand and local renewable energy
sources. Depending on its configuration, a microgrid can
work connected to the grid or in islanded mode; i.e.
disconnected from the main grid.
The new power systems paradigm enables not only the
emergence of small communities but also empowers end-
users, that can manage their energy resources and actively
participate in the smart grid. End-users can take part in
demand response programs and energy transactions, which
can result in lower energy prices and enables the intensive
and widespread use of renewable energy sources.
The use of Transactive Energy (TE) allows buildings to
act as active players using a market-driven approach in the
scope of smart grids. The GridWise Architecture Council
defines TE as “a system of economic and control
mechanisms that allows the dynamic balance of supply and
demand across the entire electrical infrastructure using
value as a key operational parameter” [1]. Although
multiple definitions do exist, this one is sufficiently open to
cope with the current state of the art.
The concept of TE can be applied to any part or
component of power systems, from the transmission to the
distribution level, including distributed resources and
consumers. This concept includes the management of
generation and consumption to ensure the required constant
balance between them. This balance gain importance in the
frame of intensive use of renewable-based generation and
distributed generation with strong stochastic nature. TE also
enables smart homes and buildings to engage in automated
market-based trading in a two-way negotiation [2].
VOLUME XX, 2019 2
Smart devices, from IoT, are being spread in homes and
buildings worldwide. Only in 2007, and in the United States
alone, 35.9 million of these devices were sold; excluded from
this number are smart televisions [3]. It is expected that by
2022, 216.9 million homes worldwide will have at least one
smart device [4]. The vast massification of such devices with
remote monitoring and control capabilities opens new
possibilities for smart homes and energy management
systems. Therefore, they should be considered and integrated
into energy management systems.
Multi-agent systems (MAS) provide adequate
representation and operational support for distributed
intelligent environments. Agents can represent physical
devices and infrastructures, ranging from single sensors to
entire buildings. Some applications of MAS in microgrids
can be seen in [5-7], where multi-agent-based microgrid
management systems are proposed, enabling distributed
consensual optimizations [5], distributed cyber-physical
models for real-time tasks [6], and islanded microgrid
operation [7]. The use of MAS allows the individual agent-
representation of each microgrid player, enabling the
exchange of data and information among them. This allows
the build of distributed intelligent communities (e.g.
microgrids) able to compete and/or cooperate to achieve
individual and common goals.
The main novelties of this work are the proposal of a
decentralized peer-to-peer transaction model and its
implementation and deployment in a microgrid. The
decentralization of this model allows and incentivizes end-
users to compete among them to pursue their personal goals
(i.e. minimize costs) and allows the microgrid to pursue its
global goal (i.e. incentivize energy transaction among end-
users to decrease the need of external energy supply). It also
avoids the need for centralized or external players to manage
and decide peer-to-peer transactions among end-users. This
is enabled by the proposed use of µGIM multi-agent system
(MAS), where each microgrid player is represented by an
individual agent running in a single-board computer (SBC).
The main contribution, of this paper, is the detailed results
achieved by the peer-to-peer transaction model executed by
µGIM system. This MAS was designed focusing on the end-
user needs and allows the management of the end-users
facility while interacting with other players. This work
demonstrates that an end-user-oriented agent-based energy
management system, like µGIM, can also perform player
interaction and execute microgrid auctions for peer-to-peer
transactions.
The paper presents promising results using an office
building divided by four tenants where each one is a
prosumer; the building’s manager/owner is also represented
by an agent. The five agents/players have the liberty to
participate in the peer-to-peer auctions where they can sell
energy lots and make bids to energy lots. A distributed open
auction model is tested, without any centralized energy
management system.
After this first introductory section, the paper presents, in
section II, some of the most successful microgrid
implementations where transactive energy is a reality.
Section III presents the µGIM platform and section IV
presents the proposed transactive energy model. The
microgrid deployment is presented in section V and the main
results can be seen in section VI. Finally, the main
conclusions are presented in section VII.
II. MICROGRIDS AND TRANSACTIVE ENERGY
This section is divided into three topics: microgrids, MAS for
microgrids, and transactive energy. The first topic presents
microgrid deployments of success stories. In the second topic,
two open-source software platforms for microgrids and energy
management systems are presented. And the third topic
presents projects and real deployments where transactive
energy can be found.
A. MICROGRIDS
Universities have a good potential to adopt microgrids on
their campus for research and energy cost reduction.
Microgrids in University campus are therefore relatively
common. Two success stories are the New York University
[8] and the University of California in San Diego [9] where
savings range from 5 to 8 million US dollars, in New York,
and 8 million US dollars, in San Diego.
The capability, of microgrids, to work in islanded mode
(i.e. disconnected from the main grid) called the attention of
military bases, allowing them to be independent of the main
grid. Therefore, some pilots were implemented in military
bases, such as Camp Pendleton Microgrid with 530 kW of
photovoltaic peak generation [10], and Fort Carson
Microgrid with an outstanding 2 MW of photovoltaic peak
generation [11].
The Brooklyn microgrid is also a very interesting pilot that
is integrated into the community [12]. This pilot enables
peer-to-peer transactions at the end-user level, where end-
users can specify the price that they are willing to pay and
the type of energy source that they are willing to acquire; e.g.
pay more for solar generation. The possibility to specify
prices for each energy source, allows end-users to gain
control over the supplied energy. This microgrid integrates
prosumers and consumers. Blockchain is used, in the
microgrid, to build a complete distributed system among
end-users, without the need of a centralized player. End-
users use a mobile application to have control over the
energy that they want to sell and the energy they want to buy,
and how the operations are made. The Brooklyn microgrid
integrates around fifty end-users using Transactive Grid
elements (TAG-e meters) that enable virtual peer-to-peer
transactions using the utility grid [13].
B. MULTI-AGENT SYSTEMS FOR MICROGRIDS
The management of microgrids can be made using
VOLTTRON. Developed at Pacific Northwest National
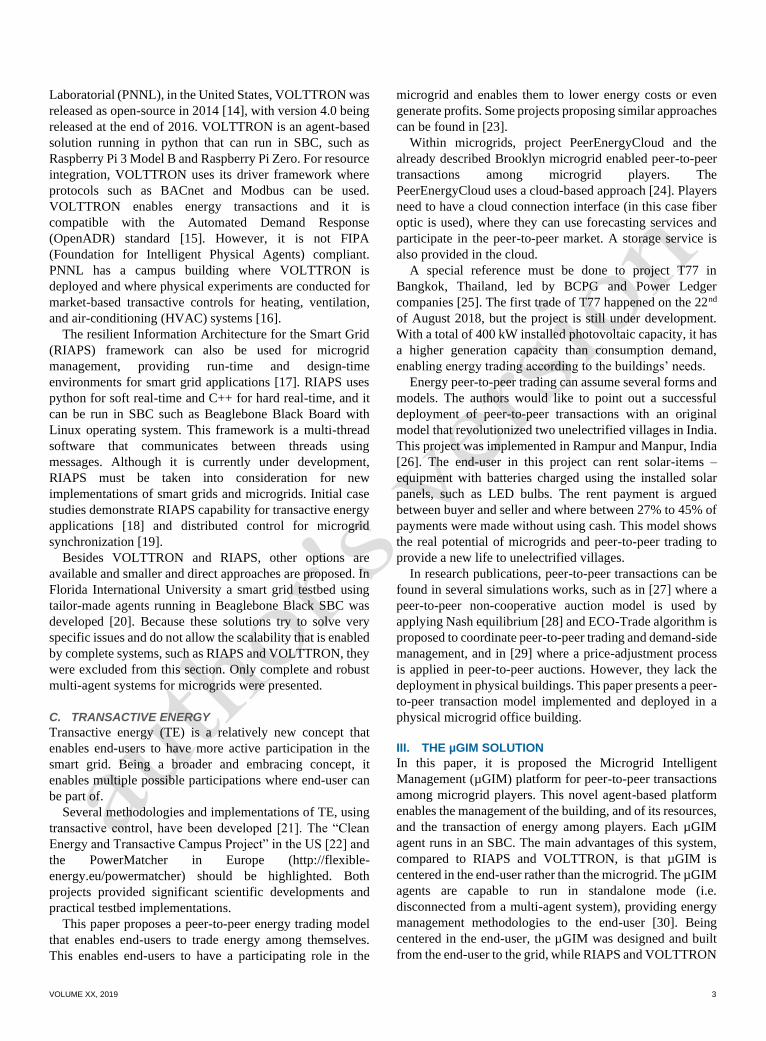
VOLUME XX, 2019 3
Laboratorial (PNNL), in the United States, VOLTTRON was
released as open-source in 2014 [14], with version 4.0 being
released at the end of 2016. VOLTTRON is an agent-based
solution running in python that can run in SBC, such as
Raspberry Pi 3 Model B and Raspberry Pi Zero. For resource
integration, VOLTTRON uses its driver framework where
protocols such as BACnet and Modbus can be used.
VOLTTRON enables energy transactions and it is
compatible with the Automated Demand Response
(OpenADR) standard [15]. However, it is not FIPA
(Foundation for Intelligent Physical Agents) compliant.
PNNL has a campus building where VOLTTRON is
deployed and where physical experiments are conducted for
market-based transactive controls for heating, ventilation,
and air-conditioning (HVAC) systems [16].
The resilient Information Architecture for the Smart Grid
(RIAPS) framework can also be used for microgrid
management, providing run-time and design-time
environments for smart grid applications [17]. RIAPS uses
python for soft real-time and C++ for hard real-time, and it
can be run in SBC such as Beaglebone Black Board with
Linux operating system. This framework is a multi-thread
software that communicates between threads using
messages. Although it is currently under development,
RIAPS must be taken into consideration for new
implementations of smart grids and microgrids. Initial case
studies demonstrate RIAPS capability for transactive energy
applications [18] and distributed control for microgrid
synchronization [19].
Besides VOLTTRON and RIAPS, other options are
available and smaller and direct approaches are proposed. In
Florida International University a smart grid testbed using
tailor-made agents running in Beaglebone Black SBC was
developed [20]. Because these solutions try to solve very
specific issues and do not allow the scalability that is enabled
by complete systems, such as RIAPS and VOLTTRON, they
were excluded from this section. Only complete and robust
multi-agent systems for microgrids were presented.
C. TRANSACTIVE ENERGY
Transactive energy (TE) is a relatively new concept that
enables end-users to have more active participation in the
smart grid. Being a broader and embracing concept, it
enables multiple possible participations where end-user can
be part of.
Several methodologies and implementations of TE, using
transactive control, have been developed [21]. The “Clean
Energy and Transactive Campus Project” in the US [22] and
the PowerMatcher in Europe (http://flexible-
energy.eu/powermatcher) should be highlighted. Both
projects provided significant scientific developments and
practical testbed implementations.
This paper proposes a peer-to-peer energy trading model
that enables end-users to trade energy among themselves.
This enables end-users to have a participating role in the
microgrid and enables them to lower energy costs or even
generate profits. Some projects proposing similar approaches
can be found in [23].
Within microgrids, project PeerEnergyCloud and the
already described Brooklyn microgrid enabled peer-to-peer
transactions among microgrid players. The
PeerEnergyCloud uses a cloud-based approach [24]. Players
need to have a cloud connection interface (in this case fiber
optic is used), where they can use forecasting services and
participate in the peer-to-peer market. A storage service is
also provided in the cloud.
A special reference must be done to project T77 in
Bangkok, Thailand, led by BCPG and Power Ledger
companies [25]. The first trade of T77 happened on the 22nd
of August 2018, but the project is still under development.
With a total of 400 kW installed photovoltaic capacity, it has
a higher generation capacity than consumption demand,
enabling energy trading according to the buildings’ needs.
Energy peer-to-peer trading can assume several forms and
models. The authors would like to point out a successful
deployment of peer-to-peer transactions with an original
model that revolutionized two unelectrified villages in India.
This project was implemented in Rampur and Manpur, India
[26]. The end-user in this project can rent solar-items –
equipment with batteries charged using the installed solar
panels, such as LED bulbs. The rent payment is argued
between buyer and seller and where between 27% to 45% of
payments were made without using cash. This model shows
the real potential of microgrids and peer-to-peer trading to
provide a new life to unelectrified villages.
In research publications, peer-to-peer transactions can be
found in several simulations works, such as in [27] where a
peer-to-peer non-cooperative auction model is used by
applying Nash equilibrium [28] and ECO-Trade algorithm is
proposed to coordinate peer-to-peer trading and demand-side
management, and in [29] where a price-adjustment process
is applied in peer-to-peer auctions. However, they lack the
deployment in physical buildings. This paper presents a peer-
to-peer transaction model implemented and deployed in a
physical microgrid office building.
III. THE µGIM SOLUTION
In this paper, it is proposed the Microgrid Intelligent
Management (µGIM) platform for peer-to-peer transactions
among microgrid players. This novel agent-based platform
enables the management of the building, and of its resources,
and the transaction of energy among players. Each µGIM
agent runs in an SBC. The main advantages of this system,
compared to RIAPS and VOLTTRON, is that µGIM is
centered in the end-user rather than the microgrid. The µGIM
agents are capable to run in standalone mode (i.e.
disconnected from a multi-agent system), providing energy
management methodologies to the end-user [30]. Being
centered in the end-user, the µGIM was designed and built
from the end-user to the grid, while RIAPS and VOLTTRON
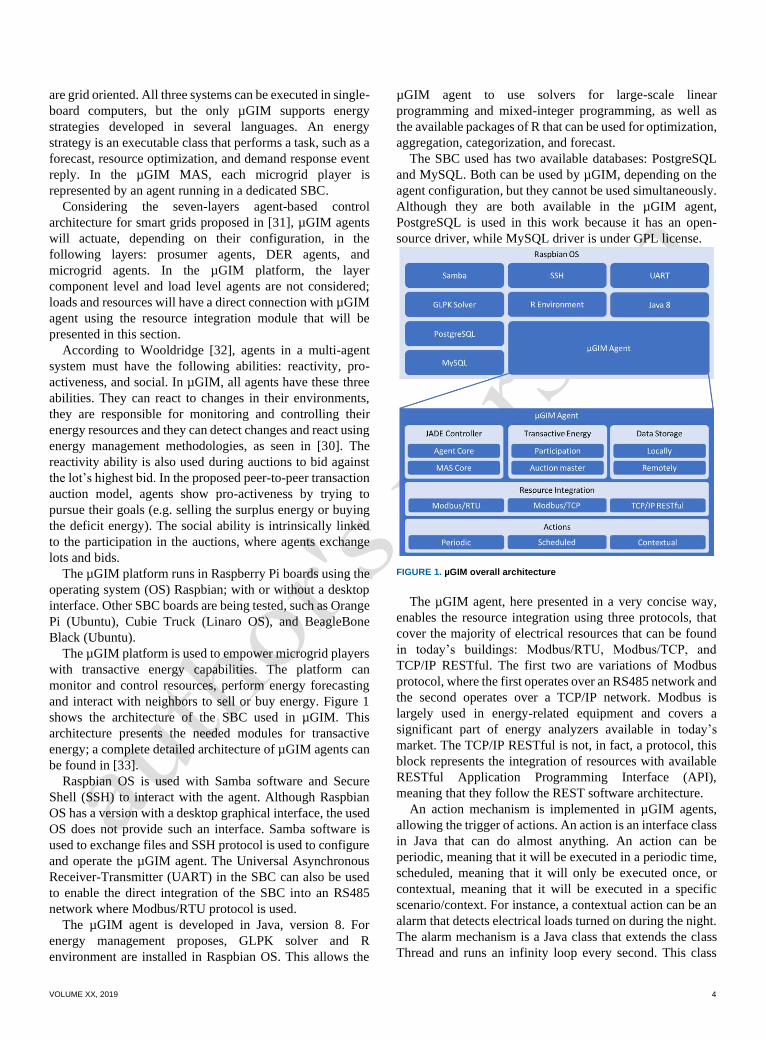
VOLUME XX, 2019 4
are grid oriented. All three systems can be executed in single-
board computers, but the only µGIM supports energy
strategies developed in several languages. An energy
strategy is an executable class that performs a task, such as a
forecast, resource optimization, and demand response event
reply. In the µGIM MAS, each microgrid player is
represented by an agent running in a dedicated SBC.
Considering the seven-layers agent-based control
architecture for smart grids proposed in [31], µGIM agents
will actuate, depending on their configuration, in the
following layers: prosumer agents, DER agents, and
microgrid agents. In the µGIM platform, the layer
component level and load level agents are not considered;
loads and resources will have a direct connection with µGIM
agent using the resource integration module that will be
presented in this section.
According to Wooldridge [32], agents in a multi-agent
system must have the following abilities: reactivity, pro-
activeness, and social. In µGIM, all agents have these three
abilities. They can react to changes in their environments,
they are responsible for monitoring and controlling their
energy resources and they can detect changes and react using
energy management methodologies, as seen in [30]. The
reactivity ability is also used during auctions to bid against
the lot’s highest bid. In the proposed peer-to-peer transaction
auction model, agents show pro-activeness by trying to
pursue their goals (e.g. selling the surplus energy or buying
the deficit energy). The social ability is intrinsically linked
to the participation in the auctions, where agents exchange
lots and bids.
The µGIM platform runs in Raspberry Pi boards using the
operating system (OS) Raspbian; with or without a desktop
interface. Other SBC boards are being tested, such as Orange
Pi (Ubuntu), Cubie Truck (Linaro OS), and BeagleBone
Black (Ubuntu).
The µGIM platform is used to empower microgrid players
with transactive energy capabilities. The platform can
monitor and control resources, perform energy forecasting
and interact with neighbors to sell or buy energy. Figure 1
shows the architecture of the SBC used in µGIM. This
architecture presents the needed modules for transactive
energy; a complete detailed architecture of µGIM agents can
be found in [33].
Raspbian OS is used with Samba software and Secure
Shell (SSH) to interact with the agent. Although Raspbian
OS has a version with a desktop graphical interface, the used
OS does not provide such an interface. Samba software is
used to exchange files and SSH protocol is used to configure
and operate the µGIM agent. The Universal Asynchronous
Receiver-Transmitter (UART) in the SBC can also be used
to enable the direct integration of the SBC into an RS485
network where Modbus/RTU protocol is used.
The µGIM agent is developed in Java, version 8. For
energy management proposes, GLPK solver and R
environment are installed in Raspbian OS. This allows the
µGIM agent to use solvers for large-scale linear
programming and mixed-integer programming, as well as
the available packages of R that can be used for optimization,
aggregation, categorization, and forecast.
The SBC used has two available databases: PostgreSQL
and MySQL. Both can be used by µGIM, depending on the
agent configuration, but they cannot be used simultaneously.
Although they are both available in the µGIM agent,
PostgreSQL is used in this work because it has an open-
source driver, while MySQL driver is under GPL license.
FIGURE 1. µGIM overall architecture
The µGIM agent, here presented in a very concise way,
enables the resource integration using three protocols, that
cover the majority of electrical resources that can be found
in today’s buildings: Modbus/RTU, Modbus/TCP, and
TCP/IP RESTful. The first two are variations of Modbus
protocol, where the first operates over an RS485 network and
the second operates over a TCP/IP network. Modbus is
largely used in energy-related equipment and covers a
significant part of energy analyzers available in today’s
market. The TCP/IP RESTful is not, in fact, a protocol, this
block represents the integration of resources with available
RESTful Application Programming Interface (API),
meaning that they follow the REST software architecture.
An action mechanism is implemented in µGIM agents,
allowing the trigger of actions. An action is an interface class
in Java that can do almost anything. An action can be
periodic, meaning that it will be executed in a periodic time,
scheduled, meaning that it will only be executed once, or
contextual, meaning that it will be executed in a specific
scenario/context. For instance, a contextual action can be an
alarm that detects electrical loads turned on during the night.
The alarm mechanism is a Java class that extends the class
Thread and runs an infinity loop every second. This class
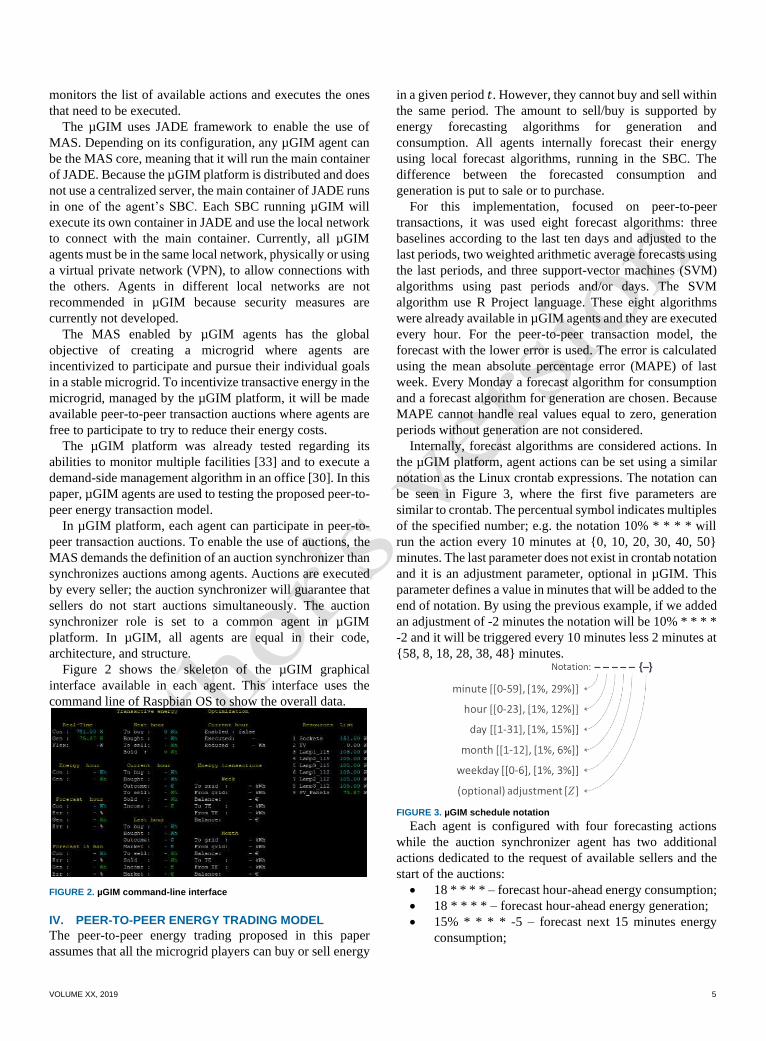
VOLUME XX, 2019 5
monitors the list of available actions and executes the ones
that need to be executed.
The µGIM uses JADE framework to enable the use of
MAS. Depending on its configuration, any µGIM agent can
be the MAS core, meaning that it will run the main container
of JADE. Because the µGIM platform is distributed and does
not use a centralized server, the main container of JADE runs
in one of the agent’s SBC. Each SBC running µGIM will
execute its own container in JADE and use the local network
to connect with the main container. Currently, all µGIM
agents must be in the same local network, physically or using
a virtual private network (VPN), to allow connections with
the others. Agents in different local networks are not
recommended in µGIM because security measures are
currently not developed.
The MAS enabled by µGIM agents has the global
objective of creating a microgrid where agents are
incentivized to participate and pursue their individual goals
in a stable microgrid. To incentivize transactive energy in the
microgrid, managed by the µGIM platform, it will be made
available peer-to-peer transaction auctions where agents are
free to participate to try to reduce their energy costs.
The µGIM platform was already tested regarding its
abilities to monitor multiple facilities [33] and to execute a
demand-side management algorithm in an office [30]. In this
paper, µGIM agents are used to testing the proposed peer-to-
peer energy transaction model.
In µGIM platform, each agent can participate in peer-to-
peer transaction auctions. To enable the use of auctions, the
MAS demands the definition of an auction synchronizer than
synchronizes auctions among agents. Auctions are executed
by every seller; the auction synchronizer will guarantee that
sellers do not start auctions simultaneously. The auction
synchronizer role is set to a common agent in µGIM
platform. In µGIM, all agents are equal in their code,
architecture, and structure.
Figure 2 shows the skeleton of the µGIM graphical
interface available in each agent. This interface uses the
command line of Raspbian OS to show the overall data.
FIGURE 2. µGIM command-line interface
IV. PEER-TO-PEER ENERGY TRADING MODEL
The peer-to-peer energy trading proposed in this paper
assumes that all the microgrid players can buy or sell energy
in a given period 𝑡. However, they cannot buy and sell within
the same period. The amount to sell/buy is supported by
energy forecasting algorithms for generation and
consumption. All agents internally forecast their energy
using local forecast algorithms, running in the SBC. The
difference between the forecasted consumption and
generation is put to sale or to purchase.
For this implementation, focused on peer-to-peer
transactions, it was used eight forecast algorithms: three
baselines according to the last ten days and adjusted to the
last periods, two weighted arithmetic average forecasts using
the last periods, and three support-vector machines (SVM)
algorithms using past periods and/or days. The SVM
algorithm use R Project language. These eight algorithms
were already available in µGIM agents and they are executed
every hour. For the peer-to-peer transaction model, the
forecast with the lower error is used. The error is calculated
using the mean absolute percentage error (MAPE) of last
week. Every Monday a forecast algorithm for consumption
and a forecast algorithm for generation are chosen. Because
MAPE cannot handle real values equal to zero, generation
periods without generation are not considered.
Internally, forecast algorithms are considered actions. In
the µGIM platform, agent actions can be set using a similar
notation as the Linux crontab expressions. The notation can
be seen in Figure 3, where the first five parameters are
similar to crontab. The percentual symbol indicates multiples
of the specified number; e.g. the notation 10% * * * * will
run the action every 10 minutes at {0, 10, 20, 30, 40, 50}
minutes. The last parameter does not exist in crontab notation
and it is an adjustment parameter, optional in µGIM. This
parameter defines a value in minutes that will be added to the
end of notation. By using the previous example, if we added
an adjustment of -2 minutes the notation will be 10% * * * *
-2 and it will be triggered every 10 minutes less 2 minutes at
{58, 8, 18, 28, 38, 48} minutes.
FIGURE 3. µGIM schedule notation
Each agent is configured with four forecasting actions
while the auction synchronizer agent has two additional
actions dedicated to the request of available sellers and the
start of the auctions:
• 18 * * * * – forecast hour-ahead energy consumption;
• 18 * * * * – forecast hour-ahead energy generation;
• 15% * * * * -5 – forecast next 15 minutes energy
consumption;

VOLUME XX, 2019 6
• 15% * * * * -5 – forecast next 15 minutes energy
generation;
• 30 * * * * – request available sellers; configured only
in the auction synchronizer and requested to all
producers and prosumers;
• 35 * * * * – synchronization among sellers to start
auctions; configured only in the auction synchronizer.
The forecasting for the next 15 minutes is executed at {10,
25, 40, 55} minutes and it will not be directly used for
transactive energy. The hour-ahead forecast will be executed
each hour at hh:18 minutes (where hh ∈ [0,23]). Energy
consumption and energy generation forecast are executed
simultaneously using multi-threads. The result determines
the amount of energy that the agent will try to sell or buy in
the following auctions.
In the proposed peer-to-peer trading model, agents/players
will not cooperate, they will be competitive agents trying to
reach their personal goals. In this model, µGIM enables the
use of four types of auctions that can be used for peer-to-peer
trading:
• English – this is an ascending-bid type of auction that
enables all participants to bid over the price of the lot,
provoking an ascending price scale over time, the
price must overpass the last bid and the item is sold
when the auctioneer stops receiving bids;
• Dutch – this is a descending-bid type of auction that
initiates at a high price and will slowly decrease over
time, it can have one or multiple bidders depending
on the lot auctioned (e.g. a lot with multiple items),
the bidders are ordered by descending price and this
indicates the priority of each bidder, and where the
bidder with higher priority is the first to select the
items in the lot;
• Blind – this is a first-price sealed-bid auction where
the lot is known by participants and where each
participant can make a unique individual and sealed
bid, then the auctioneer opens the sealed bids and the
highest bidder wins the lot and pays the presented bid;
• Vickrey – is a second-price sealed-bid auction similar
to the blind auction type, but where the highest bidder
pays the second-highest bid and not his/her bid.
An auction is considered as being the auction of a unique
lot. A set of lots/auctions is considered an auction catalogue.
Therefore, there will be one auction catalogue per hour,
where several lots can be presented and auctioned. A lot is
considered an amount of energy to trade in the next hour. All
lots regard energy to be traded in the next hour-period.
The timing of all auctions is parameterized in agents. In
our case study, the English auction type is used. The time
that the auctioneer (i.e. seller) waits for new bids before
close/selling the lot is parameterized in the configuration file.
In our model, all agents are participants in the auctions.
However, depending on their forecast, they can be sellers or
bidders. It is not possible to play both roles in the same
period 𝑡. In our model, a lot is considered as an amount of
energy (Wh) that agents want to sell in the auction. The bids
will be taken in EUR/kWh independently of the size of the
energy lot. The price that will be paid is the relation between
the bid, in EUR/kWh, and the energy lot size.
Agents are free to choose to participate, or not, in the
hourly auctions catalogue according to their individual
needs. There is no centralized optimization mechanism for
peer-to-peer transactions; agents are independent
participants that compete with each other. The proposed
model is distributed, and only individual agent goals are
pursuit, so there is no need for a central agent to optimize the
amount of energy that must be transacted in the microgrid.
Figure 4 shows the sequence diagram of the µGIM
platform, where three µGIM agents are represented: the
agent responsible for the MAS Core where JADE main
container and directory facilitator are running, the auction
synchronizer agent that is responsible for transactive energy
between players, and a generic prosumer that represents all
the platform agents.
Internally, to enable peer-to-peer trading in our model,
three recurrent routines are needed (Figure 4). The first
routine updates the agents list every minute, by using the
services of JADE Directory Facilitator agent. The second
recurrent routine allows the hourly notification of market
prices, from the auction synchronizer to all other agents. The
last routine is the execution of forecasting algorithms,
starting every hour at hh:18.
The auction synchronizer is responsible for the
synchronization of transactive energy auctions. The auction
synchronizer issues two self-triggering events that are
configured in µGIM as actions that start the request of sellers
and the start of auctions. These self-triggering events send
messages to other agents that use them as event-triggering
events to reply. At hh:30, the auction synchronizer agent
requests all available sellers. At hh:35, the auction
synchronizer starts the auctions using a FIFO (first in, first
out) methodology, where sellers are server in the order they
were presented announced. Auctions stop when no more
sellers are waiting.
Lots are auctioned every hour, and each hour has its
auction catalogue, aggregating all lots of all sellers. In each
auction catalogue, the total amount of energy (Wh) to be
traded in peer-to-peer transactions is calculated according to
equation (1).
𝑀𝐸𝑎𝑐 = min (∑𝐸𝑎𝑎𝑐
𝑠
𝑚
𝑎=1
,∑𝐸𝑎𝑎𝑐𝑏
𝑚
𝑎=1
) (1)
where 𝑚 represents the number of agents participating in
the peer-to-peer transaction auctions, 𝐸𝑎𝑎𝑐𝑠 is the amount of
energy that agent 𝑎 has to sale in auctions catalogue 𝑎𝑐, and
𝐸𝑎𝑎𝑐𝑏 is the amount of energy that agent 𝑎 wants to buy in
auctions catalogue 𝑎𝑐. An auctions catalogue, 𝑎𝑐, represents
a set of auctions that are executed within the same hour. In a
day, there are 24 auctions catalogues.

VOLUME XX, 2019 7
FIGURE 4. Sequence diagram for transactive energy
The economic trading amount in one hour is represented
by ∑ 𝐿𝑖𝑎𝑐ℎ𝑏𝑛
𝑖=1 , where 𝑛 is the number of available lots and 𝐿𝑖𝑎𝑐ℎ𝑏
is the highest bid offered for lot 𝑖 in auctions catalogue 𝑎𝑐.
The economic trading amount, equation (2), is a value
between zero – in the case where there are no buyers or
sellers – and the total amount of energy traded in the auctions
catalogue, 𝑀𝐸𝑎𝑐 , multiplied by the maximum offer, 𝑀𝑂𝑎𝑎𝑐 ,
available among microgrid agents.
0 ≤∑𝐿𝑖𝑎𝑐ℎ𝑏
𝑛
𝑖=1
≤ 𝑀𝐸𝑎𝑐 × max0≤𝑎≤𝑚
(𝑀𝑂𝑎𝑎𝑐) (2)
where ∑ 𝐿𝑖𝑎𝑐ℎ𝑏𝑛
𝑖=1 indicates the sum of all economic
transactions, summing all the highest bids of available lots,
and 𝑚 represents the number of agents in the microgrid. Lots
that did not receive bids will have a 𝐿𝑖𝑎𝑐ℎ𝑏 = 0.

VOLUME XX, 2019 8
Figure 5 shows the agent configuration file, using
JavaScript Object Notation (JSON) format. Each agent has
its configuration file. The “calculations.at” key defines a
scheduled action that calculates the energy to be sold or
bought. This action is scheduled for 3 minutes after the
execution of the forecasting algorithms. The “store” key set
with a true value, gives the information that transactions need
to be stored in the database.
The configuration “baseline” for buying energy can have
the following values: “deficit”, “all”, “infinite” or “none”.
The “deficit” value is the deficit between consumption and
generation. The “all” value indicates that the agent will try to
buy the total amount of consumption. The “infinite” value is
for test only and will force the agent to bid to every lot. The
“none” value indicates that the agent will not make any bid.
The “buy” key defines how many and how the agent will
buy energy in the transactive energy auctions. The energy,
“max_price”, “starting_price” and “increment” keys are
percentual numbers. For example, in Figure 5 the agent will
buy 110% of the deficit between generation and
consumption. The “max_price” key defines the maximum
price that the agent will offer for a lot. In this example, that
agent will offer until 90% of the market price for energy
purchase from the main grid. The “starting_price” defines
the minimum price that the agent will offer for a lot; 40% of
the market price for energy purchase. The “increment” key
represents the percentual increment that the agent will apply
to the last highest bid.
The “baseline” in “sell” key can be set to: “surplus”, “all”
or “none”. The “surplus” value indicates that the agent will
sell the surplus energy between generation and consumption.
The “all” value makes the agent to sell any energy generated.
The “none” value forces the agent to not sell any energy. "transactive_energy" : { "peer-to-peer_market" : { "calculations" : { "at": "21 * * * *" }, "buy" : { "baseline" : "deficit", "energy" : 80, "max_price" : 90, "starting_price" : 30, "increment" : 10 }, "sell" : { "baseline" : "surplus", "energy" : 80, "min_price" : 110, "max_lot_size_wh" : 100 }, "store" : true } }
FIGURE 5. µGIM agent’s transactive energy configuration
The “energy” key indicates the percentual value of the
energy that will be put to auction considering the baseline. In
this example, the agent will try to sell 80% of the surplus
energy. The “min_price” indicates that the agent will only
accept bids higher than 100% of the market price for energy
sale – i.e. energy injected to the main grid. The
“max_lot_size_wh” indicates the maximum size, in Wh, of
each energy lot.
Sellers must divide their lots before starting the auctions.
This division is not mandatory but highly recommended. If
an agent needs to buy 150 Wh, then it will not bid on lots
with more than 150 Wh. If big lots are not divided, they can
have no one bidding because they surpass the agent's energy
needs/targets. Agent 𝑎 will put energy lots to sale if equation
(3) is higher than 0.
𝐸𝑎𝑎𝑐𝑠 = {
0 𝑖𝑓 𝑏𝑎𝑠𝑒𝑙𝑖𝑛𝑒 = 𝑛𝑜𝑛𝑒 𝐹𝑔𝑒𝑛ℎ+1 − 𝐹𝑐𝑜𝑛𝑠ℎ+1 𝑖𝑓 𝑏𝑎𝑠𝑒𝑙𝑖𝑛𝑒 = 𝑠𝑢𝑟𝑝𝑙𝑢𝑠
𝐹𝑔𝑒𝑛ℎ+1 𝑖𝑓 𝑏𝑎𝑠𝑒𝑙𝑖𝑛𝑒 = 𝑎𝑙𝑙 (3)
where 𝐹𝑔𝑒𝑛ℎ+1 represents the hour-ahead generation
forecast for auctions catalogue at hour ℎ, and 𝐹𝑐𝑜𝑛𝑠ℎ+1
represents the hour-ahead consumption forecast for the same
hour. The baseline is given by the “sell.baseline” key in the
agent’s configuration file. The number of lots that agent 𝑎
will put to sell on the peer-to-peer auctions in auctions
catalogue 𝑎𝑐 is given by 𝐿𝑎𝑎𝑐𝑛𝑢𝑚𝑏𝑒𝑟 of equation (4).
𝐿𝑎𝑎𝑐𝑛𝑢𝑚𝑏𝑒𝑟 = ⌈
𝐸𝑎𝑎𝑐𝑠
𝑀𝐿𝑎𝑠⌉ (4)
The “max_lot_size_wh” of agent 𝑎 is expressed as 𝑀𝐿𝑎𝑠 .
The minimal price accepted by agent 𝑎 is equal in all its lots
in the same auctions catalogue and it is calculated according
to equation (5)
𝐿𝑎𝑎𝑐𝑚𝑖𝑛 = 𝑚𝑃𝑎 ×Mℎ
𝑆 (5)
where 𝑚𝑃𝑎 is the “min_price” in the sell configuration of
agent 𝑎 and 𝑀ℎ𝑆 represents the market price for energy sold
to the grid in hour ℎ, the same hour of auctions catalogue 𝑎𝑐.
For each lot 𝑖, in auctions catalogue 𝑎𝑐, agents will present
offers if the constraint of equation (6) is respected.
𝐿𝑖𝑎𝑐𝑠 < 𝐸𝑎𝑎𝑐
𝑏 − 𝐸𝑎𝑎𝑐𝑏𝑝
(6)
where 𝐿𝑖𝑎𝑐𝑠 is lot 𝑖 size and 𝐸𝑎𝑎𝑐
𝑏 is agent 𝑎 energy target to
buy and 𝐸𝑎𝑎𝑐𝑏𝑝
is agent 𝑎 energy bought, all regarding the same
auctions catalogue 𝑎𝑐.
If the constraint (5) is respected, then agent 𝑎 calculates
the starting offer (𝑆𝑂𝑎𝑖) of equation (7), the incremented
offer (𝐼𝑂𝑎𝑟) of equation (8), and the maximum offer (𝑀𝑂𝑎𝑖)
of equation (9). The values of 𝑆𝑂𝑎𝑖𝑎𝑐 and 𝑀𝑂𝑎𝑖𝑎𝑐 are relative
to lot 𝑖, while 𝐼𝑂𝑎𝑟𝑖𝑎𝑐 is relative to a bid request from the
auctioneer (i.e. seller).
𝑆𝑂𝑎𝑖𝑎𝑐 = 𝑆𝑃𝑎 ×𝑀ℎ𝑏 (7)
𝐼𝑂𝑎𝑟𝑖𝑎𝑐= 𝐿𝑖𝑎𝑐
ℎ𝑏 × 𝐼𝑃𝑎 (8)
𝑀𝑂𝑎𝑖𝑎𝑐 = 𝑀𝑃𝑎 ×𝑀ℎ𝑏 (9)

VOLUME XX, 2019 9
where the starting offer, 𝑆𝑂𝑎𝑖𝑎𝑐 , uses the “starting_price”
percentual value of Figure 5, 𝑆𝑃𝑎, and multiplies it by the 𝑀ℎ𝑏
that represents the market price from energy bought from the
main grid at hour ℎ. The incremented offer, 𝐼𝑂𝑎𝑟𝑖𝑎𝑐, has at it
bases the current highest bid of the lot at auction 𝑖, 𝐿𝑖𝑎𝑐ℎ𝑏 , and
the percentual value of increment, 𝐼𝑃𝑎, specified in the agent
configuration file. The maximum offer, 𝑀𝑂𝑎𝑖𝑎𝑐 , is calculated
using “max_price” value, 𝑀𝑃𝑎, and the market price. Agents
consider the energy prices to and from the main grid, while
other prices and taxes, such as peak power cost, are currently
not considered.
A second constraint is used to prevent offers in lots where
the highest bid is higher than the maximum offer of agent 𝑎.
If this constraint is not respected, the agent does not provide
and offer.
𝐿𝑖𝑎𝑐ℎ𝑏 < 𝑀𝑂𝑎𝑖𝑎𝑐 (10)
If constraints (5) and (10) are respected, then agent 𝑎
makes an offer (𝑂𝑎𝑟) to the bid request 𝑟 according to
equation (11).
𝑂𝑎𝑟𝑖𝑎𝑐=
{
𝑆𝑂𝑎𝑖𝑎𝑐 𝑖𝑓 𝐿𝑖𝑎𝑐
ℎ𝑏 < 𝑆𝑂𝑎𝑖𝑎𝑐
𝑀𝑂𝑎𝑖𝑎𝑐 𝑖𝑓 𝐿𝑖𝑎𝑐ℎ𝑏 ≥ 𝑆𝑂𝑎𝑖𝑎𝑐 𝑎𝑛𝑑 𝐼𝑂𝑎𝑟𝑖𝑎𝑐
> 𝑀𝑂𝑎𝑖𝑎𝑐
𝐼𝑂𝑎𝑟𝑖𝑎𝑐 𝑖𝑓 𝐿𝑖𝑎𝑐
ℎ𝑏 ≥ 𝑆𝑂𝑎𝑖𝑎𝑐 𝑎𝑛𝑑 𝐼𝑂𝑎𝑟𝑖𝑎𝑐≤ 𝑀𝑂𝑎𝑖𝑎𝑐
(11)
According to the constraint (5), agents do not buy or bid
lots bigger than the amount of energy they want to buy. This
means that even with several agents willing to bid on lots, it
is possible to have lots without any bid because they fall on
constraints (5).
Each transaction is stored in the seller and buyer agents’
databases. However, a more reliable, scalable and secure
method should be applied. Distributed ledgers are a good
solution that allows a decentralized approach, compliant
with the proposed model. The result from peer-to-peer
transactions can be validated and stored in Corda platform
[34], where transactions can be added using the RPC (remote
procedure call) client and/or its API.
V. BUILDING DEPLOYMENT
A total of five µGIM agents were deployed in one office
building with five independent end-users. In this scenario,
we have a building owner that is responsible for office
rentals. Offices can be rented in sets of two or three. Each
tenant and the building owner are represented by individual
agents that control the building/office energy and can
transact energy. Each tenant is an independent end-user with
an individual energy contract with an energy provider.
Although they share their physical location, they are five
separate end-users that could have five different physical
buildings, this would not change our case study.
Figure 6 shows the satellite image of our building,
identifying the operation area of each agent. The building
agent is responsible for all the common areas plus the kitchen
(room 10) and rooms 11 and 16. The tenant responsible for
zone L.1 has three offices. The tenant responsible for zone
L.2 has three offices, one of them (room 4) is used as a server
room. Zone L.3, with three rooms, is rented to another tenant.
The last tenant is renting rooms 12 and 15 (i.e. zone R.2).
Rooms 13 and 14 are empty and are not used or measured.
The building has a photovoltaic peak generation of 10 kW.
When a player rents a zone (i.e. a set of offices), it has access
to 1 kW of generation that can be used for auto-consumption
or in peer-to-peer transactions. In our case, the building’s
agent manages the remaining 6 kW of generation, resulting
from the 10 kW less the 4 kW attributed to the tenants – 1
kW for L.1 agent, 1 kW for L.2 agent, 1 kW for L.3 agent,
and 1 kW for R.2 agent.
FIGURE 6. Building agents' deployment
The deployed agents are executed in five Raspberry Pi
boards, shown in Figure 7. Each Raspberry Pi has one µGIM
agent running in its operating system (i.e. Raspbian).
Communication among agents is done using JADE
framework, through TCP/IP protocol. The building’s agent
is executed in one Raspberry Pi Zero with a 1 GHz single-
core CPU and 512 MB of RAM. The agent representing zone
L.1 is executed in one Raspberry Pi with a 700 MHz single-
core CPU and 512 MB. The other three agents are executed
in three Raspberry Pi 3 Model B with a 1.2 GHz quad-core
CPU and 1 GB of RAM.
In order to demonstrate the µGIM capabilities, Raspberry
Pi Zero is configured as MAS core and the auction
synchronizer. Raspberry Pi Zero manages the yellow areas
of Figure 6, accommodates the JADE main container, and
coordinates and manages the transactive energy auctions.
This SBC is the only one running two agents: µGIM agent,
and JADE directory facilitator (DF) agent.
Figure 7 presents the connections among all agents using
the MAS (represented in green circular line). The beige
circular line inside the green line represents the connectivity
of agents regarding peer-to-peer transactions. Although the
building’s agent acts as the auction synchronizer, it also
participants in auctions.

VOLUME XX, 2019 10
Agents also have a direct link to a remote PostgreSQL
server. Because the storage limit of SBC is small, the stored
data cannot be forever stored in the SBC. Therefore, data
with more than one day is transferred to an external server
where it is stored indefinitely. After the data has been stored
in the external server, the µGIM agent erases the same data
from the local database located inside the SBC.
FIGURE 7. µGIM agents representing hardware and connections
In this case study, all agents are configured as presented in
Figure 5. The exception is the building’s agent that does not
buy any energy, as the buy “baseline” is set to “none”.
The monitoring and control of the energy resources, in the
entire building, is done using energy analyzers and smart
plugs. The energy analyzers use an RS485 network with a
master Programmable Logic Control (PLC). The PLC is
accessed by the µGIM agents using Modbus/TCP protocol.
The smart plugs, however, use TCP/IP RESTful API. Agents
monitor resources each second and store their data every ten
seconds. Each agent is responsible for monitoring and
controlling the resources available in its area (Figure 6). In
this case study, only the monitoring ability is used to measure
energy consumption and generation. Because each agent
manages multiple resources, each resource is monitored by
an individual thread in µGIM agents.
All SBC were installed in room 14 of the building (Figure
6). In this room, it is available a board with several SBC and
HDMI monitors that are used, as can be seen in Figure 8.
Local monitors are not mandatory, but they were used for
visualization proposes and debug. Although SBC are
installed in the same physical location, they control distinct
parts of the building, according to the areas presented in
Figure 6.
FIGURE 8. SBC installation
Figure 9, Figure 10, Figure 11, Figure 12, and Figure 13
show the weekly profile of generation and consumption in
each agent. These data were collected and stored by the five
µGIM agents deployed. The data regard the period between
10 April 2019 (Wednesday) and 16 April 2019 (Tuesday).
The generation is represented by a yellow line and all the
consumptions resources are shown as aggregated. The
mentioned dataset is published under open access in [35].
Z.0 Agent represents the building’s agent. It has the
second higher consumption and the highest generation
values (Figure 9). In zone L.1, the available generation is
always lower than consumption, making this agent not
capable of selling energy (Figure 10). The same scenario
occurs in agent L.2, which has the highest consumption value
(Figure 11). The high consumption of L.2, and its periodic
consumption peaks, is the direct result of the server room
located in room 4, especially its air-conditioning unit. Agents
L.2 and R.2 are usually self-sustainable during the middle of
the day, enabling the selling of energy to other agents (Figure
12 and Figure 13).
FIGURE 9. Z.0 agent week metering

VOLUME XX, 2019 11
FIGURE 10. L.1 agent week metering
FIGURE 11. L.2 agent week metering
FIGURE 12. L.3 agent week metering
FIGURE 13. R.2 agent week metering
VI. RESULTS
This section presents the results obtained during the one
week, from 3 March 2020 (Monday) to 9 March 2020
(Sunday), where the proposed TE auction model and the
µGIM platform were in continuous execution without
supervision. The results present data from the week with
peer-to-peer (P2P) energy transaction, and without P2P
transactions. The mentioned dataset is published under open
access in [36]. Energy costs are related to the one week of
experimentation, they are the direct result of energy bought
from the grid, energy sold to the grid, energy bought in P2P
auctions, and energy sold in P2P auctions.
Figure 14 shows the microgrid consumption and
generation, as well as the energy bought from the main grid
and energy injected/sold to the main grid. The data of Figure
14 do not consider P2P transactions. Because no P2P
transactions are made, the microgrid as a whole – the
combination of the five individual agents – buys and sells
energy to the main grid at the same time (e.g. one agent is
injecting energy will others are buying). The goal for using
P2P transactions is to avoid the green line of Figure 14,
indicating that energy is being sold directly to the main grid
without being sold to other microgrid’s agents. In Figure 15,
where the results with P2P transactions are shown, the green
line significantly decreases.
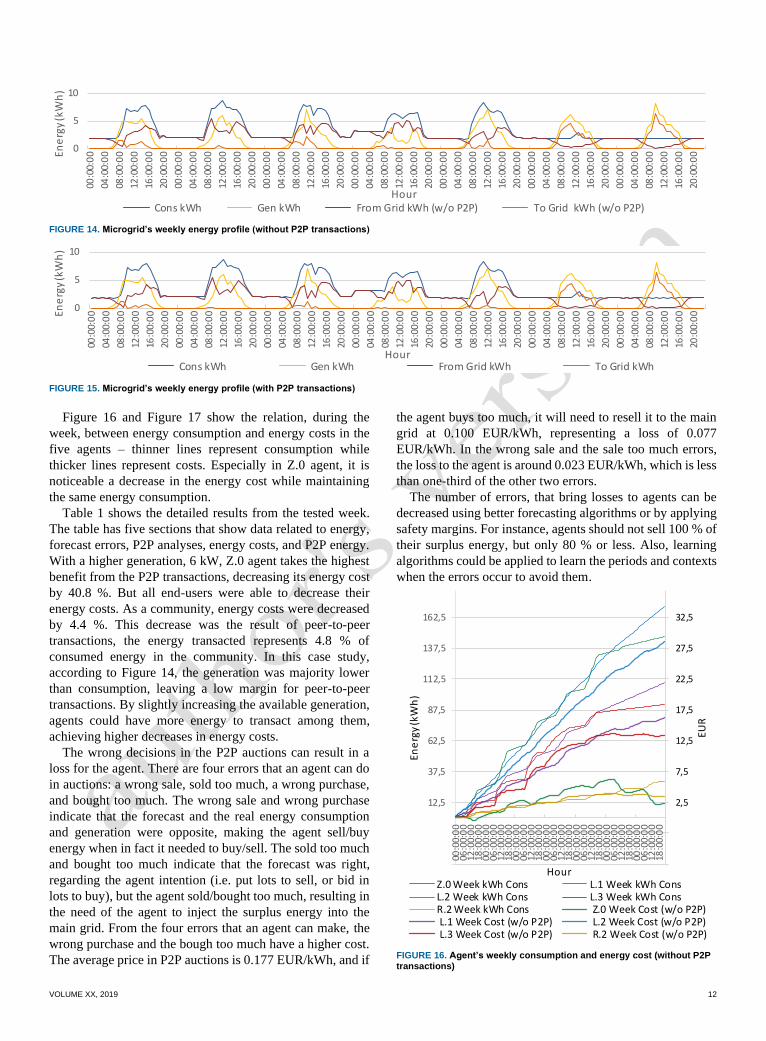
VOLUME XX, 2019 12
FIGURE 14. Microgrid’s weekly energy profile (without P2P transactions)
FIGURE 15. Microgrid’s weekly energy profile (with P2P transactions)
Figure 16 and Figure 17 show the relation, during the
week, between energy consumption and energy costs in the
five agents – thinner lines represent consumption while
thicker lines represent costs. Especially in Z.0 agent, it is
noticeable a decrease in the energy cost while maintaining
the same energy consumption.
Table 1 shows the detailed results from the tested week.
The table has five sections that show data related to energy,
forecast errors, P2P analyses, energy costs, and P2P energy.
With a higher generation, 6 kW, Z.0 agent takes the highest
benefit from the P2P transactions, decreasing its energy cost
by 40.8 %. But all end-users were able to decrease their
energy costs. As a community, energy costs were decreased
by 4.4 %. This decrease was the result of peer-to-peer
transactions, the energy transacted represents 4.8 % of
consumed energy in the community. In this case study,
according to Figure 14, the generation was majority lower
than consumption, leaving a low margin for peer-to-peer
transactions. By slightly increasing the available generation,
agents could have more energy to transact among them,
achieving higher decreases in energy costs.
The wrong decisions in the P2P auctions can result in a
loss for the agent. There are four errors that an agent can do
in auctions: a wrong sale, sold too much, a wrong purchase,
and bought too much. The wrong sale and wrong purchase
indicate that the forecast and the real energy consumption
and generation were opposite, making the agent sell/buy
energy when in fact it needed to buy/sell. The sold too much
and bought too much indicate that the forecast was right,
regarding the agent intention (i.e. put lots to sell, or bid in
lots to buy), but the agent sold/bought too much, resulting in
the need of the agent to inject the surplus energy into the
main grid. From the four errors that an agent can make, the
wrong purchase and the bough too much have a higher cost.
The average price in P2P auctions is 0.177 EUR/kWh, and if
the agent buys too much, it will need to resell it to the main
grid at 0.100 EUR/kWh, representing a loss of 0.077
EUR/kWh. In the wrong sale and the sale too much errors,
the loss to the agent is around 0.023 EUR/kWh, which is less
than one-third of the other two errors.
The number of errors, that bring losses to agents can be
decreased using better forecasting algorithms or by applying
safety margins. For instance, agents should not sell 100 % of
their surplus energy, but only 80 % or less. Also, learning
algorithms could be applied to learn the periods and contexts
when the errors occur to avoid them.
FIGURE 16. Agent’s weekly consumption and energy cost (without P2P transactions)
0
5
1000
:00:
00
04:0
0:0
0
08:0
0:0
0
12:0
0:0
0
16:0
0:0
0
20:0
0:0
0
00:0
0:0
0
04:0
0:0
0
08:0
0:0
0
12:0
0:0
0
16:0
0:0
0
20:0
0:0
0
00:0
0:0
0
04:0
0:0
0
08:0
0:0
0
12:0
0:0
0
16:0
0:0
0
20:0
0:0
0
00:0
0:0
0
04:0
0:0
0
08:0
0:0
0
12:0
0:0
0
16:0
0:0
0
20:0
0:0
0
00:0
0:0
0
04:0
0:0
0
08:0
0:0
0
12:0
0:0
0
16:0
0:0
0
20:0
0:0
0
00:0
0:0
0
04:0
0:0
0
08:0
0:0
0
12:0
0:0
0
16:0
0:0
0
20:0
0:0
0
00:0
0:0
0
04:0
0:0
0
08:0
0:0
0
12:0
0:0
0
16:0
0:0
0
20:0
0:0
0Ene
rgy
(kW
h)
Hour Cons kWh Gen kWh From Grid kWh (w/o P2P) To Grid kWh (w/o P2P)
0
5
10
00:0
0:0
0
04:0
0:0
0
08:0
0:0
0
12:0
0:0
0
16:0
0:0
0
20:0
0:0
0
00:0
0:0
0
04:0
0:0
0
08:0
0:0
0
12:0
0:0
0
16:0
0:0
0
20:0
0:0
0
00:0
0:0
0
04:0
0:0
0
08:0
0:0
0
12:0
0:0
0
16:0
0:0
0
20:0
0:0
0
00:0
0:0
0
04:0
0:0
0
08:0
0:0
0
12:0
0:0
0
16:0
0:0
0
20:0
0:0
0
00:0
0:0
0
04:0
0:0
0
08:0
0:0
0
12:0
0:0
0
16:0
0:0
0
20:0
0:0
0
00:0
0:0
0
04:0
0:0
0
08:0
0:0
0
12:0
0:0
0
16:0
0:0
0
20:0
0:0
0
00:0
0:0
0
04:0
0:0
0
08:0
0:0
0
12:0
0:0
0
16:0
0:0
0
20:0
0:0
0Ene
rgy
(kW
h)
Hour Cons kWh Gen kWh From Grid kWh To Grid kWh
-7,5
-2,5
2,5
7,5
12,5
17,5
22,5
27,5
32,5
-37,5
-12,5
12,5
37,5
62,5
87,5
112,5
137,5
162,5
00:0
0:0
006
:00:
00
12:0
0:0
018
:00:
00
00:0
0:0
006
:00:
00
12:0
0:0
018
:00:
00
00:0
0:0
006
:00:
00
12:0
0:0
018
:00:
00
00:0
0:0
006
:00:
00
12:0
0:0
018
:00:
00
00:0
0:0
006
:00:
00
12:0
0:0
018
:00:
00
00:0
0:0
006
:00:
00
12:0
0:0
018
:00:
00
00:0
0:0
006
:00:
00
12:0
0:0
018
:00:
00
EUR
Ene
rgy
(kW
h)
HourZ.0 Week kWh Cons L.1 Week kWh ConsL.2 Week kWh Cons L.3 Week kWh ConsR.2 Week kWh Cons Z.0 Week Cost (w/o P2P) L.1 Week Cost (w/o P2P) L.2 Week Cost (w/o P2P) L.3 Week Cost (w/o P2P) R.2 Week Cost (w/o P2P)

VOLUME XX, 2019 13
FIGURE 17. Agent’s weekly consumption and energy cost (with P2P transactions)
VIII. CONCLUSION
The concept of transactive energy enables the active
participation of all players in the smart grid. They can be part
of the smart grid and take economic advantages. This paper
explores the potential of transactive energy using peer-to-
peer energy transactions inside an agent-based microgrid
platform, considering English auctions.
The paper demonstrates how µGIM platform works and
how it can be deployed in a microgrid. This agent-based
management system enables the representation of each
microgrid player, using low-cost, low-power and small-size
single-board computers. The ability to manage the player’s
energy resources, while providing the communication ability
of a multi-agent system, enables µGIM to be a complete
microgrid management system, where all agents can
cooperate and collaborate to achieve a common microgrid
goal. In the presented case study, communications among
agents are used to enable peer-to-peer energy transactions.
In this paper, where a peer-to-peer energy transaction
model based on auctions is proposed, each µGIM agent is
equipped with hour-ahead forecasting algorithms for energy
consumption and generation and can participate in the peer-
to-peer transaction auctions.
The µGIM platform and the peer-to-peer transaction
model were deployed in an office building where five
independent agents, representing offices, compose a
microgrid. This work intended to measure the benefits of
peer-to-peer transaction auctions inside a microgrid to
decrease the demand and injection of energy from/into the
main grid.
Because all agents are independent entities, they all have
energy contracts with energy suppliers. However, if they
transact energy among them, they can decrease energy costs.
The case study, of this paper, shows that this is a possibility
for the majority of the microgrid players.
The results also show that some agents have high numbers
of wrong transactions, leading to bad results. This scenario
could be improved by using better forecasting algorithms
and by applying safety margins to transactions. Although the
results of this paper, with a real case study, are very
promising, they can still be improved by applying new
methodologies for peer-to-peer participation.
TABLE I MICROGRID’S OVERALL WEEKLY RESULTS Z.0 L.1 L.2 L.3 R.2 Microgrid
Ener
gy Consumption (kWh) 147.311 109.298 171.986 91.891 41.860 562.347
Generation (kWh) 169.429 28.775 28.775 28.775 28.775 284.531
Erro
rs
Forecast MAPE Cons. 10.27 % 10.04 % 9.54 % 9.61 % 9.95 % 9.88 % Forecast MAPE Gen. 6.26 % 6.57 % 6.52 % 6.50 % 6.75 % 7.16 %
P2
P a
na
lyse
s
Bought (kWh) 0.000 5.427 13.225 6.237 2.215 27.104 Sold (kWh) 22.705 0.032 0.000 1.917 2.450 27.104 Best choice periods 35 39 51 38 32 195 Wrong sale periods 4 1 0 1 3 9 Sold too much periods 15 1 0 2 8 26 Wrong purchase periods 0 0 0 0 1 1 Bought too much periods 0 2 1 1 0 4 Wrong trading (kWh) 4.320 0.094 0.003 0.069 0.250 4.736 Total number of transactions 54 43 52 42 44 235 % of best choices 64.81 % 90.70 % 98.08 % 90.48 % 72.73 % 82.98 %
Ener
gy
cost
s Week cost 1.4065 € 15.5273 € 27.9279 € 13.1305 € 3.3261 € 61.318 € Week Cost (w/o P2P) 2.3756 € 16.2455 € 28.6661 € 13.3470 € 3.4803 € 64.115 € Price per kWh (EUR/kWh) 0.0095 € 0.1421 € 0.1624 € 0.1429 € 0.0795 € 0.1090 € Price per kWh (EUR/kWh) (w/o P2P) 0.0161 € 0.1486 € 0.1667 € 0.1452 € 0.0831 € 0.1140 €
P2
P
ener
gy Price variation (w/ and w/o P2P) 40.79 % 4.42 % 2.58 % 1.62 % 4.43 % 4.36 %
Trading in consumption 0.00 % 4.97 % 7.69 % 6.79 % 5.29 % 4.82 % Trading in generation 13.40 % 0.11 % 0.00 % 6.66 % 8.51 % 9.53 %
-7,5
-2,5
2,5
7,5
12,5
17,5
22,5
27,5
32,5
-37,5
-12,5
12,5
37,5
62,5
87,5
112,5
137,5
162,500
:00:
00
06:0
0:0
012
:00:
00
18:0
0:0
000
:00:
00
06:0
0:0
012
:00:
00
18:0
0:0
000
:00:
00
06:0
0:0
012
:00:
00
18:0
0:0
000
:00:
00
06:0
0:0
012
:00:
00
18:0
0:0
000
:00:
00
06:0
0:0
012
:00:
00
18:0
0:0
000
:00:
00
06:0
0:0
012
:00:
00
18:0
0:0
000
:00:
00
06:0
0:0
012
:00:
00
18:0
0:0
0
EUR
En
erg
y (k
Wh
)
HourZ.0 Week kWh Cons L.1 Week kWh ConsL.2 Week kWh Cons L.3 Week kWh ConsR.2 Week kWh Cons Z.0 Week Cost L.1 Week Cost L.2 Week Cost L.3 Week Cost R.2 Week Cost

VOLUME XX, 2019 14
ACKNOWLEDGMENT
The present work has been developed under the MAS-Society
Project cofunded by Portugal 2020 “Fundo Europeu de
Desenvolvimento Regional” (FEDER) through PO CI,
UIDB/00760/2020 and SFRH/BD/109248/2015.
REFERENCES [1] The GridWise Architecture Council, GridWise Transactive Energy
Framework Version 1.0, 2015.
https://www.gridwiseac.org/pdfs/te_framework_report_pnnl-
22946.pdf (accessed March 20, 2018).
[2] K. Kok, S. Widergren, A Society of Devices: Integrating Intelligent
Distributed Resources with Transactive Energy, IEEE Power Energy
Mag. 14 (2016) 34–45. doi:10.1109/MPE.2016.2524962.
[3] Consumer Technology Association, 2015. Digital America 2015, pp.
85.
[4] Statista 2018. Smart Home Report 2018 - Control and Connectivity,
Smart Home Report 2018 - Control and Connectivity.
[5] Y. Han, K. Zhang, H. Li, E. A. A. Coelho and J. M. Guerrero, "MAS-
Based Distributed Coordinated Control and Optimization in Microgrid and Microgrid Clusters: A Comprehensive Overview," in IEEE
Transactions on Power Electronics, vol. 33, no. 8, pp. 6488-6508, Aug.
2018. doi: 10.1109/TPEL.2017.2761438
[6] Z. Li, C. Zang, P. Zeng, H. Yu and H. Li, "MAS based distributed
automatic generation control for cyber-physical microgrid system," in
IEEE/CAA Journal of Automatica Sinica, vol. 3, no. 1, pp. 78-89, 10
January 2016. doi: 10.1109/JAS.2016.7373765
[7] F. Chen, M. Chen, Q. Li, K. Meng, J. M. Guerrero and D. Abbott,
"Multiagent-Based Reactive Power Sharing and Control Model for Islanded Microgrids," in IEEE Transactions on Sustainable Energy,
vol. 7, no. 3, pp. 1232-1244, July 2016. doi:
10.1109/TSTE.2016.2539213
[8] T. W. Overton (Jan. 2014), “New York University Cogeneration Plant,
New York City,” POWER magazine [Online]. 07/08/2017, Available:
http://www.powermag.com/new-york-university-cogeneration-plant-
new-york-city
[9] B. Washom, J. Dilliot, D. Weil, J. Kleissl, N. Balac, W. Torre, and C.
Richter, "Ivory Tower of Power: Microgrid Implementation at the University of California, San Diego," IEEE Power and Energy
Magazine, vol. 11, pp. 28-32, July-Aug. 2013.
[10] A. Villanueva, V. Fung, J. Worrall, J. Trueblood, “Camp Pendleton Fractal Grid Demonstration”, Energy Research and Development
Division Final Project Report, December 2014 (accessed 29/03/2019)
https://www.energy.ca.gov/2016publications/CEC-500-2016-
013/CEC-500-2016-013.pdf
[11] Naval Facilities Engineering Command, “Smart Power Infrastructure
Demonstration for Energy Reliability and Security (SPIDERS)”, Technology Transition Final Public Report, 31 December 2015
(accessed 29-03-2019)
https://www.energy.gov/sites/prod/files/2016/03/f30/spiders_final_re
port.pdf
[12] LO3ENERGY, “EXERGY – Business Whitepaper”, 24 April 2018
(accessed 29/03/2019) https://lo3energy.com/wp-
content/uploads/2018/04/Exergy-BIZWhitepaper-v11.pdf
[13] D. Cardwell, “Solar Experiment Lets Neighbors Trade Energy Among Themselves”, The New York Time, 13 March 2017 (accessed
23/03/2019) https://www.nytimes.com/2017/03/13/business/energy-
environment/brooklyn-solar-grid-energy-trading.html
[14] B. Akyol, C.H. Allwardt, Z.W. Beech, J.B. Chapman, J.N. Haack, S.
Katipamula, R.G. Lutes, K.E. Monson, “VOLTTRONtm 2016”, June
2016, PNNL-25499 (accessed 23/03/2019) https://volttron.org/sites/default/files/publications/PNNL-
25499_VOLTTRON_2016.pdf
[15] U. Herberg, D. Mashima, J. G. Jetcheva and S. Mirzazad-Barijough,
"OpenADR 2.0 deployment architectures: Options and implications,"
2014 IEEE International Conference on Smart Grid Communications (SmartGridComm), Venice, 2014, pp. 782-787. doi:
10.1109/SmartGridComm.2014.7007743
[16] C.D. Corbin, A. Makhmalbaf, s. Huang, V.V. Mendon, M. Zhao, S. Somasundaram, G. Liu, H. Ngo, S. Katipamula, “Transactive Control
of Commercial Building HVAC Systems”, December 2016, PNNL-
26083 (accessed 23/03/2019) https://www.pnnl.gov/main/publications/external/technical_reports/P
NNL-26083.pdf
[17] S. Eisele, I. Mardari, A. Dubey and G. Karsai, "RIAPS: Resilient Information Architecture Platform for Decentralized Smart Systems,"
2017 IEEE 20th International Symposium on Real-Time Distributed
Computing (ISORC), Toronto, ON, 2017, pp. 125-132.
doi: 10.1109/ISORC.2017.22
[18] S. Eisele, A. Dubey, G. Karsai and S. Lukic, "WiP Abstract:
Transactive Energy Demo with RIAPS Platform," 2017 ACM/IEEE 8th International Conference on Cyber-Physical Systems (ICCPS),
Pittsburgh, PA, 2017, pp. 91-92.
[19] Y. Du, H. Tu, S. Lukic, A. Dubey and G. Karsai, "Distributed Microgrid Synchronization Strategy Using a Novel Information
Architecture Platform," 2018 IEEE Energy Conversion Congress and
Exposition (ECCE), Portland, OR, 2018, pp. 2060-2066. doi:
10.1109/ECCE.2018.8557695
[20] M. H. Cintuglu, T. Youssef and O. A. Mohammed, "Development and Application of a Real-Time Testbed for Multiagent System
Interoperability: A Case Study on Hierarchical Microgrid Control," in
IEEE Transactions on Smart Grid, vol. 9, no. 3, pp. 1759-1768, May
2018. doi: 10.1109/TSG.2016.2599265
[21] Z. Liu, Q. Wu, S. Huang, H. Zhao, Transactive energy: A review of
state of the art and implementation, in: 2017 IEEE Manchester
PowerTech, IEEE, 2017: pp. 1–6. doi:10.1109/PTC.2017.7980892
[22] H. Hao, C.D. Corbin, K. Kalsi, R.G. Pratt, Transactive Control of
Commercial Buildings for Demand Response, IEEE Trans. Power
Syst. 32 (2017) 774–783. doi:10.1109/TPWRS.2016.2559485
[23] Chenghua Zhang, Jianzhong Wu, Chao Long, Meng Cheng, “Review
of Existing Peer-to-Peer Energy Trading Projects”, Energy Procedia,
Volume 105, 2017, pp. 2563-2568. doi: 10.1016/j.egypro.2017.03.73
[24] B. Brandherm, J. Baus and J. Frey, "Peer Energy Cloud -- Civil
Marketplace for Trading Renewable Energies," 2012 Eighth International Conference on Intelligent Environments, Guanajuato,
2012, pp. 375-378. doi: 10.1109/IE.2012.46
[25] M. Fry, “CASE STUDY: Learn more about our live project with BCPG in Bangkok, Thailand”, Medium, 20 November 2018 (accessed
29/03/2019) https://medium.com/power-ledger/case-study-learn-
more-about-our-live-project-with-bcpg-in-bangkok-thailand-
ab7a31c8b464
[26] A. Singh, A. T. Strating, N.A. Romero Herrera, D. Mahato, D. V.
Keyson, H. W. van Dijk, “Exploring peer-to-peer returns in off-grid renewable energy systems in rural India: An anthropological
perspective on local energy sharing and trading”, Energy Research &
Social Science, Volume 46, 2018, pp. 194-213. doi:
10.1016/j.erss.2018.07.021.
[27] Chenghua Zhang, Jianzhong Wu, Yue Zhou, Meng Cheng, Chao
Long, “Peer-to-Peer energy trading in a Microgrid”, Applied Energy,
Volume 220, 2018, pp. 1-12. doi: 10.1016/j.apenergy.2018.03.010.
[28] M. R. Alam, M. St-Hilaire, T. Kunz, “Peer-to-peer energy trading
among smart homes”, Applied Energy, Volume 238, 2019, pp. 1434-
1443. doi: 10.1016/j.apenergy.2019.01.091.
[29] T. Morstyn, A. Teytelboym and M. D. Mcculloch, "Bilateral Contract
Networks for Peer-to-Peer Energy Trading," in IEEE Transactions on Smart Grid, vol. 10, no. 2, pp. 2026-2035, March 2019.
doi: 10.1109/TSG.2017.2786668
[30] F. H. Malik, M. Lehtonen, “A review: Agents in smart grids,” Electric Power Systems Research, Volume 131, 2016, Pages 71-79,
https://doi.org/10.1016/j.epsr.2015.10.004

VOLUME XX, 2019 15
[31] Wooldridge, M. An Introduction to Multiagent Systems, 2nd ed.;
Wiley Publishing: New Jersey, United States of America, 2009.
ISBN:0470519460 9780470519462
[32] Luis Gomes, João Spínola, Zita Vale, Juan M. Corchado, "Agent-
based architecture for demand side management using real-time
resources’ priorities and a deterministic optimization algorithm", Journal of Cleaner Production, Volume 241, 2019. doi:
10.1016/j.jclepro.2019.118154.
[33] Luis Gomes, Zita Vale, Juan M. Corchado, “Microgrid Management System Based on a Multi-Agent Approach: an Office Building Pilot”,
Measurement, 2019. doi: 10.1016/j.measurement.2019.107427.
[34] Corda documentation (accessed 23/03/2019)
https://docs.corda.net/index.html
[35] L. Gomes, “uGIM: week monitorization data of a microgrid with five
agents (10/04/19-16/04/19)”, (Version 1.0) [Data set]. Zenodo, 2019.
Doi: 10.5281/zenodo.2868129.
[36] L. Gomes, “uGIM: a week with peer-to-peer transactions (02/03/2020
- 08/03/2020)”, (Version 0.1.0) [Data set]. Zenodo, 2019. Doi:
10.5281/zenodo.3707578.