
Intelligent Multi-Vehicle DC/DC Charging Station ... - MDPI
21
energies Article Intelligent Multi-Vehicle DC/DC Charging Station Powered by a Trolley Bus Catenary Grid Michéle Weisbach 1, * ,† , Tobias Schneider 2, * ,† , Dominik Maune 2 , Heiko Fechtner 1 , Utz Spaeth 1 , Ralf Wegener 2 , Stefan Soter 2 and Benedikt Schmuelling 1 Citation: Weisbach, M.; Schneider, T.; Maune, D.; Fechtner, H.; Spaeth, U.; Wegener, R.; Soter, S.; Schmuelling, B. Intelligent Multi-Vehicle DC/DC Charging Station Powered by a Trolley Bus Catenary Grid. Energies 2021, 14, 8399. https://doi.org/ 10.3390/en14248399 Academic Editor: Daniela Chrenko Received: 30 October 2021 Accepted: 30 November 2021 Published: 13 December 2021 Publisher’s Note: MDPI stays neutral with regard to jurisdictional claims in published maps and institutional affil- iations. Copyright: © 2021 by the authors. Licensee MDPI, Basel, Switzerland. This article is an open access article distributed under the terms and conditions of the Creative Commons Attribution (CC BY) license (https:// creativecommons.org/licenses/by/ 4.0/). 1 Chair of Electric Mobility and Energy Storage Systems, University of Wuppertal, Rainer Gruenter Straße 21, 42119 Wuppertal, Germany; [email protected] (H.F.); [email protected] (U.S.); [email protected] (B.S.) 2 Institute of Electrical Machines and Drives, University of Wuppertal, Rainer Gruenter Straße 21, 42119 Wuppertal, Germany; [email protected] (D.M.); [email protected] (R.W.); [email protected] (S.S.) * Correspondence: [email protected] (M.W.); [email protected] (T.S.); Tel.: +49-(0)-202-439-1513 (M.W.); +49-(0)-202-439-1996 (T.S.) † These authors contributed equally to this work. Abstract: This article deals with the major challenge of electric vehicle charging infrastructure in urban areas—installing as many fast charging stations as necessary and using them as efficiently as possible, while considering grid level power limitations. A smart fast charging station with four vehicle access points and an intelligent load management algorithm based on the combined charging system interface is presented. The shortcomings of present implementations of the combined charging system communication protocol are identified and discussed. Practical experiments and simulations of different charging scenarios validate the concept and show that the concept can increase the utilization time and the supplied energy by a factor of 2.4 compared to typical charging station installations. Keywords: electric vehicle; fast charging; EV charging; load management; smart grid; switching matrix; resonant converter; CCS 1. Introduction The complexity of the development of intelligent fast charging infrastructure for electric vehicles (EV) is high. It involves specialized power electronics, bidirectional digital communication, and specialized control algorithms. The following sections will first provide a general introduction to the overall topic and then narrow it down to the specific application. 1.1. General Introduction The sales volume of electric vehicles has increased in recent years. By the end of 2020, over 10 million EVs had already been registered worldwide [1]. Compared to 7.3 million registered EVs by the end of 2019 [2], this was a remarkable development, accelerated by national and international policies and targets as well as a rethinking in society regarding climate protection measures. Nevertheless, to achieve global climate protection goals (e.g., Paris Agreement [3]), the number of EVs to replace gasoline-fueled vehicles must increase significantly. The European Union (EU) aims to reach climate neutrality by 2050 [4] and thus a share of 100% of zero-emission vehicles (ZEV) in the whole vehicle stock in the EU by 2050 [5]. The transport sector has a significant influence on greenhouse gas emissions: in [6], the authors emphasize that the transport sector (including aviation and shipping) has a share of one third (32%) of total CO 2 emissions in the EU, whereas 72% of these emissions were caused by road transport in 2017. In addition, ground transport accounts Energies 2021, 14, 8399. https://doi.org/10.3390/en14248399 https://www.mdpi.com/journal/energies
-
Upload
khangminh22 -
Category
Documents
-
view
0 -
download
0
Transcript of Intelligent Multi-Vehicle DC/DC Charging Station ... - MDPI

energies
Article
Intelligent Multi-Vehicle DC/DC Charging Station Powered bya Trolley Bus Catenary Grid
Michéle Weisbach 1,*,† , Tobias Schneider 2,*,†, Dominik Maune 2, Heiko Fechtner 1 , Utz Spaeth 1 ,Ralf Wegener 2, Stefan Soter 2 and Benedikt Schmuelling 1
�����������������
Citation: Weisbach, M.; Schneider, T.;
Maune, D.; Fechtner, H.; Spaeth, U.;
Wegener, R.; Soter, S.; Schmuelling, B.
Intelligent Multi-Vehicle DC/DC
Charging Station Powered by a
Trolley Bus Catenary Grid. Energies
2021, 14, 8399. https://doi.org/
10.3390/en14248399
Academic Editor: Daniela Chrenko
Received: 30 October 2021
Accepted: 30 November 2021
Published: 13 December 2021
Publisher’s Note: MDPI stays neutral
with regard to jurisdictional claims in
published maps and institutional affil-
iations.
Copyright: © 2021 by the authors.
Licensee MDPI, Basel, Switzerland.
This article is an open access article
distributed under the terms and
conditions of the Creative Commons
Attribution (CC BY) license (https://
creativecommons.org/licenses/by/
4.0/).
1 Chair of Electric Mobility and Energy Storage Systems, University of Wuppertal, Rainer Gruenter Straße 21,42119 Wuppertal, Germany; [email protected] (H.F.); [email protected] (U.S.);[email protected] (B.S.)
2 Institute of Electrical Machines and Drives, University of Wuppertal, Rainer Gruenter Straße 21,42119 Wuppertal, Germany; [email protected] (D.M.); [email protected] (R.W.);[email protected] (S.S.)
* Correspondence: [email protected] (M.W.); [email protected] (T.S.);Tel.: +49-(0)-202-439-1513 (M.W.); +49-(0)-202-439-1996 (T.S.)
† These authors contributed equally to this work.
Abstract: This article deals with the major challenge of electric vehicle charging infrastructure inurban areas—installing as many fast charging stations as necessary and using them as efficientlyas possible, while considering grid level power limitations. A smart fast charging station with fourvehicle access points and an intelligent load management algorithm based on the combined chargingsystem interface is presented. The shortcomings of present implementations of the combined chargingsystem communication protocol are identified and discussed. Practical experiments and simulationsof different charging scenarios validate the concept and show that the concept can increase theutilization time and the supplied energy by a factor of 2.4 compared to typical charging stationinstallations.
Keywords: electric vehicle; fast charging; EV charging; load management; smart grid; switchingmatrix; resonant converter; CCS
1. Introduction
The complexity of the development of intelligent fast charging infrastructure forelectric vehicles (EV) is high. It involves specialized power electronics, bidirectionaldigital communication, and specialized control algorithms. The following sections willfirst provide a general introduction to the overall topic and then narrow it down to thespecific application.
1.1. General Introduction
The sales volume of electric vehicles has increased in recent years. By the end of 2020,over 10 million EVs had already been registered worldwide [1]. Compared to 7.3 millionregistered EVs by the end of 2019 [2], this was a remarkable development, accelerated bynational and international policies and targets as well as a rethinking in society regardingclimate protection measures. Nevertheless, to achieve global climate protection goals(e.g., Paris Agreement [3]), the number of EVs to replace gasoline-fueled vehicles mustincrease significantly.
The European Union (EU) aims to reach climate neutrality by 2050 [4] and thusa share of 100% of zero-emission vehicles (ZEV) in the whole vehicle stock in the EU by2050 [5]. The transport sector has a significant influence on greenhouse gas emissions:in [6], the authors emphasize that the transport sector (including aviation and shipping)has a share of one third (32%) of total CO2 emissions in the EU, whereas 72% of theseemissions were caused by road transport in 2017. In addition, ground transport accounts
Energies 2021, 14, 8399. https://doi.org/10.3390/en14248399 https://www.mdpi.com/journal/energies

Energies 2021, 14, 8399 2 of 21
for 15% of today’s worldwide energy-related CO2 emissions [7]. Hence, the ambitious goalof the EU and other countries and regions regarding EVs can help to reduce the globalwarming caused by humans.
However, the increasing sales volume of EVs leads to challenges. One such challengeis the installation of a sufficient number of charging stations to handle the increasingdemand. The common charging systems can be divided into slow chargers (3–7 kW, AC),normal chargers (11–22 kW, AC), fast chargers (50–100 kW, DC), and ultra-fast chargers(>100 kW, DC) [8]. Depending on the charging power, battery capacity, and state ofcharge (SoC), average charging times vary between less than 20 min (ultra-fast) and up to7–16 h (slow) [8]. A more detailed technical introduction to the several charging modes ispresented in Section Two.
The majority of EV owners charge their vehicles at home or work [1]. Nevertheless,the expansion of public charging systems plays an important role, particularly for peoplewho live in apartments without the possibility of charging their EVs at home. Furthermore,public charging systems, especially fast and ultra-fast chargers on highways, are necessaryfor long-distance traveling [8]. Hence, an increasing number of charging stations in publicareas could be an incentive to purchase EVs.
In 2020, 1.3 million public charging stations had been installed worldwide, of which30% were fast chargers (above 22 kW) [1]. The majority of these chargers (500,000) wereinstalled in China. According to the report [9], the total number of charging stations inpublicly accessible areas in the United States increased in the third quarter of 2020 to88,093. The EU has already installed 250,000 public charging stations (e.g., 63,000 in theNetherlands) [1]. With regard to the target of 1 million public charging and refuelingstations for ZEV and low-emission vehicles by 2025 as stated in the European GreenDeal [10], there is a considerable gap between the set goals and the current progress. Thus,companies, research institutions, municipalities, and policymakers in the field of EVsneed to develop, among others, charging technologies, charging strategies, and a legalframework (incentives, etc.) to close this gap, as this is one of the greatest barriers to thepurchase of EVs [11].
1.2. The Potential of Multi-Vehicle Charging
The charging infrastructure is a key factor in the successful change to a climate-friendlytransport sector as mentioned above. Today, the majority of DC charging stations provideonly one or two dedicated charge points per set of power electronics. In this scenariothat EVs remain parked at the charger after finishing the charging process, the chargingstation is blocked for use by other EVs. This produces a conflict for fast chargers in urbansettings, as the average length of time parked is generally great when compared to thetime needed to charge the EV, which is generally less than 1 h, depending on the availablepower of the fast charger and the EV. The authors in [12] anticipate an average publiccharging station utilization per day of 4.7 h, at 100,000 vehicles per million population,in metropolitan areas for normal and fast chargers in the UK. The utilization is expected toincrease as the normalized number of EVs rises. The average utilization time is still low,and the demand for public chargers likely focused around specific times of day, e.g., rushhour. This means that DC-fast chargers with the ability to supply more than one or twocharge points have the benefit of providing additional low power charge points duringpeak demand times and fast charging capability in off-peak hours. This increases theoverall utilization of the charger. In addition, the charging power under real conditionsdepends on the battery management system and ambient temperature. Furthermore,manufacturers apply different charging profiles for the constant-current/constant-voltage(CCCV) charging method [13]. Therefore, it must be acknowledged that the maximumavailable charging power of a fast charging station is not required over the entire durationof the charging process. Thus, the development of a charging station with multiple chargepoints and multiple dynamically interconnected power electronics modules presented

Energies 2021, 14, 8399 3 of 21
in this paper (see Section 3) can increase the utilization factor of the power electronicssignificantly.
1.3. Research Environment—The Catenary Grid of Solingen
About 300 trolleybus systems are currently in use around the world in 43 differentcountries. In the German city of Solingen, where the battery-overhead-bus (BOB) projecttakes place, a large overhead grid, spanning about 100 km of power-line, had supplied asignificant share of the local public transportation for nearly 70 years. On routes withoutor with only partially available overhead lines, diesel-powered buses, and their respec-tive supplementary diesel units had always proven necessary until, in 2018, BOBs wereintroduced on one test line to overcome this limitation, allowing a fully electrified bus fleetin the near future. A smart trolleybus system (STS) is created to improve environmentalsustainability and economic efficiency. The STS, presented in Figure 1, is supplemented byrenewable energy and local energy storage and combined with bidirectional substations,sophisticated control algorithms, and overhead-line-driven public fast charging stationspresented in this paper. This project is funded with EUR 15 million by the German FederalMinistry of Transport and Digital Infrastructure and is called BOB Solingen.
Photovoltaic Systems
Battery-Overhead-Bus(charging & discharging)
BidirectionalSubstations
Stationary BatteryStorages
Smart Multi-Vehicle DC/DCCharging Infrastructure
Cloud Server
Picture: Chair of Power System Engineering – University of Wuppertal
Figure 1. Schematic Concept of the STS in the City of Solingen.
2. State of the Art
The state of the art of fast charging electric vehicle charging stations is examined below.The first section focuses on hardware, and the following discusses the relevant standardsinvolved, and the current control algorithm.
2.1. Hardware Fundamentals
The international standard IEC61851-1 defines four modes of EV charging, whichare shown in Table 1. In general, in mode one, the charging current is defined by theterminal interface and cannot be controlled as there is no communication between the EVand the power outlet. Mode two and three use a pulse width modulation (PWM) signalfor communication to transmit the maximum current limit of the electric vehicle supplyequipment (EVSE). The charging power for mode two, however, is low, with a maximum of22 kW. Only modes three and four can be classified as fast charging. Mode four necessitatesa digital bidirectional communication protocol, either via a controller area network (CANbus) or power line communication (PLC).
Modes one and two are commonly used for home charging in residential areas withlong parking durations due to the low power transmission. Since AC fast charging ispossible with mode three utilizing its maximum power of 43.5 kW, this mode is suitable forcharging stations in urban areas providing charge points for medium duration parking.With AC-charging, although the actual charger is located inside the EV, each charge pointneeds a dedicated supply equipment charge controller (SECC) for communication. AC-charging has the disadvantage that the AC/DC converter has to be located inside the

Energies 2021, 14, 8399 4 of 21
vehicle, which adds to weight and lowers the range. The power electronics for DC-chargingare typically located in a remote enclosure separate from the charging pole. To generatethe necessary output power, charging station manufacturers already tend to split powerelectronics into several separate modules in parallel [14]. For example, Tesla’s superchargerutilizes 12 modules [15]. ABB uses two modules each in their Terra 184 and Terra HPchargers [16,17]. Most charging stations are designed to provide two charge points to servemultiple clients at the same time. All modules work in parallel if only one EV is connected,but the modules will be evenly separated when a second EV connects to the pole. Both EVswill hence be served with a maximum of half the total power. This scheme can be developedfurther to serve even more charge points, supplied by the same total output power.
Table 1. IEC61851-1 Charging Modes.
Mode 1 2 3 4
EV power supply AC AC AC DCcommunication none PWM PWM PWM and digitalcharging currentcontrollability
EV only EV only station and EV station and EV
max. current 16 A 32 A 63 A up to 400 Amax. power 3.7 kW (1p)
11 kW (3p)7.4 kW (1p)22 kW (3p)
14.5 kW (1p)43.5 kW (3p)
up to 400 kW
Several different converter module topologies have been investigated and can possiblybe used to build the isolated DC/DC stage of the EVSE. One of these topologies is theconventional dual active bridge (DAB), shown in Figure 2a, which was one of the mostprevalent bidirectional converters historically. The DAB converter has the disadvantageof a limited ability to reduce the switching losses by zero-voltage-switching (ZVS) orzero-current-switching (ZCS) of its full bridges under light load, known as soft switching.Additionally, it has a high sensitivity towards variations in the leakage inductance of itstransformer [18,19]. This and the advancements in the semiconductor industry, such asstable silicon carbide and gallium arsenide power MOSFETs, is why resonant bidirectionalconverters, which enable higher switching frequencies, have been gaining interest inresearch and industry. Their major advantage is that they are, in principle, capable ofsoft switching over a broad load range and do so at reduced circulating energy. Severalpromising bidirectional resonant converter topologies have been proposed; all of them aresimilar to the conventional DAB converter in makeup but use frequency control insteadof phase shift control. One of these is the bidirectional full-bridge converter that uses twoinductors (LL) and a capacitor (C), known as an LLC configuration, shown in Figure 2b,proposed by T. Jiang et al. [18]. It generally has the advantage of soft switching capabilitiesin the vehicle to grid (V2G) and grid to vehicle (G2V) operation and high efficiency.However, the voltage gain of the bidirectional LLC is lower than the voltage gain ofunidirectional LLC resonant converters. This means that it potentially cannot be used as asingle stage converter in a DC grid with varying grid voltage. A topology with a highervoltage gain is the full-bridge converter shown in Figure 2c that uses three inductors (LLL)and two capacitors (C), known as the CLLC or CLLLC resonant converter [20]. The CLLCcan be designed symmetrically, with the same transformed component values for bothhalves of the resonant tank, or asymmetrically. Both the symmetrical and the asymmetricalCLLC have the upside of soft switching in both directions of power flow. The design ofthe resonant tank, however, is significantly more complex for the asymmetrical CLLC, asthe asymmetry of its resonant tank produces differing transfer characteristics for the V2Gand G2V operation. The topology developed and used in this paper is the symmetricalCLLC resonant converter, originally introduced by J. Jung et al. [21]. The symmetricalCLLC has a zero voltage switching inverter stage and a zero current switching rectifierstage. Both the symmetrical and the asymmetrical CLLC necessitate active rectification toreduce the losses produced by the MOSFET body diodes. Silicon carbide MOSFETs are

Energies 2021, 14, 8399 5 of 21
used for the rectifier stage. Because silicon carbide MOSFET body diodes have a significantforward voltage drop of >6 V, a passive rectification results in a significant power loss.The active rectification, on the other hand, usually requires multiple Rogowski coils tomeasure the resonant tank currents to synchronize the rectifier. The symmetrical CLLC,however, enables a simplified sensorless active rectification [22], which reduces hardwarespace and cost.
S1
S2
S3
S4
S5
S6
S7
S8
C1VIN C2 VOUT
Lh
S1
S2
S3
S4
S5
S7
S7
S8
C1VIN C2 VOUT
Crp
Lrp
Lh
(a) (b)
S1
S2
S3
S4
S5
S6
S7
S8
C1VIN C2 VOUT
Crp Crs
Lrp
Lh
Lrs
(c)
Figure 2. Comparison of converter topologies. (a) Conventional Dual Active Bridge, (b) BidirectionalLLC Resonant Converter, (c) Bidirectional CLLC Resonant Converter.
2.2. Communication Standards
The most prevalent DC-charging standards in Europe are CHAdeMO, which is anabbreviation of “CHArge de MOve,” equivalent to “charge for moving” and the combinedcharging system (CCS), with CCS being mandatory for DC-chargers in Germany. The CCScommunication standard is defined in the ISO-15118 and demands a digital communicationthrough powerline, fed into the control pilot lines of the CCS/Type-2 plug. The standard,in its newest versions, covers bidirectional, DC and AC charging, plug and charge, the nego-tiation of charge schedules between the EVSE and the EV, and the exchange of all necessaryinformation needed for the implementation of a load management system, e.g., informationsuch as the energy needed to fully charge the EV and the total battery capacity. However, asimplified transitional version of the ISO-15118, called the German technical specificationDIN SPEC 70121, based on an early unpublished version of the ISO-15118 standard, waspublished in 2012. The first version of the ISO-15118 was only published in late 2014.The DIN SPEC 70121 does not support scheduling, bidirectional, or AC charging and isstripped of most of the data intended for load management systems. Its original purposewas an accelerated development time, leading to the introduction of a broad fast charginginfrastructure. This now has the side effect of significant interoperability problems, which,in turn, cause increased software development time for charging station and electric vehiclemanufacturers. That and the fact that many EVs currently only support the transitionalstandard are why the limited DIN SPEC 70121 has become somewhat of a de facto CCSfast charging communication standard in Germany. Therefore, load management systemsfor CCS-chargers, for interoperability reasons, must still be able to handle the limitationsof the DIN SPEC 70121 protocol. Table 2 depicts some of these functional differencesbetween the DIN SPEC 70121, version one of the ISO-15118 protocol, and version two,called ISO-15118-20.
Energies 2021, 14, 8399 6 of 21
Table 2. Functional Differences between CCS-Communication Protocols.
Protocol DIN SPEC 70121 ISO 15118 ver.1 ISO 15118 ver.2
DC-Charging X X XAC-Charging 7 X XLoad Management 7 X XPlug & Charge 7 X XSecured Communication 7 X XBidirectional Charging 7 7 XInductive Charging 7 7 X
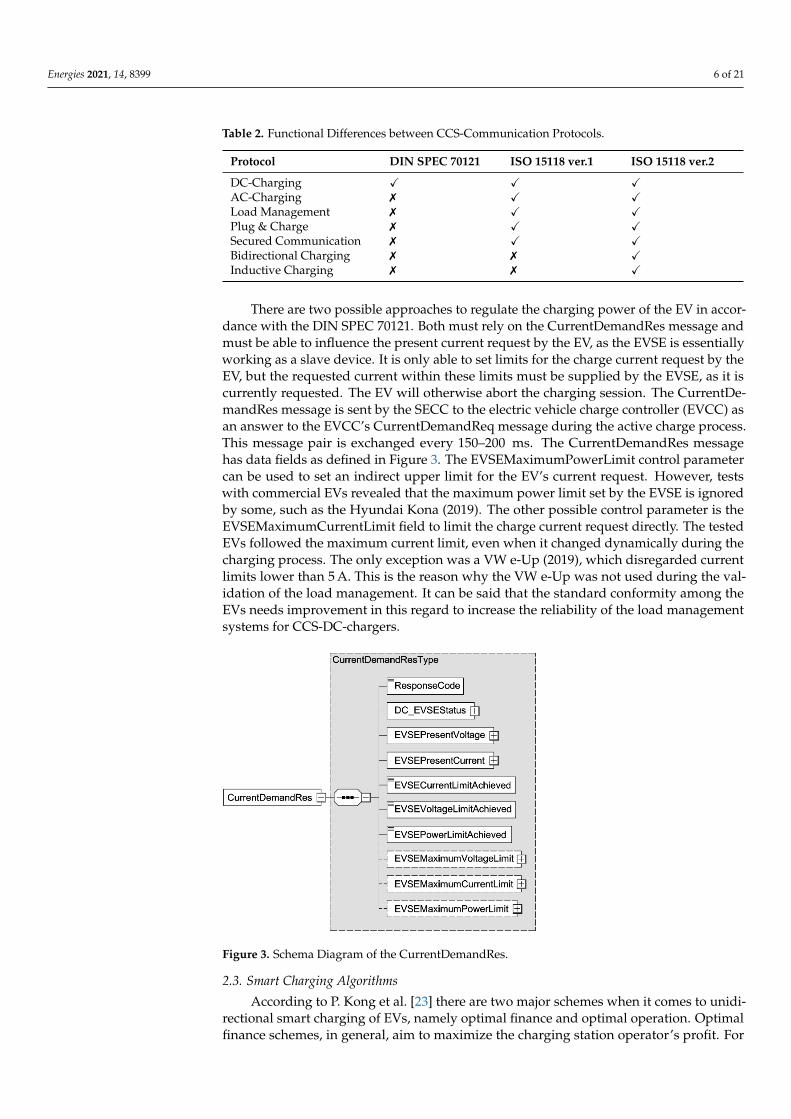
There are two possible approaches to regulate the charging power of the EV in accor-dance with the DIN SPEC 70121. Both must rely on the CurrentDemandRes message andmust be able to influence the present current request by the EV, as the EVSE is essentiallyworking as a slave device. It is only able to set limits for the charge current request by theEV, but the requested current within these limits must be supplied by the EVSE, as it iscurrently requested. The EV will otherwise abort the charging session. The CurrentDe-mandRes message is sent by the SECC to the electric vehicle charge controller (EVCC) asan answer to the EVCC’s CurrentDemandReq message during the active charge process.This message pair is exchanged every 150–200 ms. The CurrentDemandRes messagehas data fields as defined in Figure 3. The EVSEMaximumPowerLimit control parametercan be used to set an indirect upper limit for the EV’s current request. However, testswith commercial EVs revealed that the maximum power limit set by the EVSE is ignoredby some, such as the Hyundai Kona (2019). The other possible control parameter is theEVSEMaximumCurrentLimit field to limit the charge current request directly. The testedEVs followed the maximum current limit, even when it changed dynamically during thecharging process. The only exception was a VW e-Up (2019), which disregarded currentlimits lower than 5 A. This is the reason why the VW e-Up was not used during the val-idation of the load management. It can be said that the standard conformity among theEVs needs improvement in this regard to increase the reliability of the load managementsystems for CCS-DC-chargers.
Figure 3. Schema Diagram of the CurrentDemandRes.
2.3. Smart Charging Algorithms
According to P. Kong et al. [23] there are two major schemes when it comes to unidi-rectional smart charging of EVs, namely optimal finance and optimal operation. Optimalfinance schemes, in general, aim to maximize the charging station operator’s profit. For

Energies 2021, 14, 8399 7 of 21
example, in [24], the arrival time, energy demand, and departure time of each vehicleconnected to the charging station was gathered, and a charging schedule was calculateddepending on the wholesale markets energy prices, with the goal to achieve the lowestpurchasing prices while also satisfying the customer’s need for a fully charged vehicle.The energy flow in the distribution grid was examined in [25]; the energy demand wasregulated to reduce power losses.
Optimal operation, however, concentrates on flattening the grid load profile [26,27] orserving as many customers as possible despite grid level power limitations. For example,in [28], the sharing of given limited power to several EVs is performed by calculating anadequacy level for each connected EV according to the charging power that the EV expects,the capacity of its battery, and the total amount of power to be shared. Another criterion inoptimal operation schemes is the fairness of the charging process for all participants. So,in [29], a charging priority level was calculated using fuzzy logic, considering the departuretime, the battery SoC, and the electricity tariff. However, most schemes in the literaturehave only been simulated, and no investigation on real hardware has been performed.The load management proposed in this paper is an optimal operation scheme to maximizethe hardware utilization rate, as well as charging fairness, by considering the EV owner’srequest for specified energy to be delivered during the time parked.
3. Object of Investigation and Methodology
As mentioned in the introduction, one of the major challenges of future EV charginginfrastructure will be the competition between parking and charging time of an EV. A fullycharged vehicle that blocks the access point for other cars and reduces the overall utilizationtime of a classic charging station will produce a tangible financial loss for charging stationoperators, especially in urban settings with parking space shortages. This, however, maylead to an overcompensation effect by a large-scale development of charging stationsand high-powered grid connections, of which only a few would be used simultaneously.To avoid this kind of oversizing and deal with the volatile energy supply of Solingen’scatenary grid, the following concept of a DC/DC multi-vehicle-charging-station and thecorresponding load management has been developed, constructed, and tested within theframework of the project already described.
3.1. The DC/DC Multi-Vehicle-Charging Concept
This setup allows the charging station to deal with a volatile grid and simultaneouscharging requests. To ensure efficient usage of the charging point by up to four connectedEVs, the charging strategy described by the following algorithm is applied.
The investigated charger is depicted in Figure 4a. The remote supply feeds fourcharge points with a maximum total output power of 50 kW. The remote supply comprisesfour bidirectional 12.5 kW DC/DC-resonant converter modules (see Figure 4b). Each ofthese converters is connected to its own array of output relays, called switching matrix,shown in Figure 4c. The switching matrix connects each converter output to one offour charge points. Thus, it is possible to divide the maximum output power into stepsof 12.5 kW and distribute them arbitrarily to the four points. The DC/DC-convertermodules are bidirectional CLLC resonant converter prototypes and provide a maximumcharging current of 30 A, each over a voltage range of 250–435 V. The charging voltageis galvanically isolated by the converter module. The switching matrix is a safety-criticalsystem, as erroneous closing of the relays, as well as welded contacts, could short-circuitand potentially damage multiple EV batteries. The possibility of short circuits as the resultof a switching matrix fault can be prevented with output diodes, as they prohibit thecurrent reversal. However, simple output diodes are no solution for bidirectional chargers,since the reversal of the current is needed in the V2G operation. Multiple strategies havebeen implemented to prevent erroneous contact closing and to monitor the state of healthof the relay contacts. The relay drive signals are interlocked through software and analogcircuitry, but contact welding can still occur. This may be the result of inrush currents, as

Energies 2021, 14, 8399 8 of 21
the relay normally turns on, or by arcing, as the relay turns off while conducting current.The state machine shown in Figure 5 is used to prevent both. The relay to be turned onis blocked from doing so, unless the difference between the module’s output voltage andthe charge point voltage, to which the module is supposed to be connected, is less than10 V (Figure 5f). The module will otherwise pre-charge to the desired voltage (Figure 5a).The relay is enabled at the end of the pre-charge if the voltage difference is reduced to<10 V (Figure 5b). Enabled relays are blocked from turning off if they currently conduct(Figure 5g). The relay turn off is possible if its associated converter module has confirmedto be disabled or in fault state (Figure 5c). The module output voltage is then monitoreduntil it falls below 90% of the charge point voltage. The relay contacts are welded if thevoltage is not decreasing or decreases too slowly (Figure 5d). In this case, the switchingmatrix will consequently be blocked and the associated module and charge point will bedisabled. The remaining modules, switching matrices, and charge points remain functional,only with reduced maximum total output power.
Figure 4. (a) Remote Supply, (b) Converter Module, (c) Switching Matrix Module.
Exemplary switching events between two charge points are depicted in Figure 6. Fourmodules supply two charge points, starting with an equal distribution of two modulesper charge point, delivering 25 A each. The load management determined to move oneconverter from charge point one to charge point two. This happens at Figure 6 point (a).Charge point one, shown in black, is now notified to decrease its requested current from50 A to 25 A, through the EVSEMaximumCurrent data field of the CurrentDemandResmessage. The EV now decreases its requested current in a linear ramp. It should benoted that the rate of change of the requested current is not the same for all EVs; it variessignificantly between different EV models. The converter module and the correspondingrelay are disabled at Figure 6 point (b), since the requested current is lower than the presentcurrent limit for the charge point. The current dip between Figure 6 points (b) and (c)happens as follows: the now-disabled module disables its output, while the remainingmodule continues to supply only half the requested current by the EV. The module’scurrent output adapts to the reduced number of parallel modules when the switchingmodule confirms that it is disabled. This causes a large communication delay but ensuresthat no overcurrent is supplied to the charge point. The welding detection finishes atFigure 6d, at which point the module starts to precharge to the target voltage, which isreached at point Figure 6e. The relay is subsequently enabled, and the target current for allconnected modules is set to equal the requested current by the EV, divided by the numberof connected modules. This is the reason why the output current dips between points (e)

Energies 2021, 14, 8399 9 of 21
and (f) of Figure 6, until the newly connected converter module finishes its soft start. TheEV is notified of the increased maximum charge point current and may then increase itscurrent request in a linear ramp. The switched converter is not supplying energy betweenpoints (b) to (e) of Figure 6, which can last up to 12 s, depending on the voltage differencebetween the present EV battery voltages and the rate of discharge of the module outputcapacitors during the welding detection. Each module is allowed to switch at most onceevery 30 s to limit the number of switching events during a charging session, and to reducethe wear on the relay contacts.
Disconnectedstart Matrix Error
Precharge
Connected to CPx
Welding Detection
(a)
(f)
(c)
(g)
(e)(d)
(b)
Figure 5. The Switching Matrix State Machine. (a) Relay Turn on Request, (b) Relay Turn on, (c) RelayTurn off Request, (d) Module Output Voltage not Decreasing, (e) Relay Turn off, (f) Relay Disabledand (g) Relay Enabled.
(a)(b)
(c) (d)
(e)
(f)
Figure 6. Switching of one Converter Module. (a) Relay Turn off Request, (b) Relay Turn off,(c) Current Limit Adjustment, (d) Relay Turn on Request, (e) Relay Turn on and (f) Current LimitAdjustment.

Energies 2021, 14, 8399 10 of 21
A charging session is started by a user charging request, which contains certaininformation, e.g., battery capacity, remaining charging/parking time, or the target SoC, andtriggers a pre-allocation procedure to calculate the expected CS utilization. This includesthe catenary grid load (provided by another sub-system) and a power analysis of the otheralready connected vehicles as well. In case of a successful validation, the user receivespositive feedback and can continue to start the charging process. Otherwise, they areencouraged to readjust charging parameters (e.g., lower target SoC or a prolonged parkingtime). Thus, the pre-allocation procedure can be executedt in two different ways, eitherto achieve simultaneous charging of all connected vehicles or maximum utilization of thecharging station. A minimal example to visualize both procedures is displayed in Figure 7.
Time
State of
Charge
0.55
0.35
0.70
State of
Charge
0 h 0 h
EV1
EV2
(a) (b)
1.0 h 2.0 h
50 kW 50 kW
50.0 kW
50 kW
1.0 h 1.5 h
50 kW 0 kW
37.5 kW
2.0 h
Figure 7. Load Management Strategies. (a) Consecutive Charging, (b) Simultaneous Charging.
This example shows a common situation where two individual EVs reach the chargingstation at the same time and initialize two different charge requests. All parameters likebattery capacity (100 kWh), start (0.2) and target (0.7) SoC, and the maximum chargingpower (50 kW) are identical for both cars except the parking/charging time, which is 1.0 hfor EV1 and 2.0 h for EV2. Hence, the mean charging request value for both vehicles isdifferent (EV1 = 50 kW and EV2 = 25 kW). Combining both results in an overload with75 kW for the first and an underutilization with 25 kW in the second half of the chargingsession. The overall mean charging power needs to be reduced to 50 kW by one of thefollowing procedures due to power restrictions.
Starting with the first case (Figure 7a), which is characterized by a complete utilizationof the charging station, the pre-allocation procedure would sort the different chargingrequests consecutively by its last starting point to reach the target SoC. The presentedconstellation allows a complete recharge of both vehicles by postponing the second one foran hour to use the full power of 50 kW in the other half of the parking/charging time. Thisleads to a theoretical overall utilization of exactly 50 kW or 100% and a positive validationduring pre-allocation, which might be desirable. However, a simple example reveals aproblem. The EV might not yet have been charged if the owner wants to depart earlierthan initially requested and the EV priority was low during pre-allocation. The consecutivecharging strategy additionally assumes that all EVs are able to receive the 50 kW duringthe entirety of the bulk charging. However, this assumption is incorrect and results insignificant management errors, because the undersupplying of the EV as the result of alimited charging capability of the EV cannot be compensated through increased powerallowance. A simultaneous charging (weighted by the individual charging requirement) isnecessary, which reduces the target SoC of at least one vehicle during the pre-allocationof the charging sessions (reduced to 0.55 in this case), to avoid this kind of restriction.This strategy is displayed in the second case (Figure 7b) and illustrates the differences toconsecutive charging. The target charge power is not reached by focusing on only onevehicle, but rather with the partial supply of both vehicles. The result is a parallel SoCincrease for both vehicles with different gradients, which can be sensitively adjusted by adeviating parameterization in the pre-allocation procedure. The mean utilization duringthe 2 h charging period is just 37.5 kW in comparison to the 50 kW mean power of the

Energies 2021, 14, 8399 11 of 21
consecutive charging case, but the simultaneous charging provides higher flexibility, e.g.,to compensate energy supply fluctuations by the catenary grid or to reopen the chargingstation earlier for further vehicles.
After passing the pre-allocation procedure successfully, the charging process starts.Henceforth, the assignment algorithm of the load management system controls the chargepower limit of each vehicle. A value called feeding compensation account (FCA) is usedby the algorithm to ensure a fair weighted power assignment and represents the amountof energy necessary to compensate for the over- or underfeeding of a specific vehicleduring the next charging period. While an FCA value near zero corresponds to a strictfollowing of the pre-allocated charge curve, a negative FCA indicates an underfeeding, andconversely, a positive FCA points to an overfeeding. The value itself is calculated as thedifference between the assigned charge power and the remaining energy volume dividedby the remaining charge time and is finally added to the summation of previous FCAvalues. The algorithm starts with a case analysis and divides the charging EVs into threegroups, negative (underfed), zero (newly started), and positive (overfed) FCA to assign thecorrect charge power to each vehicle. In case at least one vehicle is in the negative group,all available 12.5 kW phases are shared among this group to compensate for the currentunderfeeding. If the negative group is empty, the assignment considers just the vehiclesin the zero group. The positive group receives charge power only if no other group hasmembers. Frequently, there is more than one EV in a group, which requires a tolerablesharing of the up to four available phases. Therefore, the algorithm iterates through thespecific group, calculates the individual FCA share for each vehicle, and allocates theconverter modules based on a parameterized assignment matrix. The matrix contains aset of different distribution parameters depending on the absolute number of installedcharge points. Hence, the current amount of available charge modules and the numberof connected EV are represented in lines and columns and the combination of both givesthe specific assignment directive. The following example illustrates the procedure. EV1with the maximum FCA (highest charge demand) has a share of 0.52 (two other connectedEVs and three available modules) and requests a CPA for the next period. The thirdcolumn and line of the assignment matrix supplies two values 0.65 and 0.35 which arethe distribution barriers for this constellation. Due to 0.52 < 0.35 = f alse (one module),0.52 > 0.35 = true (two modules), and 0.52 > 0.70 f alse (three modules), EV1 recives twocharge modules for the next period, and the remaining one is going to be assigned to oneof the other two EVs. This procedure ensures compliance with the charging conditions andprovides a fair distribution of the available charging power. Figure 8 presents the wholeassignment algorithm.

Energies 2021, 14, 8399 12 of 21
EV arriving and charge request
CPR =SoCv ⋅ Cv ⋅ SP
tstop,v − tstart,vACSP ⋅ SB
ACSP =tstarttstop GU, CSU
tstop,v − tstart,v
if CPR ≥ ACSP 𝐭𝐡𝐞𝐧 ഥPEVv = PR 𝐞𝐥𝐬𝐞 ഥPEVv = CPR
CSU
Fee
db
ack
/Ad
just
men
t
FCAt,v < 0
ChargePower
Assignment
AMcp,v1 AMcp,v2AMcp,vn
Pre
−Allocation
FCAt,v = Passign (cp,v) −Eremaining (t,v)
tstop,v − t⋅ cp + FCAt−1,v
FCAt,v = 0 FCAt,v > 0
FCAt,v
σv=1n FCAt,v
FCAt,v−1
σv=1n FCAt,v
−1
1
σv=1n v
1 1
1 0.80
1 1
0.85 0.90
1 0.75
1 0.70
0.65,0.35 0.70,0.50
0.60,0.30 0.50,0.40,0.30
MTD − AM
while
MTD>0
end of charging session with the last disconnected EV
next charging period
GU Grid UtilizationCSU Charging Station UtilizationACSP Available CS Powertv,start/stop Charging Station UtilizationCRP Charge Power RequestSoCv State of Charge of the Vehicle v Battery at tstartcv Battery Capacity of Vehicle vP̄EVv Mean Charging Power of Vehicle vFCAt,v Feeding Compensation Account of Vehicle v at time tPassign,(cp,v) Assigned Charge Power of the current Period
with: Passign = AM · ModuleEremaining,(t,v) Remaining Energy until tstopcp Duration of a Charging PeriodMTD Modules to distribute for the next cpAMcp,v Assigned Modules for Vehicle vs. during the next cp
Figure 8. Load Management Algorithm.
3.2. Scenario Description
This section describes the cases used to validate the concept, some of which wereevaluated through simulation and others implemented in practice.
3.2.1. Classic Use Case—Simulation and Measurement
Due to certain restrictions concerning experiments and equipment, e.g., the availableamount of rechargeable EVs, it is not possible to prove all imaginable scenarios by realmeasurements. That is where simulations are used to analyze different variations of chargerequests with one, two, or more vehicles. The first scenario is a use case, where twovehicles with a different average power need are charging at the same time. The sum oftheir average power needs, however, is less than 50 kW. The EVSE should therefore be ableto charge both EVs to the requested SoC during their parking time. The user information,corresponding to the measurement, was supplied as follows: requested parking time equalto 30 min for both EV1 and EV2, target SoC equal to 75% for EV1 and 62% for EV2. EV1has listed a battery capacity of 39 kWh, and EV2 has a battery capacity of 32 kWh. This caseis both simulated and tested on commercial EVs.
3.2.2. Double Split by Preferences—Simulation
Another scenario is called the double split and represents a situation where two vehi-cles connect to the charging station at the same time but with different parking/chargingdurations. The simulated scenario includes EV1 with a requested energy amount of 50 kWhand a parking time of just one hour. EV2 requests the same amount of energy but extends

Energies 2021, 14, 8399 13 of 21
its parking time up to two hours. A possible real life example could be a charging stationnext to a supermarket or a pedestrian area.
3.2.3. Trio Simultaneously—Simulation
Besides the double scenarios, it is theoretically possible to charge three vehicles at thesame time, but due to a lag of further EVs, this kind of analysis is carried out just by asimulation. Therefore, the input data are three vehicles with a charging time of one hour,battery capacity of 30 kWh, and a target SoC difference of +50%, which leads to a totalamount of energy of 15 kWh per car.
3.2.4. One against Three—Simulation
An enhancement of the previous scenario might be another common situation, wherethree EVs with equal charging requirements are already charging, and a fourth vehicle witha significantly higher power request and therefore higher priority arrives at the chargingstation. In this case, three EVs have the following identical parameters: start SoC of 0.2,target SoC of 0.7, battery capacity of 20 kWh, and a parking/charging time of one hour.EV4 arrives late and requests an energy volume of 22.5 kWh within 30 min of charging andthus demands a higher priority regarding the future charge power assignment.
3.2.5. Full Charging with Module Shedding—Measurement
Concerning the well-known characteristic of electro-chemical energy storage such asbatteries, marked by the decreasing ability to deal with high charging currents above anSoC of around 0.8, and due to negative side effects such as temperature rise or a reducedbattery life cycle. Therefore, the individual response of different vehicles to a continuousshedding of charging modules is going to be measured during an experiment wheremodules are switched off one by one along a decreasing charging current. In a real-life usecase, this procedure might be useful for opening the charging station for other possiblecharge requests.
3.2.6. Overall Daily Performance Potential—Simulation
The final scenario distances itself from specific use cases and focuses on the dailyperformance potential, which is mainly linked to the business interests of common charg-ing infrastructure operators. For these, the efficiency of a charging station in terms of thetransferred energy volume or the utilization hours are important to calculate economi-cal key factors such as the return on investment (ROI) to validate the profitability of acharging station.
4. Results and Discussion
The charging profile of the EV can be complex and is generally unknown to theEVSE. The load management, therefore, must assume a default charging profile to adjustits projected average power demand for the EV. One simplification would be to assumethat the electric vehicle accepts all the allowed power/current if it lies within the EV’smaximum power and current limits. This assumption would be incorrect if the EV is notcharged to about 80% SoC, called bulk charging, but is charged fully. All EVs will eithergradually or abruptly reduce the charging current at bulk SoC, eventually even down toabout 1 A. The EV communicates a generic bulk SoC value to the EVSE but may start toreduce the requested current before reaching it. The actual start of the charging currentreduction, by the EV, depends on the battery type, battery management system, and thebattery’s temperature. So, the same vehicle could have a significantly different chargingbehavior depending on the battery’s state of health [30]. This produces uncertainty forthe planning of the load management. The inconsistent reduction in the requested currentcan lead to scenarios where one vehicle with a negative FCA will eventually be assignedall converter modules, while only being able to accept a fraction of the available powerthat is being assigned to the charge point. This necessitates that converter modules are

Energies 2021, 14, 8399 14 of 21
taken from and no longer given to charge points if Equation (1) is fulfilled, with n being thenumber of parallel modules connected to the charge point. The shedding of modules hasthe additional advantage of a higher overall module loading, because resonant converters,like most converters, have a decreased efficiency during the light load operation [22].
IRequested < Imodulemax · (n − 1) (1)
4.1. Classic Use Case—Simulation and Measurement
Starting with the simulation part of the first scenario, Figure 9 presents the results inthree separate data plots. While the X-axis always shows the number of iterations (secondsfor a one-day simulation), the Y-axis represents the FCA value (Figure 9a), the assignedcharge power (Figure 9b), or the state of charge (Figure 9c). In the current case, the positiveFCA value for both vehicles represents a moderate utilization of the charging station, whichleads to achieving the target SoC; hence, the assigned charge power alternates back andforth between the two EVs. In general, besides minor deviations, this behavior should alsobe apparent during the following measurements.
17.8
Simulation Iteration [103 s]Simulation Iteration [103 s] Simulation Iteration [103 s]St
ate
of
Ch
arge
20
10
0
30
40
50
Ch
arge
Po
wer
Ass
ign
men
t[k
W]
FC
A V
alu
e
2
0
1
EV1EV2
0.4
0.3
0.2
0.5
0.6
0.7
18.0 18.2 18.4 18.6 18.0 18.2 18.4 18.6
EV1EV2
EV1EV2
18.0 18.2 18.4 18.617.8
(a) (b) (c)
Figure 9. Classic Use Case. (a) Feeding Compensation Account, (b) Charge Power and (c) Stateof Charge.
A measurement with two connected EVs is depicted in Figure 10. It can be seen thatthe EVs started their charging process practically at the same time. They do, however, havedifferent energy demands. The charging power at the two charge points alternates, as pre-dicted by the simulation, even though the FCA is positive for both EVs. At the beginningof the charge process EV2 has the higher average power demand and is consequently giventhree of four modules. EV1 is supplied by the remaining module, as observed at the end ofthe first evaluation. EV2 now develops a positive FCA, while EV1’s balance is negative.This causes the switchover of one module from EV2 to EV1 at the end of the second eval-uation. EV1 is then developing a positive FCA, as it receives more energy than it needs,and EV2 is reducing its still positive FCA because it is being undersupplied. The nextevaluation results in one module being switched back to charge point two. This time,however, both FCAs are at a positive balance, and the switching of the modules accordingto Section 3.1 avoids potential unfairness during the charging process. A possible staticdistribution of three or four modules at charge point one and one or no module at chargepoint two would have caused charge point one to fulfill its charge request significantlyearly. EV2 would afterward be charged with all four modules for the remaining time. Thisonly works out to be as fast or faster than the proposed method if the EVs can accept thepower allowance. This has been shown to not necessarily be the case. It is, therefore, likelythat a static distribution of the converters results in a slower charging request fulfillmentthan the proposed method and does not consider concepts of fairness.

Energies 2021, 14, 8399 15 of 21
(a) (b) (c)
Figure 10. Measured Charging Process of Two Electric Vehicles Simultaneously. (a) Feeding Com-pensation Account, (b) Charge Power and (c) State of Charge.
4.2. Double Split by Preferences—Simulation
The second scenario differs from the classic use case due to the negative FCA value ofEV1 (displayed in Figure 11a, which results in incomplete charging during the availabletime. That means the total available power of the charging station is not sufficient to meetthe requirements of both vehicles. The EV with the greater energy demand is prioritizedbut will not receive the total available power to guarantee the charging EV2, although atthrottled charging rate. Figure 11c shows the simulation result, which is similar to thealready known qualitative charging strategy representation of the third chapter. The ex-posed jags were evoked by the several charge power changes and depend on the periodlength, and the shorter it is, the more accurately does the result follow the idealized curve.Another point of interest is the beginning of the second half, where EV1 disconnects fromthe charging station, and the whole power of 50 kW is available for EV2, which reachesits target SoC within the remaining parking/charging time. This is why the FCA value ofEV2 is initially negative and finishes the charging being positive. Figure 11b presents theassigned charge power values and reveals an initial oscillation between the later constella-tion of (EV1 = 3 modules, EV2 = 1 module) and an equal distribution of (EV1 = 2 modules,EV2 = 2 modules).
18 19 20 21 22 23 24 18 19 20 21 22 23 24
FC
A V
alu
e
-60
-80
-40
-20
0
Simulation Iteration [103 s]Simulation Iteration [103 s] Simulation Iteration [103 s]
Stat
e o
fC
har
ge
20
10
0
30
40
50
Ch
arge
Po
wer
Ass
ign
men
t[k
W]
EV1EV2
0.4
0.3
0.2
0.5
0.6
0.7EV1EV2
EV1EV2
18 19 20 21 22 2423
(a) (b) (c)
Figure 11. Double Split by Preferences. (a) Feeding Compensation Account, (b) Charge Power,(c) State of Charge.
4.3. Simultaneous Trio—Simulation
The potential of the developed load management algorithm becomes clear in the nextscenario. For the three EVs with a charge request of 15 kWh, each during a simultaneousparking/charging time of one hour, it is not possible to complete their charging successful inthe case of a classic static charge power assignment such as EV1 = two modules, EV2 = onemodule, and EV3 = one module. Thus, the mean charge request of 15 kW is larger than asingle power module with 12.5 kW, which directly leads to an underfeeding of EV2 and

Energies 2021, 14, 8399 16 of 21
EV3. In comparison, an FCA-driven charging process provides an equal SoC increase forall three vehicles (see Figure 12c). The fact that the average requested charging powerof 15 kW is slightly higher than the maximum module power results in the presentedFCA curve of Figure 12a, where all EVs start with negative values and then work theirway back out of this deficit. Consequently, sometimes, one EV receives all modules ifit is the only one with a negative FCA value (see assignment algorithm in Section 3.1).This accelerates the baseline crossing process and brings the vehicles back on a course ofefficient distribution. The zoom box illustrates this behavior, which is also discernible inthe left half of Figure 12b.
20 21 22 23
FC
A V
alu
e
3
1
-1
0
2
EV3
EV1EV2
20 21 22 23 20 21 22 23
Simulation Iteration [103 s]Simulation Iteration [103 s] Simulation Iteration [103 s]
Stat
e o
fC
har
ge
20
10
0
30
40
50
Ch
arge
Po
wer
Ass
ign
men
t[k
W]
0.4
0.3
0.2
0.5
0.6
0.7
EV3
EV1EV2
EV3
EV1EV2
(a) (b) (c)
Figure 12. Simultaneous Trio. (a) Feeding Compensation Account, (b) Charge Power and (c) Stateof Charge.
4.4. One against Three—Simulation
This scenario expands the former use case by an additional vehicle with a significantlyhigher charge request than the other already connected EVs. The mean power demandof the three vehicles combined is 30 kW, which is not a challenge for the charging station,wherefore a positive value is already achieved after a short time and continues to rise untilthe EV4 connects to the charging station. Based on the positive buffer, the three EVs canpause for some charging periods and provide the whole power of 50 kW to the last vehicle,which is perceptible in Figure 13b. The flat shape of the SoC curve during this period isanother indication, as well as the relapsing FCA value of the first three vehicles and, inturn, the increasing value of EV4. This works until the buffer of EV1, EV2 and EV3 isdepleted, which is highlighted in Figure 13a. The simultaneous power request of 52.5 kWexceeds the capacity of the charging station, and whatever the assignment for the nextperiod is, at least one vehicle will always be underfed and further reduce its FCA value.Due to this kind of theoretical overload (physically, the charging station just provides itsrated power of 50 kW), none of the four vehicles will reach their target SoC. The remainingparking/charging time of the first three vehicles is ten minutes after EV4 disconnects fromthe charging station. Their FCA deficit is now too large to be compensated during thelast charging periods, wherefore the value continues to fall even if the vehicles narrowlymissed their target SoC. A sensitive pre-allocation is important to avoid such a mismatch.

Energies 2021, 14, 8399 17 of 21
29 30 31 32
FC
A V
alu
e-6
-8
-4
-2
0
2
-10
-12EV3EV4
EV1EV2
EV3EV4
EV1EV2
EV3EV4
EV1EV2
Simulation Iteration [103 s]Simulation Iteration [103 s] Simulation Iteration [103 s]
Stat
e o
fC
har
ge
20
10
0
30
40
50
Ch
arge
Po
wer
Ass
ign
men
t[k
W]
0.4
0.3
0.2
0.5
0.6
0.7
29 30 31 32 29 30 31 32
(a) (b) (c)
Figure 13. One against Three. (a) Feeding Compensation Account, (b) Charge Power and (c) Stateof Charge.
4.5. Full Charging with Module Shedding—Measurement
Two exemplary charging sessions are shown in Figure 14. The individual modulecurrents are shown as colored lines. The Figure 14a,b show a typical gradual decrease of aMINI SE’s requested charging current, starting from 70% SoC. The four connected convertermodules are, in accordance with Equation (1), gradually disabled and disconnected fromthe charge point. This process works if the current demand strictly decreases. The EVcharging process will then, however, be throttled if the EV increases its current demandagain, after the initial decrease. Figure 14c,d depict this case. The requested chargingcurrent decreases in sudden jumps, until the EV, most likely to calibrate its BMS, reducesthe target current down to 2 A for over one minute and at an SoC of 93%. It then increasesits requested current again to values greater than 40 A. Shedding of modules, with chargeprofiles similar to the one being shown, leads to an unwanted prolonging of the chargingsession. This problem of a faulty load management evaluation due to unknown chargingprofiles can also be present during the bulk charging of the EV battery. A measurement,where the EV requests less current than its allowance and its maximum battery currentduring the bulk charge, is depicted in Figure 15. The EV has a maximum battery current of200 A, and the SoC is below 70%. However, only less than 100 A are requested for most ofthe bulk charge.
(a) (b)
Figure 14. Cont.

Energies 2021, 14, 8399 18 of 21
(c)
100 Charge Point SoC
95
90
85
80 er.)
75
70
65
0 20 40 60
Time [min]
(d)
Figure 14. Two Different Endings of Charging Sessions. MINI SE(2020) in (a,b) and Hyundai KONA(2019) in (c,d).
(a) (b)
Figure 15. Measured Bulk Charging Process of a Hyundai KONA (2019). (a) Charge Current andMaximum Current Limit and (b) State of Charge.
4.6. Overall Daily Performance Potential—Simulation
The final scenario, which represents the overall daily performance, could includeall the previous use cases in one, as all represent real needs of EV users. This, in turn, isimportant for the operator of a charging station to calculate the amortization time or tomake a site selection. Figure 16 shows the assigned charge power throughout a whole dayof simulation and clarifies the potential of the load management algorithm to increase thedaily utilization of a charging station. Comparing the displayed simulation result with thenumber of chargeable vehicles by a classic one connector charging station (same chargerequest density), the energy volume and the utilization hours are nearly 2.4 times higher.This clearly demonstrates the benefit of multi-vehicle charging stations in combinationwith intelligent load management and their ability to operate the charging infrastructure ina customer-friendly and economically profitable manner in the future.

Energies 2021, 14, 8399 19 of 21
3020 40 50 60 70 80
Simulation Iteration [103 s]
20
10
0
30
40
50
Ch
arge
Po
wer
Ass
ign
men
t[k
W]
Figure 16. Overall Performance by Preferences.
5. Conclusions and Future Work
A load management concept for CCS fast charging stations in urban areas, based onthe idea to maximize the charge point availability despite power limitations present on thegrid level, has been proposed. The concept has been tested and validated through tests witha prototype hardware implementation for use in a DC catenary grid and commercial electricvehicles. The measurement results fit the predictions made by simulations and show thatthe active switchover of the converter modules between multiple charge points mitigatessome of the uncertainty that arises from the fact that EVSEs, which are interoperable withthe DIN Spec 70121, have no information about the state of health of the EV battery andtherefore cannot approximate the charging profiles.
According to the different behaviors of individual EVs regarding fluctuating chargingpower, some adjustments to the simulation software as well as the charging station will benecessary. First, the load management must be modified from a power-led to a current-ledsystem, since the vehicles do not necessarily accept the available output power of thecharging station, even under supposedly ideal conditions. Based on this, an EV-response-model must be developed, which allows the manual specification of certain vehicle-sidebehaviors to test the adapted control algorithm. If the underlying standards do not provideany clear specifications with regard to active load management, the corresponding systemshave no choice but to deal with the response behavior of the vehicles in the best possiblemanner available.
Author Contributions: Conceptualization, M.W. and T.S.; methodology, M.W. and T.S.; software,M.W. and T.S.; validation, M.W. and T.S.; formal analysis, M.W. and T.S.; investigation, M.W. and T.S.;resources, M.W., T.S., D.M. and H.F.; writing—original draft preparation, M.W., T.S., D.M., U.S. andH.F.; writing—review and editing, M.W., T.S., D.M., U.S., H.F., R.W., S.S. and B.S.; visualization, M.W.and T.S.; supervision, M.W. and T.S.; project administration, M.W. and T.S.; funding acquisition, R.W.,H.F., S.S. and B.S. All authors have read and agreed to the published version of the manuscript.
Funding: This research was funded by Federal Ministry of Transport and Digital Infrastructure,grant number 03MKS002B.
Data Availability Statement: Data available in a publicly accessible repositoryThe data presented inthis study are openly available in https://git.uni-wuppertal.de/tschneider.
Acknowledgments: The presented article was developed during the research project “BOB Solin-gen”, which is funded by the Federal Ministry of Transport and Digital Infrastructure. The urbantransportation operator (Stadtwerke Solingen GmbH) assisted with all the measurements. University

Energies 2021, 14, 8399 20 of 21
colleagues from all involved academic chairs were essential for a constant exchange of knowledgeand new thoughts.
Conflicts of Interest: The authors declare no conflict of interest.
References1. International Energy Agency. Global EV Outlook 2021—Accelerating Ambitions Despite the Pandemic; International Energy Agency:
Paris, France, 2021.2. International Energy Agency. Global EV Outlook 2020—Entering the Decade of Electric Drive; International Energy Agency: Paris,
France, 2020.3. United Nations. Paris Agreement; COP 21; The United Nations: Paris, France, 2015.4. Enzmann, J.; Ringel, M. Reducing Road Transport Emissions in Europe: Investigating A Demand Side Driven Approach.
Sustainability 2020, 12, 7594. [CrossRef]5. Euopean Commission. Fit for 55 Package; Euopean Commission: Brussels, Belgium, 2021.6. European Environment Agency. Monitoring CO2 Emissions from Passenger Cars and Vans in 2018; European Environment Agency:
Copenhagen, Denmark, 2020.7. International Energy Agency. World Energy Outlook 2021; International Energy Agency: Paris, France, 2021.8. European Court of Auditors. Infrastructure for Charging Electric Infrastructure for Charging Electric Vehicles: More Charging Stations
But Uneven Deployment More Charging Stations but Uneven Deployment; European Union: Luxembourg, 2021.9. Brown, A.; Lommele, S.; Schayowitz, A.; Klotz, E. Electric Vehicle Charging Infrastructure Trends from the Alternative Fueling Station
Locator: Third Quarter 2020; National Renewable Energy Lab. (NREL): Golden, CO, USA, 2021.10. Euopean Commission. The European Green Deal; Euopean Commission: Brussels, Belgium, 2019.11. Wolbertus, R.; van den Hoed, R.; Kroesen, M.; Chorus, C. Charging infrastructure roll-out strategies for large scale introduction of
electric vehicles in urban areas: An agent-based simulation study. Transp. Res. Part A Policy Pract. 2021, 148, 262–285. [CrossRef]12. Nicholas, M.; Lutsey, N. Quantifying the Electric Vehicle Charging Infrastructure Gap in the United Kingdom; International Coucil on
Clean Transportation: London, UK, 2020.13. Brenna, M.; Foiadelli, F.; Leone, C.; Longo, M. Electric Vehicles Charging Technology Review and Optimal Size Estimation. J.
Electr. Eng. Technol. 2020, 15, 2539–2552. [CrossRef]14. Tu, H. Extreme Fast Charging of Electric Vehicles: A Technology Overview. IEEE Trans. Transp. Electrific. 2019, 5, 861–878.
[CrossRef]15. Rare Look Inside Tesla Supercharger. Available online: https://insideevs.com/news/322486/rare-look-inside-tesla-
supercharger/ (accessed on 19 October 2021).16. INFOGRAPHIC|Terra 184 Charger. Available online: https://search.abb.com/library/Download.aspx?DocumentID=9AKK107
680A8808&LanguageCode=en&DocumentPartId=&Action=Launch (accessed on 19 October 2021).17. Product Leaflet Electric Vehicle Infrastructure Terra High Power—GEN III. Available online: https://search.abb.com/library/
Download.aspx?DocumentID=9AKK107991A9632&LanguageCode=en&DocumentPartId=&Action=Launch (accessed on 19October 2021).
18. Jiang, T.; Chen, X.; Zhang, J.; Wang, Y. Bidirectional llc resonantconverter for energy storage applications. In Proceedings of theTwenty-EighthAnnual IEEE Applied Power Electronics Conference and Exposition(APEC), Long Beach, CA, USA, 17–21 March2013; pp. 1145–1151.
19. Zhao, B.; Song, Q.; Liu, W.; Sun, Y. Overview of dual-active-bridge isolated bidirectional dcdc converter for high-frequency-linkpower-conversion system. IEEE Trans. Power Electron. 2014, 29, 4091–4106. [CrossRef]
20. Zahid, Z.U.; Dalala, Z.M.; Chen, R.; Chen, B.; Lai, J. Design of Bidirectional DC–DC Resonant Converter for Vehicle-to-Grid (V2G)Applications. IEEE Trans. Transp. Electrific. 2015, 1, 232–244. [CrossRef]
21. Jung, J.; Kim, H.; Kim, J.; Ryu, M.; Baek, J. High efficiency bidirectional llc resonant converter for 380V dc power distributionsystem using digital control scheme. In Proceedings of the Twenty-Seventh Annual IEEE Applied Power Electronics Conferenceand Exposition (APEC), Orlando, FL, USA, 5–9 February 2012; pp. 532–538.
22. Schneider, T.; Kratz, S.; Wegener, R.; Soter, S. Symmetrical Bidirectional CLLC-Converter with Simplified Synchronous Rectifi-cation for EV-Charging in Isolated DC Power Grids. In Proceedings of the IEEE 28th International Symposium on IndustrialElectronics (ISIE), Vancouver, BC, Canada, 12–14 June 2019.
23. Kong, P.; Karagiannidis, G.K. Charging Schemes for Plug-In Hybrid Electric Vehicles in Smart Grid: A Survey. IEEE Access 2016,4, 6846–6875. [CrossRef]
24. Li, Y.; Ni, Z.; Zhao, T.; Zhong, T.; Liu, Y.; Wu, L.; Zhao, Y. Supply Function Game Based Energy Management Between ElectricVehicle Charging Stations and Electricity Distribution System Considering Quality of Service. IEEE Trans. Ind. Appl. 2020, 56,5932–5943. [CrossRef]
25. Clement-Nyns, K. The Impact of Charging Plug-In Hybrid Electric Vehicles on a Residential Distribution Grid. IEEE Trans. PowerSyst. 2010, 25, 371–380. [CrossRef]
26. Shao, S. Demand Response as a Load Shaping Tool in an Intelligent Grid With Electric Vehicles. IEEE Trans. Smart Grid 2011, 2,624–631. [CrossRef]

Energies 2021, 14, 8399 21 of 21
27. Deshmukh, R.R.; Ballal, M.S. An energy management scheme for grid connected EVs charging stations. In Proceedings of the2018 International Conference on Power, Instrumentation, Control and Computing (PICC), Thrissur, India, 18–20 January 2018;pp. 1–6.
28. Zhang, J.; Yuan, R.; Yan, D.; Li, T.; Jiang, Z.; Ma, C.; Chen, T.; Luo, G. A Non-Cooperative Game Based Charging Power Dispatchin Electric Vehicle Charging Station and Charging Effect Analysis. In Proceedings of the 2018 2nd IEEE Conference on EnergyInternet and Energy System Integration (EI2), Beijing, China, 20–22 October 2018.
29. Yao, L.; Damiran, Z.; Lim, W.H. A fuzzy logic based charging scheme for electric vechicle parking station. In Proceedings of the2016 IEEE 16th International Conference on Environment and Electrical Engineering (EEEIC), Florence, Italy, 7–10 June 2016;pp. 1–6
30. Motoaki, Y.; Yi, W.; Salisbury, S. Empirical analysis of electric vehicle fast charging under cold temperatures. Energy Policy 2018,122, 162–168. [CrossRef]