The Dopaminergic Midbrain Encodes the Expected Certainty about Desired Outcomes
Upload
independentCategory
view
3download
0
Microglia of Rat Ventral MidbrainRecovers Its Resting State Over TimeIn Vitro: Let Microglia Rest Before Work
Ana Clara Cristovao,1,2 Ana Saavedra,3,4 Carla Pais Fonseca,1 Filipa Campos,1
Emılia Pedrosa Duarte,5,6 and Graca Baltazar1*1Health Sciences Research Center, University of Beira Interior, Covilha, Portugal2PhD Program in Experimental Biology and Biomedicine, Center for Neuroscience and Cell Biology,University of Coimbra, Coimbra, Portugal3Department of Cell Biology, Immunology and Neurosciences, Faculty of Medicine,University of Barcelona, Barcelona, Spain4Centro de Investigacion Biomedica en Red Enfermedades Neurodegenerativas (CIBERNED),Madrid, Spain5Department of Zoology, University of Coimbra, Coimbra, Portugal6Center for Neuroscience and Cell Biology, University of Coimbra, Coimbra, Portugal
Cortical or total brain cultures of microglia arecommonly used as a model to study the inflammatoryprocesses in Parkinson’s disease. Here we characterizemicroglia cultures from rat ventral midbrain and evalu-ate their response to zymosan A. We used specificmarkers of microglia and evaluated the morphology,the phagocytic activity and reactive oxygen species(ROS) levels of the cells. During the first 10 days in vitro(DIV), cultures presented predominantly cells with around morphology, expressing CD68 and with highphagocytic activity and ROS production. After 13 DIV,this tendency was reversed, with cultures showinghigher number of ramified cells and fewer CD681 cellsalong with lower phagocytic and ROS production capa-bility, suggesting that microglia must be kept in vitro forat least 13 days to recover its resting state. The expo-sure of cultures with less than 10 DIV to zymosan Asignificantly decreased cell viability. Exposure of cul-tures with 13 DIV to zymosan A (0.05, 0.5, or 5 lg/ml)increased the total cell number, the percentage ofCD681 cells, and the phagocytic activity. Concentra-tions of zymosan A higher than 5 lg/ml were alsoeffective in activating microglia but significantlydecreased the number of viable cells. In summary,microglial cells remain in the activated state for severaldays after the isolation process and, thus, stimulationof microglia recently isolated can compromise interpre-tation of the results. However, upon 13 DIV, cellsachieve properties of nonactivated microglia andpresent a characteristic response to a proinflammatoryagent. VVC 2009 Wiley-Liss, Inc.
Key words: Parkinson’s disease; neuroinflammation;dopaminergic neurotoxicity
Neuroinflammation, which involves primarily theactivity of two types of glial cells, astrocytes and
microglia, occurs frequently in both acute and chronicneurological disorders such as brain trauma, ischemicstroke, Alzheimer’s and Parkinson’s disease (PD). Dyingor damaged neurons are capable of activating microglia,regardless of how they were damaged or the neurodege-nerative disease in question (Block and Hong, 2005).Microglial cells constitute about 10% of all glial cells andare the resident immune cells in the brain serving thecritical role of immune surveillance. Several studiesstrongly imply that microglia plays the primary role inthe brain inflammatory process and is therefore, underpathologic conditions, the principal factor responsible forthe inflammation-mediated neurodegenerative process(Gao et al., 2002; Block and Hong, 2005). Microgliabecomes activated in response to brain injury or toimmunological stimuli (McGeer and McGeer, 2004;Cho et al., 2006) and undergoes morphological altera-tions upon activation (Kreutzberg, 1996). Activatedmicroglia releases a variety of soluble factors, amongwhich are proinflammatory and potentially cytotoxicmolecules such as tumor necrosis factor-a (TNFa),interleukin-1b (IL-1b), reactive oxygen species (ROS),and nitric oxide (for review see Block and Hong, 2005).Several other molecules are also up-regulated whenmicroglia is activated, namely, complement receptor 3
Contract grant sponsor: Portuguese Foundation for Science and Technol-
ogy (FCT); Contract grant number: SFRH/BD/15889/2005 (to A.C.C.).
*Correspondence to: Graca Baltazar, Health Sciences Research Center—
CICS, University of Beira Interior, Av. Infante D. Henrique, 6200-506
Covilha, Portugal. E-mail: [email protected]
Received 21 January 2009; Revised 17 June 2009; Accepted 25 June
2009
Published online 8 September 2009 in Wiley InterScience (www.
interscience.wiley.com). DOI: 10.1002/jnr.22219
Journal of Neuroscience Research 88:552–562 (2010)
' 2009 Wiley-Liss, Inc.
(CR3), lysossomal enzymes such as CD68, and majorhistocompatibility complex molecules (Graeber et al.,1990; Damoiseaux et al., 1994; Guillemin and Brew,2004).
Previously, Kim et al. (2000) highlighted theimportance of microglia in the substantia nigra (SN)area, demonstrating that this brain region has the highestmicroglia cell density and that, after brain injury inducedby injection of the bacterial endotoxin lipopolysaccha-ride (LPS), microglia becomes activated and leads toselective neurodegeneration in the SN area. Dopaminer-gic (DA) neurons are extremely sensitive to severalinsults, in part because of their low antioxidant capacity.Therefore, susceptible DA neurons are residing in apotentially dangerous microglia-enriched environmentthat can play an active role in the selective neurodegen-eration characteristic of PD (McGeer et al., 2001).
Microglia cultures are widely used to studymicroglia phenotype and function and are a commonsystem employed to study the inflammatory processes inthe brain. Previous microglia isolation approaches haveled to enriched microglia cultures from whole brain(Giulian and Baker, 1986; Floden and Combs, 2007;Park et al., 2007; Wang et al., 2007); hippocampus(Frank et al., 2006); cerebral cortices (Saura et al., 2003;Min et al., 2006); forebrain (Milner and Campbell,2002; Majed et al., 2006); subcortical white matter (deGroot et al., 2001; Dalmau et al., 2003); corpuscallosum; and prefrontal, temporal, and occipital cortex(de Groot et al., 2001).
Several reports in the literature have characterizedthe response of recently isolated microglia to differentinflammatory stimuli. However, experimental proceduressuch as preparation of primary cultures may change theinitial activation status of microglia, leading, in our opin-ion, to misleading interpretation of the results. In thepresent work, we established primary cultures of micro-glial cells from the ventral midbrain of newborn rats andevaluated the changes in the activation profile of thesecells over time in culture. We also studied the responseof these cells to the inflammatory stimulus zymosan A.To our knowledge, this is the first time that primarymicroglia cultures from the ventral midbrain have beenreported and characterized. This characterization will behelpful to those interested in studying the involvementof microglial cells in the neuroinflammation observed inPD.
MATERIALS AND METHODS
Microglial Cell Cultures
Animals were handled in accordance with the nationalethical requirements for animal research and with the Euro-pean Convention for the Protection of Vertebrate AnimalsUsed for Experimental and Other Scientific Purposes. Post-natal ventral midbrain glia cultures were prepared based onpreviously reported protocols (McCarthy and de Vellis, 1980;Saura et al., 2003; Culbert et al., 2006). Briefly, the ventralmidbrain of postnatal day three to five Wistar rat pups was
dissected, carefully stripped of the meninges, and mechanicallydissociated with a 5-ml pipette, followed by 5–10 sequentialpasses through 20-, 22-, and 25-gauge needles. Finally, thecells were passed through a 70-lm mesh, pelleted by centrifu-gation, and suspended in high-glucose Dulbecco’s modifiedEagle’s medium (DMEM; Life Technologies, Grand Island,NY) with 10% fetal bovine serum (FBS; Biochrom AG), and100 units/ml penicillin plus 100 lg/ml streptomycin (Sigma,St. Louis, MO), and plated onto 75-cm2 poly-D-lysine(Sigma)-coated culture flasks (one flask per 12 pups; BD Fal-con, Oxnard, CA). The cultures were kept at 378C in a 5%CO2, 95% air atmosphere. The medium was changed every 4days. On day 14, culture plates were shaked during 2 hr at200 rpm to detach microglial cells to the supernatant, leavingastrocytes in the adherent monolayer. The supernatant wascollected and centrifuged for 10 min at 1,200 rpm. The pelletwas then resuspended, and microglial cells were plated ontopoly-D-lysine-coated coverslips and kept at 378C in a 5%CO2, 95% air atmosphere for different time periods, as indi-cated in the text. Culture medium was replaced every 4 days.
Zymosan A Treatment
To evaluate the responsiveness of the primary microgliacultures, cells with different DIV were treated for 24 or 48 hr(depending on the experiment, as detailed below), with differ-ent concentrations of zymosan A (0.0005, 0.005, 0.05, 0.5, 5,25, or 50 lg/ml; Sigma).
Immunocytochemistry
After exposure to zymosan A for 48 hr, microglial cellswere fixed in 4% paraformaldehyde for 20 min and permeabil-ized with 0.1% Triton X-100 in phosphate-buffered saline(PBS) for 10 min. Blocking was performed by incubationwith 20% FBS in PBS containing 0.1% Tween-20 for 90 minat room temperature. The cells were then incubated for120 min at room temperature with the following primaryantibodies, according to the aim of the experiment: mouseanti-CD11b (1:150; Chemicon, Temecula, CA), chicken anti-GFAP (1:800; Chemicon), and goat anti-CD68 (1:150; SantaCruz Biotechnology, Santa Cruz, CA). After washing, cellswere incubated for 120 min with the appropriate secondaryantibodies conjugated to Alexa Fluor 546, Alexa Fluor 488, orAlexa Fluor 350 (1:1,000; Molecular Probes, Eugene, OR).For quantification of CD11b1 and CD681 cells, more than30 different fields were analyzed on a Zeiss inverted micro-scope under 363 magnification. The total number of cellswas determined by counting CD11b1 cells, and the numberof cells expressing CD68 was reported as percentage ofCD11b1 cells.
Morphological Analysis of Primary Microglia Cultures
The morphology of ventral midbrain primary cellsimmunoreactive to CD11b was evaluated at 2, 5, 10, 13, 15,and 20 DIV. The number of round and ramified microgliawas determined by counting more than 100 assigned fieldswith a 363 lens (Axiobserver Z1; Zeiss).
Characterization of a Ventral Midbrain Microglia Culture 553
Journal of Neuroscience Research
Phagocytosis Assay
To evaluate the effect of time in vitro on the functionalactivity of primary microglia cultures, we studied the phago-cytic activity of cultures with 2, 5, 10, 13, 15, and 20 DIVand the response of these cells to a zymosan A exposure of 24hr. Control cultures and cultures exposed to zymosan A wereincubated for 15 min with 0.01% fluorescent 1-lm polysty-rene microspheres (Molecular Probes) and then washed withDMEM to remove nonengulfed microspheres. Finally, cellswere fixed in 4% paraformaldehyde for 20 min. Cultures wereobserved on a Zeiss inverted microscope using a 363 lens,and cells with bright, punctuated fluorescence were consideredphagocytic.
Determination of Cellular ROS Content
ROS levels were measured using two different probes,20,70-dichlorodihydrofluorescein diacetate (DCFDA) anddihydroethidium (DHE). The DCFDA assay is based on theprinciple that DCFDA is oxidized by ROS and converted tofluorescent 20,70-dichlorofluorescein. In the DHE assay, bluefluorescent DHE is dehydrogenated by superoxide (O2
–) toform a red fluorescent ethidium bromide. Cells exposed for4 hr to zymosan A were incubated with DCFDA or DHE(both 50 lM) in culture medium for 1 and 4 hr at 378C,respectively. The fluorescence emitted was read in a spectro-fluorometer (FluoroMax-4; Horiba) using Ex/Em 485/535 nmand 590/620 nm for DCFDA and DHE, respectively.
MTT and LDH Assays
To assess cell viability, the levels of MTT reductionwere measured. After exposure to zymosan A, microglial cellswere incubated with 0.5 mg/ml 3-(4,5-dimethylthiazal-2-yl)-2,5-diphenyl-tetrazolium bromide (MTT; Sigma) in Krebsmedium for 60–90 min at 378C. MTT is converted by viablecells to a water-insoluble precipitate that was solubilized bythe addition of 0.04 M HCl in isopropanol and colorimetri-cally quantified (O.D. 570 nm) using a microplate reader(Bio-Rad, Hercules, CA). The extent of cell death was alsoassessed by using a cytotoxic assay kit to evaluate the levels ofLDH released to the culture medium. Aliquots (50 ll) of cellculture medium were incubated at room temperature in thepresence of 0.26 mM NADH, 2.87 mM sodium pyruvate,and 100 mM potassium phosphate buffer (pH 7.4) in a totalvolume of 200 ll, for 15–30 min. The levels of NAD1 for-mation were measured at 490 nm using a microplate reader(Bio-Rad).
Annexin V Assay
Microglia cultures were incubated with zymosan A for48 hr. After this period cultures were washed with freshDMEM and incubated for 15 min with 0.1 lg annexin V-FITC (Clontech Laboratories, Logan, UT). Unbound annexinV was removed by washing the cells once with the bufferprovided by the manufacturer. Cells were then permeabilizedwith 1% Triton X-100 in PBS for 5 min, and exposed to 2lM Hoechst 33342 (Molecular Probes, Eugene, OR) for 10min. Finally, cells were fixed in 4% paraformaldehyde for 20min. The number of annexin V- and Hoechst-positive cells
was estimated by counting more than 20 fields in each cover-slip. The number of annexin V-positive cells was reported aspercentage of the total number of cells.
Data and Statistical Analysis
Data are expressed as percentages of values obtainedunder control conditions or as percentages of the total numberof cells and are presented as mean 6 SEM of at least threeindependent experiments, performed in triplicate. Statisticalanalysis was performed by one-way ANOVA followedby Dunnett’s test or Bonferroni’s multiple-comparisons test.P < 0.05 was considered significant.
RESULTS
Microglia Morphological Changes and FunctionalActivity During Time In Vitro
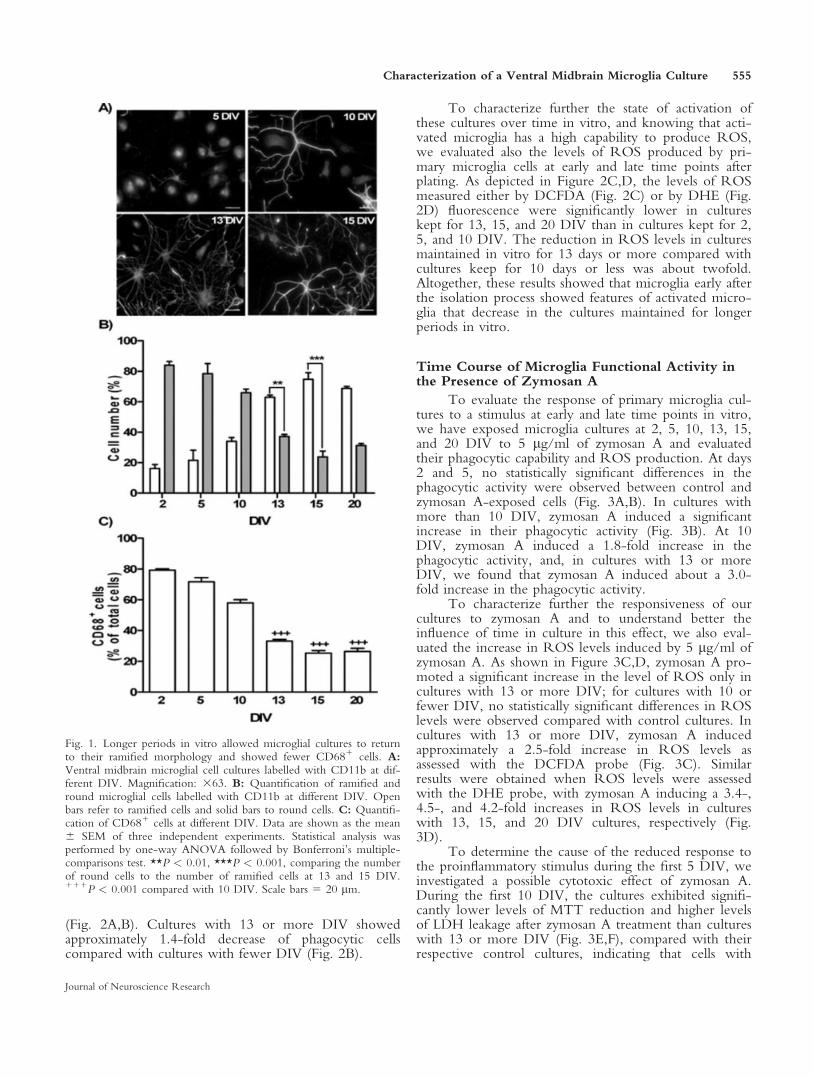
We investigated the morphological evolution ofmicroglia with the time in culture. For this propose,ramified and round cells were counted in cultures keptfor 2, 5, 10, 13, 15, and 20 DIV. More than 98% of thecells in culture were immunopositive for the microgliamarker CD11b (Fig. 1A). A gradual increase in thenumber of ramified cells was found during the first10 DIV (Fig. 1B). Two days after the isolation process,the cultures had 84% 6 2.7% round cells; after 5 days,74% 6 6.3%; and, after 10 days, 66% 6 2.7%.Therefore, until day 10, the cultures presented mainlymicroglia with round morphology. After 13 DIV, thistendency was reversed, with cultures showing predomi-nantly ramified cells (Fig. 1B), 63% 6 1.4% at 13 DIVand 76% 6 4.5% at 15 DIV. The cultures maintained invitro for 20 days showed a slight decrease in ramifiedcells compared with cultures maintained during 15 DIV(from 76% 6 4.5% to 69% 6 1.4%). In an attempt toestablish a correlation between microglia morphologicalchanges and its state of activation, we also evaluated theexpression of the marker for activated microglia, CD68,a lysosomal enzyme associated with phagocytic activity(Damoiseaux et al., 1994; Guillemin and Brew, 2004).During the first 10 DIV, the cultures presented morethan 56% 6 2.8% of cells expressing CD68 (Fig. 1C).Cultures with longer periods in vitro showed lowernumbers of CD681 cells (32% 6 1.2% and 25% 6 2.5%at 13 and 15 DIV, respectively; Fig. 1C).
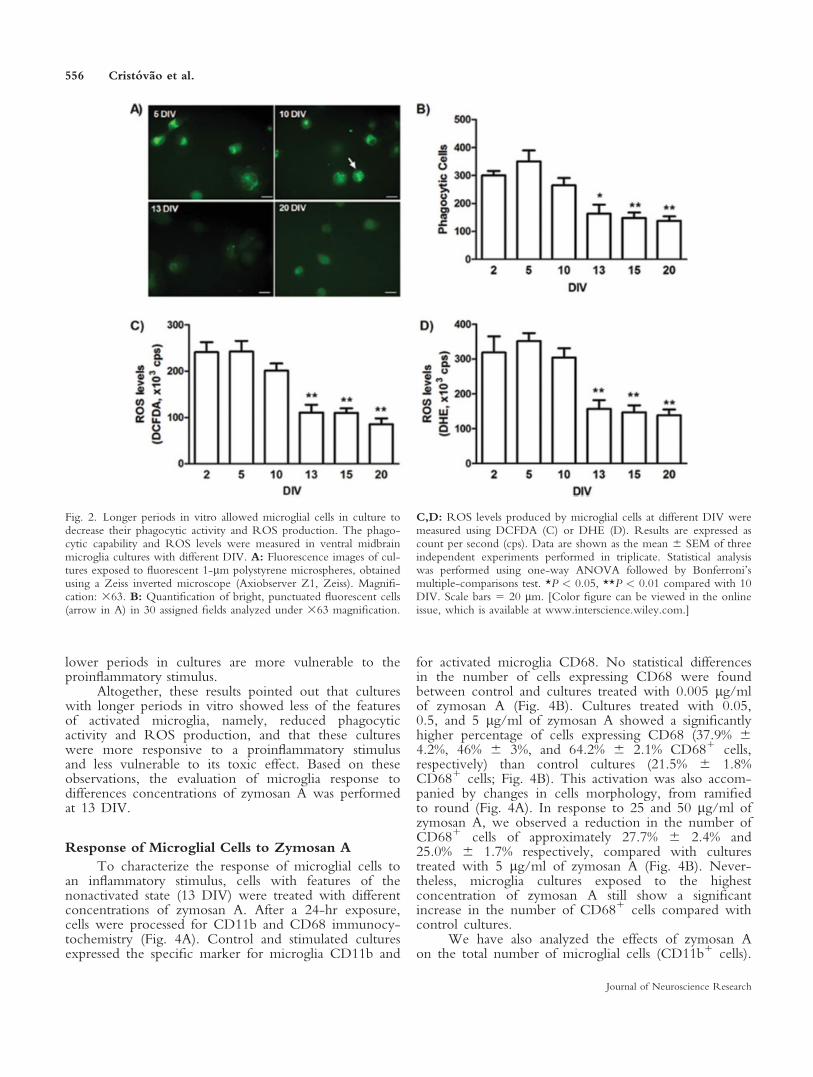
Although microglial cells share many propertieswith monocytes and macrophages, they retain exclusivemorphological and molecular characteristics (Guilleminand Brew, 2004). As with macrophages, activated micro-glia present phagocytic activity and high capability toproduce ROS (Giulian, 1987; Perry and Gordon, 1988;Streit et al., 1988). To evaluate the functional behaviorof primary microglia cultures over time in vitro, weinvestigated their phagocytic capability as well as theirability to produce ROS at different time points (2, 5,10, 13, 15, 20 DIV; Fig. 2). During the first 10 DIV,we found a high number of phagocytic cells, whichdecreased in the cultures kept for 13, 15 and 20 DIV
554 Cristovao et al.
Journal of Neuroscience Research
(Fig. 2A,B). Cultures with 13 or more DIV showedapproximately 1.4-fold decrease of phagocytic cellscompared with cultures with fewer DIV (Fig. 2B).
To characterize further the state of activation ofthese cultures over time in vitro, and knowing that acti-vated microglia has a high capability to produce ROS,we evaluated also the levels of ROS produced by pri-mary microglia cells at early and late time points afterplating. As depicted in Figure 2C,D, the levels of ROSmeasured either by DCFDA (Fig. 2C) or by DHE (Fig.2D) fluorescence were significantly lower in cultureskept for 13, 15, and 20 DIV than in cultures kept for 2,5, and 10 DIV. The reduction in ROS levels in culturesmaintained in vitro for 13 days or more compared withcultures keep for 10 days or less was about twofold.Altogether, these results showed that microglia early afterthe isolation process showed features of activated micro-glia that decrease in the cultures maintained for longerperiods in vitro.
Time Course of Microglia Functional Activity inthe Presence of Zymosan A
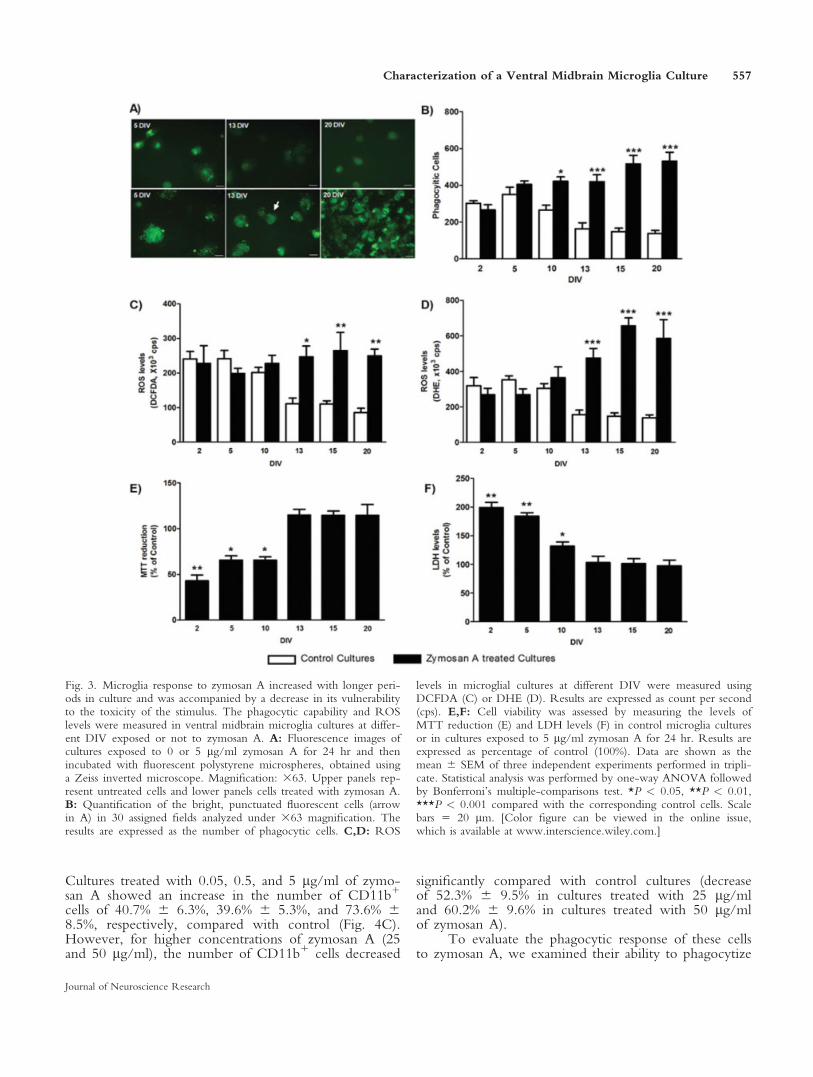
To evaluate the response of primary microglia cul-tures to a stimulus at early and late time points in vitro,we have exposed microglia cultures at 2, 5, 10, 13, 15,and 20 DIV to 5 lg/ml of zymosan A and evaluatedtheir phagocytic capability and ROS production. At days2 and 5, no statistically significant differences in thephagocytic activity were observed between control andzymosan A-exposed cells (Fig. 3A,B). In cultures withmore than 10 DIV, zymosan A induced a significantincrease in their phagocytic activity (Fig. 3B). At 10DIV, zymosan A induced a 1.8-fold increase in thephagocytic activity, and, in cultures with 13 or moreDIV, we found that zymosan A induced about a 3.0-fold increase in the phagocytic activity.
To characterize further the responsiveness of ourcultures to zymosan A and to understand better theinfluence of time in culture in this effect, we also eval-uated the increase in ROS levels induced by 5 lg/ml ofzymosan A. As shown in Figure 3C,D, zymosan A pro-moted a significant increase in the level of ROS only incultures with 13 or more DIV; for cultures with 10 orfewer DIV, no statistically significant differences in ROSlevels were observed compared with control cultures. Incultures with 13 or more DIV, zymosan A inducedapproximately a 2.5-fold increase in ROS levels asassessed with the DCFDA probe (Fig. 3C). Similarresults were obtained when ROS levels were assessedwith the DHE probe, with zymosan A inducing a 3.4-,4.5-, and 4.2-fold increases in ROS levels in cultureswith 13, 15, and 20 DIV cultures, respectively (Fig.3D).
To determine the cause of the reduced response tothe proinflammatory stimulus during the first 5 DIV, weinvestigated a possible cytotoxic effect of zymosan A.During the first 10 DIV, the cultures exhibited signifi-cantly lower levels of MTT reduction and higher levelsof LDH leakage after zymosan A treatment than cultureswith 13 or more DIV (Fig. 3E,F), compared with theirrespective control cultures, indicating that cells with
Fig. 1. Longer periods in vitro allowed microglial cultures to returnto their ramified morphology and showed fewer CD681 cells. A:Ventral midbrain microglial cell cultures labelled with CD11b at dif-ferent DIV. Magnification: 363. B: Quantification of ramified andround microglial cells labelled with CD11b at different DIV. Openbars refer to ramified cells and solid bars to round cells. C: Quantifi-cation of CD681 cells at different DIV. Data are shown as the mean6 SEM of three independent experiments. Statistical analysis wasperformed by one-way ANOVA followed by Bonferroni’s multiple-comparisons test. **P < 0.01, ***P < 0.001, comparing the numberof round cells to the number of ramified cells at 13 and 15 DIV.111P < 0.001 compared with 10 DIV. Scale bars 5 20 lm.
Characterization of a Ventral Midbrain Microglia Culture 555
Journal of Neuroscience Research
lower periods in cultures are more vulnerable to theproinflammatory stimulus.
Altogether, these results pointed out that cultureswith longer periods in vitro showed less of the featuresof activated microglia, namely, reduced phagocyticactivity and ROS production, and that these cultureswere more responsive to a proinflammatory stimulusand less vulnerable to its toxic effect. Based on theseobservations, the evaluation of microglia response todifferences concentrations of zymosan A was performedat 13 DIV.
Response of Microglial Cells to Zymosan A
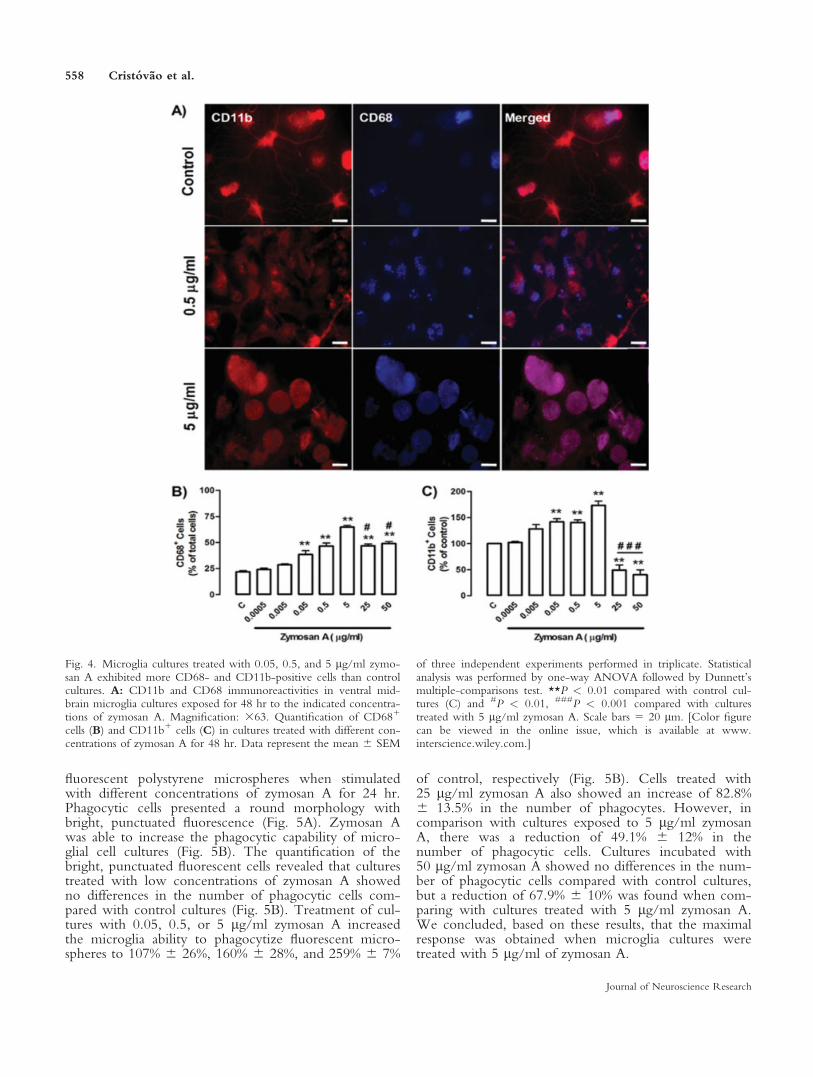
To characterize the response of microglial cells toan inflammatory stimulus, cells with features of thenonactivated state (13 DIV) were treated with differentconcentrations of zymosan A. After a 24-hr exposure,cells were processed for CD11b and CD68 immunocy-tochemistry (Fig. 4A). Control and stimulated culturesexpressed the specific marker for microglia CD11b and
for activated microglia CD68. No statistical differencesin the number of cells expressing CD68 were foundbetween control and cultures treated with 0.005 lg/mlof zymosan A (Fig. 4B). Cultures treated with 0.05,0.5, and 5 lg/ml of zymosan A showed a significantlyhigher percentage of cells expressing CD68 (37.9% 64.2%, 46% 6 3%, and 64.2% 6 2.1% CD681 cells,respectively) than control cultures (21.5% 6 1.8%CD681 cells; Fig. 4B). This activation was also accom-panied by changes in cells morphology, from ramifiedto round (Fig. 4A). In response to 25 and 50 lg/ml ofzymosan A, we observed a reduction in the number ofCD681 cells of approximately 27.7% 6 2.4% and25.0% 6 1.7% respectively, compared with culturestreated with 5 lg/ml of zymosan A (Fig. 4B). Never-theless, microglia cultures exposed to the highestconcentration of zymosan A still show a significantincrease in the number of CD681 cells compared withcontrol cultures.
We have also analyzed the effects of zymosan Aon the total number of microglial cells (CD11b1 cells).
Fig. 2. Longer periods in vitro allowed microglial cells in culture todecrease their phagocytic activity and ROS production. The phago-cytic capability and ROS levels were measured in ventral midbrainmicroglia cultures with different DIV. A: Fluorescence images of cul-tures exposed to fluorescent 1-lm polystyrene microspheres, obtainedusing a Zeiss inverted microscope (Axiobserver Z1, Zeiss). Magnifi-cation: 363. B: Quantification of bright, punctuated fluorescent cells(arrow in A) in 30 assigned fields analyzed under 363 magnification.
C,D: ROS levels produced by microglial cells at different DIV weremeasured using DCFDA (C) or DHE (D). Results are expressed ascount per second (cps). Data are shown as the mean 6 SEM of threeindependent experiments performed in triplicate. Statistical analysiswas performed using one-way ANOVA followed by Bonferroni’smultiple-comparisons test. *P < 0.05, **P < 0.01 compared with 10DIV. Scale bars 5 20 lm. [Color figure can be viewed in the onlineissue, which is available at www.interscience.wiley.com.]
556 Cristovao et al.
Journal of Neuroscience Research
Cultures treated with 0.05, 0.5, and 5 lg/ml of zymo-san A showed an increase in the number of CD11b1
cells of 40.7% 6 6.3%, 39.6% 6 5.3%, and 73.6% 68.5%, respectively, compared with control (Fig. 4C).However, for higher concentrations of zymosan A (25and 50 lg/ml), the number of CD11b1 cells decreased
significantly compared with control cultures (decreaseof 52.3% 6 9.5% in cultures treated with 25 lg/mland 60.2% 6 9.6% in cultures treated with 50 lg/mlof zymosan A).
To evaluate the phagocytic response of these cellsto zymosan A, we examined their ability to phagocytize
Fig. 3. Microglia response to zymosan A increased with longer peri-ods in culture and was accompanied by a decrease in its vulnerabilityto the toxicity of the stimulus. The phagocytic capability and ROSlevels were measured in ventral midbrain microglia cultures at differ-ent DIV exposed or not to zymosan A. A: Fluorescence images ofcultures exposed to 0 or 5 lg/ml zymosan A for 24 hr and thenincubated with fluorescent polystyrene microspheres, obtained usinga Zeiss inverted microscope. Magnification: 363. Upper panels rep-resent untreated cells and lower panels cells treated with zymosan A.B: Quantification of the bright, punctuated fluorescent cells (arrowin A) in 30 assigned fields analyzed under 363 magnification. Theresults are expressed as the number of phagocytic cells. C,D: ROS
levels in microglial cultures at different DIV were measured usingDCFDA (C) or DHE (D). Results are expressed as count per second(cps). E,F: Cell viability was assessed by measuring the levels ofMTT reduction (E) and LDH levels (F) in control microglia culturesor in cultures exposed to 5 lg/ml zymosan A for 24 hr. Results areexpressed as percentage of control (100%). Data are shown as themean 6 SEM of three independent experiments performed in tripli-cate. Statistical analysis was performed by one-way ANOVA followedby Bonferroni’s multiple-comparisons test. *P < 0.05, **P < 0.01,***P < 0.001 compared with the corresponding control cells. Scalebars 5 20 lm. [Color figure can be viewed in the online issue,which is available at www.interscience.wiley.com.]
Characterization of a Ventral Midbrain Microglia Culture 557
Journal of Neuroscience Research
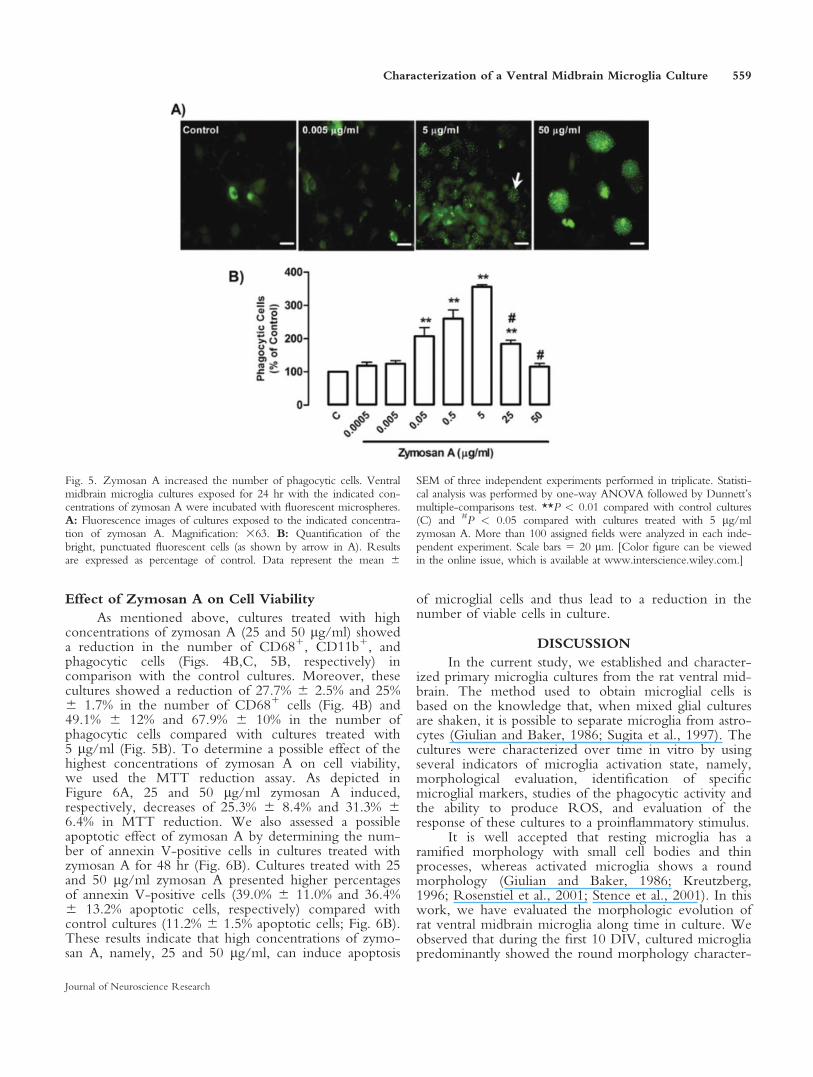
fluorescent polystyrene microspheres when stimulatedwith different concentrations of zymosan A for 24 hr.Phagocytic cells presented a round morphology withbright, punctuated fluorescence (Fig. 5A). Zymosan Awas able to increase the phagocytic capability of micro-glial cell cultures (Fig. 5B). The quantification of thebright, punctuated fluorescent cells revealed that culturestreated with low concentrations of zymosan A showedno differences in the number of phagocytic cells com-pared with control cultures (Fig. 5B). Treatment of cul-tures with 0.05, 0.5, or 5 lg/ml zymosan A increasedthe microglia ability to phagocytize fluorescent micro-spheres to 107% 6 26%, 160% 6 28%, and 259% 6 7%
of control, respectively (Fig. 5B). Cells treated with25 lg/ml zymosan A also showed an increase of 82.8%6 13.5% in the number of phagocytes. However, incomparison with cultures exposed to 5 lg/ml zymosanA, there was a reduction of 49.1% 6 12% in thenumber of phagocytic cells. Cultures incubated with50 lg/ml zymosan A showed no differences in the num-ber of phagocytic cells compared with control cultures,but a reduction of 67.9% 6 10% was found when com-paring with cultures treated with 5 lg/ml zymosan A.We concluded, based on these results, that the maximalresponse was obtained when microglia cultures weretreated with 5 lg/ml of zymosan A.
Fig. 4. Microglia cultures treated with 0.05, 0.5, and 5 lg/ml zymo-san A exhibited more CD68- and CD11b-positive cells than controlcultures. A: CD11b and CD68 immunoreactivities in ventral mid-brain microglia cultures exposed for 48 hr to the indicated concentra-tions of zymosan A. Magnification: 363. Quantification of CD681
cells (B) and CD11b1 cells (C) in cultures treated with different con-centrations of zymosan A for 48 hr. Data represent the mean 6 SEM
of three independent experiments performed in triplicate. Statisticalanalysis was performed by one-way ANOVA followed by Dunnett’smultiple-comparisons test. **P < 0.01 compared with control cul-tures (C) and #P < 0.01, ###P < 0.001 compared with culturestreated with 5 lg/ml zymosan A. Scale bars 5 20 lm. [Color figurecan be viewed in the online issue, which is available at www.interscience.wiley.com.]
558 Cristovao et al.
Journal of Neuroscience Research
Effect of Zymosan A on Cell Viability
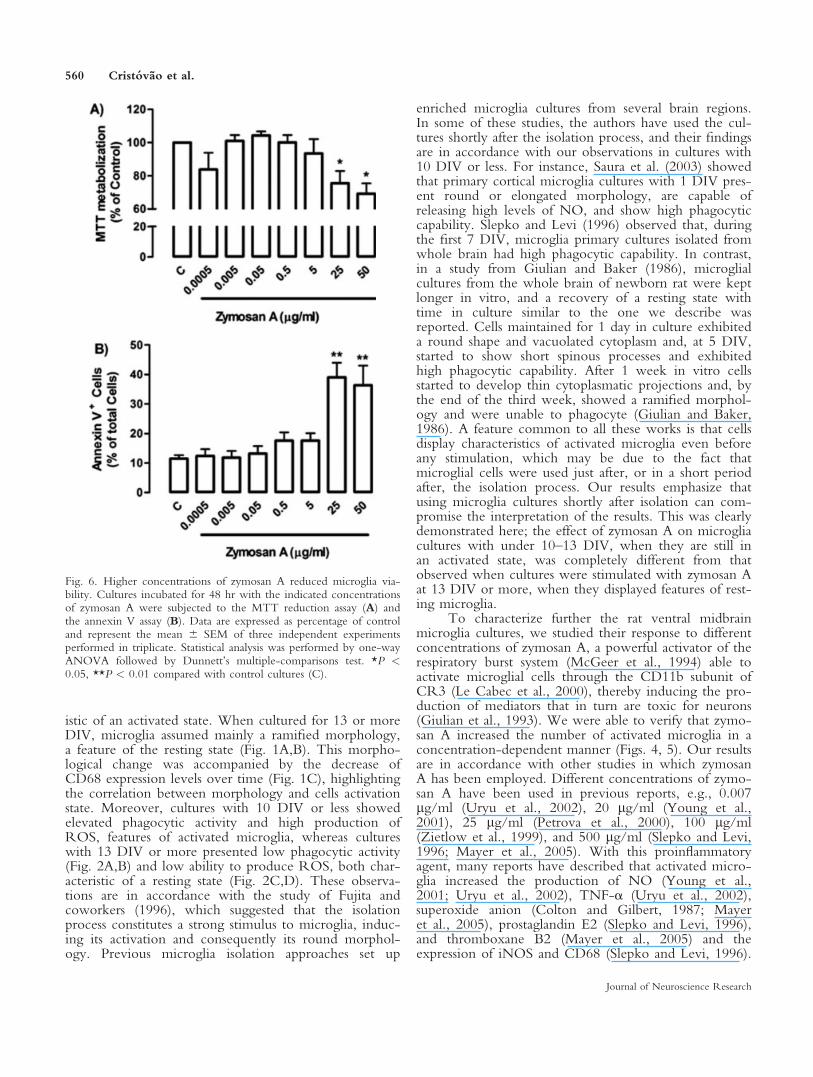
As mentioned above, cultures treated with highconcentrations of zymosan A (25 and 50 lg/ml) showeda reduction in the number of CD681, CD11b1, andphagocytic cells (Figs. 4B,C, 5B, respectively) incomparison with the control cultures. Moreover, thesecultures showed a reduction of 27.7% 6 2.5% and 25%6 1.7% in the number of CD681 cells (Fig. 4B) and49.1% 6 12% and 67.9% 6 10% in the number ofphagocytic cells compared with cultures treated with5 lg/ml (Fig. 5B). To determine a possible effect of thehighest concentrations of zymosan A on cell viability,we used the MTT reduction assay. As depicted inFigure 6A, 25 and 50 lg/ml zymosan A induced,respectively, decreases of 25.3% 6 8.4% and 31.3% 66.4% in MTT reduction. We also assessed a possibleapoptotic effect of zymosan A by determining the num-ber of annexin V-positive cells in cultures treated withzymosan A for 48 hr (Fig. 6B). Cultures treated with 25and 50 lg/ml zymosan A presented higher percentagesof annexin V-positive cells (39.0% 6 11.0% and 36.4%6 13.2% apoptotic cells, respectively) compared withcontrol cultures (11.2% 6 1.5% apoptotic cells; Fig. 6B).These results indicate that high concentrations of zymo-san A, namely, 25 and 50 lg/ml, can induce apoptosis
of microglial cells and thus lead to a reduction in thenumber of viable cells in culture.
DISCUSSION
In the current study, we established and character-ized primary microglia cultures from the rat ventral mid-brain. The method used to obtain microglial cells isbased on the knowledge that, when mixed glial culturesare shaken, it is possible to separate microglia from astro-cytes (Giulian and Baker, 1986; Sugita et al., 1997). Thecultures were characterized over time in vitro by usingseveral indicators of microglia activation state, namely,morphological evaluation, identification of specificmicroglial markers, studies of the phagocytic activity andthe ability to produce ROS, and evaluation of theresponse of these cultures to a proinflammatory stimulus.
It is well accepted that resting microglia has aramified morphology with small cell bodies and thinprocesses, whereas activated microglia shows a roundmorphology (Giulian and Baker, 1986; Kreutzberg,1996; Rosenstiel et al., 2001; Stence et al., 2001). In thiswork, we have evaluated the morphologic evolution ofrat ventral midbrain microglia along time in culture. Weobserved that during the first 10 DIV, cultured microgliapredominantly showed the round morphology character-
Fig. 5. Zymosan A increased the number of phagocytic cells. Ventralmidbrain microglia cultures exposed for 24 hr with the indicated con-centrations of zymosan A were incubated with fluorescent microspheres.A: Fluorescence images of cultures exposed to the indicated concentra-tion of zymosan A. Magnification: 363. B: Quantification of thebright, punctuated fluorescent cells (as shown by arrow in A). Resultsare expressed as percentage of control. Data represent the mean 6
SEM of three independent experiments performed in triplicate. Statisti-cal analysis was performed by one-way ANOVA followed by Dunnett’smultiple-comparisons test. **P < 0.01 compared with control cultures(C) and #P < 0.05 compared with cultures treated with 5 lg/mlzymosan A. More than 100 assigned fields were analyzed in each inde-pendent experiment. Scale bars 5 20 lm. [Color figure can be viewedin the online issue, which is available at www.interscience.wiley.com.]
Characterization of a Ventral Midbrain Microglia Culture 559
Journal of Neuroscience Research
istic of an activated state. When cultured for 13 or moreDIV, microglia assumed mainly a ramified morphology,a feature of the resting state (Fig. 1A,B). This morpho-logical change was accompanied by the decrease ofCD68 expression levels over time (Fig. 1C), highlightingthe correlation between morphology and cells activationstate. Moreover, cultures with 10 DIV or less showedelevated phagocytic activity and high production ofROS, features of activated microglia, whereas cultureswith 13 DIV or more presented low phagocytic activity(Fig. 2A,B) and low ability to produce ROS, both char-acteristic of a resting state (Fig. 2C,D). These observa-tions are in accordance with the study of Fujita andcoworkers (1996), which suggested that the isolationprocess constitutes a strong stimulus to microglia, induc-ing its activation and consequently its round morphol-ogy. Previous microglia isolation approaches set up
enriched microglia cultures from several brain regions.In some of these studies, the authors have used the cul-tures shortly after the isolation process, and their findingsare in accordance with our observations in cultures with10 DIV or less. For instance, Saura et al. (2003) showedthat primary cortical microglia cultures with 1 DIV pres-ent round or elongated morphology, are capable ofreleasing high levels of NO, and show high phagocyticcapability. Slepko and Levi (1996) observed that, duringthe first 7 DIV, microglia primary cultures isolated fromwhole brain had high phagocytic capability. In contrast,in a study from Giulian and Baker (1986), microglialcultures from the whole brain of newborn rat were keptlonger in vitro, and a recovery of a resting state withtime in culture similar to the one we describe wasreported. Cells maintained for 1 day in culture exhibiteda round shape and vacuolated cytoplasm and, at 5 DIV,started to show short spinous processes and exhibitedhigh phagocytic capability. After 1 week in vitro cellsstarted to develop thin cytoplasmatic projections and, bythe end of the third week, showed a ramified morphol-ogy and were unable to phagocyte (Giulian and Baker,1986). A feature common to all these works is that cellsdisplay characteristics of activated microglia even beforeany stimulation, which may be due to the fact thatmicroglial cells were used just after, or in a short periodafter, the isolation process. Our results emphasize thatusing microglia cultures shortly after isolation can com-promise the interpretation of the results. This was clearlydemonstrated here; the effect of zymosan A on microgliacultures with under 10–13 DIV, when they are still inan activated state, was completely different from thatobserved when cultures were stimulated with zymosan Aat 13 DIV or more, when they displayed features of rest-ing microglia.
To characterize further the rat ventral midbrainmicroglia cultures, we studied their response to differentconcentrations of zymosan A, a powerful activator of therespiratory burst system (McGeer et al., 1994) able toactivate microglial cells through the CD11b subunit ofCR3 (Le Cabec et al., 2000), thereby inducing the pro-duction of mediators that in turn are toxic for neurons(Giulian et al., 1993). We were able to verify that zymo-san A increased the number of activated microglia in aconcentration-dependent manner (Figs. 4, 5). Our resultsare in accordance with other studies in which zymosanA has been employed. Different concentrations of zymo-san A have been used in previous reports, e.g., 0.007lg/ml (Uryu et al., 2002), 20 lg/ml (Young et al.,2001), 25 lg/ml (Petrova et al., 2000), 100 lg/ml(Zietlow et al., 1999), and 500 lg/ml (Slepko and Levi,1996; Mayer et al., 2005). With this proinflammatoryagent, many reports have described that activated micro-glia increased the production of NO (Young et al.,2001; Uryu et al., 2002), TNF-a (Uryu et al., 2002),superoxide anion (Colton and Gilbert, 1987; Mayeret al., 2005), prostaglandin E2 (Slepko and Levi, 1996),and thromboxane B2 (Mayer et al., 2005) and theexpression of iNOS and CD68 (Slepko and Levi, 1996).
Fig. 6. Higher concentrations of zymosan A reduced microglia via-bility. Cultures incubated for 48 hr with the indicated concentrationsof zymosan A were subjected to the MTT reduction assay (A) andthe annexin V assay (B). Data are expressed as percentage of controland represent the mean 6 SEM of three independent experimentsperformed in triplicate. Statistical analysis was performed by one-wayANOVA followed by Dunnett’s multiple-comparisons test. *P <0.05, **P < 0.01 compared with control cultures (C).
560 Cristovao et al.
Journal of Neuroscience Research
Zymosan A has also been used in vivo. When injectedin the white matter of the corpus callosum, it inducespersistent inflammation with increased microglia activa-tion (Fitch et al., 1999), and, when injected in the spinalcord, zymosan A increases the levels of IL-1b (Sweitzeret al., 1999). Furthermore, we have verified that zymo-san A is able to induce microglial cell proliferation.These results are in agreement with in vivo studiesshowing that brain microglia proliferation was inducedin a dose-dependent manner by the intraperitoneal injec-tion of lipopolysaccharide (LPS; Shankaran et al., 2007).Dissing-Olesen et al. (2007) reported that an axonallesion in mice induces microglia activation and prolifera-tion, with a 1.6-fold increase in the number of micro-glial cells in the first 24 hr postlesion.
Cultures treated with concentrations from 0.0005to 5 lg/ml zymosan A did not induce a decrease in cellviability. However, for a concentration of zymosan A of25 lg/ml or higher, we observed that total cell number(CD11b1 cells) and number of activated cells (CD681
and exhibiting phagocytic activity) decreased comparedwith the cultures treated with 5 lg/ml. This indicatesthat concentrations of zymosan A higher than 25 lg/mlhad a toxic effect on our microglial cell culture model.Recent work showed that 0–30 lg/ml zymosan A addedto macrophages for 24 or 48 hr does not affect cell via-bility (Radkar et al., 2007). The apoptotic effect ofzymosan A on microglial cells is still an open issue.However, some information is available concerning itseffect on neutrophils and macrophages. For cultures ofneutrophils stimulated with zymosan A for more than 6hr, a significant increase in apoptosis was reported(Nagahata et al., 2004). On the other hand, Hiura et al.(2000) observed that exposure to zymosan A for morethan 16 hr promoted the apoptosis of 14.5% of the cellsin a macrophage cell line. The authors suggested thatthis effect could be related to the magnitude and dura-tion of ROS production by macrophages in response tothe stimulus. LPS, another proinflammatory stimulus,also has a proapoptotic effect on microglia. Exposure ofrat primary microglial cells to 100 ng/ml LPS resulted inan overactivation of microglia, resulting in a time- andconcentration-dependent apoptotic cell death (Liu et al.,2001). Our results on cell viability, together with evi-dence from the literature, suggest that concentrations ofzymosan A higher than 25 lg/ml should be avoided.
To increase our knowledge on the behavior andresponsiveness of ventral midbrain primary microglia cul-tures, we have also exposed the cultures to zymosan Aat different DIV. In cultures with under 10 DIV, zymo-san A did not induced increases of phagocytic activity orof ROS levels. The responsiveness of cultures keep for13 DIV or more changed dramatically, and a strong dif-ference between control and zymosan A exposed cellswas found (Fig. 3A–D). Based on the results showingthat, before 10 DIV, microglial cells had features of theactivated state and that cells with under 10 DIV werenot responding to the stimulus, we raised the possibilitythat, under these conditions, zymosan A could lead to
an overactivation of the cells, exerting a highly toxiceffect and consequently leading to cell death. In fact, ourresults supported this hypothesis, insofar as cultures with10 DIV or less were in an activated state, and exposureto a proinflammatory stimulus induced cell death (Fig.3E,F). The response of the remaining viable cells islikely not enough to allow the detection of differencesbetween untreated and zymosan A-treated cultures.
Our observations indicate that microglial cellsobtained from the ventral midbrain of newborn ratshave to be kept in vitro for 13 days after platting torecover their ramified morphology, low phagocytic activ-ity, and low ROS production. Thus, only after 13 DIV,when cells have recovered their resting state, it is possibleto use them as an in vitro model of resting microglia.
In summary, in this work, we have established andcharacterized primary cultures of microglial cells fromthe rat ventral midbrain. We show that, after 13 DIV,these cells present features of resting microglia that upona proinflammatory stimulation change from the restingto the activated state, as determined by morphologicalterations as well as increases in microglia proliferation,expression of markers of the activated state (CD68),phagocytic activity, and ROS production. These resultsopen the possibility to use these cultures as a model ofresting microglia and to understand better the involve-ment of these cells in the neuroinflammation observedin PD. In addition, our study highlights that, in order toavoid possibly misleading analysis of the results, it is im-portant to allow microglia primary cultures to recovertheir resting state by keeping them in vitro for longerperiods before their use in experiments involving micro-glia activation.
REFERENCES
Block ML, Hong JS. 2005. Microglia and inflammation-mediated
neurodegeneration: multiple triggers with a common mechanism. Prog
Neurobiol 76:77–98.
Cho BP, Song DY, Sugama S, Shin DH, Shimizu Y, Kim SS, Kim YS,
Joh TH. 2006. Pathological dynamics of activated microglia following
medial forebrain bundle transection. Glia 53:92–102.
Colton CA, Gilbert DL. 1987. Production of superoxide anions by a
CNS macrophage, the microglia. FEBS Lett 223:284–288.
Culbert AA, Skaper SD, Howlett DR, Evans NA, Facci L, Soden PE,
Seymour ZM, Guillot F, Gaestel M, Richardson JC. 2006. MAPK-
activated protein kinase 2 deficiency in microglia inhibits pro-inflam-
matory mediator release and resultant neurotoxicity. Relevance to
neuroinflammation in a transgenic mouse model of Alzheimer disease.
J Biol Chem 281:23658–23667.
Dalmau I, Vela JM, Gonzalez B, Finsen B, Castellano B. 2003. Dynamics
of microglia in the developing rat brain. J Comp Neurol 458:144–157.
Damoiseaux JG, Dopp EA, Calame W, Chao D, MacPherson GG,
Dijkstra CD. 1994. Rat macrophage lysosomal membrane antigen
recognized by monoclonal antibody ED1. Immunology 83:140–147.
de Groot CJ, Hulshof S, Hoozemans JJ, Veerhuis R. 2001. Establishment
of microglial cell cultures derived from postmortem human adult brain
tissue: immunophenotypical and functional characterization. Microsc
Res Techniq 54:34–39.
Dissing-Olesen L, Ladeby R, Nielsen HH, Toft-Hansen H, Dalmau I,
Finsen B. 2007. Axonal lesion-induced microglial proliferation and
microglial cluster formation in the mouse. Neuroscience 149:112–122.
Characterization of a Ventral Midbrain Microglia Culture 561
Journal of Neuroscience Research
Fitch MT, Doller C, Combs CK, Landreth GE, Silver J. 1999. Cellular
and molecular mechanisms of glial scarring and progressive cavitation:
in vivo and in vitro analysis of inflammation-induced secondary injury
after CNS trauma. J Neurosci 19:8182–8198.
Floden AM, Combs CK. 2007. Microglia repetitively isolated from in
vitro mixed glial cultures retain their initial phenotype. J Neurosci
Methods 164:218–224.
Frank MG, Wieseler-Frank JL, Watkins LR, Maier SF. 2006. Rapid iso-
lation of highly enriched and quiescent microglia from adult rat hippo-
campus: immunophenotypic and functional characteristics. J Neurosci
Methods 151:121–130.
Fujita H, Tanaka J, Toku K, Tateishi N, Suzuki Y, Matsuda S, Sakanaka
M, Maeda N. 1996. Effects of GM-CSF and ordinary supplements on
the ramification of microglia in culture: a morphometrical study. Glia
18:269–281.
Gao HM, Jiang J, Wilson B, Zhang W, Hong JS, Liu B. 2002. Micro-
glial activation-mediated delayed and progressive degeneration of rat
nigral dopaminergic neurons: relevance to Parkinson’s disease. J Neuro-
chem 81:1285–1297.
Giulian D. 1987. Ameboid microglia as effectors of inflammation in the
central nervous system. J Neurosci Res 18:132–153,155–171.
Giulian D, Baker TJ. 1986. Characterization of ameboid microglia
isolated from developing mammalian brain. J Neurosci 6:2163–2178.
Giulian D, Vaca K, Corpuz M. 1993. Brain glia release factors with
opposing actions upon neuronal survival. J Neurosci 13:29–37.
Graeber MB, Streit WJ, Kiefer R, Schoen SW, Kreutzberg GW. 1990.
New expression of myelomonocytic antigens by microglia and perivas-
cular cells following lethal motor neuron injury. J Neuroimmunol
27:121–132.
Guillemin GJ, Brew BJ. 2004. Microglia, macrophages, perivascular
macrophages, and pericytes: a review of function and identification.
J Leukoc Biol 75:388–397.
Hiura TS, Li N, Kaplan R, Horwitz M, Seagrave JC, Nel AE. 2000.
The role of a mitochondrial pathway in the induction of apoptosis by
chemicals extracted from diesel exhaust particles. J Immunol 165:2703–
2711.
Kim WG, Mohney RP, Wilson B, Jeohn GH, Liu B, Hong JS. 2000.
Regional difference in susceptibility to lipopolysaccharide-induced neu-
rotoxicity in the rat brain: role of microglia. J Neurosci 20:6309–6316.
Kreutzberg GW. 1996. Microglia: a sensor for pathological events in the
CNS. Trends Neurosci 19:312–318.
Le Cabec V, Cols C, Maridonneau-Parini I. 2000. Nonopsonic phagocy-
tosis of zymosan and Mycobacterium kansasii by CR3 (CD11b/CD18)
involves distinct molecular determinants and is or is not coupled with
NADPH oxidase activation. Infect Immun 68:4736–4745.
Liu B, Wang K, Gao HM, Mandavilli B, Wang JY, Hong JS. 2001. Mo-
lecular consequences of activated microglia in the brain: overactivation
induces apoptosis. J Neurochem 77:182–189.
Majed HH, Chandran S, Niclou SP, Nicholas RS, Wilkins A, Wing
MG, Rhodes KE, Spillantini MG, Compston A. 2006. A novel role for
Sema3A in neuroprotection from injury mediated by activated micro-
glia. J Neurosci 26:1730–1738.
Mayer AM, Hall ML, Lynch SM, Gunasekera SP, Sennett SH, Pomponi
SA. 2005. Differential modulation of microglia superoxide anion and
thromboxane B2 generation by the marine manzamines. BMC Pharma-
col 5:6.
McCarthy KD, de Vellis J. 1980. Preparation of separate astroglial and
oligodendroglial cell cultures from rat cerebral tissue. J Cell Biol
85:890–902.
McGeer PL, McGeer EG. 2004. Inflammation and the degenerative dis-
eases of aging. Ann N Y Acad Sci 1035:104–116.
McGeer PL, Klegeris A, Walker DG, Yasuhara O, McGeer EG. 1994.
Pathological proteins in senile plaques. Tohoku J Exp Med 174:269–
277.
McGeer PL, Yasojima K, McGeer EG. 2001. Inflammation in Parkin-
son’s disease. Adv Neurol 86:83–89.
Milner R, Campbell IL. 2002. Cytokines regulate microglial adhesion to
laminin and astrocyte extracellular matrix via protein kinase C-
dependent activation of the alpha6beta1 integrin. J Neurosci 22:1562–
1572.
Min KJ, Yang MS, Kim SU, Jou I, Joe EH. 2006. Astrocytes induce
hemeoxygenase-1 expression in microglia: a feasible mechanism for
preventing excessive brain inflammation. J Neurosci 26:1880–1887.
Nagahata H, Higuchi H, Teraoka H, Takahashi K, Kuwabara M, Ina-
nami O. 2004. Decreased apoptosis of beta 2-integrin-deficient bovine
neutrophils. Immunol Cell Biol 82:32–37.
Park YK, Chung YS, Kim YS, Kwon OY, Joh TH. 2007. Inhibition of
gene expression and production of iNOS and TNF-alpha in LPS-
stimulated microglia by methanol extract of Phellodendri cortex. Int
Immunopharmacol 7:955–962.
Perry VH, Gordon S. 1988. Macrophages and microglia in the nervous
system. Trends Neurosci 11:273–277.
Petrova TV, Hu J, Van Eldik LJ. 2000. Modulation of glial activation by
astrocyte-derived protein S100B: differential responses of astrocyte and
microglial cultures. Brain Res 853:74–80.
Radkar V, Hardej D, Lau-Cam C, Billack B. 2007. Evaluation of resver-
atrol and piceatannol cytotoxicity in macrophages, T cells, and skin
cells. Arh Hig Rada Toksikol 58:293–304.
Rosenstiel P, Lucius R, Deuschl G, Sievers J, Wilms H. 2001. From
theory to therapy: implications from an in vitro model of ramified
microglia. Microsc Res Techniq 54:18–25.
Saura J, Tusell JM, Serratosa J. 2003. High-yield isolation of murine
microglia by mild trypsinization. Glia 44:183–189.
Shankaran M, Marino ME, Busch R, Keim C, King C, Lee J, Killion S,
Awada M, Hellerstein MK. 2007. Measurement of brain microglial
proliferation rates in vivo in response to neuroinflammatory stimuli:
application to drug discovery. J Neurosci Res 85:2374–2384.
Slepko N, Levi G. 1996. Progressive activation of adult microglial cells in
vitro. Glia 16:241–246.
Stence N, Waite M, Dailey ME. 2001. Dynamics of microglial activa-
tion: a confocal time-lapse analysis in hippocampal slices. Glia 33:256–
266.
Streit WJ, Graeber MB, Kreutzberg GW. 1988. Functional plasticity of
microglia: a review. Glia 1:301–307.
Sugita Y, Becerra SP, Chader GJ, Schwartz JP. 1997. Pigment epithe-
lium-derived factor (PEDF) has direct effects on the metabolism and
proliferation of microglia and indirect effects on astrocytes. J Neurosci
Res 49:710–718.
Sweitzer SM, Colburn RW, Rutkowski M, DeLeo JA. 1999. Acute
peripheral inflammation induces moderate glial activation and spinal IL-
1beta expression that correlates with pain behavior in the rat. Brain Res
829:209–221.
Uryu S, Tokuhiro S, Murasugi T, Oda T. 2002. A novel compound,
RS-1178, specifically inhibits neuronal cell death mediated by beta-
amyloid-induced macrophage activation in vitro. Brain Res 946:298–
306.
Wang XJ, Yan ZQ, Lu GQ, Stuart S, Chen SD. 2007. Parkinson disease
IgG and C5a-induced synergistic dopaminergic neurotoxicity: role of
microglia. Neurochem Int 50:39–50.
Young SH, Ye J, Frazer DG, Shi X, Castranova V. 2001. Molecular
mechanism of tumor necrosis factor-alpha production in 1?3-beta-
glucan (zymosan)-activated macrophages. J Biol Chem 276:20781–
20787.
Zietlow R, Dunnett SB, Fawcett JW. 1999. The effect of microglia on
embryonic dopaminergic neuronal survival in vitro: diffusible signals
from neurons and glia change microglia from neurotoxic to neuropro-
tective. Eur J Neurosci 11:1657–1667.
562 Cristovao et al.
Journal of Neuroscience Research
Copyright © 2022 FDOKUMEN