This book has been specifically designed to accomplish two things... #1
Upload
independentCategory
view
5download
0
Abstract The glycosylation of the intestinal cell layer isthought to control several key functions of the gut suchas vectorial transports, defence against microbial agentsor immunological processes. It has been assumed thatthe gut microflora may modulate the glycosylation pat-tern of the intestinal cell layer. However, there is no di-rect evidence for this regulatory process. The first goalof this work was to establish the germ-free mice intesti-nal glycosylation baseline using a histochemical ap-proach and a panel of ten lectins with defined glycanspecificities to tissue sections prepared from various cel-lular compartments of the small and large intestine. Us-ing this baseline, we have studied the contribution of thegut microflora on the carbohydrate composition ofglycoconjugates of intestinal cells by comparing thegerm-free and conventional mice glycosylation patterns.Analysis of the germ-free mice intestinal glycosylationbaseline revealed that the expression of glycans dependson the proximodistal gradient (small to large intestine)and on the cell lineage (absorptive, goblet, crypt, andPaneth cells), indicating that mice are able to create andmaintain a strict topological and cell lineage-specificregulation of glycosyltransferase expression. By compar-ing germ-free and conventional mice, we find that the
gut microflora specifically modulates the gut glycosyla-tion pattern, quantitatively as well as qualitatively bychanging the cellular and subcellular distribution of gly-cans. This is the first report in mice to directly demon-strate the critical contribution of microflora to intestinalglycosylation, a key characteristic of the gut.
Keywords Host–microbial interactions · Intestinal cells · Glycosylation baseline · Germ-free mice · Conventional mice · Lectin histochemistry
Abbreviations AAA Anguilla anguilla agglutinin · DSA Datura stramonium agglutinin · GSI Griffonia simplicifolia · HPA Helix pomatia agglutinin · MAA Maackia amurensis agglutinin · RCA-I · Ricinuscommunis agglutinin I · SNA Sambucus nigra agglutinin ·UEA-I Ulex europaeus agglutinin I · WGA wheat germagglutinin
Introduction
The epithelial surface of the intestinal tract comprisesvarious cell populations, including absorptive cells (en-terocytes and colonocytes), stem cells, mucus-producinggoblet cells, defensin-producing Paneth cells and a com-plex population of enteroendocrine cells. On the top ofthis complex cellular organisation, a mucosal layer ispresent and plays a major role as the first line of protec-tion. This epithelial coat consists largely of variousglycoconjugates, such as high molecular weight mucinssynthesised mainly by goblet cells, forming the mucousgel, and other glycoconjugates, mainly glycoproteins andglycolipids, synthesised by most of the epithelial cells,forming the glycocalyx associated with the brush bordermembrane. Glycans are composed of different oligosac-charide chains which contain different sugar residues: N-acetylglucosamine (GlcNAc), galactose, N-acetylga-lactosamine (GalNAc), fucose (Fuc), N-acetylneuraminicacid (NeuAc) or sialic acid, mannose, glucose and xy-lose. Glycoproteins are classified as either N- or O-gly-
M. Freitas · G. Trugnan (✉ )INSERM U538, CHU St-Antoine, 27 rue de Chaligny, 75012 Paris, Francee-mail: [email protected].: +33-1-40011370, Fax: +33-1-40011390
M. Freitas · C. CayuelaDanone Vitapole, Route Départementale 128, 91767 Palaiseau Cedex, France
L.-G. AxelssonKarolinska Hospital, Department of Gastroenterology and Hepatology, von Euler’s 5, 171 77 Stockholm, Sweden
L.-G. Axelsson · T. MidtvedtKarolinska Institute, Department of Cellular and Molecular Biology, Laboratory of Medical Microbial Ecology, von Euler’s 5, 171 77 Stockholm, Sweden
Histochem Cell Biol (2002) 118:149–161DOI 10.1007/s00418-002-0432-0
O R I G I N A L PA P E R
Miguel Freitas · Lars-Göran AxelssonChantal Cayuela · Tore Midtvedt · Germain Trugnan
Microbial–host interactions specifically control the glycosylation patternin intestinal mouse mucosa
Accepted: 23 May 2002 / Published online: 27 June 2002© Springer-Verlag 2002
coproteins. In N-glycoproteins, the oligosaccharide is attached to the nitrogen atom of the lateral chain of as-paragine whereas in O-glycoproteins the oligosaccharideis attached to the oxygen atom of the lateral chain of ser-ine or threonine. For each group, the oligosaccharidestructure chains are composed of an inner core commonto all compounds of a given class, and one or several antennae with a wide variety of glycans, conferring heterogeneity to the glycan part of the glycoconjugate (Mouricout and Julien 1987).
Susceptibility and resistance to intestinal infections isoften associated with presence or absence of receptorsappropriately glycosylated (Mouricout 1997). The carbo-hydrate moiety of glycoproteins and glycolipids acts notonly as a site for binding of large biomolecules (for example, microbial toxins, surface proteins, hormones,antibodies) but also as nutrients for the commensal intes-tinal microflora (Carlstedt-Duke et al. 1986; Mukai et al.1998; Dai et al. 2000; Walker 2000). The glycan struc-ture of glycoconjugates is genetically determined foreach particular individual, and is a product of genes cod-ing for specific enzymes involved in the glycosylationprocess (for example, glycosyltransferases, glycosidases;Falk et al. 1998). Microbial members of the intestinalmicroflora may be responsible for initiating in vivo pro-duction of host cellular glycoconjugates needed for microbes to join an evolving intestinal niche (Umesaki etal. 1995; Bry et al. 1996) or for changing the state ofglycosylation of luminal membranes and cytoplasmicglycoconjugates of the epithelial cells in the small intes-tine (Pusztai et al. 1995; Sharma and Schumacher 1995;Sharma et al. 1995; Freitas and Cayuela 2000). A suit-able approach to study the effect of microflora upon the host is to compare genetically identical mice that: (a) have never been exposed to any micro-organisms, i.e.germ-free (GF) mice, (b) have been associated with aconventional microflora or (c) have been kept in a GFstate for a period of time and then been exposed to a microflora or a selected strain or groups of its compo-nent organisms, ex-GF (Falk et al. 1998). It is important
to emphasise that by using GF animals, a baseline is cre-ated upon which influences of various environmentalfactors (for example, microbes, microbial products, dietary factors) can be studied. So far, however, the GFintestinal glycosylation pattern in mice has been deter-mined for some glycoconjugates.
Lectins are carbohydrate-binding proteins that are use-ful markers for localisation and characterisation of glyco-conjugates, both in vivo (Falk et al. 1994; Sharma andSchumacher 1995) and in vitro (Phillips and Frisch 1990;Ryder et al. 1994; Freitas and Cayuela 2000; Freitas et al.2001). They derive from plants, prokaryote and inverte-brate species and have been used to characterise some pe-ripheral sugars (galactose, GlcNAc, GalNAc, Fuc andNeuAc). Although the carbohydrate specificities of lec-tins are often given for single peripheral sugar(s), the re-ceptor epitope may be more complex and each lectin mayhave its own structural requirements for binding.
The aim of the present work was to obtain a map ofthe peripheral sugars present in the ileum and colon ofGF and CV mice, using immunological staining tech-niques, a proper panel of lectins and a confocal fluores-cence microscope. This approach allowed us to definethe GF mice intestinal glycosylation baseline pattern toevaluate in mice the contribution of intestinal microflorato this glycosylation pattern. Furthermore, we have alsoanalysed the internal lectin staining variability.
Materials and methods
Reagents
The lectin panel used in this study is described in Table 1. All theother products were from Sigma Aldrich (St-Quentin-Fallavier,France) unless otherwise specified.
Animals
Conventional (CV) and GF inbred NMRI/KI mice were obtainedfrom the Laboratory of Medical Microbial Ecology at the Karolinska
150
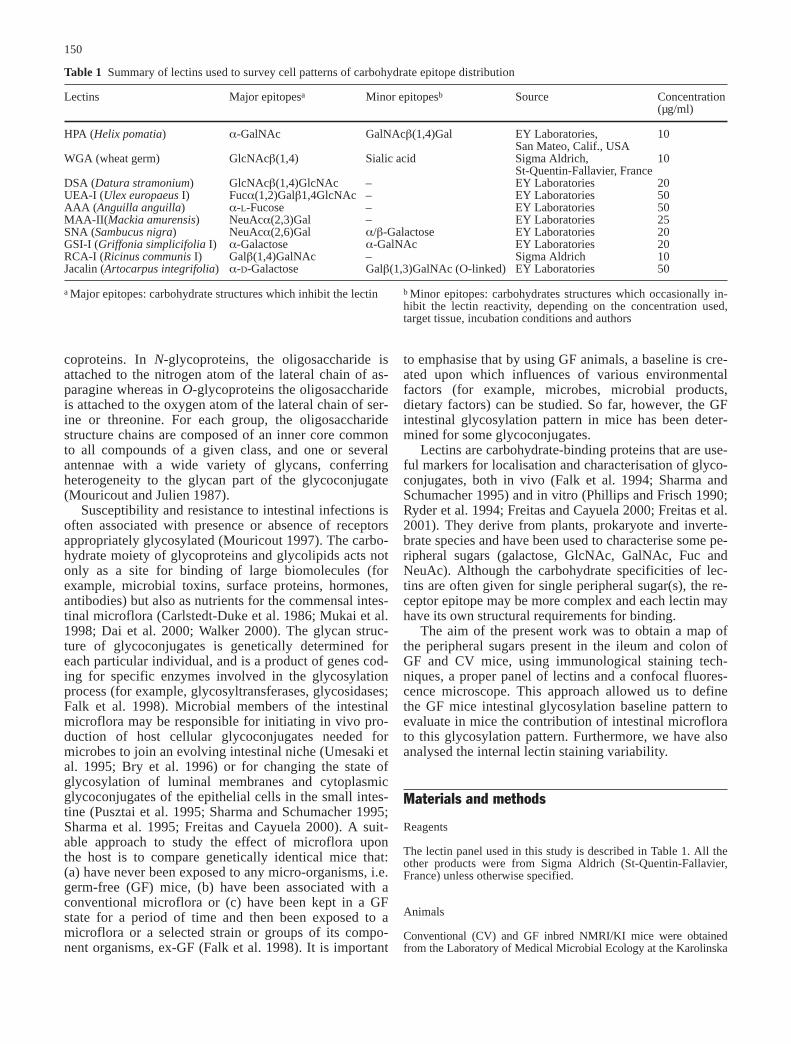
Table 1 Summary of lectins used to survey cell patterns of carbohydrate epitope distribution
Lectins Major epitopesa Minor epitopesb Source Concentration(µg/ml)
HPA (Helix pomatia) α-GalNAc GalNAcβ(1,4)Gal EY Laboratories, 10San Mateo, Calif., USA
WGA (wheat germ) GlcNAcβ(1,4) Sialic acid Sigma Aldrich, 10St-Quentin-Fallavier, France
DSA (Datura stramonium) GlcNAcβ(1,4)GlcNAc – EY Laboratories 20UEA-I (Ulex europaeus I) Fucα(1,2)Galβ1,4GlcNAc – EY Laboratories 50AAA (Anguilla anguilla) α-L-Fucose – EY Laboratories 50MAA-II(Mackia amurensis) NeuAcα(2,3)Gal – EY Laboratories 25SNA (Sambucus nigra) NeuAcα(2,6)Gal α/β-Galactose EY Laboratories 20GSI-I (Griffonia simplicifolia I) α-Galactose α-GalNAc EY Laboratories 20RCA-I (Ricinus communis I) Galβ(1,4)GalNAc – Sigma Aldrich 10Jacalin (Artocarpus integrifolia) α-D-Galactose Galβ(1,3)GalNAc (O-linked) EY Laboratories 50
a Major epitopes: carbohydrate structures which inhibit the lectin b Minor epitopes: carbohydrates structures which occasionally in-hibit the lectin reactivity, depending on the concentration used,target tissue, incubation conditions and authors

Institute, Stockholm, Sweden. Germ-free mice of the NMRI/KIstrain have been kept inbred for 43 generations. To avoid geneticdrift and to allow comparisons with mice having a normal flora, themicroflora is reintroduced at regular intervals to some GF mice byfeeding faeces from colonised mice for two generations, these miceare referred to as CV animals (Midtvedt et al. 1987). Germ-free micewere housed in gnotobiotic isolators under a strict 12-h light cycleand fed an autoclaved chow diet (R36; Lactamin, Vadstena, Sweden)ad libitum. Weekly faecal samples were checked for the presence ofmicro-organisms by Gram stain and by incubation in specific mediaunder aerobic and anaerobic conditions. Five animals (50–70 daysold) of each group were killed at postnatal day 35 by cervical dislo-cation and a midline incision was made to collect duodenum, jeju-num, ileum, caecum and colon (samples of the colon were taken atthe level of the splenic flexure). The intestines were opened longitu-dinally and the intestinal content was carefully removed with a spatula. The tissues were spread open on micropore filters and thenimmersed in Bouin’s fixation solution to allow proper orientation ofthe tissues during the histological preparation. After 24 h the Bouin’sfixation solution was exchanged to 70% ethanol through successiveethanol baths. Bouin’s solution keeps protein antigenicity and resultsin excellent morphological preservation, however definition of intra-cellular compartmentalisation of some molecules may be lost (Falket al. 1994). Conventional processing of the tissues for paraffin em-bedding was performed and approximately 3 µm serial sections werecut and placed on SuperFrost/Plus microscope slides (Menzel Gläser,Germany). Additional staining with eosin and haematoxylin was per-formed on each section for conventional histological evaluation.
Lectin staining
Sections obtained as described were subsequently deparaffinisedin xylene, and rehydrated in successive ethanol baths. The sectionswere then placed in phosphate-buffered saline (PBS), pH 7.4, con-taining 0.3% Triton X-100 and 1% bovine serum albumin for10 min. Processing tissue in this fashion allows a better access tolectin binding sites in the tissue, that may have been masked bythe paraffin embedding procedure. Sections were incubated withfluorescein isothiocyanate (FITC)-conjugated lectin for 1 h atroom temperature in a humid chamber. Lectin concentrations (Table 1) were adjusted in order to give the best signal:noise ratioas determined in preliminary experiments. Slides were then
washed five times with PBS and incubated with 1,4-diazabicyclo-[2.2.2]octane antifading reagent for 10 min and mounted withglass coverslips and glycergel (Dako, Carpinteria, Calif., USA).
Image processing
The FITC-lectins were visualised with either a Leica TCS 4D con-focal scanning laser microscope using 488 and 568 nm excitationbands from an argon krypton laser or a conventional fluorescencemicroscope Leica DMRB. Acquisition of each image was donewithout changing any light intensity setting parameters in thegreen channel. In order to eliminate non-specific fluorescence ofthe tissue, the red channel fluorescence was recorded and used asa background. Results were recorded according to the intensity offluorescence in individual cellular compartments and tissue sam-ple, and were graded semiquantitatively. Preliminary examinationsallowed to simplify the staining grade scale into three groups, neg-ative reactivity (–), moderate reactivity (+) and strong reactivity(++). We also took internal variability into consideration when atleast two mice within each group showed a different lectin reactiv-ity pattern. The main microscopist was M.F., but grading was per-formed both by M.F. and G.T., and there were no differences in interpreting staining intensity.
The analysis of GF mice intestinal sections with the differentlectins has generated a vast amount of data. Therefore we decidedto simplify the presentation of the results, and describe them intwo different parts, the small and the large intestine. For the smallintestine, results obtained with ileum are displayed. Essentiallysimilar results were obtained with the jejunum (not shown). With-in each intestinal part the analysis was made for the following cellular compartments: (a) enterocytes, goblet cells and crypt cellsfor the small intestine and (b) colonocytes and goblet cells for thelarge intestine.
In order to indicate the precise localisation of the staining, weanalysed in detail the intracellular compartments for each celltype. Enterocytes and colonocytes were classified as showing abrush border staining (see Tables 2, 3), presented as a thin layeralong the external membrane of the villi and/or a Golgi type stain-ing (see Table 2) identified as a labelled continuous line in be-tween the surface and the interior of the villi. In addition colon-ocytes were also found to have a sparse intracellular staining (seeTable 3), present evenly in the tissue, and/or a lateral membrane
151
Table 2 Intensity of cellular staining with fluorescein isothiocy-anate (FITC)-labelled lectins of the ileum of germ-free (GF) andconventional (CV) mice. Staining intensity is expressed on an ar-bitrary scale: – no staining, + moderate staining, ++ strong stain-ing. (B Brush border staining, G Golgi-type labelling, Mv mucousvesicles, Iv immature vesicles, P Paneth cells, ND not detectable)
Lectins Ileum
Enterocytes Goblet Crypts
GF CV GF CV GF CVP P
B G B G Mv Iv Mv Iv
HPA + – – + + – – + ++ ++WGA ++ ++ + + ++ – + – ++ ++DSA ++ – + – – – – – – –UEA-I – + + – – – ++ – – –AAA ND ND ND ND ND NDMAA – – + – – – – – + –SNA – – + – + – ++ – – –GSI a – + – + – ++ – –RCA-I + – + + + – ++ – – –Jacalin + – + + ++ – ++ – – –
a Internal variability
Table 3 Intensity of cellular staining with FITC-labelled lectins ofthe colon of GF and CV mice. Staining intensity is expressed onan arbitrary scale: – no staining, + moderate staining, ++ strongstaining. (B Brush border staining, Mv mucous vesicles, L lateralmembrane staining, I intracellular labelling, Iv immature vesicles,ND not detectable)
Lectins Colon
Colonocytes Goblet
GF CV GF CV
B I B L Mv Iv Mv Iv
HPA + – + – + – – ++WGA ++ – + – ++ – ++ –DSA ++ – + + – – – –UEA-I – + – – a ++ –AAA ND ND ND NDMAA – + + – a – –SNA ++ – – – + – ++ –GSI – – – – – + – ++RCA-I ++ – + ++ – – – –Jacalin – – – – a – ++
a Internal variability

152
Fig. 1A–J Lectin staining insmall intestine (ileum) of germ-free (GF) NMRI/KI mice.Sections of the ileum were in-cubated with fluorescein iso-thiocyanate (FITC)-labelledHPA (A), WGA (B), DSA (C),UEA-I (D), AAA (E), MAA (F),SNA (G), GSI (H), RCA-I (I)and Jacalin (J). Acquisition ofimages was performed with aconfocal scanning laser micro-scope. Fluorescence filterswere used in order to captureonly the specific staining thatoriginated from the FITC-lectinlabelling. Pictures are represen-tative of the tissue sample.They have been selected fromat least five similar analyses.Arrow in image J points out thetypical structure of a “goblet”cell. Inset in A shows the specific staining of enterocytesbrush border membrane withHPA. Inset in B shows the specific staining of Paneth cellswith WGA, where we can recognise their five to six“cone” assembled structure.Extremity of the arrowheadson each image indicates the orientation of the villi towardsthe lumen. Scale bars 20 µm

staining (see Table 3). The goblet cells presented a staining associ-ated either with the mature mucous vesicles (see Tables 2, 3) orwith immature vesicles (see Tables 2, 3). Mature vesicles are re-cognised by the labelling of the whole goblet cell, and eventuallyof some mucus excreted by these vesicles. On the other handstaining of immature vesicles was associated with the lower partof the goblet cell towards the interior of the villi for the ileum andof the columnar epithelium for the colon. Paneth cells are presentat the bottom of the crypts and assembled in groups of five to seven cells with an interior halo (see Table 2).
Results
Small intestine
Table 2 summarises the lectin staining pattern of the ileum, both for GF and CV mice. Figures 1 and 2 are im-ages of the ileum of GF mice. Enterocytes were labelled either on their brush border membrane or/and at the Golgiapparatus. To discriminate between mucous layer andbrush border labelling a higher magnification was used
(Fig. 2). The brush border layer is strongly stained withboth RCA-I (Fig. 1I) and DSA (Figs. 1C, 2B) in a differ-entiation-dependent manner. HPA (Fig. 1A inset), WGA(Figs. 1B, 2A) and Jacalin (Fig. 1J) stained the brush bor-der membrane less markedly. The supranuclear Golgi ap-paratus was labelled with WGA, which mainly recognisesGlcNAcβ(1,4) (Fig. 2A), and with the Fucα(1,2)Galβ1,4GlcNAc-specific UEA-I lectins (Fig. 2C). In only twoout of the five mice analysed, α-galactose-specific GSIstaining was observed showing a moderate intracellularand brush border type labelling (Fig. 1H).
The lectin staining pattern of CV mice enterocytes isshown in Fig. 3. Two interesting observations have beenmade. First, UEA-I, MAA and SNA weakly stained the brush border membrane of CV mice enterocytes incontrast to GF mice (compare Fig. 3D, F, G withFig. 1D, F G). Secondly, we have found spectacularchanges in the localisation of the staining for some lec-tins: the CV enterocytic staining with HPA, GSI, RCA-Iand Jacalin becomes associated with the Golgi apparatus
153
Fig. 2A–F Precise subcellularlocalisation of lectin staining inthe small intestine of GF mice.Images represent higher magni-fications of the ileum labellingwith WGA (A), DSA (B),UEA-I (C) and GSI (D), andeosin-haematoxylin staining ofthe ileum (E, F). F represents a higher magnification of thebottom of the crypts from E.Arrow in F shows a group ofPaneth cells assembled at thebottom of the crypt. Arrows inA and D point out specificstaining of a “goblet” cell.Scale bars 5 µm

154
Fig. 3A–J Lectin staining insmall intestine (ileum) of con-ventional (CV) NMRI/KI mice.Sections of the ileum were in-cubated with FITC-labelledHPA (A), WGA (B), DSA (C),UEA-I (D), AAA (E), MAA (F),SNA (G), GSI (H), RCA-I (I)and Jacalin (J). Inset in Ashows the specific Golgi stain-ing of enterocytes with HPA.Inset in B shows the specificstaining of enterocytes brushborder membrane and Golgiwith WGA. Scale bars 20 µm

155
Fig. 4A–J Lectin staining inlarge intestine of GF NMRI/KImice. Sections of the colonwere incubated with FITC-labelled HPA (A), WGA (B),DSA (C), UEA-I (D), AAA (E),MAA (F), SNA (G), GSI (H),RCA-I (I) and Jacalin (J). Theimages represent the most fre-quent lectin patterns observed.Scale bars 20 µm

(Fig. 3 inset in A), and much less associated with thebrush border membrane, as previously observed for theGF mice (Figs. 1, 2). WGA staining on the contrary wasmore clearly expressed at the brush border membrane inGF mice (Fig. 3B inset) as compared to CV mice(Figs. 1B, 2A) where the Golgi labelling was more pro-nounced. Finally, there was a slight decrease in the stain-ing with the lectin DSA in CV mice, compared to GFmice (Figs. 1C, 3C).
The majority of the lectins used stained GF mice gob-let cells, except for DSA, UEA-I and MAA (Figs. 1, 2).HPA, WGA, SNA, RCA-I and Jacalin stained GF gobletcells all along the tissue (Figs. 1, 2), although with dif-ferent intensities. The staining distribution of the gobletcells for the lectins described above appeared to be asso-ciated with structures resembling mucous vesicles (seearrow in Figs. 1J, 2A). The GSI staining was associatedwith the lower part of the goblet cells towards the interi-or of the villi (see arrow in Fig. 2D), suggesting stainingof immature vesicles.
Comparison of the lectin staining pattern of gobletcells in the ileum of CV mice with the one of GF micealso provided interesting observations. First, goblet cellsof CV mice were strongly stained with UEA-I (Fig. 3D),whereas in GF mice they were not stained (Fig. 2C).Second, there were some minor changes in either the lo-calisation or the intensity of goblet cell staining for HPA,WGA, SNA, GSI and RCA (Fig. 3). For example, HPAgoblet cell labelling became associated with structuresresembling immature mucous vesicles in CV mice(Fig. 3A inset), compared to the labelling of the maturemucous vesicles in GF mice (Fig. 1A inset).
Finally, GF mice crypt cells were mostly labelled withthree of the lectins used, HPA, WGA and MAA (Fig. 1).Particularly strong staining was observed with the α-GalNAc-specific HPA (Fig. 1A) and the GlcNAcβ(1,4)-specific WGA (Fig. 1B). It should be mentioned that thestaining with these two lectins was clearly associatedwith Paneth cells, revealing their typical morphology(Fig. 1B inset). Conventional eosin-haematoxylin stain-ing of the same sample (Fig. 2E, F) confirmed the pres-ence of Paneth cells at this level (see arrow in Fig. 2F).Interestingly, the microflora does not change the lectinstaining pattern of crypt cells as shown in CV mice(Fig. 3), except for MAA that was shown to no longer label the crypt cells in CV mice (compare Fig. 1F toFig. 3F). Staining with AAA for all the cellular compart-ments of the small intestine was too low to be analysed(Figs. 1E, 3E).
Large intestine
Members of the colonocyte epithelial cell lineage in GFmice were labelled by most of the lectins used (Table 3;Fig. 4). The localisation of the staining was associatedwith the brush border membrane, as shown for WGA(Figs. 4B, 5A), DSA (Figs. 4C, 5B), SNA (Fig. 4G),RCA-I (Fig. 4I) and faintly for HPA (Fig. 4A). However,staining with the lectins UEA-I (Figs. 4D, 5C) and MAA(Fig. 4F) was quite weak and essentially intracellular.
Analysis of CV mice colonocytes lectin labelling in-dicated that the microflora altered the GF mice glycosy-lation pattern (Fig. 6). The brush border membrane was
156
Fig. 5A–D Precise subcellularlocalisation of lectin staining inthe large intestine of GF mice.Higher magnifications of thecolon labelling with WGA (A),DSA (B), UEA-I (C) and GSI(D) (phase contrast and fluores-cence acquisition). Scale bars10 µm

157
Fig. 6A–J Lectin staining inlarge intestine of CV NMRI/KImice. Sections of the colonwere incubated with FITC-labelled HPA (A), WGA (B),DSA (C), UEA-I (D), AAA(E), MAA (F), SNA (G), GSI(H), RCA-I (I) and Jacalin (J).The images represent the mostfrequent lectin patterns ob-served. Scale bars 20 µm

not labelled with SNA (Fig. 6G), and WGA and DSAstaining was weak (Fig. 6B, C). In addition DSA andRCA-I labelling appeared to be redistributed towards thelateral membrane (Fig. 6C, I).
Goblet cells of GF mice were specifically stainedwith HPA, WGA, SNA, GSI and Jacalin (Figs. 4, 5).HPA, WGA and SNA labelled the entire mucous vesi-cles, while, interestingly GSI (Figs. 4H, 5D) and Jacalin(Fig. 4J) only stained the periphery of mucous vesicles
located mainly at the crypts, suggesting an associationwith the Golgi apparatus of immature goblet cells. La-belling was not observed for DSA, UEA-I, MAA andRCA-I (Figs. 4, 5). However, in one out of five mice wehave found a positive UEA-I goblet cells staining (notshown).
Similar to the ileum in CV mice, there was only asmall number, but very clear changes in the lectin stain-ing pattern of the goblet cells in the colon of CV com-
158
Fig. 7A–H Studies of internalvariability of lectin stainingpatterns among the group offive mice. A, B Sections of theileum incubated with FITC-labelled HPA for mouse 1 (A)and mouse 3 (B). C, D Sectionsof the ileum incubated withFITC-labelled GSI for mouse 3(C) and mouse 1 (D). E, F Sec-tions of the colon incubatedwith FITC-labelled WGA formouse 2 (E) and mouse 3 (F).G, H Sections of the colon in-cubated with FITC-labelledJacalin for mouse 2 (G) andmouse 3 (H). Scale bars 20 µm

pared to GF mice. The most obvious change was thevery strong labelling observed with UEA-I (Fig. 6D) inCV mice compared to GF where it was almost absent(Figs. 4D, 5C). Interestingly, HPA staining of gobletcells in CV mice was mostly localised in immature vesi-cles (Fig. 6A), while in GF mice it was present in maturemucous vesicles (Fig. 4A). Staining with AAA for all thecellular compartments of the large intestine was too lowto be analysed (Figs. 4E, 6E).
Internal variability among the mice
Variability among the five mice studied was present in10 out of 300 observed samples, and concerned onlythree out of the ten lectins (MAA, GSI, Jacalin). Asmight be seen from Fig. 7, the variability was expressedin two mice only (mouse 1, female, and mouse 3, male).As an example, HPA staining showed no variability(Fig. 7A, B), while GSI staining differed for the samemice (Fig. 7C, D).
Colonocytes did not show any lectin staining variabil-ity at all. On the other hand, we found internal stainingvariability associated with the GF goblet cells within thegroup of five mice analysed for MAA and Jacalin (Table 3). The large intestinal goblet cells of mouse 2(female) were stained positive with Jacalin (Fig. 7G)while those from mouse 3 (male) (Fig. 7H) were not.The same mice did not show any difference in their gob-let cells staining with the lectin WGA (Fig. 7E, mouse 2;Fig. 7F, mouse 3). Similar findings were obtained forMAA (results not shown). This variability could not beassociated with the sex or age of mice. Furthermore wealso exclude the fact of technical failures (for example,paraffin embedding, lectin incubation time), since all thecuts were processed in the same conditions. Such vari-ability might be related either to spontaneous mutationsof the genome or to an inbred genetic inheritance. Suchgenetic variation in inbred mice has been reported inseveral studies (Fitch and Atchley 1985; Crawley 1996).
Contrary to GF animals, we have not found any inter-nal variability in the staining of the ileum and the colonof CV animals.
Discussion
The aims of this work were: (1) to analyse the intestinalglycosylation pattern in different segments of the gut ofGF mice, using FITC-conjugated lectins, in order to es-tablish a baseline and (2) by comparing the GF and CVlectin pattern, to evaluate the contribution of the conven-tional microflora to the glycosylation pattern. This is thefirst global study performed in mice on these topicssince, until now, most of the GF and CV mice studieshave been focused to a single segment of the intestine or to a specific cellular compartment (Bry et al. 1996;Kandori et al. 1996).
The immunofluorescence approach used allowed usto establish the GF mice intestinal glycosylation baselinepattern, and all the lectins, except for AAA, give clearlabelling. Although we are aware that the lectin stainingis not enough to be completely sure that a given glucanstructure is present or not, since some crossreactionsmight exist with chemically related sugar structures, themodification of the lectin staining is a rather good indi-cation of a modification of the glycosylation pattern.
We have found a constant and strong staining withDSA, WGA and RCA-I residues in the brush border ofthe ileum and colon. This suggests that in enterocytesand colonocytes both GlcNAc and GalNAcβ(1,4) ex-pression was increased. It should be mentioned that DSAand RCA-I, but not WGA, displayed a differentiation-dependent pattern of expression. On the other hand, the brush border membrane staining with SNA wasmostly present in the colon, while the GSI (major epi-tope: α-galactose) and Jacalin brush border staining,even if variable, was mainly observed in the ileum andabsent in the colon. These observations suggest thatNeuAc transferases and α-galactosyltransferases followa tissue-specific and carbohydrate species-specific regu-lation. Finally, we did not find expression of UEA-I atthe brush border membrane of either the ileum or the co-lon. This result suggests either a downregulation of fuco-syltransferases (FucTs) at this level or a specific block-age in the targeting of fucose species to the brush bordermembrane. We favour this second hypothesis sinceFucα(1,2)Galβ1,4GlcNAc-specific UEA-I residues arealways present at the Golgi and intracellular level of theenterocytes and colonocytes, respectively. The stainingof WGA-specific species in enterocytes was associatedboth with the brush border membrane and Golgi appara-tus, indicating that GlcNAcβ(1,4) residues might also beinvolved in a specific targeting process.
Colonic mature goblet cells vesicles were staineduniquely with HPA, WGA and SNA, indicating that onlythe mucin type core 2, 3, 4 and 6 are present at this level(Van den Steen et al. 1998). Furthermore, the absence ofNeuAcα(2,3)Gal-specific MAA staining in mature vesi-cles shows that only colonic type mucins are produced(Gold and Shochat 1989). This is in good agreementwith previous results obtained on a human intestinalwell-differentiated polarised goblet cell line, HT29-MTX, where it has been shown that NeuAcα(2,6)Gal-specific SNA species are strongly present, compared to the weak reactivity of NeuAcα(2,3)Gal-specific MAA lectin (Huet et al. 1998; Freitas and Cayuela 2000; Freitas et al. 2001).
Immature goblet vesicles were identified by the stain-ing associated with the lower part of the goblet cells lo-calised towards the interior of the villi for the ileum, andof the columnar epithelium for the colon. In both cases,they were strongly stained with the α-galactose-specificGSI, suggesting that these carbohydrates species have animportant role in the maturation of mucins. This result isin good agreement with the fact that GSI has been shownto be strongly expressed in exocrine secretions.
159

Crypt bottom cells could only be recognised from the other cellular compartments in the ileum. Interesting-ly, they displayed a much more simple glycosylation pattern since they were specifically stained only with α-GalNAc-specific HPA, GlcNAcβ(1,4)-specific WGAand NeuAcα(2,3)Gal-specific MAA lectins. Paneth cellsare usually present at this level, and typically assembledin groups of five to seven cells with an interior halo(Bevins et al. 1999; Ganz 1999; Ayabe et al. 2000).Thus, HPA, WGA and, to a lesser extent, MAA appear torepresent markers for the Paneth cells in GF mice.
These results suggest that most of the glycosyl-transferases needed for the complete glycosylation processare present in GF mice intestine. However, each of theseglycosyltransferases might be differentially regulated de-pending on the cellular compartment and the tissue sampleconsidered. In some cases they can also remain inactivat-ed, waiting for luminal bacterial signals to switch themon. Differential regulation of gene expression in differenti-ated cell types in the intestinal epithelium has previouslybeen suggested for other proteins (for example, intestinalfatty acid binding protein; Cohn et al. 1992).
How may the present definition of the glycosylationbaseline of GF mice be used to delineate the contributionof gut microflora to the normal intestinal glycosylationpattern? To answer this complex question we have compared the glycosylation pattern of GF mice with theone of CV mice. We have found four different types of changes in the glycosylation pattern of CV mice: (1) increase in glycan expression, (2) decrease in glycan expression, (3) modulating the glycan expression level and (4) changing the localisation/trafficking of glycan-bearing structures.
The first, and most important change was observedfor the Fucα(1,2)Galβ1,4GlcNAc-specific UEA-I resi-dues, which were strongly stained in CV mice maturegoblet vesicles, but not in GF mice. This result indicatesthat microflora is able to switch on the fucosylation pro-cess on mucins, suggesting that specific FucT gene ex-pression was turned on. These observations are consis-tent with the works of Bry et al. in 1996, and Umesaki etal. in 1995, which have shown that colonisation of GFmice with specific microbes and/or conventional micro-flora leads to the induction of fucosylated glycoconju-gates in the small intestinal epithelium.
The opposite situation was observed for the NeuAcα(2,3)Gal-specific MAA and NeuAcα(2,6)Gal-specific SNA lectins, but was strongly dependent on theintestinal segment. In colonocytes only NeuAcα(2,6)Galexpression was switched off, whereas in crypt bottomcells the switch off concerned only the NeuAcα(2,3)Galexpression. These results fit with those of Sharma andShumacher in 1995 who also observed a decrease in sialic acid residues in rats inoculated with a human flora(Sharma and Schumacher 1995).
Apart from these two critical changes, we have alsoobserved that the CV mice microflora induced modifica-tions on particular lectin staining intensities resulting ina modulation of certain carbohydrates expression level,
mainly associated with goblet cells. For example thestaining reactivity in goblet cells with SNA (ileum andcolon), GSI (ileum and colon), RCA-I (ileum) and HPA(colon) was increased. On the other hand, a decrease inthe lectin staining intensity was observed at the colonbrush border membrane for WGA and DSA.
The last type of modification resulting from the inter-actions between the microflora and the mice intestinewere associated with the localisation and/or traffickingof glycan-bearing structures in columnar cellular com-partments (enterocytes and colonocytes). Three types ofstaining redistribution were observed. The first involvedthe change of the staining for HPA, RCA-I, GSI and Jacalin from the surface to the Golgi in enterocytes. The second involved the change of the staining forWGA- and UEA-I-specific residues from the Golgi tothe surface also in enterocytes. Finally, the third in-volved change of staining for DSA- and RCA-I-specificresidues in colonocytes from a typical brush bordermembrane staining to a lateral membrane staining. Al-though these are global results, they also show that theglycosylation process plays an important role in proteinsorting in biosynthetic traffic (Scheiffele et al. 1995).
The establishment in GF mice of an endogenous gly-cosylation pattern creates excellent opportunities for fur-ther studies of particular microbial influence upon theseparameters. Exposing GF animals to an increased num-ber of selected bacterial strains and/or bacterial productsshould make it possible to unmask the basics of prokary-ote-eukaryote crosstalk that take place under physiologi-cal as well as pathophysiological conditions.
Acknowledgements We thank P. Fontanges for the help with con-focal microscopy analysis. This work was supported by grants fromDanone, Fondation pour la Recherche Medicale (FRM) and Associ-ation pour la Recherche sur le Cancer (ARC). Miguel Freitas has agrant from the Association Nationale de Recherche Technique andthe Danone Vitapole, Danone (CIFRE grant).
References
Ayabe T, Satchell DP, Wilson CL, Parks WC, Serafini-Cessi F,Ouellette AJ (2000) Secretion of microbial α-defensins by in-testinal Paneth cells in response to bacteria. Nat Immunol1:113–118
Bevins CL, Martin-Porter E, Ganz T (1999) Defensins and innatehost defence of the gastrointestinal tract. Gut 45:911–915
Bry L, Falk PG, Midtvedt T, Gordon JI (1996) A model of host-microbial interactions in an open mammalian ecosystem.Science 273:1380–1383
Carlstedt-Duke B, Hoverstad T, Lingaas E, et al (1986) Influenceof antibiotics on intestinal mucin in healthy subjects. EurJ Clin Microbiol 5:634–638
Cohn SM, Simon TC, Roth KA, Birkenmeier EH, Gordon JI(1992) Use of transgenic mice to map cis-acting elements inthe intestinal fatty acid binding protein gene (Fabpi) that con-trol its cell lineage-specific and regional patterns of expressionalong the duodenal-colonic and crypt-villus axes of the gutepithelium. J Cell Biol 119:27–44
Crawley JN (1996) Unusual behavioral phenotypes of inbredmouse strains. Trends Neurosci 19:181–182
Dai D, Nanthkumar NN, Newburg DS, Walker WA (2000) Role of oligosaccharides and glycoconjugates in intestinal host defense. J Pediatr Gastroenterol Nutr 30(suppl 2):S23–S33
160

Falk P, Roth KA, Gordon JI (1994) Lectins are sensitive tools fordefining the differentiation programs of mouse gut epithelialcell lineages. Am J Physiol 266:G987–G1003
Falk PG, Hooper LV, Midtvedt T, Gordon JI (1998) Creating andmaintaining the gastrointestinal ecosystem: what we know andneed to know from gnotobiology. Microbiol Mol Biol Rev62:1157–1170
Fitch WM, Atchley WR (1985) Evolution in inbred strains of miceappears rapid. Science 228:1169–1175
Freitas M, Cayuela C (2000) Microbial modulation of host intesti-nal glycosylation patterns. Microb Ecol Health Dis Suppl2:165–178
Freitas M, Cayuela C, Antoine JM, Piller F, Sapin C, Trugnan G(2001) A heat labile soluble factor from Bacteroides thetaiota-omicron VPI-5482 specifically increases the galactosylationpattern of HT29-MTX cells. Cell Microbiol 3:289–300
Ganz T (1999) Defensins and host defense (comment). Science286:420–421
Gold DV, Shochat D (1989) Studies on the structure of the organ-specific determinant of human colonic mucin. Mol Immunol26:769–777
Huet G, Hennebicq-Reig S, Bolos C de, et al (1998) GalNAc-alpha-O-benzyl inhibits NeuAcalpha2–3 glycosylation andblocks the intracellular transport of apical glycoproteins andmucus in differentiated HT-29 cells. J Cell Biol 141:1311–1322
Kandori H, Hirayama K, Takeda M, Doi K (1996) Histochemical,lectin-histochemical and morphometrical characteristics of in-testinal goblet cells of germfree and conventional mice. ExpAnim 45:155–160
Midtvedt T, Carlstedt-Duke B, Hoverstad T, Midtvedt AC, Norin KE, Saxerholt H (1987) Establishment of a biochemi-cally active intestinal ecosystem in ex-germfree rats. Appl En-viron Microbiol 53:2866–2871
Mouricout M (1997) Interactions between the enteric pathogenand the host. An assortment of bacterial lectins and a set ofglycoconjugate receptors. Adv Exp Med Biol 412:109–123
Mouricout MA, Julien RA (1987) Pilus-mediated binding of bo-vine enterotoxigenic Escherichia coli to calf small intestinalmucins. Infect Immun 55:1216–1223
Mukai T, Kaneko S, Ohori H (1998) Haemagglutination and gly-colipid-binding activities of Lactobacillus reuteri. Lett ApplMicrobiol 27:130–134
Phillips TE, Frisch EB (1990) Secretory glycoconjugates of a mucin-synthesizing human colonic adenocarcinoma cell line.Analysis using double labeling with lectins. Histochemistry93:311–317
Pusztai A, Ewen SW, Grant G, et al (1995) Lectins and also bacte-ria modify the glycosylation of gut surface receptors in the rat.Glycoconj J 12:22–35
Ryder SD, Smith JA, Rhodes EG, Parker N, Rhodes JM (1994)Proliferative responses of HT29 and Caco2 human colorectalcancer cells to a panel of lectins. Gastroenterology 106:85–93
Scheiffele P, Peranen J, Simons K (1995) N-glycans as apical sort-ing signals in epithelial cells. Nature 378:96–98
Sharma R, Schumacher U (1995) The influence of diets and gutmicroflora on lectin binding patterns of intestinal mucins inrats. Lab Invest 73:558–564
Sharma R, Schumacher U, Ronaasen V, Coates M (1995) Rat in-testinal mucosal responses to a microbial flora and differentdiets. Gut 36:209–214
Umesaki Y, Okada Y, Matsumoto S, Imaoka A, Setoyama H(1995) Segmented filamentous bacteria are indigenous intesti-nal bacteria that activate intraepithelial lymphocytes and in-duce MHC class II molecules and fucosyl asialo GM1 glyco-lipids on the small intestinal epithelial cells in the ex-germ-free mouse. Microbiol Immunol 39:555–562
Van den Steen P, Rudd PM, Dwek RA, Opdenakker G (1998)Concepts and principles of O-linked glycosylation. Crit RevBiochem Mol Biol 33:151–208
Walker WA (2000) Role of nutrients and bacterial colonization inthe development of intestinal host defense. J Pediatr Gastroen-terol Nutr 30(suppl 2):S2–7
161
Copyright © 2022 FDOKUMEN