Effect of Culture Conditions on the Glycosylation Patterns of mAb
198
Effect of Culture Conditions on the Glycosylation Patterns of mAb by Hengameh Aghamohseni A thesis presented to the University of Waterloo in fulfillment of the thesis requirement for the degree of Doctorate of Philosophy in Chemical Engineering Waterloo, Ontario, Canada, 2015 ©Hengameh Aghamohseni 2015
-
Upload
khangminh22 -
Category
Documents
-
view
2 -
download
0
Transcript of Effect of Culture Conditions on the Glycosylation Patterns of mAb

Effect of Culture Conditions
on
the Glycosylation Patterns of mAb
by
Hengameh Aghamohseni
A thesis
presented to the University of Waterloo
in fulfillment of the
thesis requirement for the degree of
Doctorate of Philosophy
in
Chemical Engineering
Waterloo, Ontario, Canada, 2015
©Hengameh Aghamohseni 2015

ii
AUTHOR'S DECLARATION
I hereby declare that I am the sole author of this thesis. This is a true copy of the thesis,
including any required final revisions, as accepted by my examiners.
I understand that my thesis may be made electronically available to the public.
Hengameh Aghamohseni

iii
Statement of Contribution
Chapter 4 and partly of Chapter 6 are based on published work by Aghamohseni et al.
entitled “Effects of nutrient levels and average culture pH on the glycosylation pattern of
camelid-humanized monoclonal antibody” in Journal of Biotechnology, (2014) 186, 98–109,
2014.05.024, and are reported with permission from Journal of Biotechnology. The thesis
author's contributions to this publication were to conduct all the cell culture experiments,
experimental design, metabolites and mAb assays, sample preparation for the glycan analysis
done at the University of Manitoba and providing all the data used for the dynamic
extracellular metabolites’ and glycosylation models. Glycan analysis has been done by Dr.
Maureen Spearman with the assistance of Natali Krahn at the laboratory of Professor Mike
Butler at the University of Manitoba. In addition, the thesis author carried out the metabolic
flux analysis, macro reaction implementation, dynamic-model-structure establishment and
index-model- constitution according to the experimental results, and Kaveh Ohadi
collaborated in the coding of mathematical equations and optimization of the dynamic model
under the MATLAB environment. All plots and analysis of results were implemented by the
first author. The thesis author also wrote the final manuscript and responded to the comments
of reviewers. This work and journal paper preparation was conducted with direction from the
project main supervisors Hector Budman and Jeno Scharer and co-supervisor Murray Moo-
Young who are co-authors on the publication.

iv
Abbreviations
CHO Chinese hamster ovary
BHK Baby Hamster Kidney
NS0 Mouse Myeloma-derived
GI Galactosylation index instGI Instantaneous Galactosylation index
SI Sialylation index
mAb Monoclonal antibody
EPO Erythropoietin
tPA Plasminogen activator protein
INF Interferon
HILIC Hydrophilic interaction liquid chromatography
GU Glucose unit
RA Relative abundance
ER Endoplasmic reticulum
ADCC Antibody cell mediated cell cytotoxicity
CDC Complement dependent cytotoxicity
ELISA Enzyme-linked Immunosorbent assay
MFA Metabolic flux analysis
QmAb specific mAb productivity (pg/cell.h)
CMet metabolite concentrations (mM)
𝑄𝑣 volumetric mAb productivity (mg/l.h)
VCH Volumetric cell-hours (106
cells.hr/ml)
[Ala] Alanine concentration (mM)
[Amm], NH3 Ammonia concentration (mM)
[Asn] Asparagine concentration (mM)
[Lac] Lactic acid concentration (mM)
[Asp] Aspartic acid concentration (mM)
fgr growing fraction of viable cells
[Glc] glucose concentration (mM)
[Gln] glutamine concentration (mM)
[mAb] Monoclonal antibody concentration (mg/l)
Kij model parameters
µ specific growth rate (day-1
)
TCA Citric acid cycle
GlcNAc N-acetyl glucosamine
Man Mannose

v
GDP Guanosine diphosphate
CMP Cytidine monophosphate
UDP-GNAc Uridine diphosphate N-acetylhexosamine
UDP –GalNAc Uridine diphosphate N-acetylgalactosamine
UDP –GlcNAc Uridine diphosphate N-acetylglucosamine
G0 non-galactosylated glycan
G1 mono galactosylated glycan
G2 fully galactosylated glycan
S0 asialylated
S1 monosialylated
S2 disialylated
Sug Nucleotide sugar concentration(mM)
Xd specific death rate (day-1
)
Xv total viable cell density (106 cells/ml)
Gluc glucosidase
Man I Mannosyl-oligosaccharide 1,2-a-mannosidase
Man II Mannosyl-oligosaccharide 1,3-1,6-a-mannosidase
GnT I a-1,3-mannosyl-glycoprotein,
2-b-Nacetylglucosaminyltransferase
GnT II a-1,6-mannosyl-glycoprotein
2-b- N-acetylglucosaminyltransferase
FucT Glycoprotein 6-a-Lfucosyltransferase
GalT b-N-acetylglucosaminylglycopeptide
b-1,4-galactosyltransferase
SiaT b-Galactoside a-2,3/6-sialyltransferase
R vector of consumption and production rates of
metabolites
ψ vector of metabolite concentrations of all
intercellular metabolites
SSE sum of squared error
ODE Ordinary differential equation
E Activation energy
T Temperature (K)
pS Specific mAb productivity (pg/ cell.hr)
F Lactic acid feeding (mM)

vi
Abstract
The importance of cell culture environment on the glycan distribution of a newly
developed monoclonal antibody (mAb) has been comprehensively studied through a
combination of experiment and mathematical modeling. The ultimate goal of this research
was to formulate a mathematical framework that can be used to determine a set of operation
conditions including essential nutrient levels, byproduct concentration as well as pH and
temperature optimum conditions to control the glycan profiles. In this regard, CHO DUXB
cells were cultivated at different levels of initial glutamine concentrations (0, 2, 4, and 8
mM), pH levels (Reduced from the beginning of the culture or shifted down after the
exponential phase to 6.8±0.05) and temperature incubation (Reducing and Shifting
temperature strategies to 33˚ C). The relative abundance of glycan structures was determined
by hydrophilic interaction liquid chromatography and the galactosylation index (GI) and the
sialylation index (SI) were formulated to monitor the time profile of GI and SI levels during
cultures of typical 10 days duration. Increasing the initial level of glutamine from 0 to 8 mM
glutamine at constant level of 25 mM glucose resulted in a higher consumption rate of
glucose and consequently lowers galactosylation levels due to probable decrease of the
nucleotide sugars pool at glucose limited condition. Increasing the initial glutamine up to 8
mM was not effective for cell growth, and some growth inhibition due to high concentration
of ammonia was observed. The initial levels of glutamine concentration did not affect the
specific mAb productivity and consequently, did not impact the residence time of mAb in the
Golgi and evolution of glycosylation. For experiments initiated with different levels of

vii
glutamine, the GI values were mostly affected by the availability of glucose and ammonia
accumulation. The batches initiated without glutamine supplementation reached a higher
value of GI than batches cultivated with glutamine supplementation. It was hypothesized that
due to the observed co-metabolism of glucose and glutamine, glucose depletes faster in the
presence of glutamine thus becoming unavailable for glycosylation earlier in the culture. It
was also observed that the produced ammonia resulting from glutamine conversion had a
main effect on the activity of glycosyltransferase enzymes and consequently, led to low
levels of SI. pH reduction had negative effects on cell growth, mAb productivity but positive
effects on galactosylation and sialylation. At lower pH operation, GI rose because of a low
consumption of glucose for cell growth and SI improved because of higher sialyltransferases
activity at Reduced-pH conditions. The mechanisms for the effect of pH on glycosylation
were inferred from a combination of experimental observations and by using the GLYCOVIS
software that describes all possible glycosylation reactions occurring in the Golgi.
Regardless of the initial levels of glutamine, mild hypothermia had a significant effect
on the cell growth, mAb productivity and glycosylation profile. Cell growth was reduced at
lower temperature and cell viability remained high for a longer time of cell cultivation.
Temperature affected the specific glucose consumption rate and glucose was mainly
consumed for mAb production as specific mAb productivity and volumetric mAb
productivity were enhanced significantly. In the spite of a higher residual glucose
concentration at lower temperature compared to the control batches, the GI and SI level were

viii
not improved. This fact is likely to be correlated to the higher specific productivity of mAbs
that results in a reduced residence time in the Golgi complex.
Finally, a novel dynamic model that relates culture conditions to glycosylation was
proposed. The model consists of two sub-models: one describing the dynamic balances of
extracellular metabolites whereas the other sub-model is based on a semi-empirical balance
on a lump sum of nucleotides sugars and the correlation between these sugars’ levels to the
galactosylation index (GI). Both sub-models’ predictions were found to be in a good
agreement with the experimental data. These models can be combined together to relate the
extracellular conditions to glycosylation indices thus opening the possibility to optimize the
glycoprofiles by model based optimization. Such optimization may be able to address in
future work the tradeoff that has been observed in this thesis between mAb productivity and
glycosylation, i.e. higher productivity is generally accompanied by lower glycosylation and
vice versa.

ix
Acknowledgements
I would like to express my heart full thanks and appreciation to my outstanding
supervisors, Professors Hector Budman and Jeno Scharer for their continual supports of my
PhD study and research. Their patience, motivation, and immense knowledge added
considerably to my graduate experience. I could not have imagined having a better advisor
and mentor for my PhD study as Professor Budman. I appreciate his vast knowledge and
valuable contributions after hearth-breaking decease of Professor Jeno Scharer. I would like
to especially thank and appreciate my distinguished co-supervisor Professor Murray Moo-
Young for his great advices and directions at all levels of the research project.
I would like to thank the other members of my committee, Professors William Anderson
Frank Gu, Brendan McConkey for agreeing to be part of my PhD advising committee. I
would like to gratefully thank Professor Margaritis for serving as my external committee
member. My special thanks to Dr. Maureen Spearman for her tremendous efforts in helping
me to carry out my data analysis.
University of Waterloo and Monoclonal Antibody Network (MabNet-NSERC) are also
appreciated for the funding of this research.
I also want to thank all of my colleagues, Saeedeh Naderi, Kaveh Ohadi, Johannes Gädke
Yuncheng Du, Otacilio Pereira, Noor Aljalam, Ali Nikdel, Keywan Norouzi, Abdul
Murayyan, Jann Ang, Susan Gow and Mary McPherson and my lovely friends Hadis, Lena,
Zohreh, Fariba, Tatyana and Zhenovy for all their help, support, and valuable hints.

x
In the end, I would like to extend my heart full appreciation to my wonderful husband
Shahabedin and my kind parents Hamid and Nahid, and my thoughtful sisters Marjaneh and
Azadeh, for their endurance, support, and encouragements especially during difficult times.
Moreover, I like to appreciate the help and support of my in-laws during years of PhD
studies.

xi
Dedication
To my love and best friend
Shahabedin
for being a wonderful companion and support in all the stages of my study
This thesis and the pursuit of my goals would not have been possible
without you

xii
Table of Contents
AUTHOR'S DECLARATION .......................................................................................... ii
Statement of Contribution ................................................................................................. iii
Abstract ............................................................................................................................. vi
Acknowledgements ........................................................................................................... ix
Dedication ......................................................................................................................... xi
Table of Contents ............................................................................................................. xii
List of Figures ................................................................................................................. xvi
List of Tables ................................................................................................................ xviii
Chapter 1 Introduction ....................................................................................................... 1
1.1 Research Motivation ................................................................................................ 1
1.2 Research Objectives ................................................................................................. 4
Chapter 2 Literature Review ............................................................................................ 12
2.1 Monoclonal Antibody Production .......................................................................... 12
2.2 Chinese Hamster Ovary Cells ................................................................................ 13
2.3 Glycosylation ......................................................................................................... 14
2.3.1 N-Glycans ........................................................................................................ 15
2.4 Control of Oligosaccharide Processing in Mammalian Cell Culture ..................... 17
2.4.1 Host Cell Line ................................................................................................. 18
2.4.2 Culture Environment ....................................................................................... 19
2.4.3 Modeling of The Extracellular environment ................................................... 33

xiii
Chapter 3 Experimental Studies and Analysis Techniques ............................................. 36
3.1 Cell Line ................................................................................................................. 37
3.1.1 Initiation of Cell Culture ................................................................................. 37
3.1.2 Cell Passaging and Maintenance ..................................................................... 38
3.1.3 Cryogenic Preservation ................................................................................... 39
3.2 Batch Culture ......................................................................................................... 40
3.2.1 Reduced-pH Adjustment ................................................................................. 41
3.2.2 Reduced-Temperature Adjustment .................................................................. 42
3.2.3 Specific Metabolites Production and Consumption Rates .............................. 42
3.3 Analytical Procedures ............................................................................................ 43
3.3.1 Viable Cell Concentration and Viability Index ............................................... 43
3.3.2 Glucose, Glutamine, Lactate and Ammonia Assay ......................................... 44
3.3.3 Amino acids Assay .......................................................................................... 45
3.3.4 Monoclonal Antibody Purification and Analysis ............................................ 45
3.3.5 Glycan Analysis .............................................................................................. 46
3.3.6 Glycosylation Indices ...................................................................................... 48
Chapter 4 Effects of Nutrient Levels and Average Culture pH ....................................... 51
4.1 Introduction ............................................................................................................ 52
4.2 Materials and Methods ........................................................................................... 54
4.2.1 Batch Condition and Experimental Design ..................................................... 54
4.2.2 Analysis ........................................................................................................... 55

xiv
4.3 Results and discussion ........................................................................................... 56
4.3.1 Cell Density and Metabolite Profiles .............................................................. 56
4.3.2 Glycan Profiles ................................................................................................ 64
4.3.3 Glycosylation Indices ...................................................................................... 69
4.4 Modeling of the glycosylation Process .................................................................. 73
Chapter 5 Effect of Mild Hypothermia ............................................................................ 77
5.1 Introduction ............................................................................................................ 77
5.2 Materials and Methods ........................................................................................... 79
5.2.1 Batch Conditions and Experimental Designs .................................................. 79
5.2.2 Analysis ........................................................................................................... 80
5.3 Results and Discussion........................................................................................... 81
5.3.1 Cell Growth Characterization .......................................................................... 81
5.3.2 Extracellular Metabolite Profiles ..................................................................... 89
5.3.3 mAb’ Profiles, Specific and Volumetric Productivity .................................... 96
5.3.4 Glycan Profiles and Glycosylation Indices ................................................... 103
Chapter 6 Mathematical Modeling ................................................................................ 118
6.1 Introduction .......................................................................................................... 119
6.2 Modeling of the Extracellular Environment ........................................................ 121
6.2.1 Metabolic Flux Analysis ............................................................................... 121
6.2.2 Dynamic Modeling ........................................................................................ 129
6.3 Modeling of the Glycosylation Process ............................................................... 143

xv
6.3.1 Glycosylation Model ..................................................................................... 146
Chapter 7 Conclusion and Future Work Suggestions .................................................... 152
7.1 Conclusion ........................................................................................................... 152
7.2 Future Work Suggestions ..................................................................................... 161
7.2.1 Use of a Controlled pH and Temperature Bioreactor .................................... 161
7.2.2 Use of Fed-Batch and Perfusion Operations ................................................. 161
7.2.3 Cell Adaptation to a lower Temperature conditions ..................................... 162
7.2.4 Improvement of the Glycosylation Model .................................................... 162
7.2.5 Real Time Glycosylation Monitoring ............................................................ 163
Appendix A Metabolites and glycosylation Indices profiles with HCl pH adjustment 164
Appendix B HILIC Profiles of Glycans ........................................................................ 165
Appendix C Metabolic Pathways .................................................................................. 168
Appendix D Dynamic Model’s Parameters ................................................................... 169
Appendix E Glycosylation Index Model’s Parameters ................................................. 170
Bibliography .................................................................................................................. 171

xvi
List of Figures
Figure 1, Normal phase HPLC elution times of dextran ladder with GU units assigned (Domann et al.
2007) ............................................................................................................................................ 47
Figure 2, Structural assignments of the CHO-EG2 glycan were confirmed using shifts of GU values
of major peaks using exoglycosidase digests .............................................................................. 49
Figure 3, Viable cell density and metabolite profiles. …………………………………………….57
Figure 4, Cell viability profile. ............................................................................................................. 60
Figure 5, Viable cell density and metabolite profiles ........................................................................... 62
Figure 6, Individual glycans relative abundances (RA%) at different culture conditions. ................... 65
Figure 7, Individual glycans relative abundances (RA%) at different culture conditions. ................... 66
Figure 8, Galactosylation index, GI and sialylation index, SI at different culture conditions. ............ 70
Figure 9, Glycan distribution network from GLYCOVIS at different days of batch cultures…. 74
Figure 10, Time profile of total viable cell density of CHO cells cultivated at 4 mM glutamine and
different temperature conditions.. ................................................................................................ 82
Figure 11, Time profile of viability index of CHO cells cultivated at 4 mM glutamine and different
temperature conditions. ................................................................................................................ 83
Figure 12, Time profile of total viable cell density of CHO cells cultivated at 0 mM glutamine and
different temperature conditions. ................................................................................................. 84
Figure 13, Time profile of viability index of CHO cells cultivated at 0 mM glutamine and different
temperature conditions. ................................................................................................................ 86
Figure 14, Metabolite profiles of mild hypothermia experiment at 4 mM Gln. ................................... 90
Figure 15, Metabolite profiles of mild hypothermia experiment at 0 mM Gln. ................................... 92
Figure 16, mAbs profiles and mAbs specific productivity of mild hypothermia experiment at 4 mM
Gln. .............................................................................................................................................. 97
Figure 17, Maximum volumetric productivity, 𝑸𝒗, 𝒎𝒂𝒙, under mild-hypothermia conditions
compared to the control. .............................................................................................................. 99
Figure 18, mAbs profiles and mAbs specific productivity of mild hypothermia experiment at 0 mM
Gln. ............................................................................................................................................ 102
Figure 19, Galactosylation index, GI, profile under mild hypothermia and 4 mM glutamine condition.
................................................................................................................................................... 109

xvii
Figure 20, Galactosylation index, GI, profile under mild hypothermia and glutamine-Free condition.
................................................................................................................................................... 115
Figure 21, The complete reaction network utilized for metabolic flux analysis (Gao et al. 2007). ... 123
Figure 22, Distribution of fluxes for a batch culture with initial 4 mM glutamine and 25 mM glucose
for exponential (black bars) and post-exponential (white bars) phases of growth (Aghamohseni
et al. 2014) ................................................................................................................................. 127
Figure 23, The simplified metabolic network for CHO DUXB (Aghamohseni et al. 2014).............. 128
Figure 24, Results of model validation with 0 mM Gln, 4 mM Gln, and 8 mM Gln
conditions. .................................................................................................................................. 134
Figure 25, Results of dynamic model validation with initial 4 mM and Reduced-pH experiment. ... 140
Figure 26, Results of dynamic model calibration with initial 4 mM glutamine and model prediction
for 4mM glutamine and Reduced-Temperature and Shifted-Temperature experiments. .......... 141
Figure 27, Results of dynamic model calibration with initial 4 mM glutamine and model prediction
for 0 mM glutamine and Reduced-Temperature and Shifted-Temperature experiments.. ........ 142
Figure 28, Schematic representation of the comprehensive model (Ohadi et al. 2013). .................... 145
Figure 29, Profile of experimental and predicted GI at different culture conditions. Data points
presents experimental data and dash lines display model observations……………………151

xviii
List of Tables
Table 1, Glycan structures of Eg2-hFc based on the Glycobase .......................................................... 50
Table 2, Experimental design for three initial glutamine concentrations. ............................................ 55
Table 3, Specific glucose and glutamine consumption rates at different glutamine supplementation . 61
Table 4, Experimental design for temperature effects at two initial concentrations of glutamine and
constant level of glucose (25 mM)............................................................................................... 80
Table 5, Specific growth rate at mild hypothermia condition for cells cultivated at glutamine 4 mM
and zero mM glutamine supplementation. ................................................................................... 87
Table 6, Specific consumption and production rates of metabolites at mild hypothermia and 4 mM
glutamine a), mild hypothermia and glutamine-free b). .............................................................. 94
Table 7, Specific mAb productivity under mild-hypothermia conditions at exponential and post
exponential phase of growth, ....................................................................................................... 97
Table8, Relative abundances of dominant glycans (%) under mild hypothermia and 4 mM glutamine
on days 3, 4, 5 and 7 of cultivation. Each data point presents the average of glycan percentage
for two replicated flasks a) Shifted-Temperature and 4 mM glutamine, b) Reduced-Temperature
and 4 mM glutamine. ................................................................................................................. 104
Table 9, Relative abundances of dominant glycans (%) under mild hypothermia and glutamine-free
condition, on days 3, 4, 5, and 7 of cultivation. ......................................................................... 112
Table 10, Essential macro-reactions of extracellular metabolites ...................................................... 129
.
1
Chapter 1
Introduction
1.1 Research Motivation
Over the past two decades, the exploration and development of biopharmaceutical proteins
has been recognized as one of the major applications of biotechnology. In particular,
recombinant human proteins have been produced in a wide range of hosts such as various
mammalian (mainly murine) cell lines, bacteria, yeast and insect cells (Sethuraman and Stadheim
2006). Due to the similarity with their original form in humans, these recombinant proteins can
be used for replacement or enhancement of naturally existing proteins for the treatment of
numerous pathological conditions (Sethuraman and Stadheim 2006).
Monoclonal Antibodies (mAbs) are a class of therapeutic agents with high pharmaceutical
market interest due to their application in the fields of immunology and oncology. Their
capabilities have been proven successful, and thus, as of 2010, mAbs have claimed
approximately 5% of the estimated $850 billion pharmaceutical market. Due to this success,
rapid development in this field has been taking place, with around 40 new mAbs being studied
each year since 2007. Seventy five percent of the current applications of mAbs are to fight
various forms of cancer and arthritis, but applications to other chronic illnesses are also currently

2
being investigated. Some features of mAbs that makes them especially suitable for use in
humans are their high specificity with substrates, and their minimal side effects (Li et al. 2010;
Fekete et al. 2013).
The market for therapeutic glycoproteins produced by mammalian cells is expected to reach
US $500 billion by 2020 (Kuystermans and Al-rubeai 2015). Among the various mammalian cell
cultures, Chinese Hamster Ovary (CHO) cells have been found to be a very effective host for
industrial production of recombinant protein therapeutics. CHO cells have protein processing
machinery similar to that in humans and this can be exploited to create necessary modifications
(Butler 2006a; Hossler 2012).
Glycosylation is one of the most important post translational processes occurring in
mammalian that strongly affects the therapeutic properties of mAbs (Spearman and Butler 2015).
Therefore, it is crucial to synthesize human mAbs in animal cell cultures which primary structure
and conformation are as similar as possible to the naturally occurring proteins in the human
body. Thus, conditions should be imposed to achieve the correct glycosylation patterns (Hossler
et al. 2009).
The glycosylation process in eukaryotic cells is associated with numerous complex enzymatic
reactions whereby sugar groups (oligosaccharides) are attached to the protein’s backbone with
covalent bonds. The conserved core sugars, which form five out of the fourteen common sugar-
lipid-complexes, can be modified by trimming and branching reactions, while the proteins that
are transported through the endoplasmic reticulum (ER) and Golgi apparatus undergo

3
modifications that result in various forms of glycoproteins (Restelli and Butler 2002). Based on
the glycan binding site on the polypeptide backbone, glycans are categorized into two major
groups: N-linked glycans, where the oligosaccharides attach to the side chain of asparagine, and
O-linked glycans, where the oligosaccharides bind to serine or threonine. The former type
predominates in animal cell culture. Since many of the reactions during the glycosylation process
often do not proceed to completion due to the operating conditions occurring during synthesis, a
pool of heterogeneous glycoforms is produced (Restelli and Butler 2002; Spearman and Butler
2015).
The diversity of glycoforms may manifest itself in site–occupancy (macro-heterogeneity) or in
the structure of added glycans (micro-heterogeneity). The glycan conformations are important
because they can influence the biological characteristics of the mAb products including
secretion, solubility, receptor recognition, antigenicity, bioactivity and pharmacokinetics
(Spearman and Butler 2015).
Human serum IgG and therapeutic mAbs are highly fucosylated. It has been demonstrated that
antibody cell mediated cell cytotoxicity (ADCC) is affected by the fucosylation level of mAbs.
ADCC is activated through attachment of lymphocyte receptors (FcɣRs) to the Fc region of the
antibody. The reduction of core fucose from the glycans has been found to improve the ADCC
activity up to 50 fold (Shields et al. 2002; Konno et al. 2012). It has been observed that N-
glycans of IgG1, that possessed a higher level of galactosylation, cooperated greatly in the
activity of immune system. The normal level of agalactosylated Fc glycans of serum IgG is

4
between 25 and 35 %. In Rheumatoid arthritis, infection and inflammatory bowel diseases the
level of agalctosylated glycans of serum IgG increases significantly (Karsten et al. 2012).
Galactosylation also plays an important role in the complement dependent cytotoxicity (CDC)
of Mabs (Wong, et al., 2005a). The sialic acid content of N-glycans is also important in the
regulation of anti-inflammatory immune response of IgG (Anthony et al. 2008). In addition,
increasing the sialylation level of therapeutics could improve the serum half-life of therapeutic
proteins by preventing the activity of asialoglycoprotein receptors available in the liver (Butler
2006a).
1.2 Research Objectives
Following the above-mentioned influences of glycoforms on the therapeutic efficacy of mAbs,
it is necessary to identify the culture conditions that control the bioprocess for synthesizing
mAbs with the desired spectrum of glycans. An appropriate model with the capability of
correlating the mAb glycan profile to the cell culture conditions would be useful for bioprocess
design and control, culture media formulation, and possible genetic engineering strategies (Del
Val et al. 2010).
In view of the above, the major objective of the present study was to develop a systematic
approach to determine a set of operational conditions, including essential nutrient levels as well
as byproduct concentration, to produce a desired glycan profile. To accomplish this goal,

5
mathematical modeling was used in combination with extensive experiments to describe the
correlations between culture conditions to the antibody productivity and glycoprofiles.
It was hypothesized that using the developed model, it will be possible in the future to
accurately control the mAb productivity and the glycoprofiles by imposing the required set of
culture conditions. Although several studies have evaluated the effects of particular nutrients
(such as glucose, glutamine, galactose, etc.), culture supplements or inhibitors (ammonia,
DMSO, etc.) on the glycan profile (Hossler et al. 2009), it was found that the literature is lacking
with respect to the investigation of the combination of these factors on the glycan profile, cell
growth and antibody productivity.
To our knowledge, before the current research, no other mathematical models were available
that connected the extracellular culture conditions with the resulting glycoprofiles. Earlier
models reported in the literature studied particular aspects of the problem. For example, Del Val
et al. (2010) have developed a model to represent the N-glycosylation process within the Golgi
apparatus while considering the transport of nucleotide sugar donors from the cytosol to the
Golgi lumen. However, this model had not been coupled to the culture conditions at the time of
starting this project (Del Val et al. 2010). Recently, these authors expanded their model to
include the effect of extracellular glucose (Jedrzejewski et al. 2014). In contrast, the model
framework developed in our study considers a number of environment factors such as glucose,
glutamine, temperature and pH conditions.

6
Towards the goal of developing a comprehensive model connecting culture conditions with
glycosylation and antibody productivity, this thesis research accomplished the following tasks:
1. Evaluated the effect of glucose and glutamine availability on mAbs’ glycan profiles.
2. Assessed the effect of byproduct accumulation of ammonia on glycosylation by
cultivation of cells at different initial levels of glutamine.
3. Investigated the effect of the environmental pH on glycosylation and productivity.
4. Studied the effect of temperature reduction on glycosylation due to the resulting changes
of residence time of the antibody in the Golgi apparatus.
5. Developed a mathematical model that correlates the glycan profile with the factors
studied in the above items.
With regard to objectives (1-2), the relative contribution of each essential nutrient, particularly
glucose and glutamine, and byproduct accumulation, specifically ammonia, were investigated by
carrying out an appropriate set of experiments at 25 mM of glucose concentration and four
different levels of glutamine (0,2,4 and 8 mM). The specific production and consumption rates of
extracellular metabolites have been assessed by a multi-parameter bioanalytical system,
BioProfile 400 (Nova Biomedical, Waltham, MA). The mAb productivity was monitored by
using an enzyme-linked Immunosorbent assay (ELISA) developed by MabNet for Eg2-hFc
mAb. A hydrophilic interaction liquid chromatography (HILIC) followed by exoglycosidase
enzyme array digestion were applied for glycan analysis.
7
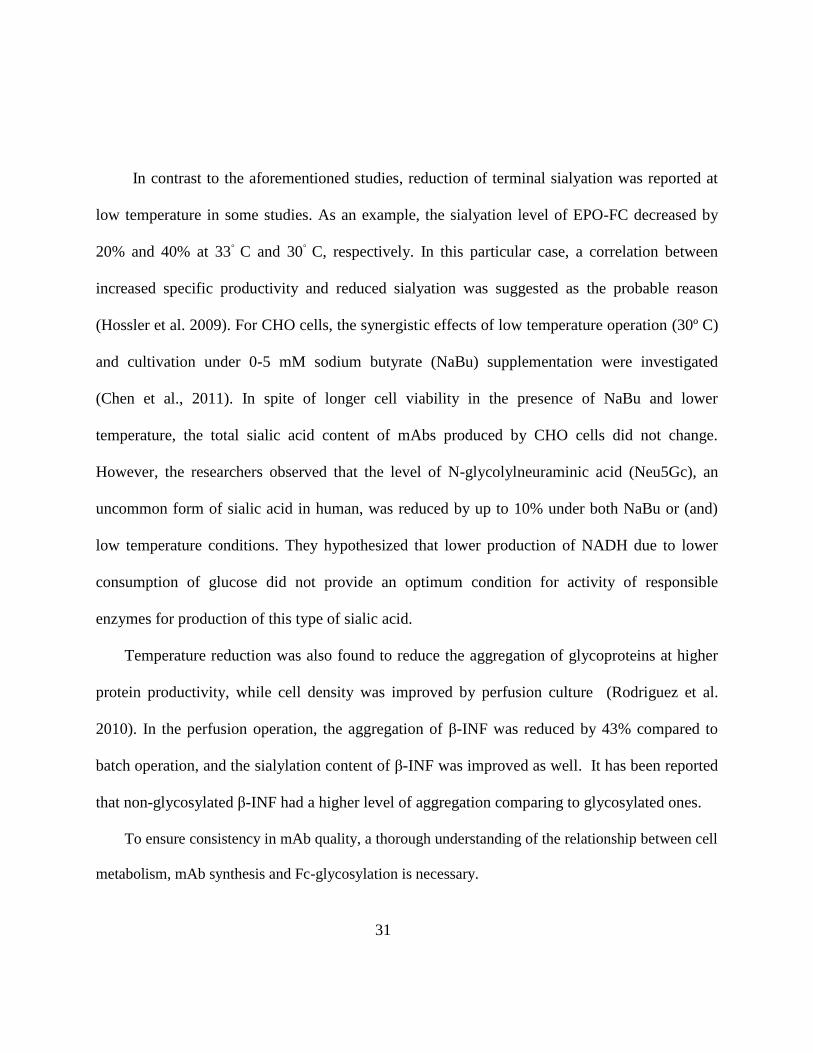
It was found that the culture with medium levels of glucose and glutamine reached the highest
level of cell density, but the mAb productivity was almost the same for all conditions. The
population of dead cells was found to be correlated with higher levels of ammonia that mostly
resulted from the metabolism of glutamine. Glycosylation levels changed significantly with the
initial glutamine level, and in the culture with a lower level of glutamine, a higher level of
sialyation was observed. Galactosylation was affected by both glucose and glutamine levels.
Regarding objective (3) it was found that reducing the culture pH to as low as 6.8±0.05 has
notable effects on sialyation and galactosylation levels. A model of the glycan reactions
occurring in the Golgi (GLYCOVIS) was used to understand the particular pathways that
determine the glycan profiles for the experiments conducted for the above objectives (1-3).
In objective (4) above, it was found that temperature changes can be used to manipulate the
residence time of mAbs through the Golgi complex thus changing the exposure time of proteins
to glycosyltransferase enzymes present in the Golgi apparatus. Later, by decreasing mAb
productivity at Reduced-pH conditions but improving mAb glycosylation, attempts were made to
apply mild hypothermia to improve protein productivity as well. In spite of the negligible effect
of temperature on the glycan pattern of glycoproteins reported by researchers ( Chen et al., 2011;
Hossler, 2012; Rodriguez et al., 2010; Yoon, Song, & Lee, 2003), we did observe changes in the
glycan profile for Eg2-hFc and, at the same time, the mAb productivity improved significantly.
The lower galactosylation levels observed at the end of the exponential phase of growth at

8
Reduced-Temperature may be due to shorter residence time of mAbs in the Golgi complex rather
than glucose limitations.
Objective (5) focused mostly on the construction of a mathematical approach for correlating
variables presented in items (1-4) to the mAbs glycosylation profile. To this end, we first
formulated a model to describe the extracellular culture conditions including cell growth,
antibody productivity and extracellular concentrations of main metabolites.
This dynamic model was based on a preliminary metabolic flux analysis (MFA) that was
applied to eliminate insignificant metabolic pathways and adding appropriate ones based on the
experimental results. The dynamic model was implemented according to the systematic approach
proposed by our group previously (Naderi et al. 2011). The parameters of the dynamic model
were calibrated based on the experimental data (Ohadi et al. 2013; Aghamohseni et al. 2014).
After, the effects of Reduced-pH and Reduced-Temperature were applied on the dynamic model
to create a descriptive dynamic model for a wider range of set of experiments and the model
parameters were recalibrated.
Then, to connect this model of extracellular properties to glycosylation two different
approaches were pursued: 1- a semi-empirical model was develop to correlate directly the
extracellular conditions to the glycosylation indices through the solution of a lumped quantity
representing nucleotides’ sugars levels (defined in Chapter 6) and 2- a mechanistic model was
formulated to correlate the extracellular culture conditions to the individual glycans’ levels
through the solution of three connected sub-models: i) a dynamic model of extracellular

9
metabolites, ii) a nucleotide sugars production model in the cytosol and iii) a model of
glycosylation occurring in the Golgi apparatus (Ohadi et al. 2013).
Although the second modeling approach is very rigorous, because it considers nucleotide and
nucleotide sugar donor networks and the kinetics of the individual reactions, we have found the
parameter optimization for this model to be very challenging. In addition, to achieve an
acceptable optimized model, many data points are required. In particular, the culture samples
needed for analysis of intracellular metabolites are relatively large as compared to the total
working volume in the flask. In this regards, the first approach regarding a semi empirical model
was expended in this thesis. This model speculates a lumped profile of nucleotide sugars and an
instantaneous galactosylation index ( instGI ). The nucleotide sugar concentration Sug per one
day interval is associated with the nucleotide sugar production, glucose and glutamine
concentration, and specific growth rate of that day. The instGI model correlates to Sug profile,
glucose concentration and mAb specific productivity. The combination of this model was
accomplished to predict the galactosylation indices for a wild range of culture condition over
seven days of cell cultivation.
The semi-empirical model proposed above is easier to calibrate and it can serve to easily
elucidate correlations between extracellular properties and glycosylation while avoiding the very
challenging parameter estimation task required for the second more rigorous model.
This thesis comprises seven chapters organized as follows:

10
Chapter 1 introduces the topic, objectives and approaches of the current research.
Chapter 2 reviews the relevant literature, including monoclonal antibody productions, the
Chinese hamster ovary cell host, animal cell culture modes, glycosylation and control of
oligosaccharide processing under different culture conditions and mathematical modeling of
glycosylation process.
Chapter 3 summarizes the methodology and techniques used in the experiments.
Chapter 4 emphasizes on the effects of glucose and glutamine depletion, ammonia accumulation
and, Reduced-pH on the mAb’s glycan profiles. This Chapter has been published in the Journal
of Biotechnology (Aghamohseni et al. 2014).
Chapter 5 demonstrates the effect of Reduced-Temperature on the mAbs’ glycan profiles.
Chapter 6 introduces the modeling strategies used to connect the extracellular environmental to
the intracellular glycosylation.
Chapter 7 summarizes significant conclusions and recommendations for future work.
The thesis author publications are as follows:
I. A Silico Study of Glycosylation in a Camelid-Humanized Monoclonal Antibody at
Different Cell culture Conditions, ready to submit to the Journal of Biotechnology, (H.
Aghamohseni, K. Ohadi, M. Spearman, M. Moo-Young, M. Butler, H. Budman, 2015).
II. Novel Dynamic Model to Predict the Glycosylation Pattern of Monoclonal Antibodies
from Extracellular Cell Culture Conditions, 12th IFAC Symposium on Computer

11
Applications in Biotechnology (K. Ohadi, H. Aghamohseni, Y. Gädke , M. Moo-Young ,
Y. Scharer, R. Legge, H. Budman, 2013).
III. Effects of Nutrient Levels and Average Culture pH on the Glycosylation Pattern of
Camelid-humanized Monoclonal Antibody, Journal of Biotechnology, (H. Aghamohseni,
K. Ohadi, M. Spearman, N. Krahn, M. Moo-Young, Y. Scharer, M. Butler, H. Budman,
2014).
IV. Fluorescence-based Soft Sensor for at Situ Monitoring of Chinese Hamster Ovary Cell
Cultures, Biotechnology and Bioengineering, (K. Ohadi, H. Aghamohseni, R. Legge, H.
Budman ,2014).

12
Chapter 2
Literature Review
2.1 Monoclonal Antibody Production
Since 1994, when the first mAb product was approved by the US FDA, the share of therapeutic
mAbs in the pharmaceutical market has rapidly increased. Currently, over 30 therapeutic mAb
are available. Previously they have been used to treat a wide range of cancers and disorder of the
autoimmune system, and more recently as carriers of various cytotoxic drugs (Munro et al.
2011).
As of 2003, the worldwide biopharmaceutical investment was estimated at more than $30
US billion. In 2010, the marketing of biological products surpassed $100 US billion and reached
$142 US billion as of 2011, with five out of ten of the current world’s dominant pharmaceuticals
being antibodies (Munro et al. 2011; Jedrzejewski et al. 2014).
Initially, therapeutic proteins were extracted from human sources such as blood clotting
factors, human serum albumin from plasma, and insulin from pancreas. Concerns over product
purity, conformity and the risk of viral infections as well as significant progression in genetic
engineering tools, motivated the adoption of recombinant expression systems. Based on the
similarity of the recombinant protein with its original form in humans, a wide range of hosts such

13
as mammalian cell lines, bacteria, yeast and insect cells, have been utilized as platforms
(Sethuraman and Stadheim 2006).
The commercial production of therapeutic mAbs was initiated using various continuous
hybridoma cell lines with the capacity of creating the desired antibodies (Elvin et al. 2013). The
earliest mAbs were involved purely murine sequences. To reduce human anti-murine antibody
responses (HAMA) and to increase their efficiency, the mAbs format was shifted to “chimeric”
type involving both murine variable and human constant domains and, more recently, to fully
human mAbs (Munro et al. 2011; Elvin et al. 2013).
Chinese hamster ovary (CHO) cells are currently the most desired expression systems used
for the manufacturing of biopharmaceuticals due to their high productivity, adaptability to
industrial scale production and the ability to produce human-like glycoforms (Hammond et al.,
2012).
2.2 Chinese Hamster Ovary Cells
The primary goal of cell culture development is the selection of an animal cell line that
enables the production of desirable cell concentration, viability and productivity (Taschwer et al.
2012). An additional consideration for selecting a cell line is obtaining the required post-
translational modification, mainly glycosylation, of the synthesized protein skeleton.
Since their isolation in 1958, CHO cell lines have been successfully used in a wide range of
research areas such as genetics, pharmacology, toxicology and cancer (Hammond et al. 2012). In

14
addition to providing appropriate glycoforms, CHO cells are known to produce genetically stable
clonal cells. They can be cultured to high density in simple bioreactors as suspended cells and
can be easily adapted to proliferate in protein-free media (Butler, 2005a; Hammond et al., 2012;
Taschwer et al., 2012). However, despite their advantage, they exhibit certain characteristics
such as shear sensitivity, low yield, and medium complexity which has motivated intensive
research on bio-process and media optimizations (Butler 2006a).
At present 60 to 70% of all the recombinant pharmaceuticals are produced in CHO cells
with a value of $100 US billion on the global market (Ahn and Antoniewicz 2012). In addition to
CHO cells, Mouse Myeloma-Derived (NS0), Baby Hamster Kidney (BHK), Human Embryo
Kidney (HEK), Human-Retina-Derived (PER-C6) cells have been used as alternative platforms
for the production of recombinant proteins. Although all these cell lines have been found to adapt
well for growth in suspension cell cultures, CHO and NS0 cell lines are considered superior
candidates in this group (Taschwer et al. 2012).
2.3 Glycosylation
Most proteins secreted by mammalian cells are glycoproteins (Hauser and Wagner 1997). The
diversity of carbohydrate components of glycoproteins is a key factor for their therapeutic
efficacy, since it can influence many of their characteristics, including pharmacokinetics,
secretion, solubility, bioactivity, recognition and antigenicity.

15
Glycosylation is one of the most important modifications that can be carried out to
glycoproteins in mammalian cells. This post-translational modification involves a series of
reactions causing the formation or cleavage of covalent bonds to the nascent synthesized
polypeptide chain (Hauser and Wagner 1997).
During glycosylation, oligosaccharides are added to the protein in a step-wise manner while
being transported through the endoplasmic reticulum (ER) and Golgi apparatus (Hossler et al.
2009). Depending on the glycan binding site on the polypeptide backbone, glycans are
categorized into two major groups: N-linked glycans referring to the case when the
oligosaccharides attach to the side chain of asparagine and O-linked glycans when the
oligosaccharides bind to serine or threonine. The N-linked glycans are more prevalent type in
mammals (Restelli and Butler 2002).
2.3.1 N-Glycans
N-linked oligosaccharides are composed of three main groups: high-mannose, hybrid and
complex-type. They all have a same pentasaccharide core structure but with different outer
branches as follows:
1) High-mannose (Man) type: typically has two to six additional Man residues linked to the
core, 2) Complex type: contains two or more outer branches containing N-acetyl glucosamine
(GlcNAc), galactose, and sialic acid and 3) Hybrid type: has features of both high-Man and

16
complex type oligosaccharides (Hauser and Wagner 1997; Restelli and Butler 2002; Butler
2005).
Human native IgG is mostly composed of N-linked Fc- complex biantennary type
oligosaccharides with heterogeneity in core fucosylation, terminal sialylation and galactosylation
(Wacker et al., 2011).
The precursor for N-glycosylation contains a lipid (dolichol) linked to an oligosaccharide
(Glc3Man9GlcNAc2). The first seven sugars of the precursor (two GlcNAc and five Man) are
obtained from nucleotide sugars, (UDP-GlcNAc and GDP-Man), respectively. The N-
glycosylation starts in the ER, where the precursor is attached to the Asn side chain of the amino
acid sequence of mAb by the oligosaccharyltransferase enzyme (Butler 2006a).
This process is followed by a series of trimming reactions for glycan removal. The first
terminal glucose is removed by α-1,2 glucosidase I (Gluc I), and the other two glucose molecules
are eliminated by a single α-1,3 glucosidase II (Gluc II). Before leaving the ER and entering the
Golgi, the newly synthesized glycoprotein may lose at least one mannose by mannosidase I (Man
I). All the mentioned consecutive reactions occur successfully in the ER if the protein has an
appropriate folding pattern. Thus, there is always a need to control the mechanism so that it
yields a required protein tertiary structure (Restelli and Butler 2002).
Following the aforementioned reactions, N-glycosylation results in the formation of
complex-type glycans by step-wise addition of monosaccharides including, GlcNAc, galactose,
fucose and sialic acid, through a series of transferases that are present in the Golgi

17
compartments. However, many of the enzymatic reactions cannot be completed, leading to
enhanced heterogeneity of the final glycan structure (micro-heterogeneity). Heterogeneity can
take different forms such as antennarity, with the number of branches from the central mannose
of the core structure, terminal sialylation, core fucosylation and addition of a ‘bisecting’ GlcNAc
to the central core Man residue (Butler 2005).
2.4 Control of Oligosaccharide Processing in Mammalian Cell
Culture
Translation of gene expression occurs according to the mRNA (messenger RNA) template thus
resulting in high constancy of the protein structure. In contrast, oligosaccharides processing
occurs in the presence of several successive enzymatic reactions in different intracellular
compartments. Therefore, the outcomes of these series of reactions differ depending on the
environmental conditions affecting this reaction (Hauser and Wagner 1997).
Because of the paramount impact of glycan profiles on properties that determine the
therapeutic efficacy of glycoproteins, such as solubility, resistance to thermal inactivation and
protease digestion, secretion, biological activity and immunogenicity, there is always a strong
incentive for optimally manipulating external factors that influence intercellular glycosylation
(Andersen and Goochee 1994; Hauser and Wagner 1997). The awareness of such effects has

18
increased the importance of developing and optimizing the culture environment to manipulate
the glycan-profiles (Restelli and Butler 2002).
The following section covers the main factors determining the heterogeneity of the final
glycan patterns.
2.4.1 Host Cell Line
The glycan patterns of a protein depend on the expression level and the availability of various
glycosyltransferase enzymes that are present in the Golgi apparatus of the cell. Analysis of the
glycoforms occurring in the same proteins but from different species and/or from different
tissues discloses that a key factor in determining the synthesis of particular N-linked
oligosaccharides depends on the relative activity of these enzymes (Butler 2006a).
Raju et al. (2000) reported that the glycan structures of IgG produced from 13 different
species were very different. They have found a significant variation in the proportion of terminal
galactose, core fucose and bisecting GlcNAc among these different species (Raju et al. 2000).
Structural changes of glycans can also be effected through metabolic engineering of the host
cell line, for instances by gene knockout of the already expressed corresponding
glycosyltransferases or by insertion of novel functionalities (Butler 2005). Structural changes
such as adding the bisecting N-acetyl glucosamine (Umaña et al. 1999) or removing fucose

19
(Konno et al. 2012) from the glycan of an IgG can improve the attachment of the antibody to Fc
receptors leading to increased antibody-dependent cell mediated cytotoxicity (ADCC).
2.4.2 Culture Environment
Cell culture conditions affect the glycosylation process as a result of changes in either the
general cell-culture method or in specific culture variables (Hauser and Wagner 1997; Restelli
and Butler 2002).
The potential mechanisms and approaches to explain such effects are summarized as:
Depletion of the cellular energy state
Variability in glycosidase and glycosyltransferase activities
Variation of nucleotide and nucleotide sugars and lipid precursors
Disruption of the local ER and Golgi environment
Degradation of extracellular glycan by glycosidase
Prolongation of protein residence time in the Golgi (Nabi and Dennis 1998; Valley et
al. 1999; Restelli and Butler 2002; Wong et al. 2010).
These mechanisms were explicitly taken into account in this thesis when devising strategies
for altering the glycoprofiles as further discussed in the modeling section of Chapter 7.

20
Mode of Culture
A number of techniques are generally used for growth of mammalian cells, including suspension
growth in batch, fed batch and perfusion cultures.
Batch culture has been the most common mode of operation in the pharmaceutical industry.
However, although batch operation is a cost-effective, simple and reliable production system, it
is limited in terms of growth and productivity (Ozturk and Hu 2006). The limitations are often
due to the accumulation of metabolic by-products, such as ammonia and lactate, or the depletion
of nutrients, such as glucose or glutamine. To address these limitations, cultures are cultivated
using alternative modes such as fed-batch or perfusion.
In a fed-batch culture, avoiding complete depletion of nutrients is operationally simple using
continuous or intermediate feeding of nutrients. Its advantages are ease of use, reliability and
adaptability (Cruz et al. 2000; Raju et al. 2000). Optimal operation strategies for fed-batch
cultures involve optimal feeding of nutrients according to the cell’s requirements for appropriate
growth and maximal productivity. For instance, maintaining the major carbon sources at low
concentrations leads to a more-efficient primary metabolism because the concentrations of toxic
metabolic by-products such as ammonia and lactate are kept at low levels. Consequently, the
cells remain in a productive state for a longer time (Raju et al. 2000; Butler 2006a).
Unlike batch cultures which require temporary adjustments, with continuous cultures
different culture parameters can be monitored under steady state conditions (Ozturk and Hu
2006). In addition, continuous operations have been reported as the most-effective processes for

21
maintaining more consistent and stable products while minimizing the amount of inhibitory
substances. Thus, the specific growth rate and physiological state of cells as well as
environmental conditions can be better controlled (Chu and Robinson 2001; Vergara et al.
2014).
In perfusion cultures, the constant supply of nutrients and continuous or intermittent
removal of media result in higher cell densities (from 106 cells/ml in batch culture to at least 10
7
cells/mL in perfusion mode) (Xie et al. 1997; Taschwer et al. 2012). Vergara et al., (2014)
capitalized on the ability of controlling the physiological state of cells in chemostat to investigate
the effect of mild hypothermia on specific productivity independently from the cell growth
reduction occurring at lower temperature. At a lower dilution rate of 0.012 h-1
and lower
temperature of 33ºC, a higher level of protein productivity was observed (Vergara et al. 2014).
However, the selection of the culture operation mode and operational strategies are strongly
dependent on a number of issues such as product secretion (growth or non-growth associated),
quality and stability of the final product in the culture and on limitations imposed by industrial-
scale production (Meuwly et al. 2006).
The choice of culture methodology also affects the properties of glycoproteins and the time
evolution of the oligosaccharide structures. For example, glucose depletion, occurring in batch
cultures in contrast with fed-batch operation where such depletion is avoided, has a significant
effect on glycosylation (Andersen and Goochee 1994). Specifically, the level of galactosylation

22
and sialylation levels of a Camelid mAb produced by CHO cells were depleted due to
unavailability of glucose at different levels of glutamine in batch condition (Liu et al. 2014).
Significant differences in the degree of sialylation were found in an immobilized culture in
comparison to free suspension conditions. The recombinant human thyrotropin (TSH) glycan
profile was examined in both hollow fiber and micro-carriers bioreactors. The TSH produced in
the hollow fiber bioreactor contained less sialic acid and galactose compared to the TSH
produced in micro-carriers beads in a larger bioreactor (Hauser and Wagner 1997). The perfusion
mode of culture has been reported as an effective and economical way to enhance the quality of
glycoproteins while combined with controlled-glucose feeding (Yang et al. 2014). Recombinant
β-IFN produced at a lower temperature in a perfusion culture provided 43% less aggregation
than in the batch process while the sialylation levels of -IFN were found to improve significantly
(Rodriguez et al. 2010).
The influences of fetal bovine serum (2%) on glycosylation patterns were investigated in
serum free medium in both suspension and micro-carrier cultures. It was found for both modes of
operation that the N-linked glycosylation, specifically fucosylation and galactosylation, was
higher in the serum-free medium than in a serum-containing medium (Gawlitzek et al. 1995).

23
Nutrient Availability
Different studies have been conducted to investigate the effects of nutrients on mammalian
cells that produce recombinant proteins. The glycosylation of mAbs was shown to significantly
change when glucose as the main carbon source is limited or is completely substituted with other
monosaccharides (del Val et al. 2010; Liu et al. 2014). Glucose starvation was explained to
generate two main deficiencies in glycoprotein synthesis: abnormal precursor attachment and
reduction of glycosylation at the expected sites of the protein. Both-mentioned irregularities
result from insufficiency of glucose-derived oligosaccharide precursors of glycans (Restelli and
Butler 2002; Liu et al. 2014).
It has been demonstrated that a reduced level of intracellular uridine triphosphate
N-Acetyl glucosamine (UDP-GlcNAc) is the main reason for the lower level of glycosylation in
both glucose and glutamine depleted media (Nyberg et al. 1999). It is also reported that the
antennarity of the glycan structure produced in BHK increases at higher levels of UDP-GlcNAc
(Valley et al. 1999). Hayter et al. (1991) showed that in a CHO chemostat culture producing
gamma interferon, the degree of glycosylation decreases at lower levels of glucose (Human et al.
1992). Fed-batch culture techniques have been used frequently to resolve this problem by
maintaining the level of glucose and glutamine above the critical concentration (Restelli and
Butler 2002). For example, the glycan profile of produced gamma interferon was monitored at
levels below 0.1 mM glutamine and 0.7 mM glucose in a CHO fed-batch culture. A significant

24
decrease in sialyation proportion and an increase in the hybrid and high mannose glycan ratio
were observed (Chee Furng Wong et al. 2005).
Burleigh S. et al. (2011) carried out a batch culture of CHO cells under different glutamine
levels in order to investigate glutamine’s effect on the efficacy of the glycosylation. Using a
glutamine-free medium resulted in lower cell growth rate, slower glucose metabolism, lower
sialylation, reduced intracellular UDP-GlcNAc sugar pools, smaller glycolytic flux and lesser
complexity of N-linked glycans (Burleigh et al. 2011). In contrast, Taschwer et al. (2011)
observed improvement in production of complex N-linked glycans of EPO produced in
glutamine-free condition (Taschwer et al. 2012).
Glucosamine is another potential substrate that was used for glycosylation modification.
Yang and Butler (2002) investigated the effect of glucosamine and ammonia on the intracellular
UDP-GNAc pool and glycosylation patterns of EPO by CHO cells cultivated in a serum-free
medium. Results showed that the presence of glucosamine or ammonia enhances the
heterogeneity of EPO due to an increase in the production of UDP-GNAc, and decreases the
production of tetra-sialylated and tetra-antennary glycan structures (Yang and Butler 2002). In
the other hand, human IgG-IL2 produced in a continuous culture of BHK-21 with low
supplementation of glucose and glucosamine exhibited the same glycosylation profile as a
control culture without glucosamine and glucose limitations (Hossler et al. 2009).
Terminal galactosylation of glycans was found to be highly correlated to the level of
galactose in the medium. Feeding the culture with higher levels of galactose increases the

25
proportion of galactosylated glycans in a variety of mAbs. However, the use of galactose instead
of glucose by galactose as a major carbon source affects the cell growth, byproduct accumulation
and protein quality (Altamirano et al. 2006).
The combinations of different nutrients affecting glycosylation have been recently
recognized as an effective strategy to modulate the Mabs’ glycosylation. For example, a
combination of manganese, galactose and uridine have been found to induce 1,4-galactosylation
of IgG4 produced by different CHO cell lines while appropriate levels of all three substances
were maintained in the culture (Grainger and James 2013). More recently, Liu et al. reported the
significant increase of the galactosylation index of two different antibodies, IgG1(DP12) from
0.30 to 0.43 and EG2 mAb from 0.73 to as high as 0.83 when cells supplemented by uridine,
manganese and galactose cocktails (Liu et al. 2014).
Amino acids present in growth media have been reported to profoundly affect glycosylation.
The addition of amino acids (cysteine, isoleucine, leucine, tryptophan, valine, asparagine,
aspartic acid and glutamine) was studied to determine their effects on the glycosylation pattern of
recombinant human erythropoietin (EPO) secreted by a CHO cell line (Crowell et al. 2007).
Although amino acid supplementation at the cell growth stages improved the protein
productivity, the sialic acid content of EPO was reduced. On the other hand, the addition of
manganese as a cofactor of 1,4-galactosyltransferase improved sialylation and productivity. In
2014, Eli Lilly’s researchers reported significant changes in the glycan structures of recombinant
proteins produced by CHO cells cultivated in a new chemically defined medium. Further studies

26
revealed that the higher level of asparagine in the new medium caused elevated levels of higher
mono and di-galactosylated glycans compared to non-galactosylated structures. They
hypothesized that the higher level of ammonia resulting from the metabolized asparagine caused
higher heterogeneity in the final product quality (McCracken et al. 2014).
Ammonia and pH
Ammonia (NH3) or the ammonium ion (NH4+) is produced as the main by-product of the
cellular enzymatic glutamine utilization or the thermal decomposition of glutamine in a medium.
Glutamine plays a key role in the generation of energy for cells and as a precursor for nucleotide
synthesis (Restelli and Butler 2002; Butler 2006a). However, it is an unstable component which
easily decomposes to ammonia when pH, temperature and phosphate concentration change
significantly (Ahn and Antoniewicz 2012). In addition, metabolism of amino acids other that
glutamine induce ammonia production (Crowell et al. 2007; McCracken et al. 2014).
The effect of ammonia accumulation has been considered as of great importance for process
optimization due to inhibitory effect on cell growth (Butler 2005; Chen and Harcum 2006), on
glycosylation alteration (Chen and Harcum 2006) and on galactosylation gene expression levels
(Brodsky et al. 2014).
Ammonia has been reported to cause heterogeneity of the final product (Crowell et al. 2007;
McCracken et al. 2014). The main effect of ammonia on mAb’s glycan profile is related to
changes in the terminal sialic acid (Andersen and Goochee 1994; Yang and Butler 2000; Hossler

27
et al. 2009). Yang et al., (2000) reported that the addition of NH4Cl to CHO cell cultures not
only significantly increased the glycan heterogeneity, but it also reduced the terminal sialic acid
concentration. They also reported that the ammonium produced as a result of glutamine
metabolism had greater effect on glycoproteins than ammonium present from NH4Cl
supplemented media (Yang and Butler 2000). Ammonia also has been reported to negatively
impact the efficacy of sialylation glycans secreted by NS0 cells (Brodsky et al. 2014).
There are two possible mechanisms to explain the effect of ammonia on glycosylation: i)
the increase of the Golgi’s pH level and ii) significant impact on the nucleotide sugar
concentrations. The accumulation of ammonia inside the cells raises the pH level where the latter
impacts the activity of transferases in the Golgi. Thus, changes in the environmental conditions
of enzymes consequently affect the final glycosylation profile. Also, the enhanced incorporation
of ammonia into glucosamine increases the level of the intermediate GlcNAc. This nucleotide
sugar competes with the sialic acid-nucleotide sugar precursor, which is the critical substrate for
the sialyation process (Valley et al. 1999; Restelli and Butler 2002; Butler 2006a). The
expression levels of 12 associated glycosylation genes of CHO cells were investigated at
different ammonia concentrations by Chen et al., (2005). They reported that the deficiency in
galactosylation and sialylation is mainly due to suppression of genes of galactosyltransferase,
sialyltransferase and the CMP-sialic acid transporter at elevated levels of ammonia. These
observed correlations mostly happens in the Golgi apparatus rather than in the cytosol and/or
endoplasmic reticulum (ER) (Chen and Harcum 2006).

28
Extracellular pH conditions affects different intracellular properties including cell
metabolism, glucose transport, ATP/ADP ratios and the intracellular pH environment. Under
unfavorable extracellular pH conditions, the internal pH of the Golgi changes, and the activity of
key enzymes involved in glycosylation decreases (Borys et al. 1993; Butler 2006a). In addition,
it has been reported that higher levels of pH cause dislocation of the glycosyltransferase enzyme
along the Golgi compartment thus negatively impacting galactosylation and sialyation in N-
linked oligosaccharides (del Val et al. 2010). The most favorable pH levels for sialylation were
found to be in the range of 6.8-7.2, although this range was found to be dependent on the cell line
type and glycoprotein product (Trummer et al., 2006; Yoon et al., 2005).
Borys et al., (1993) found that the glycosylation patterns of a recombinant protein, mouse
placental lactogen produced by CHO cells, changed over the culture pH range of 6.4 to 8.7
(Borys et al. 1993). A notable decrease in the extent of glycosylation was observed at pH lower
than 6.9 and higher than 8.2. Muthing et al., (2003) reported that the bioreactor pH for a
hybridoma cell line had a significant effect on the galactosylation of mAbs (Müthing et al. 2003).
In that work, the maximum levels of non-galactosylated (G0), mono galactosylated (G1) and
fully galactosylated (G2) glycans were detected at pH levels of 7.2, 6.9 and 7.4, respectively,
whereas the lowest level of sialyation occurred at a pH of 6.9. These results can be explained by
mislocalization of galactosyltransferase (GalT) and sialyltransferase (SiaT) (del Val et al. 2010).

29
Temperature
In general the productivity of recombinant proteins is correlated to cell viability. Due to its
strong effect on viability, temperature has been often manipulated for optimizing productivity.
Several studies have reported the significant effects of temperature on different cell culture
variables, including growth rate, cell metabolism and protein production (Ahn et al. 2008;
Hossler et al. 2009; Spearman and Butler 2015). Although the desired culture temperature is
correlated to other environmental parameters, researchers generally agree that for a specific cell
line there is an optimal temperature for which productivity is maximized (Chen et al., 2011;
Ivarsson, 2014; Rodriguez et al., 2010).
Reducing temperature mostly leads to reduced cell growth, but longer cell life and cell
productivity (Chen and Harcum 2006; Rodriguez et al. 2010; Vergara et al. 2014). To explain
this contradictory observation, Mason et al., (2014) compared the productivity of two antibody
mutant cells from stable CHO cell lines. The productivity of highly expressing mutant cells did
not improve at 32º C compared to 37ºC while the productivity of poorly expressing mutant cells
was enhanced. These authors proposed that protein types, protein folding and protein assembly
determine the effects of reduced temperature on protein production (Mason, et al., 2014).
Although, the benefit of reduced temperature has been studied by several researchers, the
mechanism by which reduced temperature enhance specific productivity has not been resolved
conclusively. The possible mechanism includes increased mRNA stability of recombinant
proteins, improved transcription and arrest of the cell cycle in the G1 phase since cell arrest

30
results in energy savings and reduced metabolism of carbon sources (Butler 2005; Vergara et al.
2014).
More recently, the possibility of controlling glycosylation by reducing the culture
temperature has been reported (Spearman and Butler 2015). However, the outcomes of
temperature reduction on glycosylation evolution are highly dependent on cell line and protein
type thus explaining contradictory observations reported in the literature. Moreover, since the
regulation of enzymes during the progress of glycosylation in the ER and Golgi is not well
understood the effect of temperature on enzyme activity and the resulting glycosylation cannot
be clearly elucidate (Butler 2005; Hossler et al. 2009; Stanley 2011).
Wang et al., (1991) investigated the effect of temperature on the residence time of proteins
in the Golgi. Incubation of the cells under lower temperature conditions (21◦C) resulted in
decreasing flow rates of glycoproteins through the Golgi and longer exposure of the protein to
glycosyltransferase enzymes. The glycoprotein incubated under the above conditions, had a
higher percentage of N-acetyllactosamine in its structure (Wang et al., 1991). The effect of lower
temperature conditions on the production rate and quality of EPO secreted by recombinant CHO
cells was studied at 30, 33, and 37° C (Yoon et al. 2003). Reducing the culture temperature
below 37◦ C increased the volumetric product titers and cell viability but hindered cell growth.
The sialic acid content of EPO produced at lower temperature than 37º C remained at higher
concentration until the late death phase of growth while it dropped significantly in the dead
phase operated at 37◦ C.
31
In contrast to the aforementioned studies, reduction of terminal sialyation was reported at
low temperature in some studies. As an example, the sialyation level of EPO-FC decreased by
20% and 40% at 33◦
C and 30◦
C, respectively. In this particular case, a correlation between
increased specific productivity and reduced sialyation was suggested as the probable reason
(Hossler et al. 2009). For CHO cells, the synergistic effects of low temperature operation (30º C)
and cultivation under 0-5 mM sodium butyrate (NaBu) supplementation were investigated
(Chen et al., 2011). In spite of longer cell viability in the presence of NaBu and lower
temperature, the total sialic acid content of mAbs produced by CHO cells did not change.
However, the researchers observed that the level of N-glycolylneuraminic acid (Neu5Gc), an
uncommon form of sialic acid in human, was reduced by up to 10% under both NaBu or (and)
low temperature conditions. They hypothesized that lower production of NADH due to lower
consumption of glucose did not provide an optimum condition for activity of responsible
enzymes for production of this type of sialic acid.
Temperature reduction was also found to reduce the aggregation of glycoproteins at higher
protein productivity, while cell density was improved by perfusion culture (Rodriguez et al.
2010). In the perfusion operation, the aggregation of β-INF was reduced by 43% compared to
batch operation, and the sialylation content of β-INF was improved as well. It has been reported
that non-glycosylated β-INF had a higher level of aggregation comparing to glycosylated ones.
To ensure consistency in mAb quality, a thorough understanding of the relationship between cell
metabolism, mAb synthesis and Fc-glycosylation is necessary.

32
Dissolve Oxygen Concentration
The effect of oxygen on the growth and viability of cells has been observed in several
studies (Restelli and Butler 2002; Butler 2006a). Also, the dissolved oxygen level (DO) has been
shown to have a significant effect on the glycan profile of proteins. Chotigeat et al. (1994)
reported that at higher levels of oxygen in CHO cell culture, the level of sialyation of
recombinant proteins improved as a result of higher activity of sialyltransferases (Chotigeat et al.
1994).
The effect of DO on the galactosylation of the IgG produced by hybridoma cells has been
investigated by Kunley et al., (1998). By reducing the level of oxygen in the culture, the glycan
profile changed from digalctosylated (G2) at 30 % oxygen level to monogalctosylated (G1) and
agalctosylated (G0) at 10% oxygen level (Kunkel et al. 1998).
Extracellular Degradation of Glycoprotein Oligosaccharides
The presence of extracellular enzymes such as fucosidase, galactosidase and sialidase that
may cause glycan degradation has been previously reported (Restelli and Butler 2002). The level
of glycan degradation in the culture depends on several factors, including culture pH and
temperature, time of glycans exposure to extracellular enzymes and their activities. In this
regard, culture processes such as fed-batch and perfusion, that prolong the cell viability longer,
may cause an increase in glycan degradations and glycan heterogeneity (Restelli and Butler
2002).

33
Stirring Speed
Adequate stirring of the culture is a key parameter for transferring sufficient nutrients to
cells. However, excessive stirring may cause negative effects on cell viability, mAb productivity
and mAb glycosylation (del Val et al. 2010). Senger et al. (2003) studied the effect of shear
stress in suspension culture on glycosylation of the recombinant tissue-type plasminogen
activator protein (r-tPA) produced by recombinant CHO cells. They reported that by increasing
the stirring speed from 40 to 200 rpm, the level of partially galactosylated tPA increased from 31
to 72%. They proposed that at higher stirring speed, protein synthesis increases resulting in a
reduced retention time of glycoproteins in the ER. This reduction in retention time negatively
affects the N-glycan site occupancy (Senger and Karim 2003).
2.4.3 Modeling of The Extracellular environment
Metabolic analysis is helpful for in-depth understanding of mammalian cell metabolism and
their intracellular physiology. Metabolic flux analysis (MFA) is a mathematical method that can
be applied for quantitative studies of cell metabolism (Sanfeliu and Stephanopoulos 1999; Ahn
and Antoniewicz 2012). It provides fundamental understanding about the metabolic pathways
involved in the overall cellular metabolism by quantifying intracellular fluxes from measured
metabolites’ production or consumption rates. In the classical MFA approaches the flux analysis
is based on the steady-state mass balance of intracellular species (Gao,et al., 2007; Naderi et al.,

34
2011). However, the steady state assumption may not be maintained in batch and fed-batch
operations used for industrial production of biologics.
Recent research has focused on dynamic MFA models with the ability to reflect the culture
variation during phase transition at different culture conditions (Naderi et al., 2011; Wahrheit, et
al., 2013). Naderi et al., (2011) adjusted the metabolic changes of a CHO cell line by developing
a kinetic model for growing and non-growing cells. A dynamic model of cell growth and
metabolism for a CHO cell cultures was developed for different glutamine concentrations and
feeding strategies in an attempt to understand the effects of glutamine on intracellular and
extracellular fluxes (Wahrheit et al. 2013). These researchers observed a strong link between
extracellular and intracellular availability of glutamine and specific metabolic pathways.
Glycosylation significantly affects the therapeutic characteristic of mAbs that can be
influenced by many operational parameters. A mathematical model with the capability of
correlating the mAb glycan profile to the cell culture conditions would be useful for bioprocess
design and control, culture media formulation, and possible genetic engineering strategies (Del
Val, et al., 2011).
Although several studies have been conducted to evaluate the effects of culture conditions on
glycan profiles, including the impacts of particular nutrient concentrations such as glucose,
glutamine, and galactose (Burleigh et al. 2011; Taschwer et al. 2012; Grainger and James 2013;
Liu et al. 2014), culture supplementation and inhibitors such as ammonia (Yang and Butler 2002;
Chen and Harcum 2006; Crowell et al. 2007), nucleotide sugar feeding (Gu and Wang 1998;

35
Wong et al. 2010) and, environmental pH and temperature alternation (Yoon et al. 2005; Ahn et
al. 2008; Rodriguez et al. 2010; Seo et al. 2013), studies exploring how the combination of these
factors affects the glycan profile are not numerous. Also, the numbers of mathematical models
that connect these factors with the resulting glycoprofiles are quite limited. Earlier models
focused on the reactions occurring in the Golgi complex but did not correlate these reactions to
the extracellular culture conditions (Hossler et al., 2006; Del Val et al., 2011). For example, Del
Val et al., (2011), presented a model of the N-glycosylation process occurring within the Golgi
apparatus while considering the transport of nucleotide sugar donors from the cytosol to the
Golgi lumen. However, this model was not coupled to the culture conditions (Del Val et al.,
2011). Such coupling is essential because the process can be manipulated solely through these
conditions. More recently, Jedrzejewki et al., (2014), extended their previous study and
presented a model frame work connecting the extracellular conditions to the intracellular
nucleotide sugar donors and glycosylation process for a mAb produced by a hybridoma cell line
(Jedrzejewski et al. 2014). They developed a mechanistic nucleotide sugar network involving
sixty metabolic reactions to connect the extracellular environment to the glycosylation process in
the Golgi apparatus.

36
Chapter 3
Experimental Studies and Analysis Techniques
Some sections of the experimental methodology presented in this chapter are based on work
published by Aghamohseni et al. (2014) and cited accordingly by permission of the Journal of
Biotechnology. The thesis author's contributions to this publication were to conduct all the cell
culture cultivations, experimental designs, amino acids, metabolites and mAbs assays and protein
A purification and sampling preparation for the glycan analysis, the latter carried out by others at
the university of Manitoba. The research work and journal paper preparation were conducted
with direction from the project supervisors, who are co-authors of the aforementioned
publication.

37
3.1 Cell Line
This study, used a transfected CHO (DUXB) cell line expressing a chimeric human-llama
heavy chain monoclonal antibody (cHCAb) received from Yves Durocher, NRC, Montreal
(Zhang et al. 2009), a member of MabNet (National Science and Engineering Research Council
monoclonal antibody network (MabNet)). The produced mAb, EG2-hFc, contains a single N-
linked glycan at Asn-297, a variable region of the heavy chain camelid (llama) antibody with a
humanized Fc region attached at the hinge section. Its smaller size (~ 80 KD), longer serum half-
life and distinctive tumor accumulation are comparable to that of human IgGs (~ 150 kD) (Bell
et al. 2010). The cell line is adapted to grow in a serum-free medium and in suspension culture
(Aghamohseni et al. 2014).
3.1.1 Initiation of Cell Culture
The cell vials of CHO (DUXB) were preserved in a liquid nitrogen tank. The frozen vials
contained 1ml of cell suspension in a cryoprotectant medium at density 5 x 10⁶ to 10 x 10
6
cells/ml. At the time of use, a frozen vial was recovered by rapid thawing in a 37˚C water bath
while shaking for two minutes. Usually the water bath was sanitized with an anti-microbial
reagent (such as Acryl AquaClean, WAK–Chemie) to prevent any microbial contamination.
Then, the vial’s contents were quickly transferred to 40 ml of pre-warmed BioGro-CHO medium

38
in an Erlenmeyer polycarbonate shake-flask (125 ml) with a vented cap. The BioGro-CHO
medium was a serum-free medium optimized and provided by MabNet for this cell line.
Before cell inoculation, the flask containing the medium was kept in a humidified CO2
incubator (Sanyo IR Sensor, 37 °C, 5 % CO2) for 15 minutes for pH and temperature
adjustment. Then, the seed culture was placed on an orbital shaker at 120 rpm (MaxQ 2000
orbital shaker) in the humidified incubator for 24-48 hours. The cell concentrations and viability
were determined by Trypan Blue staining and by counting the cells in a hemocytometer right
after inoculation.
3.1.2 Cell Passaging and Maintenance
The average doubling time of CHO (DUXB) cells is approximately 16 hours, and depending
on their rate of growth, cells are passaged 2 to 3 times a week. The maximum cell density during
the maintenance period should not exceed 2.5x10⁶ cells/ml to maintain cells in the exponential
growth phase and to prevent cell aggregation. Cell viability is not allowed to drop below 97 %
during this maintenance period.
Based upon the cell density determination, a new subculture was prepared by diluting the
cell suspension to 0.25x10⁶ cells/ml in the BioGro-CHO medium. After 48 hours, the cell density
reached approximately 2x10⁶
cells/ml. Then, the culture was ready for the next passage.

39
All maintenance procedures were performed under aseptic conditions and in a laminar flow
cabinet. To ensure conditions for optimal cell growth, the maintenance shake-flasks were
changed every 10-14 days.
3.1.3 Cryogenic Preservation
For long-term storage of CHO (DUXB) cells and for the purpose of maintaining a cell bank
reserve, cryogenic preservation of cells is necessary. For this reason, BioGro-CHO medium
containing 8 % (v/v) DMSO (dimethyl sulphoxide) was prepared and stored at 4◦C for use with
the cells during freezing. The concentration of cells was determined after harvesting during their
exponential growth phase when their viability was greater than 90%. Then, the cells were
centrifuged at 300 g for 5 minutes, and the supernatant is decanted. The cell pellets were diluted
by adding the freezing medium to obtain the final desired cell concentration (5 x 10⁶ - 10 x 10
6
cells/ml). The prepared suspension was quickly subdivided into pre-labeled 1 ml cryo-vials
which were placed overnight in a -80˚C freezer. Then, the cryo-vials were transferred into a
liquid nitrogen container on the following day.

40
3.2 Batch Culture
In the early stages of this research, we attempted to perform cell culture passage and
maintenance in T-flasks, and then transferred them to spinners. In spite of substantial cell growth
in the T-flasks, there was only very small growth in the suspension culture in spinners. Untreated
T-flaks and Erlenmeyer shaker flasks were also used to eliminate the probable effect of Trypsin
on growth. Trypsin is the enzyme that is routinely used for detaching attached cells from the
T-flask surface. After numerous trials, the polycarbonate shaker flask was found to be the best
option for maintaining sufficient growth in serum-free suspension.
The initial experiments were designed to assess the effect of essential nutrient
concentrations on the glycan patterns of mAb. To that purpose, experiments were conducted for
different initial levels of glucose and glutamine. These experiments were performed in a batch
culture adapted to suspension growth in the shake-flask by the method described in section 3.1.2,
in 500 ml flasks with 200 ml working volume and an initial cell density of 0.2x10⁶ cells/ml. The
regular serum free BioGro-CHO medium was supplemented at the beginning of the cultures with
different glucose (25 to 45 mM) and glutamine (0, 2, 4 and 8 mM) concentrations.
The flasks were placed on a 120 rpm shaker and incubated at 37◦C and 5% CO2. The growth
profile, extracellular glucose and amino acid-consumption as well as ammonia and lactate
production were monitored over 10 days. Four ml of culture were removed every day, one ml for
the immediate analysis of the viable cell concentration and viability index and the other three ml

41
for later analysis of glucose, amino acids, mAb, ammonia and lactate. Ten ml of samples were
also removed every other day for glycan profile analysis. The samples were centrifuged at 1000
rpm for 10 minutes, and the supernatants were stored at -20˚C for further analysis. The analytical
procedures are explained in section 3.3.
3.2.1 Reduced-pH Adjustment
pH changes were implemented only in the culture with 25 mM glucose and 4 mM glutamine
concentrations (i.e., normal condition) that were found to be optimal for cell growth. Attempts
for altering the pH at lower initial glutamine concentration and lower pH than 6.8±0.05 were not
successful since the growth and mAb productivity were negligible for these conditions.
Two strategies were applied for manipulating the pH: i) maintaining the average pH of
culture at 6.8±0.05 at the start of the batch operation - referred to hereafter as the Reduced-pH
strategy - and ii) shifting the average pH to 6.8±0.05 at the time period of peak cell density -
referred to hereafter as Shifted-pH strategy. Maintaining the average pH at 6.8±0.05 for reduced-
pH and Shifted-pH cultures was achieved by daily additions of pre-determined amounts of 1 M
lactic acid or HCl solutions calculated based on an a priori obtained calibration curve. These
additions achieved a required pH level of 6.8±0.05 (Aghamohseni et al. 2014).
To provide complete CO2 equilibrium, the medium was incubated in 5 % CO2 and 37 ºC
while shaking at 120 rpm for one hour before the experiments were carried out.

42
3.2.2 Reduced-Temperature Adjustment
Two strategies were applied for investigating the effect of temperature changes on cell
metabolism and mAbs’ glycosylation; i) maintaining the culture temperature at 33ºC from the
start of the batch operation - referred to hereafter as the Reduced-Temperature strategy - and ii)
shifting the temperature from 37ºC to 33ºC on day 3 of the exponential phase of growth -
referred to hereafter as Shifted-Temperature strategy.
3.2.3 Specific Metabolites Production and Consumption
Rates
The specific mAb productivity (QmAb) and production or consumption rates of metabolites
(QMet) such as glucose, glutamine, lactate, ammonia and etc. were calculated from the slope of
the linear regression of the cumulative mAb (CmAb) or metabolite concentrations (CMet) against
the volumetric cell-hours (VCH) as proposed before (Dutton et al. 1999) according to the
following equations.
𝑉𝐶𝐻 = ∑𝑋𝑣(𝑖+1)−𝑋𝑣(𝑖)
ln( 𝑋𝑣(𝑖+1)/𝑋𝑣(𝑖) (𝑡) (3-1)
𝑄𝑀𝑎𝑏/𝑀𝑒𝑡 = 𝐶𝑀𝑎𝑏/𝑀𝑒𝑡
𝑉𝐶𝐻⁄ (3-2)

43
The volumetric productivity of mAbs, was calculated based on the equation presented by
(Yoon et al. 2006) by dividing the mAbs’ concentrations by the corresponding culture time.
𝑄𝑣 = 𝐶𝑀𝑎𝑏
𝑡𝑖𝑚𝑒⁄ (3-3)
3.3 Analytical Procedures
3.3.1 Viable Cell Concentration and Viability Index
The Trypan Blue exclusion test was used to determine the number of viable and dead cells
present in the suspension culture. This method is based on the principle that only live cells
possess intact cell membranes that enable the exclusion of certain dyes such as Trypan Blue. One
hundred µl of a cell suspension were taken and mixed well with the same volume of 5% Trypan
Blue.
At higher levels of cell concentrations (greater than 5x10⁵ cells/ml) a higher level of cell
dilution had to be used. After applying a drop of Trypan Blue cell mixture (approximately 10 μl)
to a hemocytometer, the number of viable (unstained) and nonviable (stained) cells were counted
under a microscope. Cells were counted within 3 to 5 min of mixing with Trypan Blue because

44
longer times were expected to result in viability reduction and cell death. The percentage of
viable cells is calculated by the ratio of viable cells to the total cell number. Fifteen percent
errors of analysis for viable cell counting by hemocytometer were calculated for triplicated
samples.
A Moxi™ Z Mini automated cell counter, ORFLO Technologies was also applied as a
second method of cell counting for comparison with the Trypan Blue method. The errors of
analysis by the Moxi™ Z were less that hemocytometer equal to 5 % for triplicated samples.
3.3.2 Glucose, Glutamine, Lactate and Ammonia Assay
A multi-parameter bioanalytical system, BioProfile 400 (Nova Biomedical, Waltham, MA),
was used to measure the glucose, glutamine, glutamate, lactate and ammonia concentrations in
the culture (Aghamohseni et al. 2014). Five hundred µl of stored supernatants were purified by
0.2 µm filters prior to their injection into the device. In addition, an enzymatic glucose assay kit
(K-GLUC, Megazyme, Ireland) was used for glucose analyses according to the company
instruction as a backup method.
The Nova Biomedical Lactate Plus meter and the ammonia ion-selective electrode
connected to a pH/ISE meter (model 710A of VWR) were utilized to analyze lactate and
ammonia, respectively, as the backup methods for the measurements obtained with the
BioProfile 400.

45
3.3.3 Amino acids Assay
In addition to glutamine other amino acids were analyzed according to the AccQ-Tag method,
with a reverse phase C18 column using a Waters HPLC device (WATERS E 2695, Milford,
MA) equipped with a UV detector (Waters 2489, Milford, MA) with amino acid standard (Sigma
Aldrich AAS18 FLUKA) (Cohen et al. 1993; Aghamohseni et al. 2014). The errors in amino
acid analysis were up to 10% as determined from triplicated samples.
3.3.4 Monoclonal Antibody Purification and Analysis
Protein A HP spin trap TM
columns (GE Healthcare 28-9031-32) were used for purification
of mAb prior to the glycan analysis, according to the manufacturer’s instructions.
An enzyme-Linked Immunosorbent Assay (ELISA) method, developed by MabNet for
Eg2-hFc, was used for monoclonal antibody analysis. According to the protocol, the 96-well flat-
bottom high binding plate, Costar® HB was used for reading the optical density of each sample
against the blank at 450 nm with a micro-plate reader (Aghamohseni et al. 2014).
Following this protocol, the anti-human IgG1 (Fc- specific) (Sigma Aldrich I2136) and the
anti-human IgG (Fc- specific)-peroxidase antibody (Sigma Aldrich A0170), both produced in
goats, were used as the primary and secondary antibodies, respectively, with 3,3’,5,5’-

46
tetramethylbenzidine dihydrochloride (sigma T3405) as the substrate for the peroxidase. Samples
were incubated at room temperature for 30 minutes immediately after adding the substrate
solution to develop the complete color (Aghamohseni et al. 2014).
A dilution series of standard concentrated Eg2-hFc (provided by MabNet) was applied to
find an appropriate standard curve. The mAb concentration was calculated by comparing the
optical density of each sample with respect to the standard curve. The errors of ELISA for the
replicated samples in the same plate were less than 5%. However errors reached a maximum
value of 20% for independent tests performed at different days.
3.3.5 Glycan Analysis
Following release from the gel using sonication and desalting, the glycans were labelled
with 2-aminobenzamide (2-AB) (Bigge et al. 1995). The glycans were analyzed by
hydrophilic interaction liquid chromatography (HILIC) with fluorescent detection using a Waters
X-Bridge 3.5 um amide column (4.6 x 250 mm) with the column heated to 30ºC and a flow rate
of 0.86 ml/min. Then, they were eluted using 50 mM ammonium formate, pH 4.4: acetonitrile,
starting with an initial ratio of 20:80, followed by a gradient to 50:50 over 48 minutes. Peaks
were calibrated with a 2-AB labeled glucose ladder and glycan standards (Prozyme) (Guile et al.,
1996) and compared to a glycan database (www.glycobase.nibrt.ie) for preliminary identification
(Figure 1). Further structural assignments were performed by exoglycosidase array analysis

47
(Royle et al. 2006) using sialidase A (recombinant from A. ureafaciens), bovine kidney α-
fucosidase, bovine testis β-galactosidase, Jack Bean β-N-acetylhexoaminidase (Prozyme).
Digested glycans were re-analyzed using HILIC analysis, and shifts of glycan GU values were
compared (Aghamohseni et al. 2014) (Figure 2).
For this project, the database Glycobase (Campbell et a., 2008) was applied as a reference
to predict the glycan structures based on their glucose unit (GU) values. The entire assay
procedure was performed by the Department of Microbiology of University of Manitoba as part
of the MAbNet project. Five percentage errors were calculated for overall glycan analysis based
on the average differences in individual glycans RA% for the two duplicates.
Figure 1, Normal phase HPLC elution times of dextran ladder with GU units assigned
(Domann et al. 2007)

48
3.3.6 Glycosylation Indices
The predominant glycan structures found in EG2-hFc were complex biantennary fucosylated
types with different amounts of terminal galactose and sialic acid. Regarding the occupancy of
one, two or none of the available positions in the biantennary structures, Gi1
(monogalactosylated), Si1 (monosialylated), Gi
2 (digalactosylated), Si2 (disialylated),
Gi0(agalactosylated) and Si
0 (asialylated) were found (Table 1). The glycan structures with lower
relative abundance, RAs (less than 1%) were not considered, and their abundances were
normalized to give a total area of 100%. In order to simplify the analysis of the results
glycosylation indices were used to quantify the overall levels of galactosylation and sialylation.
Accordingly, the RAs of each specific glycan were added together to calculate the
galactosylation index (GI) and sialylation index (SI) as per the following equations:
GI =∑ Gi
2+ 0.5 ×∑ Gi1
∑ Gi2+ ∑ Gi
1+∑ Gi0
(3-4)
SI =∑ Si
2+ 0.5 ×∑ Si1
∑ Si2+∑ Si
1+∑ Si0
(3-5)
The values of the indices were determined by considering all the glycan structures
determined for EG2-hFc (Aghamohseni et al. 2014).

49
Figure 2, Structural assignments of the CHO-EG2 glycan were confirmed using shifts
of GU values of major peaks using exoglycosidase digests : Sialidase (Sial), Sialidase A
(recombinant from A. ureafaciens); fucosidase (Fuc), bovine kidney α-fucosidase;
galactosidase (Gal), bovine testis β-galactosidase; hexosaminidase (Hex), Jack Bean β-N-
acetylhexoaminidase (Aghamohseni et al. 2014).

50
Table 1, Glycan structures of Eg2-hFc based on the Glycobase
Glycan name (Glycobase) Glycan Structure
A2
F(6)A2G0
A1G1
A2G1
F(6)A2B
F(6)A1G1
A2BG1
(6)A2 G1 Isomers
F(6)A2G1
A2G2
A2BG2
F(6)A2G2
F(6)A2G2S1
F(6)A2G2S2
A4G3
A4G4
A4G4Sn
F(6)M2
F(6)M3
M3

51
Chapter 4
Effects of Nutrient Levels and Average Culture pH
Materials presented in Chapter 4 are based on the published work by Aghamohseni et al.
(2014) by permission of the Journal of Biotechnology. The thesis author's contributions to this
publication were to conduct all the cell culture experiments, experimental design, metabolites
and mAb assay, and sample preparation for glycan analysis at university of Manitoba. In
Addition all plots and analysis of results were implemented by the first author. The other
contributions are writing the final manuscript and respond to the comments of reviewers. This
work and journal paper preparation was conducted with direction from the project supervisors
who are co-authors on the publication (Aghamohseni et al. 2014).

52
4.1 Introduction
The key therapeutic properties of mAbs are strongly related to the post-translational process
of glycosylation (Butler 2006a; Hossler et al. 2009). The complex process of glycosylation that
occurs in eukaryotic cells involves several enzymatic reactions whereby oligosaccharide chains
are added to the polypeptide through a complex series of reactions in the endoplasmic reticulum
(ER) and the Golgi apparatus. In N-linked (asparagine-linked) glycosylation, the predominant
type in animal cells, a high mannose oligosaccharide is transferred en block to asparagine
residues from a lipid carrier molecule in the ER and they further processed and modified to add
heterogeneity and complexity to the glycoforms.
The degree of glycosylation depends on general cell-culture conditions including the mode
of culture operation, i.e. batch, fed-batch or continuous, temperature, pH, dissolved oxygen,
pCO2 and shear stress or changes in the specific culture variables including glucose, glutamine,
ammonia, lactate and amino acids levels (Butler, 2006; Hossler, 2012).
Among the culture conditions that could affect the final glycan patterns, the nutrient levels
and the concentrations of byproducts such as ammonia have been identified as very significant
(Restelli and Butler, 2002 ; Yang and Butler, 2000). To achieve higher cell growth and
productivity, mammalian cells need to be cultivated at the higher level of essential nutrients,
mainly glucose and glutamine. However, the increased level of initial nutrients results in
accumulation of cell metabolism byproducts, in particular lactate and ammonia, which in return

53
can result in lower cell densities and product titres (Nyberg et al., 1999; Taschwer et al.,
2012;Yang and Butler, 2000).
Nutrient levels influence the final glycan profiles by changing the intracellular nucleotide
sugar pools that are the precursors for oligosaccharide synthesis(Nyberg et al. 1999). For
example, high levels of UDP–GlcNAc result in significant increase of antennarity and reduction
of sialylation in baby hamster kidney (BHK) cells expressing IL-Mu6 glycoprotein (Valley et al.
1999) and for a CHO Epo-Fc fusion producer cell line (Taschwer et al. 2012).
High levels of ammonia also can result in lower glycosylation by perturbing the balance
of the nucleotide sugar pool (Chen and Harcum, 2006 ; Gawlitzek et al., 1999). However, the
reports regarding the effects of ammonia and pH on glycosylation are sometimes contradictory
and may be highly dependent on the cell line, cultivation process and glycoprotein type (Raju et
al., 2000; Butler, 2006 ; Chen and Harcum, 2006).
Our ultimate goal was defined to produce a descriptive model to assess the effects of
nutrients, by-products and culture pH on the cell growth, mAb productivity and glycosylation
progress that could be used for process optimization (Ohadi et al. 2013). Towards this objective
the current study reports a combination of experiments and modeling results that were used to
demonstrate and quantify impact of these parameters on the quality of the produced mAb under
study.
To further understand the particular tradeoff between mAb productivity and glycosylation
indices, the first objective of this study, was defined to reveal the relative correlation between

54
essential nutrients depletion and inhibitory effects of byproduct accumulation which have been
demonstrated in this chapter. The sets of experimental designs are based glucose and glutamine
concentration levels reported as the main energy sources biomass production and
posttranslational process of glycosylation. The importance of this examination relates to fact that,
the optimum nutrient conditions for cell growth are not always the same optimum conditions of
cell productivity and protein quality.
4.2 Materials and Methods
4.2.1 Batch Condition and Experimental Design
Preliminary research comprised a set of batch cultures with different combinations of initial
concentrations of glucose (25 and 45 mM) and glutamine (0, 2, 4 and 8 mM) Table 2. These
experiments were performed in 500 ml polycarbonate vented-cap shaker flasks with a 200 ml
working volume.
Depending on the desired initial nutrient concentration, appropriate amounts of concentrated
glucose (Sigma G8644) and glutamine (Sigma 59202C) were added to the regular BioGro-CHO
medium. To investigate glutamine-free and low glucose conditions, a special glutamine and
glucose free BioGro medium was employed and glucose and/or glutamine were added as needed.
The glucose and glutamine concentration in the regular BioGro-CHO medium are 25mM and 4-
mM, respectively. All the set of experiments were performed in triplicate. The same seed culture

55
cultivated in regular BioGro-CHO was used for all batches as explained in section with 0.2 x 10⁶
cells/ml inoculum concentration.
500 polycarbonate shaker flasks were used for each set of experiment and incubated in
37 ºC and 5 % incubator and 120 rpm shaker for ten days. Each set of samples run in duplicate
except control (4 mM Gln, 25 mM Glc) which was triplicate.
Samples were taken according to the procedure mentioned in section 3-2 of Chapter 3 .
Table 2 shows the preliminary experimental designs investigated for initial effect of glucose and
glutamine.
Table 2, Experimental design for four initial glutamine concentrations at 25 mM
glucose. Letter n, shows number of flakes in each set of experiment
Glutamine (mM)
Glucose
(mM)
0 2 4 8
25 n=3 n=2 n=3 n=2
4.2.2 Analysis
Viable cell density, viability index, metabolite profiles including lactate, ammonia, glucose,
glutamine, mAb concentration and glycan analysis examined according to the techniques
described in Chapter 3 section 3.3.

56
4.3 Results and discussion
4.3.1 Cell Density and Metabolite Profiles
Glucose and Glutamine Depletion Effect
The changes in viable cell density, glucose, glutamine, ammonia and lactate are presented in
Figure 3, over the course of the cultures. The high initial level of glucose of 45 mM was found to
inhibit cell growth as compared to lower initial glucose levels regardless of the glutamine level
(data not shown). Therefore, all remaining experiments for different levels of glutamine were
conducted with a glucose level of 25 mM that is recommended by the BioGro CHO suppliers. It
should be noted that the culture with 0 mM initial glutamine in the medium is expected to
contain some residual glutamine that was introduced with the inoculum.

57
Figure 3, Viable cell density and metabolite profiles. Data points represent mean ± SD
for two independent experiments except for experiments with initial 4 mM glutamine
repeated three times. Closed symbols: 0 mM glutamine, 2 mM glutamine, 4 mM
glutamine, 8 mM glutamine. A) viable cell density; B) glucose consumption; C)
glutamine consumption; D) ammonia accumulation; E) lactate accumulation; F)
monoclonal antibody production.

58
The biomass time profile shows that this particular CHO cell line is relatively fast growing
having a minimum generation time of approximately 16.5 hours and a lag phase time of less than
24 hours. The cell yield was dependent on the initial glutamine concentration and increasing the
glutamine level from 0 to 4 mM resulted in a higher peak of cell density. Providing a higher
level of glutamine at 8 mM partially inhibited the cell growth. Maximal viable cell density
(approximately 3.6x10⁶ cells.ml
-1) was observed after four days of incubation at 4 mM of
glutamine. In contrast, the maximum cell density was much lower when 2 mM or no glutamine
was added to the medium with maximal cell density of 3.1 and 2.5x10⁶ cells.ml
-1 respectively. It
is also evident from their specific consumption rates that glucose and glutamine were co-
metabolized (Table 3) as the consumption of glucose was faster in the presence of glutamine and
slower in its absence. For example, for the culture with zero initial glutamine (Figure 3), glucose
was depleted very slowly and some residual glucose remained towards the end of the culture
while for the culture with initial glutamine level of 4 mM glucose was almost totally depleted
after 5 days. On the other hand, a higher cell viability or prolonged life span was observed for the
initial glutamine free culture (Figure 4-A). Glutamine was consumed rapidly in the exponential
phase of cell growth and the peak of cell density coincided with the exhaustion of glutamine in
the culture cultivated at initial glutamine level of 4 mM. Cultures containing 4 and 8 mM
glutamine produce a higher level of lactate approximately 32 mM at the time that the maximum
cell density was reached as compared with no initial glutamine experiment. Also, ammonia
production was higher in the batches supplemented with higher initial glutamine reaching its

59
highest level of 7.5 mM at the end of the batch initiated with 8 mM glutamine. A lower peak of
cell density was observed for the culture with initial 8 mM glutamine compared to the initial 4
mM glutamine experiment leading to the speculation that higher levels of ammonia result in cell
death thus reducing the value of maximal cell density.
The specific mAb productivity (𝑄𝑚𝐴𝑏) was calculated from the slope of the linear
regression of the cumulative mAb concentration against the volumetric cell-hours (VCH),
equation 3-3 of chapter 3. Since the slopes were observed to decrease during the post-
exponential phase as compared to the slopes in the exponential phase for different glutamine
concentrations, it was concluded that the mAb productivity is partly growth associated. On the
other hand, the slopes were not exactly zero during the post-exponential phase suggesting that
some non-growth associated productivity also occurred. In the exponential phase of cell growth,
the mAb productivity was found to be approximately 0.1 pg mAb (cell.h)-1
and it dropped to
0.033 pg mAb (cell.h)-1
in the post exponential phase for all the tested initial glutamine
conditions. The mAb productivity in the culture with 8 mM glutamine initially reached a slightly
higher amount at 0.045 pg mAb (cell.h)-1
in the post exponential phase of cell growth.

60
Figure 4, Cell viability profile. Data points represent mean ± SD for two independent
experiments except for experiments with initial 4 mM glutamine repeated three times.
Closed symbols: 0 mM glutamine, 2 mM glutamine , 4 mM glutamine, , 8 mM
glutamine, reduced-pH (lactic acid), shifted-pH (lactic acid). A) Glutamine effect. B)
pH effect.

61
Table 3, Specific glucose and glutamine consumption rates at different glutamine
supplementation
Glutamine Glucose Consumption rate (pmol/cell.hr) Glutamine Consumption rate (pmol/cell.hr)
Exponential phase Post- Exponential Phase Exponential Phase Post-Exponential Phase
0 mM -0.15 -0.024 -0.004 0
2 mM -0.15 -0.036 -0.011 0
4 mM -0.2 -0.031 -0.027 0
8 mM -0.2 -0.036 -0.029 -0.007
pH Effect
The objective of reducing the pH is that such reduction was expected to result in higher
glycosylation. On the other hand the objective of shifting the pH only after reaching the cell
density peak was to benefit from an increase in galactosylation and sialylation while preserving
cell growth and mAb production mostly occurring during the exponential phase. For brevity the
results of pH adjustment by HCl are shown in the Appendix A. The experimental results of
viable cell density, glucose, glutamine and the byproduct accumulation of ammonia and lactate
for the culture initiated with 4 mM glutamine and 25 mM glucose without pH reduction (control)
were compared with the experiments of reduced-pH and shifted-pH conditions (Figure 5).

62
Figure 5, Viable cell density and metabolite profiles. Data points represent mean ± SD
for two independent experiments except for experiments with initial 4 mM glutamine
repeated three times. Closed symbols: reduced-pH (lactic acid), shifted-pH (lactic
acid), 4 mM glutamine (Control). A) Viable cell density; B) glucose consumption; C)
ammonia accumulation; D) monoclonal antibody production; E) Lactate accumulation.

63
Reducing the medium pH from 7.8± 0.05 to 6.8±0.05 along the entire culture duration
resulted in lower cell growth and mAb productivity as compared to the culture without pH
manipulation. Despite the fact that pH reduction was performed using lactic acid with the
expectation of lactic acid being used as nutrient after glucose complete depletion, lactic acid
accumulated in the culture and reduced cell growth due to non-optimal pH conditions. These
findings differ from previous results that show that lactate can serve as nutrient in later stages of
the culture and used as an effective method to reduce the ammonia production (Li, et al., 2012).
The maximum peak of cell density with the reduced-pH operation was reached after 4 days of
cultures with approximately 2.7x10⁶ cells.ml
-1 which is significantly lower than the peak of
3.6x10⁶ cells.ml
-1 obtained for the control culture, also shown in Figure 5. The mAb
productivity also decreased to 0.042 pg mAb (cell.hr)-1
but it remained constant until the end of
the culture. The shifted-pH cultures with the partial reduction of pH resulted in slight
suppression of the cell growth and mAb productivity but cell growth was higher than for the
culture operated with a lower pH from the start. Although reducing pH from the beginning of the
culture had a negative impact on the cell growth and mAb productivity, it resulted in an almost
three-fold lower rate of glucose consumption. This observation is relevant to glycosylation since
glucose is correlated to the levels of nucleotide sugar pools (Liu et al. 2014). It is also
noteworthy that ammonia levels were almost unchanged between the experiments with and
without pH manipulation. This is important for the current study since the effect of pH changes
on glycosylation has been previously assessed in the literature in cultures where these changes

64
were due to build-up or depletion of ammonia (Doyle and Butler 1990). Because in this case the
external ammonia levels did not change, the results of pH experiments can be used to assess the
effect of pH independent from the impact of ammonia levels.
4.3.2 Glycan Profiles
The predominant glycan structures determined in EG2-hFc mAb are predominantly
fucosylated biantennary structures with different amounts of terminal galactose and sialic acid:
agalactosylated (F(6)A2G0), monogalactosylated (F(6)A2G1) and digalactosylated (F(6)A2G2 ,
F(6)A2G2S1) oligosaccharides structures were identified based on the GU values from HILIC
analysis compared to Glycobase 3.2 (NIBRT.ie) and verified with exoglycosidase digestions.
Smaller amounts of other glycan structure were also identified: F(6)A1, A1G1, A2G1,
F(6)A1G1, A2G2 and F(6)A2G2S2.
The time profiles for the observed dominant glycan structures for each batch at different
glutamine levels and pH conditions are shown in Figure 6 and Figure 7, also the HILIC profile of
glycans are provided in Appendix A. The glycosylation values at each day obtained from mAb
supernatant samples represent a cumulative average of glycosylation from the start of the culture
up to that day because the mAb is exposed to different glycosylation conditions at different
times.

65
Figure 6, Individual glycans relative abundances (RA%) at different culture
conditions. The error for F(6)A2G0, F(6)A2G1, F(6)A2G2 , F(6)A2G2S1, F(6)A2G2S2 are
1.42%, 0.79%, 0.56%, 1.17% and 0.11% respectively (100%=total area of glycans) which
have been calculated based on a duplicated sample. A) Glutamine effect a day three, B)
Glutamine effect at day seven, C) pH effect at day three, D) pH effect at day seven.

66
Figure 7, Individual glycans relative abundances (RA%) at different culture
conditions. The error for F(6)A2G0, F(6)A2G1, F(6)A2G2, F(6)A2G2S1, F(6)A2G2S2 are
1.42%, 0.79%, 0.56%, 1.17% and 0.11% respectively (100%=total area of glycans) which
have been calculated based on a duplicated sample. A) Glutamine effect a day three, B)
Glutamine effect at day seven, C) pH effect at day three, D) pH effect at day seven.

67
According to Figure 6, the abundance of the agalactosylated glycan structure, F(6)A2G0,
increased along the course of culture for all non-zero initial glutamine levels. In contrast,
monogalactosylated glycan, F(6)A2G1 and digalactosylated structures, F(6)A2G2, F(6)A2G2S1
and F(6)A2G2S2 diminished temporally for all culture conditions except for the zero initial
glutamine culture in which a slight increase in sialylation was observed. There was an exception
for 8 mM culture in which the abundance of F(6)A2G1 increased form day 3 to day 7 but its
value dropped again towards the end of day 9 (Figure 7). The decline of galactosylated glycans
during the course of culture can be attributed to glucose reduction that influences nucleotide
sugars availability for further galactosylation (Nyberg et al. 1999; Ohadi et al. 2013) and partly
to the activity of glycosidase enzymes at lower cell viability in the post exponential phase of
growth (Andersen and Goochee 1994).
Ammonia levels reached to 1.6 mM in culture without glutamine supplement at day 5 while
with 2 and 4 mM initial glutamine the cultures reached higher ammonia concentrations of 3.1
and 5.1 mM respectively at the same day. These results might confirm a negative correlation
between ammonia to sialylation and explaining the higher sialylation in the glutamine free
culture. The pH in the culture with 4 mM of initial glutamine was slightly higher than the pH of
the culture with 0 mM initial glutamine although the ammonia buildup was higher in the former
culture as compared to the latter. This observation may be explained by the higher buildup of
lactic acid (Figure 3) in the 4 mM glutamine culture as compared to the 0 mM glutamine culture
following fast conversion of glucose to lactate. Thus, the experimental results suggest that

68
accumulation of ammonia should be avoided due to its negative impact on sialylation by, for
example, operating the culture with lower or zero initial levels of glutamine.
Furthermore, the sensitivity of the cell line in terms of the impact of ammonia levels on
glycosylation is higher than those reported in other studies (Yang and Butler 2000, 2002). For
example, the culture started with 4 mM of glutamine reached a level of 3.1 mM of ammonia and
exhibited 13% less RA of digalactosylated glycan as compared to the culture started with 0 mM
of glutamine that reached a maximum of 1.6 mM of ammonia at day 5 of culture.
The effect of external pH on glycosylation is shown in Figure 7, C and D. The reduced-pH
culture by lactic acid addition had a higher level of disialylated glycans than monosialylated and
asialylated types. A similar impact of pH was observed in shifted-pH operation. It is important to
notice that the ammonia concentrations for the cultures with or without pH manipulation resulted
in almost identical levels of extracellular ammonia Figure 5.
Previous researchers have explained the effect of pH through the correlation of
environmental pH levels with ammonia introduction into mitochondria (Doyle and Butler 1990;
Schneider et al. 1996). However, in the current work pH and ammonia are not significantly
correlated. Thus, the experiments with pH reduction can be used to elucidate the effect of pH
independent from any effect associated with ammonia changes as shown later. pH reduction by
HCl resulted in similar reduced growth and higher SI as with lactic acid but SI was lower that
with lactic acid due to higher levels of ammonia (Appendix A).

69
4.3.3 Glycosylation Indices
The galactosylation and sialylation indices (GI and SI) were calculated according to the
equations 3-4 and 3-5 defined in Chapter 3. Since improved therapeutic properties of mAbs are
generally related to overall levels of sialylation and galactosylation (Butler 2006a) it is suggested
that tracking the evolution of the process by monitoring the indices, can be a useful tool for
further process improvement and optimization.
The time profiles of the indices for different initial glutamine concentrations are presented in
Figure 8, A and B. The maximum GI was 0.74 and observed at the exponential phase of cell
growth (day 3) of the culture supplemented with 0 mM and 4 mM glutamine.
To calculate the errors of GI and SI, a duplicates’ analysis was done for day 7 of the culture
with 4 mM glutamine and 25 mM glucose (control). The GI and SI values were calculated for
each case and the error was then obtained based on the differences of final value of GI and SI
between two cases. The errors for GI and SI were 0.5% and 0.9% respectively.

70
Figure 8, Galactosylation index, GI and sialylation index, SI at different culture
conditions. The errors in the GI and SI index are 0.5% and 0.9% respectively which have
been calculated based on a duplicated sample. 0 mM glutamine, 2 mM glutamine , 4
mM glutamine, 8 mM glutamine, reduced-pH (lactic acid), shifted-pH (lactic acid).
A) GI and glutamine effect, B) SI and glutamine effect, C) GI and pH effect D) SI and pH
effect.

71
GI variations were noticeable during the course of the culture for all experiments with
nonzero initial glutamine levels. For the experiment with initial 4 mM of glutamine, the highest
variation corresponded to a 15% decrease in GI between the exponential phase of cell growth
(day 3) and the post exponential phase (day 5). For 0 mM glutamine culture, the GI level was
0.74 and stayed constant for the duration of the experiment. The consistent higher level of
galactosylation in the 0 mM glutamine culture can be explained by lower consumption and
higher availability of glucose when glutamine is not present due to the aforementioned co-
metabolism mechanism between glutamine and glucose. For instance, for the culture with initial
4 mM glutamine the glucose was almost completely exhausted at the beginning of the post
exponential phase (day 5) while 13 mM of glucose were still available for the culture with zero
initial glutamine at the same day. These results suggest a correlation between the galactosylation
level and glucose consumption rate (Ohadi et al. 2013; Liu et al. 2014).
In the culture with 0 mM glutamine slightly better sialylation was also observed (Figure 8,
A). The SI level was 0.15 at day 7. In the cultures with higher initial glutamine levels, SI
generally decreased over the culture. The 4 mM glutamine supplemented culture exhibited the
lowest SI level at the post exponential phase (day 5) approximately 0.08 comparing to 0 and 2
mM glutamine supplemented cultures which had at least a SI of 0.12 by the same day. This
reduction might be pertinent to higher ammonia in the culture initiated with 4 and 8 mM
glutamine.

72
It is also worth mentioning that the SI range for EG2-hFc is low (0.08 to 0.2) compared to
galactosylation (0.6 to 0.8). The sialic acid levels of commercial antibodies has been reported to
be approximately 10% to be similar to the levels observed for in human antibodies (Raju et al.
2000). Therefore the EG2-hFc falls within the typical sialylation range for IgG. However,
depending on the application achieving a higher level of sialylation might be of interest (Butler
2006a).
Figure 8, B and C, shows the effect of pH on GI and SI indices. Both GI and SI levels were
higher in the reduced-pH culture. In the latter, the highest level of GI was 0.8 in the exponential
phase (day 3) but its level dropped to 0.68 at the end of that culture indicating that the
galactosylation was very low for the mAb produced during the post-exponential phase. However,
the GI was still higher at the end of the culture as compared to the GI for the culture with the
same initial concentration of glutamine but without pH reduction for which the GI was about 0.6.
In the shifted-pH culture, similar GI and SI as compared to the culture where pH was not reduced
(control) were observed. The maximum level of SI was observed in the reduced-pH culture at the
beginning of the post exponential phase (day5) at approximately 0.21. The average SI was 0.19
as compared to the average SI observed for the culture without pH reduction which was 0.1.

73
4.4 Modeling of the glycosylation Process
The GLYCOVIS software (Hossler et al. 2006) was used to identify the most significant
glycosylation pathways for the cell line under study. The program uses the amounts of the
individual glycans as inputs. The code produces a graphical description of the glycosylation
pathways where each pathway is described by a particular color corresponding to a specific
range of glycan abundance in terms of percentages. For example, Figure 9 describes the
pathways corresponding to the measured glycans at day 5 and 7 of the culture started with 0 and
4 mM glutamine and for the experiment where pH was reduced towards the end of the culture
time (reduced-pH). The bold lines in Figure 9 correspond to the most significant pathways
corresponding to the most abundant glycans levels measured along this pathway.

74
Figure 9, Glycan distribution network from GLYCOVIS at different days of batch
cultures. Numbers indicates individual glycans and labels on arrows describe enzymes that
trigger those specific reactions. G44 or F(6)A2G0, G45 and G46 or F(6)A2G1, G49 or
F(6)A2G2, G51or F(6)A2G2S1, G52 or F(6)A2G2S2 . A) 4 mM Glc at day 5, B) 4 mM Gln
at day 7, C) 0 mM Gln at day 5, D) 0 mM Gln at day 7, E) reduced-pH (lactic acid) at day
5, F) reduced-pH (lactic acid) at day 7.

75
The numbers in Figure 9, correspond to different glycans where the numbers in bold are
glycans that were actually measured in the experiments whereas the others must occur as
intermediates to enable the occurrence of the measured ones. The correspondence between the
numbers and their chemical compositions was provided before (Hossler et al. 2006)
Similar GLYCOVIS plots were obtained for each day of a particular culture conducted in
the current study. First, it was found that the pathways of significant reactions as well as glycans
remained the same for all cultures. The only differences between the experiments were in terms
of strengths (i.e. colors) of the pathways. For example, in day 5 of the culture with initial 4 mM
glutamine the range of the most significant pathway (bold line) terminating in a digalctosylated
glycan (glycan 49) is at 30-40% whereas in day 7 the same pathway is at 20-30%. For the initial
zero glutamine culture for both days 5 and 7 the level of glycan 49 remained at 30-40% (Figure
9, A to D) thus explaining the overall higher galactosylation observed in the 0 mM glutamine as
compared to the 4 mM glutamine culture. Beyond the identification of significant glycosylation
pathways the results of GLYCOVIS in combination with the measured distribution of glycans
abundances can be used to correlate the evolution of the glycosylation process with different
culture conditions tested in the current work.
As it shown in Figure 9, A and C, agalactosylated glycan (Glycan 44) is higher in the 4 mM
glutamine culture as compared to the 0 mM glutamine culture at day 5. A plausible reason is that
UDP –GlcNAc, one of the precursors of glycan 44, increases with higher levels of ammonia as
occurring in the culture with 4 mM glutamine as compared to the culture with initial 0 mM

76
glutamine. UDP –GlcNAc has been reported as a competitor for sialic acid transport (Valley et
al. 1999; Butler 2006a) resulting in the lower observed sialylation for the 4 mM glutamine
culture.
The lower level of galactosylation index observed for the 4 mM glutamine culture is that the
reaction from glycan 44 to monogalctosylated isomer glycans (glycan 45 and 46) and then to
digalctosylated glycan (glycan 49) cannot proceed forward due to unavailability of galactose
pool resulting from early depletion of glucose by day 4. This is further corroborated by
comparing the glycans distributions for day 7 (Figure 9, B and D).
When comparing the reduced-pH culture with 4 mM initial glutamine culture with normal
pH levels (Figure 9, A, B, E and F) the distribution of glycans in day 5 indicates that the
abundance of glycan 44 is similar for both cultures corroborating the correlation of this glycan
with ammonia since in both cultures the ammonia levels are similar. On the other hand the
abundances of glycans 51 (monosialylated glycan) and 52 (disialylated glycan), which
corresponding reactions are regulated by sialyltransferase, are higher in the reduced pH culture.
The higher observed activity in this pathway indicates an effect of pH on the activity of
sialyltransferase (Borys et al. 1993).

77
Chapter 5
Effect of Mild Hypothermia
5.1 Introduction
Improvement of mammalian cell productivity have mostly focused on the use of fed-batch
modes (Li et al. 2010; Naderi et al. 2011) and the optimization of cell culture media
compositions (Butler 2005; Kim et al. 2013). Optimization of the cell culture’s operating
conditions plays a significant role in achieving higher productivity along with required quality in
larger scale production. Among process parameters that can be optimized, temperature has been
reported as a highly effective means for raising the mAbs’ productivity (Trummer et al. 2006).
Applying mild hypothermia techniques has been reported as a feasible industrial solution
(Chen et al. 2011; Vergara et al. 2014) that mostly leads to reduced cell growth, but longer cell
life and cell productivity (Chen and Harcum 2006; Rodriguez et al. 2010; Vergara et al. 2014).
Although, the benefits of reduced temperature have been utilized by several researchers, its
mechanism on specific productivity enhancement has not been conclusively resolved. The
mechanisms that were suggested to explain temperature effects on productivity include increased
mRNA stability of recombinant proteins, improved transcription levels and cell cycle arrest in

78
the G1 phase that leads to energy savings and reduced consumption of carbon sources towards
cell growth (Butler 2005; Vergara et al. 2014).
However, reducing the culture’s temperature not only influences cell growth and protein
expression but also influences the posttranslational process of glycosylation (Mason et al. 2014;
Sou et al. 2014). The effects of mild hypothermia on glycosylation are highly dependent on cell
line and protein type thus explaining the contradictory observations reported in the literature.
Moreover, since the regulation of enzymes during the progress of glycosylation in the ER and
Golgi are not well understood, the effect of temperature on enzyme activity and the resulting
glycosylation have not been conclusively elucidated (Hossler et al. 2009; Stanley 2011).
According to our previous observations (Chapters 5) (Aghamohseni et al. 2014), consistently
higher glycosylation indices were obtained for two cases: i) glutamine-free cultures with
resulting lower ammonia levels and higher availability of residual glucose and ii) in Reduced-pH
conditions. However, it was also found for these two cases that productivity is negatively
impacted thus leading to a tradeoff between productivity and glycosylation levels. This chapter
explores the effects of mild hypothermia on both glycosylation and productivity to test whether
there are similar tradeoffs between these two properties as obtained in the previous investigations
with different levels of glutamine and culture pH. The results of this investigation were also used
to further calibrate the mathematical model presented in Chapter 6.

79
5.2 Materials and Methods
5.2.1 Batch Conditions and Experimental Designs
According to the results presented in Chapter 4, at the medium level of glutamine (4 mM
Gln) and 25 mM Glc, cell growth was higher. On the other hand, for glutamine-free conditions
and 25 mM of glucose, higher levels of glycosylation indices were observed. Due to these
competing outcomes, the effect of temperature manipulation was tested for only these two set of
conditions to assess whether it is possible to obtain better tradeoffs between productivity and
glycosylation.
Experiments were performed in 500 ml polycarbonate vented-cap shaker flasks with 200 ml
working volumes. Each set of experiments was performed in triplicate.
The experimental design for this chapter is described in Table 4. The same seed culture
cultivated in regular BioGro-CHO (4 mM Gln, 25 mM Glc) was used for all batches (Chapter 3
section 3.2), with 0.2 x 10⁶
cells/ml inoculum concentration (Chapter 3, section 3.2).
Temperature adjustments were applied as per the steps explained in Chapter 3, section 3.2.1.
Briefly, flasks with 0 and 4 mM Gln and 25 mM Glc were either kept in a 37ºC incubator
through ten days of culture, to be referred to as “Reduced-Temperature” mode or transferred to a
33ºC incubator on day three after inoculation where cells were expected to still be in their
exponential phase of growth, to be referred to as “Shifted-Temperature” mode. Two different
incubators operated with two different temperature set points, 33ºC and 37ºC, were used to effect

80
the temperature changes. All flasks were maintained for a 10-12 days period during which the
viability never dropped below 40%.
Table 4, Experimental design for temperature effects at two initial concentrations of
glutamine and constant level of glucose (25 mM). The letter n, represents number of flasks
in each set of experiments.
Glutamine (mM)
Temperature
0 4
Control (37ºC) n=3 n=3
Reduced (33ºC) n=3 n=3
Shifted to 33ºC n=3 n=3
5.2.2 Analysis
Samples were taken daily for analysis of viable cell density; viability index; metabolite
profiles, including of lactate, ammonia, glucose, glutamine and mAbs concentrations. Since for
the initial 3 days, mAb productivity was very low, samples for glycan analysis were taken every
other day starting from day three when appropriate amounts of mAbs were produced. All the
analyses were carried out according to the techniques explained in Chapter 3, section 3.3.

81
5.3 Results and Discussion
5.3.1 Cell Growth Characterization
Temperature Effect and 4 mM Glutamine Condition
The cell density profile and viability indices for cultures cultivated at 4 mM glutamine and
mild hypothermia conditions are compared with a control (Figure 10). The control culture at
37ºC reached a higher peak of cell density 3.6x10⁶
cells/ml, at day four after inoculation. As for
the Temperature-Shifted batch, for which the temperature was reduced from 37ºC to 33ºC on day
3, the cell density peak was lower as compared to the control and it occurred at day 3. Thus, cell
growth dropped as soon as the temperature change was applied. However, for the shifted
temperature culture, cells entered their predominantly death phase more slowly which, led to a
higher viable cell density at day 7 of 1.4x10⁶
cells/ml as compared to the control, which reached
0.8x10⁶ cells/ml at that day.
The impact of lower temperature was even more evident when cells were cultured at 33ºC for
the entire experiment (Reduced-Temperature mode). As shown in Figure 10 the cells exhibit a
lag phase of more than 24 hours for this condition as compared to a much smaller lag phase for
the control culture. The cell density peak was delayed to day 6 and the maximum cell density
was 44% lower as compared to the control. The highest cell density observed for the Reduced-
Temperature batch was 2x10⁶ cells/ml at day 6. Although at lower temperature the cells did not

82
reach the same viable cell density as shown in Figure 3, they stayed in the stationary phase for a
longer time and consequently entered their dead phase later.
Figure 10, Time profile of total viable cell density of CHO cells cultivated at 4 mM
glutamine and different temperature conditions. Data points represent mean ± SD for
triplicate experiments. Control at 37ºC, Shifted-Temperature and, Reduced-
Temperature.
According to the Figure 11, the viability index of Reduced-Temperature stood above 90%
until day 7 post inoculations, while for the control and Shifted-Temperature, this value was
maintained for a shorter period of 5 days.

83
Figure 11, Time profile of viability index of CHO cells cultivated at 4 mM glutamine and
different temperature conditions. Data points represent mean ± SD for triplicated
experiments. Control at 37ºC, Shifted-Temperature and, Reduced-Temperature.
Temperature effect and Glutamine-Free Condition
As shown in Chapter 4, glutamine is a key nutrient for cell growth of this cell line and, in a
particular proportion with glucose (4 mM glutamine and 25 mM glucose), resulted in optimal
cell growth. Thus, lack of glutamine was found to hinder the ability of cells to reach higher

84
viable cell densities. Figure 12, presents the time profiles of viable cells cultivated at different
temperature settings without glutamine supplementation.
Figure 12, Time profile of total viable cell density of CHO cells cultivated at 0 mM
glutamine and different temperature conditions. Data points represent mean ± SD for
triplicated experiments. Control (37ºC), Shifted-Temperature and, Reduced-
Temperature.
The control (Glutamine-free and 37˚C) and Shifted-Temperature cultures both reached their
peaks of cell density on day 4 of the culture with densities of 2.23±0.37 and 2.08±0.2 x 10⁶
cells/ml, respectively while the peak of cell density for the Reduced-Temperature operation
occurred on day 5 and it was equal to 2.09±0.11 x10⁶
cells/ml. As for the 4 mM glutamine

85
culture, the rate of dead cells was slower at lower temperature conditions. The cell viability over
50% under the Shifted-Temperature condition increased to almost 12 days, which was a record
value among all the experimental conditions investigated in the current research.
Overall, cells reacted to lower temperature more moderately under glutamine-free conditions
as compared to cultures initially supplemented with glutamine. This observation can be
explained by the fact that under glutamine starvation the specific growth rate was already low so
the contribution of lower temperature to cell growth was less noticeable than for the cultures
initiated with 4 mM glutamine.
The viability index profiles for glutamine-free batches at different temperature regimes are
displayed in Figure 13. The viability index for both the Shifted-Temperature and Reduced-
Temperature modes of operation remained above 90% until day 6 after inoculation, while for the
control, this value started to drop on day 5.
Comparing of results of temperature effect with and without glutamine supplementation
(Figure 10 and Figure 12) disclosed that the main effect of mild hypothermia on cell population
was the reduction of specific growth rates and increasing the cell life. Table 5 summarizes the
specific growth rates, µ (1/h), and death rates (negative values), during the exponential and post-
exponential phases of growth. The reported values in the table were calculated based on the
equation 3-1 and 3-2 presented in Chapter 3.

86
Figure 13, Time profile of viability index of CHO cells cultivated at 0 mM glutamine
and different temperature conditions. Data points represent mean ± SD for triplicated
experiments. Control (37ºC), Shifted-Temperature and, Reduced-Temperature.
Achieving lower specific cell growths under reduced temperature conditions is in agreement
with results reported in previous studies (Trummer et al. 2006; Mason et al. 2014; Vergara et al.
2014). However, it was observed in the current study that for glutamine supplemented cultures
under the Reduced-Temperature regime the viable cell density could not reach the same levels as
under control condition (4 mM Gln) even at the later days of cultivation, in contrast with
previously reported results (Sureshkumar and Mutharasan 1991; Weidemann et al. 1994). On the
other hand for the glutamine-free case under the Reduced-Temperature (Figure 12) mode of

87
operation the cell density reached 2.09±0.11 x10⁶
cells/ml, almost the same value of the peak in
density obtained for the control but with a delay of one day.
Table 5, Specific growth rate at mild hypothermia condition for cells cultivated at
glutamine 4 mM and zero mM glutamine supplementation.
Exponential phase of growth
Specific growth rate (1/h)
Post-exponential phase of growth
Specific Death Rates (1/h)
Gln Control
(37˚C)
Shifted-Temp. Reduced-Temp.
Control
(37˚C)
Shifted-Temp. Reduced-Temp.
4 mM 0.031 0.031 0.021 -0.03 -0.009 -0.006
0 mM 0.026 0.022 0.022 -0.01 -0.004 -0.008
As reported in Chapter 4, the specific growth rate was slower under glutamine-free
conditions than in the 4 mM glutamine supplemented culture, regardless of the temperature
levels. For both the Reduced-Temperature and Shifted-Temperature modes the specific growth
rates were affected but to different extents for the glutamine supplemented and glutamine-free
cultures. For example, with initial 4 mM glutamine, the culture under Shifted-Temperature
regime had similar specific growth as the control (4 mM Gln and 37˚C), while under the
Reduced-Temperature regime the specific growth dropped significantly by 32 % as compared to
the control. Under glutamine-free condition, we observed almost the same specific growth rate

88
for the control, the Shifted-Temperature and the Reduced-Temperature conditions at the
exponential phase of growth.
At the post exponential phase of growth (decline phase), for the 4 mM glutamine culture, the
specific growth rate dropped by 70 % and 80 % for the Shifted-Temperature and the Reduced-
Temperature regime respectively, compared to the control. Thus, for cultures initiated with 4
mM glutamine, the temperature reduction strategies reduced both the cell growth and death rate
during both the exponential and post-exponential phases of growth. In contrast, for cultures
initiated without glutamine, the lower temperature operation only decreased the death rates but
did not affect the growth (Table 5). It was reported by (Wahrheit et al. 2013) that in the absent
of glutamine, the latter is synthesize in the early stages of growth and it is consumed at the later
stages of the culture. On the other hand, in the shifted temperature operation, the glucose
consumption is lower in the post-exponential phase thus postponing the occurrence of cell death
with increasing viability as shown in Figure 15 for glucose and Figure 12 for cell viability.
The observed longer cell viability for both glutamine-free and 4 mM glutamine cultures
under the lower temperature conditions are in agreement with other studies (Moore et al. 1997;
Yoon et al. 2005; Mason et al. 2014). In the current study, the culture operated under the Shifted-
Temperature regime and without glutamine, exhibited a longer life span as compared to the
Reduced-Temperature cultures with initial 4 mM Gln. In addition, the combination of glutamine-
free and Shifting-Temperature conditions was found to be the most effective for extending the
cell viability.

89
5.3.2 Extracellular Metabolite Profiles
Temperature Effect and 4 mM Glutamine Condition
The extracellular metabolite concentrations were analyzed for all batches over a period of 10
to 12 days depending on the longevity of the culture. The time profiles of glutamine, glucose,
lactate and ammonia at 4 mM Gln are shown in Figure 14.
Residual concentrations of glucose and glutamine were higher in both the Shifted-
Temperature and Reduced-Temperature samples than those of the control. The control culture
ran out of glucose on day 5, whereas for the Shifted-Temperature and Reduced-Temperature
sufficient glucose (3.3±0.4 mM and 6.6±0.8, respectively), was left in the culture for sustaining
growth.
Glutamine was consumed even faster than glucose. All the extracellular glutamine was
consumed by day 3 for both the control and the Shifted- Temperature batches, while 2.5±0.3 mM
glutamine was still left at that day in the Reduced-Temperature samples. In the latter, glutamine
was exhausted only after 6 days of cultivation. This fact can be explained by the lower cell
growth observed under mild hypothermia conditions, which led to preservation of glucose and
glutamine in the culture.

90
Figure 14, Metabolite profiles of mild hypothermia experiment at 4 mM Gln. Data points
represent mean ± SD for triplicate experiments: Control at 37ºC, Shifted-
Temperature, and Reduced-Temperature. A) Glutamine (mM), B) ammonia, C) lactate
(mM), D) glucose (mM).
Lactate profiles were very similar in all the experiments at the exponential phase. Lactate
was produced at a higher rate during the exponential phase of growth and then it was consumed
to a slight extent during the post–exponential phase. The maximum lactate production occurred
on day 5 up to a value of 31±1.8 mM for all conditions and its levels dropped to 27.5±1.8 on day

91
9. However, the specific lactate consumption at the decline phase was not similar for Reduced-
Temperature conditions. In the latter case, due to high availability of glucose, the used of lactate
as an alternative carbon source was limited.
Ammonia accumulation followed a fairly similar pattern in all the experiments. The level of
ammonia accumulation drops by almost 90% in the post-exponential phase of growth. The
highest level of ammonia at day 9 after inoculation was 4.5±0.3 mM for the Control, 3.91±0.39
mM for Temperature-Shift and 3.89±0.06 for Reduced-Temperature samples.
Temperature Effect and Glutamine-Free Condition
The time profiles of extracellular glucose, lactate and ammonia under glutamine-free
condition are shown in Figure 15. Residual concentrations of glucose were similar in the
exponential phase regardless of the type of experiment. However, the glucose levels continued to
drop for both Shifted-Temperature and Reduced-Temperature operating modes because of the
prolonged cell growth in the post-exponential phase. It is worth mentioning that due to
measurement error, the Control flask was started with a slightly higher level of glucose (27 mM)
as compared to 25 mM used in most experiments. However, it is unlikely that this relatively
small error in initial glucose can explain that glucose residuals as high as 8±2.2 mM were
observed towards the end of culturing.

92
Figure 15, Metabolite profiles of mild hypothermia experiment at 0 mM Gln. Data points
represent mean ± SD for triplicate experiments: Control at 37ºC, Shifted-
Temperature, and Reduced-Temperature. A) ammonia (mM), B) Lactate (mM), C)
glucose (mM)
As for the 4 ml glutamine experiment, lactate was produced at a higher rate during the
exponential phase of growth and then was consumed to a slight extent during the post–
exponential phase under all conditions. Similar to 4 mM glutamine conditions, lactate

93
consumption was lower at the lower temperature experiments. The maximum concentrations of
lactate were 26.19± 1.41 mM on day 4 for the Control, 26.85±1.48 mM on day 5 for the Shifted-
Temperature experiment and 25.85±2.19 mM on day 5 for the Reduced-Temperature
experiment. The minimum levels of lactate towards the end of the post-exponential phase were
23.7±0.28 mM.
For the Reduced-Temperature experiment without glutamine supplementation, ammonia
initially accumulated and then stayed at the same level of 1.35±0.08 mM, for the entire 9 days of
incubation, in contrast to the cultures started with 4 mM glutamine environment where ammonia
accumulated for the entire duration of the culture. Also, in the absence of glutamine, ammonia
levels increased to 2.3±0.34 mM and 1.97±0.028 mM for the Control and the Shifted-
Temperature samples respectively. Thus, for glutamine-free cultures, cells still produced
ammonia by metabolizing amino acids other than glutamine (Wahrheit et al. 2013).
The specific production and consumption rates of metabolites under mild hypothermia
condition have been calculated based on equations 3-1 and 3-2 and are presented in Table 6. For
both 0 mM and 4 mM glutamine condition, reducing the temperature did not affect the specific
glucose and glutamine uptake rate significantly. As the specific growth rate was also lower
compared to the control condition at mild hypothermia (Table 5), glucose and glutamine were
consumed in a larger degree towards protein production relative to cell growth as compared to
the operation at normal temperatures. The results of the protein production details are presented
later in section 5.3.3. In addition, our observation indicates that in the absence of initial

94
glutamine similar metabolic pathways are used for synthesis of intracellular glutamine regardless
of the temperature conditions.
Table 6, Specific consumption and production rates of metabolites at mild
hypothermia and 4 mM glutamine a), mild hypothermia and glutamine-free b).
a) Specific Consumption and Production Rates of Metabolites (pmol/cell.h)
Mild Hypothermia and 4 mM Glutamine
Exponential phase of growth Post-exponential phase of growth
Control (37˚C) Shifted-Temp. Reduced-Temp. Control (37˚C) Shifted-Temp. Reduced-Temp.
Glc -0.2 -0.2 -0.25 -0.04 -0.04 -0.05
Gln -0.03 -0.03 -0.04 0 0 -0.013
lac 0.19 0.17 0.2 -0.01 -0.01 -0.003
NH4 0.02 0.02 0.02 0.003 0 0.001
b) Specific Consumption and Production Rates of Metabolites (pmol/cell.h)
Mild Hypothermia and Glutamine-Free
Exponential phase of growth Post-exponential phase of growth
Control (37˚C) Shifted-Temp. Reduced-Temp. Control (37˚C) Shifted-Temp. Reduced-Temp.
Glc -0.15 -0.18 -0.17 -0.024 -0.023 -0.04
lac 0.51 0.52 0.55 -0.026 -0.015 -0.015
NH4 0.005 0.003 0.0004 0.005
0.003
-0.001
0.0004

95
As explained in the Chapter 4, in batches with glutamine supplementation, glucose
consumption rate was higher than glutamine-free due to co-metabolism of glucose and glutamine
in this cell line. In terms of carbon catabolism under low hypothermia conditions the findings in
the literature are somewhat contradictory. For example, Vergara et al (2014) showed that the
glucose consumption rate was not affected by lowering the temperature to 33ºC in a process
producing a plasminogen activator by CHO cells. On the other hand, Yoon et al (Yoon et al.
2005) showed that glucose and glutamine were consumed at a slower rate at 32.5 ºC as compared
to a process of EPO production by CHO cells where lower temperatures did not affect the
glucose consumption rate.
Regardless of the initial level of glutamine, lactate production was not affected by the lower
temperature strategies. However its consumption reduced in the decline phase due to a higher
availability of glucose as the main carbon source at low temperature conditions for cell growth
and metabolism. Specific ammonia accumulation was higher in the exponential phase of growth
for all conditions and significantly decreased in the decline phase. In the glutamine free
condition the rate of ammonia formation was lower as compare to the batches initiated with
glutamine concentration. This fact can be explained by the utilization of ammonia for glutamine
synthesis (Wahrheit et al. 2013).

96
5.3.3 mAb’ Profiles, Specific and Volumetric Productivity
Temperature Effect and 4 mM Glutamine Condition
Figure 16, a-b presents the mAb concentration profile and specific productivity,𝑄𝑝, for
cultures cultivated at 4 mM glutamine under mild hypothermia and control conditions. The
concentration of mAbs was found to monotonically increase under Reduced-Temperature
conditions throughout the culture while for the Control and Shifted-Temperature samples, the
mAb concentration decreased during the post exponential phase of growth. The maximum
concentration of mAb at day 9 of cultivation reached 41.5±3.8 mg/l for Reduced-Temperature,
25.8±3.9 mg/l for Shifted-Temperature and 19.3±1 mg/l for the control samples. .
The mAb concentration as a function of the time integral values of viable cell growth
(equation 3-2) is presented in Figure 16-b. The specific productivity can be inferred from the
slopes of this figure according to (equation 3-2). The slope values are summarized in Table 7 for
the exponential and post-exponential phases of growth. For both the Shifted-Temperature and the
Control cultures, the slope of mAb productivity dropped in the post exponential phase of growth.
However, this drop was not observed under mild hypothermia as compared to the control
experiment.

97
Figure 16, mAbs profiles and mAbs specific productivity of mild hypothermia
experiment at 4 mM Gln. Data points represent mean ± SD for triplicate experiments:
Control at 37ºC, Shifted-Temperature and, Reduced-Temperature. mAbs’
concentration vs time A); mAbs’ concentrations vs volumetric cell hours (VCH) B).
Table 7, Specific mAb productivity under mild-hypothermia conditions at exponential
and post exponential phase of growth,
Specific mAb Productivity (pg/cell.h)
Exponential phase of growth Post-exponential phase of growth
Gln Control
(37˚C)
Shifted-Temp. Reduced-Temp.
Control
(37˚C)
Shifted-Temp. Reduced-Temp.
4 mM 0.12 0.083 0.15 0.036 0.054 0.15
0 mM 0.12 0.12 0.13 0.039 0.078 0.13

98
The data presented in Table 7 reveals that reducing temperature for the entire duration of the
culture (9 days) can improve 𝑄𝑝 up to 25% for the exponential phase; and up to 3 fold increase
for the post-exponential phase of growth as compared to the control batches. Reducing the
temperature at the middle of the exponential phase of growth was not as effective as reducing the
temperature for the entire culture time. However, even for the shifted temperature experiment,
𝑄𝑝 was increased in the post- exponential phase of growth by 50% as compared to the control
experiment.

99
Figure 17, Maximum volumetric productivity, 𝑸𝒗,𝒎𝒂𝒙, under mild-hypothermia
conditions compared to the control.
Maximum volumetric productivity rates, 𝑄𝑣,𝑚𝑎𝑥, were calculated from equation 3.3 by dividing
the maximum value of mAb concentrations by the culture time. The blue bars in Figure 17,
describe the maximum volumetric productivity values at 4 mM glutamine for the 3 experiments,
i.e. reduced temperature, shifted temperature and control. The 𝑄𝑣,𝑚𝑎𝑥, under Shifted-
Temperature was not significantly increased as compared to the control batches. However, under
Reduced-Temperature conditions, the maximum productivity increased by almost 100% as

100
compared to the Control reaching a level of 0.2±0.01 (mg/l.h). Thus, with an initial 4 mM
glutamine concentration, cultivating the cells at a lower temperature (33ºC) was an effective
strategy for obtaining both higher volumetric mAb productivity and specific productivity. The
improved final mAb concentration in this case, was not due to extended culture longevity, but
rather to a marked increase of specific mAb productivity. Possible mechanisms that explain this
observation are the increased mRNA stability of recombinant proteins at lower temperature and
the improved transcription levels. On the other hand, we did not observe any reduction in
metabolism of carbon sources as reported by other researchers (Michael Butler, 2005a; Vergara
et al., 2014).
Temperature Effect and Glutamine-Free Condition
Figure 18, a-b, describes mAb concentration profiles as a function of time and volumetric
cell hours respectively for cultures initiated without glutamine for Reduced-Temperature and
Control conditions.
Similar to the experiments initiated with 4 mM glutamine, the concentration of mAbs
monotonically increased under Reduced-Temperature conditions throughout the culture. Shifting
the temperature at the exponential phase of growth was also effective to increase a high level of
protein production. According to Figure 18, the maximum mAbs concentration for Shifted-
Temperature was 39.19±0.27 mg/l, on day 11; for Reduced-Temperature was 42.89±2.22 mg/l,
on day 9; while for the control it was about two times slower equal to 17.2±4.5 mg/l, on the same

101
day. The specific mAbs productivity, 𝑄𝑝 , for exponential and post- exponential phases are
calculated form the slopes in Figure 18-b, and are summarized in Table 7. Under reduced-
Temperature conditions, 𝑄𝑝, rose until the end of cultivation, and its value reached 0.13
(pg/cell.hr). This is approximately a three times higher productivity as compared to the Control
condition during the post exponential phase of growth. Under Shifted-Temperature, 𝑄𝑝 was 0.12
(pg/cell.hr) in the exponential phase of growth; then dropped to 0.08 (pg/cell.hr) at the decline
phase. The maximum volumetric productivity, 𝑄𝑣,𝑚𝑎𝑥, is shown in Figure 17 by the red bars. In
contrast with the culture initiated with 4 mM glutamine the 𝑄𝑣,𝑚𝑎𝑥 significantly improved for
both Shifted and Reduced-Temperature cultures as compared to the control.

102
Figure 18, mAbs profiles and mAbs specific productivity of mild hypothermia
experiment at 0 mM Gln. Data points represent mean ± SD for triplicate experiments:
Control at 37ºC, Shifted-Temperature, and Reduced-Temperature. A mAbs’
concentration vs time); B) mAbs’ concentrations vs volumetric cell hours (VCH)
This productivity increased by approximately 2 fold and 2.5 fold as compared to the control, for
the Shifted and Reduced-Temperature experiments respectively.
Among all the experiments conducted with different levels of initial glutamine and with
reduced temperature strategies, the experiment with the Reduced temperature regime and
initiated with 4 mM glutamine resulted in the largest improvement in specific productivity in the

103
exponential phase, whereas the experiment initiated without glutamine and under a Shifted-
Temperature operation exhibited the highest volumetric productivity.
In summary, the main effect of mild hypothermia, regardless of the initial concentration of
glutamine, was a marked decrease in cell growth. At glutamine-free conditions it resulted in
lower ammonia production while the glucose uptake rate was not affected. In addition the lower
temperature strategies improved both mAbs’ specific productivity and mAbs’ volumetric
productivity regardless of initial glutamine conditions.
5.3.4 Glycan Profiles and Glycosylation Indices
Temperature Effect and 4 mM Glutamine Condition
The glycan profiles of mAbs were analyzed using the method presented in Chapter 3,
section 3.3.5. Samples were collected during the exponential phase (day 3), early stationary
phase (day 4) and death phase of growth (day 5 and 7). The relative abundances (RA) of
dominant glycans were normalized on the basis of a total area of 100 % (Table8). The data points
on the table show the means of RA % for two replicated batches.
From the abundance of dominant fucosylated glycans, specifically F6A2G0, F6A2G1,
F6A2G2, F6A2G2S1 and F6A2G2S1, it can be inferred that the glycan evolutions during the
course of the culture were different between the Shifted and Reduced-Temperature experiments.

104
Table8, Relative abundances of dominant glycans (%) under mild hypothermia and 4
mM glutamine on days 3, 4, 5 and 7 of cultivation. Each data point presents the average of
glycan percentage for two replicated flasks a) Shifted-Temperature and 4 mM glutamine,
b) Reduced-Temperature and 4 mM glutamine.
a ) Shifted- Temperature and 4 mM glutamine
Day 3 Day 4 Day 5 Day 7
F(6)A1 0.32± 0.45 0.31±0.11 0.83±0.22 2.06±0.34
A1G1 1.79±1.18 1.048±0.178 0.34±0.23 0.62±0.08
F(6)A2G0 7.06±0.37 12.02±2.1 19.12±1.95 25.13±1.56
A2G1 0.23±0.32 0.47±0.00 1.08±0.23 2.61±0.02
A2G1 0±0 0.24±0.34 0.62±0.88 1.31±1.85
F(6)A1G1 0±0 1.68±2.3 0±0 1.26±1.78
F(6)A2G1 isomer 13.81±0.23 14.93±1.49 14.41±0.3 13.41±0.42
F(6)A2G1isomer 13.81±0.23 14.93±1.49 14.41±0.3 13.41±0.42
A2G2 0.43±0.61 1.35±0.48 1.33±0.27 1.55±0.24
F(6)A2G2 45.87±1.5 38.68±7.13 36.7±1.75 29.23±2.78
F(6)A2G2S1 6.51±0.06 5.64±0.86 4.68±0.28 3.86±0.57
F(6)A2G2S1 6.51±0.06 5.64±0.86 4.68±0.28 3.8±0.57
F(6)A2G2S2 3.64±1.03 3.01±0.24 1.73±0.4 1.68±0.44
b ) Reduced- Temperature and 4 mM glutamine
Day 3 Day 4 Day 5 Day 7
F(6)A1 0.36±0.05 0.32±0.036 0.23±0.04 0.54±0.02
A1G1 1.24±0.39 0.27±0.08 0.08±0.11 0.11±0.08
F(6)A2G0 14.11±2.42 9.32±0.64 8.3±0.23 15.08±0.36
A2G1 0.38±0.12 0.36±0.06 0.45±0.07 0.52±0.06
A2G1 0.24±0.12 0.21±0.29 0.2±0.28 0.28±0.4
F(6)A1G1 0±0 0.06±0.08 0.27±0.39 0±0
F(6)A2G1 isomer 18.84±0.34 19.65±0.3 19.62±0.13 18.36±0.02
F(6)A2G1isomer 18.84±0.34 19.65±0.3 19.62±0.12 18.36±0.02
A2G2 0.45±0.32 0.43±0.21 1.54±1.34 0.73±0.05
F(6)A2G2 37±1.75 40.09±0.77 39.64±0.73 35.69±0.64
F(6)A2G2S1 3.63±0.19 4.03±0.1 4.26±0.06 4.17±0.07
F(6)A2G2S1 3.63±0.19 4.03±0.1 4.26±0.062 4.17±0.07
F(6)A2G2S2 1.24±0.06 1.63±0.16 1.48±0.04 1.93±0.01

105
For example, F(6)A2G0, a non galactosylated glycan, reached on day 3 a twofold higher
percentage area of 14.11 ±2.24 under the Reduced-Temperature operation as compared to the
Shifted-Temperature operation (7.06 ±0.37 ). Subsequently, the level of this glycan declined to
8.3±0.23 on day 7 under Reduced-Temperature condition and again rose to 15.08±0.36 on day 9.
But under Shifted-Temperature, the level of this glycan consistently increased until the end of
culturing to the value of 25.13 ±1.56 %. F(6)A2G0 is the main non-galactosylated glycan for
this mAb and its higher concentration at day 3 for the Reduced-Temperature samples as
compared to the Shifted-Temperature can be explained by the lower residence of mAb of the
former in the Golgi complex. The reduction of the residence time is due to a higher rate of
production at lower temperature that limits the exposure time of protein to the
glycosyltransferase enzymes (Butler 2006b). The lower availability of glucose observed towards
the end of the culture is possibly the reason for the consistent increase of this non-galactosylated
glycan for the Control and the Shifted-Temperature cultures. Due to depletion of glucose with
the associated decrease in galactose, less amount of F(6)A2G0 is further reacted thus explaining
its monotonic increase until the end of the batch.
The levels of a monogalactosylated glycan, F(6)A2G1, remained almost constant during
culturing for both the Shifted Temperature and Reduced Temperature operations (18.84±0.34 to
18.36±0.02 % on days 3 and 7 respectively, for Reduced-Temperature compared to the
13.81±0.23 to 13.41±0.42 % on the same days, for the Shifted-Temperature samples).

106
The reduction in temperature affected the fully galactosylated glycans, including F(6)A2G2,
F(6)A2G2S1, and F(6)A2G2S2 differently for the Shifted and Reduced-Temperature
experiments. For instance, the abundance of these glycans consistently decreased until day 9
under the Shifted-Temperature operation, whereas for the Reduced-Temperature operation their
levels were lower on day 3, increased between day 3 and day 7 and dropped again on day 9. The
maximum levels of F(6)A2G2 for the Shifted and Reduced-Temperature regimes were
45.87±1.5 % on day 3 and 40.09±0.77% on day 4, respectively. Following the results of
F(6)A2G0, the temporal accumulation of this non-galactosylated may explain the subsequent
reduction of F(6)A2G2 for the Shifted-Temperature condition since the former glycan is a
substrate for the latter glycan. Similarly, the higher level of F(6)A2G0 in the Reduced-
Temperature at day 3, my explain the lower level of F(6)A2G2 on the same day.
The highest levels of sialylated glycans mainly, F(6)A2G2S1 and F(6)A2G2S2 were
6.51±0.06% and 3.64±1.03% on day 3 of the Shifted-Temperature culture, and 4.26±0.06% and
1.93±0.01% on day 5 and day 7 of cultivation respectively, for the Reduced-Temperature flasks.
We have previously reported that (Chapter 4) ammonia inversely affect on the sialylation
evolution (Aghamohseni et al. 2014). However, mild-hypothermia did not alter the ammonia
production rate and approximately same concentration of ammonia equal to 4 ±0.3 mM was
obtained for all the three conditions. Also, in agreement with previous studies (Ohadi et al. 2013;
Liu et al. 2014) there is a clear correlation between galactosylation and sialyation levels as sialic
acid can only is attached to a galactose branch of a glycoprotein.

107
Figure 19, describes the time profiles of the glycosylation indices. These values were
calculated according to equations 3.4 and 3.5 based on the RA% values presented in Table8.
Under the control and the Shifted-Temperature conditions, the galactosylation index, GI value,
(Figure 19-a) reached its maximum level on day 3, and its profile declined approximately by
19 %, for the control and 27% for the Shifted-Temperature between day 3 to day 7. In contrast,
significantly different trends of the GI profile were observed for the Reduced-Temperature
condition. For example, the GI at day 3 reached a value of 0.66, much lower than the values
observed for the Shifted Temperature and Control cultures (0.78 and 0.76 for the Shifted-
Temperature and the Control respectively). The highest level of GI occurred on day 5 and it was
still lower than the maximum GI values for the Control and Shifted-Temperature conditions. A
possible explanation for these differences is that during the exponential phase, higher specific
mAb productivity under Reduced-Temperature compared to the Shifted Temperature and
Control cultures, resulting in a shorter residence time of mAb within the cell and in less
glycosylation thus a lower GI value observed at the lower temperature of 33˚C.
According to above mentioned observations, the galactosylation index (GI) and sialylation
index (SI) are strongly correlated. Accordingly, the SI value at day 3 for the Reduced
Temperature culture was also lower as compared to the Shifted-Temperature and the control
conditions (Figure 19-b) and, similarly to the GI, SI value increased between day 3 and day 7.
Thus, mild hypothermia was favorable for mAb production, but not helpful for increasing the

108
level of glycosylation. This outcome was explicitly considered in the development of the semi-
empirical model presented in Chapter 6.

109
Figure 19, Galactosylation index, GI, profile under mild hypothermia and 4 mM
glutamine condition. Data points represent mean for duplicated experiments: Control
at 37ºC, Shifted-Temperature, and Reduced-Temperature.

110
Temperature Effect and Glutamine-Free Condition
The data points on the Table 9, show the mean values of RA % , for two replicated batches.
Similar to the cultures initiated with 4mM of glutamine, it can be observed from the abundances
of F6A2G0, F6A2G1, F6A2G2, F6A2G2S1 and F6A2G2S1 that time evolution of the glycans
were different between the Shifted and the Reduced-Temperature batches.
F(6)A2G0, the dominant non-galactosylated glycan, reached on day 3 a higher level of 14.5
±1.56 % under the Reduced-Temperature regime as compared to the Shifted-Temperature (8.77
±3.39 %) operation. Subsequently, the levels of this glycan declined to 8.8±1.3 and 6.14±0.17 %
on day 4 and 5 respectively, for the Reduced-Temperature condition, and again rose to
12.73±0.83 % on day 7. Similar trends were observed for this glycan for the Shifted-
Temperature operation. Its levels declined to 5.53±0.27 and 4.78±0.38 on days 4 and 5
respectively and then increased to 8.15± 0.87 and 13.39±0.65 on days 7 and 9 of cultivation
consequently. Similar to the initial 4 mM glutamine case, the high concentration of F(6)A2G0
can be explained by the higher rate of mAb production at this condition that consequently results
in a lower residence time of proteins in the Golgi apparatuses. However, the profile of F(6)A2G0
for the cultures initiated without at glutamine was not similar to the ones initiated with 4 mM
glutamine supplementation at Shifted-Temperature and its relative abundance did not increase
monotonically. It appears that for glutamine limited conditions, the nucleotide sugars were
depleted earlier as compared to the cultures initiated with 4 mM glutamine thus resulting in

111
decreasing galactosylation towards the end of the culture. This observation is more evident in the
GI and SI profile as presented later in this section (Figure 20).
The level of a monogalactosylated glycan, F(6)A2G1, under Shifted-Temperature
conditions remained almost constant from day 3 (14.58±1.47) until day 7 (16.23±0.98) of the
culture. Then it dropped to 13.85±0.25 on day 9 of cultivation. This glycan reached higher values
under Reduced-Temperature and glutamine free experiments. In the latter case, the level of
F(6)A2G1 decreased from 20.27±1.79 on day 3 to 18.11±0.27 and 18.08±0.48 on days 4 and 5
respectively and then dropped to a lower value of 16.34±0.47 on day 7 of cultivation.
Reduction in temperature affected the fully galactosylated glycans, including F(6)A2G2,
F(6)A2G2S1, and F(6)A2G2S2, differently for the Shifted and Reduced-Temperature
experiments. The abundance of these three glycans were low on day 3, then improved until day 7
and dropped on day 9 for the Reduced-Temperature batch, while, for the Shifted-Temperature
batch, F(6)A2G2 dropped consistently until day 9. On the other hand, the evolution of sialylation
with time was similar to the Reduced-Temperature operation. The maximum levels of F(6)A2G2
for Shifted and Reduced-Temperature were 41.7±5.25 on day 3 and 39.75±0.97 on day 5
respectively.

112
Table 9, Relative abundances of dominant glycans (%) under mild hypothermia and
glutamine-free condition, on days 3, 4, 5, and 7 of cultivation. Each data point presents the
average glycan percentage for two replicated flasks a) Shifted-Temperature and glutamine-
free, b) Reduced-Temperature and glutamine-free.
a ) Shifted- Temperature and 4 mM glutamine
Day 3 Day 4 Day 5 Day 7 Day 9
F(6)A1 0±0 0.11±0.15 0.1±0.14 0.37±053 0.57±0.81
A1G1 0±0 0±0 0±0 0.17±0.23 0±0
F(6)A2G0 8.77±3.39 5.54±0.27 4.47±0.39 8.16±0.84 13.37±0.65
A2G1 1.21±0.72 0.71±0.09 0.63±0.03 0.92±0.07 1.69±0.15
A2G1 1.21±0.72 0.71±0.09 0.63±0.03 0.92±0.07 1.69±0.15
F(6)A1G1 0±0 0±0 0±0 0±0 0±0
F(6)A2G1 isomer 14.58±1.47 15.51±0.82 14.98±0.33 16.23±0.98 13.85±0.25
F(6)A2G1 isomer 14.58±1.47 15.51±0.82 14.98±0.33 16.23±0.98 13.85±0.25
A2G2 1.61±0.30 1.28±0.01 1.29±0.17 1.27±0.07 1.46±0.38
F(6)A2G2 41.70±5.25 45.57±0.67 41.38±0.05 40.48±0.65 35.93±1.77
F(6)A2G2S1 6.19±0.89 6.04±0.5 7.54±0.28 5.96±1.09 6.78±0.01
F(6)A2G2S1 6.19±0.89 6.04±0.5 7.54±0.28 5.96±1.09 6.78±0.01
F(6)A2G2S2 2.64±0.08 2.97±0.58 6.15±0.63 3.34±0.79 3.3±0.84
b ) Reduced- Temperature and 4 mM glutamine
Day 3 Day 4 Day 5 Day 7
F(6)A1 1.4±1.4 0.22±0.31 0.18±0.25 1.17±0.05
A1G1 0±0 0±0 0.09±0.14 0.08±0.11
F(6)A2G0 14.51±1.56 8.80±1.30 6.15±0.17 12.73±0.83
A2G1 0.72±0.00 1.05±0.76 0.53±0.01 1.62±0.26
A2G1 0.72±0.00 1.05±0.746 0.53±0.01 1.62±0.26
F(6)A1G1 0±0 0.129±0.09 0.09±0.13 0.09±0.14
F(6)A2G1 isomer 20.27±1.79 18.11±0.27 18.08±0.48 16.34±0.47
F(6)A2G1 isomer 20.27±1.79 18.11±0.27 18.08±0.48 16.34±0.47
A2G2 0.43±0.61 1.31±0.49 0.73±0.28 1.64±0.07
F(6)A2G2 33.94±2.53 39.52±0.46 39.75±0.97 35.66±0.19
F(6)A2G2S1 3.08±0.60 4.69±0.96 5.76±0.15 5.15±0.77
F(6)A2G2S1 3.08±0.60 4.69±0.96 5.76±0.15 5.15±0.77
F(6)A2G2S2 1.54±0.63 1.55±0.21 4.23±1.00 2.39±0.32

113
From the results of F(6)A2G1, it is observed that the temporal accumulation or depletion of this
mono-galactosylated glycan is correlated to the corresponding reduction or increase of the fully-
galactosylated F(6)A2G2 since the former glycan is a substrate for the latter glycan.
The highest values of F(6)A2G2S1 and F(6)A2G2S2 were 7.54±0.28 and 6.15±0.63 for
Shifted-Temperature and, 5.76±0.15 and 4.23±1.00 for Reduced-Temperature, respectively. This
trend is because of the observed correlation of galactosylation and sialylation as observed in our
previous study (Chapter 4)(Aghamohseni et al. 2014). Figure 20 describes the time profiles of
glycosylation indices that were calculated according to equations 3.4 and 3.5 based on the RA%
values presented in Table 9.
Similar to 4 mM glutamine condition, for the Reduced-Temperature batch and zero initial
glutamine, the GI profile was different from the Control. On day 3, a lower level of GI equal to
0.61 was observed compared to 0.75 and 0.74 GI values for the Shifted-Temperature and the
Control batches, respectively. Then the level of GI increased to a value of 0.72 on day 5, almost
the same as for the Control batch. The low level of GI on day 3 for the Reduced-Temperature
batch can be again explained by the combination of lower growth with associated slower
synthesis of nucleotides and high mAb specific productivity with the resulting lower residence
time of proteins passing through the Golgi (Butler 2006a).
Reducing the temperature to 33 ˚C, for both the Shifted Temperature and Reduced
Temperature operations contributed to increase the sialylation levels specifically on the day 5 of
cultivation. In agreement with our previous observation in chapter 4 (Aghamohseni et al. 2014),

114
the low level of ammonia accumulation in the later days of the culture can be the reason for the
high levels of SI observed in these cases (Figure 15).

115
Figure 20, Galactosylation index, GI, profile under mild hypothermia and glutamine-
Free condition. Data points represent mean for duplicated experiments: Control at 37ºC,
Shifted-Temperature, and Reduced-Temperature.

116
In summary, the effect of mild-hypothermia conditions on the CHO cells’ growth, mAbs
productivity and glycosylation have been investigated by two strategies, a shifting of the
temperature on day 3 of the culture and operating the entire culture at a lower temperature of
33˚ C. These strategies were investigated for two different initial glutamine concentration, 4 mM
and 0 mM. The observed increase in mAb productivity was in agreement with previous studies
(Trummer et al. 2006; Vergara et al. 2014) with the exception of the study by Seo at al., (2013)
that reported a lack of effect of temperature (33˚C) on productivity for a rF2N78 cell line (Seo
et al. 2013).
The volumetric productivity𝑄𝑝 was found to increase by more than 80% as compared to the
control condition, during the exponential phase of growth for both the initial glutamine-Free and
4 mM glutamine conditions and by up to threefold increase during the post-exponential phase of
growth when the cells were cultivated at Reduced-Temperature conditions. 𝑄𝑣𝑚𝑎𝑥 also increased
by almost 100% for the Reduced-Temperature conditions for cultures initiated with zero or 4
mM glutamine concentrations. Applying mild hypothermia techniques in this research study was
also helpful for increasing cells’ viability but reduced the cells growth rate which is in
agreement with previous studies (Chen and Harcum 2006; Rodriguez et al. 2010; Vergara et al.
2014).
In terms of the effect of temperature on glycosylation we observed a different progression of
the galactosylation index (GI) during 9 days of cultivation for the Reduced-Temperature and
Shifted-Temperature compared to the Control batches for both 4 mM and 0 mM initial glutamine

117
levels. The GI Index reached a low value during the exponential phase of growth and its level
improved by day 5 of the culture. Our results revealed that reducing the optimum temperature for
cell growth reduces glycosylation. This reduction may be related to: i- a reduction in cell growth
that is associated to a decrease in nucleotides and nucleotide sugars synthesis and ii- an increase
in mAb specific productivity which results in a shorter residence time in the Golgi. This
correlation between temperature reduction and glycosylation is further discussed and modeled in
the mathematical modeling chapter (Chapter 6). It should also be noticed that several previous
studies did not reported any changes on the glycosylation profiles while cells were cultivated at
lower temperatures (Rodriguez et al. 2010; Taschwer et al. 2012; Seo et al. 2013).
118
Chapter 6
Mathematical Modeling
The dynamic model presented in the first section of this chapter is based on the modeling
section of an earlier work (Aghamohseni et al. 2014) and cited accordingly by permission of the
Journal of Biotechnology. The thesis author's specific contributions to the modeling section of
this publication were to perform the experimental design, running experiments and analysis, and
to provide all the data used for the dynamic models. In addition, she carried out the metabolic
flux analysis, macro reaction implementation and formulation of the model structure according
to the experimental results. Then, she collaborated with Kaveh Ohadi, one of the co-authors of
the publication above on the coding of the mathematical equations and optimization of the
dynamic model in the MATLAB environment.

119
6.1 Introduction
A dynamic model for describing the evolution of extracellular metabolites’ concentrations
with time during a batch culture was formulated based on a metabolic flux analysis (MFA)
approach developed by our research group (Naderi et al. 2011). The objectives for developing a
model to describe the extracellular metabolites were: i) to systematically understand and quantify
the metabolic behavior of nutrients and by products for different experimental conditions, ii) to
correlate cell growth and death with the metabolites’ dynamics and iii) to ultimately correlate the
evolution of extracellular metabolites to the dynamic evolution of glycans. Figure 21 describes
the network of reactions considered for the MFA. This network serves as the basis for the
formulation of the dynamic balances for extracellular metabolites. Fluxes were calculated from
the changes with respect to time of the extracellular metabolites’ concentrations, as per the
method given by Naderi et al., 2011. In this calculation, it was assumed that the intermediates of
glycolysis and the TCA cycle do not accumulate over time (Aghamohseni et al. 2014).
From the calculated flux distribution, a set of macro-reactions was obtained that relates the
concentrations of nutrients to those of by-products. Based on these reactions, a set of dynamic
mass balances relating the most significant nutrients to by-products were formulated using the
Michaelis-Menten kinetics for each reaction. A biomass balance was formulated based on
growth and death rates and accounts separately for the populations of growing and non-growing
cells (Aghamohseni et al. 2014). Further details about the model are given in the “Modeling of

120
the Extracellular Environment”, section 6.2.1 of this chapter. The impacts of Reduced-pH and
Reduced-Temperature were also modeled through the resulting changes in growth rate. The
dynamic equations updated for describing the effect of pH and temperature are presented in
section 6.2.2 of this chapter.
To describe the interrelation between the extracellular environment and the glycosylation
reactions we initially examined a rigorous mechanistic model in a work co-authored with (Ohadi
et al. 2013). However, it was found that this model is very difficult to calibrate due to the large
number of model parameters and the relative scarcity of data. Instead, we proposed in the second
part of this chapter a novel semi-empirical model to connect extracellular properties of cell
metabolism to the intracellular process of mAbs’ glycosylation. This semi-empirical model is
composed of two different equations: i) an ordinary differential equation describing a lump sum
of the nucleotides’ sugars as a function of extracellular glucose and glutamine concentration and,
specific growth rates and ii) a steady state equation describing the correlation between the
galactosylation index (GI) equation with the nucleotides’ sugars levels calculated in the part I of
the model, the specific mAb production rates and, the extracellular glucose concentrations. The
dependency of the nucleotide sugar model and GI model equations was based on our
understanding of the process and the experimental data collected during the current research
study and previously published studies.
The semi-empirical model proposed above was found to be easy to calibrate as compared to
the rigorous mechanistic model mentioned above. As such it can serve to efficiently elucidate

121
correlations between extracellular properties and glycosylation while avoiding the very
challenging parameter estimation task required for a more rigorous model (Ohadi et al. 2013).
The results obtained with the semi-empirical model are presented in Section 6.3 of this chapter
and compared to experimental data.
6.2 Modeling of the Extracellular Environment
6.2.1 Metabolic Flux Analysis
Metabolic flux analysis (MFA) is a method used for determining intracellular metabolic
fluxes in live cells (Sanfeliu and Stephanopoulos 1999; Ahn and Antoniewicz 2012). MFA
provides fundamental understanding about the metabolic pathways involved in the overall
cellular metabolism by quantifying fluxes from measured metabolites’ production or
consumption rates. The flux analysis is based on the steady-state mass balance of intracellular
species (Gao, 2007).
A metabolic flux analysis has been implemented for the current study, based on the flux
values for the CHO DUXB and the network presented in Figure 21. This metabolic network
includes the four metabolic pathways of interest here, glycolysis, pentose phosphate, TCA cycle
and amino acid metabolism, which are the main carbon consuming pathways and are responsible
for energy and biomass production. With the exception of tryptophan, which has insignificant

122
involvement in protein and energy production (Gambhir et al. 2003), all amino acids are
involved in the analysis. Reversible reactions were accounted for by assuming in the flux
calculations that these reactions proceed in both directions for the conversions of pyruvate to
oxalacetate, α-ketoglutarate to glutamate, and glutamate to glutamine, i.e., reactions 7, 25, and
26. The network comprises 30 metabolites and 37 intercellular fluxes. The corresponding set of
stoichiometric equations is summarized in Appendix B.
The calculation of the fluxes was performed based on experimentally measured consumption
rates of nutrients and production rates of by-products. Fluxes were calculated separately for the
exponential and post-exponential phases where the time corresponding to the peak in cell density
was used as the boundary between the two phases. To calculate the fluxes, average consumption
and production rates were calculated from experimental data collected during the exponential or
post-exponential phases.
The entire set of mass balance equations, which were obtained based on the stoichiometric
reactions (F), can be formulated in the following matrix equality:
JA R (6-1)
where J= [ji] is a vector of unknown fluxes, and A= [αim] is the stoichiometric matrix of
reactions in which each entry αim is the stoichiometric coefficient for metabolite m={1,…,nm}
in reaction i={1,…,ni}. The fluxes are expressed in units of mol of the corresponding metabolite
per hour and per mol of biomass.

123
Figure 21, The complete reaction network utilized for metabolic flux analysis (Gao et
al. 2007).
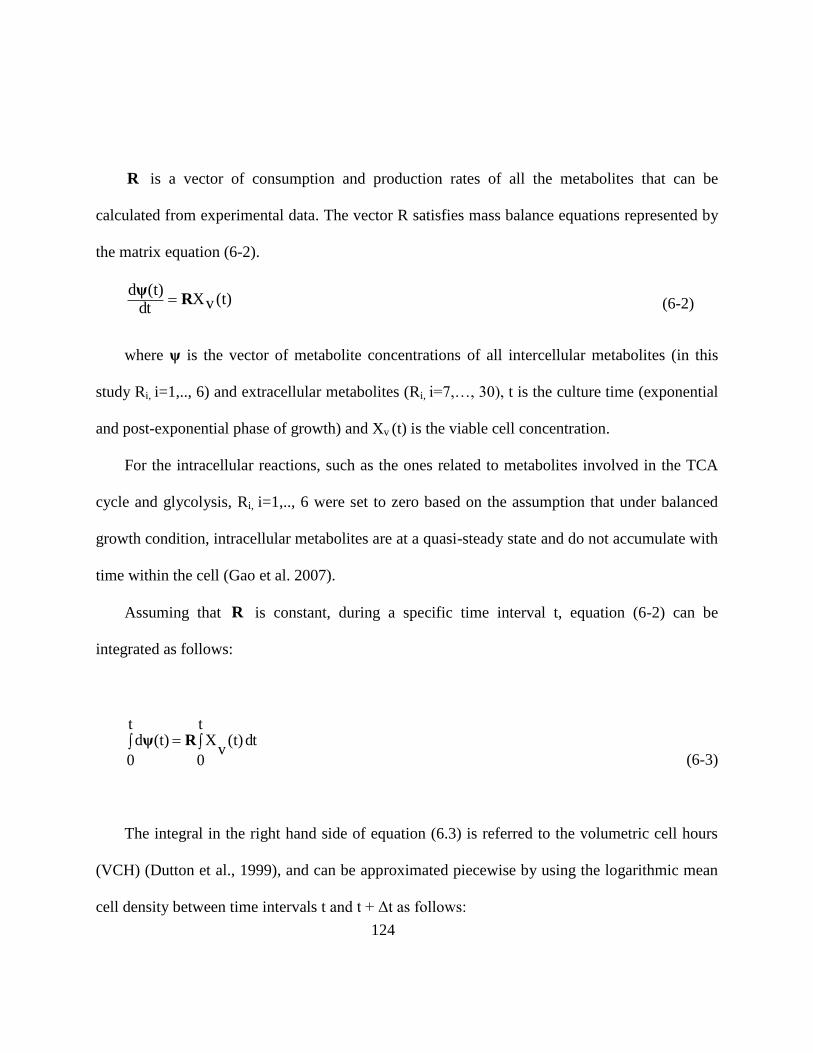
124
R is a vector of consumption and production rates of all the metabolites that can be
calculated from experimental data. The vector R satisfies mass balance equations represented by
the matrix equation (6-2).
(t)vXdt
(t)dR
ψ (6-2)
where ψ is the vector of metabolite concentrations of all intercellular metabolites (in this
study Ri, i=1,.., 6) and extracellular metabolites (Ri, i=7,…, 30), t is the culture time (exponential
and post-exponential phase of growth) and Xv (t) is the viable cell concentration.
For the intracellular reactions, such as the ones related to metabolites involved in the TCA
cycle and glycolysis, Ri, i=1,.., 6 were set to zero based on the assumption that under balanced
growth condition, intracellular metabolites are at a quasi-steady state and do not accumulate with
time within the cell (Gao et al. 2007).
Assuming that R is constant, during a specific time interval t, equation (6-2) can be
integrated as follows:
dtt
0
t
0
(t)v
X(t)d Rψ
(6-3)
The integral in the right hand side of equation (6.3) is referred to the volumetric cell hours
(VCH) (Dutton et al., 1999), and can be approximated piecewise by using the logarithmic mean
cell density between time intervals t and t + Δt as follows:

125
ttΔttt
t
0
tv
XΔtt
vX
ln
tv
X
Δttv
X
VCH
(6-4)
The system of equations defined by the matrix equality (6-1) for the network considered in
this study was found to be underdetermined, i.e. the number of unknowns is larger than the
number of equations. To solve the fluxes a constrained optimization approach was applied
(Naderi et al. 2011). Only positive values for each flux, corresponding to the directions assumed
for the reactions in the network, were considered as a set of constraints. A quadratic
programming (using the MATLAB function qp ) approach was used to minimize the differences
between the measured and modeled rates as follows:
J)A( TJ)A-( RRMin (6-5)
Subjected to …
j>0
where, the vector R corresponds to the measured consumption or production rates, whereas the
vector obtained from the product JA corresponds to the corresponding predicted rates.

126
Figure 22 presents the flux distribution of a control batch (4 mM Gln, 25 mM Glc) during
the exponential and post-exponential phases of growth. It should be noticed that the MFA was
conducted in this work with the purpose of identifying the significant metabolic reaction and
based on those, to formulate a simplified dynamic mass balances’ model. Then, to achieve this
objective, the insignificant fluxes contributing less than 0.1% of total flux were omitted from the
network. This simplification does not imply that the eliminated fluxes and corresponding amino
acids are not necessary for growth but rather that they are not major contributors to the
requirements of the cells in terms of energy and biomass formation. As a result
fluxes ji,, i={1,2,3,4,5,6,7,8,23,24,25,26,27,28,30,31,32,33,34}
were found to be significant, and the rest of the fluxes were eliminated from the metabolic
network. The simplified network for CHO DUXB is shown in Figure 23.

127
Figure 22, Distribution of fluxes for a batch culture with initial 4 mM glutamine and 25
mM glucose for exponential (black bars) and post-exponential (white bars) phases of
growth (Aghamohseni et al. 2014)
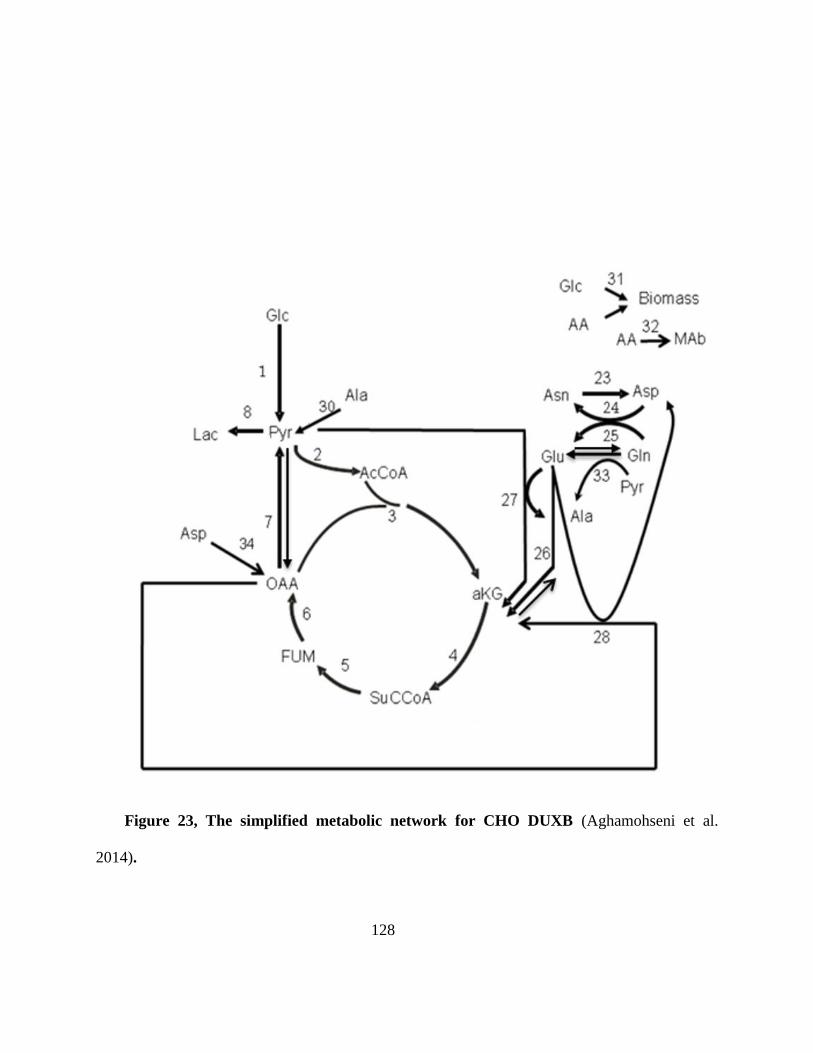
128
Figure 23, The simplified metabolic network for CHO DUXB (Aghamohseni et al.
2014).

129
6.2.2 Dynamic Modeling
Glucose and Glutamine Depletion effects
The dynamic model was formulated based on MFA analysis combined with data collected from
batches cultivated at different initial levels of glutamine and glucose. Based on the reduced
network shown in (Figure 23) and using the quasi-steady assumption for the intracellular species
we obtain a set of macro-reactions that directly relate substrates to the products. The resulting 8
macro-reactions are listed in Table 10.
Table 10, Essential macro-reactions of extracellular metabolites
E1 Glc → 2Lac
E2 Glc → 6CO2
E3 Asn → Asp + NH3
E4 Ala → NH3 + 3 CO2
E5 Gln + 0.5 Glc→ Asp+Ala+ Co2
E6 Asp→ NH3 + 4 CO2
E7 Glc+2 NH3→2CO2 + Gln
E8 Gln+Asp → Asn+Ala+2Co2

130
A dynamic model was developed for cell density that discriminates between viable and dead
cell populations. In this model the viable biomass population was assumed to consist of both
growing (fgr) and non-growing (1 – fgr) fractions as described in (Aghamohseni et al. 2014).
Based on the observation that growth stopped when glucose was depleted, the fgr was assumed
to be correlated to the glucose concentration and described accordingly by equation 6-6.
.
12
11][1 KGlc
fgrK
dt
dfgr
(6-6)
According to the experimental results, the viable cell population was dependent on glucose
and glutamine concentrations. The ammonia [Amm] and lactate [Lac] concentrations in the
denominator of the cell growth term (the third and fourth terms in the right hand side of equation
6-7), reflect the fact that ammonia and lactate accumulation in the culture were found to be
inhibitors of cell growth (Naderi et al., 2011; Quek et al., 2010). Since the level of ammonia
could not explain by itself the rate of death, an additional term was used to represent the death
rate which is inversely proportional to glucose level. Increasing ammonia concentration and
glucose starvation induced the rate of dead cells in agreement with previously reported studies
(Ahn & Antoniewicz, 2012; Zustiak, et al., 2008). This dependency of death on glucose
concentration was hypothesized to be caused by autophagic death where the cell consumes itself
in the absence of nutrients (Kim et al., 2013; Zustiak et al., 2008). Equations 6-7 and 6-8

131
describe the dynamic evolution of viable cells and dead cells respectively. The fifth parameter
(K28) of equation 6-8 was added to account for cell lysis during the cell cultivation.
][
][1
11.
][1
1
][1
1
][
][
][
][..
25
24
2723
2621
max
Glc
K
AmmK
Xfgrk
KLac
KAmmGlnK
Gln
GlcK
GlcXfgr
dt
dX
nvd
vv
(6-7)
d
nvd
d XkGlc
K
AmmK
Xfgrkdt
dX28
25
24 ][)(1
1.1.
(6-8)
Dynamic models for nutrients and byproducts were developed according to the macro-
reactions listed in Table 10 as follows:
vv XKGlcK
GlcK
GlnKGlcK
GlnGlcKX
dt
Glcd35
34
33
3632
31
][
][
][][
]][[][
(6-9)
][][
]][[][
4342
41GlnKGlcK
GlnGlcXK
dt
Glndv (6-10)
dt
GlcdX
KGlc
GlcK
dt
Lacdv
][][
52
51
(6-11)
][
][][
62
61AsnK
AsnXK
dt
Asndv
(6-12)

132
][][
]][[
][
][
][
][][
6564
63
72
71
62
61
GlnKGlcK
GlnGlcK
AspK
AspK
AsnK
AsnKX
dt
Aspdv (6-13)
][
][
][][
]][[][
82
81
6564
65
AlaK
AlaK
GlnKGlcK
GlnGlcKX
dt
Aladv (6-14)
][
][
][
][
][
][][][
82
81
72
71
62
61
9291AlaK
AlaK
AspK
AspK
AsnK
AsnKXK
dt
GlndK
dt
Ammdv (6-15)
][102101 GlcKKXdt
dmAbv (6-16)
Lactate production (equation 6-9) was assumed to be proportional to glucose consumption
pre-multiplied by a yield where the latter was used to account for deviations from the assumption
of zero accumulation of intermediates in glycolysis. Following the reactions listed in Table 10,
ammonia accumulation was correlated to the metabolism of glutamine, asparagine, aspartate and
alanine (equation 6-15).
Based on the experimental data, glucose was found to be positively correlated with the Mab
production, as described in equation 6-16.
The parameters of the eleven ordinary differential equations (ODEs) (equations 6-6 to 6-16)
were optimized by minimizing the sum of squared error (SSE) between experimental and model
predicted results. The data of a batch culture initiated with 4 mM of glutamine (presented in
Chapter 4) was used for calibration of parameters. The parameter values resulting from
calibration of the model are provided in Appendix C.

133
The prediction ability of the model was tested with data obtained for the cultures with 0 and
8 mM initial glutamine levels. These data were not used to calibrate the model. The comparison
between experiments and model predictions are shown in Figure 24. Acceptable agreement was
obtained between the predictions, thus corroborating different important experimental
observations: i) glutamine and glucose are co-metabolized during the culture, ii) Cell death
depends on both ammonia and glucose, iii) Mab productivity is correlated with glucose and iv)
Mab is produced by both growing and non-growing cells (Aghamohseni et al. 2014).

134
Figure 24, Results of model validation with 0 mM Gln, 4 mM Gln, and 8 mM
Gln conditions. The data points present real data, and dashed lines present the model
prediction. A) Total viable cell concentration (106 cells/ml); B) Glc concentration (mM); C)
ammonia concentration (mM); D) mAb concentration (mg/l).

135
pH and Temperature Effect
The experimental studies describing the impact of lowering pH and temperature on cell
growth and protein production have been presented in Chapter 4 and Chapter 5. In this chapter
the mathematical model presented in section 6.2.2 is modified to account for these effects.
Although experimental studies regarding the effect of pH and temperature on cell growth and
protein productivity have been previously reported (Ahn et al., 2008; Kaufmann et al., 2001;
Rodriguez et al., 2010; Yoon et al., 2006), mathematical models describing these effects have not
been presented as yet.
To develop a mathematical model that accounts for the effect of pH, batches initiated with
different concentrations of glutamine for different pH conditions were monitored daily and
regression equations representing the evolution of pH with time were obtained. In the control
batch pH was not externally manipulated and pH levels never drop below a level of 6.9±0.05.
For the rest of the batches, pH was manipulated by the addition of an acid to a level of 6.8±0.05.
This reduction was done, as described in Chapter 3, according to either one of two strategies: i)
the pH was reduced from the beginning and from the entire duration of the culture (Reduced-pH
strategy) or ii) the pH lowered after the completion of the exponential growth phase (Shifted pH
strategy). Our experiments and previous experimental studies (Seo et al. 2013) indicated that
lowering of pH mostly impacts the cell growth. Accordingly the dependency of growing cells
with respect to pH was formulated by the combination of equations 6-17 and 6-18. These
equations contain two new parameters (k29 and k30), and after calibration with data they

136
successfully accommodated the impact of pH on the fraction of growing cells. The parameters of
this equation were calibrated together with the equations presented above.
30
29
1 )9.6)((exp1
12
k
tpHk
p
(6-17)
12
111][1 KGlc
fgrKp
dt
dfgr
(6-18)
In addition to its effect on cell growth, pH was also found to affect the rate of glucose
depletion (Aghamohseni et al. 2014) in agreement with previous studies (Trummer et al. 2006;
Seo et al. 2013). Initially it was hypothesized that this slower depletion of glucose is caused by a
lower growth resulting from the reduction in pH. However, it was found that the reduction in
growth alone could not explain the observed glucose depletion rate. Then, it was further argued
that the lactic acid used for pH adjustment will indirectly affect the rate of glucose depletion
since it may serve as an additional source of carbon. Accordingly the glucose and lactate
balances were adjusted as follows:
vvv FXKXK
GlcK
GlcK
GlnKGlcK
GlnGlcKX
dt
Glcd3735
34
33
3632
31
][
][
][][
]][[][
(6-19)
FKdt
GlcdX
KGlc
GlcK
dt
Lacdv 38
52
51 ][][
(6-20)
in which F represents moles of lactic acid added per volume of culture at 24-hour intervals for
pH adjustment, and K37 and K38 were new parameters added for calibration of the glucose and

137
lactate profiles . FXK37 , in the right hand side of the glucose balance represents a possible
consumption of lactic acid by CHO as a carbon source. The remaining seven dynamic ODE
equations were left unchanged.
The experiments on the effects of mild-hypothermia described in Chapter 5, indicated that cell
cultivation at a lower temperature of 33ºC resulted in reduced cell growth, improved cell
viability and increased mAb productivity (Rodriguez et al. 2010; Vergara et al. 2014). Thus, an
Arrhenius-type dependence, equation 6-21, was introduced into the viable cells balance to
describe the effect of temperature on growth (Mensonides, et al., 2014). The viable cell dynamic
balance equations consist of both growing and non-growing cells and temperature was assumed
to affect both groups by decreasing the specific growth rate of viable cells while extending their
life span. Thus, in equation 6-22, the coefficients 1Q and 2Q were calibrated to capture the
effects of temperature on decreasing cell growth rates and cell death rates respectively.
mAb production was also found to be affected by temperature and therefore the corresponding
balance was adjusted by a pre-multiplying parameter to capture this effect. The modified
equations of Xv and mAb are as follows:
RT
EAQ
exp. (6-21)

138
][
][1
11.
][1
1
][1
1
][
][
][
][..
25
24
2
2723
2621
max1
Glc
K
AmmK
XfgrkQ
KLac
KAmmGlnK
Gln
GlcK
GlcXfgrQ
dt
dX
nvd
v
v
(6-22)
.
][1021013 GlcKKXQdt
dMabv (6-23)
Equation 6-23 presents the effect of temperature on the mAb productivity at mild-hypothermia
conditions as it was observed that mild hypothermia improved the specific mAb productivity
consistently for over 9 days of cultivation. The remaining eight ODE equations were left
unchanged and the parameters of the model were re-optimized. The optimized parameters are
shown in Appendix C.
The prediction ability of the modified dynamic model was tested with data obtained from the
cultures with 4 Mm glutamine with the Reduced-pH strategy, 4 and 0 mM glutamine with the
Reduced-Temperature strategy and, 4 and 0 mM glutamine with the Shifted-Temperature
strategy. These set of experiments were not used to calibrate the model. The compared
experiments and model predictions are presented in Figure 25, Figure 26, and Figure 27
indicating good agreement with the experimental data. The differences between mAb

139
measurements and their corresponding predictions can be partially explained by the occurrence
of an approximate 20% error in the ELISA analysis.

140
Figure 25, Results of dynamic model validation with initial 4 mM and Reduced-pH
experiment. The data points present real data, and dashed lines present the model
prediction. A) Total viable cell concentration (106 cells/ml), B) Mab concentration (mg/l).

141
Figure 26, Results of dynamic model calibration with initial 4 mM glutamine and
model prediction for 4mM glutamine and Reduced-Temperature and Shifted-Temperature
experiments. The data points present real data, and dashed lines present the model
prediction. A) Total viable cell concentration (106 cells/ml), B) mAb concentration (mg/l).

142
Figure 27, Results of dynamic model calibration with initial 4 mM glutamine and
model prediction for 0 mM glutamine and Reduced-Temperature and Shifted-
Temperature experiments. The data points present real data, and dashed lines present the
model prediction. A) Total viable cell concentration (106 cells/ml), B) mAb concentration
(mg/l).

143
6.3 Modeling of the Glycosylation Process
The glycan profile of mAb expressed by a particular cell line in a culture may be affected by
different factors such as the cells’ environmental conditions, the method of culture, and the host
cell line (Restelli and Butler 2002; Hossler 2012). Thus, it is necessary to identify the culture
conditions that control the bioprocess for synthesizing mAbs with the desired spectrum of
glycans. An appropriate model with the capability of correlating the mAb glycan profile to the
cell culture conditions can be useful for bioprocess design and control, culture media
formulation, and possible genetic engineering strategies (Del Val, et al., 2011).
In view of the above, the purpose of the present section is to develop a systematic approach for
manipulating cell culture conditions so as to produce a desired glycan profile. To achieve this
goal, a mathematical modeling approach was proposed that allowed correlating the extracellular
culture conditions to the resulting galactosylation of the antibody. This model can thus serve to
control the glycosylation process.
Although several studies have been conducted to evaluate the effects of culture conditions on
glycan profiles, including the impacts of particular nutrient concentrations such as glucose,
glutamine, and galactose (Burleigh et al. 2011; Taschwer et al. 2012; Grainger and James 2013;
Liu et al. 2014), culture supplementation and inhibitors such as ammonia (Yang and Butler 2002;
Chen and Harcum 2006; Crowell et al. 2007), nucleotide sugar feeding (Gu and Wang 1998;
Wong et al. 2010) and, environmental pH and temperature alternation (Yoon et al. 2005; Ahn et

144
al. 2008; Rodriguez et al. 2010; Seo et al. 2013), studies exploring how the combination of these
factors affects the glycosylation are not numerous. Models reported in the literature mostly
focused on the glycosylation process occurring in the Golgi (Hossler et al., 2006; Del Val et al.,
2011) but did not discuss the interconnection between the culture conditions and the
glycosylation of the proteins. For example, Del Val et al., (2011) presented a model describing
the N-glycosylation process occurring within the Golgi apparatus while considering the transport
of nucleotide sugar donors from the cytosol to the Golgi lumen. However, this model was not
coupled to the culture conditions (Del Val et al., 2011) while such coupling is essential for model
based control because the process can be manipulated solely through these conditions.
Association of extracellular conditions to the intracellular glycosylation process has been
implemented in our group based on a developed comprehensive matrix of reactions for the
glycosylation process in mammalian cells (Hossler et al. 2006). This novel dynamic consists
(Figure 28) of three main sub-models: i) a metabolic flux analysis (MFA) based dynamic
model, ii) a nucleotide sugars model and iii) a glycosylation model in the Golgi apparatus (Ohadi
et al. 2013). The predicted results of temporal glycosylation indices were in good agreement with
the experimental glycosylation indices of mAbs produced by CHO cells under batch condition
with two initial glutamine concentrations. However, this model is of very high dimensions
involving over 100 differential equations and a large number of calibration parameters thus
making it difficult to fit for a wide range of operating conditions. Therefore, this research study
is being further investigated in our group.

145
Figure 28, Schematic representation of the comprehensive model: Metabolic Flux
Analysis (left), Nucleotide Sugar (center), Glycosylation based on Golgi Maturation (right)
(Ohadi et al. 2013).
More recently, Jedrzejewki et al., (2014), presented a model frame work connecting the
extracellular conditions to the intracellular nucleotide sugar donors and glycosylation process for
a mAb produced by a hybridoma cell line (Jedrzejewski et al. 2014). However, the model of
Jedrzejewki et al was only calibrated to experiments of one single batch and its prediction ability
has not been investigated.
Although, the mechanistic models of (Ohadi et al. 2013) and (Jedrzejewski et al. 2014) are
rigorous but require a very large number of parameters thus requiring large data sets for
calibration and making it difficult to accurately estimate the parameters. The other challenging
aspect of this type of modeling is that, it requires measurements of intracellular nucleotides and
nucleotide sugars and those measurements require collecting large volumes of cell culture

146
supernatants that impact the evolution of the culture. Also, the nucleotide sugars data available in
this work have been found to be very noisy. To circumvent the problems associated to the
mechanistic models, we propose in the next section a semi-empirical model that can still serve to
correlate the extracellular culture conditions and glycosylation while avoiding the very
challenging parameter estimation task required for a more rigorous model.
6.3.1 Glycosylation Model
Mathematical Model Development
A semi-empirical glycosylation model was developed to explain the experimental observations
presented in Chapters 4 and 5 in terms of correlations between extracellular culture conditions
and the level of mAb galactosylation. Although the current model cannot predict the level of
sialylation, it can be expanded in future to accomplish this goal. The proposed semi-empirical
model consists of two parts: i) a dynamic balance of a lumped quantity representing the total
nucleotide sugar intracellular concentration ii) a static correlation to predict the galactosylation
index as a function of parameters that are expected to affect this index such as the nucleotides
sugars levels, the specific antibody productivity and the glucose level. These two components of
the model are given by equations 6-24 and 6-25 respectively:

147
][ln1)(3
2
1 SugaGGlca
Glcta
dt
dSug qp
m
(6-24)
)))((
())((
1
654SugaGlca
SugGlc
atSGI
r
p
inst
(6-25)
where Sug is the lumped concentration of all types of nucleotide as nucleotide sugars present
within viable cells at one-day intervals. instGI represents a galactosylation index resulting from
the galactosylation process occurring within the Golgi at a particular time interval. These
equations only predict the GI for a specific time instance but do not consider the accumulation of
glycan concentration along the culture cultivation. Then, the average galactosylation index of the
mAb present in the batch culture at any given time requires the calculation of a cumulative
average based on the productivity and the instantaneous GI values given by 6-25 as described
later in this section.
The Nucleotide sugar model, equation 6-24, was assumed to be a function of extracellular
glucose and glutamine concentrations, and the specific growth of CHO-DUXB cells cultivated at
different culture condition. The effects of glucose availability on the nucleotide sugar pools have
been reported previously (Grammatikos,et al., 1998; Jedrzejewski et al., 2014; Liu et al., 2014;
Valley et al., 1999). In addition, it has been found that glucose and glutamine are co-metabolites
for the current cell line (Ohadi et al. 2013; Aghamohseni et al. 2014). The assumed dependency
of the nucleotides sugars synthesis term on growth rate is based on the fact that these sugars are

148
synthesized from nucleotides which serve as substrates for nucleic acids’ that are needed for
biomass formation (Jedrzejewski et al. 2014).
equation 6-25 is dependent on the lumped nucleotides’ sugar level solved by equation 6-24,
specific mAb production rates and extracellular glucose concentrations. The dependency of
galactosylation on nucleotides sugars is evident since the latter are substrates for all the
glycosylation reactions (Gu and Wang 1998; Valley et al. 1999; Wong et al. 2010; Ohadi et al.
2013). The assumed effect of specific productivity on galactosylation is based on the fact that the
productivity will determine the residence time of proteins within the Golgi thus determining the
extent of glycosylation. A large residence time is expected to result in a high glycosylation. For
example, we observed that at lower temperature conditions the specific mAb productivity was
consistently higher for the entire duration of the batch as compared to the control culture
(Chapter 5) while the galactosylation was lower. This observation is in agreement with the
assumption that a higher productivity implies a smaller residence time of protein through the
Golgi complex and reduced exposure time to the galactosyltransferases present in the Golgi
complex (Wang et al. 1991; Butler 2006a). The third parameter on the instGI model is [Glc]. In
our earlier study we have demonstrated that higher availability of glucose in the batches initiated
with lower pH and glutamine concentrations resulted in the availability of glucose for longer
time periods and further glycosylation (Ohadi et al. 2013; Aghamohseni et al. 2014). The glucose
availability also has been reported to affect the site occupancy or macro-heterogeneity of the
glycan profile through alteration of lipid-linked oligosaccharides (Rearick et al. 1981; Liu et al.

149
2014). As glucose itself is involved as a substrate in the synthesis of nucleotide and nucleotide
sugars, a Michaelis-Menten expression involving glucose was assumed for this reaction.
As mentioned, equation 6-25, depict the instantaneous GI level in one individual cell while the
GI measurement of a supernatant sample will reflect a cumulative value of the glycosylated
mAbs cultivated consistently until the time of sample analysis. In order to convert the predicted
value of instGI into a cumulative
AccGI , the following equation is used:
t
t
inst
Acc
dtmAb
dtGImAb
GI
0
*
0
*
][
][ (6-26)
in which mAb is the concentration of mAb produced in one day interval. The parameters of
the above two equations were optimized by minimizing the sum of squared error (SSE) between
experimental and model predicted results. The data of batch cultures initiated with 4 mM and 0
mM glutamine for control conditions (normal pH conditions and 37˚C), for reduced pH and for
reduced temperature were used for calibration of parameters. In addition, the initial value for GI
and Sug at time=0 was also estimated by the two model-equations. For brevity, the parameter
values are provided in the Appendix D.
Figure 29, presents the value of GI predicted by the index model in comparison with the
experimental data. The developed index model was able to successfully capture the
galactosylation index profile during the course of the culture. The maximal errors were of the

150
order of 10%. In addition, this model covered a variety of culture conditions, glutamine effect,
pH effect and temperature effect. Some of the discrepancies between data and model predictions
under mild-hypothermia conditions can be explained by the fact that for simplicity the effect of
lower temperature on expression level of glycosyltransferase enzymes was not considered in this
approach (Sou et al. 2014).
In summary, our approach for developing a semi-imperial model was successful enough to
correlate the effects of different culture condition and galactosylation indices. This mathematical
frame work can be extended for other conditions as well for control the glycosylation process.

151
Figure 29, Profile of experimental and predicted GI at different culture conditions.
Data points presents experimental data and dash lines display model observations ,
A) 4 mM glutamine without pH and temperature; B) 0 mM Gln without pH and
temperature; C) 8 mM glutamine without pH and temperature D) 4 mM glutamine and
Reduced-pH to 6.8 ; E) 4 mM glutamine and Shifted-Temperature to 33˚C ; F) 4 mM
glutamine and Reduced-Temperature to 33˚C.

152
Chapter 7
Conclusion and Future Work Suggestions
7.1 Conclusion
Monoclonal antibodies (mAbs) are one of the key therapeutic glycoprotein products in the
pharmaceutical industry. However, production of these glycoproteins is associated with many
challenges in terms of productivity and quality. The glycan conformations are important quality-
measurements because they can influence the biological characteristics of mAb including
secretion, solubility, receptor recognition, antigenicity, bioactivity and pharmacokinetics. The
post translational process of glycosylation can be affected by many environmental conditions and
it can be quantified in terms of site–occupancy (macro-heterogeneity) or in the structure of added
glycans (micro-heterogeneity).
The goal of this research was to investigate the impacts of different cell culture parameters
on the glycosylation pattern of a novel mAb, Eg2-hFc, produced by a newly developed cell line,
CHO DUXB. Then, based on the experimental observations, the goal was extended to develop a
mathematical model that could serve in the future to control and optimize the glycosylation
process. It was argued that a model relating culture conditions including essential nutrient levels,

153
byproduct concentration as well as pH and temperature conditions to the resulting glycoprofiles,
may serve in the future to calculate a set of operating conditions to obtain a desired glycan
distribution. The following discussion summarizes the challenges and approaches that have been
pursued to establish connections between the cell metabolism and the glycosylation processes to
provide a systematic approach for controlling glycan profiles.
The thesis is organized into 7 Chapters. Chapters 1, 2 and 3 present and introduction to the
problem, a literature review and the materials and methods used in the experimental and
modeling studies.
In Chapter 4 the effects of glucose, glutamine, ammonia and pH levels on growth, mAb
productivity and the glycans’ evolutions were studied. Cells were cultivated at 0, 2, 4 and, 8 mM
of initial of glutamine and 25 mM of glucose. We found that increasing the initial level of
glutamine from 0 to 8 mM glutamine for a constant level of glucose, resulted in higher
consumption rate of glucose and consequently lower galactosylation levels. The faster depletion
of glucose was associated to a co-metabolic consumption of glutamine and glucose mostly
related to the requirement of both metabolites for biomass formation. It has been previously
reported that a reduced level of intracellular uridine triphosphate N-Acetyl glucosamine (UDP-
GlcNAc) is the main reason for the lower level of glycosylation in both glucose and glutamine
depleted media (Nyberg et al. 1999). Although, increasing the level of glutamine from 0 mM to
4 mM resulted in a lower level of GI, it improved the cell growth and a higher peak of cell
density was observed when cells were cultured with 4 mM initial glutamine. Increasing the

154
initial glutamine concentration to 8 mM was found to slightly inhibit cell growth possibly due to
the high concentration of ammonia resulting from glutamine conversion. In addition, since the
mAb specific productivity was found to be correlated with growth, an increase of initial
glutamine from 0 mM to 4 mM resulted in more mAb but lower GI. Hence, there was a clear
tradeoff between increasing mAb productivity versus reaching a higher level of galactosylation
which is often preferred in mAbs’ therapeutic applications.
The sialic acid content of N-glycans is also important in the regulation of anti-inflammatory
immune response of IgG (Anthony et al. 2008) and improvement of the serum half-life of
therapeutic proteins (Butler 2006b). Thus, we investigated ways to affect the sialylation
especially through the concentration of ammonia. The experiments showed that higher ammonia
levels resulting from cultures initiated with higher glutamine concentrations led to less
galactosylation and less sialylation. In addition, since some of the experiments with different
levels of ammonia resulted in similar levels of pH, it was possible to discern between the effects
of pH and ammonia on sialylation. Previous reported studies in the literature have hypothesized
that the mechanisms by which pH and ammonia affect sialylation are indeed different. For
example, it was reported that ammonia is correlated with the synthesis of UDP–GlcNAc which
may in turn inhibit sialic acid transport (Valley et al. 1999). To further investigate the individual
effects of ammonia and pH and their possible correlation to the glycosylation process, we
designed and conducted a series of experiments and analyzed the experimental results by a
computer code (GLYCOVIZ) that calculates the level of reactions for all possible glycosylation

155
reactions occurring within the Golgi. The experiments consisted in adding a lactic acid solution
for lowering pH to a level of 6.8±0.05 for batches started with 4 mM glutamine and 25 mM
glucose (Chapter 3). Then, the GLYCOVIS (Hossler et al. 2006) software was used to elucidate
the individual mechanisms by which ammonia and pH affect the galactosylation and sialylation
levels. Cultivation of cells at lower pH showed that the effect of pH was independent of changes
in ammonia. pH reduction increased the GI and SI levels but at the cost of a reduction in Mab
productivity. Then, once again there is a tradeoff between productivity and the desired
glycosylation levels. Based on the GLYCOVIS analysis, pH is likely to impact sialylation
through the activity of the sialyltransferases. Thus, besides availability of glucose and glutamine,
ammonia and pH play crucial roles on GI and SI evolution for this specific cell line.
In Chapter 5, we examined the impacts of mild-hypothermia on cell growth, metabolic
profile, mAb production and, mAb glycosylation process. It was initially hypothesized that
reducing the temperature will slow down the passage of mAbs through the Golgi thus increasing
glycosylation levels but without affecting the overall batch productivity of mAb. In that way one
could improve both mAb productivity and glycosylation levels in contrast with manipulation of
nutrients or pH that resulted, as shown in Chapter 4, in a trade-off between productivity and
glycosylation. Two strategies were applied to investigate the effect of the lower temperature of
33˚C, i) cultivation cells at 33˚C consistently for 10 days ii) shifting temperature from the
optimum of 37˚C to 33˚C on day 3 of culture when cells were still in their exponential phase of
their growth according to the explained method in Chapter 3. Batches with 4 mM and 0 mM

156
initial glutamine concentrations were selected for investigating temperature impacts as we
observed in the studies summarized in Chapter 4 that high level of GI and SI occurred for 0 mM
initial glutamine whereas high levels of mAb and cell population occurred at 4 mM glutamine. It
was found from these experiments that reducing the temperature of the culture to 33˚C, either
from the beginning (Reduced Temperature strategy) or after the exponential phase of growth
(Shifted Temperature strategy) and regardless of the initial level of glutamine, had a significant
effect on cell growth, mAb productivity and glycosylation profile. Cell growth was, as expected,
lower at 33˚C while cell viability remained high for a longer time of cell cultivation. In contrast
to other reports regarding the increase (Yoon et al. 2003) or the decrease (Sou et al. 2014) of
glucose metabolism at lower temperature, the specific glucose consumption rate did not change
in our experiments. In the other word, the yield of cell formation per glucose consumption during
the exponential phase of growth was equal to 0.12 (106 cells/mM Glc) for all batches. However,
the yield of cell formation per glutamine consumption in the exponential phase of growth
decreased under hypothermia conditions. This value was 1.02 (106 cells/mM Gln) for control
condition, 0.68 (106 cells/mM Glc) for Shifted-Temperature, and 0.48 (10
6 cells/mM Glc) for
Reduced-Temperature respectively. Thus, glutamine appears to be utilized for protein production
rather than for cell growth at lower temperatures as we found significant improvements in mAb
production. So, the requirements of glutamine and glucose for biomass formation seem to be
different when operating at 33˚C versus normal temperature levels. The maximum volumetric
productivity was equal to 0.2 (mg/L.h) for both batches cultivated at 0 and 4 mM glutamine and

157
the Reduced-Temperature condition, i.e. the temperature was reduced from the beginning of the
batch. The improved mAb concentration was not because of extended culture longevity, but to a
marked increase of specific mAb productivity. Although mild hypothermia was favorable for
mAb production, it was not helpful for increasing the level of glycosylation. It is argued that a
reduction of the residence time of mAbs through the Golgi apparatus due to a higher rate of
production at lower temperature resulted in a lower value of GI compared to control conditions.
This fact was confirmed by the experiments and explicitly considered in the development of the
semi-empirical model presented in Chapter 6. The GI and SI trends with culture time were
different for 4 and 0 mM glutamine under Reduced-Temperature and they reached a low value
on day 3 and gradually rose until day 5, in contrast with the monotonically decreasing trend that
was observed for the control condition.
In Chapter 6, a modeling framework was proposed to correlate extracellular culture
conditions to the intracellular mAb glycosylation. Based on the observations presented in
chapters 4 and 5 regarding the effects of nutrient availability, ammonia, specific productivity,
temperature and pH conditions on the glycosylation of Eg2-hFc mAb, we formulated a model
with the capability of correlating the mAb glycan profile to the aforementioned factors. We
argue that this model would be useful for glycosylation control and optimization. The model
consists of two sub-models where the first sub-model describes the extracellular metabolites
evolutions with time and the second sub-model correlates the outputs from the first part of the
model to the glycosylation levels. For the first sub-model the most dominant metabolic pathways

158
of CHO cells was in terms of energy and biomass formation were considered and a metabolic
flux analysis was performed. The fluxes were calculated based on a quadratic programming
formulation where a norm of the differences between measured and predicted consumption and
production rates of metabolites was minimized. Based on the dominant fluxes, nine different
micro-reactions were formulated. According to these macro- reaction and based on the
experimental results eleven dynamic balances for cell growth, cell death, amino acids, ammonia,
lactate and mAb profiles were formulated. The calibrated dynamic models were found in good
agreement with experimental data. They correctly described the co-metabolism of glucose and
glutamine, the dependency of death rate with respect to ammonia and glucose depletion and the
correlation of mAb to cell growth and availability of glucose. Subsequently, the model was
successfully modified to describe the effects of reduced pH and temperature conditions on cell
growth and metabolites dynamic profiles.
To correlate the outputs from the first sub-model with the glycosylation conditions we
initially formulated in collaboration with another member of our research group, a mechanistic
model that takes into account detailed balances of nucleotides and nucleotides sugars and all
possible glycosylation reactions occurring in the Golgi. Although this model was very rigorous,
but it was of very high dimensions and has been found to be very difficult to calibrate for the
different operating conditions used in the experiments. I co-authored a paper on the subject but I
have not used it in this thesis due to the aforementioned calibration challenges (Ohadi et al.
2013). Instead, a second sub-model consisting of a semi-empirical formulation was constructed

159
to correlate the culture conditions to glycosylation. This semi empirical model uses a dynamic
balance of a lumped sum of nucleotides sugars thus assuming that the nucleotides sugars are
correlated with each other. Then, the concentration of nucleotides sugars calculated from this
balance is used as an input for an equation that represents the instantaneous galactosylation
process occurring in the Golgi. In terms of time scale the galactosylation process is assumed to
be instantaneous because it represents the passage of the antibody through the Golgi apparatus
where the glycosylation reactions occur while, the dynamic balances for nucleotides are
representing reactions occurring during the life of one cell. The nucleotide sugar concentration
Sug is solved at one day interval as a function of glucose and glutamine concentrations and the
specific growth rate of that day. The dependency of the nucleotides synthesis on growth rate is
based on the recognition that nucleotides sugars derive from nucleotides where the latter are
mostly used for cell growth. The instGI model correlates to Sug profile, glucose concentration
and mAb specific productivity. The combination of this model was accomplished to predict the
galactosylation indices for a wild range of culture condition over 7 days of cell cultivation.
Considering the simplicity of this semi-empirical model, the agreement between experiments and
model predictions was acceptable. For example the model correctly predicted the trends of the
cumulative GI for cultures operated at both normal and reduced temperature conditions.
From the research presented in this thesis it can be concluded that cell culture environment
has notable impacts on the glycan distribution of the new developed camelid humanized mAb.
However, there are clear trade-offs between glycosylation levels and productivity thus implying

160
that productivity has to be sacrificed for higher therapeutic efficacy that is obtained with higher
glycosylation. For example, higher initial glutamine levels resulted in better growth and
productivity but less galactosylation and sialylation due to glucose deprivation and ammonia
accumulation respectively. Similarly low temperature operation increased the specific
productivity but negatively impacted the glycosylation.

161
7.2 Future Work Suggestions
7.2.1 Use of a Controlled pH and Temperature Bioreactor
The results presented in this research (Chapter 4 and 5) rely on shaker flask batch
cultivation. The control of pH in shaker flask was approximately achieved by manual periodic
additions of acid thus resulting in oscillations in pH between instances of acid addition. On the
other hand, pH can be closely monitored and controlled in a bioreactor. In addition oxygen
concentration can be adjusted at optimum level for controlling the glycosylation process. This
may allow for more accurate assessment of the effect of different levels of pH for extended
periods of time and for collecting data that is more repeatable for the purpose of model
calibration. However, volume effects and shear stress are additional factors that may negatively
impact glycosylation (Senger and Karim 2003; Ivarsson et al. 2014).
7.2.2 Use of Fed-Batch and Perfusion Operations
In Chapter 6, it was demonstrated that both the extracellular metabolites and the
glycosylation levels are strongly dependent on the level of glucose. In fed-batch cultures, glucose
is typically maintained at low levels but away from zero concentration by carefully controlled
feeding strategies according to the cell’s requirements for appropriate cell growth and maximal
productivity to obtain a unique glycan profiles. Maintaining the major carbon sources at low
concentrations leads to keep the concentrations of toxic metabolic by-products such as ammonia

162
at low levels (Butler 2006a). In perfusion cultures, the constant supply of nutrients and
continuous or intermittent removal of media result in higher cell densities. An optimum dilution
rate may exist that provides acceptable mAb productivity due to prolonged cell viability and, at
the same time, a high residence time of proteins within the cells (Golgi) to produce more
completely glycosylated products.
7.2.3 Cell Adaptation to a lower Temperature conditions
In Chapter 5, it was indicated that temperature has a significant effect on increasing the
specific mAb productivity of the current cell line. However, the increase in the product titre was
accompanied by a significant decrease of cell growth. Isolation of a cell population which is
adapted to grow at lower temperature may allow for extending glycosylation evolution through
reducing the specific productivity, i.e. lower residence time, while maintaining a high level of
mAb concentration because of higher cell growth of the adapted culture. Fast growing cells can
be selected during continuous passaging while cell cultivation performs at a lower temperature
such as 33˚C.
7.2.4 Improvement of the Glycosylation Model
It has been reported by other researchers that Mild hypothermia condition influences the
expression level of galactosylation enzymes involved in the process of glycosylation (Sou et al.
2014). Additionally, the evolution of glycosylation processes occurring in the Golgi apparatus

163
could be affected by changes in the enzymatic activity under lower pH conditions. These factors
could be integrated into the models presented in Chapter 6 to better describe the experimental
results. This will require the experimental analysis of enzyme levels which is currently pursued
at the University of Manitoba.
7.2.5 Real Time Glycosylation Monitoring
As it was presented in Chapters 4 and 5, glycosylation is a crucial property of mAb that usually
drops towards the end of the batch culture due to lack of nutrient availability and ammonia
accumulation. The other culture environment including, oxygen concentration, pH and temperature
levels also can influence the final product quality. In addition GI value is not constant during cell
cultivation (except for glutamine free condition) and usually drops till the end of batch operation.
Accumulation of mAb at the end of batch or fed-batch operation would induce protein aggregation or
glycan removal due to activity of sialidase enzyme released by lysed cells. These expected changes
in glycosylation along the culture require proper monitoring if control of the process is desired.
Recent industrial research has focused into real time online monitoring techniques with the ability to
reflect the culture variation into product quality in real time. For example, researchers of the Amgen
pharmaceutical company combined the micro sequential injection (μSI) system with an ultra-
performance liquid chromatography (UPLC) system in an attempt to perform real-time monitoring
of the antibody glycan profile (Tharmalingam, et al., 2014).

164
Appendix A
Metabolites and glycosylation Indices profiles with HCl pH adjustment
Metabolite profiles of reduced- pH by HCl addition. Closed symbols: 4 mM glutamine,
reduced-pH (lactic acid), reduced-pH (HCl). A) GI level, B) SI level, C) cell growth
profile, D) glucose profile, E) ammonia profile.

165
Appendix B
HILIC Profiles of Glycans
Appendix A, HILIC profile of glycan analysis for cultures supplemented with different
level of glutamine and cultivated at different pH adjustment by lactic acid. A) day 3, B) day
5, C) day 7 , D) day 9

166

167

168
Appendix C Metabolic Pathways
Appendix B, the general metabolic pathways of CHO DUXB cell line
Flux Numbers Metabolic Pathways Reactions
j1 GLC→ 2PYR + 2NADH + 2ATP
j2 PYR→ AcCoA + CO2+NADH
j3 AcCoA + OAA→ aKG + NADH + CO2
j4 aKG→ SuCCoA+ NADH + CO2
j5 SuCCoA→ FUM + NADH
j6 FUM→ OAA + NADH
j7 OAA PYR + NADPH + CO2
j8 PYR + NADH→ LAC
j9 THR→ PYR + CO2 + NH3 + 2NADH
j10 2GLY→ SER+CO2+NH3 + NADH
j11 SER→ PYR+NH3
j12 PHE→ TYR + NADH
j13 TYR→ FUM + 2AcCoA + NH3 + CO2 + NADPH
j14 VAL→ SuCCoA + CO2 + NH3 + NADPH
j15 THR→ SuCCoA + NH3
j16 ILE→ SuCCoA + AcCoA + NADPH + NH3
j17 MET + O2→ SuCCoA + SO2 + NADPH + NH3
j18 LEU→ NH3 + 3AcCoA + NADPH
j19 LYS→ 2 AcCoA + 2CO2 + 2NADPH + 2NH3
j20 HIS→ GLU+2NH3+CO2
j21 ARG→ aKG + 2NH3 + UREA + 3 NADH
j22 GLU + ATP + 2 NADPH→ PRO
j23 ASN→ ASP + ATP + NH3
j24 GLN + ASP + 2 ATP→ ASN + GLU
j25 GLN GLU + ATP + NH3
j26 GLUAKG + NADPH + NH3
j27 PYR + GLU→ ALA + AKG
j28 GLU + OAA→ ASP + AKG
j29 CYS + O2→ PYR + SO2 + NADH + NH3
j30 ALA→ PYR + NADH + NH3
j33 Gln + Pyr→Glu+Ala
j34 Asp →OAA+NH3

169
Appendix D
Dynamic Model’s Parameters
Appendix C, The parameters values refer to the coefficients in the differential
equations.
Parameter value Parameter value K11 0.254 K43 4.96
K12 9.99 K51 0.5338
µ 1.38 K52 1 10-7
K21 1 K61 1.9053
K23 6.243 K62 27.032
K24 2 K63 0.3899
K25 0.00621 K64 0.00001
n 2.854 K65 0.0306
K31 12 K71 3.026
K32 46 K72 7.897
K33 0.922 K81 5.522
K34 47.506 K82 34.7
K35 0.1636 K91 0.44
K36 0.0437 K92 0.249
K41 9.12 K101 0.87
K42 10.18 K102 0.032
Kd 1.2
K29 0.07 K30 0.05
K37 -4.3 K38 0.19
Q1 0.7 Q2 0.45
Q3 2.3 ε 0.001

170
Appendix E
Glycosylation Index Model’s Parameters
Appendix D, Glycosylation index model’s parameters
Parameter Value
a1 4.579
a2 0.5871
a3 1
a4 2.378
a5 1.408
a6 0.0526
m 2.5
p 2.5
q 0.5
s 0.0861
r 0.0861
Nuc(t=0) 0.4299
GI(t=0) 0.472

171
Bibliography
Aghamohseni H, Ohadi K, Spearman M, Krahn N, Moo-Young M, Scharer JM, et al. Effects
of nutrient levels and average culture pH on the glycosylation pattern of camelid-
humanized monoclonal antibody. J Biotechnol. Elsevier B.V.; 2014 Sep 30;186:98–109.
Ahn WS, Antoniewicz MR. Towards dynamic metabolic flux analysis in CHO cell cultures.
Biotechnol J. 2012 Jan;7(1):61–74.
Ahn WS, Jeon J-J, Jeong Y-R, Lee SJ, Yoon SK. Effect of culture temperature on
erythropoietin production and glycosylation in a perfusion culture of recombinant CHO
cells. Biotechnol Bioeng. 2008 Dec 15;101(6):1234–44.
Altamirano C, Illanes A, Becerra S, Cairó JJ, Gòdia F. Considerations on the lactate
consumption by CHO cells in the presence of galactose. J Biotechnol. 2006
Oct;125(4):547–56.
Andersen DC, Goochee CF. The effect of cell-culture conditions on the oligosaccharide
structures of secreted glycoproteins. Curr Opin Biotechnol. 1994 Oct;5(5):546–9.
Anthony RM, Nimmerjahn F, Ashline DJ, Reinhold VN, Paulson JC, Ravetch J V.
Recapitulation of IVIG anti-inflammatory activity with a recombinant IgG Fc. Science.
2008 Apr 18;320(5874):373–6.
Bell A, Wang ZJ, Arbabi-Ghahroudi M, Chang T a, Durocher Y, Trojahn U, et al.
Differential tumor-targeting abilities of three single-domain antibody formats. Cancer
Lett. Elsevier Ireland Ltd; 2010 Mar 1;289(1):81–90.
Bigge JC, Patel TP, Bruce JA, Goulding P., Charles S., Parekh R. nonselective and efficeient
fluorescent labeling of glycans using 2-amino benzamide and anthranilic acid. Anal
Biochem. 1995;30(2):229–38.
Borys MC, Linzer DL., Papoutsakis ET. Culture pH Affcets Expression rates and
Glycosylation of Recombinant Mouse Placental Lactogen Proteins by Chinese Hamster
Ovary (CHO) Cells. Nat Biotechnol. 1993;11:720–4.
Brodsky AN, Caldwell M, Bae S, Harcum SW. Glycosylation-related genes in NS0 cells are
insensitive to moderately elevated ammonium concentrations. J Biotechnol. Elsevier
B.V.; 2014 Oct 10;187:78–86.

172
Burleigh SC, van de Laar T, Stroop CJM, van Grunsven WMJ, O’Donoghue N, Rudd PM, et
al. Synergizing metabolic flux analysis and nucleotide sugar metabolism to understand
the control of glycosylation of recombinant protein in CHO cells. BMC Biotechnol.
BioMed Central Ltd; 2011 Jan;11(1):95.
Butler M. Animal cell cultures: recent achievements and perspectives in the production of
biopharmaceuticals. Appl Microbiol Biotechnol. 2005 Aug;68(3):283–91.
Butler M. Optimisation of the cellular metabolism of glycosylation for recombinant proteins
produced by Mammalian cell systems. Cytotechnology. 2006a Mar;50(1-3):57–76.
Butler M. Optimisation of the cellular metabolism of glycosylation for recombinant proteins
produced by Mammalian cell systems. Cytotechnology. 2006b Mar;50(1-3):57–76.
Campbell MP, Royle L, Radcliffe CM, Dwek RA, Rudd PM. GlycoBase and autoGU: Tools
for HPLC-based glycan analysis. Bioinformatics. 2008;24:1214–6.
Chee Furng Wong D, Tin Kam Wong K, Tang Goh L, Kiat Heng C, Gek Sim Yap M. Impact
of dynamic online fed-batch strategies on metabolism, productivity and N-glycosylation
quality in CHO cell cultures. Biotechnol Bioeng. 2005 Jan 20;89(2):164–77.
Chen F, Kou T, Fan L, Zhou Y, Ye Z, Zhao L, et al. The combined effect of sodium butyrate
and low culture temperature on the production, sialylation, and biological activity of an
antibody produced in CHO cells. Biotechnol Bioprocess Eng. 2011 Dec 3;16(6):1157–
65.
Chen P, Harcum SW. Effects of elevated ammonium on glycosylation gene expression in
CHO cells. Metab Eng. 2006 Mar;8(2):123–32.
Chotigeat W, Watanapokasin Y, Mahler S, Gray PP. Role of environmental conditions on the
expression levels, glycoform pattern and levels of sialyltransferase for hFSH produced
by recombinant CHO cells. Cytotechnology. 1994;15(1-3):217–21.
Chu L, Robinson DK. Industrial choices for protein production by large-scale cell culture.
Curr Opin Biotechnol. 2001;12:180–7.
Cohen SA, De Antonis K., Michaud D. Compositional Protein Analysis Using 6-
Aminoquinolyl-N-Hydroxysuccinimidyl Carbamate, a novel derivatization reagent.
Tech Protein Chem IV. San Diego: Academic Press; 1993. p. 289–98.

173
Crowell CK, Grampp GE, Rogers GN, Miller J, Scheinman RI. Amino Acid and Manganese
Supplementation Modulates the Glycosylation State of Erythropoietin in a CHO Culture
System. 2007;96(3):538–49.
Cruz HJ, Moreira L, Carrondo MJT. Metabolically optimised BHK cell fed-batch cultures.
2000;80:109–18.
Domann PJ, Pardos-Pardos AC, Fernandes DL, Spencer DIR, Radcliffe CM, Royle L, et al.
Separation-based glycoprofiling approaches using fluorescent labels. Proteomics. 2007
Sep;7 Suppl 1:70–6.
Doyle C, Butler M. The effect of pH on the toxicity of ammonia to a murine hybridoma. J
Biotechnol. 1990 Jul;15(1-2):91–100.
Dutton RL, Scharer JM, Moo-Young M. Hybridoma growth and productivity: effects of
conditioned medium and of inoculum size. Cytotechnology. 1999 Jan;29(1):1–10.
Elvin JG, Couston RG, van der Walle CF. Therapeutic antibodies: market considerations,
disease targets and bioprocessing. Int J Pharm. Elsevier B.V.; 2013 Jan 2;440(1):83–98.
Fekete S, Gassner A-L, Rudaz S, Schappler J, Guillarme D. Analytical strategies for the
characterization of therapeutic monoclonal antibodies. TrAC Trends Anal Chem.
Elsevier Ltd; 2013 Jan;42:74–83.
Gambhir A, Korke R, Lee J, Fu P, Europa A, Hu W. Analysis of Cellular Metabolism of
Hybridoma Cells at Distinct Physiological States. 2003;95(4).
Gao J, Gorenflo VM, Scharer JM, Budman HM. Dynamic Metabolic Modeling for a MAB
Bioprocess. 2007;168–81.
Gawlitzek M, Papac DI, Sliwkowski MB, Ryll T. Incorporation of 15N from ammonium into
the N-linked oligosaccharides of an immunoadhesin glycoprotein expressed in Chinese
hamster ovary cells. Glycobiology. 1999 Mar;9(2):125–31.
Gawlitzek M, Valley U, Nimtz M, Wagner R, Conradt HS. Characterization of changes in
the glycosylation pattern of recombinant proteins from BHK-21 cells due to different
culture conditions. J Biotechnol. 1995;42:117–31.
Grainger RK, James DC. CHO cell line specific prediction and control of recombinant
monoclonal antibody N-glycosylation. Biotechnol Bioeng. 2013 Nov;110(11):2970–83.

174
Grammatikos SI, Valley U, Nimtz M, Conradt HS, Wagner R. Intracellular UDP - N -
Acetylhexosamine Pool Affects N -Glycan Complexity : A Mechanism of Ammonium
Action on Protein. 1998;410–9.
Gu X, Wang DI. Improvement of interferon-gamma sialylation in Chinese hamster ovary cell
culture by feeding of N-acetylmannosamine. Biotechnol Bioeng. 1998 Jul
20;58(6):642–8.
Hammond S, Kaplarevic M, Borth N, Betenbaugh MJ, Lee KH. Chinese hamster genome
database: an online resource for the CHO community at www.CHOgenome.org.
Biotechnol Bioeng. 2012 Jun;109(6):1353–6.
Hauser H, Wagner R. Mammalian cell biotechnology in protein production /editors, Hansjorg
Hauser, Roland Wagner. Berlin ; New York: Walter de Gruyter; 1997.
Hossler P. Protein Glycosylation Control in Mamalian Cell Culture:Past Precedents and
Contemporary prospects. In: Wei-Shou Hu, A -P Zeng, editors. Genomics Syst Biol
Mamm Cell Cult. Advances i. Heidelberg ; New York: Springe; 2012. p. 187–219.
Hossler P, Goh L, Lee MM, Hu W. GlycoVis : Visualizing Glycan Distribution in the Protein
N -Glycosylation Pathway in Mammalian Cells. Biotechnol Bioeng. 2006;95:946–60.
Hossler P, Khattak SF, Li ZJ. Optimal and consistent protein glycosylation in mammalian
cell culture. Glycobiology. 2009 Sep;19(9):936–49.
Human R, Hayter PM, Curling EMA, Baines AJ, Jenkins N, Salmon I, et al. Glucose-Limited
Chemostat Culture of Chinese Hamster Ovary Cells Producing. Biotechnol Bioeng.
1992;39:327–35.
Ivarsson M, Villiger TK, Morbidelli M, Soos M. Evaluating the impact of cell culture
process parameters on monoclonal antibody N-glycosylation. J Biotechnol. Elsevier
B.V.; 2014 Aug 28;188C:88–96.
Jedrzejewski PM, del Val IJ, Constantinou A, Dell A, Haslam SM, Polizzi KM, et al.
Towards controlling the glycoform: a model framework linking extracellular
metabolites to antibody glycosylation. Int J Mol Sci. 2014 Jan;15(3):4492–522.
Jimenez del Val I, Nagy JM, Kontoravdi C. A dynamic mathematical model for monoclonal
antibody N-linked glycosylation and nucleotide sugar donor transport within a maturing
Golgi apparatus. Biotechnol Prog. 2011;27(6):1730–43.

175
Karsten CM, Pandey MK, Figge J, Kilchenstein R, Taylor PR, Rosas M, et al. Anti-
inflammatory activity of IgG1 mediated by Fc galactosylation and association of
FcγRIIB and dectin-1. Nat Med. 2012 Sep;18(9):1401–6.
Kaufmann H, Mazur X, Marone R, Bailey JE, Fussenegger M. Comparative analysis of two
controlled proliferation strategies regarding product quality, influence on tetracycline-
regulated gene expression, and productivity. Biotechnol Bioeng. 2001 Mar
20;72(6):592–602.
Kim DY, Chaudhry MA, Kennard ML, Jardon MA, Braasch K, Dionne B, et al. Fed-Batch
CHO Cell t-PA Production and Feed Glutamine Replacement to. Biotechnol Prog.
2013;29:165–75.
Konno Y, Kobayashi Y, Takahashi K, Takahashi E, Sakae S, Wakitani M, et al. Fucose
content of monoclonal antibodies can be controlled by culture medium osmolality for
high antibody-dependent cellular cytotoxicity. Cytotechnology. 2012 May;64(3):249–
65.
Kunkel JP, Jan DCH, Jamieson JC, Butler M. Dissolved oxygen concentration in serum-free
continuous culture affects N-linked glycosylation of a monoclonal antibody. J
Biotechnol. 1998;62:55–71.
Kuystermans D, Al-rubeai M. Animal Cell Culture. In: Al-Rubeai M, editor. Cham: Springer
International Publishing; 2015. p. 717–57.
Li F, Vijayasankaran N, Shen A (Yijuan), Kiss R, Amanullah A. Cell culture processes for
monoclonal antibody production. MAbs. 2010 Sep 1;2(5):466–79.
Li J, Wong CL, Vijayasankaran N, Hudson T, Amanullah A. Feeding lactate for CHO cell
culture processes: impact on culture metabolism and performance. Biotechnol Bioeng.
2012 May;109(5):1173–86.
Liu B, Spearman M, Doering J, Lattová E, Perreault H, Butler M. The availability of glucose
to CHO cells affects the intracellular lipid-linked oligosaccharide distribution, site
occupancy and the N-glycosylation profile of a monoclonal antibody. J Biotechnol.
Elsevier B.V.; 2014 Jan 20;170:17–27.
Mason M, Sweeney B, Cain K, Stephens P, Sharfstein S. Reduced Culture Temperature
Differentially Affects Expression and Biophysical Properties of Monoclonal Antibody
Variants. Antibodies. 2014 Aug;3(3):253–71.

176
McCracken N a, Kowle R, Ouyang A. Control of galactosylated glycoforms distribution in
cell culture system. Biotechnol Prog. 2014;30(3):547–53.
Mensonides FIC, Brul S, Hellingwerf KJ, Bakker BM, Teixeira de Mattos MJ. A kinetic
model of catabolic adaptation and protein reprofiling in Saccharomyces cerevisiae
during temperature shifts. FEBS J. 2014 Feb 13;281(3):825–41.
Meuwly F, Weber U, Ziegler T, Gervais a, Mastrangeli R, Crisci C, et al. Conversion of a
CHO cell culture process from perfusion to fed-batch technology without altering
product quality. J Biotechnol. 2006 May;123(1):106–16.
Moore A, Mercer J, Dutina G, Donahue CJ, Bauer KD, Mather JP, et al. Effects of
temperature shift on cell cycle , apoptosis and nucleotide pools in CHO cell batch
cultues. 1997;47–54.
Munro TP, Mahler SM, Huang EP, Chin DY, Gray PP. Bridging the gap: facilities and
technologies for development of early stage therapeutic mAb candidates. MAbs.
2011;3(5):440–52.
Müthing J, Kemminer SE, Conradt HS, Sagi D, Nimtz M, Kärst U, et al. Effects of buffering
conditions and culture pH on production rates and glycosylation of clinical phase I anti-
melanoma mouse IgG3 monoclonal antibody R24. Biotechnol Bioeng. 2003 Aug
5;83(3):321–34.
Nabi IR, Dennis JW. The extent of polylactosamine glycosylation of MDCK LAMP-2 is
determined by its Golgi residence time. Glycobiology. 1998 Sep;8(9):947–53.
Naderi S, Meshram M, Wei C, McConkey B, Ingalls B, Budman H, et al. Development of a
mathematical model for evaluating the dynamics of normal and apoptotic Chinese
hamster ovary cells. Biotechnol Prog. 2011;27(5):1197–205.
Nyberg GB, Balcarcel RR, Follstad BD, Stephanopoulos G, Wang DI. Metabolic effects on
recombinant interferon-gamma glycosylation in continuous culture of Chinese hamster
ovary cells. Biotechnol Bioeng. 1999 Mar 5;62(3):336–47.
Ohadi K, Aghamohseni H, Gädke J, Moo-Young M, Legge RL, Scharer J, et al. Novel
Dynamic Model to Predict the Glycosylation Pattern of Monoclonal Antibodies from
Extracellular Cell Culture Conditions. 12th IFAC Symp Comput Appl Biotechnol. 2013.

177
Ohadi K, Aghamohseni H, Legge RL, Budman HM. Fluorescence-based soft sensor for at
situ monitoring of chinese hamster ovary cell cultures. Biotechnol Bioeng. 2014 Aug
16;111(8):1577–86.
Ozturk SS, Hu W. cell culture technology for pharmaceutical and cell-based technology.
New york; 2006.
Quek L-E, Dietmair S, Krömer JO, Nielsen LK. Metabolic flux analysis in mammalian cell
culture. Metab. Eng. 2010. p. 161–71.
Raju TS, Briggs JB, Borge SM, Jones AJ. Species-specific variation in glycosylation of IgG:
evidence for the species-specific sialylation and branch-specific galactosylation and
importance for engineering recombinant glycoprotein therapeutics. Glycobiology.
2000;10:477–86.
Rearick J, Chapman A, Kornfeld S. Glucose Starvation Alters Lipid-linked Oligosaccharide
Biosynthesis in Chinese Hamster Ovary Cells*. J Biol Chem. 1981;256(12):6255–61.
Restelli V, Butler M. 2. the effect of cell culture parameters on protein glycosylation. In: Al-
Rubeai M, editor. cell enginering. Springer Netherlands; 2002. p. 61–92.
Rodriguez J, Spearman M, Tharmalingam T, Sunley K, Lodewyks C, Huzel N, et al. High
productivity of human recombinant beta-interferon from a low-temperature perfusion
culture. J Biotechnol. Elsevier B.V.; 2010 Dec;150(4):509–18.
Royle L, Radcliffe CM, Dwek RA, Rudd PM. Detailed structural analysisof N-glycans
released from glycoproteins in SDS-PAGE gel bands using HPLCcombined with
exoglycosidase array digestions. Methods Mol Biol. 2006;347:125–43.
Sanfeliu A, Stephanopoulos G. Effect of glutamine limitation on the death of attached
Chinese hamster ovary cells. Biotechnol Bioeng. 1999;64:46–53.
Schneider M, Marison IW, Stockar U von. the importancce of ammonia in mamamlian cell
culture.pdf. J Biotechnol. 1996;46:161–85.
Senger RS, Karim MN. Effect of shear stress on intrinsic CHO culture state and
glycosylation of recombinant tissue-type plasminogen activator protein. Biotechnol
Prog. 2003;19(4):1199–209.

178
Seo JS, Kim YJ, Cho JM, Baek E, Lee GM. Effect of culture pH on recombinant antibody
production by a new human cell line, F2N78, grown in suspension at 33.0 °C and 37.0
°C. Appl Microbiol Biotechnol. 2013 Jun;97(12):5283–91.
Sethuraman N, Stadheim T a. Challenges in therapeutic glycoprotein production. Curr Opin
Biotechnol. 2006 Aug;17(4):341–6.
Shields RL, Lai J, Keck R, O’Connell LY, Hong K, Meng YG, et al. Lack of fucose on
human IgG1 N-linked oligosaccharide improves binding to human Fcgamma RIII and
antibody-dependent cellular toxicity. J Biol Chem. 2002 Jul 26;277(30):26733–40.
Sou SN, Sellick C, Lee K, Mason A, Kyriakopoulos S, Polizzi KM, et al. How does mild
hypothermia affect monoclonal antibody glycosylation? Biotechnol Bioeng. 2014 Dec
29;1–29.
Spearman M, Butler M. Animal Cell Culture. In: Al-Rubeai M, editor. Cham: Springer
International Publishing; 2015. p. 237–58.
Stanley P. Golgi Glycosylation. Cold Spring Harb Perspect Biol. 2011;3:a005199:1–13.
Sureshkumar GK, Mutharasan R. The Influence of Temperature on a Monoclonal Antibody
Production. 1991;37:292–5.
Taschwer M, Hackl M, Hernández Bort J a, Leitner C, Kumar N, Puc U, et al. Growth,
productivity and protein glycosylation in a CHO EpoFc producer cell line adapted to
glutamine-free growth. J Biotechnol. Elsevier B.V.; 2012 Jan 20;157(2):295–303.
Tharmalingam T, Wu C-H, Callahan S, Goudar CT. A Framework for Real-time
Glycosylation Monitoring (RT-GM) in Mammalian Cell Culture. Biotechnol Bioeng.
2014 Dec;n/a – n/a.
Trummer E, Fauland K, Seidinger S, Schriebl K, Lattenmayer C, Kunert R, et al. Process
Parameter Shifting : Part I . Effect of DOT , pH , and Temperature on the Performance
of Epo-Fc Expressing CHO Cells Cultivated in Controlled Batch Bioreactors. 2006;
Umaña P, Jean-mairet J, Moudry R, Amstutz H, Bailey JE. Engineered glycoforms of an
antineuro- blastoma IgG1 with optimized antibody- dependent cellular cytotoxic
activity. 1999;17(February).

179
Del Val IJ, Kontoravdi C, Nagy JM. Towards the implementation of quality by design to the
production of therapeutic monoclonal antibodies with desired glycosylation patterns.
Biotechnol Prog. 2010;26(6):1505–27.
Valley U, Nimtz M, Conradt HS, Wagner R. Incorporation of Ammonium into N-
Acetylhexosamines and into Carbohydrate Structures in Glycoproteins. Biotechnol
Bioeng. 1999;64:401–17.
Vergara M, Becerra S, Berrios J, Osses N, Reyes J, Rodríguez-Moyá M, et al. Differential
effect of culture temperature and specific growth rate on CHO cell behavior in
chemostat culture. PLoS One. 2014 Jan;9(4):e93865.
Wahrheit J, Nicolae A, Heinzle E. Dynamics of growth and metabolism controlled by
glutamine availability in Chinese hamster ovary cells. Appl Microbiol Biotechnol. 2013
Dec 22;
Wang W-C, Lee N, Aoki D, Fukuda MN, Fukuda M. The Poly-N-acetyllactosamines
Attached to Lysosomal Membrane Glycoproteins Are Increased by the Prolonged
Association with the Golgi Complex *. J Biol Chem. 1991;266.
Weidemann R, Ludwing A, Kretzmer G. Low temperature cultivation - A step towards
process optimisation. 1994;111–6.
Wong NSC, Wati L, Nissom PM, Feng HT, Lee MM, Yap MGS. An investigation of
intracellular glycosylation activities in CHO cells: effects of nucleotide sugar precursor
feeding. Biotechnol Bioeng. 2010 Oct 1;107(2):321–36.
Xie L, Nyberg G, Gu X, Li H, Mo F, Wang DIC. Gamma-Interferon Production and Quality
in Stoichiometric Fed-Batch Cultures of Chinese Hamster Ovary ( CHO ) Cells under
Serum-Free Conditions. Biotechnol Bioeng. 1997;56(5):577–82.
Yang M, Butler M. Effects of ammonia on CHO cell growth, erythropoietin production, and
glycosylation. Biotechnol Bioeng. 2000 May 20;68(4):370–80.
Yang M, Butler M. Effects of ammonia and glucosamine on the heterogeneity of
erythropoietin glycoforms. Biotechnol Prog. 2002;18(1):129–38.
Yang WC, Lu J, Kwiatkowski C, Yuan H, Kshirsagar R, Ryll T, et al. Perfusion seed cultures
improve biopharmaceutical fed-batch production capacity and product quality.
Biotechnol Prog. 2014;30(3):616–25.

180
Yoon SK, Choi SL, Song JY, Lee GM. Effect of culture pH on erythropoietin production by
Chinese hamster ovary cells grown in suspension at 32.5 and 37.0 degrees C. Biotechnol
Bioeng. 2005 Feb 5;89(3):345–56.
Yoon SK, Kim SH, Song JY, Lee GM. Biphasic culture strategy for enhancing volumetric
erythropoietin productivity of Chinese hamster ovary cells. Enzyme Microb Technol.
2006 Jul;39(3):362–5.
Yoon SK, Song JY, Lee GM. Effect of low culture temperature on specific productivity,
transcription level, and heterogeneity of erythropoietin in Chinese hamster ovary cells.
Biotechnol Bioeng. 2003 May 5;82(3):289–98.
Zhang J, Mackenzie R, Durocher Y. Therapeutic Antibodies. In: Dimitrov AS, editor.
Totowa, NJ: Humana Press; 2009. p. 323–36.
Zustiak M., Pollack J., MR M, Betenbaugh MJ. Feast or famine: autophagy control and
engineering in eukaryotic cell culture. Curr Opin Biotechnol. 2008;19:518–26.