Micro-environmental Modelling
12
Indoor Aerosol Modeling: Basic Principles and Practical Applications Tareq Hussein & Markku Kulmala Received: 10 December 2006 / Accepted: 8 May 2007 / Published online: 16 August 2007 # Springer Science + Business Media B.V. 2007 Abstract The type and amount of indoor air pollutants affects the comfort and quality of indoor environments. Therefore, indoor air quality is an important issue with different social, economic, and health aspects because people in developing countries spend most of their time indoors being exposed to different kinds of indoor pollutants. The indoor air quality can be assessed empirically by measuring the pollutant concentrations or can be predicted by means of mathematical models. An indoor aerosol model describes the dynamic behav- ior of indoor air pollutants. The basic concept of indoor air models is the mass-balance-conservation where several factors that govern the indoor particle concentrations can be described. These factors may include direct emissions from indoor sources, outdoor aerosol particles penetrating indoors as a result of the ventilation and filtration processes, deposition onto indoor surfaces, and removal from indoor air by means of ventilation. Here we present principles of indoor aerosol models and we also give examples of different kind of models. Keywords Indoor air quality . Emissions . Numerical simulation 1 Introduction An air pollutant can be a gas or an aerosol particle including solid, liquid, radioactive, bio-aerosols, etc. Indoor air pollutants are either generated indoors or transported from the outdoor (Jones 1999). The change rate of an indoor pollutant concentration is therefore governed by sources and sinks. While pollutants are exchanged between the indoor and outdoor air their concentrations are reduced by filtration/infiltration and loss mechanisms such as deposition onto duct lines, building shell, and indoor surfaces. Re-suspension and emissions of pollutants increase their concentrations indoors. In general, the concentrations and dynamic behavior of indoor aerosols can be predicted by means of indoor aerosol models. An indoor aerosol model must, at least, incorporate the most relevant processes such as indoor-outdoor air exchange, penetration, and depo- sition processes; therefore, we will recall them as the controlling parameters. An indoor air model may, additionally, incorporate deposition and re-suspension processes as well as emissions due indoor activities (Kulmala et al. 1999). A simple indoor aerosol model describes the dynamic behavior of one type of air pollutants in a single compartment. Simple indoor aerosol models Water Air Soil Pollut: Focus (2008) 8:23–34 DOI 10.1007/s11267-007-9134-x T. Hussein : M. Kulmala Department of Physical Sciences, University of Helsinki, P.O. Box 64, 00014 Helsinki, Finland T. Hussein (*) Institute of Applied Environmental Science, Stockholm University, Frescativägen 54a, 10691 Stockholm, Sweden e-mail: [email protected]
Transcript of Micro-environmental Modelling

Indoor Aerosol Modeling: Basic Principlesand Practical Applications
Tareq Hussein & Markku Kulmala
Received: 10 December 2006 /Accepted: 8 May 2007 / Published online: 16 August 2007# Springer Science + Business Media B.V. 2007
Abstract The type and amount of indoor airpollutants affects the comfort and quality of indoorenvironments. Therefore, indoor air quality is animportant issue with different social, economic, andhealth aspects because people in developingcountries spend most of their time indoors beingexposed to different kinds of indoor pollutants. Theindoor air quality can be assessed empirically bymeasuring the pollutant concentrations or can bepredicted by means of mathematical models. Anindoor aerosol model describes the dynamic behav-ior of indoor air pollutants. The basic concept ofindoor air models is the mass-balance-conservationwhere several factors that govern the indoor particleconcentrations can be described. These factors mayinclude direct emissions from indoor sources,outdoor aerosol particles penetrating indoors as aresult of the ventilation and filtration processes,deposition onto indoor surfaces, and removal fromindoor air by means of ventilation. Here we presentprinciples of indoor aerosol models and we alsogive examples of different kind of models.
Keywords Indoor air quality . Emissions .
Numerical simulation
1 Introduction
An air pollutant can be a gas or an aerosol particleincluding solid, liquid, radioactive, bio-aerosols, etc.Indoor air pollutants are either generated indoors ortransported from the outdoor (Jones 1999). Thechange rate of an indoor pollutant concentration istherefore governed by sources and sinks. Whilepollutants are exchanged between the indoor andoutdoor air their concentrations are reduced byfiltration/infiltration and loss mechanisms such asdeposition onto duct lines, building shell, and indoorsurfaces. Re-suspension and emissions of pollutantsincrease their concentrations indoors. In general, theconcentrations and dynamic behavior of indooraerosols can be predicted by means of indoor aerosolmodels. An indoor aerosol model must, at least,incorporate the most relevant processes such asindoor-outdoor air exchange, penetration, and depo-sition processes; therefore, we will recall them as thecontrolling parameters. An indoor air model may,additionally, incorporate deposition and re-suspensionprocesses as well as emissions due indoor activities(Kulmala et al. 1999).
A simple indoor aerosol model describes thedynamic behavior of one type of air pollutants in asingle compartment. Simple indoor aerosol models
Water Air Soil Pollut: Focus (2008) 8:23–34DOI 10.1007/s11267-007-9134-x
T. Hussein :M. KulmalaDepartment of Physical Sciences, University of Helsinki,P.O. Box 64, 00014 Helsinki, Finland
T. Hussein (*)Institute of Applied Environmental Science,Stockholm University,Frescativägen 54a, 10691 Stockholm, Swedene-mail: [email protected]
are the base-block of more complicated indooraerosol models and they have been commonly usedin literature to predict total number or mass concen-trations of aerosol particles, radioactivity concen-trations of radon gas, or fate of bio-aerosols indoors(e.g. Jamriska et al. 2003; Riley et al. 2002; Kulmalaet al. 1999; Raunemaa et al. 1989; Alzona et al.1979; Lum and Graedel 1973). We can easily extenda simple indoor aerosol model to describe thedynamic behavior of several indoor pollutants; i.e.multiple-component approach. The change rate ofeach component concentration must be thereforedescribed separately. In principle, indoor pollutantsdo interact with each others through chemicalreactions, disintegration, aerosol dynamics, etc. Acommon example of multiple-component indoor airmodels is the sectional (size-resolved) indoor airmodel in which the dynamic behavior of indoorparticle size distributions is the main interest (e.g.Asmi et al. 2004; Nazaroff 2004; Thatcher et al.2002; Long et al. 2000; Abt et al. 2000; Thatcher andLayton 1995).
In real life situations, dwellings consist ofseveral rooms/floors in addition to a mechanicalventilation system (fresh and exhaust air sectionsand sometimes a recycled air section) or the indoorpollutant concentrations may show spatial gra-dients, therefore, a single-compartment indoor airmodel is no longer valid. Multiple-compartmentand size-resolved indoor aerosol models are intro-duced to describe the dynamic behavior of aerosolparticles within a dwelling or large halls. Multiple-compartment and size-resolved indoor air modelsare very complicated and numerically demanding.MC-SIAM and MIAQ are multiple-compartmentand size resolved indoor aerosol models that in-corporate aerosol dynamics (Hussein et al. 2005b,2006; Miller and Nazaroff 2001; Nazaroff andCass 1989, 1986). Several multiple-compartmentand size-resolved indoor aerosol models can befound in literature (e.g. Thornburg et al. 2001;Mosley et al. 2001; Schneider et al. 1999; Tunget al. 1999).
In this paper we will present and discuss the basicprinciples and development of different types ofindoor aerosol models, their accuracy, and somepractical applications. Our discussion will be specificfor indoor aerosol particles only.
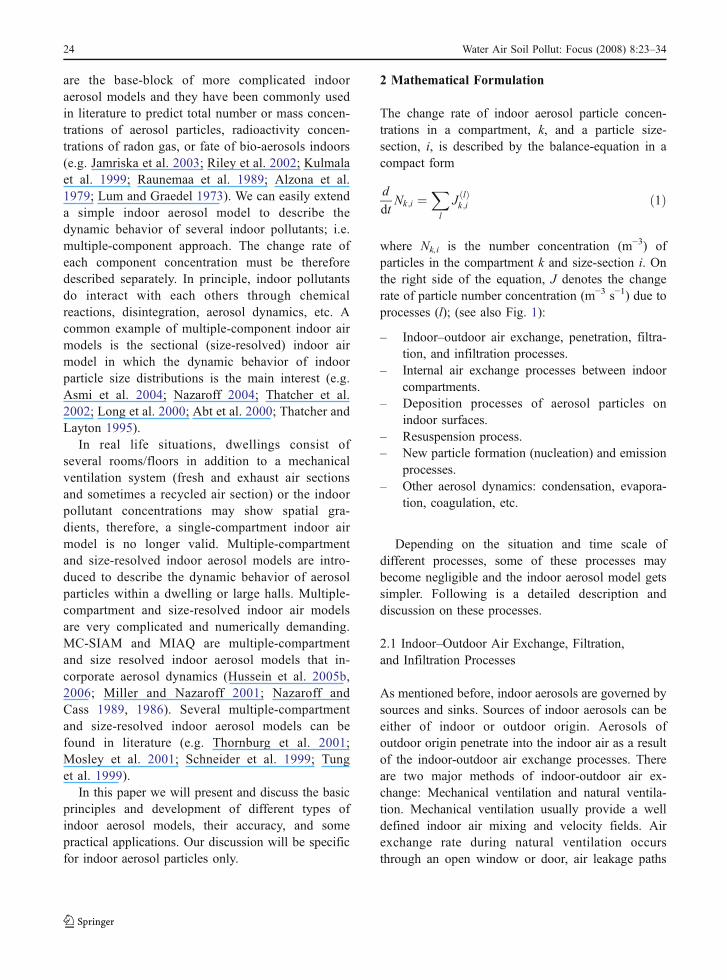
2 Mathematical Formulation
The change rate of indoor aerosol particle concen-trations in a compartment, k, and a particle size-section, i, is described by the balance-equation in acompact form
d
dtNk;i ¼
Xl
J ðlÞk;i ð1Þ
where Nk,i is the number concentration (m−3) ofparticles in the compartment k and size-section i. Onthe right side of the equation, J denotes the changerate of particle number concentration (m−3 s−1) due toprocesses (l); (see also Fig. 1):
– Indoor–outdoor air exchange, penetration, filtra-tion, and infiltration processes.
– Internal air exchange processes between indoorcompartments.
– Deposition processes of aerosol particles onindoor surfaces.
– Resuspension process.– New particle formation (nucleation) and emission
processes.– Other aerosol dynamics: condensation, evapora-
tion, coagulation, etc.
Depending on the situation and time scale ofdifferent processes, some of these processes maybecome negligible and the indoor aerosol model getssimpler. Following is a detailed description anddiscussion on these processes.
2.1 Indoor–Outdoor Air Exchange, Filtration,and Infiltration Processes
As mentioned before, indoor aerosols are governed bysources and sinks. Sources of indoor aerosols can beeither of indoor or outdoor origin. Aerosols ofoutdoor origin penetrate into the indoor air as a resultof the indoor-outdoor air exchange processes. Thereare two major methods of indoor-outdoor air ex-change: Mechanical ventilation and natural ventila-tion. Mechanical ventilation usually provide a welldefined indoor air mixing and velocity fields. Airexchange rate during natural ventilation occursthrough an open window or door, air leakage paths
24 Water Air Soil Pollut: Focus (2008) 8:23–34
across the building shell, via wall-cracks, or around awindow shell.
Contrary to mechanical ventilation, the air ex-change rate and the penetration factor are not wellcontrolled during natural ventilation; the air exchangerate is typically governed by several factors such asambient wind (speed, direction, and turbulence),thermal buoyancy, the size and position of ventilationopening or leakage path, heat source and solarradiation, the conductance of the envelope, etc. (e.g.Li and Delsante 2001; Dascalaki et al. 1996).
The mathematical formulation of the indoor-out-door air exchange processes for an indoor compart-ment is simply
J IO�exchangek;i ¼ 1
Vk
Xm
QmkPm;iN out;i
� 1
VkQk;removedNk;i ð2Þ
where Vk is the volume (m3) of compartment k andthe summation is over all pathways that bring outdooraerosol particles into the compartment, Qmk denotesthe air flow rate (m3 s−1) that brings outdoor aerosolparticles with outdoor concentrations Nout,i (m
−3) viapathway m, Pm,i is the penetration factor of aerosolparticles via that path, Qk,removed denotes the removedair flow rate (m3 s−1), and Nk,i is the aerosol particlenumber concentration (m−3) in compartment k.
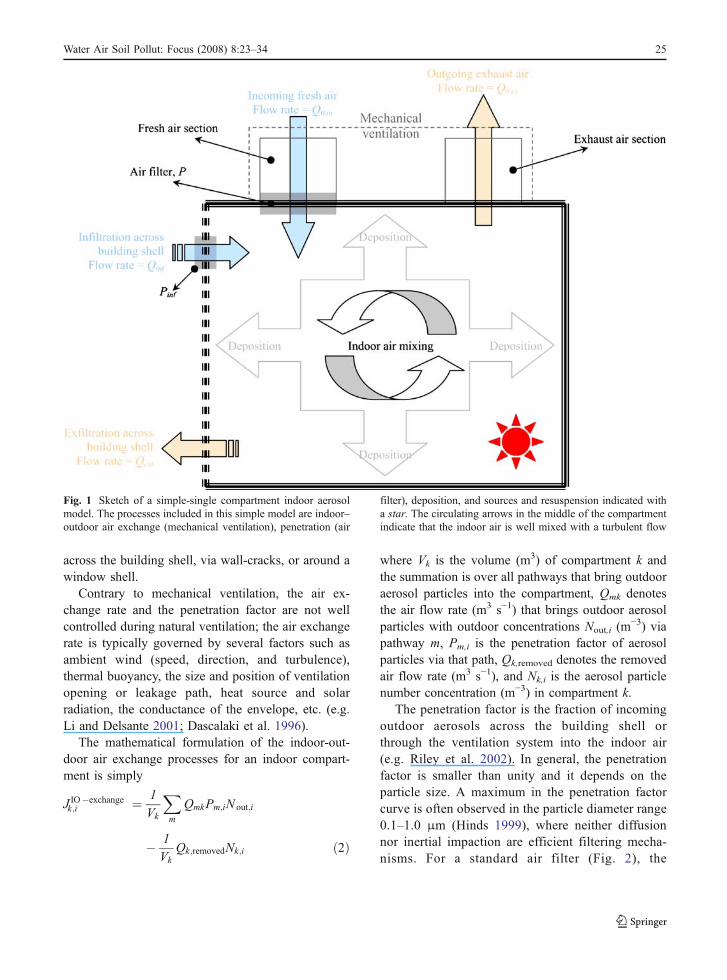
The penetration factor is the fraction of incomingoutdoor aerosols across the building shell orthrough the ventilation system into the indoor air(e.g. Riley et al. 2002). In general, the penetrationfactor is smaller than unity and it depends on theparticle size. A maximum in the penetration factorcurve is often observed in the particle diameter range0.1–1.0 μm (Hinds 1999), where neither diffusionnor inertial impaction are efficient filtering mecha-nisms. For a standard air filter (Fig. 2), the
Fig. 1 Sketch of a simple-single compartment indoor aerosolmodel. The processes included in this simple model are indoor–outdoor air exchange (mechanical ventilation), penetration (air
filter), deposition, and sources and resuspension indicated witha star. The circulating arrows in the middle of the compartmentindicate that the indoor air is well mixed with a turbulent flow
Water Air Soil Pollut: Focus (2008) 8:23–34 25

penetration factor can be derived from its filtrationefficiency (FE)
Pi ¼ 1� FEi %
100%ð3Þ
The filtration efficiency is defined as the fraction ofentering aerosols retained by the filter. Penetrationacross filters depends on air flow rate and dustloading on the filter (Goodfellow and Tähti 2001;Hanley et al. 1994). Across the building shell, i.e.natural ventilation, the penetration factor varies withthe building geometry, surface materials, and pressuredrop along the leakage path (e.g. Liu and Nazaroff2001).
2.2 Internal Air Exchange Processes
In a multiple-compartment approach, internal air ex-change between compartments can strongly influenceindoor aerosol concentrations and it is mathematicallywritten as
J internal�exchangek;i ¼ 1
Vk
Xj
QjkNj;i � QkjNk;i
� � ð4Þ
where Qjk is the air flow rate (m3 s−1) fromcompartment j into compartment k, and Nj,i and Nk,i
are respectively the aerosol particle number concen-trations (m−3) in these compartments. In practice, it isnot necessary that Qjk and Qkj are equal. The drivingforces of internal air exchange are pressure differ-ences caused by winds, temperature differences, andfan operation.
The internal air exchange between compartments isvery difficult to be measured. However, CFD model-ing and multiple-compartment air flow models (suchas COMIS and CONTAM) provide better understand-ing on the air flow indoors (e.g. Posner et al. 2003;Ren and Stewart 2003; Haas et al. 2002; Ziskind et al.2002; Borchiellini and Fürbringer 1999; Feustel 1999;Roulet et al. 1999; Walton 1997; Fan 1995; Gan1995). However, from the indoor air quality point ofview, internal air exchange has received too littleattention; more specifically with respect to indoorparticles, a few studies have explored concentrationvariability among rooms and the factors that influencethem (e.g. Hussein et al. 2006; Miller and Nazaroff2001; Ju and Spengler 1981).
In the context of indoor aerosol modeling, it isimportant to distinguish between the term “airexchange rate” and the term “ventilation rate”. The“air exchange rate” has the units of air volume perunit time (e.g. m3 s−1) and it represents the amountof air that passes through a certain path. The
Fig. 2 Filtration efficien-cies of standard class fil-ters: ASHRAE standards areadopted from Hanley et al.(1994) at 1.3 m/s face ve-locity, and BS EN 779standards are adopted fromGoodfellow and Tähti(2001) at the minimumefficiency
26 Water Air Soil Pollut: Focus (2008) 8:23–34
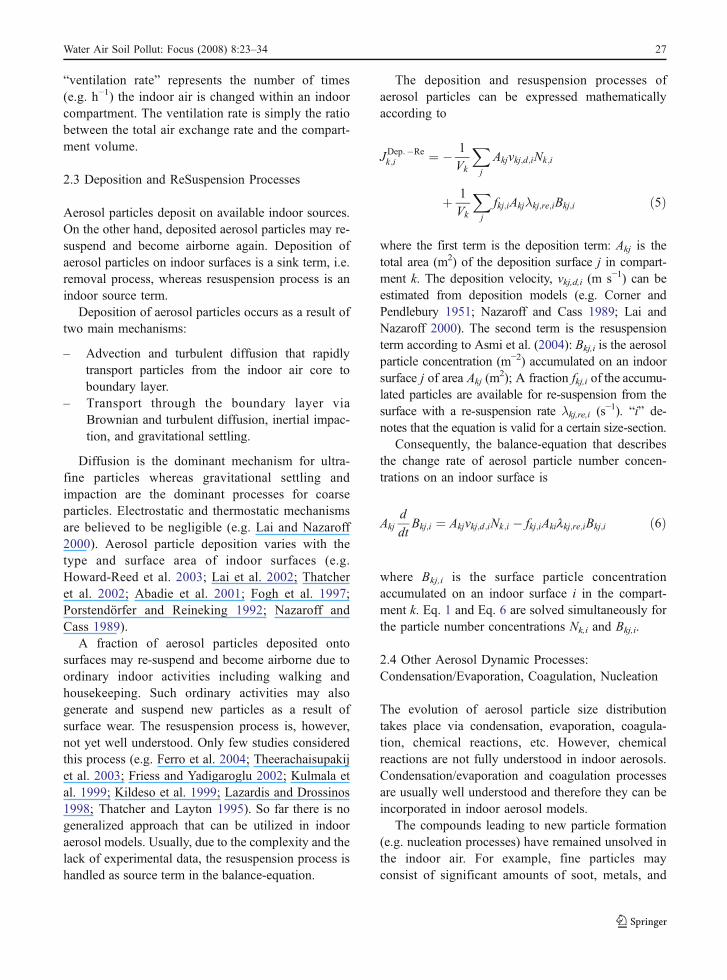
“ventilation rate” represents the number of times(e.g. h−1) the indoor air is changed within an indoorcompartment. The ventilation rate is simply the ratiobetween the total air exchange rate and the compart-ment volume.
2.3 Deposition and ReSuspension Processes
Aerosol particles deposit on available indoor sources.On the other hand, deposited aerosol particles may re-suspend and become airborne again. Deposition ofaerosol particles on indoor surfaces is a sink term, i.e.removal process, whereas resuspension process is anindoor source term.
Deposition of aerosol particles occurs as a result oftwo main mechanisms:
– Advection and turbulent diffusion that rapidlytransport particles from the indoor air core toboundary layer.
– Transport through the boundary layer viaBrownian and turbulent diffusion, inertial impac-tion, and gravitational settling.
Diffusion is the dominant mechanism for ultra-fine particles whereas gravitational settling andimpaction are the dominant processes for coarseparticles. Electrostatic and thermostatic mechanismsare believed to be negligible (e.g. Lai and Nazaroff2000). Aerosol particle deposition varies with thetype and surface area of indoor surfaces (e.g.Howard-Reed et al. 2003; Lai et al. 2002; Thatcheret al. 2002; Abadie et al. 2001; Fogh et al. 1997;Porstendörfer and Reineking 1992; Nazaroff andCass 1989).
A fraction of aerosol particles deposited ontosurfaces may re-suspend and become airborne due toordinary indoor activities including walking andhousekeeping. Such ordinary activities may alsogenerate and suspend new particles as a result ofsurface wear. The resuspension process is, however,not yet well understood. Only few studies consideredthis process (e.g. Ferro et al. 2004; Theerachaisupakijet al. 2003; Friess and Yadigaroglu 2002; Kulmala etal. 1999; Kildeso et al. 1999; Lazardis and Drossinos1998; Thatcher and Layton 1995). So far there is nogeneralized approach that can be utilized in indooraerosol models. Usually, due to the complexity and thelack of experimental data, the resuspension process ishandled as source term in the balance-equation.
The deposition and resuspension processes ofaerosol particles can be expressed mathematicallyaccording to
JDep:�Rek;i ¼ � 1
Vk
Xj
Akjvkj;d;iNk;i
þ 1
Vk
Xj
fkj;iAkjλkj;re;iBkj;i ð5Þ
where the first term is the deposition term: Akj is thetotal area (m2) of the deposition surface j in compart-ment k. The deposition velocity, vkj,d,i (m s−1) can beestimated from deposition models (e.g. Corner andPendlebury 1951; Nazaroff and Cass 1989; Lai andNazaroff 2000). The second term is the resuspensionterm according to Asmi et al. (2004): Bkj,i is the aerosolparticle concentration (m−2) accumulated on an indoorsurface j of area Akj (m
2); A fraction fkj,i of the accumu-lated particles are available for re-suspension from thesurface with a re-suspension rate λkj,re,i (s
−1). “i” de-notes that the equation is valid for a certain size-section.
Consequently, the balance-equation that describesthe change rate of aerosol particle number concen-trations on an indoor surface is
Akjd
dtBkj;i ¼ Akjvkj;d;iNk;i � fkj;iAkilkj;re;iBkj;i ð6Þ
where Bkj,i is the surface particle concentrationaccumulated on an indoor surface i in the compart-ment k. Eq. 1 and Eq. 6 are solved simultaneously forthe particle number concentrations Nk,i and Bkj,i.
2.4 Other Aerosol Dynamic Processes:Condensation/Evaporation, Coagulation, Nucleation
The evolution of aerosol particle size distributiontakes place via condensation, evaporation, coagula-tion, chemical reactions, etc. However, chemicalreactions are not fully understood in indoor aerosols.Condensation/evaporation and coagulation processesare usually well understood and therefore they can beincorporated in indoor aerosol models.
The compounds leading to new particle formation(e.g. nucleation processes) have remained unsolved inthe indoor air. For example, fine particles mayconsist of significant amounts of soot, metals, and
Water Air Soil Pollut: Focus (2008) 8:23–34 27

organic compounds. A common example of newparticle formation in the indoor air is accompaniedwith pealing citrus fruits that releases terpens in theatmosphere. This produces significant amounts ofaerosol particles that grow from the very smallsizes bellow 0.01 μm to the Aitken mode between0.025–0.1 μm (e.g. Vartiainen et al. 2006). On theother hand, cooking usually generates different kindsof vapors that stimulate secondary particle formationin the indoor air.
In literature can be found several aerosoldynamics models that can be integrated in indoorair models; few to mention: “University of HelsinkiMulti-component Aerosol model” – UHMA –(Korhonen et al. 2004), AEROFOR (Pirjola 1999),and the integrated aerosol dynamic model describedby Nazaroff and Cass (1989, 1986).
2.5 Indoor Sources of Aerosol Particles
As mentioned before, indoor aerosol particles aregoverned by sources that are either of indoor oroutdoor origin. Indoor sources are usually due toinhabitant’s activities. Indoor coarse particles tendto be produced by mechanical means. Bio-aerosolsincluding allergens, fungi, bacteria, and viruses canbe either coarse or fine (e.g. Meklin et al. 2002;Lee et al. 2002; Otten and Burge 1999; Wanner1993; Platts-Mills et al. 1991). Indoor fine particlesare generated by means of gas-to-particle conversionprocesses that are often associated with high tem-perature during combustion and cooking.
Even though many studies discussed indoorsources of aerosol particles only a few focused onthe particle number size distributions and even veryfew presented quantitative determination of aerosolparticle emissions from indoor sources (Husseinet al. 2005a, b, 2006; Afshari et al. 2005; He et al.2004; Fan and Zhang 2001).
3 Mathematical Solutions of Indoor AerosolModels: Some Practical Applications
The required input variables to simulate or predict theconcentrations of indoor aerosols are: the aerosolparticle concentrations in the outdoor air, penetrationfactor (or filtration efficiency), ventilation rate (or airexchange rate), deposition rate (or deposition veloc-
ity), dwelling geometries (volume, internal surfacearea including walls, ceilings, floors, and furniture),internal air-exchange rates between indoor compart-ments, and a diary of indoor activities. All these inputparameters and variables are set up for a mathematicalsolution that solves for indoor particle concentrationsin each size-section and each compartment, Nk,i.
Consider a single compartment dwelling andassume that
– The indoor air is well mixed,– Penetration factor, ventilation rate, and deposition
rate are all constant,– The aerosol particle concentration is rather
constant in the outdoor air,– The indoor source has a constant emission rate,– The re-suspension process is negligible, and– Condensation/evaporation and coagulation pro-
cesses are also negligible.
The common mathematical formulation for asimple sectional indoor aerosol model (e.g. Jamriskaet al. 2003; Riley et al. 2002; Mosley et al. 2001;Kulmala et al. 1999)
d
dtNin;i ¼ lPiNout;i � lþ ld;i
� �Nin;i þ Sin;i ð7Þ
Where Nin,i (cm−3) and Nout,i (cm
−3) are respectivelythe indoor and outdoor particle number concentrationsindoors and outdoors, Pi is the penetration factor,λ (s−1) is the ventilation rate, λd,i (s−1) is thedeposition rate of aerosol particles on indoor surfaces,and Sin,i (cm
−3 s−1) is the sources of aerosol particlesin the indoor air.
The analytical solution for this simple indoor airmodel can be easily verified in the form
Nin;i tð Þ ¼ N0;in;ie� λþλd;ið Þt
þ λPiNout;i þ Sin;iλþ λd;i
1� e� λþλd;ið Þt� �ð8Þ
where N0,in,i is the initial concentration (at time t=0)of the indoor aerosol particles within size-section i.
Indoor and outdoor aerosol particle concentrationsmay maintain steady-state conditions after a certaintime period (i.e. long enough time period) when theoutdoor aerosol concentrations are rather constant.For example, if we further assume that indoor sourcesof aerosol particles are negligible; i.e. Sin,i<<λPiNout,i,
28 Water Air Soil Pollut: Focus (2008) 8:23–34
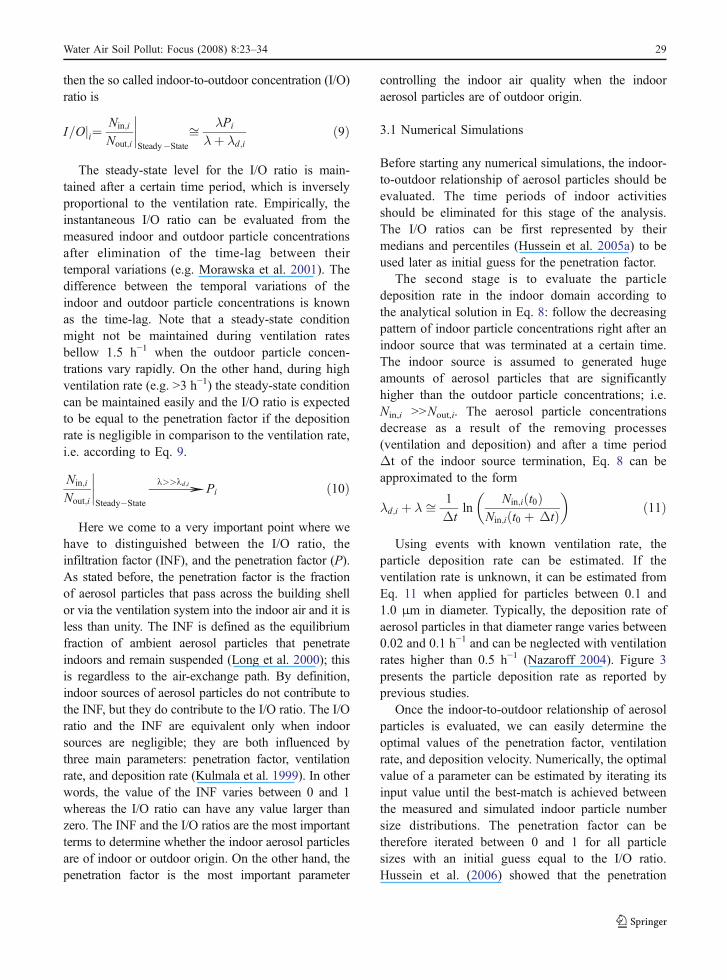
then the so called indoor-to-outdoor concentration (I/O)ratio is
I=Oji¼Nin;i
Nout;i
����Steady�State
ffi λPi
λþ λd;ið9Þ
The steady-state level for the I/O ratio is main-tained after a certain time period, which is inverselyproportional to the ventilation rate. Empirically, theinstantaneous I/O ratio can be evaluated from themeasured indoor and outdoor particle concentrationsafter elimination of the time-lag between theirtemporal variations (e.g. Morawska et al. 2001). Thedifference between the temporal variations of theindoor and outdoor particle concentrations is knownas the time-lag. Note that a steady-state conditionmight not be maintained during ventilation ratesbellow 1.5 h−1 when the outdoor particle concen-trations vary rapidly. On the other hand, during highventilation rate (e.g. >3 h−1) the steady-state conditioncan be maintained easily and the I/O ratio is expectedto be equal to the penetration factor if the depositionrate is negligible in comparison to the ventilation rate,i.e. according to Eq. 9.
Nin;i
Nout;i
����Steady�State
→1>>1d;i Pi ð10Þ
Here we come to a very important point where wehave to distinguished between the I/O ratio, theinfiltration factor (INF), and the penetration factor (P).As stated before, the penetration factor is the fractionof aerosol particles that pass across the building shellor via the ventilation system into the indoor air and it isless than unity. The INF is defined as the equilibriumfraction of ambient aerosol particles that penetrateindoors and remain suspended (Long et al. 2000); thisis regardless to the air-exchange path. By definition,indoor sources of aerosol particles do not contribute tothe INF, but they do contribute to the I/O ratio. The I/Oratio and the INF are equivalent only when indoorsources are negligible; they are both influenced bythree main parameters: penetration factor, ventilationrate, and deposition rate (Kulmala et al. 1999). In otherwords, the value of the INF varies between 0 and 1whereas the I/O ratio can have any value larger thanzero. The INF and the I/O ratios are the most importantterms to determine whether the indoor aerosol particlesare of indoor or outdoor origin. On the other hand, thepenetration factor is the most important parameter
controlling the indoor air quality when the indooraerosol particles are of outdoor origin.
3.1 Numerical Simulations
Before starting any numerical simulations, the indoor-to-outdoor relationship of aerosol particles should beevaluated. The time periods of indoor activitiesshould be eliminated for this stage of the analysis.The I/O ratios can be first represented by theirmedians and percentiles (Hussein et al. 2005a) to beused later as initial guess for the penetration factor.
The second stage is to evaluate the particledeposition rate in the indoor domain according tothe analytical solution in Eq. 8: follow the decreasingpattern of indoor particle concentrations right after anindoor source that was terminated at a certain time.The indoor source is assumed to generated hugeamounts of aerosol particles that are significantlyhigher than the outdoor particle concentrations; i.e.Nin,i >>Nout,i. The aerosol particle concentrationsdecrease as a result of the removing processes(ventilation and deposition) and after a time periodΔt of the indoor source termination, Eq. 8 can beapproximated to the form
λd;i þ λ ffi 1
Δtln
Nin;i t0ð ÞNin;i t0 þ Δtð Þ
� �ð11Þ
Using events with known ventilation rate, theparticle deposition rate can be estimated. If theventilation rate is unknown, it can be estimated fromEq. 11 when applied for particles between 0.1 and1.0 μm in diameter. Typically, the deposition rate ofaerosol particles in that diameter range varies between0.02 and 0.1 h−1 and can be neglected with ventilationrates higher than 0.5 h−1 (Nazaroff 2004). Figure 3presents the particle deposition rate as reported byprevious studies.
Once the indoor-to-outdoor relationship of aerosolparticles is evaluated, we can easily determine theoptimal values of the penetration factor, ventilationrate, and deposition velocity. Numerically, the optimalvalue of a parameter can be estimated by iterating itsinput value until the best-match is achieved betweenthe measured and simulated indoor particle numbersize distributions. The penetration factor can betherefore iterated between 0 and 1 for all particlesizes with an initial guess equal to the I/O ratio.Hussein et al. (2006) showed that the penetration
Water Air Soil Pollut: Focus (2008) 8:23–34 29

factor for their guest apartment varied between the25th percentiles of the I/O ratio. In the same study, theoptimal value of the ventilation rate varied between0.6 and 1.2 h−1 (measured value 0.27–0.61 h−1). Theoptimal value of the friction velocity was 10–30 cm/s.Following similar procedure, the optimal curve of thepenetration factor was also estimated for an officeroom and a family house as illustrated by Hussein etal. (2005b).
To illustrate a numerical simulation example wepicked up one of our previous measurements in an
office room (Hussein et al. 2005b), which consists ofa small shower room (2/9 the volume), smallbathroom (1/9 the volume), and working office place(2/3 the volume). The total volume of that office roomwas about 32 m3 with surface-to-volume ratio ofabout 2.63 m−1. The office room was ventilatedmechanically with a ventilation rate ∼3 h−1 and G3-class filter. Figures 4 and 5 illustrate the simulation ofthe indoor particle number concentrations by using afriction velocity 17 cm/s for the deposition model byLai and Nazaroff (2000); note that the simulation
Fig. 3 Particle deposition rates reported in previous studies. The lines represent calculated deposition rates using the model by Laiand Nazaroff (2000): A/V is the total indoor surface area to the total room volume ratio and u* is the friction velocity
Fig. 4 Simulation of indoorparticle number concentra-tions for an office room:total volume 32 m3, surface-to-volume ratio 2.63 m−1,mechanically ventilation3 h−1, G3-class filter, fric-tion velocity 17 cm/s. Notethat the simulation was basedon single-compartment andsectional approach for theparticle diameter range be-tween 8 and 590 nm and thefigure presents the particlenumber concentrations with-in the size ranges indicatedon the figure
30 Water Air Soil Pollut: Focus (2008) 8:23–34

was based on single-compartment and sectionalapproach for the particle diameter range between8–590 nm. It seems that a single compartmentapproach with the measured parameters and theguessed friction velocity is therefore suitable topredict the indoor particle number concentrations inthat office room. In our example the indoor particlenumber concentrations are small enough to ignorethe coagulation process.
3.2 Semi-Empirical Estimation of Indoor AerosolEmissions
If we are convinced with our optimal values of theventilation rate, friction velocity, and the penetra-tion factor, then we can simulate the particle num-ber size distributions by ignoring indoor sources.Evaluating the difference between the measured andsimulated concentrations and assume it is equiva-
Fig. 5 Simulation of indoorparticle number concentra-tions for the same casepresented in Fig. 4, here wepresent the whole numbersize distribution of indooraerosol particles (upper)measured and (lower)simulated
Water Air Soil Pollut: Focus (2008) 8:23–34 31

lent to the airborne aerosol particles due to indoorsources
SEmittedk;i ¼ NMeasured
k;i � NSimulatedk;i ð12Þ
we can estimate the emission rate term as (Husseinet al. 2005b, 2006)
d
dtSEmittedk;i ¼ JEmissions
k;i þ JCoagulationk;i
þ JCondensationk;i
� 1
Vk
Xj
Akjvkj;d;iSEmittedk;i
� 1
Vk
Xl
Qk;removedSEmittedk;i : ð13Þ
This principle can also provide quantification foraerosol particle losses due to un-identified indoorsinks of aerosol particles, which are indicated bynegative values in the emission rate term. Equations12 and 13 state a semi-empirical principle based onthe following: the indoor aerosol particle concentra-tion measurements quantify the suspended aerosolparticles resulting from all possible sources and sinks.Similarly, simulations of indoor particle concentra-tions illustrate the amount of aerosol particles afterbeing engaged in the processes included in the indooraerosol model. The difference between the measuredand simulated particle concentrations provides theinitial step to determine the emission rate.
4 Summary and Conclusions
There are two major types of indoor aerosol models:single-compartment (single-zone) and multiple-com-partments (multiple-zone). Single compartment indooraerosol models are typically used when the indoorpollutant concentrations do not show spatial gradients.If this assumption does not hold, there is a need for amultiple compartment indoor aerosol model. If theindoor aerosol model describes the dynamic behaviorof only one pollutant, it is then called single-compo-nent. Otherwise, it is called multiple-component. Ourmain objective in this paper is to present the basicprinciples of indoor air models illustrated with somepractical applications.
A sectional indoor aerosol model is superior to asimple indoor aerosol model because it providesbetter understanding about the particle size depen-dence of aerosol dynamic processes. In general, theaccuracy of an indoor aerosol model is limited to theextent of indoor air mixing. Here, “mixing” refers tothe dilution, transport, and dispersion of a pollutantwithin a domain, i.e. compartment. Mixing is drivenby mechanical means (e.g. mechanical ventilation),flow through an open window (e.g. natural ventila-tion), or movement of people within a room.Temperature gradients among the indoor air parcelscan induce convection that induces mixing too.
Simulation of indoor aerosol particles is verychallenging. The estimation of the optimal parametersshould be performed with great care based on goodunderstanding on the indoor-outdoor relationship ofaerosol particles. There can be several sets of optimalparameters that lead to the same acceptable modelsimulation results. However, a good understandingabout the indoor-outdoor aerosol problem helps us todetermine the most suitable set of optimal parameters.On the other hand, simulation of indoor aerosolparticles is very difficult during indoor activitiesbecause of the lack of information about the physical-chemical characteristics of aerosol particles generatedduring indoor activities.
The accuracy of a sectional indoor aerosol model islimited to the description of the dynamic behavior ofaerosol particles and their size distribution. Forexample, the penetration and deposition processesare particle-size dependent. Therefore, considering awide size-range of aerosol particles may under or overestimate the penetration or the deposition processes. Itis more likely that the physical-chemical character-istics of aerosol particles should be taken into accountto better describe their dynamic behavior.
The present indoor aerosol models are able todescribe accurate enough most aerosol dynamicprocesses. However, the new particle formation (seee.g. Vartiainen et al. 2006) in the indoor air cannot bedescribed yet in a proper way. Since, the numberconcentration of ultrafine indoor aerosol particles arepartly determined by new particle formation, alsofuture indoor models should be able to considernucleation and subsequent growth indoors includingrecently developed new theories like cluster activation(Kulmala et al. 2006).
32 Water Air Soil Pollut: Focus (2008) 8:23–34

References
Abadie, M., Limam, K., & Allard, F. (2001). Indoor particlepollution: Effect of wall textures on particle Deposition.Building and Environment, 36, 821–827.
Abt, E., Suh, H. H., Catalano, P., & Koutrakis, P. (2000).Relative contribution of outdoor and indoor particlesources to indoor concentrations. Environmental Scienceand Technology, 34, 3579–3587.
Afshari, A., Matson, U., & Ekberg, L. E. (2005). Characterizationof indoor sources of fine and ultrafine particles: A studyconducted in a full-scale chamber. Indoor Air, 15, 141–150.
Alzona, J., Cohen, B. L., Rudolph, H., Jow, H. N., &Frohliger, J. O. (1979). Indoor–outdoor relationships forairborne particulate matter of outdoor origin. AtmosphericEnvironment, 13, 55–60.
Asmi, A. J., Pirjola, L. H., & Kulmala, M. A. (2004). Sectionalaerosol model for submicron particles in indoor air.Scandinavian Journal of Work, Environment & Health,30(Suppl 2), 63–72.
Borchiellini, R., & Fürbringer, J.-M. (1999). An evaluationexercise of a multizone air flow model. Energy andBuildings, 30, 35–51.
Corner, B. J., & Pendlebury, E. D. (1951). The coagulation anddeposition of a stirred aerosol. Proceedings of the PhysicalSociety, B64, 645–654.
Dascalaki, E., Santamouris, M., Argiriou, A., Helmis, C.,Asimakopoulos, D. N., Papadopoulos, K. et al. (1996).On the combination of air velocity and flow measurementsin single sided natural ventilation configurations. Energyand Buildings, 24, 155–165.
Fan, Y. (1995). CFD modelling of the air and contaminantdistribution in rooms. Energy and Buildings, 23, 33–39.
Fan, C. W., & Zhang, J. J. (2001). Characterization of emissionsfrom portable household combustion devices: Particle sizedistributions, emission rates and factors, and potentialexposures. Atmospheric Environment, 35, 1281–1290.
Ferro, A. R., Kopperud, R. J., & Hildemann, L. M. (2004)Source strengths for indoor human activities that resus-pend particulate matter. Environmental Science and Tech-nology, 38, 1759–1764.
Feustel, H. E. (1999). COMIS – an international multizone air-flow and contaminant transport model. Energy andBuildings, 30, 3–18.
Fogh, C. L., Byrne, M. A., Roed, J., & Goddard, A. J. H.(1997). Size specific indoor aerosol deposition measure-ments and derived I/O concentrations ratios. AtmosphericEnvironment, 31, 2193–2203.
Friess, H., & Yadigaroglu, G. (2002). Modeling of theresuspension of particle clusters from multilayer aerosoldeposits with variable porosity. Journal of AerosolScience, 33, 883–906.
Gan, G. (1995). Evaluation of room air distributions systemsusing computational fluid dynamics. Energy and Build-ings, 23, 83–93.
Goodfellow, H., & Tähti, E. (2001). Industrial ventilation:Design guidebook. In Gustavsson, J. (Ed.), Cabin air filters:Performance and requirements. Academic Press, California,p. 685 (SAE Conference, Detroit, February 1996.)
Haas, A., Weber, A., Dorer, V., Keilholz, W., & Pelletret, R.(2002). COMIS v3.1 simulation environment for multi-zone air flow and pollutant transport modelling. Energyand Buildings, 34, 873–882.
Hanley, J. T., Ensor, D. S., Smith, D. D., & Sparks, L. E.(1994). Fractional aerosol filtration efficiency of in ductventilation air cleaners. Indoor Air, 4, 169–178.
He, C., Morawska, L., Hitchins, J., & Gilbert, D. (2004).Contribution from indoor sources to particle number andmass concentrations in residential houses. AtmosphericEnvironment, 38, 3405–3415.
Hinds, W. C. (1999). Aerosol technology (2nd ed.). New York:Wiley.
Howard-Reed, C., Wallace, L. A., & Emmerich, S. J. (2003).Effect of ventilation system and air filters on decayrates of particles produced by indoor sources in anoccupied townhouse. Atmospheric Environment, 37,5295–5306.
Hussein, T., Glytsos, T., Ondráček, J., Ždímal, V., Hämeri, K.,Lazaridis, M., et al. (2006). Particle size characterizationand emission rates during indoor activities in a house.Atmospheric Environment, 40, 4285–4307.
Hussein, T., Hämeri, K., Heikkinen, M. S. A., & Kulmala, M.(2005a). Indoor and outdoor particle size characterizationat a family house in Espoo – Finland. AtmosphericEnvironment, 39, 3697–3709.
Hussein, T., Korhonen, H., Herrmann, E., Hämeri, K.,Lehtinen, K., & Kulmala, M. (2005b). Emission ratesdue to indoor activities: Indoor aerosol model develop-ment, evaluation, and applications. Aerosol Science andTechnology, 39(11), 1111–1127.
Jamriska, M., Morawska, L., & Ensor, D. S. (2003). Control strat-egies for sub-micrometer particles indoors: Model study ofair filtration and ventilation. Indoor Air, 13, 96–105.
Jones, A. P. (1999). Indoor air quality and health. AtmosphericEnvironment, 33, 4535–4564.
Ju, C., & Spengler, J. D. (1981) Room to room variations inconcentration of respirable particles in residences. Envi-ronmental Science and Technology, 15, 592–596.
Kildeso, J., Vinzents, P., Schneider, T., & Kloch, N. P. (1999) Asimple method for measuring the potential resuspension ofdust from carpets in the indoor environment. TextileResearch Journal, 69, 169–175.
Korhonen, H., Lehtinen, K. E. J., & Kulmala, M. (2004). Aerosoldynamic model UHMA: Model development and validation.Atmospheric Chemistry and Physics, 4, 757–771.
Kulmala, M., Asmi, A., & Pirjola, L. (1999). Indoor air aerosolmodel: The effect of outdoor air, filtration and ventilationon indoor concentrations. Atmospheric Environment, 33,2133–2144.
Kulmala, M., Lehtinen, K. E. J., & Laaksonen, A. (2006).Cluster activation theory as an explanation of the lineardependence between formation rate of 3 nm particles andsulphuric acid concentration. Atmospheric Chemistry andPhysics, 6, 787–793.
Lai, A. C. K., & Nazaroff, W. W. (2000). Modeling indoorparticle deposition from turbulent flow onto smoothsurfaces. Journal of Aerosol Science, 31, 463–476.
Lai, A. C. K., Byrne, M. A., & Goddard, A. J. H. (2002).Experimental studies of the effect of rough surfaces and air
Water Air Soil Pollut: Focus (2008) 8:23–34 33

speed on aerosol deposition in a test chamber. AerosolScience and Technology, 36, 973–982.
Lazardis, M., & Drossinos, Y. (1998). Multilayer resuspensionof small identical particles by turbulent flow. Journal ofAerosol Science and Technology, 28(6), 548–560.
Lee, S.-C., Guo, H., Li, W.-M., & Chan, L.-Y. (2002). Inter-comparison of air pollutant concentrations in differentindoor environments in Hong Kong. Atmospheric Envi-ronment, 36, 1929–1940.
Li, Y., & Delsante, A. (2001). Natural ventilation induced bycombined wind and thermal forces. Building and Envi-ronment, 36, 59–71.
Liu, D.-L., & Nazaroff, W. W. (2001). Modeling pollutantpenetration across building envelopes. Atmospheric Envi-ronment, 35, 4451–4462.
Long, C. H., Suh, H. H., & Koutrakis, P. (2000). Characteriza-tion of indoor particle sources using continuous mass andsize monitors. Journal of Air and Waste ManagementAssociation, 50, 1236–1250.
Lum, R. M., & Graedel, T. E. (1973) Measurements and modelsof indoor aerosol size spectra. Atmospheric Environment,7, 827–842.
Meklin, T., Reponen, T., Toivola, M., Koponen, V., Husman, T.,Hyvärinen, A., et al. (2002). Size distributions of airbornemicrobes in moisture-damaged and reference school build-ings of two construction types. Atmospheric Environment,36, 6031–6039.
Miller, S. L., & Nazaroff, W. W. (2001). Environmental tobaccosmoke particles in multizone indoor environments. Atmo-spheric Environment, 35, 2053–2067.
Morawska, L., He, C., Hitchins, J., Gilbert, D., &Parappukkaran, S. (2001). The relationship betweenindoor and outdoor airborne particles in the residentialenvironment. Atmospheric Environment, 35, 3463–3473.
Mosley, R. B., Greenwell, D. J., Sparks, L. E., Guom Z.,Tucker, W. G., Fortmann, R. et al. (2001). Penetration ofambient fine particles into the indoor environment.Aerosol Science and Technology, 34, 127–136.
Nazaroff, W. W. (2004). Indoor particle dynamics. Indoor Air,14(Suppl 7), 175–183.
Nazaroff, W. W., & Cass, G. R. (1986). Mathematical modelingof chemically reactive pollutants in indoor air. Environ-mental Science and Technology, 20, 924–934.
Nazaroff, W. W., & Cass, G. R. (1989). Mathematical modelingof indoor aerosol dynamics. Environmental Science andTechnology, 23, 157–166.
Otten, J. A., & Burge, H. A. (1999). Bacteria. In: Macher, J.(Ed.), Bioaerosols, assessment and control. AmericanConference of Governmental Industrial Hygienists, Cin-cinnati, pp. 183–1810.
Pirjola, L. (1999). Effects of the increased UV radiation andbiogenic VOC emissions on ultrafine sulphate aerosolformation. Journal of Aerosol Science, 29, 355–367.
Platts-Mills, T. A. E., Ward, G. W., Sporik, R., Gelber, L. E.,Champman, M. D., & Heymann, P. W. (1991). Epidemi-ology of the relationship between exposure to indoorallergins and asthema. International Archives of Allergyand Applied Immunology, 87(2), 505–510.
Porstendörfer, J., & Reineking, A. (1992) Indoor behavior andcharacteristics of radon progeny. Radiation ProtectionDosimetery, 45, 303–311.
Posner, J. D., Buchanan, C. R., & Dunn-Rankin, D. (2003).Measurement and prediction of indoor air flow in a modelroom. Energy and Buildings, 35, 515–526.
Raunemaa, T., Kulmala, M., Saari, H., Olin, M., & Kulmala,M. H. (1989). Indoor air aerosol model: Transport indoorsand deposition of fine and coarse particles. AerosolScience and Technology, 11, 11–25.
Ren, Z., & Stewart, J. (2003). Simulating air flow andtemperature distribution inside buildings using a modifiedversion of COMIS with sub-zonal divisions. Energy andBuildings, 35, 257–271.
Riley, W. J., Mckone, T. E., Lai, A. C. K., & Nazaroff, W. W.(2002). Indoor particulate matter of outdoor origin:Importance of size-dependent removal mechanisms. Envi-ronmental Science and Technology, 36, 200–207.
Roulet, C.-A., Fürbringer, J.-M., & Creton, P. (1999). Theinfluence of the user on the results of multizone air flowsimulations with COMIS. Energy and Buildings, 30, 73–86.
Schneider, T., Kildeso, J., & Breum, N. O. (1999). A two-compartment model for determining the contribution ofsources, surface deposition and resuspension to air andsurface dust concentration levels in occupied rooms.Building and Environment, 34, 583–595.
Thatcher, T. L., & Layton, D. W. (1995). Deposition,resuspension, and penetration of particles within a resi-dence. Atmospheric Environment, 29, 1487–1497.
Thatcher, T. L., Lai, A. C. K., Moreno-Jackson, R., Sextro,R. G., & Nazaroff, W. W. (2002). Effects of roomfurnishings and air speed on particle deposition ratesindoors. Atmospheric Environment, 36, 1811–1819.
Theerachaisupakij, W., Matsusaka, S., Akashi, Y., &Masuda, H.(2003). Reentrainment of deposited particles by drag andaerosol collision. Journal of Aerosol Science, 34, 261–274.
Thornburg, J., Ensor, D. S., Rodos, C. E., Lawless, P. A., Sparks,L. E., & Mosley, R. B. (2001). Penetration of particles intobuildings and associated physical factors – Part I: Modeldevelopment and computer simulations. Journal of AerosolScience and Technology, 34, 284–296.
Tung, T. C. W., Chao, C. Y. H., & Burnett, J. (1999). Amethodology to investigate the particulate penetrationcoefficient through building shell. Atmospheric Environ-ment, 33, 881–893.
Vartiainen, E., Kulmala, M., Ruuskanen, T. M., Taipale, R.,Rinne, J., & Vehkamäki, H. (2006). Formation and growthof indoor air aerosol particles as a result of D-limoneneoxidation. Atmospheric Environment, 40, 7882–7892.
Walton, G. N. (1997). CONTAM96 User manual. ReportNSITIR 6056. US Department of Commerce, NationalInstitute of Standards and Technology, Gaithersburg(September).
Wanner, H. U. (1993). Sources of pollutants in indoor air. IARCScientific Publications, 109, 19–30.
Ziskind, G., Dubovsky, V., & Letan, R. (2002). Ventilation bynatural convection of a one-story building. Energy andBuildings, 34, 91–102.
34 Water Air Soil Pollut: Focus (2008) 8:23–34