The Effect of Vitamin Supplementation on Subclinical ... - MDPI

Methylation and Gene Expression Responses to Ethanol
Feeding and Betaine Supplementation in the Cystathionine
Beta Synthase-Deficient Mouse
Valentina Medici, Diane I. Schroeder, RimaWoods, Janine M. LaSalle, Yongzhi Geng,Noreene M. Shibata, Janet Peerson, Emir Hodzic, Sanjana Dayal, Hidekazu Tsukamoto,
Kusum K. Kharbanda, Brittany Tillman, Samuel W. French, and Charles H. Halsted
Background: Alcoholic steatohepatitis (ASH) is caused in part by the effects of ethanol (EtOH) onhepatic methionine metabolism.
Methods: To investigate the phenotypic and epigenetic consequences of altered methionine metabo-lism in this disease, we studied the effects of 4-week intragastric EtOH feeding with and without themethyl donor betaine in cystathionine beta synthase (CbS) heterozygous C57BL/6J mice.
Results: The histopathology of early ASH was induced by EtOH feeding and prevented bybetaine supplementation, while EtOH feeding reduced and betaine supplementation maintained thehepatic methylation ratio of the universal methyl donor S-adenosylmethionine (SAM) to the meth-yltransferase inhibitor S-adenosylhomocysteine (SAH). MethylC-seq genomic sequencing of hetero-zygous liver samples from each diet group found 2 to 4% reduced methylation in gene bodies,but not promoter regions of all autosomes of EtOH-fed mice, each of which were normalized insamples from mice fed the betaine-supplemented diet. The transcript levels of nitric oxide synthase(Nos2) and DNA methyltransferase 1 (Dnmt1) were increased, while those of peroxisome prolifera-tor receptor-a (Ppara) were reduced in EtOH-fed mice, and each was normalized in mice fed thebetaine-supplemented diet. DNA pyrosequencing of CbS heterozygous samples found reducedmethylation in a gene body of Nos2 by EtOH feeding that was restored by betaine supplementa-tion and was correlated inversely with its expression and positively with SAM/SAH ratios.
Conclusions: The present study has demonstrated relationships among EtOH induction of ASHwith aberrant methionine metabolism that was associated with gene body DNA hypomethylation in allautosomes and was prevented by betaine supplementation. The data imply that EtOH-induced changesin selected gene transcript levels and hypomethylation in gene bodies during the induction of ASH are aresult of altered methionine metabolism that can be reversed through dietary supplementation ofmethyl donors.
Key Words: Alcohol, S-Adenosylmethionine, S-Adenosylhomocysteine, Cystathionine Beta Syn-thase, DNAMethylation.
CHRONIC EXPOSURE TO ethanol (EtOH) has pro-found effects on hepatic methionine metabolism which
secondarily are involved in the regulation of DNA methyla-tion and consequently the expressions of genes relevant tothe pathogenesis of alcoholic steatohepatitis (ASH; Halstedand Medici, 2011; Kharbanda, 2009; Mato and Lu, 2007). In
particular, methionine metabolism is implicated in the pro-duction of the methyl donor, S-adenosylmethionine (SAM),which is generated from homocysteine by the enzymes methi-onine synthase and methionine adenosyltransferase and isthe substrate for DNA and histone methyltransferases(Fig. 1). The alternative pathway leading to the production
From the Department of InternalMedicine (VM, YG, NMS, CHH), University of California Davis, Sacramento, California; Department ofMed-ical Microbiology and Immunology (DIS, RW, JML), Genome Center, and MIND Institute, University of California Davis, Sacramento, California;Department of Nutrition (JP), University of California Davis, Sacramento, California; School of Veterinary Medicine Real Time PCR and ResearchDiagnostic Facility (EH), University of California Davis, Sacramento, California; Department of Internal Medicine (SD), University of Iowa, IowaCity, Iowa; Southern California Research Center for ALPD and Cirrhosis (HT), Keck School of Medicine, University of Southern California, LosAngeles, California; Greater Los Angeles VA Healthcare System (HT), Los Angeles, California; Research Service (KKK), Veterans AffairsNebraska-Western Iowa Health Care System, Omaha, Nebraska; and Department of Pathology (BT, SWF), UCLA/Harbor Medical Center,Torrance, California.
Received for publication November 15, 2013; accepted February 12, 2014.Reprint requests: Valentina Medici, MD, Division of Gastroenterology and Hepatology, Department of Internal Medicine, University of California,
Davis, 4150 V Street, Suite 3500, Sacramento, CA 95817; Tel.: 916-734-3751; Fax: 916-734-7908; E-mail: [email protected]© 2014 by the Research Society on Alcoholism.
DOI: 10.1111/acer.12405
1540 Alcohol Clin Exp Res, Vol 38, No 6, 2014: pp 1540–1549
ALCOHOLISM: CLINICAL AND EXPERIMENTAL RESEARCH Vol. 38, No. 6June 2014
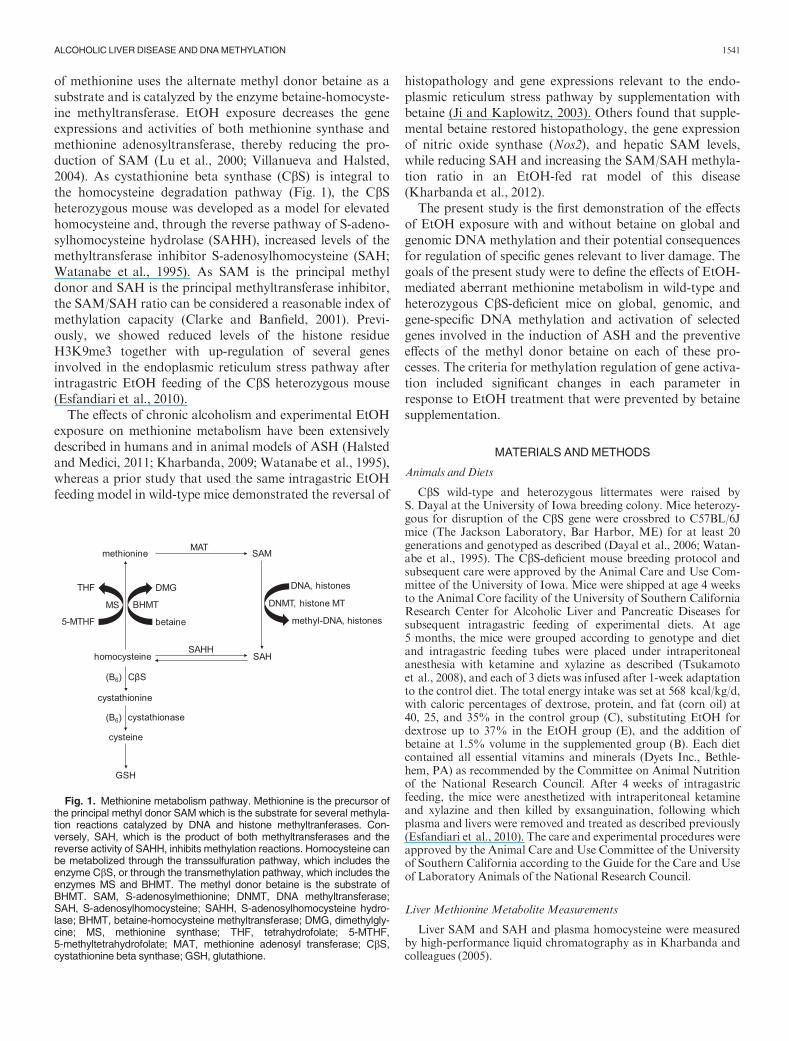
of methionine uses the alternate methyl donor betaine as asubstrate and is catalyzed by the enzyme betaine-homocyste-ine methyltransferase. EtOH exposure decreases the geneexpressions and activities of both methionine synthase andmethionine adenosyltransferase, thereby reducing the pro-duction of SAM (Lu et al., 2000; Villanueva and Halsted,2004). As cystathionine beta synthase (CbS) is integral tothe homocysteine degradation pathway (Fig. 1), the CbSheterozygous mouse was developed as a model for elevatedhomocysteine and, through the reverse pathway of S-adeno-sylhomocysteine hydrolase (SAHH), increased levels of themethyltransferase inhibitor S-adenosylhomocysteine (SAH;Watanabe et al., 1995). As SAM is the principal methyldonor and SAH is the principal methyltransferase inhibitor,the SAM/SAH ratio can be considered a reasonable index ofmethylation capacity (Clarke and Banfield, 2001). Previ-ously, we showed reduced levels of the histone residueH3K9me3 together with up-regulation of several genesinvolved in the endoplasmic reticulum stress pathway afterintragastric EtOH feeding of the CbS heterozygous mouse(Esfandiari et al., 2010).The effects of chronic alcoholism and experimental EtOH
exposure on methionine metabolism have been extensivelydescribed in humans and in animal models of ASH (Halstedand Medici, 2011; Kharbanda, 2009; Watanabe et al., 1995),whereas a prior study that used the same intragastric EtOHfeeding model in wild-type mice demonstrated the reversal of
histopathology and gene expressions relevant to the endo-plasmic reticulum stress pathway by supplementation withbetaine (Ji and Kaplowitz, 2003). Others found that supple-mental betaine restored histopathology, the gene expressionof nitric oxide synthase (Nos2), and hepatic SAM levels,while reducing SAH and increasing the SAM/SAH methyla-tion ratio in an EtOH-fed rat model of this disease(Kharbanda et al., 2012).The present study is the first demonstration of the effects
of EtOH exposure with and without betaine on global andgenomic DNA methylation and their potential consequencesfor regulation of specific genes relevant to liver damage. Thegoals of the present study were to define the effects of EtOH-mediated aberrant methionine metabolism in wild-type andheterozygous CbS-deficient mice on global, genomic, andgene-specific DNA methylation and activation of selectedgenes involved in the induction of ASH and the preventiveeffects of the methyl donor betaine on each of these pro-cesses. The criteria for methylation regulation of gene activa-tion included significant changes in each parameter inresponse to EtOH treatment that were prevented by betainesupplementation.
MATERIALS ANDMETHODS
Animals and Diets
CbS wild-type and heterozygous littermates were raised byS. Dayal at the University of Iowa breeding colony. Mice heterozy-gous for disruption of the CbS gene were crossbred to C57BL/6Jmice (The Jackson Laboratory, Bar Harbor, ME) for at least 20generations and genotyped as described (Dayal et al., 2006; Watan-abe et al., 1995). The CbS-deficient mouse breeding protocol andsubsequent care were approved by the Animal Care and Use Com-mittee of the University of Iowa. Mice were shipped at age 4 weeksto the Animal Core facility of the University of Southern CaliforniaResearch Center for Alcoholic Liver and Pancreatic Diseases forsubsequent intragastric feeding of experimental diets. At age5 months, the mice were grouped according to genotype and dietand intragastric feeding tubes were placed under intraperitonealanesthesia with ketamine and xylazine as described (Tsukamotoet al., 2008), and each of 3 diets was infused after 1-week adaptationto the control diet. The total energy intake was set at 568 kcal/kg/d,with caloric percentages of dextrose, protein, and fat (corn oil) at40, 25, and 35% in the control group (C), substituting EtOH fordextrose up to 37% in the EtOH group (E), and the addition ofbetaine at 1.5% volume in the supplemented group (B). Each dietcontained all essential vitamins and minerals (Dyets Inc., Bethle-hem, PA) as recommended by the Committee on Animal Nutritionof the National Research Council. After 4 weeks of intragastricfeeding, the mice were anesthetized with intraperitoneal ketamineand xylazine and then killed by exsanguination, following whichplasma and livers were removed and treated as described previously(Esfandiari et al., 2010). The care and experimental procedures wereapproved by the Animal Care and Use Committee of the Universityof Southern California according to the Guide for the Care and Useof Laboratory Animals of the National Research Council.
Liver Methionine Metabolite Measurements
Liver SAM and SAH and plasma homocysteine were measuredby high-performance liquid chromatography as in Kharbanda andcolleagues (2005).
methionine
cystathionine
cysteine
GSH
cystathionase(B6)
CβS
methyl-DNA, histones
DNMT, histone MT
DNA, histonesTHF
MS
5-MTHF
DMG
BHMT
betaine
homocysteineSAHH
SAH
SAMMAT
(B6)
Fig. 1. Methionine metabolism pathway. Methionine is the precursor ofthe principal methyl donor SAM which is the substrate for several methyla-tion reactions catalyzed by DNA and histone methyltranferases. Con-versely, SAH, which is the product of both methyltransferases and thereverse activity of SAHH, inhibits methylation reactions. Homocysteine canbe metabolized through the transsulfuration pathway, which includes theenzyme CbS, or through the transmethylation pathway, which includes theenzymes MS and BHMT. The methyl donor betaine is the substrate ofBHMT. SAM, S-adenosylmethionine; DNMT, DNA methyltransferase;SAH, S-adenosylhomocysteine; SAHH, S-adenosylhomocysteine hydro-lase; BHMT, betaine-homocysteine methyltransferase; DMG, dimethylgly-cine; MS, methionine synthase; THF, tetrahydrofolate; 5-MTHF,5-methyltetrahydrofolate; MAT, methionine adenosyl transferase; CbS,cystathionine beta synthase; GSH, glutathione.
ALCOHOLIC LIVER DISEASE ANDDNAMETHYLATION 1541

Liver Histopathology
Liver histopathology was evaluated independently by S.W.French by quantitative scoring of appropriately stained slides inblinded fashion using computerized software for 4 grades forparameters of lipid accumulation, lobular inflammation, necrosis,and fibrosis. Intrahepatic fat was further quantified as % per totalpixels using the 109 objective (French et al., 1993).
Analysis of Global DNAMethylation Levels by Dot-Blot Analyses
Global DNA methylation was measured in mouse livers fromeach genotype and diet group using dot-blot analysis as previouslydescribed (Woods et al., 2012). Data are expressed according tosignal intensities of 5-methylcytosine.
Analysis of Genomic DNAMethylation Levels by MethylC-seq
Genomic DNA methylation according to each autosome wasanalyzed in 3 representative heterozygous liver samples from eachof the 3 feeding groups of heterozygous mice by MethylC-seq asdescribed (Lister et al., 2009; Schroeder et al., 2011). MethylC-seqprovides a genome-wide quantitative measurement of DNAmethyl-ation that is unbiased to genomic location of CpG sites (Lister et al.,2009). Briefly, genomic DNA from each sample was sheared,annealed to methylated sequencing adapters, and bisulfite con-verted. DNA methylation genomic sequencing of each preparedsample was performed at the University of California Berkeley Vin-cent J. Coates Genomics Sequencing Laboratory. Reads weremapped to the mm9 version of the mouse genome using BS Seeker(Chen et al., 2010). CpG site methylation data in promoter and genebody regions of genes from each of 19 autosomes were combinedfrom both DNA strands, and multiple clonal reads with the samestart site were removed. Custom Perl scripts were used to convertBS Seeker output to BED files of percent methylation per CpG site.The BED files were used for data visualization on the UCSCHuman Genome Browser and for further data analysis. The datawere analyzed using custom Perl scripts and R programs (Schroederet al., 2011, 2013).
Quantitative Polymerase Chain Reaction
Liver samples from all mice were analyzed using the Vet-For-Allkit and BioSprint magnetic bead extraction instrument (QIAGEN,Valencia, CA; Osman et al., 2012). We selected a total of 21 genesinvolved in alcoholic liver injury and methionine metabolism path-ways for expression analysis by quantitative polymerase chain reac-tion (qPCR) (Bustin et al., 2009), using the geometric mean of 3reference genes Hprt1, B2m, and Gapdh for normalization. Primersfor each gene were designed using Primer Express and are shown inTable S1. Data were expressed as fold changes in each feeding groupof each genotype compared to the mean gene expression values incontrol diet samples from mice of each genotype.
Immunohistochemical Staining
Liver tissues from heterozygous mice were fixed in neutral-buf-fered formalin, embedded in paraffin, cut into 4-lm-thick sections,and stained with antibodies to inducible nitric oxide synthase(iNOS), DNA methyltransferase 1 (DNMT1), and peroxisome pro-liferator receptor-a (PPARa), each at 1/100 titer (Epitomics,Burlington, CA), followed by Donkey fluorescein isothiocyanate(FITC)-labeled antibody 1/100 titer (Jackson ImmunoResearchLabs Inc., Westgrove, PA). The expression of each of these geneshad been identified by qPCR analysis as significantly altered in sam-ples from EtOH-fed mice and normalized in samples from betaine-supplemented mice. Cellular fluorescence intensity was quantified in
each slide in blinded fashion using an FITC filter, Nikon (Tokyo,Japan) morphometric software, and a Nikon 400 fluorescent micro-scope 409 objective with the same sensitivity setting throughout(Bardag-Gorce et al., 2008).
Pyrosequencing Analysis of Gene-Specific DNAMethylation
Based on results from the qPCR analysis of gene expressions, weselected Nos2, Ppar-a, and Dnmt1 for pyrosequencing analyses ofpotential methylation differences in liver samples from each of the 3heterozygous feeding groups and to correlate these findings withtheir respective gene expressions and with liver SAM and SAM/SAH ratios. Regions of interest and primer selections were identifiedaccording to the prior MethylC-seq genomic analyses and were fur-ther defined by PyroMark Assay Design 2.0 and the UCSCGenomeBrowser July 2007 version. Bisulfite treatment of genomic DNAwas performed using the EZ DNA Methylation-Direct Kit (ZymoResearch, Irvine, CA). Triplicate PCR amplifications were per-formed using the recommended protocol for Pyromark CpG Assay(QIAGEN). Samples were sequenced on a Pyromark Q24 Pyro-sequencer using Pyromark Gold Q24 Reagents (QIAGEN), andmethylation levels were analyzed using Pyromark Q24 Software. Aninternal bisulfite conversion control was used in the pyrosequencingassay which measured methylation at selected CpG sites for eachassay.
Statistical Analyses
Outcome variables were assessed for conformance to the normaldistribution and transformed if needed. Means were comparedbetween diets and genotypes with 2-factor analysis of variance(ANOVA), and Tukey–Kramer tests were used for post hoc pair-wise comparisons. Spearman correlations were used to assess therelationships of Nos2 DNA methylation values in each heterozy-gous feeding group to its respective gene expression values. Analyseswere performed with SAS for Windows Release 9.3 (Cary, NC).Group differences in MethylC-seq analyses were determined sepa-rately by the Student’s t-test.
RESULTS
Baseline Characteristics andMethionineMetabolites
Mouse body weights were similar among all 6 groups after4 weeks of feeding (Table 1). EtOH feeding increased liverweights and consequently liver/body weight ratios in bothwild-type and heterozygous mice, and this ratio was restoredto control levels by betaine supplementation in heterozygousmice. Blood EtOH levels were appropriately elevated in theEtOH groups and were unchanged by betaine supplementa-tion of the EtOH diets. Plasma alanine aminotransferase(ALT) levels were increased 3- to 4-fold by EtOH feeding ineach genotype but were not normalized by betaine supple-mentation of the EtOH diet, with wide variation of individ-ual results. SAM levels were reduced by about one-half ineach genotype by EtOH feeding and were amplified by ~50-fold by supplementation of the SAM precursor betaine tothe EtOH diet. SAH levels were increased in both genotypesof EtOH-fed mice and were further amplified by betainetreatment in response to the extreme elevation of its precur-sor SAM. As a result of these changes, the SAM/SAH ratioin each genotype was reduced by EtOH feeding and was
1542 MEDICI ET AL.

increased by betaine supplementation. Mean plasma homo-cysteine levels were increased more than 6-fold in the EtOH-fed heterozygotes and were significantly lowered to controllevels by betaine supplementation. There were no genotypeeffects or interactions on these parameters except for geno-type effects on plasma homocysteine levels when comparingresults from the 2 EtOH groups (p < 0.003).
Histopathology
Scores of liver injury were influenced by diets with no inde-pendent or interactive genotype effects. As depicted (Fig. 2),total and steatosis scores were significantly increased byEtOH feeding within each genotype and were reduced bybetaine supplementation in heterozygotes. There were nochanges among the groups in inflammation scores, and therewere minimal to no scores for necrosis or fibrosis among thegroups (not shown).
Global DNAMethylation by Dot-Blot Analysis
Global methylation levels were assessed by signal intensi-ties of 5-methylcytosine in liver samples from each genotypeand diet group. According to ANOVA of all results, therewere no genotype effects or differences among the dietgroups.
GenomeMethylC-seq Analysis
Each of 19 autosomes from heterozygous EtOH-fed micehad lower percent genomic methylation compared to valuesin control mice, whereas methylation in each autosome wasrestored to its respective control level by betaine supplemen-tation (Table 2). Combining these data, the average methyla-tion of all autosomes was 72.6% in control diet groupsamples and was decreased to 71.1% in EtOH group samples(p < 0.03 vs. control samples) but was maintained at controldiet levels by betaine supplementation with 72.4% averagemethylation (p < 0.04 vs. EtOH samples with p = 0.0182
overall diet effect). Evaluating regions of each genome ineach autosome, the average methylation at CpG sites in genebodies in the EtOH group was significantly less than thatfound in the control and betaine groups (Fig. 3A). However,methylation of the majority of CpG sites in promoter regionsand in CpG island shores was unaffected by EtOH feedingand betaine treatment (Fig. 3B).
Effects of EtOH and Betaine on Transcript Levels ofDnmt1,Nos2, and Ppara
We selected a total of 21 genes in pathways of inflamma-tion, lipogenesis, endoplasmic reticulum stress, and methio-nine metabolism for expression analysis by qPCR. Specificprimer sequences and qPCR results for each gene accordingto the 2 genotypes are listed in Tables S1 and S2. Amongthese 21 genes, only Dnmt1, Nos2, and Ppara met criteria forchanges in expression being altered by EtOH feeding andcorrected by betaine supplementation. As the expressions ofNos2 and Ppara were unaffected by genotype, each of theirdietary effects was analyzed by pooling data from both geno-types. On the other hand, Dnmt1 expression was influencedby both genotype and diet, and dietary effects were only sig-nificant in heterozygotes. As shown in Table 3, the meanexpression of Nos2 in pooled data from both genotypes wasincreased 7.6-fold by EtOH treatment and was reduced sig-nificantly to control levels by betaine supplementation.Whereas EtOH feeding reduced Ppara expression in pooledresults from both genotypes, it increased Dnmt1 expressionamong heterozygotes, and values for each gene expressionwere restored to respective control levels by betaine supple-mentation.
Immunohistochemistry of Selected Proteins
ImmunohistochemicalstainingforproteinlevelsofDNMT1and iNOS in liver specimens fromCbS heterozygousmice fol-lowed similar dietary patterns as found for their gene tran-scripts, with maximal and significant staining in the EtOH
Table 1. Effects of Diets in CbSWild-Type and Heterozygous Mice
Wild-type control(6)
Wild-type EtOH(4)
Wild-type betaine(6)
Hetero control(7)
Hetero EtOH(8)
Hetero betaine(8)
Body weight (g) 28 � 1.2 28.9 � 3.4 26.8 � 5.3 30 � 1.3 29.1 � 4.6 26.2 � 4Liver weight (g) 1.5 � 0.1a 2.5 � 0.4b 2 � 0.4b 1.6 � 0.1a 2.7 � 0.7b 1.9 � 0.4a
Liver/body weight 0.05 � 0.01a 0.08 � 0.01b 0.07 � 0.01b 0.05 � 0.01a 0.09 � 0.01b 0.07 � 0.01c
Blood EtOH (mg/ml) 5.3 � 1.5a 286 � 167b 249 � 110b 5.1 � 2.1a 156 � 121b 185 � 97b
ALT (U/l) 19.6 � 6.6a 93.5 � 20.4b 113.5 � 109b 30.8 � 28.9a 107.3 � 48b 121 � 99b
Liver SAM (nmol/g) 57.4 � 5a 27.6 � 16.0b 2862 � 1113c 69.5 � 14.4a 32.0 � 16.2b 3,087 � 2,123c
Liver SAH (nmol/g) 31.6 � 10.7a 57.2 � 25.0b 100.8 � 46.7b 59.6 � 19.7a 74.6 � 21.4a 131.2 � 56.2b
SAM:SAH 2 � 0.6a 0.65 � 0.6b 39.1 � 35.8c 1.31 � 0.5a 0.48 � 0.3b 39.5 � 56.0c
Plasma homocysteine(nmol/ml)
4.3 � 2.6a 14.0 � 6.8b 10.4 � 8.2ab 12.2 � 6.2a 80.6 � 52.8b 12.6 � 9.1a
ALT, alanine aminotransferase; CbS, cystathionine beta synthase; SAM, S-adenosylmethionine; SAH, S-adenosylhomocysteine; EtOH, ethanol. Val-ues are expressed as mean � standard deviation. The number of mice in each group is reported in parentheses. Values with different letter symbol aresignificantly different (p < 0.05) from each other within each genotype. There were no genotype effects except for plasma homocysteine (p < 0.003) inthe 2 different EtOH-fed groups.
ALCOHOLIC LIVER DISEASE ANDDNAMETHYLATION 1543

Fig. 2. Histopathology of mouse livers after 4 weeks of control (A and D), ethanol (B and E), and betaine-supplemented ethanol diet (C and F) (hema-toxylin and eosin, 109). Selective images show typical changes in wild-type (top) and heterozygous mice (bottom) and followed by quantitative scores foreach diet and genotype. Values in the table are expressed as mean � standard deviation. The number of mice in each group is reported in parentheses.Values with different letter symbols are significantly different (p < 0.05) from each other within each genotype.
Table 2. Methylation of Autosomes byMethylC-seq Genome Analyses
Chromosome Control EtOH Betaine p-Value EtOH vs. control p-Value betaine vs. EtOH
1 73.95 � 0.41 72.51 � 0.57 73.84 � 0.51 0.0282 0.04102 71.84 � 0.43 70.41 � 0.51 71.60 � 0.40 0.0219 0.03123 74.02 � 0.44 72.52 � 0.61 73.90 � 0.53 0.0318 0.04514 71.39 � 0.45 69.99 � 0.55 71.29 � 0.47 0.0292 0.03765 72.05 � 0.46 70.59 � 0.52 71.89 � 0.41 0.0233 0.03126 73.56 � 0.39 72.07 � 0.58 73.35 � 0.44 0.0274 0.04327 70.00 � 0.43 68.64 � 0.52 69.87 � 0.40 0.0273 0.03528 72.38 � 0.44 70.95 � 0.53 72.25 � 0.39 0.0245 0.03069 72.35 � 0.43 70.88 � 0.57 72.21 � 0.45 0.0270 0.037210 73.87 � 0.40 72.46 � 0.53 73.72 � 0.39 0.0253 0.034611 69.23 � 0.44 67.88 � 0.49 69.03 � 0.29 0.0248 0.036412 73.26 � 0.50 71.72 � 0.61 73.07 � 0.45 0.0311 0.043513 74.20 � 0.45 72.80 � 0.57 74.03 � 0.44 0.0323 0.046814 73.91 � 0.43 72.37 � 0.58 73.77 � 0.50 0.0253 0.035815 72.51 � 0.36 71.08 � 0.52 72.31 � 0.40 0.0215 0.034916 74.31 � 0.42 72.90 � 0.59 74.16 � 0.43 0.0325 0.045717 71.77 � 0.37 70.44 � 0.46 71.61 � 0.37 0.0191 0.029118 74.43 � 0.37 72.93 � 0.53 74.21 � 0.42 0.0206 0.034619 70.91 � 0.40 69.58 � 0.46 70.74 � 0.28 0.0208 0.0291X 73.48 � 0.57 71.93 � 0.71 73.13 � 0.58 0.0461 0.0914All autosomes 72.55 � 0.43 71.11 � 0.54 72.39 � 0.42 0.0254 0.0358
EtOH, ethanol.
1544 MEDICI ET AL.

group that was normalized by betaine supplementation(Fig. 4).On theother hand, protein levels ofPparadidnot fol-low the same trend as their gene expressions, because its meanlevel was increased by EtOH feeding, and there was no differ-enceafterbetainetreatment.
Pyrosequencing
Samples from CbS heterozygote mice were selected for py-rosequencing analyses of the same 3 genes with differentialgene expressions according to diet, and DNA regions werechosen according to anticipated changes prior MethylC-seqanalyses. As there were no significant methylation differencesamong groups in promoter region CpG sites in any of the 3genes, representative sites were selected according to CpG-rich sites in gene bodies. As shown in Table 4, DNA methyl-ation of CpG-rich regions in Dnmt1 and Ppara was not sig-nificantly different in liver samples from the 3 diet groups,except for increased methylation of Dnmt1 in the betainesupplement group at a region over 1 kb upstream of thetranscription start site in chromosome 9. On the other hand,the percent DNA methylation in a region spanning 7 CpGsites in the second intron of Nos2 was significantly reduced
by EtOH feeding and was sustained at control levels by beta-ine supplementation. Among all 3 diet groups in this CbSheterozygote cohort, the percent DNA methylation of Nos2in this region was correlated negatively with its relativeexpression (r = �0.5104; p < 0.03) and positively with liverSAM (r = 0.7538, p < 0.0001) and the SAM/SAH ratio(r = 0.79850, p < 0.0001). Whereas a previous study foundthat the transcription of Nos2 in mouse mesangial cells wasinhibited by hypermethylation of a specific promoter regionin its DNA (Yu and Kone, 2004), we were unable to findmethylation differences in the same Nos2 promoter region inthe heterozygote livers of control, EtOH-fed, and betaine-supplemented mice.
DISCUSSION
Epigenetic regulation of genes relevant to liver injury inASH may be closely related to underlying EtOH-inducedchanges in methionine metabolism. Our initial studies in mi-cropigs fed EtOH-containing diets that were deficient in thefolate methyl donor demonstrated accelerated onset of thehistopathology of ASH with significant decreases in hepaticSAM and the SAM/SAH methylation ratio compared tothose fed folate replete diet (Halsted et al., 2002) togetherwith increased transcript levels of genes involved in endoplas-mic reticulum stress and lipogenesis (Esfandiari et al., 2005).Subsequent intervention studies in the same micropig modelshowed that the histopathology of ASH, abnormal SAM/SAH ratio, and the activation of the same liver injury genescould be prevented by concurrent supplementation of EtOHdiets with the methyl donor SAM (Esfandiari et al., 2007;Villanueva et al., 2007). More recently, we demonstratedthat 4-week intragastric feeding of EtOH to CbS heterozy-gous mice reduced the SAM/SAH ratio while elevating theexpressions of selected endoplasmic reticulum genes, each ofwhich were associated with decreased H3K9me3 histonemethylation (Esfandiari et al., 2010).The main findings of the present study are, first, that 4
weeks of EtOH feeding resulted in increased steatosis andtotal hepatic histopathology scores typical of early ASH inboth genotypes, together with significant reductions in SAMand the SAM/SAH methylation ratio, all of which wereprevented by supplementing the EtOH diet with the methyldonor betaine (Fig. 2 and Table 1). Contrasting genotype
Fig. 3. Genome-wide changes in methylation in (A) gene bodies and(B) promoters, CpG islands (CGIs), and CGI shores. The average methyl-ation was computed for each gene/promoter/CGI and CGI shore withineach of the 3 groups, and differences among groups were plotted as den-sity histograms. As shown in (A) for gene bodies, ethanol diet samples hadon average 1.2% less methylation than betaine-supplemented diet sam-ples, whereas control diet samples had on average 1.5% greater methyla-tion than ethanol diet samples. As shown in (B), ethanol and betainetreatments did not change methylation levels in promoters, CGIs, or CGIshores.
Table 3. Relative Gene Expressions ofDnmt1, Nos2, and Ppara
Diet Dnmt1 Nos2 Ppara
Control 0.126 � 0.77a (7) �0.208 � 1.069a (10) �0.609 � 0.469a (13)Ethanol 1.817 � 0.463b (8) 7.610 � 2.616b (12) �2.079 � 0.401c (12)Betaine �2.7 � 1.639ac (8) �2.694 � 2.445ac (14) �0.095 � 0.756ac (14)
Dnmt1, DNAmethyltransferase 1; Nos2, nitric oxide synthase; Ppara, peroxisome proliferator receptor-a.Data are expressed as mean � standard error of mean. In parentheses, the numbers of mice studied in each group. All data are represented by rela-
tive fold differences from control values within each genotype. As there were no genotype effects on expressions of Nos2 and Ppara, values were calcu-lated by pooling diet data from both genotypes, whereas Dnmt1 data refer to heterozygous mice only. Values with different letters are significantlydifferent at p < 0.05.
ALCOHOLIC LIVER DISEASE ANDDNAMETHYLATION 1545

effects, plasma homocysteine levels were significantlyincreased in the EtOH-fed heterozygotes compared to thosein the wild-type mice (Table 1), as has been shown by others
who developed this model (Watanabe et al., 1995). Thesedata showing greater perturbation of methionine metabolismamong heterozygotes provide a rationale for the use of thisgenotype for several of the subsequent analyses, includingMethylC-seq genomic and pyrosequencing methylationanalyses. Unexpectedly, betaine supplementation did not sig-nificantly reduce ALT levels in either genotype despite theimprovement of histological scores of inflammation and stea-tosis in both genotypes. A prior study on the effects of beta-ine supplementation in a similar intragastric mouse modelwith 6 weeks of EtOH feeding showed decreased serumhomocysteine and prevention of the steatosis response toEtOH but nonsignificant reduction in ALT levels (Ji andKaplowitz, 2003). We may speculate that longer dietaryexposure in our mouse model could have been associatedwith greater histopathology in the EtOH groups and poten-tial reductions in ALT in the betaine-supplemented groups.
Second, there were no significant changes in global DNAmethylation according to dot-blot analyses of all samples
Fig. 4. Immunohistochemical staining for iNOS, DNMT1, and PPARa in representative liver sections from heterozygous mice fed control (A, D, G),ethanol (B, E, H), and betaine-supplemented ethanol diets (C, F, I). Both iNOS and DNMT1 are shown at 109, and PPARa is shown at 409 magnifica-tion. Immunohistochemical intensity units are shown in the accompanying table. Values are expressed as mean � standard deviation intensity units. Val-ues with different letter superscripts are significantly different, p < 0.05. DNMT1, DNA methyltransferase 1; iNOS, inducible nitric oxide synthase;PPARa, peroxisome proliferator receptor-a.
Table 4. CpGmethylation ofDnmt1, Nos2, and Ppara in HeterozygousMice
Diet Dnmt1 Nos2 Ppara
Control 47.9 � 8.47a (5) 43.81 � 0.63c (6) 39.5 � 7.89 (5)Ethanol 47.6 � 7.48a (5) 41.17 � 0.77d (7) 36.4 � 4.53 (5)Betaine 60.5 � 5.5b (5) 45.59 � 1.73c (7) 27.6 � 5.29 (5)
Dnmt1, DNA methyltransferase 1; Nos2, nitric oxide synthase; Ppara,peroxisome proliferator receptor-a.
Values are expressed as mean � standard deviation. In parenthesesare the number of mice studied in each group.Dnmt1 chromosome 9, basepair position in gene body 20,766,199 to 20,766,217; Nos2: chromosome11, second intron, base pair position 78,738,995 to 78,739,403, including 7CpG sites; Ppara chromosome 15, base pair position in promoter region at8,557,227 to 8,557,256. Values with different letter symbols are signifi-cantly different: a versus b: p < 0.04; c versus d p < 0.01.
1546 MEDICI ET AL.

from both genotypes and all 3 diets. These findings are con-sistent with those from our prior study (Esfandiari et al.,2010) which used the liquid chromatography-tandem massspectrometry (LC-TMS) method to calculate percentage ofmethylated cytosine residues among total cytosine residues(Quinlivan and Gregory, 2008). Both methylation dot-blotand MethylC-seq specifically quantitate CpG site methyla-tion, while LC-TMS measures all cytosine methylation.According to prior studies in animal models of other liverdiseases, global DNA methylation may be regulated in partby underlying hepatic inflammation (Gonda et al., 2012;Medici et al., 2013; Stenvinkel et al., 2007; Wierda et al.,2010), which was minimal in our studies.Third, our genome analysis of heterozygote samples by
MethylC-seq showed that DNA hypomethylation wasinduced by EtOH feeding in each of 19 autosomes and wasprevented in each autosome by betaine supplementation(Table 2). Furthermore, the results of this analysis showedthat hypomethylation occurred exclusively in gene bodies,whereas no diet-induced methylation effects were found ingene promoter regions (Fig. 3). These novel findings high-light the need to examine gene body methylation patternswhen examining DNA methylation changes in other modelsof ASH. Our data are consistent with other genome-widestudies of DNA methylation patterns, in which CpG islandpromoters are predominantly un-methylated, in contrast tothe high levels of methylation within gene bodies (Aranet al., 2011; Ball et al., 2009; Lister et al., 2009; Zemachet al., 2010). Recent studies indicate that gene body methyla-tion levels are likely to be determined by the greater accessi-bility of their DNA to methyl donors and methyltransferases(Jjingo et al., 2012).Fourth, among the 21 selected genes related to liver
injury and methionine metabolism, only Nos2, Ppara, andDnmt1 presented patterns of changes in transcript levelsthat reflected opposing responses to EtOH and betaine sup-plementation. In particular, EtOH feeding increased boththe transcript and protein levels of Dnmt1 in heterozygousmice and of Nos2 in pooled genotype samples, each ofwhich were reduced by provision of the methyl donor beta-ine, whereas the transcript levels of Ppara were reduced byEtOH and maintained at control levels by betaine (Table 3and Fig. 4).Fifth, the findings of significant methylation changes in
the gene body of Nos2 (Table 4) are supported by the novelobservation from methylome analysis that the effects ofEtOH on mouse chromosomes are confined to gene bodiesand are not found in promoter regions (Fig. 3).The significant correlations of these findings with SAM/
SAH ratios from all 3 diet groups support a potential linkbetween the effects of EtOH and betaine with hepatic methi-onine metabolism and gene-specific methylation. However,as gene expression is regulated by many factors, we cannotinfer a specific causative relationship between the methyla-tion pattern of Nos2 (Table 4) at this gene body site and itsexpression (Table 3), whereas the clinical relevance of this
finding may only be established by additional studies in liverbiopsies from ASH patients.iNOS is required for the sustained generation of nitric
oxide, which, in turn, causes a broad spectrum of injury,including processes of lipid peroxidation, mitochondrial dis-ruption, and DNA damage with pro-apoptotic effects (Daviset al., 2001). Others correlated increased liver Nos2 expres-sion and activity in rats fed high EtOH diets with the severityof steatosis and necroinflammation in association with acti-vation of nuclear factor kappa beta and induction of tumornecrosis factor alpha (Yuan et al., 2006). Furthermore, mito-chondrial dysfunction and the histopathology of ASH weresignificantly attenuated in EtOH-fed Nos2 knockout mice(Venkatraman et al., 2004) and in mice treated with a selec-tive iNOS inhibitor (McKim et al., 2003). Consistent withour present findings, others found more than 40-fold eleva-tion in hepatic Nos2 transcript levels in mice fed an intraga-stric EtOH and high-fat diet, together with more severehistopathology than shown in the present experiment (Xuet al., 2011), whereas betaine supplementation reversed liverhistopathology, elevated iNOS levels, and nitric oxide accu-mulation in an EtOH-fed rat model of ASH (Kharbandaet al., 2012).PPARa functions as a transcription factor to induce the
expressions of a series of genes involved in fatty acid trans-port, mitochondrial fatty acid oxidation, catabolism, andinflammatory responses.Our present data showed a discrepancy between the tran-
script and protein expressions of Ppara in response to EtOHfeeding (Table 3 and Fig. 4) and no changes among dietgroups in its DNA methylation according to pyrosequencing(Table 4). Another study showed that Ppara gene expressionwas both increased and associated with increased DNAmethylation in EtOH-fed rats (Khachatoorian et al., 2013),while others showed that down-regulation of Ppara geneexpression is involved in the development of steatosis associ-ated with ASH (Aoyama et al., 1998). The regulation ofPpara expression is complex and is influenced by fatty acidaccumulation (Kersten et al., 2000), whereas its protein levelis unstable and is rapidly degraded through the ubiquitin–proteasome pathway (Blanquart et al., 2002). The observa-tion that the ubiquitin–proteasome pathway is inhibited byEtOH (French, 2000) could account for our findings ofincreased PPARa protein levels according to immunohisto-chemistry after EtOH diet (Fig. 4).Dnmt1 encodes the principal mammalian DNMT and
functions in maintenance of methylation status. Our studyshowed that EtOH feeding of heterozygous mice increasedthe transcript and protein levels of Dnmt1 (Table 3, Fig. 4),which were each reduced by provision of the methyl donorbetaine, whereas pyrosequencing demonstrated that methyl-ation targeted an upstream nonpromoter region of the genebody after betaine treatment (Table 4). Limited data areavailable on the role of Dnmt1 in the development of ASH.EtOH-fed Dnmt1 N/+ hypomorphic mice that expressreduced levels of Dnmt1 presented less severe hepatic
ALCOHOLIC LIVER DISEASE ANDDNAMETHYLATION 1547

steatosis than wild-type mice with normal expression ofDnmt1, together with concomitant dysregulation of keyenzymes involved in lipid metabolism and oxidative stress(Kutay et al., 2012). Consistent with our findings, the meth-ylation of the promoter regions of the genes for EtOH andlipid metabolism in that study was not different among geno-types and dietary treatments, suggesting that factors otherthan DNA methylation regulated gene transcript levels inabsence ofDnmt1 with or without EtOH feeding.
In summary, EtOH feeding of the CbS-deficient mousemodel reduced the hepatic SAM/SAH ratio of methylationcapacity in association with reduced gene body methylationin all autosomes and in a specific gene body site inNos2, eachof which were prevented by betaine supplementation. Eventhough this is a new finding, its clinical significance remainsuncertain and other factors linking methylation to geneexpression changes in ASH include histone modifications(Esfandiari et al., 2010; Mandrekar, 2011; Shukla et al.,2008) and/or potential effects of EtOH-induced liver injuryand inflammation on epigenetic marks as described by others(Gonda et al., 2012; Medici et al., 2013; Stenvinkel et al.,2007; Wierda et al., 2010).
ACKNOWLEDGMENTS
This research was supported by National Institutes ofHealth grant numbers K08DK084111 (to VM),R03AA020577-01 (to CHH), P50AA11991 Southern Cali-fornia Research Center for ALPD and Cirrhosis (to HT),P50AA11991 Morphology Core (to SWF), R01ES021707(to JML and DIS), and by a Biomedical LaboratoryResearch and Development National Merit Review grantBX001155 from the Department of Veterans Affairs, Officeof Research and Development (to KKK). VM is a memberof the University of California San Francisco Liver Center(Liver Center grant number P30 DK026743) and receivedfunds from the Division of Gastroenterology and Hepatolo-gy at UC Davis. The content is the sole responsibility of theauthors and does not necessarily represent the official viewsof the National Institutes of Health.
REFERENCES
Aoyama T, Peters JM, Iritani N, Nakajima T, Furihata K, Hashimoto T,
Gonzalez FJ (1998) Altered constitutive expression of fatty acid-metabo-
lizing enzymes in mice lacking the peroxisome proliferator-activated recep-
tor alpha (PPARalpha). J Biol Chem 273:5678–5684.Aran D, Toperoff G, Rosenberg M, Hellman A (2011) Replication timing-
related and gene body-specific methylation of active human genes. Hum
Mol Genet 20:670–680.Ball MP, Li JB, Gao Y, Lee JH, LeProust EM, Park IH, Xie B, Daley GQ,
Church GM (2009) Targeted and genome-scale strategies reveal gene-body
methylation signatures in human cells. Nat Biotechnol 27:361–368.Bardag-Gorce F, Oliva J, Villegas J, Fraley S, Amidi F, Li J, Dedes J, French
B, French SW (2008) Epigenetic mechanisms regulate Mallory Denk body
formation in the livers of drug-primed mice. ExpMol Pathol 84:113–121.Blanquart C, Barbier O, Fruchart JC, Staels B, Glineur C (2002) Peroxisome
proliferator-activated receptor alpha (PPARalpha) turnover by the
ubiquitin-proteasome system controls the ligand-induced expression level
of its target genes. J Biol Chem 277:37254–37259.Bustin SA, Benes V, Garson JA, Hellemans J, Huggett J, Kubista M, Muel-
ler R, Nolan T, Pfaffl MW, Shipley GL, Vandesompele J, Wittwer CT
(2009) The MIQE guidelines: minimum information for publication of
quantitative real-time PCR experiments. Clin Chem 55:611–622.Chen PY, Cokus SJ, Pellegrini M (2010) BS Seeker: precise mapping for
bisulfite sequencing. BMC Bioinformatics 11:203.
Clarke S, Banfield K (2001) S-adenosylmethionine-dependent methyltransfe-
rases, in Homocysteine in Health and Disease (Carmel R, Jacobsen D eds),
pp 63–78. Cambridge University Press, Cambridge.
Davis KL,Martin E, Turko IV, Murad F (2001) Novel effects of nitric oxide.
Annu Rev Pharmacol Toxicol 41:203–236.Dayal S, Wilson KM, Leo L, Arning E, Bottiglieri T, Lentz SR (2006)
Enhanced susceptibility to arterial thrombosis in a murine model of hyper-
homocysteinemia. Blood 108:2237–2243.Esfandiari F, Medici V, Wong DH, Jose S, Dolatshahi M, Quinlivan E,
Dayal S, Lentz SR, Tsukamoto H, Zhang YH, French SW, Halsted CH
(2010) Epigenetic regulation of hepatic endoplasmic reticulum stress
pathways in the ethanol-fed cystathionine beta synthase-deficient mouse.
Hepatology 51:932–941.Esfandiari F, Villanueva JA, Wong DH, French SW, Halsted CH (2005)
Chronic ethanol feeding and folate deficiency activate hepatic endoplasmic
reticulum stress pathway in micropigs. Am J Physiol Gastrointest Liver
Physiol 289:G54–G63.
Esfandiari F, You M, Villanueva JA, Wong DH, French SW, Halsted CH
(2007) S-adenosylmethionine attenuates hepatic lipid synthesis inmicropigs
fed ethanol with a folate-deficient diet. Alcohol Clin ExpRes 31:1231–1239.French SW (2000) Mechanisms of alcoholic liver injury. Can J Gastroenterol
14:327–332.French SW, Nash J, Shitabata P, Kachi K, Hara C, Chedid A, Mendenhall
CL (1993) Pathology of alcoholic liver disease. VA Cooperative Study
Group 119. Semin Liver Dis 13:154–169.Gonda TA, Kim YI, Salas MC, Gamble MV, Shibata W, Muthupalani S,
Sohn KJ, Abrams JA, Fox JG, Wang TC, Tycko B (2012) Folic acid
increases global DNA methylation and reduces inflammation to prevent
Helicobacter-associated gastric cancer in mice. Gastroenterology 142:824–833.e7.
Halsted CH, Medici V (2011) Vitamin-dependent methionine metabolism
and alcoholic liver disease. AdvNutr 2:421–427.Halsted CH, Villanueva JA, Devlin AM, Niemela O, Parkkila S, Garrow
TA, Wallock LM, Shigenaga MK, Melnyk S, James SJ (2002) Folate defi-
ciency disturbs hepatic methionine metabolism and promotes liver injury
in the ethanol-fed micropig. Proc Natl Acad Sci USA 99:10072–10077.Ji C, Kaplowitz N (2003) Betaine decreases hyperhomocysteinemia, endo-
plasmic reticulum stress, and liver injury in alcohol-fed mice. Gastroenter-
ology 124:1488–1499.Jjingo D, Conley AB, Yi SV, Lunyak VV, Jordan IK (2012) On the presence
and role of human gene-body DNAmethylation. Oncotarget 3:462–474.Kersten S, Desvergne B, Wahli W (2000) Roles of PPARs in health and dis-
ease. Nature 405:421–424.Khachatoorian R, Dawson D, Maloney EM, Wang J, French BA, French
SW (2013) SAMe treatment prevents the ethanol-induced epigenetic alter-
ations of genes in the Toll-like receptor pathway. Exp Mol Pathol 94:243–246.
Kharbanda KK (2009) Alcoholic liver disease and methionine metabolism.
Semin Liver Dis 29:155–165.Kharbanda KK, Rogers DD 2nd, Mailliard ME, Siford GL, Barak AJ, Bec-
kenhauer HC, Sorrell MF, Tuma DJ (2005) Role of elevated S-adenosyl-
homocysteine in rat hepatocyte apoptosis: protection by betaine. Biochem
Pharmacol 70:1883–1890.Kharbanda KK, Todero SL, King AL, Osna NA, McVicker BL, Tuma DJ,
Wisecarver JL, Bailey SM (2012) Betaine treatment attenuates chronic eth-
anol-induced hepatic steatosis and alterations to the mitochondrial respira-
tory chain proteome. Int J Hepatol 2012:962183.
Kutay H, Klepper C, Wang B, Hsu SH, Datta J, Yu L, Zhang X, Majumder
S, Motiwala T, Khan N, Belury M, McClain C, Jacob S, Ghoshal K
1548 MEDICI ET AL.

(2012) Reduced susceptibility of DNA methyltransferase 1 hypomorphic
(Dnmt1N/+) mice to hepatic steatosis upon feeding liquid alcohol diet.
PLoS ONE 7:e41949.
Lister R, Pelizzola M, Dowen RH, Hawkins RD, Hon G, Tonti-Filippini J,
Nery JR, Lee L, Ye Z, Ngo QM, Edsall L, Antosiewicz-Bourget J, Stewart
R, Ruotti V, Millar AH, Thomson JA, Ren B, Ecker JR (2009) Human
DNA methylomes at base resolution show widespread epigenomic differ-
ences. Nature 462:315–322.Lu SC, Huang ZZ, Yang H, Mato JM, Avila MA, Tsukamoto H (2000)
Changes in methionine adenosyltransferase and S-adenosylmethionine
homeostasis in alcoholic rat liver. Am J Physiol Gastrointest Liver Physiol
279:G178–G185.
Mandrekar P (2011) Epigenetic regulation in alcoholic liver disease. World J
Gastroenterol 17:2456–2464.Mato JM, Lu SC (2007) Role of S-adenosyl-L-methionine in liver health and
injury. Hepatology 45:1306–1312.McKim SE, Gabele E, Isayama F, Lambert JC, Tucker LM, Wheeler MD,
Connor HD, Mason RP, Doll MA, Hein DW, Arteel GE (2003) Inducible
nitric oxide synthase is required in alcohol-induced liver injury: studies
with knockout mice. Gastroenterology 125:1834–1844.Medici V, Shibata NM, Kharbanda KK, LaSalle JM, Woods R, Liu S,
Engelberg JA, Devaraj S, Torok NJ, Jiang JX, Havel PJ, Lonnerdal B,
Kim K, Halsted CH (2013) Wilson’s disease: changes in methionine
metabolism and inflammation affect global DNA methylation in early
liver disease. Hepatology 57:555–565.Osman F, Olineka T, Hodzic E, Golino D, Rowhani A (2012) Comparative
procedures for sample processing and quantitative PCR detection of
grapevine viruses. J VirolMethods 179:303–310.Quinlivan EP, Gregory JF 3rd (2008) DNA methylation determination by
liquid chromatography-tandem mass spectrometry using novel biosynthet-
ic [U-15N]deoxycytidine and [U-15N]methyldeoxycytidine internal stan-
dards. Nucleic Acids Res 36:e119.
Schroeder DI, Blair JD, Lott P, Yu HO, Hong D, Crary F, Ashwood P,
Walker C, Korf I, Robinson WP, LaSalle JM (2013) The human placenta
methylome. Proc Natl Acad Sci USA 110:6037–6042.Schroeder DI, Lott P, Korf I, LaSalle JM (2011) Large-scale methylation
domains mark a functional subset of neuronally expressed genes. Genome
Res 21:1583–1591.Shukla SD, Velazquez J, French SW, Lu SC, Ticku MK, Zakhari S (2008)
Emerging role of epigenetics in the actions of alcohol. Alcohol Clin Exp
Res 32:1525–1534.Stenvinkel P, Karimi M, Johansson S, Axelsson J, Suliman M, Lindholm B,
Heimburger O, Barany P, Alvestrand A, Nordfors L, Qureshi AR, Ek-
strom TJ, Schalling M (2007) Impact of inflammation on epigenetic DNA
methylation— a novel risk factor for cardiovascular disease? J Intern Med
261:488–499.
Tsukamoto H, Mkrtchyan H, Dynnyk A (2008) Intragastric ethanol infusion
model in rodents. MethodsMol Biol 447:33–48.Venkatraman A, Shiva S,Wigley A, Ulasova E, Chhieng D, Bailey SM, Dar-
ley-Usmar VM (2004) The role of iNOS in alcohol-dependent hepatotoxic-
ity and mitochondrial dysfunction in mice. Hepatology 40:565–573.Villanueva JA, Esfandiari F, White ME, Devaraj S, French SW, Halsted CH
(2007) S-adenosylmethionine attenuates oxidative liver injury in micropigs
fed ethanol with a folate-deficient diet. Alcohol Clin Exp Res 31:1934–1943.
Villanueva JA, Halsted CH (2004) Hepatic transmethylation reactions in mi-
cropigs with alcoholic liver disease. Hepatology 39:1303–1310.Watanabe M, Osada J, Aratani Y, Kluckman K, Reddick R, MalinowMR,
Maeda N (1995) Mice deficient in cystathionine beta-synthase: animal
models for mild and severe homocyst(e)inemia. Proc Natl Acad Sci USA
92:1585–1589.Wierda RJ, Geutskens SB, Jukema JW, Quax PH, van den Elsen PJ (2010)
Epigenetics in atherosclerosis and inflammation. J Cell Mol Med 14:1225–1240.
Woods R, Vallero RO, Golub MS, Suarez JK, Ta TA, Yasui DH, Chi LH,
Kostyniak PJ, Pessah IN, Berman RF, Lasalle JM (2012) Long-lived epi-
genetic interactions between perinatal PBDE exposure and Mecp2308
mutation. HumMol Genet 21:2399–2411.Xu J, Lai KK, Verlinsky A, Lugea A, French SW, Cooper MP, Ji C, Tsu-
kamoto H (2011) Synergistic steatohepatitis by moderate obesity and alco-
hol in mice despite increased adiponectin and p-AMPK. J Hepatol
55:673–682.Yu Z, Kone BC (2004) Hypermethylation of the inducible nitric-oxide syn-
thase gene promoter inhibits its transcription. J Biol Chem 279:46954–46961.
Yuan GJ, Zhou XR, Gong ZJ, Zhang P, Sun XM, Zheng SH (2006) Expres-
sion and activity of inducible nitric oxide synthase and endothelial nitric
oxide synthase correlate with ethanol-induced liver injury. World J Gas-
troenterol 12:2375–2381.Zemach A, McDaniel IE, Silva P, Zilberman D (2010) Genome-wide evolu-
tionary analysis of eukaryotic DNAmethylation. Science 328:916–919.
SUPPORTING INFORMATION
Additional Supporting Information may be found in theonline version of this article:Table S1.Genes selected for expression analyses.Table S2.Relative gene expressions by qPCR according to
genotype.
ALCOHOLIC LIVER DISEASE ANDDNAMETHYLATION 1549
Copyright © 2022 FDOKUMEN