Effect of iso-octane/methane blend on laminar burning velocity and flame instability
Upload
independentCategory
view
0download
0
Proceedings
Proceedings of the Combustion Institute 31 (2007) 321–328
www.elsevier.com/locate/proci
of the
CombustionInstitute
Methyl concentration time-histories duringiso-octane and n-heptane oxidation and pyrolysis q
D.F. Davidson *, M.A. Oehlschlaeger, R.K. Hanson
Mechanical Engineering Department, Stanford University, Stanford, CA 94305, USA
Abstract
Methyl radical concentration time-histories were measured during the oxidation and pyrolysis ofiso-octane and n-heptane behind reflected shock waves. Initial reflected shock conditions covered tem-peratures of 1100–1560 K, pressures of 1.6–2.0 atm and initial fuel concentrations of 100–500 ppm.Methyl radicals were detected using cw UV laser absorption near 216 nm; three wavelengths were usedto compensate for time- and wavelength-dependent interference absorption. Methyl time-histories werecompared to the predictions of several current oxidation models. While some agreement was foundbetween modeling and measurement in the early rise, peak and plateau values of methyl, and in theignition time, none of the current mechanisms accurately recover all of these features. Sensitivity anal-ysis of the ignition times for both iso-octane and n-heptane showed a strong dependence on the reac-tion C3H5 + H = C3H4 + H2, and a recommended rate was found for this reaction. Sensitivity analysisof the initial rate of CH3 production during pyrolysis indicated that for both iso-octane and n-heptane,reaction rates for the initial decomposition channels are well isolated, and overall values for these rateswere obtained. The present concentration time-history data provide strong constraints on the reactionmechanisms of both iso-octane and n-heptane oxidation, and in conjunction with OH concentrationtime-histories and ignition delay times, recently measured in our laboratory, should provide a self-con-sistent set of kinetic targets for the validation and refinement of iso-octane and n-heptane reactionmechanisms.� 2006 The Combustion Institute. Published by Elsevier Inc. All rights reserved.
Keywords: CH3 time-histories; Shock tube; Reaction rate measurements; iso-Octane; n-Heptane
1. Introduction
There is a growing need for a wide range ofreliable, self-consistent kinetic targets for the val-idation and refinement of large hydrocarbon reac-tion mechanisms and a simultaneous need foraccurate reaction rate measurements for the criti-
1540-7489/$ - see front matter � 2006 The Combustion Institdoi:10.1016/j.proci.2006.07.087
qSupplementary data for this article can be accessed
online. See Appendix A.* Corresponding author.E-mail address: [email protected] (D.F. Davidson).
cal reactions in these mechanisms. While there hasbeen a great deal of work on the smaller hydrocar-bons, such as C1 and C2 compounds, as evidencedby the development of the GRI mechanism fornatural gas [1], there has not been the same levelof experimental detail available for the largerhydrocarbons, and in particular, for iso-octaneand n-heptane. Information on these two speciesis valuable because together they are the primaryreference fuel components for gasoline, and indi-vidually because iso-octane is an archetypicallarge branched alkane and used as a single-com-ponent surrogate for gasoline in HCCI engine
ute. Published by Elsevier Inc. All rights reserved.

322 D.F. Davidson et al. / Proceedings of the Combustion Institute 31 (2007) 321–328
modeling, and n-heptane is an archetypical nor-mal alkane and used as a single-component surro-gate for diesel.
Shock tubes can provide critically neededtarget data for these larger hydrocarbons. Thesedata can take the form of ignition delay times,concentration time-histories for transient radicaland stable species, and reaction rate measure-ments for critical elementary reactions. Consen-sus shock-tube-derived ignition delay time dataare now available for both iso-octane andn-heptane over a wide array of temperatures,pressures, fuel concentrations and stoichiome-tries from our laboratory and elsewhere [2–5].We also have measured species time-historiesfor OH during iso-octane and n-heptane oxida-tion [6,7], and examined reaction rates ofkey decomposition reactions of n-alkane andbranched alkane decomposition [8]. However,information on methyl radical concentrationsduring iso-octane and n-heptane oxidation hasnot previously been available. This informationis needed as CH3 is a good indicator of fueldecomposition and of intermediate carbon con-version, particularly for alkanes, where it is aprecursor for the formation of formaldehyde,HCO and CO.
Current high-temperature oxidation mecha-nisms for iso-octane and n-heptane suggest rapidconversion of the initial fuel to CH3 and othersmall radicals and stable intermediates [9–12].Among these smaller intermediates, CH3 plays asignificant role. In an analysis of the fuel decom-position given later, approximately 12% of thecarbon in iso-octane and 14% of the carbon inn-heptane rapidly takes the form of CH3. Onceformed, the CH3 is relatively stable as a combus-tion intermediate and remains in relatively largeconcentrations with long pre-ignition plateausduring the oxidation for both fuels. At the temper-atures of this study, 1100–1600 K, the decomposi-tion of iso-octane and n-heptane are dominated bysimple pyrolysis, and accurate experimentallyderived rate coefficients for these reactions areneeded. Currently only estimated values or valuesfrom indirect determinations are available; seeCurran et al. and others for details of these esti-mates [9–12].
To help extend the kinetics database for iso-octane and n-heptane, we have measured CH3
concentration time-histories during the high tem-perature oxidation and pyrolysis in a shock tubeusing narrow-linewidth laser absorption. Model-ing and sensitivity analysis of these concentrationtime-histories and ignition times provide anopportunity to evaluate existing reaction mecha-nisms and to measure several critical reactions.To our knowledge these measurements are thefirst laser-based methyl time-history measure-ments for reaction of large hydrocarbons in ashock tube.
2. Experimental setup
CH3 concentration time-histories were mea-sured behind reflected shock waves using nar-row-linewidth laser absorption at 216 nm. Herewe briefly describe the shock tube facility, andthen the laser absorption scheme.
Measurements were performed by bursting,with pressurized helium, 0.12–0.25 mm polycar-bonate diaphragms separating a 3.35 m long driv-er section and a 8.54 m long, 14.25 cm diameter,stainless steel electro-polished driven section.The driven section of the shock tube was turbo-molecular pumped and regularly achieved ulti-mate pressures and leak/outgassing rates of10�7 torr and 1–3 · 10�6 torr/min, respectively.Optical access is made 2 cm from the end wallthrough diametrically opposed fused silica win-dows along with piezo-electric transducer (PZT)pressure measurements. Incident shock speedswere measured using 5 PZT transducers and con-ditions behind the reflected shock waves were cal-culated with a chemically frozen ideal shock code,based on incident shock speeds extrapolatedto the shock tube end wall. Reflected shocktemperature uncertainties are of the order of±0.5–1.5%. Test gas mixtures are made in an80 L stainless steel, magnetically driven, turbo-pumped, heated mixing tank using research gradeargon and oxygen gases and the vapor pressureabove the 99+% spectrophotometric grade fuelliquids; pressures were measured using accurateMKS� Baratron capacitance manometers.
Laser light near 216 nm was generated using aCoherent� 7 W all-lines argon ion UV laserpumping a Coherent� 699 ring dye laser flowingwith Stilbene 3 dye, using the technique previouslydeveloped in our laboratory by Oehlschlaegeret al. [13]. The fundamental radiation from thering dye laser was doubled in a Spectra-Physics�Delta external cavity using a b-BBO crystal togenerate 3 mW of 216 nm light. The stabilityand wavelength of the fundamental radiationwas monitored using a scanning interferometerand Burleigh� wavemeter. The UV radiationwas divided into two beams, the reference beam(I0) and the transmitted beam (I) which passedthrough the shock tube. Both beams were detectedwith specialized Hamamatsu� S1722-02 Si UVsensitive photo-diodes added to ThorLabs�PDA 55 detectors.
This absorption scheme permitted the determi-nation of CH3 concentration from the simpleBeer–Lambert relation:
I=I0 ¼ expð�KCH3ðkÞPX CH3
LÞ; ð1Þwhere P is the total pressure in atm, L is the path-length in cm (the shock tube inner diameter), XCH3
is the mole fraction of CH3, and kCH3(k) is the
absorption coefficient in atm�1 cm�1, which is pri-marily a function of temperature and wavelength.

D.F. Davidson et al. / Proceedings of the Combustion Institute 31 (2007) 321–328 323
CH3 has a wide pre-dissociatively broadenedabsorption feature (B2A 01–X2A002) near 216 nm.Three wavelengths were used in this study; theabsorption coefficient at the center wavelength216.55 nm was previously determined by Oehlsch-laeger et al. [13], and those at 214.97 and218.70 nm were measured in this study using thesame method
kCH3ð216:55 nmÞ¼ 1:48� 104 T�1 expð2109=T Þ ½atm�1 cm�1� ð2Þ
kCH3ð214:97 nmÞ¼ 1:14� 104 T�1 expð1509=T Þ ½atm�1 cm�1� ð3Þ
kCH3ð218:70 nmÞ¼ 1:18� 104 T�1 expð980=T Þ ½atm�1 cm�1� ð4Þ
Example absorption data at all three wavelengthsare shown in Fig. 1. These three measurementswere made during different shock wave experi-ments with near-identical conditions, in whichonly the laser wavelength was varied. The temper-atures of the three different shocks were 1557,1558 and 1561 K. The three data traces showlow noise, typically equivalent to absorptions of±0.1–0.2%. The small spikes at �75 ls are the re-sult of schlieren beam steering from the incidentshock passage; the schlieren spikes from thereflected shock passage are hidden in the rapid riseat 0 ls. After ignition at 700 ls, the absorption re-turns to the zero pre-shock level. The differencesin the three signals are due to differences in theabsorption coefficients of CH3 and those of theinterfering species. At early times the signal isdominated by CH3 absorption, while at latertimes the absorption of the secondary productscan be of the same magnitude as that of CH3.
0 200 400 600 800 10000.0
0.2
0.4
0.6
0.8
1.0
500 ppm Iso-Octane1559K, 1.55 atmφ=1.0 / Argon
Abs
orba
nce
Time [μs]
216.55 nm 214.97 nm 218.70 nm
Fig. 1. Example methyl absorption traces for iso-octaneoxidation at three wavelengths. Initial shock conditions:1559 K, 1.55 atm, 500 ppm iso-octane, 6250 ppm oxygenin argon.
3. Interference absorption
Near 216 nm where these CH3 absorption mea-surements are performed, there is interferenceabsorption from the intermediate products of oxi-dation. These species include the major fueldecomposition products: ethylene, higher olefinsand conjugated olefins. Previous absorption mea-surements in our laboratory of acetylene and eth-ylene indicate that only minor interference isexpected from these two species [13]. The absorp-tion from the intermediate species also changeswith time. To separate out the CH3 concentrationtime-history from the UV absorption data a mul-ti-wavelength strategy was used. The approach issimilar to the two-wavelength strategy used forOH measurements in iso-octane ignition per-formed previously in our laboratory [2].
We assume that at any time during the experi-ment and at any wavelength near the centralwavelength k0, there is an unknown amount ofabsorption due to non-CH3 sources and that thisabsorption has an absorption coefficient-molefraction-equivalent product of the form:
kINTðkÞX INT ¼ kINTðk0Þð1� eðk� ðk0ÞÞX INT ð5Þwhere k0 is 216.55 nm, the center absorptionwavelength, and kINT(k)XINT is the time-depen-dent interference kX product at wavelength k. eis the (assumed) linear slope of the interferenceabsorption coefficient as a function of wavelengthand is also a function of time. This expressioncombined with the Beer–Lambert expression givesthe total absorption measured at each wavelength:
lnðI=I0Þ=PL ¼ kCH3ðkÞX CH3
þ kINTðkÞX INT ð6ÞWith absorbance measurements at all three differ-ent wavelengths and Eqs. (2)–(6) we can solve forthe three unknowns: XCH3
(the desired quantity),kINT(k)XINT and e at each time during an experi-ment. The information in the kINT(k)XINT and etime-histories is not used in the present analysisother than to gauge the relative magnitude ofthe interference when compared to the CH3
absorption.
4. Data and modeling
Twenty-four experimental conditions werestudied, each at three wavelengths, for a total of72 shock wave experiments: 27 in pyrolysis sys-tems and 45 in oxidative systems. Figure 2 showsCH3 concentration time-histories for stoichiome-tric iso-octane oxidation at 1559 K, 1.55 atm with500 ppm of fuel and 6250 ppm O2 in argon, andFig. 3 shows the variation of these profiles withtemperature. During the initial decomposition ofthe fuel at T = 1559 K, CH3 forms a peak ofapproximately 500 ppm near 5 ls and disappears

0 200 400 600 800 1000
0
20
-20
-40
-60
(1) H+O2=O+OH(2) C3H5+H=C3H4+H2(3) C3H6+H=C3H5+H2(4) CH4+M=CH3+H+M(5) C3H5+O=C2H3HCO+H(6) C3H5=C2H2+CH3
CH
3 S
ensi
tivity
Time [μs]
(2)
(1)
(5,6)
(3,4)
Fig. 4. CH3 sensitivity plot for iso-octane ignition at theconditions of Fig. 2. The six largest sensitivities are shown.
10 100 1000
10
100
CH
3 M
ole
Fra
ctio
n [p
pm]
Time [μs]
500ppm n-Heptane1395 K, 1.72 atmφ= 1 / Argon
Ref. [12] Ref. [10]
Fig. 5. Example methyl absorption data: n-heptaneoxidation. Modeling: dashed line, Held et al. [12]; dot-dashed line, Curran et al. [10]. Initial conditions:500 ppm n-heptane, 5500 ppm O2 in argon.
Fig. 3. CH3 absorption data: iso-octane ignition. Initialconditions: 500 ppm iso-octane, 6250 ppm O2 in argon.Upper trace, 1559 K; middle trace, 1470 K; lower trace,1300 K.
1 10 100 100010
100
1000
CH
3 M
ole
Fra
ctio
n [p
pm]
Time [μs]
500 ppm Iso-Octane1559K, 1.55 atmφ=1.0 / Argon
Ref. [11] Ref. [15] Ref. [14]
Fig. 2. Example methyl absorption data: iso-octaneoxidation. Model calculations: Dashed line, Davis andLaw [11]; dot-dashed line, Ogink and Golovitchev [15];dot-dot-dash line, Pitsch et al. [14].
324 D.F. Davidson et al. / Proceedings of the Combustion Institute 31 (2007) 321–328
at ignition near 650 ls. This peak represents anapproximate 12% carbon yield from iso-octanesimilar to that predicted by the three models:Davis and Law [11], Pitsch et al. [14], and Oginkand Golovitchev [15]. Formation rates for CH3
differ in the Davis and Law mechanism from theother two models, being substantially faster thanexperimentally measured. However the ignitiontime is more accurately captured by the Davisand Law mechanism than the other two models,and the Davis and Law mechanism also capturesthe peak and plateau CH3 values of Fig. 3 rela-tively well (within 20%) over the full temperaturerange.
A sensitivity plot for CH3 based on the Davisand Law mechanism is shown in Fig. 4. Sensitivityis defined here as
SlocalðtÞ ¼ ½ðdX CH3=dkiÞðtÞ�½ki=X CH3
ðtÞ�:The main competing sensitivities for ignition timeare for the two reactions H + O2 = OH + O andC3H5 + H = C3H4 + H2. This competition makesthe ignition times of iso-octane at these conditionsvery sensitive to the reaction rate of C3H5 + Hand the rates of reactions forming C3H5. Thesame reaction plays a similar role in n-heptaneoxidation at these conditions.
Figure 5 shows CH3 concentration time-histo-ries for stoichiometric n-heptane oxidation at1395 K, 1.72 atm with 500 ppm of fuel and550 ppm O2 in argon, and Fig. 6 shows the varia-tion of these profiles with temperature. Duringthe initial decomposition of the fuel (see Fig. 5),CH3 forms a peak of approximately 170 ppm near40 ls and disappears at ignition near 1000 ls. Thispeak represents an approximate 5% carbon yieldfrom n-heptane, similar to that predicted by theCurran et al. mechanism [10], but different than
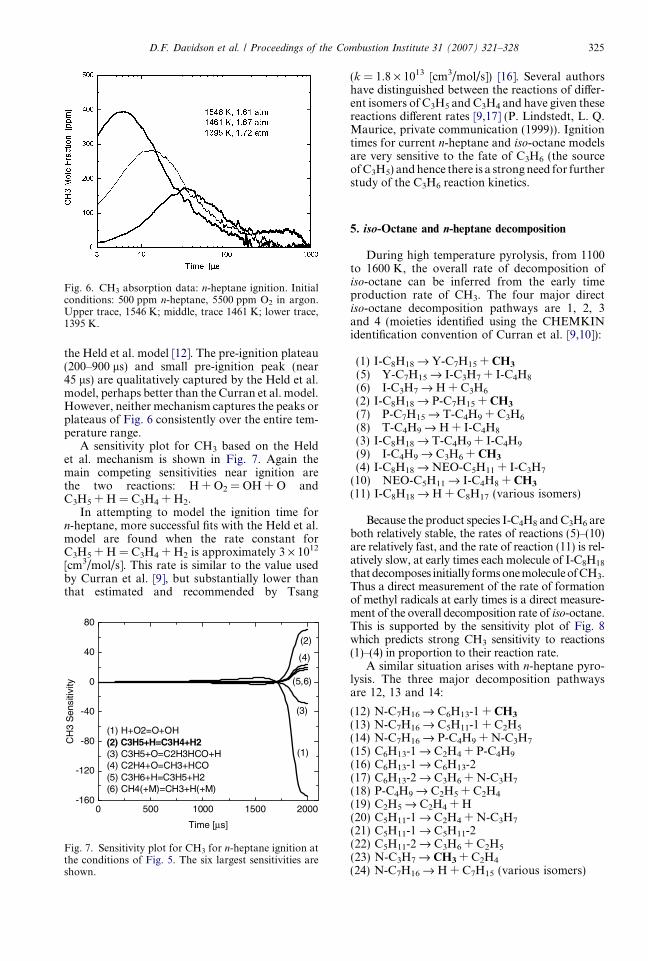
Fig. 6. CH3 absorption data: n-heptane ignition. Initialconditions: 500 ppm n-heptane, 5500 ppm O2 in argon.Upper trace, 1546 K; middle, trace 1461 K; lower trace,1395 K.
D.F. Davidson et al. / Proceedings of the Combustion Institute 31 (2007) 321–328 325
the Held et al. model [12]. The pre-ignition plateau(200–900 ls) and small pre-ignition peak (near45 ls) are qualitatively captured by the Held et al.model, perhaps better than the Curran et al. model.However, neither mechanism captures the peaks orplateaus of Fig. 6 consistently over the entire tem-perature range.
A sensitivity plot for CH3 based on the Heldet al. mechanism is shown in Fig. 7. Again themain competing sensitivities near ignition arethe two reactions: H + O2 = OH + O andC3H5 + H = C3H4 + H2.
In attempting to model the ignition time forn-heptane, more successful fits with the Held et al.model are found when the rate constant forC3H5 + H = C3H4 + H2 is approximately 3 · 1012
[cm3/mol/s]. This rate is similar to the value usedby Curran et al. [9], but substantially lower thanthat estimated and recommended by Tsang
0 500 1000 1500 2000-160
-120
-80
-40
0
40
80
(1) H+O2=O+OH(2) C3H5+H=C3H4+H2(3) C3H5+O=C2H3HCO+H(4) C2H4+O=CH3+HCO(5) C3H6+H=C3H5+H2(6) CH4(+M)=CH3+H(+M)
CH
3 S
ensi
tivity
Time [μs]
(1)
(2)
(3)
(4)
(5,6)
Fig. 7. Sensitivity plot for CH3 for n-heptane ignition atthe conditions of Fig. 5. The six largest sensitivities areshown.
(k = 1.8 · 1013 [cm3/mol/s]) [16]. Several authorshave distinguished between the reactions of differ-ent isomers of C3H5 and C3H4 and have given thesereactions different rates [9,17] (P. Lindstedt, L. Q.Maurice, private communication (1999)). Ignitiontimes for current n-heptane and iso-octane modelsare very sensitive to the fate of C3H6 (the sourceof C3H5) and hence there is a strong need for furtherstudy of the C3H6 reaction kinetics.
5. iso-Octane and n-heptane decomposition
During high temperature pyrolysis, from 1100to 1600 K, the overall rate of decomposition ofiso-octane can be inferred from the early timeproduction rate of CH3. The four major directiso-octane decomposition pathways are 1, 2, 3and 4 (moieties identified using the CHEMKINidentification convention of Curran et al. [9,10]):
(1) I-C8H18 fi Y-C7H15 + CH3
(5) Y-C7H15 fi I-C3H7 + I-C4H8
(6) I-C3H7 fi H + C3H6
(2) I-C8H18 fi P-C7H15 + CH3
(7) P-C7H15 fi T-C4H9 + C3H6
(8) T-C4H9 fi H + I-C4H8
(3) I-C8H18 fi T-C4H9 + I-C4H9
(9) I-C4H9 fi C3H6 + CH3
(4) I-C8H18 fi NEO-C5H11 + I-C3H7
(10) NEO-C5H11 fi I-C4H8 + CH3
(11) I-C8H18 fi H + C8H17 (various isomers)
Because the product species I-C4H8 and C3H6 areboth relatively stable, the rates of reactions (5)–(10)are relatively fast, and the rate of reaction (11) is rel-atively slow, at early times each molecule of I-C8H18
that decomposes initially forms one molecule of CH3.Thus a direct measurement of the rate of formationof methyl radicals at early times is a direct measure-ment of the overall decomposition rate of iso-octane.This is supported by the sensitivity plot of Fig. 8which predicts strong CH3 sensitivity to reactions(1)–(4) in proportion to their reaction rate.
A similar situation arises with n-heptane pyro-lysis. The three major decomposition pathwaysare 12, 13 and 14:
(12) N-C7H16 fi C6H13-1 + CH3
(13) N-C7H16 fi C5H11-1 + C2H5
(14) N-C7H16 fi P-C4H9 + N-C3H7
(15) C6H13-1 fi C2H4 + P-C4H9
(16) C6H13-1 fi C6H13-2(17) C6H13-2 fi C3H6 + N-C3H7
(18) P-C4H9 fi C2H5 + C2H4
(19) C2H5 fi C2H4 + H(20) C5H11-1 fi C2H4 + N-C3H7
(21) C5H11-1 fi C5H11-2(22) C5H11-2 fi C3H6 + C2H5
(23) N-C3H7 fi CH3 + C2H4
(24) N-C7H16 fi H + C7H15 (various isomers)

Fig. 9. CH3 production during n-heptane pyrolysis.Initial conditions: 1330 K, 1.78 atm, 500 ppm n-heptane,balance Ar.
Fig. 10. Rate of production of CH3 during iso-octaneand n-heptane pyrolysis. dXCH3
/dt is in units of ppmCH3 per ls per 100 ppm of initial fuel loading. Exper-imental pressures over this range of temperatures aregiven by P [atm] = 2.88 – T [K]/1200.
0 20 40 60 80 100-0.4
-0.2
0.0
0.2
0.4
0.6
CH
3 S
ensi
tivity
Time [μs]
C8H18=T-C4H9+I-C4H9 (3)C8H18=Y-C7H15+CH3 (1)C8H18=neo-C5H11+I-C3H7 (4)
C8H18=P-C7H15+CH3 (2)
C8H18+H=C8H17+H22CH3=C2H6
Fig. 8. Methyl sensitivity during iso-octane pyrolysis.Initial conditions: 1300 K, 1.5 atm, 100 ppm iso-octane,balance argon. Constant volume calculation using theCurran et al. mechanism [9]. Primary decompositionchannels are shown as solid lines; secondary interferingreactions are shown as dashes.
326 D.F. Davidson et al. / Proceedings of the Combustion Institute 31 (2007) 321–328
Here reactions (15)–(23) are relatively fast,reaction (24) is relatively slow, and C2H4 andC3H6 are relatively stable. For pathway (12), theimmediate methyl yield is 100% and a secondmethyl can be rapidly generated (in competitionwith reaction (15)) through the isomerizationchannel reactions (16), (17) and (23). For pathway(13) the methyl yield is determined by the branch-ing ratio of reactions (20) and (21); reaction (20)produces a methyl from N-C3H7 and the isomeri-zation channel reactions (21) and (22) do not. Forpathway (14) one methyl is produced through thedecomposition of N-C3H7. Using the estimatedn-heptane branching ratios of Babushok andTsang [18; W. Tsang, private communication(2005)] and measured alkyl radical decompositionbranching ratios from Yamauchi et al. [19] we findfrom 1300 to 1600 K that the predicted methylyield for the overall decomposition rate (molesof CH3 produced for each mole of fuel) variesfrom 88% to 91%. Because of the uncertaintiesin these estimates, we will assume, for simplicity,an overall methyl yield of 100% in the rate deter-mination. This methyl yield is also consistent withthe ethylene yields measured in our laboratory forn-heptane [20].
Example n-heptane pyrolysis data are shown inFig. 9. The excellent sensitivity of the CH3 absorp-tion diagnostic is evident with minimum detectiv-ities of order 1 ppm, though the noise level issomewhat higher than observed in iso-octaneexperiments (not shown here). CH3 productionrates are determined from initial rise, typicallyover the first 3–30 ls depending on temperature.
Figure 10 presents the raw rate of CH3 pro-duction data for both iso-octane and n-heptanepyrolysis for pressures from 1.6 to 2.0 atm. Scat-
ter in these measurements is small and the sen-sitivity of the methyl diagnostic is sufficientthat the rates can be measured over four ordersof magnitude.
The comparison of the measured overall rateof iso-octane and n-heptane decomposition andestimated values from several workers is shownin Fig. 11. In the iso-octane data there is evi-dence of some pressure-dependent falloff at thehigher temperatures where the pressures areslightly lower. For both fuels, the rates reportedin Davis and Law [11] (and Held et al. [12]which are the same) intersect the current mea-surements. The estimates of Curran et al.[9,10] and Babushok and Tsang [18] (W. Tsang,private communication (2005)) are lower than

0.65 0.70 0.75 0.80 0.85103
104
105
106D
ecom
posi
tion
Ra
te k
[s-1]
1000/T [1/K]
1428 K 1250 K
Iso-Octane
n-Heptane
Fig. 11. First-order decomposition rates k for iso-octaneand n-heptane. Upper three lines, iso-octane; lower fourlines, n-heptane. Solid lines, fit to data; dashed lines,Davis and Law rates [11]; short dashes, Curran et al.rates [9,10]; dot-dasheded line, Babushok and Tsang [18](W. Tsang, private communication (2005)).
D.F. Davidson et al. / Proceedings of the Combustion Institute 31 (2007) 321–328 327
the measured values, but recover the correctactivation energy. Expressions for the overalldecomposition rate measurements in argon pre-sented in Fig. 11 are the following:
n-heptane : k ½s�1�¼ 9:00� 1014 expð�67; 300 ½cal=mol�=RT ½K�Þ;1300� 1600 K; 1:8 atm
iso-octane : k ½s�1�¼ 5:20� 1015 expð�67; 800 ½cal=mol�=RT ½K�Þ;1200� 1400 K; 1:7 atm
Uncertainties in these measurements are ±30%with the largest uncertainty being the effect ofsecondary reactions and the estimated branchingratios during n-heptane decomposition. Theoreti-cally predicted rates for alkane decompositionreactions should be improved by comparison withthese measurements, and the implementation ofthese rates in reaction mechanisms shouldimprove their predictive power at early times.
6. Conclusions
We have measured CH3 concentration time-histories for iso-octane and n-heptane oxidationand pyrolysis at high temperatures. These mea-surements are the first laser-based methyl time-history measurements for large hydrocarbons ina shock tube. These data provide validation tar-gets for many aspects of their reaction mecha-nisms including: the rate of fuel decomposition(initial CH3 rate of rise), fuel decompositionbranching ratios (peak CH3 concentrations), pre-
ignition chemistry (CH3 plateau levels), and igni-tion times (disappearance of CH3).
A preferred reaction rate forC3H5 + H = C3H4 + H2 was inferred from theignition times of both fuels. Overall decomposi-tion rates were determined from the rate of pro-duction of CH3 during pyrolysis of iso-octaneand n-heptane.
This work is part of a continuing effort at Stan-ford University to generate a fundamental kineticsdatabase utilizing shock tube data to supportmodeling and mechanism development for practi-cal fuels and their components [21]. When takenin conjunction with recent OH concentrationtime-histories and ignition time measurementsmade in our laboratory under similar conditions,these data place increasingly strong constraintson the modeling of ignition of these fuels. Furtherwork will include similar studies of fuel compo-nents including aromatics and other speciesincluding HCO, HO2 and benzyl radicals.
Acknowledgments
This work was supported by the US ArmyResearch Office under contract numberW911NF-04-1-0138 and the US Department ofEnergy through the University Consortium forHCCI Engine Research.
Appendix A. Supplementary data
Supplementary data associated with this articlecan be found in the online version at doi:10.1016/j.proci.2006.07.087.
References
[1] G.P. Smith, D.M. Golden, M. Frenklach, N.W.Moriarty, B. Eiteneer, M. Goldenberg, C.T. Bow-man, R.K. Hanson, S. Song, W.C. Gardiner, Jr.,V.V. Lissianski, Z. Qin, GRI-Mech—An OptimizedDetailed Chemical Reaction Mechanism for Meth-ane Combustion, available at http://www.me.berke-ley.edu/gri_mech/ (1995).
[2] D.F. Davidson, M.A. Oehlschlaeger, J.T. Herbon,R.K. Hanson, Proc. Combust. Inst. 29 (2002) 1295–1301.
[3] D.F. Davidson, B.M. Gauthier, R.K. Hanson,Proc. Combust. Inst. 30 (2005) 1175–1182.
[4] D.C. Horning, D.F. Davidson, R.K. Hanson,J. Prop. Power 18 (2002) 363–371.
[5] K. Fieweger, R. Blumenthal, G. Adomeit, Proc.Combust. Inst. 25 (1994) 1579–1585.
[6] D.F. Davidson, J.T. Herbon, D.C. Horning, R.K.Hanson, Intl. J. Chem. Kinet. 33 (2001) 775–783.
[7] M.A. Oehlschlaeger, D.F. Davidson, J.T. Herbon,R.K. Hanson, Intl. J. Chem. Kinet. 36 (2004) 67–78.
328 D.F. Davidson et al. / Proceedings of the Combustion Institute 31 (2007) 321–328
[8] M.A. Oehlschlaeger, D.F. Davidson, R.K. Hanson,J. Phys. Chem. A 108 (2004) 4247–4253.
[9] H.J. Curran, P. Gaffuri, W.J. Pitz, C.K. Westbrook,Combust. Flame 129 (2002) 253–280. Available athttp://www-cms.llnl.gov/combustion/combustion2.html.
[10] H.J. Curran, P. Gaffuri, W.J. Pitz, C.K. Westbrook,Combust. Flame 114 (1998) 149–177.
[11] S.G. Davis, C.K. Law, Proc. Combust. Inst. 27(1998) 521–527.
[12] T.J. Held, A.J. Marchese, F.L. Dryer, Combust.Sci. Tech. 123 (1997) 107–146.
[13] M.A. Oehlschlaeger, D.F. Davidson, R.K. Hanson,Proc. Combust. Inst. 30 (2005) 1119–1127; D.F.Davidson A.Y. Chang, M.D. Di Rosa, R.K. Hanson,J. Quant. Spectrosc. Radiat. Transfer 49 (1993)559–571.
[14] H. Pitsch, N. Peters, K. Seshadri, Proc. Combust.Inst. 26 (1996) 763–771.
[15] R. Ogink, V. Golovitchev, SAE, 2001-01-3614 and2002-01-1745.
[16] W. Tsang, J. Phys. Chem. Ref. Data 20 (1991) 221–273.
[17] L. Q. Maurice, Ph.D. thesis, Department of Mechan-ical Engineering, Imperial College, October 1996.
[18] V. I. Babushok, W. Tsang, J. Prop. Power 20 (2004)403–414.
[19] N. Yamauchi, A. Miyoshi, K. Kosaka, M. Koshi,H. Matsui, J. Phys. Chem. A 103 (1999) 2723–2733.
[20] D.C. Horning, D.F. Davidson, R.K. Hanson, in:Proc. Intl. Symposium Shock Waves 23 (2001) 311–317.
[21] D. F. Davidson, R. K. Hanson, FundamentalKinetics Database Utilizing Shock Tube Measure-ments, Mechanical Engineering Department, Stan-ford University, Stanford CA (2005). http://navier.stanford.edu/hanson/.
Comment
Gernot Friedrichs, Kiel University, Germany. What isthe absolute accuracy of the extracted CH3 peak andplateau concentration?
Reply. The absolute accuracy of the extractedCH3 peak is ±20% and is dominated by the uncer-
tainty in the absorption coefficient and the interfer-ence subtraction method. This number is consistentwith the decomposition rate determinations. The pla-teau concentration has a somewhat larger absoluteuncertainty (±30%) because of the larger interferenceabsorption.
Copyright © 2022 FDOKUMEN