Methods for the integration, modelling and presentation of high-resolution regional hydrochemical...
16
ELSEVIER Journal of Geochemical Exploration 64 (1998) 67–82 Methods for the integration, modelling and presentation of high-resolution regional hydrochemical baseline survey data B. Smith a,L , M.G. Hutchins a , B.G. Rawlins a , T.R. Lister a , P. Shand b a British Geological Survey, Keyworth, Nottingham NG12 5GG, UK b British Geological Survey, Crowmarsh Gifford, Wallingford, Oxon OX10 8BB, UK Accepted 21 May 1998 Abstract The completion of the high-resolution (ca. 1 sample per 1.5 km 2 ) geochemical survey of Wales and part of the West Midlands by the British Geological Survey has created a unique data set containing over 13,500 site-specific hydrochemical and stream-sediment analyses for a typical suite of over 21 major and trace components. The collection of such a wide range of data over an area with contrasting geology, soils, geomorphology and land use has enabled the delineation and study of hydrochemical processes on a regional basis. Methods are presented describing transformations performed from basic concentration-based data (pH, conductivity and 21 major and trace elements) into hydrochemically relevant trilinear and solubility diagrams predicting aqueous speciation and ionic domination. These data are then displayed and interpreted using a series of thematic composites. The utility of coupling speciation diagrams, based upon pure ideal systems, with Geographical Information Systems for describing processes controlling hydrogeochemical evolution at a regional scale is described. The validity of using solubility diagrams to describe large regional hydrochemical data sets is tested using geographically linked representations of aqueous saturation and chemical speciation generated from the individual modelling of each sample using PHREEQC. Comparison of the pure and real (PHREEQC) systems for calcite and gypsum indicated that there was a small over-prediction in the pure system; the greatest differences occurred in samples of the highest ionic strength. 1998 The Natural Environment Research Council Keywords: regional geochemical survey; hydrogeochemical mapping; GIS; surface water chemistry; hydrochemistry 1. Introduction High-resolution baseline mapping of stream-sed- iment chemistry in the United Kingdom is being undertaken by the British Geological Survey (BGS) on a regional basis in the G-BASE (Geochemical BAseline Survey of the Environment) programme. The survey area covering Wales and part of the West Midlands (Figs. 1 and 2), is the first to incorporate L Corresponding author. high-resolution stream-water chemistry. Preliminary studies were undertaken in North Wales by staff of the Geochemistry Group and Hydrogeology Group of the British Geological Survey during the early 1990’s (Simpson et al., 1993), and the survey was subsequently extended to the rest of the area. Approximately 13,500 stream-water samples were collected. The average sample density was 1 per 1.5 km 2 , with a bias towards areas of high stream density in upland regions. Preliminary anal- ysis of the baseline survey data (Simpson et al., 0375-6742/98/$19.00 c 1998 The Natural Environment Research Council PII:S0375-6742(98)00021-1
Transcript of Methods for the integration, modelling and presentation of high-resolution regional hydrochemical...

ELSEVIER Journal of Geochemical Exploration 64 (1998) 67–82
Methods for the integration, modelling and presentation ofhigh-resolution regional hydrochemical baseline survey data
B. Smith a,Ł, M.G. Hutchins a, B.G. Rawlins a, T.R. Lister a, P. Shand b
a British Geological Survey, Keyworth, Nottingham NG12 5GG, UKb British Geological Survey, Crowmarsh Gifford, Wallingford, Oxon OX10 8BB, UK
Accepted 21 May 1998
Abstract
The completion of the high-resolution (ca. 1 sample per 1.5 km2) geochemical survey of Wales and part of the WestMidlands by the British Geological Survey has created a unique data set containing over 13,500 site-specific hydrochemicaland stream-sediment analyses for a typical suite of over 21 major and trace components. The collection of such a widerange of data over an area with contrasting geology, soils, geomorphology and land use has enabled the delineation andstudy of hydrochemical processes on a regional basis. Methods are presented describing transformations performed frombasic concentration-based data (pH, conductivity and 21 major and trace elements) into hydrochemically relevant trilinearand solubility diagrams predicting aqueous speciation and ionic domination. These data are then displayed and interpretedusing a series of thematic composites. The utility of coupling speciation diagrams, based upon pure ideal systems,with Geographical Information Systems for describing processes controlling hydrogeochemical evolution at a regionalscale is described. The validity of using solubility diagrams to describe large regional hydrochemical data sets is testedusing geographically linked representations of aqueous saturation and chemical speciation generated from the individualmodelling of each sample using PHREEQC. Comparison of the pure and real (PHREEQC) systems for calcite and gypsumindicated that there was a small over-prediction in the pure system; the greatest differences occurred in samples of thehighest ionic strength. 1998 The Natural Environment Research Council
Keywords: regional geochemical survey; hydrogeochemical mapping; GIS; surface water chemistry; hydrochemistry
1. Introduction
High-resolution baseline mapping of stream-sed-iment chemistry in the United Kingdom is beingundertaken by the British Geological Survey (BGS)on a regional basis in the G-BASE (GeochemicalBAseline Survey of the Environment) programme.The survey area covering Wales and part of the WestMidlands (Figs. 1 and 2), is the first to incorporate
Ł Corresponding author.
high-resolution stream-water chemistry. Preliminarystudies were undertaken in North Wales by staff ofthe Geochemistry Group and Hydrogeology Groupof the British Geological Survey during the early1990’s (Simpson et al., 1993), and the survey wassubsequently extended to the rest of the area.
Approximately 13,500 stream-water sampleswere collected. The average sample density was 1per 1.5 km2, with a bias towards areas of highstream density in upland regions. Preliminary anal-ysis of the baseline survey data (Simpson et al.,
0375-6742/98/$19.00 c 1998 The Natural Environment Research CouncilPII: S 0 3 7 5 - 6 7 4 2 ( 9 8 ) 0 0 0 2 1 - 1
68 B. Smith et al. / Journal of Geochemical Exploration 64 (1998) 67–82
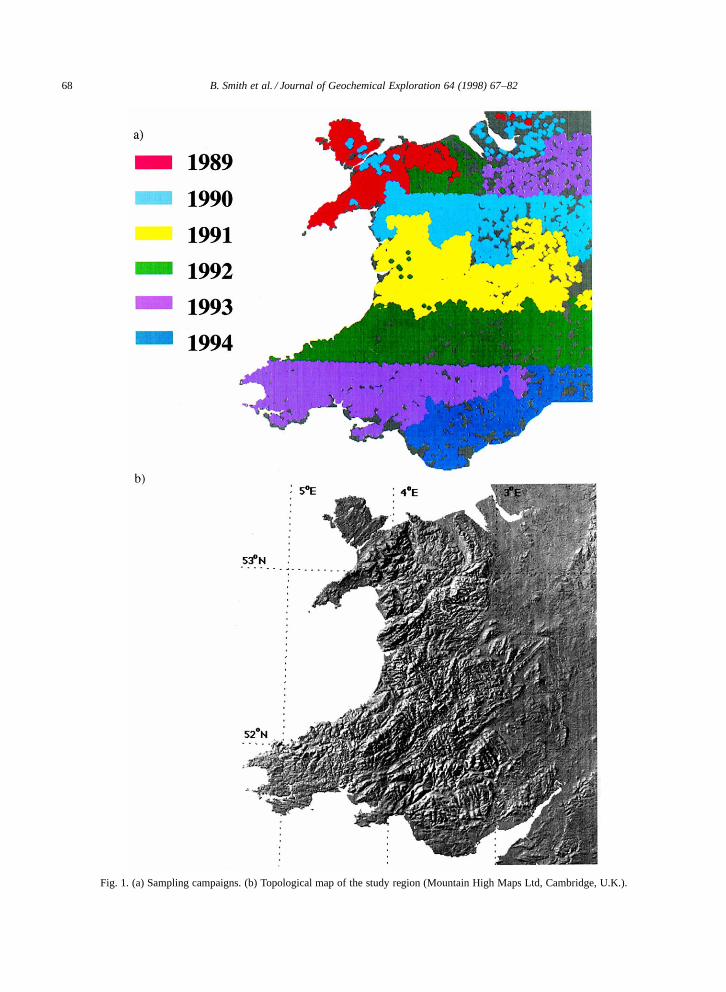
Fig. 1. (a) Sampling campaigns. (b) Topological map of the study region (Mountain High Maps Ltd, Cambridge, U.K.).
B. Smith et al. / Journal of Geochemical Exploration 64 (1998) 67–82 69
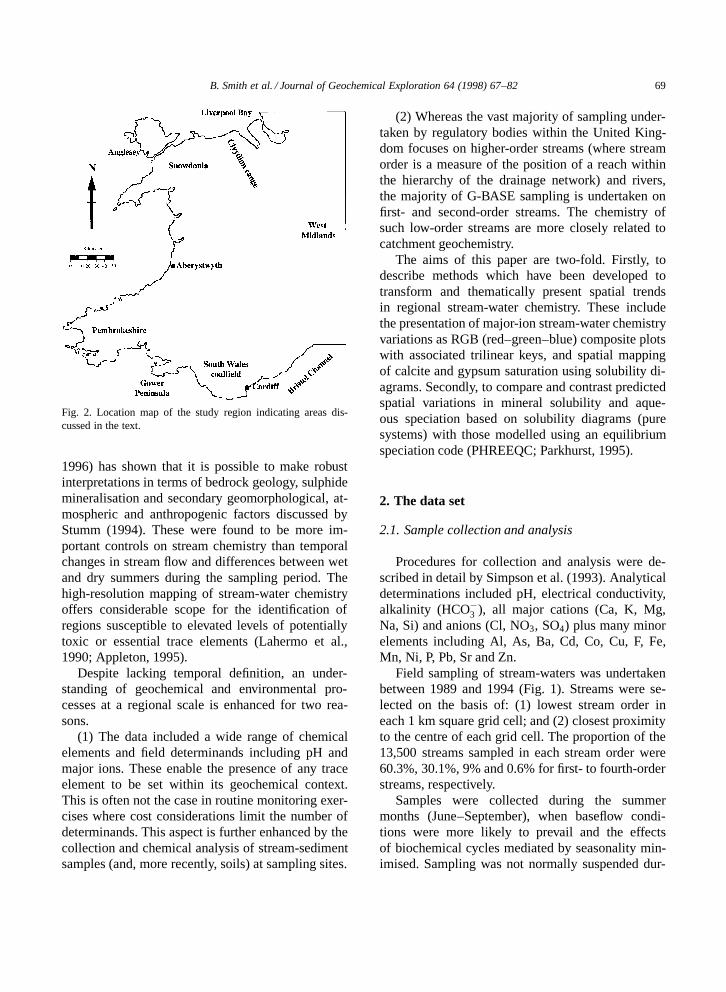
Fig. 2. Location map of the study region indicating areas dis-cussed in the text.
1996) has shown that it is possible to make robustinterpretations in terms of bedrock geology, sulphidemineralisation and secondary geomorphological, at-mospheric and anthropogenic factors discussed byStumm (1994). These were found to be more im-portant controls on stream chemistry than temporalchanges in stream flow and differences between wetand dry summers during the sampling period. Thehigh-resolution mapping of stream-water chemistryoffers considerable scope for the identification ofregions susceptible to elevated levels of potentiallytoxic or essential trace elements (Lahermo et al.,1990; Appleton, 1995).
Despite lacking temporal definition, an under-standing of geochemical and environmental pro-cesses at a regional scale is enhanced for two rea-sons.
(1) The data included a wide range of chemicalelements and field determinands including pH andmajor ions. These enable the presence of any traceelement to be set within its geochemical context.This is often not the case in routine monitoring exer-cises where cost considerations limit the number ofdeterminands. This aspect is further enhanced by thecollection and chemical analysis of stream-sedimentsamples (and, more recently, soils) at sampling sites.
(2) Whereas the vast majority of sampling under-taken by regulatory bodies within the United King-dom focuses on higher-order streams (where streamorder is a measure of the position of a reach withinthe hierarchy of the drainage network) and rivers,the majority of G-BASE sampling is undertaken onfirst- and second-order streams. The chemistry ofsuch low-order streams are more closely related tocatchment geochemistry.
The aims of this paper are two-fold. Firstly, todescribe methods which have been developed totransform and thematically present spatial trendsin regional stream-water chemistry. These includethe presentation of major-ion stream-water chemistryvariations as RGB (red–green–blue) composite plotswith associated trilinear keys, and spatial mappingof calcite and gypsum saturation using solubility di-agrams. Secondly, to compare and contrast predictedspatial variations in mineral solubility and aque-ous speciation based on solubility diagrams (puresystems) with those modelled using an equilibriumspeciation code (PHREEQC; Parkhurst, 1995).
2. The data set
2.1. Sample collection and analysis
Procedures for collection and analysis were de-scribed in detail by Simpson et al. (1993). Analyticaldeterminations included pH, electrical conductivity,alkalinity (HCO�3 ), all major cations (Ca, K, Mg,Na, Si) and anions (Cl, NO3, SO4) plus many minorelements including Al, As, Ba, Cd, Co, Cu, F, Fe,Mn, Ni, P, Pb, Sr and Zn.
Field sampling of stream-waters was undertakenbetween 1989 and 1994 (Fig. 1). Streams were se-lected on the basis of: (1) lowest stream order ineach 1 km square grid cell; and (2) closest proximityto the centre of each grid cell. The proportion of the13,500 streams sampled in each stream order were60.3%, 30.1%, 9% and 0.6% for first- to fourth-orderstreams, respectively.
Samples were collected during the summermonths (June–September), when baseflow condi-tions were more likely to prevail and the effectsof biochemical cycles mediated by seasonality min-imised. Sampling was not normally suspended dur-

70 B. Smith et al. / Journal of Geochemical Exploration 64 (1998) 67–82
ing stormflow conditions and the data presented hereare not corrected for any hydrographic or climaticeffects.
To optimise the conditions of sampling and stor-age for all of the parameters to be determined, sixwater samples were collected at each site. Carewas taken to minimise contamination when han-dling the sample bottles, and all sample bottles andfiltration equipment were rinsed thoroughly withseveral aliquots of the appropriate filtered or un-filtered sample before collection. Three 30-ml sam-ple polystyrene Sterilin vials were filled from thestream after rinsing. An additional unfiltered samplewas collected in a 250-ml polyethylene bottle for themeasurement of alkalinity. A plastic syringe and afilter holder containing a 0.45-µm membrane filterwere used to collect two 30-ml samples filtered intoSterilin vials, one for the determination of the an-ions Cl� and NO�3 (nitrate), and the other for cationanalysis by ICP–AES (inductively coupled plasma–atomic emission spectrometry). At the end of eachday’s sampling the second filtered sample was acid-ified to 1% v=v with high-purity nitric acid. Anacidified deionised water blank in a 30-ml Sterilin
vial was included with every 100 samples as a checkon contamination from the containers and the acid.
pH was measured on return to the field base usinga glass combination electrode connected to a high-performance pH meter (Radiometer Model PHM80). Total alkalinity (bicarbonate, HCO�3 ) was de-termined the day after collection by titrating 100-mlaliquots of samples against sulphuric acid (0.16 or1.6 N) to an end point of pH ¾4.5 using bromocre-sol green as indicator. All remaining samples werebatched in the field and returned to BGS analyt-ical laboratories where automated colorimetry wasused to determine Cl� and NO�3 in the filtered,unacidified water samples (Cook and Miles, 1980).The cations (Na, K, Ca, Mg, Si) and sulphate (asS) were analysed by ICP–AES (inductively coupledplasma atomic emission spectrometry; Miles andCook, 1982).
2.2. Data quality control
The accuracy and precision of analysis performedin the BGS analytical chemistry laboratories is con-trolled through regular inter-laboratory comparison
of river- and waste-water samples (UK Aquacheckscheme), and in batch quality-control standards. Ad-ditional control of within-batch precision, inter-batchprecision, and contamination is maintained by theG-BASE programme through the regular analysis offield blanks and duplicates.
Charge-balance calculations using major-ion con-centrations were performed for each of the 13,500samples. Approximately 11% of samples had chargeimbalances greater than 25% (mostly due to theabsence of one or more major determinands, or oc-casionally to the inappropriate addition of nitric acidto the NO3 and Cl split) and were removed from thedataset. Therefore, the trilinear diagrams and mineralsaturation data presented in this paper are based onapproximately 12,000 individual samples.
Abrupt changes in the concentration of individ-ual determinands would be expected to occur at theboundaries of the annual sampling campaigns if pro-longed differences in hydrological conditions (i.e. wetand dry summers) had significant and persistent ef-fects on stream-water chemistry. However, as illus-trated by Simpson et al. (1996), campaign boundariesare not evident in maps of individual determinands.
3. Data manipulation and presentation
3.1. Thematic maps of solute composition
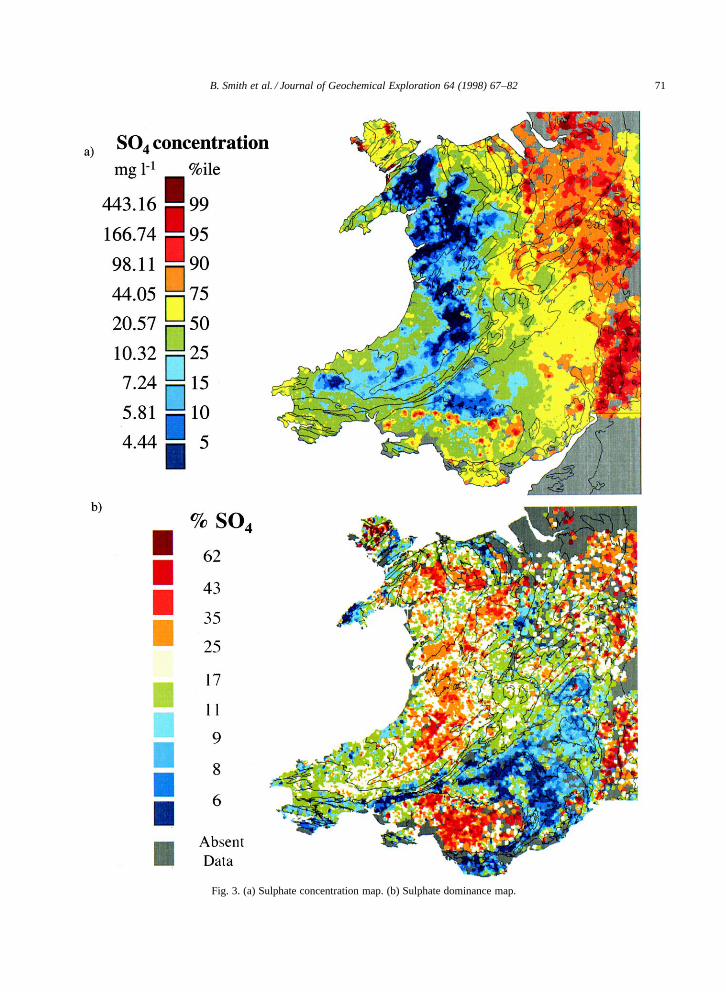
Traditionally within the G-BASE programmestream-sediment and hydrochemical data have beenspatially mapped as concentrations transformed toa percentile distribution (5, 10, 15, 25, 50, 75, 90,95 and 99 percentiles). However, when applied tohydrochemical data, differences resulting from dilu-tion at a regional scale can hinder the delineation ofcompositional changes. An alternative way of pre-senting the data is to show individual major ionsas a percentage of total negative or positive charge(ion dominance) as described in Hem (1985). Fig. 3shows maps of sulphate concentration (expressed inmg=l) and sulphate dominance (both classified ac-cording to a percentile scale). It clearly demonstratesthe advantage of using the latter during investigationsof the origin and relative importance of sulphate instream-water chemistry. The oxidation of sulphur-bearing minerals, particularly pyrite, may account
B. Smith et al. / Journal of Geochemical Exploration 64 (1998) 67–82 71
Fig. 3. (a) Sulphate concentration map. (b) Sulphate dominance map.
72 B. Smith et al. / Journal of Geochemical Exploration 64 (1998) 67–82
for the high proportion of sulphate in stream-watersover the South Wales coalfield. Sulphate dominancealong the eastern margin of the map is a result of thedissolution of gypsum in Triassic sandstones whichextend from Liverpool Bay to the Bristol Channel.
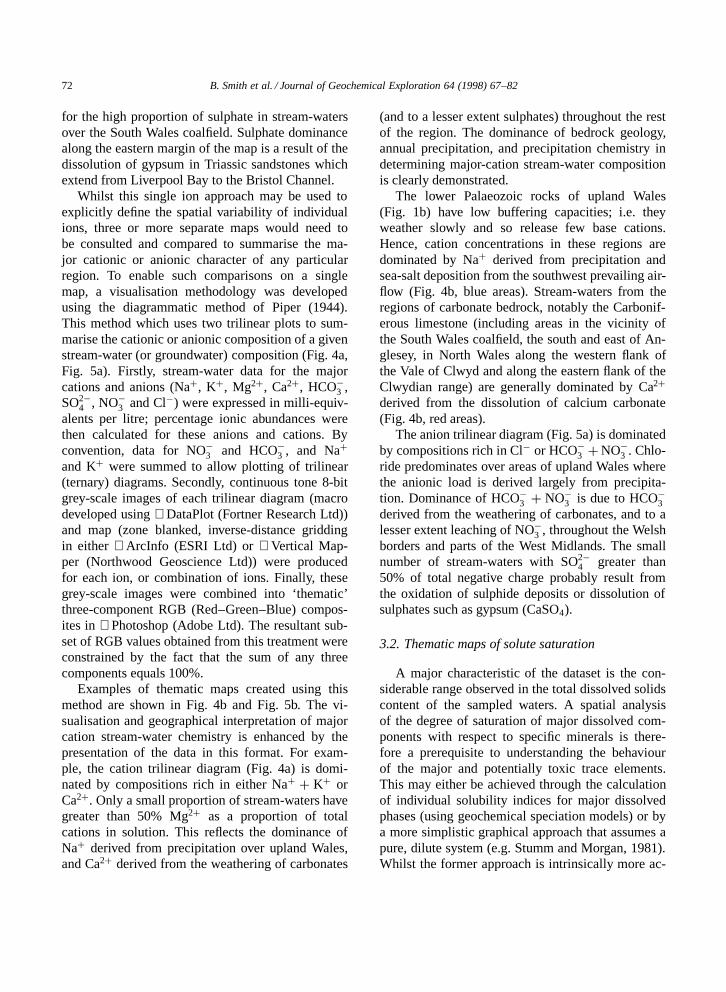
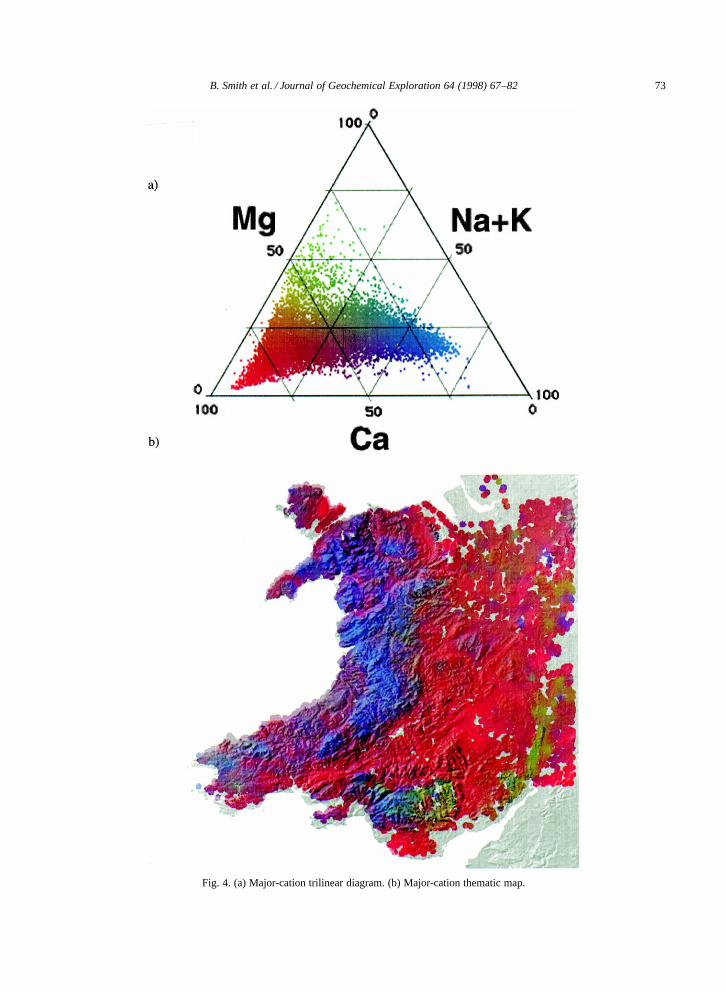
Whilst this single ion approach may be used toexplicitly define the spatial variability of individualions, three or more separate maps would need tobe consulted and compared to summarise the ma-jor cationic or anionic character of any particularregion. To enable such comparisons on a singlemap, a visualisation methodology was developedusing the diagrammatic method of Piper (1944).This method which uses two trilinear plots to sum-marise the cationic or anionic composition of a givenstream-water (or groundwater) composition (Fig. 4a,Fig. 5a). Firstly, stream-water data for the majorcations and anions (NaC, KC, Mg2C, Ca2C, HCO�3 ,SO2�
4 , NO�3 and Cl�) were expressed in milli-equiv-alents per litre; percentage ionic abundances werethen calculated for these anions and cations. Byconvention, data for NO�3 and HCO�3 , and NaC
and KC were summed to allow plotting of trilinear(ternary) diagrams. Secondly, continuous tone 8-bitgrey-scale images of each trilinear diagram (macrodeveloped using DataPlot (Fortner Research Ltd))and map (zone blanked, inverse-distance griddingin either ArcInfo (ESRI Ltd) or Vertical Map-per (Northwood Geoscience Ltd)) were producedfor each ion, or combination of ions. Finally, thesegrey-scale images were combined into ‘thematic’three-component RGB (Red–Green–Blue) compos-ites in Photoshop (Adobe Ltd). The resultant sub-set of RGB values obtained from this treatment wereconstrained by the fact that the sum of any threecomponents equals 100%.
Examples of thematic maps created using thismethod are shown in Fig. 4b and Fig. 5b. The vi-sualisation and geographical interpretation of majorcation stream-water chemistry is enhanced by thepresentation of the data in this format. For exam-ple, the cation trilinear diagram (Fig. 4a) is domi-nated by compositions rich in either NaC C KC orCa2C. Only a small proportion of stream-waters havegreater than 50% Mg2C as a proportion of totalcations in solution. This reflects the dominance ofNaC derived from precipitation over upland Wales,and Ca2C derived from the weathering of carbonates
(and to a lesser extent sulphates) throughout the restof the region. The dominance of bedrock geology,annual precipitation, and precipitation chemistry indetermining major-cation stream-water compositionis clearly demonstrated.
The lower Palaeozoic rocks of upland Wales(Fig. 1b) have low buffering capacities; i.e. theyweather slowly and so release few base cations.Hence, cation concentrations in these regions aredominated by NaC derived from precipitation andsea-salt deposition from the southwest prevailing air-flow (Fig. 4b, blue areas). Stream-waters from theregions of carbonate bedrock, notably the Carbonif-erous limestone (including areas in the vicinity ofthe South Wales coalfield, the south and east of An-glesey, in North Wales along the western flank ofthe Vale of Clwyd and along the eastern flank of theClwydian range) are generally dominated by Ca2C
derived from the dissolution of calcium carbonate(Fig. 4b, red areas).
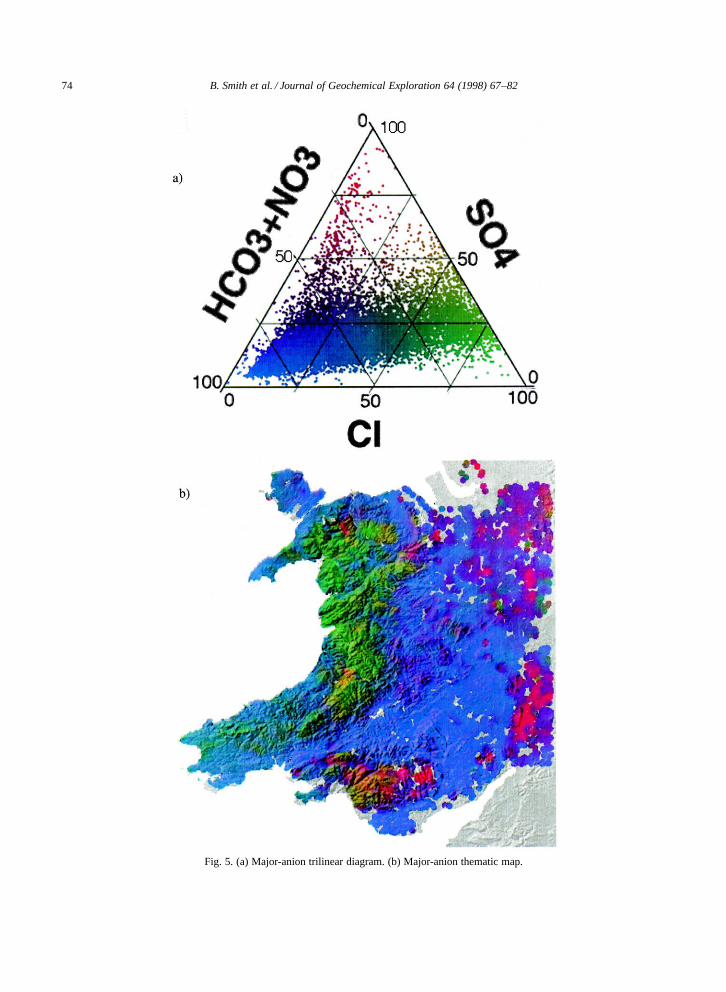
The anion trilinear diagram (Fig. 5a) is dominatedby compositions rich in Cl� or HCO�3 CNO�3 . Chlo-ride predominates over areas of upland Wales wherethe anionic load is derived largely from precipita-tion. Dominance of HCO�3 C NO�3 is due to HCO�3derived from the weathering of carbonates, and to alesser extent leaching of NO�3 , throughout the Welshborders and parts of the West Midlands. The smallnumber of stream-waters with SO2�
4 greater than50% of total negative charge probably result fromthe oxidation of sulphide deposits or dissolution ofsulphates such as gypsum (CaSO4).
3.2. Thematic maps of solute saturation
A major characteristic of the dataset is the con-siderable range observed in the total dissolved solidscontent of the sampled waters. A spatial analysisof the degree of saturation of major dissolved com-ponents with respect to specific minerals is there-fore a prerequisite to understanding the behaviourof the major and potentially toxic trace elements.This may either be achieved through the calculationof individual solubility indices for major dissolvedphases (using geochemical speciation models) or bya more simplistic graphical approach that assumes apure, dilute system (e.g. Stumm and Morgan, 1981).Whilst the former approach is intrinsically more ac-
B. Smith et al. / Journal of Geochemical Exploration 64 (1998) 67–82 73
Fig. 4. (a) Major-cation trilinear diagram. (b) Major-cation thematic map.
74 B. Smith et al. / Journal of Geochemical Exploration 64 (1998) 67–82
Fig. 5. (a) Major-anion trilinear diagram. (b) Major-anion thematic map.
B. Smith et al. / Journal of Geochemical Exploration 64 (1998) 67–82 75
curate, its use on large data sets is limited due tothe complexities of data input. An approach usingsolubility diagrams was therefore developed for thedissolution of calcite and gypsum in a similar man-ner to that described in the previous section fortrilinear diagrams.
The degree of saturation with respect to calcitewas calculated using the equations for calcite sol-ubility at 15ºC (the mean temperature of stream-waters collected during part of the survey) and theformation constant for the bicarbonate ion (Plummerand Busenberg, 1982). A plot of saturation with re-spect to calcite for each of the 12,000 samples inrelation to the line for calcite solubility is shownin Fig. 6a. Red and green colour channels wereused to represent continuous variation in the valuesof (pH C pHCO3) and (2pH � pCa) axes, respec-tively. The HCO�3 concentration of approximately50 stream-water samples were erroneous because aweaker acid was used for alkalinity titration, result-ing in artificially high values, which plot as a band inthe lower right hand corner of Fig. 6a.
The stream-waters most highly undersaturatedwith respect to calcite plot in the lower left corner ofFig. 6a. The resultant pattern shows the weatheringreaction of calcite (Stumm and Morgan, 1981). Thisis equivalent to adding successive small amounts ofcalcite to distilled water until saturation is reached.The similarity in the distribution of the samples mostsaturated with respect to calcite and their proximityto the theoretical solubility line suggest that calcu-lations based on the pure system (Ca2C and HCO�3 )are an effective representation of the pure system.
Stream-waters most undersaturated with respectto calcite are present in upland regions over resistantrocks along the western coastline of Wales, over theSnowdonia region and across the South Wales coal-field (Fig. 6b, red areas). Stream-waters on Old RedSandstone lithologies of the Silurian and Devonianof southwest Wales, and the Permian and Triassicsandstones which extend from Liverpool Bay to theBristol Channel, all approach saturation. This is con-sistent with the presence of calcite cements in theselithologies. The most extensive regions of limestonein Wales, including the Gower Peninsula, the Liasand Carboniferous Limestones to the south of theSouth Wales coalfield, the northern margin of theBristol Channel, in North Wales along the western
flank of the Vale of Clwyd and along the east-ern flank of the Clwydian range, are saturated withrespect to calcite. Other regions of Carboniferouslimestone saturated with respect to calcite includethe south and west of Anglesey and the DevonianOld Red Sandstone which extends along the north-ern margin of the South Wales coalfield and alongthe south of Pembrokeshire.
Fig. 6a can also be used to indicate the partialpressure of CO2 (pCO2). pCO2 increases with de-creasing pH C pHCO3, so that samples lying to theleft of the plot have higher pCO2 than those on theright. Data points enhanced in pCO2 are dark brownand plot in Fig. 6b to the south of Snowdonia and onthe highland area to the east of Aberystwyth.
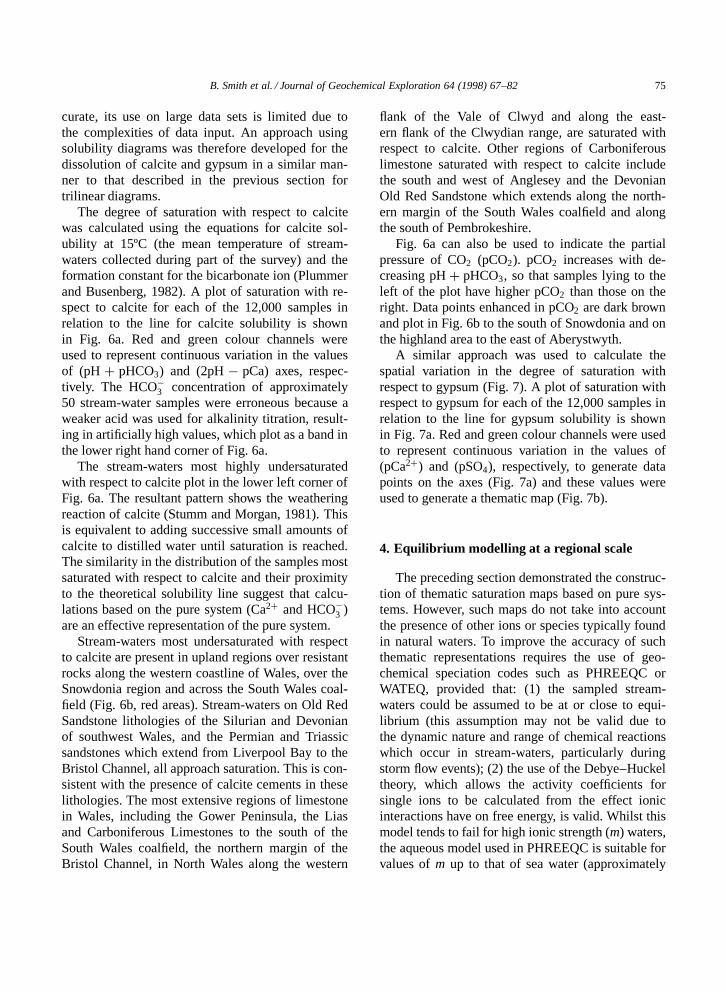
A similar approach was used to calculate thespatial variation in the degree of saturation withrespect to gypsum (Fig. 7). A plot of saturation withrespect to gypsum for each of the 12,000 samples inrelation to the line for gypsum solubility is shownin Fig. 7a. Red and green colour channels were usedto represent continuous variation in the values of(pCa2C) and (pSO4), respectively, to generate datapoints on the axes (Fig. 7a) and these values wereused to generate a thematic map (Fig. 7b).
4. Equilibrium modelling at a regional scale
The preceding section demonstrated the construc-tion of thematic saturation maps based on pure sys-tems. However, such maps do not take into accountthe presence of other ions or species typically foundin natural waters. To improve the accuracy of suchthematic representations requires the use of geo-chemical speciation codes such as PHREEQC orWATEQ, provided that: (1) the sampled stream-waters could be assumed to be at or close to equi-librium (this assumption may not be valid due tothe dynamic nature and range of chemical reactionswhich occur in stream-waters, particularly duringstorm flow events); (2) the use of the Debye–Huckeltheory, which allows the activity coefficients forsingle ions to be calculated from the effect ionicinteractions have on free energy, is valid. Whilst thismodel tends to fail for high ionic strength (m) waters,the aqueous model used in PHREEQC is suitable forvalues of m up to that of sea water (approximately

76 B. Smith et al. / Journal of Geochemical Exploration 64 (1998) 67–82
Fig. 6. (a) Degree of calcite saturation in stream-water samples. (b) Thematic map illustrating degree of calcite saturation.
B. Smith et al. / Journal of Geochemical Exploration 64 (1998) 67–82 77
Fig. 7. (a) Graph of gypsum saturation. (b) Thematic map of gypsum saturation.
78 B. Smith et al. / Journal of Geochemical Exploration 64 (1998) 67–82
0.7; Parkhurst, 1995). Waters described in this pa-per have an inter-quartile range for m of 0.001 to0.007 with a maximum of 0.146, and are thereforesuitable for use in the context of modelling withPHREEQC.
Waters from this survey were modelled to investi-gate the use of aqueous phase speciation calculationand to compare the spatial distribution of solubil-ity data with that prepared using a pure systemapproach.
4.1. Methodology
Speciation models typically require data input in aspecific format, necessitating the editing of chemicalparameters for each sample. This does not present aproblem if modelling is restricted to a few samples.In this study, however, processing of data for approx-imately 12,000 individual samples was required. Thedevelopment of a simplified input and output rou-tine to the speciation code PHREEQC by Parkhurst(1995) has, however, enabled the efficient input ofdata from this study. Data input into PHREEQC wasmade in the form of an ASCII text file edited usinga spreadsheet package. Each model-run lasted forapproximately 1 h when run on an Apple PowerMacintosh (8100) with 32 Mb of RAM.
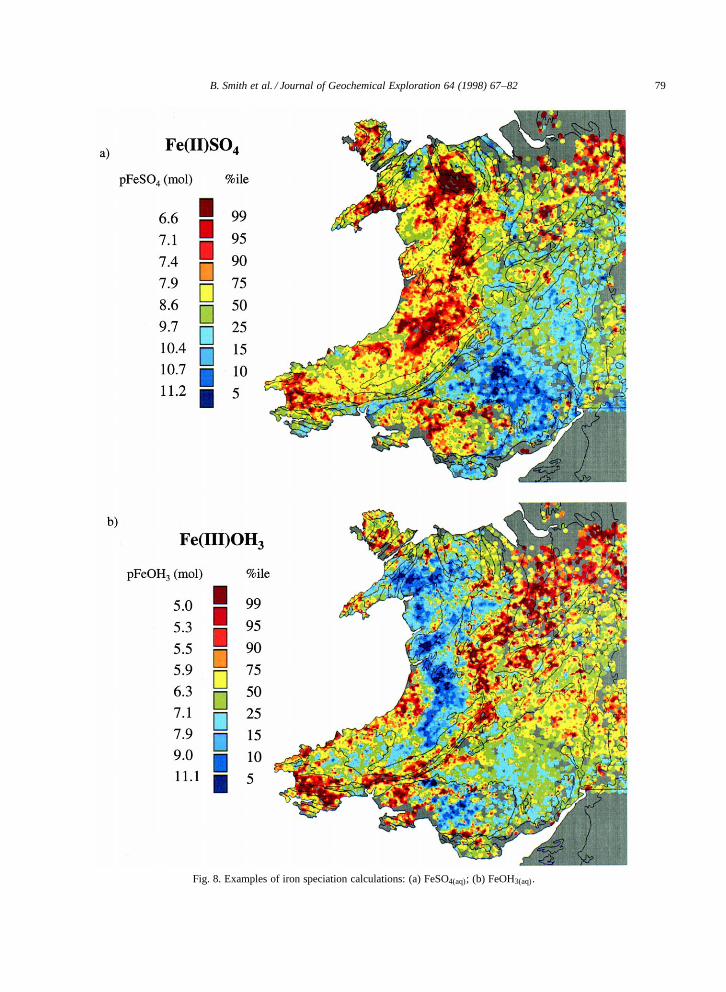
Examples highlighting the controls on the dis-solved forms of Fe in stream-water using equilib-rium speciation modelling are presented in Fig. 8for the species Fe(II)SO4(aq) and Fe(III)OH3(aq). Allmajor-ion stream-water chemistry parameters anddissolved Fe concentrations for the dataset were in-cluded as input to the speciation model (PHREEQC)assuming relatively oxidising conditions (pe D 4which corresponds to an Eh value of 236 mV). Out-put from the model, in the form of molalities for eachspecies, were log-transformed (� log10) and griddedusing inverse distance weighted interpolation.
The speciation model calculated the greatest con-centrations of Fe(II)SO4(aq) in acidic streams withelevated SO2�
4 concentrations, including areas to theeast of Snowdonia, to the southeast of Aberystwyth,in Pembrokeshire and surrounding the South Walescoalfield (Fig. 8a). The streams in which calculatedFe(III)OH3 concentrations were greatest are locatedin areas of high pH, in a line that would extendapproximately from Pembrokeshire to the north of
the map, with the exception of the upland areas tothe south and east of Aberystwyth (Fig. 8b).
Without measurements of TOC (total organic car-bon) speciation modelling cannot account for reac-tions with organics, which are particularly importantfor the speciation of certain metals, particularly Al(Driscoll, 1989). Since 1994, all stream-water sam-pling in the G-BASE programme in northern Irelandand throughout areas of northern England have in-cluded the determination of TOC.
4.2. Comparison of thematic solute saturation maps:pure vs. real systems
Pure and real-system saturation indices werecalculated for calcite and gypsum. The pure-sys-tem saturation indices were calculated using theconcentrations of Ca2C and HCO�3 (calcite), andCa2C and SO2�
4 (gypsum), in individual samplesand the respective equilibrium constants (log Kcal
at 15ºC D �8:42, Plummer and Busenberg, 1982;log Kgyp at 15ºC D �4:35, Drever, 1988). Theequilibrium chemical speciation model PHREEQC(Parkhurst, 1995) with the WATEQ4F database (Balland Nordstrom, 1991) was used to calculate the sat-uration indices for calcite and gypsum using pH andall major- and trace-ion concentrations for all stream-water samples at 15ºC. The real system accounts forreactions between all major ions, not simply thetwo ions which constitute the mineral phase in thepure-system calculation.
The differences between the saturation indicescalculated for pure and real systems are plotted inFig. 9a (gypsum) and Fig. 9c (calcite). The differ-ences were also compared with saturation indicescalculated for each ionic strength (Fig. 9b and d,respectively). In all samples the pure system overes-timate the saturation index (SI). The overestimationswere generally small, the greatest differences oc-curred in samples of the highest ionic strength in theeast of the region. One notable exception was the rel-atively large overestimation of values for the gypsumSI calculated by the two methods for stream-watersamples along the Welsh coastline. This differencepotentially results from the formation of epsomite(MgSO4.7H20) in coastal areas due to sea-salt inputsof Mg (Krauskopf, 1982).
B. Smith et al. / Journal of Geochemical Exploration 64 (1998) 67–82 79
Fig. 8. Examples of iron speciation calculations: (a) FeSO4(aq); (b) FeOH3(aq).

80 B. Smith et al. / Journal of Geochemical Exploration 64 (1998) 67–82
B. Smith et al. / Journal of Geochemical Exploration 64 (1998) 67–82 81
5. Conclusions
Methods have been described for transformingand presenting regional hydrochemical survey datain the form of thematic maps. These represent alogical step forward from maps of absolute concen-tration, which while being of direct use for the iden-tification of ‘hot spots’ and regulatory exceedance,have limited value in the study of catchment evo-lution and management issues at a regional scale.Maps based on trilinear diagrams and saturationcalculations for calcite and gypsum form a betterbasis for interpreting the processes controlling ma-jor-ion stream-water composition than maps of abso-lute concentration. Saturation calculations for calciteand gypsum based on pure and real (equilibrium spe-ciation model) systems were generally similar acrossthe range of stream-water compositions; the great-est differences were observed in samples with thehighest ionic strengths. On the basis of the findingspresented above, calculations of mineral saturationindices should, where possible, be based on real sys-tems (e.g. PHREEQC) which incorporate reactionsbetween all inorganic ions found in natural waters.
In addition to the major-ion stream chemistry datapresented in this paper, additional speciation mod-elling of potentially toxic elements is currently beingundertaken (e.g. Rawlins et al., 1997) along with thestudy of how spatial data collected in the G-BASEprogramme may be viewed in a temporal context(e.g. Hutchins et al., 1997). Stream-water chemistrydata for 5000 individual sample sites (including TOCdata) will also soon be available for the Humber–Trent region of the U.K. This dataset presents anexcellent opportunity to elucidate the role of humicsubstances in controlling major and trace ion stream-water chemistry at the regional scale. Selected sitesthroughout this region were also monitored on adaily basis and will be used to identify the mag-nitude of chemical variations due to hydrologicalconditions.
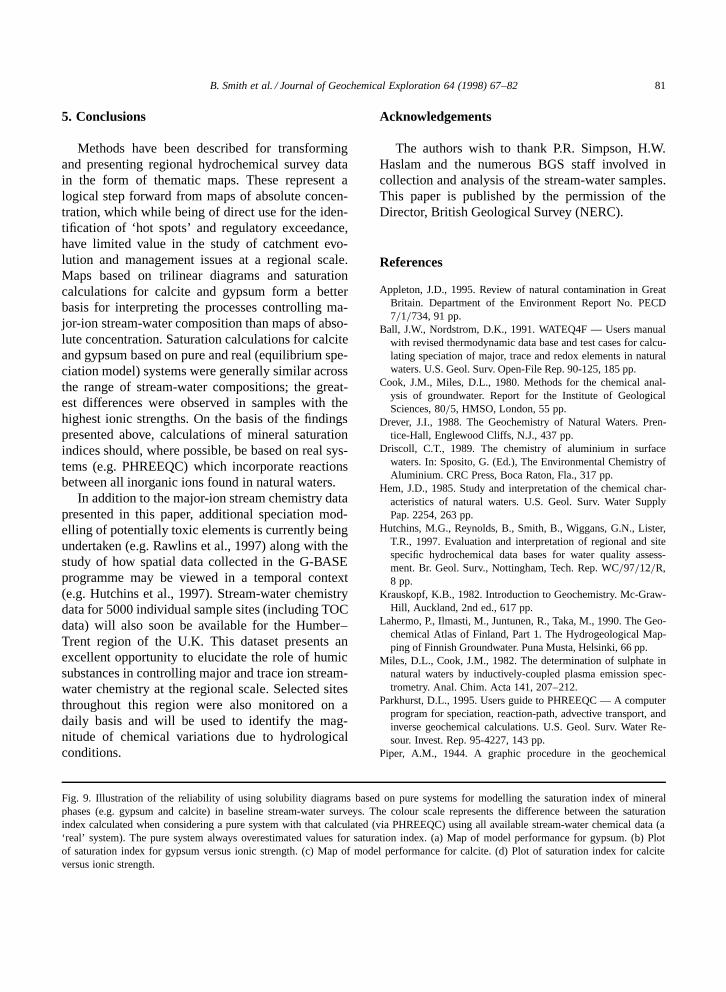
Fig. 9. Illustration of the reliability of using solubility diagrams based on pure systems for modelling the saturation index of mineralphases (e.g. gypsum and calcite) in baseline stream-water surveys. The colour scale represents the difference between the saturationindex calculated when considering a pure system with that calculated (via PHREEQC) using all available stream-water chemical data (a‘real’ system). The pure system always overestimated values for saturation index. (a) Map of model performance for gypsum. (b) Plotof saturation index for gypsum versus ionic strength. (c) Map of model performance for calcite. (d) Plot of saturation index for calciteversus ionic strength.
Acknowledgements
The authors wish to thank P.R. Simpson, H.W.Haslam and the numerous BGS staff involved incollection and analysis of the stream-water samples.This paper is published by the permission of theDirector, British Geological Survey (NERC).
References
Appleton, J.D., 1995. Review of natural contamination in GreatBritain. Department of the Environment Report No. PECD7=1=734, 91 pp.
Ball, J.W., Nordstrom, D.K., 1991. WATEQ4F — Users manualwith revised thermodynamic data base and test cases for calcu-lating speciation of major, trace and redox elements in naturalwaters. U.S. Geol. Surv. Open-File Rep. 90-125, 185 pp.
Cook, J.M., Miles, D.L., 1980. Methods for the chemical anal-ysis of groundwater. Report for the Institute of GeologicalSciences, 80=5, HMSO, London, 55 pp.
Drever, J.I., 1988. The Geochemistry of Natural Waters. Pren-tice-Hall, Englewood Cliffs, N.J., 437 pp.
Driscoll, C.T., 1989. The chemistry of aluminium in surfacewaters. In: Sposito, G. (Ed.), The Environmental Chemistry ofAluminium. CRC Press, Boca Raton, Fla., 317 pp.
Hem, J.D., 1985. Study and interpretation of the chemical char-acteristics of natural waters. U.S. Geol. Surv. Water SupplyPap. 2254, 263 pp.
Hutchins, M.G., Reynolds, B., Smith, B., Wiggans, G.N., Lister,T.R., 1997. Evaluation and interpretation of regional and sitespecific hydrochemical data bases for water quality assess-ment. Br. Geol. Surv., Nottingham, Tech. Rep. WC=97=12=R,8 pp.
Krauskopf, K.B., 1982. Introduction to Geochemistry. Mc-Graw-Hill, Auckland, 2nd ed., 617 pp.
Lahermo, P., Ilmasti, M., Juntunen, R., Taka, M., 1990. The Geo-chemical Atlas of Finland, Part 1. The Hydrogeological Map-ping of Finnish Groundwater. Puna Musta, Helsinki, 66 pp.
Miles, D.L., Cook, J.M., 1982. The determination of sulphate innatural waters by inductively-coupled plasma emission spec-trometry. Anal. Chim. Acta 141, 207–212.
Parkhurst, D.L., 1995. Users guide to PHREEQC — A computerprogram for speciation, reaction-path, advective transport, andinverse geochemical calculations. U.S. Geol. Surv. Water Re-sour. Invest. Rep. 95-4227, 143 pp.
Piper, A.M., 1944. A graphic procedure in the geochemical
82 B. Smith et al. / Journal of Geochemical Exploration 64 (1998) 67–82
interpretation of water analysis. Am. Geophys. Union Trans.25, 914–923.
Plummer, L.N., Busenberg, E., 1982. The solubilities of calcite,aragonite and vaterite in CO2–H2O solutions between 0º and900ºC, and an evaluation of the aqueous model for the sys-tem CaCO3–CO2–H20. Geochim. Cosmochim. Acta 46, 1011–1040.
Rawlins, B.G., Reader, J.P., Smith, B., Breward, N., Lister, T.R.,1997. Modelling and mapping the concentration and mobilityof potentially toxic elements in Welsh stream-waters. Br. Geol.Surv., Nottingham. Tech. Rep. WC=97=9=R, 8 pp.
Simpson, P.R., Edmunds, W.M., Breward, N., Cook, J.M., Flight,D.M.A., Hall, G.E.M., Lister, T.R., 1993. Geochemical map-ping of stream-water for environmental studies and mineralexploration in the UK. In: Proceedings of International Geo-
chemical Mapping Symposium, V.M. Goldschmidt Confer-ence, Reston, Va., May 8–10, 1992. J. Geochem. Explor. 49,63–88.
Simpson, P.R., Breward, N., Flight, D.M.A., Lister, T.R., Cook,J.M., Smith, B., Hall, G.E.M., 1996. High-resolution re-gional hydrogeochemical baseline mapping of stream-waterof Wales, the Welsh borders and the West Midlands region.Appl. Geochem. 11, 621–632.
Stumm, W., 1994. Acquisition of solutes and regulation of thecomposition of natural waters. In: Bidoglio, G., Stumm, W.(Eds.), Chemistry of Aquatic Systems: Local and Global Per-spectives. Kluwer, Dordrecht, 534 pp.
Stumm, W., Morgan, J.J., 1981. Aquatic Chemistry: An Intro-duction Emphasizing Chemical Equilibria in Natural Waters.Wiley, New York, 780 pp.