Baseline Study Report - CARE | Evaluations
101
1 Baseline Study Report for the Project “Where the Rain Falls (WtRF) - Phase III Project” Executive Summary Background Bangladesh is frequently cited as one of the most vulnerable countries to climate change (Huq and Ayers, 2007) because of its disadvantageous geographic location; flat and low-lying topography; high population density; high levels of poverty; reliance of many livelihoods on climate sensitive sectors, particularly agriculture and fisheries; and inefficient institutional aspects (CCC, 2006). Considering the above scenarios of climate change risks and as a part of initiative to address the effect of climate change, CARE Bangladesh has started implementing the project “Where the Rain Falls (WtRF III)”generously funded by Prince Albert Foundation. The project is mainly based on Community Based Adaptation (CBA) and aims at improving the resilience of targeted vulnerable and marginalized communities to the impacts of increasing variability of rainfall patterns by promoting SuPER (Sustainable, Profitable, Equitable and Resilient) agriculture approach. CARE has been implementing the WtRF project in Kurigram district since January 2014 and WtRF Phase III which started from January 2017has built on the earlier phase of the project. The WtRF Phase III project focuses on climate resilient agriculture and targets 6,500 small and marginalized farmers in 20 villages (2,500 from previous phase in 5 villages and an additional 4,000 small and marginalized farmers from additional 15 villages in Kurigram). Objective The overall objective is to establish a baseline for the project as per the approved project proposal and log-frame so that project can establish a SMART (Specific, Measurable, Achievable, Realistic and Time-bound) monitoring and evaluation (M&E) system. The specific objectives are to create baseline information to measure the progress of indicators set for achieving the outputs, specific goals and overall objectives of the project with those of the end line survey. Methodology Data was collected through quantitative and qualitative methods. Review of project documents and secondary information, meeting, household survey, Focus Group Discussion (FGD), Key Informant Interview (KII) and individual interview through household survey generated adequate information to answer the questions as outlined in the ToR. A total of 350 targeted households of the project from 15 new villages were randomly selected for data collection using structured questionnaire. Results The summary finding of the baseline information is given in the Table below: Name of Indicator Baseline information % of FFS members with increased knowledge on climatic risks and adaptive options 29.71 Average month with insufficient food at households 3.35
-
Upload
khangminh22 -
Category
Documents
-
view
4 -
download
0
Transcript of Baseline Study Report - CARE | Evaluations

1
Baseline Study Report for the Project
“Where the Rain Falls (WtRF) - Phase III Project”
Executive Summary
Background
Bangladesh is frequently cited as one of the most vulnerable countries to climate change (Huq and Ayers, 2007) because of its disadvantageous geographic location; flat and low-lying topography; high population density; high levels of poverty; reliance of many livelihoods on climate sensitive sectors, particularly agriculture and fisheries; and inefficient institutional aspects (CCC, 2006). Considering the above scenarios of climate change risks and as a part of initiative to address the effect of climate change, CARE Bangladesh has started implementing the project “Where the Rain Falls (WtRF III)”generously funded by Prince Albert Foundation. The project is mainly based on Community Based Adaptation (CBA) and aims at improving the resilience of targeted vulnerable and marginalized communities to the impacts of increasing variability of rainfall patterns by promoting SuPER (Sustainable, Profitable, Equitable and Resilient) agriculture approach. CARE has been implementing the WtRF project in Kurigram district since January 2014 and WtRF Phase III which started from January 2017has built on the earlier phase of the project. The WtRF Phase III project focuses on climate resilient agriculture and targets 6,500 small and marginalized farmers in 20 villages (2,500 from previous phase in 5 villages and an additional 4,000 small and marginalized farmers from additional 15 villages in Kurigram). Objective The overall objective is to establish a baseline for the project as per the approved project proposal and log-frame so that project can establish a SMART (Specific, Measurable, Achievable, Realistic and Time-bound) monitoring and evaluation (M&E) system. The specific objectives are to create baseline information to measure the progress of indicators set for achieving the outputs, specific goals and overall objectives of the project with those of the end line survey. Methodology Data was collected through quantitative and qualitative methods. Review of project documents and secondary information, meeting, household survey, Focus Group Discussion (FGD), Key Informant Interview (KII) and individual interview through household survey generated adequate information to answer the questions as outlined in the ToR. A total of 350 targeted households of the project from 15 new villages were randomly selected for data collection using structured questionnaire. Results The summary finding of the baseline information is given in the Table below:
Name of Indicator Baseline information
% of FFS members with increased knowledge on climatic risks and adaptive options
29.71
Average month with insufficient food at households
3.35

2
% increase in adaptive capacities of communities
23.4
% increase in agricultural productivity Boro rice BRRIdhan 28 – 2.5 MT/hectare Aman rice Local variety) – 2.0 MT/hectare Aman rice BRRIdhan 11 – 3.5 MT/hectare Mustard BINA 4, BARI 14 – 1.35 MT/hectare
% of farmers practising at least three adaptive agricultural technology.
4.28
% of women increased their mobility and took part in family decision
14.1
% of women who are able to equally participate in household financial decision making
16.9
Number of Union Parishad allocated budget in their annual plan considering climate vulnerabilities and risks
01
Targeted participants of the project Major findings are a) the project has targeted majority woman participants (73.7%), b) the target group was mostly (>95%) small and marginalized farmers owning land up to 100 decimal (0.40 hectare), c) the household yearly income was BDT 106,572 far below that of the rural people in Bangladesh (BDT 220,188) and the national average (BDT 381,756) in 2015, and d) the yearly household expenditure in 2016 was BDT 108,617, which is also far below that of the rural people in Bangladesh (BDT 225,204) in 2015. Knowledge base of the targeted communities on climate risks and adaptive options Major findings are a) only 29.71 % FFS members of the targeted households know about climate risks, b) only few households (13.4%) participated in training /meeting/workshop on climate change issues, c) Out of the FFS members (29.71%) with knowledge of climate risks, major drivers of climate change risks were flood, hail storm and heavy rainfall as the causal factors that affected crop production, d) only 37.14% households received early warning about climate change induced disaster Status of households/family having average month with insufficient food Major findings are a) the targeted households had insufficient food in 3.5 months on an average throughout the year b) October and March were the lean months when 77.4% and 68.9 % households respectively faced difficulty of taking 3 meals a day c) in normal period majority households(61.1%) took two time meals per day but during disaster period the majority households (65.71%) took only one meal per day, d) majority households (96.6%) experienced malnutrition related problems and in effect almost all households (96.3%) faced problem in their health and working efficiency, e) majority households (71.1%) took less food to adapt to food insecurity and 63.10% households took loan from local institutions or local elite person to cope with food insecurity, f) During disaster time, 40.4% households provided two time meals for their male members while only 18.7 % households provided two time meals for their female members,
3
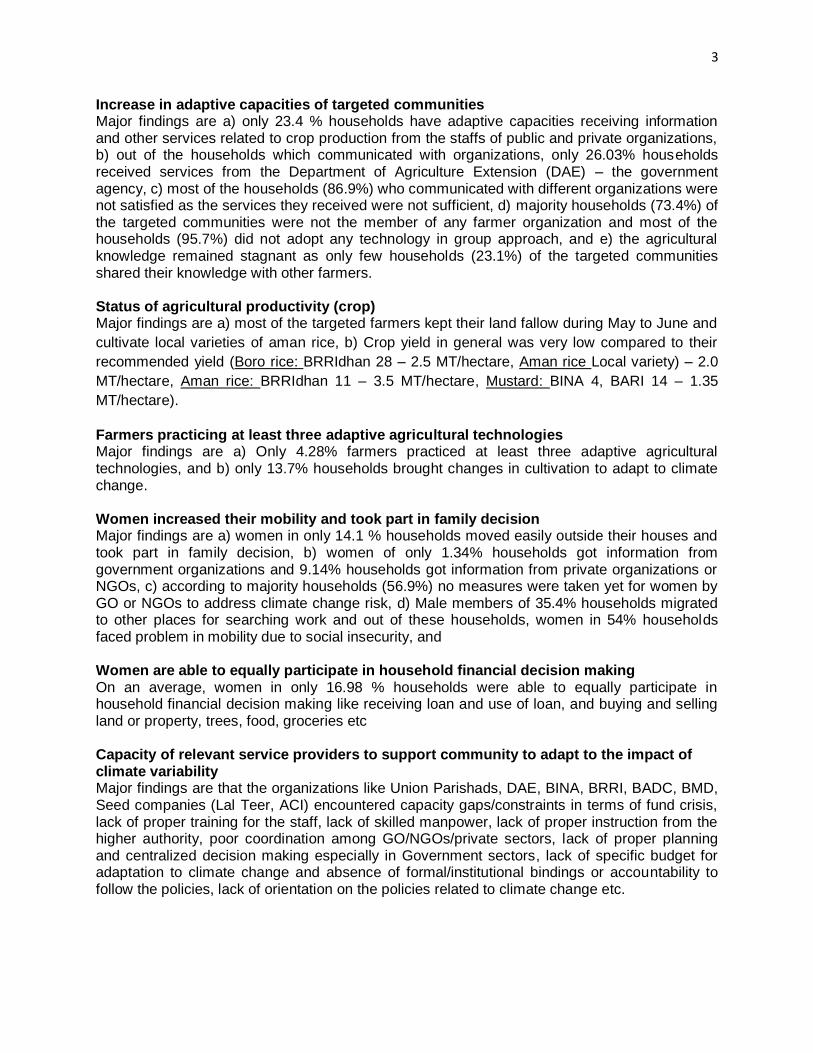
Increase in adaptive capacities of targeted communities Major findings are a) only 23.4 % households have adaptive capacities receiving information and other services related to crop production from the staffs of public and private organizations, b) out of the households which communicated with organizations, only 26.03% households received services from the Department of Agriculture Extension (DAE) – the government agency, c) most of the households (86.9%) who communicated with different organizations were not satisfied as the services they received were not sufficient, d) majority households (73.4%) of the targeted communities were not the member of any farmer organization and most of the households (95.7%) did not adopt any technology in group approach, and e) the agricultural knowledge remained stagnant as only few households (23.1%) of the targeted communities shared their knowledge with other farmers.
Status of agricultural productivity (crop) Major findings are a) most of the targeted farmers kept their land fallow during May to June and
cultivate local varieties of aman rice, b) Crop yield in general was very low compared to their
recommended yield (Boro rice: BRRIdhan 28 – 2.5 MT/hectare, Aman rice Local variety) – 2.0
MT/hectare, Aman rice: BRRIdhan 11 – 3.5 MT/hectare, Mustard: BINA 4, BARI 14 – 1.35
MT/hectare).
Farmers practicing at least three adaptive agricultural technologies Major findings are a) Only 4.28% farmers practiced at least three adaptive agricultural technologies, and b) only 13.7% households brought changes in cultivation to adapt to climate change. Women increased their mobility and took part in family decision Major findings are a) women in only 14.1 % households moved easily outside their houses and took part in family decision, b) women of only 1.34% households got information from government organizations and 9.14% households got information from private organizations or NGOs, c) according to majority households (56.9%) no measures were taken yet for women by GO or NGOs to address climate change risk, d) Male members of 35.4% households migrated to other places for searching work and out of these households, women in 54% households faced problem in mobility due to social insecurity, and Women are able to equally participate in household financial decision making On an average, women in only 16.98 % households were able to equally participate in household financial decision making like receiving loan and use of loan, and buying and selling land or property, trees, food, groceries etc Capacity of relevant service providers to support community to adapt to the impact of climate variability Major findings are that the organizations like Union Parishads, DAE, BINA, BRRI, BADC, BMD, Seed companies (Lal Teer, ACI) encountered capacity gaps/constraints in terms of fund crisis, lack of proper training for the staff, lack of skilled manpower, lack of proper instruction from the higher authority, poor coordination among GO/NGOs/private sectors, lack of proper planning and centralized decision making especially in Government sectors, lack of specific budget for adaptation to climate change and absence of formal/institutional bindings or accountability to follow the policies, lack of orientation on the policies related to climate change etc.
4
Number of Union Parishad allocated budget in their annual plan considering climate vulnerabilities and risks Only one Union Parishad (Holokhana) out of three targeted unions of the project has allocated budget Tk. 200,000.00 in their annual plan (2016-2017) considering climate vulnerabilities and risks, and Functional linkage established between relevant stakeholders and community to adapt to the impact of climate variability Poor functional linkage among stakeholders due to communication gap, lack of collaborative efforts, poor fund and management, disparity in implementation strategy, lack of formal/institutional bindings to follow the policies, lack of proper planning and centralized decision making especially in the Government sectors etc
Major Recommendation
• The target communities possess very poor knowledge on the climate risks primarily due to poor sources of information channel and hence the project requires strengthening linkages of target communities with the relevant information and service providers (government and private) in the project area.
• The project should integrate the capacity and participation of the government agencies particularly in the delivery of early warning to the people through community based adaptation.
• To reach the goal of the project, the targeted communities especially women should be provided with or should be made capable of making innovative ways of adaptation to climate change through SuPER agriculture approach, and through improved information channels and decision making process so that their food insecurity is reduced significantly.
• The project needs sensitizing DAE to be involved in the project interventions following SuPER agriculture approach and to create an enabling environment so that the targeted communities receive services sufficiently even after the project is over (ie, sustainability).
• The project should take care of farmer’s capacity development in a group to disseminate innovative knowledge and technologies among neighboring farmers
• Existing cropping patterns should be adjusted with alternate crops and varieties to be grown in fallow period using the benefit of early monsoon and replacing local varieties with flood or drought tolerant modern varieties in consultation with local communities to increase cropping intensity and crop yield of the project participants
• The project should tap the alternate adaptive technologies and build capacity of farmers to practice them to address climate change. This requires linking the targeted communities with government and private organizations having activities for adaptation to climate change risk and vulnerabilities
• The project should facilitate family and social counseling inviting husband or male members of family and village elite persons for creating participatory environment so that women can be freely involved in income generating activities outside the house so that women mobility is increased
• The project should sensitize government organizations in particular so that they integrate women friendly activities in their annual program and consequently women mobility is increased due to these activities.

5
• The project should consider implementing some capacity development programs like training of respective staff, orientation on the relevant policies, conducting advocacy workshop/seminar involving policy makers, and facilitation on participatory planning among different stakeholders on community based adaptation to climate change risks.
• The project needs sensitizing UP committees so that all targeted Union Parishads allocate budget in their annual plan considering climate vulnerabilities and risks ensuring participation of target communities in bottom up planning
• To improve functional linkages, the project should organize more training of trainers, workshop/seminar involving staff of relevant organizations like Union Parishad, DAE, research organizations, metrological department, NGOs, private seed companies etc,
1. Introduction
1.1 Drivers of climate change risks in Bangladesh
Bangladesh is frequently cited as one of the most vulnerable countries to climate change (Huq
and Ayers, 2007) because of its disadvantageous geographic location; flat and low-lying
topography; high population density; high levels of poverty; reliance of many livelihoods on
climate sensitive sectors, particularly agriculture and fisheries; and inefficient institutional
aspects (CCC, 2006). The production of crop in Bangladesh is constrained by too much water
during the wet season and too little during the dry season (Rahman, et al., 2007). Various
studies indicate that a temperature rise of 1 to 20C in combination with lower solar radiation
causes sterility in rice spikelet. It is feared that moisture stress would be more intense during the
dry season, which might force the Bangladeshi farmers to reduce the area for boro cultivation.
Shortfall in food grain production would severely threaten food security of the poverty-ridden
country (Rahman, et al., 2007).
1.2 Initiatives of the Government and NGOs of Bangladesh in general
In response to the threat, Government of Bangladesh has adopted action plans, particularly
National Adaptation Program of Action (NAPA) in 2005 followed by Bangladesh Climate Change
Strategy and Action Plan (BCCSAP) in 2009 (MoEF 2009) for combating the challenges of
climate change. Adaptation to climate change is mainstreamed in different sectoral plans and
programs, such as National Water Management Plans, Agricultural Policy etc. Besides, NGOs
and donor agencies also have their own plans and programs for saving life and property of
people from the emerging calamity. To understand the threat of climate change and its coping
up processes in different sectors, CARE Bangladesh has undertaken an initiative to investigate
the presumed impact of existing adaptation options in the backdrop of changing climatic
conditions in future.

6
1.3 Adaptation is a solution to address climate change in Bangladesh
Adaptation to Climate Change means the initiatives and measures to reduce the vulnerability of
natural and human systems against actual or expected climate change effects. This is distinct
from the mitigation. It is inevitable because even if the global warming is restricted to projected
temperature rise of 2 °C, it will have various local impacts on different communities (IPCC,
2007). Adaptation options could be resettlement, livelihood diversification, new varieties of crops
tolerant to floods and droughts, new technologies, significant infrastructural modifications, as
well as change in management and lifestyle practices. Adaptive measures involve research and
development initiatives too.
1.4 Rationale for the baseline survey
Considering the above scenarios of climate change risks and as a part of initiative to address
the effect of climate change, CARE Bangladesh has started implementing the project “Where
the Rain Falls (WtRF III)”generously funded by Prince Albert Foundation. Where The Rain Falls
began in 2011 in 8 countries with a research phase on migration, food security and climate
change. The results were published in end of 2012 and community based adaptation (CBA)
project were then implemented in 5 of the countries including Bangladesh. In Bangladesh, the
CBA project started in 2014 and finished in December 2015. A project end evaluation revealed
significant impact of the project activities on the lives of project beneficiary HH level and beyond.
Hence, the same donor Prince Albert II of Monaco Foundation has allocated a small bridging
fund to continue the project initiatives in Bangladesh for additional period until December 2016.
Based on the performance of the phase II project, the same donor has again supported the
Where the Rain Falls project phase III for a period of 3 years from January 2017.
The project is mainly based on Community Based Adaptation (CBA) and aims at improving the
resilience of targeted vulnerable and marginalized communities to the impacts of increasing
variability of rainfall patterns by promoting SuPER (Sustainable, Profitable, Equitable and
Resilient) agriculture approach. The project will adopt a rights-based approach and focus its
advocacy and mobilization efforts on empowering women, enabling vulnerable groups to
participate in local decision-making/governance, and ensuring equitable access to resources
and services vital to adaptation. CARE has been implementing the WtRF project in Kurigram
district since January 2014 and WtRF Phase III, which started from January 2017, has built on
the first phase. The project in phase I has demonstrated substantial results which encouraged
local authorities (UP) to make provision in their annual plans and allocate budget to establish
7
seed banks with adaptive variety seeds in their respective unions. Under this project BINA dhan
11 has been identified as the most suitable flood tolerant rice for monsoon, BRRI dhan 28 & 58
have been identified as the most suitable adaptive rice for summer.
The WtRF Phase III project focuses on climate resilient agriculture and has targeted 6500 small
and marginalized farmers in 20 villages (2500 from previous phase in 5 villages and an
additional 4,000 small and marginalized farmers from additional 15 villages in Kurigram). The
overall goal of the project is to improve resilience of 20 communities, especially women, from
Kurigram district against increasing vulnerability of rainfall patterns by promoting SuPER
agriculture approach and community based adaptation. The specific goals and corresponding
outputs are as follows:
Specific Goal 1: 20 # of communities are more resilient to climate risks and change and
corresponding output-1.1:Community plan integrated climate risks and climate change issues
output 1.2: Increased practice of Super Agriculture Approach output 1.3: Women are more
empowered and feel confident to respond to variable climate condition and output 1.4:
Enhanced capacity of service providers to support community to adapt to the impact of climate
variability. Specific Goal 2: Local, regional and/or national policies and civil society
organizations better integrate climate risks and change and corresponding output 2.1:
Integrated CBA activities in annual plan of Union Parishad and output 2.2: Functional linkage
established between relevant stakeholders and community to adapt to the impact of climate
variability.
Baseline survey provides a starting point from which a comparison can be made; and ideally, a
baseline is conducted prior to the beginning of the project or at a stage of the program
intervention and it becomes the point of comparison for monitoring and evaluation of data; and
the bulk of baseline survey focuses on the intended outcomes of the program. In this context
CARE Bangladesh has decided to conduct this baseline survey and the survey was
implemented by a team of consultants led by Dr. Syed Samsuzzaman, Agricultural, Climate
Adaptation and Rights based Development Specialist.
1.5 Objective of the survey
The overall objective is to establish a baseline for the project as per the approved project
proposal and log-frame so that project can establish a SMART (Specific, Measurable,
Achievable, Realistic and Time-bound) monitoring and evaluation (M&E) system.
8
To this end, this survey identifies baseline information which will allow the project to measure
the progress of indicators set for achieving the outputs, specific goals and overall objectives of
the project by comparing the indicators’ values of the baseline with those of the end line survey.
The specific objectives of this survey are:
i. To assess the adaptive capacities of the targeted communities
ii. To measure food insecure months of climate victims
iii. To identify the status of women empowerment in household financial decision
making
iv. To measure the ability of community people to build resilience to the effects of
climate change and variability
v. To know the knowledge base of the targeted communities on climate risks and
adaptive options
vi. To know the status of practice in adaptive agriculture and corresponding
productivity by the targeted communities
vii. To know the status of mobility of women and their participation in family decision
making
viii. To know the capacity of relevant service providers to support community
to adapt to the impact of climate variability
ix. To know the number of Union Parishad which allocated budget in their annual
plan considering climate vulnerabilities and risks
x. To map out status of functional linkage between relevant stakeholders and
community to adapt to the impact of climate variability
2. Methodology
Given the complex nature of the project that entails a wide range of issues, the methodology of
the study was developed based on project documents including the Terms of Reference
(Appendix I), logical frame work (Appendix II) and M & E planning matrix (Appendix III). The
project mainly improves the resilience of the targeted communities to the effect of climate
change ie, how communities will make themselves more prepared to adapt to the changing
climatic patterns affecting agricultural production, living and economic capability. It is, therefore,
important to increase adaptive capacities of the communities so that they are more resilient to
the effects of climate change. Hence, to increase adaptive capacities the communities require
gaining knowledge to adapt to climate change and in particular the capability of farmers to

9
cultivate various flood tolerant and drought tolerant agricultural varieties and technologies.
Increased adaptive capacities will eventually help farmers to follow the techniques and
measures in cultivating adaptive varieties. If the adaptive capacities of farmers are increased
and consequently adaptive techniques and measures are practiced, their agricultural
productivity will be increased. The project gives priority to increase women mobility ie, their
movement to various places they need for economic, educational purposes and family
maintenance and make them equally able to participate in households financial decision
making. Increased agricultural productivity and economic involvement of women in addition to
men will increase food secure period throughout the year. The project also gives effort to
motivate Union Parishads so that they allocate budget in their annual plan considering climate
vulnerabilities and risks so that communities will increase their adaptive capacity to the
changing climate. In the context of above expected results of the project as per logical frame
work and based on definition of M & E matrix, the indicators for this baseline survey/research
are designed. The assumption is that the finding of the baseline indicators in comparison with
that of the same indicators in the end line survey will meet the expected outputs while several
outputs will meet the specific goals and in turn the specific goals will meet the overall goal of the
project.
Data was collected through quantitative and qualitative methods. Review of project documents
and secondary information, household surveys, Focus Group Discussions (FGD), Key Informant
Interviews (KII) and individual household interviews generated adequate information as per
measurable indicators of the project log-frame. The government and private organizations
relevant to the project provided necessary assistance during the field work and collection of
information for the study. Structured questionnaires were used to collect the quantitative data
through household survey, while for qualitative data, Focus Group Discussion, Key Informant
Interview and field observations methods were followed.
Specific tools, sample size and nature of participants to meet the objectives of the survey as
mentioned above are given below (Table 1):
10
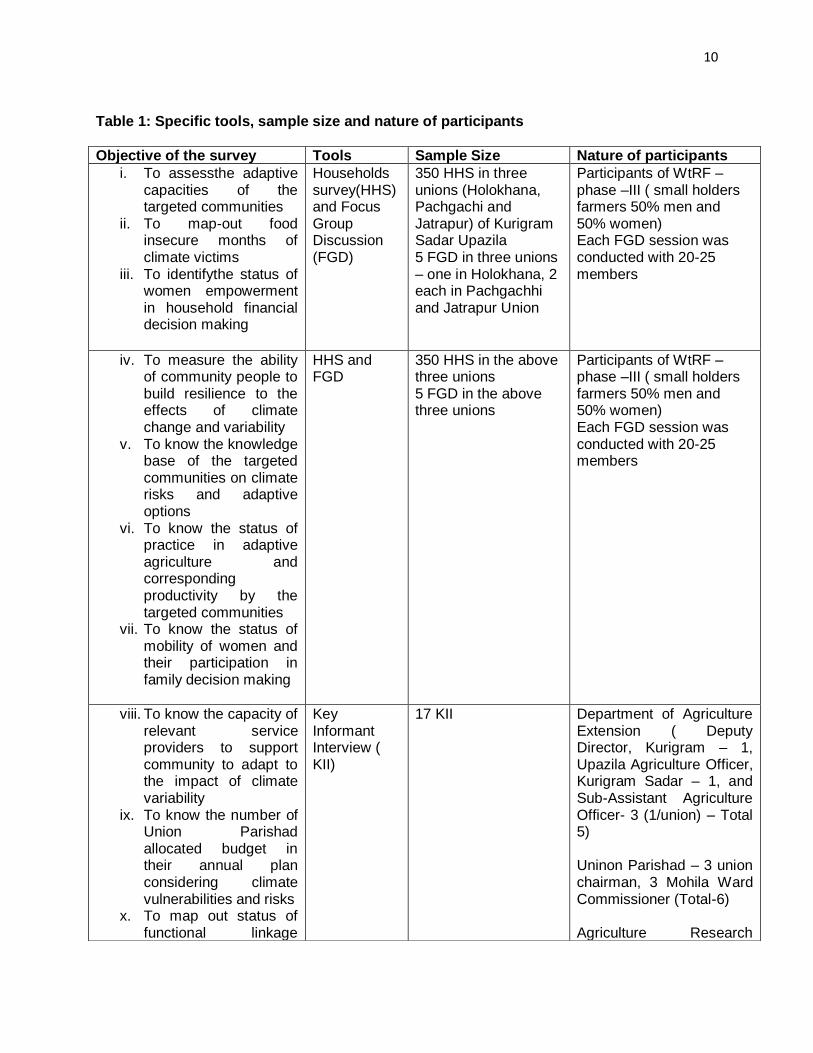
Table 1: Specific tools, sample size and nature of participants
Objective of the survey Tools Sample Size Nature of participants
i. To assessthe adaptive capacities of the targeted communities
ii. To map-out food insecure months of climate victims
iii. To identifythe status of women empowerment in household financial decision making
Households survey(HHS) and Focus Group Discussion (FGD)
350 HHS in three unions (Holokhana, Pachgachi and Jatrapur) of Kurigram Sadar Upazila 5 FGD in three unions – one in Holokhana, 2 each in Pachgachhi and Jatrapur Union
Participants of WtRF –phase –III ( small holders farmers 50% men and 50% women) Each FGD session was conducted with 20-25 members
iv. To measure the ability of community people to build resilience to the effects of climate change and variability
v. To know the knowledge base of the targeted communities on climate risks and adaptive options
vi. To know the status of practice in adaptive agriculture and corresponding productivity by the targeted communities
vii. To know the status of mobility of women and their participation in family decision making
HHS and FGD
350 HHS in the above three unions 5 FGD in the above three unions
Participants of WtRF –phase –III ( small holders farmers 50% men and 50% women) Each FGD session was conducted with 20-25 members
viii. To know the capacity of relevant service providers to support community to adapt to the impact of climate variability
ix. To know the number of Union Parishad allocated budget in their annual plan considering climate vulnerabilities and risks
x. To map out status of functional linkage
Key Informant Interview ( KII)
17 KII Department of Agriculture Extension ( Deputy Director, Kurigram – 1, Upazila Agriculture Officer, Kurigram Sadar – 1, and Sub-Assistant Agriculture Officer- 3 (1/union) – Total 5) Uninon Parishad – 3 union chairman, 3 Mohila Ward Commissioner (Total-6) Agriculture Research
11
2.1 Quantitative method: Household Survey
The quantitative data were collected through door to door survey on sample basis of the
randomly selected respondent from the project working area. The questionnaire was developed
on goals and outcomes of the project logical framework. The data were collected mainly on the
status of targeted participants on their socio-economic characteristics, knowledge on climate
change, adaptive practices, crop productivity, family food security, mobility of women and
gender disaggregated decision making in household affairs. However before finalization, the
questionnaire was field-tested and fitted accordingly. Based on the selection criteria agreed with
CARE Bangladesh, 15 new villages taken under the project were selected as sample area to
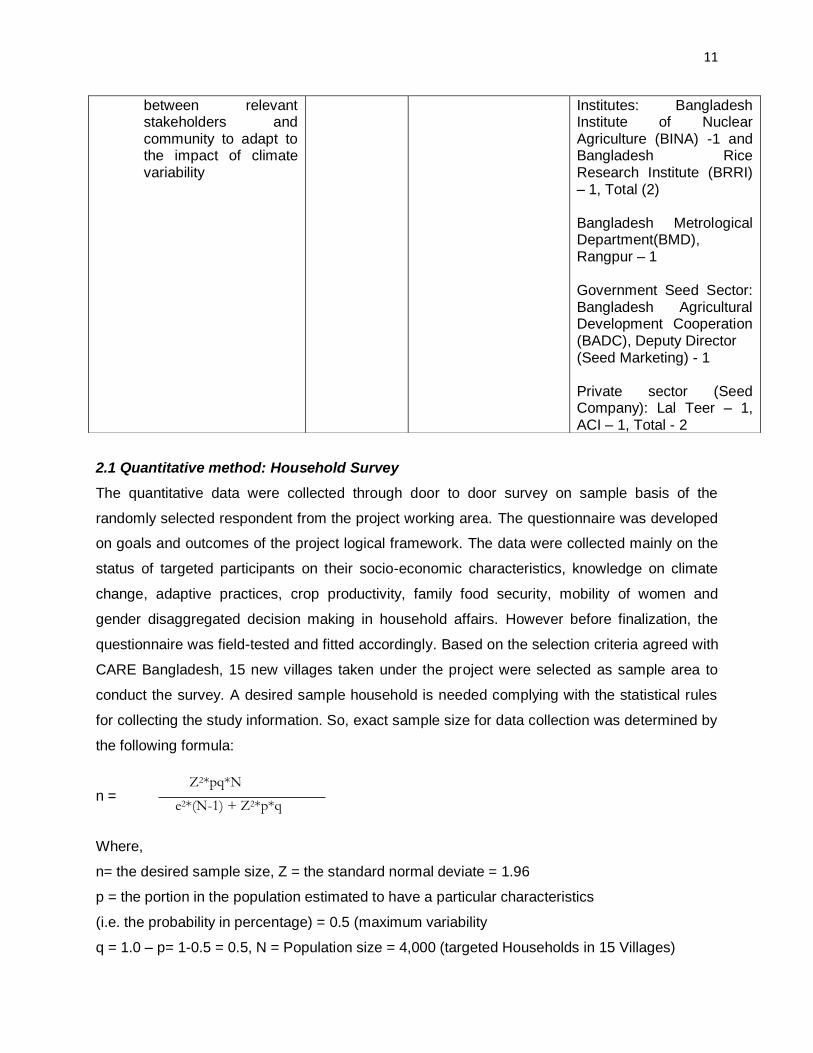
conduct the survey. A desired sample household is needed complying with the statistical rules
for collecting the study information. So, exact sample size for data collection was determined by
the following formula:
n =
Where,
n= the desired sample size, Z = the standard normal deviate = 1.96
p = the portion in the population estimated to have a particular characteristics
(i.e. the probability in percentage) = 0.5 (maximum variability
q = 1.0 – p= 1-0.5 = 0.5, N = Population size = 4,000 (targeted Households in 15 Villages)
between relevant stakeholders and community to adapt to the impact of climate variability
Institutes: Bangladesh Institute of Nuclear Agriculture (BINA) -1 and Bangladesh Rice Research Institute (BRRI) – 1, Total (2) Bangladesh Metrological Department(BMD), Rangpur – 1 Government Seed Sector: Bangladesh Agricultural Development Cooperation (BADC), Deputy Director (Seed Marketing) - 1 Private sector (Seed Company): Lal Teer – 1, ACI – 1, Total - 2
e2*(N-1) + Z2*p*q
Z2*pq*N

12
e = Degree of desired error level (suppose we desire 95% confidence level and +_5% precision
= 0.05
1.96x1.96x0.5x0.5x4,000
Therefore, n = ___________________________________ = 3841.6/10.9579 = 350.58
(samples)
0.05x0.05 (4,000 – 1) + 1.96x1.96x0.5x0.5
Hence, a total of 350 sample households were randomly selected out of 4,000 targeted
households from 15 new villages of the project for data collection. These sample
households were selected based on the proportion of targeted households in each
village to the total targeted households of 15 new villages (Appendix IV). The random
selection was carried out among the total targeted households of each village. The data
were collected from the sample households using structured questionnaire (Appendix V:
Household survey questionnaire).
2.2.Qualitative method
The qualitative methods/techniques, termed as participatory methods, have allowed to capture
relevant information from project participants, relevant organizations, the local Institutes, and
Civil Society Organizations (CSOs) as deemed appropriate through semi-structured guidelines.
The qualitative method has included Participatory Rapid Appraisal (PRA) exercises for FGD,
Key Informant Interview (KII) etc.
2.2.1 Focus Group Discussion (FGD) – was done with the marginal and smallholders farmers
groups to capture information from the target community on the various aspects of the
interventions to be promoted by the project. A guideline was used while discussing with the
participants (Appendix VI: FGD guideline). A total of 5 FGD was conducted taking 20-25 farmers
in a group from 5 villages out of 15 villages randomly. The size of FGD was determined based
on the proportionate sampling (12-15%) of 163 members of the Farmers Field School (FFS)
taking at least 70% women participants as the majority of the project participants were women.
The FGD size was kept in such a small fragment of the FFS primarily to ensure effective
participation of each and every member in discussion.
2.2.2 Key Informant Interview (KII) – was done with the local institutes (Union Parishad,
Department of Agriculture Extension, Research Institutes, Meteorological Department and
private seed companies) to assess their views on the existing situation of the specific issues of
13
the study. A total of 17 KII was conducted depending on their availability of the respondents.
The KII interviewees were selected representing the above local institutes and were interviewed
as per the pre-designed checklist (Appendix VII: KII checklist).
2.2.3 Team composition - The study team was formed with most experienced and committed
consultants working in the research and development sector. There were two operational teams
for the study. A four member consultant team was engaged in this survey. This team was
comprised of Team Leader cum Agricultural, Climate adaptation and Rights based Development
Specialist Dr. Syed Samsuzzaman, Institutional development and Agricultural specialist, Mr. Md.
Rajab Ali, Community Development and Agricultural Specialist Mr. Shahid Hossain, Gender and
Women Empowerment Specialist Ms.ZarinYesminChaity, Lecturer, Department of Women and
Gender Studies, Begum Rokeya University, Rangpur.
Field Operation Team was comprised of 10 (5 former project staff of CARE Bangladesh – 2
female and 3 male, and 5 senior undergraduate students – 1 female and 4 male) experienced
and adequately qualified Data Enumerators for conducting the household survey work. In
addition, 2 Data Entry Operators and one Data Analyst (Statistician) were employed for data
entry and analysis. This field operation team was headed by the Team Leader and other
Consultants. To avoid any sort of biasness, the enumerators collected information from the
selected households as per the list supplied by the implementing organization on random basis.
2.2.4 Reporting - Statistical analysis was done in SPSS package. A large number of data was
analyzed using cross tabulation techniques of the SPSS Computer Application using the coding
process of the various respondents. Multivariate analysis was done to figure out the mean,
median, ranges that contribute to social and economic vulnerability of disaster matters of the
population of surveyed area. Qualitative information was compiled based on the commonalities
and differences in opinions of the various respondents.
3. Findings of the survey
3.1 Socio-economic status of the targeted participants
The project is designed in such a way that only the marginalized and smallholders farmers,
especially women, who really need assistance for adapting to climate change risks and
vulnerabilities, will choose to participate in the program.
14
The following information collected from the baseline survey will qualify the basic parameters of
the above targeting criteria followed in the project:
3.1.1 Targeted project participants by gender
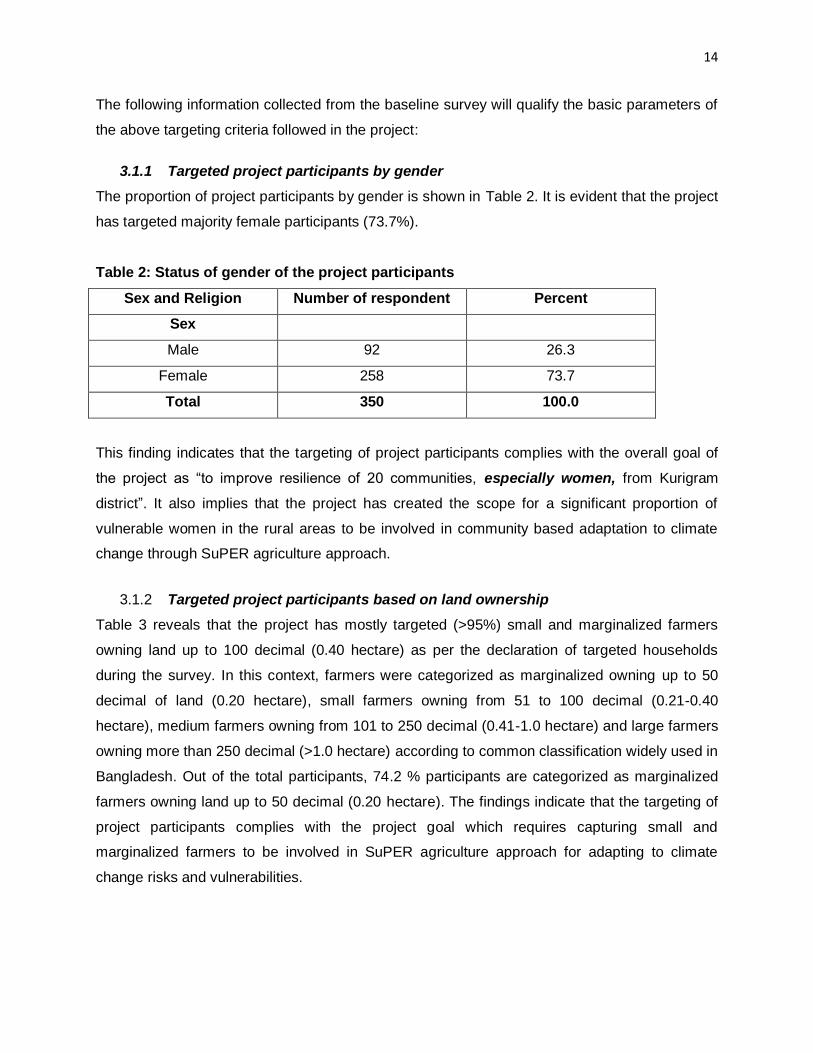
The proportion of project participants by gender is shown in Table 2. It is evident that the project
has targeted majority female participants (73.7%).
Table 2: Status of gender of the project participants
Sex and Religion Number of respondent Percent
Sex
Male 92 26.3
Female 258 73.7
Total 350 100.0
This finding indicates that the targeting of project participants complies with the overall goal of
the project as “to improve resilience of 20 communities, especially women, from Kurigram
district”. It also implies that the project has created the scope for a significant proportion of
vulnerable women in the rural areas to be involved in community based adaptation to climate
change through SuPER agriculture approach.
3.1.2 Targeted project participants based on land ownership
Table 3 reveals that the project has mostly targeted (>95%) small and marginalized farmers
owning land up to 100 decimal (0.40 hectare) as per the declaration of targeted households
during the survey. In this context, farmers were categorized as marginalized owning up to 50
decimal of land (0.20 hectare), small farmers owning from 51 to 100 decimal (0.21-0.40
hectare), medium farmers owning from 101 to 250 decimal (0.41-1.0 hectare) and large farmers
owning more than 250 decimal (>1.0 hectare) according to common classification widely used in
Bangladesh. Out of the total participants, 74.2 % participants are categorized as marginalized
farmers owning land up to 50 decimal (0.20 hectare). The findings indicate that the targeting of
project participants complies with the project goal which requires capturing small and
marginalized farmers to be involved in SuPER agriculture approach for adapting to climate
change risks and vulnerabilities.
15
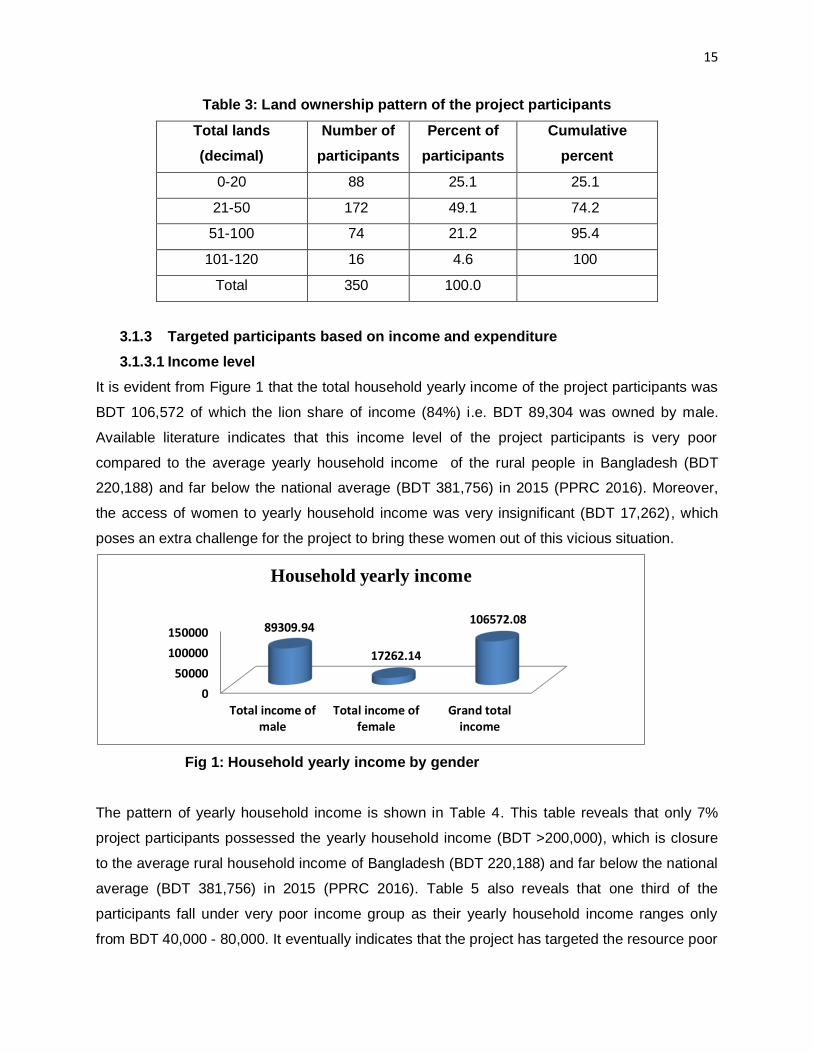
Table 3: Land ownership pattern of the project participants
Total lands
(decimal)
Number of
participants
Percent of
participants
Cumulative
percent
0-20 88 25.1 25.1
21-50 172 49.1 74.2
51-100 74 21.2 95.4
101-120 16 4.6 100
Total 350 100.0
3.1.3 Targeted participants based on income and expenditure
3.1.3.1 Income level
It is evident from Figure 1 that the total household yearly income of the project participants was
BDT 106,572 of which the lion share of income (84%) i.e. BDT 89,304 was owned by male.
Available literature indicates that this income level of the project participants is very poor
compared to the average yearly household income of the rural people in Bangladesh (BDT
220,188) and far below the national average (BDT 381,756) in 2015 (PPRC 2016). Moreover,
the access of women to yearly household income was very insignificant (BDT 17,262), which
poses an extra challenge for the project to bring these women out of this vicious situation.
Fig 1: Household yearly income by gender
The pattern of yearly household income is shown in Table 4. This table reveals that only 7%
project participants possessed the yearly household income (BDT >200,000), which is closure
to the average rural household income of Bangladesh (BDT 220,188) and far below the national
average (BDT 381,756) in 2015 (PPRC 2016). Table 5 also reveals that one third of the
participants fall under very poor income group as their yearly household income ranges only
from BDT 40,000 - 80,000. It eventually indicates that the project has targeted the resource poor
0
50000
100000
150000
Total income ofmale
Total income offemale
Grand totalincome
89309.94
17262.14
106572.08
Household yearly income
16
people who are marginalized having minimal access to income. It is implied that this baseline
status of poor income would be of potential platform to the project to bring the significant impact
of the SuPER agriculture approach on income.
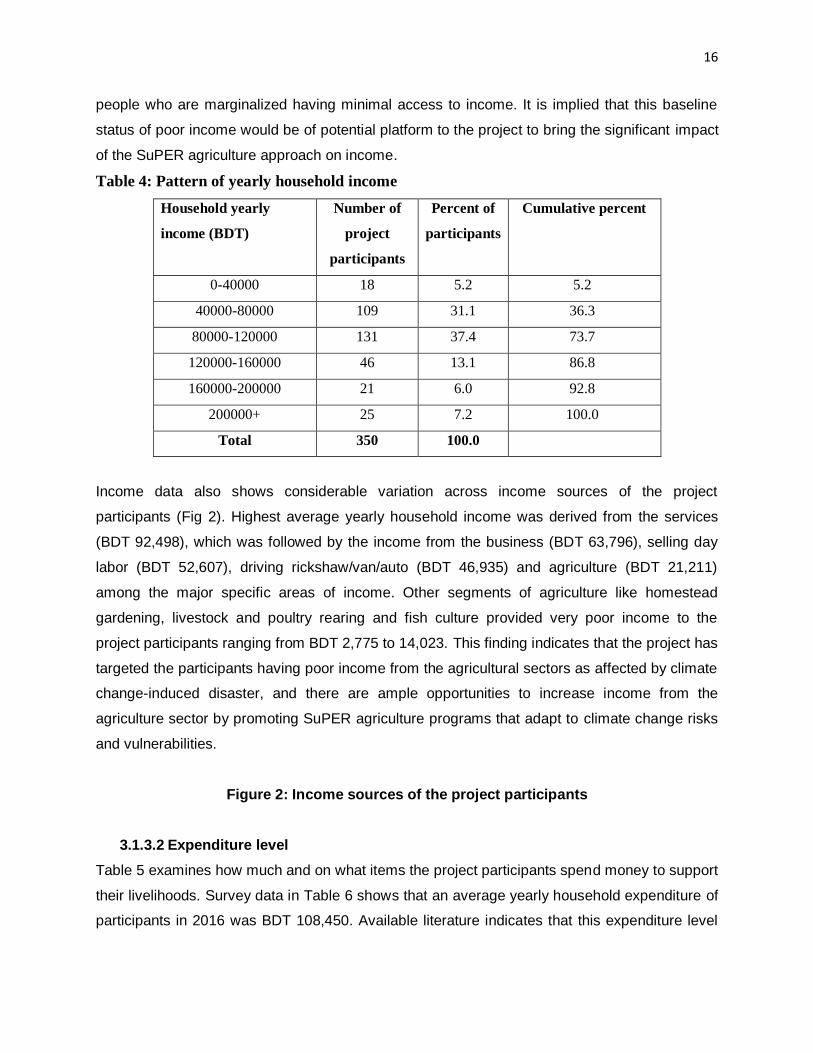
Table 4: Pattern of yearly household income
Household yearly
income (BDT)
Number of
project
participants
Percent of
participants
Cumulative percent
0-40000 18 5.2 5.2
40000-80000 109 31.1 36.3
80000-120000 131 37.4 73.7
120000-160000 46 13.1 86.8
160000-200000 21 6.0 92.8
200000+ 25 7.2 100.0
Total 350 100.0
Income data also shows considerable variation across income sources of the project
participants (Fig 2). Highest average yearly household income was derived from the services
(BDT 92,498), which was followed by the income from the business (BDT 63,796), selling day
labor (BDT 52,607), driving rickshaw/van/auto (BDT 46,935) and agriculture (BDT 21,211)
among the major specific areas of income. Other segments of agriculture like homestead
gardening, livestock and poultry rearing and fish culture provided very poor income to the
project participants ranging from BDT 2,775 to 14,023. This finding indicates that the project has
targeted the participants having poor income from the agricultural sectors as affected by climate
change-induced disaster, and there are ample opportunities to increase income from the
agriculture sector by promoting SuPER agriculture programs that adapt to climate change risks
and vulnerabilities.
Figure 2: Income sources of the project participants
3.1.3.2 Expenditure level
Table 5 examines how much and on what items the project participants spend money to support
their livelihoods. Survey data in Table 6 shows that an average yearly household expenditure of
participants in 2016 was BDT 108,450. Available literature indicates that this expenditure level
17
of the project participants is very poor compared to the average yearly household expenditure of
the rural people in Bangladesh (BDT 225,204) in 2015 (PPRC 2016).
Table 6 reveals that one third of the participants fall under a very poor capacity of expenditure
group as their yearly household expenditures range only from BDT 40,000 - 80,000. It
eventually indicates that the poor expenditure capacity of the project participants was mainly
due to their poor income level as shown in Table 3 and Table 4. The findings of PPRC (2016)
also corroborates well with this survey report as the average yearly household income (BDT
220,188) and corresponding expenditure (BDT 225.204) of rural households in Bangladesh in
2015 also showed a deficit balance. So, the project has captured very poor households having
potential to increase their income level with the practice of adaptive agriculture.
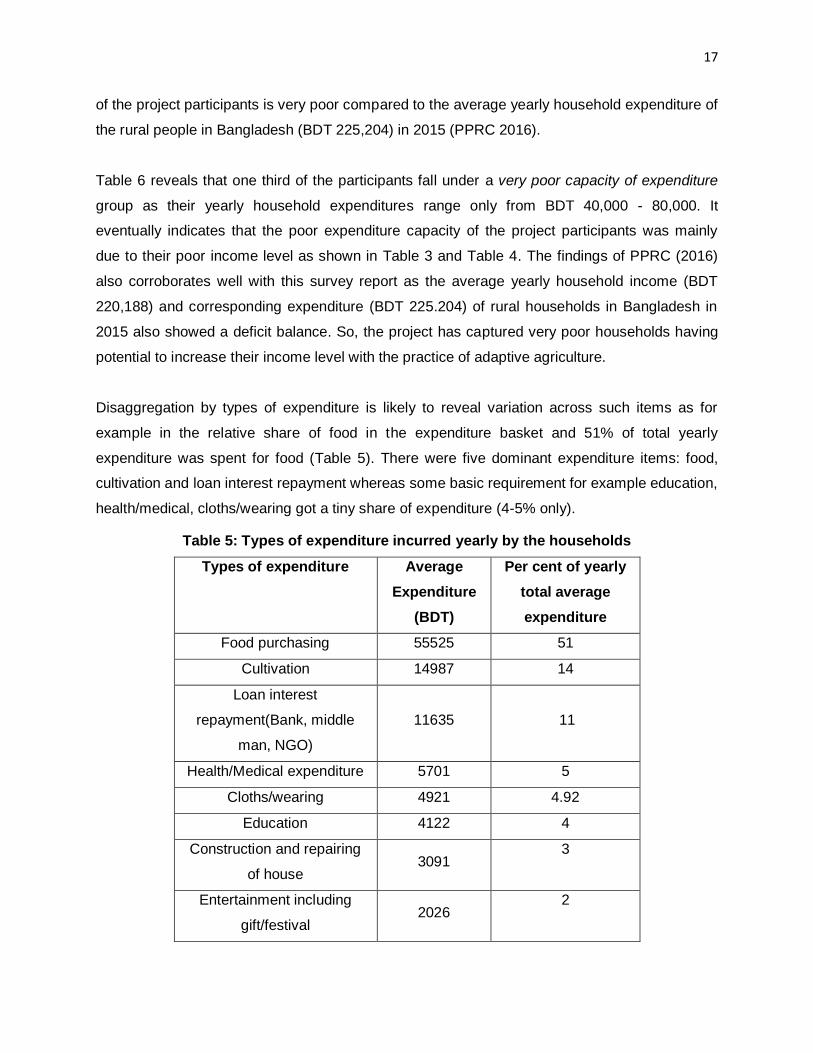
Disaggregation by types of expenditure is likely to reveal variation across such items as for
example in the relative share of food in the expenditure basket and 51% of total yearly
expenditure was spent for food (Table 5). There were five dominant expenditure items: food,
cultivation and loan interest repayment whereas some basic requirement for example education,
health/medical, cloths/wearing got a tiny share of expenditure (4-5% only).
Table 5: Types of expenditure incurred yearly by the households
Types of expenditure Average
Expenditure
(BDT)
Per cent of yearly
total average
expenditure
Food purchasing 55525 51
Cultivation 14987 14
Loan interest
repayment(Bank, middle
man, NGO)
11635
11
Health/Medical expenditure 5701 5
Cloths/wearing 4921 4.92
Education 4122 4
Construction and repairing
of house 3091
3
Entertainment including
gift/festival 2026
2

18
Marriage (if any) 1625 1.5
Dowry (if any) 1276 1
Electricity/solar 1261 1
Firewood/
Kerosene 820
0.8
Cosmetics 880 0.8
Others 747 0.7
Total average
expenditure 108,617
100
Table 6: Pattern of yearly household expenditure
Yearly
household
expenditure
Number of
project
participants
Percent of
project
participants
Cumulative
percent
0-40000 14 4.0 4.0
40000-80000 109 31.1 35.1
80000-120000 128 36.6 71.7
120000-160000 52 14.8 86.5
160000-200000 24 6.9 93.4
200000+ 23 6.6 100
Total 350 100.0
Major findings in this section are a) the project has targeted majority woman participants
(73.7%), b) the target group was mostly (>95%) small and marginalized farmers owning
land up to 100 decimal (0.40 hectare), c) the household yearly income was BDT 106,572
far below that of the rural people in Bangladesh (BDT 220,188) and the national average
(BDT 381,756) in 2015, and d) the yearly household expenditure in 2016 was BDT 108,617,
which is also far below that of the rural people in Bangladesh (BDT 225,204) in 2015.
3.2 Resilient capacities of communities to climate risks and changes

19
This section mainly provides findings of the baseline survey as per indicators set in logical frame
work, which will be compared with the findings against the same indicators of the end line
survey. The summary finding of the baseline information is given in Table 7.
Table 7: Summary findings of baseline survey as per indicators set in logical frame work
Name of Indicator Baseline information
% of FFS members with increased knowledge on climatic risks and adaptive options
29.71
Average month with insufficient food at households
3.35
% increase in adaptive capacities of communities
23.4
% increase in agricultural productivity Boro rice BRRIdhan 28 – 2.5 MT/hectare Aman rice Local variety) – 2.0 MT/hectare Aman rice BRRIdhan 11 – 3.5 MT/hectare Mustard BINA 4, BARI 14 – 1.35 MT/hectare
% of farmers practising at least three adaptive agricultural technology.
4.28
% of women increased their mobility and took part in family decision
14.1
% of women who are able to equally participate in household financial decision making
16.9
Number of Union Parishad allocated budget in their annual plan considering climate vulnerabilities and risks
01
The detail of the above baseline information is presented in the sections given below:
3.2.1 Knowledge base of the targeted communities on climate risks and adaptive
options
3.2.1.1 Percent of FFS (Farmer Field School) members with knowledge on climatic risks
and adaptive options
Fig 3 reveals that the majority members of FFS households (70.29%) did not know about
climate risks, indicating that they could not understand the risks due to climate change although
they receive some information and assistance from the government and NGOs. Thus, only
29.71 % FFS members know about climate risks.

20
Fig 3: FFS member with knowledge of climate risks
3.2.1.2 Concept of FFS members on the indicators of climate risks
The survey findings in Fig 4 show that the project participants who know about climate risks
(29.71% in fig 4) have some concepts regarding the indicators of climate change. According to
the respondents, the major drivers of climate change risks were the change of rainfall pattern
(22% respondents), frequent flood (21% respondents) and increase in hailstorms (20 %
respondents).R. Selvaraju et al, FAO (206) showed in their survey conducted in Bangladesh
that people perceived that the seasonal cycle and rainfall pattern were changed, droughts became
more frequent, pest and disease incidences were increased and the average temperature was increased
in the summer while winter was shortened. The present survey findings, however, shows a small
proportion of project participants know about different indicators of climate risks. Moreover, their
conceptual clarity were not in depth as very few people know about the recent climate change events
like prolong drought, shorter winter season, frequent cold wave in winter, increase in foggy weather,
epidemic outbreak of minor diseases like blast of boro rice etc. Therefore, it implies that the project
participants require in depth knowlege about the current drivers of climate change and the
corresponding risks created thereby.
No70.29%
Yes29.71%
Percent of FFS member with knowledge of climate risks

21
Fig 4: FFS members with knowledge on different indicators of climate change risks
It is also evident from the discussion with farmers in a group (FGD) that some of them were able
to explain the drivers of climate change risks such as prolong drought, insufficient rainfall during
rainy season, untimely rainy season, increase in intensity of cold during winter, delayed winter
season, severe flood, unseasonal flood, prolong flood, recurrent flood (3 or 4 times), unevenly
hailstorm etc.
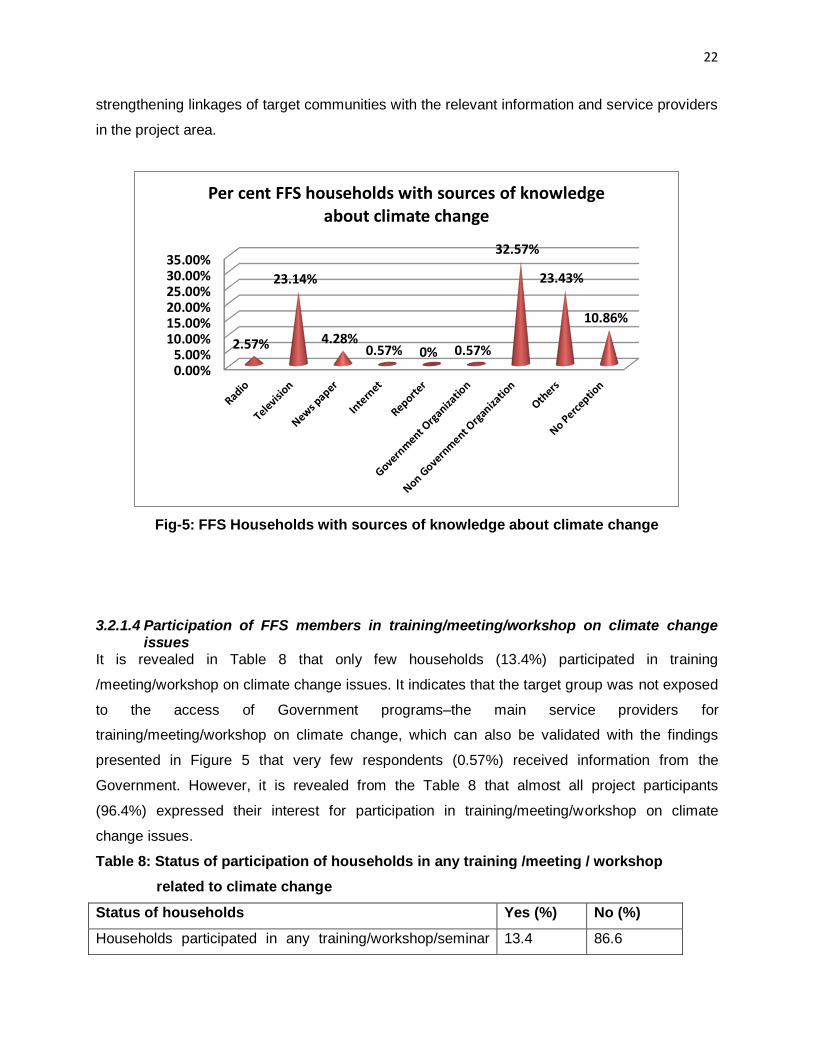
3.2.1.3 FFS members with sources of information about climate change
Figure 5 reveals that less than one-third of the FFS households received information about
climate change from NGOs (32.57%) and Television (23.14%) while very few households
receive information from other sources. The findings also reveals that very negligible proportion
of project participants (0.57%) received information from the government agencies about
climate change. So, the target communities possess very poor knowledge on the climate risks
primarily due to poor sources of information channel and hence the project requires
0.00%
5.00%
10.00%
15.00%
20.00%
25.00%
11.87%
21.99%20.41%
6.33%
21.04%
0.95%3.32%
0% 0.16%
8.23%
5.70%
Per cent of houseolds with knowledge on different indicators of climate risks
22
strengthening linkages of target communities with the relevant information and service providers
in the project area.
Fig-5: FFS Households with sources of knowledge about climate change
3.2.1.4 Participation of FFS members in training/meeting/workshop on climate change issues
It is revealed in Table 8 that only few households (13.4%) participated in training
/meeting/workshop on climate change issues. It indicates that the target group was not exposed
to the access of Government programs–the main service providers for
training/meeting/workshop on climate change, which can also be validated with the findings
presented in Figure 5 that very few respondents (0.57%) received information from the
Government. However, it is revealed from the Table 8 that almost all project participants
(96.4%) expressed their interest for participation in training/meeting/workshop on climate
change issues.
Table 8: Status of participation of households in any training /meeting / workshop
related to climate change
Status of households Yes (%) No (%)
Households participated in any training/workshop/seminar 13.4 86.6
0.00%5.00%
10.00%15.00%20.00%25.00%30.00%35.00%
2.57%
23.14%
4.28%0.57% 0% 0.57%
32.57%
23.43%
10.86%
Per cent FFS households with sources of knowledge about climate change
23
related to climate change
Households were interested for participation in any such
kind of training/workshop/seminar related to climate change
96.4 3.6
While discussing with a group of farmers (FGD), it was evident that they did not receive enough
training related to climate change adaptation issues, except what they received was mainly how
to prepare seedbed during the time of flood. Upon an open question, all of them expressed their
interest to receive the training on the following subject areas:
• Alternate technologies for adaptation to climate change, particularly how to
cultivate crops to cope with drought, flood, untimely winter season etc.
• Timely access to early warning information on flood and thunderstorm,
• Harmful effect of climate change on agriculture and how to cope with these
harmful effects
• Livestock and poultry rearing
• Disaster risk reduction and preparedness
• Pest and disease management of crops, livestock and fisheries
• Preservation of seed, dry food and child food
Therefore the project should take care of the interest of project participants so that they receive
new knowledge through training on the above subjects.
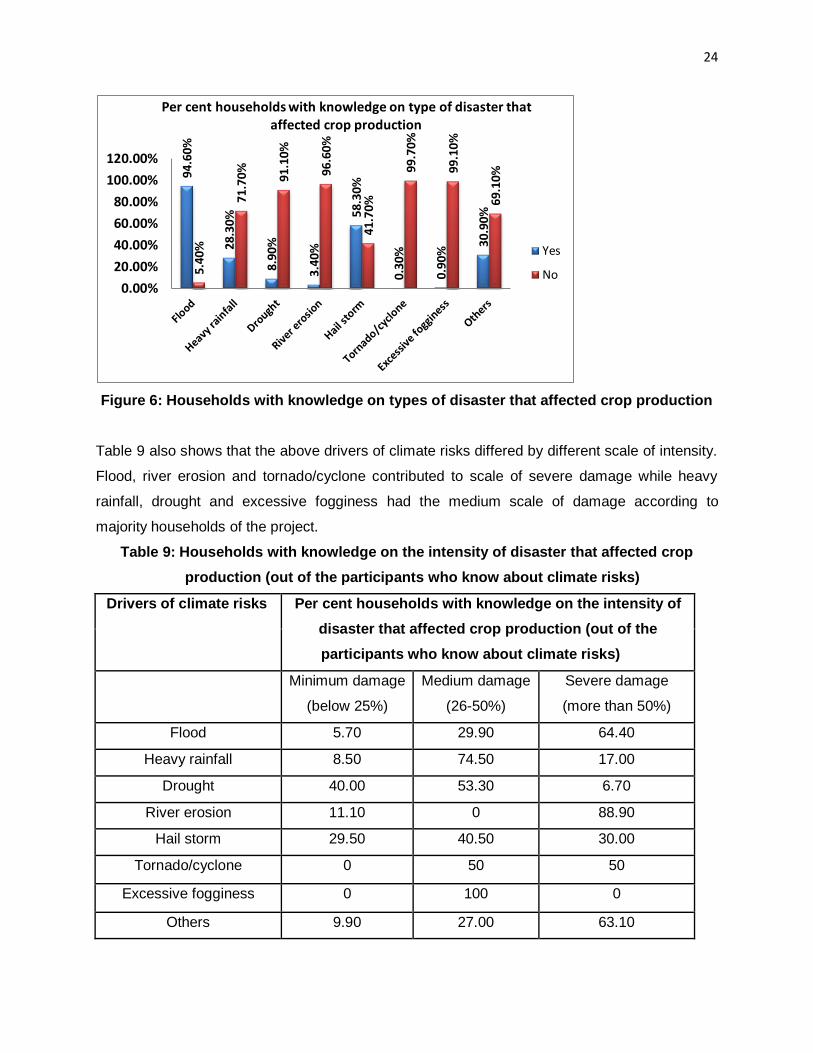
3.2.1.5 Knowledge of the targeted communities about the effect of climate change on
crop production
The survey recognized major drivers of climate change risks that affected crop production in the
project area. Figure 6 shows that out of the households (29.71%) with knowledge of climate
risks as shown in Fig 3, almost all households (94.6%) perceived flood as the major driver of
climate risks that affected crop production. Next to flood, about half of the households (58.30%)
recognized hail storm and about one-third (28.30%) reported heavy rainfall as the causal factors
that also affected crop production. Drought, river erosion, Tornado/Cyclone and excessive
fogginess were not noticed as critical factors that affected crop production according to the vast
majority of households (>90%).
24
Figure 6: Households with knowledge on types of disaster that affected crop production
Table 9 also shows that the above drivers of climate risks differed by different scale of intensity.
Flood, river erosion and tornado/cyclone contributed to scale of severe damage while heavy
rainfall, drought and excessive fogginess had the medium scale of damage according to
majority households of the project.
Table 9: Households with knowledge on the intensity of disaster that affected crop
production (out of the participants who know about climate risks)
Drivers of climate risks Per cent households with knowledge on the intensity of
disaster that affected crop production (out of the
participants who know about climate risks)
Minimum damage
(below 25%)
Medium damage
(26-50%)
Severe damage
(more than 50%)
Flood 5.70 29.90 64.40
Heavy rainfall 8.50 74.50 17.00
Drought 40.00 53.30 6.70
River erosion 11.10 0 88.90
Hail storm 29.50 40.50 30.00
Tornado/cyclone 0 50 50
Excessive fogginess 0 100 0
Others 9.90 27.00 63.10
94.6
0%
28.3
0%
8.90
%
3.40
%
58.3
0%
0.30
%
0.90
%
30.9
0%
5.40
%
71.7
0% 91.1
0%
96.6
0%
41.7
0%
99.7
0%
99.1
0%
69.1
0%
0.00%
20.00%
40.00%
60.00%
80.00%
100.00%
120.00%
Per cent households with knowledge on type of disaster that affected crop production
Yes
No
25
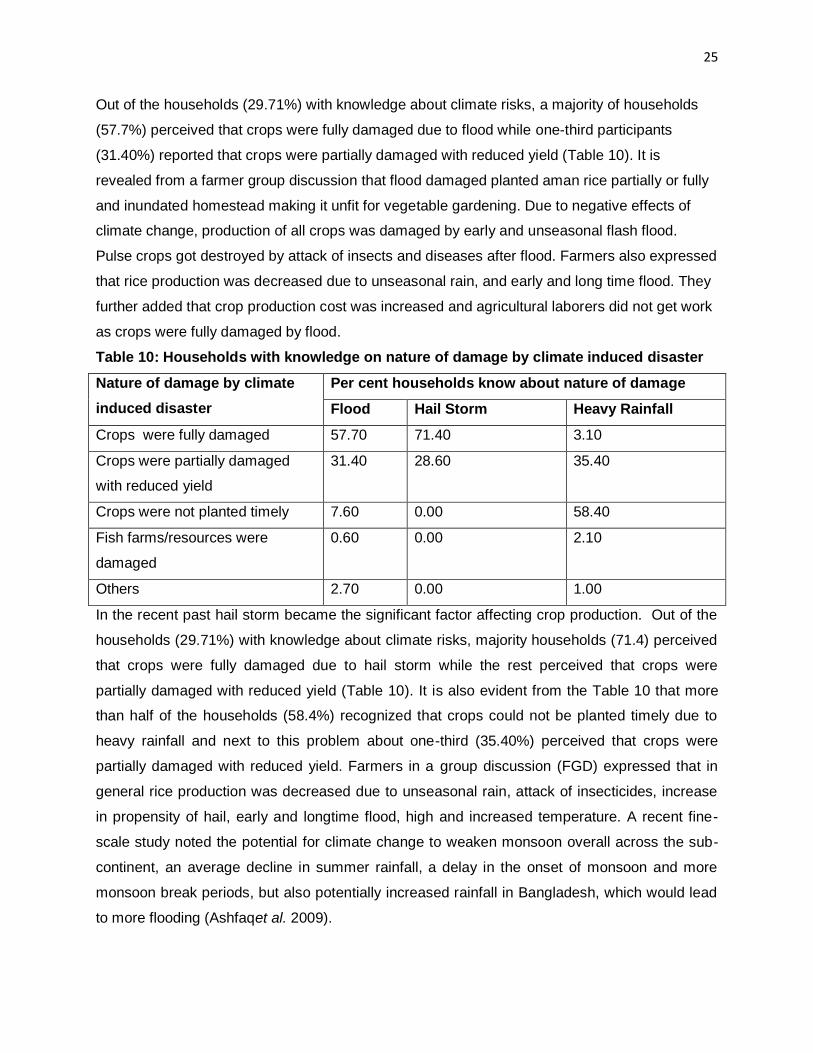
Out of the households (29.71%) with knowledge about climate risks, a majority of households
(57.7%) perceived that crops were fully damaged due to flood while one-third participants
(31.40%) reported that crops were partially damaged with reduced yield (Table 10). It is
revealed from a farmer group discussion that flood damaged planted aman rice partially or fully
and inundated homestead making it unfit for vegetable gardening. Due to negative effects of
climate change, production of all crops was damaged by early and unseasonal flash flood.
Pulse crops got destroyed by attack of insects and diseases after flood. Farmers also expressed
that rice production was decreased due to unseasonal rain, and early and long time flood. They
further added that crop production cost was increased and agricultural laborers did not get work
as crops were fully damaged by flood.
Table 10: Households with knowledge on nature of damage by climate induced disaster
Nature of damage by climate
induced disaster
Per cent households know about nature of damage
Flood Hail Storm Heavy Rainfall
Crops were fully damaged 57.70 71.40 3.10
Crops were partially damaged
with reduced yield
31.40 28.60 35.40
Crops were not planted timely 7.60 0.00 58.40
Fish farms/resources were
damaged
0.60 0.00 2.10
Others 2.70 0.00 1.00
In the recent past hail storm became the significant factor affecting crop production. Out of the
households (29.71%) with knowledge about climate risks, majority households (71.4) perceived
that crops were fully damaged due to hail storm while the rest perceived that crops were
partially damaged with reduced yield (Table 10). It is also evident from the Table 10 that more
than half of the households (58.4%) recognized that crops could not be planted timely due to
heavy rainfall and next to this problem about one-third (35.40%) perceived that crops were
partially damaged with reduced yield. Farmers in a group discussion (FGD) expressed that in
general rice production was decreased due to unseasonal rain, attack of insecticides, increase
in propensity of hail, early and longtime flood, high and increased temperature. A recent fine-
scale study noted the potential for climate change to weaken monsoon overall across the sub-
continent, an average decline in summer rainfall, a delay in the onset of monsoon and more
monsoon break periods, but also potentially increased rainfall in Bangladesh, which would lead
to more flooding (Ashfaqet al. 2009).
26
3.2.1.6 Knowledge of the targeted communities on adaptive options through early
warning and shelter during disaster
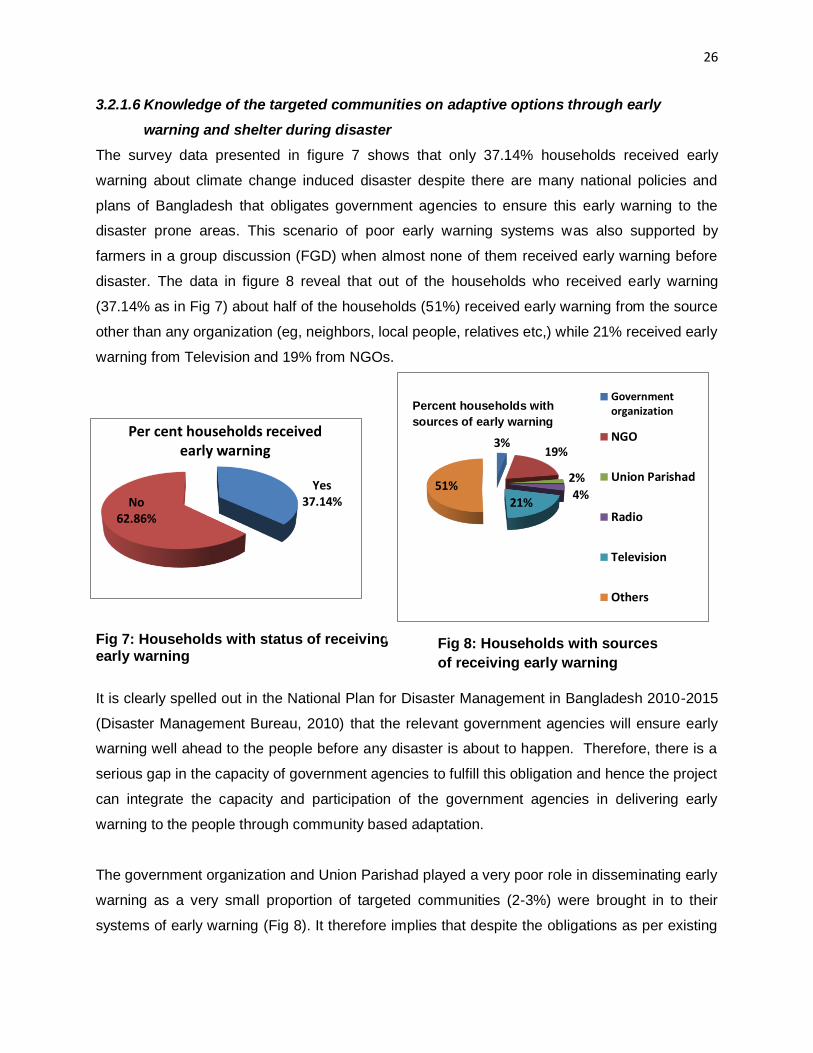
The survey data presented in figure 7 shows that only 37.14% households received early
warning about climate change induced disaster despite there are many national policies and
plans of Bangladesh that obligates government agencies to ensure this early warning to the
disaster prone areas. This scenario of poor early warning systems was also supported by
farmers in a group discussion (FGD) when almost none of them received early warning before
disaster. The data in figure 8 reveal that out of the households who received early warning
(37.14% as in Fig 7) about half of the households (51%) received early warning from the source
other than any organization (eg, neighbors, local people, relatives etc,) while 21% received early
warning from Television and 19% from NGOs.
Fig 7: Households with status of receiving early warning
It is clearly spelled out in the National Plan for Disaster Management in Bangladesh 2010-2015
(Disaster Management Bureau, 2010) that the relevant government agencies will ensure early
warning well ahead to the people before any disaster is about to happen. Therefore, there is a
serious gap in the capacity of government agencies to fulfill this obligation and hence the project
can integrate the capacity and participation of the government agencies in delivering early
warning to the people through community based adaptation.
The government organization and Union Parishad played a very poor role in disseminating early
warning as a very small proportion of targeted communities (2-3%) were brought in to their
systems of early warning (Fig 8). It therefore implies that despite the obligations as per existing
Yes37.14%No
62.86%
Per cent households received early warning
3%19%
2%
4%21%
51%
Governmentorganization
NGO
Union Parishad
Radio
Television
Others
Fig 8: Households with sources
of receiving early warning
Percent households with
sources of early warning

27
national policies/plan of Bangladesh, government organizations and local government (Union
Parishad) were not able to provide early warning before disaster to the mass people in the
project site. Thus, the project should create the space for building capacity and coordination in
and among relevant government organizations and Union Parishads. Further, there are disaster
management committees at different administrative tiers of the government from national to
union level, and at union level there is Union Disaster Management Committee (UDMC) as per
National Disaster Management Plan 2010-2015.However, UDMC does not have representative
from the climate victims. So, the project should develop the voicing capacity of the targeted
communities in such way that they are able to create pressure to include their representative in
UDMC and in turn, they can activate the committee to reduce climate risks through early
warning. It is very unlikely that out of the households who receive early warning (37.14%)about
three-fourth of the households (73.70%) did not go to the flood rehabilitation center (Table 11).It
is worth mentioning that the targeted households were so aware on the importance of early
warning to reduce the risks of climate induced disaster as almost cent percent (97.7%) of the
households showed interest to receive early warning (Table 11).
Table 11: Status of households who went to flood rehabilitation center after receiving
early warning and who were interested to receive early warning
Status of Households Yes (%) No (%)
Households went to flood rehabilitation center after
receiving early warning
26.3 73.7
Households were interested to receive early warning
97.7
2.3
This finding indicates that the targeted households are reluctant to go to the flood shelter even
they receive early warning and know its importance. The main reason for their reluctance is
evident from the data presented in figure 9 that the flood rehabilitation centers were not
available in their vicinity according to majority households (76.22 %) out the households who
received early warning but did not go to the shelter. Apart from this, steeling of family assets,
scarcity of sufficient space, unhygienic environment, far away from home and others were the
minor reasons as mentioned only by few households (1.75-7.69%). This finding indicates that
the targeted areas of the project did not receive assistance neither from the government nor
from the NGOs to build flood rehabilitation center in the vicinity of households and hence the
question of receiving early warning by the communities was useless. Therefore, the challenge is

28
ahead of the project as to how the early warning system is made operational by the government
agencies and at the same time how the communities can make best use of this early warning
for adapting to climate induced disasters.
Fig-9: Targeted households with reasons why they did not go to the flood rehabilitation
center even after receiving early warning
Major findings in this section are a) only 29.71 % FFS members of the targeted
households know about climate risks, b) only few households (13.4%) participated in
training /meeting/workshop on climate change issues, c) Out of the FFS members
(29.71%) with knowledge of climate risks, major drivers of climate change risks were
flood, hail storm and heavy rainfall as the causal factors that affected crop production, d)
only 37.14% households received early warning about climate change induced disaster
3.2.2 Status of households/family having average month with insufficient food
End hunger, achieve food security and improve nutrition is at the heart of the sustainable
development goals. At the same time, climate change is already impacting agriculture
(Ahammad et el, 2015) and food security, and will make the challenge of ending hunger and
malnutrition even more difficult. Multiple aspects of food security were explored by the survey,
including food insecure months of households.
3.2.2.1 Average month with insufficient food at households
Scarcity of sufficient
space4.90%
Unhygienic environment
3.15%Steeling of
family assets7.69%
Far away from home1.75%
Absence of rehabilation
centre76.22%
Others6.29%
Per cent households with reasons why they did not go to the flood shelter

29
Table 12 reveals that the targeted households had insufficient food in 3.5 months on an average
throughout the year. About one-third households (33.14%) encountered difficulty due to food
deficiency in 4 months while one-fourth (26 %) households had food deficiency in 3 months and
a similar proportion of households experienced insufficient food respectively in 5 months
(12.86%) and 2 months (12.57%). A small proportion of households noticed food deficiency in 6
months (4.57%) and in 1 month (7.43%) while a very negligible proportion of households
(3.43%) did not have food insufficient month throughout the year.
Table 12: Average month with insufficient food per household
Number of month with
insufficient food
Households
(number)
Households
(%)
Total food
insecure months
Six months 16 4.57 96
Five months 45 12.86 225
Four months 116 33.14 464
Three months 91 26.00 273
Two months 44 12.57 88
One month 26 7.43 26
No month 12 3.43 00
Total 350 100 1172
Average month with insufficient
food/household
01 01 3.35
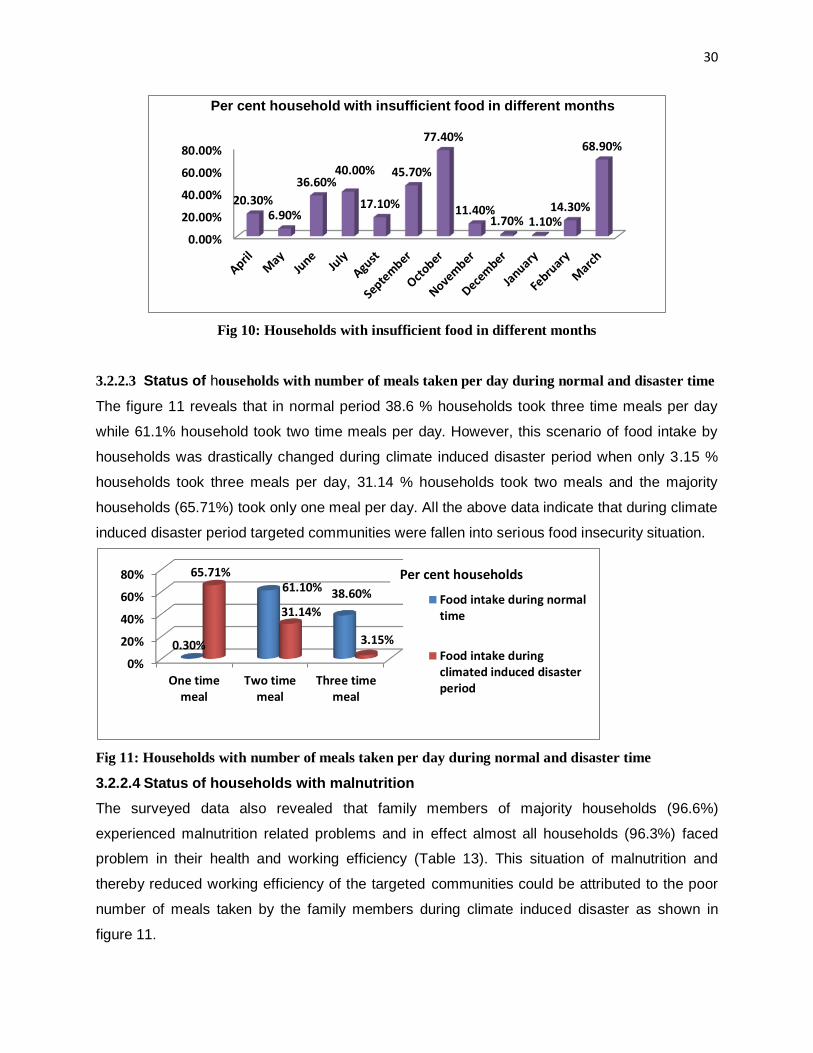
3.2.2.2 Status of households with insufficient food in different months
The figure 10 reveals that October and March were the lean months when 77.4% and 68.9 %
households respectively faced difficulty of taking 3 meals a day and nearly 36 to 45%
households also faced food deficiency during June, July and September. This scenario of food
insecure months was also supported by the farmers in a group discussion (FGD) that they faced
food scarcity two times a year, one during March and the other in October i.e one during the
later part of boro season and the other is the pre harvesting of amon rice. This finding indicates
some sort of reversal of seasonal famine like situation called “monga”, which was eradicated
from northwest Bangladesh 8-10 years back simply by introducing alternate crops and cropping
pattern with short duration rice varieties like BRRI dhan 33 and BINA 7.
30
Fig 10: Households with insufficient food in different months
3.2.2.3 Status of households with number of meals taken per day during normal and disaster time
The figure 11 reveals that in normal period 38.6 % households took three time meals per day
while 61.1% household took two time meals per day. However, this scenario of food intake by
households was drastically changed during climate induced disaster period when only 3.15 %
households took three meals per day, 31.14 % households took two meals and the majority
households (65.71%) took only one meal per day. All the above data indicate that during climate
induced disaster period targeted communities were fallen into serious food insecurity situation.
Fig 11: Households with number of meals taken per day during normal and disaster time
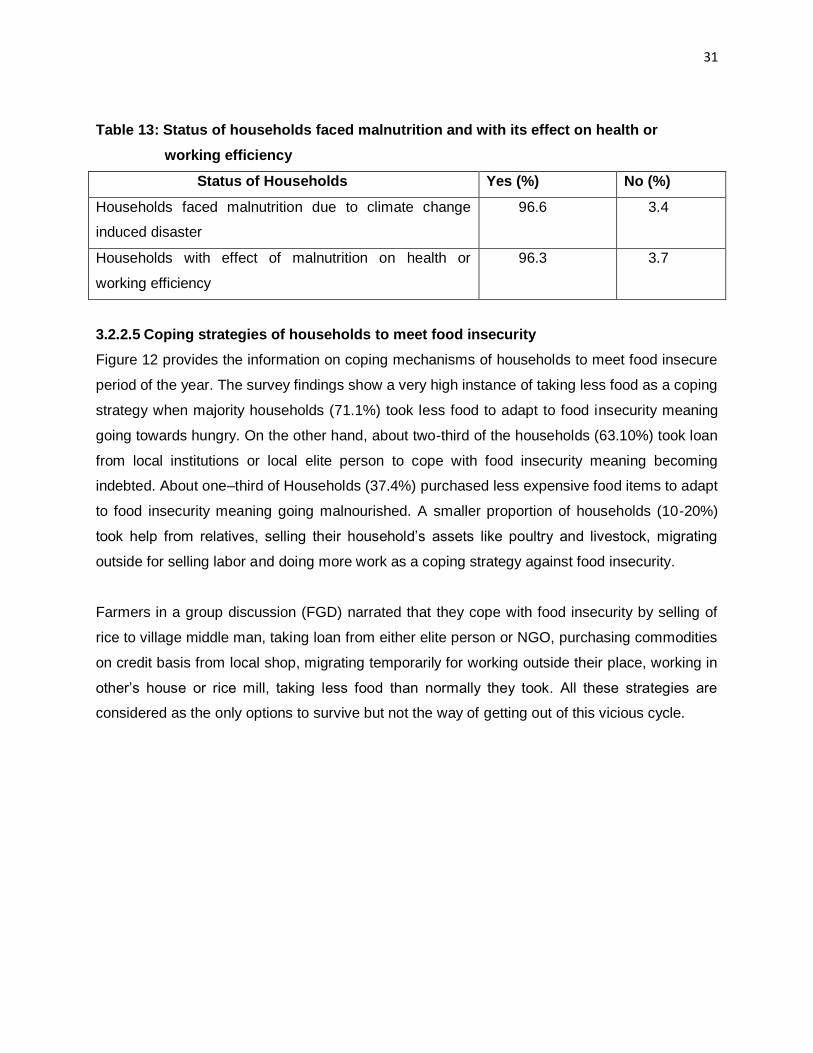
3.2.2.4 Status of households with malnutrition
The surveyed data also revealed that family members of majority households (96.6%)
experienced malnutrition related problems and in effect almost all households (96.3%) faced
problem in their health and working efficiency (Table 13). This situation of malnutrition and
thereby reduced working efficiency of the targeted communities could be attributed to the poor
number of meals taken by the family members during climate induced disaster as shown in
figure 11.
0.00%
20.00%
40.00%
60.00%
80.00%
20.30%6.90%
36.60%40.00%
17.10%
45.70%
77.40%
11.40%1.70% 1.10%
14.30%
68.90%
Per cent household with insufficient food in different months
0%
20%
40%
60%
80%
One timemeal
Two timemeal
Three timemeal
0.30%
61.10% 38.60%
65.71%
31.14%
3.15%
Food intake during normaltime
Food intake duringclimated induced disasterperiod
Per cent households
31
Table 13: Status of households faced malnutrition and with its effect on health or
working efficiency
Status of Households Yes (%) No (%)
Households faced malnutrition due to climate change
induced disaster
96.6 3.4
Households with effect of malnutrition on health or
working efficiency
96.3 3.7
3.2.2.5 Coping strategies of households to meet food insecurity
Figure 12 provides the information on coping mechanisms of households to meet food insecure
period of the year. The survey findings show a very high instance of taking less food as a coping
strategy when majority households (71.1%) took less food to adapt to food insecurity meaning
going towards hungry. On the other hand, about two-third of the households (63.10%) took loan
from local institutions or local elite person to cope with food insecurity meaning becoming
indebted. About one–third of Households (37.4%) purchased less expensive food items to adapt
to food insecurity meaning going malnourished. A smaller proportion of households (10-20%)
took help from relatives, selling their household’s assets like poultry and livestock, migrating
outside for selling labor and doing more work as a coping strategy against food insecurity.
Farmers in a group discussion (FGD) narrated that they cope with food insecurity by selling of
rice to village middle man, taking loan from either elite person or NGO, purchasing commodities
on credit basis from local shop, migrating temporarily for working outside their place, working in
other’s house or rice mill, taking less food than normally they took. All these strategies are
considered as the only options to survive but not the way of getting out of this vicious cycle.

32
Fig 12: Copping strategies of households to meet food insecurity
3.2.2.6 Food security of women in particular as affected by climate change
It is clearly evident from the Table 14 that there was a significant disparity between men and
women while taking food regardless of normal and disaster time, which is a common scenario in
our society happening generation to generation. Nevertheless, the situation of women regarding
food security during the time of disaster was quite alarming among the target communities of
the project. During normal time 40.4 % households provided three time meals for their male
members while only 24.8% households provided three time meals for their female members. On
the other hand during disaster time, despite a general decline of food intake across the gender
40.4% households provided two time meals for their male members while only 18.7 %
households provided two time meals for their female members. They mainly tried to feed their
children so the children of 77.2% households ate food three times a day during disaster. It was
also evident from the discussion with the farmers in a group (FGD) when they expressed that
normally they took food three times a day but during flood they tookfood only one time a day
due to damage of crops. They further narrated that women took food two times per day when
they were busy with postharvest work and however, they admitted that women took less amount
and poor quality of food than men due to the traditional practice in the society. So, it is clear
from this survey data that during disaster time food security was greatly hampered in general
0.00%
10.00%
20.00%
30.00%
40.00%
50.00%
60.00%
70.00%
80.00%63.10%
15.10% 14.00%
3.70%
22.60%
71.10%
37.40%
9.10%13.10%
6.00%
Per cent households cope with food insecurity

33
and in most of the cases women became the worst victim of food scarcity that ultimately
affected their health and nutrition.
Table 14: Status of food intake by household family members during normal time and
climate change induced disaster
Status of food intake
By sex Per cent households with food intake of family members
One time Two time Three time
During normal time Men 0.30 59.30 40.40
Women 1.10 74.10 24.80
Children 3.60 2.30 94.10
During climate change
induced disaster
Men 53.10 40.40 6.50
Women 78.40 18.70 2.90
Children 1.00 21.80 77.20
It is, therefore, worth mentioning that to reach the goal of the project the targeted communities
especially women should be provided with innovative ways of adaption to climate change
through SuPER agriculture approach so that their food insecurity is reduced significantly.
Major findings in this section are a) the targeted households had insufficient food in 3.5
months on an average throughout the year b) October and March were the lean months
when 77.4% and 68.9 % households respectively faced difficulty of taking 3 meals a day
c) in normal period majority households(61.1%) took two time meals per day but during
disaster period the majority households (65.71%) took only one meal per day, d) majority
households (96.6%) experienced malnutrition related problems and in effect almost all
households (96.3%) faced problem in their health and working efficiency, e) majority
households (71.1%) took less food to adapt to food insecurity and 63.10% households
took loan from local institutions or local elite person to cope with food insecurity, f)
During disaster time, 40.4% households provided two time meals for their male members
while only 18.7 % households provided two time meals for their female members,
3.2.3 Increase in adaptive capacities of targeted communities
It is to be noted that different government agencies/departments are mandated to provide
services, information and resources to the poor people. Now-a-days, communities are also
receiving services form NGOs, and dealers or retailers of private seed and pesticide companies.
34
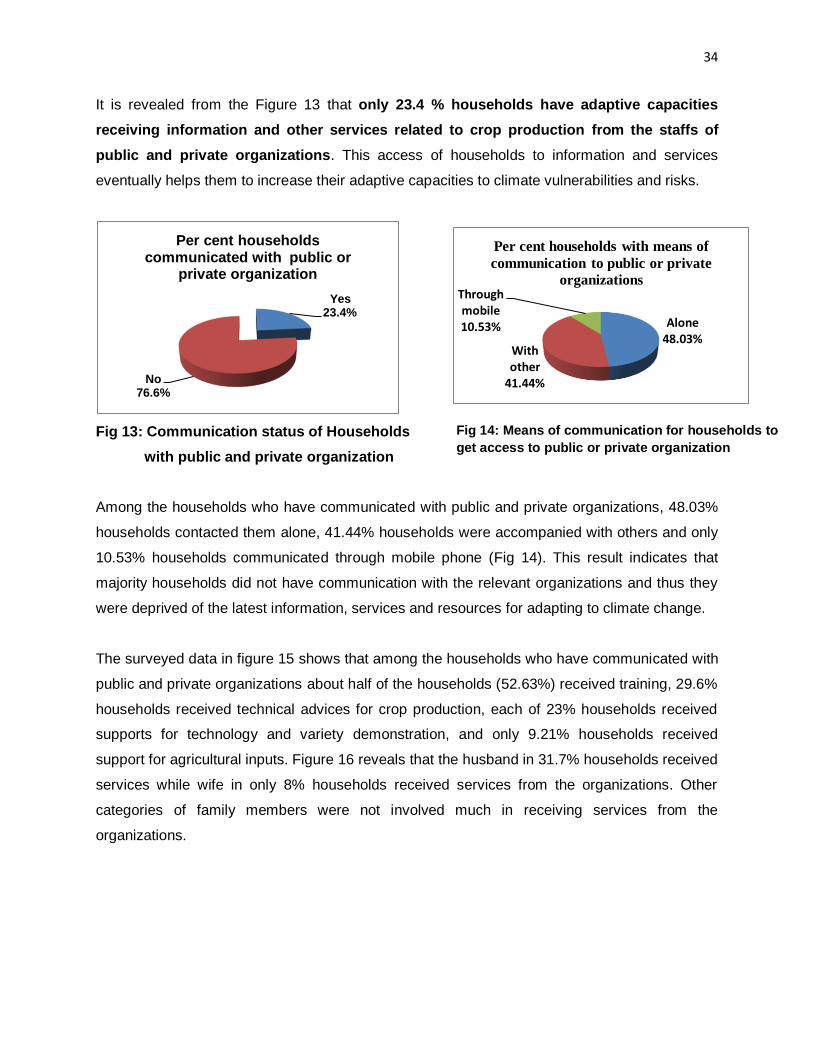
It is revealed from the Figure 13 that only 23.4 % households have adaptive capacities
receiving information and other services related to crop production from the staffs of
public and private organizations. This access of households to information and services
eventually helps them to increase their adaptive capacities to climate vulnerabilities and risks.
Fig 13: Communication status of Households
with public and private organization
Among the households who have communicated with public and private organizations, 48.03%
households contacted them alone, 41.44% households were accompanied with others and only
10.53% households communicated through mobile phone (Fig 14). This result indicates that
majority households did not have communication with the relevant organizations and thus they
were deprived of the latest information, services and resources for adapting to climate change.
The surveyed data in figure 15 shows that among the households who have communicated with
public and private organizations about half of the households (52.63%) received training, 29.6%
households received technical advices for crop production, each of 23% households received
supports for technology and variety demonstration, and only 9.21% households received
support for agricultural inputs. Figure 16 reveals that the husband in 31.7% households received
services while wife in only 8% households received services from the organizations. Other
categories of family members were not involved much in receiving services from the
organizations.
Yes23.4%
No76.6%
Per cent households communicated with public or
private organization
Alone48.03%
With other
41.44%
Through mobile10.53%
Per cent households with means of
communication to public or private
organizations
Fig 14: Means of communication for households to
get access to public or private organization

35
Fig 15: Types of services received by the targeted
Households from the organizations
Households were asked from which organizations they have received services. It is revealed
from Table 15 that only 26.03% households received services from the Department of
Agriculture Extension (DAE) – the government agency while 22% households received services
from NGOs. Others like private agricultural input sellers and agriculture research organizations
were not available in the vicinity of the project site and hence very few households (0.3-2.6%)
received services from them. The surveyed data in Table 16 revealed that most of the
households (86.9%) were not satisfied as the services they received from the above
organizations were not sufficient.
Table 15: Types of organizations communicated by the households to receive services
Types of organization provided services Number of
households
Per cent
Department of Agriculture Extension (DAE) 91 26.30
NGO 77 22.00
Agricultural Research Institution 01 0.30
Private agriculture input sellers (seed, pesticides) 9 2.60
Others 14 4.00
Table 16: Status of services received by households from organizations
0.00%
10.00%
20.00%
30.00%
40.00%
50.00%
60.00% 52.63%
23.68%29.60%
23.03%
9.21%4.60%
Per cent household with types of services
received from organizations
0.00%5.00%
10.00%15.00%20.00%25.00%30.00%35.00%
31.70%
8% 6.90%3.10%
Per cent households with type
of members recieved services
Fig 16: Type of family members from households
received services from the organizations
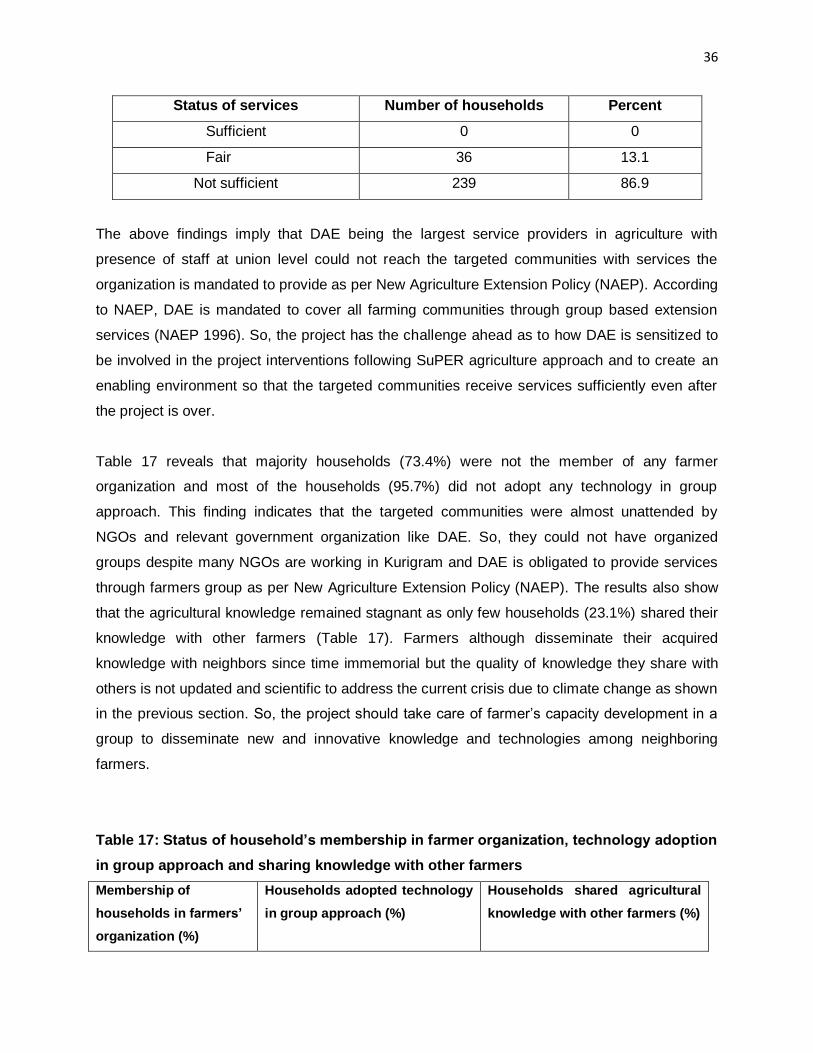
36
Status of services Number of households Percent
Sufficient 0 0
Fair 36 13.1
Not sufficient 239 86.9
The above findings imply that DAE being the largest service providers in agriculture with
presence of staff at union level could not reach the targeted communities with services the
organization is mandated to provide as per New Agriculture Extension Policy (NAEP). According
to NAEP, DAE is mandated to cover all farming communities through group based extension
services (NAEP 1996). So, the project has the challenge ahead as to how DAE is sensitized to
be involved in the project interventions following SuPER agriculture approach and to create an
enabling environment so that the targeted communities receive services sufficiently even after
the project is over.
Table 17 reveals that majority households (73.4%) were not the member of any farmer
organization and most of the households (95.7%) did not adopt any technology in group
approach. This finding indicates that the targeted communities were almost unattended by
NGOs and relevant government organization like DAE. So, they could not have organized
groups despite many NGOs are working in Kurigram and DAE is obligated to provide services
through farmers group as per New Agriculture Extension Policy (NAEP). The results also show
that the agricultural knowledge remained stagnant as only few households (23.1%) shared their
knowledge with other farmers (Table 17). Farmers although disseminate their acquired
knowledge with neighbors since time immemorial but the quality of knowledge they share with
others is not updated and scientific to address the current crisis due to climate change as shown
in the previous section. So, the project should take care of farmer’s capacity development in a
group to disseminate new and innovative knowledge and technologies among neighboring
farmers.
Table 17: Status of household’s membership in farmer organization, technology adoption
in group approach and sharing knowledge with other farmers
Membership of
households in farmers’
organization (%)
Households adopted technology
in group approach (%)
Households shared agricultural
knowledge with other farmers (%)

37
Yes No Yes No Yes No
26.6 73.4 4.3 95.7 23.1 76.9
From the above results/findings it can be concluded that the ability of target communities to
build resilience to the effects of climate change and vulnerabilities is minimal primarily due to
their poor communication with relevant organization, receiving inadequate services from the
organizations, weak linkages with the government organization like DAE in particular for
addressing climate effects on crop production and the absence of organized farmers group.
Major findings in this section are a) only 23.4 % households have adaptive capacities
receiving information and other services related to crop production from the staffs of
public and private organizations, b) out of the households communicated with
organizations only 26.03% households received services from the Department of
Agriculture Extension (DAE) – the government agency, c) most of the households
(86.9%) who communicated with different organizations were not satisfied as the
services they received were not sufficient, d) majority households (73.4%) of the targeted
communities were not the member of any farmer organization and most of the
households (95.7%) did not adopt any technology in group approach, and e) the
agricultural knowledge remained stagnant as only few households (23.1%) of the
targeted communities shared their knowledge with other farmers.
3.3 Increased practices of SuPER Agriculture approach
3.3.1 Status of agricultural productivity (crop)
Farmers in a group discussion provided the following crops and cropping pattern they practiced
in the last 5 years:
Existing Cropping pattern
High land : Fallow - Seedbed - Vegetable
Medium high land : Fallow - Aman rice - Boro rice
Low land : Fallow –Mustard - Boro rice
Table 18 reveals that farmers generally cultivated rice variety BRRIdhan 28 during boro season
and received 2.5 MT /hectare yield. Due to the risk of flood, they cultivated local varieties of
aman rice eg, Ganjila, Goti etc, with an average yield of 2-2.5 MT/hectare. Very few farmers
cultivated BRRIdhan 49, BRRIdhan 11 and BRRIdhan 52 (submergence tolerance) with

38
average yield of 3.5 MT /hectare. Mustard was cultivated with varieties eg, BINA 4 and BARI 14
by a few farmers receiving average yield of 1.35 MT per hectare.
Table 18: Status of crop yield received by the target communities during Kharif season in
2016 and Rabi season in 2017
Crop Season Variety Yield
(MT/hectare)
Remarks
Boro rice Rabi BRRIdhan 28 2.5 Many farmers cultivated but
crops were affected by
blast disease
Aman rice Kharif II Gonjila, Goti 2.0 Many farmers cultivated
local varieties to avoid risk
of flood but yield was low
Aman rice Kharif II BRRIdhan 49,
BRRIdhan 11,
BRRIdhan 52
3.5 Few farmers cultivated but
crops were affected by
prolong flood
Mustard Rabi BINA 4, BINA 14 1.35 Few farmers cultivated but
crops were affected by
delayed planting due to
flood
It is evident from the above practices of farmers that the most of the targeted farmers kept their
land fallow during May to June after boro harvest and before t.aman rice, and cultivate local
varieties in t.aman rice season but crop yield in general was very low compared to their
recommended yield. Crop harvest in the recent boro rice season was seriously affected by blast
disease and yield was significantly reduced. Prolong flood affected high HYV aman rice and the
farmers cultivated local varieties, which gave lower yield. Mustard or other rabi crops could not
be planted in time due to delay in recession of flood water and consequently yield was low. This
indicates that there are opportunities to increase cropping intensity and crop yield with
adjustment of crops and alternate varieties to be grown in fallow period using the benefit of early
monsoon and replacing local varieties with flood or drought tolerant modern varieties.
3.3.2 Farmers practicing at least three adaptive agricultural technologies
3.3.2.1 Targeted farmers practicing at least three adaptive agricultural technologies

39
Table 19 reveals that a very few targeted farmers (18%) practiced different adaptive agricultural
technologies within a range of 1-8 in numbers out of which the highest proportion of households
(8.86%) practiced only one technology and the lowest proportion (0.29%) of households
practiced five technologies. Within the range of 3-8 technologies there were 4.28% farmers who
practiced at least three adaptive agricultural technologies out of which 0.57 % farmers practiced
8 technologies, 1.14 % farmers used seven technologies, 0.86% with 6 technologies, 0.29%
with 5 technologies, 0.57 % with 4 technologies and 0.86% with 3 technologies.
Table 19: Status of farmers practicing at least three adaptive agricultural technologies
Adaptive agricultural
technology (number)
Households
(number)
Households
(%)
Cumulative
households (number)
Cumulative
households (%)
Eight 2 0.57 2 0.57
Seven 4 1.14 6 1.70
Six 3 0.86 9 2.56
Five 1 0.29 10 2.85
Four 2 0.57 12 3.42
Three 3 0.86 15 4.28
Two 17 4.86 32 9.14
One 31 8.86 63 18
Total 63 18
The results indicate that majority farmers of the targeted communities did not bring any change
in their cultivation to adapt to climate change risks and vulnerabilities, which can be validated
with the findings given below.
3.3.2.2 Households with changes in cultivation to adapt to climate change
Study findings presented in the figure 17 shows that only 13.7% households brought changes in
cultivation to adapt to climate change while majority farmers (86.3%) did not bring any change in
their cultivation system due to climate change.
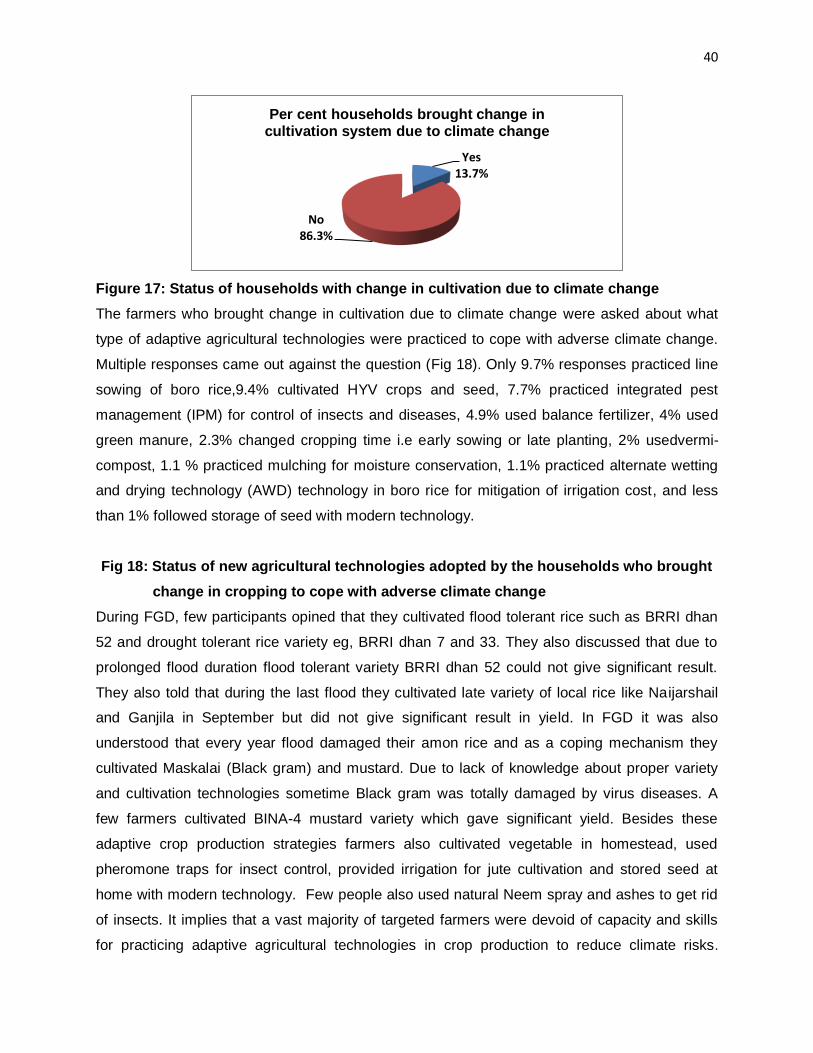
40
Figure 17: Status of households with change in cultivation due to climate change
The farmers who brought change in cultivation due to climate change were asked about what
type of adaptive agricultural technologies were practiced to cope with adverse climate change.
Multiple responses came out against the question (Fig 18). Only 9.7% responses practiced line
sowing of boro rice,9.4% cultivated HYV crops and seed, 7.7% practiced integrated pest
management (IPM) for control of insects and diseases, 4.9% used balance fertilizer, 4% used
green manure, 2.3% changed cropping time i.e early sowing or late planting, 2% usedvermi-
compost, 1.1 % practiced mulching for moisture conservation, 1.1% practiced alternate wetting
and drying technology (AWD) technology in boro rice for mitigation of irrigation cost, and less
than 1% followed storage of seed with modern technology.
Fig 18: Status of new agricultural technologies adopted by the households who brought
change in cropping to cope with adverse climate change
During FGD, few participants opined that they cultivated flood tolerant rice such as BRRI dhan
52 and drought tolerant rice variety eg, BRRI dhan 7 and 33. They also discussed that due to
prolonged flood duration flood tolerant variety BRRI dhan 52 could not give significant result.
They also told that during the last flood they cultivated late variety of local rice like Naijarshail
and Ganjila in September but did not give significant result in yield. In FGD it was also
understood that every year flood damaged their amon rice and as a coping mechanism they
cultivated Maskalai (Black gram) and mustard. Due to lack of knowledge about proper variety
and cultivation technologies sometime Black gram was totally damaged by virus diseases. A
few farmers cultivated BINA-4 mustard variety which gave significant yield. Besides these
adaptive crop production strategies farmers also cultivated vegetable in homestead, used
pheromone traps for insect control, provided irrigation for jute cultivation and stored seed at
home with modern technology. Few people also used natural Neem spray and ashes to get rid
of insects. It implies that a vast majority of targeted farmers were devoid of capacity and skills
for practicing adaptive agricultural technologies in crop production to reduce climate risks.
Yes13.7%
No86.3%
Per cent households brought change in cultivation system due to climate change
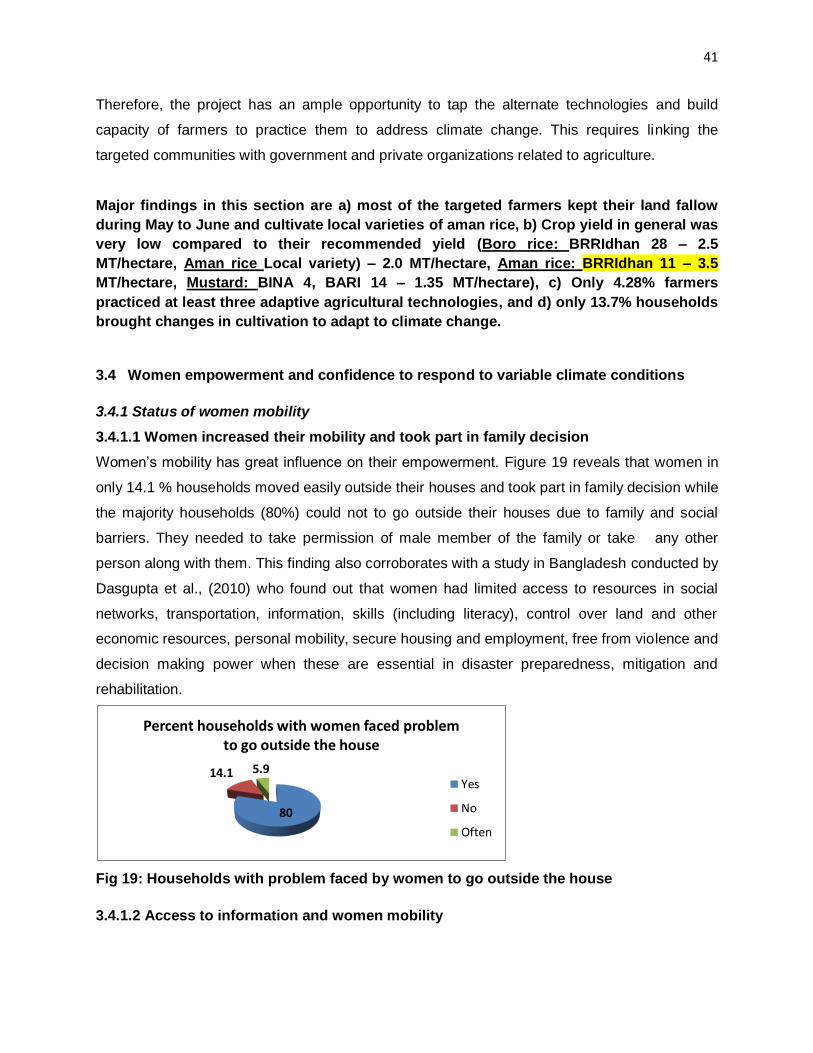
41
Therefore, the project has an ample opportunity to tap the alternate technologies and build
capacity of farmers to practice them to address climate change. This requires linking the
targeted communities with government and private organizations related to agriculture.
Major findings in this section are a) most of the targeted farmers kept their land fallow
during May to June and cultivate local varieties of aman rice, b) Crop yield in general was
very low compared to their recommended yield (Boro rice: BRRIdhan 28 – 2.5
MT/hectare, Aman rice Local variety) – 2.0 MT/hectare, Aman rice: BRRIdhan 11 – 3.5
MT/hectare, Mustard: BINA 4, BARI 14 – 1.35 MT/hectare), c) Only 4.28% farmers
practiced at least three adaptive agricultural technologies, and d) only 13.7% households
brought changes in cultivation to adapt to climate change.
3.4 Women empowerment and confidence to respond to variable climate conditions
3.4.1 Status of women mobility
3.4.1.1 Women increased their mobility and took part in family decision
Women’s mobility has great influence on their empowerment. Figure 19 reveals that women in
only 14.1 % households moved easily outside their houses and took part in family decision while
the majority households (80%) could not to go outside their houses due to family and social
barriers. They needed to take permission of male member of the family or take any other
person along with them. This finding also corroborates with a study in Bangladesh conducted by
Dasgupta et al., (2010) who found out that women had limited access to resources in social
networks, transportation, information, skills (including literacy), control over land and other
economic resources, personal mobility, secure housing and employment, free from violence and
decision making power when these are essential in disaster preparedness, mitigation and
rehabilitation.
Fig 19: Households with problem faced by women to go outside the house
3.4.1.2 Access to information and women mobility
80
14.1 5.9
Percent households with women faced problem to go outside the house
Yes
No
Often

42
Information is crucial for women mobility to respond to climate change effect and reduce
disaster risk and mitigate any possible loss. Majority respondents from FGD shared that women
received very few advance information and training regarding disaster and climate change. It
can be seen from the figure 20 that women of only 1.34% households got information from
government organizations and 9.14% households got information from private organizations or
NGOs. Women’s access to media was not easy or available as only 6.45% households got
information from radio and TV.
Fig 20: Households with women’s sources of information about climate change.
3.4.1.3 Status of measures taken by Government and private sectors involving women in
activities outside their houses
The figure 21 shows that according to majority households (56.9%) no measures were taken yet
for women by GO or NGOs through activities outside their houses to address climate change.
Only 9.0% households referred GO and NGOs who took important measures for women. So a
huge number of women were remained unreached as GO and NGOs were not targeting
specifically women considering their gender role and adverse situation during disaster. The
project therefore should sensitize government organizations in particular so that they integrate
women friendly activities in their annual program and consequently women mobility is increased
due to these activities.
0.00%
10.00%
20.00%30.00%
40.00%
50.00%
60.00% 50.81%
6.45% 8.87%3.23% 1.34%
9.14%
20.16%
Per cent households with women's Source of information about climate change
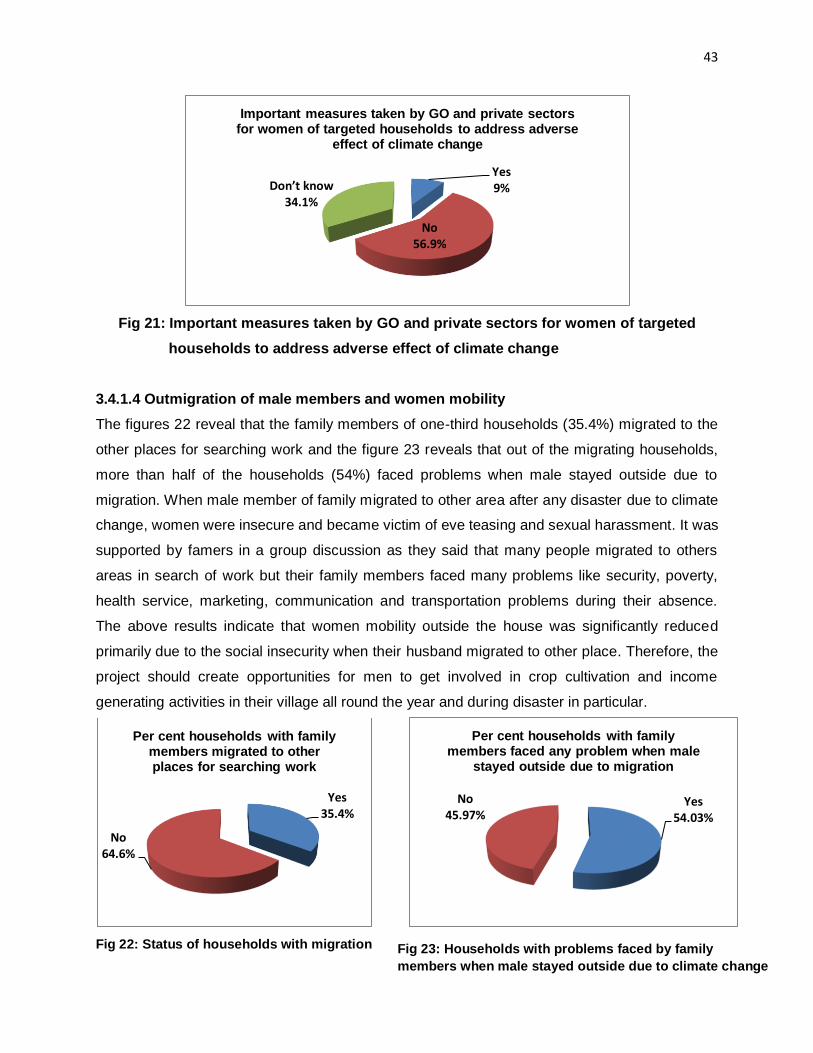
43
Fig 21: Important measures taken by GO and private sectors for women of targeted
households to address adverse effect of climate change
3.4.1.4 Outmigration of male members and women mobility
The figures 22 reveal that the family members of one-third households (35.4%) migrated to the
other places for searching work and the figure 23 reveals that out of the migrating households,
more than half of the households (54%) faced problems when male stayed outside due to
migration. When male member of family migrated to other area after any disaster due to climate
change, women were insecure and became victim of eve teasing and sexual harassment. It was
supported by famers in a group discussion as they said that many people migrated to others
areas in search of work but their family members faced many problems like security, poverty,
health service, marketing, communication and transportation problems during their absence.
The above results indicate that women mobility outside the house was significantly reduced
primarily due to the social insecurity when their husband migrated to other place. Therefore, the
project should create opportunities for men to get involved in crop cultivation and income
generating activities in their village all round the year and during disaster in particular.
Fig 22: Status of households with migration
Yes9%
No56.9%
Don’t know34.1%
Important measures taken by GO and private sectors for women of targeted households to address adverse
effect of climate change
Yes35.4%
No64.6%
Per cent households with family members migrated to other places for searching work
Yes54.03%
No45.97%
Per cent households with family members faced any problem when male
stayed outside due to migration
Fig 23: Households with problems faced by family
members when male stayed outside due to climate change

44
of family members to other places for
searching work
3.4.2 Status of women who are able to equally participate in household financial
decision making
The Table 20 clearly shows that men were main decision maker regarding buying or selling any
land or property. In majority households (80.40%), men solely took decision while buying and
selling land or property where only in 5.70% households women took decision in the same
regards. Only 13.10 % respondents said that both male and female member of the family
equally took decision for buying and selling any land or property. In case of buying and selling
trees, men in majority households (82%) took decision while women in only 6.6% households
took decision in this regard. However, women in only 10.8% households took decision equally
with men for buying or selling trees. Men in majority households (81.8%) took decision for
buying and marketing groceries while women in only 6.3 % households took decision in this
regard. However, only women in 10.7% households took decision equally with men for buying
and marketing groceries. In 48.10% households, men singularly handled borrowing money and
managed where and how to spend it, in contrary in only 15.40% households, women borrowed
money individually and used money. About one-third (30.90%) respondents mentioned that both
male and female equally took decision on receiving loan and spending the money. In case of
buying food for family, men in majority households (66.4%) took decision alone while women in
only 13.3 % households took decision in this regards. However, both women and men in only
19.4% households equally took decision for buying food. The overall results indicate that, on an
average, women in only 16.98 % households were able to equally participate in household
financial decision making like receiving loan and use of loan, and buying and selling land or
property, trees, food, groceries etc.
Table 20: Gender disaggregated decision-making about household financial affairs
Decision-making about household
affairs
Male (%) Female
(%)
Both (%)
Buying and selling land
80.4 5.7 13.1
Buying and selling of trees 82.0 6.6 10.8
Buying and marketing groceries 81.8 6.3 10.7
Receiving loan and use of loans 48.1 15.4 30.9
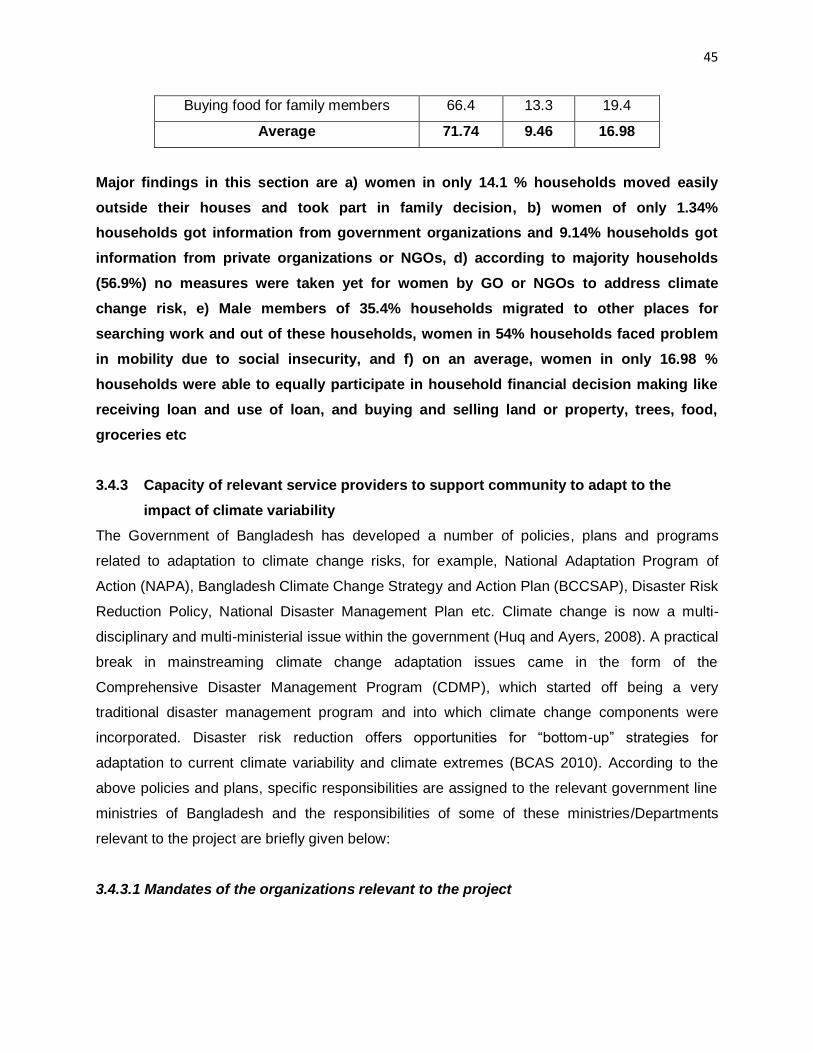
45
Buying food for family members 66.4 13.3 19.4
Average 71.74 9.46 16.98
Major findings in this section are a) women in only 14.1 % households moved easily
outside their houses and took part in family decision, b) women of only 1.34%
households got information from government organizations and 9.14% households got
information from private organizations or NGOs, d) according to majority households
(56.9%) no measures were taken yet for women by GO or NGOs to address climate
change risk, e) Male members of 35.4% households migrated to other places for
searching work and out of these households, women in 54% households faced problem
in mobility due to social insecurity, and f) on an average, women in only 16.98 %
households were able to equally participate in household financial decision making like
receiving loan and use of loan, and buying and selling land or property, trees, food,
groceries etc
3.4.3 Capacity of relevant service providers to support community to adapt to the
impact of climate variability
The Government of Bangladesh has developed a number of policies, plans and programs
related to adaptation to climate change risks, for example, National Adaptation Program of
Action (NAPA), Bangladesh Climate Change Strategy and Action Plan (BCCSAP), Disaster Risk
Reduction Policy, National Disaster Management Plan etc. Climate change is now a multi-
disciplinary and multi-ministerial issue within the government (Huq and Ayers, 2008). A practical
break in mainstreaming climate change adaptation issues came in the form of the
Comprehensive Disaster Management Program (CDMP), which started off being a very
traditional disaster management program and into which climate change components were
incorporated. Disaster risk reduction offers opportunities for “bottom-up” strategies for
adaptation to current climate variability and climate extremes (BCAS 2010). According to the
above policies and plans, specific responsibilities are assigned to the relevant government line
ministries of Bangladesh and the responsibilities of some of these ministries/Departments
relevant to the project are briefly given below:
3.4.3.1 Mandates of the organizations relevant to the project

46
The Ministry of Local Government, Rural Development and Cooperatives, and its
associated organizations (eg, Union Parishad) are responsible for building roads, bridges
and culverts for communication to cyclone shelters and growth centers; advising people to keep
the foundations of their residence above flood level; preparing maps showing population
concentration and deep wells, protected pond and other sources of drinking water; ensuring
reserve stock of tube wells and spare parts; ensuring availability of drinking water at times of
need; providing assistance for rescue and relief operations; ensuring availability of repair
workers for emergency repair of damaged tube wells in affected areas and sending technicians
from unaffected areas to the affected areas. The Ministry of Agriculture, Department of
Agriculture Extension, Bangladesh Rice Research Institute (BRRI),Bangladesh
Agricultural Research Council (BARC) and Bangladesh Agricultural Research Institute
(BARI) are responsible for carrying out research on the development of different crop varieties
resilient to different climate stresses, allocation of funds for the purchase and distribution of
seeds and fertilizers; and implementation of post disaster relief operations. Bangladesh
Agricultural Development Cooperation (BADC) is to arrange for keeping stocks of seeds,
fertilizers and insecticides. The Bangladesh Meteorological Department (BMD) is responsible
for watching over weather conditions, and ensuring improvement of cyclone forecast procedures
and supply of information on regular basis.
In Bangladesh all government line agencies and local government (Union Parishad) are
considered are obligated to provide services relevant to their areas of responsibility to the duty
holders ie, the people of the country as per constitution down to the above policies, rules and
regulations. Nevertheless, these obligations are not usually met by the relevant organizations
either due to lack of commitment and capacities, and also lack of accountability. Hence, this
section mainly investigates the present capacity of the organizations through the Key Informant
Interview (KII) conducted during the survey. It will eventually helps the project to find the
capacity gaps as per above policies and to work on capacity enhancement of these
organizations to support communities to adapt to climate change risks.
3.4.3.2 Current capacities and relevant constraints/capacity gaps of the organizations
3.4.3.2.1 Union Parishads (Holokhana, Pachgachhi and Jatrapur), Kurigram Upazilla
These Union Parishads have activities like a) Taking pre preparation on flood by UDMC
committee b) Preparing voluntary group for helping flood affected people c) Announcing through
mike of the mosque to provide early warning for people take shelter in safe place before

47
disaster d) sharing and coordinating with the work of NGOs, but they do not have any specific
activities of their own e) providing life jacket during flood, relief etc. There is Union Disaster
Management Committee (UDMC), which select the climate affected people to receive the
services from the above activities. Major constraints they faced were fund crisis, lack of proper
training for the staff, lack of skilled manpower, lack of proper instruction from the higher
authority, lack of required tools, poor communication with NGO officials, shortage of transport
during flood etc. Some members heard about DRR, Gender and SEED policies, and also New
Agriculture Extension Policy (NAEP) but they did not know the details. They said that there was
no training or orientation provided by any organization on these policies.
3.4.3.2.2 Department of Agriculture Extension (DAE)
In DAE there are activities like: new variety extension, changing cropping pattern, increase soil
fertility, mechanization of cultivation, supply power tiller among co-operatives/ farmers group,
provide training like seed production, seed storage, fruits gardening, demonstration of alternate
varieties in Aus season, training (in house, spot training through IPM club etc,), demonstration
of flood tolerant rice varieties, provided training on vermi compost, low water requiring crops for
cultivation such as wheat, maize, demonstration of floating seed bed and preservation of dry
seed in plastic bag. DAE provides information and other activities through assigned staff. From
Upazilla level to Block of every union, they provide information to the Sub Assistant Agriculture
Officer (SAAO) and in turn SAAO provide information and spot training to the farmers.
Moreover, field day, fair, workshops are conducted at community level. They select contract
farmers (marginal, small and medium), follow group based extension and conduct about 8,000
demonstrations per season. Farmers having 1 hectare of land and directly involved in
agriculture are selected for demonstration. Group discussion is done as per DAE’s guideline.
Personal communication, group formation and mobile apps are also followed. Modern training
facilities are unavailable, lack of skilled person and shortage of field staff, lack of sophisticated
laboratory facilities, poor budget for training/ less staff training, poor communication due to river,
poor coordination among GO/NGOs/private sectors are the major constraints of DAE. Number
of extension staffs ( SAAO) is insufficient, each SAAO is responsible for 1200 farmers but this
ration was not maintained, Each SAAO provided services among 3000 to 5000 farmers.
3.4.3.2.3 Bangladesh Institute of Nuclear Agriculture (BINA)
In general BINA has the activities like a) genetic breeding of blast tolerant varieties of rice, flood
and drought tolerant varieties, b) demonstration of BINA 14 as late boro or BRAUS, BINA 11

48
and12 as flash flood tolerant in aman and BINA 17 as drought tolerant (green super rice
requiring 30% less fertilizer) in aman, water saving variety BINA 19 in Aus (recently released) as
drought tolerant and direct seeding c) Farmers training on the above climate resilient rice
varieties. BINA disseminate technology and information through demonstration and training,
distribute truthful level seeds to farmers. However, farmers training and demonstration were
organized through DAE personnel who select farmer’s community, target area and participants.
The Scientists know the relevant plans/policies but not in depth. However, major constraints
they face to implement the above activities are lack of manpower, lack of sophisticated
laboratory facilities, shortage of fund. Apart from these, poor fund and management constraints
affect proper communication for varietal demonstration and farmers training because DAE staff
do not receive training on varieties to be demonstrated.
3.4.3.2.4 Bangladesh Rice Research Institute (BRRI)
In general, BRRI implements varietal development through genetic improvement (stress, flood,
disease tolerant etc) and participatory variety selection for submergence and drought tolerance
through demonstration. They disseminate information on modern knowledge and technologies
generated in BRRI and also disseminate flood and drought tolerant varieties through
demonstration and distribute seeds to farmers. They conduct demonstration through individual
and community based farmers organization, disseminate technologies through NGOs on
demand basis and make close collaboration with DAE for technology transfer. However, major
constraints they face to implement the above activities are shortage of field staff, poor budget,
poor coordination among GO/NGOs/private sectors, lack of proper planning and centralized
decision making especially in Government sectors leading to poor coordination among the
stakeholders.
3.4.3.2.5 Bangladesh Agriculture Development Corporation (BADC)- Seed Marketing
BADC (Seed Marketing) has the activities like farmers training, workshop/seminar with dealers,
elite farmers and DAE officers, motivation of elite farmers to do block cultivation of alternate
varieties to adapt to climate change etc. They motivate farmers for marketing of seeds based on
their demand, and share results through dealers and elite farmers with other stakeholders.
Activities are mainly implemented through dealers and elite farmers. They strictly follow SEED
policy, SEED act and rules. New Agriculture Extension Policy (NAEP) and other policies were
not instructed from BADC. Grass roots coordination for sharing of relevant policies is very poor.
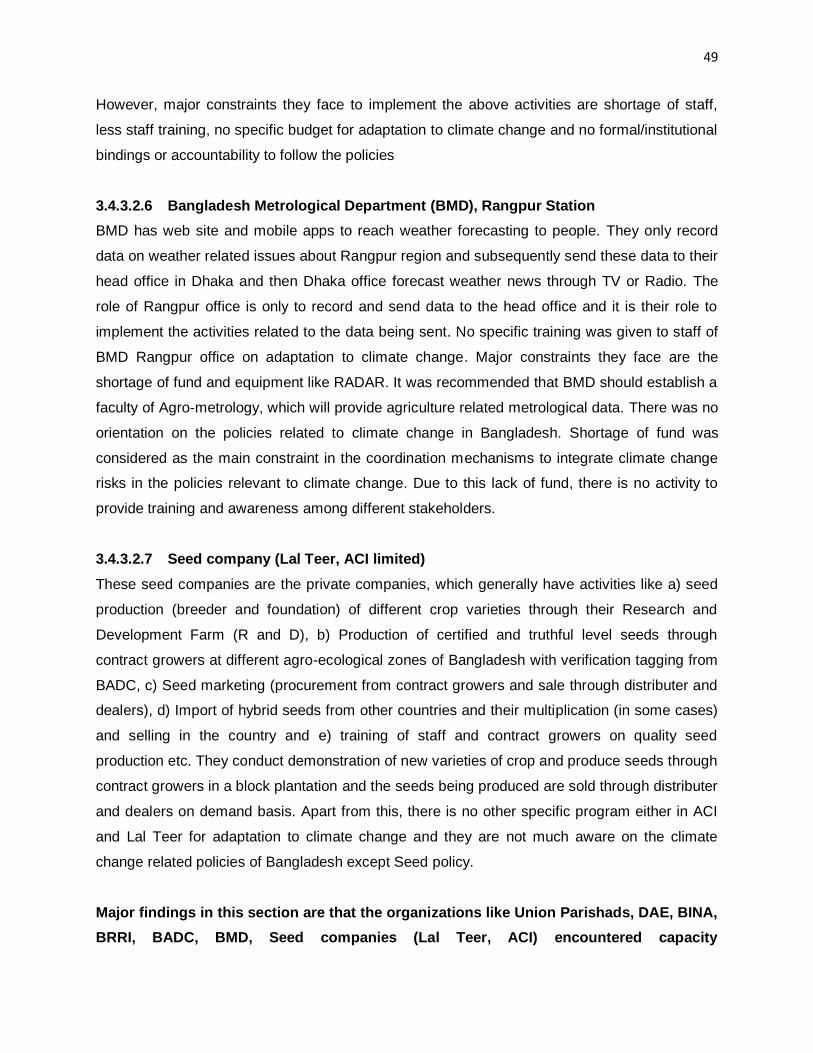
49
However, major constraints they face to implement the above activities are shortage of staff,
less staff training, no specific budget for adaptation to climate change and no formal/institutional
bindings or accountability to follow the policies
3.4.3.2.6 Bangladesh Metrological Department (BMD), Rangpur Station
BMD has web site and mobile apps to reach weather forecasting to people. They only record
data on weather related issues about Rangpur region and subsequently send these data to their
head office in Dhaka and then Dhaka office forecast weather news through TV or Radio. The
role of Rangpur office is only to record and send data to the head office and it is their role to
implement the activities related to the data being sent. No specific training was given to staff of
BMD Rangpur office on adaptation to climate change. Major constraints they face are the
shortage of fund and equipment like RADAR. It was recommended that BMD should establish a
faculty of Agro-metrology, which will provide agriculture related metrological data. There was no
orientation on the policies related to climate change in Bangladesh. Shortage of fund was
considered as the main constraint in the coordination mechanisms to integrate climate change
risks in the policies relevant to climate change. Due to this lack of fund, there is no activity to
provide training and awareness among different stakeholders.
3.4.3.2.7 Seed company (Lal Teer, ACI limited)
These seed companies are the private companies, which generally have activities like a) seed
production (breeder and foundation) of different crop varieties through their Research and
Development Farm (R and D), b) Production of certified and truthful level seeds through
contract growers at different agro-ecological zones of Bangladesh with verification tagging from
BADC, c) Seed marketing (procurement from contract growers and sale through distributer and
dealers), d) Import of hybrid seeds from other countries and their multiplication (in some cases)
and selling in the country and e) training of staff and contract growers on quality seed
production etc. They conduct demonstration of new varieties of crop and produce seeds through
contract growers in a block plantation and the seeds being produced are sold through distributer
and dealers on demand basis. Apart from this, there is no other specific program either in ACI
and Lal Teer for adaptation to climate change and they are not much aware on the climate
change related policies of Bangladesh except Seed policy.
Major findings in this section are that the organizations like Union Parishads, DAE, BINA,
BRRI, BADC, BMD, Seed companies (Lal Teer, ACI) encountered capacity

50
gaps/constraints in terms of fund crisis, lack of proper training for the staff, lack of
skilled manpower, lack of proper instruction from the higher authority, poor coordination
among GO/NGOs/private sectors, lack of proper planning and centralized decision
making especially in Government sectors, lack of specific budget for adaptation to
climate change and absence of formal/institutional bindings or accountability to follow
the policies, lack of orientation on the policies related to climate change etc.
The project, therefore, should consider implementing some capacity development programs like
training of respective staff, orientation on the relevant policies, conducting advocacy
workshop/seminar involving policy makers for sensitization, and facilitation on participatory
planning among different stakeholders on community based adaptation to climate change risks.
3.5 Local, regional and /or national policies and several civil society organizations better
integrate climate risks and changes
3.5.1 Number of Union Parishad allocated budget in their annual plan considering
climate vulnerabilities and risks
The project will implement its activities covering three unions of Kurigram district viz, Holokhana,
Pachgachhi and Jatrapur. It is evident from interview of the respective chairman and women
councilors that they have limitation of budget and policy gaps in their local government authority
although they have planned and implemented some activities to reduce disaster risks as
narrated earlier. Only one Union Parishad (Holokhana) out of three targeted unions of the
project has allocated budget Tk. 200,000.00 in their annual plan (2016-2017) considering
climate vulnerabilities and risks (against disaster risk reduction activities). The other
Union Parishads (Pachgachi and Jatrapur) do not have specific budget on this climate change
issue. Major constraints they face are fund crisis/ no specific budget /scarcity of resource, lack
of skilled manpower, no direction from higher authority, lack of required tools etc.
Hence, the project needs sensitizing UP committees so that all targeted Union Parishads
allocate budget in their annual plan considering climate vulnerabilities and risks ensuring
participation of target communities in bottom up planning.
3.5.2 Functional linkage established between relevant stakeholders and community to
adapt to the impact of climate variability
51
It is revealed from different organizations through Key Informant Interview (KII) that different
NGOs work in this area and they inform the targeted communities about their activities. Apart
from this, there is no other networking or coordination among different organizations. However,
divisional coordination meeting in agriculture is conducted (1/month) among the GOs, NGOs
and companies. But the quality of network in terms of participation and activities is poor and can
be considered as informal way of communication. Major constraints are a) communication gap
between government organization (GO) and NGOs b) lack of collaborative efforts of the
stakeholders c) Poor fund and management constraints affecting proper communication d)
NGOs run with single technology and deals with marginal/landless farmers while DAE run with
multiple technologies and deals with all categories of farmers e) no formal/institutional bindings
or accountability to follow the policies f) lack of proper planning and centralized decision making
especially in the Government sectors g) irresponsibility of elected public representative such as
chairman of Union Parishad etc. The organizations provided some specific recommendations
for effective coordination to integrate climate change risks, which are a) coordination among
different stakeholders needs to be strengthened especially with DAE b) effective monthly
coordination meeting should be conducted at Union level with the participants of GOs and
NGOs c) Other stakeholders should give proper value to the Union Parishad members and
committee, d) NGOs should take advice of Union Parishad, as they are permanent body in this
area, before initiating any activity e) to avoid duplication of activities, NGOs need to coordinate
among themselves f) Other stakeholders should give proper value and priority to the
government officers of agriculture department and work in coordination with them g) More
training of trainers, workshop/seminar involving staff of relevant organizations like DAE, NGOs,
private seed companies should be organized etc, h) NGOs should share their activities with
Govt. Departments i) farmers should be brought under digital systems with data base j)
organizational monitoring and sharing of results/information should be ensured k)
decentralization of decision making and planning at grass roots level etc.
Major findings in this section are a) Only one Union Parishad (Holokhana) out of three
targeted unions of the project has allocated budget Tk. 200,000.00 in their annual plan
(2016-2017) considering climate vulnerabilities and risks, and b) poor functional linkage
among stakeholders due to communication gap, lack of collaborative efforts, poor fund
and management, disparity in implementation strategy, lack of formal/institutional
bindings to follow the policies, lack of proper planning and centralized decision making
especially in the Government sectors etc
52
4 Conclusion and Recommendation
From the findings of the baseline survey it can be concluded that the project has rightly targeted
majority woman participants, small and marginalized farmers and resource poor people with low
income, expenditure and asset base. It is evident that the targeted communities are seriously
affected by climate change risks and vulnerabilities in terms of poor knowledge base and
practices on adaptive options, reduced crop yield and food security, poor ability to build
resilience, and very poor women mobility and their involvement in household financial decision.
These vulnerabilities of targeted communities are further intensified due to capacity
gaps/constraints of and poor functional linkages among different stakeholders relevant to the
project (eg, Union Parishad, Department of Agriculture Extension, Research Institutions,
Metrological Department, private seed companies etc.). To address these vulnerabilities of
communities and capacity constraints of the service providers, a comprehensive and
sustainable approach is essential so that targeted communities are able to build resilience to the
effects of climate change risks with continuous supports from the public and private agencies.
The project has, therefore, challenges ahead as to how to make best use of the positive impacts
of its intervention/activities by the communities through the public and private service providers.
However, the following recommendations being emerged from the survey findings may be
considered as crucial to get better results in reducing the effects of climate risks and
vulnerabilities of the targeted communities.
Recommendation
• The target communities possess very poor knowledge on the climate risks
primarily due to poor sources of information channel and hence the project
requires strengthening linkages of target communities with the relevant
information and service providers (government and private) in the project area.
• The project should integrate the capacity and participation of the government
agencies particularly in the delivery of early warning to the people through
community based adaptation.
• To reach the goal of the project, the targeted communities especially women
should be provided with or should be made capable of making innovative ways of
adaptation to climate change through SuPER agriculture approach, and through
53
improved information channels and decision making process so that their food
insecurity is reduced significantly.
• The project needs sensitizing DAE to be involved in the project interventions
following SuPER agriculture approach and to create an enabling environment so
that the targeted communities receive services sufficiently even after the project
is over (ie, sustainability).
• The project should take care of farmer’s capacity development in a group to
disseminate innovative knowledge and technologies among neighboring farmers
• Existing cropping patterns should be adjusted with alternate crops and varieties
to be grown in fallow period using the benefit of early monsoon and replacing
local varieties with flood or drought tolerant modern varieties in consultation with
local communities to increase cropping intensity and crop yield of the project
participants
• The project should tap the alternate adaptive technologies and build capacity of
farmers to practice them to address climate change. This requires linking the
targeted communities with government and private organizations having activities
for adaptation to climate change risk and vulnerabilities
• The project should facilitate family and social counseling inviting husband or
male members of family and village elite persons for creating participatory
environment so that women can be freely involved in income generating activities
outside the house so that women mobility is increased
• The project should sensitize government organizations in particular so that they
integrate women friendly activities in their annual program and consequently
women mobility is increased due to these activities.
• The project should consider implementing some capacity development programs
like training of respective staff, orientation on the relevant policies, conducting
advocacy workshop/seminar involving policy makers, and facilitation on
participatory planning among different stakeholders on community based
adaptation to climate change risks.
• The project needs sensitizing UP committees so that all targeted Union
Parishads allocate budget in their annual plan considering climate vulnerabilities
and risks ensuring participation of target communities in bottom up planning
• To improve functional linkages, the project should organize more training of
trainers, workshop/seminar involving staff of relevant organizations like Union
54
Parishad, DAE, research organizations, metrological department, NGOs, private
seed companies etc,
5 References
Ashfaq, M., Shi, Y., Tung,S., Trapp,W.R.J., Gao, X., Pal, J.S. and Diffenbaugh, N.S. 2009. Suppression of South Asian Summer Monsoon Precipitation in the 21st Century. Geophysical Research Letters, 36, L01704, 3 January. Ahammad, H., Heyhoe, E., Nelson, G., Sands, R., Fujimori, S., Hasegawa, T., van der
Mensbrugghe, D., Blanc, E., Havlík, P., Valin, H., Kyle, P., Mason d’ croz, D., can Meijl, H.,
Schmita, C., Lotze-Campen, H., von Lampe, M. &Tabeau, A.2015. The role of international
trade under a changing climate: insights from global economic modelling. In A. Elbehri, ed.
Climate change and food systems: global assessments and implications for food security and
trade. Rome, FAO.
BCAS (2010), Scoping Assessment onClimate Change Adaptationin Bangladesh CCC, 2006. Who is doing What in Bangladesh? Report on the First Meeting. CCC (Climate
Change Cell), Comprehensive Disaster Management Programme. Dhaka: GoB.
Dasgupta, Samir, Ismail Siriner & Sarathi De P. (editors), (2010) ‘Women’s encounter with disaster’ Frontpage Publications Ltd, India. Disaster Management Bureau (2010, Disaster Management & Relief Division: National Plan for Disaster Management2010-2015. FAO (2016): Climate change and Food Security: Risks and Responses
Huq, S. & Ayers, J. (2008). Taking steps: mainstreaming national adaptation. IIED Briefing. [internet] Available at http://www.iied.org/pubs/pdfs/17040IIED.pdf Huq, S. and Ayers, J.M. 2007. Critical list: the 100 nations most vulnerable to climate change, in
IIED Sustainable Development Opinion. London: International Institute of
Environment and Development (IIED).
IPCC, 2007. Climate Change 2007: Impacts, Adaptation and Vulnerability. Contribution of
Working Group II to the Fourth Assessment Report of the Intergovernmental Panel on Climate
Change, Annex I., M.L. Parry, O.F. Canziani, J.P. Palutikof, P.J. van der Linden and C.E.
Hanson, Eds., Cambridge University Press, Cambridge, UK.
Isaure Delaporte and Mathilde Maurel (2015): Adaptation to Climate Change in Bangladesh MoA (1996), New Agriculture Extension Policy (NAEP), Ministry of Agriculture, Bangladesh
MoEF (2009), Bangladesh Climate Change Strategy And Action Plan (BCCSAP), 2009. Ministry
55
of Environment and Forest, Government of the Peopl’s Republic of Bangladesh. PPRC (2016), Politics, Governance and Middle Income Aspirations Realities and Challenges An Empirical Study conducted by Power and Participation Research Centre
institutiand options RAHMAN, M. H. & ALAM, M. J. B. (Eds.) (2009) Facing the challenges of Climate Change: Issues, Impacts and Strategies for Bangladesh with focus on Water & Waste Management, Dhaka,ITN-BUET. R. Selvaraju, A.R. Subbiah, S. Baas, I. Juergens, FAO (2006): Livelihoods adaptation to climate variability and change in drought-prone areas of Bangladesh. SM Hossain, MA Tarafdar, MA Sheikh, S Baroi, AKMMC Journal 2013 4(2) 5-9: Study on Level
of Knowledge on Climate Change Among the People Residing in a Selected Area
of Dhaka City
Appendices
Appendix I: Terms of Reference (ToR) Baseline study for Where the Rain Falls (WtRF) – Phase III Project, CARE Bangladesh Background of Consultancy: Generously funded by Prince Albert Foundation, the Where the Rain Falls (WtRF II) – Community Based Adaptation (CBA) project in Bangladesh aims at improving the resilience of targeted vulnerable and marginalized communities to the impacts of increasing variability of rainfall patterns by promoting SuPER (Sustainable, Profitable, Equitable and Resilient) agriculture approach and Community Based Adaptation. The project will adopt a rights-based approach and focus its advocacy and mobilization efforts on empowering women, enabling vulnerable groups to participate in local decision-making/governance, and ensuring equitable access to resources and services vital to adaptation. CARE has been implementing the WtRF project in Kurigram district since January 2014 and WtRF Phase III has built on the first phase which started from January 2017.

56
The WtRF Phase III project will focus on climate resilient agriculture and will target 6500 small and marginalized farmers in 20 villages (2500 from previous phase in 5 villages and an additional 4,000 small and marginalized farmers from additional 15 villages in Kurigram). CARE Bangladesh will implement the project through its partner organization- Eco Social Development Organization (ESDO). The overall goal of the project is to improve resilience of 20 communities, especially women, from Kurigram district against increasing vulnerability of rainfall patterns by promoting SuPER Agriculture approach and community based adaptation. Specific Goal 1: 20 # of communities are more resilient to climate risks and change. Specific Goal 2: Local, regional and/or national policies and civil society organizations better integrate climate risks and change. Rationale and objective of the study As mentioned above, the WtRF Phase II project is built on the first phase and replicate the approach in 15 new villages: from climate vulnerability analysis and adaptation plans to the implementation of the best practices. Baseline study will be conducted in extended 15 communities only. Now the statistical data of the new communities is needed to have clear idea about the current situation as per agreement of the proposal and log frame with donor. This will help to monitor and evaluate the project success within the project time frame. The overall objective is to establish a baseline for the project as per the approved project proposal and log-frame so that project can establish a SMART (Specific, Measurable, Achievable, Realistic and Time-bound) monitoring and evaluation (M&E) system. The specific objectives of the baseline survey – a) To know how climate change affects small-holder farmers’ agriculture in terms of cropping system i.e variety (both adaptive and traditional), technology (e.g., alternate dry and wet method, green manure, water management etc) and pattern ( for low, medium and high land) etc.
b) To identify current Knowledge, Attitude and Practice (KAP) of small holder farmers in relation to climate change, climatic risk, adaptive option & community participation on agricultural technology practices.
c) To know the capacity of local institute (Union Parishads, Department of Agriculture Extension (DAE), Research Institute, and Meteorological Department) in relation with Community Based Adaptation i.e financing, planning and skill in adaptation, and recommendations to develop their capacity.
d) To assess gender impacts considering above three points and in addition family level decision making as well as mobility of women.
e) To assess mechanism of integration of climate change risks in local, regional and national levels in the line of fiscal framework.
This baseline data will provide key references to assess the extent to which the project has achieved the expected outcomes and impacts during an independent evaluation at the end of the project. Methodology The consultancy firm /individual will develop detailed methodology focusing on project indicators
detailed out in the logical framework and will support to add relevant result indicators to the
existing logframe. The methodology should propose how to use existing resilience/adaptation
frameworks to improve those result indicators.1. The study should combine qualitative and

57
quantitative methods. The quantitative survey should be statistically logical and reinforced by
qualitative information gathered. Baseline indicators will be selected through community
consultation in the inception period and will focus on people’s behaviors and response to
climate change and to track climate –resilient livelihood strategies. In brief, the Baseline will be
done in 15 new communities, Union Parishad and technical departments (DAE, Research
Institute, Meteorology department etc.) that are relevant to the project. Worth mentioning, we
would complement the end-line of the 5 existing communities to make sure that we have
coherent data between all villages.
Specific Tasks, Outputs and Time Frame
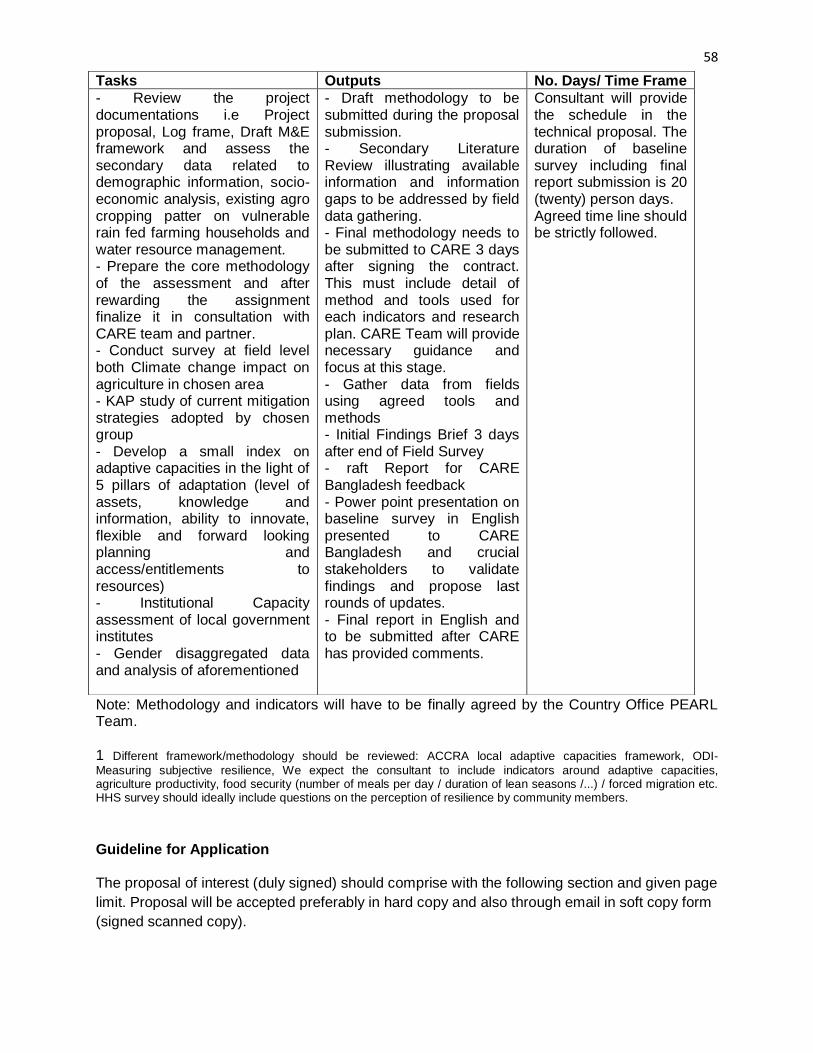
58
Note: Methodology and indicators will have to be finally agreed by the Country Office PEARL Team. 1 Different framework/methodology should be reviewed: ACCRA local adaptive capacities framework, ODI-
Measuring subjective resilience, We expect the consultant to include indicators around adaptive capacities, agriculture productivity, food security (number of meals per day / duration of lean seasons /...) / forced migration etc. HHS survey should ideally include questions on the perception of resilience by community members.
Guideline for Application The proposal of interest (duly signed) should comprise with the following section and given page
limit. Proposal will be accepted preferably in hard copy and also through email in soft copy form
(signed scanned copy).
Tasks Outputs No. Days/ Time Frame
- Review the project documentations i.e Project proposal, Log frame, Draft M&E framework and assess the secondary data related to demographic information, socio-economic analysis, existing agro cropping patter on vulnerable rain fed farming households and water resource management. - Prepare the core methodology of the assessment and after rewarding the assignment finalize it in consultation with CARE team and partner. - Conduct survey at field level both Climate change impact on agriculture in chosen area - KAP study of current mitigation strategies adopted by chosen group - Develop a small index on adaptive capacities in the light of 5 pillars of adaptation (level of assets, knowledge and information, ability to innovate, flexible and forward looking planning and access/entitlements to resources) - Institutional Capacity assessment of local government institutes - Gender disaggregated data and analysis of aforementioned
- Draft methodology to be submitted during the proposal submission. - Secondary Literature Review illustrating available information and information gaps to be addressed by field data gathering. - Final methodology needs to be submitted to CARE 3 days after signing the contract. This must include detail of method and tools used for each indicators and research plan. CARE Team will provide necessary guidance and focus at this stage. - Gather data from fields using agreed tools and methods - Initial Findings Brief 3 days after end of Field Survey - raft Report for CARE Bangladesh feedback - Power point presentation on baseline survey in English presented to CARE Bangladesh and crucial stakeholders to validate findings and propose last rounds of updates. - Final report in English and to be submitted after CARE has provided comments.
Consultant will provide the schedule in the technical proposal. The duration of baseline survey including final report submission is 20 (twenty) person days. Agreed time line should be strictly followed.
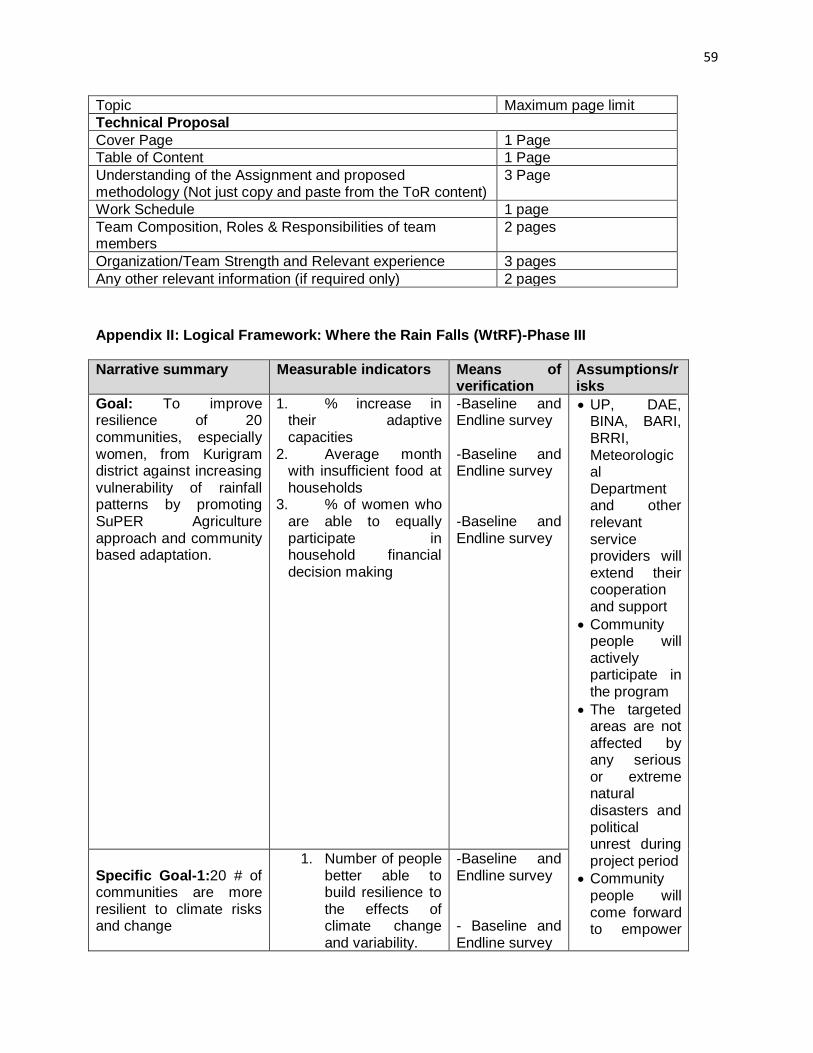
59
Topic Maximum page limit
Technical Proposal
Cover Page 1 Page
Table of Content 1 Page
Understanding of the Assignment and proposed methodology (Not just copy and paste from the ToR content)
3 Page
Work Schedule 1 page
Team Composition, Roles & Responsibilities of team members
2 pages
Organization/Team Strength and Relevant experience 3 pages
Any other relevant information (if required only) 2 pages
Appendix II: Logical Framework: Where the Rain Falls (WtRF)-Phase III
Narrative summary Measurable indicators Means of verification
Assumptions/risks
Goal: To improve resilience of 20 communities, especially women, from Kurigram district against increasing vulnerability of rainfall patterns by promoting SuPER Agriculture approach and community based adaptation.
1. % increase in their adaptive capacities
2. Average month with insufficient food at households
3. % of women who are able to equally participate in household financial decision making
-Baseline and Endline survey -Baseline and Endline survey -Baseline and Endline survey
• UP, DAE, BINA, BARI, BRRI, Meteorological Department and other relevant service providers will extend their cooperation and support
• Community people will actively participate in the program
• The targeted areas are not affected by any serious or extreme natural disasters and political unrest during project period
• Community people will come forward to empower
Specific Goal-1:20 # of communities are more resilient to climate risks and change
1. Number of people better able to build resilience to the effects of climate change and variability.
-Baseline and Endline survey - Baseline and Endline survey
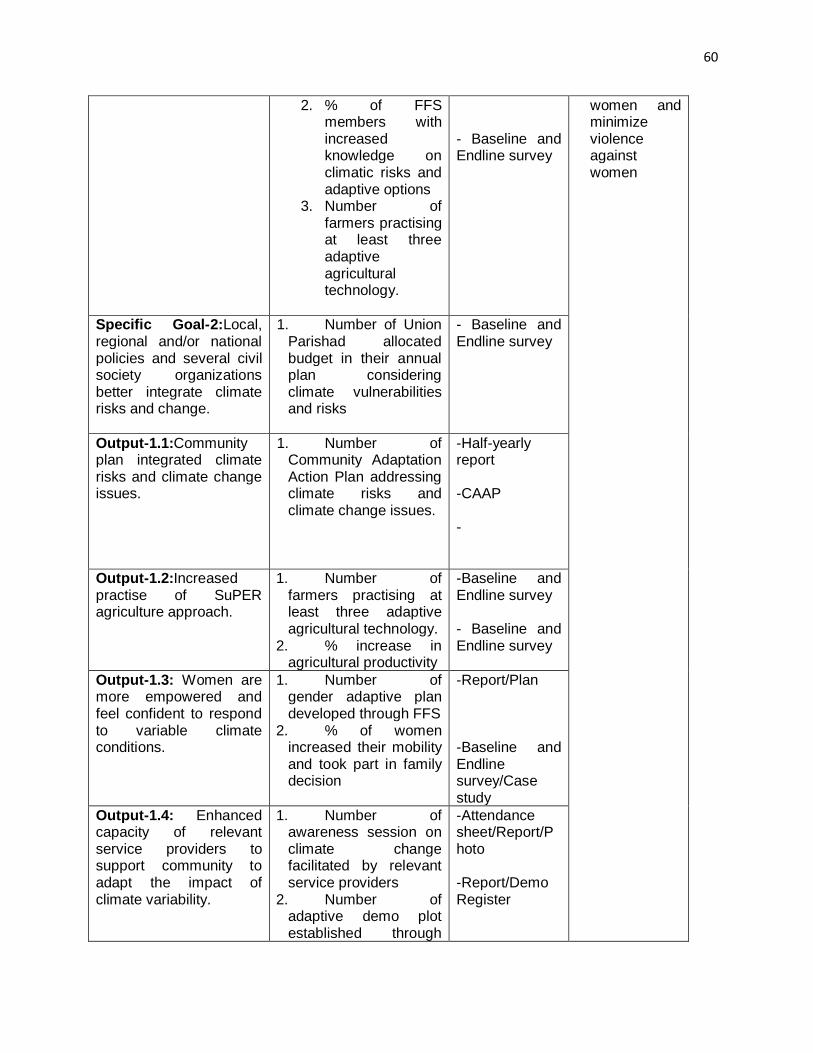
60
2. % of FFS members with increased knowledge on climatic risks and adaptive options
3. Number of farmers practising at least three adaptive agricultural technology.
- Baseline and Endline survey
women and minimize violence against women
Specific Goal-2:Local, regional and/or national policies and several civil society organizations better integrate climate risks and change.
1. Number of Union Parishad allocated budget in their annual plan considering climate vulnerabilities and risks
- Baseline and Endline survey
Output-1.1:Community plan integrated climate risks and climate change issues.
1. Number of Community Adaptation Action Plan addressing climate risks and climate change issues.
-Half-yearly report -CAAP -
Output-1.2:Increased practise of SuPER agriculture approach.
1. Number of farmers practising at least three adaptive agricultural technology.
2. % increase in agricultural productivity
-Baseline and Endline survey - Baseline and Endline survey
Output-1.3: Women are more empowered and feel confident to respond to variable climate conditions.
1. Number of gender adaptive plan developed through FFS
2. % of women increased their mobility and took part in family decision
-Report/Plan -Baseline and Endline survey/Case study
Output-1.4: Enhanced capacity of relevant service providers to support community to adapt the impact of climate variability.
1. Number of awareness session on climate change facilitated by relevant service providers
2. Number of adaptive demo plot established through
-Attendance sheet/Report/Photo -Report/Demo Register

61
union parishad
Output-2.1: Integrated CBA activities in annual plan of Union Parishads (UPs)
1. Number of Union Parishads (UPs) integrated CBA activities in the annual plan
-Progress Report
Output-2.2: Functional linkage established between relevant stakeholders and community to adapt the impact of climate variability
1. Number of events held with relevant stakeholders to share knowledge and practices on the impact of climate vulnerability
Attendance sheet/Report/Press coverage
Activity-1.1.1: Stakeholder consultations with community people on existing climate vulnerabilities, cropping pattern and adaptive practices.
Activity- 1.1.2: Refresher workshop and review Community Action Plan in 5 old villages.
Activity-1.2.1: Identification and selection of groups and form FFS (15 new FFS) and arrangement of FFS Meeting
Activity-1.2.2: Awareness session on climate change in presence of facilitator from Met Dept, FFWC, DAE, UP
Activity-1.2.3: Establishing Demonstration plot-and follow ups: 10 different interventions in 20 villages(4000 farmers will practice adaptive varieties or technologies)
Activity-1.2.4: Organization of Farmers' Field days – 6 field days
Activity-1.2.5: Arrange
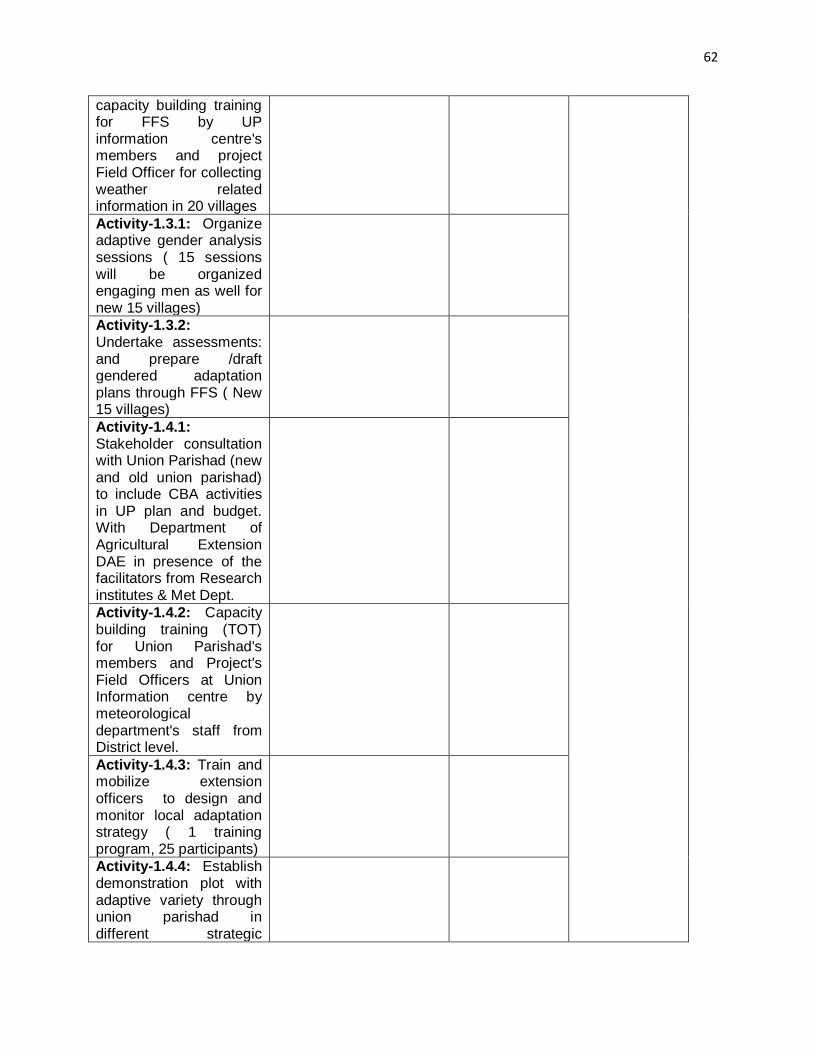
62
capacity building training for FFS by UP information centre's members and project Field Officer for collecting weather related information in 20 villages
Activity-1.3.1: Organize adaptive gender analysis sessions ( 15 sessions will be organized engaging men as well for new 15 villages)
Activity-1.3.2: Undertake assessments: and prepare /draft gendered adaptation plans through FFS ( New 15 villages)
Activity-1.4.1: Stakeholder consultation with Union Parishad (new and old union parishad) to include CBA activities in UP plan and budget. With Department of Agricultural Extension DAE in presence of the facilitators from Research institutes & Met Dept.
Activity-1.4.2: Capacity building training (TOT) for Union Parishad's members and Project's Field Officers at Union Information centre by meteorological department's staff from District level.
Activity-1.4.3: Train and mobilize extension officers to design and monitor local adaptation strategy ( 1 training program, 25 participants)
Activity-1.4.4: Establish demonstration plot with adaptive variety through union parishad in different strategic
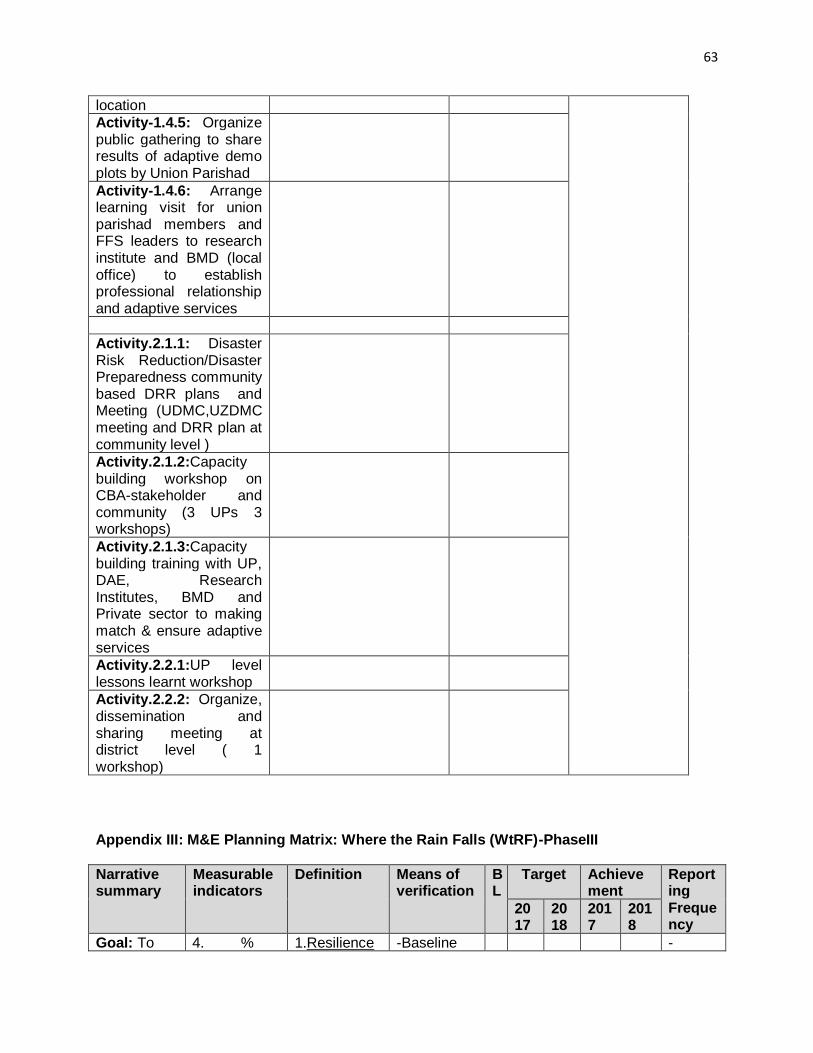
63
location
Activity-1.4.5: Organize public gathering to share results of adaptive demo plots by Union Parishad
Activity-1.4.6: Arrange learning visit for union parishad members and FFS leaders to research institute and BMD (local office) to establish professional relationship and adaptive services
Activity.2.1.1: Disaster Risk Reduction/Disaster Preparedness community based DRR plans and Meeting (UDMC,UZDMC meeting and DRR plan at community level )
Activity.2.1.2:Capacity building workshop on CBA-stakeholder and community (3 UPs 3 workshops)
Activity.2.1.3:Capacity building training with UP, DAE, Research Institutes, BMD and Private sector to making match & ensure adaptive services
Activity.2.2.1:UP level lessons learnt workshop
Activity.2.2.2: Organize, dissemination and sharing meeting at district level ( 1 workshop)
Appendix III: M&E Planning Matrix: Where the Rain Falls (WtRF)-PhaseIII
Narrative summary
Measurable indicators
Definition Means of verification
BL
Target Achievement
Reporting Frequency
2017
2018
2017
2018
Goal: To 4. % 1.Resilience -Baseline -

64
improve resilience of 20 communities, especially women, from Kurigram district against increasing vulnerability of rainfall patterns by promoting SuPER Agriculture approach and community based adaptation.
increase in their adaptive capacities
5. Average month with insufficient food at households
6. % of women who are able to equally participate in household financial decision making
to the effects of climate change and variability- People will make themselves more prepared to respond to the changing climate patterns so that they can overcome the negative effects caused by climate change and variability on their agricultural production, living and economic capability. Women have more access to every sphere of agricultural tasks. 2.Adaptive Capacities- Farmers will gain the knowledge and capability to cultivate various flood tolerant and drought tolerant agricultural varieties and technology
and Endline survey -Baseline and Endline survey -Baseline and Endline survey
Baseline and Endline -Baseline and Endline -Baseline and Endline
Specific
4. Number of
1.Climatic risks- The
-Baseline and Endline
-Baselin
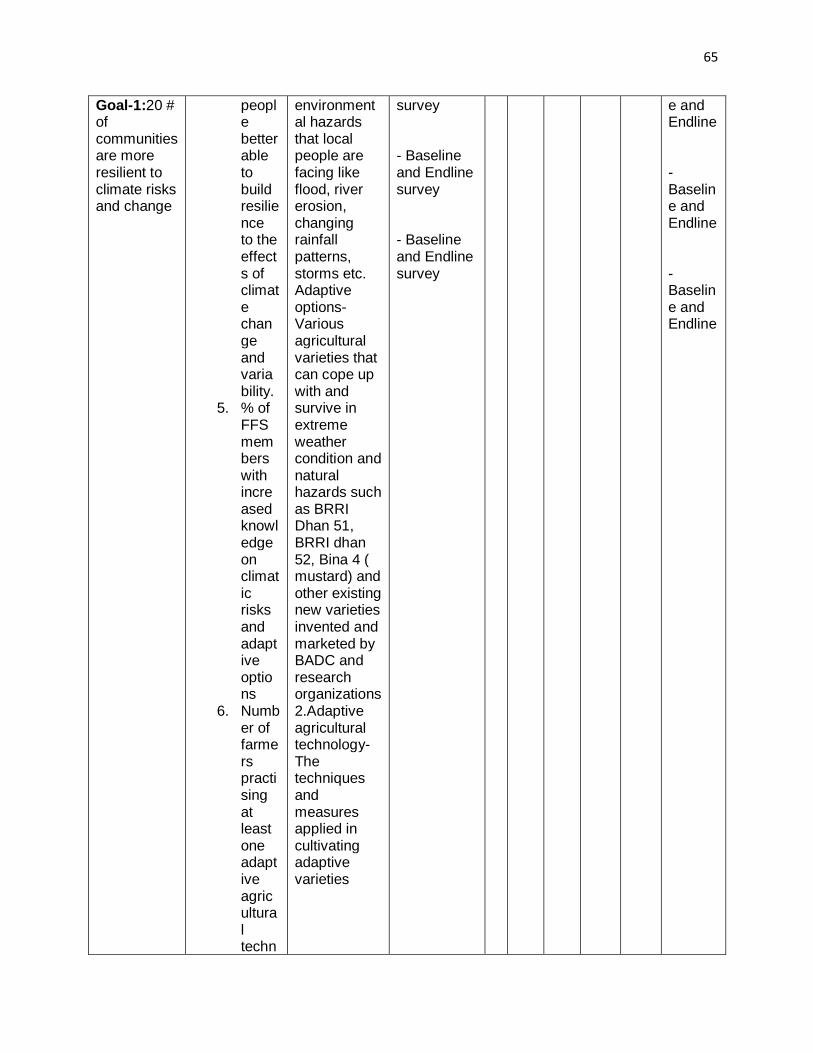
65
Goal-1:20 # of communities are more resilient to climate risks and change
people better able to build resilience to the effects of climate change and variability.
5. % of FFS members with increased knowledge on climatic risks and adaptive options
6. Number of farmers practising at least one adaptive agricultural techn
environmental hazards that local people are facing like flood, river erosion, changing rainfall patterns, storms etc. Adaptive options- Various agricultural varieties that can cope up with and survive in extreme weather condition and natural hazards such as BRRI Dhan 51, BRRI dhan 52, Bina 4 ( mustard) and other existing new varieties invented and marketed by BADC and research organizations 2.Adaptive agricultural technology- The techniques and measures applied in cultivating adaptive varieties
survey - Baseline and Endline survey - Baseline and Endline survey
e and Endline - Baseline and Endline - Baseline and Endline
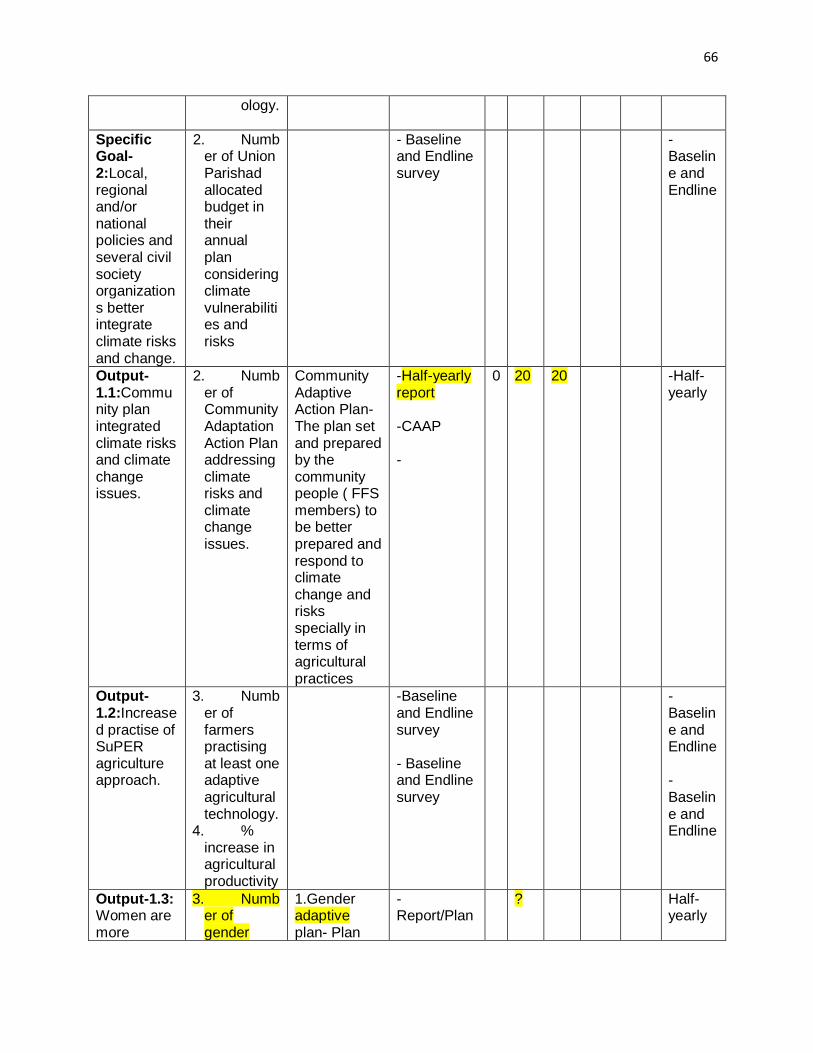
66
ology.
Specific Goal-2:Local, regional and/or national policies and several civil society organizations better integrate climate risks and change.
2. Number of Union Parishad allocated budget in their annual plan considering climate vulnerabilities and risks
- Baseline and Endline survey
-Baseline and Endline
Output-1.1:Community plan integrated climate risks and climate change issues.
2. Number of Community Adaptation Action Plan addressing climate risks and climate change issues.
Community Adaptive Action Plan- The plan set and prepared by the community people ( FFS members) to be better prepared and respond to climate change and risks specially in terms of agricultural practices
-Half-yearly report -CAAP -
0 20 20 -Half-yearly
Output-1.2:Increased practise of SuPER agriculture approach.
3. Number of farmers practising at least one adaptive agricultural technology.
4. % increase in agricultural productivity
-Baseline and Endline survey - Baseline and Endline survey
-Baseline and Endline - Baseline and Endline
Output-1.3: Women are more
3. Number of gender
1.Gender adaptive plan- Plan
-Report/Plan
? Half-yearly
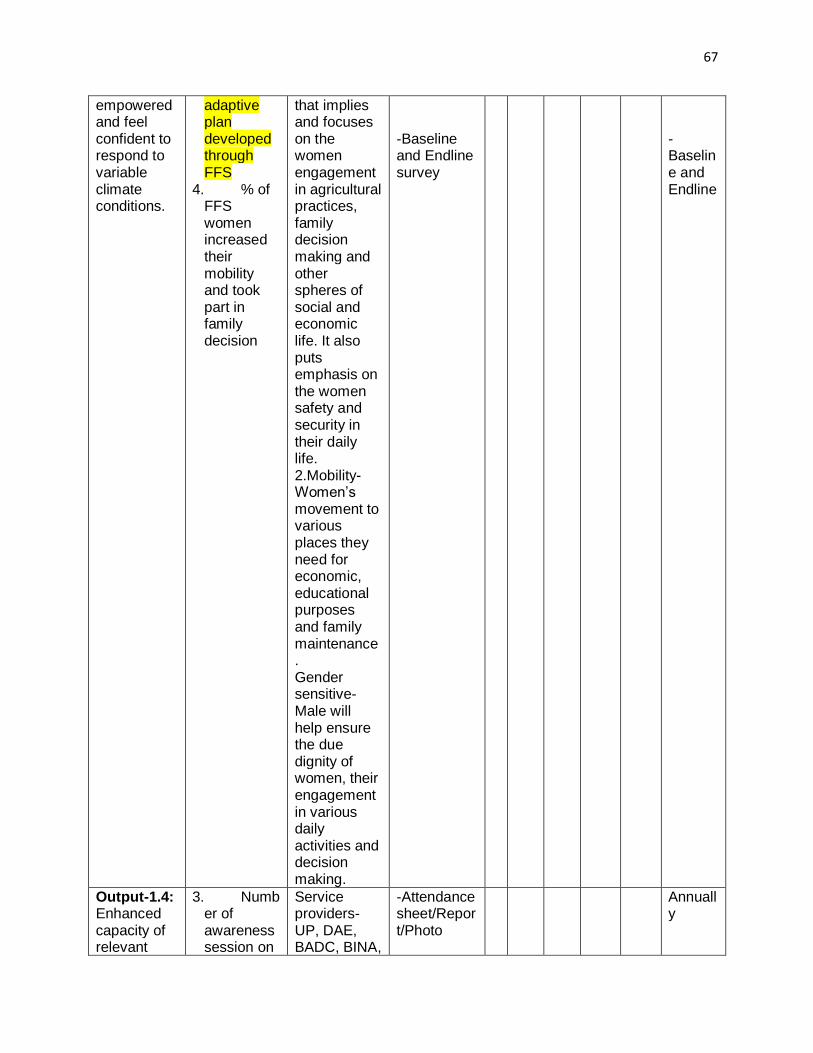
67
empowered and feel confident to respond to variable climate conditions.
adaptive plan developed through FFS
4. % of FFS women increased their mobility and took part in family decision
that implies and focuses on the women engagement in agricultural practices, family decision making and other spheres of social and economic life. It also puts emphasis on the women safety and security in their daily life. 2.Mobility- Women’s movement to various places they need for economic, educational purposes and family maintenance. Gender sensitive- Male will help ensure the due dignity of women, their engagement in various daily activities and decision making.
-Baseline and Endline survey
-Baseline and Endline
Output-1.4: Enhanced capacity of relevant
3. Number of awareness session on
Service providers- UP, DAE, BADC, BINA,
-Attendance sheet/Report/Photo
Annually

68
service providers to support community to adapt the impact of climate variability.
climate change facilitated by relevant service providers
4. Number of adaptive demo plot established through union parishad
BARI, Meteorology Dept. Demo Plot- Farmer’s land cultivated to justify the suitability and productivity of adaptive varieties and shown during Farmers Field Day (FFD) to disseminate the message and motivate nearby people concerning these.
-Report/Demo Register
Half-yearly
Output-2.1: Integrated CBA activities in annual plan of Union Parishads (UPs)
2. Number of Union Parishads (UPs) integrated CBA activities in the annual plan
CBA- Community Based Adaptation. This includes the activities, measures, techniques and strategies applied by the community people themselves to be better prepared to respond to climate changes, risks and hazards.
-Progress Report
Annually
Output-2.2: Functional linkage
1.Number of events held with relevant
Attendance sheet/Report
Annually
69
established between relevant stakeholders and community to adapt the impact of climate variability
stakeholders to share knowledge and practices on the impact of climate vulnerability
Activity-1.1.1: Stakeholder consultations with community people on existing climate vulnerabilities, cropping pattern and adaptive practices.
Activity- 1.1.2: Refresher workshop and review Community Action Plan in 5 old villages.
Activity-1.2.1: Identification and selection of groups and form FFS (15 new FFS) and arrangement of FFS Meeting
Activity-1.2.2: Awareness session on climate

70
change in presence of facilitator from Met Dept, FFWC, DAE, UP
Activity-1.2.3: Establishing Demonstration plot-and follow ups: 10 different interventions in 20 villages(4000 farmers will practice adaptive varieties or technologies)
Activity-1.2.4: Organization of Farmers' Field days – 6 field days
Activity-1.2.5: Arrange capacity building training for FFS by UP information centre's members and project Field Officer for collecting weather related information in 20 villages
Activity-1.3.1:
71
Organize adaptive gender analysis sessions ( 15 sessions will be organized engaging men as well for new 15 villages)
Activity-1.3.2: Undertake assessments: and prepare /draft gendered adaptation plans through FFS ( New 15 villages)
Activity-1.4.1: Stakeholder consultation with Union Parishad (new and old union parishad) to include CBA activities in UP plan and budget. With Department of Agricultural Extension DAE in presence of the facilitators from Research institutes & Met Dept.
72
Activity-1.4.2: Capacity building training (TOT) for Union Parishad's members and Project's Field Officers at Union Information centre by meteorological department's staff from District level.
Activity-1.4.3: Train and mobilize extension officers to design and monitor local adaptation strategy ( 1 training program, 25 participants)
Activity-1.4.4: Establish demonstration plot with adaptive variety through union parishad in different strategic location
Activity-1.4.5: Organize
73
public gathering to share results of adaptive demo plots by Union Parishad
Activity-1.4.6: Arrange learning visit for union parishad members and FFS leaders to research institute and BMD (local office) to establish professional relationship and adaptive services
Activity.2.1.1: Disaster Risk Reduction/Disaster Preparedness community based DRR plans and Meeting (UDMC,UZDMC meeting and DRR plan at community level )
Activity.2.1.2:Capacity building workshop on CBA-
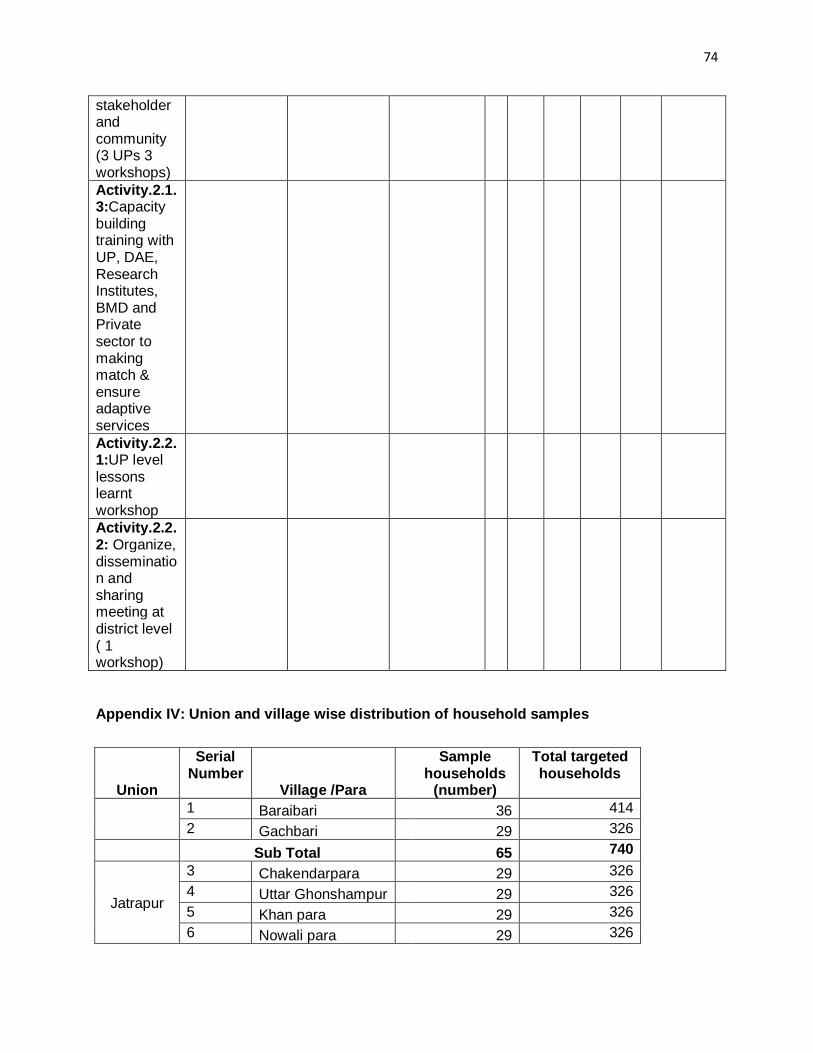
74
stakeholder and community (3 UPs 3 workshops)
Activity.2.1.3:Capacity building training with UP, DAE, Research Institutes, BMD and Private sector to making match & ensure adaptive services
Activity.2.2.1:UP level lessons learnt workshop
Activity.2.2.2: Organize, dissemination and sharing meeting at district level ( 1 workshop)
Appendix IV: Union and village wise distribution of household samples
Union
Serial Number
Village /Para
Sample households
(number)
Total targeted households
1 Baraibari 36 414
2 Gachbari 29 326
Sub Total 65 740
Jatrapur
3 Chakendarpara 29 326
4 Uttar Ghonshampur 29 326
5 Khan para 29 326
6 Nowali para 29 326
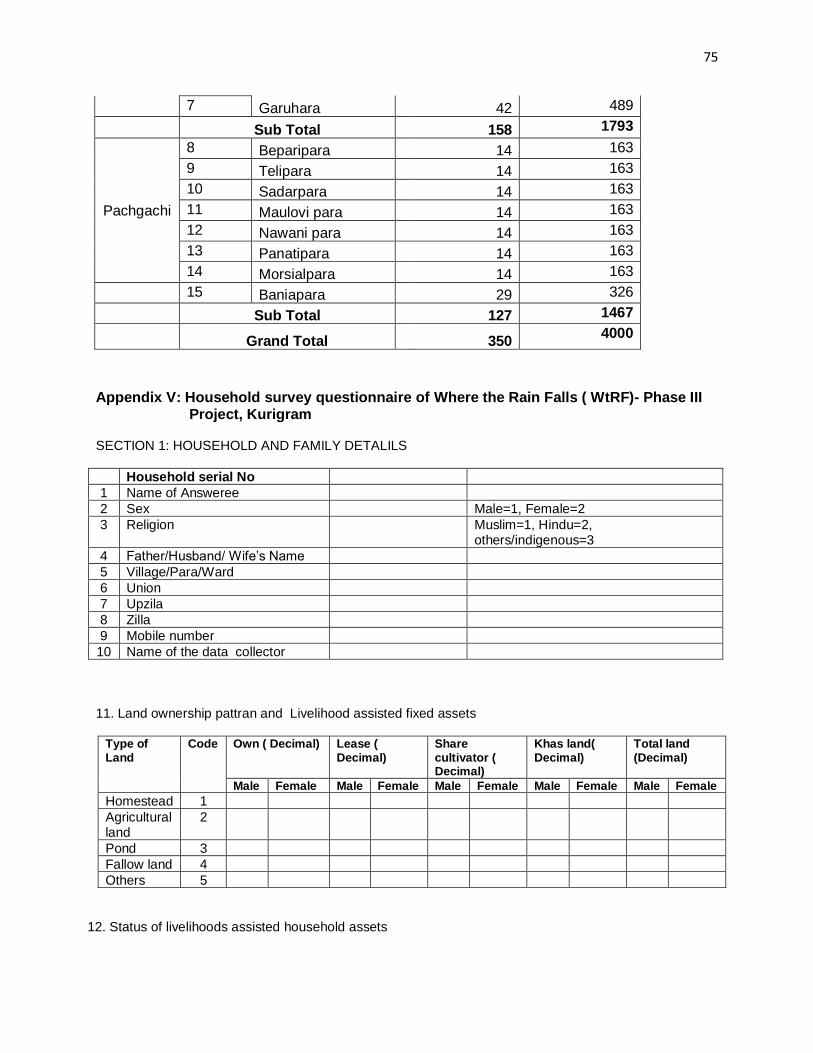
75
7 Garuhara 42 489
Sub Total 158 1793
Pachgachi
8 Beparipara 14 163
9 Telipara 14 163
10 Sadarpara 14 163
11 Maulovi para 14 163
12 Nawani para 14 163
13 Panatipara 14 163
14 Morsialpara 14 163 15 Baniapara 29 326
Sub Total 127 1467
Grand Total
350
4000
Appendix V: Household survey questionnaire of Where the Rain Falls ( WtRF)- Phase III Project, Kurigram SECTION 1: HOUSEHOLD AND FAMILY DETALILS
Household serial No
1 Name of Answeree
2 Sex Male=1, Female=2
3 Religion Muslim=1, Hindu=2, others/indigenous=3
4 Father/Husband/ Wife’s Name
5 Village/Para/Ward
6 Union
7 Upzila
8 Zilla
9 Mobile number
10 Name of the data collector
11. Land ownership pattran and Livelihood assisted fixed assets
Type of Land
Code Own ( Decimal) Lease ( Decimal)
Share cultivator ( Decimal)
Khas land( Decimal)
Total land (Decimal)
Male Female Male Female Male Female Male Female Male Female
Homestead 1
Agricultural land
2
Pond 3
Fallow land 4
Others 5
12. Status of livelihoods assisted household assets
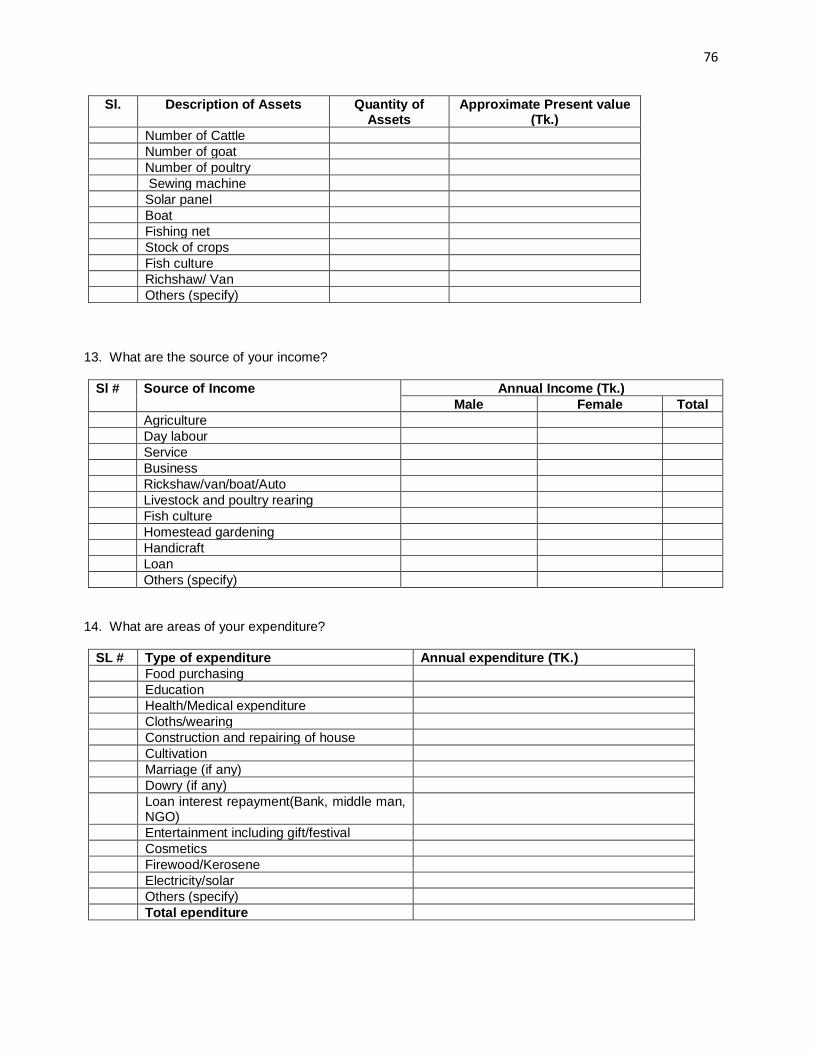
76
Sl. Description of Assets Quantity of Assets
Approximate Present value (Tk.)
Number of Cattle
Number of goat
Number of poultry
Sewing machine
Solar panel
Boat
Fishing net
Stock of crops
Fish culture
Richshaw/ Van
Others (specify)
13. What are the source of your income?
Sl # Source of Income Annual Income (Tk.)
Male Female Total
Agriculture
Day labour
Service
Business
Rickshaw/van/boat/Auto
Livestock and poultry rearing
Fish culture
Homestead gardening
Handicraft
Loan
Others (specify)
14. What are areas of your expenditure?
SL # Type of expenditure Annual expenditure (TK.)
Food purchasing
Education
Health/Medical expenditure
Cloths/wearing
Construction and repairing of house
Cultivation
Marriage (if any)
Dowry (if any)
Loan interest repayment(Bank, middle man, NGO)
Entertainment including gift/festival
Cosmetics
Firewood/Kerosene
Electricity/solar
Others (specify)
Total ependiture
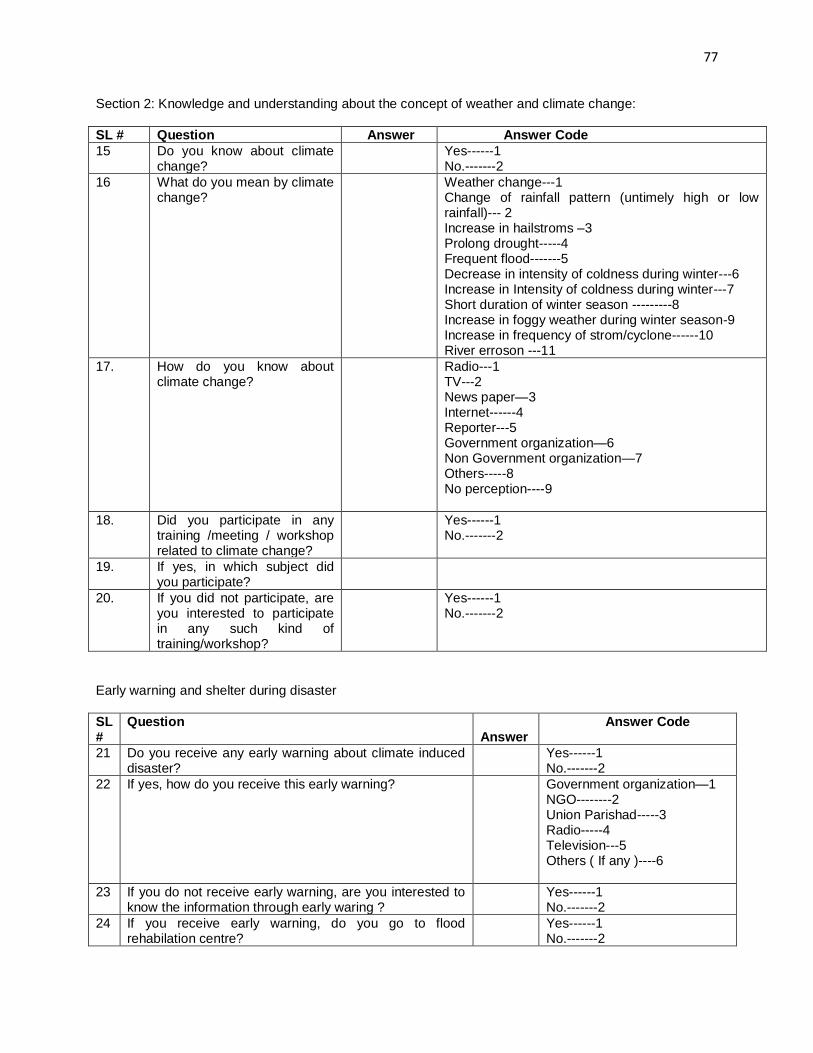
77
Section 2: Knowledge and understanding about the concept of weather and climate change:
SL # Question Answer Answer Code
15 Do you know about climate change?
Yes------1 No.-------2
16 What do you mean by climate change?
Weather change---1 Change of rainfall pattern (untimely high or low rainfall)--- 2 Increase in hailstroms –3 Prolong drought-----4 Frequent flood-------5 Decrease in intensity of coldness during winter---6 Increase in Intensity of coldness during winter---7 Short duration of winter season ---------8 Increase in foggy weather during winter season-9 Increase in frequency of strom/cyclone------10 River erroson ---11
17. How do you know about climate change?
Radio---1 TV---2 News paper—3 Internet------4 Reporter---5 Government organization—6 Non Government organization—7 Others-----8 No perception----9
18. Did you participate in any training /meeting / workshop related to climate change?
Yes------1 No.-------2
19. If yes, in which subject did you participate?
20. If you did not participate, are you interested to participate in any such kind of training/workshop?
Yes------1 No.-------2
Early warning and shelter during disaster
SL #
Question Answer
Answer Code
21 Do you receive any early warning about climate induced disaster?
Yes------1 No.-------2
22 If yes, how do you receive this early warning? Government organization—1 NGO--------2 Union Parishad-----3 Radio-----4 Television---5 Others ( If any )----6
23 If you do not receive early warning, are you interested to know the information through early waring ?
Yes------1 No.-------2
24 If you receive early warning, do you go to flood rehabilation centre?
Yes------1 No.-------2
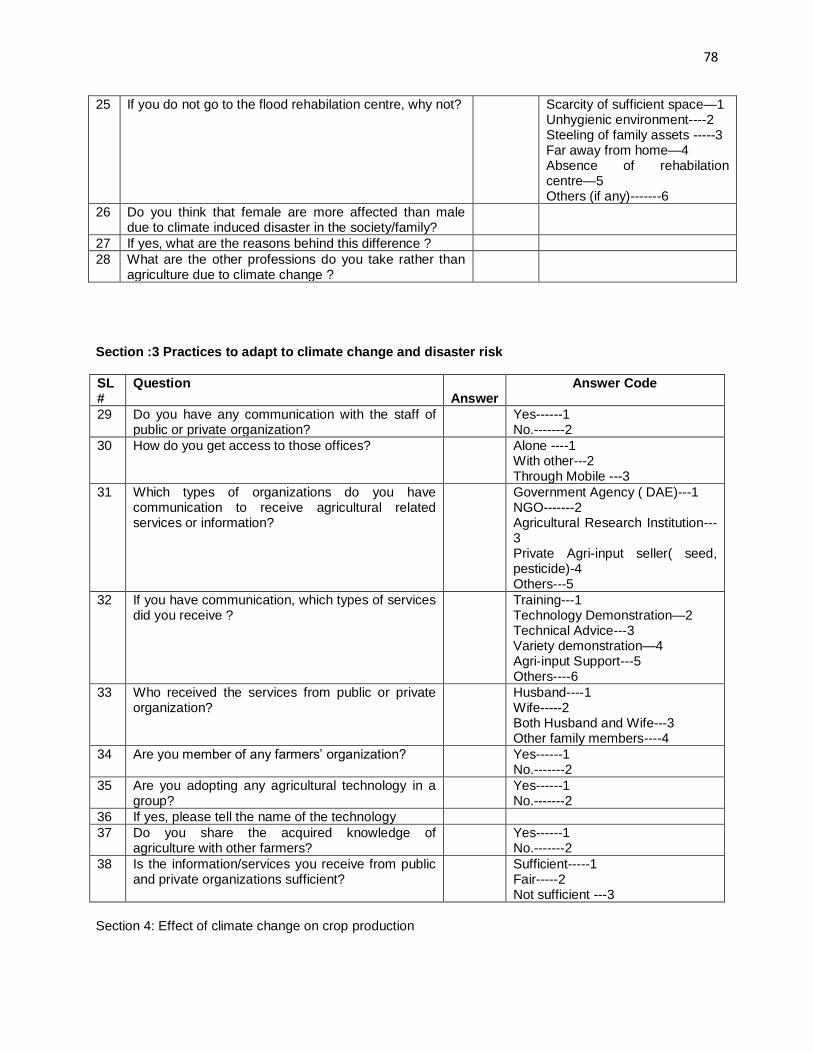
78
25 If you do not go to the flood rehabilation centre, why not? Scarcity of sufficient space—1 Unhygienic environment----2 Steeling of family assets -----3 Far away from home—4 Absence of rehabilation centre—5 Others (if any)-------6
26 Do you think that female are more affected than male due to climate induced disaster in the society/family?
27 If yes, what are the reasons behind this difference ?
28 What are the other professions do you take rather than agriculture due to climate change ?
Section :3 Practices to adapt to climate change and disaster risk
SL #
Question Answer
Answer Code
29 Do you have any communication with the staff of public or private organization?
Yes------1 No.-------2
30 How do you get access to those offices? Alone ----1 With other---2 Through Mobile ---3
31 Which types of organizations do you have communication to receive agricultural related services or information?
Government Agency ( DAE)---1 NGO-------2 Agricultural Research Institution---3 Private Agri-input seller( seed, pesticide)-4 Others---5
32 If you have communication, which types of services did you receive ?
Training---1 Technology Demonstration—2 Technical Advice---3 Variety demonstration—4 Agri-input Support---5 Others----6
33 Who received the services from public or private organization?
Husband----1 Wife-----2 Both Husband and Wife---3 Other family members----4
34 Are you member of any farmers’ organization? Yes------1 No.-------2
35 Are you adopting any agricultural technology in a group?
Yes------1 No.-------2
36 If yes, please tell the name of the technology
37 Do you share the acquired knowledge of agriculture with other farmers?
Yes------1 No.-------2
38 Is the information/services you receive from public and private organizations sufficient?
Sufficient-----1 Fair-----2 Not sufficient ---3
Section 4: Effect of climate change on crop production
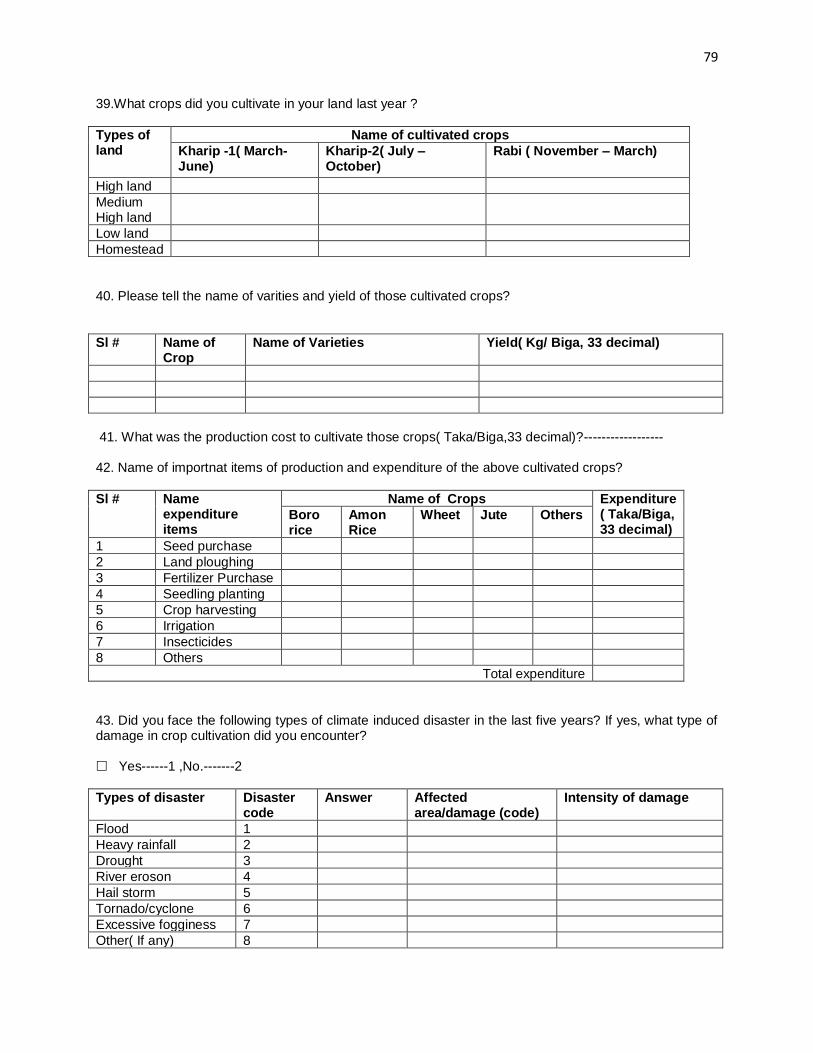
79
39.What crops did you cultivate in your land last year ?
Types of land
Name of cultivated crops
Kharip -1( March- June)
Kharip-2( July – October)
Rabi ( November – March)
High land
Medium High land
Low land
Homestead
40. Please tell the name of varities and yield of those cultivated crops?
Sl # Name of Crop
Name of Varieties Yield( Kg/ Biga, 33 decimal)
41. What was the production cost to cultivate those crops( Taka/Biga,33 decimal)?------------------ 42. Name of importnat items of production and expenditure of the above cultivated crops?
Sl # Name expenditure items
Name of Crops Expenditure ( Taka/Biga, 33 decimal)
Boro rice
Amon Rice
Wheet Jute Others
1 Seed purchase
2 Land ploughing
3 Fertilizer Purchase
4 Seedling planting
5 Crop harvesting
6 Irrigation
7 Insecticides
8 Others
Total expenditure
43. Did you face the following types of climate induced disaster in the last five years? If yes, what type of damage in crop cultivation did you encounter? Yes------1 ,No.-------2
Types of disaster Disaster code
Answer Affected area/damage (code)
Intensity of damage
Flood 1
Heavy rainfall 2
Drought 3
River eroson 4
Hail storm 5
Tornado/cyclone 6
Excessive fogginess 7
Other( If any) 8
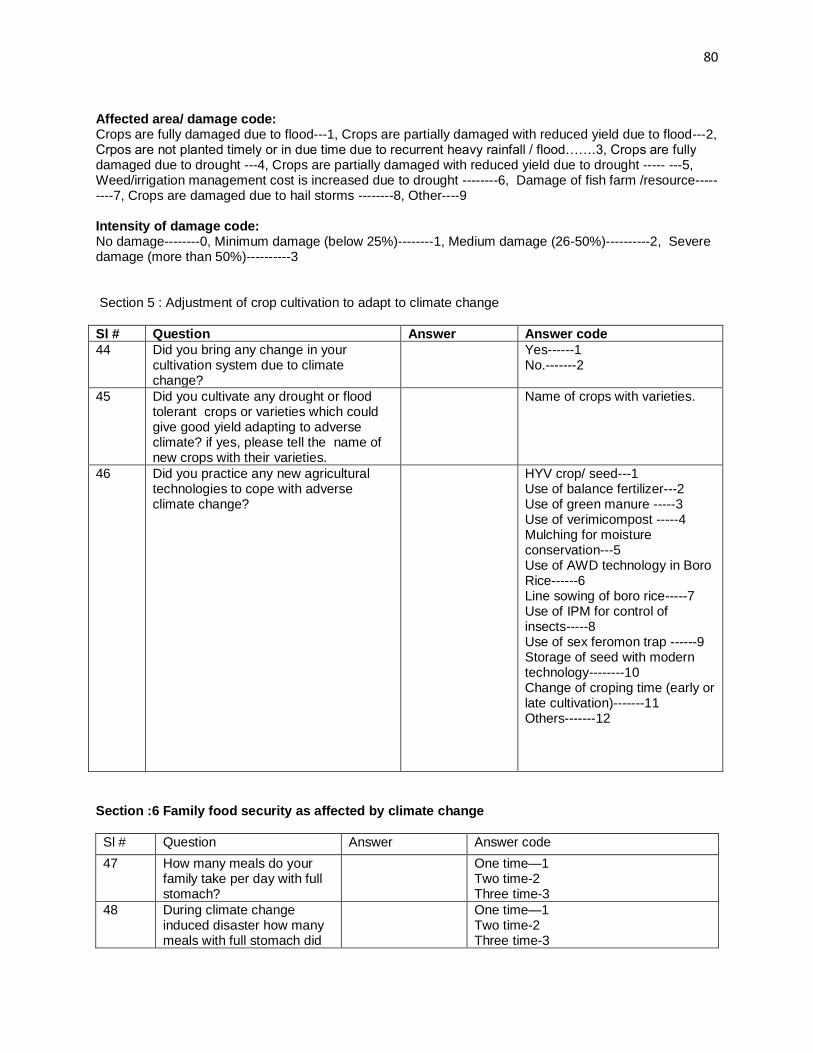
80
Affected area/ damage code: Crops are fully damaged due to flood---1, Crops are partially damaged with reduced yield due to flood---2, Crpos are not planted timely or in due time due to recurrent heavy rainfall / flood…….3, Crops are fully damaged due to drought ---4, Crops are partially damaged with reduced yield due to drought ----- ---5, Weed/irrigation management cost is increased due to drought --------6, Damage of fish farm /resource---------7, Crops are damaged due to hail storms --------8, Other----9 Intensity of damage code: No damage--------0, Minimum damage (below 25%)--------1, Medium damage (26-50%)----------2, Severe damage (more than 50%)----------3 Section 5 : Adjustment of crop cultivation to adapt to climate change
Sl # Question Answer Answer code
44 Did you bring any change in your cultivation system due to climate change?
Yes------1 No.-------2
45 Did you cultivate any drought or flood tolerant crops or varieties which could give good yield adapting to adverse climate? if yes, please tell the name of new crops with their varieties.
Name of crops with varieties.
46 Did you practice any new agricultural technologies to cope with adverse climate change?
HYV crop/ seed---1 Use of balance fertilizer---2 Use of green manure -----3 Use of verimicompost -----4 Mulching for moisture conservation---5 Use of AWD technology in Boro Rice------6 Line sowing of boro rice-----7 Use of IPM for control of insects-----8 Use of sex feromon trap ------9 Storage of seed with modern technology--------10 Change of croping time (early or late cultivation)-------11 Others-------12
Section :6 Family food security as affected by climate change
Sl # Question Answer Answer code
47 How many meals do your family take per day with full stomach?
One time—1 Two time-2 Three time-3
48 During climate change induced disaster how many meals with full stomach did
One time—1 Two time-2 Three time-3

81
your family take per day?
49 Which months of the years did your family generally face food deficiency? ( Mention the Months)
1= Baisakh, 2= Jaisthya, 3=Ashar, 4= Sraban, 5= Bhadra, 6= Aswin, 7= Kartik, 8= Agrahayan, 9= Poush, 10= Magh, 11= Falgun, 12= Chaitra
50 How do you meet up this food deficiency?
1= Taking loan, 2= Doing more work, 3= Going outside to sell labour (Temporary migration), 4= Utilizing own savings, 5= Taking help from relatives, 6= Taking less food, 7= Purchasing less expensive food, 8= Selling productive household assets, 9= Selling poultry/ livestock, 10= Others (specify)
51 Are your family members facing any malnutrition related problems due to climate change induced disaster?
Yes------1 No.-------2
52 Do you have any effect of that malnutrion on your health or working efficiency ?
Yes------1 No.-------2
Section 7: Forced migration due to climate change Seasonal Migration:
Sl # Question Answer Answer code
53 Do your family members migrate to other places for searching work?
Yes------1 No.-------2
54 If yes, why do you migrate and how long do you stay outside? Please indicate the name of months
Answer code
55 If yes, please tell the types of migration Short duration ( regular) 2 / 3 times per yea------------1 Short duration (irregular) 2/3 times per year------------2 Long duration ( regular)--------3 Long duration ( irregular)--------4 Daily---------5
56 Did your family members face any problem when you stayed outside due to migration?
Yes------1 No.-------2
57 If yes, what types of problems did they face?
Section : 8 Gender disaggretaed decision making and food security 58. Who decides about personal affairs?
Subject Code Answer Answer code
Child bearing 1 How many members participate in decision making process.
Saving 2
New economic activity initiation 3

82
Engagement in productive activities
4 (Male-1,female-2,Botht—3,Female take minimal responsibilities----4, Members of other family----5, Do not know-----6
Proper use of services 5
Vote casting 6
59. Decision-making about household affairs?
Subject Code Answer Answer code
Buying and selling land
1 How many members participate in decision making process. (Male-1,female-2,Botht—3,Female take minimal responsibilities----4, Members of other family----5, Do not know-----6
Buying and selling of trees 2
Buying and marketing small food items, groceries.
3
Receiving loan and use of loans . 4
Sending children to school. 5
Arranging child marriage. 6
Buying food for family members. 7
Daily family activities ( Cooking, cloth washing, agricultural work, carrying water, cattle rearing, toilet clearing, child bathing etc.)
8
Others (if any) 9
Appling innovative technology in agriculture.
10
Cattle rearing (Cow & goat). 11
Did you help your husband/ wife for their activities/work?
12 Yes------1 No.-------2
If yes, What types of work did you help? 13 Agricultural work------1 Cattle rearing.-------2 Poultry rearing---3 Cooking---4 Child rearing-----5 Cloth washing-----6 Crop harvest and storage------7 Children education-----8 Others-------9
Food Security of women during climate change induced disaster 60. How many meals do your family members take per day during climate induced disaster? One time -1, Two time—2, Three times---3
Family members Food intake during normal time ( #)
Food intake during disaster period ( #)
Male
Female
Children
Section 9: Mobilitty of women (both men and women participants of the project to be asked)
Sl #
Question Answer Answer code
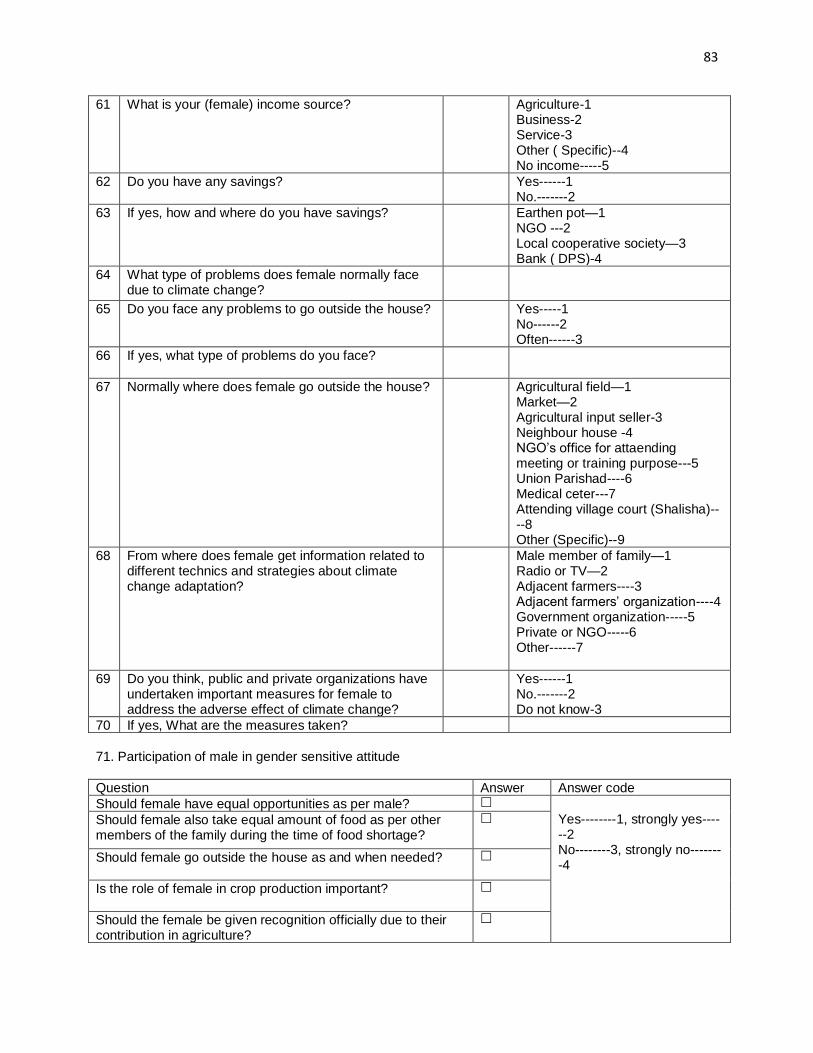
83
61 What is your (female) income source? Agriculture-1 Business-2 Service-3 Other ( Specific)--4 No income-----5
62 Do you have any savings? Yes------1 No.-------2
63 If yes, how and where do you have savings? Earthen pot—1 NGO ---2 Local cooperative society—3 Bank ( DPS)-4
64 What type of problems does female normally face due to climate change?
65 Do you face any problems to go outside the house? Yes-----1 No------2 Often------3
66 If yes, what type of problems do you face?
67 Normally where does female go outside the house? Agricultural field—1 Market—2 Agricultural input seller-3 Neighbour house -4 NGO’s office for attaending meeting or training purpose---5 Union Parishad----6 Medical ceter---7 Attending village court (Shalisha)----8 Other (Specific)--9
68 From where does female get information related to different technics and strategies about climate change adaptation?
Male member of family—1 Radio or TV—2 Adjacent farmers----3 Adjacent farmers’ organization----4 Government organization-----5 Private or NGO-----6 Other------7
69 Do you think, public and private organizations have undertaken important measures for female to address the adverse effect of climate change?
Yes------1 No.-------2 Do not know-3
70 If yes, What are the measures taken?
71. Participation of male in gender sensitive attitude
Question Answer Answer code
Should female have equal opportunities as per male? Yes--------1, strongly yes------2 No--------3, strongly no--------4
Should female also take equal amount of food as per other members of the family during the time of food shortage?
Should female go outside the house as and when needed?
Is the role of female in crop production important?
Should the female be given recognition officially due to their contribution in agriculture?
84
Do you help your wife/husband in their work? Yes-----------1 No------------2
If yes, in which activities/work do you help?
Agricultural work------1 Cattle rearing.-------2 Poultry rearing---3 Cooking---4 Child rearing-5 Cloth washing-6 Crop harvest and storage-7 Children education-8 Others-9
Appendix VI: Focus Group Discussion (FGD) checklist of Where the Rain Falls
(WtRF)- Phase III Project, Kurigram
Serial Number of the Questionnaire:
Date of data collection:
Month Date Year
Area Identification:
District Code:
Upazila Code:
Union Code:
Village Code:
1. Perception on climate change and disaster risk reduction
2. Do you know about the different policies about Climate change (). If yes, Explain.
3. Please identify any climate induced disaster, which have occurred in your area in the last
five years and what was the adverse effects of those climate induced disasters
4. Do you receive any early warning about climate change? How have you known that early warning please explain?
5. Have you received any trainings related to coping mechanism with climate change
effect, if yes please explain and will you have any desire to receive climate change effect or coping mechanism with adverse effect of climate change?
6. What measures or initiatives have been undertaken by public and private organizations to cope with of those adverse effects of climate change? If yes how you are benefited from those initiatives?
7. Are you members of any farmers organization? If yes, how did you form of those
farmers’ organization? What measures or initiatives have you been undertaken to enroll huge amount of women members or included women friendly planning of those farmers’ organization? What are the benefits of farmers’ organization?
85
8. Are you member of standing committees of Union Parishad or any other committees formed by public or private organizations? If yes, Please explain your role and responsibilities of those committees.
9. Which crops you have cultivated in the last 12 months? Please tell those cultivated crop
names with their varieties and yield?
10. What constraints or problems did you face to cultivate crop due to adverse effect of climate change( Crop fully or partially damaged due to flood or drought, infestation of insects and diseases, increase of production cost, decrease of yield, crop cannot planted timely due to water logging or drought etc.)? Who are the most effected in your family or society? Please explain.
11. What strategies you have yourselves under taken to cope with adverse climate change
effect particularly crop cultivation with other sides( Drought tolerant crops or varieties, Flood tolerant crops or varieties, adaptive crops and different types of adaptation technologies) ? Please explain.
12. Which months of the years did you face food shortage? What are the reasons of that food shortage and how did you cope with that food shortage? Please explain.
13. Did you migrant other areas of the country? If yes, in which months of the year did you migrant? What are the advantages and disadvantages of your family due to of migration? Please explain.
14. What problems did you face if men are outside of the home due to migration?
15. Please tell the role and responsibilities of female and male members of your family regarding decision making for personal and family affairs ( Child bearing, adoptive new economic activity, engagement of productivity activities, regarding land selling and purchasing, tree and other assets’ selling and purchasing, commodities’ marketing, receiving credit and new investment, sending children to school, marriage of children, purchasing food for family, use of innovative technologies, livestock rearing, daily activities such as cooking, cloth washing, agricultural work, toilet clearing, carrying water, child bathing etc ).
16. Descript the status of daily food intake by your family members (female, male and children)? Please tell the above food intake status when your crop production was affected due to adverse effect of climate change.
17. Please tell the role and responsibilities of female and male members of your family regarding the daily activities (Family, domestic activities, crop production related, Purchasing and selling).
18. How do you evaluate the women contribution in all economic activities from family to national level? And what are you thinking to ensure women participation in all economic activities.
Appendix VII: Key Informant Interview (KII) Checklist of Where the Rain Falls ( WtRF)-
Phase III Project, Kurigram
86
1. Department of Agriculture Extension ( Deputy Director, Upazila Agriculture Officer,Sub-Assistant Agriculture Officer) DD, Kurigram-1, UAO, Kurigram Sadar- 1, SAAO- 3 (1/union) – Total 5
2. Uninon Parishad – 3 Union Chairman, 3 Mohila Councilors (Total-6) 3. Agriculture Research Institution ( BINA, BRRI) – BINA (1), BRRI (1)Total (2) 4. Meteorological Department - 1 5. Private sector (Seed Company) - 2(Lal Teer, ACI) 6. BADC SEED ( Assistant/ Deputy Director)-1
A key informant interview is for the representative of the relevant organizations / departments
responsible for adaptation to climate change. The interview follows a semi-structure
questionnaire/checklist to describe the existing situation in terms of climate change adaptation
to agriculture, activities (research and development) undertaken, information dissemination
regarding impact of climate change, capacity to cope with adverse effect of climate change in
agriculture.
1. Identification
1.1. Name of key informant/interviewee :
1.2. Designation :
1.3. Cell Phone: :
1.4. Department/ Organization:
1.5. Union :
1.6. Upazila :
1.7. District :
1.8. Date of interview:
1.9. Name of interviewer:
Checklist:
1. Perception on climate change and disaster risk reduction
2. Please identify any climate change induced disaster,which have occurred in this
Kurigram upazila/district in the last 5 years.
a) Type of disaster
b) Intensity (high/medium/low)
c) Frequency
d) Effect on crop production
e) Coping mechanisms by community/farmers
3. Name of activities/ projects to cope with climate change effect in your organization (eg,
technology, demonstration, training, early warning, weather forecasting etc.)
4. Type of roles, services and resources relevant to address climate change you are obligated to provide to the climate victims through the above activities/projects
87
5. Strategies/approaches through which you implement the above activities/projects
(community selection, targeting of area and participants etc.)
6. Specific achievement of the above activities/projects to address climate change
7. Please mention related plans of your organization to cope with climate change effect
(involving community participation, considering women issues etc.)
8. Major areas of budget/fund in the current fiscal year of your organization to address
climate change effect (please mention activities in line with budget/fund)
9. Type of awareness activities, skills training, workshop and others so far implemented by
your organization in Kurigram to address climate change effect
10. Specific areas of initiatives and innovations of your organization to cope with climate
change effect (new strategies, technology, alternate varieties and cropping pattern, early
warning disseminating system and knowledge dissemination etc.)
11. Effect of climate change on crop yield, livelihoods, seasonal migration, health and family
nutrition, particularly women and children.
12. Major constraints your organization face to address climate change effect and to
implement climate resilient activities
13. Specific recommendations in terms of organogram, fund, equipments, staff training,
coordination and gender issues.
14. Level of awareness onBangladesh Climate Change Action plan-2009, DRR policy, New
Agriculture Policy, Seed policy, Gender policy and the other (if any) relevant to climate
change.
15. Name of activities/initiatives of the above policies in your organizationalaction plan
16. Status of implementation of the activities/initiatives as per above policies
17. Scope of strengthening community based organizations to sensitize policy makers in
favor of integration of climate change risks in the national policies and activities.
18. Status and mechanisms of network/coordination with other organization (Government/
Union Parishad /NGO/Private sectors) to implement the activities relevant to climate
change effect at local (union and upazila), regional (district/division) and national level
19. Major gaps/constraints in the coordination mechanisms to integrate climate change risks
in the above policies.
20. Specific recommendations for effective coordination to integrate climate change risks in
the above policies

88
Appendix VIII: Statistical Analysis of Data
Table 1: Frequency distribution of Sex.
Sex and Religion Number of respondent Percent
Sex
Male 92 26.3
Female 258 73.7
Total 350 100.0
Table 2: Frequency distribution of grand total of lands
Grand total of
lands
Code Frequency Percent Cumulative
percent
0-20 1 88 25.1 25.1
21-50 2 172 49.1 74.2
51-100 3 74 21.2 95.4
101-120 4 16 4.6 100
Total 350 100.0
Table 3: Descriptive statistics of source of income.
Source of income N Minimum Maximu
m
Mean Std.
Deviatio
n
Agriculture
Male 19 1500 32000 9015.47 7733.99
Female 307 1000 194700 21966.18 25335.61
Total 326 1000 194700 21211.39 24837.75
Day labor
Male 30 1800 90000 30724.33 21051.63
Female 225 4000 162900 52251.78 25359.13
Total 241 4000 162900 52607.39 25379.65
Service
Male 2 28000 36000 32000.00 5656.85
Female 35 10000 348000 86113.00 76988.26
Total 36 10000 560000 92498.75 105498.1
Male 3 15000 70500 37666.67 29113.28

89
Business Female 71 10000 270000 64900.35 41613.35
Total 74 10000 270000 63796.28 41388.06
Rickshaw/v
an/boat/Aut
o
Male 1 2000 2000 2000.00 .
Female 19 3000 109500 49300.00 28594.27
Total 20 2000 109500 46935.00 29773.54
Livestock
and poultry
rearing
Male 121 250 72600 4063.41 7521.73
Female 38 500 80800 15265.79 17938.97
Total 158 250 80800 6783.37 11926.88
Fish culture
Male 0
Female 17 400 90000 14023.53 21986.43
Total 17 400 90000 14023.53 21986.43
Homestead
gardening
Male 17 500 8000 2441.18 2439.02
Female 3 1000 8000 4666.67 3511.89
Total 20 500 8000 2775.00 2640.55
Handicraft
Male 17 1200 42000 11958.82 11378.27
Female 0
Total 17 1200 42000 11958.82 11378.27
Loan
Male 169 1200 70000 20004.30 12758.36
Female 26 4000 200000 36711.54 42619.29
Total 191 1200 200000 22587.58 20351.61
Others
Male 23 1000 100000 15913.04 21443.23
Female 51 1200 200000 47306.47 35979.26
Total 74 1000 200000 37265.27 35299.80
Table 4: Descriptive statistics of total income.
Income source N Minimum Maximum Mean Std.
Deviation
Grand total
income of male 350 0 389550 89309.94 60704.238
Grand total
income of
female
348 0 295000 17262.14 25684.160
Grand total
income 350 1500 633233 106353.43 65605.496
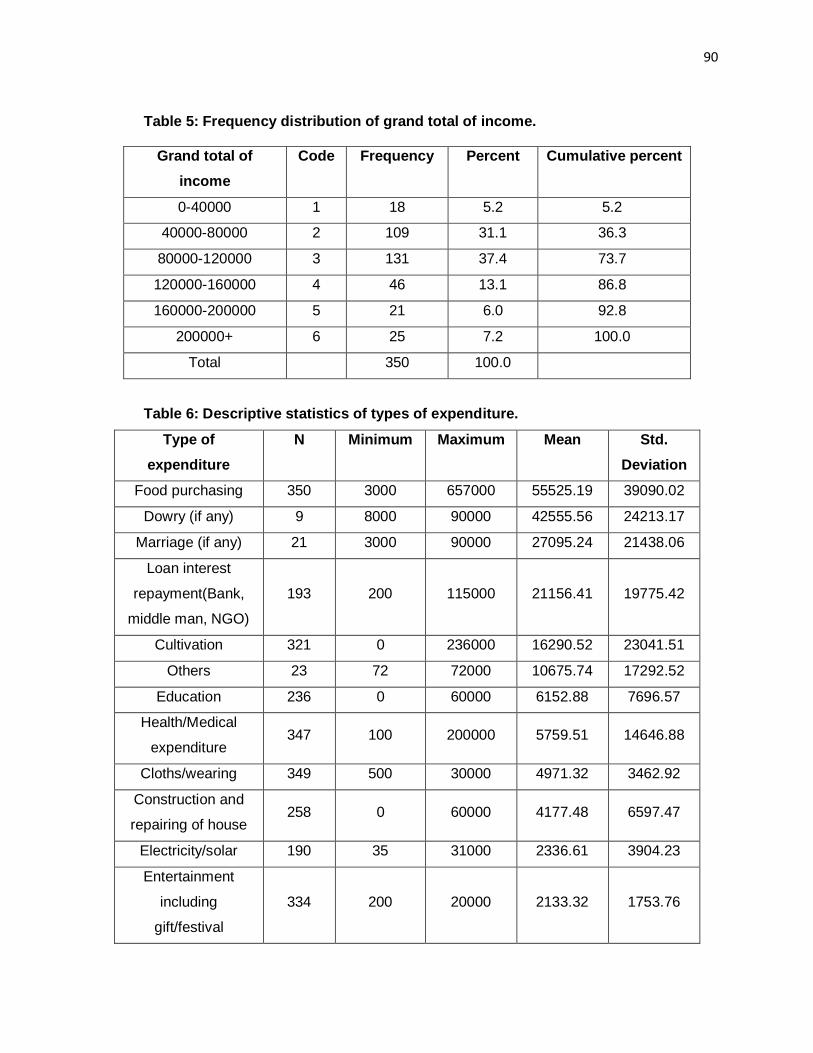
90
Table 5: Frequency distribution of grand total of income.
Grand total of
income
Code Frequency Percent Cumulative percent
0-40000 1 18 5.2 5.2
40000-80000 2 109 31.1 36.3
80000-120000 3 131 37.4 73.7
120000-160000 4 46 13.1 86.8
160000-200000 5 21 6.0 92.8
200000+ 6 25 7.2 100.0
Total 350 100.0
Table 6: Descriptive statistics of types of expenditure.
Type of
expenditure
N Minimum Maximum Mean Std.
Deviation
Food purchasing 350 3000 657000 55525.19 39090.02
Dowry (if any) 9 8000 90000 42555.56 24213.17
Marriage (if any) 21 3000 90000 27095.24 21438.06
Loan interest
repayment(Bank,
middle man, NGO)
193 200 115000 21156.41 19775.42
Cultivation 321 0 236000 16290.52 23041.51
Others 23 72 72000 10675.74 17292.52
Education 236 0 60000 6152.88 7696.57
Health/Medical
expenditure 347 100 200000 5759.51 14646.88
Cloths/wearing 349 500 30000 4971.32 3462.92
Construction and
repairing of house 258 0 60000 4177.48 6597.47
Electricity/solar 190 35 31000 2336.61 3904.23
Entertainment
including
gift/festival
334 200 20000 2133.32 1753.76
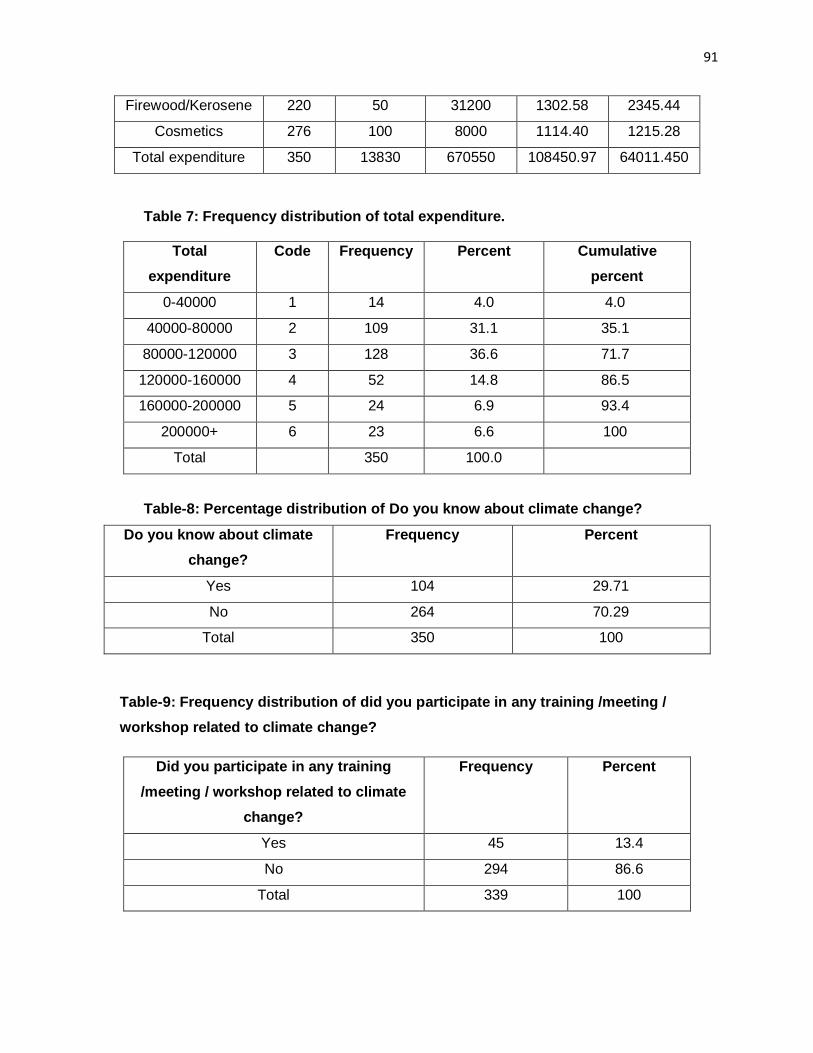
91
Firewood/Kerosene 220 50 31200 1302.58 2345.44
Cosmetics 276 100 8000 1114.40 1215.28
Total expenditure 350 13830 670550 108450.97 64011.450
Table 7: Frequency distribution of total expenditure.
Total
expenditure
Code Frequency Percent Cumulative
percent
0-40000 1 14 4.0 4.0
40000-80000 2 109 31.1 35.1
80000-120000 3 128 36.6 71.7
120000-160000 4 52 14.8 86.5
160000-200000 5 24 6.9 93.4
200000+ 6 23 6.6 100
Total 350 100.0
Table-8: Percentage distribution of Do you know about climate change?
Do you know about climate
change?
Frequency Percent
Yes 104 29.71
No 264 70.29
Total 350 100
Table-9: Frequency distribution of did you participate in any training /meeting /
workshop related to climate change?
Did you participate in any training
/meeting / workshop related to climate
change?
Frequency Percent
Yes 45 13.4
No 294 86.6
Total 339 100
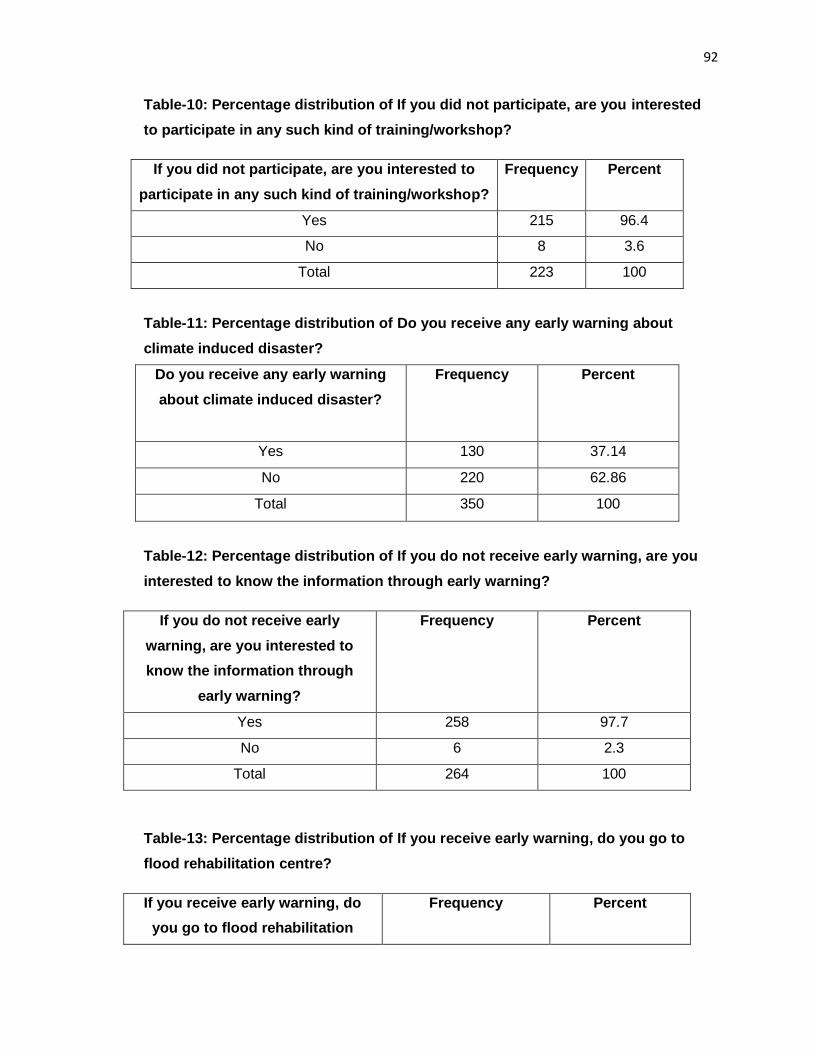
92
Table-10: Percentage distribution of If you did not participate, are you interested
to participate in any such kind of training/workshop?
If you did not participate, are you interested to
participate in any such kind of training/workshop?
Frequency Percent
Yes 215 96.4
No 8 3.6
Total 223 100
Table-11: Percentage distribution of Do you receive any early warning about
climate induced disaster?
Do you receive any early warning
about climate induced disaster?
Frequency Percent
Yes 130 37.14
No 220 62.86
Total 350 100
Table-12: Percentage distribution of If you do not receive early warning, are you
interested to know the information through early warning?
If you do not receive early
warning, are you interested to
know the information through
early warning?
Frequency Percent
Yes 258 97.7
No 6 2.3
Total 264 100
Table-13: Percentage distribution of If you receive early warning, do you go to
flood rehabilitation centre?
If you receive early warning, do
you go to flood rehabilitation
Frequency Percent
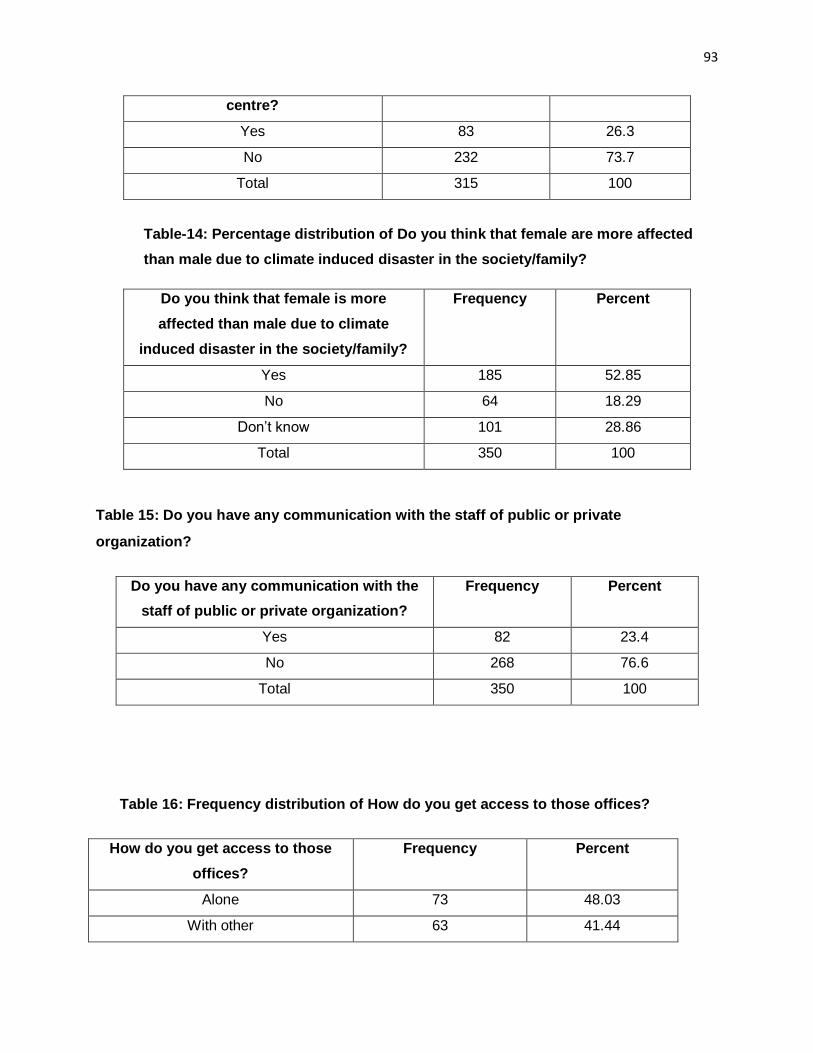
93
centre?
Yes 83 26.3
No 232 73.7
Total 315 100
Table-14: Percentage distribution of Do you think that female are more affected
than male due to climate induced disaster in the society/family?
Do you think that female is more
affected than male due to climate
induced disaster in the society/family?
Frequency Percent
Yes 185 52.85
No 64 18.29
Don’t know 101 28.86
Total 350 100
Table 15: Do you have any communication with the staff of public or private
organization?
Do you have any communication with the
staff of public or private organization?
Frequency Percent
Yes 82 23.4
No 268 76.6
Total 350 100
Table 16: Frequency distribution of How do you get access to those offices?
How do you get access to those
offices?
Frequency Percent
Alone 73 48.03
With other 63 41.44
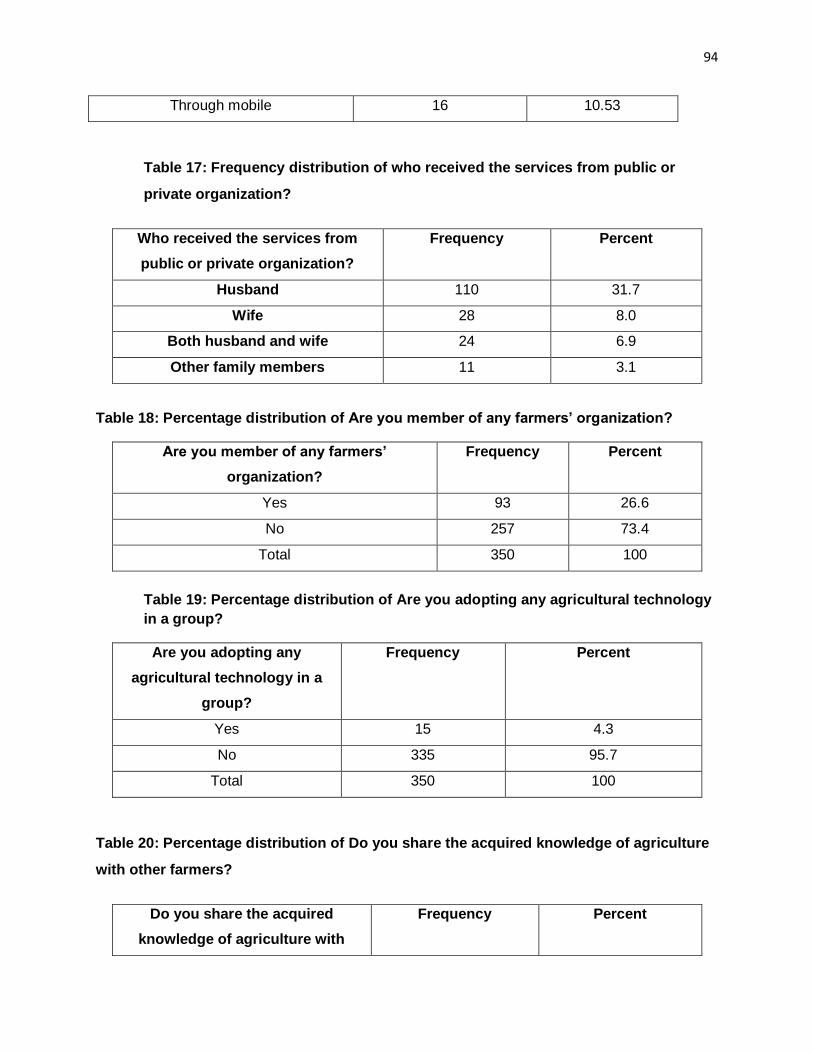
94
Through mobile 16 10.53
Table 17: Frequency distribution of who received the services from public or
private organization?
Who received the services from
public or private organization?
Frequency Percent
Husband 110 31.7
Wife 28 8.0
Both husband and wife 24 6.9
Other family members 11 3.1
Table 18: Percentage distribution of Are you member of any farmers’ organization?
Are you member of any farmers’
organization?
Frequency Percent
Yes 93 26.6
No 257 73.4
Total 350 100
Table 19: Percentage distribution of Are you adopting any agricultural technology
in a group?
Are you adopting any
agricultural technology in a
group?
Frequency Percent
Yes 15 4.3
No 335 95.7
Total 350 100
Table 20: Percentage distribution of Do you share the acquired knowledge of agriculture
with other farmers?
Do you share the acquired
knowledge of agriculture with
Frequency Percent

95
other farmers?
Yes 81 23.1
No 269 76.9
Table 21: Is the information/services you receive from public and private organizations
sufficient?
Are the information/services you receive
from public and private organizations
sufficient?
Frequency Percent
Sufficient 0 0
Fair 36 13.1
Not sufficient 239 86.9
Table 22: Percentage distribution of did you face the following types of climate
induced disaster in the last five years? If yes, what type of damage in crop
cultivation did you encounter?
Answer Affected area/damage
Intensity of
damage
Types of
disaster
Yes No 1 2 3 4 5 6 7 8 9 1 2 3
Flood 331 29 54.
6
29.
7
7.
1
0 0 0 0.6 2.6 0 5.4 28.
3
60.
9
Heavy
rainfall
96 25
4
0.9 9.7 1
6
0 0.
3
0 0.3 0 0 2.3 20.
0
4.6
Drought 31 31
9
0.3 0.9 0 2.
9
4 0.
6
0 0.3 0 3.4 4.6 0.6
River
erosion
9 34
1
0.9 0 0 0 0 0 0 1.7 0 0.3 0 2.3
Hail storm 204 14
6
6 1.4 0 0 0.
3
0 44.
6
6.9 0 17.
4
24 17.
7
Tornado/cy
clone
2 34
8
0.3 0 0 0 0 0 0 0.3 0 0 0.3 0.3
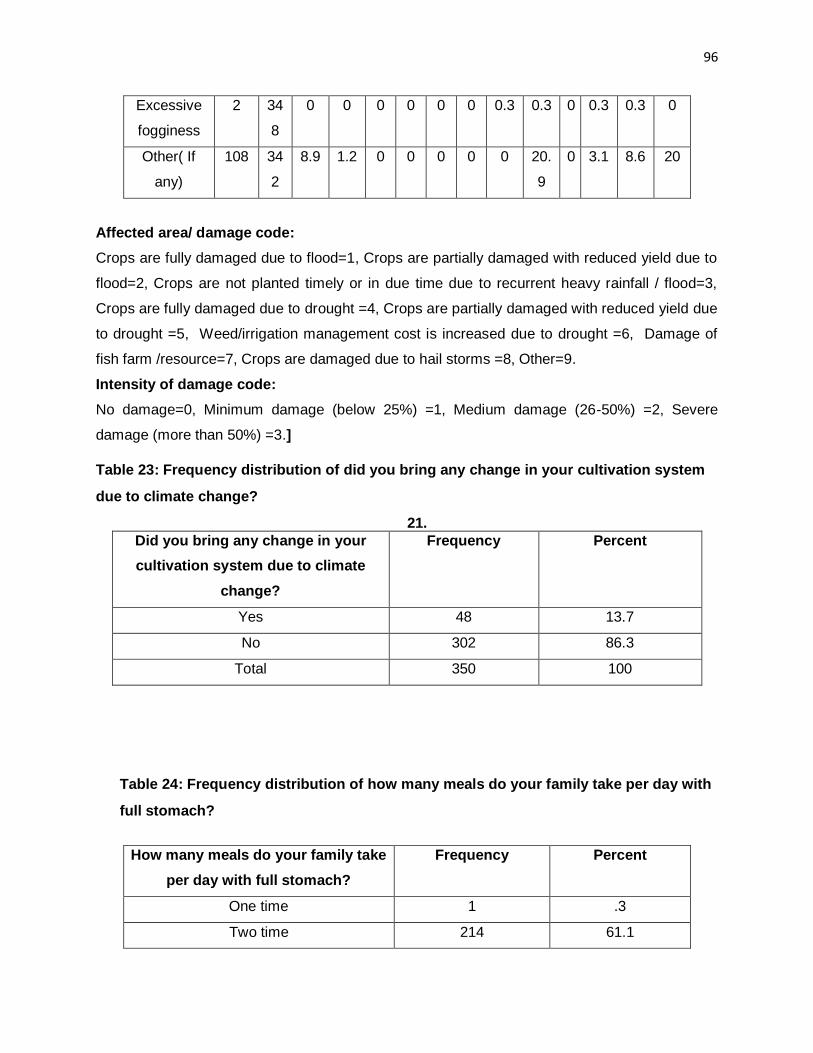
96
Excessive
fogginess
2 34
8
0 0 0 0 0 0 0.3 0.3 0 0.3 0.3 0
Other( If
any)
108 34
2
8.9 1.2 0 0 0 0 0 20.
9
0 3.1 8.6 20
Affected area/ damage code:
Crops are fully damaged due to flood=1, Crops are partially damaged with reduced yield due to
flood=2, Crops are not planted timely or in due time due to recurrent heavy rainfall / flood=3,
Crops are fully damaged due to drought =4, Crops are partially damaged with reduced yield due
to drought =5, Weed/irrigation management cost is increased due to drought =6, Damage of
fish farm /resource=7, Crops are damaged due to hail storms =8, Other=9.
Intensity of damage code:
No damage=0, Minimum damage (below 25%) =1, Medium damage (26-50%) =2, Severe
damage (more than 50%) =3.]
Table 23: Frequency distribution of did you bring any change in your cultivation system
due to climate change?
21.
Did you bring any change in your
cultivation system due to climate
change?
Frequency Percent
Yes 48 13.7
No 302 86.3
Total 350 100
Table 24: Frequency distribution of how many meals do your family take per day with
full stomach?
How many meals do your family take
per day with full stomach?
Frequency Percent
One time 1 .3
Two time 214 61.1
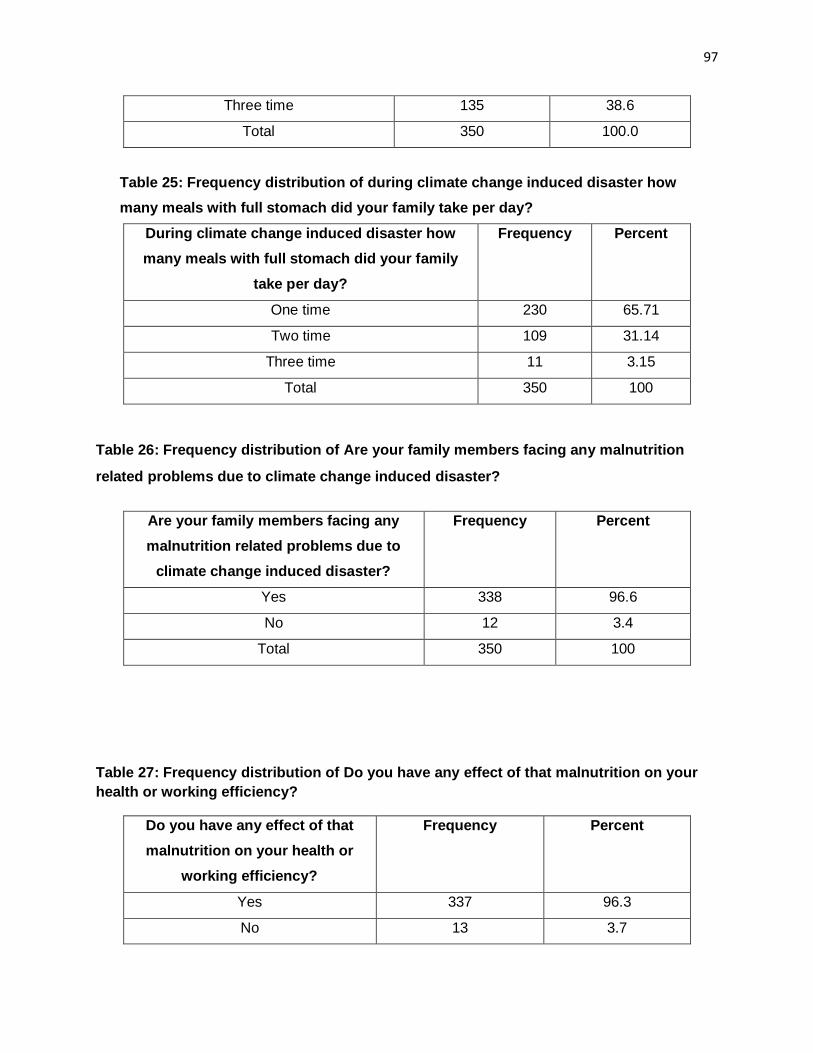
97
Three time 135 38.6
Total 350 100.0
Table 25: Frequency distribution of during climate change induced disaster how
many meals with full stomach did your family take per day?
During climate change induced disaster how
many meals with full stomach did your family
take per day?
Frequency Percent
One time 230 65.71
Two time 109 31.14
Three time 11 3.15
Total 350 100
Table 26: Frequency distribution of Are your family members facing any malnutrition
related problems due to climate change induced disaster?
Are your family members facing any
malnutrition related problems due to
climate change induced disaster?
Frequency Percent
Yes 338 96.6
No 12 3.4
Total 350 100
Table 27: Frequency distribution of Do you have any effect of that malnutrition on your
health or working efficiency?
Do you have any effect of that
malnutrition on your health or
working efficiency?
Frequency Percent
Yes 337 96.3
No 13 3.7
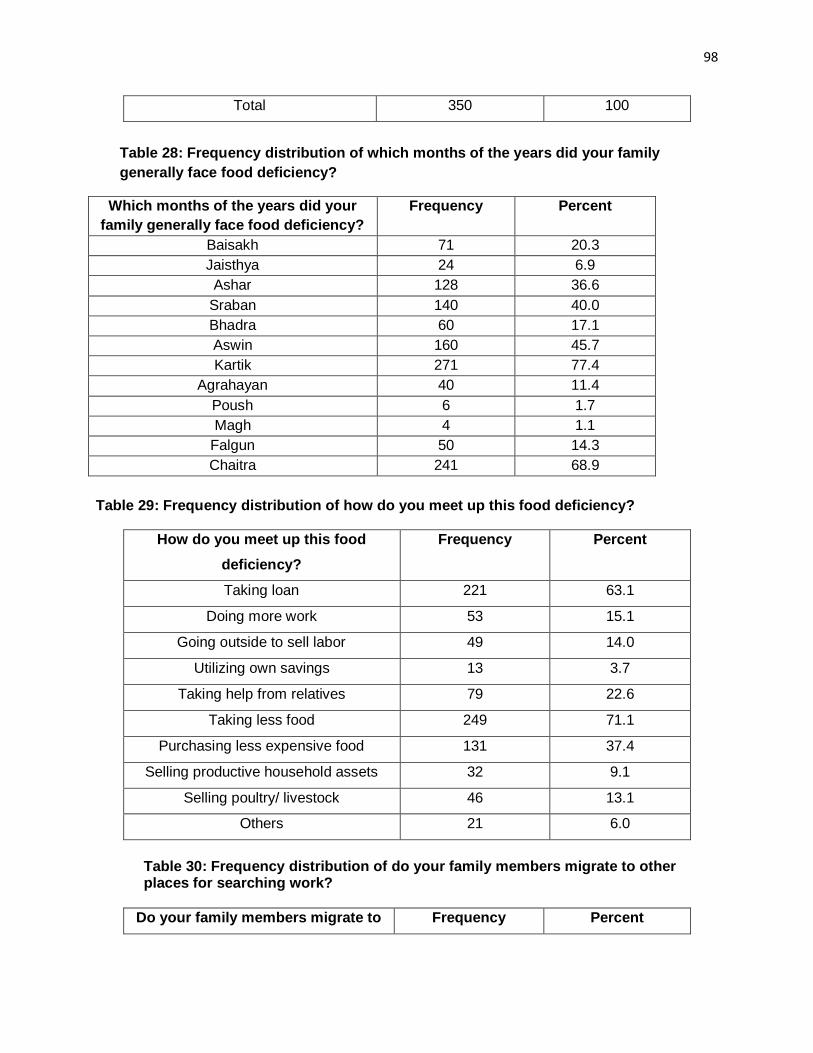
98
Total 350 100
Table 28: Frequency distribution of which months of the years did your family
generally face food deficiency?
Which months of the years did your
family generally face food deficiency?
Frequency Percent
Baisakh 71 20.3
Jaisthya 24 6.9
Ashar 128 36.6
Sraban 140 40.0
Bhadra 60 17.1
Aswin 160 45.7
Kartik 271 77.4
Agrahayan 40 11.4
Poush 6 1.7
Magh 4 1.1
Falgun 50 14.3
Chaitra 241 68.9
Table 29: Frequency distribution of how do you meet up this food deficiency?
How do you meet up this food
deficiency?
Frequency Percent
Taking loan 221 63.1
Doing more work 53 15.1
Going outside to sell labor 49 14.0
Utilizing own savings 13 3.7
Taking help from relatives 79 22.6
Taking less food 249 71.1
Purchasing less expensive food 131 37.4
Selling productive household assets 32 9.1
Selling poultry/ livestock 46 13.1
Others 21 6.0
Table 30: Frequency distribution of do your family members migrate to other places for searching work?
Do your family members migrate to Frequency Percent
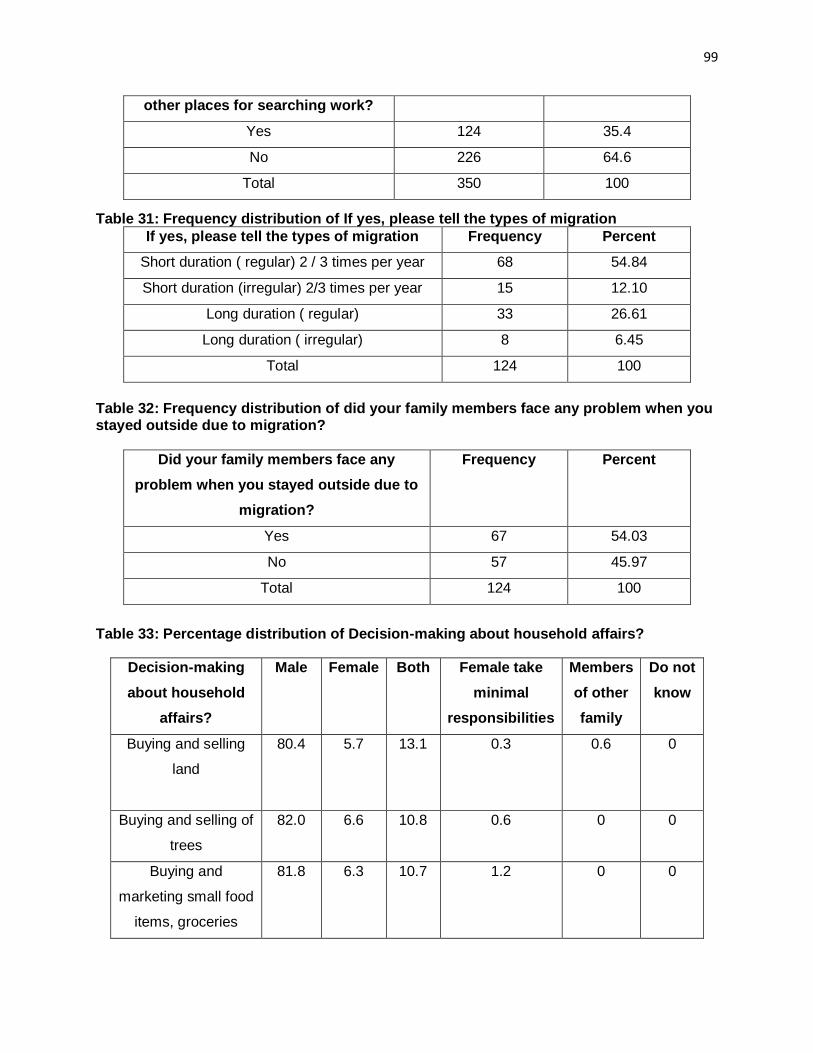
99
other places for searching work?
Yes 124 35.4
No 226 64.6
Total 350 100
Table 31: Frequency distribution of If yes, please tell the types of migration
If yes, please tell the types of migration Frequency Percent
Short duration ( regular) 2 / 3 times per year 68 54.84
Short duration (irregular) 2/3 times per year 15 12.10
Long duration ( regular) 33 26.61
Long duration ( irregular) 8 6.45
Total 124 100
Table 32: Frequency distribution of did your family members face any problem when you stayed outside due to migration?
Did your family members face any
problem when you stayed outside due to
migration?
Frequency Percent
Yes 67 54.03
No 57 45.97
Total 124 100
Table 33: Percentage distribution of Decision-making about household affairs?
Decision-making
about household
affairs?
Male Female Both Female take
minimal
responsibilities
Members
of other
family
Do not
know
Buying and selling
land
80.4 5.7 13.1 0.3 0.6 0
Buying and selling of
trees
82.0 6.6 10.8 0.6 0 0
Buying and
marketing small food
items, groceries
81.8 6.3 10.7 1.2 0 0

100
Receiving loan and
use of loans
48.1 15.4 30.9 4.9 0 0.6
Sending children to
school
11.1 33 54.3 1.2 0.3 0
Arranging child
marriage
37.6 5.9 48.0 1.0 7.5 0
Buying food for
family members
66.4 13.3 19.4 0.3 0.6 0
Daily family activities 5.3 81.9 12.3 0 0.6 0
Appling innovative
technology in
agriculture
85.1 8.5 4.9 0.9 0.3 0.3
Cattle rearing (Cow
& goat)
39.0 36.6 22.9 0.3 0.9 0.3
Others 54.1 21.6 10.8 0 0 13.5
Table 34: Percentage distribution of how many meals do your family members take per
day during climate induced disaster?
Family
members
Food intake during normal
time( #)
Food intake during disaster
period( #)
Male Female Children Male Female Children
One time 0.3 1.2 3.6 53.1 78.4 1.0
Two time 59.3 74.1 2.3 40.4 18.7 21.8
Three
time
40.4 24.8 94.1 6.5 2.9 77.2
Total 100 100 100 100 100 100
Table 35: Distribution of problem facing by women to go outside the house.
Problem faced by
women to go outside the
house
Frequency Percent
Yes 273 80

101
Table 36: Percentage distribution of important measures taken by GO and private sectors
for women to address adverse effect of climate change.
important measures taken by GO and private
sectors for women to address adverse effect
of climate change
Frequency Percent
Yes 31 9.0
No 195 56.9
Don’t know 117 34.1
No 48 14.1
Often 20 5.9