Hydrochemical monitoring of near surface groundwater ... - SKB
68
SVENSK KÄRNBRÄNSLEHANTERING AB SWEDISH NUCLEAR FUEL AND WASTE MANAGEMENT CO Box 3091, SE-169 03 Solna Phone +46 8 459 84 00 skb.se SVENSK KÄRNBRÄNSLEHANTERING Hydrochemical monitoring of near surface groundwater and surface waters Results from the sampling period January–December 2016 Anders Wallin Micke Borgiel Susanne Qvarfordt P-17-41 Report P-17-41 April 2018
-
Upload
khangminh22 -
Category
Documents
-
view
9 -
download
0
Transcript of Hydrochemical monitoring of near surface groundwater ... - SKB

e
SVENSK KÄRNBRÄNSLEHANTERING AB
SWEDISH NUCLEAR FUEL
AND WASTE MANAGEMENT CO
Box 3091, SE-169 03 Solna
Phone +46 8 459 84 00
skb.se
SVENSK KÄRNBRÄNSLEHANTERING
Hydrochemical monitoring of near surface groundwater and surface waters
Results from the sampling period January–December 2016
Anders Wallin
Micke Borgiel
Susanne Qvarfordt
P-1
7-4
1
Report
P-17-41April 2018

Hydrochemical monitoring of near surface groundwater and surface waters
Results from the sampling period January–December 2016
Anders Wallin, Micke Borgiel, Susanne Qvarfordt Sveriges Vattenekologer
ISSN 1651-4416SKB P-17-41ID 1617513
April 2018
Keywords: Aktivitetsplan, AP SFK-10-082, AP SFK 16-023.
This report concerns a study which was conducted for Svensk Kärnbränslehantering AB (SKB). The conclusions and viewpoints presented in the report are those of the authors. SKB may draw modified conclusions, based on additional literature sources and/or expert opinions.
Data in SKB’s database can be changed for different reasons. Minor changes in SKB’s database will not necessarily result in a revised report. Data revisions may also be presented as supplements, available at www.skb.se.
A pdf version of this document can be downloaded from www.skb.se.
© 2018 Svensk Kärnbränslehantering AB

SKB P-17-41 3
Abstract
This report presents the hydrochemical monitoring of near surface groundwaters and surface waters in Forsmark during the sampling period January to December 2016.
Near surface groundwaters were sampled and analysed four times during this period. First the samples were collected from shallow soil monitoring wells and one BAT-pipe. In August 2016 the sampling program was changed, adding new soil pipes and excluding the BAT-pipe in the sampling program.
Sampling of surface waters (sea, streams and lakes) was performed once per month (except July) in the four streams and once per season (four times) in the sea and lakes included in the monitoring programme. Water from an extra sampling location (the outlet of Lake Biotestsjön) was collected once per month (except in July) for tritium analyses in order to check for possible tritium contamination from the nuclear power plant. Starting in August 2016 the monitoring program was extended to include not only tritium but also ordinary water sampling from the outlet of Lake Biotestsjön as well as a few new sampling locations in the sea to be able to reveal possible nitrogen contamination later on when the underground construction starts.
The results from the near surface groundwater and surface water monitoring include field measurements of redox potential (ORP), pH, dissolved oxygen, electrical conductivity and water temperature, as well as chemical analyses of major constituents, nutrient salts, trace metals and isotopes. For surface waters, the field measurements also include depth and turbidity.
Generally, the new data confirm the knowledge and conclusions from the earlier investigation periods. The characters of the near surface groundwaters in the monitoring programme generally remain unchanged also this year.
Surface waters in the lakes and streams in the Forsmark area are well buffered with high alkalinity, high pH and high calcium concentrations. The proportions of the major ions in the sampled fresh-waters and the shallow sea bay were similar to previous years, showing no major changes. Also, the concentrations of total nitrogen and total phosphorus were similar to previous years. However, a slightly elevated concentration of Na+ and Cl− indicate salt water inflow into Bolundsfjärden. Previous data indicates periodic tritium contamination from the adjacent nuclear power plant in water samples from near the cooling water outlet. In 2016, elevated tritium concentration was measured in November and December.

4 SKB P-17-41
Sammanfattning
Rapporten dokumenterar den hydrokemiska övervakningen av ytnära grundvatten och ytvatten i Forsmarksområdet under provtagningsperioden januari till december 2016.
Provtagning och analyser av ytnära grundvatten utfördes vid fyra tillfällen under 2016. I januari och april provtogs vatten från fem jordborrhål och ett BAT-rör. I augusti omformades provtagnings-programmet vilket innebar att BAT-röret ströks och nya jordborrhål lades till i programmet.
Ytvatten provtogs en gång per månad (utom i juli) i fyra bäckar samt fyra gånger per år (en gång per årstid) i tre sjöar och i havet. En extra provpunkt vid utloppet av Biotestsjön provtogs en gång per månad (utom i juli) i syfte att kontrollera eventuell kontaminering av tritium från kärnkraftverket. Även detta förändrades med start i augusti 2016. Från augusti provtogs provpunkten vid utloppet av Biotestsjön enligt samma tillvägagångssätt som övriga ytvattenprover (d.v.s. mer utförlig provtagning och analys). Dessutom lades nya havspunkter till i programmet.
De erhållna resultaten från ytnära grundvatten och ytvatten omfattar fältmätningar av ORP (redox-potential), pH, löst syre, elektrisk konduktivitet och vattentemperatur samt kemiska analyser av huvudkomponenter, närsalter, kolföreningar, spårelement och isotoper. För ytvatten mäts även djup och turbiditet.
Årets data bekräftar generellt slutsatser från tidigare undersökningsperioder. Ytvattnet i sjöar och bäckar i Forsmarksområdet är väl buffrade med hög alkalinitet, högt pH och höga kalciumkoncentrationer. Koncentrationen av de vanligaste jonerna i de provtagna sötvattnen och havspunkten liknade före-gående år och visar därmed inga större förändringar under året. Något förhöjda koncentrationer av natrium- och kloridjoner indikerar dock saltvattensinflöde i Bolundsfjärden. Förhöjda halter av tritium uppmättes i proverna nära kylvattenutsläppet från kärnkraftverket (Biotestsjön) vid provtagningarna i november och december.
SKB P-17-41 5
Contents
1 Introduction 7
2 Near surface groundwaters 92.1 Objectives and scope 92.2 Sampling objects 92.3 Equipment 11
2.3.1 Sampling equipment 112.3.2 Multi-parameter sondes 112.3.3 BAT-equipment 11
2.4 Performance 122.4.1 Sampling programme 122.4.2 Sample handling and analyses 142.4.3 Nonconformities 15
2.5 Results 152.5.1 Field measurements 152.5.2 Water analyses 16
2.6 Summary and discussion 18
3 Surface waters 193.1 Objectives and scope 193.2 Sampling locations and sampling schedule 193.3 Equipment 21
3.3.1 Sampling equipment 213.3.2 Multi-parameter sondes 213.3.3 General field equipment 22
3.4 Performance 223.4.1 Presampling preparations 223.4.2 Water sampling 223.4.3 Field measurements 223.4.4 Sample treatment and chemical analyses 253.4.5 Data handling/post processing 253.4.6 Nonconformities 26
3.5 Results 273.5.1 General 273.5.2 Water analyses 273.5.3 Field measurements 293.5.4 Water composition 293.5.5 The NP-ratio in the surface water 33
3.6 Summary and discussion 35
References 37
Appendix 1 Sampling and analytical methods 39
Appendix 2 Near surface groundwater 41
Appendix 3 Surface waters 49


SKB P-17-41 7
1 Introduction
The site investigations in Forsmark were finished in June 2007 (SKB 2001, 2005) and a less intensive phase commenced when a prolonged monitoring programme was established (SKB 2007). This docu-ment reports the performance and results for near surface groundwater and surface waters during the period January to December 2016. The monitoring has been ongoing, in one form or another, since 2001 and is today performed according to the monitoring programme from 2007 (SKB 2007).
The sampling objects for near surface groundwater in soil include shallow monitoring wells and wells/pipes equipped with BAT-filter tips (a special sampling system described in Section 2.3.3). The different sampling objects are presented in Table 2-1 and a map showing their location is presented in Figure 2-1. The surface water sampling sites include lakes, streams and sea bays in the Forsmark area. The sampling locations are presented in Figure 3-1 and Table 3-1.
The monitoring activities include sampling and chemical analyses as well as field measurements. The controlling documents for the activities are listed in Table 1-1. The activity plans and method descriptions are SKB’s internal controlling documents. Original data from the reported activities are stored in the primary database Sicada. Data are traceable in Sicada by the activity plan numbers (AP SFK 10-082 and AP SFK 16-023). Only data in the database are accepted for further interpretation and modelling. The results presented in this report are regarded as copies of the original data. Data in the database may be revised, if needed. However, such revision of the database will not necessarily result in a revision of this report.
Table 1-1. Controlling documents for performance of the activity.
Activity plans Number VersionHydrokemisk moniteringsprogram för gölar, ytvatten och ytnära grundvatten januari 2015 till juni 2016.
AP SFK 10-082 1.0
Hydrokemiskt övervakningsprogram för ytvatten, ytnära grundvatten och gölar. Augusti till och med december 2016.
AP SFK 16-023 1.0
Method descriptions Number VersionMetodbeskrivning för ytvattenprovtagningar vid platsundersökningar. SKB MB 900.004 2.0Provtagning och Provhantering SKB MD 452.001 11.0
Water sampling and measurement procedures are also described in SKB PIR-04-09 “Metodik för provtagning av ekologiska parametrar i hav”, SKB PIR-04-06, “Metodik för provtagning av ekologiska parametrar i sjöar och vatten-drag”, and SKB PIR-04-12, ”Översikt över provhanterings- och analysrutiner för vattenprov” (SKB internal documents).
Figure 1-1. Sampling at Norra bassängen (PFM000097) in February 2016.


SKB P-17-41 9
2 Near surface groundwaters
2.1 Objectives and scopeAn extensive, two-year-long sampling campaign designed to characterise near surface groundwaters in different types of environments within the candidate area (SKB 2001) was followed by a reduced monitoring programme in July 2005 (SKB 2005). The site investigation of the candidate area was concluded in June 2007 but the monitoring programme (SKB 2007) will continue until the construction of the repository for spent nuclear fuel starts and during the construction and operation phase. This in order to monitor the water composition and obtain long time-series of data, first to create a base-line describing the natural variations and second to follow changes caused by the construction and operation of the repository.
During the reported period, January–December 2016, the sampling locations (stand pipes) within the monitoring programme were sampled at four occasions, in January, April, August and October. The sampling was conducted from shallow soil monitoring wells and one BAT-pipe. In August 2016 the sampling program was changed, adding three new soil pipes and excluding the BAT-pipe in the sampling program. The different sampling objects are presented in Table 2-1 and a map showing their location is presented in Figure 2-1.
The activity includes water sampling for chemical analysis as well as direct measurements in the field of parameters such as ORP (redox potential), pH, dissolved oxygen, electrical conductivity (EC) and water temperature. The analytical protocol includes major constituents, nutrient salts, silica, carbon species as well as isotopes and trace metals, see Tables 2-2 and 2-3.
2.2 Sampling objectsThe monitoring programme for near surface groundwater includes stand pipes and one BAT-pipe. The wells/pipes are of the following types:
1. Single stand pipes made of HDPE located close to drill sites.
2. Double and single stand pipes made of HDPE. Double pipes means that one of the pipes is equipped with a permanently installed sensor for logging the groundwater pressure and the other pipe is intended for hydrochemical sampling.
3. Stand pipes installed in the sediment below the water layer in Lake Bolundsfjärden (Figure 1-1). These pipes are made of ordinary, non-stainless iron. Stand pipes located in till below fen are of the same type.
4. Pipes equipped with BAT-filter tips as described in Section 2.3.3.
For pipe types 1) to 3), the positions of the filter/screen part, and for type 4) the position of the BAT-filter tip, correspond to the upper and lower section limits (Secup and Seclow) in the Sicada database. The section limits refer to the top of the stand pipe (Top Of Casing/TOC).
The sampled monitoring wells and their stand pipe types are listed in Table 2-1. The locations of the different sampling objects are displayed in Figure 2-1.

10 SKB P-17-41
Figure 2-1. Sampling locations within the monitoring programme for surface and near surface waters in Forsmark durin g2016. One location constitutes an alternative for a regular sampling position (see Table 3-1) and PFM007910–7912 are sampling points planned to be included in the programme 2017.
Table 2-1. List of sampling objects, type of sampling and type of pipe.
Idcode Comments on sampled object Pipe type Comment on monitoring
SFM0001 Stand pipe connected to drill site PlasticSFM0023 Stand pipe in sediment below water surface IronSFM0032 Double-pipe for chemistry PlasticSFM0037 Double-pipe for chemistry PlasticSFM0049 Double-pipe for chemistry PlasticSFM0051 BAT-system, drill site 1 BAT Excluded from August 2016SFM0002 Double-pipe for chemistry Plastic Included from August 2016SFM0011 Double-pipe for chemistry Plastic Included from August 2016SFM0057 Double-pipe for chemistry Plastic Included from August 2016

SKB P-17-41 11
2.3 Equipment2.3.1 Sampling equipmentGroundwater samples from the shallow monitoring stand pipes in soil were collected using pump setups, each one consisting of a submersible electrical pump (12V, Awimex) connected to a 5–10 m long polyamide-tube (Tecalan) of 8 mm diameter. Manually operated electrical regulators were used to adjust the water flow to a maximum of 0.5 litre/minute. Disposable filters (0.45 μm, ∅ = 22 mm) were used for filtration of some sample portions. The filters were fitted to 60 ml syringes. A separate pump set-up was used for the stand pipe made from standard iron, i.e. pipe SFM0023, in order to minimize the risk of contaminating other samples.
2.3.2 Multi-parameter sondesField measurements were conducted with a multi-parameter sonde, InSitu Troll9500 (Figure 2-2). A hand held PC is connected to the sonde through a cable for logging and initial field control of data.
The measured parameters in near surface groundwaters included pH, water temperature, oxygen, ORP (redox potential) as well as electrical conductivity. Measurements were conducted in a flow-through cell, Figure 2-2.
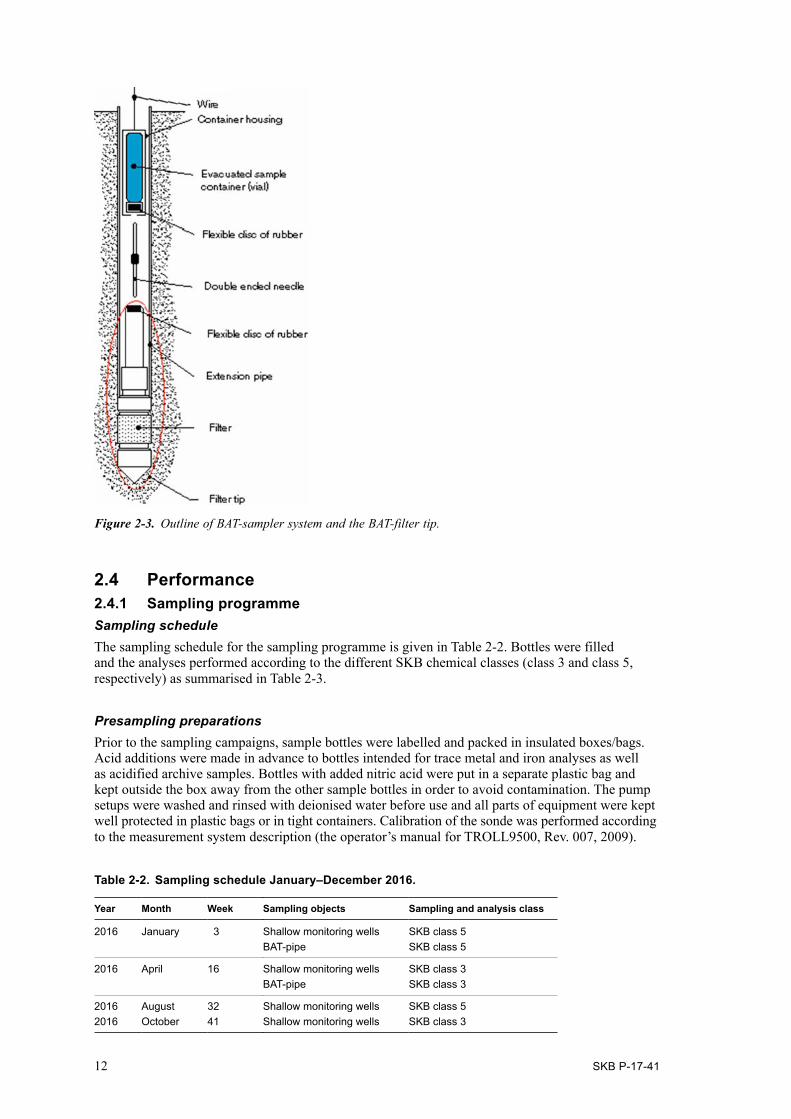
2.3.3 BAT-equipmentWater sampling in the stand pipe equipped with a BAT-filter tip was performed with a GeoN BAT-type groundwater sampler. The sampler carries an evacuated and hermetically closed glass sample container, 500 mL, and a vial. The vial is fitted with a cap with a rubber disc, similar to the disc in the filter tip. The needle of the sampler, which is “double-ended”, penetrates through the two rubber discs, thus connecting the filter tip to the vial cap, see Figure 2-3. Due to the vacuum in the vial, water will be sucked from the aquifer, through the filter and the needle, into the vial.
Figure 2-2. The multi parameter sonde used in 2016, Troll9500.
Multiparameter sonde Troll9500
Water from groundwater pipe
Flow trough cell
Water outflow
Water intake
12 SKB P-17-41
2.4 Performance 2.4.1 Sampling programmeSampling scheduleThe sampling schedule for the sampling programme is given in Table 2-2. Bottles were filled and the analyses performed according to the different SKB chemical classes (class 3 and class 5, respectively) as summarised in Table 2-3.
Presampling preparationsPrior to the sampling campaigns, sample bottles were labelled and packed in insulated boxes/bags. Acid additions were made in advance to bottles intended for trace metal and iron analyses as well as acidified archive samples. Bottles with added nitric acid were put in a separate plastic bag and kept outside the box away from the other sample bottles in order to avoid contamination. The pump setups were washed and rinsed with deionised water before use and all parts of equipment were kept well protected in plastic bags or in tight containers. Calibration of the sonde was performed according to the measurement system description (the operator’s manual for TROLL9500, Rev. 007, 2009).
Table 2-2. Sampling schedule January–December 2016.
Year Month Week Sampling objects Sampling and analysis class
2016 January 3 Shallow monitoring wells SKB class 5BAT-pipe SKB class 5
2016 April 16 Shallow monitoring wells SKB class 3 BAT-pipe SKB class 3
2016 August 32 Shallow monitoring wells SKB class 5 2016 October 41 Shallow monitoring wells SKB class 3
Figure 2-3. Outline of BAT-sampler system and the BAT-filter tip.
SKB P-17-41 13
Sampling and measurements The groundwater sampling procedure described below was generally applied in the groundwater pipes and wells, except for the BAT-pipe.
First, the groundwater level in the pipe was established by sounding and the water volume of the pipe was calculated. The pump with its connected tube was lowered carefully in order to prevent dirt from entering the pipe. The water inlet of the submersible pump was lowered to the filter/screen section of the pipe or just above. Pumping was then performed at a maximum flow rate of 0.5 litre per minute. The pumped water was disposed of at least 10 m away from the sampling object where it filtrated back into the ground. The pumping phases were as follows:
• Exchange of water volume in pipe and tubes: The water volume was exchanged three to five times (depending on the exchange/recovery time) prior to the actual sampling.
• Field measurement: A flow-through cell was connected to the pump setup and measurements were performed with the multi parameter sonde. The results were recorded when the electrodes and sensors in the flow-through cell showed stable values (minimum 10 minutes). A judgement of the plausibility of the values was made in the field and accepted values were noted in the field protocol and logged on the hand held PC.
• Sampling: All sample bottles, except the ones with added acid, were rinsed three times with sample water before they were filled. Disposable filters were used for filtration of water portions for major components, trace metals, Fe, nutrients and DOC/DIC. Each filter was rinsed with sample water (approx. 20 mL) before the sample portion/filtrate was collected. Bottles containing acid were the last ones to be filled in order to prevent acid contamination in the other sample portions. Disposable plastic gloves were used during the sampling. The samples were transported back from the field in insulated boxes/bags.
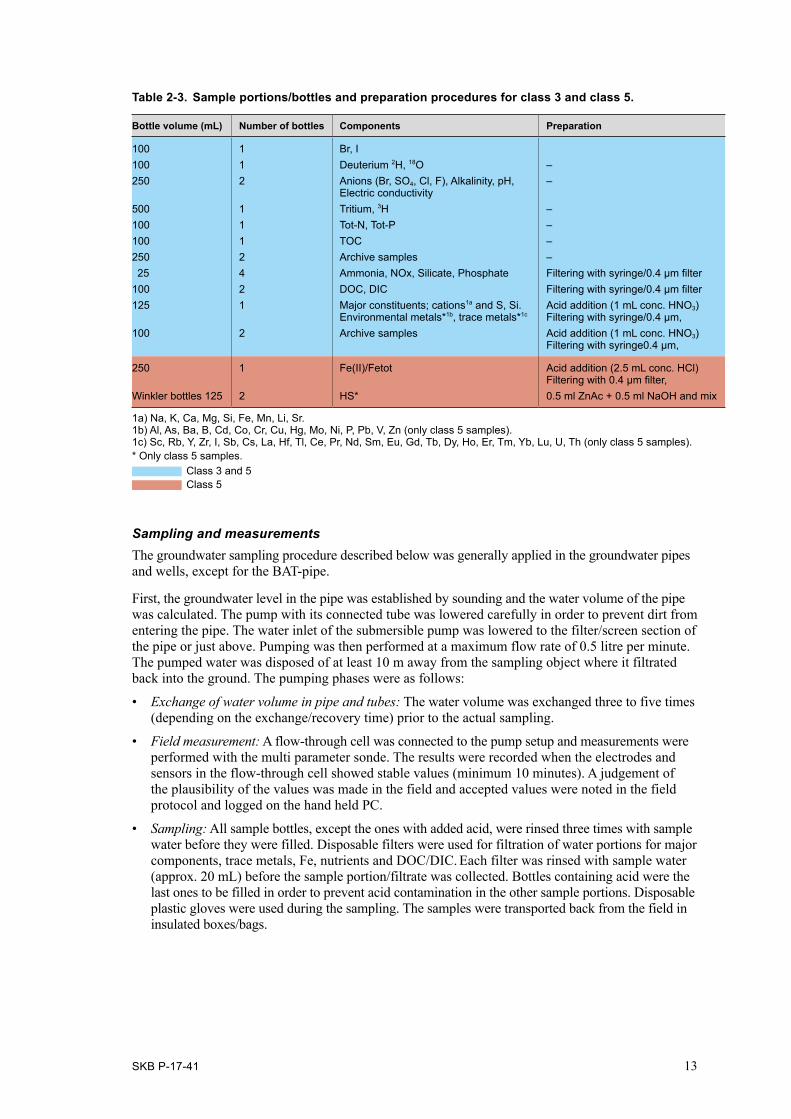
Table 2-3. Sample portions/bottles and preparation procedures for class 3 and class 5.
Bottle volume (mL) Number of bottles Components Preparation
100 1 Br, I100 1 Deuterium 2H, 18O –250 2 Anions (Br, SO4, Cl, F), Alkalinity, pH,
Electric conductivity–
500 1 Tritium, 3H –100 1 Tot-N, Tot-P –100 1 TOC –250 2 Archive samples –25 4 Ammonia, NOx, Silicate, Phosphate Filtering with syringe/0.4 μm filter
100 2 DOC, DIC Filtering with syringe/0.4 μm filter125 1 Major constituents; cations1a and S, Si.
Environmental metals*1b, trace metals*1cAcid addition (1 mL conc. HNO3) Filtering with syringe/0.4 μm,
100 2 Archive samples Acid addition (1 mL conc. HNO3) Filtering with syringe0.4 μm,
250 1 Fe(II)/Fetot Acid addition (2.5 mL conc. HCl) Filtering with 0.4 μm filter,
Winkler bottles 125 2 HS* 0.5 ml ZnAc + 0.5 ml NaOH and mix
1a) Na, K, Ca, Mg, Si, Fe, Mn, Li, Sr. 1b) Al, As, Ba, B, Cd, Co, Cr, Cu, Hg, Mo, Ni, P, Pb, V, Zn (only class 5 samples). 1c) Sc, Rb, Y, Zr, I, Sb, Cs, La, Hf, Tl, Ce, Pr, Nd, Sm, Eu, Gd, Tb, Dy, Ho, Er, Tm, Yb, Lu, U, Th (only class 5 samples).* Only class 5 samples.
Class 3 and 5Class 5
14 SKB P-17-41
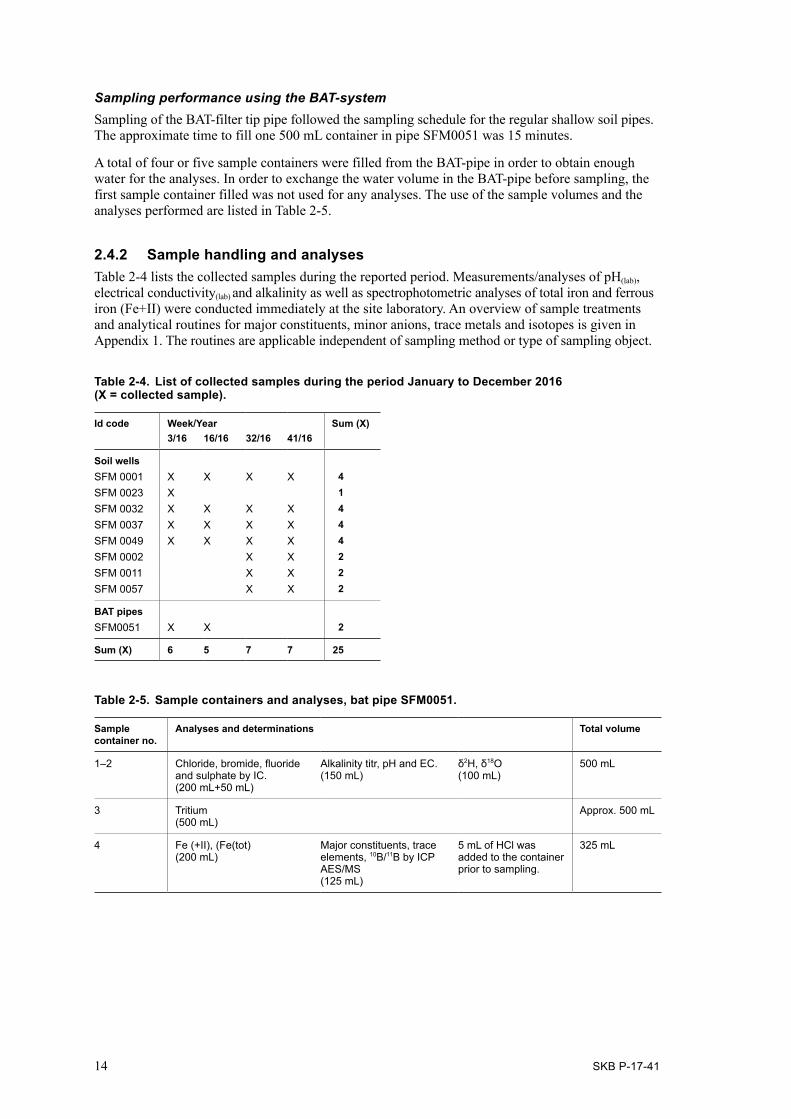
Sampling performance using the BAT-system Sampling of the BAT-filter tip pipe followed the sampling schedule for the regular shallow soil pipes. The approximate time to fill one 500 mL container in pipe SFM0051 was 15 minutes.
A total of four or five sample containers were filled from the BAT-pipe in order to obtain enough water for the analyses. In order to exchange the water volume in the BAT-pipe before sampling, the first sample container filled was not used for any analyses. The use of the sample volumes and the analyses performed are listed in Table 2-5.
2.4.2 Sample handling and analysesTable 2-4 lists the collected samples during the reported period. Measurements/analyses of pH(lab), electrical conductivity(lab) and alkalinity as well as spectrophotometric analyses of total iron and ferrous iron (Fe+II) were conducted immediately at the site laboratory. An overview of sample treatments and analytical routines for major constituents, minor anions, trace metals and isotopes is given in Appendix 1. The routines are applicable independent of sampling method or type of sampling object.
Table 2-4. List of collected samples during the period January to December 2016 (X = collected sample).
Id code Week/Year Sum (X)3/16 16/16 32/16 41/16
Soil wellsSFM 0001 X X X X 4SFM 0023 X 1SFM 0032 X X X X 4SFM 0037 X X X X 4SFM 0049 X X X X 4SFM 0002 X X 2SFM 0011 X X 2SFM 0057 X X 2
BAT pipes SFM0051 X X 2
Sum (X) 6 5 7 7 25
Table 2-5. Sample containers and analyses, bat pipe SFM0051.
Sample container no.
Analyses and determinations Total volume
1–2 Chloride, bromide, fluoride and sulphate by IC. (200 mL+50 mL)
Alkalinity titr, pH and EC. (150 mL)
δ2H, δ18O (100 mL)
500 mL
3 Tritium (500 mL)
Approx. 500 mL
4 Fe (+II), (Fe(tot) (200 mL)
Major constituents, trace elements, 10B/11B by ICP AES/MS (125 mL)
5 mL of HCl was added to the container prior to sampling.
325 mL

SKB P-17-41 15
2.4.3 NonconformitiesDue to problems with the pipe, site SFM0023 was only sampled in January 2016. This is due to unreliable data. The exclusion of this data is due to highly variable water quality both during the sampling and between sample occasions. The differences in water quality can e.g. be observed during the sampling. The water colour can shift from clear to black. Also, the charge balance error is rarely acceptable. The bad water quality is probably due to the corroded iron pipe used in this site. A new pipe was added at the SFM0023 site in 2016. However, this new pipe did not work during 2016 and the sampling site must be fixed before reliable samples can be obtained.
No sampling was performed in the private wells (PFM000001, PFM000009 and PFM006382) during this sampling period (2016).
2.5 Results2.5.1 Field measurementsThe pH, electrical conductivity, dissolved oxygen, oxygen saturation, water temperature and redox potential (ORP) results from the field measurements are presented in Appendix 2.
pH-measurementField measurements of pH are plotted against the corresponding laboratory values in Figure 2-4. The data show good agreement between field and laboratory measurements although some deviation is expected due to different water temperatures and the time delay between field and laboratory measurements. However, in one case, the disagreement seems to be too large. This is from the only sampling occasion at the site SFM0023 in Lake Bolundsfjärden, where large differences between field and laboratory values are common. This well yields little water and the inflow is very slow (the exchange of the pipe volume takes ca 24 h), which means that field measurements must be performed the day before the water is sampled for laboratory analyses. This may explain the large differences in pH-values illustrated by the point disagreeing most from the red line in Figure 2-4.
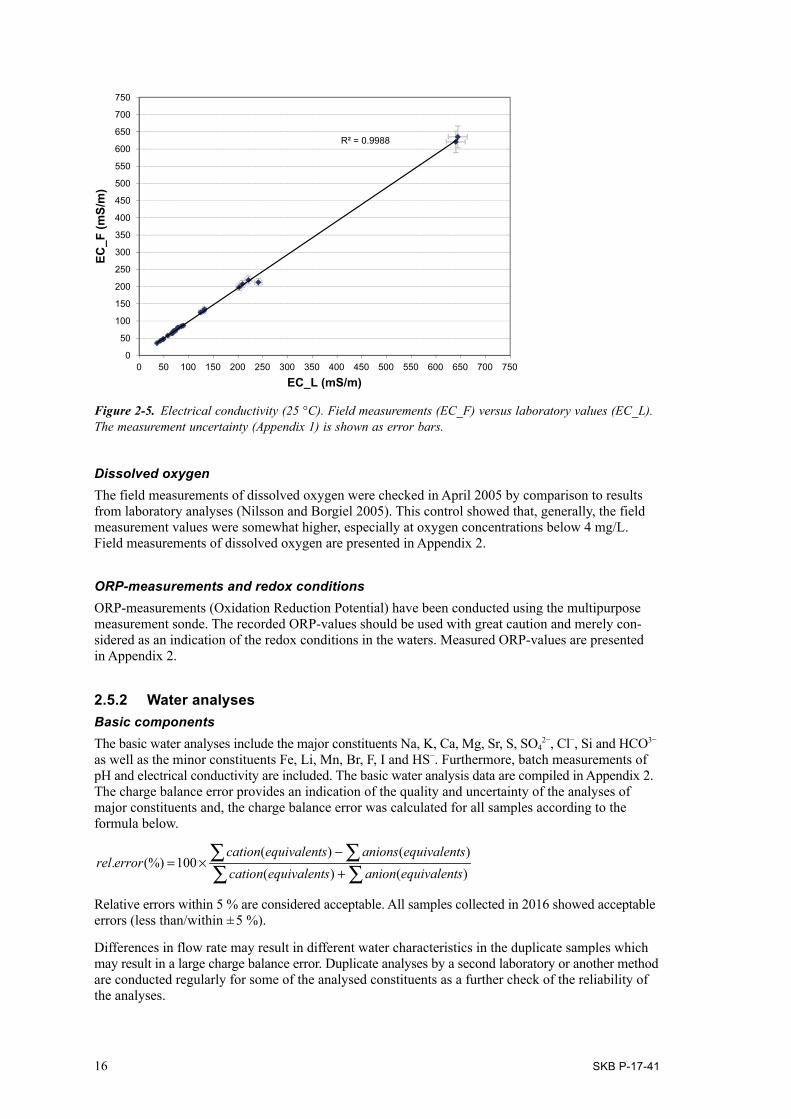
Electrical conductivityElectrical conductivity values from the field are plotted versus corresponding laboratory values in Figure 2-5. The values show good agreement between field and laboratory measurements.
Figure 2-4. Field-pH (pH_F) values versus laboratory-pH (pH_L) values. Field-pH and laboratory-pH values are measured at prevailing water temperature and at 25 °C respectively. The measurement uncertainty (Appendix 1) is shown as error bars.
5.00
5.50
6.00
6.50
7.00
7.50
8.00
8.50
9.00
5.00 5.50 6.00 6.50 7.00 7.50 8.00 8.50 9.00
pH_F
pH_L
16 SKB P-17-41
Dissolved oxygenThe field measurements of dissolved oxygen were checked in April 2005 by comparison to results from laboratory analyses (Nilsson and Borgiel 2005). This control showed that, generally, the field measurement values were somewhat higher, especially at oxygen concentrations below 4 mg/L. Field measurements of dissolved oxygen are presented in Appendix 2.
ORP-measurements and redox conditionsORP-measurements (Oxidation Reduction Potential) have been conducted using the multipurpose measurement sonde. The recorded ORP-values should be used with great caution and merely con-sidered as an indication of the redox conditions in the waters. Measured ORP-values are presented in Appendix 2.
2.5.2 Water analysesBasic componentsThe basic water analyses include the major constituents Na, K, Ca, Mg, Sr, S, SO4
2−, Cl−, Si and HCO3− as well as the minor constituents Fe, Li, Mn, Br, F, I and HS−. Furthermore, batch measurements of pH and electrical conductivity are included. The basic water analysis data are compiled in Appendix 2. The charge balance error provides an indication of the quality and uncertainty of the analyses of major constituents and, the charge balance error was calculated for all samples according to the formula below.
∑ ∑∑ ∑
+−
×=)()()()(
100(%).sequivalentanionsequivalentcationsequivalentanionssequivalentcation
errorrel
Relative errors within 5 % are considered acceptable. All samples collected in 2016 showed acceptable errors (less than/within ± 5 %).
Differences in flow rate may result in different water characteristics in the duplicate samples which may result in a large charge balance error. Duplicate analyses by a second laboratory or another method are conducted regularly for some of the analysed constituents as a further check of the reliability of the analyses.
Figure 2-5. Electrical conductivity (25 °C). Field measurements (EC_F) versus laboratory values (EC_L). The measurement uncertainty (Appendix 1) is shown as error bars.
R² = 0.9988
0
50
100
150
200
250
300
350
400
450
500
550
600
650
700
750
0 50 100 150 200 250 300 350 400 450 500 550 600 650 700
EC_F
(mS/
m)
750
EC_L (mS/m)
SKB P-17-41 17
The bromide analyses are often uncertain, for example the detection limit of bromide by ion chro-matography (< 0.2 mg/L) is often too high for fresh waters. Therefore, duplicate analyses by ICP (bromine) have been performed for most samples.
Surface water supplementsShallow groundwater analysis includes the surface water supplements/options NH4-N, NO2-N, NO3-N+NO2-N, NO3-N, tot-N, tot-P, PO4-P, TOC, DOC and DIC. The analytical data are compiled in Appendix 2. The DIC values should be used with care and bicarbonate values (by alkalinity titration) are considered more reliable.
The concentrations of the different nitrogen, phosphorous and carbon compounds may show seasonal variation depending on decomposition processes and varying redox conditions also in shallow ground-water, however, this variation is more pronounced in surface waters. The graphs in Figure 2-7 show the variations of total nitrogen, ammonium and phosphate in the sampled groundwater from the five soil-pipes included in the long-term monitoring programme.
The results from 2016 show concentrations within the previously recorded variations for each sampling location, except for well SFM0023. In the well SFM0023 the concentrations of total nitrogen was higher during January 2016 compared to previous years (Figures 2-7). Results from the new soil pipes (SFM0002, SFM0011 and SFM0057) are available in Appendix 2.
Trace metalsThe analyses of trace and rare earth elements include Al, As, Sc, Cd, Cr, Cu, Co, Hg, Ni, Zn, Pb, V, U, Th, Rb, Y, Zr, Mo, In, Sb, Cs, Ba, La, Hf, Tl, Ce, Pr, Nd, Sm, Eu, Gd, Tb, Dy, Ho, Er, Tm, Yb, Se and Lu. The trace element data are compiled in Appendix 2.
These elements are generally present at low concentrations in the groundwater and the risk for contamination is high. Especially data on common metals such as Al, Cr, Cu, Co, Ni and Zn must be used with caution. Trace metals are not analysed for the iron stand pipe SFM0023 in Lake Bolundsfjärden because of the risk for contamination from the iron pipe.
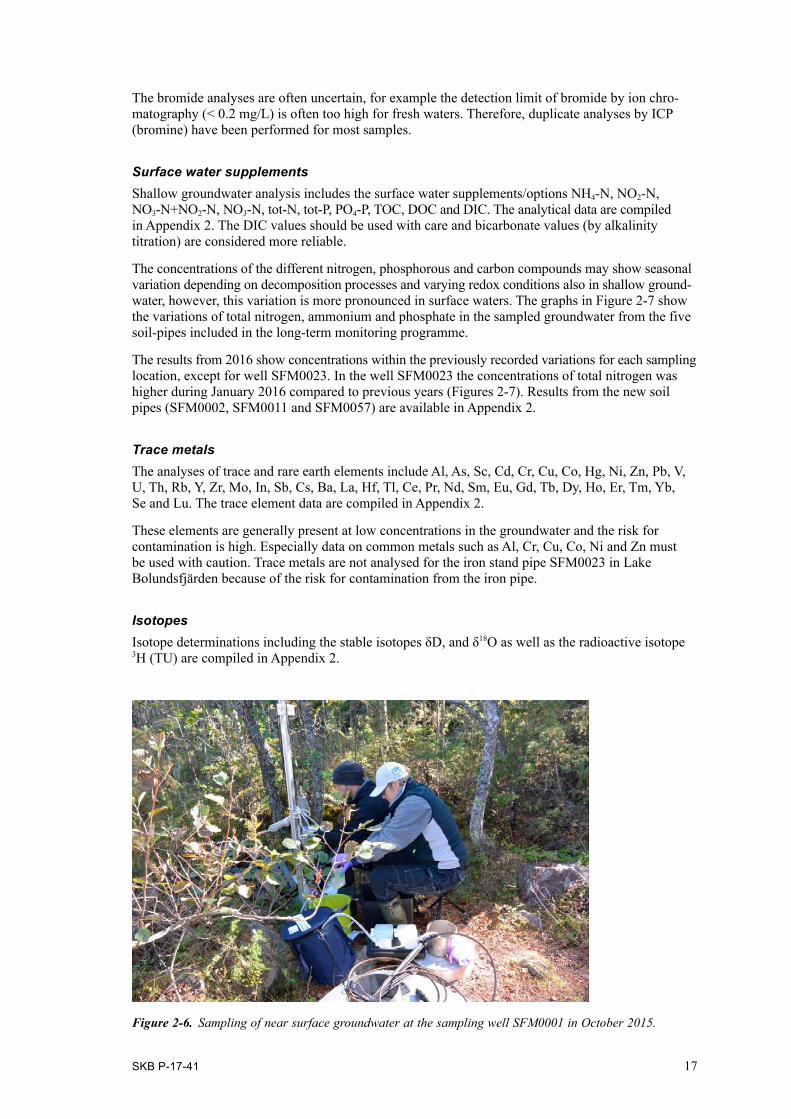
IsotopesIsotope determinations including the stable isotopes δD, and δ18O as well as the radioactive isotope 3H (TU) are compiled in Appendix 2.
Figure 2-6. Sampling of near surface groundwater at the sampling well SFM0001 in October 2015.

18 SKB P-17-41
Figure 2-7. Ammonium, total nitrogen and phosphate concentrations plotted versus sampling date for the sampling wells SFM0001, SFM0023, SFM0032, SFM0037 and SFM0049. Note the different scales and that the phosphate concentration is given on the secondary Y-axis. The measurement uncertainty is shown as error bars.
0
0.02
0.04
0.06
0.08
0.1
0
0.2
0.4
0.6
0.8
1
1.2
1.4
1.6
1.8
2002 2004 2006 2008 2010 2012 2014 2016
Con
cent
ratio
n (m
g/L)
Year
SFM0001
0
0.01
0.02
0.03
0.04
0.05
0
1
2
3
4
5
6
7
2002 2004 2006 2008 2010 2012 2014 2016
Con
cent
ratio
n (m
g/L)
Year
SFM0023
0
0.01
0.02
0.03
0.04
0
0.05
0.1
0.2
0.3
0.4
0.5
0.6
0.7
0.8
1
0.9
2002 2004 2006 2008 2010 2012 2014 2016
Con
cent
ratio
n (m
g/L)
Year
Concenttration PO
4 _P (mg/L)
SFM0032
0
0.01
0.02
0.03
0.04
0.05
0
1
0.5
1.5
2
2.5
2002 2004 2006 2008 2010 2012 2014 2016
Con
cent
ratio
n (m
g/L)
Year
SFM0037
NH4_N
N-tot
PO4_P
0
0.01
0.02
0.03
0.04
0
0.05
0.2
0.4
0.6
1
0.8
1.2
2002 2004 2006 2008 2010 2012 2014 2016
Con
cent
ratio
n (m
g/L)
Year
SFM0049
Concenttration PO
4 _P (mg/L)
Concenttration PO
4 _P (mg/L)
Concenttration PO
4 _P (mg/L)
Concenttration PO
4 _P (mg/L)
2.6 Summary and discussionThe characters of the near surface groundwater in the sampling locations included in the monitoring programme generally remain unchanged. The chemical investigation routines for near surface ground-water are well established after several years of field work, reporting and data administration and this year of the long-term monitoring programme has passed without any major nonconformities or surprises. However, only one sample was collected from stand pipe in Lake Bolundsfjärden (SFM0023) during 2016. The reason for this is the bad condition of the iron pipe used in the well.
With start in August 2016, three new soil pipes were included and the BAT-pipe was excluded from the monitoring program.

SKB P-17-41 19
3 Surface waters
3.1 Objectives and scopeSampling and analyses of surface waters in the Forsmark area began in 2002 during the site investiga-tion phase. After the site investigations, the surface water monitoring programme continued and focused on sampling locations in the prioritised north-western part of the Forsmark candidate area (SKB 2007). The monitoring programme was reviewed and modified in 2010. The modifications of the programme have resulted in reduced sampling frequency in the lakes and the sea and fewer isotope determinations. However, the analytical programme was also extended in the streams adding environmental metals to the analytical programme at every sampling occasion.
The main objectives are to obtain long time-series of data to create a base-line, describing the natural variations. This in order to allow identification of eventual perturbation effects from SKB activities during the future construction and operation of the repository for nuclear waste.
The programme includes sampling of water for chemical analysis as well as direct field measurements of physical and chemical parameters such as ORP (Oxidation Reduction Potential), pH, dissolved oxygen, EC, measurement depth, turbidity and water temperature.
Analyses of major constituents, surface water supplements (nutrient salts etc) and trace elements were conducted frequently (once a month) while extended analyses, including also isotopes were performed once per season, i.e. in January, April, August and October.
3.2 Sampling locations and sampling scheduleThe monitoring programme included four lakes, one shallow sea bay location and four streams. The extent of the sampling varied at different occasions. The streams were sampled at eleven occasions (once per month, except for July) and the lake and sea sampling locations at four occasions (once per season) during the reported time period. Water from an extra sampling object (the outlet of Lake Biotestsjön) was also collected once per month (except July) for tritium analyses in order to check for possible tritium contamination from the nuclear power plant.
Figure 3-1. Field sampling at PFM000069 in April 2016.
20 SKB P-17-41
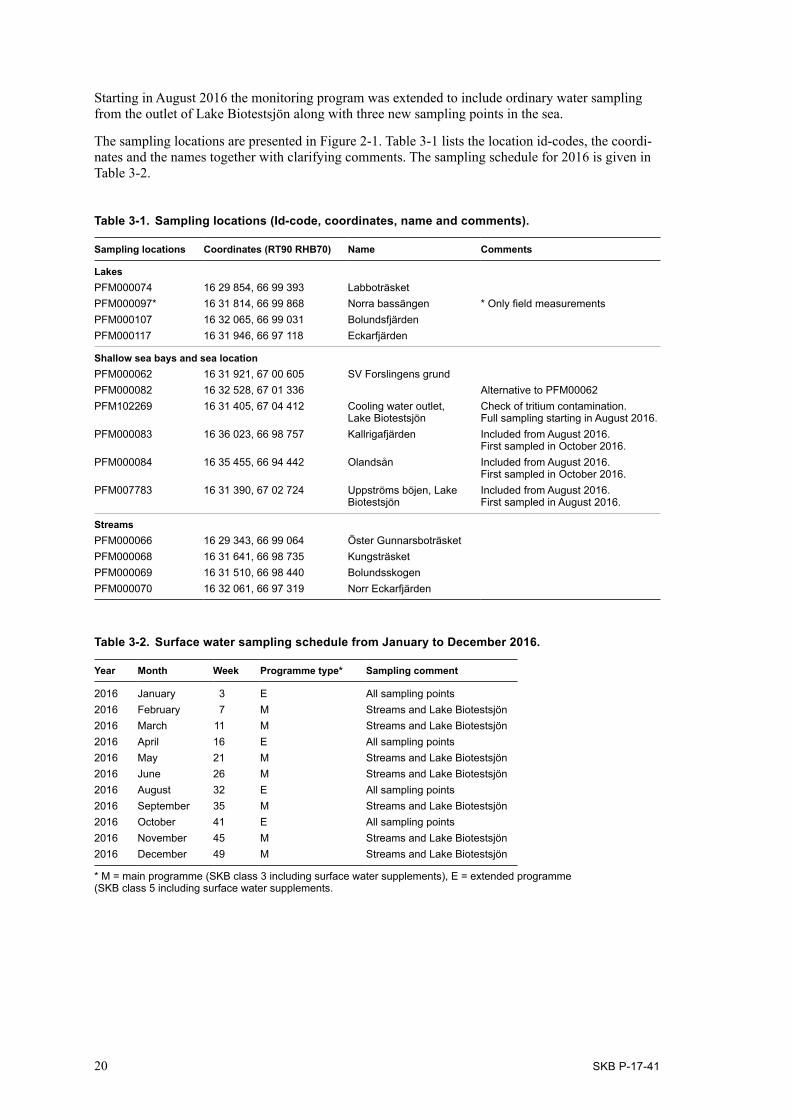
Starting in August 2016 the monitoring program was extended to include ordinary water sampling from the outlet of Lake Biotestsjön along with three new sampling points in the sea.
The sampling locations are presented in Figure 2-1. Table 3-1 lists the location id-codes, the coordi-nates and the names together with clarifying comments. The sampling schedule for 2016 is given in Table 3-2.
Table 3-1. Sampling locations (Id-code, coordinates, name and comments).
Sampling locations Coordinates (RT90 RHB70) Name Comments
LakesPFM000074 16 29 854, 66 99 393 LabboträsketPFM000097* 16 31 814, 66 99 868 Norra bassängen * Only field measurementsPFM000107 16 32 065, 66 99 031 Bolundsfjärden PFM000117 16 31 946, 66 97 118 Eckarfjärden
Shallow sea bays and sea locationPFM000062 16 31 921, 67 00 605 SV Forslingens grundPFM000082 16 32 528, 67 01 336 Alternative to PFM00062PFM102269 16 31 405, 67 04 412 Cooling water outlet,
Lake BiotestsjönCheck of tritium contamination. Full sampling starting in August 2016.
PFM000083 16 36 023, 66 98 757 Kallrigafjärden Included from August 2016. First sampled in October 2016.
PFM000084 16 35 455, 66 94 442 Olandsån Included from August 2016. First sampled in October 2016.
PFM007783 16 31 390, 67 02 724 Uppströms böjen, Lake Biotestsjön
Included from August 2016. First sampled in August 2016.
StreamsPFM000066 16 29 343, 66 99 064 Öster GunnarsboträsketPFM000068 16 31 641, 66 98 735 KungsträsketPFM000069 16 31 510, 66 98 440 BolundsskogenPFM000070 16 32 061, 66 97 319 Norr Eckarfjärden
Table 3-2. Surface water sampling schedule from January to December 2016.
Year Month Week Programme type* Sampling comment
2016 January 3 E All sampling points2016 February 7 M Streams and Lake Biotestsjön2016 March 11 M Streams and Lake Biotestsjön2016 April 16 E All sampling points2016 May 21 M Streams and Lake Biotestsjön2016 June 26 M Streams and Lake Biotestsjön2016 August 32 E All sampling points2016 September 35 M Streams and Lake Biotestsjön2016 October 41 E All sampling points2016 November 45 M Streams and Lake Biotestsjön2016 December 49 M Streams and Lake Biotestsjön
* M = main programme (SKB class 3 including surface water supplements), E = extended programme (SKB class 5 including surface water supplements.
SKB P-17-41 21
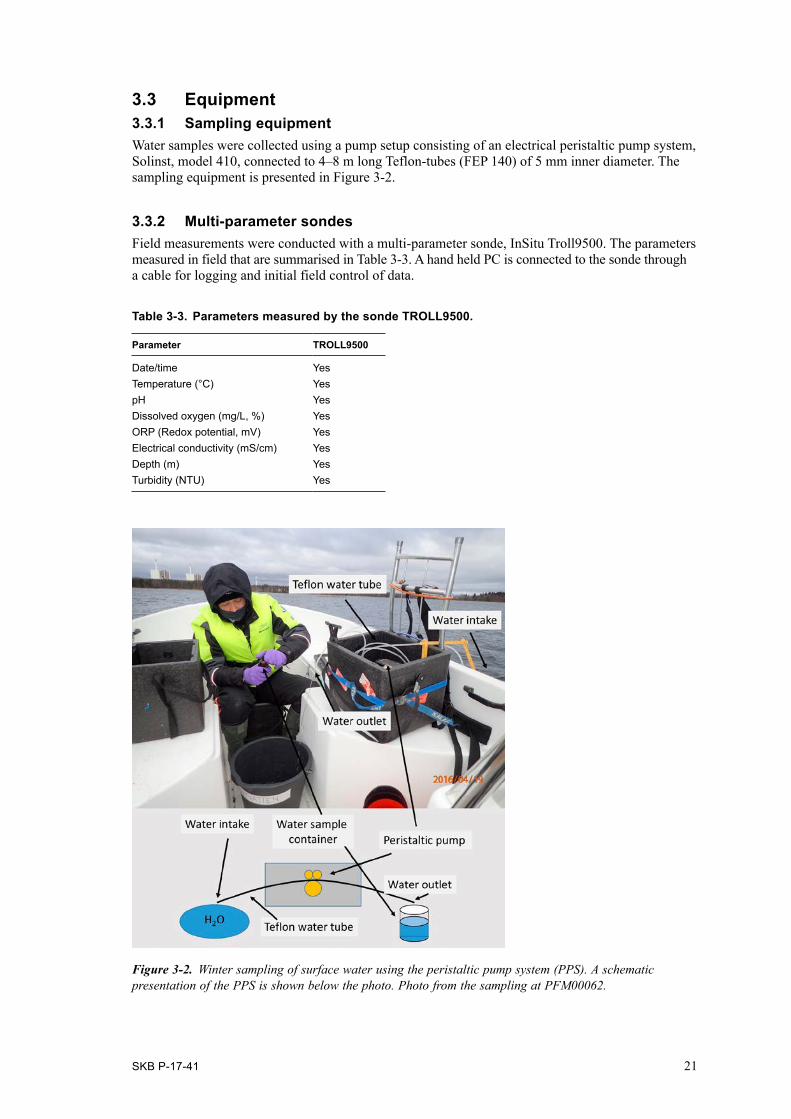
3.3 Equipment3.3.1 Sampling equipmentWater samples were collected using a pump setup consisting of an electrical peristaltic pump system, Solinst, model 410, connected to 4–8 m long Teflon-tubes (FEP 140) of 5 mm inner diameter. The sampling equipment is presented in Figure 3-2.
3.3.2 Multi-parameter sondesField measurements were conducted with a multi-parameter sonde, InSitu Troll9500. The parameters measured in field that are summarised in Table 3-3. A hand held PC is connected to the sonde through a cable for logging and initial field control of data.
Table 3-3. Parameters measured by the sonde TROLL9500.
Parameter TROLL9500
Date/time YesTemperature (°C) YespH YesDissolved oxygen (mg/L, %) YesORP (Redox potential, mV) YesElectrical conductivity (mS/cm) YesDepth (m) YesTurbidity (NTU) Yes
Figure 3-2. Winter sampling of surface water using the peristaltic pump system (PPS). A schematic presentation of the PPS is shown below the photo. Photo from the sampling at PFM00062.
22 SKB P-17-41
3.3.3 General field equipment
• Ruttner samplers were used as back up if the portable pump system should fail.
• The exact positions of the sampling locations were determined using a GPS (Garmin GPSmap 78s) with an average accuracy of ± 0.5–1.0 m.
• Water depth in the lakes and sea was measured using an echo sounder (Plastimo, Echotest, LCD digital sounder) with an accuracy of ± 0.05 m.
• Water transparency was estimated using a Secchi disc and an aqua scope.
• Disposable filters (Millipore, 0.40 μm, ∅ = 22 mm) were used together with 60 mL syringes to filter specific sample portions of the sampled water in the field.
• Stopwatch, a water-filled plastic bottle (50 mL) and measuring-tape were used for flow/runoff estimates in stream waters.
3.4 Performance3.4.1 Presampling preparationsPrior to sampling, the sample bottles were labelled and packed in insulated boxes/bags. Acid additions were made in advance to bottles intended for iron and trace metal analyses as well as acidified archive samples. The bottles with added acid were placed in separate plastic bags outside the box/bag to avoid contamination. The peristaltic pump system, including the Teflon tubes, was washed using acid (0.5 M HCl) and rinsed with deionised water before use. The equipment was kept well protected in plastic bags or in tight containers. Calibration of the sonde was performed according to the measurement system description (the operator’s manual for TROLL9500 Rev.007, 2009).
3.4.2 Water sampling Water samples were collected using the peristaltic pump system. Lake and sea water samples were collected close to the surface at 0.5 m depth. When the lake and sea sampling locations were covered with ice, water was also collected from approximately 0.5 m above the lake or sea bottom, in order to sample water both above and below the stratification. Stream water samples were collected at approximately 0.1 m depth. The peristaltic pump and sample bottles were rinsed with water from the sampling locations prior to collecting samples, except for bottles with acid additions. The disposable filters were rinsed with sample water before filtering and sampling commenced. The field crew wore rubber gloves to avoid contamination and great care was taken not to contaminate bottles or equipment. Bottles and samples with added acid were handled and stored separately to avoid contaminating other sample portions.
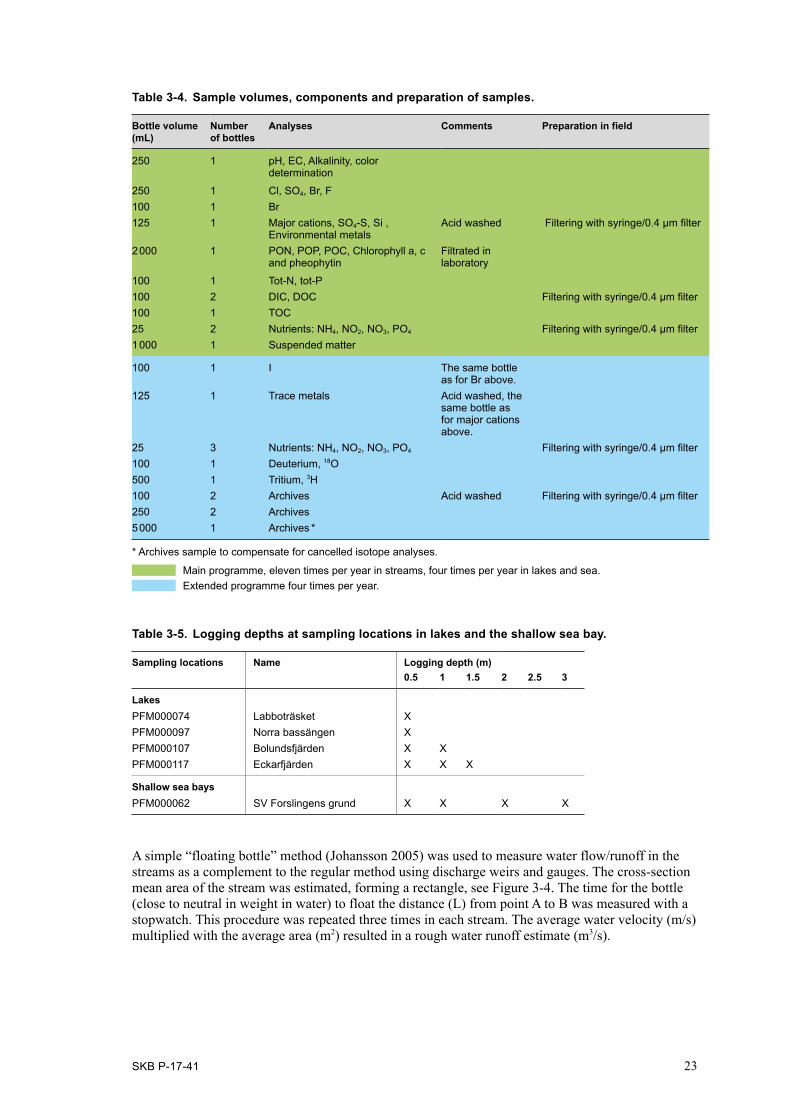
Each sample consists of several sample portions labelled with the same sample number. The prepara-tion of the sample portions in the field differs depending on their use. Details on collected sample portions, components to be analysed and sample preparations are summarised in Table 3-4.
3.4.3 Field measurements The multi parameter sonde was used for measurements of pH, water temperature, ORP, turbidity, electrical conductivity and dissolved oxygen. Light penetration was measured at lake and sea sampling locations with a Secchi disc according to the Swedish standard BIN SR 111. Photo documentation of stream waters was performed to facilitate evaluation of the investigation data. Photos were taken at each stream water sampling location. At the lakes and one sea sampling location field measurements were taken in a depth profile, with measurements logged at every metre from the surface to the bottom, see Table 3-5.
SKB P-17-41 23
Table 3-4. Sample volumes, components and preparation of samples.
Bottle volume (mL)
Number of bottles
Analyses Comments Preparation in field
250 1 pH, EC, Alkalinity, color determination
250 1 Cl, SO4, Br, F 100 1 Br 125 1 Major cations, SO4-S, Si ,
Environmental metalsAcid washed Filtering with syringe/0.4 μm filter
2 000 1 PON, POP, POC, Chlorophyll a, c and pheophytin
Filtrated in laboratory
100 1 Tot-N, tot-P 100 2 DIC, DOC Filtering with syringe/0.4 μm filter100 1 TOC 25 2 Nutrients: NH4, NO2, NO3, PO4 Filtering with syringe/0.4 μm filter1 000 1 Suspended matter
100 1 I The same bottle as for Br above.
125 1 Trace metals Acid washed, the same bottle as for major cations above.
25 3 Nutrients: NH4, NO2, NO3, PO4 Filtering with syringe/0.4 μm filter100 1 Deuterium, 18O 500 1 Tritium, 3H 100 2 Archives Acid washed Filtering with syringe/0.4 μm filter250 2 Archives 5 000 1 Archives *
* Archives sample to compensate for cancelled isotope analyses.
Main programme, eleven times per year in streams, four times per year in lakes and sea. Extended programme four times per year.
Table 3-5. Logging depths at sampling locations in lakes and the shallow sea bay.
Sampling locations Name Logging depth (m)0.5 1 1.5 2 2.5 3
LakesPFM000074 Labboträsket XPFM000097 Norra bassängen XPFM000107 Bolundsfjärden X XPFM000117 Eckarfjärden X X X
Shallow sea bays PFM000062 SV Forslingens grund X X X X
A simple “floating bottle” method (Johansson 2005) was used to measure water flow/runoff in the streams as a complement to the regular method using discharge weirs and gauges. The cross-section mean area of the stream was estimated, forming a rectangle, see Figure 3-4. The time for the bottle (close to neutral in weight in water) to float the distance (L) from point A to B was measured with a stopwatch. This procedure was repeated three times in each stream. The average water velocity (m/s) multiplied with the average area (m2) resulted in a rough water runoff estimate (m3/s).

24 SKB P-17-41
Figure 3-3. On the way to the sampling site at Labboträsket (PFM000074).
Figure 3-4. Schematic presentation for estimating water runoff in natural stream waters (see text for explanation).

SKB P-17-41 25
3.4.4 Sample treatment and chemical analysesAn overview of sample treatment and analytical methods is given in Appendix 1. The routines are applicable independently of sampling method or type of sampling object.
3.4.5 Data handling/post processingA field protocol established during sampling/measuring contains metadata (idcode, date, time, sample no., field crew etc.), a few measured data and weather observations as well as other comments on field conditions that may influence the analytical results. The field protocols supply the basic information for creating activities and activity comments in the Sicada database and also information that describes the sampling conditions for further storage in database tables. Furthermore, eventual deviations from the sampling programme or from the normal routines are also documented in special reports/comment files. The comment files are stored in the Sicada file archive Table 3-6.
Field measurement dataThe logged data from field measurements are exported digitally from the hand held PC to the specified Sicada data table. The original data file, as well as photographs and comments on sampling and measurements, are stored in the Sicada file archive, Table 3-6.
Table 3-6. File types stored in the Sicada file archive.
Type of file Example of file name No. per sampling session
Data file YTv41_16_data.xls 1Comments Noterat V41-16.doc 1Photography PFM66.jpg 1–4
Figure 3-5. Sampling in the cooling water outlet (PFM102269).

26 SKB P-17-41
Other relevant information and dataInformation about weather conditions and related parameters describing the sampling conditions are compiled in a separate Table in Sicada called “Weather_data” which contains the following columns below. These data are not presented in this report but are useful information when evaluating data. Furthermore, additional complementary information from other measurement activities within the monitoring programme are also available.
Air temperature Wind velocity Runoff/Water flowCloudiness Wind direction Water depthPrecipitation Light penetration (lakes and sea) Snow/ice depth
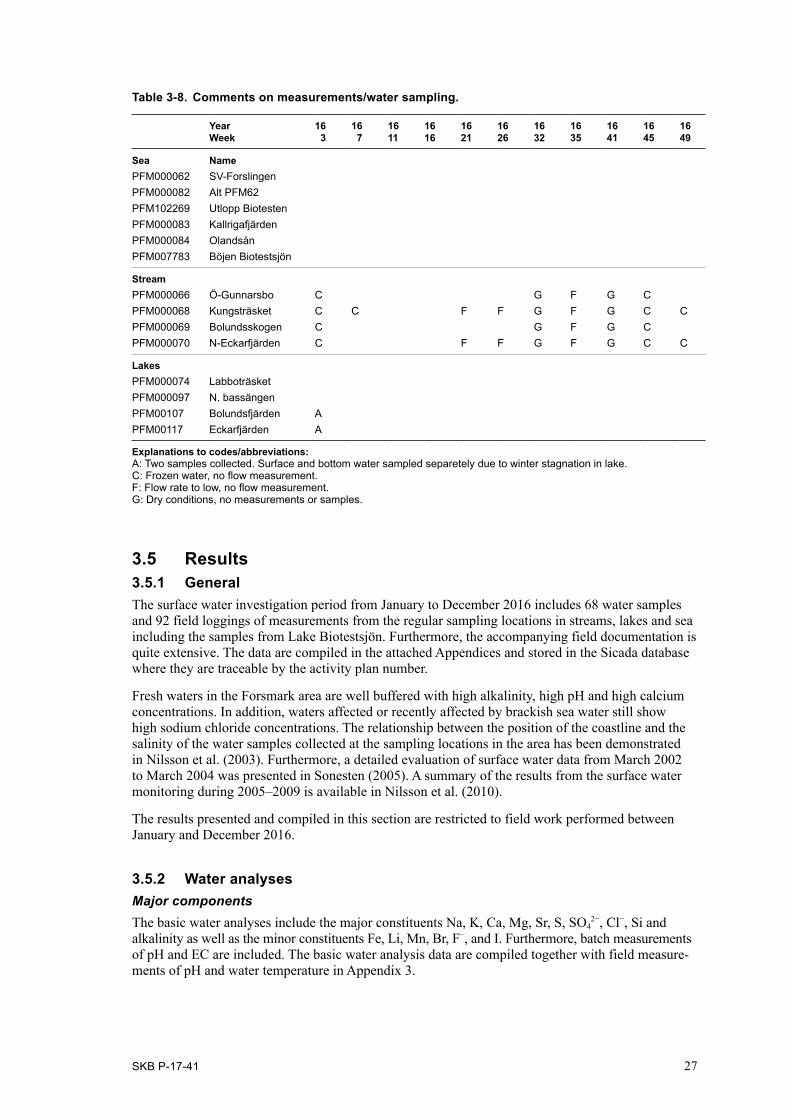
3.4.6 NonconformitiesSome nonconformities have been reported during this sampling period, January–December 2016. The flow measurements in the streams were not always performed due to the ice, dry conditions or too much water vegetation. Collected samples and reasons for deviations from the programme are compiled in Tables 3-7 and 3-8.
During 2016 there were problems with both the ordinary and backup Troll sondes. The problems were mainly connected to the O2 probes. Unreliable O2-values was recorded in the weeks 3, 7 and 11. During the service of the sondes (in the weeks 16, 21, 26 and 32) another Troll sonde (AquaTroll) was borrowed from the service centre and used during field measurements. This sonde covered the variables from the ordinary sondes and the O2-values were good. However, when the ordinary sondes returned from service the O2-values were still poor which is why unreliable O2-values was recorded in the weeks 35, 41, 45 and 49.
Table 3-7. Collected samples and conducted measurements. Explanations and abbreviations:
Year Week
16 3
16 7
16 11
16 16
16 21
16 26
16 32
16 35
16 41
16 45
16 49
Sum
Sea NamePFM000062 SV-Forslingen C X X X 3PFM000082 Alt PFM62PFM102269 Utlopp Biotesten Y* Y* Y* Y* Y* Y* X X X X X 11PFM000083 Kallrigafjärden X 1PFM000084 Olandsån X 1PFM007783 Böjen Biotestsjön X X 2
StreamPFM000066 Ö-Gunnarsbo X X X X X X G X G X X 9PFM000068 Kungsträsket X X X X X X G X G X X 9PFM000069 Bolundsskogen X X X X X X G X G X X 9PFM000070 N-Eckarfjärden X X X X X X G X G X X 9
LakesPFM000074 Labboträsket X X X X 4PFM000097 N. bassängen B B B B B B B B B B BPFM00107 Bolundsfjärden XX X X X 5PFM00117 Eckarfjärden XX X X X 5
Sum water samples 10 5 5 9 5 5 6 5 8 5 5 68
Y: Sample taken, no field measurements. X: Sample and fieldmeasurments taken. B: No sample, only field measurements with sonde. C: No measurement due to weak ice. G: Dry conditions, no measurements or samples. *: Only tritium and anions samples.
SKB P-17-41 27
Table 3-8. Comments on measurements/water sampling.
Year Week
16 3
16 7
16 11
16 16
16 21
16 26
16 32
16 35
16 41
16 45
16 49
Sea NamePFM000062 SV-ForslingenPFM000082 Alt PFM62PFM102269 Utlopp BiotestenPFM000083 KallrigafjärdenPFM000084 OlandsånPFM007783 Böjen Biotestsjön
StreamPFM000066 Ö-Gunnarsbo C G F G CPFM000068 Kungsträsket C C F F G F G C CPFM000069 Bolundsskogen C G F G CPFM000070 N-Eckarfjärden C F F G F G C C
LakesPFM000074 LabboträsketPFM000097 N. bassängenPFM00107 Bolundsfjärden APFM00117 Eckarfjärden A
Explanations to codes/abbreviations: A: Two samples collected. Surface and bottom water sampled separetely due to winter stagnation in lake. C: Frozen water, no flow measurement. F: Flow rate to low, no flow measurement. G: Dry conditions, no measurements or samples.
3.5 Results 3.5.1 General The surface water investigation period from January to December 2016 includes 68 water samples and 92 field loggings of measurements from the regular sampling locations in streams, lakes and sea including the samples from Lake Biotestsjön. Furthermore, the accompanying field documentation is quite extensive. The data are compiled in the attached Appendices and stored in the Sicada database where they are traceable by the activity plan number.
Fresh waters in the Forsmark area are well buffered with high alkalinity, high pH and high calcium concentrations. In addition, waters affected or recently affected by brackish sea water still show high sodium chloride concentrations. The relationship between the position of the coastline and the salinity of the water samples collected at the sampling locations in the area has been demonstrated in Nilsson et al. (2003). Furthermore, a detailed evaluation of surface water data from March 2002 to March 2004 was presented in Sonesten (2005). A summary of the results from the surface water monitoring during 2005–2009 is available in Nilsson et al. (2010).
The results presented and compiled in this section are restricted to field work performed between January and December 2016.
3.5.2 Water analysesMajor componentsThe basic water analyses include the major constituents Na, K, Ca, Mg, Sr, S, SO4
2−, Cl−, Si and alkalinity as well as the minor constituents Fe, Li, Mn, Br, F−, and I. Furthermore, batch measurements of pH and EC are included. The basic water analysis data are compiled together with field measure-ments of pH and water temperature in Appendix 3.
28 SKB P-17-41
The charge balance errors, see section 2.5.2 for calculation formula, give an indication of the quality and uncertainty of the analyses of major constituents. All samples were within the acceptable errors for surface water (± 10 %).
Surface water supplementsThe surface water supplements include NH4-N, NO2-N, NO3-N+NO2-N, NO3-N, tot-N, tot-P, PO4-P, TOC, DOC and DIC. The analytical data are compiled in Appendix 3. The DIC values should be used with care and bicarbonate values, by alkalinity titration, are considered more reliable.
IsotopesThe isotope data including the stable isotopes δD, δ18O, as well as the radioactive isotope tritium (3H) are compiled in Appendix 3.
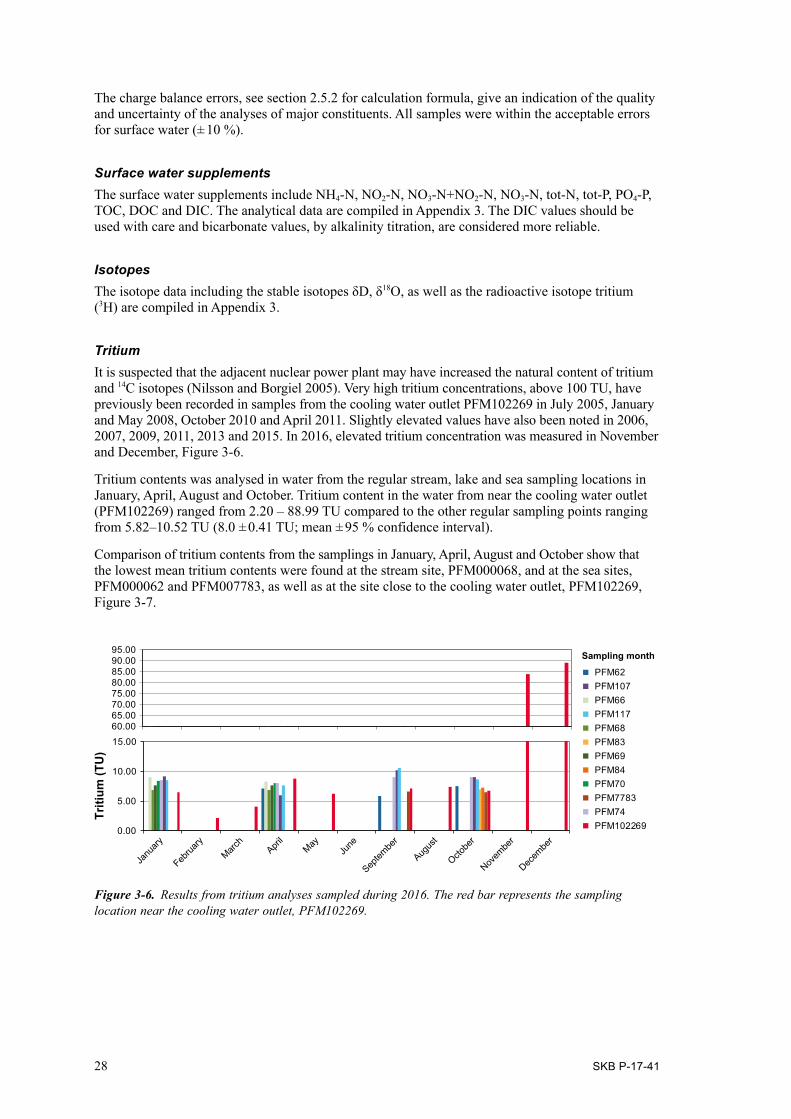
TritiumIt is suspected that the adjacent nuclear power plant may have increased the natural content of tritium and 14C isotopes (Nilsson and Borgiel 2005). Very high tritium concentrations, above 100 TU, have previously been recorded in samples from the cooling water outlet PFM102269 in July 2005, January and May 2008, October 2010 and April 2011. Slightly elevated values have also been noted in 2006, 2007, 2009, 2011, 2013 and 2015. In 2016, elevated tritium concentration was measured in November and December, Figure 3-6.
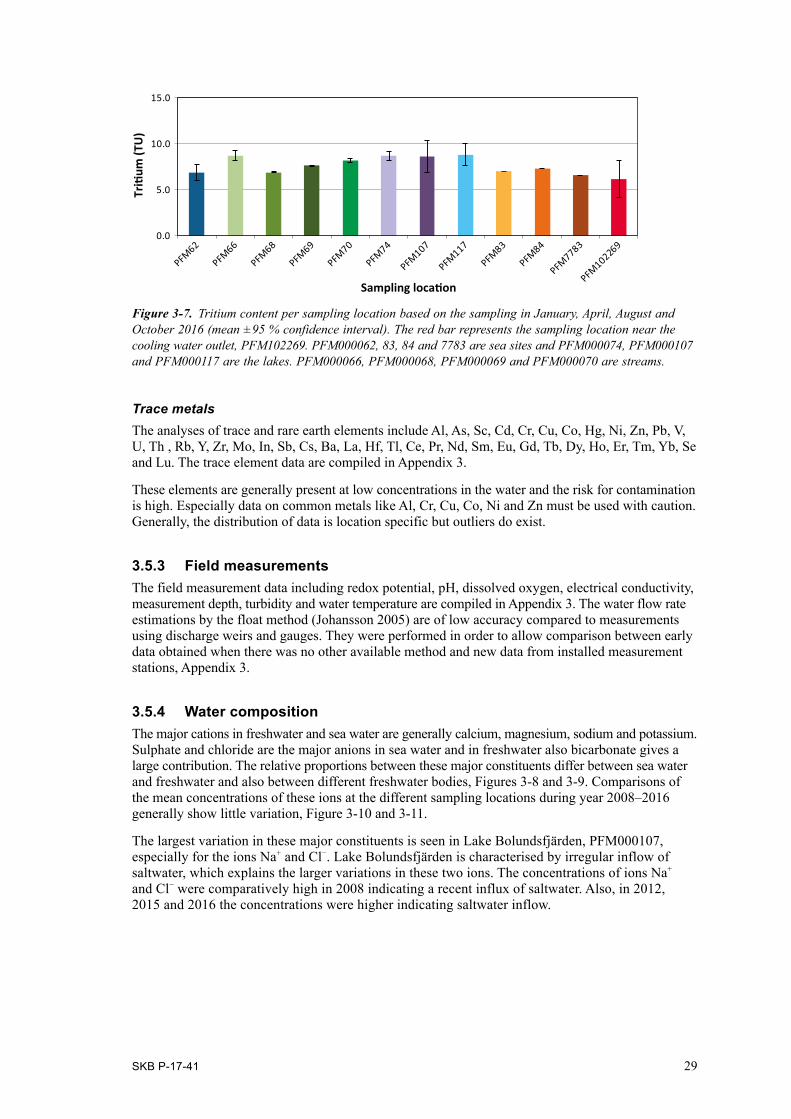
Tritium contents was analysed in water from the regular stream, lake and sea sampling locations in January, April, August and October. Tritium content in the water from near the cooling water outlet (PFM102269) ranged from 2.20 – 88.99 TU compared to the other regular sampling points ranging from 5.82–10.52 TU (8.0 ± 0.41 TU; mean ± 95 % confidence interval).
Comparison of tritium contents from the samplings in January, April, August and October show that the lowest mean tritium contents were found at the stream site, PFM000068, and at the sea sites, PFM000062 and PFM007783, as well as at the site close to the cooling water outlet, PFM102269, Figure 3-7.
Figure 3-6. Results from tritium analyses sampled during 2016. The red bar represents the sampling location near the cooling water outlet, PFM102269.
60.0065.0070.0075.0080.0085.0090.0095.00
Sampling month
0.00
5.00
10.00
15.00
Triti
um (T
U)
Sampling month
PFM62
PFM66
PFM68
PFM69
PFM70
PFM74
PFM107
PFM117
PFM83
PFM84
PFM7783
PFM102269
Janu
ary
Februa
ryMarc
hApri
lMay
June
Augus
t
Septem
ber
Octobe
r
Novem
ber
Decem
ber
SKB P-17-41 29
Trace metalsThe analyses of trace and rare earth elements include Al, As, Sc, Cd, Cr, Cu, Co, Hg, Ni, Zn, Pb, V, U, Th , Rb, Y, Zr, Mo, In, Sb, Cs, Ba, La, Hf, Tl, Ce, Pr, Nd, Sm, Eu, Gd, Tb, Dy, Ho, Er, Tm, Yb, Se and Lu. The trace element data are compiled in Appendix 3.
These elements are generally present at low concentrations in the water and the risk for contamination is high. Especially data on common metals like Al, Cr, Cu, Co, Ni and Zn must be used with caution. Generally, the distribution of data is location specific but outliers do exist.
3.5.3 Field measurementsThe field measurement data including redox potential, pH, dissolved oxygen, electrical conductivity, measurement depth, turbidity and water temperature are compiled in Appendix 3. The water flow rate estimations by the float method (Johansson 2005) are of low accuracy compared to measurements using discharge weirs and gauges. They were performed in order to allow comparison between early data obtained when there was no other available method and new data from installed measurement stations, Appendix 3.
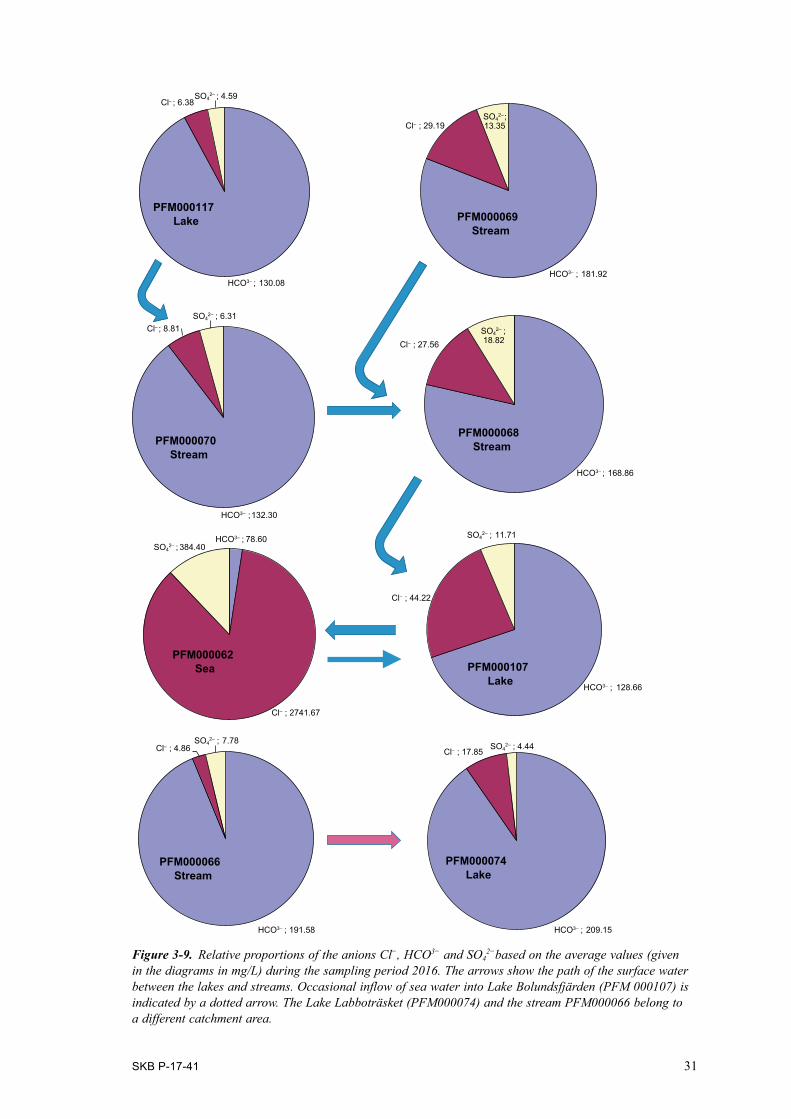
3.5.4 Water composition The major cations in freshwater and sea water are generally calcium, magnesium, sodium and potassium. Sulphate and chloride are the major anions in sea water and in freshwater also bicarbonate gives a large contribution. The relative proportions between these major constituents differ between sea water and freshwater and also between different freshwater bodies, Figures 3-8 and 3-9. Comparisons of the mean concentrations of these ions at the different sampling locations during year 2008–2016 generally show little variation, Figure 3-10 and 3-11.
The largest variation in these major constituents is seen in Lake Bolundsfjärden, PFM000107, especially for the ions Na+ and Cl−. Lake Bolundsfjärden is characterised by irregular inflow of saltwater, which explains the larger variations in these two ions. The concentrations of ions Na+ and Cl− were comparatively high in 2008 indicating a recent influx of saltwater. Also, in 2012, 2015 and 2016 the concentrations were higher indicating saltwater inflow.
Figure 3-7. Tritium content per sampling location based on the sampling in January, April, August and October 2016 (mean ± 95 % confidence interval). The red bar represents the sampling location near the cooling water outlet, PFM102269. PFM000062, 83, 84 and 7783 are sea sites and PFM000074, PFM000107 and PFM000117 are the lakes. PFM000066, PFM000068, PFM000069 and PFM000070 are streams.
0.0
5.0
10.0
15.0
Tri�
um (T
U)
Sampling loca�on

30 SKB P-17-41
Figure 3-8. Relative proportions of the cations Na+, K+, Ca2+, Mg2+ based on average values during the sampling period 2016. The average values (mg/L) are displayed behind each cation in the diagrams. The arrows show the path of the surface water between the lakes and streams. Occasional inflow of sea water into Lake Bolundsfjärden (PFM 000107) is indicated by a dashed arrow. The Lake Labboträsket (PFM000074) and the stream PFM000066 belong to a different catchment area.
Na; 1520.00
K; 55.10
Ca; 75.03 Mg; 170.00
PFM000062Sea
Na; 6.77K; 2.14
Ca; 42.08
Mg; 2.74
PFM000117Lake
Na; 12.96
K; 1.89
Ca; 68.63
Mg; 3.85
PFM000074Lake
Na; 29.08
K ; 2.80
Ca ; 43.80
Mg; 5.74
PFM000107Lake
Na; 5.63
K; 2.37
Ca; 64.68
Mg; 3.13
PFM000066Stream
Na; 17.93
K ; 2.39
Ca; 62.14
Mg; 4.92
PFM000068Stream
Na; 19.00
K; 2.20
Ca; 63.40
Mg; 4.99
PFM000069Stream
Na; 7.76
K; 1.88
Ca; 45.39
Mg; 2.76
PFM000070Stream
SKB P-17-41 31
Figure 3-9. Relative proportions of the anions Cl−, HCO3− and SO42−based on the average values (given
in the diagrams in mg/L) during the sampling period 2016. The arrows show the path of the surface water between the lakes and streams. Occasional inflow of sea water into Lake Bolundsfjärden (PFM 000107) is indicated by a dotted arrow. The Lake Labboträsket (PFM000074) and the stream PFM000066 belong to a different catchment area.
HCO3– ; 78.60
Cl– ; 2741.67
SO42– ; 384.40
PFM000062Sea
; 130.08
Cl– ; 6.38SO4
2– ; 4.59
PFM000117Lake
HCO3– ; 209.15
Cl– ; 17.85 SO42– ; 4.44
PFM000074Lake
HCO3– ; 128.66
Cl– ; 44.22
SO42– ; 11.71
PFM000107Lake
HCO3– ; 191.58
Cl– ; 4.86SO4
2– ; 7.78
PFM000066Stream
; 168.86
Cl– ; 27.56SO4
2– ; 18.82
PFM000068Stream
; 181.92
Cl– ; 29.19SO4
2–; 13.35
PFM000069Stream
HCO3– ; 132.30
Cl– ; 8.81SO4
2– ; 6.31
PFM000070Stream
HCO3–
HCO3–HCO3–

32 SKB P-17-41
Figure 3-11. Mean concentrations of the anions Cl−, HCO3− and SO42− during the years 2008–2016 at
the sampling locations in the three lakes (PFM000074, PFM000107 and PFM000117) the four streams (PFM000066, PFM000068, PFM000069 and PFM000070) and the sea (PFM000062).
PFM000117
PFM000074PFM000107
PFM000066PFM000068PFM000069PFM000070
PFM000062
0500
1 0001 5002 0002 5003 000
0
25
50
75
100
mg/
L (P
FM00
0062
)
mg/
L
Cl–
0
25
50
75
100
050100150200250300
mg/
L (P
FM00
0062
)
mg/
L
HCO3–
0
100
200
300
400
500
0
10
20
30
mg/
L (P
FM00
0062
)
mg/
L
SO42–
PFM000117
PFM000074PFM000107
PFM000066PFM000068PFM000069PFM000070
PFM000062
010203040506070
0
1
2
3
4
5
mg/
L (P
FM00
0062
)
mg/
L
K+
0
500
1 000
1 500
2 000
05101520253035404550
mg/
L (P
FM00
0062
)
mg/
L
Na+
0
20
40
60
80
100
0102030405060708090100
mg/
L (P
FM00
0062
)
mg/
L
Ca2+
020406080
100120140160180200
0
2
4
6
8
10
mg/
L (P
FM00
0062
)
mg/
L
Mg2+
Figure 3-10. Mean concentrations of the cations Na+, K+, Ca2+, Mg2+ during the years 2008–2016 at the sampling locations in the three lakes (PFM000074, PFM000107 and PFM000117) the four streams (PFM000066, PFM000068, PFM000069 and PFM000070) and the sea (PFM000062).

SKB P-17-41 33
Figure 3-12. Field measurements at site PFM000068.
3.5.5 The NP-ratio in the surface waterThe nutrients, nitrogen and phosphorus, are often the limiting factors for the primary production. Primary producers, such as plants and phytoplankton, use nitrogen and phosphorus in a ratio of about 16 mol nitrogen to 1 mol phosphorous, also known as the Redfield ratio, or 7:1 in terms of mass. A ratio deviating from 16 (or 7) indicates that the primary production is limited by either nitrogen or phosphorus. When nitrogen is present in excess the ratio will be higher than 16, indicating that lack of phosphorus is limiting the growth. Whereas lower ratios indicate nitrogen limitations, which may favour growth of blue green algae able to use nitrogen from the air. In fresh water, phosphorus is usually the limiting nutrient whereas in the oceans it is usually nitrogen.
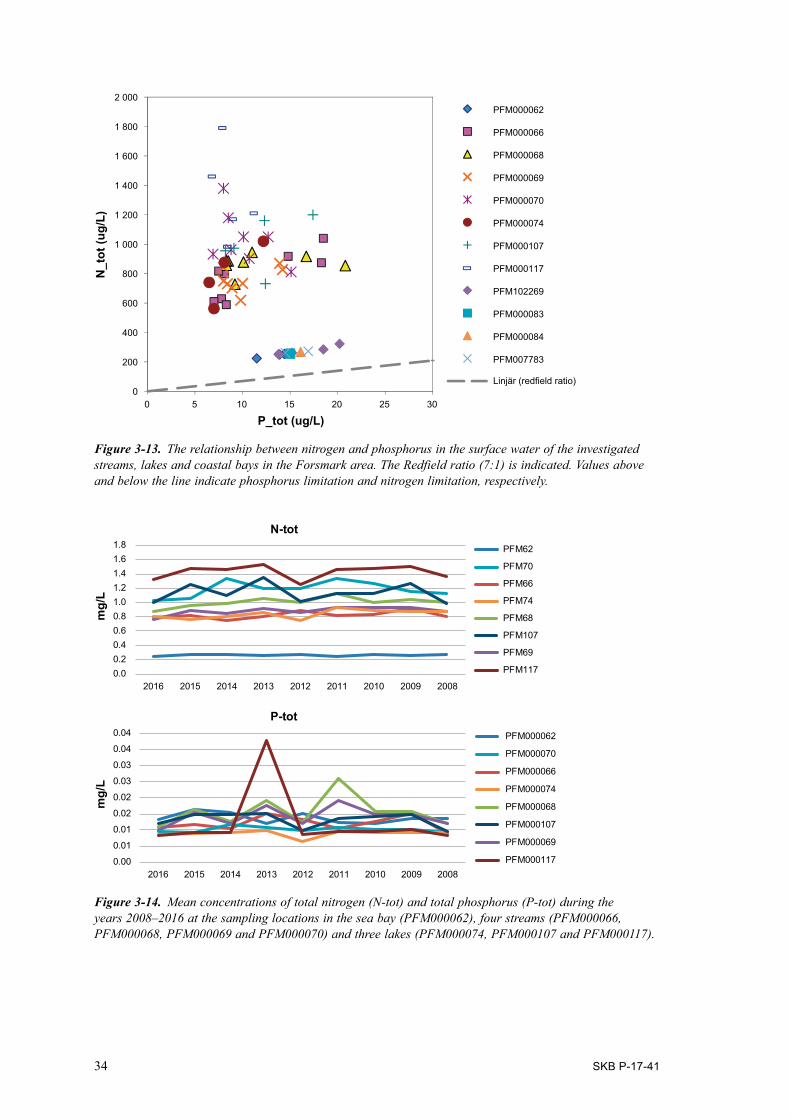
Figure 3-13 shows the relationship between nitrogen and phosphorous in the surface water of the investigated streams, lakes and coastal bays in the Forsmark area. The lakes and streams are phos-phorus limited with high concentrations of nitrogen. The coastal bays in the Baltic Sea, PFM000062, PFM000083, PFM000084 and PFM007783 are also phosphorous limited although the ratio is much lower.
Comparisons of the mean concentrations of total nitrogen and total phosphorus during years 2008–2016 generally show little variation between years, Figure 3-14. The largest variation is seen for phosphorus in Lake Eckarfjärden, PFM000117, but there is no increasing or decreasing trend over the years.
34 SKB P-17-41
0
200
400
600
800
1 000
1 200
1 400
1 600
1 800
2 000
0 5 10 15 20 25 30
N_t
ot (u
g/L)
P_tot (ug/L)
Linjär (redfield ratio)
PFM000062
PFM000066
PFM000068
PFM000069
PFM000070
PFM000074
PFM000107
PFM000117
PFM102269
PFM000083
PFM000084
PFM007783
Figure 3-13. The relationship between nitrogen and phosphorus in the surface water of the investigated streams, lakes and coastal bays in the Forsmark area. The Redfield ratio (7:1) is indicated. Values above and below the line indicate phosphorus limitation and nitrogen limitation, respectively.
Figure 3-14. Mean concentrations of total nitrogen (N-tot) and total phosphorus (P-tot) during the years 2008–2016 at the sampling locations in the sea bay (PFM000062), four streams (PFM000066, PFM000068, PFM000069 and PFM000070) and three lakes (PFM000074, PFM000107 and PFM000117).
0.00
0.01
0.01
0.02
0.02
0.03
0.03
0.04
0.04
2016 2015 2014 2013 2012 2011 2010 2009 2008
mg/
L
P-totPFM000062
PFM000066
PFM000068
PFM000069
PFM000070
PFM000074
PFM000107
PFM000117
0.00.20.40.60.81.01.21.41.61.8
2016 2015 2014 2013 2012 2011 2010 2009 2008
mg/
L
N-totPFM62
PFM66
PFM68
PFM69
PFM70
PFM74
PFM107
PFM117
SKB P-17-41 35
3.6 Summary and discussionThe chemical investigation routines for surface waters are well established and this period of the long-term surface water monitoring programme has passed without any major nonconformities or surprises.
The main experiences and conclusions from surface water sampling and analyses during the sampling period January to December 2016 are summarised below:
• Previous data indicates periodic tritium contamination from the adjacent nuclear power plant in water samples from near the cooling water outlet. In 2016, elevated tritium concentration was measured in November and December.
• The proportions of the major ions in the sampled freshwaters and the shallow sea bay were similar to previous years. However, in 2015 and 2016 the concentration of Na+ and Cl− in Lake Bolundsfjärden, PFM000107, were higher compared to 2013 and 2014, indicating saltwater inflows.
• The concentrations of total nitrogen and total phosphorus in the sampled freshwaters and shallow sea bay were similar to previous years.


SKB P-17-41 37
References
SKB’s (Svensk Kärnbränslehantering AB) publications can be found at www.skb.com/publications.
Johansson P-O, 2005. Forsmark site investigation. Manual discharge measurements in brooks, April 2002 – April 2005. SKB P-05-153, Svensk Kärnbränslehantering AB.
Nilsson A-C, Borgiel M, 2005. Forsmark site investigation. Sampling and analyses of surface waters. Results from sampling in the Forsmark area, March 2004 – June 2005. SKB P-05-274, Svensk Kärnbränslehantering AB.
Nilsson A-C, Karlsson S, Borgiel M, 2003. Forsmark site investigation. Sampling and analyses of surface waters. Results from sampling in the Forsmark area, March 2002 to March 2003. SKB P-03-27, Svensk Kärnbränslehantering AB.
Nilsson A-C (ed), Berg C, Harrström J, Jönsson S, Thur P, Borgiel M, Qvarfordt S, 2010. Forsmark site investigation. Hydrochemical monitoring of groundwaters and surface waters. Results from water sampling in the Forsmark area, January–December 2009. SKB P-10-40, Svensk Kärnbränslehantering AB.
SKB, 2001. Site investigations. Investigation methods and general execution programme. SKB TR-01-29, Svensk Kärnbränslehantering AB.
SKB, 2005. Forsmark site investigation. Programme for further investigations of geosphere and biosphere. SKB R-05-14, Svensk Kärnbränslehantering AB.
SKB, 2007. Forsmark site investigation. Programme for long-term observations of geosphere and biosphere after completed site investigations. SKB R-07-34, Svensk Kärnbränslehantering AB.
Sonesten L, 2005. Chemical characteristics of surface waters in the Forsmark area. Evaluation of surface water chemistry data from the Forsmark area. SKB R-05-41, Svensk Kärnbränslehantering AB.


SKB P-17-41 39
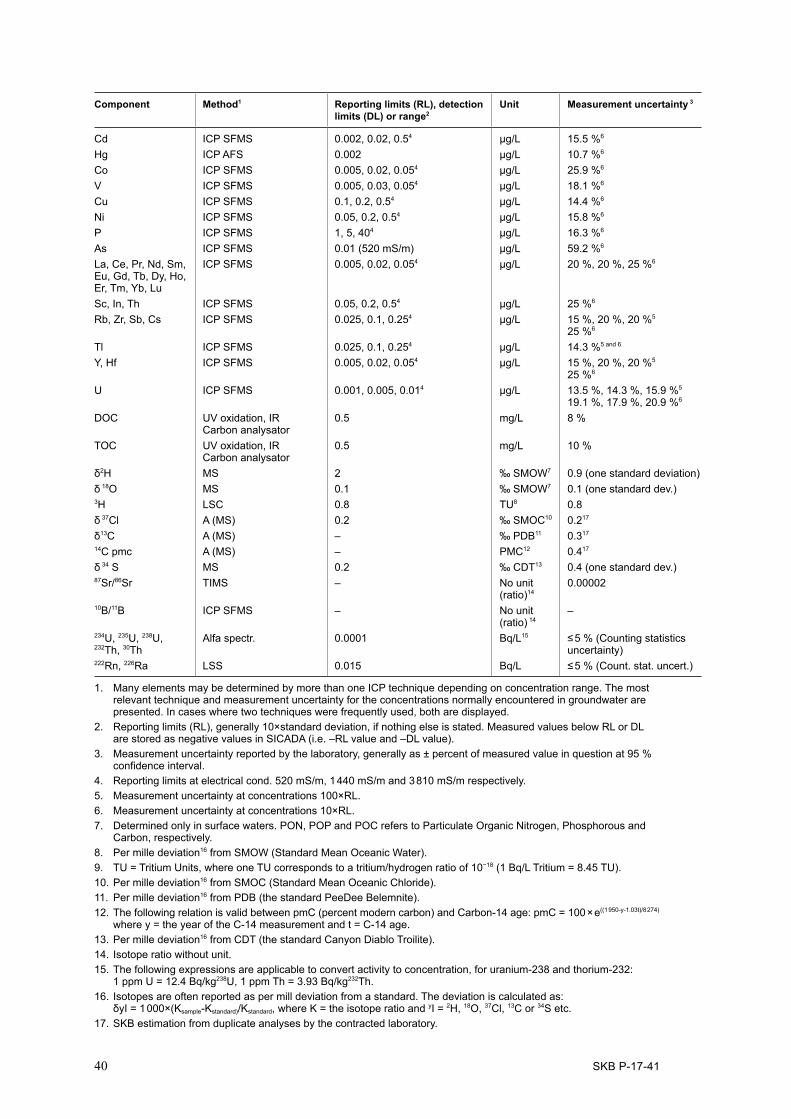
Appendix 1
Sampling and analytical methods Component Method1 Reporting limits (RL), detection
limits (DL) or range2Unit Measurement uncertainty 3
pH Potentiometric 3–10 pH unit ± 0.1EC Electrical Conductivity
meas.2–150 150–10 000
mS/m 5 % 3 %
HCO3 Alkalinity titration 2 mg/L 4 %Cl− Cl−
Mohr-titration IC
≥ 70 0.5 – 70
mg/L 5 % 8 %
SO4 IC 0.5 mg/L 12 %Br− IC DL 0.2, RL 0.5 mg/L 15 %Br ICP SFMS 0.001, 0.004, 0.0104 mg/L 25 %5
F− F−
IC Potentiometric
DL 0.2, RL 0.5 DL 0.1, RL 0.2
mg/L 13 % 12 %
I− ICP SFMS 0.001, 0.004, 0.0104 mg/L 25 %5
Na ICP AES 0.1 mg/L 13 %K ICP AES 0.4 mg/L 12 %Ca ICP AES 0.1 mg/L 12 %Mg ICP AES 0.09 mg/L 12 %S(tot) ICP AES 0.16 mg/L 12 %Si(tot) ICP AES 0.03 mg/L 14 %Sr ICP AES 0.002 mg/L 12 %Li ICP AES 0.004 mg/L 12.2 %Fe ICP AES 0.02 mg/L 13.3 %6
Fe ICP SFMS 0.0004, 0.002, 0.0044 mg/L 20 %6
Mn ICP AES 0.003 mg/L 12.1 %5
Mn ICP SFMS 0.00003, 0.00004, 0.00014 mg/L 53 %6
Fe(II), Fe(tot) Spectrophotometry DL 0.006, RL 0.02 mg/L 0.005 (0.02–0.05 mg/L) 9 % (0.05–1 mg/L) 7 % (1–3 mg/L)
HS− Spectrophotometry, SKB SKB DL 0.006, RL 0.02 mg/L 25 %HS− Spectrophotometry,
external laboratory0.01 mg/L 0.02 (0.01–0.2 mg/L)
12 % (>0.2 mg/L)NO2 as N Spectrophotometry 0.1 μg/L 2 %NO3 as N Spectrophotometry 0.2 μg/L 5 %NO2+NO3 as N Spectrophotometry 0.2 μg/L 0.2 (0.2–20 μg/L)
2 % (> 20 μg/L)NH4 as N Spectrophotometry, SKB 11 μg/L 30 % (11–20 μg/L)
25 % (20–50 μg/L) 12 % (50–1 200 μg/L)
NH4 as N Spectrophotometry external laboratory
0.8 μg/L 0.8 (0.8–20 μg/L) 5 % (> 20 μg/L)
PO4 as P Spectrophotometry 0.7 μg/L 0.7 (0.7–20 μg/L) 3 % (> 20 μg/L)
SiO4 Spectrophotometry 1 μg/L 2.5 % (>100 μg/L)O2 Iodometric titration 0.2 – 20 mg/L 5 %Chlorophyll a, c pheopigment7
/1/ 0.5 μg/L 5 %
Component Method1 Reporting limits (RL), detection limits (DL) or range2
Unit Measurement uncertainty 3
PON7 /1/ 0.5 μg/L 5 %POP7 /1/ 0.1 μg/L 5 %POC7 /1/ 1 μg/L 4 %Tot-N7 /1/ 10 μg/L 4 %Tot-P7 /1/ 0.5 μg/L 6 %Al, ICP SFMS 0.2, 0.3, 0.74 μg/L 17.6 %6
Zn ICP SFMS 0.2, 0.8, 24 μg/L 15.5, 17.7, 25.5 %6 Ba, Cr, Mo, ICP SFMS 0.01, 0.04, 0.14 μg/L Ba 15 %4, Cr 22 %5
Mo 39 %6
Pb ICP SFMS 0.01, 0.1, 0.34 μg/L 15 %6
40 SKB P-17-41
Component Method1 Reporting limits (RL), detection limits (DL) or range2
Unit Measurement uncertainty 3
Cd ICP SFMS 0.002, 0.02, 0.54 μg/L 15.5 %6
Hg ICP AFS 0.002 μg/L 10.7 %6
Co ICP SFMS 0.005, 0.02, 0.054 μg/L 25.9 %6 V ICP SFMS 0.005, 0.03, 0.054 μg/L 18.1 %6
Cu ICP SFMS 0.1, 0.2, 0.54 μg/L 14.4 %6
Ni ICP SFMS 0.05, 0.2, 0.54 μg/L 15.8 %6
P ICP SFMS 1, 5, 404 μg/L 16.3 %6
As ICP SFMS 0.01 (520 mS/m) μg/L 59.2 %6
La, Ce, Pr, Nd, Sm, Eu, Gd, Tb, Dy, Ho, Er, Tm, Yb, Lu
ICP SFMS 0.005, 0.02, 0.054 μg/L 20 %, 20 %, 25 %6
Sc, In, Th ICP SFMS 0.05, 0.2, 0.54 μg/L 25 %6
Rb, Zr, Sb, Cs ICP SFMS 0.025, 0.1, 0.254 μg/L 15 %, 20 %, 20 %5
25 %6
Tl ICP SFMS 0.025, 0.1, 0.254 μg/L 14.3 %5 and 6
Y, Hf ICP SFMS 0.005, 0.02, 0.054 μg/L 15 %, 20 %, 20 %5
25 %6
U ICP SFMS 0.001, 0.005, 0.014 μg/L 13.5 %, 14.3 %, 15.9 %5
19.1 %, 17.9 %, 20.9 %6
DOC UV oxidation, IR Carbon analysator
0.5 mg/L 8 %
TOC UV oxidation, IR Carbon analysator
0.5 mg/L 10 %
δ2H MS 2 ‰ SMOW7 0.9 (one standard deviation)δ 18O MS 0.1 ‰ SMOW7 0.1 (one standard dev.)3H LSC 0.8 TU8 0.8 δ 37Cl A (MS) 0.2 ‰ SMOC10 0.217
δ13C A (MS) – ‰ PDB11 0.317
14C pmc A (MS) – PMC12 0.417
δ 34 S MS 0.2 ‰ CDT13 0.4 (one standard dev.)87Sr/86Sr TIMS – No unit
(ratio)140.00002
10B/11B ICP SFMS – No unit (ratio) 14
–
234U, 235U, 238U, 232Th, 30Th
Alfa spectr. 0.0001 Bq/L15 ≤ 5 % (Counting statistics uncertainty)
222Rn, 226Ra LSS 0.015 Bq/L ≤ 5 % (Count. stat. uncert.)
1. Many elements may be determined by more than one ICP technique depending on concentration range. The most relevant technique and measurement uncertainty for the concentrations normally encountered in groundwater are presented. In cases where two techniques were frequently used, both are displayed.
2. Reporting limits (RL), generally 10×standard deviation, if nothing else is stated. Measured values below RL or DL are stored as negative values in SICADA (i.e. –RL value and –DL value).
3. Measurement uncertainty reported by the laboratory, generally as ± percent of measured value in question at 95 % confidence interval.
4. Reporting limits at electrical cond. 520 mS/m, 1 440 mS/m and 3 810 mS/m respectively.5. Measurement uncertainty at concentrations 100×RL.6. Measurement uncertainty at concentrations 10×RL.7. Determined only in surface waters. PON, POP and POC refers to Particulate Organic Nitrogen, Phosphorous and
Carbon, respectively. 8. Per mille deviation16 from SMOW (Standard Mean Oceanic Water). 9. TU = Tritium Units, where one TU corresponds to a tritium/hydrogen ratio of 10−18 (1 Bq/L Tritium = 8.45 TU).10. Per mille deviation16 from SMOC (Standard Mean Oceanic Chloride).11. Per mille deviation16 from PDB (the standard PeeDee Belemnite).12. The following relation is valid between pmC (percent modern carbon) and Carbon-14 age: pmC = 100 × e((1 950-y-1.03t)/8 274)
where y = the year of the C-14 measurement and t = C-14 age.13. Per mille deviation16 from CDT (the standard Canyon Diablo Troilite).14. Isotope ratio without unit.15. The following expressions are applicable to convert activity to concentration, for uranium-238 and thorium-232:
1 ppm U = 12.4 Bq/kg238U, 1 ppm Th = 3.93 Bq/kg232Th.16. Isotopes are often reported as per mill deviation from a standard. The deviation is calculated as:
δyI = 1 000×(Ksample-Kstandard)/Kstandard, where K = the isotope ratio and yI = 2H, 18O, 37Cl, 13C or 34S etc. 17. SKB estimation from duplicate analyses by the contracted laboratory.

SKB P-17-41 41
Appendix 2
Near surface groundwater
Table A2-1. Field measurements.
Idcode Measuring date yyyy/mm/dd hh:mm
Sample no
Water temp. (°C)
pH EC (mS/m)
ORP (mV)
O2 diss. (mg/L)
Oxygen (%)
SFM0001 2016/01/20 09:10 30712 6.05 7.21 219.2 −180 −0.16 −1.3SFM0001 2016/04/19 15:15 30754 5.03 7.19 133.7 −240 0.06 0.5SFM0001 2016/08/08 11:30 30896 8.20 7.27 198.3 −260 −0.01 −0.1SFM0001 2016/10/14 10:04 30934 8.59 7.29 207.4 −190 0.13 1.1SFM0002 2016/08/12 11:45 30902 9.68 7.04 71.8 −140 0.01 0.1SFM0002 2016/10/14 10:44 30935 9.39 7.05 72.2 −90 0.53 4.7SFM0011 2016/08/11 12:37 30901 8.69 7.48 620.7 −110 0.00 0.0SFM0011 2016/10/12 15:32 30931 8.66 7.44 635.3 −100 0.08 0.7SFM0023 2016/01/21 09:00 30714 6.60 8.27 212.5 −260 0.03 0.3SFM0032 2016/01/20 12:05 30713 4.22 7.16 84.5 −130 −0.16 −1.2SFM0032 2016/04/20 14:35 30755 4.45 7.14 80.8 −170 0.77 6.1SFM0032 2016/08/08 15:45 30898 11.07 6.93 80.6 −240 −0.02 −0.2SFM0032 2016/10/13 14:48 30933 9.47 7.00 86.8 −150 0.01 0.1SFM0037 2016/01/19 10:54 30710 1.93 6.68 64.3 −150 0.22 1.6SFM0037 2016/04/19 09:49 30753 5.20 7.01 70.8 −100 1.07 9.0SFM0037 2016/08/08 17:44 30899 11.77 6.94 125.2 −120 2.28 21.3SFM0037 2016/10/12 10:16 30930 9.47 6.94 129.5 −90 0.73 6.4SFM0049 2016/01/19 14:00 30711 3.58 6.93 46.2 −210 −0.19 −1.4SFM0049 2016/04/18 15:43 30752 3.63 6.91 35.7 −160 0.13 1.0SFM0049 2016/08/08 14:17 30897 12.10 6.71 47.8 −260 −0.01 −0.1SFM0049 2016/10/13 11:08 30932 10.97 6.79 42.6 −190 0.06 0.5SFM0057 2016/08/11 10:09 30900 8.13 6.97 57.7 −30 −0.01 −0.1SFM0057 2016/10/11 15:10 30929 8.93 6.88 64.4 80 0.10 0.8
42 S
KB
P-17-41
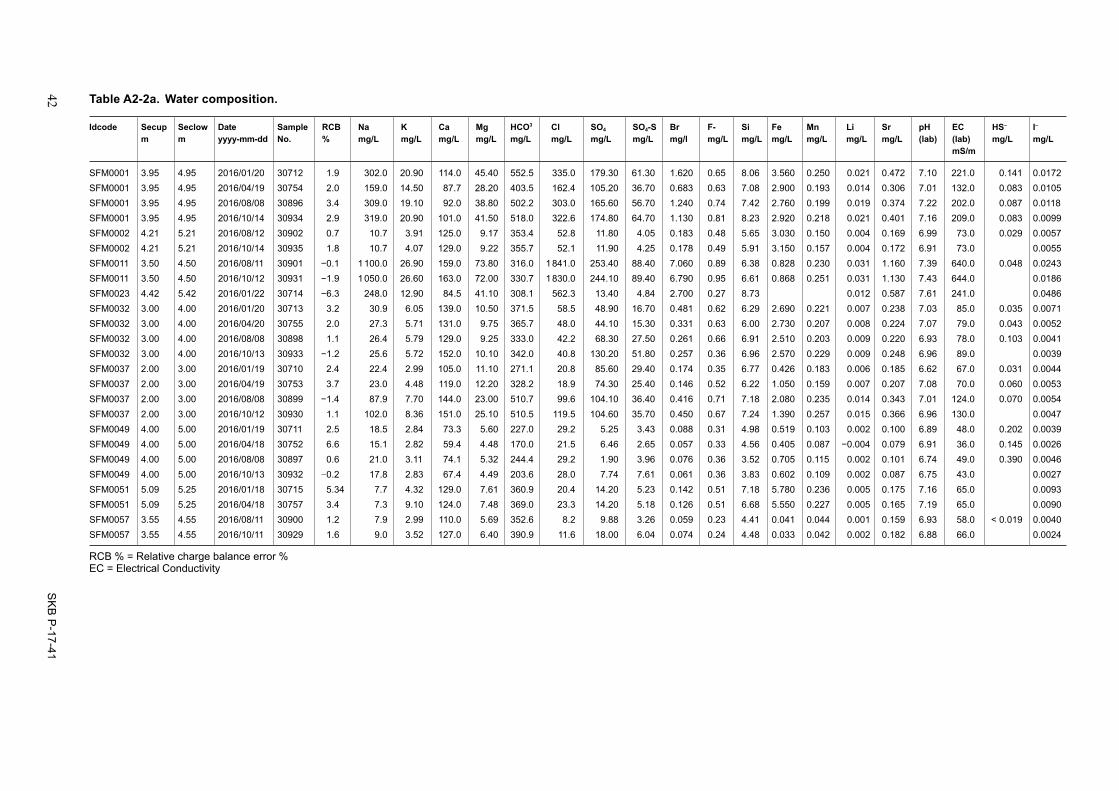
Table A2-2a. Water composition.
Idcode Secup m
Seclow m
Date yyyy-mm-dd
Sample No.
RCB %
Na mg/L
K mg/L
Ca mg/L
Mg mg/L
HCO3 mg/L
Cl mg/L
SO4 mg/L
SO4-S mg/L
Br mg/l
F- mg/L
Si mg/L
Fe mg/L
Mn mg/L
Li mg/L
Sr mg/L
pH (lab)
EC (lab) mS/m
HS– mg/L
I– mg/L
SFM0001 3.95 4.95 2016/01/20 30712 1.9 302.0 20.90 114.0 45.40 552.5 335.0 179.30 61.30 1.620 0.65 8.06 3.560 0.250 0.021 0.472 7.10 221.0 0.141 0.0172SFM0001 3.95 4.95 2016/04/19 30754 2.0 159.0 14.50 87.7 28.20 403.5 162.4 105.20 36.70 0.683 0.63 7.08 2.900 0.193 0.014 0.306 7.01 132.0 0.083 0.0105SFM0001 3.95 4.95 2016/08/08 30896 3.4 309.0 19.10 92.0 38.80 502.2 303.0 165.60 56.70 1.240 0.74 7.42 2.760 0.199 0.019 0.374 7.22 202.0 0.087 0.0118SFM0001 3.95 4.95 2016/10/14 30934 2.9 319.0 20.90 101.0 41.50 518.0 322.6 174.80 64.70 1.130 0.81 8.23 2.920 0.218 0.021 0.401 7.16 209.0 0.083 0.0099SFM0002 4.21 5.21 2016/08/12 30902 0.7 10.7 3.91 125.0 9.17 353.4 52.8 11.80 4.05 0.183 0.48 5.65 3.030 0.150 0.004 0.169 6.99 73.0 0.029 0.0057SFM0002 4.21 5.21 2016/10/14 30935 1.8 10.7 4.07 129.0 9.22 355.7 52.1 11.90 4.25 0.178 0.49 5.91 3.150 0.157 0.004 0.172 6.91 73.0 0.0055SFM0011 3.50 4.50 2016/08/11 30901 −0.1 1 100.0 26.90 159.0 73.80 316.0 1 841.0 253.40 88.40 7.060 0.89 6.38 0.828 0.230 0.031 1.160 7.39 640.0 0.048 0.0243SFM0011 3.50 4.50 2016/10/12 30931 −1.9 1 050.0 26.60 163.0 72.00 330.7 1 830.0 244.10 89.40 6.790 0.95 6.61 0.868 0.251 0.031 1.130 7.43 644.0 0.0186SFM0023 4.42 5.42 2016/01/22 30714 −6.3 248.0 12.90 84.5 41.10 308.1 562.3 13.40 4.84 2.700 0.27 8.73 0.012 0.587 7.61 241.0 0.0486SFM0032 3.00 4.00 2016/01/20 30713 3.2 30.9 6.05 139.0 10.50 371.5 58.5 48.90 16.70 0.481 0.62 6.29 2.690 0.221 0.007 0.238 7.03 85.0 0.035 0.0071SFM0032 3.00 4.00 2016/04/20 30755 2.0 27.3 5.71 131.0 9.75 365.7 48.0 44.10 15.30 0.331 0.63 6.00 2.730 0.207 0.008 0.224 7.07 79.0 0.043 0.0052SFM0032 3.00 4.00 2016/08/08 30898 1.1 26.4 5.79 129.0 9.25 333.0 42.2 68.30 27.50 0.261 0.66 6.91 2.510 0.203 0.009 0.220 6.93 78.0 0.103 0.0041SFM0032 3.00 4.00 2016/10/13 30933 −1.2 25.6 5.72 152.0 10.10 342.0 40.8 130.20 51.80 0.257 0.36 6.96 2.570 0.229 0.009 0.248 6.96 89.0 0.0039SFM0037 2.00 3.00 2016/01/19 30710 2.4 22.4 2.99 105.0 11.10 271.1 20.8 85.60 29.40 0.174 0.35 6.77 0.426 0.183 0.006 0.185 6.62 67.0 0.031 0.0044SFM0037 2.00 3.00 2016/04/19 30753 3.7 23.0 4.48 119.0 12.20 328.2 18.9 74.30 25.40 0.146 0.52 6.22 1.050 0.159 0.007 0.207 7.08 70.0 0.060 0.0053SFM0037 2.00 3.00 2016/08/08 30899 −1.4 87.9 7.70 144.0 23.00 510.7 99.6 104.10 36.40 0.416 0.71 7.18 2.080 0.235 0.014 0.343 7.01 124.0 0.070 0.0054SFM0037 2.00 3.00 2016/10/12 30930 1.1 102.0 8.36 151.0 25.10 510.5 119.5 104.60 35.70 0.450 0.67 7.24 1.390 0.257 0.015 0.366 6.96 130.0 0.0047SFM0049 4.00 5.00 2016/01/19 30711 2.5 18.5 2.84 73.3 5.60 227.0 29.2 5.25 3.43 0.088 0.31 4.98 0.519 0.103 0.002 0.100 6.89 48.0 0.202 0.0039SFM0049 4.00 5.00 2016/04/18 30752 6.6 15.1 2.82 59.4 4.48 170.0 21.5 6.46 2.65 0.057 0.33 4.56 0.405 0.087 −0.004 0.079 6.91 36.0 0.145 0.0026SFM0049 4.00 5.00 2016/08/08 30897 0.6 21.0 3.11 74.1 5.32 244.4 29.2 1.90 3.96 0.076 0.36 3.52 0.705 0.115 0.002 0.101 6.74 49.0 0.390 0.0046SFM0049 4.00 5.00 2016/10/13 30932 −0.2 17.8 2.83 67.4 4.49 203.6 28.0 7.74 7.61 0.061 0.36 3.83 0.602 0.109 0.002 0.087 6.75 43.0 0.0027SFM0051 5.09 5.25 2016/01/18 30715 5.34 7.7 4.32 129.0 7.61 360.9 20.4 14.20 5.23 0.142 0.51 7.18 5.780 0.236 0.005 0.175 7.16 65.0 0.0093SFM0051 5.09 5.25 2016/04/18 30757 3.4 7.3 9.10 124.0 7.48 369.0 23.3 14.20 5.18 0.126 0.51 6.68 5.550 0.227 0.005 0.165 7.19 65.0 0.0090SFM0057 3.55 4.55 2016/08/11 30900 1.2 7.9 2.99 110.0 5.69 352.6 8.2 9.88 3.26 0.059 0.23 4.41 0.041 0.044 0.001 0.159 6.93 58.0 < 0.019 0.0040SFM0057 3.55 4.55 2016/10/11 30929 1.6 9.0 3.52 127.0 6.40 390.9 11.6 18.00 6.04 0.074 0.24 4.48 0.033 0.042 0.002 0.182 6.88 66.0 0.0024
RCB % = Relative charge balance error % EC = Electrical Conductivity
SK
B P
-17-41 43
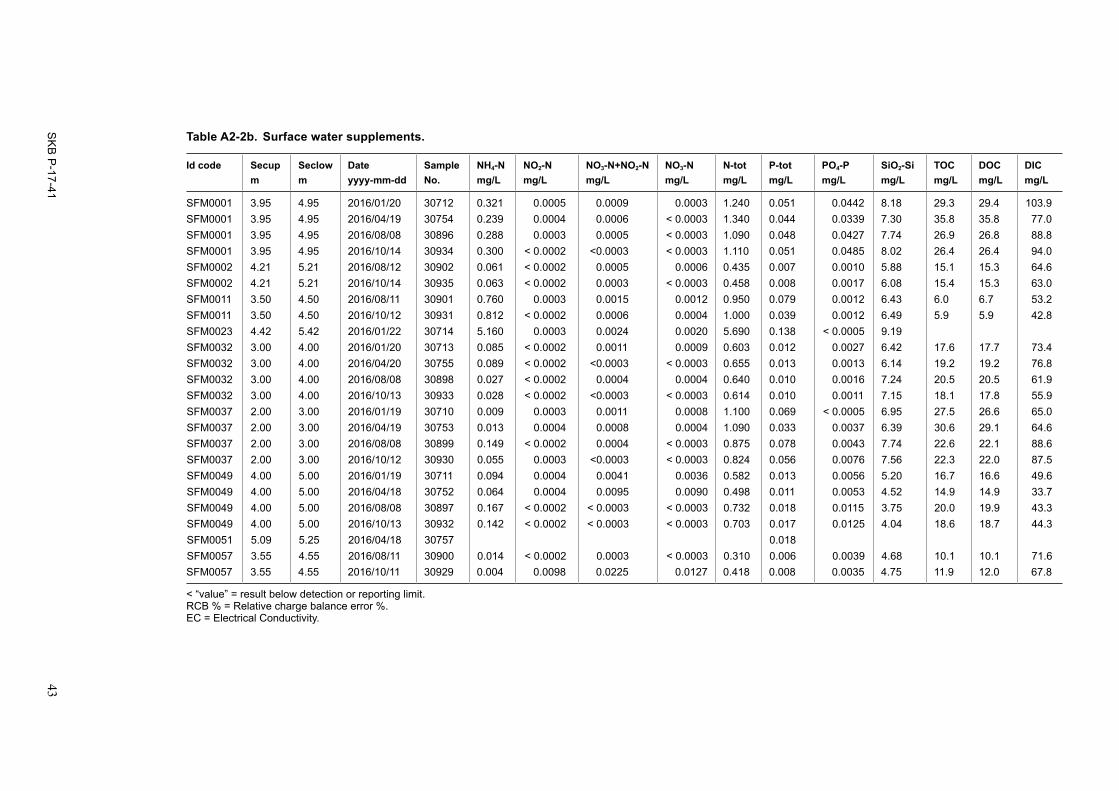
Table A2-2b. Surface water supplements.
Id code Secup Seclow Date Sample NH4-N NO2-N NO3-N+NO2-N NO3-N N-tot P-tot PO4-P SiO2-Si TOC DOC DICm m yyyy-mm-dd No. mg/L mg/L mg/L mg/L mg/L mg/L mg/L mg/L mg/L mg/L mg/L
SFM0001 3.95 4.95 2016/01/20 30712 0.321 0.0005 0.0009 0.0003 1.240 0.051 0.0442 8.18 29.3 29.4 103.9SFM0001 3.95 4.95 2016/04/19 30754 0.239 0.0004 0.0006 < 0.0003 1.340 0.044 0.0339 7.30 35.8 35.8 77.0SFM0001 3.95 4.95 2016/08/08 30896 0.288 0.0003 0.0005 < 0.0003 1.090 0.048 0.0427 7.74 26.9 26.8 88.8SFM0001 3.95 4.95 2016/10/14 30934 0.300 < 0.0002 <0.0003 < 0.0003 1.110 0.051 0.0485 8.02 26.4 26.4 94.0SFM0002 4.21 5.21 2016/08/12 30902 0.061 < 0.0002 0.0005 0.0006 0.435 0.007 0.0010 5.88 15.1 15.3 64.6SFM0002 4.21 5.21 2016/10/14 30935 0.063 < 0.0002 0.0003 < 0.0003 0.458 0.008 0.0017 6.08 15.4 15.3 63.0SFM0011 3.50 4.50 2016/08/11 30901 0.760 0.0003 0.0015 0.0012 0.950 0.079 0.0012 6.43 6.0 6.7 53.2SFM0011 3.50 4.50 2016/10/12 30931 0.812 < 0.0002 0.0006 0.0004 1.000 0.039 0.0012 6.49 5.9 5.9 42.8SFM0023 4.42 5.42 2016/01/22 30714 5.160 0.0003 0.0024 0.0020 5.690 0.138 < 0.0005 9.19SFM0032 3.00 4.00 2016/01/20 30713 0.085 < 0.0002 0.0011 0.0009 0.603 0.012 0.0027 6.42 17.6 17.7 73.4SFM0032 3.00 4.00 2016/04/20 30755 0.089 < 0.0002 <0.0003 < 0.0003 0.655 0.013 0.0013 6.14 19.2 19.2 76.8SFM0032 3.00 4.00 2016/08/08 30898 0.027 < 0.0002 0.0004 0.0004 0.640 0.010 0.0016 7.24 20.5 20.5 61.9SFM0032 3.00 4.00 2016/10/13 30933 0.028 < 0.0002 <0.0003 < 0.0003 0.614 0.010 0.0011 7.15 18.1 17.8 55.9SFM0037 2.00 3.00 2016/01/19 30710 0.009 0.0003 0.0011 0.0008 1.100 0.069 < 0.0005 6.95 27.5 26.6 65.0SFM0037 2.00 3.00 2016/04/19 30753 0.013 0.0004 0.0008 0.0004 1.090 0.033 0.0037 6.39 30.6 29.1 64.6SFM0037 2.00 3.00 2016/08/08 30899 0.149 < 0.0002 0.0004 < 0.0003 0.875 0.078 0.0043 7.74 22.6 22.1 88.6SFM0037 2.00 3.00 2016/10/12 30930 0.055 0.0003 <0.0003 < 0.0003 0.824 0.056 0.0076 7.56 22.3 22.0 87.5SFM0049 4.00 5.00 2016/01/19 30711 0.094 0.0004 0.0041 0.0036 0.582 0.013 0.0056 5.20 16.7 16.6 49.6SFM0049 4.00 5.00 2016/04/18 30752 0.064 0.0004 0.0095 0.0090 0.498 0.011 0.0053 4.52 14.9 14.9 33.7SFM0049 4.00 5.00 2016/08/08 30897 0.167 < 0.0002 < 0.0003 < 0.0003 0.732 0.018 0.0115 3.75 20.0 19.9 43.3SFM0049 4.00 5.00 2016/10/13 30932 0.142 < 0.0002 < 0.0003 < 0.0003 0.703 0.017 0.0125 4.04 18.6 18.7 44.3SFM0051 5.09 5.25 2016/04/18 30757 0.018SFM0057 3.55 4.55 2016/08/11 30900 0.014 < 0.0002 0.0003 < 0.0003 0.310 0.006 0.0039 4.68 10.1 10.1 71.6SFM0057 3.55 4.55 2016/10/11 30929 0.004 0.0098 0.0225 0.0127 0.418 0.008 0.0035 4.75 11.9 12.0 67.8
< “value” = result below detection or reporting limit. RCB % = Relative charge balance error %. EC = Electrical Conductivity.
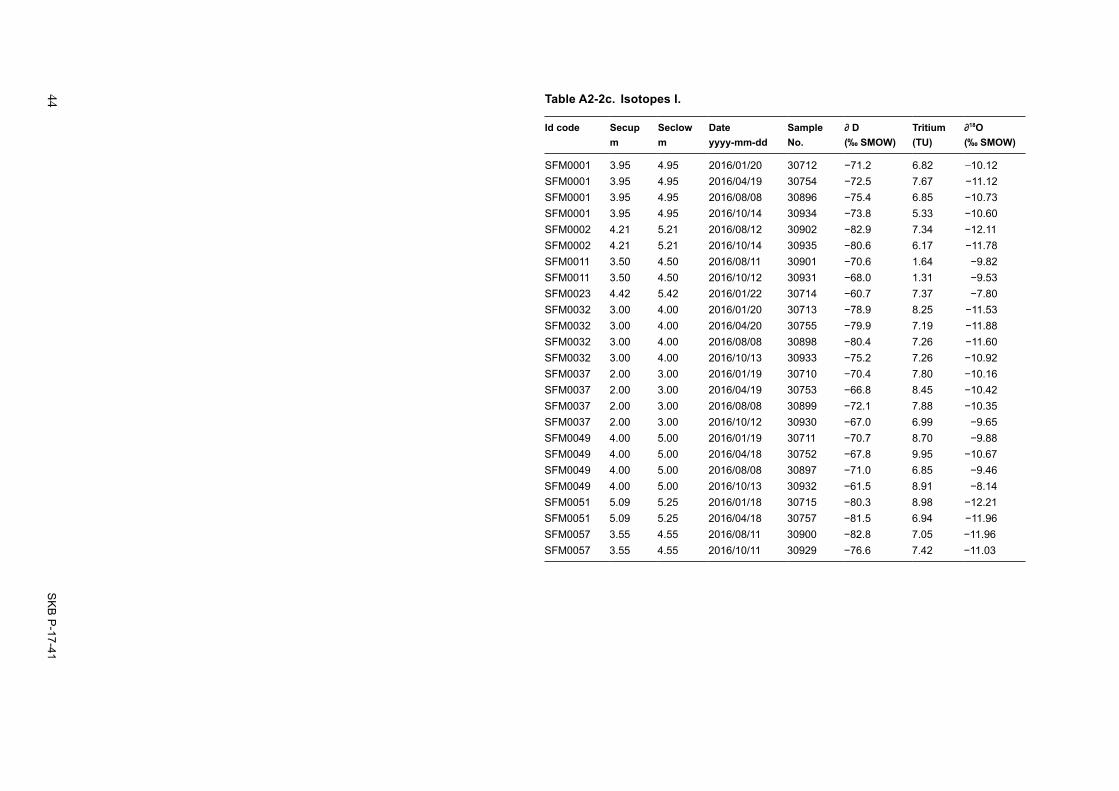
44 S
KB
P-17-41
Table A2-2c. Isotopes I.
Id code Secup Seclow Date Sample ∂ D Tritium ∂18Om m yyyy-mm-dd No. (‰ SMOW) (TU) (‰ SMOW)
SFM0001 3.95 4.95 2016/01/20 30712 −71.2 6.82 −10.12SFM0001 3.95 4.95 2016/04/19 30754 −72.5 7.67 −11.12SFM0001 3.95 4.95 2016/08/08 30896 −75.4 6.85 −10.73SFM0001 3.95 4.95 2016/10/14 30934 −73.8 5.33 −10.60SFM0002 4.21 5.21 2016/08/12 30902 −82.9 7.34 −12.11SFM0002 4.21 5.21 2016/10/14 30935 −80.6 6.17 −11.78SFM0011 3.50 4.50 2016/08/11 30901 −70.6 1.64 −9.82SFM0011 3.50 4.50 2016/10/12 30931 −68.0 1.31 −9.53SFM0023 4.42 5.42 2016/01/22 30714 −60.7 7.37 −7.80SFM0032 3.00 4.00 2016/01/20 30713 −78.9 8.25 −11.53SFM0032 3.00 4.00 2016/04/20 30755 −79.9 7.19 −11.88SFM0032 3.00 4.00 2016/08/08 30898 −80.4 7.26 −11.60SFM0032 3.00 4.00 2016/10/13 30933 −75.2 7.26 −10.92SFM0037 2.00 3.00 2016/01/19 30710 −70.4 7.80 −10.16SFM0037 2.00 3.00 2016/04/19 30753 −66.8 8.45 −10.42SFM0037 2.00 3.00 2016/08/08 30899 −72.1 7.88 −10.35SFM0037 2.00 3.00 2016/10/12 30930 −67.0 6.99 −9.65SFM0049 4.00 5.00 2016/01/19 30711 −70.7 8.70 −9.88SFM0049 4.00 5.00 2016/04/18 30752 −67.8 9.95 −10.67SFM0049 4.00 5.00 2016/08/08 30897 −71.0 6.85 −9.46SFM0049 4.00 5.00 2016/10/13 30932 −61.5 8.91 −8.14SFM0051 5.09 5.25 2016/01/18 30715 −80.3 8.98 −12.21SFM0051 5.09 5.25 2016/04/18 30757 −81.5 6.94 −11.96SFM0057 3.55 4.55 2016/08/11 30900 −82.8 7.05 −11.96SFM0057 3.55 4.55 2016/10/11 30929 −76.6 7.42 −11.03
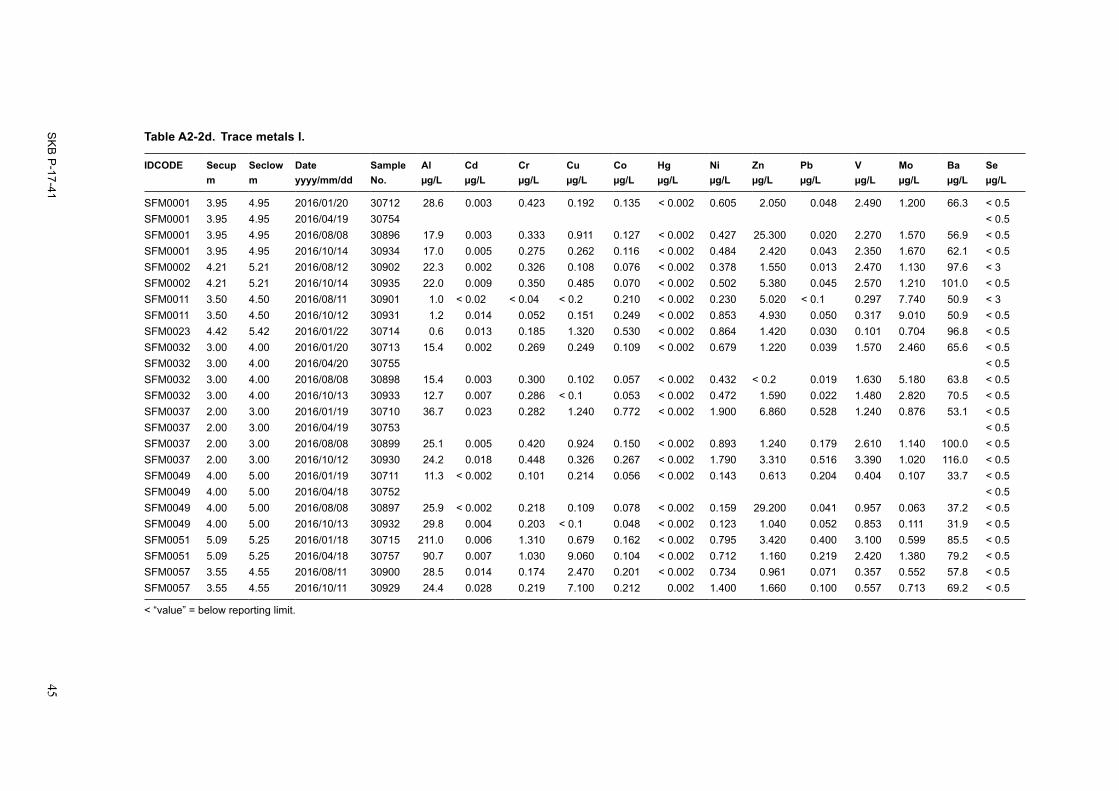
SK
B P
-17-41 45
Table A2-2d. Trace metals I.
IDCODE Secup Seclow Date Sample Al Cd Cr Cu Co Hg Ni Zn Pb V Mo Ba Sem m yyyy/mm/dd No. µg/L µg/L µg/L µg/L µg/L µg/L µg/L µg/L µg/L µg/L µg/L µg/L µg/L
SFM0001 3.95 4.95 2016/01/20 30712 28.6 0.003 0.423 0.192 0.135 < 0.002 0.605 2.050 0.048 2.490 1.200 66.3 < 0.5SFM0001 3.95 4.95 2016/04/19 30754 < 0.5SFM0001 3.95 4.95 2016/08/08 30896 17.9 0.003 0.333 0.911 0.127 < 0.002 0.427 25.300 0.020 2.270 1.570 56.9 < 0.5SFM0001 3.95 4.95 2016/10/14 30934 17.0 0.005 0.275 0.262 0.116 < 0.002 0.484 2.420 0.043 2.350 1.670 62.1 < 0.5SFM0002 4.21 5.21 2016/08/12 30902 22.3 0.002 0.326 0.108 0.076 < 0.002 0.378 1.550 0.013 2.470 1.130 97.6 < 3SFM0002 4.21 5.21 2016/10/14 30935 22.0 0.009 0.350 0.485 0.070 < 0.002 0.502 5.380 0.045 2.570 1.210 101.0 < 0.5SFM0011 3.50 4.50 2016/08/11 30901 1.0 < 0.02 < 0.04 < 0.2 0.210 < 0.002 0.230 5.020 < 0.1 0.297 7.740 50.9 < 3SFM0011 3.50 4.50 2016/10/12 30931 1.2 0.014 0.052 0.151 0.249 < 0.002 0.853 4.930 0.050 0.317 9.010 50.9 < 0.5SFM0023 4.42 5.42 2016/01/22 30714 0.6 0.013 0.185 1.320 0.530 < 0.002 0.864 1.420 0.030 0.101 0.704 96.8 < 0.5SFM0032 3.00 4.00 2016/01/20 30713 15.4 0.002 0.269 0.249 0.109 < 0.002 0.679 1.220 0.039 1.570 2.460 65.6 < 0.5SFM0032 3.00 4.00 2016/04/20 30755 < 0.5SFM0032 3.00 4.00 2016/08/08 30898 15.4 0.003 0.300 0.102 0.057 < 0.002 0.432 < 0.2 0.019 1.630 5.180 63.8 < 0.5SFM0032 3.00 4.00 2016/10/13 30933 12.7 0.007 0.286 < 0.1 0.053 < 0.002 0.472 1.590 0.022 1.480 2.820 70.5 < 0.5SFM0037 2.00 3.00 2016/01/19 30710 36.7 0.023 0.282 1.240 0.772 < 0.002 1.900 6.860 0.528 1.240 0.876 53.1 < 0.5SFM0037 2.00 3.00 2016/04/19 30753 < 0.5SFM0037 2.00 3.00 2016/08/08 30899 25.1 0.005 0.420 0.924 0.150 < 0.002 0.893 1.240 0.179 2.610 1.140 100.0 < 0.5SFM0037 2.00 3.00 2016/10/12 30930 24.2 0.018 0.448 0.326 0.267 < 0.002 1.790 3.310 0.516 3.390 1.020 116.0 < 0.5SFM0049 4.00 5.00 2016/01/19 30711 11.3 < 0.002 0.101 0.214 0.056 < 0.002 0.143 0.613 0.204 0.404 0.107 33.7 < 0.5SFM0049 4.00 5.00 2016/04/18 30752 < 0.5SFM0049 4.00 5.00 2016/08/08 30897 25.9 < 0.002 0.218 0.109 0.078 < 0.002 0.159 29.200 0.041 0.957 0.063 37.2 < 0.5SFM0049 4.00 5.00 2016/10/13 30932 29.8 0.004 0.203 < 0.1 0.048 < 0.002 0.123 1.040 0.052 0.853 0.111 31.9 < 0.5SFM0051 5.09 5.25 2016/01/18 30715 211.0 0.006 1.310 0.679 0.162 < 0.002 0.795 3.420 0.400 3.100 0.599 85.5 < 0.5SFM0051 5.09 5.25 2016/04/18 30757 90.7 0.007 1.030 9.060 0.104 < 0.002 0.712 1.160 0.219 2.420 1.380 79.2 < 0.5SFM0057 3.55 4.55 2016/08/11 30900 28.5 0.014 0.174 2.470 0.201 < 0.002 0.734 0.961 0.071 0.357 0.552 57.8 < 0.5SFM0057 3.55 4.55 2016/10/11 30929 24.4 0.028 0.219 7.100 0.212 0.002 1.400 1.660 0.100 0.557 0.713 69.2 < 0.5
< “value” = below reporting limit.


SKB P-17-41 47
Table A2-2e. Trace metals II.
Idcode Secup Seclow Date Sample U Th Sc Rb Y Zr Sb Cs La Hf Tl Ce Pr Nd Sm Eu Gd Tb Dy Ho Er Tm Yb Lu m m yyyy/mm/dd No. µg/L µg/L µg/L µg/L µg/L µg/L µg/L µg/L µg/L µg/L µg/L µg/L µg/L µg/L µg/L µg/L µg/L µg/L µg/L µg/L µg/L µg/L µg/L µg/L
SFM0001 3.95 4.95 2016/01/20 30712 4.300 0.343 0.156 4.390 3.060 < 10 0.055 0.073 1.760 0.469 < 0.01 4.340 0.452 2.000 0.425 0.043 0.450 0.067 0.442 0.098 0.302 0.041 0.295 0.023
SFM0001 3.95 4.95 2016/08/08 30896 3.420 0.171 0.116 3.660 2.320 9.250 0.047 < 0.03 1.340 0.147 < 0.01 3.320 0.324 1.420 0.294 0.034 0.327 0.047 0.328 0.067 0.214 0.028 0.208 0.030
SFM0001 3.95 4.95 2016/10/14 30934 3.230 0.176 0.097 4.460 2.220 9.650 0.051 0.047 1.400 0.136 < 0.01 3.680 0.326 1.450 0.306 0.031 0.327 0.044 0.309 0.061 0.206 0.027 0.194 0.032
SFM0002 4.21 5.21 2016/08/12 30902 2.880 0.210 0.142 1.640 2.560 8.190 0.029 < 0.03 0.932 0.186 < 0.01 2.620 0.230 1.070 0.229 0.024 0.278 0.041 0.312 0.073 0.259 0.038 0.304 0.048
SFM0002 4.21 5.21 2016/10/14 30935 2.900 0.219 0.151 1.940 2.660 9.520 0.033 < 0.03 0.938 0.197 < 0.01 2.640 0.224 1.060 0.233 0.019 0.286 0.041 0.323 0.072 0.268 0.039 0.302 0.054
SFM0011 3.50 4.50 2016/08/11 30901 9.390 < 0.2 < 0.4 5.640 0.723 0.248 < 0.1 < 0.1 0.272 < 0.02 < 0.05 0.343 0.053 0.229 0.042 < 0.02 0.062 < 0.02 0.050 < 0.02 0.037 < 0.02 0.033 < 0.02
SFM0011 3.50 4.50 2016/10/12 30931 9.560 < 0.02 < 0.05 6.360 0.568 0.300 0.043 0.096 0.217 0.007 < 0.01 0.264 0.039 0.191 0.036 < 0.005 0.047 0.005 0.040 0.009 0.029 < 0.004 0.028 0.007
SFM0023 4.42 5.42 2016/01/22 30714 1.030 0.320 0.142 1.600 1.460 < 10 0.061 0.058 0.988 0.268 < 0.01 2.050 0.236 0.955 0.195 0.014 0.200 0.029 0.204 0.043 0.143 0.023 0.163 0.015
SFM0032 3.00 4.00 2016/01/20 30713 10.400 0.102 0.074 2.050 1.600 6.390 0.036 < 0.03 0.642 0.314 < 0.01 1.190 0.153 0.696 0.142 0.008 0.156 0.025 0.181 0.042 0.135 0.020 0.138 0.012
SFM0032 3.00 4.00 2016/08/08 30898 4.000 0.116 0.071 1.900 1.830 3.680 0.053 < 0.03 0.786 0.080 < 0.01 1.510 0.190 0.842 0.177 0.020 0.211 0.030 0.216 0.049 0.168 0.022 0.176 0.023
SFM0032 3.00 4.00 2016/10/13 30933 4.180 0.093 0.062 2.120 1.560 3.690 0.053 < 0.03 0.780 0.065 < 0.01 1.480 0.174 0.795 0.163 0.013 0.182 0.025 0.190 0.040 0.140 0.020 0.147 0.025
SFM0037 2.00 3.00 2016/01/19 30710 13.700 0.236 0.090 4.130 2.170 2.390 0.066 < 0.03 1.920 0.366 0.013 3.430 0.409 1.700 0.336 0.030 0.314 0.044 0.299 0.063 0.196 0.028 0.188 0.016
SFM0037 2.00 3.00 2016/08/08 30899 10.400 0.246 0.152 6.400 2.660 4.260 0.116 < 0.03 1.750 0.109 < 0.01 3.130 0.396 1.720 0.361 0.038 0.383 0.052 0.368 0.078 0.256 0.035 0.260 0.034
SFM0037 2.00 3.00 2016/10/12 30930 11.000 0.222 0.143 7.890 2.790 5.410 0.072 0.032 1.830 0.116 0.020 3.240 0.403 1.770 0.367 0.032 0.366 0.051 0.376 0.076 0.260 0.036 0.268 0.047
SFM0049 4.00 5.00 2016/01/19 30711 0.352 0.117 < 0.05 2.950 0.651 0.560 0.028 < 0.03 0.724 0.184 < 0.01 1.350 0.162 0.685 0.132 0.013 0.118 0.016 0.101 0.021 0.063 0.009 0.061 < 0.005
SFM0049 4.00 5.00 2016/08/08 30897 0.241 0.122 0.086 4.020 0.891 0.486 0.026 < 0.03 1.030 0.023 < 0.01 2.010 0.236 0.978 0.190 0.023 0.174 0.023 0.149 0.028 0.089 0.012 0.087 0.009
SFM0049 4.00 5.00 2016/10/13 30932 0.176 0.117 0.055 4.120 0.967 0.536 0.020 < 0.03 1.070 0.018 < 0.01 2.080 0.238 1.020 0.200 0.021 0.179 0.023 0.153 0.029 0.095 0.013 0.088 0.015
SFM0057 3.55 4.55 2016/08/11 30900 7.320 0.117 0.152 3.220 1.640 1.340 0.109 < 0.03 1.210 0.036 0.023 2.280 0.268 1.200 0.235 0.031 0.239 0.032 0.224 0.046 0.146 0.019 0.137 0.015
SFM0057 3.55 4.55 2016/10/11 30929 11.200 0.109 0.131 4.200 1.850 1.670 0.193 < 0.03 1.380 0.037 0.028 2.510 0.288 1.290 0.254 0.028 0.261 0.035 0.238 0.047 0.157 0.021 0.146 0.033
< “value” = below reporting limit.

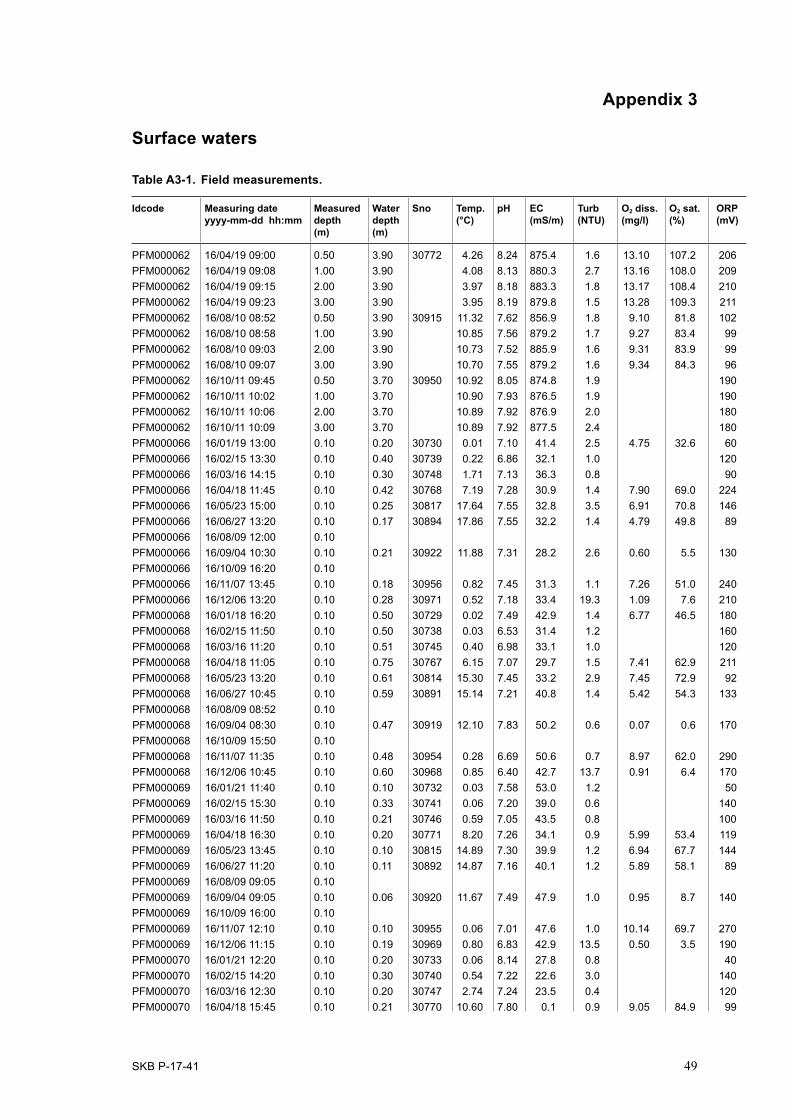
SKB P-17-41 49
Appendix 3
Surface waters
Table A3-1. Field measurements.
Idcode Measuring date yyyy-mm-dd hh:mm
Measured depth (m)
Water depth (m)
Sno Temp. (°C)
pH EC (mS/m)
Turb (NTU)
O2 diss. (mg/l)
O2 sat. (%)
ORP (mV)
PFM000062 16/04/19 09:00 0.50 3.90 30772 4.26 8.24 875.4 1.6 13.10 107.2 206PFM000062 16/04/19 09:08 1.00 3.90 4.08 8.13 880.3 2.7 13.16 108.0 209PFM000062 16/04/19 09:15 2.00 3.90 3.97 8.18 883.3 1.8 13.17 108.4 210PFM000062 16/04/19 09:23 3.00 3.90 3.95 8.19 879.8 1.5 13.28 109.3 211PFM000062 16/08/10 08:52 0.50 3.90 30915 11.32 7.62 856.9 1.8 9.10 81.8 102PFM000062 16/08/10 08:58 1.00 3.90 10.85 7.56 879.2 1.7 9.27 83.4 99PFM000062 16/08/10 09:03 2.00 3.90 10.73 7.52 885.9 1.6 9.31 83.9 99PFM000062 16/08/10 09:07 3.00 3.90 10.70 7.55 879.2 1.6 9.34 84.3 96PFM000062 16/10/11 09:45 0.50 3.70 30950 10.92 8.05 874.8 1.9 190PFM000062 16/10/11 10:02 1.00 3.70 10.90 7.93 876.5 1.9 190PFM000062 16/10/11 10:06 2.00 3.70 10.89 7.92 876.9 2.0 180PFM000062 16/10/11 10:09 3.00 3.70 10.89 7.92 877.5 2.4 180PFM000066 16/01/19 13:00 0.10 0.20 30730 0.01 7.10 41.4 2.5 4.75 32.6 60PFM000066 16/02/15 13:30 0.10 0.40 30739 0.22 6.86 32.1 1.0 120PFM000066 16/03/16 14:15 0.10 0.30 30748 1.71 7.13 36.3 0.8 90PFM000066 16/04/18 11:45 0.10 0.42 30768 7.19 7.28 30.9 1.4 7.90 69.0 224PFM000066 16/05/23 15:00 0.10 0.25 30817 17.64 7.55 32.8 3.5 6.91 70.8 146PFM000066 16/06/27 13:20 0.10 0.17 30894 17.86 7.55 32.2 1.4 4.79 49.8 89PFM000066 16/08/09 12:00 0.10PFM000066 16/09/04 10:30 0.10 0.21 30922 11.88 7.31 28.2 2.6 0.60 5.5 130PFM000066 16/10/09 16:20 0.10PFM000066 16/11/07 13:45 0.10 0.18 30956 0.82 7.45 31.3 1.1 7.26 51.0 240PFM000066 16/12/06 13:20 0.10 0.28 30971 0.52 7.18 33.4 19.3 1.09 7.6 210PFM000068 16/01/18 16:20 0.10 0.50 30729 0.02 7.49 42.9 1.4 6.77 46.5 180PFM000068 16/02/15 11:50 0.10 0.50 30738 0.03 6.53 31.4 1.2 160PFM000068 16/03/16 11:20 0.10 0.51 30745 0.40 6.98 33.1 1.0 120PFM000068 16/04/18 11:05 0.10 0.75 30767 6.15 7.07 29.7 1.5 7.41 62.9 211PFM000068 16/05/23 13:20 0.10 0.61 30814 15.30 7.45 33.2 2.9 7.45 72.9 92PFM000068 16/06/27 10:45 0.10 0.59 30891 15.14 7.21 40.8 1.4 5.42 54.3 133PFM000068 16/08/09 08:52 0.10PFM000068 16/09/04 08:30 0.10 0.47 30919 12.10 7.83 50.2 0.6 0.07 0.6 170PFM000068 16/10/09 15:50 0.10PFM000068 16/11/07 11:35 0.10 0.48 30954 0.28 6.69 50.6 0.7 8.97 62.0 290PFM000068 16/12/06 10:45 0.10 0.60 30968 0.85 6.40 42.7 13.7 0.91 6.4 170PFM000069 16/01/21 11:40 0.10 0.10 30732 0.03 7.58 53.0 1.2 50PFM000069 16/02/15 15:30 0.10 0.33 30741 0.06 7.20 39.0 0.6 140PFM000069 16/03/16 11:50 0.10 0.21 30746 0.59 7.05 43.5 0.8 100PFM000069 16/04/18 16:30 0.10 0.20 30771 8.20 7.26 34.1 0.9 5.99 53.4 119PFM000069 16/05/23 13:45 0.10 0.10 30815 14.89 7.30 39.9 1.2 6.94 67.7 144PFM000069 16/06/27 11:20 0.10 0.11 30892 14.87 7.16 40.1 1.2 5.89 58.1 89PFM000069 16/08/09 09:05 0.10PFM000069 16/09/04 09:05 0.10 0.06 30920 11.67 7.49 47.9 1.0 0.95 8.7 140PFM000069 16/10/09 16:00 0.10PFM000069 16/11/07 12:10 0.10 0.10 30955 0.06 7.01 47.6 1.0 10.14 69.7 270PFM000069 16/12/06 11:15 0.10 0.19 30969 0.80 6.83 42.9 13.5 0.50 3.5 190PFM000070 16/01/21 12:20 0.10 0.20 30733 0.06 8.14 27.8 0.8 40PFM000070 16/02/15 14:20 0.10 0.30 30740 0.54 7.22 22.6 3.0 140PFM000070 16/03/16 12:30 0.10 0.20 30747 2.74 7.24 23.5 0.4 120PFM000070 16/04/18 15:45 0.10 0.21 30770 10.60 7.80 0.1 0.9 9.05 84.9 99
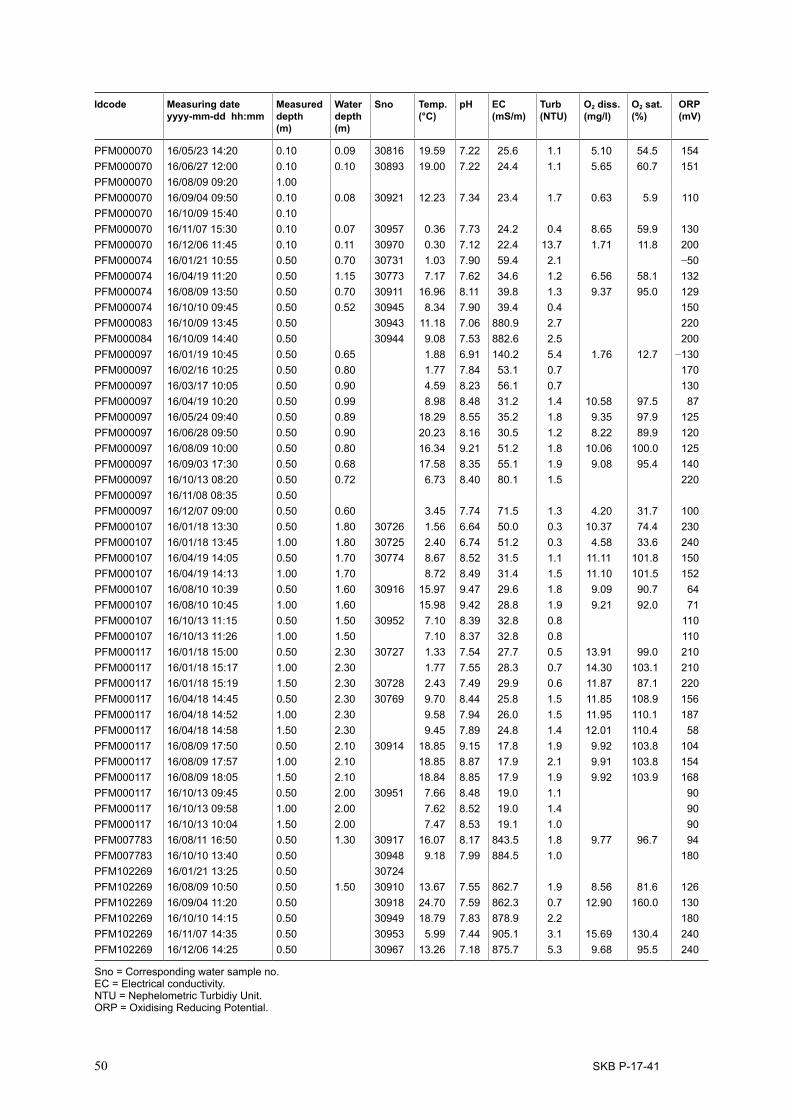
50 SKB P-17-41
Idcode Measuring date yyyy-mm-dd hh:mm
Measured depth (m)
Water depth (m)
Sno Temp. (°C)
pH EC (mS/m)
Turb (NTU)
O2 diss. (mg/l)
O2 sat. (%)
ORP (mV)
PFM000070 16/05/23 14:20 0.10 0.09 30816 19.59 7.22 25.6 1.1 5.10 54.5 154PFM000070 16/06/27 12:00 0.10 0.10 30893 19.00 7.22 24.4 1.1 5.65 60.7 151PFM000070 16/08/09 09:20 1.00PFM000070 16/09/04 09:50 0.10 0.08 30921 12.23 7.34 23.4 1.7 0.63 5.9 110PFM000070 16/10/09 15:40 0.10PFM000070 16/11/07 15:30 0.10 0.07 30957 0.36 7.73 24.2 0.4 8.65 59.9 130PFM000070 16/12/06 11:45 0.10 0.11 30970 0.30 7.12 22.4 13.7 1.71 11.8 200PFM000074 16/01/21 10:55 0.50 0.70 30731 1.03 7.90 59.4 2.1 −50PFM000074 16/04/19 11:20 0.50 1.15 30773 7.17 7.62 34.6 1.2 6.56 58.1 132PFM000074 16/08/09 13:50 0.50 0.70 30911 16.96 8.11 39.8 1.3 9.37 95.0 129PFM000074 16/10/10 09:45 0.50 0.52 30945 8.34 7.90 39.4 0.4 150PFM000083 16/10/09 13:45 0.50 30943 11.18 7.06 880.9 2.7 220PFM000084 16/10/09 14:40 0.50 30944 9.08 7.53 882.6 2.5 200PFM000097 16/01/19 10:45 0.50 0.65 1.88 6.91 140.2 5.4 1.76 12.7 −130PFM000097 16/02/16 10:25 0.50 0.80 1.77 7.84 53.1 0.7 170PFM000097 16/03/17 10:05 0.50 0.90 4.59 8.23 56.1 0.7 130PFM000097 16/04/19 10:20 0.50 0.99 8.98 8.48 31.2 1.4 10.58 97.5 87PFM000097 16/05/24 09:40 0.50 0.89 18.29 8.55 35.2 1.8 9.35 97.9 125PFM000097 16/06/28 09:50 0.50 0.90 20.23 8.16 30.5 1.2 8.22 89.9 120PFM000097 16/08/09 10:00 0.50 0.80 16.34 9.21 51.2 1.8 10.06 100.0 125PFM000097 16/09/03 17:30 0.50 0.68 17.58 8.35 55.1 1.9 9.08 95.4 140PFM000097 16/10/13 08:20 0.50 0.72 6.73 8.40 80.1 1.5 220PFM000097 16/11/08 08:35 0.50PFM000097 16/12/07 09:00 0.50 0.60 3.45 7.74 71.5 1.3 4.20 31.7 100PFM000107 16/01/18 13:30 0.50 1.80 30726 1.56 6.64 50.0 0.3 10.37 74.4 230PFM000107 16/01/18 13:45 1.00 1.80 30725 2.40 6.74 51.2 0.3 4.58 33.6 240PFM000107 16/04/19 14:05 0.50 1.70 30774 8.67 8.52 31.5 1.1 11.11 101.8 150PFM000107 16/04/19 14:13 1.00 1.70 8.72 8.49 31.4 1.5 11.10 101.5 152PFM000107 16/08/10 10:39 0.50 1.60 30916 15.97 9.47 29.6 1.8 9.09 90.7 64PFM000107 16/08/10 10:45 1.00 1.60 15.98 9.42 28.8 1.9 9.21 92.0 71PFM000107 16/10/13 11:15 0.50 1.50 30952 7.10 8.39 32.8 0.8 110PFM000107 16/10/13 11:26 1.00 1.50 7.10 8.37 32.8 0.8 110PFM000117 16/01/18 15:00 0.50 2.30 30727 1.33 7.54 27.7 0.5 13.91 99.0 210PFM000117 16/01/18 15:17 1.00 2.30 1.77 7.55 28.3 0.7 14.30 103.1 210PFM000117 16/01/18 15:19 1.50 2.30 30728 2.43 7.49 29.9 0.6 11.87 87.1 220PFM000117 16/04/18 14:45 0.50 2.30 30769 9.70 8.44 25.8 1.5 11.85 108.9 156PFM000117 16/04/18 14:52 1.00 2.30 9.58 7.94 26.0 1.5 11.95 110.1 187PFM000117 16/04/18 14:58 1.50 2.30 9.45 7.89 24.8 1.4 12.01 110.4 58PFM000117 16/08/09 17:50 0.50 2.10 30914 18.85 9.15 17.8 1.9 9.92 103.8 104PFM000117 16/08/09 17:57 1.00 2.10 18.85 8.87 17.9 2.1 9.91 103.8 154PFM000117 16/08/09 18:05 1.50 2.10 18.84 8.85 17.9 1.9 9.92 103.9 168PFM000117 16/10/13 09:45 0.50 2.00 30951 7.66 8.48 19.0 1.1 90PFM000117 16/10/13 09:58 1.00 2.00 7.62 8.52 19.0 1.4 90PFM000117 16/10/13 10:04 1.50 2.00 7.47 8.53 19.1 1.0 90PFM007783 16/08/11 16:50 0.50 1.30 30917 16.07 8.17 843.5 1.8 9.77 96.7 94PFM007783 16/10/10 13:40 0.50 30948 9.18 7.99 884.5 1.0 180PFM102269 16/01/21 13:25 0.50 30724PFM102269 16/08/09 10:50 0.50 1.50 30910 13.67 7.55 862.7 1.9 8.56 81.6 126PFM102269 16/09/04 11:20 0.50 30918 24.70 7.59 862.3 0.7 12.90 160.0 130PFM102269 16/10/10 14:15 0.50 30949 18.79 7.83 878.9 2.2 180PFM102269 16/11/07 14:35 0.50 30953 5.99 7.44 905.1 3.1 15.69 130.4 240PFM102269 16/12/06 14:25 0.50 30967 13.26 7.18 875.7 5.3 9.68 95.5 240
Sno = Corresponding water sample no. EC = Electrical conductivity. NTU = Nephelometric Turbidiy Unit. ORP = Oxidising Reducing Potential.
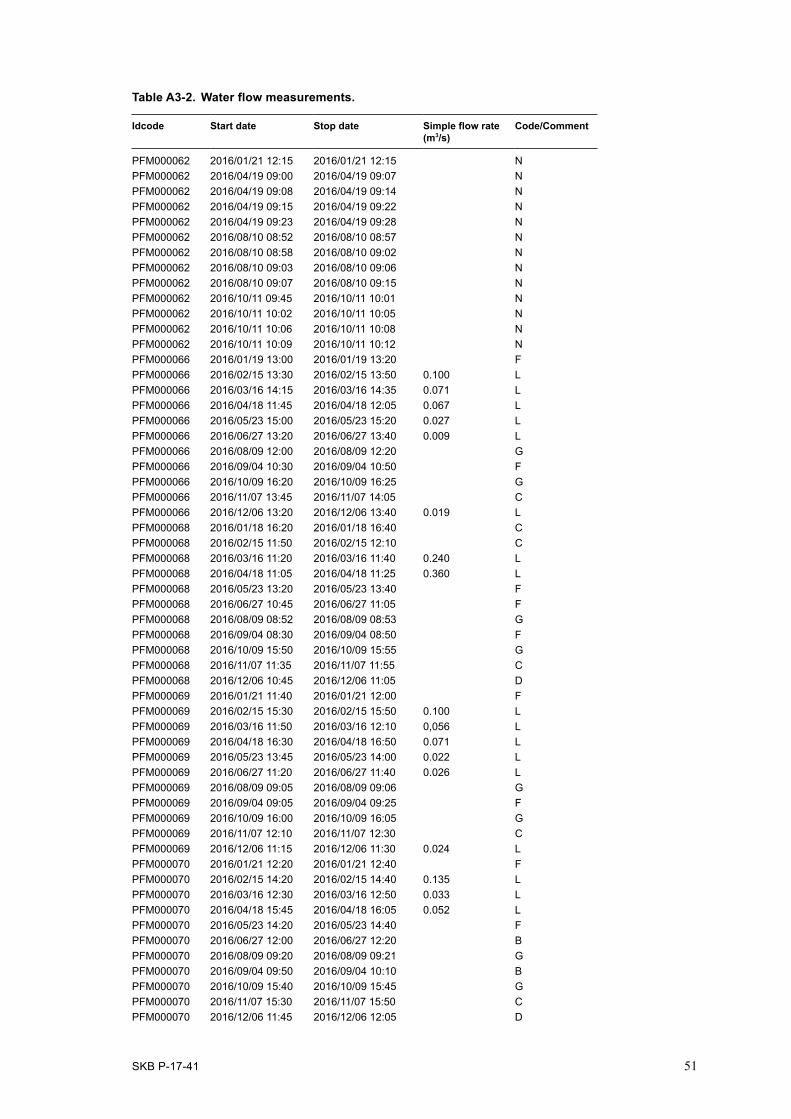
SKB P-17-41 51
Table A3-2. Water flow measurements.
Idcode Start date Stop date Simple flow rate (m3/s)
Code/Comment
PFM000062 2016/01/21 12:15 2016/01/21 12:15 NPFM000062 2016/04/19 09:00 2016/04/19 09:07 NPFM000062 2016/04/19 09:08 2016/04/19 09:14 NPFM000062 2016/04/19 09:15 2016/04/19 09:22 NPFM000062 2016/04/19 09:23 2016/04/19 09:28 NPFM000062 2016/08/10 08:52 2016/08/10 08:57 NPFM000062 2016/08/10 08:58 2016/08/10 09:02 NPFM000062 2016/08/10 09:03 2016/08/10 09:06 NPFM000062 2016/08/10 09:07 2016/08/10 09:15 NPFM000062 2016/10/11 09:45 2016/10/11 10:01 NPFM000062 2016/10/11 10:02 2016/10/11 10:05 NPFM000062 2016/10/11 10:06 2016/10/11 10:08 NPFM000062 2016/10/11 10:09 2016/10/11 10:12 NPFM000066 2016/01/19 13:00 2016/01/19 13:20 FPFM000066 2016/02/15 13:30 2016/02/15 13:50 0.100 LPFM000066 2016/03/16 14:15 2016/03/16 14:35 0.071 LPFM000066 2016/04/18 11:45 2016/04/18 12:05 0.067 LPFM000066 2016/05/23 15:00 2016/05/23 15:20 0.027 LPFM000066 2016/06/27 13:20 2016/06/27 13:40 0.009 LPFM000066 2016/08/09 12:00 2016/08/09 12:20 GPFM000066 2016/09/04 10:30 2016/09/04 10:50 FPFM000066 2016/10/09 16:20 2016/10/09 16:25 GPFM000066 2016/11/07 13:45 2016/11/07 14:05 CPFM000066 2016/12/06 13:20 2016/12/06 13:40 0.019 LPFM000068 2016/01/18 16:20 2016/01/18 16:40 CPFM000068 2016/02/15 11:50 2016/02/15 12:10 CPFM000068 2016/03/16 11:20 2016/03/16 11:40 0.240 LPFM000068 2016/04/18 11:05 2016/04/18 11:25 0.360 LPFM000068 2016/05/23 13:20 2016/05/23 13:40 FPFM000068 2016/06/27 10:45 2016/06/27 11:05 FPFM000068 2016/08/09 08:52 2016/08/09 08:53 GPFM000068 2016/09/04 08:30 2016/09/04 08:50 FPFM000068 2016/10/09 15:50 2016/10/09 15:55 GPFM000068 2016/11/07 11:35 2016/11/07 11:55 CPFM000068 2016/12/06 10:45 2016/12/06 11:05 DPFM000069 2016/01/21 11:40 2016/01/21 12:00 FPFM000069 2016/02/15 15:30 2016/02/15 15:50 0.100 LPFM000069 2016/03/16 11:50 2016/03/16 12:10 0,056 LPFM000069 2016/04/18 16:30 2016/04/18 16:50 0.071 LPFM000069 2016/05/23 13:45 2016/05/23 14:00 0.022 LPFM000069 2016/06/27 11:20 2016/06/27 11:40 0.026 LPFM000069 2016/08/09 09:05 2016/08/09 09:06 GPFM000069 2016/09/04 09:05 2016/09/04 09:25 FPFM000069 2016/10/09 16:00 2016/10/09 16:05 GPFM000069 2016/11/07 12:10 2016/11/07 12:30 CPFM000069 2016/12/06 11:15 2016/12/06 11:30 0.024 LPFM000070 2016/01/21 12:20 2016/01/21 12:40 FPFM000070 2016/02/15 14:20 2016/02/15 14:40 0.135 LPFM000070 2016/03/16 12:30 2016/03/16 12:50 0.033 LPFM000070 2016/04/18 15:45 2016/04/18 16:05 0.052 LPFM000070 2016/05/23 14:20 2016/05/23 14:40 FPFM000070 2016/06/27 12:00 2016/06/27 12:20 BPFM000070 2016/08/09 09:20 2016/08/09 09:21 GPFM000070 2016/09/04 09:50 2016/09/04 10:10 BPFM000070 2016/10/09 15:40 2016/10/09 15:45 GPFM000070 2016/11/07 15:30 2016/11/07 15:50 CPFM000070 2016/12/06 11:45 2016/12/06 12:05 D

52 SKB P-17-41
Idcode Start date Stop date Simple flow rate (m3/s)
Code/Comment
PFM000074 2016/01/21 10:55 2016/01/21 11:15 NPFM000074 2016/04/19 11:20 2016/04/19 11:40 NPFM000074 2016/08/09 13:50 2016/08/09 14:10 NPFM000074 2016/10/10 09:45 2016/10/10 10:05 NPFM000083 2016/10/09 13:45 2016/10/09 14:05 NPFM000084 2016/10/09 14:40 2016/10/09 15:00 NPFM000097 2016/01/19 10:45 2016/01/19 10:55 NPFM000097 2016/02/16 10:25 2016/02/16 10:40 NPFM000097 2016/03/17 10:05 2016/03/17 10:15 NPFM000097 2016/04/19 10:20 2016/04/19 10:40 NPFM000097 2016/05/24 09:40 2016/05/24 10:00 NPFM000097 2016/06/28 09:50 2016/06/28 10:10 NPFM000097 2016/08/09 10:00 2016/08/09 10:10 NPFM000097 2016/09/03 17:30 2016/09/03 17:40 NPFM000097 2016/10/13 08:20 2016/10/13 08:40 NPFM000097 2016/11/08 08:35 2016/11/08 08:50 NPFM000097 2016/12/07 09:00 2016/12/07 09:20 NPFM000107 2016/01/18 13:30 2016/01/18 13:45 NPFM000107 2016/01/18 13:45 2016/01/18 14:00 NPFM000107 2016/04/19 14:05 2016/04/19 14:12 NPFM000107 2016/04/19 14:13 2016/04/19 14:23 NPFM000107 2016/08/10 10:39 2016/08/10 10:44 NPFM000107 2016/08/10 10:45 2016/08/10 10:55 NPFM000107 2016/10/13 11:15 2016/10/13 11:25 NPFM000107 2016/10/13 11:26 2016/10/13 11:30 NPFM000117 2016/01/18 15:00 2016/01/18 15:17 NPFM000117 2016/01/18 15:17 2016/01/18 15:19 NPFM000117 2016/01/18 15:19 2016/01/18 15:40 NPFM000117 2016/04/18 14:45 2016/04/18 14:46 NPFM000117 2016/04/18 14:52 2016/04/18 14:53 NPFM000117 2016/04/18 14:58 2016/04/18 14:59 NPFM000117 2016/08/09 17:50 2016/08/09 17:56 NPFM000117 2016/08/09 17:57 2016/08/09 18:04 NPFM000117 2016/08/09 18:05 2016/08/09 18:10 NPFM000117 2016/10/13 09:45 2016/10/13 09:57 NPFM000117 2016/10/13 09:58 2016/10/13 10:03 NPFM000117 2016/10/13 10:04 2016/10/13 10:08 NPFM007783 2016/08/11 16:50 2016/08/11 17:10 NPFM007783 2016/10/10 13:40 2016/10/10 14:00 NPFM102269 2016/01/21 13:25 2016/01/21 13:35 NPFM102269 2016/08/09 10:50 2016/08/09 11:20 NPFM102269 2016/09/04 11:20 2016/09/04 11:40 NPFM102269 2016/10/10 14:15 2016/10/10 14:35 NPFM102269 2016/11/07 14:35 2016/11/07 14:55 NPFM102269 2016/12/06 14:25 2016/12/06 14:45 N
Code Code description A Blocked flow; no measurement B Too much water vegetation, no measurement C Water completely frosen, no measurement D Too much ice, no measurement E Flow rate too high, no measurement F Flow rate too low, no measurement G Dry conditions, no measurements H Measurement not possible, estimated value I Measurement not possible, see protocol K Comment missing L Flow rate value available M Low water level N Lake, Sea, no measurement O Too much wind, no measurement P Stationary water

SKB P-17-41 53
Table A3-3a. Compilation of hydrochemical data from water analyses.
Idcode Sample no. Depth Sampling date RCB Na K Ca Mg HCO3– Cl– SO42– SO4-S Br F– Si Fe Mn Li Sr I– pH_L pH_F Temp_F EC_L(m) (yyyy-mm-dd) (%) (mg/L) (mg/L) (mg/L) (mg/L) (mg/L) (mg/L) (mg/L) (mg/L) (mg/L) (mg/L) (mg/L) (mg/L) (mg/L) (mg/L) (mg/L) (mg/L) (°C) (mS/m)
PFM000062 30772 0.50 2016/04/19 −0.9 1 510.0 55.80 75.6 169.00 80.4 2 724.0 385.10 129.00 8.520 0.41 0.53 0.0041 0.0022 0.0290 1.110 0.0156 8.11 8.24 4.26 882
PFM000062 30915 0.50 2016/08/10 0.6 1 600.0 56.30 74.6 175.00 78.6 2 786.0 391.20 131.00 10.000 0.34 0.56 0.0021 0.0078 0.0270 1.110 0.0134 7.63 7.62 11.32 903
PFM000062 30950 0.50 2016/10/11 −2.4 1 450.0 53.20 74.9 166.00 76.8 2 715.0 376.90 127.00 9.120 0.37 0.51 < 0.002 0.0011 0.0264 1.060 < 0.09 7.88 8.05 10.92 884
PFM000066 30730 0.10 2016/01/19 5.1 6.4 2.40 83.4 3.70 244.9 5.9 6.00 2.39 0.075 0.25 6.04 0.1410 0.0284 0.0022 0.088 0.0082 7.18 7.10 0.01 42
PFM000066 30739 0.10 2016/02/15 5.0 4.9 2.10 62.6 2.94 184.6 4.4 6.25 2.21 0.042 < 0.2 4.87 0.0742 0.0137 0.0017 0.065 0.0046 7.12 6.86 0.22 33
PFM000066 30748 0.10 2016/03/16 4.2 5.8 2.05 70.8 3.39 214.4 5.0 5.11 1.90 0.049 0.23 5.14 0.0847 0.0200 0.0017 0.077 0.0058 7.15 7.13 1.71 37
PFM000066 30768 0.10 2016/04/18 3.2 4.3 1.96 60.3 2.68 185.6 3.7 3.79 1.49 0.036 0.21 3.89 0.0647 0.0081 0.0014 0.062 0.0055 7.46 7.28 7.19 32
PFM000066 30817 0.10 2016/05/23 4.0 5.3 1.90 63.0 2.96 194.9 3.7 2.61 1.20 0.040 0.25 2.93 0.1040 0.0165 0.0019 0.070 0.0058 7.57 7.55 17.64 33
PFM000066 30894 0.10 2016/06/27 5.7 5.3 1.52 66.0 3.07 198.4 3.0 1.56 0.92 0.049 0.22 3.97 0.2900 0.0308 0.0020 0.075 0.0086 7.49 7.55 17.86 33
PFM000066 30922 0.10 2016/09/04 5.2 6.0 1.99 56.3 2.87 165.7 4.4 7.36 2.82 0.046 0.24 5.16 0.1010 0.0157 0.0023 0.065 0.0053 7.21 7.31 11.88 30
PFM000066 30956 0.10 2016/11/07 3.3 7.0 4.80 56.4 3.45 158.1 8.3 21.60 7.43 0.037 0.22 4.92 0.0261 0.0055 0.0025 0.062 0.0022 7.15 7.45 0.82 33
PFM000066 30971 0.10 2016/12/06 4.3 5.7 2.59 63.3 3.15 177.6 5.3 15.70 5.69 0.047 0.22 5.18 0.0329 0.0012 < 0.004 0.067 0.0031 7.48 7.18 0.52 33
PFM000068 30729 0.10 2016/01/18 5.0 15.2 2.45 71.8 4.87 203.8 21.4 12.80 4.92 0.132 0.29 5.34 0.1730 0.1020 0.0026 0.104 0.0095 7.11 7.49 0.02 43
PFM000068 30738 0.10 2016/02/15 9.0 10.5 2.21 58.2 3.83 146.5 13.8 13.30 5.03 0.068 0.23 4.63 0.1030 0.0091 0.0020 0.079 0.0053 7.12 6.53 0.03 32
PFM000068 30745 0.10 2016/03/16 5.0 11.3 2.01 54.8 3.83 154.1 15.6 11.80 4.30 0.080 0.27 4.35 0.1420 0.0154 0.0020 0.080 0.0061 7.19 6.98 0.40 34
PFM000068 30767 0.10 2016/04/18 3.8 10.1 2.08 51.6 3.74 150.4 15.2 9.10 3.50 0.076 0.25 3.21 0.0990 0.0123 0.0018 0.072 0.0060 7.35 7.07 6.15 32
PFM000068 30814 0.10 2016/05/23 5.0 18.0 2.13 58.0 4.53 167.1 27.2 7.99 3.05 0.139 0.32 4.04 0.2950 0.0373 0.0024 0.093 0.0077 7.51 7.45 15.30 39
PFM000068 30891 0.10 2016/06/27 5.1 20.8 2.17 61.8 5.04 179.8 32.4 5.29 2.35 0.167 0.32 4.66 0.5180 0.0754 0.0031 0.106 0.0092 7.38 7.21 15.14 41
PFM000068 30919 0.10 2016/09/04 2.7 30.2 3.11 70.1 6.57 172.3 48.0 45.50 15.30 0.196 0.29 5.03 0.3100 0.0196 < 0.004 0.130 0.0071 7.18 7.83 12.10 53
PFM000068 30954 0.10 2016/11/07 2.7 28.7 2.67 67.1 6.78 180.3 47.0 30.80 10.50 0.173 0.27 5.99 0.1350 0.0065 0.0035 0.121 0.0056 7.27 6.69 0.28 50
PFM000068 30968 0.10 2016/12/06 3.2 16.6 2.70 65.9 5.08 165.4 27.4 32.80 11.50 0.125 0.28 5.26 0.1090 0.0060 < 0.004 0.104 0.0044 7.25 6.40 0.85 43
PFM000069 30732 0.10 2016/01/21 4.3 21.2 2.73 86.4 6.02 245.4 33.8 14.90 5.53 0.187 0.32 12.50 0.2300 0.2100 0.0036 0.125 0.0125 7.03 7.58 0.03 53
PFM000069 30741 0.10 2016/02/15 4.6 13.6 2.22 64.9 4.41 177.5 21.1 16.70 5.79 0.093 0.27 5.25 0.0809 0.0107 0.0024 0.091 0.0046 7.05 7.20 0.06 40
PFM000069 30746 0.10 2016/03/16 6.0 18.6 2.34 71.3 5.32 194.6 27.6 14.20 5.32 0.130 0.31 5.97 0.1530 0.0257 0.0025 0.107 0.0068 7.06 7.05 0.59 44
PFM000069 30771 0.10 2016/04/18 2.4 13.0 1.98 52.8 3.77 156.1 20.8 10.40 3.79 0.090 0.26 3.88 0.0794 0.0064 0.0018 0.077 0.0054 7.25 7.26 8.20 34
PFM000069 30815 0.10 2016/05/23 3.8 20.4 2.22 58.2 4.79 173.3 31.1 8.22 3.16 0.135 0.32 4.51 0.1600 0.0191 0.0025 0.094 0.0069 7.46 7.30 14.89 40
PFM000069 30892 0.10 2016/06/27 6.3 6.2 1.13 44.9 2.43 134.1 4.6 2.50 1.28 0.047 0.21 2.12 0.0998 0.0433 0.0015 0.051 0.0103 7.27 7.16 14.87 24
PFM000069 30920 0.10 2016/09/04 3.5 32.1 2.70 65.5 6.74 183.7 49.7 22.10 8.07 0.211 0.28 4.81 0.1330 0.0050 0.0035 0.119 0.0079 7.41 7.49 11.67 51
PFM000069 30955 0.10 2016/11/07 2.0 27.8 1.76 62.0 6.40 194.5 44.7 9.12 3.48 0.180 0.26 6.06 0.0654 0.0033 0.0028 0.107 0.0075 7.44 7.01 0.06 49
PFM000069 30969 0.10 2016/12/06 2.8 18.1 2.70 64.6 5.00 178.1 29.3 22.00 7.85 0.115 0.27 5.43 0.0834 0.0085 < 0.004 0.097 0.0052 7.20 6.83 0.80 43
PFM000070 30733 0.10 2016/01/21 5.6 7.1 2.20 50.6 2.89 150.6 6.8 4.57 1.96 0.062 0.24 10.70 0.0240 0.0033 0.0018 0.057 0.0107 7.47 8.14 0.06 28
PFM000070 30740 0.10 2016/02/15 9.0 4.7 1.65 38.8 2.24 103.2 4.5 6.79 2.51 0.035 < 0.2 3.09 0.1010 0.0057 0.0012 0.043 0.0058 7.22 7.22 0.54 21
PFM000070 30747 0.10 2016/03/16 7.7 4.7 1.46 40.5 2.27 111.3 4.4 5.88 2.20 0.025 0.20 3.33 0.0758 0.0079 0.0009 0.046 0.0053 7.21 7.24 2.74 22
PFM000070 30770 0.10 2016/04/18 4.9 5.8 1.90 48.6 2.49 144.8 5.6 4.40 1.83 0.040 0.20 1.42 0.0278 0.0089 0.0013 0.051 0.0084 7.68 7.80 10.60 26
PFM000070 30816 0.10 2016/05/23 4.7 6.4 1.64 45.2 2.48 139.4 5.2 3.18 1.36 0.046 0.24 0.80 0.0893 0.0883 0.0012 0.051 0.0084 7.35 7.22 19.59 25
PFM000070 30893 0.10 2016/06/27 5.1 21.6 2.20 59.3 4.99 172.1 34.0 5.26 2.34 0.159 0.31 4.52 0.2380 0.0260 0.0032 0.098 0.0078 7.36 7.22 19.00 40
PFM000070 30921 0.10 2016/09/04 5.2 6.2 1.33 45.0 2.32 131.2 4.6 7.04 2.87 0.049 0.21 2.66 0.3120 0.1150 0.0021 0.052 0.0102 7.01 7.34 12.23 25
PFM000070 30957 0.10 2016/11/07 3.1 6.3 2.09 43.9 2.67 127.5 7.0 12.90 4.65 0.034 < 0.2 3.45 0.2200 0.2070 0.0021 0.047 0.0037 6.96 7.73 0.36 26
PFM000070 30970 0.10 2016/12/06 4.6 7.0 2.41 36.6 2.51 110.6 7.2 6.78 2.51 0.045 0.22 2.29 0.0100 0.0037 < 0.004 0.042 0.0063 7.18 7.12 0.30 23
PFM000074 30731 0.50 2016/01/21 5.0 8.1 2.52 85.8 4.00 250.4 9.9 6.29 2.47 0.079 0.25 6.68 0.0884 0.0465 0.0024 0.094 0.0070 7.02 7.90 1.03 44
PFM000074 30773 0.50 2016/04/19 1.9 8.6 2.08 60.8 2.98 189.1 12.8 4.01 1.55 0.053 0.23 3.86 0.0397 0.0113 0.0015 0.068 0.0054 7.56 7.62 7.17 35
PFM000074 30911 0.50 2016/08/09 4.0 18.0 1.38 63.6 4.26 196.6 23.6 3.78 1.75 0.097 0.29 7.54 0.0333 0.0081 0.0023 0.093 0.0104 7.93 8.11 16.96 40
PFM000074 30945 0.50 2016/10/10 2.8 17.2 1.58 64.3 4.14 200.5 25.1 3.67 1.51 0.086 0.33 7.35 0.0199 0.0049 0.0022 0.087 0.0063 7.80 7.90 8.34 40
PFM000083 30943 0.50 2016/10/09 −2.6 1 450.0 53.30 74.9 167.00 76.5 2 725.0 386.00 128.00 8.980 0.40 0.50 0.0026 0.0009 0.0261 1.060 < 0.09 8.02 7.06 11.18 886
PFM000084 30944 0.50 2016/10/09 −2.1 1 470.0 53.50 75.4 167.00 79.4 2 726.0 408.90 129.00 8.790 0.35 0.53 0.0032 0.0018 0.0279 1.070 < 0.09 7.88 7.53 9.08 888
PFM000107 30726 0.50 2016/01/18 4.3 40.2 3.44 54.3 7.07 156.9 63.3 13.60 5.26 0.325 0.29 1.53 0.0378 0.0115 0.0031 0.102 0.0082 7.59 6.64 1.56 51
PFM000107 30725 1.00 2016/01/18 5.9 36.3 3.33 61.3 6.86 170.7 54.7 14.50 5.56 0.291 0.30 2.43 0.0674 0.0233 0.0031 0.107 0.0082 7.37 6.74 2.40 51
PFM000107 30774 0.50 2016/04/19 3.4 16.3 2.19 44.0 3.99 131.2 24.3 9.76 3.61 0.099 0.22 0.79 0.0448 0.0038 0.0019 0.068 0.0049 8.43 8.52 8.67 31

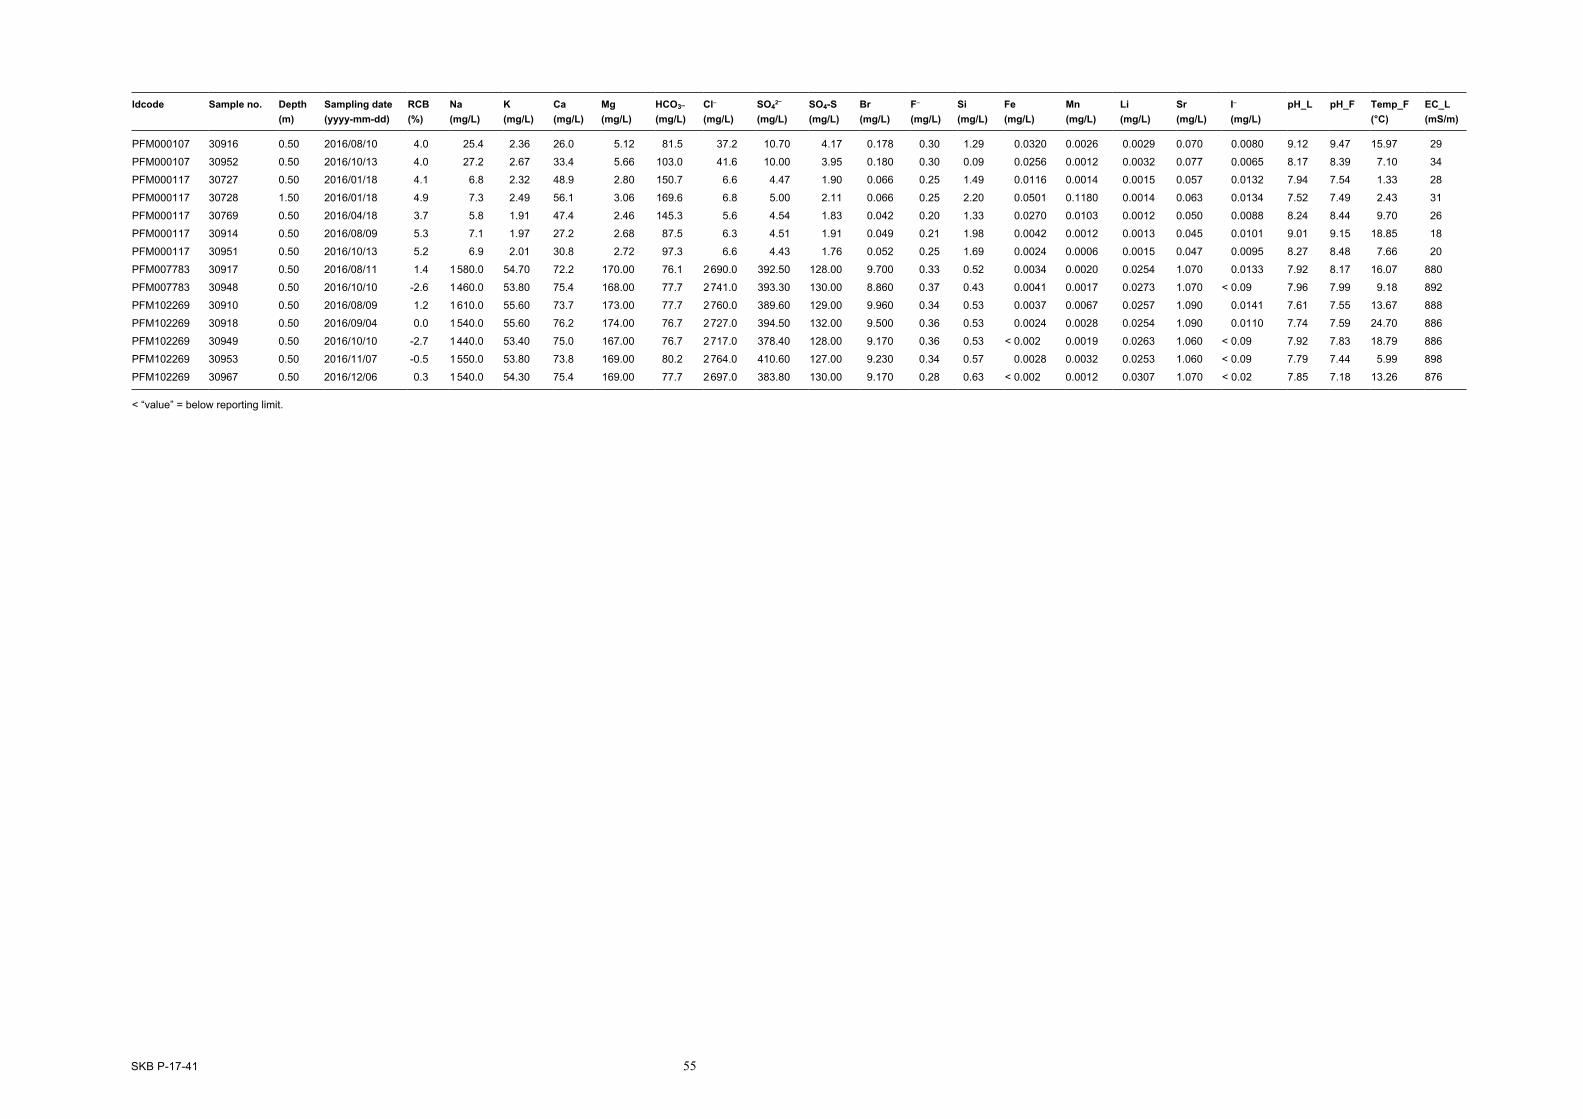
SKB P-17-41 55
Idcode Sample no. Depth Sampling date RCB Na K Ca Mg HCO3– Cl– SO42– SO4-S Br F– Si Fe Mn Li Sr I– pH_L pH_F Temp_F EC_L(m) (yyyy-mm-dd) (%) (mg/L) (mg/L) (mg/L) (mg/L) (mg/L) (mg/L) (mg/L) (mg/L) (mg/L) (mg/L) (mg/L) (mg/L) (mg/L) (mg/L) (mg/L) (mg/L) (°C) (mS/m)
PFM000107 30916 0.50 2016/08/10 4.0 25.4 2.36 26.0 5.12 81.5 37.2 10.70 4.17 0.178 0.30 1.29 0.0320 0.0026 0.0029 0.070 0.0080 9.12 9.47 15.97 29
PFM000107 30952 0.50 2016/10/13 4.0 27.2 2.67 33.4 5.66 103.0 41.6 10.00 3.95 0.180 0.30 0.09 0.0256 0.0012 0.0032 0.077 0.0065 8.17 8.39 7.10 34
PFM000117 30727 0.50 2016/01/18 4.1 6.8 2.32 48.9 2.80 150.7 6.6 4.47 1.90 0.066 0.25 1.49 0.0116 0.0014 0.0015 0.057 0.0132 7.94 7.54 1.33 28
PFM000117 30728 1.50 2016/01/18 4.9 7.3 2.49 56.1 3.06 169.6 6.8 5.00 2.11 0.066 0.25 2.20 0.0501 0.1180 0.0014 0.063 0.0134 7.52 7.49 2.43 31
PFM000117 30769 0.50 2016/04/18 3.7 5.8 1.91 47.4 2.46 145.3 5.6 4.54 1.83 0.042 0.20 1.33 0.0270 0.0103 0.0012 0.050 0.0088 8.24 8.44 9.70 26
PFM000117 30914 0.50 2016/08/09 5.3 7.1 1.97 27.2 2.68 87.5 6.3 4.51 1.91 0.049 0.21 1.98 0.0042 0.0012 0.0013 0.045 0.0101 9.01 9.15 18.85 18
PFM000117 30951 0.50 2016/10/13 5.2 6.9 2.01 30.8 2.72 97.3 6.6 4.43 1.76 0.052 0.25 1.69 0.0024 0.0006 0.0015 0.047 0.0095 8.27 8.48 7.66 20
PFM007783 30917 0.50 2016/08/11 1.4 1 580.0 54.70 72.2 170.00 76.1 2 690.0 392.50 128.00 9.700 0.33 0.52 0.0034 0.0020 0.0254 1.070 0.0133 7.92 8.17 16.07 880
PFM007783 30948 0.50 2016/10/10 -2.6 1 460.0 53.80 75.4 168.00 77.7 2 741.0 393.30 130.00 8.860 0.37 0.43 0.0041 0.0017 0.0273 1.070 < 0.09 7.96 7.99 9.18 892
PFM102269 30910 0.50 2016/08/09 1.2 1 610.0 55.60 73.7 173.00 77.7 2 760.0 389.60 129.00 9.960 0.34 0.53 0.0037 0.0067 0.0257 1.090 0.0141 7.61 7.55 13.67 888
PFM102269 30918 0.50 2016/09/04 0.0 1 540.0 55.60 76.2 174.00 76.7 2 727.0 394.50 132.00 9.500 0.36 0.53 0.0024 0.0028 0.0254 1.090 0.0110 7.74 7.59 24.70 886
PFM102269 30949 0.50 2016/10/10 -2.7 1 440.0 53.40 75.0 167.00 76.7 2 717.0 378.40 128.00 9.170 0.36 0.53 < 0.002 0.0019 0.0263 1.060 < 0.09 7.92 7.83 18.79 886
PFM102269 30953 0.50 2016/11/07 -0.5 1 550.0 53.80 73.8 169.00 80.2 2 764.0 410.60 127.00 9.230 0.34 0.57 0.0028 0.0032 0.0253 1.060 < 0.09 7.79 7.44 5.99 898
PFM102269 30967 0.50 2016/12/06 0.3 1 540.0 54.30 75.4 169.00 77.7 2 697.0 383.80 130.00 9.170 0.28 0.63 < 0.002 0.0012 0.0307 1.070 < 0.02 7.85 7.18 13.26 876
< “value” = below reporting limit.

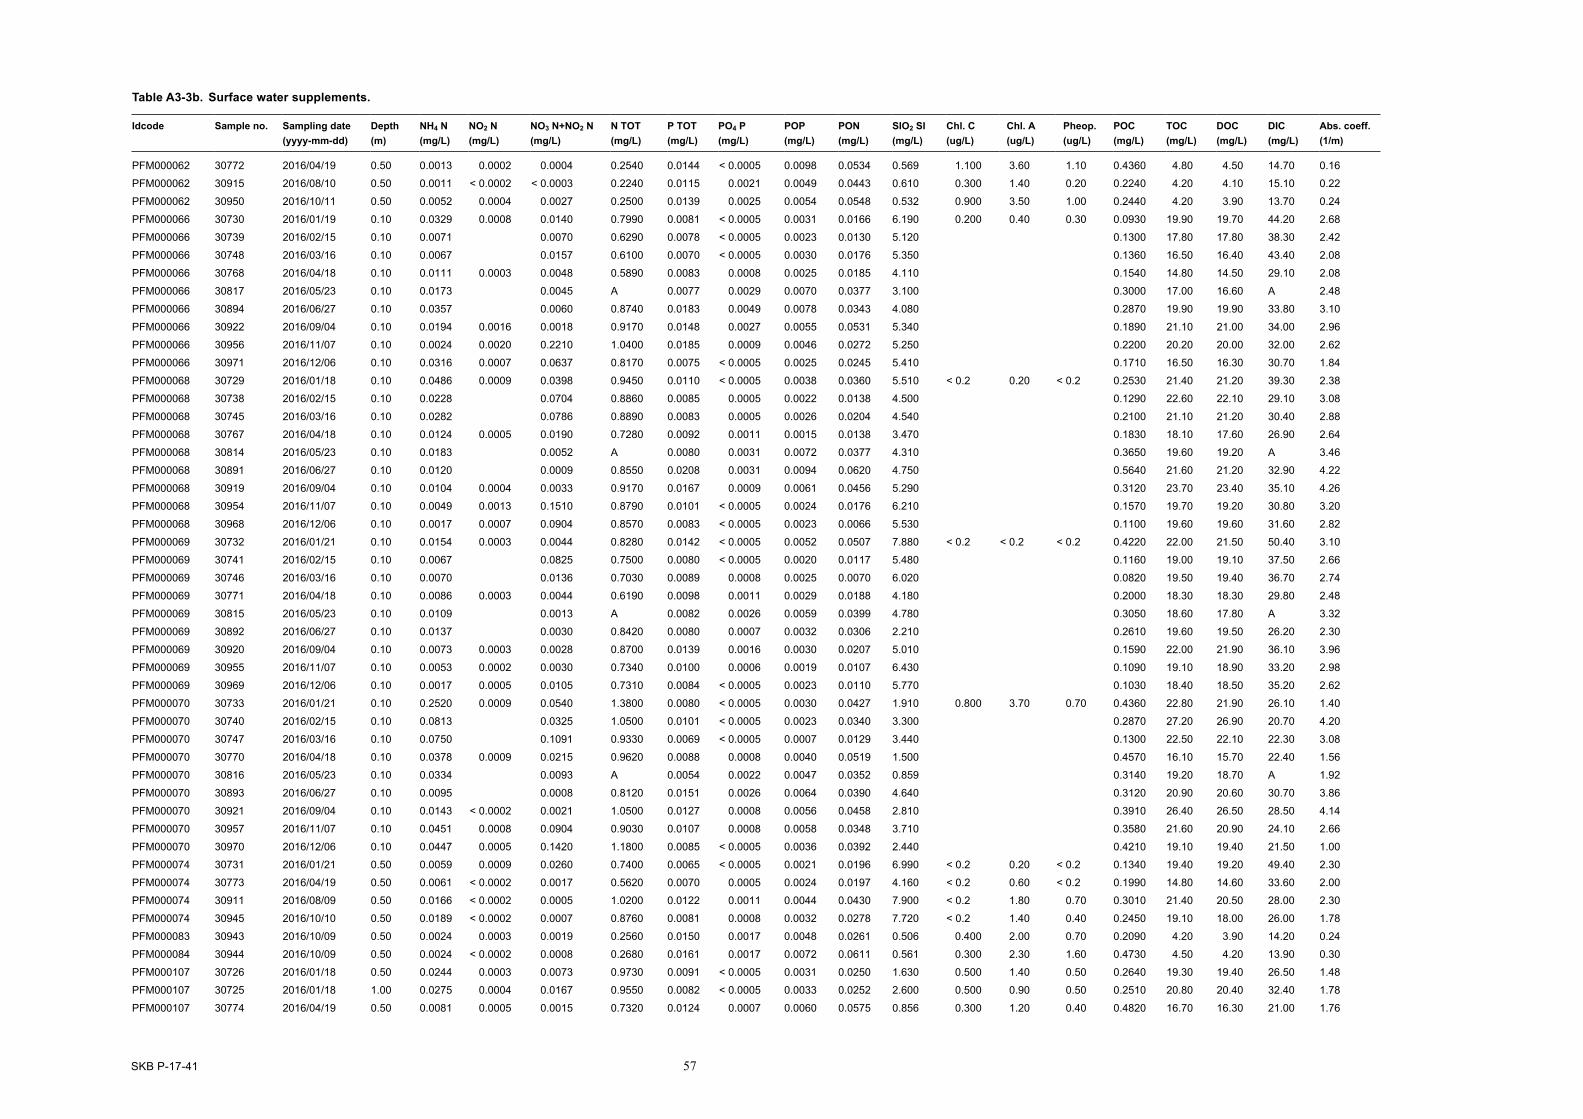
SKB P-17-41 57
Table A3-3b. Surface water supplements.
Idcode Sample no. Sampling date Depth NH4 N NO2 N NO3 N+NO2 N N TOT P TOT PO4 P POP PON SIO2 SI Chl. C Chl. A Pheop. POC TOC DOC DIC Abs. coeff.(yyyy-mm-dd) (m) (mg/L) (mg/L) (mg/L) (mg/L) (mg/L) (mg/L) (mg/L) (mg/L) (mg/L) (ug/L) (ug/L) (ug/L) (mg/L) (mg/L) (mg/L) (mg/L) (1/m)
PFM000062 30772 2016/04/19 0.50 0.0013 0.0002 0.0004 0.2540 0.0144 < 0.0005 0.0098 0.0534 0.569 1.100 3.60 1.10 0.4360 4.80 4.50 14.70 0.16
PFM000062 30915 2016/08/10 0.50 0.0011 < 0.0002 < 0.0003 0.2240 0.0115 0.0021 0.0049 0.0443 0.610 0.300 1.40 0.20 0.2240 4.20 4.10 15.10 0.22
PFM000062 30950 2016/10/11 0.50 0.0052 0.0004 0.0027 0.2500 0.0139 0.0025 0.0054 0.0548 0.532 0.900 3.50 1.00 0.2440 4.20 3.90 13.70 0.24
PFM000066 30730 2016/01/19 0.10 0.0329 0.0008 0.0140 0.7990 0.0081 < 0.0005 0.0031 0.0166 6.190 0.200 0.40 0.30 0.0930 19.90 19.70 44.20 2.68
PFM000066 30739 2016/02/15 0.10 0.0071 0.0070 0.6290 0.0078 < 0.0005 0.0023 0.0130 5.120 0.1300 17.80 17.80 38.30 2.42
PFM000066 30748 2016/03/16 0.10 0.0067 0.0157 0.6100 0.0070 < 0.0005 0.0030 0.0176 5.350 0.1360 16.50 16.40 43.40 2.08
PFM000066 30768 2016/04/18 0.10 0.0111 0.0003 0.0048 0.5890 0.0083 0.0008 0.0025 0.0185 4.110 0.1540 14.80 14.50 29.10 2.08
PFM000066 30817 2016/05/23 0.10 0.0173 0.0045 A 0.0077 0.0029 0.0070 0.0377 3.100 0.3000 17.00 16.60 A 2.48
PFM000066 30894 2016/06/27 0.10 0.0357 0.0060 0.8740 0.0183 0.0049 0.0078 0.0343 4.080 0.2870 19.90 19.90 33.80 3.10
PFM000066 30922 2016/09/04 0.10 0.0194 0.0016 0.0018 0.9170 0.0148 0.0027 0.0055 0.0531 5.340 0.1890 21.10 21.00 34.00 2.96
PFM000066 30956 2016/11/07 0.10 0.0024 0.0020 0.2210 1.0400 0.0185 0.0009 0.0046 0.0272 5.250 0.2200 20.20 20.00 32.00 2.62
PFM000066 30971 2016/12/06 0.10 0.0316 0.0007 0.0637 0.8170 0.0075 < 0.0005 0.0025 0.0245 5.410 0.1710 16.50 16.30 30.70 1.84
PFM000068 30729 2016/01/18 0.10 0.0486 0.0009 0.0398 0.9450 0.0110 < 0.0005 0.0038 0.0360 5.510 < 0.2 0.20 < 0.2 0.2530 21.40 21.20 39.30 2.38
PFM000068 30738 2016/02/15 0.10 0.0228 0.0704 0.8860 0.0085 0.0005 0.0022 0.0138 4.500 0.1290 22.60 22.10 29.10 3.08
PFM000068 30745 2016/03/16 0.10 0.0282 0.0786 0.8890 0.0083 0.0005 0.0026 0.0204 4.540 0.2100 21.10 21.20 30.40 2.88
PFM000068 30767 2016/04/18 0.10 0.0124 0.0005 0.0190 0.7280 0.0092 0.0011 0.0015 0.0138 3.470 0.1830 18.10 17.60 26.90 2.64
PFM000068 30814 2016/05/23 0.10 0.0183 0.0052 A 0.0080 0.0031 0.0072 0.0377 4.310 0.3650 19.60 19.20 A 3.46
PFM000068 30891 2016/06/27 0.10 0.0120 0.0009 0.8550 0.0208 0.0031 0.0094 0.0620 4.750 0.5640 21.60 21.20 32.90 4.22
PFM000068 30919 2016/09/04 0.10 0.0104 0.0004 0.0033 0.9170 0.0167 0.0009 0.0061 0.0456 5.290 0.3120 23.70 23.40 35.10 4.26
PFM000068 30954 2016/11/07 0.10 0.0049 0.0013 0.1510 0.8790 0.0101 < 0.0005 0.0024 0.0176 6.210 0.1570 19.70 19.20 30.80 3.20
PFM000068 30968 2016/12/06 0.10 0.0017 0.0007 0.0904 0.8570 0.0083 < 0.0005 0.0023 0.0066 5.530 0.1100 19.60 19.60 31.60 2.82
PFM000069 30732 2016/01/21 0.10 0.0154 0.0003 0.0044 0.8280 0.0142 < 0.0005 0.0052 0.0507 7.880 < 0.2 < 0.2 < 0.2 0.4220 22.00 21.50 50.40 3.10
PFM000069 30741 2016/02/15 0.10 0.0067 0.0825 0.7500 0.0080 < 0.0005 0.0020 0.0117 5.480 0.1160 19.00 19.10 37.50 2.66
PFM000069 30746 2016/03/16 0.10 0.0070 0.0136 0.7030 0.0089 0.0008 0.0025 0.0070 6.020 0.0820 19.50 19.40 36.70 2.74
PFM000069 30771 2016/04/18 0.10 0.0086 0.0003 0.0044 0.6190 0.0098 0.0011 0.0029 0.0188 4.180 0.2000 18.30 18.30 29.80 2.48
PFM000069 30815 2016/05/23 0.10 0.0109 0.0013 A 0.0082 0.0026 0.0059 0.0399 4.780 0.3050 18.60 17.80 A 3.32
PFM000069 30892 2016/06/27 0.10 0.0137 0.0030 0.8420 0.0080 0.0007 0.0032 0.0306 2.210 0.2610 19.60 19.50 26.20 2.30
PFM000069 30920 2016/09/04 0.10 0.0073 0.0003 0.0028 0.8700 0.0139 0.0016 0.0030 0.0207 5.010 0.1590 22.00 21.90 36.10 3.96
PFM000069 30955 2016/11/07 0.10 0.0053 0.0002 0.0030 0.7340 0.0100 0.0006 0.0019 0.0107 6.430 0.1090 19.10 18.90 33.20 2.98
PFM000069 30969 2016/12/06 0.10 0.0017 0.0005 0.0105 0.7310 0.0084 < 0.0005 0.0023 0.0110 5.770 0.1030 18.40 18.50 35.20 2.62
PFM000070 30733 2016/01/21 0.10 0.2520 0.0009 0.0540 1.3800 0.0080 < 0.0005 0.0030 0.0427 1.910 0.800 3.70 0.70 0.4360 22.80 21.90 26.10 1.40
PFM000070 30740 2016/02/15 0.10 0.0813 0.0325 1.0500 0.0101 < 0.0005 0.0023 0.0340 3.300 0.2870 27.20 26.90 20.70 4.20
PFM000070 30747 2016/03/16 0.10 0.0750 0.1091 0.9330 0.0069 < 0.0005 0.0007 0.0129 3.440 0.1300 22.50 22.10 22.30 3.08
PFM000070 30770 2016/04/18 0.10 0.0378 0.0009 0.0215 0.9620 0.0088 0.0008 0.0040 0.0519 1.500 0.4570 16.10 15.70 22.40 1.56
PFM000070 30816 2016/05/23 0.10 0.0334 0.0093 A 0.0054 0.0022 0.0047 0.0352 0.859 0.3140 19.20 18.70 A 1.92
PFM000070 30893 2016/06/27 0.10 0.0095 0.0008 0.8120 0.0151 0.0026 0.0064 0.0390 4.640 0.3120 20.90 20.60 30.70 3.86
PFM000070 30921 2016/09/04 0.10 0.0143 < 0.0002 0.0021 1.0500 0.0127 0.0008 0.0056 0.0458 2.810 0.3910 26.40 26.50 28.50 4.14
PFM000070 30957 2016/11/07 0.10 0.0451 0.0008 0.0904 0.9030 0.0107 0.0008 0.0058 0.0348 3.710 0.3580 21.60 20.90 24.10 2.66
PFM000070 30970 2016/12/06 0.10 0.0447 0.0005 0.1420 1.1800 0.0085 < 0.0005 0.0036 0.0392 2.440 0.4210 19.10 19.40 21.50 1.00
PFM000074 30731 2016/01/21 0.50 0.0059 0.0009 0.0260 0.7400 0.0065 < 0.0005 0.0021 0.0196 6.990 < 0.2 0.20 < 0.2 0.1340 19.40 19.20 49.40 2.30
PFM000074 30773 2016/04/19 0.50 0.0061 < 0.0002 0.0017 0.5620 0.0070 0.0005 0.0024 0.0197 4.160 < 0.2 0.60 < 0.2 0.1990 14.80 14.60 33.60 2.00
PFM000074 30911 2016/08/09 0.50 0.0166 < 0.0002 0.0005 1.0200 0.0122 0.0011 0.0044 0.0430 7.900 < 0.2 1.80 0.70 0.3010 21.40 20.50 28.00 2.30
PFM000074 30945 2016/10/10 0.50 0.0189 < 0.0002 0.0007 0.8760 0.0081 0.0008 0.0032 0.0278 7.720 < 0.2 1.40 0.40 0.2450 19.10 18.00 26.00 1.78
PFM000083 30943 2016/10/09 0.50 0.0024 0.0003 0.0019 0.2560 0.0150 0.0017 0.0048 0.0261 0.506 0.400 2.00 0.70 0.2090 4.20 3.90 14.20 0.24
PFM000084 30944 2016/10/09 0.50 0.0024 < 0.0002 0.0008 0.2680 0.0161 0.0017 0.0072 0.0611 0.561 0.300 2.30 1.60 0.4730 4.50 4.20 13.90 0.30
PFM000107 30726 2016/01/18 0.50 0.0244 0.0003 0.0073 0.9730 0.0091 < 0.0005 0.0031 0.0250 1.630 0.500 1.40 0.50 0.2640 19.30 19.40 26.50 1.48
PFM000107 30725 2016/01/18 1.00 0.0275 0.0004 0.0167 0.9550 0.0082 < 0.0005 0.0033 0.0252 2.600 0.500 0.90 0.50 0.2510 20.80 20.40 32.40 1.78
PFM000107 30774 2016/04/19 0.50 0.0081 0.0005 0.0015 0.7320 0.0124 0.0007 0.0060 0.0575 0.856 0.300 1.20 0.40 0.4820 16.70 16.30 21.00 1.76

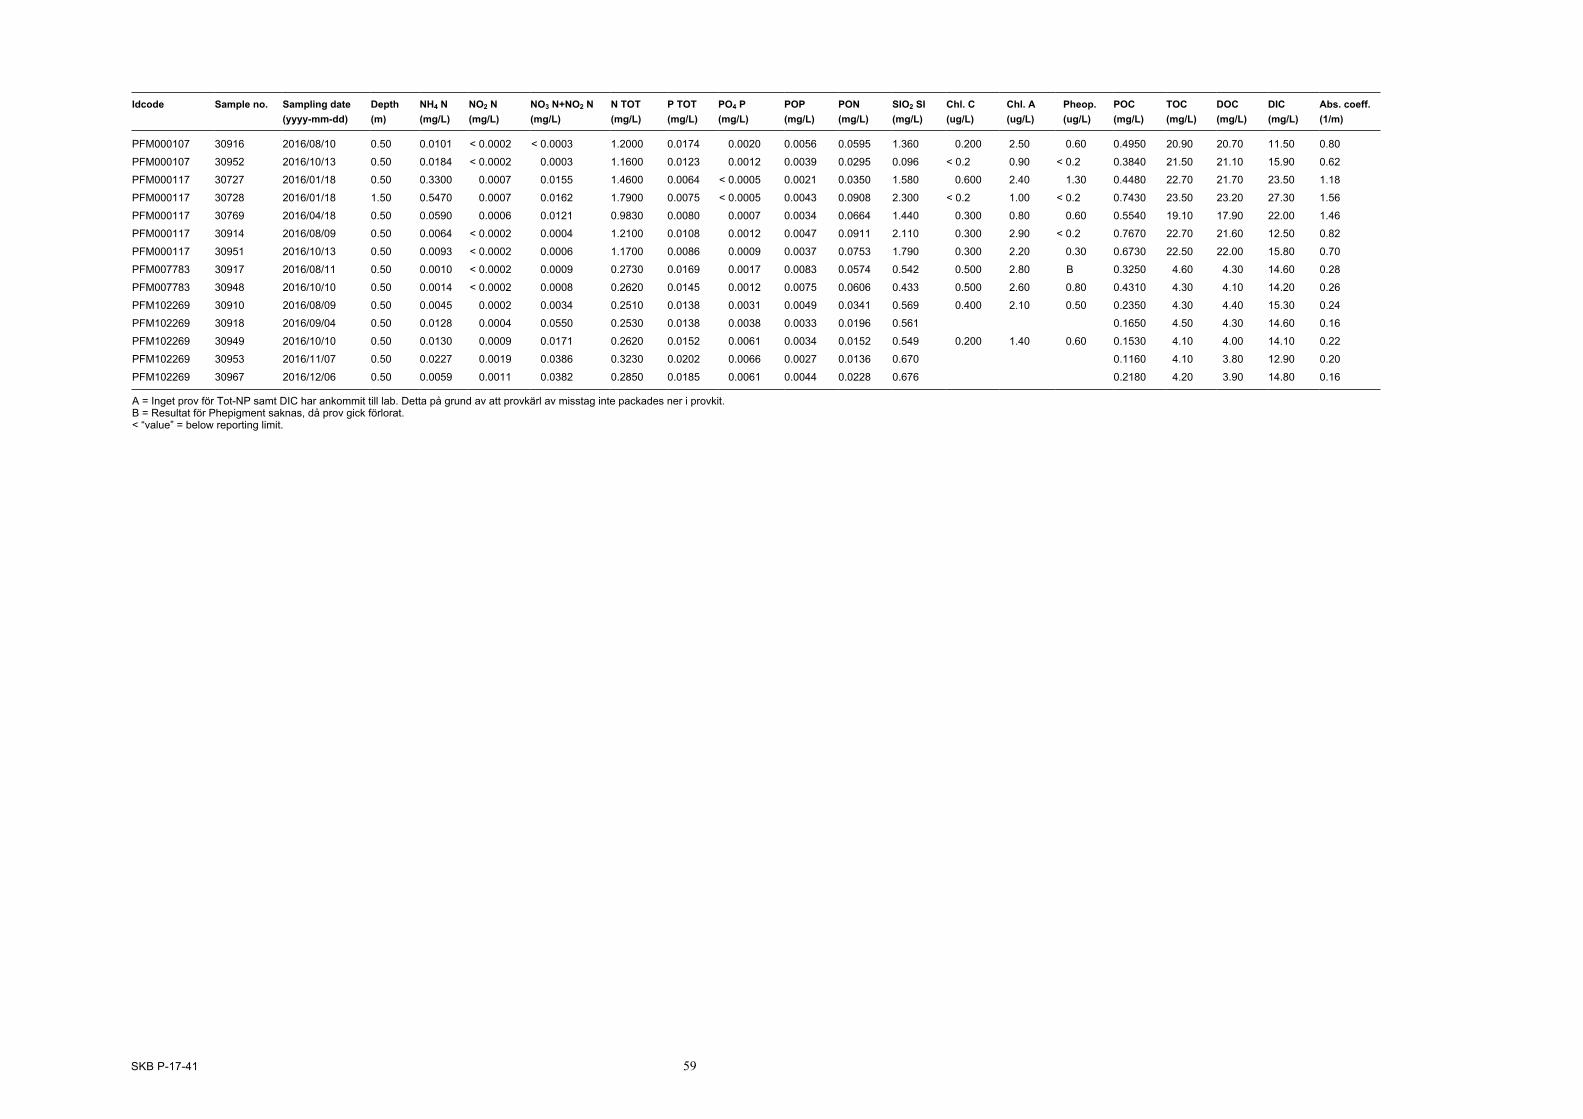
SKB P-17-41 59
Idcode Sample no. Sampling date Depth NH4 N NO2 N NO3 N+NO2 N N TOT P TOT PO4 P POP PON SIO2 SI Chl. C Chl. A Pheop. POC TOC DOC DIC Abs. coeff.(yyyy-mm-dd) (m) (mg/L) (mg/L) (mg/L) (mg/L) (mg/L) (mg/L) (mg/L) (mg/L) (mg/L) (ug/L) (ug/L) (ug/L) (mg/L) (mg/L) (mg/L) (mg/L) (1/m)
PFM000107 30916 2016/08/10 0.50 0.0101 < 0.0002 < 0.0003 1.2000 0.0174 0.0020 0.0056 0.0595 1.360 0.200 2.50 0.60 0.4950 20.90 20.70 11.50 0.80
PFM000107 30952 2016/10/13 0.50 0.0184 < 0.0002 0.0003 1.1600 0.0123 0.0012 0.0039 0.0295 0.096 < 0.2 0.90 < 0.2 0.3840 21.50 21.10 15.90 0.62
PFM000117 30727 2016/01/18 0.50 0.3300 0.0007 0.0155 1.4600 0.0064 < 0.0005 0.0021 0.0350 1.580 0.600 2.40 1.30 0.4480 22.70 21.70 23.50 1.18
PFM000117 30728 2016/01/18 1.50 0.5470 0.0007 0.0162 1.7900 0.0075 < 0.0005 0.0043 0.0908 2.300 < 0.2 1.00 < 0.2 0.7430 23.50 23.20 27.30 1.56
PFM000117 30769 2016/04/18 0.50 0.0590 0.0006 0.0121 0.9830 0.0080 0.0007 0.0034 0.0664 1.440 0.300 0.80 0.60 0.5540 19.10 17.90 22.00 1.46
PFM000117 30914 2016/08/09 0.50 0.0064 < 0.0002 0.0004 1.2100 0.0108 0.0012 0.0047 0.0911 2.110 0.300 2.90 < 0.2 0.7670 22.70 21.60 12.50 0.82
PFM000117 30951 2016/10/13 0.50 0.0093 < 0.0002 0.0006 1.1700 0.0086 0.0009 0.0037 0.0753 1.790 0.300 2.20 0.30 0.6730 22.50 22.00 15.80 0.70
PFM007783 30917 2016/08/11 0.50 0.0010 < 0.0002 0.0009 0.2730 0.0169 0.0017 0.0083 0.0574 0.542 0.500 2.80 B 0.3250 4.60 4.30 14.60 0.28
PFM007783 30948 2016/10/10 0.50 0.0014 < 0.0002 0.0008 0.2620 0.0145 0.0012 0.0075 0.0606 0.433 0.500 2.60 0.80 0.4310 4.30 4.10 14.20 0.26
PFM102269 30910 2016/08/09 0.50 0.0045 0.0002 0.0034 0.2510 0.0138 0.0031 0.0049 0.0341 0.569 0.400 2.10 0.50 0.2350 4.30 4.40 15.30 0.24
PFM102269 30918 2016/09/04 0.50 0.0128 0.0004 0.0550 0.2530 0.0138 0.0038 0.0033 0.0196 0.561 0.1650 4.50 4.30 14.60 0.16
PFM102269 30949 2016/10/10 0.50 0.0130 0.0009 0.0171 0.2620 0.0152 0.0061 0.0034 0.0152 0.549 0.200 1.40 0.60 0.1530 4.10 4.00 14.10 0.22
PFM102269 30953 2016/11/07 0.50 0.0227 0.0019 0.0386 0.3230 0.0202 0.0066 0.0027 0.0136 0.670 0.1160 4.10 3.80 12.90 0.20
PFM102269 30967 2016/12/06 0.50 0.0059 0.0011 0.0382 0.2850 0.0185 0.0061 0.0044 0.0228 0.676 0.2180 4.20 3.90 14.80 0.16
A = Inget prov för Tot-NP samt DIC har ankommit till lab. Detta på grund av att provkärl av misstag inte packades ner i provkit. B = Resultat för Phepigment saknas, då prov gick förlorat.< “value” = below reporting limit.

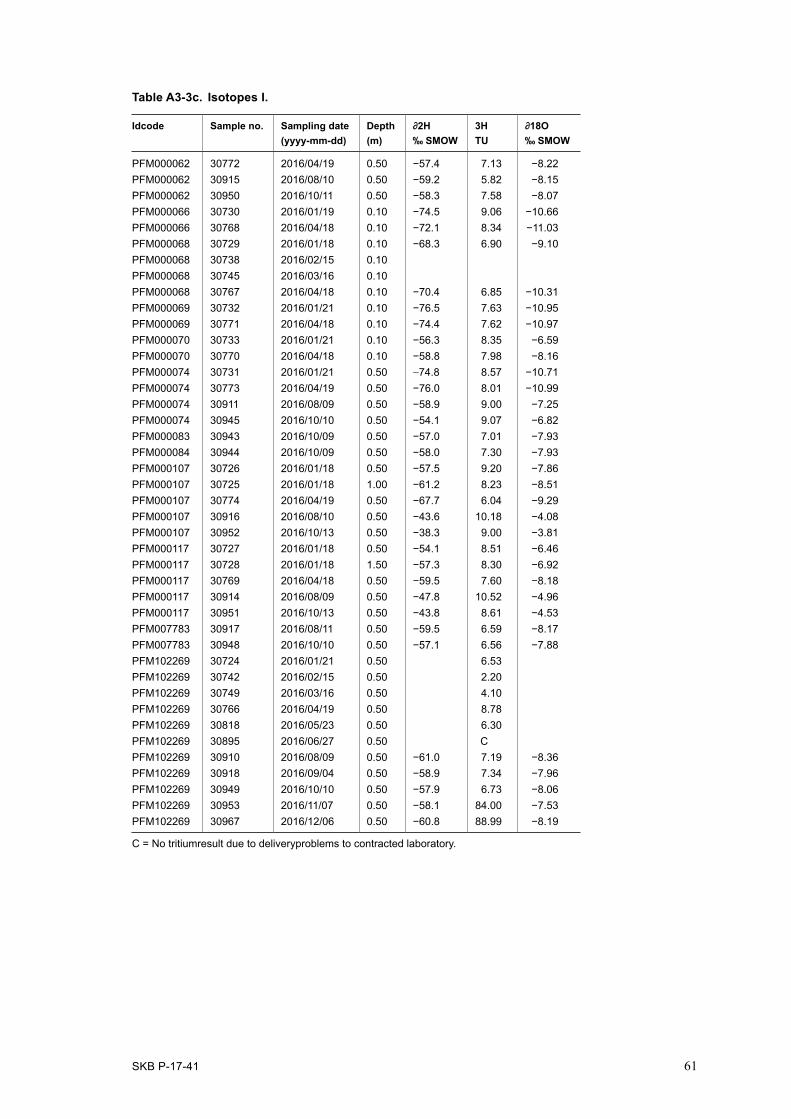
SKB P-17-41 61
Table A3-3c. Isotopes I.
Idcode Sample no. Sampling date Depth ∂2H 3H ∂18O(yyyy-mm-dd) (m) ‰ SMOW TU ‰ SMOW
PFM000062 30772 2016/04/19 0.50 −57.4 7.13 −8.22PFM000062 30915 2016/08/10 0.50 −59.2 5.82 −8.15PFM000062 30950 2016/10/11 0.50 −58.3 7.58 −8.07PFM000066 30730 2016/01/19 0.10 −74.5 9.06 −10.66PFM000066 30768 2016/04/18 0.10 −72.1 8.34 −11.03PFM000068 30729 2016/01/18 0.10 −68.3 6.90 −9.10PFM000068 30738 2016/02/15 0.10PFM000068 30745 2016/03/16 0.10PFM000068 30767 2016/04/18 0.10 −70.4 6.85 −10.31PFM000069 30732 2016/01/21 0.10 −76.5 7.63 −10.95PFM000069 30771 2016/04/18 0.10 −74.4 7.62 −10.97PFM000070 30733 2016/01/21 0.10 −56.3 8.35 −6.59PFM000070 30770 2016/04/18 0.10 −58.8 7.98 −8.16PFM000074 30731 2016/01/21 0.50 −74.8 8.57 −10.71PFM000074 30773 2016/04/19 0.50 −76.0 8.01 −10.99PFM000074 30911 2016/08/09 0.50 −58.9 9.00 −7.25PFM000074 30945 2016/10/10 0.50 −54.1 9.07 −6.82PFM000083 30943 2016/10/09 0.50 −57.0 7.01 −7.93PFM000084 30944 2016/10/09 0.50 −58.0 7.30 −7.93PFM000107 30726 2016/01/18 0.50 −57.5 9.20 −7.86PFM000107 30725 2016/01/18 1.00 −61.2 8.23 −8.51PFM000107 30774 2016/04/19 0.50 −67.7 6.04 −9.29PFM000107 30916 2016/08/10 0.50 −43.6 10.18 −4.08PFM000107 30952 2016/10/13 0.50 −38.3 9.00 −3.81PFM000117 30727 2016/01/18 0.50 −54.1 8.51 −6.46PFM000117 30728 2016/01/18 1.50 −57.3 8.30 −6.92PFM000117 30769 2016/04/18 0.50 −59.5 7.60 −8.18PFM000117 30914 2016/08/09 0.50 −47.8 10.52 −4.96PFM000117 30951 2016/10/13 0.50 −43.8 8.61 −4.53PFM007783 30917 2016/08/11 0.50 −59.5 6.59 −8.17PFM007783 30948 2016/10/10 0.50 −57.1 6.56 −7.88PFM102269 30724 2016/01/21 0.50 6.53PFM102269 30742 2016/02/15 0.50 2.20PFM102269 30749 2016/03/16 0.50 4.10PFM102269 30766 2016/04/19 0.50 8.78PFM102269 30818 2016/05/23 0.50 6.30PFM102269 30895 2016/06/27 0.50 CPFM102269 30910 2016/08/09 0.50 −61.0 7.19 −8.36PFM102269 30918 2016/09/04 0.50 −58.9 7.34 −7.96PFM102269 30949 2016/10/10 0.50 −57.9 6.73 −8.06PFM102269 30953 2016/11/07 0.50 −58.1 84.00 −7.53PFM102269 30967 2016/12/06 0.50 −60.8 88.99 −8.19
C = No tritiumresult due to deliveryproblems to contracted laboratory.

62 SKB P-17-41
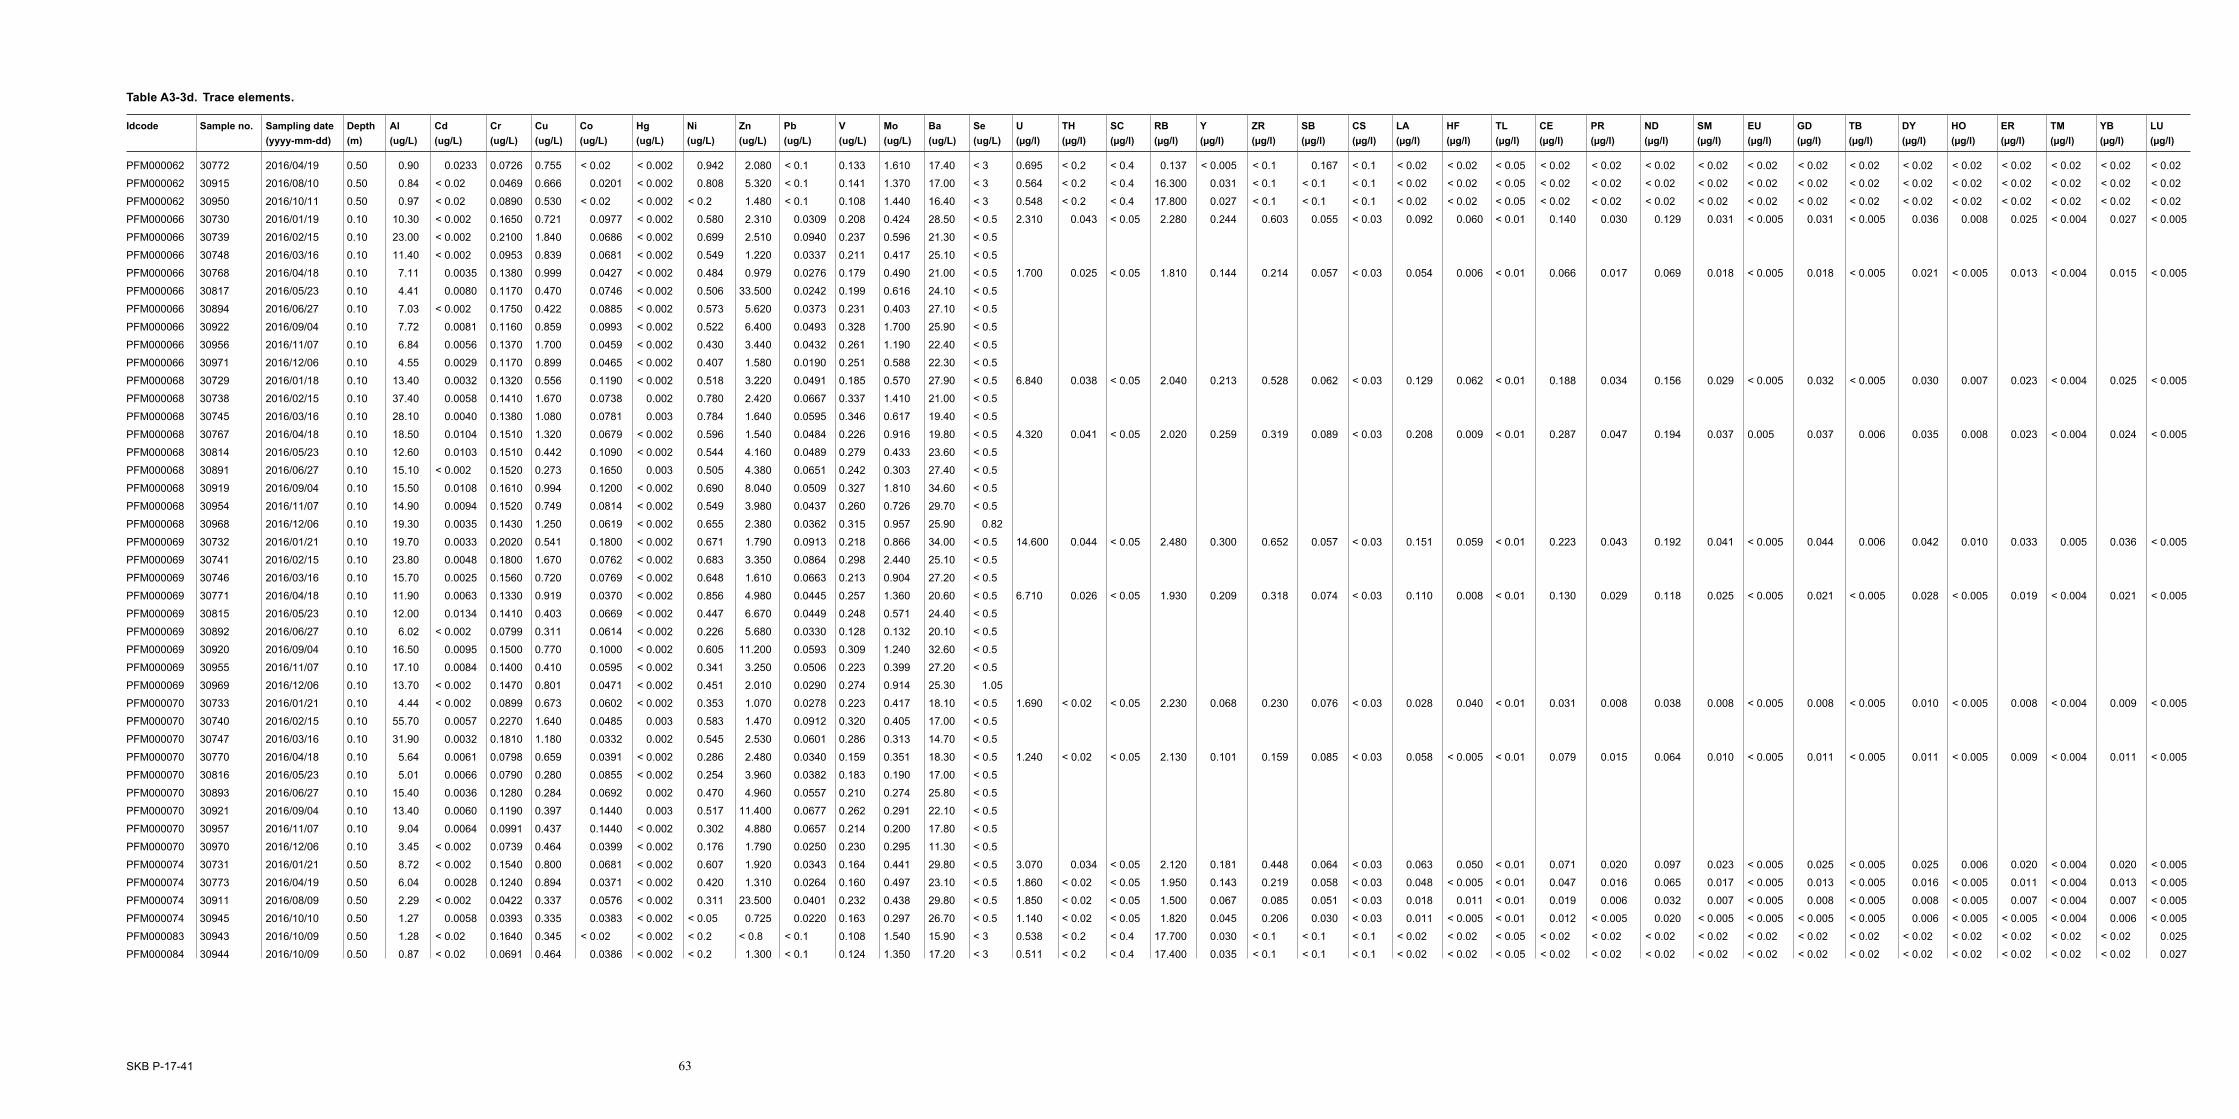
SKB P-17-41 63
Table A3-3d. Trace elements.
Idcode Sample no. Sampling date Depth Al Cd Cr Cu Co Hg Ni Zn Pb V Mo Ba Se U TH SC RB Y ZR SB CS LA HF TL CE PR ND SM EU GD TB DY HO ER TM YB LU(yyyy-mm-dd) (m) (ug/L) (ug/L) (ug/L) (ug/L) (ug/L) (ug/L) (ug/L) (ug/L) (ug/L) (ug/L) (ug/L) (ug/L) (ug/L) (µg/l) (µg/l) (µg/l) (µg/l) (µg/l) (µg/l) (µg/l) (µg/l) (µg/l) (µg/l) (µg/l) (µg/l) (µg/l) (µg/l) (µg/l) (µg/l) (µg/l) (µg/l) (µg/l) (µg/l) (µg/l) (µg/l) (µg/l) (µg/l)
PFM000062 30772 2016/04/19 0.50 0.90 0.0233 0.0726 0.755 < 0.02 < 0.002 0.942 2.080 < 0.1 0.133 1.610 17.40 < 3 0.695 < 0.2 < 0.4 0.137 < 0.005 < 0.1 0.167 < 0.1 < 0.02 < 0.02 < 0.05 < 0.02 < 0.02 < 0.02 < 0.02 < 0.02 < 0.02 < 0.02 < 0.02 < 0.02 < 0.02 < 0.02 < 0.02 < 0.02
PFM000062 30915 2016/08/10 0.50 0.84 < 0.02 0.0469 0.666 0.0201 < 0.002 0.808 5.320 < 0.1 0.141 1.370 17.00 < 3 0.564 < 0.2 < 0.4 16.300 0.031 < 0.1 < 0.1 < 0.1 < 0.02 < 0.02 < 0.05 < 0.02 < 0.02 < 0.02 < 0.02 < 0.02 < 0.02 < 0.02 < 0.02 < 0.02 < 0.02 < 0.02 < 0.02 < 0.02
PFM000062 30950 2016/10/11 0.50 0.97 < 0.02 0.0890 0.530 < 0.02 < 0.002 < 0.2 1.480 < 0.1 0.108 1.440 16.40 < 3 0.548 < 0.2 < 0.4 17.800 0.027 < 0.1 < 0.1 < 0.1 < 0.02 < 0.02 < 0.05 < 0.02 < 0.02 < 0.02 < 0.02 < 0.02 < 0.02 < 0.02 < 0.02 < 0.02 < 0.02 < 0.02 < 0.02 < 0.02
PFM000066 30730 2016/01/19 0.10 10.30 < 0.002 0.1650 0.721 0.0977 < 0.002 0.580 2.310 0.0309 0.208 0.424 28.50 < 0.5 2.310 0.043 < 0.05 2.280 0.244 0.603 0.055 < 0.03 0.092 0.060 < 0.01 0.140 0.030 0.129 0.031 < 0.005 0.031 < 0.005 0.036 0.008 0.025 < 0.004 0.027 < 0.005
PFM000066 30739 2016/02/15 0.10 23.00 < 0.002 0.2100 1.840 0.0686 < 0.002 0.699 2.510 0.0940 0.237 0.596 21.30 < 0.5
PFM000066 30748 2016/03/16 0.10 11.40 < 0.002 0.0953 0.839 0.0681 < 0.002 0.549 1.220 0.0337 0.211 0.417 25.10 < 0.5
PFM000066 30768 2016/04/18 0.10 7.11 0.0035 0.1380 0.999 0.0427 < 0.002 0.484 0.979 0.0276 0.179 0.490 21.00 < 0.5 1.700 0.025 < 0.05 1.810 0.144 0.214 0.057 < 0.03 0.054 0.006 < 0.01 0.066 0.017 0.069 0.018 < 0.005 0.018 < 0.005 0.021 < 0.005 0.013 < 0.004 0.015 < 0.005
PFM000066 30817 2016/05/23 0.10 4.41 0.0080 0.1170 0.470 0.0746 < 0.002 0.506 33.500 0.0242 0.199 0.616 24.10 < 0.5
PFM000066 30894 2016/06/27 0.10 7.03 < 0.002 0.1750 0.422 0.0885 < 0.002 0.573 5.620 0.0373 0.231 0.403 27.10 < 0.5
PFM000066 30922 2016/09/04 0.10 7.72 0.0081 0.1160 0.859 0.0993 < 0.002 0.522 6.400 0.0493 0.328 1.700 25.90 < 0.5
PFM000066 30956 2016/11/07 0.10 6.84 0.0056 0.1370 1.700 0.0459 < 0.002 0.430 3.440 0.0432 0.261 1.190 22.40 < 0.5
PFM000066 30971 2016/12/06 0.10 4.55 0.0029 0.1170 0.899 0.0465 < 0.002 0.407 1.580 0.0190 0.251 0.588 22.30 < 0.5
PFM000068 30729 2016/01/18 0.10 13.40 0.0032 0.1320 0.556 0.1190 < 0.002 0.518 3.220 0.0491 0.185 0.570 27.90 < 0.5 6.840 0.038 < 0.05 2.040 0.213 0.528 0.062 < 0.03 0.129 0.062 < 0.01 0.188 0.034 0.156 0.029 < 0.005 0.032 < 0.005 0.030 0.007 0.023 < 0.004 0.025 < 0.005
PFM000068 30738 2016/02/15 0.10 37.40 0.0058 0.1410 1.670 0.0738 0.002 0.780 2.420 0.0667 0.337 1.410 21.00 < 0.5
PFM000068 30745 2016/03/16 0.10 28.10 0.0040 0.1380 1.080 0.0781 0.003 0.784 1.640 0.0595 0.346 0.617 19.40 < 0.5
PFM000068 30767 2016/04/18 0.10 18.50 0.0104 0.1510 1.320 0.0679 < 0.002 0.596 1.540 0.0484 0.226 0.916 19.80 < 0.5 4.320 0.041 < 0.05 2.020 0.259 0.319 0.089 < 0.03 0.208 0.009 < 0.01 0.287 0.047 0.194 0.037 0.005 0.037 0.006 0.035 0.008 0.023 < 0.004 0.024 < 0.005
PFM000068 30814 2016/05/23 0.10 12.60 0.0103 0.1510 0.442 0.1090 < 0.002 0.544 4.160 0.0489 0.279 0.433 23.60 < 0.5
PFM000068 30891 2016/06/27 0.10 15.10 < 0.002 0.1520 0.273 0.1650 0.003 0.505 4.380 0.0651 0.242 0.303 27.40 < 0.5
PFM000068 30919 2016/09/04 0.10 15.50 0.0108 0.1610 0.994 0.1200 < 0.002 0.690 8.040 0.0509 0.327 1.810 34.60 < 0.5
PFM000068 30954 2016/11/07 0.10 14.90 0.0094 0.1520 0.749 0.0814 < 0.002 0.549 3.980 0.0437 0.260 0.726 29.70 < 0.5
PFM000068 30968 2016/12/06 0.10 19.30 0.0035 0.1430 1.250 0.0619 < 0.002 0.655 2.380 0.0362 0.315 0.957 25.90 0.82
PFM000069 30732 2016/01/21 0.10 19.70 0.0033 0.2020 0.541 0.1800 < 0.002 0.671 1.790 0.0913 0.218 0.866 34.00 < 0.5 14.600 0.044 < 0.05 2.480 0.300 0.652 0.057 < 0.03 0.151 0.059 < 0.01 0.223 0.043 0.192 0.041 < 0.005 0.044 0.006 0.042 0.010 0.033 0.005 0.036 < 0.005
PFM000069 30741 2016/02/15 0.10 23.80 0.0048 0.1800 1.670 0.0762 < 0.002 0.683 3.350 0.0864 0.298 2.440 25.10 < 0.5
PFM000069 30746 2016/03/16 0.10 15.70 0.0025 0.1560 0.720 0.0769 < 0.002 0.648 1.610 0.0663 0.213 0.904 27.20 < 0.5
PFM000069 30771 2016/04/18 0.10 11.90 0.0063 0.1330 0.919 0.0370 < 0.002 0.856 4.980 0.0445 0.257 1.360 20.60 < 0.5 6.710 0.026 < 0.05 1.930 0.209 0.318 0.074 < 0.03 0.110 0.008 < 0.01 0.130 0.029 0.118 0.025 < 0.005 0.021 < 0.005 0.028 < 0.005 0.019 < 0.004 0.021 < 0.005
PFM000069 30815 2016/05/23 0.10 12.00 0.0134 0.1410 0.403 0.0669 < 0.002 0.447 6.670 0.0449 0.248 0.571 24.40 < 0.5
PFM000069 30892 2016/06/27 0.10 6.02 < 0.002 0.0799 0.311 0.0614 < 0.002 0.226 5.680 0.0330 0.128 0.132 20.10 < 0.5
PFM000069 30920 2016/09/04 0.10 16.50 0.0095 0.1500 0.770 0.1000 < 0.002 0.605 11.200 0.0593 0.309 1.240 32.60 < 0.5
PFM000069 30955 2016/11/07 0.10 17.10 0.0084 0.1400 0.410 0.0595 < 0.002 0.341 3.250 0.0506 0.223 0.399 27.20 < 0.5
PFM000069 30969 2016/12/06 0.10 13.70 < 0.002 0.1470 0.801 0.0471 < 0.002 0.451 2.010 0.0290 0.274 0.914 25.30 1.05
PFM000070 30733 2016/01/21 0.10 4.44 < 0.002 0.0899 0.673 0.0602 < 0.002 0.353 1.070 0.0278 0.223 0.417 18.10 < 0.5 1.690 < 0.02 < 0.05 2.230 0.068 0.230 0.076 < 0.03 0.028 0.040 < 0.01 0.031 0.008 0.038 0.008 < 0.005 0.008 < 0.005 0.010 < 0.005 0.008 < 0.004 0.009 < 0.005
PFM000070 30740 2016/02/15 0.10 55.70 0.0057 0.2270 1.640 0.0485 0.003 0.583 1.470 0.0912 0.320 0.405 17.00 < 0.5
PFM000070 30747 2016/03/16 0.10 31.90 0.0032 0.1810 1.180 0.0332 0.002 0.545 2.530 0.0601 0.286 0.313 14.70 < 0.5
PFM000070 30770 2016/04/18 0.10 5.64 0.0061 0.0798 0.659 0.0391 < 0.002 0.286 2.480 0.0340 0.159 0.351 18.30 < 0.5 1.240 < 0.02 < 0.05 2.130 0.101 0.159 0.085 < 0.03 0.058 < 0.005 < 0.01 0.079 0.015 0.064 0.010 < 0.005 0.011 < 0.005 0.011 < 0.005 0.009 < 0.004 0.011 < 0.005
PFM000070 30816 2016/05/23 0.10 5.01 0.0066 0.0790 0.280 0.0855 < 0.002 0.254 3.960 0.0382 0.183 0.190 17.00 < 0.5
PFM000070 30893 2016/06/27 0.10 15.40 0.0036 0.1280 0.284 0.0692 0.002 0.470 4.960 0.0557 0.210 0.274 25.80 < 0.5
PFM000070 30921 2016/09/04 0.10 13.40 0.0060 0.1190 0.397 0.1440 0.003 0.517 11.400 0.0677 0.262 0.291 22.10 < 0.5
PFM000070 30957 2016/11/07 0.10 9.04 0.0064 0.0991 0.437 0.1440 < 0.002 0.302 4.880 0.0657 0.214 0.200 17.80 < 0.5
PFM000070 30970 2016/12/06 0.10 3.45 < 0.002 0.0739 0.464 0.0399 < 0.002 0.176 1.790 0.0250 0.230 0.295 11.30 < 0.5
PFM000074 30731 2016/01/21 0.50 8.72 < 0.002 0.1540 0.800 0.0681 < 0.002 0.607 1.920 0.0343 0.164 0.441 29.80 < 0.5 3.070 0.034 < 0.05 2.120 0.181 0.448 0.064 < 0.03 0.063 0.050 < 0.01 0.071 0.020 0.097 0.023 < 0.005 0.025 < 0.005 0.025 0.006 0.020 < 0.004 0.020 < 0.005
PFM000074 30773 2016/04/19 0.50 6.04 0.0028 0.1240 0.894 0.0371 < 0.002 0.420 1.310 0.0264 0.160 0.497 23.10 < 0.5 1.860 < 0.02 < 0.05 1.950 0.143 0.219 0.058 < 0.03 0.048 < 0.005 < 0.01 0.047 0.016 0.065 0.017 < 0.005 0.013 < 0.005 0.016 < 0.005 0.011 < 0.004 0.013 < 0.005
PFM000074 30911 2016/08/09 0.50 2.29 < 0.002 0.0422 0.337 0.0576 < 0.002 0.311 23.500 0.0401 0.232 0.438 29.80 < 0.5 1.850 < 0.02 < 0.05 1.500 0.067 0.085 0.051 < 0.03 0.018 0.011 < 0.01 0.019 0.006 0.032 0.007 < 0.005 0.008 < 0.005 0.008 < 0.005 0.007 < 0.004 0.007 < 0.005
PFM000074 30945 2016/10/10 0.50 1.27 0.0058 0.0393 0.335 0.0383 < 0.002 < 0.05 0.725 0.0220 0.163 0.297 26.70 < 0.5 1.140 < 0.02 < 0.05 1.820 0.045 0.206 0.030 < 0.03 0.011 < 0.005 < 0.01 0.012 < 0.005 0.020 < 0.005 < 0.005 < 0.005 < 0.005 0.006 < 0.005 < 0.005 < 0.004 0.006 < 0.005
PFM000083 30943 2016/10/09 0.50 1.28 < 0.02 0.1640 0.345 < 0.02 < 0.002 < 0.2 < 0.8 < 0.1 0.108 1.540 15.90 < 3 0.538 < 0.2 < 0.4 17.700 0.030 < 0.1 < 0.1 < 0.1 < 0.02 < 0.02 < 0.05 < 0.02 < 0.02 < 0.02 < 0.02 < 0.02 < 0.02 < 0.02 < 0.02 < 0.02 < 0.02 < 0.02 < 0.02 0.025
PFM000084 30944 2016/10/09 0.50 0.87 < 0.02 0.0691 0.464 0.0386 < 0.002 < 0.2 1.300 < 0.1 0.124 1.350 17.20 < 3 0.511 < 0.2 < 0.4 17.400 0.035 < 0.1 < 0.1 < 0.1 < 0.02 < 0.02 < 0.05 < 0.02 < 0.02 < 0.02 < 0.02 < 0.02 < 0.02 < 0.02 < 0.02 < 0.02 < 0.02 < 0.02 < 0.02 0.027

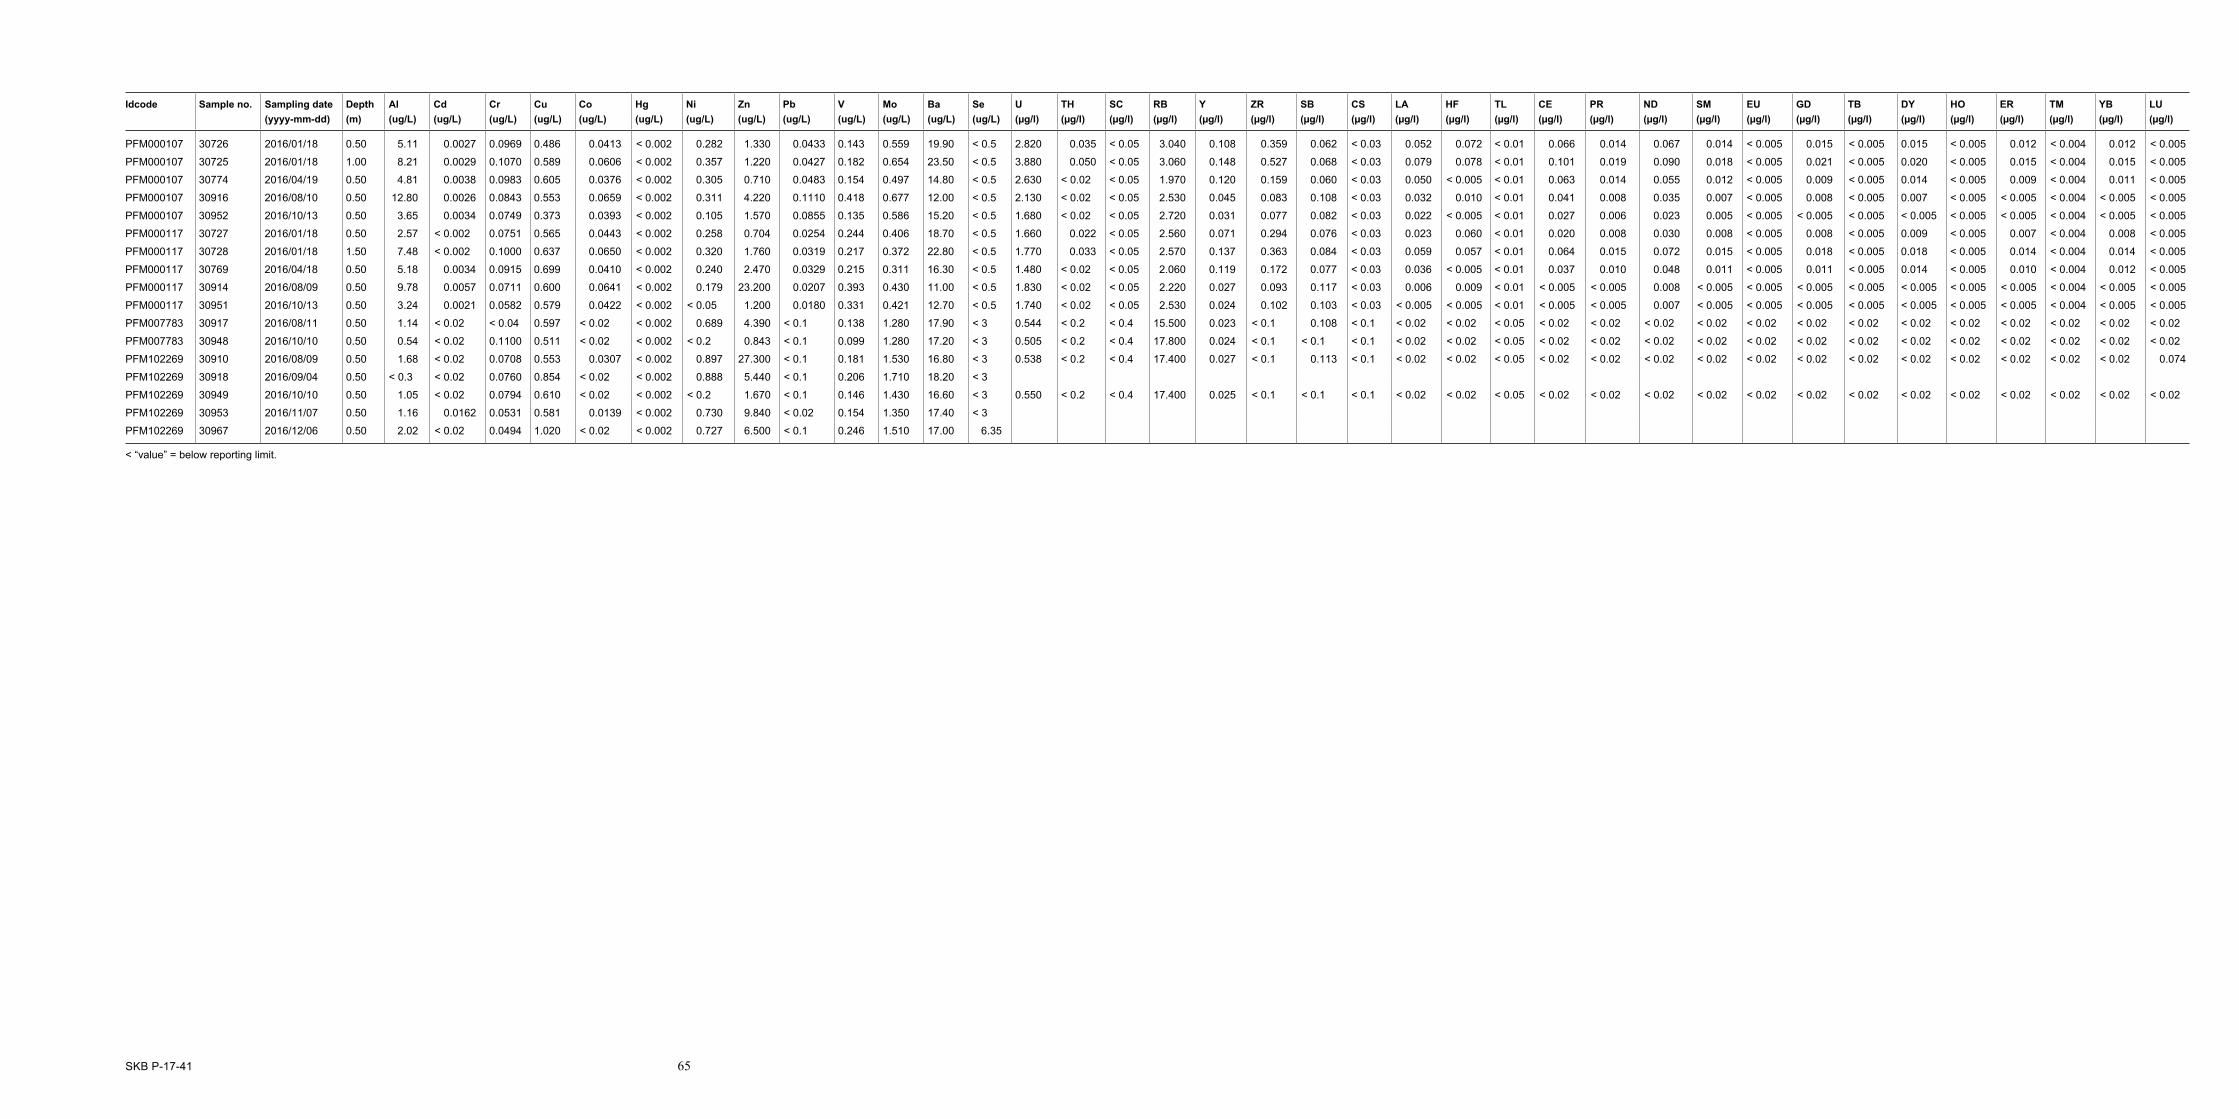
Idcode Sample no. Sampling date Depth Al Cd Cr Cu Co Hg Ni Zn Pb V Mo Ba Se U TH SC RB Y ZR SB CS LA HF TL CE PR ND SM EU GD TB DY HO ER TM YB LU(yyyy-mm-dd) (m) (ug/L) (ug/L) (ug/L) (ug/L) (ug/L) (ug/L) (ug/L) (ug/L) (ug/L) (ug/L) (ug/L) (ug/L) (ug/L) (µg/l) (µg/l) (µg/l) (µg/l) (µg/l) (µg/l) (µg/l) (µg/l) (µg/l) (µg/l) (µg/l) (µg/l) (µg/l) (µg/l) (µg/l) (µg/l) (µg/l) (µg/l) (µg/l) (µg/l) (µg/l) (µg/l) (µg/l) (µg/l)
PFM000107 30726 2016/01/18 0.50 5.11 0.0027 0.0969 0.486 0.0413 < 0.002 0.282 1.330 0.0433 0.143 0.559 19.90 < 0.5 2.820 0.035 < 0.05 3.040 0.108 0.359 0.062 < 0.03 0.052 0.072 < 0.01 0.066 0.014 0.067 0.014 < 0.005 0.015 < 0.005 0.015 < 0.005 0.012 < 0.004 0.012 < 0.005
PFM000107 30725 2016/01/18 1.00 8.21 0.0029 0.1070 0.589 0.0606 < 0.002 0.357 1.220 0.0427 0.182 0.654 23.50 < 0.5 3.880 0.050 < 0.05 3.060 0.148 0.527 0.068 < 0.03 0.079 0.078 < 0.01 0.101 0.019 0.090 0.018 < 0.005 0.021 < 0.005 0.020 < 0.005 0.015 < 0.004 0.015 < 0.005
PFM000107 30774 2016/04/19 0.50 4.81 0.0038 0.0983 0.605 0.0376 < 0.002 0.305 0.710 0.0483 0.154 0.497 14.80 < 0.5 2.630 < 0.02 < 0.05 1.970 0.120 0.159 0.060 < 0.03 0.050 < 0.005 < 0.01 0.063 0.014 0.055 0.012 < 0.005 0.009 < 0.005 0.014 < 0.005 0.009 < 0.004 0.011 < 0.005
PFM000107 30916 2016/08/10 0.50 12.80 0.0026 0.0843 0.553 0.0659 < 0.002 0.311 4.220 0.1110 0.418 0.677 12.00 < 0.5 2.130 < 0.02 < 0.05 2.530 0.045 0.083 0.108 < 0.03 0.032 0.010 < 0.01 0.041 0.008 0.035 0.007 < 0.005 0.008 < 0.005 0.007 < 0.005 < 0.005 < 0.004 < 0.005 < 0.005
PFM000107 30952 2016/10/13 0.50 3.65 0.0034 0.0749 0.373 0.0393 < 0.002 0.105 1.570 0.0855 0.135 0.586 15.20 < 0.5 1.680 < 0.02 < 0.05 2.720 0.031 0.077 0.082 < 0.03 0.022 < 0.005 < 0.01 0.027 0.006 0.023 0.005 < 0.005 < 0.005 < 0.005 < 0.005 < 0.005 < 0.005 < 0.004 < 0.005 < 0.005
PFM000117 30727 2016/01/18 0.50 2.57 < 0.002 0.0751 0.565 0.0443 < 0.002 0.258 0.704 0.0254 0.244 0.406 18.70 < 0.5 1.660 0.022 < 0.05 2.560 0.071 0.294 0.076 < 0.03 0.023 0.060 < 0.01 0.020 0.008 0.030 0.008 < 0.005 0.008 < 0.005 0.009 < 0.005 0.007 < 0.004 0.008 < 0.005
PFM000117 30728 2016/01/18 1.50 7.48 < 0.002 0.1000 0.637 0.0650 < 0.002 0.320 1.760 0.0319 0.217 0.372 22.80 < 0.5 1.770 0.033 < 0.05 2.570 0.137 0.363 0.084 < 0.03 0.059 0.057 < 0.01 0.064 0.015 0.072 0.015 < 0.005 0.018 < 0.005 0.018 < 0.005 0.014 < 0.004 0.014 < 0.005
PFM000117 30769 2016/04/18 0.50 5.18 0.0034 0.0915 0.699 0.0410 < 0.002 0.240 2.470 0.0329 0.215 0.311 16.30 < 0.5 1.480 < 0.02 < 0.05 2.060 0.119 0.172 0.077 < 0.03 0.036 < 0.005 < 0.01 0.037 0.010 0.048 0.011 < 0.005 0.011 < 0.005 0.014 < 0.005 0.010 < 0.004 0.012 < 0.005
PFM000117 30914 2016/08/09 0.50 9.78 0.0057 0.0711 0.600 0.0641 < 0.002 0.179 23.200 0.0207 0.393 0.430 11.00 < 0.5 1.830 < 0.02 < 0.05 2.220 0.027 0.093 0.117 < 0.03 0.006 0.009 < 0.01 < 0.005 < 0.005 0.008 < 0.005 < 0.005 < 0.005 < 0.005 < 0.005 < 0.005 < 0.005 < 0.004 < 0.005 < 0.005
PFM000117 30951 2016/10/13 0.50 3.24 0.0021 0.0582 0.579 0.0422 < 0.002 < 0.05 1.200 0.0180 0.331 0.421 12.70 < 0.5 1.740 < 0.02 < 0.05 2.530 0.024 0.102 0.103 < 0.03 < 0.005 < 0.005 < 0.01 < 0.005 < 0.005 0.007 < 0.005 < 0.005 < 0.005 < 0.005 < 0.005 < 0.005 < 0.005 < 0.004 < 0.005 < 0.005
PFM007783 30917 2016/08/11 0.50 1.14 < 0.02 < 0.04 0.597 < 0.02 < 0.002 0.689 4.390 < 0.1 0.138 1.280 17.90 < 3 0.544 < 0.2 < 0.4 15.500 0.023 < 0.1 0.108 < 0.1 < 0.02 < 0.02 < 0.05 < 0.02 < 0.02 < 0.02 < 0.02 < 0.02 < 0.02 < 0.02 < 0.02 < 0.02 < 0.02 < 0.02 < 0.02 < 0.02
PFM007783 30948 2016/10/10 0.50 0.54 < 0.02 0.1100 0.511 < 0.02 < 0.002 < 0.2 0.843 < 0.1 0.099 1.280 17.20 < 3 0.505 < 0.2 < 0.4 17.800 0.024 < 0.1 < 0.1 < 0.1 < 0.02 < 0.02 < 0.05 < 0.02 < 0.02 < 0.02 < 0.02 < 0.02 < 0.02 < 0.02 < 0.02 < 0.02 < 0.02 < 0.02 < 0.02 < 0.02
PFM102269 30910 2016/08/09 0.50 1.68 < 0.02 0.0708 0.553 0.0307 < 0.002 0.897 27.300 < 0.1 0.181 1.530 16.80 < 3 0.538 < 0.2 < 0.4 17.400 0.027 < 0.1 0.113 < 0.1 < 0.02 < 0.02 < 0.05 < 0.02 < 0.02 < 0.02 < 0.02 < 0.02 < 0.02 < 0.02 < 0.02 < 0.02 < 0.02 < 0.02 < 0.02 0.074
PFM102269 30918 2016/09/04 0.50 < 0.3 < 0.02 0.0760 0.854 < 0.02 < 0.002 0.888 5.440 < 0.1 0.206 1.710 18.20 < 3
PFM102269 30949 2016/10/10 0.50 1.05 < 0.02 0.0794 0.610 < 0.02 < 0.002 < 0.2 1.670 < 0.1 0.146 1.430 16.60 < 3 0.550 < 0.2 < 0.4 17.400 0.025 < 0.1 < 0.1 < 0.1 < 0.02 < 0.02 < 0.05 < 0.02 < 0.02 < 0.02 < 0.02 < 0.02 < 0.02 < 0.02 < 0.02 < 0.02 < 0.02 < 0.02 < 0.02 < 0.02
PFM102269 30953 2016/11/07 0.50 1.16 0.0162 0.0531 0.581 0.0139 < 0.002 0.730 9.840 < 0.02 0.154 1.350 17.40 < 3
PFM102269 30967 2016/12/06 0.50 2.02 < 0.02 0.0494 1.020 < 0.02 < 0.002 0.727 6.500 < 0.1 0.246 1.510 17.00 6.35
< “value” = below reporting limit.
SKB P-17-41 65
SVENSK KÄRNBRÄNSLEHANTERING
Arkite
ktkop
ia AB
, Bro
mm
a, 20
18
P-1
7-4
1
SKB is responsible for managing spent nuclear fuel and radioactive
waste produced by the Swedish nuclear power plants such that man
and the environment are protected in the near and distant future.
skb.se