Method for integration of lattice structures in design for ...
164
HAL Id: tel-01688758 https://tel.archives-ouvertes.fr/tel-01688758 Submitted on 19 Jan 2018 HAL is a multi-disciplinary open access archive for the deposit and dissemination of sci- entific research documents, whether they are pub- lished or not. The documents may come from teaching and research institutions in France or abroad, or from public or private research centers. L’archive ouverte pluridisciplinaire HAL, est destinée au dépôt et à la diffusion de documents scientifiques de niveau recherche, publiés ou non, émanant des établissements d’enseignement et de recherche français ou étrangers, des laboratoires publics ou privés. Method for integration of lattice structures in design for additive manufacturing Abdul Hadi Azman To cite this version: Abdul Hadi Azman. Method for integration of lattice structures in design for additive manufacturing. Materials. Université Grenoble Alpes, 2017. English. NNT : 2017GREAI004. tel-01688758
-
Upload
khangminh22 -
Category
Documents
-
view
0 -
download
0
Transcript of Method for integration of lattice structures in design for ...

HAL Id: tel-01688758https://tel.archives-ouvertes.fr/tel-01688758
Submitted on 19 Jan 2018
HAL is a multi-disciplinary open accessarchive for the deposit and dissemination of sci-entific research documents, whether they are pub-lished or not. The documents may come fromteaching and research institutions in France orabroad, or from public or private research centers.
L’archive ouverte pluridisciplinaire HAL, estdestinée au dépôt et à la diffusion de documentsscientifiques de niveau recherche, publiés ou non,émanant des établissements d’enseignement et derecherche français ou étrangers, des laboratoirespublics ou privés.
Method for integration of lattice structures in design foradditive manufacturing
Abdul Hadi Azman
To cite this version:Abdul Hadi Azman. Method for integration of lattice structures in design for additive manufacturing.Materials. Université Grenoble Alpes, 2017. English. �NNT : 2017GREAI004�. �tel-01688758�

THESEPour obtenir le grade de
DOCTEUR DE LA COMMUNAUTE UNIVERSITEGRENOBLE ALPESSpecialite : GI : Genie Industriel : conception et production
Arrete ministeriel : 25 Mai 2016
Presentee par
Abdul Hadi AZMAN
These dirigee par Francois VILLENEUVEet codirigee par Frederic VIGNAT
preparee au sein du Laboratoire G-SCOPet de l’Ecole Doctorale I-MEP2
Method for integration of latticestructures in design for additivemanufacturingMethode pour l’integration des structures treil-lis dans la conception pour la fabrication addi-tive
These soutenue publiquement le 24 Fevrier 2017,devant le jury compose de :
Daniel COUTELLIERProfesseur des universites, Universite de Valenciennes et du Hainaut Cambresis,PresidentJerome PAILHESMaıtre de Conferences HDR, ENSAM, Campus de Bordeaux-Talence,RapporteurLionel ROUCOULESProfesseur des universites, ENSAM, Campus d’Aix en Provence, RapporteurEric MAIREDirecteur de Recherche CNRS HDR, rattache a l’INSA de Lyon, ExaminateurFrederic VIGNATMaıtre de Conferences HDR, Grenoble-INP, Co-Directeur de theseFrancois VILLENEUVEProfesseur, Universite Grenoble Alpes, Directeur de these

None of us got to where we arealone.
Harvey Mackay
AcknowledgementThis dissertation is the result of the work that has been conducted duringyears of research with the G-SCOP laboratory, and under the Univ. GrenobleAlpes, France. In various ways, it has involved several persons and organi-sations that I am most eager to acknowledge.
First and foremost, I would like to thank my supervisors. To FrancoisVilleneuve for his trust and confidence in me which goes a long way to mymaster degree year, for his constructive comments, directions, and the con-tinuous moral support. To Frederic Vignat for his availabilities, helpful andrelevant comments, as well as fruitful discussion and corrections.
Secondly, I would like to express the gratitude to the National Universityof Malaysia (UKM) and the Ministry of Higher Education Malaysia (MOHE)for the funding of the research. I would also like to thank the Product-ProcessDesign (CPP) and Additive Manufacturing team for their direct and indirectparticipation and investment in this work, for their kindness and valuableguidelines.
My sincere thanks also go to the jury members who have agreed to eval-uate this dissertation. I am honoured and thankful to Jerome Pailhes andLionel Roucoules for their interest in this work and by agreeing to be thereporters. I also thank Daniel Coutellier and Eric Maire for their acceptanceto be my viva examiner.
I express my appreciation to the staffs, my colleagues and friends at the G-SCOP Laboratory who participated and contributed in one way or another.In particular, to Marie-Josephe, Fadila, Souad, Myriam, Kevin, Jean-Yves,Sebastien, Christelle, Hoang, Jing Tao, Rachad, and Olga. Thank you foryour support, for the various exchanges, convivialities and your help duringthese years.
Finally, I would like to convey my heartful appreciation to my families. Tomy mother Zainoha Zakaria and my father, Azman Hassan for their prayers,encouragement and blessing. From 1993 to 1997, it was my parents who bothcompleted at the same time their PhDs at the University of Lougborough,UK, now exactly twenty years on, 2013-2017, me and my wife repeat the sameaccomplishment by both doing our PhDs at the same time in Grenoble. Theyhave been an inspiration to me in completing my PhD. I would like thank my

mother-in-law Aishah for her support and wisdom, and to my grandparentsfor the wait. But most importantly, to my wife, Asma’ and our sons, Talhahand Suhayb, not only for their patience and endless support, but also for theirlove and their sharing of every moment along this memorable journey. Tomy brothers, sisters, friends and their families whom I can’t possibly mentionall their names, thank you very much. It has been a long and challengingjourney, but with many memorable memories.
Now this is not the end. It isnot even the beginning of theend. But it is, perhaps, the endof the beginning.
Winston Churchill
Abdul Hadi AzmanGrenoble, February 2017

Contents
List of Figures . . . . . . . . . . . . . . . . . . . . . . . . . . . . . . vList of Tables . . . . . . . . . . . . . . . . . . . . . . . . . . . . . . viiDefinition of used terms . . . . . . . . . . . . . . . . . . . . . . . . viiiAcronyms . . . . . . . . . . . . . . . . . . . . . . . . . . . . . . . . x
General introduction 1
1 Literature review 71.1 Importance of lattice structures . . . . . . . . . . . . . . . . . 8
1.1.1 Industrial requirements in the twenty-first century . . . 81.1.2 The need for lattice structures . . . . . . . . . . . . . . 8
1.2 Introduction on lattice structures . . . . . . . . . . . . . . . . 91.3 Manufacturing lattice structures . . . . . . . . . . . . . . . . . 12
1.3.1 Manufacturing stochastic and prismatic structures . . . 121.3.2 Conventional lattice structure manufacturing methods 131.3.3 Metallic Additive Manufacturing . . . . . . . . . . . . 141.3.4 Conclusion . . . . . . . . . . . . . . . . . . . . . . . . . 18
1.4 Lattice structure properties . . . . . . . . . . . . . . . . . . . 191.4.1 Mechanical properties . . . . . . . . . . . . . . . . . . 211.4.2 Conclusion . . . . . . . . . . . . . . . . . . . . . . . . . 25
1.5 Lattice structure design methods . . . . . . . . . . . . . . . . 251.5.1 Design for additive manufacturing . . . . . . . . . . . . 251.5.2 Design for additive manufacturing methodology propo-
sitions . . . . . . . . . . . . . . . . . . . . . . . . . . . 261.5.3 Conclusion . . . . . . . . . . . . . . . . . . . . . . . . . 29
1.6 CAD file formats for additive manufacturing . . . . . . . . . . 291.6.1 CAD tools to create lattice structures . . . . . . . . . . 291.6.2 Analysis of current CAD file formats . . . . . . . . . . 301.6.3 Conclusion . . . . . . . . . . . . . . . . . . . . . . . . . 34
1.7 Literature review conclusion . . . . . . . . . . . . . . . . . . . 35
2 CAD tools in additive manufacturing 372.1 Evaluating current CAD tools performances in the context of
design for additive manufacturing . . . . . . . . . . . . . . . . 382.1.1 Human Machine Interface . . . . . . . . . . . . . . . . 402.1.2 CAD software utility . . . . . . . . . . . . . . . . . . . 422.1.3 CAD file format . . . . . . . . . . . . . . . . . . . . . . 442.1.4 RAM usage . . . . . . . . . . . . . . . . . . . . . . . . 46

Contents
2.1.5 Conclusion . . . . . . . . . . . . . . . . . . . . . . . . . 482.2 Evaluating current CAE tools performances in the context of
design for additive manufacturing . . . . . . . . . . . . . . . . 482.2.1 FEA computation file size . . . . . . . . . . . . . . . . 492.2.2 FEA time duration . . . . . . . . . . . . . . . . . . . . 502.2.3 Conclusion . . . . . . . . . . . . . . . . . . . . . . . . . 51
2.3 Conclusion . . . . . . . . . . . . . . . . . . . . . . . . . . . . . 52
3 Lattice structure design strategy 533.1 Definitions of used terms . . . . . . . . . . . . . . . . . . . . . 553.2 Proposed lattice structure design method . . . . . . . . . . . . 56
3.2.1 Concept to link lattice structure, solid material andequivalent material . . . . . . . . . . . . . . . . . . . . 56
3.2.2 Step-by-step of the proposed method . . . . . . . . . . 613.2.3 Application example of the proposed lattice structure
design method . . . . . . . . . . . . . . . . . . . . . . . 623.3 A methodology for the creation of equivalent lattice structure
materials . . . . . . . . . . . . . . . . . . . . . . . . . . . . . . 693.3.1 FEA simulation and variables . . . . . . . . . . . . . . 693.3.2 Simulation execution . . . . . . . . . . . . . . . . . . . 743.3.3 Stress concentration . . . . . . . . . . . . . . . . . . . 753.3.4 Results . . . . . . . . . . . . . . . . . . . . . . . . . . . 773.3.5 Analysis . . . . . . . . . . . . . . . . . . . . . . . . . . 83
3.4 Results verification . . . . . . . . . . . . . . . . . . . . . . . . 873.4.1 Comparison with results from other articles . . . . . . 873.4.2 Comparison with case study results . . . . . . . . . . . 903.4.3 Conclusion . . . . . . . . . . . . . . . . . . . . . . . . . 98
3.5 Summary . . . . . . . . . . . . . . . . . . . . . . . . . . . . . 99
4 Definition and creation of the skeleton model of the latticestructures 1014.1 Lattice structure configurations . . . . . . . . . . . . . . . . . 103
4.1.1 Pattern . . . . . . . . . . . . . . . . . . . . . . . . . . 1044.1.2 Relative density . . . . . . . . . . . . . . . . . . . . . . 1044.1.3 Progressivity . . . . . . . . . . . . . . . . . . . . . . . 1064.1.4 Conformality . . . . . . . . . . . . . . . . . . . . . . . 1064.1.5 Design space . . . . . . . . . . . . . . . . . . . . . . . . 1084.1.6 Joint shape . . . . . . . . . . . . . . . . . . . . . . . . 109
4.2 Creation of skeleton model . . . . . . . . . . . . . . . . . . . . 1094.2.1 Skeleton model concept . . . . . . . . . . . . . . . . . . 1094.2.2 Skeleton model algorithm . . . . . . . . . . . . . . . . 111

Contents
4.3 Visualisation . . . . . . . . . . . . . . . . . . . . . . . . . . . . 1194.4 Manufacturing . . . . . . . . . . . . . . . . . . . . . . . . . . . 1214.5 Summary . . . . . . . . . . . . . . . . . . . . . . . . . . . . . 123
General conclusion 124
Bibliography 127
A Detailed FEA simulation results for the lattice structures 133
B Skeleton model points, lines, sections and joints lists 136

List of Figures
1 Example of an octet-truss lattice structure manufactured withadditive manufacturing . . . . . . . . . . . . . . . . . . . . . . 1
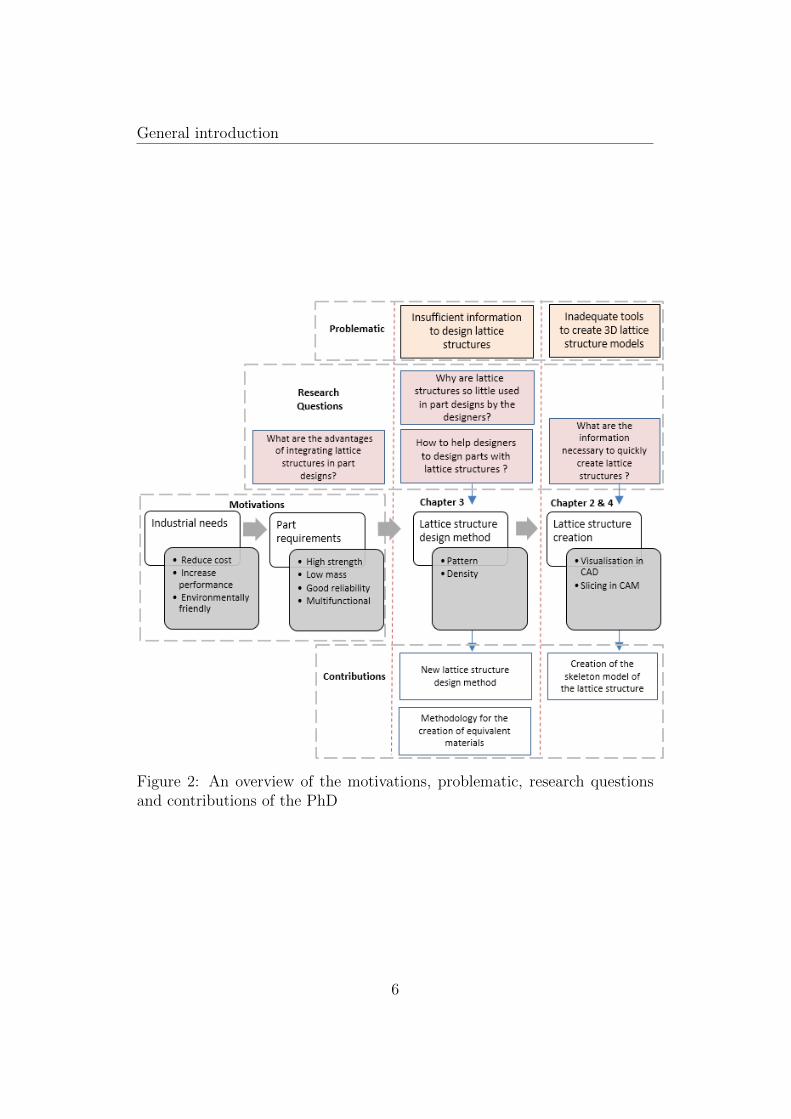
2 An overview of the motivations, problematic, research ques-tions and contributions of the PhD . . . . . . . . . . . . . . . 6
1.1 Architectured materials according to (Ashby, 2013) . . . . . . 91.2 Stochastic, periodic, prismatic, and lattice structures . . . . . 111.3 An octet-truss lattice structure 3D model in CAD . . . . . . . 161.4 Inside an EBM machine (Lu et al., 2009) . . . . . . . . . . . . 161.5 Difference between a designed lattice structure strut in CAD,
its numerical equivalent cylinder, geometrical equivalent cylin-der and the manufactured strut with additive manufacturing(Suard, 2015) . . . . . . . . . . . . . . . . . . . . . . . . . . . 18
1.6 Young’s Modulus-density space materials diagram (Ashby, 2013) 201.7 Three main lattice structure design variable influence accord-
ing to (Ashby, 2006) . . . . . . . . . . . . . . . . . . . . . . . 211.8 Stiffness experiment of octet-truss (stretching-dominated) and
kelvin foam (bending-dominated). The octet-truss lattice struc-ture demonstrates markedly superior specific stiffness com-pared with the open-cell foam (Kelvin foam) (Zheng et al.,2014) . . . . . . . . . . . . . . . . . . . . . . . . . . . . . . . . 24
1.9 Design strategy categories for additive manufacturing accord-ing to (Tang et al., 2014) . . . . . . . . . . . . . . . . . . . . . 26
1.10 Square bracket design proposed using a new design methodfor additive manufacturing (Vayre et al., 2012a) . . . . . . . . 27
1.11 Steps for design-optimization of a lattice structure (Zhanget al., 2015) . . . . . . . . . . . . . . . . . . . . . . . . . . . . 28
1.12 Integrated multi-level and multi-discipline design process (Tanget al., 2014) . . . . . . . . . . . . . . . . . . . . . . . . . . . . 28
2.1 The roles of each criterion in evaluating CAD tools for additivemanufacturing . . . . . . . . . . . . . . . . . . . . . . . . . . . 38
2.2 Circular lattice structure bars . . . . . . . . . . . . . . . . . . 392.3 Different lattice structure dimensions . . . . . . . . . . . . . . 402.4 Creating a basic 1 cm × 1 cm × 1 cm octet truss lattice
structure with circular section bars . . . . . . . . . . . . . . . 412.5 First and second repetition from elementary structure to ob-
tain a 5 cm × 5 cm × 5 cm size octet truss lattice structure . 42
i

List of Figures
2.6 Cubic lattice structure repetition duration . . . . . . . . . . . 432.7 Octet-truss lattice structure repetition duration . . . . . . . . 442.8 Cubic lattice structure file size . . . . . . . . . . . . . . . . . . 452.9 Octet-truss lattice structure file size . . . . . . . . . . . . . . . 462.10 Cubic lattice structure RAM consumption . . . . . . . . . . . 472.11 Octet-truss RAM consumption . . . . . . . . . . . . . . . . . . 472.12 FEA simulation on an octet-truss lattice structure . . . . . . . 492.13 Octet-truss lattice structure FEA computations file size . . . . 502.14 Octet-truss lattice structure FEA time duration . . . . . . . . 512.15 Summary of evaluation, problems, conclusions and solutions
of chapter two . . . . . . . . . . . . . . . . . . . . . . . . . . . 52
3.1 Which type of lattice structure to choose? Cubic or hexa-trusslattice structure? Which densities are needed? . . . . . . . . . 54
3.2 Bounding box(blue) and lattice structure (yellow) . . . . . . . 553.3 Lattice structure design method based on the use of equivalent
material . . . . . . . . . . . . . . . . . . . . . . . . . . . . . . 563.4 The relation between lattice structure, solid material and equiv-
alent material . . . . . . . . . . . . . . . . . . . . . . . . . . . 573.5 Step-by-step of the new design method to design lattice struc-
tures . . . . . . . . . . . . . . . . . . . . . . . . . . . . . . . . 603.6 Design space . . . . . . . . . . . . . . . . . . . . . . . . . . . . 633.7 Solid material and boundary conditions . . . . . . . . . . . . . 643.8 Displacements and Von Mises stress results of the FEA . . . . 643.9 Relative Young’s modulus in function of relative density . . . 653.10 Relative Young’s modulus in function of relative density for
octet-truss lattice structure at 0◦ angle position . . . . . . . . 663.11 Relative strength in function of relative density for octet-truss
lattice structure at 0◦ angle position . . . . . . . . . . . . . . . 673.12 FEA on equivalent material with relative density at 13% . . . 673.13 Lattice structure CAD model . . . . . . . . . . . . . . . . . . 683.14 Compression and shear test on a hexa-truss lattice structure . 703.15 Isometric view of 5 × 5 × 5 elementary units. From left
to right : octet-truss, cubic, hexa-truss and open-cell latticestructure . . . . . . . . . . . . . . . . . . . . . . . . . . . . . . 70
3.16 Side view of each elementary unit. From left to right : octet-truss, cubic, hexa-truss and open-cell elementary unit . . . . . 71
3.17 Cubic lattice structure at 0◦ and 45◦ angle . . . . . . . . . . . 713.18 Side view of open-cell foam lattice structures with 11.9%,
25.3% and 36.9% relative densities . . . . . . . . . . . . . . . 72
ii
List of Figures
3.19 5 × 5 × 5 unit octet-truss lattice structures with differentlength and sections of struts but same densities . . . . . . . . 72
3.20 High density hexa-truss lattice structure . . . . . . . . . . . . 733.21 Stress concentration in sharp edges of an octet-truss lattice
structure . . . . . . . . . . . . . . . . . . . . . . . . . . . . . . 763.22 Stress concentration in sharp edges of an cubic lattice structure 763.23 Stress concentration in sharp edges of an hexa-truss lattice
structure . . . . . . . . . . . . . . . . . . . . . . . . . . . . . . 773.24 Stress concentration in sharp edges of an open-cell foam lattice
structure . . . . . . . . . . . . . . . . . . . . . . . . . . . . . . 773.25 Octet-truss lattice structure compression test at 0◦ and 45◦
angle . . . . . . . . . . . . . . . . . . . . . . . . . . . . . . . . 783.26 Octet-truss lattice structure shear test at 0◦ and 45◦ angle . . 783.27 Relative strength in function of relative density for octet-truss
lattice structure at 0◦ and 45◦ angle . . . . . . . . . . . . . . . 793.28 Cubic lattice structure compression at 0◦ and 45◦ angle . . . . 793.29 Cubic lattice structure shear test at 0◦ and 45◦ angle . . . . . 803.30 Relative strength in function of relative density for cubic lat-
tice structure at 0◦ and 45◦ angle . . . . . . . . . . . . . . . . 803.31 Hexa-truss lattice structure compression test at 0◦ and 45◦ angle 813.32 Hexa-truss lattice structure shear test at 0◦ and 45◦ angle . . . 813.33 Relative strength in function of relative density for hexa-truss
lattice structure at 0◦ and 45◦ angle . . . . . . . . . . . . . . . 823.34 Open-cell foam lattice structure compression test at 0◦ and
45◦ angle . . . . . . . . . . . . . . . . . . . . . . . . . . . . . . 823.35 Open-cell foam lattice structure shear test at 0◦ and 45◦ angle 833.36 Relative strength in function of relative density for open-cell
foam lattice structure at 0◦ and 45◦ angle . . . . . . . . . . . . 833.37 Comparison of relative Young’s modulus in function of relative
density at 0◦ angle . . . . . . . . . . . . . . . . . . . . . . . . 843.38 Comparison of relative Young’s modulus in function of relative
density at 45◦ angle . . . . . . . . . . . . . . . . . . . . . . . . 853.39 Comparison of relative shear modulus in function of relative
density at 0◦ angle . . . . . . . . . . . . . . . . . . . . . . . . 853.40 Comparison of relative shear modulus in function of relative
density at 45◦ angle . . . . . . . . . . . . . . . . . . . . . . . . 863.41 Relative Young’s modulus in function of relative density for
octet-truss lattice structure, in comparison with Suard’s results 873.42 Experimental compression test of octet-truss lattice structure
conducted by (Suard, 2015) . . . . . . . . . . . . . . . . . . . 883.43 FEA on diamond lattice structure by (Neff, 2015) . . . . . . . 88
iii

List of Figures
3.44 Relative Young’s modulus in function of relative density fordiamond lattice structure, in comparison with Neff’s results . . 89
3.45 Relative strength in function of relative density for bendingand stretching-dominated lattice structures, in comparison withAshby’s results . . . . . . . . . . . . . . . . . . . . . . . . . . 89
3.46 FEA on the L shaped lattice structure (left) and equivalentmaterial (right) . . . . . . . . . . . . . . . . . . . . . . . . . . 91
3.47 FEA on the C shaped lattice structure (left) and equivalentmaterial (right) . . . . . . . . . . . . . . . . . . . . . . . . . . 91
3.48 Displacements of the L shape part: Lattice structure (left) andequivalent material (right) . . . . . . . . . . . . . . . . . . . . 92
3.49 Von Mises stress of the L shape part: Lattice structure (left)and equivalent material (right) . . . . . . . . . . . . . . . . . . 93
3.50 Displacements of the C shape part: Lattice structure (left)and equivalent material (right) . . . . . . . . . . . . . . . . . . 95
3.51 Von Mises stress of the C shape part: Lattice structure (left)and equivalent material (right) . . . . . . . . . . . . . . . . . . 97
3.52 General view of the proposed lattice structures design method 99
4.1 Chapter 4 . . . . . . . . . . . . . . . . . . . . . . . . . . . . . 1024.2 Lattice structure configurations . . . . . . . . . . . . . . . . . 1034.3 First order relative density as a function of the true relative
density for the cubic lattice structure. The red line representsthe isovalue . . . . . . . . . . . . . . . . . . . . . . . . . . . . 105
4.4 First order relative density as a function of the true relativedensity for the octet-truss lattice structure. . . . . . . . . . . . 105
4.5 Different types of conformal lattice structures . . . . . . . . . 1074.6 Example of a cubic lattice structure with an upper planar and
curved surface of the design space . . . . . . . . . . . . . . . . 1084.7 Connection between extremity struts and design space . . . . 1094.8 Cubic lattice structure with rounded joint edges . . . . . . . . 1094.9 Skeleton model: Lattice structure defined by points, lines and
sections . . . . . . . . . . . . . . . . . . . . . . . . . . . . . . 1114.10 Class, functions, input and output information of the algorithm1114.11 Elementary structure repetition to obtain 3 x 3 x 3 unit lattice
structure . . . . . . . . . . . . . . . . . . . . . . . . . . . . . . 1134.12 Overlapping points and lines after elementary structure repe-
tition . . . . . . . . . . . . . . . . . . . . . . . . . . . . . . . . 1134.13 Step one case one and two . . . . . . . . . . . . . . . . . . . . 1144.14 Step two . . . . . . . . . . . . . . . . . . . . . . . . . . . . . . 1154.15 Step three case one and two . . . . . . . . . . . . . . . . . . . 115
iv

List of Figures
4.16 Constant scaled 3 x 3 x 3 unit cubit lattice structure with apitch dimension of 2 . . . . . . . . . . . . . . . . . . . . . . . 116
4.17 Progressive scaled 3 x 3 x 3 unit cubit lattice structure . . . . 1174.18 Method one . . . . . . . . . . . . . . . . . . . . . . . . . . . . 1174.19 Method two . . . . . . . . . . . . . . . . . . . . . . . . . . . . 1184.20 Method to obtain non-conformal extremity struts . . . . . . . 1194.21 Example of a cubic, octet-truss and hexa-truss lattice struc-
ture created with points and lines visualised in a viewer (Par-aview) . . . . . . . . . . . . . . . . . . . . . . . . . . . . . . . 120
4.22 Visualisation of lattice structure built by geometric primitivelines and cylinders . . . . . . . . . . . . . . . . . . . . . . . . 121
4.23 Slicing lattice structure lines into layers and adding section tosliced lines . . . . . . . . . . . . . . . . . . . . . . . . . . . . . 122
4.24 Adding section to sliced lines . . . . . . . . . . . . . . . . . . 1234.25 Proposal of a new CAD file format for additive manufacturing
taking into aspect CAD, CAE and CAM requirements . . . . 126
B.1 Lattice structure generator user interface created to create lat-tice structures . . . . . . . . . . . . . . . . . . . . . . . . . . . 146
B.2 Proposal of lattice structure generator user interface to createlattice structures . . . . . . . . . . . . . . . . . . . . . . . . . 146
v
List of Tables
1.1 Definition of elementary and lattice structure used in this PhD 111.2 Octet-truss (Ashby, 2006), tetrakaidecahedron (Zhu et al., 1997)
and open-cell foam elementary structures . . . . . . . . . . . . 121.3 Investment casting (Mun et al., 2015)Expanded metal sheet
(Kooistra and Wadley, 2007), metallic wire assembly (Que-heillalt and Wadley, 2005) and snap fit (Dong et al., 2015)method process to manufacture lattice structures. . . . . . . . 13
1.4 Synthesis: Advantages and disadvantages of additive manufac-turing and conventional lattice structure manufacturing tech-niques . . . . . . . . . . . . . . . . . . . . . . . . . . . . . . . 19
1.5 Types of deformation for lattice structures according to (Suard,2015) . . . . . . . . . . . . . . . . . . . . . . . . . . . . . . . . 22
1.6 Influence of stretching and bending-dominated structures onmechanical properties according to (Ashby, 2006) . . . . . . . 23
1.7 Obj file format key information . . . . . . . . . . . . . . . . . 331.8 Synthesis : CAD File Formats Comparison . . . . . . . . . . . 35
2.1 Average time to generate 1st and 2nd repetition . . . . . . . . 432.2 Lattice structure CAD file sizes . . . . . . . . . . . . . . . . . 452.3 RAM consumption . . . . . . . . . . . . . . . . . . . . . . . . 462.4 Octet-truss lattice structure FEA computations file size . . . . 502.5 Octet-truss lattice structure FEA time duration . . . . . . . . 51
3.1 Material properties of the octet-truss lattice structure equiva-lent material . . . . . . . . . . . . . . . . . . . . . . . . . . . . 90
3.2 Percentage difference between the displacement of the latticestructure and the equivalent material (L shape part) . . . . . 92
3.3 Percentage difference between the Von Mises stress of the lat-tice structure and the equivalent material (L shape part) . . . 94
3.4 Percentage difference between the displacement of the latticestructure and the equivalent material (C shape part) . . . . . 96
3.5 Percentage difference between the Von Mises stress of the lat-tice structure and the equivalent material C shape part) . . . 97
4.1 Number of points and lines for cubic, octet-truss, hexa-trussand open-cell foam elementary structure . . . . . . . . . . . . 104
4.2 Constant and gradient lattice structures . . . . . . . . . . . . 107
vi
List of Tables
4.3 Elementary octet-truss structure: Point, line, section and con-nection list . . . . . . . . . . . . . . . . . . . . . . . . . . . . . 110
4.4 Elementary cubic structure: Point and line list . . . . . . . . . 112
A.1 Relative Young’s modulus and relative strength for cubic lat-tice structure compression and shear test at 0◦ and 45◦ angle . 133
A.2 Relative Young’s modulus and relative strength for octet-trusslattice structure compression and shear test at 0◦ and 45◦ angle134
A.3 Relative Young’s modulus and relative strength for hexa-trusslattice structure compression and shear test at 0◦ and 45◦ angle134
A.4 Relative Young’s modulus and relative strength for open-celllattice structure compression and shear test at 0◦ and 45◦ angle135
B.1 Elementary octet-truss structure: Point and line list . . . . . . 136B.2 Elementary hexa-truss structure: Point and line list . . . . . . 137B.3 Elementary open-cell foam structure: Point and line list . . . . 138B.4 3 x 3 x 3 unit cubic lattice structure with with a pitch size of
one . . . . . . . . . . . . . . . . . . . . . . . . . . . . . . . . . 139B.5 Scaled 3 x 3 x 3 unit cubic lattice structure with a pitch size
of 2 . . . . . . . . . . . . . . . . . . . . . . . . . . . . . . . . . 140B.6 Scaled 3 x 3 x 3 unit cubic lattice structure with gradient
elementary structures . . . . . . . . . . . . . . . . . . . . . . . 141B.7 Conformal cubic lattice structure with non-parallel upper and
lower boundaries . . . . . . . . . . . . . . . . . . . . . . . . . 142B.8 Conformal cubic lattice structure with parallel upper and lower
boundaries . . . . . . . . . . . . . . . . . . . . . . . . . . . . . 143B.9 Output point and line list . . . . . . . . . . . . . . . . . . . . 144B.10 Output section and join shape list . . . . . . . . . . . . . . . . 145
vii

Definition of used terms
Definitions adopted by researchers are often not uniform, so some key termsare explained to establish positions taken in the PhD research.
Architectured material
Architectured material is a combination of a monolithic material with spaceto generate a new structure which has the equivalent of a new monolithicmaterial.
Cellular structure
Cellular material is another name for architectured materials. Cellular struc-tures can be categorized into two types: stochastic (foams) and periodicstructures.
Stochastic foams
Cellular materials which cannot be characterized by a single unit cell areaare referred to as stochastic foams.
Periodic structure
Cellular materials characterized by a unit cell that can be translated throughthe structure are referred to as periodic materials
Prismatic structure
Periodic materials which the unit cells are translated in two dimensions.These are known as prismatic cellular materials
Lattice structure
Periodic materials which have three-dimensional periodicity, which meansthat its unit cells are translated in three axis. These structures are frequentlyreferred to as lattice or micro-truss materials
viii

Definition of used terms
Curling
Curling is the effect of high distortion on the extremities of the planes inparts manufactured by additive manufacturing.
ix
Acronyms
Acronyms
AM Additive manufacturing
AMF Additive Manufacturing File
ALM Additive Layer Manufacturing
B-Rep Boundary representation
CAD Computer-aided-design
CAM Computer-aided-manufacturing
CAE Computer-aided engineering
EBM Electron beam melting
FEM Finite element method
FF Freeform fabrication
IGES Initial Graphics Exchange Specification
PRS Powder Recovery System
RAM Random-access memory
RM Rapid Manufacturing
RP Rapid Prototyping
SLS Selective Laser Sintering
STL STereoLithography
STEP Standard for the Exchange of Product model data
VRML Virtual Reality Modelling Language
3D Three-dimensional
x

General introduction
Introduction
Additive manufacturing is a recent development in manufacturing. It is nowpossible to manufacture metallic lattice structures easily with additive man-ufacturing. Lattice structure is a type of architectured material and canbe defined as “a combination of two or more materials, or of material andspace, assembled in a way as to have the attributes not offered by any onematerial alone”(Ashby, 2013). Lattice structures can be used to producehigh strength low mass parts. It brings many advantages, for example pro-duce lighter aeroplanes and consequently improve fuel savings. However, thebreakthrough in lattice structure manufacturing capability is yet to be fol-lowed by a breakthrough in lattice structure design methods and CAD tools.Currently only traditional design methods are available for additive manu-facturing design strategies, which do not consider the requirements of latticestructure applications. Thus, despite its advantages, lattice structures arestill not widely used. This work focuses on lattice structure design methodsand creation in CAD tools to facilitate wide use of lattice structures in prod-ucts. Figure 1 is an example of an octet-truss lattice structure manufacturedwith the Electron Beam Melting (EBM) technology.
Figure 1: Example of an octet-truss lattice structure manufactured withadditive manufacturing

General introduction
Motivation
In a fast moving world, where technology improves and advances rapidly,nothing stays still. Today’s industrial designers seek to optimize product de-signs to best meet the requirements of clients and markets. The bar has beenset higher and higher to fulfil the ever demanding economical, environmentaland society needs. Hence, the emphasize on research and development toimprove performances and gains in every possible way has become essential.It has become important for engineers to design and manufacture high per-formance lightweight products. For example, lighter parts in the aerospaceand automotive industries can contribute to huge amounts of savings in fuelconsumption. This is a very important factor for companies in reducingcosts. This PhD aims to help engineers to integrate lattice structures in partdesigns and produce lightweight products.
Problematic
It is now possible to manufacture high strength low mass parts using latticestructures manufactured with additive manufacturing. However, even thoughlattice structures can now be manufactured easily with additive manufactur-ing, they are currently not widely used in part designs. New capabilitiesin manufacturing technology creates new requirements for design strategies.This progress in manufacturing is yet to be followed by new innovations andimprovements in lattice structure design methods and computer-aided-design(CAD) tools. Current design strategies and CAD tools are not tailored foradditive manufacturing. Designers currently do not have the required infor-mation to correctly integrate lattice structures in part designs and also donot have the necessary tools for easy lattice structure creation and manip-ulation in CAD software. This constitutes a major stumbling block for thewide use of lattice structures in part designs. It is important to know theconditions and factors that influence lattice structure design decisions andits applications.
Research question
From this first observation regarding metallic additive manufacturing andcurrent lattice structure design methods and CAD tools, the main questionsthat arise are :
2

General introduction
• What are the advantages of integrating lattice structures in part de-signs?
• Why are lattice structures so little used in part designs?
• What are the informations necessary to help designers to design partscontaining lattice structures?
• How can lattice structures be created quickly and easily in CAD?
These questions will be thoroughly answered in the literature review andthe following chapters.
Objective
The principal aim of this PhD is to facilitate and improve the integrationof lattice structures in additive manufacturing parts. This improvement willbe in two areas, first in the design strategy of the lattice structures and sec-ondly the creation, visualisation and slicing in CAD and CAM environmentrespectively.
Lattice structure design strategy For the design strategy, the goal isto help designers to have the necessary information to choose the correctlattice structure pattern and density based on the part’s requirements. Thiswill contribute towards better integration of lattice structures in additivemanufacturing part designs and make it easier to conduct finite-element-analysis (FEA).
Create, visualise and slice lattice structure After choosing the config-urations of the lattice structures, the next goal is to help designers to createthe lattice structures easily and quickly in CAD software and also to make iteasier to visualise and slice in CAD and CAM environment. Improvementsin CAD tools to design lattice structures are needed and will greatly improvethe additive manufacturing numerical chain.
Research strategy
To answer the research questions and achieve the desired objectives, the PhDstrategy has been outlined as follows. The following explains the work donefor each stage of the Phd strategy.
3

General introduction
Chapter 1: Literature review The aim of this literature review is tostudy what had previously been published in this field of research. Thischapter investigates the importance of lattice structures, lattice structuremanufacturing techniques, lattice structure mechanical properties, lattice de-sign methods and current CAD file formats for additive manufacturing.
Chapter 2: CAD tools in additive manufacturing In this secondchapter, the aim is to evaluate the performances of current CAD and CAEtools to determine whether they are adequate enough for the needs of additivemanufacturing. Experiments were conducted in CATIA V5, observations andanalysis were made on the time taken to create lattice structure models, RAMconsumption during the operations, time taken to execute finite-element-analysis and CAD and FEA computation file sizes.
Chapter 3: Lattice structure design strategy In this chapter, theaim is to propose a new lattice structure design method. This new designmethod will serve as a guideline for engineers to choose the correct latticestructure pattern and density. A methodology to define equivalent latticestructure materials is needed to eradicate the creation of lattice structurewith surfaces and volumes.
Chapter 4: Definition and creation of the skeleton model of thelattice structure In this chapter, the goal is to visualise and slice latticestructures in CAD and CAM respectively. First, lattice structure configura-tions were determined. Next the aim is to study the informations needed torepresent and create lattice structures in CAD. Finally, the visualisation andslicing of the lattice structures are explored.
Contribution
There are three main contributions in this PhD. A new lattice structuredesign strategy is presented. This serves as a guideline for designers to inte-grate lattice structures in additive manufactured parts. With this guideline,designers will have at their disposal a guideline to choose lattice structurepatterns and densities. This will help the integration of lattice structuresadditive manufactured parts.
The second contribution is a methodology to create equivalent latticestructure materials. This solid material equivalence replaces the need tocreate lattice structures in CAD and finite-element-analysis, which are both
4

General introduction
time consuming. This will save time in CAD 3D model creation and finite-element-analysis in CAE software.
The third contribution is the proposal to define lattice structures withpoints, lines, sections and joints instead of surfaces and volumes. The points,lines, sections and joints information are referred to as the skeleton model.Lattice structure geometrical configurations were determined and an algo-rithm for the creation of a skeleton model for these configurations werepresented. A method is presented to visualise and slice lattice structuresfrom the skeleton model. This proposal is a starting point for future worksto create a new CAD file format, CAD and CAM tools suitable for latticestructures and additive manufacturing.
Overview
Figure 2 illustrates an overview of this PhD thesis. Starting with the mo-tivation of the work, problematic, research questions and contributions ofthis research. Chapter two evaluates current CAD tools performances to de-sign lattice structures. A new lattice structure design method is presentedin chapter three and in chapter four we propose a new methodology for thecreation and representation of 3D lattice structure models.
5
General introduction
Figure 2: An overview of the motivations, problematic, research questionsand contributions of the PhD
6

Chapter 1
Literature review
Contents1.1 Importance of lattice structures . . . . . . . . . . . . 8
1.1.1 Industrial requirements in the twenty-first century . . 8
1.1.2 The need for lattice structures . . . . . . . . . . . . . 8
1.2 Introduction on lattice structures . . . . . . . . . . . 9
1.3 Manufacturing lattice structures . . . . . . . . . . . 12
1.3.1 Manufacturing stochastic and prismatic structures . . 12
1.3.2 Conventional lattice structure manufacturing methods 13
1.3.3 Metallic Additive Manufacturing . . . . . . . . . . . . 14
1.3.4 Conclusion . . . . . . . . . . . . . . . . . . . . . . . . 18
1.4 Lattice structure properties . . . . . . . . . . . . . . 19
1.4.1 Mechanical properties . . . . . . . . . . . . . . . . . . 21
1.4.2 Conclusion . . . . . . . . . . . . . . . . . . . . . . . . 25
1.5 Lattice structure design methods . . . . . . . . . . . 25
1.5.1 Design for additive manufacturing . . . . . . . . . . . 25
1.5.2 Design for additive manufacturing methodology propo-sitions . . . . . . . . . . . . . . . . . . . . . . . . . . . 26
1.5.3 Conclusion . . . . . . . . . . . . . . . . . . . . . . . . 29
1.6 CAD file formats for additive manufacturing . . . . 29
1.6.1 CAD tools to create lattice structures . . . . . . . . . 29
1.6.2 Analysis of current CAD file formats . . . . . . . . . . 30
1.6.3 Conclusion . . . . . . . . . . . . . . . . . . . . . . . . 34
1.7 Literature review conclusion . . . . . . . . . . . . . . 35
7

Chapter 1. Literature review
This literature review will be the basis and starting point for this research.This review was conducted by studying what had previously been publishedregarding lattice structures, specifically concerning the importance of latticestructures, lattice structure properties, lattice structure design methods, lat-tice structure applications in products, manufacturing of lattice structuresand CAD file formats for additive manufacturing. The objective is to findthe problems encountered by designers to integrate lattice structures in partdesigns and the benefits of lattice structure application.
1.1 Importance of lattice structures
1.1.1 Industrial requirements in the twenty-first cen-tury
As the world becomes more competitive, industries are looking at every vi-able prospect to stay relevant and be ahead of the competition. Economicaland environmental needs are forcing companies to reduce cost, increase per-formance gains, and reduce wastes. New solutions have to be invented to gainevery possible improvement. As the need for energy conservation increases,the need for lightweight parts increases too (Manfredi et al., 2014). Thebenefits of weight reduction are significant. In the aerospace industry, wherethe need to reduce weight is important, companies are trying to manufacturelighter aeroplanes. Reduction in the weight of an aeroplane can contributeto vast amount of savings in fuel expenses. In the automotive industry, re-ducing a cars weight contributes to fuel economy and lower CO2 emissions(Beyer, 2014). Studies have shown that a 10% reduction in weight can savearound 6-8% in fuel consumption.
1.1.2 The need for lattice structures
It is important to produce parts which are lightweight but have good mechan-ical properties. Lattice structure is a good solution to achieve this objective.High strength low mass property is a key advantage of lattice structure (Chuet al., 2008). Lattice structures can be used to achieve excellent performanceand multi functionality while reducing weight. This concept of architecturedmaterial comes from the desire to put material only where it is needed (Tanget al., 2014). The research field regarding lattice structures has receivedincreased attention due to their advantages over stochastic structures in pro-ducing lightweight and high strength parts (Ashby et al., 2000).
8

Chapter 1. Literature review
The free-form capability of additive manufacturing enables engineers tomanufacture lattice structures. This ability to manufacture lightweight struc-tures entices engineers in the aerospace industry to use lattice structuresmanufactured with additive manufacturing (Wong and Hernandez, 2012). Inthe aerospace industry, lightweight parts are needed to improve their per-formances. Weight reduction is really important in the aviation industry,where a reduction of one kilogram in an aeroplane can help fuel savings ofup to 3000 USD per year (Fall, 2013). Hence the importance of lattice struc-tures in producing lightweight structures to reduce cost. The cost factor isimportant in the automotive industry, thus low-cost titanium powders areneeded to expand its use in this domain (Froes and Dutta, 2014). Latticestructures are also important in biomedical engineering, where it is suitablefor cell attachment and growth on implants (Darwish and Aslam, 2016; Pon-ader et al., 2008). The main players of additive manufacturing are from theaerospace and medical industries, while other industries such as automotiveare beginning to exploit the use of titanium alloys.
1.2 Introduction on lattice structures
History and background Lattice structure is a type of architectured ma-terial, which is a combination of a monolithic material and space to generatea new structure which has the equivalent mechanical properties of a newmonolithic material (Ashby, 2013).
Figure 1.1: Architectured materials according to (Ashby, 2013)
Figure 1.1 illustrates the two combinations and categories of architecturedmaterial. Architectured materials are also known as cellular structures. Theword “cell” originates from a latin word called “cella”, which means a smallcompartement or an enclosed space (Gibson and Ashby, 1999). Clusters
9

Chapter 1. Literature review
of cells creates a cellular structure. Most common cellular structures ineveryday life are wood, cork and sponges. These structures have existed forages and human beings have benefited from their various uses. For example,cork has been used in wine bottles since the Roman age. Engineers are nowcapable of making cellular structures. Structures such as honey-comb likestructures have emerged to create lightweight structures.
Lattice structures in nature There are also many materials in naturewhich contain lattice structure designs. These materials play a role in lightweightstructures. Natural tubular structures often have honey-comb like or foamlike core, which supports denser outer cylindrical shell and increases the re-sistance of the shell to local buckling failure (Gibson, 2005). These materialscan be a reference for the configurations of lattice structures in creatinglightweight high strength materials. For example, hexagonal lattice struc-tures have some similarities with cellular structures of wood. The stiffnessand strength of a species of wood depends on its density and the direction ofthe load applied on it. Its stiffness and strength is higher if the direction ofthe load applied is the same as the direction of the wood, compared to if itwas applied across it. Another example is the structure of trabecular bone.The structure of the bone is adapted to the loads applied to it. It grows inresponse to the magnitude and direction of the load applied (Gibson, 2005).
Stochastic and periodic structures Architectured materials can be di-vided into two categories, stochastic and periodic structures. Materials char-acterized by a unit cell that can be translated through the structure arereferred to as periodic materials (Wadley, 2002). Whereas cellular materialswhich cannot be characterized by a single unit cell area are referred to asstochastic foams.
Prismatic and lattice structures It exists two types of periodic cellularstructures. First, periodic materials where the unit cells are translated in twodimensions are known as prismatic cellular materials (Wadley, 2002). Anexample of a prismatic cellular material is the honeycomb structure, whichhas very good properties for a high stiffness and low mass structure (Rochuset al., 2007). The second type, are periodic materials which have three-dimensional periodicity. This means that its unit cells are translated alongthree axis. These structures are frequently referred to as lattice materials(Wadley, 2002). Therefore, a lattice structure is an example of a cellularstructure.
10

Chapter 1. Literature review
Figure 1.2: Stochastic, periodic, prismatic, and lattice structures
In this work, the terms described above are used to identify specific struc-tures and avoid ambiguity. The Venn diagram in figure 1.2 shows the differ-ence between stochastic, periodic, prismatic and lattice structures. In thiswork, we consider lattice structures as periodic cellular structures. Table 1.1illustrates the definition of the terms used in this PhD for elementary andlattice structures.
Table 1.1: Definition of elementary and lattice structure used in this PhD
11

Chapter 1. Literature review
Lattice structure patterns There are many types of lattice structurepatterns. A lattice structure pattern depends on the pattern of its elementarystructure, as shown in table 1.1. Common lattice structure patterns are octet-truss , cubic, tetrakaidecahedron, and open-cell foam lattice structures. Table1.2 illustrates an octet-truss elementary structure containing an octahedralcore surrounded by tetrahedral units, tetrakaidecahedron structure and open-cell foam structure. Open-cell foam structures imitate stochastic structuresby placing struts connected at the joints. These joints have low connectivitywith other joints.
Table 1.2: Octet-truss (Ashby, 2006), tetrakaidecahedron (Zhu et al., 1997)and open-cell foam elementary structures
.
1.3 Manufacturing lattice structures
Cellular structures in nature have been used by humans since thousands ofyears. Now, new techniques have emerged to manufacture these structures.We examine the processes that can be used to manufacture cellular andlattice structures.
1.3.1 Manufacturing stochastic and prismatic struc-tures
The first processes capable of manufacturing cellular structures were mainlyfor stochastic and prismatic structures. Manufacturing lattice structures usedto be more costly compared to manufacturing stochastic metal foams. Thisresulted in wide use of metal foams and honey-combs in structures.
The manufacturing of metallic cellular structures emerged as an impor-tant new field of metallurgy, various techniques have emerged to manufac-
12

Chapter 1. Literature review
ture these structures. These techniques can be either from liquid or solidstate. For example in liquid state process, gas injection is used to createthese structures, whereas in solid state processes, foaming agents are used tomanufacture cellular metals.
1.3.2 Conventional lattice structure manufacturing meth-ods
Table 1.3: Investment casting (Mun et al., 2015)Expanded metal sheet(Kooistra and Wadley, 2007), metallic wire assembly (Queheillalt andWadley, 2005) and snap fit (Dong et al., 2015) method process to manu-facture lattice structures.
In this section, we review conventional manufacturing techniques to pro-duce lattice structures and its limitations. There are four different tech-niques, investment casting, expanded metal sheets, metallic wire assembly(Moongkhamklang et al., 2008) and snap fit method. Table 1.3 illustrateseach manufacturing technique. For the investment casting technique, firstthe pattern assembly is dipped in ceramic slurry to obtain a ceramic shellcoating. The next step is the drying and dewaxing of the pattern assembly.The final step is the shell cracking to obtain the final product. Expanded
13

Chapter 1. Literature review
metal sheets process consists in three main operations which are slitting, flat-tening and folding the metal sheets. In the metallic wire assembly process,first stainless steel solid wires and hollow tubes are assembled using toolingto align the cylinders in collinear layers. Orientation alternates for each layerto form the lattice’s structure. Finally the structure is bonded using a braz-ing technique. In the snap-fitting method (Dong et al., 2015; Finnegan et al.,2007), metal sheets were cut with water jet according to the truss pattern.Then the rows of the trusses were aligned and snap-fit attached to the struc-ture to form the octet-truss lattice structure. Finally the lattice structure isbrazed for bonding of the structure.
Disadvantages of conventional lattice structure manufacturing tech-niques Each of the conventional manufacturing method explained in theprevious paragraph has its own limitations. For example, the metallic wireassembly process has limitations in terms of the lattice structure patternable to be manufactured. The operation to form the lattice pattern is com-plicated and is not capable of manufacturing complex lattice structures pat-terns. Whereas the expanded metal sheet process produces large amounts ofwaste and the metal has to be perforated and punched (Suard, 2015), whichlimits the number of metals that can be processed. As for investment cast-ing, the need to infiltrate and flow into the tortuous structure also limits theprocess for alloys which has high fluidity (Wadley et al., 2003). Investmentcasting is able to manufacture aerospace-quality titanium alloy lattice struc-tures (Li et al., 2008) and complex shapes, however it is not cost-effectiveand needs new methods to detect and repair the casting defects which areoften present in this process (Wang et al., 2003).
1.3.3 Metallic Additive Manufacturing
Additive manufacturing is defined by the American Society for Testing Ma-terials (ASTM) as “ a process of joining materials to make object from 3Dmodel data, usually layer upon layer, as opposed to subtractive manufactur-ing methodologies ” (Standard, 2012). In the last ten to twenty years, manynew metallic additive manufacturing technologies have been developed. It isnow possible to manufacture metallic end products with additive manufac-turing (Vayre et al., 2012b).
History The first breakthrough in additive manufacturing was in 1987,when Carl Deckard, a university of Texas researcher succeeded in developinglayered manufacturing and printed 3D models using a laser light to fuse layer
14

Chapter 1. Literature review
by layer metal powders to create a prototype. The first patent for 3D objectsby CAD was awarded to Charles Hull, who was widely regarded as the fatherof the rapid prototyping industry.
Classification There are many types of additive manufacturing technolo-gies. These can be categorized into two categories, either layer-based or directdeposition (Vayre et al., 2012b). Examples of layer-based additive manufac-turing are selective laser sintering (SLS), selective laser melting (SLM) andelectron beam melting (EBM). The two types of energy sources used to meltthe metallic powders for additive manufacturing machines are laser and elec-tron beam. The techniques which fully melt the particles are SLM and EBM.Whereas the processes which partially melt the particles are SLS and directmetal laser sintering (DMLS). Only EBM and SLM are capable of manu-facturing metallic lattice structures. In this Phd, we focus on the latticestructures manufactured with EBM.
EBM technology Additive manufacturing is a manufacturing process basedon a layer-by-layer approach. It is the opposite to subtractive manufactur-ing. Parts are manufactured by melting successive layers of materials ratherthan removing them, as is the case of subtractive manufacturing. Additivemanufacturing is capable of manufacturing free-form parts. Thus suitablefor lattice structure manufacturing.
During the manufacturing process, each layer of the part is melted to theexact geometry of the 3D CAD model. During this process, the machinebuilds a series of layers with each one on top of the previous one. Additivemanufacturing requires a 3D CAD model of each part, for example the octet-truss lattice structure in figure 1.3. The 3D CAD model is then sliced intoslices in one direction (Brackett et al., 2011) by a pre-processing additivemanufacturing software. Fine metallic powders are melted to form the exactgeometrical form of the part.
The system for an electron-beam-melting (EBM) machine consists of avacuum chamber, work piece, powder container, and the powder meltingsystem, as shown in figure 1.4. An EBM machine uses high voltage and anincandescent cathode to generate an electron beam which melts the powder.This takes place in a high vacuum chamber to avoid oxidation of the metalpowder and parts (Wong and Hernandez, 2012). The machine has to beplaced in a closed-door room to avoid oxidation of metallic powder and dustmixing with the powder.
After the manufacturing process, the part is then taken out from themachine to remove the unmelted metallic powder. This process is conducted
15

Chapter 1. Literature review
Figure 1.3: An octet-truss lattice structure 3D model in CAD
Figure 1.4: Inside an EBM machine (Lu et al., 2009)
using the powder recovery system (PRS). The PRS machine blows away allthe unmelted power which will then be collected, filtered and reused in theadditive manufacturing machine for the next manufacturing cycle.
When positioning the parts in the build, supports are added. These sup-ports are added in the pre-processing software dedicated to additive manu-facturing. They are important to help support the molten parts and also toevacuate heat from the part.
16

Chapter 1. Literature review
Advantages of additive manufacturing Compared to conventional man-ufacturing processes, additive Manufacturing has many advantages. For ex-ample, the ability to manufacture complex forms and shapes (Vayre et al.,2012a). This capability gives a whole new freedom for designers when design-ing the parts. Thus helping engineers to produce hollow parts and improvethe functionality of components. For example, engineers can now design andmanufacture topology optimised parts and lattice structures.
Additive manufacturing is no longer limited to plastic parts and is capableof producing technical components and not just prototypes (Reinhart andTeufelhart, 2011). Engineers can directly manufacture metallic end products.This saves time and eradicates the need to use a mould.
Additive manufacturing enables the use of titanium alloys and cobaltchromium instead of conventional materials. Studies have proved that thetitanium parts manufactured with additive manufacturing have mechanicalproperties which are good or better than the conventionally manufacturedtitanium alloys (Dutta and Froes, 2015).
Tests in the most difficult conditions have been done on additive manufac-tured parts. Cooper et al. tested hydraulic manifolds against real conditionsfound in the demanding world of motorsports application. Parts produced byadditive manufacturing show that this technology is reliable in consistentlyproducing accurate dimensions and also in meeting the mechanical crite-rias needed (Cooper et al., 2012). This study proved the robust capabilitiesand consistency of components manufactured with additive manufacturing.Therefore, it will provide users the confidence to use this technology to pro-vide mechanical and geometrical properties that match those of traditionalmanufacturing processes. Studies have shown that titanium alloy parts man-ufactured with additive manufacturing have mechanical properties which areas good or better than those manufactured with conventional manufacturingprocesses (Froes and Dutta, 2014).
Constraints and limits of additive manufacturing In the previousparagraphs, many advantages of additive manufacturing have been explained.However, it does bring it’s own constraints and disadvantages too. Supportsare needed to dissipate heat during the building process and also to avoidoverhanging surfaces from collapsing (Vayre et al., 2012a,b). There is alsothe need to remove un-melted powder from the build after the process anda potential need for post surface-treatment if needed for functional surfaces(Cooper et al., 2012). These problems has resulted in many new research.New discoveries have to be made to solve these problems. In terms of cost andenvironmental friendliness, there is not yet reliable research to conclude that
17

Chapter 1. Literature review
additive manufacturing is better than traditional manufacturing processes.It is a new process that will come alongside the others.
Manufacturability of lattice structures These manufacturability con-straints have to be taken into account when designing lattice structure. Man-ufacturability of lattice structures have to be integrated during the designprocess to avoid problems (Zhang et al., 2015). For example, the effects ofcurling, the need of supports and the capability of removing unmelted metal-lic powders with the PRS have to be considered in the design process of latticestructures. The difference between the struts of the lattice structure CADmodels and those of the manufactured structures poses a problem, especiallyfor structures with thin struts. Figure 1.5 illustrates the diameter differencebetween the struts designed in CAD and those manufactured with additivemanufacturing. A mechanical equivalent diameter of lattice structure strutsmanufactured with additive manufacturing was proposed by (Suard, 2015).
Figure 1.5: Difference between a designed lattice structure strut in CAD,its numerical equivalent cylinder, geometrical equivalent cylinder and themanufactured strut with additive manufacturing (Suard, 2015)
Table 1.4 summarises the advantages and disadvantages of additive man-ufacturing and conventional lattice structure manufacturing techniques ex-plained in this section.
1.3.4 Conclusion
Existing lattice structure manufacturing processes such as investment cast-ing, expanded sheet metal, metallic wire assembly and snap-fit method have
18

Chapter 1. Literature review
Advantages Disadvantages
Additive Manufacturing
Ability to manufacture complexforms and hollow partsEnables the use of titanium alloysand cobalt instead of conventionalmaterialsEquivalent or better mechanicalproperties than with conventionalmanufacturing processes
The need of supports to dissipate heatand avoid overhanging surfaces collapsingThe need to remove unmelted powderafter the building processPotential need for post surface-treatment
Conventional techniques Not addressed
Complicated operationsProduces large amount of wasteLimits the number of metals that can beprocessedLimits to alloys with high fluidityNot cost-effectiveNeeds new methods to detect and repaircasting defect
Table 1.4: Synthesis: Advantages and disadvantages of additive manufactur-ing and conventional lattice structure manufacturing techniques
limitations. For the last ten years, additive manufacturing has become aviable answer to manufacture lattice structures and is gaining popularity asthe primary manufacturing process for lattice structures ahead of conven-tional methods (Rashed et al., 2016). With additive manufacturing, manytypes of lattice structures can be manufactured easily and reliably. Hence,contributing to the possible wide use of lattice structures.
However, additive manufacturing has its manufacturing constraints too,such as curling, the need for support and the need to blow away the unmeltedmetallic power. These manufacturability constraint factors have to be con-sidered and integrated in new lattice structure design strategy propositions.
1.4 Lattice structure properties
Introduction In material science, material properties can be shown inmany possible diagrams. However, they all have one thing in common, whichis that they have parts of the diagram filled with materials, and parts whichhave holes and are empty (Ashby, 2013). For example, figure 1.6 shows thebig holes in the top left and bottom right corner in the Young’s modulus-density space. This means that it does not exist a monolithic material whichhas high elastic modulus and low density.
Monolithic materials are not able to fill the whole space in material scienceand are not sufficient to fulfil all required properties, hence creating theneed of architectured material. With architectured material, it is possible toproduce parts with high stiffness-to-density ratio and fill these holes of the
19

Chapter 1. Literature review
Figure 1.6: Young’s Modulus-density space materials diagram (Ashby, 2013)
diagram. These materials such as foams and lattice structures must be seenas a single material in its own right, with its own properties. If a cellularmaterial outperforms an existing material in the material property diagram,then the material property space has been extended (Ashby, 2013). Thepossibility to fill the big holes left in this Young’s modulus-density diagramwith lattice structure is very interesting.
History Cellular structures have been known for generations, but it wasonly in the last 30 years that an understanding of materials with a cellular-like structure has emerged. Previously, manufacturing lattice structures werelimited by the process available during that period. It now exists techniquesto manufacture lattice structures easily. This has impacted the research inlattice structure properties. Previously, the majority of cellular material re-search publications were related to the cellular structures which were able tobe manufactured at that time. Thus, the majority of research papers pub-lished were about material properties of stochastic and prismatic materialsonly. It was then possible to manufacture these types of structures easily andreliably by manufacturing processes such as foaming solidification (Wadley,
20

Chapter 1. Literature review
2002).There were however already some manufacturing processes which were ca-
pable of manufacturing lattice structures, but these processes were expensive,complicated and had many limitations. Making it not cost effective and notsuitable. This increased cost outweighed the improvements gained in weightreduction of the parts manufactured. Manufacturing stochastic metals weremore cheaper than manufacturing periodic lattice structures (Wadley, 2002).The high cost and complexity of titanium investment casting process andlimitations of other conventional process to manufacture lattice structuresresulted in very limited mechanical property information for titanium-basedlattice structures as a function of their relative density (Dong et al., 2015).
1.4.1 Mechanical properties
Figure 1.7: Three main lattice structure design variable influence accordingto (Ashby, 2006)
Influences of a structure’s property There are three main factors whichinfluence the properties of a structure, the material of the structure, its celltopology, and its relative density (Ashby, 2006). This is shown in figure1.7. The material of which the lattice structure is made of influences thestructure’s mechanical, thermal and electrical properties. Whereas the el-ementary structure pattern or topology influences the bending-dominatedor stretching-dominated property of the structure. The relative density de-pends on the struts size and length. The relative Young’s modulus of abending-dominated structure scales with the square of the relative density.The scaling law of strength can be derived as:
21

Chapter 1. Literature review
E
Es
∝ (ρ
ρs)2 (1.1)
Prismatic structures have single properties which are only in one directionof the part. Whereas lattice structures can have multifunctional propertiesand along each X, Y and Z axis of the part. Another interesting possibilityis to create a lattice structure which has different mechanical properties foreach direction of the part, depending on the requirements of the part in eachdirection.
Stretching and bending-dominated structures To help differentiatethe lattice structure mechanical properties and its applications, these struc-tures can be categorized in two different deformation categories: bending-dominated and stretching-dominated structures. Stretching-dominated isuseful to produce high stiffness and low weight parts, for example cubic andoctet-truss lattice structures. On the other hand, by orienting the latticestructures struts in a certain pattern to obtain a bending dominated struc-ture, it is also possible to manufacture parts suitable for energy absorption(Evans et al., 2001). The design pattern of a lattice structure influences itsmechanical property. This information (Suard, 2015) is summarized in table1.5 for each lattice structure pattern.
Table 1.5: Types of deformation for lattice structures according to (Suard,2015)
The difference between stochastic and periodic structure mechanical prop-erties influences their applications. Stochastic foams are bending-dominatedstructures, thus are well equipped for energy absorption. Table 1.6 showsthe influence of stretching and bending-dominated structures in mechanicalproperties.
The experiment in figure 1.8 shows that stretching-dominated structuresoffer greater stiffness and strength per unit weight than those in which the
22

Chapter 1. Literature review
Table 1.6: Influence of stretching and bending-dominated structures on me-chanical properties according to (Ashby, 2006)
23

Chapter 1. Literature review
Figure 1.8: Stiffness experiment of octet-truss (stretching-dominated) andkelvin foam (bending-dominated). The octet-truss lattice structure demon-strates markedly superior specific stiffness compared with the open-cell foam(Kelvin foam) (Zheng et al., 2014)
dominant mode of deformation is bending (Deshpande et al., 2001). In thisexperiment, a compression test was conducted to compare and study thestiffness of an octet-truss lattice structure and a Kelvin foam. An octet-trussis a stretching-dominated structure, where as a Kelvin foam is a bending-dominated structure.
Therefore, to maximize stiffness and strength, the structure must bestretching-dominated. This information provides an initial basis for the studyof lattice structure mechanical properties. However, it must be further de-tailed and research is needed to find out for all lattice structure configura-tions. At the moment it does not yet exist a cellular structure database whichcontains elastic constants, yield criteria and failure mode of different latticestructure patterns (Zhang et al., 2015).
24

Chapter 1. Literature review
1.4.2 Conclusion
Many comprehensive researches and papers regarding cellular structure prop-erties have already been published (Wadley, 2006; Ashby et al., 2000; Ashby,2006; Wolcott, 1990). However, research regarding lattice structure prop-erties are yet to be fully explored and studied. Previous material sciencepapers published regarding cellular structures depended predominantly ontheir manufacturability, which explains why many research previously con-ducted were mainly on foams and prismatic structures only. For examplemechanical properties of the honeycomb structure and metal foams.
Manufacturing process to manufacture lattice structure existed, but wasexpensive and thus outweighed its weight improvements, consequently mak-ing it not extensively used in mechanical parts. Hence not many publicationswere published on lattice structure properties and many are yet unexplored.The main publications were regarding the main structures such as the octet-truss lattice structure. However, the innovation of additive manufacturingtechnology changes all this. Technological advances in additive manufac-turing has provided opportunities to use lattice structures in part designs.Thus, creating the need to study lattice structure properties. This vacuumof information is one of the reason that prevents designers from using latticestructure in part designs. Lattice structure configurations and propertieshave to be studied in order to integrate it correctly in part designs.
1.5 Lattice structure design methods
In this section, the aim is to explain about lattice structure design methodsand additive manufacturing from a design perspective.
1.5.1 Design for additive manufacturing
Additive manufacturing has brought unprecedented freedom for engineers tomanufacture parts with complex forms. However, current design methods donot take full advantages of additive manufacturing capabilities. Hence theneed for a new design method with the consideration of lattice structuresdesign for additive manufacturing parts. In this section, we take a look atcurrent design methods proposed for additive manufacturing.
Additive manufacturing has many new advantages compared to conven-tional manufacturing processes and therefore creates new opportunities inmanufacturing. These advantages will only be fully utilized and optimizedto its maximum if the whole process in creating the parts is specifically tai-lored for additive manufacturing. The challenge is now on designers to be
25

Chapter 1. Literature review
innovative in the design process to reach the maximum potential of additivemanufacturing capabilities. Improvements in the design strategy and CADtools are needed in order to take full advantage of these capabilities (Rosen,2007).
Current design strategies are not tailored to optimize additive manu-facturing (Vayre et al., 2012a). The advantages of additive manufacturingwill only be reached and optimized to its maximum if the design methodis specifically tailored for its use. It may require a change in the numericalchain so that additive manufacturing can be used at its full potential by de-signers. Designers have to find new design strategies to achieve this objective(Cooper et al., 2012). To fully optimise the potential of additive manufac-turing geometrical freedom, it is important to progress in design guidelinesfor additive manufacturing (Kranz et al., 2015). There is currently a lack ofdesign methods to help engineers design lattice structure parts for additivemanufacturing.
1.5.2 Design for additive manufacturing methodologypropositions
Design methods for additive manufacturing can be divided into many cate-gories. First in terms of the scale size of the parts, and second its purpose indifferent disciplines. Figure 1.9 summarizes these categories of design strat-egy proposals for additive manufacturing according to (Tang et al., 2014). Inthis PhD, the scope of the research focuses on the design strategy of meso-level structures. Macro-level structure design proposals concentrates on theuse of topology optimization of the form of the parts, whereas meso-levelstructures focuses lattice structure designs.
Figure 1.9: Design strategy categories for additive manufacturing accordingto (Tang et al., 2014)
A new design method has been proposed by (Vayre et al., 2012a) toimprove the additive manufacturing design process. It consists of four steps.
26

Chapter 1. Literature review
The first step is to analyse the specifications of the part, then to proposesingle or several rough shapes. Third to optimize the shapes and definecertain parameters. Lastly the design is validated. Figure 1.10 illustratesthis design strategy. This proposition has taken into account the advantagesof additive manufacturing to design lightweight structures. However, thisproposition can be further improve as it does not take advantage of the useof lattice structures in the method.
Figure 1.10: Square bracket design proposed using a new design method foradditive manufacturing (Vayre et al., 2012a)
Other proposition includes, topology optimization on lattice structurestruts to modify its densities (Zhang et al., 2015). This idea integrates cellu-lar structure construction, topology optimization and material model calibra-tion. Using scaling laws, the topology optimization of the cellular structureis applied just as it is usually applied on a continuous solid object. Fig-ure 1.11 illustrates the steps in this proposition. This design-optimizationmethod permits engineers to conduct topology optimization on the latticestructures just as they are done for solid objects. Explicit lattice structuresare then constructed by mapping the continuous characterization parametersto individual cells.
A new design method has been proposed which integrates multi-level andmulti-discipline design methods into a single process, as shown in figure 1.12.Tang et al. notes that current design methods have two limitations. First,most design methods are focused on a single level scale and second, thatthere are few design methods that integrate multi-functions in a single part(Tang et al., 2014). They proposed a framework incorporating multifunctionand multilevel design method in a single part. Their method integrates theuse of traditional topology optimization into multi discipline optimizationframework and the use of the homogenization theory to convert the result oftopology optimization into meso-lattice structures (Tang et al., 2014).
27

Chapter 1. Literature review
Figure 1.11: Steps for design-optimization of a lattice structure (Zhang et al.,2015)
Figure 1.12: Integrated multi-level and multi-discipline design process (Tanget al., 2014)
28

Chapter 1. Literature review
1.5.3 Conclusion
Current design methods are not tailored to optimize additive manufacturingrequirements. Some research have tried to explore and find a solution to thisproblem. For example, new design for additive manufacturing methodologyproposition and the optimization of lattice structures. These propositionsare a start and have to be explored further in order to make it more reliableto be used in additive manufacturing. The integration of lattice structures isnot yet clear. Currently it does not exist a lattice structure pattern selectionmethod to select suitable lattice structure patterns for each purpose. Newlattice structure design strategies are needed to maximise its use in partdesigns.
1.6 CAD file formats for additive manufac-
turing
Additive manufacturing application has increased tremendously in the twenty-first century. Applications and research in additive manufacturing have in-creased and are now applied in many domains. Many new technologies andimprovements have been made. However, the breakthrough in manufacturinghas not yet been followed by a breakthrough in CAD.
1.6.1 CAD tools to create lattice structures
New CAD tools are needed in order to take full advantage of additive man-ufacturing capabilities. Many researchers said they see the lack of capableCAD tools as a limit for their research and for the utilization of additivemanufacturing technologies(Rosen, 2007). It may require a change in thenumerical chain so that addtive manufacturing can be used at its full poten-tial by designers (Vayre et al., 2012a). CAD software must be tailored tomeet additive manufacturing needs (Campbell et al., 2012). Additive man-ufacturing requires 3D CAD models of each part, which are then sliced intoslices in one direction in a CAM software to generate cross section profiles(Brackett et al., 2011). These cross section profiles are exported directlyto the additive manufacturing machine to be manufactured layer-by-layer.Most commercially available CAD programs use parametric B-Rep systems,thus making it challenging to produce digital models for additive manu-facturing. These are suited to modeling forms and shapes associated withconventional manufacturing processes such as extrusions, but less suitablefor complex geometries associated with additive manufacturing (Thompson
29

Chapter 1. Literature review
et al., 2016). Traditional CAD systems require an interface that can developcomplex structures and store their data and properties (Thompson et al.,2016).
1.6.2 Analysis of current CAD file formats
STL STL has been the de facto format for the last two decades (Hiller andLipson, 2009). STL is a very simple format and has only triangular facetsand is potential for defining faces with any number of edges (McMains et al.,2002). This is the general format for STL :solid namefacet normal ni nj nk
outer loopvertex v1x v1y v1zvertex v2x v2y v2z
vertex v3x v3y v3z
endloopendfacetendsolid name
The STL file format has many disadvantages. For example, it is not goodenough to handle multiple and graded materials (Hiller and Lipson, 2009). Italso does not contain information on surface colors. This problem is specificto rapid printing machines which possess the capability to print 3D colouredobjects. There are four main deficiencies in the STL file format:
1. Redundancy in the file format.2. Lack of a complete geometric description. Exact shape reconstruction
is impossible.3. No well-defined approximation method.4. Lack of technological information.
Consequently, these four deficiencies give the following implications re-spectively:
1. Large STL file formats which slows down fabrication2. Produce a lack of coherence between facets and a risk for creating
mismatching vertices and incorrect topology. Consequently, object dis-tortions may be produce.
There is redundancy in the file format because the normal can be deter-mined in two different ways (Al-Ahmari and Moiduddin, 2014). The first isby calculating the vertices which are ordered in a counter-clockwise round
30

Chapter 1. Literature review
the facet, and the other is by referring to the normal specified in the STLformat. Which makes one of them redundant. Unless in cases where thefacet is very small and calculations based on the vertex positions are usuallyinaccurate. Lack of coherence between facets is also another problem. Thereis no information except for the vertices’ positions. Which means that itis necessary to search for matching vertices if the model is to be recreated.This is potentially time consuming and prone to creating incorrect topology.These problems of the STL format are well known. But it is still used and noreal alternative has been able to replace STL. The solution to this problemis still an open question, the obvious solution is to replace it with a properdata exchange format. But this has not yet been achieved due to the well-known problems of introducing a new format. There are a few extension tothe STL file format aimed at overcoming these problems. Three approacheshave been discussed to improve data communication for free-form fabrication,by the use of approximation control parameters, the development and use ofSTL extensions and with STEP based methods. These extension proposalsshow that small work and extensions can improve largely the STL format.However, this study also shows that even with extensions and improvements,it is still necessary to replace the STL file format for the use in additivemanufacturing.
STEP The Standard for the Exchange of Product Model Data (STEP) isa comprehensive ISO standard (ISO 10303) that describes how to representand exchange digital geometry and product information (Iyer et al., 2001).It provides information for the complete product life-cycle, such as manu-facturing, design, maintenance, utilization and disposal (Bhandarkar et al.,2000). STEP is a solid model representation which is unnecessarily complexfor the needs of the additive manufacturing community. The main reason forthe development of formats such as IGES and STEP was to have a neutralCAD file format which was application independent (Iyer et al., 2001). Thusit is supported by all CAD systems. STEP was created as a successor to theIGES file format (McHenry and Bajcsy, 2008).
It is subdivided into a head and data section. The head section consistsof a fixed structure, whereas the data section contains the application datato a given Express schema. The entities to be captured and exchanged inSTEP are defined in schemas written in an information modellings languagecalled EXPRESS.
The ISO 10303 has parts which contains Applications Protocol (Aps).Examples of Aps which exist currently area :
• AP 202 Associative draughting (1996)
31

Chapter 1. Literature review
• AP 203 Configuration-controlled design (1994)• AP 207 Sheet metal die planning and design (1999)• AP 224 Mechanical product definition for process planning using ma-
chining features (1999)• AP 225 Building elements using explicit shape representation (1999)
The most common AP use is the application protocol AP 203, Configuration-controlled design. It is used for transferring product shape models, assemblystructure, and configuration control information.
IGES The Initial Graphics Exhange Specification (IGES) file format waspublished by the National Bureau of Standards in 1980. It was designed tostore information of 2D and 3D parts. It can be regarded as “The first modernelectronic data exchange tool” (Bhandarkar et al., 2000). It was popular, butnot enough to satisfy all the requirements of engineers and researchers, whicheventually lead to the development of the STEP file format. The IGES fileformat is a neutral format which permits the transfer of data between CADand engineering systems. The IGES file format does not provide data otherthan drawing or 3D modeling, thus it is not suitable for CAM needs, andalso does not provide any life-cycle related information like the STEP fileformat (Bhandarkar et al., 2000). The IGES file format has some problems,such as that it does not have a formal data model, causing ambiguities. Itsstructure of 80 characters also makes it very verbose and very difficult tounderstand. This makes it very difficult to identify and correct mistakes anderrors (Bhandarkar et al., 2000; McHenry and Bajcsy, 2008). Since IGESdoes not have a formal data model, few problems have surfaced for CADvendors which have developed their own extension to the file format. Suchas the loss of information and inconsistency with other CAD systems. Thusmaking it unacceptable for engineering use (Bhandarkar et al., 2000).
AMF The proposed Additive Manufacturing Format (AMF) looks to bea very good prospect to replace STL files as the de facto format for addi-tive manufacturing. However, this has not been the case because it is notopen-source and the capabilities of AMF to define material colors and typesof materials are not really needed or used by most additive manufacturingmachines. AMF is defined by curved triangles of the surface of a part. Accep-tance of this file format for use in additive manufacturing in the end dependson its endorsement by both the CAD suppliers and additive manufacturingmanufacturers (Al-Ahmari and Moiduddin, 2014).
32

Chapter 1. Literature review
PLY The Polygon file format, or also known as Stanford triangle format isa pure-mesh based format. It uses polygon meshes and can include informa-tion about texture and color but does not define materials or microstructurevolumetrically. It was intended to store and view data from 3D scanners. Itspurpose was to be flexible and act as a portable 3D file format (McHenryand Bajcsy, 2008). The Ply file format has both binary and ASCII versions.For the binary version, it includes information to make it machine indepen-dent. It is popular due to its simplicity and flexibility (McHenry and Bajcsy,2008). Users can define key types to make extensions. Ply supports geometryin the form of vertices, edges, faces, vertex colours, textures and materials(McHenry and Bajcsy, 2008).
OBJ OBJ is a mesh based format, which is compact and widely accepted inthe 3D modeling community. It can map textures easily but lacks the abilityto define materials or microstructure volumetrically. The Obj file format is asimple, text based file format (McHenry and Bajcsy, 2008). It was developedby Wavefront techonologies.
The Obj file format consists of line of keys and various values. It supportsgeometry informations such as vertices, edges, faces, parametric surfaces, ver-tex, textures, material properties, and groups (McHenry and Bajcsy, 2008).It is widely adopted by other CAD systems and can be imported and exportedby a number of them (McHenry and Bajcsy, 2008). Below is an example ofan Obj file format keys and values:v 0.0 0.0 0.0v 0.0 1.0 0.0v 1.0 0.0 0.0f 1 2 3
Table 1.7 shows the key informations :
Key Description# Commentv Vertexl Linef Face
vt Texture Coordinatevn Normalg Group... ...
Table 1.7: Obj file format key information
33

Chapter 1. Literature review
VRML Virtual Reality Modeling Language (VRML) is a mesh-based fileformat which was intended to allow 3D content to be viewed over the web(Nadeau et al., 1998). It includes information about 3D surface, colour, andalso information that is irrelevant for additive manufacturing. For example,transparency, animations, lights, sounds, and embedded navigation URLs.VRML does not support defining multiple materials within a given mesh orarbitrary microstructure.
Synthesis on CAD file formats In table 1.8, we compare each CAD fileformat, its advantages and disadvantages.
1.6.3 Conclusion
Additive manufacturing is a new technology which has its own numericalchain. To fulfil its potential, each stage of the numerical chain has to betailored according to additive manufacturing requirements . Hence a needto study each phase in the numerical chain to see whether improvements areneeded.
From the analysis of various CAD file formats, we conclude that thereis currently not a file format which is fully optimized for additive manufac-turing. Each file format which exists today were created for other uses andtechnologies in the past. Recent work have been conducted to create newCAD file formats for additive manufacturing, or modify existing ones to cor-respond to the need of additive manufacturing, but these are yet to replaceSTL as the de facto CAD file format in additive manufacturing. New CADtools are needed to overcome the these limitations. Thus the need to studyand create a new CAD file format for additive manufacturing which takesinto consideration the requirements of each phase in the numerical chain. Itwill require a change in the numerical chain so that designers can use lat-tice structures and additive manufacturing at its maximum potential (Vayreet al., 2012a).
34

Chapter 1. Literature review
FileFormat
Type Original purpose Advantage Disadvantage
IGES
(1980)
Geometry :Vertices,linespolylines,arcs,curves,parametricsurface,CSG, b-rep,Open source
To exchange databetween CADsystemsStore 2D and 3Dmodels
Neutral CAD file format
No formal information modelIncomplete exchange due tochanges by CAD systemsLife-cycle support informationonly for design applications80-column format is not easilyhuman understandableDifficulty to correct errors
STL
(1988)
TriangulatedOpen source
Stereo lithographymachines
Easy conversionWide range input outputSimple slicing algorithmSequential memoryaccess
Large file sizeTruncation errorsIncompletenessInconsistencyIncorrect normaland intersectionsDegerate facets
OBJ
(1992)
Geometry;verticesOpen source
For WavefrontTechnologies’advancedanimation package
SimpleCompactWide accepted in 3Dmodelling community
Not able to define materials
STEP
(1993)
TriangulatedboundaryFaceted boundaryGeneral surfaceB-rep solidOpen source
Describe life cycleproduct dataindependant fromany systemTo success IGES
Resourcs available totransfer slide dataIntegrated resoucrescontains all needed todefine contours andpatternsUse exact geometryand NURBS curvesContains geometry andmaterials informationPossible to includeprocess information
Unnecessarily complex forthe needs of additivemanufacturing
PLY
(mid 1990s)
Geometry :Vertices,edges,faces,vertex,colours,textures,materials
Store 3D datafrom scanners
SimplicityFlexibilityAllows user definedtypes
Does not define materials ormicrostructure volumetrically
VRML
(1997)Open source
Represent 3Dinteractive vectorgraphics for theinternet
Includes information ofsurface and colours
Unneccessary information forAM: transparency,animations,lights, sounds, URLSImpossible to define multiplematerials
AMF(2011)
Curve trianglesOpen source
AM machines Resolution independentContains unnecessaryinformation for metallic AM
Table 1.8: Synthesis : CAD File Formats Comparison
1.7 Literature review conclusion
With the progress in additive manufacturing as a reliable process to manu-facture lattice structures, it should have been the catalyst in the wide useof these structures in products. However, this is not yet the case as thereis still a large vacuum of information regarding lattice structure mechanicalproperties, lattice structure design strategies and CAD file format and soft-ware for additive manufacturing. Hence lattice structures are currently not
35

Chapter 1. Literature review
broadly used in mechanical parts even though is has many advantages, suchas producing high strength low mass structures.
Therefore, in order to reach the great potential of additive manufacturingand to facilitate wide use of lattice structures in products, improvements andresearch must be made in these four aspects :
• Lattice structure mechanical properties
• Lattice structures design strategies
• CAD and CAE tools for lattice structures
• CAD file formats for additive manufacturing
These four aspects are investigated in the following chapters to achievethe PhD objective.
36

Chapter 2
CAD tools in additivemanufacturing
Contents2.1 Evaluating current CAD tools performances in the
context of design for additive manufacturing . . . . 38
2.1.1 Human Machine Interface . . . . . . . . . . . . . . . . 40
2.1.2 CAD software utility . . . . . . . . . . . . . . . . . . . 42
2.1.3 CAD file format . . . . . . . . . . . . . . . . . . . . . 44
2.1.4 RAM usage . . . . . . . . . . . . . . . . . . . . . . . . 46
2.1.5 Conclusion . . . . . . . . . . . . . . . . . . . . . . . . 48
2.2 Evaluating current CAE tools performances in thecontext of design for additive manufacturing . . . . 48
2.2.1 FEA computation file size . . . . . . . . . . . . . . . . 49
2.2.2 FEA time duration . . . . . . . . . . . . . . . . . . . . 50
2.2.3 Conclusion . . . . . . . . . . . . . . . . . . . . . . . . 51
2.3 Conclusion . . . . . . . . . . . . . . . . . . . . . . . . 52
37

Chapter 2. CAD tools in additive manufacturing
2.1 Evaluating current CAD tools performances
in the context of design for additive man-
ufacturing
Lattice structure is an important element in the design of additive manu-facturing parts. Therefore, there is a need to design parts containing latticestructures efficiently and conveniently using CAD tools. This chapter aimsto evaluate the current CAD tool’s performances in the context of design tocreate lattice structure 3D models.
The criteria chosen to evaluate these performances are:
• The total number of operations the operator has to perform to designthe basic lattice structure pattern.• The total time the operator needs to design a lattice structure• The time taken by the CAD software to apply and generate a repetition
function.• The CAD file sizes• The RAM usage in CAE and CAM software.
These criteria are used to evaluate the performances of current CAD toolsin terms of human machine interface, and data exchange between CAD, CAEand CAM for additive manufacturing, as shown in figure 2.1.
Figure 2.1: The roles of each criterion in evaluating CAD tools for additivemanufacturing
The computer used to carry out this experiment has the following speci-fications:
1. Windows 7 Professional 64 bits2. Intel R© Processor Core i7-3540M CPU @ 3.00 GHz
38

Chapter 2. CAD tools in additive manufacturing
3. 8 GB RAM4. 500 GB hard disc
Three variables have been chosen for the design of the experiment:
1. Dimensions and volumes of the parts2. Lattice structure patterns3. Sections of the bars of the lattice structures
Two lattice structure patterns were chosen to see how the software handlesthe design of simple lattice structures such as cubic lattice structures and alsomore complicated lattice structure patterns such as an octet-truss latticestructure:
1. Octet-truss lattice structures2. Cubic lattice structures
The bars of the lattice structures were designed with two different sectionsto see if it makes any differences in term of software and operator:
1. Square section2. Circular section
Figure 2.2 shows an example of a struts circular section.
Figure 2.2: Circular lattice structure bars
Four part dimensions were chosen to see how the software adapts fordifferent sizes of parts. These volumes were chosen to see the gradual effectsof volume sizes on the performance of the CAD software. The maximumdimension chosen is 20 cm × 20 cm × 20 cm, which is approximately themaximum dimension that can be built in current additive manufacturingmachines. The four dimensions and volumes are (see figure 2.3) :
1. 5cm × 5cm × 5cm (volume : 125cm2)2. 10cm × 10cm × 10cm (volume : 1000cm2)3. 15cm × 15cm × 15cm (volume : 3375cm2)4. 20cm × 20cm × 20cm (volume: 8000cm2)
39

Chapter 2. CAD tools in additive manufacturing
Figure 2.3: Different lattice structure dimensions
2.1.1 Human Machine Interface
The objective of this section is to observe the challenges experienced by theuser when designing lattice structures in a CAD software. The software usedin this experiment is CATIA. It uses the same B-REP models to describethe geometry and as other commercially available CAD software. Thereforethe results with CATIA will be comparable and representative of other CADsoftware such as Solidworks and Creo.
A total of 19 different parts with the different variables have been designedin the CAD software. Each operation and difficulty was observed and noted.Figure 2.4 is an example of some of the steps to design a 1 cm × 1 cm × 1cm octet-truss elementary structure.
Making up this elementary structure in a classical CAD environmentrequires no less than 91 operations. Some of these are illustrated in figure2.4.
1. Create a new plane2. Draw a circle in the sketch to form the section of the bar3. Extrude the circle to form the bar4. Create a new plane to draw the circle section bars5. Repeat function to generate symmetrical bars6. Create a new plane7. Apply the repeat function to generate symmetrical bars8. Create a new plane9. Apply the extrude function to generate a new bar
10. Create a new plane11. Apply the extrude function to create a new bar
40

Chapter 2. CAD tools in additive manufacturing
12. Repeat function to generate symmetrical bars
Figure 2.4: Creating a basic 1 cm × 1 cm × 1 cm octet truss lattice structurewith circular section bars
These are just some of the operations done to create the elementary fea-ture. Making the 1 cm× 1 cm× 1 cm lattice structure requires 91 operations,consisting of:
• 35 operations to create a sketch• 21 extruding operations• 3 rectangular repetition operations• 25 operations to define a new plane• 7 operations to define a new point
The total time that I needed to create this 10 mm × 10 mm × 10 mmoctet-truss lattice structure is 1 hour and 35 minutes. As described in thissection, the basic 10 mm × 10 mm × 10 mm lattice structure had to be
41

Chapter 2. CAD tools in additive manufacturing
designed manually step by step and must be represented graphically to obtainthe lattice structure pattern in the CAD software. The method is timeconsuming because the lattice structures have to be represented and designedfrom scratch. There are no special functions to automatically generate thedesired lattice structures in the current CAD software.
To create a 50 mm × 50 mm × 50 mm lattice structure, the next step isto apply:
1. The rectangular repetition function along the XY plane with a spacingof 1 cm and 5 instances to obtain a 5 cm × 5 cm part dimension.
2. The rectangular repetition function along XZ plane to obtain a 5 cm× 5 cm × 5 cm structure.
The same repetition procedure was done to obtain other dimensions andvolumes. For example, 10 cm × 10 cm × 10 cm, 15 cm × 15 cm × 15 cm,and 20 cm × 20 cm × 20 cm lattice structures. Figure 2.5 shows these twosteps of rectangular repetition to obtain the final desired volume.
Figure 2.5: First and second repetition from elementary structure to obtaina 5 cm × 5 cm × 5 cm size octet truss lattice structure
2.1.2 CAD software utility
The performance of the CAD software when processing certain operationswas examined. The objective is to observe the performance of the softwarein doing these operations for the eight cases studied. The time taken toapply the first and second repetitions of the basic lattice structure was usedas a criterion to evaluate this performance. Each of the first and secondrectangular repetition operation was repeated three times during the study
42

Chapter 2. CAD tools in additive manufacturing
to obtain an average time and more reliable results. Table 2.1 and figure 2.6and figure 2.7 show the time taken by the CAD software to accomplish theseoperations for each part.
Table 2.1: Average time to generate 1st and 2nd repetition
Figure 2.6: Cubic lattice structure repetition duration
The time that the CAD software needs to generate and execute the rep-etition function increases linearly with the volume of the parts. Thus theoperations become time consuming for large volume parts. An octet-trusslattice structure takes two to ten times more time than a cubic lattice struc-ture when applying the repetition function due to the higher number ofsurface areas compared to square lattice structures.
When applying the second repetition function for the parts starting from15 cm × 15 cm × 15 cm dimensions, the software could no longer execute
43

Chapter 2. CAD tools in additive manufacturing
the repetition function successfully, even after more than three hours of wait-ing time. The RAM used by the CAD software reached 2.292 GB and thesoftware did not respond and had to be restarted. The CAD software andthe computer were not capable of generating the second repetition functionfor an octet-truss lattice structure over 15 cm × 15 cm × 15 cm volume.
Figure 2.7: Octet-truss lattice structure repetition duration
2.1.3 CAD file format
The second result examined is the size of the CAD files for each part whenexported to different CAD file formats. The objective is to find out the effectsof the type and size of lattice structures on file sizes and whether current fileformats are suitable for the requirements of additive manufacturing. Theparts were exported and saved in the CAD software to different file formatssuch as IGES, STL and STEP. These are common file formats used to importparts in CAM and CAE software.
44

Chapter 2. CAD tools in additive manufacturing
Table 2.2: Lattice structure CAD file sizes
Figure 2.8: Cubic lattice structure file size
Table 2.2 and figures 2.8 and 2.9 show the CAD file sizes of the latticestructures for different configurations. Each file format has different file sizesfor the same part volume. This is because each format is written in a differentway. The files sizes depend on how the information of the part is interpretedand written. Each file format saves the information differently. The IGES,STL and STEP format generated large file sizes for lattice structures parts.For example, a STL file for 10 cm x 10 cm x 10 cm octet truss reached 280.4MB. This shows that current file formats generate large file sizes and are notsuitable to store information of lattice structure parts. For example, STLformat generates and stores information on triangular meshes of the surfacearea of the part. Therefore, when the parts contain large surface areas, thefile increases heavily. Currently, there has yet to be a file format which can
45

Chapter 2. CAD tools in additive manufacturing
describe lattice structure patterns and dimensions with a minimum set ofinformation. For example, describing the basic elementary structure andrepetition should suffice.
Figure 2.9: Octet-truss lattice structure file size
2.1.4 RAM usage
The RAM used by the computer to import and load the files in CAD, CAMand CAE software was examined and noted. The objective is to find outwhether the files generated could be loaded in CAE and CAM software or iferrors occurred. ANSYS and MAGICS were chosen as the CAE and CAMsoftware respectively in this experiment. The results are shown in table 2.3and figures 2.10 and 2.11
Table 2.3: RAM consumption
46

Chapter 2. CAD tools in additive manufacturing
Figure 2.10: Cubic lattice structure RAM consumption
Five STL files of the parts could not be loaded in ANSYS. When loadingthe parts into the software, the computer indicated nearly 4 GB of RAM wasused by the software. It eventually failed to load the parts into the software.This showed that for large-sized STL files and lattice structure parts, theCAE software is not capable of processing the information and even loadingthe parts into the software. Large surface areas of the parts contributed tohigh quantity of information to be processed by the software.
Figure 2.11: Octet-truss RAM consumption
From this case study, it is evident that current CAD software and file for-mats are not competent to design and store lattice structure parts efficientlyand is not suited to exchange data with CAE and CAM software. The resultsobtained show that it is difficult to design lattice structure CAD models, asthe process is very time consuming and generates large file sizes. This thusleads to high RAM consumption, making it very heavy for the software andcomputer to handle. For large volumes, the parts prove to be too heavy for
47

Chapter 2. CAD tools in additive manufacturing
the computer to manipulate in CAD, CAE and CAM software. This is dueto the large number of surface areas of the lattice structure that the softwarehas to process. In certain cases, the software was unable to achieve the de-sired operation. The patterns of the cellular structures had to be drawn oneby one and then the repetition function was used until the desired structurewas achieved. These problems made it impractical for users to design usualcellular structures quickly and efficiently, consequently making the processtime consuming.
2.1.5 Conclusion
New requirements in part designs for additive manufacturing result in newneeds for computer-aided-design. Current CAD software are not tailored forthese new requirements. Actual CAD, CAE and CAM tools and file formatsare insufficient to fulfil these new needs for additive manufacturing and hasto be replaced. Product designs, CAD, CAE and CAM requirements aretaken into consideration for the creation of a new CAD file format. A newresearch has to be carried out in order to determine the most robust andefficient method to design lattice structures in CAD software.
2.2 Evaluating current CAE tools performances
in the context of design for additive man-
ufacturing
In this section, a case study was done to evaluate current CAE tools perfor-mances to perform finite-element-analysis (FEA) on lattice structures. Theobjective is to evaluate whether the performances of current CAE tools areadequate to perform these tasks efficiently and conveniently on lattice struc-tures using volumic FEA. Two case studies were conducted. In the first one,the FEA computation file size was measured and analysed. In the secondone, the time to execute an FEA on the lattice structures was taken. Theresults were analysed and conclusions were made.
In this experiment, the lattice structure pattern chosen is the octet-trusslattice structure, while the variable of the experiment is the different dimen-sions of the structure. Figure 2.12 shows the force applied. It is a compressiontest with -500N applied in the Z-axis. Each elementary octet-truss structureis 1cm × 1cm × 1cm in dimension. The dimensions and volumes of thestructures are:
1. 2cm × 2cm × 2cm (volume : 8cm2)
48

Chapter 2. CAD tools in additive manufacturing
Figure 2.12: FEA simulation on an octet-truss lattice structure
2. 3cm × 3cm × 3cm (volume : 27cm2)3. 4cm × 4cm × 4cm (volume : 64cm2)4. 5cm × 5cm × 5cm (volume: 125cm2)5. 6cm × 6cm × 6cm (volume: 216cm2)6. 7cm × 7cm × 7cm (volume: 343cm2)
2.2.1 FEA computation file size
After the analysis, the FEA computation files were saved. Each file sizewas noted and shown in table 2.4. The FEA computation file size increasestremendously when the volume of the parts increases. For the 7 × 7 × 7 unitoctet-truss lattice structure, the FEA computations file size reached 36.6 GB.This made the computer slow and consumed a lot of disk space. Figure 2.13shows the significant increase in FEA computation file size compared to theincrease in part volume.
49

Chapter 2. CAD tools in additive manufacturing
Table 2.4: Octet-truss lattice structure FEA computations file size
Figure 2.13: Octet-truss lattice structure FEA computations file size
2.2.2 FEA time duration
As soon as the FEA analysis was executed, the stopwatch started and thetime duration was taken. The results are shown in table 2.5. The FEAduration increased significantly when the part envelope increased. For the 7× 7× 7 unit octet-truss lattice structure, the time to execute the analysis wasreally long, 2 hours and 14 minutes. This proves to be very time consumingfor the users to execute FEA on an octet-truss lattice structures. Figure 2.14shows that the FEA analysis time increases significantly when the latticestructure’s volume increases.
50

Chapter 2. CAD tools in additive manufacturing
Table 2.5: Octet-truss lattice structure FEA time duration
Figure 2.14: Octet-truss lattice structure FEA time duration
2.2.3 Conclusion
The CAE software consumes a significant amount of time to execute theanalysis and it creates very large FEA computation file sizes. If lattice struc-tures are to be the norm in lightweight high strength additive manufacturedparts, this is a problem that must be solved. Engineers and designers requiretools that are powerful enough to conduct FEA on lattice structures easilyand quickly. Current CAE software analyses parts based on the surface vol-ume of the part. Thus for parts such as lattice structures which have a largeamount of surfaces, this generates a problem for the software to execute FEAanalysis. New methods and tools must be constructed to find a solution tothis problem.
51

Chapter 2. CAD tools in additive manufacturing
2.3 Conclusion
From this research, we conclude that current CAD software are not practicalfor users to design lattice structures efficiently for additive manufacturingparts and that current CAE software are not up to scratch in terms of per-formance to execute finite-element analysis on lattice structure parts.
There are two ways to overcome this problem. The first would be tocreate a new CAD application to quickly design a lattice structure in theCAD software, or the other would be to represent the lattice structure witha solid volume without the need to create the lattice structure CAD modelwith struts. This would be possible by creating a new CAD file format whichinterprets information of the part as lattice structures and by creating a newequivalent material, thus making it easier to design and conduct FEA. Figure2.15 is a summary of the problems, conclusions and solutions presented inthis chapter.
Figure 2.15: Summary of evaluation, problems, conclusions and solutions ofchapter two
52

Chapter 3
Lattice structure designstrategy
Contents3.1 Definitions of used terms . . . . . . . . . . . . . . . . 55
3.2 Proposed lattice structure design method . . . . . . 56
3.2.1 Concept to link lattice structure, solid material andequivalent material . . . . . . . . . . . . . . . . . . . . 56
3.2.2 Step-by-step of the proposed method . . . . . . . . . . 61
3.2.3 Application example of the proposed lattice structuredesign method . . . . . . . . . . . . . . . . . . . . . . 62
3.3 A methodology for the creation of equivalent latticestructure materials . . . . . . . . . . . . . . . . . . . 69
3.3.1 FEA simulation and variables . . . . . . . . . . . . . . 69
3.3.2 Simulation execution . . . . . . . . . . . . . . . . . . . 74
3.3.3 Stress concentration . . . . . . . . . . . . . . . . . . . 75
3.3.4 Results . . . . . . . . . . . . . . . . . . . . . . . . . . 77
3.3.5 Analysis . . . . . . . . . . . . . . . . . . . . . . . . . . 83
3.4 Results verification . . . . . . . . . . . . . . . . . . . 87
3.4.1 Comparison with results from other articles . . . . . . 87
3.4.2 Comparison with case study results . . . . . . . . . . 90
3.4.3 Conclusion . . . . . . . . . . . . . . . . . . . . . . . . 98
3.5 Summary . . . . . . . . . . . . . . . . . . . . . . . . . 99
53

Chapter 3. Lattice structure design strategy
In spite of the various benefits of lattice structures, engineers currentlydo not have the required information to integrate it easily and correctly inpart design. They do not have the necessary information to choose the mostsuitable lattice structure configuration and they do not have the appropriatetools to evaluate the designed parts. We start this chapter by giving a realcase example of this problem.
Figure 3.1: Which type of lattice structure to choose? Cubic or hexa-trusslattice structure? Which densities are needed?
The central volume of the part presented in figure 3.1 was initially solid.To reduce the weight of the part, the designers had wanted to integratelattice structures in this central area of the part. What structure would thusbe suitable: a cubic or hexa-truss lattice structure? The main questions thatusually arise for the engineers in these situations are :
• How do I choose the most suitable lattice structure?
– Which type of lattice structure patterns do I choose?
– What lattice structure densities are needed?
• Does the selected lattice structure configuration validate the prescribedrequirements?
Designers need a reliable guideline to help them choose the correct latticestructure pattern and density to fulfil the part’s mechanical requirements.After describing the definitions of the used terms, we present the concept andthe stages of the lattice structure design method. An application example ofthe proposed lattice structure design method is presented. Next, we show howto determine the characteristics of the equivalent material and we apply thisapproach for different lattice structures. The results obtained are compared
54

Chapter 3. Lattice structure design strategy
with a case study and theoretical and experimental results from the literature.Finally, an example to choose the lattice structure is presented.
3.1 Definitions of used terms
Definitions adopted by researchers are often not uniform, so the key termsin this chapter are explained to establish positions taken in this chapter andavoid ambiguity.
Design space Design space is the defined volume that limits the authorizedarea. It is defined in the part requirement. The lattice structure has to bedesigned within this volume.
Relative density The relative density is the ratio between the volumeof material of the lattice structure and the volume of the bounding box.Equation 3.1 and figure 3.2 illustrate the relative density.
Relative density =Lattice structure volume
Bounding box(3.1)
Figure 3.2: Bounding box(blue) and lattice structure (yellow)
Solid material The solid material is a volume corresponding to the bound-ing box of the lattice structure, filled with a dense material. The solid ma-terial has the mechanical properties of the material attributed.
Equivalent material The equivalent material is a volume correspondingto the bounding box of the lattice structure, filled with a dense materialwhose mechanical properties are similar to the mechanical properties of thelattice structure.
55

Chapter 3. Lattice structure design strategy
3.2 Proposed lattice structure design method
The aim of the guideline is to help designers have at their disposal the infor-mation needed to know which lattice structure configuration to use in theirpart designs. In chapter 2, we have concluded that large number of surfacesimplied by the use of the lattice structures causes time consuming processesin CAD and CAE software. We also concluded that current CAD softwareare incapable of designing lattice structures easily and quickly. These factorsinfluenced the decision in this proposed lattice structure design method toavoid altogether the need to create lattice structure CAD models based onvolumes and surfaces and to do FEA on these elements.
Figure 3.3: Lattice structure design method based on the use of equivalentmaterial
Figure 3.3 shows an overview of this chapter. The input for the latticestructure design method is the design space, part requirements and functionalsurfaces. The design method is based on the use of equivalent material tochoose the most suitable lattice structure which fulfils the parts requirementswithin the design space and respects the functional surfaces. With the useof equivalent material, the outcome of the design method are the choice ofpartitions and the material, pattern and relative density of each partition.
3.2.1 Concept to link lattice structure, solid materialand equivalent material
The proposed idea in this new lattice structure design strategy is to replaceand represent the lattice structure CAD model with an equivalent material.It is solid and does not contain any struts, thus has few surfaces only. Withthis lattice structure equivalent material, it will make it easier and quicker toconduct finite-element-analysis (FEA) due to the small number of surfacesinvolved. The main idea of the proposed method is to define the link between
56

Chapter 3. Lattice structure design strategy
a lattice structure, solid material and equivalent material. Two concepts areused to link the mechanical properties of a lattice structure and an equiva-lent material: the relative Young’s modulus and the relative strength. Therelative Young’s modulus will be used to evaluate the strain of the latticestructure. The relative strength will evaluate the equivalent tensile stress (inour case Von Mises stress) of the lattice structure.
Figure 3.4: The relation between lattice structure, solid material and equiv-alent material
Figure 3.4 shows an example of the concept presented. Imagine a cubicdesign space that supports a defined mechanical loading. Let us supposea solid material filling this space, consisting of a given material which theYoung’s modulus is 100 GPa and the yield strength is 800 MPa. Submittedto a defined mechanical loading, this solid material will have for example amaximum Von Mises stress of 50 MPa. This solid material will therefore beover dimensionned for the envisaged mechanical loading. If this solid materialis replaced by a lattice structure with a relative density of 0.25, made of thesame material as the solid material, the yield strength will be unchanged(800 MPa) but the equivalent Young’s modulus of the lattice structure willbe much lower (6 GPa). Subjected to the defined mechanical loading, the
57

Chapter 3. Lattice structure design strategy
maximum Von Mises stress in the lattice structure will be much higher (500MPa). The equivalent material is a dense material which properties enablesto easily predict the mechanical characteristic of the lattice structure. Inour case, the equivalent material will have a Young’s modulus equal to theequivalent Young’s modulus of the lattice structure (6 GPa). It will alsobe necessary to attribute to the equivalent material a yield strength lowerthan the solid material to simulate the difference of strength between thesolid material and the lattice structure. In this case, a yield strength of 40MPa. The FEA conducted on the equivalent material will make it possibleto quickly choose a suitable lattice structure.
To determine the corresponding characteristics of the equivalent mate-rial for different lattice structures and different materials, it is necessary toestablish, for each type of lattice structure, a relation between the relativedensity of the lattice structure and the relative Young’s modulus, and therelation between the relative density and the relative strength.
In the example presented in figure 3.4, the relative Young’s modulus of thelattice structure is equal to 0.06 (6 GPa/100 GPa) and the relative strengthis equal to 0.05 (50 MPa/1000 MPa). These two parameters make it possibleto determine the equivalent material whose Young’s modulus will be equalto 0.06 x 100 GPa = 6 GPa and the yield strength will be equal to 0.05x 800 MPa = 40 MPa. The proposed method does not consider any stressconcentration. Section 3.3.3 of this chapter will analyse this hypothesis.
So we define the relative Young’s modulus as the ratio between theYoung’s modulus of the lattice structure and the Young’s modulus of thesolid material. The Young’s modulus of the equivalent material is the sameas the Young’s modulus of the lattice structure. For a given load, the rela-tive strength is the ratio between the Von Mises stress of the solid materialand the Von Mises stress of the lattice structure. Consequently, the relativestrength is also the ratio between the yield strength of the equivalent mate-rial and the yield strength of the solid material. Equations 3.2 , 3.3 and 3.4summarize these relations.
Relative Young’s modulus =Lattice structure Young’s modulus
Solid material Young’s modulus(3.2)
Relative stress =Solid material Von Mises stress
Lattice structure Von Mises stress(3.3)
Relative strength =Equivalent material yield strength
Solid material yield strength(3.4)
58

Chapter 3. Lattice structure design strategy
We also know that :
Lattice structure Young’s modulus = Equivalent material Young’s modulus(3.5)
Solid material yield strength = Lattice structure yield strength (3.6)
59

Chapter 3. Lattice structure design strategy
Fig
ure
3.5:
Ste
p-b
y-s
tep
ofth
enew
des
ign
met
hod
todes
ign
latt
ice
stru
cture
s
60

Chapter 3. Lattice structure design strategy
3.2.2 Step-by-step of the proposed method
Figure 3.5 summarizes the different steps of the proposed method.
Input The input of the method are the design space and the part require-ments, which in our case are the force applied, the safety factor, and themaximum strain. Safety factor is a term describing the load carrying ca-pacity of a system beyond the expected or actual loads. This allows foremergency situations, unexpected loads or misuse. The safety factor used inthis work is defined as:
Safety factor =Maximum stress allowed
Maximum stress applied(3.7)
Step 1 In the first step, the designer creates a 3D CAD model with asolid material within the design space. Then the boundary conditions ofthe part are added and a FEA simulation is executed. The Von Mises stressdistribution and the displacement distribtion are the indicators to help choosethe most suitable lattice structure pattern and relative density in step two.
Step 2 In the second step, the partitions have to be defined. The partitionsare separations of the part into different zones. They are defined based on thedisplacement distribution and Von Mises stress distribution obtained fromthe step one results. Each partition can have different relative densities.
After the partitions are defined, the next stage consists of two parts: firstto choose the most suitable lattice structure pattern for each partition, thento choose the relative density which fulfil the part’s requirements for eachpartition.
To choose the most suitable lattice structure pattern and angle load,it is necessary to estimate the relative Young’s modulus of each partition.This relative Young’s modulus can be obtained by dividing the maximumdisplacement calculated in step one for a partition by the maximum straindefined in the requirements. Then, using the comparison of relative Young’smodulus in function of different lattice structure pattern, a choice can bemade (see figure 3.5 step 2 figure A).
Based on the maximum displacement and the maximum Von Mises stressof the FEA result in step one for each pattern, the relative density can bedetermined. It depends on the relative Young’s modulus and the relative
61
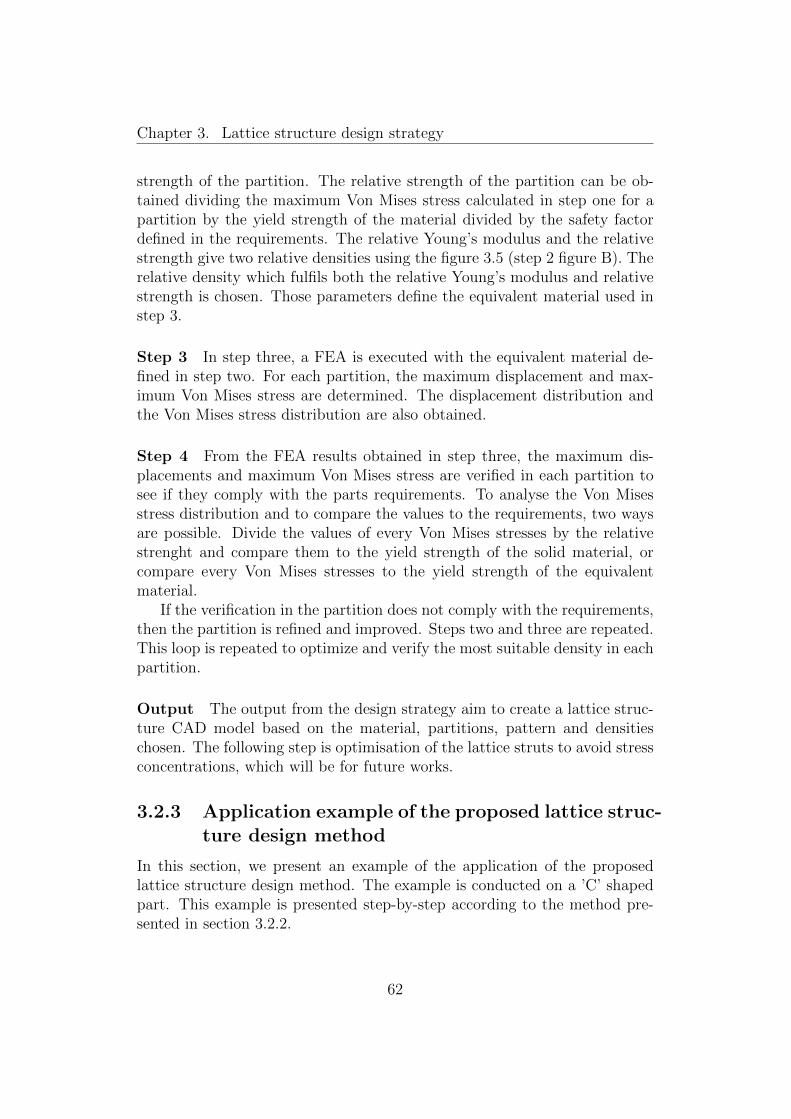
Chapter 3. Lattice structure design strategy
strength of the partition. The relative strength of the partition can be ob-tained dividing the maximum Von Mises stress calculated in step one for apartition by the yield strength of the material divided by the safety factordefined in the requirements. The relative Young’s modulus and the relativestrength give two relative densities using the figure 3.5 (step 2 figure B). Therelative density which fulfils both the relative Young’s modulus and relativestrength is chosen. Those parameters define the equivalent material used instep 3.
Step 3 In step three, a FEA is executed with the equivalent material de-fined in step two. For each partition, the maximum displacement and max-imum Von Mises stress are determined. The displacement distribution andthe Von Mises stress distribution are also obtained.
Step 4 From the FEA results obtained in step three, the maximum dis-placements and maximum Von Mises stress are verified in each partition tosee if they comply with the parts requirements. To analyse the Von Misesstress distribution and to compare the values to the requirements, two waysare possible. Divide the values of every Von Mises stresses by the relativestrenght and compare them to the yield strength of the solid material, orcompare every Von Mises stresses to the yield strength of the equivalentmaterial.
If the verification in the partition does not comply with the requirements,then the partition is refined and improved. Steps two and three are repeated.This loop is repeated to optimize and verify the most suitable density in eachpartition.
Output The output from the design strategy aim to create a lattice struc-ture CAD model based on the material, partitions, pattern and densitieschosen. The following step is optimisation of the lattice struts to avoid stressconcentrations, which will be for future works.
3.2.3 Application example of the proposed lattice struc-ture design method
In this section, we present an example of the application of the proposedlattice structure design method. The example is conducted on a ’C’ shapedpart. This example is presented step-by-step according to the method pre-sented in section 3.2.2.
62

Chapter 3. Lattice structure design strategy
Input A design space of a ’C’ shaped form is given. The part’s requirementsare:
• Load = 10 000 N (See figure 3.7 for the load and boundary conditions)• Maximum displacement = 6 mm• Safety factor = 1.5• Material : Ti-6Al-4V• Design space : See figure 3.6
Figure 3.6: Design space
Step 1 The first step is to fill the design space with a solid material. Ti-6Al-4V is attributed as the material. Figure 3.7 shows the solid material andboundary conditions.
Here, we execute a FEA on the solid material and observe the displace-ments and Von Mises stress. Figure 3.8 shows the displacements and VonMises stresses results of the FEA. The displacement and Von Mises stressresults will be indicators to help choose the most suitable lattice structurepattern and relative density in step 2.
63

Chapter 3. Lattice structure design strategy
Figure 3.7: Solid material and boundary conditions
Figure 3.8: Displacements and Von Mises stress results of the FEA
Concerning the determination of the maximum Von Mises stress, thestress concentration due to the sharp edges are deducted from the valueobtained from the FEA. Figure 3.8 gives the threshold value of the VonMises stress after the deduction of the stress concentrations. The results
64

Chapter 3. Lattice structure design strategy
obtained from this FEA simulation are:
• Maximum displacement = 0.102 mm• Maximum Von Mises stress = 14.5 MPa
Step 2 In the second step of this proposed lattice structure design method,first we define the partitions, then we choose the lattice structure pattern andits relative density. In this example, we decide to define a unique partitionand to choose the same relative density through out the whole structure. Thechoice of the lattice structure pattern and relative density depends on themechanical property of the lattice structure pattern (stretching or bending-dominated), its relative Young’s modulus and relative strength. To choosethe most suitable lattice structure pattern and angle load, it is necessary toestimate the relative Young’s modulus of the partition. This relative Young’smodulus can be obtained dividing the maximum displacement calculated instep one (0.102 mm) by the maximum strain defined in the requirements (6mm). Then, using the comparison of relative young’s modulus in function ofdifferent lattice structure pattern, a choice can be made (see figure 3.9). Inthat example, the relative Young’s modulus is calculated with the equation3.8.
Figure 3.9: Relative Young’s modulus in function of relative density
Based on figure 3.9, the octet-truss lattice structure at 0◦ position anglesuits this case since it is stretching-dominated and considered isotropic inall directions. The relative Young’s modulus in function of relative densityfor the octet-truss lattice structure at 0◦ position angle give the minimumrelative density of the lattice structure.
65

Chapter 3. Lattice structure design strategy
Maximum displacement calculated
Maximum displacement allowed=
0.102 mm
6 mm= 0.017 (3.8)
From the relative Young’s modulus in function of relative density graph infigure 3.10 at 0.017 relative Young’s modulus, we obtain the correspondingrelative density, which is 0.11.
Figure 3.10: Relative Young’s modulus in function of relative density foroctet-truss lattice structure at 0◦ angle position
The maximum Von Mises stress result obtained in step 1 is 14.5 MPa.Equation 3.9 gives the maximum Von Mises stress considering the safetyfactor.
Maximum Von Mises stress× Safety factor = 14.5 MPa× 1.5 = 21.75 MPa(3.9)
We obtain the following result :
Maximum Von stress
Solid material yield strength×(safety factor) =
21.75 MPa
910 MPa= 0.024 (3.10)
From the relative strength in function of relative density graph in figure3.11 at 0.024 relative strength, we obtain the corresponding relative density,which is 0.13.
66

Chapter 3. Lattice structure design strategy
Figure 3.11: Relative strength in function of relative density for octet-trusslattice structure at 0◦ angle position
From both figures 3.10 and 3.11, the next step is to choose the highestrelative density between the two. Therefore, in this example, the chosenrelative density is 13%. Then, the equivalent material chosen is characterizedby a relative strength of 0.024 and a relative Young’s modulus of 0.022. Theyield strength of the equivalent material is obtained by equation 3.4: 910MPa x 0.024 = 21.84 MPa.
Figure 3.12: FEA on equivalent material with relative density at 13%
Step 3 In step three, a FEA is executed with the equivalent material cho-sen in step two. The maximum displacement and Von Mises stress are deter-mined. The displacement distribution and the Von Mises stress distributionare also obtained. Figure 3.12 shows the result of FEA on the equivalent
67

Chapter 3. Lattice structure design strategy
material in terms of displacement and Von Mises stress. The FEA resultswith the equivalent material are:
• Maximum displacement = 4.7 mm
Step 4 The maximum displacement and maximum Von Mises stress ob-tained in step three are compared with the requirements of the part to val-idate the choice taken. If the displacement and Von Mises stress respectthe maximum displacement and yield strength of the equivalent material al-lowed, the part is then validated. We compare the FEA values with the partsrequirements :
• Maximum displacement (4.7 mm) lower than the maximum displace-ment allowed (6 mm)• Maximum Von Mises stress multiplicated by the safety factor (14.5
MPa x 1.5 = 21.75 MPa) lower than equivalent material yield strength(21.84 MPa)
Both of these values are lower than the values allowed in the parts re-quirements. Therefore the lattice part is validated.
Output A lattice structure CAD model with the pattern and relative den-sity chosen is created. Figure 3.13 shows the lattice structure CAD modelcreated.
Figure 3.13: Lattice structure CAD model
68

Chapter 3. Lattice structure design strategy
3.3 A methodology for the creation of equiv-
alent lattice structure materials
From the proposed lattice structure design method, research was needed todevelop an equivalent material. In this section, we present the methodologyto create the equivalent material and the FEA simulations conducted. Thedifferent variables, lattice patterns and simulations are described and theresults are analysed.
From (Ashby, 2006), we know that the mechanical properties of a latticestructure depends on three factors, its material, lattice pattern and den-sity. These three factors influence the displacement and Von Mises stress ofa lattice structure. Thus, by executing FEA simulation on various latticestructure patterns and relative densities, we are able to determine the linkbetween these configurations and their displacement and Von Mises stress.This knowledge helps us to know the mechanical properties of the latticestructure and enables the creation of equivalent materials.
As we explained in section 3.1, the proposed lattice structure designmethod needs knowledge on equivalent material. The creation of equiva-lent materials replaces the need to conduct FEA on lattice structures andreduces FEA time. Therefore, in this section, we propose a methodologyto create these equivalent materials. The proposed methodology consists ofexecuting FEA simulations for compression and shear tests on lattice struc-tures to investigate the variation of relative Young’s modulus, relative shearmodulus and relative strength with different relative densities and patterns.
3.3.1 FEA simulation and variables
To obtain the relative Young’s modulus, the relative shear modulus andrelative strength, the FEA simulation was conducted in two different ways,a compression and shear loading test, as shown in figure 3.14.
69

Chapter 3. Lattice structure design strategy
Figure 3.14: Compression and shear test on a hexa-truss lattice structure
Before conducting the simulations, the variables must first be determined.The variables depend on the objectives fixed. Thus the variables of thesimulations are the lattice structure patterns, relative densities and the latticestructure position angle. The position angle is based on the angle of thelattice structure to the angle of the force applied.
Lattice structure pattern The first variable chosen is the lattice struc-ture pattern. Four lattice structure pattern have been chosen, octet-truss lat-tice structure, cubic lattice structure, hexa-truss lattice structure and open-cell foam lattice structure. Figure 3.15 illustrates an example of each latticestructure pattern with a dimension of 5 × 5 × 5 elementary units orientedat a 0◦ angle. Figure 3.16 shows each elementary unit of the lattice structurepattern. All the simulations were conducted on lattice structures with squarestrut sections.
Figure 3.15: Isometric view of 5 × 5 × 5 elementary units. From left to right: octet-truss, cubic, hexa-truss and open-cell lattice structure
70

Chapter 3. Lattice structure design strategy
Figure 3.16: Side view of each elementary unit. From left to right : octet-truss, cubic, hexa-truss and open-cell elementary unit
Lattice structure position angle These lattice structures were tested intwo different positional orientations relative to the loads applied to determinethe mechanical properties in different directions. The angle of the forceapplied on the part replicates different lattice structure patterns. For examplea cubic lattice structure becomes two different patterns if the force is appliedat a 0◦ angle or a 45◦ angle. Therefore it is important to test the structureswith stress from different angles. Figure 3.17 is an example of a cubic latticestructures which is oriented at 0◦ and 45◦ angles.
Figure 3.17: Cubic lattice structure at 0◦ and 45◦ angle
Lattice structure relative density The thickness of the square strutsection and length dimensions of the struts are varied to obtain differentlattice structure densities.
Relative density =Lattice structure volume
Lattice structure bounding box(3.11)
The lengths of the elementary structures are 5 mm, 10 mm, 15 mm and20 mm and the thickness of the square strut sections are 1 mm, 1.5 mmand 2 mm. Figure 3.18 shows an example of various relative densities for an
71

Chapter 3. Lattice structure design strategy
open-cell foam lattice structure. In this example, as the thickness is increasedfrom 1 to 2 mm, the relative density of the open-cell foam lattice structurewith a 5 mm elementary structure length increases from 11.9% to 36.9%.
Figure 3.18: Side view of open-cell foam lattice structures with 11.9%, 25.3%and 36.9% relative densities
A lattice structure which has the same relative density can also havedifferent thickness and different length of the struts, as shown in figure 3.19.In this example of an octet-truss lattice structure, the struts thickness variesfrom 1 mm to 2 mm, while its elementary structure length varies from 10mm to 20 mm to obtain the same relative density of 14.8%.
Figure 3.19: 5 × 5 × 5 unit octet-truss lattice structures with different lengthand sections of struts but same densities
72

Chapter 3. Lattice structure design strategy
Manufacturing constraints and relative density range of validityThe relative density considered depends on the manufacturability constraintand the range of validity. For example, after the manufacturing process withthe EBM machine, un-melted metallic powder have to be blown away to ob-tain the lattice structure. However, not all un-melted metallic powder canbe blown away. For example, in cases where high density lattice structuresare manufactured, it prevents the un-melted powder to be removed from thestructures. That’s why we focused in this experiment the relative densityrange to 25% (Suard, 2015). Figure 3.20 shows examples of two hexa-trusslattice structures which are not taken into account in the experiment becauseof its high density. At relative densities higher than 80%, the lattice struc-ture can no longer be thought of as a lattice structure, but becomes a solidcontaining a distribution of small spherical holes.
Figure 3.20: High density hexa-truss lattice structure
Lattice structure material In order to be universal for all types of ma-terials, the results are explained in relative units. Therefore the results areindependent of the materials used. Examples of the relative units involved arerelative Young’s modulus, relative shear modulus, relative Von Mises stressand relative density. Hence, it is sufficient to conduct the simulations with asingle type of material. In this work, the material chosen in Ti-6Al-4V.
Summary of the experiment variables A total of 96 lattice structureCAD model were created with each of the variables chosen. Here is a sum-mary of the variables chosen:
73

Chapter 3. Lattice structure design strategy
• Lattice structure pattern:
– Cubic– Octet-truss– Hexa-truss– Open-cell foam
• Struts thickness (mm):
– 1– 1.5– 2
• Elementary structure length (mm):
– 5– 10– 15– 20
• Lattice angle position:
– 0◦
– 45◦
3.3.2 Simulation execution
In this section, we explain the execution of the simulation. The softwarechosen to do this simulation is CATIA V5. Each lattice CAD model was de-signed and imported in the generative structural analysis function in CATIAV5 to conduct finite-element-analysis. All the structures were of the samenumber of elementary units (5 × 5 × 5 units). The relative density of theparts were obtained by measuring the volume of the lattice structure, dividedby its bounding box volume. For each simulation, the same value of forcewas applied (500 N). The mesh size has to be at least three times smallerthan the thickness of the strut. A total of 192 FEA simulations were con-ducted with each variable for the compression and shear tests. Even thoughit would have been a faster simulation to conduct FEA beams instead ofvolumes, FEA beams has a limited range of application and is only validfor relative densities of up to 5% (Suard, 2015). FEA with volume is moreprecise than a beam simulation since it does not rely of beam assumptions(Suard, 2015). After executing the FEA, the results are then measured. TheVon Mises stresses and displacements results were exported for each finite-element-analysis, consisting of each point coordinates’ displacements and VonMises stresses. Here is the step-by-step method to conduct the FEA and toobtain and analyse the data :
74

Chapter 3. Lattice structure design strategy
1. Define the boundary conditions2. Define the mesh size3. Execute the FEA simulation4. Get the structure’s displacement and Von Mises stress and export the
result data for each element.5. Calculate the Young’s modulus of the structure by dividing the stress
applied on the part by its strain (equation 3.14).
Stress applied =Load applied
Lattice structure envelope surface(3.12)
Strain =Displacement along direction of the force
Initial lenght(3.13)
Lattice structure Young’s modulus =Stress applied
Strain(3.14)
6. Divide the lattice structure’s Young modulus by the Young’s modulusof the material (Ti-6Al-4V in our case: 114GPa) to obtain the relativeYoung’s modulus of the lattice structure (equation 3.15).
Relative Young’s modulus =Lattice structure Young’s modulus
Young’s modulus of solid material(3.15)
7. Eradicate the stress concentration results to get the realistic maximumVon Mises stress, which is at 99.5% instead of its maximum value.Section 3.3.3 explains this step in detail.
8. Calculate the relative strength by dividing stress applied on the struc-ture with the Von Mises stress at 99.5% (equation 3.16).
Relative strength =Stress applied
Von Mises stress at 99.5%(3.16)
9. The results obtained are, relative Young’s modulus, relative shear mod-ulus and relative strength in function of the relative density.
3.3.3 Stress concentration
A stress concentration is an area of the mesh where the stress raises abovethe applied nominal stress. Since the section of the struts are square, thiscreates sharp 90◦ edges in the struts of the structure, therefore creating verysmall surface area and resulting in very high concentration of stress. Thus,the maximum Von Mises stress result can not be taken directly from theFEA data. Hence, to obtain a usable Von Misess stress result, a method
75

Chapter 3. Lattice structure design strategy
was made to eradicate the stress concentration results. In this method, agraph with the cumulative number of elements of the FEA mesh in functionof the Von Mises stress value is made. For example, from the graph in figure3.21, we can see that the Von Mises stress concentration exists for 0.5%of the FEA mesh elements. These are the areas of the sharp edges of thelattice struts, contributing very high Von Mises value for very little number ofelements. Therefore, the result of the Von Mises stress of each FEA taken isthe asymptote at 99.5% of the cumulative number of mesh elements. Figures3.21, 3.22, 3.23 and 3.24 show the stress concentration for octet-truss, cubic,hexa-truss and open-cell foam lattice structures respectively and the VonMises stress results.
Figure 3.21: Stress concentration in sharp edges of an octet-truss latticestructure
Figure 3.22: Stress concentration in sharp edges of an cubic lattice structure
76

Chapter 3. Lattice structure design strategy
Figure 3.23: Stress concentration in sharp edges of an hexa-truss latticestructure
Figure 3.24: Stress concentration in sharp edges of an open-cell foam latticestructure
The research in this PhD limits to FEA of the elements unaffected by thestress concentration. The following procedures of adding rounded edges (seefigure 4.8) and optimizing lattice struts in stress concentrated areas are nottreated in this thesis. It will be a perspective of the research and for futureworks.
3.3.4 Results
In this section, results obtained are presented for each lattice structure. Allthe detailed results are presented in appendix A.
Octet-truss lattice structure Figure 3.25 and figure 3.26 show the rela-tive Young’s modulus and the relative shear modulus in function of relative
77

Chapter 3. Lattice structure design strategy
density for the octet-truss lattice structure. The octet truss lattice structurehas approximately the same relative Young’s modulus in the 0◦ and 45◦ direc-tions. The octet truss lattice structure has the same relative shear modulusin the 0◦ and 45◦ directions.
Figure 3.25: Octet-truss lattice structure compression test at 0◦ and 45◦
angle
Figure 3.26: Octet-truss lattice structure shear test at 0◦ and 45◦ angle
78

Chapter 3. Lattice structure design strategy
Figure 3.27: Relative strength in function of relative density for octet-trusslattice structure at 0◦ and 45◦ angle
Figure 3.27 shows the relative strength in function of the relative densityof the octet-truss lattice structure. For the application of the lattice structuredesign method presented in 3.2.2, the relative strength from the compressiontest is used to define the equivalent material.
Cubic lattice structure Figures 3.28 and 3.29 show the relative Young’smodulus and the relative shear modulus in function of relative density for thecubic lattice structure. The cubic lattice structure’s relative Young’s modulusis significantly higher in the 0◦ direction compared to the 45◦ direction. Thecubic lattice structure has the same relative shear modulus in 0◦ and 45◦
directions.
Figure 3.28: Cubic lattice structure compression at 0◦ and 45◦ angle
79

Chapter 3. Lattice structure design strategy
Figure 3.29: Cubic lattice structure shear test at 0◦ and 45◦ angle
Figure 3.30: Relative strength in function of relative density for cubic latticestructure at 0◦ and 45◦ angle
Figure 3.30 shows the relative strength in function of the relative densityof the cubic lattice structure for compression and shear tests at 0◦ and 45◦
position angles.
Hexa-truss lattice structure Figure 3.31 and figure 3.32 show the rela-tive Young’s modulus and the relative shear modulus in function of relativedensity for the hexa-truss lattice structure. The relative Young’s modulus in0◦ angle is higher than in the 45◦ angle. While the relative shear modulus isapproximately the same in both 0◦ and 45◦ angle positions.
80
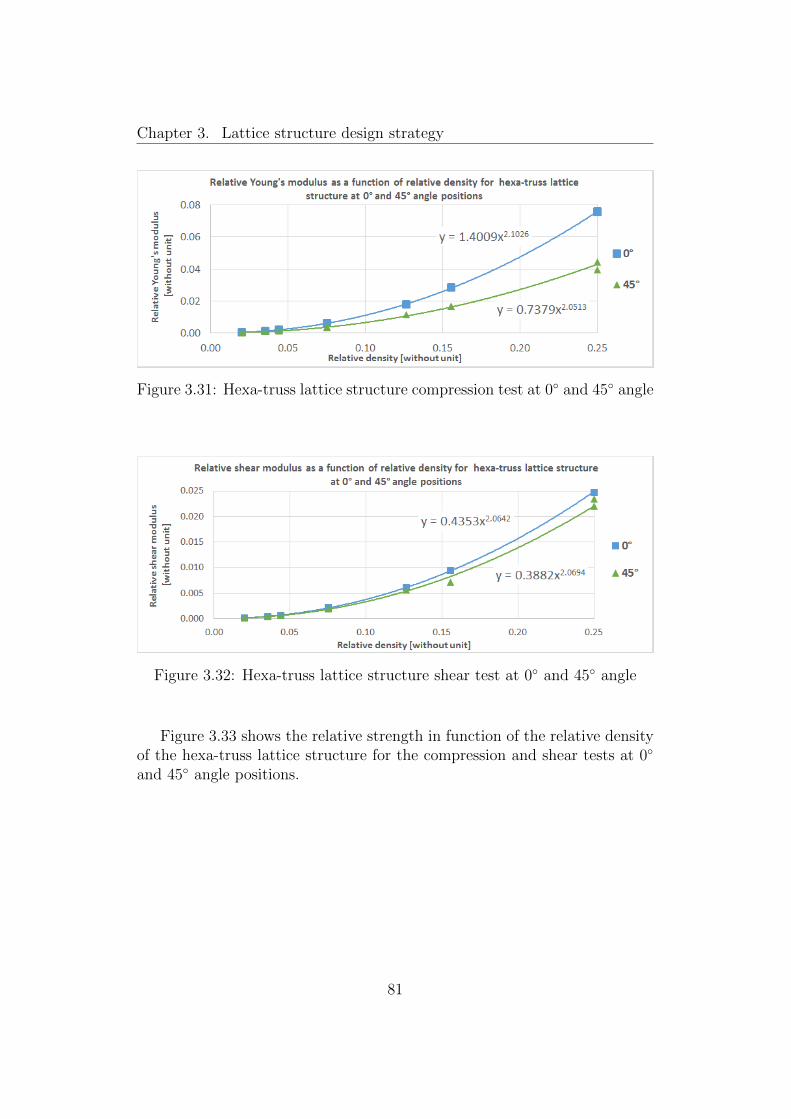
Chapter 3. Lattice structure design strategy
Figure 3.31: Hexa-truss lattice structure compression test at 0◦ and 45◦ angle
Figure 3.32: Hexa-truss lattice structure shear test at 0◦ and 45◦ angle
Figure 3.33 shows the relative strength in function of the relative densityof the hexa-truss lattice structure for the compression and shear tests at 0◦
and 45◦ angle positions.
81
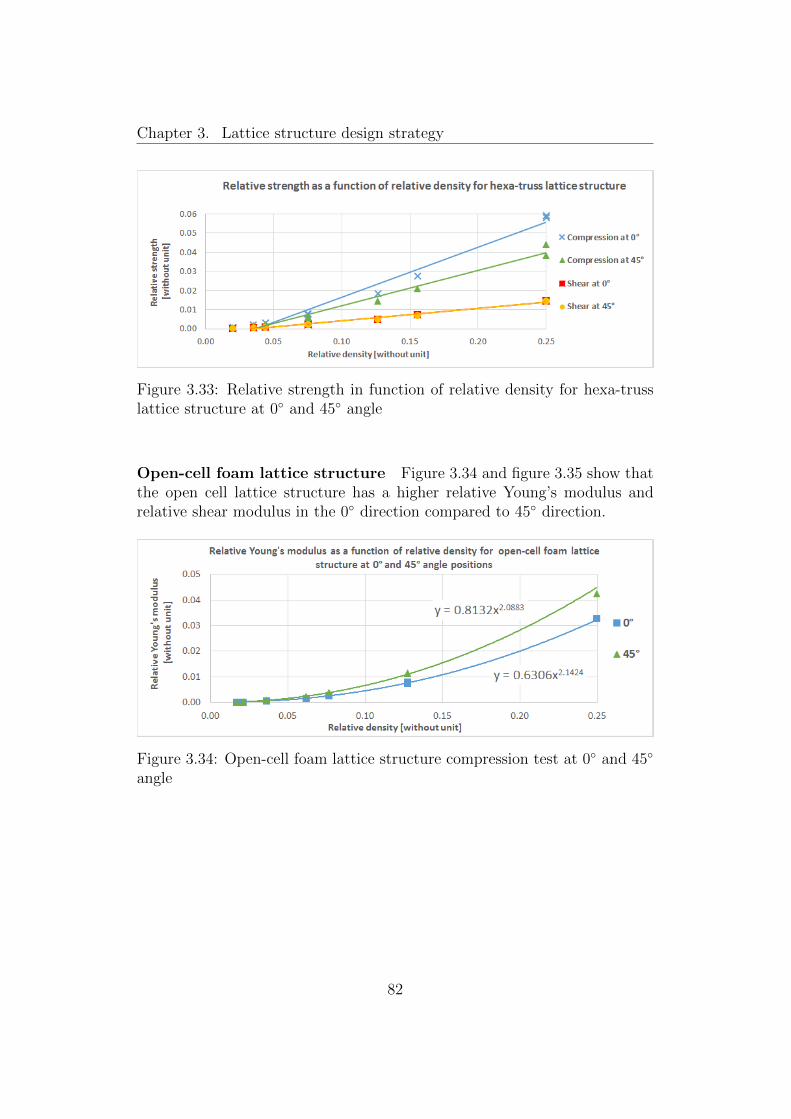
Chapter 3. Lattice structure design strategy
Figure 3.33: Relative strength in function of relative density for hexa-trusslattice structure at 0◦ and 45◦ angle
Open-cell foam lattice structure Figure 3.34 and figure 3.35 show thatthe open cell lattice structure has a higher relative Young’s modulus andrelative shear modulus in the 0◦ direction compared to 45◦ direction.
Figure 3.34: Open-cell foam lattice structure compression test at 0◦ and 45◦
angle
82

Chapter 3. Lattice structure design strategy
Figure 3.35: Open-cell foam lattice structure shear test at 0◦ and 45◦ angle
Figure 3.36 shows the relative strength in function of the relative densityof the open-cell foam lattice structure.
Figure 3.36: Relative strength in function of relative density for open-cellfoam lattice structure at 0◦ and 45◦ angle
3.3.5 Analysis
In this section, we analyse, compare and conclude the results obtained foreach lattice structure.
Influence of stretching and bending-dominated structures Figure3.37 shows a comparison for relative Young’s modulus in function of relativedensity at 0◦ angle for each lattice structure pattern. We can observe that thecubic lattice structure has the highest relative Young’s modulus compared
83

Chapter 3. Lattice structure design strategy
to all other lattice structure patterns. The octet-truss and hexa-truss lat-tice structures have the second and third highest relative Young’s modulus infunction of relative density. The lowest one is the open-cell foam lattice struc-ture. This is because of the stretching and bending-dominated characteristicof these structures. Cubic lattice structure is stretching-dominated where asthe open-cell foam lattice structure is bending-dominated. The octet-trusslattice structure is stretching-dominated in both 0◦ and 45◦ angles. Octet-truss is suitable for high strength lightweight structures. Open-cell foamlattice structure is bending dominated and is suitable for energy absorptionstructures.
Figure 3.37: Comparison of relative Young’s modulus in function of relativedensity at 0◦ angle
Influence of 0◦ and 45◦ position angles Figure 3.38 shows the relativeYoung’s modulus in function of relative density at 45◦ angle. From the graph,we can analyse that the cubic lattice structure in this case has the lowestrelative Young’s modulus compared to the other. When positioned at a 0◦
angle, it has the highest relative Young’s modulus compared to the rest. Itis worthy here to note that the orientation of the lattice structure influencesits characteristic and mechanical properties. At 0◦ angle, the cubic latticestructure is stretching-dominated, where as when the force is loaded at a45◦, the structure becomes bending-dominated. Where as for the octet-trusslattice structure, the relative Young’s modulus is approximately the samein both 0◦ and 45◦ angle orientations. We can conclude that due to thepattern of the struts in octet-truss lattice structures, this pattern can beconsidered as an isotropic material. This is due to the fact that octet-trusslattice structures have struts which are oriented in both 0◦ and 45◦ angles.
84

Chapter 3. Lattice structure design strategy
Thus it is stretching-dominated in both angles. Lattice structure patternswhich have struts only oriented in 0◦ and 90◦ angles can not be considered asan isotropic material. Their mechanical property changes according to thedirection of the force. Figure 3.39 and figure 3.40 shows a comparison forrelative shear modulus in function of relative density at 0◦ and 45◦ angles foreach lattice structure pattern respectively. These findings lead us to considerlattice structures as different materials depending on their orientation.
Figure 3.38: Comparison of relative Young’s modulus in function of relativedensity at 45◦ angle
Figure 3.39: Comparison of relative shear modulus in function of relativedensity at 0◦ angle
85

Chapter 3. Lattice structure design strategy
Figure 3.40: Comparison of relative shear modulus in function of relativedensity at 45◦ angle
Relative density The different combinations of struts thickness and el-ementary structure length that produce the same relative density will haveconstant relative Young’s and shear modulus. For example, for the hexa-trusslattice structure, three lattice structures which have the same 7.9% relativedensity with different strut thickness and elementary structure length havethe same relative Young’s and relative shear modulus. It is also worthy tonote here the effect of relative density by adjusting the struts thickness andlength of the elementary structure for the reason that it directly manipulatesthe mechanical response of the lattice structures.
86

Chapter 3. Lattice structure design strategy
3.4 Results verification
The results obtained are compared in this section. In the section, we con-ducted two verifications, first by comparing with results obtained in otherarticles, and second by conducting case studies to compare FEA results be-tween lattice structures and equivalent materials.
3.4.1 Comparison with results from other articles
Previous work had been published for octet-truss and diamond lattice struc-tures to establish relations between their relative density and relative Young’smodulus. We compare the FEA results that we obtained with the data pub-lished by (Suard, 2015) and (Neff, 2015) for octet-truss and diamond latticestructure respectively.
Figure 3.41: Relative Young’s modulus in function of relative density foroctet-truss lattice structure, in comparison with Suard’s results
Figure 3.41 shows a comparison between FEA results that we obtainedand the results published by (Suard, 2015). Suard et al. conducted both FEAand experimental (see figure 3.42) compression tests of octet-truss latticestructures. The results and the FEA and experimental results by Suard etal. shows good agreement. The good correlation indicates not only thatthe relative Young’s modulus in function of relative density data that weobtained in our FEA simulations are similar to that obtained by (Suard,2015), but also that it is in agreement with the experimental results.
We also compared with another article published for diamond latticestructure. Figure 3.43 illustrates the diamond lattice structure created by(Neff, 2015) for FEA to obtain the relative Young’s modulus in function ofrelative density.
87

Chapter 3. Lattice structure design strategy
Figure 3.42: Experimental compression test of octet-truss lattice structureconducted by (Suard, 2015)
Figure 3.43: FEA on diamond lattice structure by (Neff, 2015)
We created the same lattice structure pattern and dimension and con-ducted a FEA compression test. The results obtained are shown in figure3.44. From this graph, we can see that both the FEA results that we obtainedand the results obtained by Neff et al. are in agreement.
Figure 3.45 shows the comparison between relative strength of ideal stretch-ing and bending-dominated structures published by (Ashby, 2013) and theresults of lattice structures from our FEA simulations.
88

Chapter 3. Lattice structure design strategy
Figure 3.44: Relative Young’s modulus in function of relative density fordiamond lattice structure, in comparison with Neff’s results
Figure 3.45: Relative strength in function of relative density for bending andstretching-dominated lattice structures, in comparison with Ashby’s results
From these results, we can see that the results obtained in FEA weresimilar and comparable to the other results published in other papers. Thus,this verifies the reliability of the measurements and data gathered that canbe used in the proposed lattice structure design method.
89

Chapter 3. Lattice structure design strategy
3.4.2 Comparison with case study results
Case study Two case studies were conducted to compare the FEA resultsbetween the lattice structure and its equivalent material, one with a L shapepart, another with a C shape part. For each case study, two parts werecreated, first with octet-truss lattice structure, the second with the equivalentmaterial. Both case studies have the same lattice structure pattern andrelative density. The material chosen for the two case studies is titaniumalloy Ti-6Al-4V. The lattice structure pattern is an octet-truss at 0◦ angleposition with a relative density of 0.086. The results presented in section 3.3of this chapter gives us a relative Young’s modulus of 0.012 and a relativestrength of 0.014.
We can thus determine the equivalent material’s Young modulus from thesolid material’s Young’s modulus using equations 3.2 and 3.5. Similarly, it ispossible to calculate the equivalent material’s yield strength from the solidmaterial’s yield strength using equation 3.4.
Therefore the equivalent material Young’s modulus is :
Equivalent material Young’s modulus = 0.012× 114 GPa = 1.368 GPa(3.17)
Table 3.1: Material properties of the octet-truss lattice structure equivalentmaterial
The mechanical properties of the octet-truss and equivalent material aresummarized in table 3.1. A 10 000 N load and clamps are applied as shownin figures 3.46 and 3.47 for the L and C shape part respectively.
90

Chapter 3. Lattice structure design strategy
Figure 3.46: FEA on the L shaped lattice structure (left) and equivalentmaterial (right)
A FEA simulation was executed and the displacements and the Von Misesstresses were measured. The FEA results were compared in ten elements forboth parts to see the percentage difference between the two parts to verifywhether equivalent material has similar mechanical properties and is able toreplace the lattice structure for FEA simulation.
Figure 3.47: FEA on the C shaped lattice structure (left) and equivalentmaterial (right)
91

Chapter 3. Lattice structure design strategy
Displacement: L shape part Figure 3.48 shows the displacement of theFEA result. From this image, we observe that the displacement of the latticestructure and equivalent material are in good agreement.
Figure 3.48: Displacements of the L shape part: Lattice structure (left) andequivalent material (right)
Table 3.2: Percentage difference between the displacement of the latticestructure and the equivalent material (L shape part)
The percentage difference between both results are compared. The dis-placements of ten elements with the same coordinates of the lattice structureand equivalent material are compared. Table 3.2 shows the percentage differ-ence between the two results. We can see that the difference ranges from 20
92

Chapter 3. Lattice structure design strategy
to 24%. These differences are relatively large and will undoubtedly requirefurther developments for it to be reduced. The positive point is that theequivalent material tends to generate more displacements than the latticestructure. Consequently, it creates a security factor in the selection of thelattice structures that meet the requirements.
Von Mises stress: L shape part To compare the Von Mises stress re-sult between the lattice structure and equivalent material, the Von Misesstress obtained from the equivalent material has to be divided by the relativestrength. For the octet-truss lattice structure at 0◦ angle position, this valueis 0.014. For example for element 1, the calculation is :
Von Mises stress
Relative strength=
5.995
0.014= 428 MPa (3.18)
Figure 3.49: Von Mises stress of the L shape part: Lattice structure (left)and equivalent material (right)
Figure 3.49 shows the Von Mises stress repartition from the FEA re-sult. From this image, we observe that the Von Mises stress repartition ofthe lattice structure and equivalent material are in good agreement. Table3.3 shows the comparison results. We can see that the difference betweenthe lattice structure and equivalent material is relatively important, rangingfrom 5% to 25%. These differences are not negligible and will undoubtedlyrequire further development for it to be reduced. In particular not taking
93

Chapter 3. Lattice structure design strategy
into account the stress concentrations is a factor that can explain these dif-ferences, as well as the influence of the selected points, which are always inthe material for the equivalent material and which can be found out of thematerial or at the limit for the lattice structure. The positive point is thatthe equivalent material tends to generate more Von Mises stress than thelattice structure. Consequently, it creates a security factor in the selectionof the lattice structures that meet the requirements.
Table 3.3: Percentage difference between the Von Mises stress of the latticestructure and the equivalent material (L shape part)
Displacement: C shape part Figure 3.50 shows the parts displacement.From this image, we observe that the displacement of the lattice structureand equivalent material are in good agreement.
94

Chapter 3. Lattice structure design strategy
Figure 3.50: Displacements of the C shape part: Lattice structure (left) andequivalent material (right)
Table 3.4 shows the displacements results and comparison for ten elementsbetween the lattice structure and the equivalent material.
We can see that the difference ranges from 22 to 24%. These differencesare relatively large and will undoubtedly require further developments for itto be reduced. They are larger in the L shape part, due to the more complexpart form and higher solicitation in the ’C’ shaped part. The positive point isthat the equivalent material tends to generate more displacements than thelattice structure. Consequently, it creates a security factor in the selectionof the lattice structures that meet the requirements.
95

Chapter 3. Lattice structure design strategy
Table 3.4: Percentage difference between the displacement of the latticestructure and the equivalent material (C shape part)
Von Mises stress: C shape part Figure 3.51 shows the Von Mises stressrepartition from the FEA result. From this image, we observe that the VonMises stress repartition of the lattice structure and equivalent material arein good agreement. The table 3.5 shows the Von Mises stress results andcomparison for ten elements between the lattice structure and the equivalentmaterial. We can see that the difference between the lattice structure andequivalent material is relatively important, ranging from 0% to 25%. Thesedifferences are not negligible and will undoubtedly require further develop-ments for it to be reduced. They are slightly higher in case of L shape part.In particular not taking into account the stress concentrations is a factor thatcan explain these differences, as well as the influence of the selected points,which are always in the material for the equivalent material and which canbe found out of the material or at the limit for the lattice structure. Thepositive point is that the equivalent material tends to generate more VonMises stress the lattice structure. Consequently, it creates a security factorin the selection of the lattice structures that meet the requirements.
96

Chapter 3. Lattice structure design strategy
Figure 3.51: Von Mises stress of the C shape part: Lattice structure (left)and equivalent material (right)
Table 3.5: Percentage difference between the Von Mises stress of the latticestructure and the equivalent material C shape part)
97

Chapter 3. Lattice structure design strategy
3.4.3 Conclusion
The concept of equivalent material was applied in a FEA of an octet-trusslattice structure. The use of this concept for the prediction of the displace-ments and Von Mises stress of such a structure was validated by comparisonwith a FEA of the lattice structure. We observed that the differences rangebetween 5 to 26%. This range is acceptable for the purpose of pre-sizinglattice structure CAD models. We can conclude from this study case thatthe equivalent materials produced can represent the lattice structure in FEAand that the methodology to obtain the equivalent material is reliable.
98

Chapter 3. Lattice structure design strategy
3.5 Summary
In this chapter, a new lattice structure design method for engineers to eas-ily and quickly design lattice structures has been presented. This chapterproposes a new lattice structure design method, while its representation andcreation will be presented in the next chapter, as shown in figure 3.52.
Figure 3.52: General view of the proposed lattice structures design method
New lattice structure design method A new lattice structure designmethod is proposed. This new method helps engineers to choose the mostsuitable lattice structure easily and quickly. It will help to achieve the greatpotential of additive manufacturing by widely integrating lattice structuresin additive manufactured parts to produce lightweight high strength parts.This design method eradicates the need of creating lattice structure CADmodels with struts and also improves the FEA simulations of these struc-tures, which is a time consuming process. The lattice structures are replacedwith an equivalent material which have the same mechanical properties.
Methodology for the creation of equivalent lattice structure mate-rials In this chapter, we also presented a methodology to create equivalentlattice structure materials. This equivalent material is solid and has thesame mechanical properties of lattice structures. This methodology to cre-ate equivalent materials can be used to create equivalent materials for other
99

Chapter 3. Lattice structure design strategy
lattice structure patterns. With this method, we are able to analyse the me-chanical behaviour and determine whether a lattice structure is bending orstretching-dominated.
100

Chapter 4
Definition and creation of theskeleton model of the lattice
structures
Contents4.1 Lattice structure configurations . . . . . . . . . . . . 103
4.1.1 Pattern . . . . . . . . . . . . . . . . . . . . . . . . . . 104
4.1.2 Relative density . . . . . . . . . . . . . . . . . . . . . 104
4.1.3 Progressivity . . . . . . . . . . . . . . . . . . . . . . . 106
4.1.4 Conformality . . . . . . . . . . . . . . . . . . . . . . . 106
4.1.5 Design space . . . . . . . . . . . . . . . . . . . . . . . 108
4.1.6 Joint shape . . . . . . . . . . . . . . . . . . . . . . . . 109
4.2 Creation of skeleton model . . . . . . . . . . . . . . . 109
4.2.1 Skeleton model concept . . . . . . . . . . . . . . . . . 109
4.2.2 Skeleton model algorithm . . . . . . . . . . . . . . . . 111
4.3 Visualisation . . . . . . . . . . . . . . . . . . . . . . . 119
4.4 Manufacturing . . . . . . . . . . . . . . . . . . . . . . 121
4.5 Summary . . . . . . . . . . . . . . . . . . . . . . . . . 123
101

Chapter 4. Definition and creation of the skeleton model of the latticestructures
In this chapter we will deal with the problem of visualization and manu-facturing of lattice structures. The type of lattice structure (pattern, density,etc.) being determined, it is necessary to give to the designer a representa-tion in a CAD environment. This is achieved by uploading to the graphiccard the facets, results of the discretization of the boundary surfaces of allthe elements of the structure. The structure being validated by the designer,its manufacturing requires the determination of the contours and the fusiontrajectory for each layer. This is usually done once again from the bound-ary surface (skin) discretized or not. We have shown in Chapter 2 that themodelling in a usual CAD environment and the use of the boundary surfaceis not appropriate in terms of ergonomics and resource consumption. It istherefore necessary to propose a new way of modeling these lattices from thedata collected in Chapter 3 and then to visualize them and to prepare theirmanufacturing.
For this, the proposal is to go through a skeleton model, the informationabout the skin being used at the time of the calculation of the visualizationdata by the graphics card or the manufacturing data by the CAM software.The skeleton model is created from the geometric data of the lattice structureas shown in figure 4.1. In this chapter, first the data necessary to describea lattice structure will be listed and described in section 4.1. Then thealgorithm to create the skeleton model from these data will be presented insection 4.2. Finally how visualisation and calculation of the manufacturingfrom the skeleton model is imagined will be exposed in section 4.3.
Figure 4.1: Chapter 4
102

Chapter 4. Definition and creation of the skeleton model of the latticestructures
4.1 Lattice structure configurations
In this section, the different types of lattice structure configurations thathave to be described and created is examined. Figure 4.2 summarises thedifferent lattice structure configurations and variables. There are six vari-ables: pattern, design space, density, progressivity, conformality and joint.In the following subsections, the variables are explained in detail.
Figure 4.2: Lattice structure configurations
103

Chapter 4. Definition and creation of the skeleton model of the latticestructures
4.1.1 Pattern
The lattice pattern is the basic element of its geometric structure. It isbased on nodes positions and struts connection between these nodes. Thereare many types of lattice structure patterns. The most used are the fourfollowing ones.
• Cubic• Octet-truss• Hexa-truss• Open-cell foam• Diamond
Figure 3.16 shows a representation and table 4.1 the number of pointsand lines for these four lattice structure pattern. An open format to describeexisting and new pattern is presented in section 4.2. The pattern is thenrepeated in the volume, deformed and adjusted to create the final latticestructure.
Table 4.1: Number of points and lines for cubic, octet-truss, hexa-truss andopen-cell foam elementary structure
4.1.2 Relative density
The relative density is the ratio between the volume of material of the lat-tice structure and the volume of the bounding box. It is a function of thegeometrical parameters and of the strut section. Equation 3.1 and figure 3.2illustrate the relative density. The volume of material of the lattice structuredepends on the pitch and strut section dimension. The pitch dimension canvary along the X, Y and Z-axis. The section can be circular, square or anyother geometries.
At a first order the relative density can be approximated for each patternas a function of pitch and section for a constant pitch and section. For anoctet-truss lattice structure the first order approximation is given in equation4.1 and for a cubic lattice structure by the equation 4.2 where l is the pitchand s is the section. This approximation is realistic for low density but
104

Chapter 4. Definition and creation of the skeleton model of the latticestructures
the error becomes larger for higher densities as overlapping volume at theconnections become more important. Figures 4.3 and 4.4 shows the firstorder relative density as a function of the true relative density, which hasbeen measured from the CAD model of a unit cell.
ρ1st = 12√
2(s
l2) (4.1)
ρ1st = (3 ∗ sl2
) (4.2)
Figure 4.3: First order relative density as a function of the true relativedensity for the cubic lattice structure. The red line represents the isovalue
Figure 4.4: First order relative density as a function of the true relativedensity for the octet-truss lattice structure.
105

Chapter 4. Definition and creation of the skeleton model of the latticestructures
4.1.3 Progressivity
Lattice structures relative density can be uniform or gradient. For uniformlattice structures, the size and dimensions of each elementary structure areconstant throughout the whole design space. As for gradient lattice struc-tures, the dimensions of each elementary lattice structure vary throughoutthe part. The sections of the struts can also vary to produce gradient latticestructures and with a variable relative density. Table 4.2 shows examplesof constant and gradient lattice structures for each pattern. This ability tooptimise lattice structures using gradient lattice structures creates differentrelative densities in each area of the part. With the same material, a latticestructure with higher relative density will have higher strength and stiffness.By locally optimising the relative density and properties of a lattice struc-ture, it is possible to meet the requirements of a specific loading in an areaof a part. This gradient form can be designed to follow the direction andmagnitudes of the loads applied to the part. In areas where high stress isapplied, a higher relative density lattice structure will be needed, while inareas where lower stress is applied, lower relative density is needed.
4.1.4 Conformality
Lattice structures can follow different design space forms, such as curved orplanar surfaces. This characteristic is categorised as conformal lattice struc-ture. Struts in conformal lattice structures are oriented in accordance withthe form of the design space, whereas in non-conformal lattice structures,the struts are oriented independently from the design space along three per-pendicular directions. Figure 4.5 shows examples in 2D of different designspace forms and the corresponding conformal lattice structures. There aretwo types: first the opposite surfaces are parallel, second they are not par-allel. The definition of the conformality is versatile and complex has notbeen deeply studied. It will mainly be driven by meshing parameters. Onlyconformality in one direction has been considered with two cases, the twoopposite surfaces are parallel or not.
106

Chapter 4. Definition and creation of the skeleton model of the latticestructures
Table 4.2: Constant and gradient lattice structures
Figure 4.5: Different types of conformal lattice structures
107

Chapter 4. Definition and creation of the skeleton model of the latticestructures
4.1.5 Design space
Design space or zone from chapter 3, is the area of 3D space where thedefined lattice is built. It is defined by it’s boundary surfaces and the meshis adjusted to keep only the portion inside these surfaces, as shown in figure4.6. The lattice is adjusted in relation to this design space and differentsolutions for the connections between the lattice and the edge of the designspace can be designed.
Figure 4.6: Example of a cubic lattice structure with an upper planar andcurved surface of the design space
There are two types of connections between the lattice structure extremitystruts and the design space boundary surface. Figure 4.7 shows an exampleof the two types. The first type of connection is the non-conformal extremitystrut connection, whereas the second connection is the conformal extremitystruts connection. In the non-conformal extremity struts, struts that cutthe boundary are only adjusted while in the conformal extremity struts, theorientation of the extremity struts are modified to follow the orientation ofthe surface of the design space. As for conformal lattice, conformal extremityhas a lot of possibilities and has not been deeply studied in this manuscript.
108

Chapter 4. Definition and creation of the skeleton model of the latticestructures
Figure 4.7: Connection between extremity struts and design space
4.1.6 Joint shape
The connection between the struts forms a joint. At each joint, forms areadded to form the joint. Theses forms can be either rounded edges or spheres.Figure 4.8 is an example of a cubic lattice structure with rounded joint edges.
Figure 4.8: Cubic lattice structure with rounded joint edges
4.2 Creation of skeleton model
4.2.1 Skeleton model concept
In this chapter, the objective is to propose an alternative to skin or B-Repmodels. Current CAD tools currently create and represent lattice struc-tures using surfaces and volumes. This thus contributes to large file sizes,high RAM consumption, as well as time-consuming creations and operations.Hence, a better way to create lattice structure parts than the current method
109

Chapter 4. Definition and creation of the skeleton model of the latticestructures
is by defining it with four elements, which are points, lines, strut sectionsand joints. These four elements define a skeleton model. Table 4.3 shows thepoint, line, section and connection list for an elementary octet-truss struc-ture. The point list contains the coordinates of each point (X, Y, Z) and theline list contains the lines (struts) connecting these points, it is described bya beginning point and ending point. The section list describes the size of thesection for each line to define a strut. It is described by a section size at thebeginning and end of the line. The connection line describes the type of jointat each corresponding point. The following subsections will explain how theskeleton model is created.
Table 4.3: Elementary octet-truss structure: Point, line, section and connec-tion list
110

Chapter 4. Definition and creation of the skeleton model of the latticestructures
Figure 4.9 illustrates a cubic lattice structure defined with a skeletonmodel. The lattice structure on the left is created with only points and lines,whereas for the lattice structure on the right, the strut sections are added.
Figure 4.9: Skeleton model: Lattice structure defined by points, lines andsections
4.2.2 Skeleton model algorithm
The algorithm to create the skeleton model is presented in this section.
Figure 4.10: Class, functions, input and output information of the algorithm
Figure 4.10 shows the workflow to create the skeleton model from thecharacteristics of the lattice structure defined in section 4.1. In blue arethe steps that has already been implemented, while in green are those to bedeveloped in future works. The following paragraphs explain the successivesteps of the algorithm.
111

Chapter 4. Definition and creation of the skeleton model of the latticestructures
Elementary structure creation The elementary pattern is described ina unit cube by the coordinates of the points and the lines linking these points.For example, to create a cubic lattice structure, eight points are needed todefine the cubic elementary structure, as shown in table 4.4. The number ofeach point corresponds to its index number in the algorithm. The coordinatesof each point are shown in the corresponding columns in the table. The eightpoints are connected with twelve lines. The column on the left and rightindicates the index of the points connected to construct each line. The pointand line lists of the octet-truss, hexa-truss and open-cell foam elementarystructure are presented in tables B.1, B.2 and B.3 in appendix B.
Table 4.4: Elementary cubic structure: Point and line list
A point is defined by its coordinates. Here we use the Cartesian coor-dinate system to describe the coordinates of the points. Therefore, a pointclass consists of the coordinates X, Y and Z. In this class, we also attributean index to each point. The index of the point refers to the position of thepoint in the points list.
A line connects two points. Therefore it is defined by the point at thebeginning of the line and the point at the end of the line. The lines definedare straight (having no curvature). Each line is attributed an index, whichrefers to the position of the line in the line list.
A section is defined by its geometry and its dimensions. Here only circularand square sections have been considered. A section is assigned to eachextremity (beginning and end) of each line.
A joint is described by its form, for example rounded edges or spheresand its dimensions. Each point is attributed a joint form in the joint list.
112

Chapter 4. Definition and creation of the skeleton model of the latticestructures
Create repetition To create the lattice structure, a repetition of the ele-mentary structure is carried out. The elementary structure is repeated witha pitch of one in each direction till the desired number of cells is obtained.Figure 4.11 shows the repetition of an elementary structure repetition in theX, Y and Z-axis to obtain a 3 x 3 x 3 unit cubic lattice structure. Herewe note that during the repetition of two elementary structures, overlappingpoints and lines were created. Thus a function is required to delete theseoverlapping points and lines. Table B.4 in appendix B contains the pointand line lists for this 3 x 3 x 3 unit cubic lattice structure.
Figure 4.11: Elementary structure repetition to obtain 3 x 3 x 3 unit latticestructure
Remove duplicated points and lines Next, we remove the overlappingpoints and lines which exist after the elementary structure repetition, asshown in figure 4.12.
Figure 4.12: Overlapping points and lines after elementary structure repeti-tion
In step one, first an empty point list is created. This list is referred to as
113
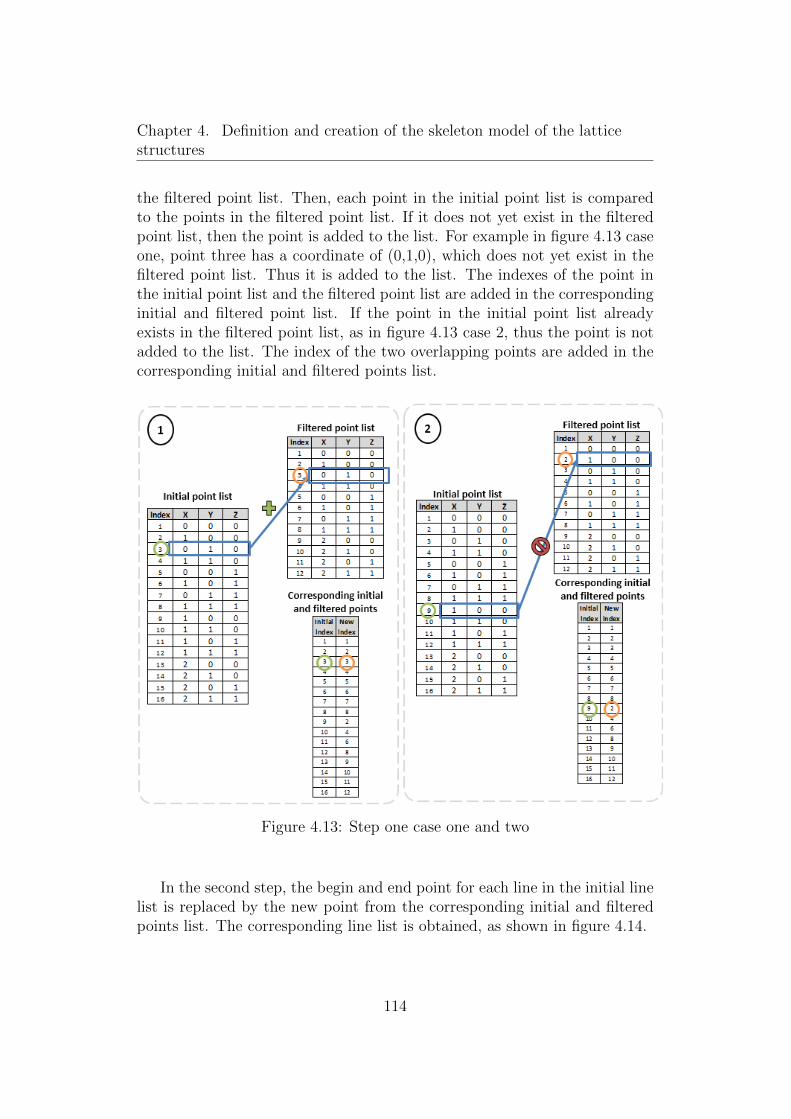
Chapter 4. Definition and creation of the skeleton model of the latticestructures
the filtered point list. Then, each point in the initial point list is comparedto the points in the filtered point list. If it does not yet exist in the filteredpoint list, then the point is added to the list. For example in figure 4.13 caseone, point three has a coordinate of (0,1,0), which does not yet exist in thefiltered point list. Thus it is added to the list. The indexes of the point inthe initial point list and the filtered point list are added in the correspondinginitial and filtered point list. If the point in the initial point list alreadyexists in the filtered point list, as in figure 4.13 case 2, thus the point is notadded to the list. The index of the two overlapping points are added in thecorresponding initial and filtered points list.
Figure 4.13: Step one case one and two
In the second step, the begin and end point for each line in the initial linelist is replaced by the new point from the corresponding initial and filteredpoints list. The corresponding line list is obtained, as shown in figure 4.14.
114

Chapter 4. Definition and creation of the skeleton model of the latticestructures
Figure 4.14: Step two
Figure 4.15: Step three case one and two
In the third step, an empty line list is created. This list is referred to as
115

Chapter 4. Definition and creation of the skeleton model of the latticestructures
filtered line list. Then, each line in the initial line list is compared to the linein the filtered point list. If it does not yet exist in the filtered line list, thepoint is then added to the list, as shown in figure 4.15 case one. If the line inthe initial line list already exists in the filtered line list, thus the line is notadded to the list, as shown in figure 4.15 case two.
Create scale The lattice structure being defined with a unit pitch, it has tobe scaled so that its pitch becomes the one defined by the designer. The scalecan be either constant or gradient depending on the progressivity defined bythe designer.
Figure 4.16 shows an example a constant 3 x 3 x 3 unit scale latticestructure with a pitch dimension of 2 mm. As we can see in the point andline lists is shown in table B.5 in appendix B, the line list is the same as anunscaled structure in table B.4, the only changes occur in the coordinates ofthe points list, where each point in the elementary structure is multiplied bytwo.
Figure 4.16: Constant scaled 3 x 3 x 3 unit cubit lattice structure with apitch dimension of 2
Figure 4.17 is an example of a scale gradient lattice structure. Herethe algorithm is the same used as for the scaled constant lattice structure,the only difference being the multiplication of the coordinates of the points.Here, instead of multiplying with a constant, the coordinates of the pointsare multiplied with maths formulas such as exponential, square or power. Aswe can see in the point and line lists shown in table B.6 in appendix B, theline list is the same as an unscaled structure in table B.4, the only changesoccur in the coordinates of the points list, where each point in the elementarystructure is multiplied by the maths formula applied.
116

Chapter 4. Definition and creation of the skeleton model of the latticestructures
Figure 4.17: Progressive scaled 3 x 3 x 3 unit cubit lattice structure
To obtain the constant or gradient lattice structure, the following algo-rithm is used :For Point in Pointlist :X = x * (maths formula or constant dimension)Y = y * (maths formula or constant dimension)Z = z * (maths formula or constant dimension)
Create conformality Conformal lattice structures are created from theprevious point list by moving the points according to the driving surfaces.Here we propose three different methods to move the points. The first methodconsists of measuring the distance between the horizontal and vertical designspace boundaries. Next, each distance is divided by the number of unitsin the lattice structure to obtain an equal spacing between each line in thevertical and horizontal direction. This method is illustrated in figure 4.18.In this example, a 4 x 4 x 1 unit cubic lattice structure conforms to thedesign space. Table B.7 in appendix B shows the point and line list of thisconformal cubic lattice structure.
Figure 4.18: Method one
The second proposed method is for conformal lattice structures with par-allel design space boundaries. In this case, the idea proposed is to measure thedistance of the lower design space boundary to the origin of the axis. Then,
117

Chapter 4. Definition and creation of the skeleton model of the latticestructures
each coordinate in this direction is translated with the distance measured,as shown in figure 4.19 to translate all the points. Table B.8 in appendix Bshows the point and line list of this conformal cubic lattice structure.
Figure 4.19: Method two
The third method is similar to the first method, the only difference beingthe method to calculate the distance between the points. Instead of dividingthe distance between the design space boundaries by the number of units asin method one, here we use the minmax formula to create equal distancesbetween the points in each direction. An illustration of this third method isgiven in figure 4.5.
Cut to design space There are two types of connections between thelattice structure extremity and boundary of the design space, as shown infigure 4.7. The connections are created by modifying the position of thepoints of the extremity struts on the boundary surface of the design spaceto obtain lines which connects the extremities of the lattice structure to thedesign space surface. The method to obtain the non-conformal extremitystruts is shown in figure 4.20 and the conformal one has not been adressed inthis manuscript. First the line for which the two points are outside the designspace are deleted. Then for the lines having one point inside the design andone point outside the design space, a point is created at the intersection ofthe line and the design space boundary and then the outside point is replacedby the new point. Finally the points which are not any more connected to aline are deleted. The same approach can by carried out to obtain conformal
118

Chapter 4. Definition and creation of the skeleton model of the latticestructures
extremity struts, except in this case, creation of the new points is carried outdifferently. Here, the points are repositioned according the orientation of thedesign space boundary surface.
Figure 4.20: Method to obtain non-conformal extremity struts
Output information The output information contains the lists of thepoints, lines, strut sections and joints. In the points list, each line containsthe coordinates of the point. The lines list contains the index of the pointsto which they are connected. The section list contains section characteristicsfor each strut extremity and the joint list contains the joint type. Figure 4.21is an example of a cubic, octet-truss and hexa-truss lattice structure createdwith points and lines, and visualised in a viewer (Paraview).
Tables B.9 and B.10 in appendix B is an example of a 3 x 3 x 3 cubiclattice structure. It contains point, line, section and joint shapes lists.
4.3 Visualisation
Proposed visualisation method The idea for the proposed method isto avoid the need to create lattice structures with surfaces and volumes byreplacing them with lines, points and sections. From the skeleton model, thesolution is to use geometric primitives to visualise the lattice structures inCAD. Geometric primitives are the simplest geometric objects that a CADsystem can draw and store. Commonly used geometric primitives include:
119

Chapter 4. Definition and creation of the skeleton model of the latticestructures
Figure 4.21: Example of a cubic, octet-truss and hexa-truss lattice structurecreated with points and lines visualised in a viewer (Paraview)
• Points• Lines and line segments• Planes• Circles and ellipses• Triangles and other polygons• Spline curves
Whereas in 3D applications, basic geometric forms and shapes are con-sidered to be primitives, for example:
• Spheres• Cubes or boxes• Toroids• Cylinders• Pyramids
Figure 4.22 shows an example of a cubic lattice structure visualised inthe CAD software by adding the section of the struts. Lattice structures canbe built with geometric primitives such as cylinders and spheres. The idea isto send to the graphic card the primitives (for example a cylinder) based onthe information of the skeleton model. The graphic card will then calculatethe facet to create the visualisation model of the lattice.
120

Chapter 4. Definition and creation of the skeleton model of the latticestructures
Figure 4.22: Visualisation of lattice structure built by geometric primitivelines and cylinders
4.4 Manufacturing
Proposed slicing method The data sent to the usual machine in additivemanufacturing are the contour of the melted zones for each layer. The 3Dmodel of the part has to be sliced to determine these contours. In our case,the skin of the part is not known and the slicing has to be done from theskeleton. The lines are sliced to obtain the centre of the contours. Then, fromthe section list and the orientation of the struts, we create the contours andfinally the outer contour of the form. The joint forms, for example roundedor sphere joints, are not addressed in this manuscript. It will be for futureworks.
Figure 4.23 shows the two steps.
Strut section The form of the contour around the mean line depends onthe section and the orientation of the strut. For example, for a circularsection, a strut oriented at a 90◦ angle has a circular section, while strutswhich are not at 90◦ angles have ellipse-shaped sections. The exact shape ofthe ellipse depends on the angle of the orientation.
121

Chapter 4. Definition and creation of the skeleton model of the latticestructures
Figure 4.23: Slicing lattice structure lines into layers and adding section tosliced lines
Strut joint The section form in a strut joint is a combination of jointellipses, as shown in figure 4.24. Here we see the joint in an octet-trusslattice structure, where four struts are connected at the joint at an inclinedangle. First the lines at the joint is sliced to obtain four points, then anellipse contour is added surrounding each point. Next, the contours of theellipse are joined together, by keeping only the outer contour, to obtain thefinal section form.
122

Chapter 4. Definition and creation of the skeleton model of the latticestructures
Figure 4.24: Adding section to sliced lines
4.5 Summary
Two advances are presented in this chapter. First, the determination of lat-tice structure part configurations for metallic additive manufacturing. Sec-ond, a new proposed method to visualise lattice structure in CAD and slice itin CAM. First the requirements and problems encountered were determined.The core of this proposed methodology is the representation and creation oflattice structures with points, lines and section sizes, referred to as the skele-ton model. The creation of the skeleton model is described. A algorithmwas created based on this concept. A method was proposed to visualise thelattice structures in CAD software by using geometric primitives. In CAMenvironment, a new method was proposed to slice lattice structures using theskeleton model. This PhD serves as a starting point for future developmentsin the creation of conformal lattice structures, cutting to the design space,section, joints and connections contributing to new and improved CAD andCAM tools for additive manufacturing and also a new additive manufacturingfile format.
123

General conclusion
Aim and strategy
The aim of this PhD is to facilitate and improve the integration of latticestructures in additive manufacturing parts. The problematic has been splitinto difference parts. First, the design aspect of the lattice structures, wherethe goal is to help designers have the necessary information to be able tochoose and integrate the correct type of lattice structures based on a part’srequirements. Then, the definition of a skeleton model for visualisation andcreation of manufacturing data. The outcome will contribute to the wide useof lattice structures in additive manufactured parts.
Main results
New lattice structure design method
A new lattice structure design method is proposed for better lattice structureintegration in part designs. This design method enables designers to choosethe correct lattice pattern and density. An essential part of this propositionis the use of equivalent lattice structure materials. This eradicates the needto design lattice structure CAD models and reduces FEA simulation time.
Methodology to create an equivalent lattice structurematerial
A methodology to create an equivalent material is presented in this Phd the-sis. It enables engineers to replace lattice structure CAD models with CADsolid models which have the same mechanical properties. This methodologycan be used to define equivalent materials for other lattice structure patterns.The equivalent materials reduces FEA simulation time.
Evaluation of current CAD tools performances in addi-tive manufacturing
The performances of current CAD tools were assessed to determine whetherthey are adequate enough for the requirements of additive manufacturing.Results show that current CAD software are not practical for designers to

General conclusion
design lattice structures easily and quickly for additive manufacturing andthat current CAE software are not up to scratch in terms of performances toexecute finite-element-analysis of lattice structures. Improvements in CADand CAE software are needed.
Definition and creation of the skeleton model for latticestructures
A representation and creation of lattice structures with points, lines andsection sizes, referred to as the skeleton model was created. Lattice structuregeometrical characteristics were determined and an algorithm for the creationof a skeleton model for these characteristics were presented.
Future work
New CAD tools to design lattice structures
To overcome the problem of having to design lattice structures manuallyin CAD software, CAD tools must be able to automatically create the lat-tice structures CAD models. One which enables designers to choose froma library the lattice pattern, struts thickness and length, and functions toautomatically create the lattice structures. This work is a basis for futurework to create new CAD tools to design lattice structures
CAD file formats for additive manufacturing
A new CAD file format suitable for lattice structure is needed. One thatstores lattice structure information based on points and lines instead of sur-faces and volumes. Lattice part designs, CAD, CAE and CAM requirementshave to be taken into consideration for the creation of this new CAD fileformat for additive manufacturing, as shown in figure 4.25. This work is astarting point for the creation of a new CAD file format for additive manu-facturing.
Lattice structure optimisation and stress concentration
The proposed lattice structure design method allows engineers to choose thecorrect lattice structure pattern and density. A preliminary study regardingstress concentration in lattice structures is assessed in this Phd. However,
125

General conclusion
Figure 4.25: Proposal of a new CAD file format for additive manufacturingtaking into aspect CAD, CAE and CAM requirements
future work is needed to optimise the lattice structure struts and overcomethe stress concentration areas.
Lattice structure partitioning
In the proposed lattice structure design method, the partitions were definedby the engineer based on the FEA results. However, it would be interestingto have a detail method to define this partitions. This will help engineers tochoose the most optimised partitions. The approach proposed in this workopens the path for future research in this area.
126

Bibliography
Al-Ahmari, A. and K. Moiduddin2014. Cad issues in additive manufacturing. Comprehensive MaterialsProcessing. Advances in Additive Manufacturing and Tooling, 10:375–399.
Ashby, M.2006. The properties of foams and lattices. Philosophical Transactions ofthe Royal Society of London A: Mathematical, Physical and EngineeringSciences, 364(1838):15–30.
Ashby, M.2013. Designing architectured materials. Scripta Materialia, 68(1):4–7.
Ashby, M. F., T. Evans, N. A. Fleck, J. Hutchinson, H. Wadley, and L. Gibson2000. Metal Foams: A Design Guide. Elsevier.
Beyer, C.2014. Strategic implications of current trends in additive manufacturing.Journal of Manufacturing Science and Engineering, 136(6):064701.
Bhandarkar, M. P., B. Downie, M. Hardwick, and R. Nagi2000. Migrating from iges to step: one to one translation of iges drawingto step drafting data. Computers in industry, 41(3):261–277.
Brackett, D., I. Ashcroft, and R. Hague2011. Topology optimization for additive manufacturing. In Proceedingsof the Solid Freeform Fabrication Symposium, Austin, TX, Pp. 348–362.
Campbell, I., D. Bourell, and I. Gibson2012. Additive manufacturing: rapid prototyping comes of age. RapidPrototyping Journal, 18(4):255–258.
Chu, C., G. Graf, and D. W. Rosen2008. Design for additive manufacturing of cellular structures. Computer-Aided Design and Applications, 5(5):686–696.
Cooper, D. E., M. Stanford, K. A. Kibble, and G. J. Gibbons2012. Additive manufacturing for product improvement at red bull tech-nology. Materials & Design, 41:226–230.
127

Bibliography
Darwish, S. M. and M. U. Aslam2016. Auxetic cellular structures for custom made orthopedic implantsusing additive manufacturing. International Journal of Engineering andAdvanced Technology (IJEAT), 4(2).
Deshpande, V., M. Ashby, and N. Fleck2001. Foam topology: bending versus stretching dominated architectures.Acta Materialia, 49(6):1035–1040.
Dong, L., V. Deshpande, and H. Wadley2015. Mechanical response of ti–6al–4v octet-truss lattice structures. In-ternational Journal of Solids and Structures, 60:107–124.
Dutta, B. and F. Froes2015. 24-the additive manufacturing (am) of titanium alloys. TitaniumPowder Metallurgy, Butterworth-Heinemann, Boston, Pp. 447–468.
Evans, A. G., J. W. Hutchinson, N. A. Fleck, M. Ashby, and H. Wadley2001. The topological design of multifunctional cellular metals. Progressin Materials Science, 46(3):309–327.
Fall, G. C.2013. Industry research monitor: Additive manufacturing. General Elec-tric Corporation,(accessed in April 2014) http://www. americas. gecapital.com/GECA Document/Additive Manufacturing Fall 201, 3.
Finnegan, K., G. Kooistra, H. N. Wadley, and V. Deshpande2007. The compressive response of carbon fiber composite pyramidal trusssandwich cores. International Journal of Materials Research, 98(12):1264–1272.
Froes, F. and B. Dutta2014. The additive manufacturing (am) of titanium alloys. In AdvancedMaterials Research, volume 1019, Pp. 19–25. Trans Tech Publ.
Gibson, L. J.2005. Biomechanics of cellular solids. Journal of biomechanics, 38(3):377–399.
Gibson, L. J. and M. F. Ashby1999. Cellular solids: structure and properties. Cambridge university press.
128

Bibliography
Hiller, J. D. and H. Lipson2009. Stl 2.0: a proposal for a universal multi-material additive man-ufacturing file format. In Proceedings of the Solid Freeform FabricationSymposium, number 1, Pp. 266–278. Citeseer.
Iyer, A., S. G. Kapoor, and R. E. DeVor2001. Cad data visualization for machining simulation using the step stan-dard. Journal of manufacturing systems, 20(3):198.
Kooistra, G. W. and H. N. Wadley2007. Lattice truss structures from expanded metal sheet. Materials &Design, 28(2):507–514.
Kranz, J., D. Herzog, and C. Emmelmann2015. Design guidelines for laser additive manufacturing of lightweightstructures in tial6v4. Journal of Laser Applications, 27(S1):S14001.
Li, Q., E. Y. Chen, D. R. Bice, and D. C. Dunand2008. Mechanical properties of cast ti-6al-4v lattice block structures. Met-allurgical and Materials Transactions A, 39(2):441–449.
Lu, W., F. Lin, J. Han, H. Qi, and N. Yan2009. Scan strategy in electron beam selective melting. Tsinghua Science& Technology, 14:120–126.
Manfredi, D., E. Ambrosio, F. Calignano, M. Krishnan, R. Canali, S. Bi-amino, M. Pavese, E. Atzeni, L. Iuliano, P. Fino, et al.2014. Direct metal laser sintering: an additive manufacturing technologyready to produce lightweight structural parts for robotic applications. Lametallurgia italiana, (10).
McHenry, K. and P. Bajcsy2008. An overview of 3d data content, file formats and viewers. NationalCenter for Supercomputing Applications, 1205.
McMains, S., J. Smith, and C. Sequin2002. The evolution of a layered manufacturing interchange format. InASME 2002 International Design Engineering Technical Conferences andComputers and Information in Engineering Conference, Pp. 945–953.American Society of Mechanical Engineers.
Moongkhamklang, P., D. M. Elzey, and H. N. Wadley2008. Titanium matrix composite lattice structures. Composites Part A:applied science and manufacturing, 39(2):176–187.
129

Bibliography
Mun, J., B.-G. Yun, J. Ju, and B.-M. Chang2015. Indirect additive manufacturing based casting of a periodic 3d cel-lular metal–flow simulation of molten aluminum alloy. Journal of Manu-facturing Processes, 17:28–40.
Nadeau, D. R., J. L. Moreland, and M. M. Heck1998. Introduction to vrml 97. ACM SIGGRAPH ‘98 Course Notes.
Neff, C.2015. Mechanical Properties of Laser-Sintered-Nylon Diamond Lattices.PhD thesis, University of South Florida.
Ponader, S., E. Vairaktaris, P. Heinl, C. v. Wilmowsky, A. Rottmair,C. Korner, R. F. Singer, S. Holst, K. A. Schlegel, F. W. Neukam, et al.2008. Effects of topographical surface modifications of electron beammelted ti-6al-4v titanium on human fetal osteoblasts. Journal of biomedicalmaterials research Part A, 84(4):1111–1119.
Queheillalt, D. T. and H. N. Wadley2005. Cellular metal lattices with hollow trusses. Acta Materialia,53(2):303–313.
Rashed, M., M. Ashraf, R. Mines, and P. J. Hazell2016. Metallic microlattice materials: A current state of the art on man-ufacturing, mechanical properties and applications. Materials & Design,95:518–533.
Reinhart, G. and S. Teufelhart2011. Load-adapted design of generative manufactured lattice structures.Physics Procedia, 12:385–392.
Rochus, P., J.-Y. Plesseria, M. Van Elsen, J.-P. Kruth, R. Carrus, and T. Dor-mal2007. New applications of rapid prototyping and rapid manufactur-ing (rp/rm) technologies for space instrumentation. Acta Astronautica,61(1):352–359.
Rosen, D. W.2007. Computer-aided design for additive manufacturing of cellular struc-tures. Computer-Aided Design and Applications, 4(5):585–594.
Standard, A.2012. F2792. 2012. standard terminology for additive manufacturing tech-nologies. ASTM F2792-10e1.
130

Bibliography
Suard, M.2015. Characterization and optimization of lattice structures made by Elec-tron Beam Melting. PhD thesis, Univ. Grenoble Alpes.
Tang, Y., J.-Y. Hascoet, and Y. F. Zhao2014. Integration of topological and functional optimization in design foradditive manufacturing. In ASME 2014 12th Biennial Conference on Engi-neering Systems Design and Analysis, Pp. V001T06A006–V001T06A006.American Society of Mechanical Engineers.
Thompson, M. K., G. Moroni, T. Vaneker, G. Fadel, R. I. Campbell, I. Gib-son, A. Bernard, J. Schulz, P. Graf, B. Ahuja, et al.2016. Design for additive manufacturing: Trends, opportunities, con-siderations, and constraints. CIRP Annals-Manufacturing Technology,65(2):737–760.
Vayre, B., F. Vignat, and F. Villeneuve2012a. Designing for additive manufacturing. Procedia CIRP, 3:632–637.
Vayre, B., F. Vignat, and F. Villeneuve2012b. Metallic additive manufacturing: state-of-the-art review andprospects. Mechanics & Industry, 13(02):89–96.
Wadley, H. N.2002. Cellular metals manufacturing. Advanced Engineering Materials,4(10):726–733.
Wadley, H. N.2006. Multifunctional periodic cellular metals. Philosophical Transactionsof the Royal Society of London A: Mathematical, Physical and EngineeringSciences, 364(1838):31–68.
Wadley, H. N., N. A. Fleck, and A. G. Evans2003. Fabrication and structural performance of periodic cellular metalsandwich structures. Composites Science and Technology, 63(16):2331–2343.
Wang, J., A. Evans, K. Dharmasena, and H. Wadley2003. On the performance of truss panels with kagome cores. InternationalJournal of Solids and Structures, 40(25):6981–6988.
Wolcott, M. P.1990. Cellular solids: Structure and properties: by lorna j. gibson andmichael f. ashby; published by pergamon, oxford, 1988; 358 pp.
131

Bibliography
Wong, K. V. and A. Hernandez2012. A review of additive manufacturing. ISRN Mechanical Engineering.
Zhang, P., J. Toman, Y. Yu, E. Biyikli, M. Kirca, M. Chmielus, and A. C.To2015. Efficient design-optimization of variable-density hexagonal cellularstructure by additive manufacturing: theory and validation. Journal ofManufacturing Science and Engineering, 137(2):021004.
Zheng, X., H. Lee, T. H. Weisgraber, M. Shusteff, J. DeOtte, E. B. Duoss,J. D. Kuntz, M. M. Biener, Q. Ge, J. A. Jackson, et al.2014. Ultralight, ultrastiff mechanical metamaterials. Science,344(6190):1373–1377.
Zhu, H., J. Knott, and N. Mills1997. Analysis of the elastic properties of open-cell foams with tetrakaidec-ahedral cells. Journal of the Mechanics and Physics of Solids, 45(3):319–343.
132

Appendix A
Detailed FEA simulationresults for the lattice structures
Table A.1 shows the result for the cubic lattice structure which contains therelative Young’s modulus, relative shear modulus and relative strength infunction of the relative density for 0◦ and 45◦ angle positions.
Table A.1: Relative Young’s modulus and relative strength for cubic latticestructure compression and shear test at 0◦ and 45◦ angle
Table A.2 shows the result for the octet-truss lattice structure whichcontains the relative Young’s modulus, relative shear modulus and relativestrength in function of the relative density.
133

Appendix A. Detailed FEA simulation results for the lattice structures
Table A.2: Relative Young’s modulus and relative strength for octet-trusslattice structure compression and shear test at 0◦ and 45◦ angle
Table A.3 shows the result for the hexa-truss lattice structure whichcontains the relative Young’s modulus, relative shear modulus and relativestrength in function of the relative density.
Table A.3: Relative Young’s modulus and relative strength for hexa-trusslattice structure compression and shear test at 0◦ and 45◦ angle
Table A.4 shows the result for the open-cell foam lattice structure which
134

Appendix A. Detailed FEA simulation results for the lattice structures
contains the relative Young’s modulus, relative shear modulus and relativestrength in function of the relative density for tests in 0◦ and 45◦ positionangles.
Table A.4: Relative Young’s modulus and relative strength for open-celllattice structure compression and shear test at 0◦ and 45◦ angle
135

Appendix B
Skeleton model points, lines,sections and joints lists
Table B.1: Elementary octet-truss structure: Point and line list
136
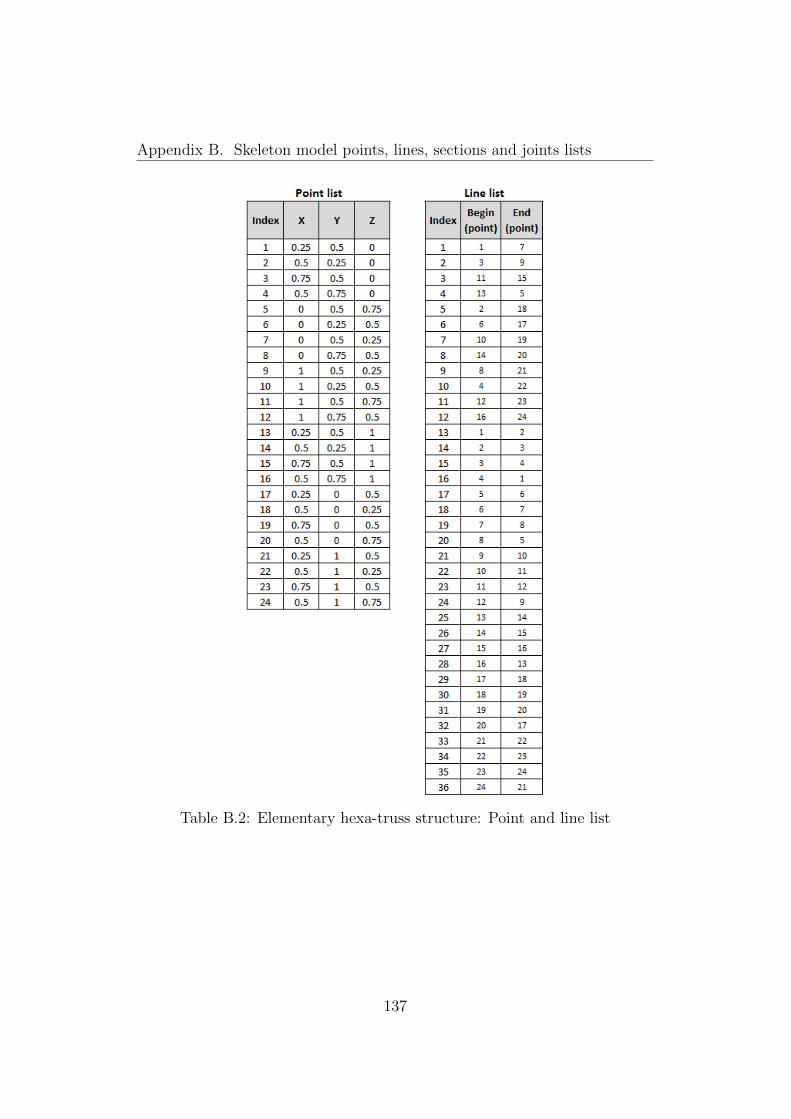
Appendix B. Skeleton model points, lines, sections and joints lists
Table B.2: Elementary hexa-truss structure: Point and line list
137
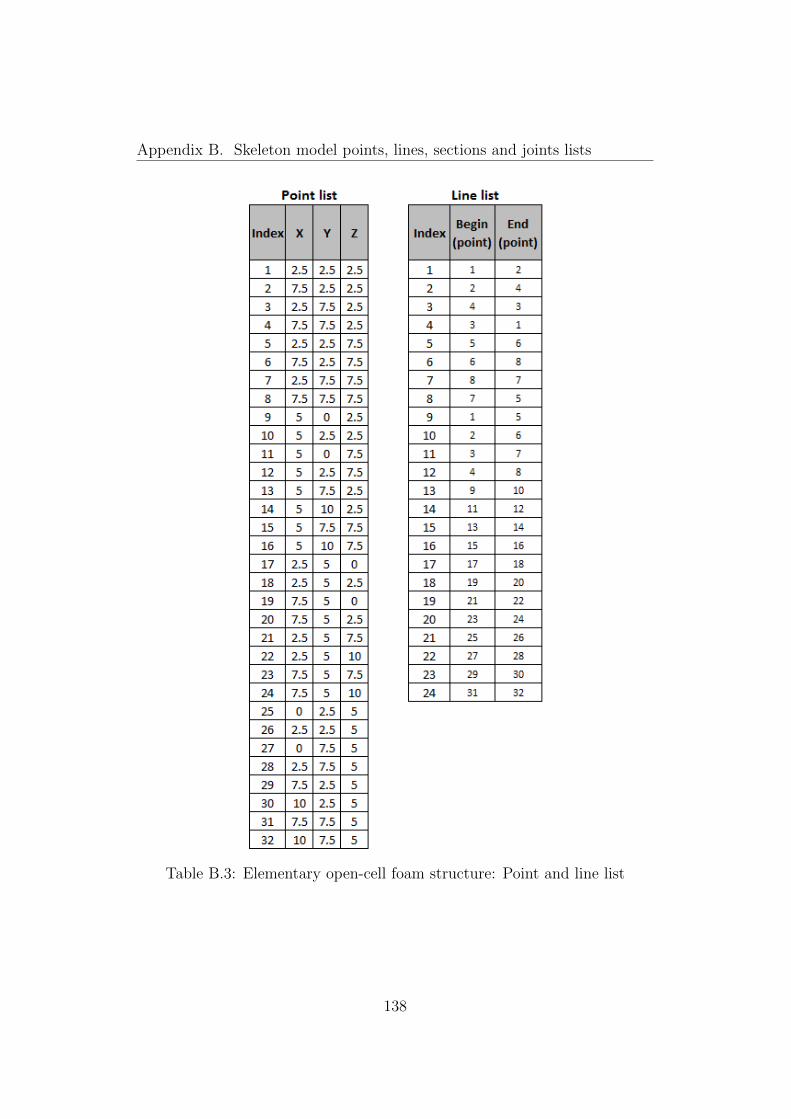
Appendix B. Skeleton model points, lines, sections and joints lists
Table B.3: Elementary open-cell foam structure: Point and line list
138

Appendix B. Skeleton model points, lines, sections and joints lists
Table B.4: 3 x 3 x 3 unit cubic lattice structure with with a pitch size of one
139
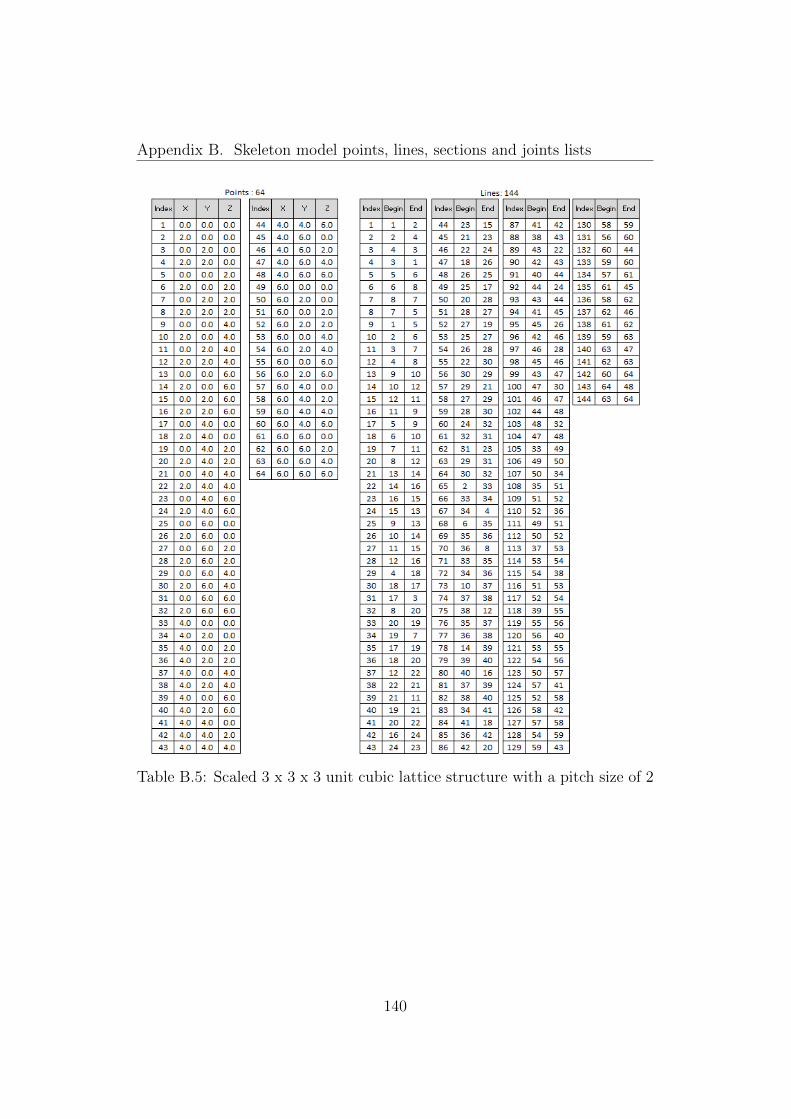
Appendix B. Skeleton model points, lines, sections and joints lists
Table B.5: Scaled 3 x 3 x 3 unit cubic lattice structure with a pitch size of 2
140

Appendix B. Skeleton model points, lines, sections and joints lists
Table B.6: Scaled 3 x 3 x 3 unit cubic lattice structure with gradient elemen-tary structures
141

Appendix B. Skeleton model points, lines, sections and joints lists
Table B.7: Conformal cubic lattice structure with non-parallel upper andlower boundaries
142

Appendix B. Skeleton model points, lines, sections and joints lists
Table B.8: Conformal cubic lattice structure with parallel upper and lowerboundaries
143

Appendix B. Skeleton model points, lines, sections and joints lists
Table B.9: Output point and line list
144

Appendix B. Skeleton model points, lines, sections and joints lists
Table B.10: Output section and join shape list
145

Appendix B. Skeleton model points, lines, sections and joints lists
Figure B.1: Lattice structure generator user interface created to create latticestructures
Figure B.1 shows the graphic user interface of the program created. Theinput information is entered by the user in the user interface. For example,the dimension of the elementary and lattice units, the maths formula tocreate progressive lattice structure and the lattice structure pattern.
A proposal of the complete lattice structure generator user interface whichcontains all the input information is illustrated in figure B.2. This proposalis for future works to import the design space and create conformal latticestructures.
Figure B.2: Proposal of lattice structure generator user interface to createlattice structures
146

Abstract
It is now possible to manufacture metallic lattice structures easily with addi-tive manufacturing. Lattice structures can be used to produce high strengthlow mass parts. However, it does not exist a method to design lattice struc-tures for additive manufacturing. The thesis addressed the following researchquestions: Why are lattice structures so little used in part designs? Whatare the information necessary to help designers to design parts containinglattice structures? How can lattice structures be created quickly and easilyin CAD? The main contributions are the evaluation of current CAD toolsin terms of human machine interface, CAD file formats, CAE and CAM todesign lattice structures, a new lattice structure design strategy, a method-ology to create equivalent materials, the determination of the main latticestructure geometrical characteristics and a new skeleton model to define lat-tice structures with points, lines, sections and joints instead of surfaces andvolumes.Key words: Lattice structures, Design, CAD, Additive manufacturing
Resume
Il est maintenant possible de fabriquer des structures treillis metalliquesfacilement avec la fabrication additive. Les structures en treillis peuventetre utilisees pour produire des pieces de faible masse et de haute resistance.Il n’existe pas de methode de conception pour les structures treillis. La thesea aborde les questions de recherche suivantes: Pourquoi les structures treillissont-elles si peu utilisees dans la conception? Quelles sont les informationsnecessaires pour aider les concepteurs a concevoir des pieces contenant desstructures treillis? Comment les structures treillis peuvent-elles etre creeesrapidement et facilement dans le CAO? Les contributions principales sontl’evaluation des outils CAO actuels dans la conception des structures treil-lis en termes d’interface homme machine, de formats de fichiers CAO et deFAO pour la fabrication d’additive, une nouvelle strategie de conception destructures treillis, une methodologie pour calculer des proprietes materiauequivalent, determination des caracteristiques geometriques principales desstructures treillis a partir de points, de lignes, de sections et de connexions aulieu des surfaces et des volumes et une methode pour visualiser et decouperles structures treillis a partir du modele squelette.Mots cles: Structure treillis, Conception, CAO, Fabrication Additive