Mechanisms of Wave Fractionation at Boundaries of High-Frequency Excitation in the Posterior Left...
8
Mechanisms of Wave Fractionation at Boundaries of High-Frequency Excitation in the Posterior Left Atrium of the Isolated Sheep Heart During Atrial Fibrillation Jérôme Kalifa, MD*; Kazuhiko Tanaka, MD*; Alexey V. Zaitsev, PhD; Mark Warren, PhD; Ravi Vaidyanathan, MS; David Auerbach, MS; Sandeep Pandit, PhD; Karen L. Vikstrom, PhD; Robert Ploutz-Snyder, PhD; Arkadzi Talkachou, MS; Felipe Atienza, MD, PhD; Gérard Guiraudon, MD; José Jalife, MD; Omer Berenfeld, PhD Background—High-frequency fractionated electrograms recorded during atrial fibrillation (AF) in the posterior left atrium (PLA) and elsewhere are being used as target sites for catheter ablation. We tested the hypothesis that highly periodic electric waves emerging from AF sources at or near the PLA give rise to the most fractionated activity in adjacent locations. Methods and Results—Sustained AF was induced in 8 isolated sheep hearts (0.5 mol/L acetylcholine). Endocardial videoimaging (DI-4-ANEPPS) and electric mapping of the PLA enabled spatial characterization of dominant frequencies (DFs) and a regularity index (ratio of DF to total power). Regularity index showed that fractionation was lowest within the area with the maximal DF (DFmax domain; 0.190.02) and highest within a band of 3 mm (0.160.02; P0.047) at boundaries with lower-frequency domains. The numbers of spatiotemporal periodic episodes (25.92.3) and rotors per experiment (1.90.7) were also highest within the DFmax domain. Most commonly, breakthrough waves at the PLA traveled toward the rest of the atria (76.88.1% outward versus 23.28.1% inward; P0.01). In both experiments and simulations with an atrial ionic model, fractionation at DFmax boundaries was associated with increased beat-to-beat variability of conduction velocity and directionality with wavebreak formation. Conclusions—During stable AF, the PLA harbors regular, fast, and highly organized activity; the outer limit of the DFmax domain is the area where the most propagation pattern variability and fractionated activity occur. These new concepts introduce a new perspective in the clinical use of high-frequency fractionated electrograms to localize sources of AF precisely at the PLA and elsewhere. (Circulation. 2006;113:626-633.) Key Words: atrium fibrillation Fourier analysis mapping C atheter ablation for atrial fibrillation (AF) was focused initially on pulmonary vein (PV) isolation. 1,2 More re- cently, various alternative ablative strategies, surgical or those that use radiofrequency catheter delivery at or near the posterior wall of the left atrium (LA), have proved successful. 1,3– 6 In particular, 2 studies have emphasized the possibility of using frequency and fractionation analyses of intra-atrial electrograms as guidance for ablation of AF sources. 6,7 The justification for such studies is the apparent disruption of the AF substrate associated with assumed dominant rotors in the LA and right atrium as suggested by high-frequency complex fractionated atrial electrograms (CFAEs) during mapping of AF. 6 CFAEs were found in several areas of the atria but were confined primarily to the interatrial septum, PVs, and LA roof. 6 However, the relation between local frequency, AF wave propagation patterns, and electrogram fractionation was not adequately explored. Clinical Perspective p 633 Previously, we introduced the technique of dominant frequency (DF) mapping to characterize the spatial distribution of excitation frequencies during AF. 8,9 This approach allowed accurate identifi- cation of sites of periodic activity and the demonstration that stable, localized, high-frequency sources were responsible for AF mainte- nance in the isolated sheep heart. The highest DF was most often (80%) localized to the posterior LA (PLA), near or at a PV ostium. In addition, using high-resolution videoimaging, we demonstrated that such sources corresponded to fast vortexlike reentry around minuscule cores (microreentry) 8 that resulted in a large dispersion of frequencies throughout the atria during AF. Importantly, the areas Received July 12, 2005; revision received November 17, 2005; accepted December 2, 2005. From the Institute for Cardiovascular Research, Department of Pharmacology, SUNY Upstate Medical University, Syracuse, NY (J.K., K.T., A.V.Z., M.W., R.V., D.A., S.P., K.L.V., R.P.-S., A.T., J.J., O.B.); Hospital General Universitario Gregorio Marañón, Madrid, Spain (F.A.); and Canadian Surgery Technologies and Advanced Robotics, University of Western Ontario, London, Ontario, Canada (G.G.). *Drs Kalifa and Tanaka contributed equally to this article. The online-only Data Supplement can be found at http://circ.ahajournals.org/cgi/content/full/113/5/626/DC1. Correspondence to Omer Berenfeld, PhD, Institute for Cardiovascular Research, SUNY Upstate Medical University, 750 E Adams St, Syracuse, NY 13210, E-mail [email protected] © 2006 American Heart Association, Inc. Circulation is available at http://www.circulationaha.org DOI: 10.1161/CIRCULATIONAHA.105.575340 626
Transcript of Mechanisms of Wave Fractionation at Boundaries of High-Frequency Excitation in the Posterior Left...

Mechanisms of Wave Fractionation at Boundaries ofHigh-Frequency Excitation in the Posterior Left Atrium of
the Isolated Sheep Heart During Atrial FibrillationJérôme Kalifa, MD*; Kazuhiko Tanaka, MD*; Alexey V. Zaitsev, PhD; Mark Warren, PhD;
Ravi Vaidyanathan, MS; David Auerbach, MS; Sandeep Pandit, PhD; Karen L. Vikstrom, PhD;Robert Ploutz-Snyder, PhD; Arkadzi Talkachou, MS; Felipe Atienza, MD, PhD;
Gérard Guiraudon, MD; José Jalife, MD; Omer Berenfeld, PhD
Background—High-frequency fractionated electrograms recorded during atrial fibrillation (AF) in the posterior left atrium (PLA) andelsewhere are being used as target sites for catheter ablation. We tested the hypothesis that highly periodic electric waves emergingfrom AF sources at or near the PLA give rise to the most fractionated activity in adjacent locations.
Methods and Results—Sustained AF was induced in 8 isolated sheep hearts (0.5 �mol/L acetylcholine). Endocardialvideoimaging (DI-4-ANEPPS) and electric mapping of the PLA enabled spatial characterization of dominantfrequencies (DFs) and a regularity index (ratio of DF to total power). Regularity index showed that fractionation waslowest within the area with the maximal DF (DFmax domain; 0.19�0.02) and highest within a band of �3 mm(0.16�0.02; P�0.047) at boundaries with lower-frequency domains. The numbers of spatiotemporal periodic episodes(25.9�2.3) and rotors per experiment (1.9�0.7) were also highest within the DFmax domain. Most commonly,breakthrough waves at the PLA traveled toward the rest of the atria (76.8�8.1% outward versus 23.2�8.1% inward;P�0.01). In both experiments and simulations with an atrial ionic model, fractionation at DFmax boundaries wasassociated with increased beat-to-beat variability of conduction velocity and directionality with wavebreak formation.
Conclusions—During stable AF, the PLA harbors regular, fast, and highly organized activity; the outer limit of the DFmaxdomain is the area where the most propagation pattern variability and fractionated activity occur. These new conceptsintroduce a new perspective in the clinical use of high-frequency fractionated electrograms to localize sources of AFprecisely at the PLA and elsewhere. (Circulation. 2006;113:626-633.)
Key Words: atrium � fibrillation � Fourier analysis � mapping
Catheter ablation for atrial fibrillation (AF) was focusedinitially on pulmonary vein (PV) isolation.1,2 More re-
cently, various alternative ablative strategies, surgical or thosethat use radiofrequency catheter delivery at or near the posteriorwall of the left atrium (LA), have proved successful.1,3–6 Inparticular, 2 studies have emphasized the possibility of usingfrequency and fractionation analyses of intra-atrial electrogramsas guidance for ablation of AF sources.6,7 The justification forsuch studies is the apparent disruption of the AF substrateassociated with assumed dominant rotors in the LA and rightatrium as suggested by high-frequency complex fractionatedatrial electrograms (CFAEs) during mapping of AF.6 CFAEswere found in several areas of the atria but were confinedprimarily to the interatrial septum, PVs, and LA roof.6 However,the relation between local frequency, AF wave propagation
patterns, and electrogram fractionation was not adequatelyexplored.
Clinical Perspective p 633Previously, we introduced the technique of dominant frequency
(DF) mapping to characterize the spatial distribution of excitationfrequencies during AF.8,9 This approach allowed accurate identifi-cation of sites of periodic activity and the demonstration that stable,localized, high-frequency sources were responsible for AF mainte-nance in the isolated sheep heart. The highest DF was most often(80%) localized to the posterior LA (PLA), near or at a PV ostium.In addition, using high-resolution videoimaging, we demonstratedthat such sources corresponded to fast vortexlike reentry aroundminuscule cores (microreentry)8 that resulted in a large dispersion offrequencies throughout the atria during AF. Importantly, the areas
Received July 12, 2005; revision received November 17, 2005; accepted December 2, 2005.From the Institute for Cardiovascular Research, Department of Pharmacology, SUNY Upstate Medical University, Syracuse, NY (J.K., K.T., A.V.Z., M.W., R.V.,
D.A., S.P., K.L.V., R.P.-S., A.T., J.J., O.B.); Hospital General Universitario Gregorio Marañón, Madrid, Spain (F.A.); and Canadian Surgery Technologies and AdvancedRobotics, University of Western Ontario, London, Ontario, Canada (G.G.).
*Drs Kalifa and Tanaka contributed equally to this article.The online-only Data Supplement can be found at http://circ.ahajournals.org/cgi/content/full/113/5/626/DC1.Correspondence to Omer Berenfeld, PhD, Institute for Cardiovascular Research, SUNY Upstate Medical University, 750 E Adams St, Syracuse, NY 13210, E-mail
[email protected]© 2006 American Heart Association, Inc.
Circulation is available at http://www.circulationaha.org DOI: 10.1161/CIRCULATIONAHA.105.575340
626

harboring the microreentrant sources were shown to be highlyregular10 and spatiotemporally organized.11 Fractionated activityand complex electrograms were identified mainly at boundariesseparating different frequency domains,12 eg, between the area of1:1 activation by the microreentrant source and a neighboringlower-frequency domain. Here, we analyze optical and electrogramrecordings at the endocardial surface of the PLA of the isolatedsheep heart to provide insight into the mechanisms underlyinghigh-frequency CFAEs during AF.6 We tested the hypothesis thathighly periodic electric waves emerging from AF sources at or nearthe PLA give rise to the most fractionated activity in adjacentlocations, which would explain the relatively high success of usingCFAEs to guide AF ablation therapy.
MethodsIsolated Heart PreparationAnimals were used according to NIH guidelines. Eight sheep (15 to 25 kg)were anesthetized with sodium pentobarbital (35 mg/kg IV). Hearts wereremoved, placed in cold cardioplegic solution, connected to a Langendorffapparatus, and continuously perfused at 200 mL/min with 36°C to 38°CTyrode’s solution (pH 7.4; 95% O2, 5% CO2). A minimal surgical cut wasmade in the LA appendage (LAA), avoiding any visible coronary branches.In Figure 1A, the lines of incision are shown in a representative example. InFigure 1B, the mapped area includes the 4 PV ostia and their junction withthe endocardial wall of the PLA.
Fibrillation and MappingSustained AF (�5 minutes) was induced by burst pacing in the continuouspresence of acetylcholine (0.5 �mol/L) in the perfusate. An area of �5 cm2
of the endocardial surface of the PLA was mapped with a CCD camera(128�128 pixels, 300 frames per second, 5-second movies) and a poten-tiometric dye (DI-4-ANEPPS) as detailed elsewhere.11 We obtained 1movie per minute for 5 minutes for every experiment. For validation, in 2experiments (7 and 8), we also recorded bipolar electrograms from the PLAimmediately after (experiment 7) or simultaneously with (experiment 8) theoptical movies. In addition, in all experiments, bipolar electrograms wererecorded continuously from the septal portion of Bachmann’s bundle (BB)and at the right atrial appendage (RAA).
Spectral and Fractionation AnalysesSpectral and fractionation analyses of optical and electric signals wereperformed on their power spectra obtained by a fast Fourier transformation.A DF corresponding to the highest peak in the power spectrum in the rangeof 1 to 30 Hz and with a resolution of �0.24 Hz was determined for eachsignal. Thus, the DFs of all pixels were used to generate a DF map of thefield of view for each movie. Thereafter, the 6 DF maps of each movie inan experiment were superimposed to construct an averaged color-coded DFmap for that experiment.12 The average map included all DF valuesbetween 1 and 30 Hz. The area with the maximal DF (DFmax domain) wasdefined as the area corresponding to the highest DF in that map. Boundaryof DFmax was set as (DFmax-1). In addition, the power spectrum was usedto quantify the fractionation of the signals, as shown in Figure 1C (right).For each signal, a regularity index (RI) was defined as the ratio of the powerat the DF to total power.13 The power at the DF was calculated by summingthe power values at the highest peak and its adjacent values (fixed band of�0.75 Hz), and the total power was calculated as the sum over the range of1 to 30 Hz. Average maps of RI were constructed like the DF maps.Furthermore, conventional parameters of signals variability and complexitydescribing fractionated activity were quantified for each pixel in each movieas follows. Movies were band pass filtered at 1 to 30 Hz. As illustrated inFigure 1C (left), for each pixel, we subtracted the average value of thesignal. The time markers of the zero crossing on the fluorescent signalindicated the span of the positive and negative halves of the action potentials(APs). The amplitude of each AP was assigned on the basis of the differencebetween the most positive and most negative fluorescence values for eachhalf above and below the zero line (Figure 1C, short horizontal lines). Thenumber of deflections (DFLs; asterisks) was counted as the number ofchanges in slope in each half. For example, in the top tracing of Figure 1C(left), each half has 1 change in slope (positive to negative or vice versa)between its zero-crossing flanking points, whereas in the bottom tracing, thenumber of changes in slope is �1 for some halves. Then, the variability ofthe signal was quantified as the coefficient of variation in amplitude(COVAMP; SD/mean amplitude), and the complexity of the signal wasquantified as the average DFL per impulse. In 6 movies per experiment, wecompared the values of RI, COVAMP, and DFL inside and outside theDFmax area.
Propagation Pattern AnalysisThe number, patterns, and locations of spatiotemporally periodicwaves and of rotating waves were evaluated. Details of the analysisare presented in the online-only Data Supplement.
Directionality AnalysisThe directionality of activation was analyzed for each pixel as follows. Allactivation times were determined at 50% of the upstroke of the optical AP.The vector bilinear best fit was used on a 5�5-pixel window(�1.25�1.25 mm2) to obtain the directions of propagation in 30° bins.14
The recurrence of the predominant direction (RPD) was calculated from theratio of the number of activations in the predominant direction to the totalnumber of activations.14
Computer SimulationsWe used a 5�5-cm2 model with realistic atrial kinetics with heterogeneousIK,ACh density in the presence of 0.1 �mol/L acetylcholine.15 Details of themodel are presented in the online-only Data Supplement.
Statistical AnalysisTo compare RI, COVAMP, and DFL values for regions inside andoutside the DFmax area (see Spectral and Fractionation Analysis
Figure 1. Atrial preparation and fractionation analysis. A, LA freewall with lines of incision. B, Exposure of the mapped PLA. The4 PV ostia are visualized. C, Diagram of fractionation analysis.Left, Traces with horizontal lines marking the most positive andnegative amplitudes used to calculate COVAMP; asterisks indi-cate deflections used for DFL calculation. Right, Power spectrawith DF values (�) and total power (red area under the curves)used for RI calculation (DF power/total power). D, Maximal DFat PLA, BB, and RAA. RSPV indicates right superior PV; RIPV,right inferior PV; LSPV, left superior PV; and LIPV, left inferiorPV. *P�0.005 vs BB and RAA.
Kalifa et al Fractionation at the Posterior Left Atrium 627

section), the data were submitted to a 2 (region; inside or outside)�6(time; T1 through T6) dependent-measures ANOVA, setting 2-tailed� to 0.05. We anticipated significant region differences, nonsignif-icant time effects, and no significant region-by-time interactioneffect, confirming our hypothesis that the region effects are consis-tent and uniform over the 5-minute time span. We used Mauchley’stest of sphericity on our repeated observations and interpretedHuynh-Feldt–adjusted significance values in cases in which our datarequired corrections for nonsphericity. Frequency data also werecompared by use of a dependent-measures ANOVA, with 2-tailed��0.05. In this analysis, we used a priori contrasts comparingfrequency data in the DFmax area with those in the BB and RAAregions. Our comparisons of predominant wave directions also useda dependent-measures ANOVA statistic with a priori contrastscomparing the most dominant direction to the second- and third-most-dominant directions.
ResultsPosterior LA Harbors the Highest DFFigure 1D shows that in 8 experiments the DFmax was significantlyhigher at the PLA endocardium than at the BB and RAA (18.6�1.0versus 14.3�0.8 and 13.9�1.2 Hz, respectively). Indeed, ANOVAcomparisons supported our prediction of higher frequencies at thePLA. The overall effect was significant (P�0.006), and moreimportantly, a priori contrasts comparing PLA with BB and RAADFmax values were also significant (P�0.006 and P�0.007,respectively). Notably, those DFmax values were consistent withthose obtained previously in intact isolated hearts with epicardialrecordings,8,9,11,16,17 indicating appropriate perfusion conditions.
Rate and Regularity in the PLAAverage DF maps were obtained from 6 movies (5 minutes of AF)for each of the 8 experiments. In general, the pixels with DFmax(red end of the color scale; see Figure 2) spanned �36�10% of thefield of view in the PLA (1.8�0.5 cm2 of �5 cm2). On average, theDFmax domain extended over 1.75�0.25 PV ostia (range, 1 to 3;left inferior PV, 6 of 8 experiments; left superior PV, 5 of 8; RIPV,2 of 8; and right superior PV, 1 of 8).
In Figure 2A, we present 3 single-pixel optical APs, along withtheir power spectra. Figure 2B shows the corresponding DF (left)and RI (right) maps. The APs were obtained from 3 different areaswithin the highest-frequency domain (red) in which a spatiotempo-rally periodic wave occurred as a breakthrough at the site of highestRI (pixel 1). Thus, all 3 locations show the same dominantfrequency (�20 Hz) in their power spectra. However, as clearlyillustrated in the RI map (Figure 2B, right), the 3 showed apprecia-bly different degrees of AP fragmentation from the center to theperiphery of the DFmax domain. Location 1 (red) was the mostregular, followed by 2 and then 3. This was reflected by thepresence of additional frequency peaks in the power spectra andlower RI values in locations 2 and 3. Thus, during stable AF, thehighest degree of fractionation of the optical signal occurs at theedge of the highest-frequency domain.
To determine whether a similar relationship between localfrequency and regularity could be identified through electric ratherthan optical recordings, we placed bipolar electrodes at locations 1through 3 in the same experiment as that shown in Figure 2. Theelectrograms illustrated in Figure 2C were obtained about 20minutes after the optical movies. At this time, all 3 bipolarelectrograms showed a slightly lower frequency (�16 Hz) thanbefore. However, the spatial distribution of regularity was qualita-
tively and quantitatively the same as that shown by the earlieroptical recordings. Again, location 1 shows the highest RI, withgradual reductions toward locations 2 and 3. Similar results wereobtained in another experiment (data not shown), in which opticaland bipolar electrogram data were obtained simultaneously. Com-parison of 2 locations showed that the values of DF were similarwith both techniques (17.6 and 13.7 Hz for optical and 16.9 and14.9 Hz for electric for locations 1 and 2, respectively). The RIvalues were higher at the high-DF location (0.9 and 0.58 for opticaland electric, respectively) than at the low-DF location (0.4 in bothoptical and electric). As confirmed below, a striking commonfeature in all our experiments is that the area of the DFmax alwaysencompasses the highest-RI signals at the PLA.
Patterns of PropagationWe quantified the properties of waves traveling in the DFmaxdomain to determine its role in the maintenance of AF.8,18 InFigure 3A, 3 sequential isochronal maps show highly periodicactivity emanating as a breakthrough and propagating from
Figure 2. Optical and electrogram fractionation. A, Representativepixel recordings at locations 1, 2, and 3 (right to left). B, DF (left)and RI (right) maps for the same movie. C, Simultaneous bipolarelectrograms obtained 20 minutes after optical recording at sites 1,2, and 3. Note a similar increase in fractionation (ie, a decrease inRI) in both optical and electric signals from locations 1 to 3.
628 Circulation February 7, 2006

the fastest and most regular region on the right side of thefield of view (lateral; dark blue) toward the left side (septal;red). As shown by the DF and RI maps in Figure 3B and 3C,respectively, the septal side demonstrated slower and morefractionated activity. In every experiment, a dominant prop-
agation pattern could be identified on the PLA, resulting inhigh spatiotemporal organization. Therefore, in Figure 3D, awave-by-wave directionality analysis was carried out afterclassifying the breakthrough waves as traveling in any of the4 major directions (see inset). Comparing the number ofwaves in each direction in 8 experiments, an ANOVAcomparison of the 3 most dominant wave directions revealeda significant overall effect (P�0.002), and a priori contrastsshowed that direction I had a significantly higher number ofwaves than either direction II or III (P�0.03 and P�0.009,respectively). Overall, the average number of independentspatiotemporally periodic waves was 25.9�2.3, and theaverage total number of rotors lasting �1 rotation was1.9�0.7 per experiment, each of them lasting 1.5�0.1rotations. The most common pattern of activation was that ofbreakthroughs generating impulses traveling from the PLAtoward the rest of the atria (76.8�8.1% traveling outwardversus 23.2�8.1% traveling inward; P�0.01).
Local Activation Rate and FractionationPixel-by-pixel quantification of the local RI enabled us todetermine the spatial relation between DF and regularity.Figure 4A and 4B shows the DF and RI maps, respectively,from 1 experiment. The outline of the outer boundaries of theDFmax allows clear appreciation of the high RI inside theDFmax. RI decreases very rapidly at the boundaries of theDFmax domain but then increases again toward the peripheryof the field of view. This is confirmed by the single-pixelrecordings sampled from 3 different regions (points 1, 2, and3). Although the activation frequency decreases from point 1to 2 and then 3, RI decreases from point 1 to 2 but thenincreases at point 3, which corresponds to the lowest DFamong all 3 points. Figure 4C depicts the relation between DFand RI for all pixels in the same experiment. A clear biphasicrelation is observed. The vertical dashed line corresponds tothe DFmax boundary. It indicates that the minimum RI, ie,the maximum fractionation, occurs at frequencies below theDFmax. At very low frequencies, RI again increases.
Figure 4. Relation between frequency and fractionation. A, AverageDF map. B, Average RI map. C, Signals from locations 1 to 3. D,Biphasic relationship between DF and RI. Dashed line indicates limitof DFmax domain; arrowhead, predominant direction of propagation.
Figure 3. Recurrence in AF wave direc-tionality. A, Consecutive activation mapsshowing a spatiotemporally periodicwave propagating from left PVs to therest of the PLA (white arrows). B, Aver-age DF map. C, Average RI map. Area ofhighest RI is enclosed in the DFmaxdomain. RI diminishes along the predom-inant direction of AF wave propagation.D, Wave-by-wave directionality analysisof breakthroughs at the PLA. Break-throughs were classified according todirection (see inset and text). For eachdirection, the number of waves is nor-malized to the number at the preferentialdirection in each experiment. *P�0.03and P�0.009 vs directions (Dir) II and III,respectively.
Kalifa et al Fractionation at the Posterior Left Atrium 629

Impulse Variability and FractionationWe also used standard parameters of signal fractionation to quantifythe variability in the amplitude of the optical signals and their DFLs.Figure 5 presents maps of 5-minute average COVAMP (Figure 5A)and DFL (Figure 5B) from the same experiment as in Figure 4. Thesuperimposed DFmax outline adapted from Figure 4A demon-strates that both COVAMP and DFL are higher outside than insidethe DFmax area. As such, COVAMP and DFL values werenegatively correlated with both RI values (R��0.17 andR��0.10; P�0.05 and P�0.01, respectively) and DF values(R��0.37 and R��0.32; P�0.05 and P�0.09, respectively).Figure 5C and 5D shows quantitative data for 8 experiments.Analysis of RI, COVAMP, and DFL establishes that the degree offractionation of the AF signals is smallest inside the fastest-activating region of the PLA. We observed significantly higher RI,lower COVAMP, and lower DFL inside than outside the DFmaxarea (RI, 0.19�0.03 versus 0.15�0.02, P�0.047; COVAMP,0.81�0.19 versus 1.08�0.22, P�0.004; DFL, 1.67�0.22 versus2.09�0.22, P�0.004 [mean�SE]). Confirming our hypotheses, the2 (region)�6 (time) ANOVAs on RI, COVAMP, and DFLoutcomes revealed only significant region effects, with nonsignifi-cant time effects and no region-by-time interaction effects, indicat-ing that region differences are consistent over time (see StatisticalAnalysis).
Fractionation and Impulse PropagationThe incidence of wavebreaks and directionality at each pixel weremeasured as illustrated in Figure 6. Figure 6A shows a DF map inwhich the outer limit of the DFmax area is outlined by the dashedcurve and the general direction of wave propagation (arrow) isoutward of that domain. Singularity points corresponding to sites ofwavebreaks also are noted (circles) and seen to cluster primarily onan �3-mm rim around the DFmax domain, ie, where RI is minimal.In all experiments, 92.1�3% singularity points localized within that
rim. Figure 6B shows an average map, color-coded for percentagerecurrence of local predominant direction (RPD; see Material andMethods). Here, the inner solid line shows the limit of the DFmaxdomain; the outer dashed line limits the area of low RPD. Althoughon average the RPD was not different between inside and outsidethe DFmax area (33.8�0.9% versus 32.8�0.6%; P�NS), in 5 of 8experiments, it was possible to identify a rim at the outer limit of theDFmax frequency domain in which the direction of propagationchanged more frequently on a beat-to-beat basis than elsewhere.This rim coincided with the area of lowest RI.
Computer SimulationsTo provide additional insight into the mechanisms underlyinglocal fractionation during AF without the confounding effectsof the complex atria, we used a numerical approach. Figure7A shows a snapshot of a simulation in a 2D sheet. Stablereentry in the upper half of the sheet acted as the high-frequency source of fibrillatory waves that propagated towardthe bottom of the sheet with a slightly different angle on theright and left sides of the sheet (see movie in the online-onlyData Supplement). The DF map in Figure 7B, correspondingto 4 seconds of simulation, shows 3 frequency domains: Inthe upper half, a 21.7-Hz frequency domain (DFmax)matches the rotor frequency; in the lower half, domains of13.2 and 12.7 Hz reflecting complex propagation patternswere identified. In Figure 7C, except for the center ofrotation, the highest-RI region coincides with the DFmaxdomain. Figure 7D shows a profile of RI along the verticalline in Figure 7C. It reveals an area of very low regularityalong a narrow band between the DFmax and the lower-DFdomains. This correlates highly with the AP recordings inFigure 7E, obtained from locations 1 through 4 in the sheet.Clearly, activity in the DFmax domain is highly organized,whereas fragmentation (low RI) occurs at the boundary withthe lower-frequency domains. Concomitantly, the phase sin-gularities were clustered close to the limit between DFmaxand low-DF domains (see Figure 7C). However fragmenta-tion is again reduced (ie, increased RI) at the low-frequencydomain, distant from the interface with the DFmax domain.
In Figure 8, we present 15 consecutive local activation mapsfrom 3 sites during the same simulation. Figure 8A shows activationmaps from site 1 where directionality is highly recurrent (RPD,
Figure 5. Signal fractionation parameters. A, Average COVAMPmap. B, Average DFL map. COVAMP and DFL are minimalinside the DFmax domain (dashed line; same experiment as inFigure 4). C–E, In 8 experiments, average RI values were signifi-cantly higher inside than outside the DFmax domain (*P�0.047).The reverse was true for COVAMP and DFL (*P�0.004).
Figure 6. Pixel-by-pixel directionality analysis. A, DF map. B,Average RPD map for the same experiment shows sharpdecrease of RPD around the limit of DFmax domain. Inner solidline indicates limit of the DFmax domain. Area between the solidand dashed lines shows low RPD. Arrow shows the generaldirection of wave propagation; circles, phase singularities corre-sponding to wavebreak sites.
630 Circulation February 7, 2006
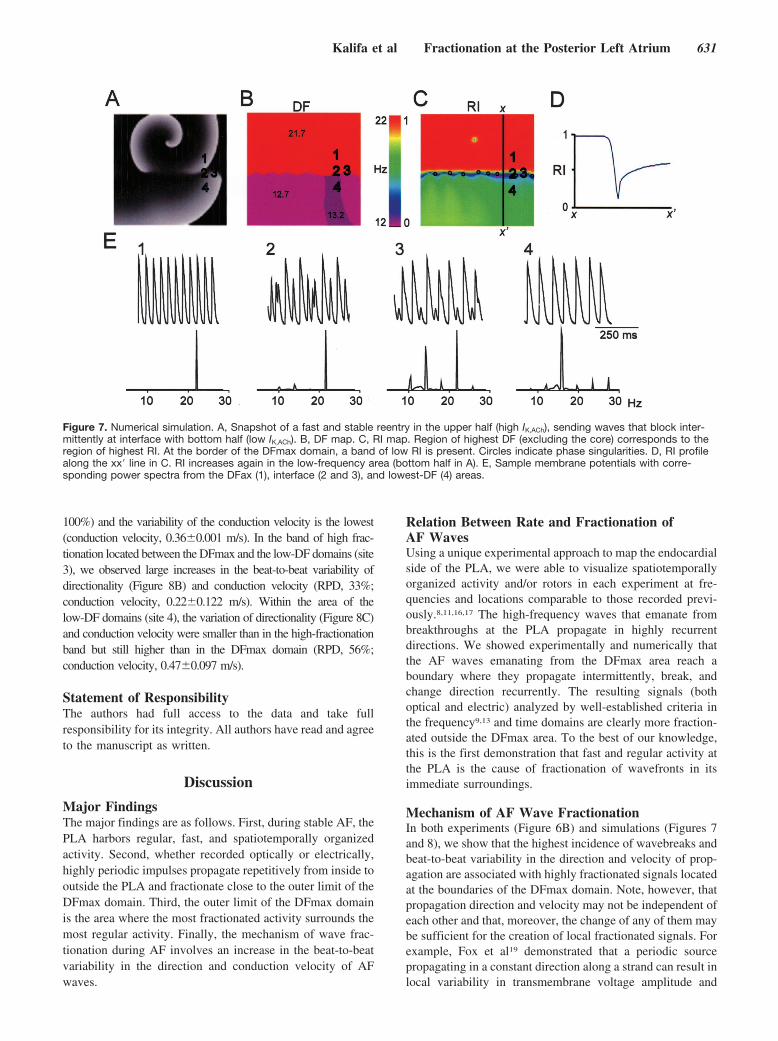
100%) and the variability of the conduction velocity is the lowest(conduction velocity, 0.36�0.001 m/s). In the band of high frac-tionation located between the DFmax and the low-DF domains (site3), we observed large increases in the beat-to-beat variability ofdirectionality (Figure 8B) and conduction velocity (RPD, 33%;conduction velocity, 0.22�0.122 m/s). Within the area of thelow-DF domains (site 4), the variation of directionality (Figure 8C)and conduction velocity were smaller than in the high-fractionationband but still higher than in the DFmax domain (RPD, 56%;conduction velocity, 0.47�0.097 m/s).
Statement of ResponsibilityThe authors had full access to the data and take fullresponsibility for its integrity. All authors have read and agreeto the manuscript as written.
Discussion
Major FindingsThe major findings are as follows. First, during stable AF, thePLA harbors regular, fast, and spatiotemporally organizedactivity. Second, whether recorded optically or electrically,highly periodic impulses propagate repetitively from inside tooutside the PLA and fractionate close to the outer limit of theDFmax domain. Third, the outer limit of the DFmax domainis the area where the most fractionated activity surrounds themost regular activity. Finally, the mechanism of wave frac-tionation during AF involves an increase in the beat-to-beatvariability in the direction and conduction velocity of AFwaves.
Relation Between Rate and Fractionation ofAF WavesUsing a unique experimental approach to map the endocardialside of the PLA, we were able to visualize spatiotemporallyorganized activity and/or rotors in each experiment at fre-quencies and locations comparable to those recorded previ-ously.8,11,16,17 The high-frequency waves that emanate frombreakthroughs at the PLA propagate in highly recurrentdirections. We showed experimentally and numerically thatthe AF waves emanating from the DFmax area reach aboundary where they propagate intermittently, break, andchange direction recurrently. The resulting signals (bothoptical and electric) analyzed by well-established criteria inthe frequency9,13 and time domains are clearly more fraction-ated outside the DFmax area. To the best of our knowledge,this is the first demonstration that fast and regular activity atthe PLA is the cause of fractionation of wavefronts in itsimmediate surroundings.
Mechanism of AF Wave FractionationIn both experiments (Figure 6B) and simulations (Figures 7and 8), we show that the highest incidence of wavebreaks andbeat-to-beat variability in the direction and velocity of prop-agation are associated with highly fractionated signals locatedat the boundaries of the DFmax domain. Note, however, thatpropagation direction and velocity may not be independent ofeach other and that, moreover, the change of any of them maybe sufficient for the creation of local fractionated signals. Forexample, Fox et al19 demonstrated that a periodic sourcepropagating in a constant direction along a strand can result inlocal variability in transmembrane voltage amplitude and
Figure 7. Numerical simulation. A, Snapshot of a fast and stable reentry in the upper half (high IK,ACh), sending waves that block inter-mittently at interface with bottom half (low IK,ACh). B, DF map. C, RI map. Region of highest DF (excluding the core) corresponds to theregion of highest RI. At the border of the DFmax domain, a band of low RI is present. Circles indicate phase singularities. D, RI profilealong the xx� line in C. RI increases again in the low-frequency area (bottom half in A). E, Sample membrane potentials with corre-sponding power spectra from the DFax (1), interface (2 and 3), and lowest-DF (4) areas.
Kalifa et al Fractionation at the Posterior Left Atrium 631

intermittent blockades. In addition, the shape of the imping-ing wavefront is likely to play a role in the homogeneity ofthe distribution of low RI values at the boundaries of theDFmax domain. This effect may explain the small differencesbetween the DF and RI distributions on the right and left sidesof the simulated maps in Figure 7. Indeed, Figure 7A showsthat a reentrant wavefront approaches the boundaries betweenDF domains at slightly different angles on right versus leftsides. In that regard, a hypothetical point source generatingthe activity would yield a slightly different RI distribution.Thus, the shape of the wavefront is an additional, albeit notindependent, factor controlling fractionation.
Mechanisms of AF MaintenanceAF maintenance has been suggested to depend on organizedmicroreentry, pacemaker, or triggered activity at thePLA.8,10,11,20 The consistent observation of high frequencyand spatiotemporally periodic waves in our experimentsstrongly supports the idea that AF in this model is maintainedby functional reentry. The most common pattern of endocar-
dial propagation in our study was that of a breakthrough, andthe reentrant activity observed at the endocardium wasshort-lived. Previous epicardial recordings in isolated sheephearts demonstrated that stable acetylcholine-induced AF wassustained by stable microreentrant sources located in the PLAwall near the PV ostia with an average core diameter�2 mm.8 Thus, breakthroughs in our study are likely to havereflected reentry with an intramural filament.21 Our simula-tion results also support the hypothesis that high-frequencyreentry might very well be the mechanism supporting frac-tionation at DFmax domain boundaries. Nevertheless, wecannot completely exclude the possibility of another sourcemechanism. We chose to simulate reentry as an illustration offast and stable source because, to the best of our knowledge,spontaneous pacemaker activity was not achievable at realis-tic experimental AF frequencies.
Clinical ImplicationsThe PLA is known to play a critical role in maintenance of AF inpatients.1,5,22 Recently, electrogram-based radiofrequency ablationprocedures have shown that frequency and/or fractionation criteriacould be used to achieve satisfactory AF ablation success rates.6,7
Nademanee et al6 could terminate AF in a high percentage ofpatients by delivering radiofrequency at sites harboring fast CFAEs.However, other approaches such as the anatomic3 and combined(anatomic and electrogram based23) methods have also provedeffective. As such, the role of electrogram-based criteria of AFablation has not been clearly established, and the electrophysiolog-ical mechanism and dynamics of fractionation of AF waves inpatients have not been elucidated. Our experimental and numericaldata describe the mechanism of fractionation of AF waves at thePLA. In fact, our results may help us to better understand the reasonfor the relatively high success rate of ablation procedures that usehigh-frequency CFAEs as the target for radiofrequency delivery.6
Clearly, it would be erroneous to infer from the radiofrequencyablation data that the DFmax domain itself is the area of highestfractionation. In addition, our data also show that the site wheremost fractionation occurs during AF coexists in the periphery of themost rapid and less fractionated area. Therefore, we surmise thatproducing a relatively large anatomic obstacle by radiofrequencyablation in the region of high fragmentation that bounds the DFmaxsite would increase the likelihood of AF termination. This wouldhappen because the ablation crater would form an effective wallagainst which the wavefront would collide head on and be annihi-lated. These new concepts introduce a new perspective in theclinical use of high-frequency CFAEs to localize sources of AF atthe PLA and elsewhere.
Study LimitationsThis study has a small size design (n�8). The properties ofthe substrate responsible for increased variability in velocityand direction of AF waves at the PLA have not been studied.It is reasonable to assume that the variability in direction ofmyocardial fibers24,25 and other ionic properties at the PLAmay have played a role. Finally, the fractionation propertiesof bipolar and unipolar recordings of the extracellular poten-tial may be different from those of the transmembranepotential, as measured by optical mapping technique. How-ever, data in Figure 2 and numerical simulations demonstrate
Figure 8. Directionality in numerical simulation. Vectorial best-fitanalysis shows direction of propagation for 15 sequential (left-to-right, top-to-bottom) activations at pixels 1, 3, and 4 (seeFigure 7). A, Pixel 1. No variability in directionality or conductionvelocity (see text; area of highest DF and RI). B, Pixel 3. Maxi-mum variability of directionality and conduction velocity (area oflowest RI). C, Pixel 4. Slightly reduced variability in conductionvelocity and directionality (area of intermediate RI). Color scaleis the normalized activation time from blue to red.
632 Circulation February 7, 2006

that the spatial relation between rate and fractionation holdsregardless of the recording technique.
AcknowledgmentsThis work was supported by grants from the NHLBI (R01–HL–60843 toJ.J.), Spanish Society of Cardiology (to F.A.), AHA postdoctoral fellow-ships (to J.K. and S.P.), and SDG (0230311N to O.B.). We thank JianlingDeng and Jiang Jiang for technical assistance.
DisclosuresNone.
References1. Jais P, Haissaguerre M, Shah DC, Chouairi S, Gencel L, Hocini M,
Clementy J. A focal source of atrial fibrillation treated by discrete radio-frequency ablation. Circulation. 1997;95:572–576.
2. Haissaguerre M, Jais P, Shah DC, Takahashi A, Hocini M, Quiniou G, GarrigueS, Le Mouroux A, Le Metayer P, Clementy J. Spontaneous initiation of atrialfibrillation by ectopic beats originating in the pulmonary veins. N Engl J Med.1998;339:659–666.
3. Pappone C, Oreto G, Rosanio S, Vicedomini G, Tocchi M, Gugliotta F, SalvatiA, Dicandia C, Calabro MP, Mazzone P, Ficarra E, Di Gioia C, Gulletta S, NardiS, Santinelli V, Benussi S, Alfieri O. Atrial electroanatomic remodeling aftercircumferential radiofrequency pulmonary vein ablation: efficacy of an anatomicapproach in a large cohort of patients with atrial fibrillation. Circulation. 2001;104:2539–2544.
4. Oral H, Knight BP, Tada H, Ozaydin M, Chugh A, Hassan S, Scharf C, Lai SW,Greenstein R, Pelosi F Jr, Strickberger SA, Morady F. Pulmonary vein isolationfor paroxysmal and persistent atrial fibrillation. Circulation. 2002;105:1077–1081.
5. Todd DM, Skanes AC, Guiraudon G, Guiraudon C, Krahn AD, Yee R, Klein GJ.Role of the posterior left atrium and pulmonary veins in human lone atrialfibrillation: electrophysiological and pathological data from patients undergoingatrial fibrillation surgery. Circulation. 2003;108:3108–3114.
6. Nademanee K, McKenzie J, Kosar E, Schwab M, Sunsaneewitayakul B,Vasavakul T, Khunnawat C, Ngarmukos T. A new approach for catheter ablationof atrial fibrillation: mapping of the electrophysiologic substrate. J Am CollCardiol. 2004;43:2044–2053.
7. Sanders P, Berenfeld O, Hocini M, Jais P, Vaidyanathan R, Hsu LF, Garrigue S,Takahashi Y, Rotter M, Sacher F, Scavee C, Ploutz-Snyder R, Jalife J, Hais-saguerre M. Spectral analysis identifies sites of high-frequency activity main-taining atrial fibrillation in humans. Circulation. 2005;112:789–797.
8. Mandapati R, Skanes A, Chen J, Berenfeld O, Jalife J. Stable microreentrantsources as a mechanism of atrial fibrillation in the isolated sheep heart. Circu-lation. 2000;101:194–199.
9. Berenfeld O, Mandapati R, Dixit S, Skanes AC, Chen J, Mansour M, Jalife J.Spatially distributed dominant excitation frequencies reveal hidden organizationin atrial fibrillation in the Langendorff-perfused sheep heart. J Cardiovasc Elec-trophysiol. 2000;11:869–879.
10. Arora R, Verheule S, Scott L, Navarrete A, Katari V, Wilson E, Vaz D, Olgin JE.Arrhythmogenic substrate of the pulmonary veins assessed by high- resolutionoptical mapping. Circulation. 2003;107:1816–1821.
11. Skanes AC, Mandapati R, Berenfeld O, Davidenko JM, Jalife J. Spatiotemporalperiodicity during atrial fibrillation in the isolated sheep heart. Circulation. 1998;98:1236–1248.
12. Samie FH, Berenfeld O, Anumonwo J, Mironov SF, Udassi S, Beaumont J,Taffet S, Pertsov AM, Jalife J. Rectification of the background potassium current:a determinant of rotor dynamics in ventricular fibrillation. Circ Res. 2001;89:1216–1223.
13. Zaitsev AV, Berenfeld O, Mironov SF, Jalife J, Pertsov AM. Distribution ofexcitation frequencies on the epicardial and endocardial surfaces of fibrillatingventricular wall of the sheep heart. Circ Res. 2000;86:408–417.
14. Berenfeld O, Zaitsev AV, Mironov SF, Pertsov AM, Jalife J. Frequency-dependent breakdown of wave propagation into fibrillatory conduction across thepectinate muscle network in the isolated sheep right atrium. Circ Res. 2002;90:1173–1180.
15. Kneller J, Zou R, Vigmond EJ, Wang Z, Leon LJ, Nattel S. Cholinergic atrialfibrillation in a computer model of a two-dimensional sheet of canine atrial cellswith realistic ionic properties. Circ Res. 2002;90:E73–E87.
16. Mansour M, Mandapati R, Berenfeld O, Chen J, Samie FH, Jalife J. Left-to-rightgradient of atrial frequencies during acute atrial fibrillation in the isolated sheepheart. Circulation. 2001;103:2631–2636.
17. Sarmast F, Kolli A, Zaitsev A, Parisian K, Dhamoon AS, Guha PK, Warren M,Anumonwo JM, Taffet SM, Berenfeld O, Jalife J. Cholinergic atrial fibrillation:I(K,ACh) gradients determine unequal left/right atrial frequencies and rotordynamics. Cardiovasc Res. 2003;59:863–873.
18. Kalifa J, Jalife J, Zaitsev AV, Bagwe S, Warren M, Moreno J, Berenfeld O, NattelS. Intra-atrial pressure increases rate and organization of waves emanating fromthe superior pulmonary veins during atrial fibrillation. Circulation. 2003;108:668–671.
19. Fox JJ, Riccio ML, Hua F, Bodenschatz E, Gilmour RF Jr. Spatiotemporaltransition to conduction block in canine ventricle. Circ Res. 2002;90:289–296.
20. Chou CC, Nihei M, Zhou S, Tan A, Kawase A, Macias ES, Fishbein MC, Lin SF,Chen PS. Intracellular calcium dynamics and anisotropic reentry in isolatedcanine pulmonary veins and left atrium. Circulation. 2005;111:2889–2897.
21. Pertsov AM, Jalife J. Scroll waves in 3 dimensional muscle. In: Zipes DP, JalifeJ, eds. Cardiac Electrophysiology, From Cell to Bedside. Philadelphia, Pa: WBSaunders Co; 2000.
22. Lemery R, Guiraudon G. Catheter and surgical ablation strategies in atrial fibril-lation: what have we learned? Curr Opin Cardiol. 2005;20:26–30.
23. Oral H, Knight BP, Ozaydin M, Chugh A, Lai SW, Scharf C, Hassan S,Greenstein R, Han JD, Pelosi F Jr, Strickberger SA, Morady F. Segmental ostialablation to isolate the pulmonary veins during atrial fibrillation: feasibility andmechanistic insights. Circulation. 2002;106:1256–1262.
24. Hocini M, Ho SY, Kawara T, Linnenbank AC, Potse M, Shah D, Jais P, JanseMJ, Haissaguerre M, De Bakker JM. Electrical conduction in canine pulmonaryveins: electrophysiological and anatomic correlation. Circulation. 2002;105:2442–2448.
25. Nathan H, Gloobe H. Myocardial atrio-venous junctions and extensions (sleeves)over the pulmonary and caval veins: anatomical observations in variousmammals. Thorax. 1970;25:317–324.
CLINICAL PERSPECTIVERadiofrequency catheter ablation is used in patients presenting drug-refractory atrial fibrillation (AF), with the goal ofisolating and/or terminating the electrical sources responsible for the arrhythmia. Recent studies suggest that high-frequency complex fractionated atrial electrograms (CFAEs) recorded during AF could be used as target sites for ablation,as such sites may be important in the maintenance of AF. Nevertheless, it is not clear if there is any relationship betweenthe fastest sites and the most fractionated sites, or what guidance can be obtained from their localization to improveablation. In the present study, we use experimental and computer models of AF to explore the mechanism underlying signalfractionation during AF. We provide evidence that the fastest activity in the posterior left atrial wall of the sheep heartduring AF is in fact the most regular, with most fractionated electrograms recorded in adjacent locations surrounding theAF sources. Our study demonstrates that AF-induced electrogram fractionation is the result of increased variability inpropagation velocity and direction of waves emanating from AF sources. In addition, the waves fragment intermittently atthe interface of the fastest region with areas of lower frequencies. Overall, these data help explain the high success rate ofAF ablation techniques aimed at abolishing high-frequency CFAEs. It is likely that targeting high-frequency CFAEs forablation results in isolation of the areas harboring the AF sources. As such, our results may open a new perspective in thetreatment of AF in patients.
Kalifa et al Fractionation at the Posterior Left Atrium 633