Evaluation Report on the Universal Instructional Design Project at the University of Guelph
Upload
khangminh22Category
view
1download
0
Investigations on the Influence of Cellular Sugar and Endoplasmic Reticulum
Dynamics on Plastid Pleomorphy in Arabidopsis thaliana
by
Kiah A. Barton
A Thesis
presented to
The University of Guelph
In partial fulfilment of requirements
for the degree of
Doctor of Philosophy
in
Molecular and Cellular Biology
Guelph, Ontario, Canada
© Kiah A. Barton, April, 2020
ABSTRACT
INVESTIGATIONS ON THE INFLUENCE OF CELLULAR SUGAR AND
ENDOPLASMIC RETICULUM DYNAMICS ON PLASTID PLEOMORPHY
IN ARABIDOPSIS THALIANA
Kiah A. Barton
University of Guelph, 2020
Advisor:
Dr. Jaideep Mathur
Plastids exhibit continuous changes in shape over time, seen either as alterations in the form of the
entire plastid or as the extension of thin stroma-filled tubules (stromules). Live-imaging of
fluorescently-highlighted organelles was used to assess the role of cellular sugar status and
endoplasmic reticulum (ER) rearrangement in this behaviour. Plastids in the pavement cells of
Arabidopsis are shown to be chloroplasts and a brief summary of their physical relationship with
other cellular structures, their development, and their stromule response to exogenous sucrose is
presented. Of the several sugars and sugar alcohols tested, plastid elongation in response to
exogenously applied sugars is specific to glucose, sucrose and maltose, indicating that the response
is not osmotic in nature. Sugar analogs, used to assess the contribution of sugar signalling to a
process, and the sucrose signalling component trehalose-6-phosphate have no effect on stromule
formation. Stromule frequency increases in response to multiple nutrient stresses in a sugar-
dependent manner. Mutants with increased sugar accumulation show corresponding increases in
stromule frequencies, though plastid swelling as a result of excessive starch accumulation
negatively affects stromule formation. The elongation and retractions of plastids is seen to
correlate with the rearrangement of the ER. Transient dilations in tubular portions of plastids, as
iii
well as gaps in stromal fluorescence, are associated with regions of spatial interaction with the ER.
The degree of plastid elongation correlates with the size of the ER polygons both regionally and
at the level of individual plastids, with more elongated etioplasts seen alongside smaller ER
polygons. The disruption of ER structure or rearrangement through treatment with Latrunculin B,
Brefeldin A or cold temperatures corresponds with a decrease in general plastid elongation and the
inhibition of stromule induction by sucrose. The endoplasmic reticulum morphology 1-1 mutant
has compromised ER structure and this correlates with a general reduction in plastid tubulation.
The evidence presented here suggests that cellular sugar has a pivotal role in inducing plastid
pleomorphy in an ER-mediated manner.
iv
ACKNOWLEDGEMENTS
The number of people who have been there to help, support and encourage me throughout this
journey seems innumerable. The only conceivable place to begin is by thanking Dr. Jaideep
Mathur for encouraging me to think critically, to speak when I have something to say, and to see
the beauty as well as the science. You have given me a sense of awe at both the complexity and
the majesty of life, fostered a desire to understand it, and encouraged me to appreciate the mystery
as much as the answer.
My many wonderful co-conspirators in the Mathur Lab were indispensable to both my sanity and
my progress throughout. Thank you Ashley, for enabling my addiction to hot chocolate and donuts,
and for always being there to chat, to assist, or to escape the lab as necessary; Alena, for your
helpfulness and for introducing me to frozen yoghurt; Michael, for being an endless source of
scientific know-how and music; Cole, for your optimism and for the fun you brought to the lab;
and Kate, for gallivanting across the world with me and being a wonderful friend. I’d also like to
thank all of the undergraduate students for their enthusiasm and help, and my ducklings, Jacqueline
and Nailah, for their wonderful and hilarious attempts to drag me out into the world. And of course
I cannot thank Neeta enough, for being just plain awesome. Neither the plants nor the students
would survive without her cheerfulness and care.
I would like to thank the members of my advisory committee: Dr. Joseph Colasanti, Dr. Ian Tetlow,
and Dr. Barry Shelp, for your encouragement, your constructive criticism, and your thoughtful
suggestions. A huge thank you to Bertilla Moroni as well, for being so very kind and helpful. To
fellow grad students, thank you for your conversation, commiseration, and words of support. Most
especially, thank you Jenelle, for being an awesome roommate and an amazing friend, and for
providing me with both encouragement to write and cats to cuddle.
My friends and family were with me always. Thank you Mom, for your perpetual willingness to
read and edit this thesis, and for never tiring of playing the synonym game when I was struggling
to write ‘The Beast’; Dad, for being an endless source of groan-worthy jokes and fun; Grandma
and Grand Dad, for your support and encouragement; and Nathan, for providing me with a weekly
escape from writing and thus helping me to maintain some pretence of sanity. And a millions
thanks to my beloved friends, Andrea, Elizabeth, Meghan, Sheridan, and Bruce, for being your
amazing selves. Always there to talk, listen, or create mayhem as required. I apologize that I have
not yet managed to create either a tomato that tastes like cake or a dragon made of vegetation, and
thank you for supporting me regardless of this oversight.
And of course, I would like to acknowledge the Natural Sciences and Engineering Research
Council, the Ontario Graduate Scholarship, the Canada Foundation for Innovation, the Dr. Donald
R. Phillips Scholarship, and the Molecular and Cellular Biology department of the University of
Guelph for providing funding for this research.
Last, but definitely not least, I would like to thank the plants for not staging an uprising despite all
the things I subjected them to over the years in the interest of science, both standard and mad.

v
TABLE OF CONTENTS
Abstract ........................................................................................................................................... ii
Acknowledgements ........................................................................................................................ iv
Table of Contents ............................................................................................................................ v
List of Tables .................................................................................................................................. ix
List of Figures .................................................................................................................................. x
List of Abbreviations ..................................................................................................................... xv
List of Appendices ........................................................................................................................ xvi
1 General Introduction ................................................................................................................ 1
1.1 Plastids: Types and general characteristics ..................................................................... 1
1.2 Plastid pleomorphy: Stromules, protrusions, and plastid dynamics ................................ 5
1.3 Proposed functions of stromules ..................................................................................... 7
1.4 Potential mechanisms of plastid elongation .................................................................... 9
1.5 Hypotheses .................................................................................................................... 10
2 Pavement cell chloroplasts in Arabidopsis ............................................................................ 11
2.1 Pavement cells in Arabidopsis have chloroplasts .......................................................... 11
2.1.1 Letter to the Editor ................................................................................................. 12
2.2 Chloroplast behaviour and interactions with other organelles in Arabidopsis thaliana
pavement cells. .......................................................................................................................... 18
2.2.1 Introduction ........................................................................................................... 18
2.2.2 Results ................................................................................................................... 20
2.2.3 Discussion .............................................................................................................. 37
2.2.4 Methods ................................................................................................................. 42
3 Plastid pleomorphy and cellular sugar status ........................................................................ 45
vi
3.1 Introduction ................................................................................................................... 45
3.2 Results ........................................................................................................................... 51
3.2.1 Confocal imaging of chloroplasts influences plastid behaviour ............................ 51
3.2.2 Short and long-term exogenous sucrose feeding induces changes in plastid shape
51
3.2.3 Changes in plastid shape are induced by sucrose, glucose and maltose, but not other
osmotic agents, metabolically inactive sugar analogs or T6P ............................................... 56
3.2.4 Nutrient deprivation increases plastid extension in a sugar dependent manner .... 61
3.2.5 Changes to chloroplast shape in response to light correlate with changes in cellular
sugar, rather than redox stress ............................................................................................... 65
3.2.6 Stromule formation increases in response to endogenous sugar accumulation and is
independent of starch accumulation ...................................................................................... 73
3.2.7 Creation of a photo-convertible fluorescent protein targeted to starch grains ...... 79
3.3 Discussion ...................................................................................................................... 80
3.4 Methods ......................................................................................................................... 96
3.4.1 Plant material and growth conditions .................................................................... 96
3.4.2 Confocal microscopy ............................................................................................. 96
3.4.3 Assessment of the effect of imaging on chloroplasts ............................................ 97
3.4.4 Measuring plastid pleomorphy .............................................................................. 97
3.4.5 Statistical analysis ................................................................................................. 98
3.4.6 Treatment of plants to assess stromule responses ................................................. 99
3.4.7 Measurement of total soluble carbohydrates ....................................................... 100
3.4.8 Nutrient deprivation experiments ........................................................................ 102
3.4.9 Cloning and transient expression of GBSS1:mEosFP ......................................... 102
4 Plastid pleomorphy and the endoplasmic reticulum ............................................................ 106
4.1 Introduction ................................................................................................................. 106
vii
4.2 Results ......................................................................................................................... 121
4.2.1 The ER network ................................................................................................... 121
4.2.2 Plastid dynamics correlate with ER remodeling in stable transgenics and across
multiple plastid types ........................................................................................................... 127
4.2.3 The degree of plastid extension correlates with changes to the size of the ER mesh
143
4.2.4 Disruption of the ER correlates with negative effects on plastid extension ........ 147
4.2.5 Association of the ER and the actin cytoskeleton ............................................... 159
4.2.6 Mutants with altered ER morphologies have altered stromule behavior ............. 168
4.2.7 Unusual plastid phenotypes remain ER associated ............................................. 179
4.2.8 The BnCLIP1 protein, previously identified as a putative chloroplast-ER MCS
marker, shows inconsistent localization .............................................................................. 196
4.2.9 A photo-convertible lumenal ER construct was created but lumen dispersal was too
rapid for studying protein movement .................................................................................. 201
4.3 Discussion .................................................................................................................... 202
4.4 Methods ....................................................................................................................... 210
4.4.1 Plant material and growth conditions .................................................................. 210
4.4.2 Confocal microscopy ........................................................................................... 210
4.4.3 Assessment of the association between ER polygon size and cell size ............... 210
4.4.4 Imaging and assessment of ER dynamics and correlation with plastids ............. 210
4.4.5 Estimation of anchor point numbers .................................................................... 211
4.4.6 Measuring plastid pleomorphy ............................................................................ 212
4.4.7 Statistical Analysis .............................................................................................. 212
4.4.8 Treatment of plants to assess ER behaviour and plastid responses ..................... 212
4.4.9 Measurement of the correlation between ER polygon size and plastid extension
213
viii
4.4.10 Chloroplast isolation ............................................................................................ 213
4.4.11 Electron microscopy ............................................................................................ 215
4.4.12 Cloning of BnCLIP1:RFP, DALL2:RFP, MEX1:R/YFP and mEosFP:ER ........ 218
5 General Discussion .............................................................................................................. 220
6 References ........................................................................................................................... 227
Appendix 1: Fluorescent Constructs and plant lines ................................................................... 252
Appendix 2: Conditions and treatments for which the effect on plastid protrusion or stromule
frequency has been reported ........................................................................................................ 256
ix
LIST OF TABLES
Table 2.1. Non-comprehensive list of publications reflecting on the status of chloroplasts in
pavement cells in Arabidopsis. ...................................................................................................... 13
Table 2.2 Transgenic lines and mutants of Arabidopsis used for assessing the subcellular
environment around PCCs ............................................................................................................. 21
Table 4.1. Reports of close ER-plastid association ..................................................................... 117
x
LIST OF FIGURES
Figure 2.1.1 Representative images illustrating the presence of small chloroplasts in epidermal
avement cells of Arabidopsis thaliana ........................................................................................... 17
Figure 2.2.1 The presence of PCCs in Arabidopsis ....................................................................... 22
Figure 2.2.2. A general fluorescent protein aided assessment of pavement cell chloroplasts and
their surroundings .......................................................................................................................... 26
Figure 2.2.3. Observations on PCC in tpFNR:YFP mito:GFP and tpFNR:mEosFP GFP:PTS1
double transgenic lines of Arabidopsis .......................................................................................... 29
Figure 2.2.4. The perimeter of PCC plastid bodies and stromules did not differ .......................... 30
Figure 2.2.5. Using stromule formation to assess the physiological relationship between epidermal
and mesophyll layers ..................................................................................................................... 31
Figure 2.2.6. Images showing leucoplasts and chloroplasts in and around trichome cells in
Arabidopsis expressing tpFNR:GFP and in the glabra2 (gl2) mutant epidermal cells ................. 33
Figure 2.2.7. Images from Arabidopsis wild type plants and mutants allow clear differentiation
between leucoplast and chloroplasts ............................................................................................. 36
Figure 3.2.1. An increase in chloroplast stromule frequency occurs in the epidermis and underlying
cell layer of 7-day-old hypocotyls in response to both long and short term exogenous sucrose
exposure, and correlates with an increase in total soluble carbohydrates within the seedlings .... 52
Figure 3.2.2. An increase in plastid elongation in response to sucrose occurs in etioplasts and
leucoplasts, suggesting a universal plastid response ..................................................................... 55
Figure 3.2.3. Stromule formation in response to exogenous sugars is specific to sucrose, glucose
and maltose and is not a direct response to osmotic stress ............................................................ 58
Figure 3.2.4. Sucrose and glucose analogs do not influence stromule frequency ......................... 60
Figure 3.2.5. Phosphate deprivation increases stromule frequency and soluble carbohydrate
accumulation in a sucrose-dependent manner ............................................................................... 63
Figure 3.2.6. Nitrogen and potassium deprivation increase stromule frequency and total soluble
carbohydrate levels only in the presence of exogenous sucrose ................................................... 65
Figure 3.2.7. Light induced stromule formation correlates with a change in cellular sugar rather
than redox stress ............................................................................................................................ 67
xi
Figure 3.2.8. The ntrc1-1 mutant shows no significant alteration to light induced stromule
induction ........................................................................................................................................ 69
Figure 3.2.9. Changes in soluble carbohydrate accumulation under different photoperiods correlate
with stromule frequency ................................................................................................................ 71
Figure 3.2.10. Prolonged darkness correlates with changes in general epidermal chloroplast shape
that can be reversed with light and sucrose ................................................................................... 72
Figure 3.2.11. Stromule frequency is not significantly influenced by the absence or presence of
starch .............................................................................................................................................. 74
Figure 3.2.12. Stromule frequencies in high soluble sugar mutants correlate with soluble
carbohydrate levels ........................................................................................................................ 77
Figure 3.2.13. Soluble carbohydrate accumulation in the hps1 mutant can be manipulated by
altering the concentration of sucrose in the growth medium and high soluble carbohydrate
accumulation correlates with high stromule frequency ................................................................. 78
Figure 3.2.14. The GBSS:mEosFP fluorescent construct ............................................................. 80
Figure 4.1.1 Protein interactions and lipid composition affect membrane curvature .................. 108
Figure 4.2.1. The basic cortical ER structure is a polygonal network of tubules in most cell types
..................................................................................................................................................... 122
Figure 4.2.2. Non-polygonal ER structures were evident in most cells ...................................... 123
Figure 4.2.3. ER form varied between tissues and between adjacent cells ................................. 124
Figure 4.2.4. ER polygon size correlated with growth condition rather than cell size ................ 126
Figure 4.2.5. The ER rapidly changes form in response to cell damage ..................................... 127
Figure 4.2.6. Fluorescently highlighting the ER lumen does not influence stromule frequency 128
Figure 4.2.7. Chloroplasts shape is more rigid than that of leucoplasts or etioplasts ................. 129
Figure 4.2.8. The ER associates with various plastid types in stable transgenic Arabidopsis plants
with labelled ER lumen and plastid stroma.. ............................................................................... 130
Figure 4.2.9. ER structures remain associated with isolated chloroplasts ................................... 132
Figure 4.2.10. Extensions from isolated chloroplasts are rare and show dynamics distinct from
those found in an intact cell ......................................................................................................... 133
Figure 4.2.11. Plastid extension correlates with the movement of ER tubules in multiple plastid
types ............................................................................................................................................. 134
xii
Figure 4.2.12. Plastid extension occurred alongside ER rearrangement, tubule extension or
streaming ..................................................................................................................................... 135
Figure 4.2.13. Plastid extension could occur alongside the formation of an ER channel, but
channels could also form and dissolve around a previously extended region of a plastid .......... 138
Figure 4.2.14. Plastid elongation occurs along irregular paths suggestive of an external directional
force ............................................................................................................................................. 138
Figure 4.2.15. Plastid extension could occur when the plastid body was pulled away from a fixed
point, often correlating plastid interaction with a rapidly streaming region of ER ..................... 139
Figure 4.2.16. Plastid dynamics highlight the location of potential anchor points between the
plastids and another cellular structure ......................................................................................... 141
Figure 4.2.17. Plastid tubules could rapidly retract to either a secondary position that corresponded
with an ER tubule or all the way to the plastid body ................................................................... 142
Figure 4.2.18. Elongated etioplasts are associated with regions of smaller ER polygons .......... 145
Figure 4.2.19. Sucrose treatment increased chloroplast stromule frequency and ER polygon size,
but did not significantly impact ER rearrangement ..................................................................... 146
Figure 4.2.20. 40nM LatB reduces ER rearrangement and inhibits stromule extension from
chloroplasts .................................................................................................................................. 148
Figure 4.2.21. The residual ER tubules in cells with a disrupted polygonal network after 40 nM
LatB treatement were associated with chloroplasts ..................................................................... 149
Figure 4.2.22. 1 µM LatB resulted in the disruption of the polygonal ER network .................... 151
Figure 4.2.23. 1 µM LatB reduces stromule frequency and stromule length in response to 40mM
sucrose ......................................................................................................................................... 154
Figure 4.2.24. BFA caused minor changes to ER structure and reduced etioplast elongation in dark
grown hypocotyls ........................................................................................................................ 155
Figure 4.2.25. Cold treatment reduces sucrose-induced stromule frequency .............................. 157
Figure 4.2.26. Plants acclimated to cold temperatures partially recover sucrose-induced stromule
formation ..................................................................................................................................... 158
Figure 4.2.27. Direct visual correlation between ER tubules and the visible filaments of the actin
cytoskeleton is limited ................................................................................................................. 160
Figure 4.2.28. Regions of ER streaming occur alongside actin bundles ..................................... 160
xiii
Figure 4.2.29. The size of the polygons in the ER network relative to surrounding cells and the
location of cisternae within the ER network could be estimated from the actin cytoskeleton .... 162
Figure 4.2.30. LatB treatment fragments the actin cytoskeleton ................................................. 164
Figure 4.2.31. A cage of short actin filaments was seen only around mesophyll chloroplasts in
regions with very bright GFP signal ............................................................................................ 165
Figure 4.2.32. The crk GFP:mTalin tpFNR:mEosFP lines available show a slightly elevated
stromule frequency in response to sucrose .................................................................................. 167
Figure 4.2.33. The ER in the hypocotyl of 7-day-old ermo1-1 mutant seedlings is characterized by
small round structures and a faint polygonal network ................................................................. 169
Figure 4.2.34. Stromule extension correlates with ER behaviour in ermo1-1 ............................ 171
Figure 4.2.35. The ermo1-1 mutant has reduced stromule frequency, stromule length and etioplast
elongation .................................................................................................................................... 171
Figure 4.2.36. The ER in the pah1pah2 double mutant has large cisternae but their prevalence
varies between cells ..................................................................................................................... 172
Figure 4.2.37. ER cisternae can be static or show internal dynamics ......................................... 174
Figure 4.2.38. Stromules in the pah1pah2 mutant could extend through active cisternae .......... 174
Figure 4.2.39. Stromules in the pah1pah2 mutant could extend through active cisternae .......... 175
Figure 4.2.40. Transient dilations in tubular regions of plastids correlate with the ER .............. 177
Figure 4.2.41. Gaps in stromal fluorescence within a tubular region of plastid correlated with the
ER ................................................................................................................................................ 178
Figure 4.2.42. Chloroplasts in senescing leaves have uneven borders and abnormal stromules 181
Figure 4.2.43. The membrane fluidizer BA produced cisternae in the ER but had little effect on
the chloroplast ............................................................................................................................. 181
Figure 4.2.44. The mex1 mutant shows a range of mesophyll chlorophyll phenotypes reminiscent
of senescing leaves ...................................................................................................................... 183
Figure 4.2.45. mex1 chloroplasts observed using transmission electron microscopy show dilated
thylakoids, thylakoid-free regions and loops of stroma .............................................................. 184
Figure 4.2.46. The plastid-ER correlation is maintain in mex1 despite the unusual plastid
phenotypes ................................................................................................................................... 185
Figure 4.2.47. The correlation between the ER and unusual stromules shapes was maintained over
time .............................................................................................................................................. 187
xiv
Figure 4.2.48. Chloroplasts in the arc6 mutant are enlarged and have prominent inclusions .... 188
Figure 4.2.49. The ER cage around chloroplasts and the ER channel around stromules were
maintained in arc6 despite the large chloroplast size .................................................................. 190
Figure 4.2.50. Abnormal plastid structures occurred often in arc6 and correlated with atypical
regions of ER ............................................................................................................................... 190
Figure 4.2.51. Looped regions of a stromule in arc6 behaved similarly to a typical stromule in
terms of ER correlation with extension and movement .............................................................. 192
Figure 4.2.52. The im mutant shows horizontal and vertical variegation ................................... 193
Figure 4.2.53. Plastids in the im mutant are similar in appearance to plastids of the same type in
control plants ............................................................................................................................... 194
Figure 4.2.54. Electron micrographs of the im mutant show chloroplast with thylakoid membranes
in green sectors and leucoplasts lacking clear internal membranes in white sectors. ................. 196
Figure 4.2.55. The ER-plastid was maintained for leucoplasts in the im mutant and locations of
constrictions correlated with positions of ER bands. .................................................................. 196
Figure 4.2.56. The association of chloroplast-associated BnCLIP1 with the ER appears most
coincidental .................................................................................................................................. 198
Figure 4.2.57. Localization patterns of BnCLIP1 and MEX1 vary depending on fluorescent
protein, and DLL2:RFP is punctate but shows now clear ER correlation ................................... 200
xv
LIST OF ABBREVIATIONS
2-DG 2-deoxy-D-glucose
ABA Abscisic acid
adg1-1 adp-glucose pyrophosphorylase 1-1
arc6 accumulation and replication of chloroplasts 6
BFA Brefeldin A
CI Confidence interval
crk crooked
DCMU (3,4-dichlorophenyl)-1,1-dimethylurea
DMSO Dimethylsulfoxide
ER Endoplasmic reticulum
GBSS Granule-bound starch synthase
GFP Green fluorescent protein
gl2 glabra2
GSR General stress response
hps1 hypersensitive to phosphate starvation 1
HXK1 Hexokinase 1
im immutans
LatB Latrunculin B
LB Lysogeny broth
MCC Mesophyll cell chloroplast
MCS Membrane contact site
mEosFP Monomeric Eos fluorescent protein
mex1 maltose excess 1
MGDG Monogalactosyldiacylglycerol
MGD Monogalactosyldiacylglycerol synthase
MS Murashige and Skoog
NBDG 2-(N-(7-Nitrobenz-2-oxa-1,3-diazol-4-yl)Amino)-2-Deoxyglucose
NTRC NADPH-dependent thioredoxin reductase C
PCC Pavement cell chloroplast
pETC Photosynthetic electron transport chain
pgm1 phosphoglucomutase
PLAM Plastid associated membrane
PSII Photosystem II
RFP Red fluorescent protein
ROS Reactive oxygen species
SEM Scanning electron microscopy
sex1 starch excess 1
SnRK1 SNF1-related protein kinase 1
T6P Trehalose-6-phosphate
TEM Transmission electron microscopy
tpFNR Transit peptide of Ferredoxin NADP(+) oxidoreductase
wrm wurm
YFP Yellow fluorescent protein
xvi
LIST OF APPENDICES
Appendix 1: Fluorescent constructs and plant lines
Appendix 2: Conditions and treatments for which the effect on plastid protrusion or stromule
frequency has been reported
1
1 General Introduction 1.1 Plastids: Types and general characteristics Plastids within the plant cell are the site of a host of biochemical processes essential for both the
everyday and long-term survival of a plant. They contribute to the biosynthesis or processing of
carbohydrates, amino acids, lipids, fatty acids, pigments, vitamins, nucleic acids and isoprenoids
(Rolland et al., 2012). Originating from the endosymbiosis of a cyanobacterial ancestor with a
eukaryotic host, plastids in higher plants are bound by two envelope membranes surrounding a
semi-aqueous stroma and, in many cases, internal membrane structures (Wise, 2007). As their
name suggests, plastids show considerable plasticity in both function and form, and were so named
after Schimper (1883) established that several apparently distinct organelles shared a common
embryonic parent, the proplastid. Throughout the life of a plant, plastids can take on specialized
forms, leading to a population of organelles that have different structure and biochemistry
depending on tissue, developmental stage, and environmental conditions (Wise, 2007). In general,
plastids are first roughly categorized by their pigmentation. Chloroplasts are identified by their
green colouration due to an abundance of chlorophyll, chromoplasts by the dominance of orange-
yellow carotenoids, and leucoplasts by the absence of visible pigment (Schimper 1883; 1885). In
accordance with the biochemistry of these different plastid populations, they may contain one or
several types of inclusions. These include starch grains, which are composed of glucan chains that
act to store carbohydrates (Zeeman et al., 2002); plastoglobules, which are structures made of
proteins and lipids that assist in lipid synthesis and storage (Austin, 2006); and crystals, which
may be composed of proteins (Thomson and Whatley, 1980; Wise, 2007) or carotenoid pigments
(Maass et al., 2009). Many different plastid types and sub-types have been labelled to date based
on structure, function, pigmentation and predominant inclusions.
As the site of photosynthesis, the chloroplast is the best studied identity of the plastid. These
autotrophic organelles are located primarily in aerial tissues. They harvest light energy and use it
to fix carbon dioxide into sugars, providing both a source of energy and a source of carbon
substrates to the entire plant. The canonical chloroplast can be visually identified by its green
chlorophyll pigment, stacked thylakoid membranes, the daily creation of transitory starch and the
subsequent breakdown of this starch at night (Wise, 2007). The stacked thylakoid membranes,
2
called grana, are held stable by interactions between proteins of the photosynthetic machinery on
the opposing surfaces of appressed thylakoids (Dekker and Boekema, 2005). This relatively rigid
structure results in chloroplasts having a consistent plastid body and lens-shaped profile. Their
shape develops concomitantly with grana formation (Vothknecht and Westhoff, 2001) and
becomes more variable again as the grana are disassembled during the transition to gerontoplasts
in older tissues (Pancaldi et al., 1996; Ghosh et al., 2001; Evans et al., 2010; Uzelac et al., 2016).
Gerontoplasts are an uncommitted senescent form of a chloroplast. They are characterized by
increasing disorganization and unstacking of thylakoid membranes, the loss of chlorophyll
pigment and the accumulation of plastoglobules as the plastids are broken down for remobilization
of their materials to other parts of the plant (Evans et al., 2010; Biswal et al., 2012; Solymosi and
Keresztes, 2013).
Large green plastids with stacked thylakoids, diurnal transitory starch accumulation, and a
distinctive lens-shaped profile accurately describes most chloroplasts located in the mesophyll
tissue of leaves, which account for the vast majority of photosynthetic output. However, in other
tissues chloroplasts can have altered structure. For example, thylakoid stacking is not a requisite
feature of all chloroplasts, as the bundle sheath chloroplasts in some species are agranal and
correspondingly lack the standard lens-shaped body (Woo et al., 1970; Andersen et al., 1972;
Munekage, 2016). The most easily observed chloroplast populations that do not conform to typical
mesophyll chloroplast size and structure are those seen in the epidermal tissues. In most species,
the guard cells have green pigmented plastids that are much smaller than those seen in the
mesophyll, often have minimal thylakoid stacking, and have significantly more variable patterns
of starch accumulation, with starch content increasing at night and falling during the day in some
species (Lawson, 2009). The metabolic contribution of these plastids to the guard cell is not fully
understood and seems to vary substantially by species. Although there is evidence that the Calvin
cycle can be active in guard cell chloroplasts, several studies support a malate synthesis pathway
as the primary mechanism of carbon fixation and suggest that a large portion of the energy
generated by the photosynthetic electron transport chains may be used for processes other than the
Calvin cycle, potentially to assist in the transport of ions required to control stomatal opening and
3
closing (Lawson, 2009; Lawson et al., 2014). Nonetheless, these plastids are considered
chloroplasts.
The identity of the plastids in the pavement cells, which make up the bulk of the epidermal tissue,
appears to be more variable. Some species, such as Nicotiana tabacum L., are accepted as having
pavement cell chloroplasts (Dupree et al., 1991; Brunkard et al., 2015). However, despite an in-
depth survey indicating that chloroplasts are see in over half the species observed (Moore, 1888),
the generally held opinion is that the plastids in the pavement cells of most species are non-green
(MacDonald, 2003; Smith, 2005; Bowes and Mauseth, 2008; Solomon et al., 2010; Vaughan,
2013). Arabidopsis thaliana (L.) Heynh. is used in many studies as a model plant species due to
its small size, sequenced genome, short life-cycle, large seed set, and ease of genetic manipulation
(Koornneef and Meinke, 2010). It typifies the inconsistencies in the reporting of pavement cell
plastid identity, with numerous reports that clearly describe green pigmented plastids in the
pavement cells (See Table 2.1; Pyke and Leech, 1994; Robertson et al., 1996; Vitha et al., 2001;
Holzinger et al., 2008; Kojo et al., 2009) and others that report an absence of chlorophyll pigment
(Haseloff et al., 1997; Meurer et al., 1998; Haswell and Meyerowitz, 2006; Brunkard et al., 2015).
Due to the ease of imaging the epidermal relative to the mesophyll chloroplasts, these small
pavement cell plastids are often used in visual studies of plastid behaviour in response to light and
other stimuli. How a plastid responds to its environment both biochemically and physically is
interpreted in the context of the plastid’s function and role within the cell. Light-based movement
of a mesophyll chloroplast is thought to optimize light gathering and minimize photooxidative
damage, but if the same movement was seen in non-photosynthetic plastids, a different explanation
might instead be given. It is therefore a point of importance to clearly identify the plastid type
being used in an experiment in order to give context to any interpretations drawn from the results,
and a closer study of the identity of pavement cell chloroplasts in Arabidopsis is a worthwhile
endeavour.
While most aerial tissues of a plant develop chloroplasts if exposed to light, the plastids will
differentiate instead into etioplasts if the plant is grown in the dark for several days. Some argue
that the prolonged darkness required to generate etioplasts makes them an artificial plastid type
4
that occurs only under lab conditions. However, there is growing evidence that they occur in nature
in young tissues that take several days to grow through the soil or that are heavily shaded by
existing growth (Reviewed in Solymosi and Schoefs, 2010). The internal structure of these
chloroplast precursors consists of flat unstacked prothylakoids and paracrystalline prolamellar
bodies, the latter of which are made up of membrane tubules, protochlorophyllide, carotenoid
pigments, and some proteins or precursors of the photosynthetic machinery (Lopez-Juez and Pyke,
2005; Rodríguez-Villalón et al., 2009; Solymosi and Schoefs, 2010; Kowalewska et al., 2016).
Upon illumination, the prolamellar bodies are rapidly converted into stacked thylakoids and the
photosynthetic machinery is assembled (Kowalewska et al., 2016). Contrary to the chloroplasts
they will become, etioplasts are heterotrophic plastids and must import carbon substrates for
metabolism (Jarvis, 2007). The creation of etioplasts by maintaining a dark environment for plant
growth can be useful for studying changes to plastid structure, thylakoid development, and the
necessity of light for certain enzymes, biochemical processes or plastid behaviours. Unlike the
more consistent chloroplasts, etioplasts have an extremely variable shape and can range from
round to an almost completely tubular structure (Kwok and Hanson, 2003; Waters et al., 2004;
Holzinger et al., 2008; Gray et al., 2012; Schattat et al., 2012a).
Leucoplasts represent the broadest category of plastids, as there are several sub-types defined by
the type of compounds stored. They often have minimal internal membrane structures (Solymosi
and Keresztes, 2013) and can be identified most easily through staining of stored components or
electron microscopy. The shape of leucoplasts is similar to that of etioplasts, ranging from round
to mostly tubular (Esau, 1944; Fester et al., 2001; Hans et al., 2004; Itoh and Fujiwara, 2010; Gray
et al., 2012; Vismans et al., 2016). They can appear throughout the plant, but are most readily
observed in the roots, storage structures such as tubers or seeds, or above-ground non-green tissues
such as petals (Pyke, 2007; Irish, 2008). Leucoplasts that predominantly store starch are termed
amyloplasts. Elaioplasts are leucoplasts whose principal inclusions are lipid-storing plastoglobules
and proteinoplasts those with protein crystals or amorphous protein accumulations. Amyloplasts
are readily visible in storage tissues such as seeds or tubers, as well as in the tips of roots, where
they contribute to gravitropism. Unlike in chloroplasts, whose starch accumulation is transitory,
amyloplast starch grains are a more long-term storage structure (Pyke, 2007). Due to the large

5
number and size of starch grains within, amyloplasts primarily appear round and swollen (Salema
and Badenhuizen, 1967; Thomson and Whatley, 1980; Sagisaka, 2008). Elaioplasts and
proteinoplasts are less commonly observed and less well studied. Elaioplasts are primarily
described in reproductive tissues such as the anther tapetum, in the seeds of oil crops or in secretory
tissues (Ting et al., 1998; Ross et al., 2000; Pyke, 2007; Bartoli et al., 2011; Suzuki et al., 2013;
Quilichini et al., 2014; Zhu et al., 2018). Very few studies describe proteinoplasts in recent years
and although they are always included in lists of differentiated plastid forms, the information
available on them is minimal and whether they should be considered a plastid subtype has been
questioned (Solymosi et al., 2018).
1.2 Plastid pleomorphy: Stromules, protrusions, and plastid dynamics Much of the information available on the ultrastructure of plastids is derived from transmission
electron microscopy. This technique allows extremely high magnification imaging of cellular
structures, but has limited utility for studying dynamic processes, as it requires fixation and
sectioning of the plant tissue (McDonald, 2014). Discovered many years earlier in the jellyfish
Aequorea victoria (Shimomura et al., 1962), the first known fluorescent protein, green fluorescent
protein (GFP), was successfully cloned in 1992 (Prasher et al., 1992) and revolutionized light
microscopy. Since this time, many variants of GFP and other fluorescent proteins have been
discovered or developed and fluorescent proteins that span the visual spectrum are now available.
These proteins can be genetically fused to proteins of interest or tagged with conserved cellular
targeting signals and expressed in the organism of interest (Wiedenmann et al., 2009; Chudakov
et al., 2010). Confocal laser scanning microscopy excites these expressed fluorescent proteins, but
limits the emission light collected to a narrow focal plane, creating a clean image of the cell interior
at that plane. This can produce near real-time time-lapse images or three-dimensional snapshots of
a living cell and allows the study of organelle dynamics, interactions between different
components of the cell, rapid cell responses to stimuli, and other plant cell and tissue behaviours.
That plastids can exhibit considerable changes to their overall shape has been known for many
decades. Esau (1944) detailed the presence of membrane tubules extending outwards from the
6
otherwise fixed body of chloroplasts. This observation was echoed by Spencer and Wildman
(1962), who described the mobility of the jacket surrounding mesophyll chloroplasts as it extended
and retracted protuberances. In keeping with their more dynamic basal shape, leucoplasts have
been shown to continuously change their shape entirely over relatively short time-periods (Faull,
1935; Esau, 1944). However, electron microscopy has led to an impression that plastid shape is
predominantly limited to a spherical to ellipsoid shape spectrum and other forms were atypical
(Solymosi and Keresztes, 2013). This began to change with the use of fluorescent proteins to study
the plastid and the renewed interest in the long, thin stroma-filled tubules that can extend from
plastids (Köhler et al., 1997), which are bound by both envelope membranes (Holzinger et al.,
2007a; Holzinger et al., 2008) and were in subsequent studies named ‘stromules’ (Köhler and
Hanson, 2000). Stromules are dynamic transient structures that can rapidly extend and retract from
a plastid body or branch along their length (Gunning, 2005) and common to all plastid types in
higher plants (Hanson and Sattarzadeh, 2008; Hanson and Hines, 2018). They are reported to
extend more frequently from non-green plastids and are considered rare among mesophyll
chloroplasts (Köhler and Hanson, 2000; Hanson and Sattarzadeh, 2008). Stromules are generally
defined as being less than 0.8 µm in width and at least 3 µm in length (Hanson and Sattarzadeh,
2008), but these criteria are not strictly followed. A shape index value, measured as the ratio
between length and width, was also established (Holzinger et al., 2007a) to distinguish stromules
from the short, wide projections that can extend from chloroplasts. These wider projections have
been name ‘protrusions’ and there is some speculation that they are distinct in structure and
function from stromules (Buchner et al., 2007; Lütz and Engel, 2007; Buchner et al., 2015).
Despite the attempts to quantify proportions that would allow conclusive and consistent
identification of stromules or protrusions, simplified criteria are not sufficient to capture the range
and dynamics of plastid shape. The basic definition of a stromule by length and width could easily
apply not only to tubules extended outwards from a plastid body, but also to elongated regions
within an etioplast or leucoplast. The shape index criteria designed to distinguish between
stromules and protrusions in mesophyll chloroplasts use chlorophyll autofluorescence as a starting
point for measuring the length of extensions and a position for measuring radius (Holzinger et al.,
2007a). These criteria therefore cannot be applied as defined to other plastid types, due to the lack
7
of both chlorophyll autofluorescence and a consistent plastid body. Further, live-imaging of
mesophyll chloroplasts reveals a continuous change in shape index, with a single extension being
defined as a protrusion, a stromule or between the two categories depending on the moment of
imaging. This demonstrates that any numerical categorization of the two structures is artificial
(Delfosse et al., 2016). Given that stromules are reported to form more frequently among less-
tightly packed mesophyll chloroplasts and protrusions in more tightly packed areas (Waters et al.,
2004; Holzinger et al., 2007a; Hanson and Sattarzadeh, 2008), these are likely examples of the
same general phenomenon, simply limited by factors in the cellular environment. Though the terms
stromule and protrusion are useful from a descriptive point of view, they are both part of a
continuous spectrum of plastid shapes.
1.3 Proposed functions of stromules The function of stromules is one of the most avidly studied aspects of their formation. Among the
earliest proposed and most widely accepted functions was to act as bridges to connect two plastids
and allow for the exchange of materials between them. This was based on fluorescent recovery
after photobleaching experiments, where the fluorescent protein in one plastid body was
photobleached and observed to flow through a thin tubule to another plastid body (Köhler et al.,
1997; Tirlapur et al., 1999; Köhler et al., 2000). These studies, however, never demonstrated the
fusion event between a stromule and a neighbouring plastid. Schattat et al. (2012a) used the mEos
photo-convertible fluorescent protein (mEosFP), which could be irreversibly converted from a
green to a red form, to individually colour plastids with the aim of observing plastid fusion.
However, they could find no evidence of this phenomenon. They suggest instead that since the
plastids used in the original protein-flow studies were leucoplasts or etioplasts, their dynamic
nature gave the impression of two plastids joined by a stromule when they were in reality single
plastids that had formed two enlarged regions as they changed shape. Protein flow was therefore
demonstrated within a single plastid. The fusion of two plastids that were previously independent,
either through stromules or otherwise, and the subsequent transfer of proteins between them has
not been observed, and if stromules do fuse with other plastids, it is likely a rare event rather than
a common function of stromule extension (Schattat et al., 2012a; Schattat et al., 2014).
8
Other proposed functions of stromules include increasing the surface area shared between the
plastid and the surrounding cytoplasm, enhancing interactions with other organelles, dispersing
reactive oxygen species (ROS), and recycling plastidial components during stress (Hanson and
Hines, 2018). These theories are based on the observation of conditions that increase the frequency
of stromule formation. Many of these conditions represent times of stress for the plant, when
increased exchange and signaling between organelles and the control of ROS would be beneficial,
to facilitate a response and mitigate damage respectively. These include biotic stresses such as
viral or bacterial infection (Caplan et al., 2015; Erickson et al., 2018) and abiotic stresses such as
increased salinity, drought, nutrient deprivation, and elevated temperature (Holzinger et al., 2007a;
Gray et al., 2012; Vismans et al., 2016). A complete table of the conditions reported to influence
stromule extension is provided in Appendix 2. Both biotic and abiotic stresses are mediated by
overlapping pathways of hormone signaling and evidence suggests that these hormones themselves
can initiate stromule extension, with abscisic acid (ABA; Gray et al., 2012; Vismans et al., 2016),
strigolactones (Vismans et al., 2016), salicylic acid (Caplan et al., 2015), cytokinins (Erickson et
al., 2014), ethylene, and jasmonates (Gray et al., 2012) each apparent promoting stromule
formation.
The considerable range of conditions and hormones that result in stromule formation makes it
difficult to narrow down specific pathways within the cell that control stromule extension, the
identification of which could provide valuable information about stromule function, the
mechanism of stromule formation, and the conservation of stromule extension across species. In
addition to stress conditions and hormone exposure, increased stromule extension occurs daily
during the diurnal period, when photosynthates are being synthesized, and in response to
exogenous application of sucrose or glucose (Schattat and Klösgen, 2011; Schattat et al., 2012b).
This is of particular interest because in addition to their metabolic contributions, sucrose and
glucose are important signaling molecules and sugar-signaling pathways intersect with those of
many hormones (Ljung et al., 2015; Li and Sheen, 2016; Sakr et al., 2018). Further, elevated sugar
levels are seen to accompany many stress conditions (Gómez-Ariza et al., 2007; Rosa et al., 2009).
As the stromule response to sugars occurs in a more rapid timeframe than many of the other
treatments (See Appendix 2) and sugar accumulation can be theoretically tied to the majority of
9
these treatments, cellular sugar levels have the potential to be a central point for the control of
stromule extension.
1.4 Potential mechanisms of plastid elongation There are several theories on the mechanism of stromule formation. Though some promote a
protein-based system, arising from observations of tubular structures emanating from isolated
chloroplasts (Ho and Theg, 2016), these structures bear little resemblance in terms of appearance
or dynamics to stromules in intact cells. The tensioned and seemingly directed movement of
stromules (Gunning, 2005) is thought to result from the pulling on the plastid envelope by another
structure within the cell, most often a component of the cytoskeletal system. Based on correlated
dynamics, disruption with drug treatments, and mutation analysis, the actin-myosin system (Kwok
and Hanson, 2003; Natesan et al., 2009; Bross et al., 2017) and the microtubules (Erickson et al.,
2018; Kumar et al., 2018) have been individually implicated in providing the pulling force behind
stromule extension. These studies often report a minimal role for the other cytoskeletal structure
in stromule extension and present differing results on the effect of drug-based cytoskeletal
disruption (Appendix 2). Another group has reported a high degree of correlated dynamics
between the extension and branching of stromules and the nearby tubules of the endoplasmic
reticulum (ER; Schattat et al., 2011a, 2011b). The ER is one of the largest organelles within the
cell, forming a meshwork of tubules surrounding the cell cortex and extending in bulk through
other regions of the cell. A dynamic structure, it is constantly undergoing tubule rearrangement
and streaming of bulk components (Sparkes et al., 2009b; Westrate et al., 2015; Griffing et al.,
2017). It is the site of synthesis, sorting and processing of proteins, plays a role in cellular calcium
homeostasis, is involved in hormone signaling, and is a central hub for lipid synthesis, modification
and transport (Sparkes et al., 2009b; Friml and Jones, 2010; Hawes et al., 2015; Westrate et al.,
2015; Bellucci et al., 2017). An ER based mechanism for stromule extension is intriguing, as these
two organelles are closely linked both biochemically and physically. The pathway of lipid
synthesis is shared between the two organelles and lipid transfer is proposed to occur at membrane
contact sites (MCS), formed from the hemifusion of the plastid outer envelope with the ER
membrane (Andersson et al., 2007; Mehrshahi et al., 2013; Mehrshahi et al., 2014). These MCS
provide a point at which the ER could exert a force on the plastid envelope (Schattat et al., 2011a,
10
2011b). The theory of stromule extension as a result of ER rearrangement does not negate previous
results on the effect of cytoskeletal disruption on plastid behaviour, as ER rearrangement is
dependent on both the actin-myosin system and the microtubules (Sparkes et al., 2011; Hamada et
al., 2012; Hamada et al., 2014; Griffing et al., 2017). It remains the least-investigated mechanism
of stromule formation, but has the potential to resolve the conflicting evidence on the role of the
cytoskeleton in stromule extension.
1.5 Hypotheses Here I aim to establish the identity of the plastids in the epidermis of Arabidopsis to facilitate the
interpretation of plastid behaviour in the context of cell metabolism, to investigate whether cellular
sugar levels can act as a global trigger to unify the diverse conditions that induce stromule
formation, and to determine whether endoplasmic reticulum dynamics contribute to the extension
of stromules. We do so by investigating three hypotheses:
1. There are chloroplasts in the epidermal pavement cells of Arabidopsis. 2. Cellular sugar levels influence stromule extension.
3. Stromule dynamics are associated with ER rearrangement and ER disruption alters plasid behaviour.

11
2 Pavement cell chloroplasts in Arabidopsis 2.1 Pavement cells in Arabidopsis have chloroplasts Kiah A. Barton 1, Martin H. Schattat 2, Torsten Jakob 3, Gerd Hause 4, Christian Wilhelm 3, Joseph
F. Mckenna 5, Csaba Máthé 1,6, John Runions 5, Daniel Van Damme 7.8, Jaideep Mathur 1*
1. Laboratory of Plant Development and Interactions, Department of Molecular and Cellular
Biology, University of Guelph, 50 Stone Rd., Guelph. ON. N1G2W1. Canada.
2. Martin-Luther-Universität Halle-Wittenberg, Institutsbereich Pflanzen- physiologie,
Weinbergweg 10, 06120 Halle (Saale), Germany.
3. Department of Plant Physiology, Institute of Biology, Faculty of Biosciences, Pharmacy
and Psychology, University of Leipzig, Leipzig, Germany.
4. Microscopy Unit. Biocenter. Martin-Luther-University Halle-Wittenberg. Weinbergweg
22. D-06120 Halle/Saale, Germany.
5. Oxford Brookes University. S209A Sinclair, Gypsy lane, Oxford, OX3 0BP, United
Kingdom.
6. Department of Botany, University of Debrecen, Faculty of Science and Technology,
Debrecen, Hungary.
7. VIB Department of Plant Systems Biology, Ghent University. Technologiepark 927, 9052
Gent, Belgium.
8. Department of Plant Biotechnology and Bioinformatics, Ghent University, 9052 Ghent,
Belgium
Published as a Letter to the Editor in Plant Physiology (2016) 171: 723-726. Minor
modifications have been made to the text and figures for presentation within this thesis.
12
2.1.1 Letter to the Editor
Plastids are multi-functional, pleomorphic organelles of purported endosymbiotic origin that in
plants and green algae display a characteristic double membrane envelope (Wise, 2007). All
plastids originate from colourless proplastids, and a simple pigmentation-based classification
distinguishes chloroplasts from other plastids by the presence of chlorophyll, chromoplasts by the
predominance of other pigments, and leucoplasts by the absence of all pigmentation (Schimper,
1883; 1885). Plastids are able to interconvert according to tissue and developmental requirements.
(Schimper, 1883; 1885).
In higher plants the majority of chloroplasts are found in the leaf mesophyll tissue. The presence
of chloroplasts in the epidermis of some higher plant species, including tobacco, is also generally
accepted (Shaw and MacLachlan, 1954; Dupree et al., 1991; Brunkard et al., 2015). However,
several modern textbooks and primary publications categorically state that the epidermis of higher
plants contains chloroplasts only in the guard cells, while pavement and trichome cells have
leucoplasts (MacDonald, 2003; Smith, 2005; Bowes and Mauseth, 2008; Solomon et al., 2010;
Vaughan, 2013). In the model plant Arabidopsis, observations of leucoplasts in the unicellular
trichomes are consistent, but there is considerable ambiguity regarding the presence or absence of
chloroplasts in pavement cells (Table 2.1).
Several publications clearly show chloroplasts in the pavement cells of Arabidopsis and a precise,
observation-based statement that contradicts the common text book knowledge has been made by
Pyke (2009, p.15): “In a leaf, the chloroplasts in the epidermal cells covering the leaf surface are
significantly smaller and poorly developed compared with mesophyll chloroplasts, but do contain
low levels of chlorophyll and should be considered as chloroplasts”. Nevertheless, a degree of
uncertainty is maintained since other investigators who have observed chlorophyll fluorescence in
pavement cells have either dismissed it as artifactual or have described such chloroplasts as not
being fully developed (Haseloff et al., 1997; Chiang et al., 2012; Higa et al., 2014). Still others
report an absence of chlorophyll fluorescence in the pavement cells (Table 2.1). The significance
of this issue is highlighted by a recent publication that uses the purported absence of chloroplasts
in the pavement cells to explain differences in plastid behaviour between cotyledon pavement and
guard cells in response to chemically induced redox stress (Brunkard et al., 2015).

13
Table 2.1. Non-comprehensive list of publications reflecting on the status of chloroplasts in pavement cells in
Arabidopsis.
Suggested status
Basis Reference
Absent Chlorophyll autofluorescence in guard cells only Brunkard et al., 2015 Absent Chlorophyll-containing plastids not observed Haseloff et al., 1997
Absent Reported as being non-green; chlorophyll signal not shown Haswell and Meyerowitz 2006
Absent Chlorophyll autofluorescence in guard cells only Chiang et al., 2012
Absent Reported; chlorophyll signal not shown Bergmann et al., 2004
Absent Expression of 35S-PAC-GFP construct only in guard cells;
chlorophyll signal not shown
Meurer et al., 1998
Absent Stated in discussion, no citation Kagawa and Wada 2000
Ambiguous Chlorophyll fluorescence; typical chloroplast internal
structure in embryo
Tejos et al., 2010
Ambiguous Chlorophyll autofluorescence in leaf primordia; indicate
loss of chlorophyll later
Charuvi et al., 2012
Ambiguous Chlorophyll autofluorescence Higa et al., 2014
Present Citation only Pyke and Page 1998
Present Internal thylakoid ultrastructure observed Robertson et al., 1996
Present Chlorophyll autofluorescence observed Kojo et al., 2009
Present Chlorophyll autofluorescence observed Fujiwara et al., 2015
Present Chlorophyll autofluorescence observed Holzinger et al., 2008
Present Pale chloroplasts reported Pyke and Leech 1994
Present Chlorophyll autofluorescence observed Joo et al., 2005
Present Acknowledged as chloroplasts Vitha et al., 2001
The plastid type identified in a tissue creates an association with specific attributes. The name
influences our comprehension of its internal biochemistry, its response and susceptibility to
environmental stimuli such as redox imbalances and its overall behaviour and interactions with
other cytoplasmic components and compartments. For example, photosynthesis in chloroplasts
suggests a primary source of sugars, whereas leucoplasts are recognized as sink plastids that
receive already synthesized sugar molecules. For models that rely on identifying a plastid type to
explain plastid behavior, a changed label can suggest a different but perhaps experimentally
unsubstantiated interpretation.
After recognizing the present ambiguity on the subject, we investigated the presence of
chloroplasts in the pavement cells in Arabidopsis. Representative images and observations are
presented (Fig. 2.1.1). Chlorophyll autofluorescence (emission peak 685nm) is routinely detected
both by our lab and several others using epifluorescent microscopy (B-3A long-pass filter set) as
well as confocal laser scanning microscopy (excitation 488nm; emission collected 650-750nm) in
pavement cell plastids. The observations remain consistent for plants in different stages of
14
development, grown on soil or on sucrose-containing medium under varying light conditions (Fig.
2.1.1A,B). Measurements on plastid number done by Dr. M. Schattat are in accordance with an
earlier report by Pyke and Leech (1994), with the number of chloroplasts in a pavement cell being
one-tenth (10 ± 3) of that observed for mesophyll cells (110 ± 10). In comparison to the clustered
chloroplasts in mesophyll cells, pavement cell chloroplasts appear very dispersed, often located
near the edges of the jigsaw-puzzle shaped cells. The average size of pavement cell chloroplasts is
approximately one-half the size of a mesophyll chloroplast but slightly larger than guard cell
chloroplasts. The average chlorophyll autofluorescence intensity of pavement cell chloroplasts lies
between that of guard cell and mesophyll cell chloroplasts. Observations of low chlorophyll signal
are matched by ultrastructural details that show a small number of clearly defined grana (Fig.
2.1.1C-D). Moreover, Pulse-Amplitude Fluorescence measurements carried out by Dr. T. Jakobs
and Dr. M. Schattat suggest that under actinic illumination, pavement cell chloroplasts exhibit a
fluorescent transient comparable to that shown by mesophyll chloroplasts, suggesting that they do
have an active photosystem II and can utilize light energy for carbon fixation.
Whereas each observation presented here supports earlier publications (referenced in Table 2.1)
suggesting the presence of chloroplasts in Arabidopsis pavement cells there is some basis for their
perceived absence. One reason that they may be overlooked lies in their low number and sparse
distribution in pavement cells. Further, like chloroplasts in the mesophyll, pavement cell
chloroplasts exhibit light avoidance responses (Higa et al. 2014) and relocate to the lower lateral
regions of the cells in tissue exposed to light. This location places them very close to the mesophyll
layer so that when imaged from above, as is the usual practice, they appear positioned alongside
the mesophyll chloroplasts even when using confocal microscopy. Their location in the lower
region of pavement cells also removes them from the focal plane for guard cell chloroplasts, where
imaging of the epidermis is often focused, and conveys an impression of the absence of
chloroplasts from the pavement cells. However, a comparison of chloroplast size and the use of a
stroma-targeted probe clearly demonstrates their presence (Fig. 2.1.1B). As shown in Fig. 2.1.1A,
imaging a tissue from a lateral perspective in addition to the top-down view (Fig. 2.1.1B) allows
all autofluorescent plastids to be detected and helps dispel the illusion that chloroplasts are not
present in the pavement cells. We also note that a prevalent practice during multichannel confocal
imaging is to minimize the fluorescence detection levels to obtain clear images of the strongly
15
autofluorescent mesophyll chloroplasts. Since pavement cell chloroplasts display considerably
lower autofluorescence, their fluorescent signal may fall below the detection range in this
circumstance.
Another factor requiring consideration in the context of pavement cell chloroplasts is the intrinsic
ability of plastids to interconvert from one kind to another. Chlorophyll, the distinguishing feature
of a chloroplast, is lost quite rapidly in senescing as well as wounded tissue. This would allow a
plastid to be classified as a leucoplast based on visual identification. As cotyledons of varying ages
have been used in some studies (Chiang et al., 2012; Brunkard et al., 2015), we observed this tissue
carefully and found that pavement cells in older cotyledons and senescing leaves do contain a
mixture of chloroplasts and leucoplasts. Whether observations made on these tissues can be taken
as representative of normally functioning leaves and be used to promote the view that pavement
cells in Arabidopsis plants have only leucoplasts is questionable.
It appears that categorizing plastids in pavement cells in Arabidopsis as leucoplasts is largely due
to limited information to the contrary, rather than evidence in favour of this conclusion. While
Arabidopsis becomes another lab plant like tobacco (Dupree et al., 1991), in which chloroplasts in
pavement cells can be observed, it is noteworthy that independent surveys by Moore (1888) and
Stohr (1879) had already indicated that between 85 and 95% of dicotyledonous species contain
chlorophyll in the lower epidermis, while at least half of the 120 species investigated by Moore
(1888) had chloroplasts in the upper epidermis. Perhaps the presence of chloroplasts in pavement
cells occurs more widely than acknowledged hitherto. Recognition of a population of small
chloroplasts with a high stroma to grana ratio in the pavement cells should open out new avenues
for research on their actual contribution to the general upkeep and functioning of the aerial plant
epidermis.
16
pcgc
pc
meso
1
3
2
4
A Bgc gc
1
2
Meso
Epi
*
**
*
C
D
Epi Meso
17
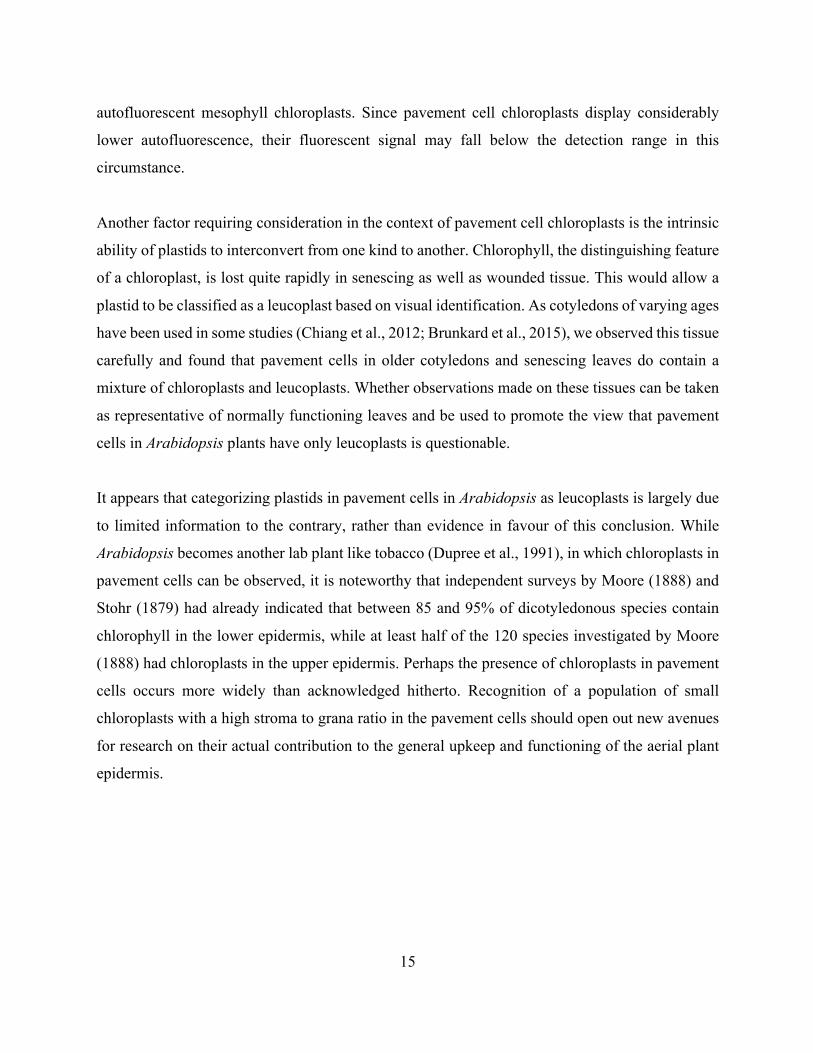
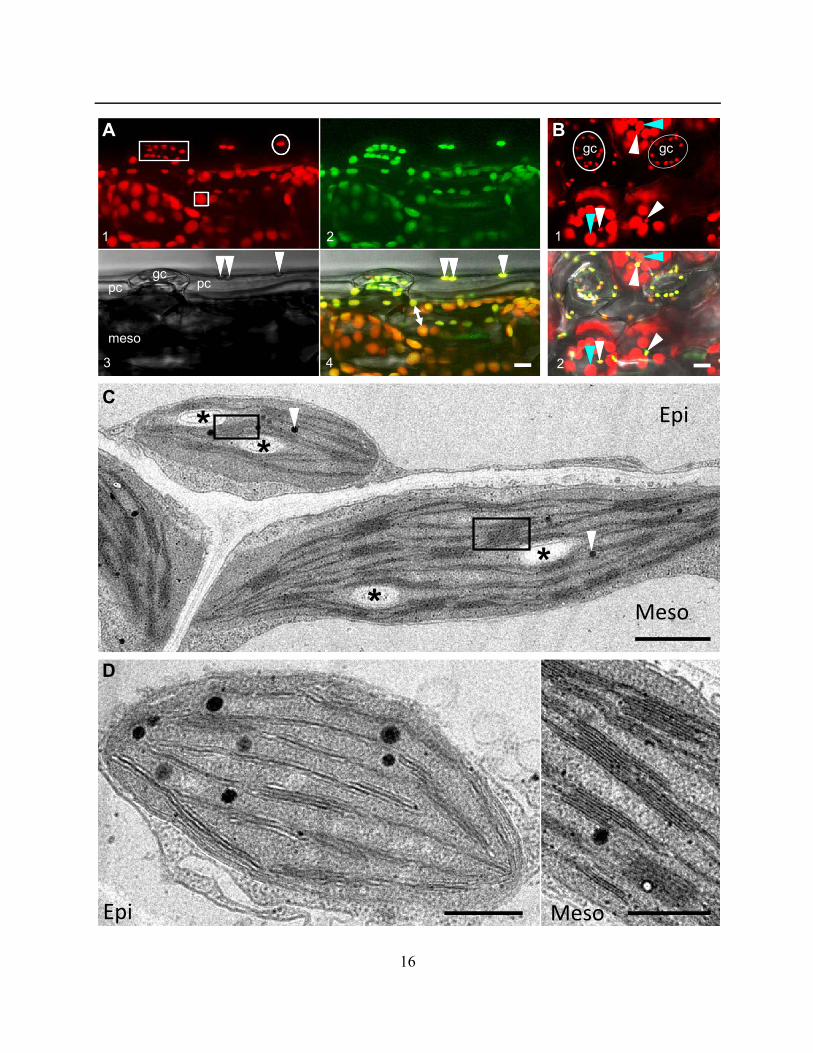
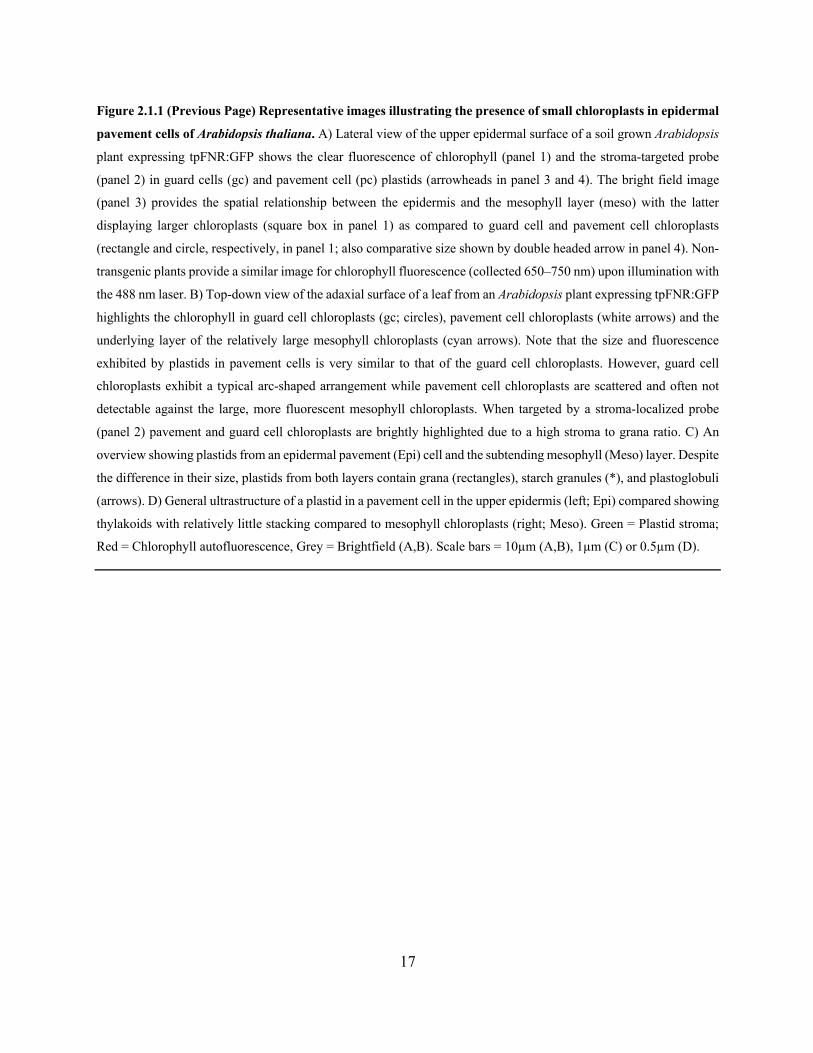
Figure 2.1.1 (Previous Page) Representative images illustrating the presence of small chloroplasts in epidermal
pavement cells of Arabidopsis thaliana. A) Lateral view of the upper epidermal surface of a soil grown Arabidopsis
plant expressing tpFNR:GFP shows the clear fluorescence of chlorophyll (panel 1) and the stroma-targeted probe
(panel 2) in guard cells (gc) and pavement cell (pc) plastids (arrowheads in panel 3 and 4). The bright field image
(panel 3) provides the spatial relationship between the epidermis and the mesophyll layer (meso) with the latter
displaying larger chloroplasts (square box in panel 1) as compared to guard cell and pavement cell chloroplasts
(rectangle and circle, respectively, in panel 1; also comparative size shown by double headed arrow in panel 4). Non-
transgenic plants provide a similar image for chlorophyll fluorescence (collected 650–750 nm) upon illumination with
the 488 nm laser. B) Top-down view of the adaxial surface of a leaf from an Arabidopsis plant expressing tpFNR:GFP
highlights the chlorophyll in guard cell chloroplasts (gc; circles), pavement cell chloroplasts (white arrows) and the
underlying layer of the relatively large mesophyll chloroplasts (cyan arrows). Note that the size and fluorescence
exhibited by plastids in pavement cells is very similar to that of the guard cell chloroplasts. However, guard cell
chloroplasts exhibit a typical arc-shaped arrangement while pavement cell chloroplasts are scattered and often not
detectable against the large, more fluorescent mesophyll chloroplasts. When targeted by a stroma-localized probe
(panel 2) pavement and guard cell chloroplasts are brightly highlighted due to a high stroma to grana ratio. C) An
overview showing plastids from an epidermal pavement (Epi) cell and the subtending mesophyll (Meso) layer. Despite
the difference in their size, plastids from both layers contain grana (rectangles), starch granules (*), and plastoglobuli
(arrows). D) General ultrastructure of a plastid in a pavement cell in the upper epidermis (left; Epi) compared showing
thylakoids with relatively little stacking compared to mesophyll chloroplasts (right; Meso). Green = Plastid stroma;
Red = Chlorophyll autofluorescence, Grey = Brightfield (A,B). Scale bars = 10µm (A,B), 1µm (C) or 0.5µm (D).
18
2.2 Chloroplast behaviour and interactions with other organelles in
Arabidopsis thaliana pavement cells. Kiah A. Barton, Michael R. Wozny, Neeta Mathur, Erica-Ashley Jaipargas, Jaideep Mathur 1*
1. Laboratory of Plant Development and Interactions, Department of Molecular and Cellular
Biology, University of Guelph, 50 Stone Rd., Guelph. ON. N1G2W1. Canada.
The development of the transgenic plant lines was carried out by J Mathur, N Mathur, and K
Barton. Plant line growth and maintenance was performed by N Mathur. The assessment of the
presence of chlorophyll under varying scenarios was carried out by K Barton. Imaging of the
positional relationship between the chloroplast and other cellular structures was performed by K
Barton and J Mathur. MR Wozny and E-A Jaipargas performed the investigation on mitochondria
and peroxisome interactions with the chloroplast. K Barton performed the assessment of
chloroplast responses to light and sugar.
Published in the Journal of Cell Science (2018) 131: jcs202275. Minor modifications have
been made for presentation within this thesis.
2.2.1 Introduction
Plastids are multi-functional, pleomorphic organelles of purported endo-symbiotic origin that
display a characteristic double membrane envelope in plants and green algae (Wise, 2007).
Observations on the basic features of plastids date back to the mid-seventeenth century (reviewed
by Gunning et al., 2007). All plastid types are believed to originate as colourless pro-plastids in
meristems (Schimper, 1883, 1885) and their subsequent differentiation takes place according to
tissue and developmental requirements (Jarvis and López-Juez, 2013; Paila et al., 2015; Liebers et
al., 2017). Early studies by Schimper (1883, 1885) established the inter-convertibility of plastids
from one type to another. Presently, on the basis of pigmentation, chloroplasts are distinguished
from other plastids by the presence of chlorophyll, chromoplasts by the predominance of other
pigments, and leucoplasts by the absence of all pigmentation.
19
In higher plants, the majority of chloroplasts are found in the leaf mesophyll tissue and, at the
ultra-structural level, display the classical thylakoid membrane system of stacked thylakoid grana
connected by intergranal lamellae. However, chloroplasts in the bundle sheath cells of C4 plants
are often agranal (Bisalputra et al., 1969; Woo et al., 1970), suggesting that well-defined grana are
not a requirement for identification as a chloroplast. Although the majority of photosynthesis
occurs in the mesophyll, the guard cells of most plant species are recognized as having chloroplasts
that possess an active electron transport chain, are capable of fixing carbon dioxide and play an
important role in stomatal opening and closing (Lawson, 2008; Lawson et al., 2014).
In addition to guard cells the aerial epidermis consists of trichomes and large pavement cells. It is
widely believed that chloroplasts are absent from the pavement cells of Arabidopsis and most other
higher plants (MacDonald, 2003; Smith, 2005; Bowes and Mauseth, 2008; Solomon et al., 2010;
Vaughan, 2013; Brunkard et al., 2015). However, the presence of chloroplasts in pavement cells
of Arabidopsis thaliana is well documented (Pyke and Leech, 1994; Roberston et al., 1996; Vitha
et al., 2001; Joo et al., 2005; Pyke, 2009) and was reinforced by recent observations (Barton et al.,
2016).
Pavement cell chloroplasts (PCCs) in Arabidopsis are comparable in size to guard cell chloroplasts
but are approximately half the size of mesophyll chloroplasts (MCCs). In the jigsaw shaped
pavement cells in expanded cotyledons and leaves of Arabidopsis, 9 to 15 PCCs are found per cell,
while a single mesophyll cell may contain over 120 chloroplasts (Pyke and Leech, 1992, 1994;
Barton et al., 2016). PCCs are photosynthetically active and show clear grana, but their chlorophyll
autofluorescence signal is low compared to MCCs (Barton et al., 2016). A high stroma to thylakoid
ratio in PCCs means, upon expressing plastid-targeted fluorescent proteins, they are easier to
image than are MCCs, so these plastids are sometimes used for visual studies of plastid responses
(Kwok and Hanson, 2004a; Higa et al., 2014; Caplan et al., 2015; Brunkard et al., 2015). However,
whether this small population shows responses that are representative of all chloroplasts is
uncertain and much remains unknown about the spatiotemporal behaviour of PCCs or their
relationship with other cellular components and compartments.
20
Here we use a range of fluorescent protein probes targeted to the chloroplasts and other subcellular
structures to investigate PCCs and their surroundings, and contrast PCCs response to light and
sucrose with that of MCCs. The creation of new transgenic plant resources, and characterization
of PCCs from a cell biological, physiological and developmental perspective lays down the
foundation for further investigations on the actual contribution of these small chloroplasts during
plant interactions with the environment.
2.2.2 Results
2.2.2.1 Identifying the PCCs and creating resources for their characterization
The presence of PCCs in Arabidopsis was best appreciated when the pavement cells were viewed
from a lateral perspective. As shown in Fig. 2.2.1, this view was easily achieved for pavement
cells lying at the edges of cotyledons and leaves. It allowed direct observation of the subcellular
environment around the PCCs without interference from the fluorescence signal of underlying
mesophyll layers. The PCCs are small when compared to the MCCs; however, even from a lateral
view, it can appear that some small chloroplasts are in the mesophyll plane when the pavement
and mesophyll cells are closely interlocked. In order to confirm that the smaller chloroplasts were
located exclusively in the pavement cells, the Arabidopsis crooked (crk) and wurm (wrm) mutants
were used. In these mutants, epidermal cells in the hypocotyl, cotyledons, and young leaves
become abnormally elongated upon detachment from each other along the long axis (Fig. 2.2.1A;
Mathur, 2005). Similar to in wild-type plants, two chloroplast populations were visible in crk and
wrm mutants, one consisting of small chloroplasts and the other large chloroplasts. The pavement
cells that had curved out of the general epidermal plane in crk and wrm plants clearly exhibited
small PCCs, while cells in the layers beneath displayed only the larger MCCs. (Fig. 2.2.1B). In
wild type Arabidopsis, uncertainty about the exact location of chloroplasts in the epidermal or the
mesophyll layer can thus be resolved by observing their relative sizes.
A number of double transgenic and mutant Arabidopsis lines expressing different targeted
fluorescent probes were created for understanding PCC behaviour in relation to their subcellular
environment (Table 2.2). The following general observations were made on the interactions
between the highlighted organelles and the PCCs.
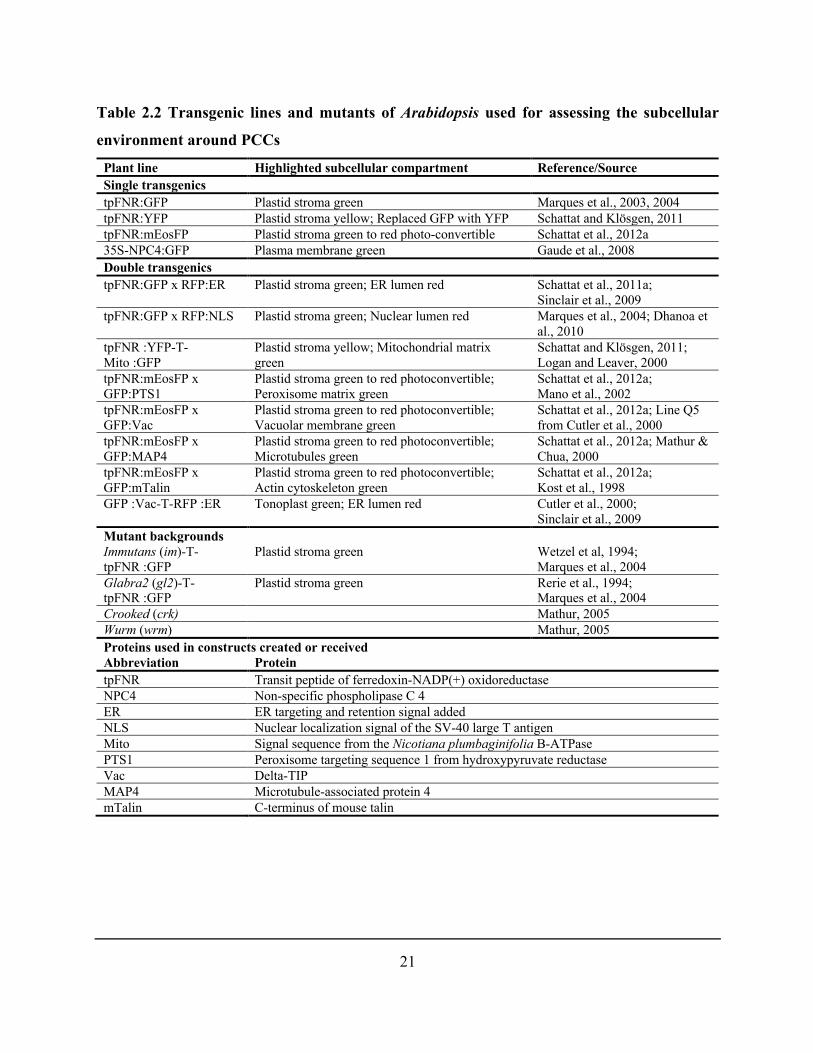
21
Table 2.2 Transgenic lines and mutants of Arabidopsis used for assessing the subcellular
environment around PCCs
Plant line Highlighted subcellular compartment Reference/Source Single transgenics
tpFNR:GFP Plastid stroma green Marques et al., 2003, 2004
tpFNR:YFP Plastid stroma yellow; Replaced GFP with YFP Schattat and Klösgen, 2011
tpFNR:mEosFP Plastid stroma green to red photo-convertible Schattat et al., 2012a
35S-NPC4:GFP Plasma membrane green Gaude et al., 2008
Double transgenics
tpFNR:GFP x RFP:ER Plastid stroma green; ER lumen red Schattat et al., 2011a;
Sinclair et al., 2009
tpFNR:GFP x RFP:NLS Plastid stroma green; Nuclear lumen red Marques et al., 2004; Dhanoa et
al., 2010
tpFNR :YFP-T-
Mito :GFP
Plastid stroma yellow; Mitochondrial matrix
green
Schattat and Klösgen, 2011;
Logan and Leaver, 2000
tpFNR:mEosFP x
GFP:PTS1
Plastid stroma green to red photoconvertible;
Peroxisome matrix green
Schattat et al., 2012a;
Mano et al., 2002
tpFNR:mEosFP x
GFP:Vac
Plastid stroma green to red photoconvertible;
Vacuolar membrane green
Schattat et al., 2012a; Line Q5
from Cutler et al., 2000
tpFNR:mEosFP x
GFP:MAP4
Plastid stroma green to red photoconvertible;
Microtubules green
Schattat et al., 2012a; Mathur &
Chua, 2000
tpFNR:mEosFP x
GFP:mTalin
Plastid stroma green to red photoconvertible;
Actin cytoskeleton green
Schattat et al., 2012a;
Kost et al., 1998
GFP :Vac-T-RFP :ER Tonoplast green; ER lumen red Cutler et al., 2000;
Sinclair et al., 2009
Mutant backgrounds
Immutans (im)-T-
tpFNR :GFP
Plastid stroma green Wetzel et al, 1994;
Marques et al., 2004
Glabra2 (gl2)-T-tpFNR :GFP
Plastid stroma green Rerie et al., 1994; Marques et al., 2004
Crooked (crk) Mathur, 2005
Wurm (wrm) Mathur, 2005
Proteins used in constructs created or received
Abbreviation Protein
tpFNR Transit peptide of ferredoxin-NADP(+) oxidoreductase
NPC4 Non-specific phospholipase C 4
ER ER targeting and retention signal added
NLS Nuclear localization signal of the SV-40 large T antigen
Mito Signal sequence from the Nicotiana plumbaginifolia B-ATPase
PTS1 Peroxisome targeting sequence 1 from hydroxypyruvate reductase
Vac Delta-TIP
MAP4 Microtubule-associated protein 4
mTalin C-terminus of mouse talin
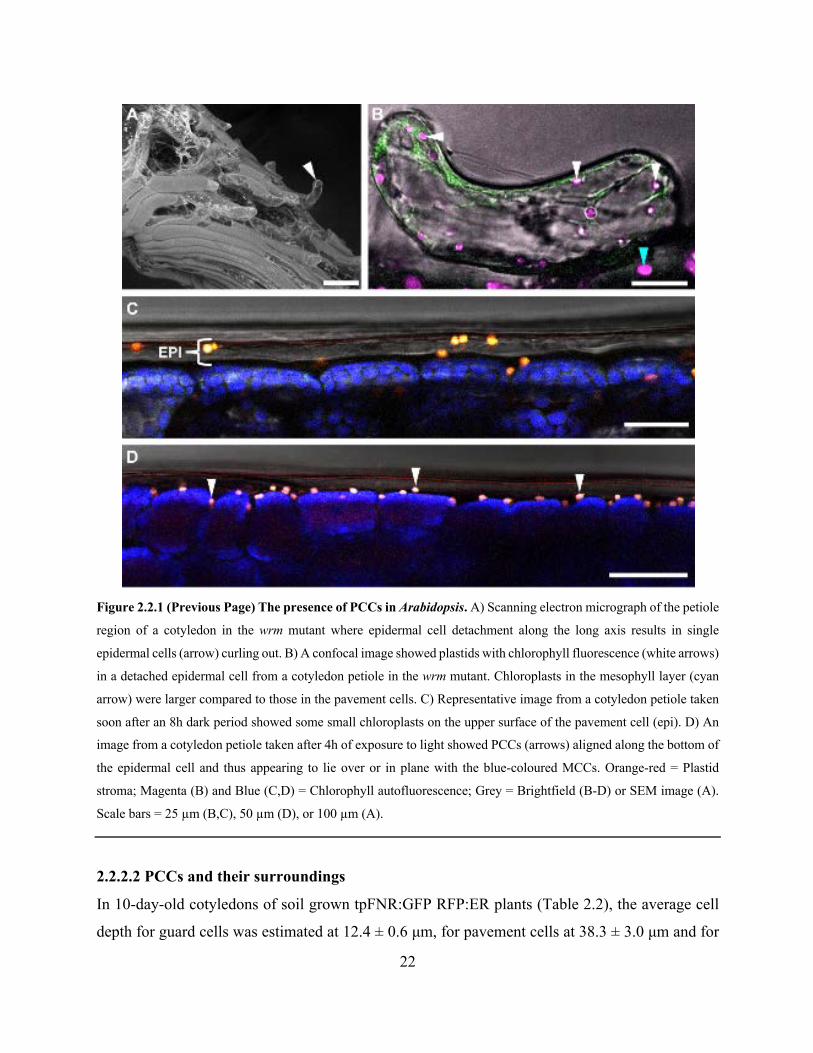
22
Figure 2.2.1 (Previous Page) The presence of PCCs in Arabidopsis. A) Scanning electron micrograph of the petiole
region of a cotyledon in the wrm mutant where epidermal cell detachment along the long axis results in single
epidermal cells (arrow) curling out. B) A confocal image showed plastids with chlorophyll fluorescence (white arrows)
in a detached epidermal cell from a cotyledon petiole in the wrm mutant. Chloroplasts in the mesophyll layer (cyan
arrow) were larger compared to those in the pavement cells. C) Representative image from a cotyledon petiole taken
soon after an 8h dark period showed some small chloroplasts on the upper surface of the pavement cell (epi). D) An
image from a cotyledon petiole taken after 4h of exposure to light showed PCCs (arrows) aligned along the bottom of
the epidermal cell and thus appearing to lie over or in plane with the blue-coloured MCCs. Orange-red = Plastid
stroma; Magenta (B) and Blue (C,D) = Chlorophyll autofluorescence; Grey = Brightfield (B-D) or SEM image (A).
Scale bars = 25 µm (B,C), 50 µm (D), or 100 µm (A).
2.2.2.2 PCCs and their surroundings
In 10-day-old cotyledons of soil grown tpFNR:GFP RFP:ER plants (Table 2.2), the average cell
depth for guard cells was estimated at 12.4 ± 0.6 μm, for pavement cells at 38.3 ± 3.0 μm and for
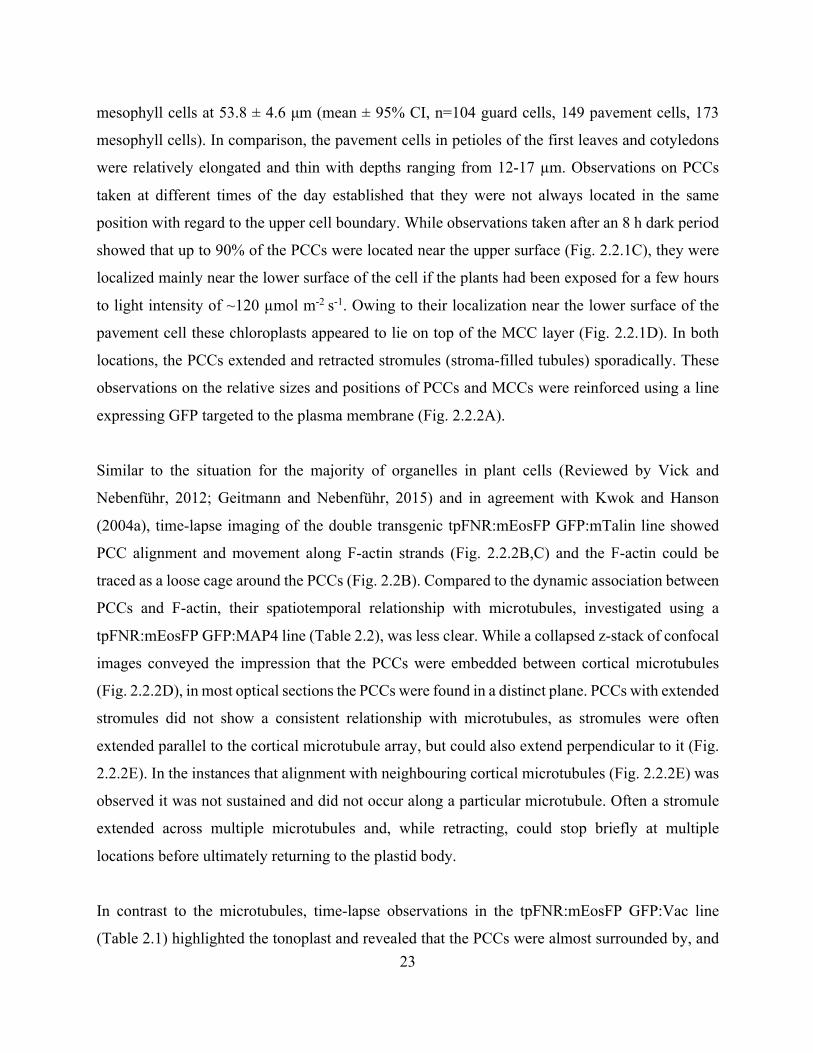
23
mesophyll cells at 53.8 ± 4.6 μm (mean ± 95% CI, n=104 guard cells, 149 pavement cells, 173
mesophyll cells). In comparison, the pavement cells in petioles of the first leaves and cotyledons
were relatively elongated and thin with depths ranging from 12-17 µm. Observations on PCCs
taken at different times of the day established that they were not always located in the same
position with regard to the upper cell boundary. While observations taken after an 8 h dark period
showed that up to 90% of the PCCs were located near the upper surface (Fig. 2.2.1C), they were
localized mainly near the lower surface of the cell if the plants had been exposed for a few hours
to light intensity of ~120 µmol m-2 s-1. Owing to their localization near the lower surface of the
pavement cell these chloroplasts appeared to lie on top of the MCC layer (Fig. 2.2.1D). In both
locations, the PCCs extended and retracted stromules (stroma-filled tubules) sporadically. These
observations on the relative sizes and positions of PCCs and MCCs were reinforced using a line
expressing GFP targeted to the plasma membrane (Fig. 2.2.2A).
Similar to the situation for the majority of organelles in plant cells (Reviewed by Vick and
Nebenführ, 2012; Geitmann and Nebenführ, 2015) and in agreement with Kwok and Hanson
(2004a), time-lapse imaging of the double transgenic tpFNR:mEosFP GFP:mTalin line showed
PCC alignment and movement along F-actin strands (Fig. 2.2.2B,C) and the F-actin could be
traced as a loose cage around the PCCs (Fig. 2.2B). Compared to the dynamic association between
PCCs and F-actin, their spatiotemporal relationship with microtubules, investigated using a
tpFNR:mEosFP GFP:MAP4 line (Table 2.2), was less clear. While a collapsed z-stack of confocal
images conveyed the impression that the PCCs were embedded between cortical microtubules
(Fig. 2.2.2D), in most optical sections the PCCs were found in a distinct plane. PCCs with extended
stromules did not show a consistent relationship with microtubules, as stromules were often
extended parallel to the cortical microtubule array, but could also extend perpendicular to it (Fig.
2.2.2E). In the instances that alignment with neighbouring cortical microtubules (Fig. 2.2.2E) was
observed it was not sustained and did not occur along a particular microtubule. Often a stromule
extended across multiple microtubules and, while retracting, could stop briefly at multiple
locations before ultimately returning to the plastid body.
In contrast to the microtubules, time-lapse observations in the tpFNR:mEosFP GFP:Vac line
(Table 2.1) highlighted the tonoplast and revealed that the PCCs were almost surrounded by, and

24
could be tugged on by the movement of, thin vacuolar tubules (Fig. 2.2.2F). For PCCs located on
the cell periphery (Fig. 2.2.2G), the vacuole was closely appressed to the plastid on the side interior
to the cell. In all cases, time-lapse imaging suggested that the vacuolar membrane flowed loosely
over the chloroplast surface (Fig. 2.2.2H). Whereas a top-down view (Fig. 2.2.2H) also suggested
a very close association between PCCs and the vacuolar membranes, we were perplexed by the
presence of many areas that looked very similar in size to the PCCs but did not show the typical
chloroplast fluorescence (Fig. 2.2.2I). We found the observations with the vacuole probe
reminiscent of earlier observations on chloroplasts made using lines co-expressing tpFNR:GFP
and an ER-targeted RFP (Schattat et al., 2011a). As reported previously (Schattat et al., 2011a),
the PCCs were embedded within an ER cage surrounding the entire chloroplast (Fig. 2.2.2K) and
both organelles moved in concert. Stromules extended sporadically from the PCCs and aligned
closely with the ER mesh or extended along ER-lined channels (Fig. 2.2.2L,M). In order to
understand the PCC-vacuole-ER relationship better, we developed a double transgenic line co-
expressing the vacuole-targeted GFP and the ER-targeted RFP. Using this line, it was found that
the vacuole presses against and outlines other organelles in a similar manner. Lateral views of
PCCs in the GFP:Vac RFP:ER line (Table 2.2) showed that the ER-cage was located between the
vacuolar membrane and the PCCs (Fig. 2.2.2J) and that ER bodies could be amongst the organelles
appearing similar in size to PCCs (Fig. 2.2.2J).
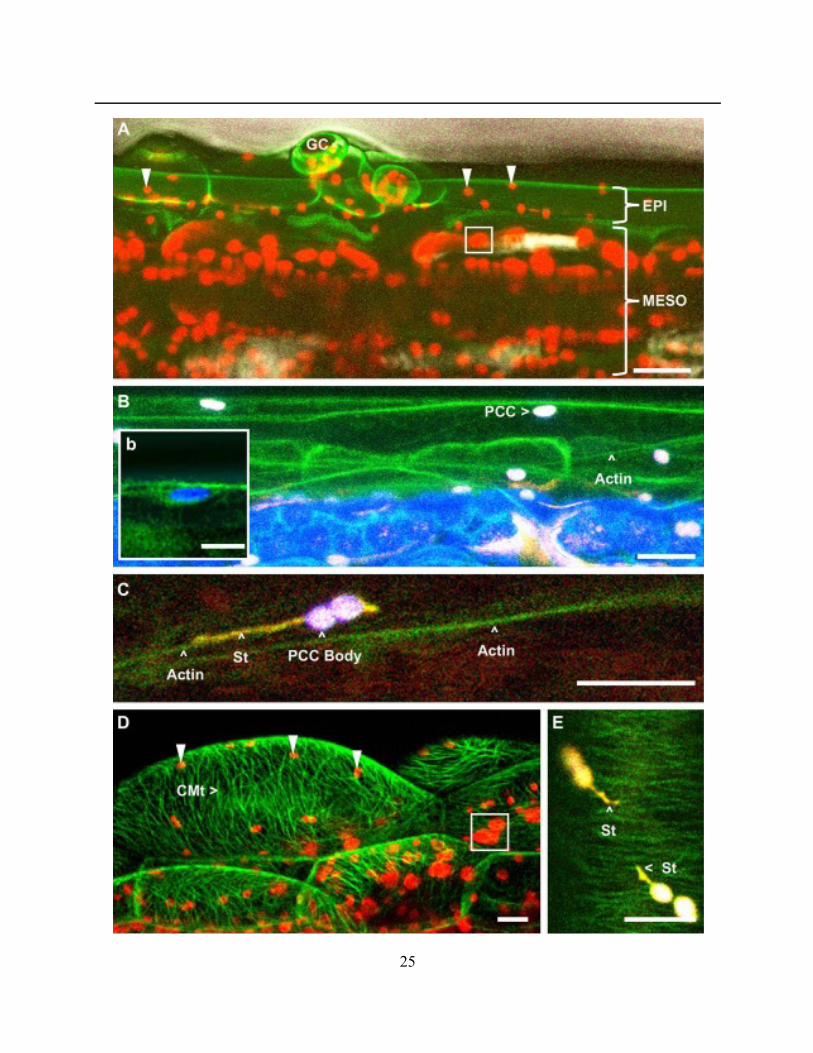
25
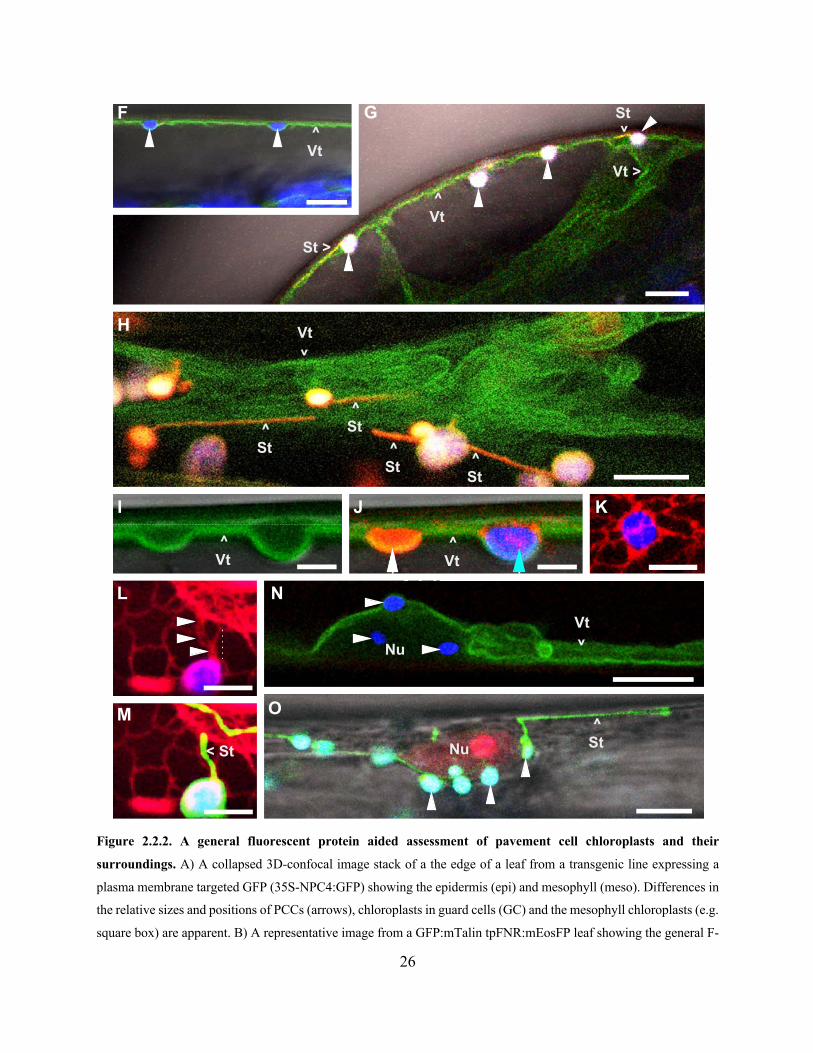
26
Figure 2.2.2. A general fluorescent protein aided assessment of pavement cell chloroplasts and their
surroundings. A) A collapsed 3D-confocal image stack of a the edge of a leaf from a transgenic line expressing a
plasma membrane targeted GFP (35S-NPC4:GFP) showing the epidermis (epi) and mesophyll (meso). Differences in
the relative sizes and positions of PCCs (arrows), chloroplasts in guard cells (GC) and the mesophyll chloroplasts (e.g.
square box) are apparent. B) A representative image from a GFP:mTalin tpFNR:mEosFP leaf showing the general F-
^Vt
^Vt
Vt >
St^
St >
^St
^St
^St ^
St
^Vt
^Vt
Vt^
< St
Vt^
Nu
Nu^
St
F G
H
I J K
L
M
N
O
27
actin cytoskeleton around PCCs and an inset ‘b’ showing a magnified view of F-actin cage around a single PCC. The
underlying blue layer contains the MCCs, which have a high level of chlorophyll. C) Image from the GFP:mTalin
tpFNR:mEosFP line shows the main chloroplast body and the elongated stromule (St) aligned with an actin strand. D)
Most PCCs in a GFP:MAP4 line do not appear in the same plane as cortical microtubules (CMt) and a collapsed 3D
stack of confocal images suggests their random dispersal in the cell at different planes. Relative to the PCCs (arrows)
the MCCs (e.g. box) appear large. E) A collapsed stack of 3D confocal images from a GFP:MAP4 tpFNR:mEosFP
line suggests that stromules (St) may align transiently with cortical microtubules over short distances. F) PCCs
appressed against the upper boundary of a pavement cell by the green fluorescent vacuole (Vt) in a GFP:Vac line. The
underlying MCCs are also visible in the bottom right. G) Lateral view of a pavement cell in the GFP:Vac
tpFNR:mEosFP line showing the peripheral localization of PCCs (arrows) with extended stromules (St) and
subtending vacuolar tubules (Vt). H) A top down view of a pavement cell shows PCCs with stromules (St) engulfed
by vacuolar tubules (Vt). I) An image from the GFP:Vac RFP:ER transgenic line shows the vacuolar membrane (Vt)
surrounding structures of the same size as PCCs. J) Image acquired from an RFP:ER GFP:Vac double transgenic
shows that the structures suggested in ‘I’ are due to the vacuole (Vt) surrounding an ER-body (white arrow) and a
PCC (cyan arrow). K) Image of a PCC with an ER cage similar to that observed around MCCs. L) Image of a
chlorophyll-containing PCC-body enmeshed in an ER cage and with a contiguous ER channel (arrows) in a
tpFNR:GFP RFP:ER line. M) Image from L of a PCC from the tpFNR:GFP RFP:ER line with green fluorescent
stromules (St) extended into the ER channel. N) Image of the vacuolar tubules (Vt) engulfing the nucleus (Nu), with
three PCCs (arrows) in the peri-nuclear region. O) Image of PCCs with and without extended stromules (St) clustered
around a nucleus (Nu) in a tpFNR:GFP RFP:NLS line. Green = Plasma membrane (A), Actin cytoskeleton (B,C),
Microtubules (D,E), Vacuolar membrane (F-J, N) or Plastid stroma (M,O); Yellow-orange = Plastid stroma
(B,C,E,G,H); Red = Chlorophyll autofluorescence (A,D), ER (K-M) or Nucleus (O); Blue = Chlorophyll
autofluorescence (B,C,F-H,J-O). Scale bars = 5 µm (I-M), 10 µm (B-H,N,O), or 25 µm (A).
The vacuolar tubules also engulfed the nucleus and allowed us to observe nucleus-associated PCCs
(Fig. 2.2.2N). A line co-expressing the tpFNR:GFP and a nucleus-targeted RFP was developed
and showed that in 15 ± 3% (mean ± s.d; n=80 cells from four seedlings) of cotyledon pavement
cells in 7-day-old seedlings, anywhere between 3 to 12 PCCs could be found in the perinuclear
region (Fig. 2.2.2O). The nuclear association was often transient and a variable number of PCCs
were observed reaching the perinuclear region or moving away from it. In the remaining cells, the
PCCs were dispersed and showed no clear nuclear association. Upon observing stromules extended
by the perinuclear PCCs we were unable to find a clear indication whether the stromules extended
towards or away from the nucleus.
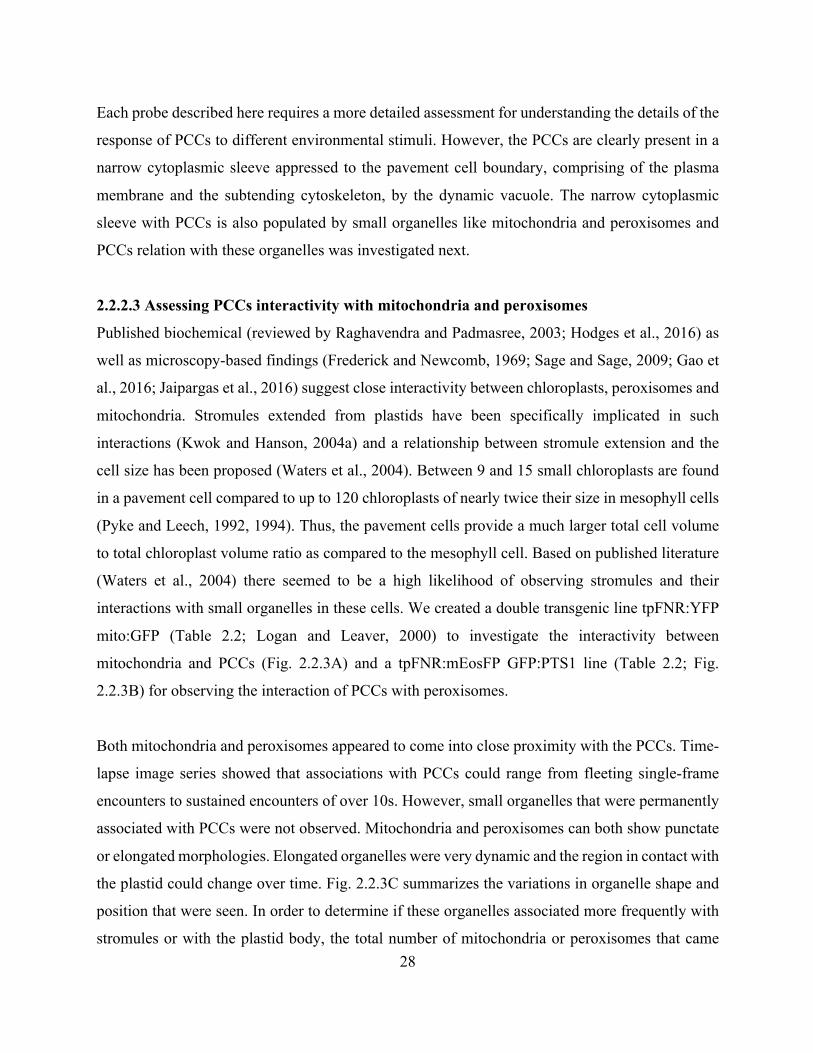
28
Each probe described here requires a more detailed assessment for understanding the details of the
response of PCCs to different environmental stimuli. However, the PCCs are clearly present in a
narrow cytoplasmic sleeve appressed to the pavement cell boundary, comprising of the plasma
membrane and the subtending cytoskeleton, by the dynamic vacuole. The narrow cytoplasmic
sleeve with PCCs is also populated by small organelles like mitochondria and peroxisomes and
PCCs relation with these organelles was investigated next.
2.2.2.3 Assessing PCCs interactivity with mitochondria and peroxisomes
Published biochemical (reviewed by Raghavendra and Padmasree, 2003; Hodges et al., 2016) as
well as microscopy-based findings (Frederick and Newcomb, 1969; Sage and Sage, 2009; Gao et
al., 2016; Jaipargas et al., 2016) suggest close interactivity between chloroplasts, peroxisomes and
mitochondria. Stromules extended from plastids have been specifically implicated in such
interactions (Kwok and Hanson, 2004a) and a relationship between stromule extension and the
cell size has been proposed (Waters et al., 2004). Between 9 and 15 small chloroplasts are found
in a pavement cell compared to up to 120 chloroplasts of nearly twice their size in mesophyll cells
(Pyke and Leech, 1992, 1994). Thus, the pavement cells provide a much larger total cell volume
to total chloroplast volume ratio as compared to the mesophyll cell. Based on published literature
(Waters et al., 2004) there seemed to be a high likelihood of observing stromules and their
interactions with small organelles in these cells. We created a double transgenic line tpFNR:YFP
mito:GFP (Table 2.2; Logan and Leaver, 2000) to investigate the interactivity between
mitochondria and PCCs (Fig. 2.2.3A) and a tpFNR:mEosFP GFP:PTS1 line (Table 2.2; Fig.
2.2.3B) for observing the interaction of PCCs with peroxisomes.
Both mitochondria and peroxisomes appeared to come into close proximity with the PCCs. Time-
lapse image series showed that associations with PCCs could range from fleeting single-frame
encounters to sustained encounters of over 10s. However, small organelles that were permanently
associated with PCCs were not observed. Mitochondria and peroxisomes can both show punctate
or elongated morphologies. Elongated organelles were very dynamic and the region in contact with
the plastid could change over time. Fig. 2.2.3C summarizes the variations in organelle shape and
position that were seen. In order to determine if these organelles associated more frequently with
stromules or with the plastid body, the total number of mitochondria or peroxisomes that came
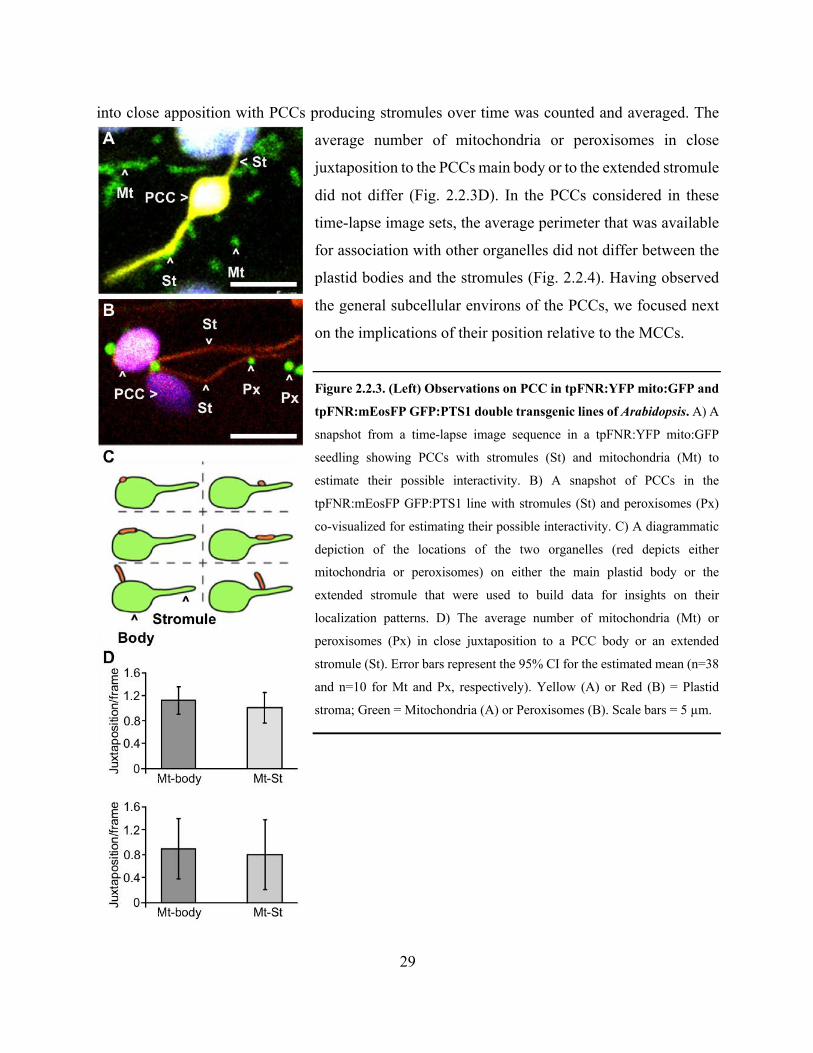
29
into close apposition with PCCs producing stromules over time was counted and averaged. The
average number of mitochondria or peroxisomes in close
juxtaposition to the PCCs main body or to the extended stromule
did not differ (Fig. 2.2.3D). In the PCCs considered in these
time-lapse image sets, the average perimeter that was available
for association with other organelles did not differ between the
plastid bodies and the stromules (Fig. 2.2.4). Having observed
the general subcellular environs of the PCCs, we focused next
on the implications of their position relative to the MCCs.
Figure 2.2.3. (Left) Observations on PCC in tpFNR:YFP mito:GFP and
tpFNR:mEosFP GFP:PTS1 double transgenic lines of Arabidopsis. A) A
snapshot from a time-lapse image sequence in a tpFNR:YFP mito:GFP
seedling showing PCCs with stromules (St) and mitochondria (Mt) to
estimate their possible interactivity. B) A snapshot of PCCs in the
tpFNR:mEosFP GFP:PTS1 line with stromules (St) and peroxisomes (Px)
co-visualized for estimating their possible interactivity. C) A diagrammatic
depiction of the locations of the two organelles (red depicts either
mitochondria or peroxisomes) on either the main plastid body or the
extended stromule that were used to build data for insights on their
localization patterns. D) The average number of mitochondria (Mt) or
peroxisomes (Px) in close juxtaposition to a PCC body or an extended
stromule (St). Error bars represent the 95% CI for the estimated mean (n=38
and n=10 for Mt and Px, respectively). Yellow (A) or Red (B) = Plastid
stroma; Green = Mitochondria (A) or Peroxisomes (B). Scale bars = 5 µm.
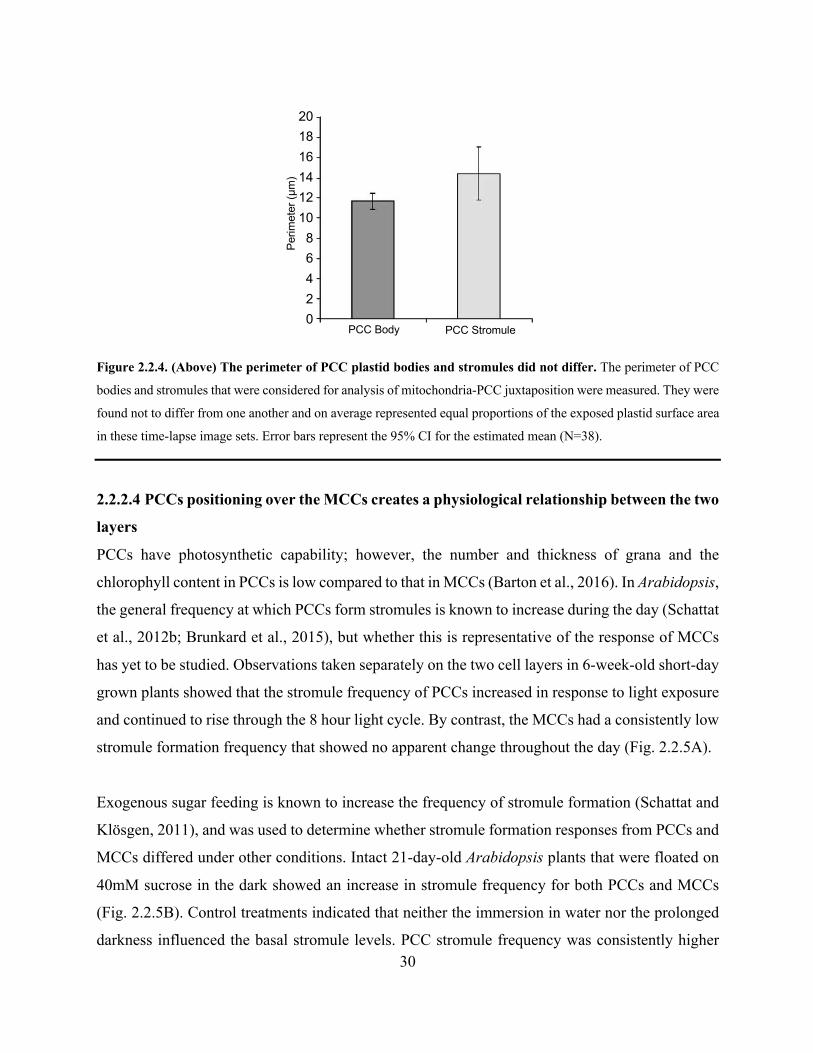
30
Figure 2.2.4. (Above) The perimeter of PCC plastid bodies and stromules did not differ. The perimeter of PCC
bodies and stromules that were considered for analysis of mitochondria-PCC juxtaposition were measured. They were
found not to differ from one another and on average represented equal proportions of the exposed plastid surface area
in these time-lapse image sets. Error bars represent the 95% CI for the estimated mean (N=38).
2.2.2.4 PCCs positioning over the MCCs creates a physiological relationship between the two
layers
PCCs have photosynthetic capability; however, the number and thickness of grana and the
chlorophyll content in PCCs is low compared to that in MCCs (Barton et al., 2016). In Arabidopsis,
the general frequency at which PCCs form stromules is known to increase during the day (Schattat
et al., 2012b; Brunkard et al., 2015), but whether this is representative of the response of MCCs
has yet to be studied. Observations taken separately on the two cell layers in 6-week-old short-day
grown plants showed that the stromule frequency of PCCs increased in response to light exposure
and continued to rise through the 8 hour light cycle. By contrast, the MCCs had a consistently low
stromule formation frequency that showed no apparent change throughout the day (Fig. 2.2.5A).
Exogenous sugar feeding is known to increase the frequency of stromule formation (Schattat and
Klösgen, 2011), and was used to determine whether stromule formation responses from PCCs and
MCCs differed under other conditions. Intact 21-day-old Arabidopsis plants that were floated on
40mM sucrose in the dark showed an increase in stromule frequency for both PCCs and MCCs
(Fig. 2.2.5B). Control treatments indicated that neither the immersion in water nor the prolonged
darkness influenced the basal stromule levels. PCC stromule frequency was consistently higher
20181614121086420
Perim
eter
(µm
)
PCC Body PCC Stromule

31
than that of MCCs, but for both populations the increase began within the first hour, and continued
to rise throughout the 5h of treatment (Fig. 2.2.5B). However, the stromule formation response
from MCCs was almost entirely inhibited when the plants were exposed to light during the sucrose
treatment, while the PCC response was unchanged from that in the dark treatment (Fig. 2.2.5C,D).
During our light and sugar experiments, chlorophyll autofluorescence confirmed that the plastids
of all pavement cells observed were indeed chloroplasts. However, reports of leucoplasts in
pavement cells of Arabidopsis do exist, so we further investigated under what conditions this could
occur and how the behaviour and appearance of epidermal leucoplasts differ from PCCs.
32
Figure 2.2.5. (Previous Page) Using stromule formation to assess the physiological relationship between
epidermal and mesophyll layers. A) Frequency of stromule formation (stromule frequency) of PCCs and MCCs over
an 8h light period in 6-week-old plants grown under short-day conditions. B) Hourly change in stromule frequency of
PCCs and MCCs in response to treatment with a 40 mM sucrose solution. C,D) Stromule frequency of PCCs (C) and
MCCs (D) in 21-day-old plants treated with 40 mM sucrose or a water control for 3 hours. Plants were either kept in
the dark or exposed to 120µmol m-2 s-1 light during the treatment. Error bars represent the 95% CI for the estimated
mean (n=16) for all experiments. Letters indicate statistically significant groups (p < 0.05). Statistical comparisons for
A and B were only done within a plastid type (PCC or MCC), with distinct letters used for each.
2.2.2.5 A developmental perspective: Exploring PCCs and plastid-interconvertibility
Leucoplasts, by definition (Schimper, 1883; 1885), do not contain chlorophyll and are stroma-rich.
When using the stroma-targeted tpFNR:GFP probe (Marques et al., 2004; Schattat and Klösgen,
2011), leucoplasts appear uniformly green fluorescent (emission 510 - 520nm), while the green
stromal fluorescence in chloroplasts surrounds the chlorophyll autofluorescence of the grana
(emission 650 - 750nm). This allowed us to monitor the presence of both plastid types in pavement
cells during development. We first investigated whether chloroplasts are the default plastid type
in the epidermis of Arabidopsis.
Observations on Arabidopsis leaves in the tpFNR:GFP line (Table 2.2) revealed that, unlike in the
chloroplast-containing guard and pavement cells, trichome plastids are leucoplasts (Fig. 2.6A). As
trichomes are initiated from protodermal cells in expanding leaves (Szymanski et al., 2000;
Schellmann and Hülskamp, 2005), if the chloroplast represents the standard plastid type in
epidermal cells, the chlorophyll must be lost from trichome plastids as the cell differentiates. In
the glabra2 (gl2) mutant of Arabidopsis the trichome differentiation was initiated, but the majority
of trichomes did not remain committed to the trichome fate and either matured into small spikes
(Fig. 2.2.6B,C) or collapsed into large misshapen cells very similar to pavement cells (Fig. 2.2.6D;
Rerie et al., 1994). In a gl2 GFP:mTalin line where the green fluorescence provides cellular context
to the chlorophyll auto-fluorescence, the aberrant trichomes had chloroplasts rather than
leucoplasts (Fig. 2.2.6E,F). Therefore, guard cells, pavement cells, and trichome cells that have
not completely differentiated all contain chloroplasts in Arabidopsis.

33
Figure 2.2.6 Images showing leucoplasts and chloroplasts in and around trichome cells in Arabidopsis
expressing tpFNR:GFP and in the glabra2 (gl2) mutant epidermal cells. A) A flattened z-stack of confocal images
showing the base of a trichome (tri), the epidermis (epi) and the mesophyll (meso) layers in an Arabidopsis (Columbia
ecotype) plant expressing tpFNR:GFP. Panels 1, 2, 3, 4 show GFP, chlorophyll autofluorescence, a bright field image
and a merged image, respectively. Note the presence of chlorophyll fluorescence in the pavement cells of the epidermal
layer but its complete absence in the trichome cell (panel 2). As shown by the stroma-targeted tpFNR:GFP probe
mature trichomes in Arabidopsis possess leucoplasts only (panel1; arrow). B) A scanning electron microscope image
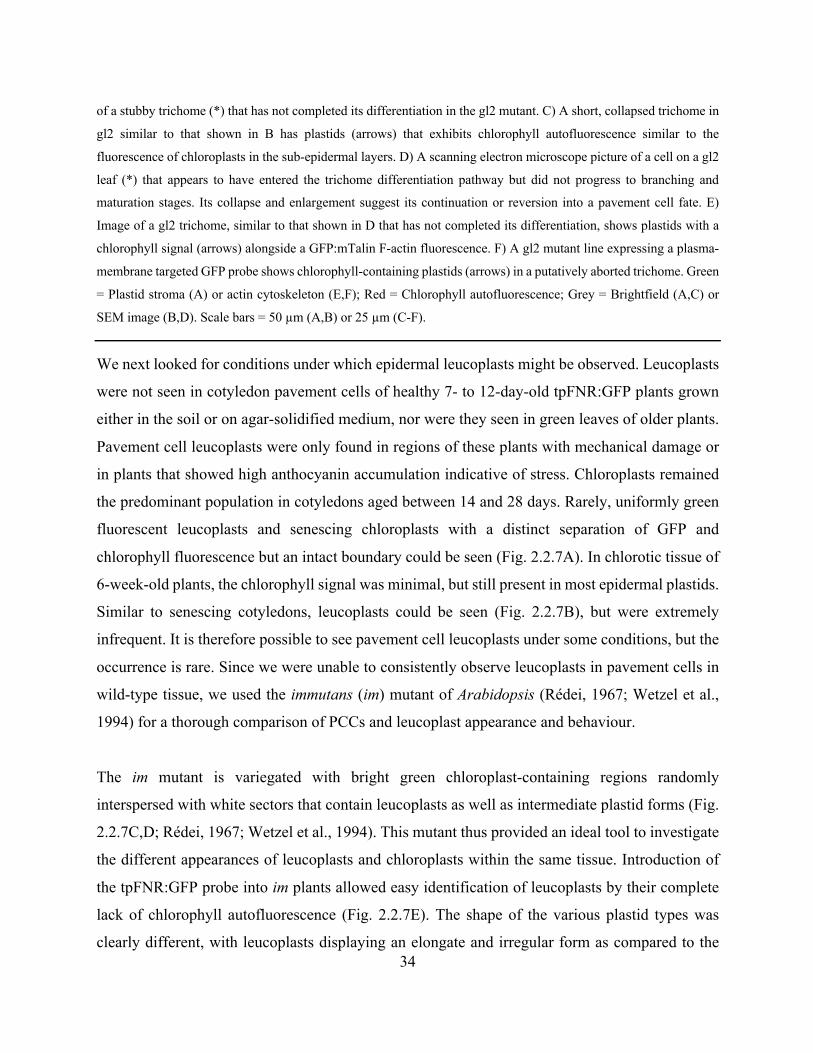
34
of a stubby trichome (*) that has not completed its differentiation in the gl2 mutant. C) A short, collapsed trichome in
gl2 similar to that shown in B has plastids (arrows) that exhibits chlorophyll autofluorescence similar to the
fluorescence of chloroplasts in the sub-epidermal layers. D) A scanning electron microscope picture of a cell on a gl2
leaf (*) that appears to have entered the trichome differentiation pathway but did not progress to branching and
maturation stages. Its collapse and enlargement suggest its continuation or reversion into a pavement cell fate. E)
Image of a gl2 trichome, similar to that shown in D that has not completed its differentiation, shows plastids with a
chlorophyll signal (arrows) alongside a GFP:mTalin F-actin fluorescence. F) A gl2 mutant line expressing a plasma-
membrane targeted GFP probe shows chlorophyll-containing plastids (arrows) in a putatively aborted trichome. Green
= Plastid stroma (A) or actin cytoskeleton (E,F); Red = Chlorophyll autofluorescence; Grey = Brightfield (A,C) or
SEM image (B,D). Scale bars = 50 µm (A,B) or 25 µm (C-F).
We next looked for conditions under which epidermal leucoplasts might be observed. Leucoplasts
were not seen in cotyledon pavement cells of healthy 7- to 12-day-old tpFNR:GFP plants grown
either in the soil or on agar-solidified medium, nor were they seen in green leaves of older plants.
Pavement cell leucoplasts were only found in regions of these plants with mechanical damage or
in plants that showed high anthocyanin accumulation indicative of stress. Chloroplasts remained
the predominant population in cotyledons aged between 14 and 28 days. Rarely, uniformly green
fluorescent leucoplasts and senescing chloroplasts with a distinct separation of GFP and
chlorophyll fluorescence but an intact boundary could be seen (Fig. 2.2.7A). In chlorotic tissue of
6-week-old plants, the chlorophyll signal was minimal, but still present in most epidermal plastids.
Similar to senescing cotyledons, leucoplasts could be seen (Fig. 2.2.7B), but were extremely
infrequent. It is therefore possible to see pavement cell leucoplasts under some conditions, but the
occurrence is rare. Since we were unable to consistently observe leucoplasts in pavement cells in
wild-type tissue, we used the immutans (im) mutant of Arabidopsis (Rédei, 1967; Wetzel et al.,
1994) for a thorough comparison of PCCs and leucoplast appearance and behaviour.
The im mutant is variegated with bright green chloroplast-containing regions randomly
interspersed with white sectors that contain leucoplasts as well as intermediate plastid forms (Fig.
2.2.7C,D; Rédei, 1967; Wetzel et al., 1994). This mutant thus provided an ideal tool to investigate
the different appearances of leucoplasts and chloroplasts within the same tissue. Introduction of
the tpFNR:GFP probe into im plants allowed easy identification of leucoplasts by their complete
lack of chlorophyll autofluorescence (Fig. 2.2.7E). The shape of the various plastid types was
clearly different, with leucoplasts displaying an elongate and irregular form as compared to the
35
consistent, round to oval shape of chloroplasts (e.g. Fig. 2.2.1C). PCCs in green sectors, apart from
the occasional extension of stromules, maintained their lens-like shape over time, whereas
leucoplasts exhibited a dynamic morphology. In rare cases, individual leucoplasts did maintain a
round morphology over time in the pavement cells. Observations on the im leaf epidermis provided
another interesting insight (Fig. 2.2.7F) on plastids. No chlorophyll signal was visible in any
epidermal cell type in the white sectors and even within a pavement or guard cell, the leucoplast
size varied considerably. Similarly, chloroplasts of different sizes were visible in the pavement
cells of green sectors. While the presence of chlorophyll in green sectors reinforced our earlier
observations on wild type plants, it became apparent from the im mutant that plastid size cannot
be considered as a consistent criterion for identification of either leucoplasts or chloroplasts within
a cell layer.
Based on our investigations on the gl2 and im mutants it is clear that there is tremendous condition-
dependent inter-convertibility between the chloroplasts and leucoplasts. In wild-type Arabidopsis,
whereas pavement cells in young cotyledons and leaves possess small chloroplasts, cells of older
tissues may have an increased number of leucoplasts.
Figure 2.2.7 (Next page). Images from Arabidopsis wild type plants and mutants allow clear differentiation
between leucoplast and chloroplasts. A) A group of physiologically compromised swollen PCC in a senescent
cotyledon exhibit the clear separation of their GFP highlighted stroma and the chlorophyll contents. B) An image from
a pavement cell in a senescing 16-day-old cotyledon of an Arabidopsis plant expressing tpFNR:GFP shows several
green leucoplasts (arrow) alongside a plastid exhibiting a green-red mix (panel 4) suggesting the presence of
chlorophyll (panel 2). C) Image of young plants of the Arabidopsis variegated mutant im showing the characteristic
green and white sectors containing chloroplasts and leucoplasts, respectively. D) Image of a leaf of the im mutant
transformed with stroma targeted tpFNR:GFP shows green fluorescent sectors that contain mostly leucoplasts and
regions with chloroplasts that show both stromal and chlorophyll fluorescence. E) A compressed confocal image stack
of a portion of a leaf petiole in im tpFNR:GFP shows lens-shaped chloroplasts (white arrows) and variously shaped
and elongated green fluorescent leucoplasts (magenta arrows) that clearly lack chlorophyll. F) Confocal image of a
variegated leaf from im shows chlorophyll fluorescence against a bright field background. Chloroplasts are absent in
the cells of a white, Leucoplast rich sector in the upper left (magenta box), whereas the right side of the image shows
mesophyll chloroplast. Chloroplasts that are intermediate in size between guard cell chloroplasts (boxes) and
mesophyll chloroplasts are visible in the pavement cells in the lower left leaf sector. Chloroplasts in guard cells (boxes)
appear in a typical curved pattern as compared to the scattered chloroplasts in neighbouring pavement cells. Green
36
(A, B, D, E) = Plastid stroma; Blue (A, D-F) or red (B) = Chlorophyll autofluorescence. Scale bars = 5 µm (A,B), 20
µm (E), 25 µm (F), 100 µm (D) or 1 mm (C).

37
2.2.3 Discussion
The presence of chloroplasts in epidermal pavement cells of Arabidopsis has already been
established (Pyke, 2009; Barton et al., 2016). The present work aimed to describe fresh resources
and the basic subcellular relationships for PCCs to facilitate further study on this under-researched
subpopulation of chloroplasts.
Based on the probes that have been used, a general picture of the PCCs in Arabidopsis has
emerged. They are found in a thin cytoplasmic sleeve delimited on its exterior by the cell boundary
consisting of plasma membrane and a reinforcing cytoskeletal mesh. PCCs and stromules exhibit
clear alignments with actin filaments. Interactions with the actin cytoskeleton have been suggested
to play a role in both stromule extension and whole plastid movement (Kwok and Hanson, 2004a;
Kadota et al., 2009). Indeed, the coordinated movement of the perinuclear plastids by the actin
cytoskeleton has been reported to play a role in nuclear movement during the blue-light avoidance
response (Higa et al., 2014). Despite this, we saw clustering of PCCs around nuclei in only a small
proportion of pavement cells, suggesting that nuclear movement either does not require the
presence of PCCs or requires a mass migration of PCCs to the nucleus before it can occur. The
actin cytoskeleton also supports the cortical ER and the vacuolar membrane (Higaki et al., 2006;
Ueda et al., 2010). The vacuolar membrane appears to press cortical PCCs against the cell
periphery and almost completely encloses more cell-central PCCs. Although we saw that rapid
vacuolar movement is often accompanied by the appearance of ‘tugging’ on PCCs, the vacuole
appears primarily to move freely over the plastid surface. This is in accordance with the idea of a
shared association with the actin cytoskeleton but does not suggest a role for the vacuole in directed
PCC or stromule movement. In contrast, as reported by Schattat et al. (2011a) and reconfirmed
here, the PCCs and extended stromules are firmly enmeshed in the cortical ER and plastid
behaviour appears to directly associate with ER rearrangement.
Unlike the previous organelles discussed, no clear spatial association of the microtubules with
PCCs could be seen. Microtubules form a tight array of largely parallel filaments that traverse the
cell periphery (Reviewed in Dixit and Cyr, 2004), and PCCs seemed to sit below the plane of this
array, with stromules extending either parallel or perpendicular to it. The potential for a
microtubule effect on PCCs should however be investigated further, as the ER has been implicated
38
in stromule extension (Schattat et al., 2011a) and an effect of microtubules on ER rearrangement
has been reported (Hamada et al., 2014). The relationship between the outer membranes of the
PCCs, the ER and the vacuole creates a very dynamic field for membrane contacts and exchange
of metabolites and ions. Ongoing investigations on the membrane contacts between the PCCs and
the surrounding endomembranes facilitated by the double transgenic lines reported here are
providing interesting insights that will be presented in Section 4.
All plastids are known to produce stromules (reviewed by Gray et al, 2001; Hanson and
Sattarzadeh, 2011; Schattat et al., 2015) and these extensions have been suggested to be interaction
platforms for organelles such as nuclei, mitochondria and peroxisomes (Kwok and Hanson, 2004a,
2004b). Our present observations suggest that all these organelles associate only occasionally and
rather transiently, and that mitochondria and peroxisomes show no preference for association with
the stromule over the plastid body. On this basis we do not consider that there is a specific
subpopulation of mitochondria and peroxisomes that are targeted particularly to the PCC body or
stromule and maintain a sustained presence around them. However, though the individual
perimeters of the stromule and plastid body were comparable, extension of a stromule does
increase the total plastid perimeter. Though no preference is shown for association with a stromule,
its extension may increase the total number of organelles with which a plastid can interact.
Accumulation of plastids has been observed in the perinuclear region of hypocotyl cells and dark-
adapted leaves of Arabidopsis (Kwok and Hanson, 2004b; Higa et al., 2014), and in pathogen-
challenged cells of tobacco (Caplan et al., 2008; Krenz et al., 2012; Caplan et al., 2015), however
our present observations do not suggest the presence of a sustained PCCs population around the
nuclei under standard growth conditions. In addition, we have been unable to support the idea that
stromules extended by the PCCs in the perinuclear region display a specific configuration in
relation to the nucleus. Whether the perinuclear aggregation of chloroplasts occurs in mesophyll
cells in Arabidopsis, as well as whether this phenomenon is specific to stressed plants or plays a
role in normal growth and development, remains to be investigated.
A major insight provided from this work involves the inter-relationship between chloroplasts and
the differences in plastid behaviour between the pavement and mesophyll cells. In a model that

39
considered PCCs to be leucoplasts, it was proposed that the epidermal layer acts as a sink for
sugars produced by the mesophyll (Brunkard et al., 2015). In principle, all chloroplasts are capable
of photosynthesis, but their output of photosynthates might differ considerably. The sugar output
from PCCs is unknown, but given their small size and number (Pyke and Leech, 1994; Barton et
al., 2016) it is likely small compared to that of the underlying MCCs. Therefore, recognizing the
plastids in pavement cells as chloroplasts does not negate a potential source-sink relationship
between the epidermis and the mesophyll. In order for continuous export of photosynthates from
MCCs and efficient photosynthesis, mesophyll cells must shuttle sugars to sink tissues (Ainsworth
and Bush, 2011). The pavement cells, being close in proximity and potentially low in sugar
production, could provide a readily accessible sink. Experiments done by Schattat and Klösgen
(2011) showed that sugar induces stromule formation, so an accumulation of sugar in sink tissues
may be accompanied by an increased stromule frequency. In observations throughout the
photosynthetic period, we found that PCCs stromules increase in number throughout the day but
that MCCs maintain a consistently low stromule frequency. This observation, alongside the sugar
responsiveness of stromules, could suggest that while MCCs mainly export their photosynthates,
the PCCs respond to the consequent increase in levels of cytosolic sugar within the pavement cells.
The idea was further tested by inducing stromules with exogenously fed 40 mM sucrose (Schattat
and Klösgen, 2011). The stromule formation frequency increased significantly in PCC regardless
of whether light is given during treatment. Interestingly, an increase in the stromule frequency of
MCCs occurred in the dark, but not when plants were exposed to light during treatment. This
supports a model where mesophyll chloroplasts are capable of sugar-induced stromule induction
but, while photosynthesis is active, continuous export of sugars from the cytosol prevents sufficient
accumulation for induction. We therefore propose that pavement cells act as a sink for sugars from
the mesophyll during the daylight period. Investigations are underway to explore the physiological
sugar-regulated inter-chloroplastic relationship further, and are presented in Section 3. Another
important implication of these results is that PCC behaviour is not representative of the majority
of leaf chloroplasts under all conditions. Therefore, care should be taken when choosing an
experimental tissue, and before applying a model based on PCCs to all chloroplasts, the individual
PCC and MCC responses should be compared.
40
Our results also highlight the potential effect of growth and treatment conditions on stromule
responses. Previous studies in Arabidopsis and tobacco on stromule responses throughout the day-
night cycle showed an increase in stromule frequency within the first few hours of light exposure
and then consistent stromule frequency throughout the day (Schattat et al., 2012b; Brunkard et al.,
2015). This is in contrast to our observations of a gradual increase in stromules over the course of
the entire day. Interestingly, both previous studies grew their plants under a 12 h light – 12 h dark
photoperiod, while we used an 8 h light – 16 h dark cycle. If the diurnal changes in cellular sugar
status were responsible for the stromule response then photoperiod would certainly have an effect,
as plant sugar metabolism adjusts to compensate for a longer night (Suplice et al., 2014).
Photoperiod, as well as the time of day that tissue is collected, should therefore be taken into
consideration when comparing observations of stromule frequency between experiments.
Similarly, our observations of increased stromules in the mesophyll in response to sugar treatment
appear to conflict with the statement by Brunkard et al. (2015) that mesophyll chloroplasts are not
sugar responsive. However, as demonstrated here, mesophyll stromules are only induced by
sucrose treatment in the dark. Brunkard et al. (2015) did not specify the lighting conditions for
their treatment, but if they conducted their treatments in the light, then both observations are in
accordance. It is therefore apparent that many factors, including photoperiod, time of observation
and light exposure during treatment, influence plastid behaviour and that thorough reporting of all
conditions is necessary to allow for comparison among studies.
The suggested link between PCCs behaviour, photosynthesis and sugar regulation also led us to
explore the developmental aspects of chloroplast formation. The present view traces all plastids to
a population of proplastids, which are colourless and so by definition, constitute leucoplasts.
Further development of these colourless plastids into chlorophyll-containing chloroplasts occurs
in a tissue- and cell-specific manner and requires input from nuclear-encoded proteins (Jarvis and
Lopez-Juez, 2013; Liebers et al., 2017). The linear route of leucoplasts and etioplasts greening into
chloroplasts is thus well supported. Studies on plastids in the L1 layer of the shoot apical meristem
and the epidermis of developing embryos suggest that this conversion occurs early in the epidermal
cells, as either stacked grana or chlorophyll autofluorescence were seen in the plastids of these
tissues (Tejos et al., 2010; Charuvi et al., 2012). Our observations with the gl2 mutant support
chloroplasts as the standard plastid type in epidermal cells, as the presence of chloroplasts in the
41
under-developed trichomes suggests the presence of PCCs in the protodermal cells from which
trichomes originate. It follows that loss of chlorophyll is responsible for the presence of leucoplasts
in wild type trichomes, and that chloroplast-to-leucoplast conversion is part of normal
development. We found that this phenomenon also occurs in senescent cells and tissues and in
these cases is dependent upon a change in the cell physiology. As senescence is accompanied by
breakdown of chlorophyll (Hörtensteiner, 2006) and the chlorophyll signal is relatively low in
PCCs (Barton et al., 2016), they are likely to be among the first plastids in which chlorophyll loss
is visible during senescence. Based on our observations, it is clear that investigations of PCCs in
Arabidopsis must always take the growing conditions, tissue health and developmental stage of
the plant into consideration.
The use of the im mutant (Rédei, 1967; Wetzel et al., 1994) allowed us to reliably observe
leucoplasts in pavement cells and indicated another facet of the leucoplast-chloroplast relationship.
The two plastid types show considerable differences in behaviour but we determined that neither
shape nor size was sufficient on its own to distinguish between chloroplasts and leucoplasts. This
mutant also provides an interesting tool for future research to test, in a horizontal context, our
hypothesis that differences in stromule response can be indicative of a source-sink relationship
between cells. The white sectors with leucoplasts and the green sectors with photosynthetic
chloroplasts lie side by side on a leaf in this mutant. Since the white sectors are non-photosynthetic,
they represent sink tissues that should show a stromule response to accumulation of photosynthates
from juxtaposed green regions.
42
2.2.4 Methods
2.2.4.1 Plant material and growth conditions
Single and double transgenic lines were created through Agrobacterium mediated floral dip
transformation (Clough and Bent, 1998) or through crossing. A complete list of plant lines used in
this chapter is provided in Table 2.2. The four different conditions for plant growth were as
follows: (1) growth in sealed tissue culture boxes for 7-12 days or 21 days on sterilized Sunshine
mix LA4 under a long-day light regime (16 h light – 8 h dark) for experiments on stromule
frequency in response to sucrose; (2) growth for 7-12 days in petri dishes containing Murashige
and Skoog basal medium (1962; Sigma M404) with B5 vitamins and 3% sucrose under a long day
light regime for observations of the interactions between PCCs and other organelles; (3) growth in
pots for 6 to 7 weeks on Sunshine mix LA4 in a controlled chamber under a short day light regime
(8h light - 16h dark) for observations on diurnal plastid responses and leucoplast conversion in
leaves. Diurnal stromule observations were taken on healthy green leaves, while observations on
senescent chloroplasts were taken in older chlorotic leaves. All plants were grown under 120 μmol
m-2 s-1 fluorescent light and at a temperature of 21°C.
2.2.4.2 Confocal microscopy
All fluorescence imaging was done on whole plants, with the exception of imaging of leaves over
3 weeks of age, in which the third and fourth true leaves from each plant were detached and imaged
immediately. The plants were mounted in water and imaged using a Leica TCS-SP5 confocal
microscopy system equipped with a 488 nm Ar laser and a 543 nm HeNe Laser. GFP fluorescence
was acquired between 500-520 nm, RFP fluorescence between 570-620 nm, YFP fluorescence
between 530-550 nm and chlorophyll autofluorescence between 660-750 nm. mEosFP was photo-
converted using a mercury lamp and the Leica fluorescence filter set D (Excitation 355 to 425 nm).
The entire field of view was exposed to the conversion light for 10 to 15 s. All confocal images
were acquired at a resolution of 1024 x 512 or 1024 x 1024 pixels. Three-dimensional (xyz) stacks
were collected with a step-size of 0.99 μm and successive frames in x,y,t time lapse series were
1.935 s apart. Images were processed using proprietary Leica (LSM SPII) software, ImageJ
(Schneider et al., 2012) and Adobe Photoshop CS6. Quick time 7 and Videator v2 (Stone Design
Corp., New Mexico) were used for assembling and annotating time-lapse movies.

43
2.2.4.3 Scanning electron microscopy
Scanning electron microscopy (SEM) was carried out on unfixed, uncoated samples taken directly
from the green house and observed using a Hitachi Tabletop TM-1000 system (Hitachi High-
Technologies Corp., Tokyo).
2.2.4.4 Calculation of cell depths
Cell depths were calculated in the tpFNR:GFP RFP:ER background to allow visualization of the
plastid populations and the cortical ER surrounding the cell borders. z-stacks were taken with a
step size of 0.4 μm from the upper epidermal surface to the bottom of the mesophyll cells in the
cotyledons of 8 individual 10-day-old seedlings. In ImageJ (Schneider et al. 2012), orthogonal
views allowed the calculation of cell depth of between 15 and 20 cells of each type (pavement,
guard, or mesophyll) each of the 8 stacks based on the number of steps required to traverse the
cell.
2.2.4.5 Analysis of PCC and small organelles
Time-lapsed images were collected for 41 to 321 frames. One to three PCCs per image set had
stromules that remained in focus for the frames analyzed. Collection time for each frame was 1.935
seconds. A total of n=38 and n=10 PCCs were followed for analyzing mitochondria and
peroxisome encounters with PCCs respectively. The number of mitochondria or peroxisomes
closely appressed to the PCCs body or stromule was counted manually for each frame of the image
sets using the ImageJ Cell Counter plugin [Kurt De Vos (University of Sheffield;
https://imagej.nih.gov/ij/plugins/cell-counter.html, 2001]. The total number of close encounters
between PCCs and either mitochondria or peroxisomes was summed and averaged over the total
number of frames analyzed. 95% confidence intervals (CI) for the estimated means were calculated
for the data. The perimeter of the body and stromule of PCCs was measured in the first frame of
the time-lapse image sets used for counting the average number of mitochondria juxtaposed to
PCCs and the mean perimeters were reported with 95% CIs.
44
2.2.4.6 Stromule frequency: Treatment, image acquisition, calculation and statistical
analysis
Treatment of seedlings with 40 mM sucrose or water controls was performed by carefully
removing the entire plant from the soil and floating the plants in solution for 3 hours in either a
dark chamber or under normal growth lighting. For consistency, plants were always taken at the
end of the night cycle to begin treatment. For each condition under which stromule frequency was
measured, n=16 z-stacks were taken, with a step size of 0.99 μm, through the epidermis and the
upper region of the mesophyll on the adaxial surface, two stacks in each of the two most expanded
leaves of four plants. Standard deviation z-projections were obtained using ImageJ (Schneider et
al., 2012) and the number of plastids in both the PCC and MCC populations exhibiting or lacking
stromules in each image was counted using the Cell Counter plugin in ImageJ [Kurt De Vos
(University of Sheffield; https://imagej.nih.gov/ij/plugins/cell-counter.html, 2001]. The calculated
stromule frequencies were transformed with the arcsin(√Freq) function according to Schattat and
Klösgen, (2011). 95% CI for the estimated mean and statistical significance (Two-way ANOVA
with post-hoc Tukey HSD test) were assessed using the transformed data. The mean and CI were
back-transformed for representation in the figures.
45
3 Plastid pleomorphy and cellular sugar status 3.1 Introduction The plastids within a plant cell are well known for their plasticity of function and form, and the
interest in the intersection of these two characteristics is growing. Identifying the purpose of
changes to plastid shape and their contribution to the functioning of a cell has become the focus of
many plastid biology studies. Stromules and protrusions are outward projections of the plastid
envelope membranes and stroma that occur in all plastid types (Holzinger et al., 2007a; Hanson
and Hines, 2018), with stromules being long and thin, and protrusions short and broad. There was
some speculation that these may represent distinct structures (Buchner et al., 2007; Holzinger et
al., 2007a; Lütz and Engel, 2007) but time-lapse imaging suggests that they are transient forms of
the more general phenomenon of plastid pleomorphy (Delfosse et al., 2016). A substantial number
of studies have characterized changes to plastid shape in response to various stimuli (Appendix 2),
providing insight either into how plastids extend or why they might do so. Most proposed stromule
functions can be boiled down to an increased potential for the transfer of materials between the
plastid and other cellular compartments (Hanson and Hines, 2018), based on the correlation
between conditions that increase stromule frequency and those where increased exchange would
be considered beneficial.
It is generally agreed that stromule formation requires, at least in part, the pulling of the plastid
envelope by an external cellular structure, with the actin cytoskeleton (Kwok and Hanson, 2004a;
Natesan et al., 2009; Sattarzadeh et al., 2009), microtubules (Kwok and Hanson, 2003; Erickson
et al., 2018; Kumar et al., 2018), and endoplasmic reticulum (Schattat et al., 2011a, 2011b) each
being given consideration (Erickson and Schattat, 2018). However, the movement of these
structures is relatively consistent in healthy cells while the behaviour of plastids is not. The fact
that plastid tubulation occurs more frequently in some tissues and under certain conditions suggests
that factors are at play beyond the simple exertion of a pulling force. Changes to membrane
properties, alterations to osmotic status and mechanical constriction are each proposed
mechanisms by which the likelihood of plastid elongation can be influenced. However, the actual
contribution of these mechanisms to plastid tubulation and the pathways by which they might be
46
manipulated are uncertain (Delfosse et al., 2018; Erickson and Schattat, 2018; Hanson and Hines,
2018).
The wide range of conditions that promote or inhibit plastid tubulation, as well as the variation in
response between species and tissues, makes it improbable that each condition acts through a
distinct pathway to influence plastid shape. After laying out the majority of the reports on stromule
formation in the literature and excluding those that can be explained from a direct mechanistic
perspective, due to impact on the cytoskeleton, ER, or plastid membrane properties, several groups
of stromule promoting treatments can be established. Specifically, stromule frequency generally
increases after exposure to abiotic or biotic stresses, to plant growth regulators, to light, to ROS
and to sugars. Identifying the common aspects between these groups may narrow down relevant
pathways for future research into the cellular events that result in plastid extension.
The effect of several different abiotic stresses on plastid shape have been investigated. Salt stress
(Gray et al., 2012; Yamane et al., 2012), drought conditions simulated with osmotic agents or leaf
detachment (Gray et al., 2012), phosphate starvation (Vismans et al., 2016), and high temperature
(Buchner et al., 2007; Holzinger et al., 2007a) are each reported to increase the frequency of either
protrusions or stromules. Stress responses in a plant are mediated by a host of plant growth
regulators and many of these growth regulators have been implicated in triggering plastid
elongation. ABA is one of the primary growth regulators involved in abiotic stress reactions
(Tuteja, 2007). Gray et al. (2012) attributed the increase in stromules during abiotic stress to this
growth regulator, as exogenous ABA exposure increased stromule frequency and chemical
inhibition of ABA synthesis abolishes the stromule response to abiotic stressors (Gray et al., 2012).
Vismans et al. (2016) attributed the effect of ABA on stromule extension to factors further
downstream. Strigolactones are plant growth regulators whose role in stress responses has only
recently begun to be uncovered (Pandey et al., 2016). When strigolactone biosynthesis is blocked,
the stromule response to both phosphate stress and to exogenous ABA is prevented. This suggests
that the effect of ABA on plastid shape is a consequence of downstream strigolactone synthesis
and that strigolactones are responsible for the plastid response to at least some abiotic stresses
(Vismans et al., 2016).
47
The plant response to biotic stresses, such as exposure to viral or bacterial effector proteins (Caplan
et al., 2015; Erickson et al., 2018), insect-induced damage (Barczak-Brzyżek et al., 2017),
exposure to Agrobacterium (Erickson et al., 2014), and colonization by mycorrhizal fungi (Fester
et al., 2001; Hans et al., 2004; Lohse et al., 2005), can also be accompanied by increased stromule
frequency. The response of a plant to biotic factors is heavily influenced by ethylene, jasmonates
and salicylic acid (Verma et al., 2016) and these growth regulators can affect plastid behaviour.
Exogenous application of either an ethylene precursor or methyl jasmonate results in increased
stromule formation (Gray et al., 2012). Whether the effect of salicylic acid on plastid elongation
is positive, negative or situational is uncertain. In one study, a salicylic acid analog increases
stromule frequency (Caplan et al., 2015), whereas salicylic acid reduces stromule frequency from
basal levels in another study (Gray et al., 2012). Yet another plant growth regulator, cytokinin,
was found to be behind the extension of stromules in response to Agrobacterium, as strains that
had a cytokinin biosynthesis gene on the Ti plasma induced stromule frequency while those
without it did not (Erickson et al., 2014). There is therefore evidence that most biotic and abiotic
stresses and most plant growth regulators tested to date can influence plastid shape, either
promoting or inhibiting elongation.
The time-frame in which a response is seen is an important consideration when attempting to
narrow down specific pathways that contribute to stromule formation. Stromule responses to
strigolactones can occur within an hour and a half (Vismans et al., 2016) and to ABA within 3 h
(Gray et al., 2012; Vismans et al., 2016). This suggests that the changes required to cause stromule
formation can be activated and carried out within this timeframe. For the other growth regulators,
effects were observed between 16 h and several days of treatment (Gray et al., 2012; Erickson et
al., 2014; Caplan et al., 2015). If the plastid response to these growth regulators requires a longer
treatment time, it is probable that they do not directly activate the pathways that influence stromule
formation but instead influence the production of the signaling molecule or growth regulator that
does. Indeed, Gray et al. (2012) suggested that ethylene acts upstream of ABA in signaling
stromule formation, as the response to ethylene does not occur if ABA synthesis was inhibited. If
ABA works by influencing strigolactone biosynthesis (Vismans et al., 2016), then the effect of
ethylene may be at least two levels removed from the elements that directly affect plastid shape.

48
When looking for specific factors that contribute to plastid elongation, a short response timeframe
should therefore be an important criterion.
Diurnal increases in stromule frequency have been reported to occur in the epidermal chloroplasts
of Arabidopsis and tobacco (Schattat et al., 2012b; Brunkard et al., 2015; Barton et al., 2017) As
the site of photosynthesis, chloroplasts use light energy and carbon dioxide to produce the sugars
that ultimately support almost every aspect of cell metabolism. The harnessing of light energy
produces ROS that must be neutralized or dispersed to prevent damage to the photosystems and
plastid membranes (Foyer and Shigeoka, 2010). Given the apparent correlation between light and
stromule extension, sugars and ROS each have the potential to be involved in activating stromule
extension.
Brunkard et al. (2015) suggested that ROS trigger a redox-based mechanism of stromule induction
in response to light. Stromule frequency increases within 2 h of treatment with compounds that
block electron transfer through the photosynthetic electron transport chain (pETC), theoretically
causing the production of singlet oxygen or superoxide molecules. They further identified that
silencing the expression of tobacco NADPH-dependent thioredoxin reductase C (NTRC), a
chloroplast-localized redox regulator, increases stromule frequency, providing a link between
redox status and stromule extension. ROS have also been shown to induce stromules in other
studies, in which hydrogen peroxide increases stromule frequency over a much longer period of
exposure (Gray et al., 2012; Caplan et al., 2015).
The accumulation of sugars has also been suggested as an explanation for the stromule response
of chloroplasts to light, based on the rise in epidermal and mesophyll stromule frequency upon
exposure to exogenous sucrose or glucose (Schattat and Klösgen, 2011; Schattat et al., 2012b;
Barton et al., 2017). Some specificity of the sugar type is also found, as the effect of fructose was
much lower (Schattat and Klösgen, 2011). The stromule response to sugars is rapid, beginning
within the first hour after treatment (Schattat and Klösgen, 2011; Barton et al., 2017), and this puts
it alongside strigolactones, and potentially some ROS, as one of the most rapid inducers of
stromule found to date. A direct comparison has not been done between endogenous changes to
49
sugar accumulation and stromule frequency, so whether this response occurs during the course of
normal plant function remains unknown.
Sugars have considerable potential to influence cellular events either through their contribution to
metabolic pathways or by acting as signaling molecules (Li and Sheen, 2016). The control of
carbon metabolism is a critical part of both plant development and the response to environmental
factors, with sugars often accumulating within the cell during times of stress (Rosa et al., 2009;
Sami et al., 2016). A rise in cellular sugar is seen to accompany many abiotic stresses that are also
associated with stromule extension, including drought, salinity, oxidative and temperature stresses
(Baxter et al., 2006; Wingler and Roitsch, 2008; Rosa et al., 2009). Sugar accumulation also often
occurs as a response to pathogen interactions, and endogenous or exogenous sugars can trigger
many pathways associated with pathogen resistance and biotic stresses (Herbers et al., 1996;
Thibaud et al., 2004; Gómez-Ariza et al., 2007). It is therefore possible that the stromule response
seen during abiotic and biotic stress can be accounted for by changes to soluble sugar levels.
Crosstalk between growth regulator and sugar signaling is an important aspect of maintaining the
balance between carbon availability and cellular processes (Ljung et al., 2015; Sakr et al., 2018).
It has been proposed that nearly a tenth of Arabidopsis genes can be activated by sugar signals
(Kang et al., 2010). Glucose, fructose and sucrose are the most commonly discussed signaling
sugars and each is thought to act through distinct mechanisms, typically involving sugar sensors
that activate or repress transcription factors (Li and Sheen, 2016). This is followed by alterations
to the expression of genes involved in protein and lipid synthesis or metabolism; sugar production,
metabolism and transport; nutrient assimilation; and other cellular processes (Li, 2006; Osuna et
al., 2007). The ability of sugars to affect gene expression is very rapid, with changes to some
transcripts detected within 30 min of treatment with exogenous sucrose (Osuna et al., 2007). As
was seen for stress conditions, there is considerable overlap between the growth regulators that
have been associated with changes to plastid shape and those that can act in conjunction with sugar
signaling. Crosstalk with sugars, either through reciprocal control of the levels of growth regulator
and sugars or through shared signaling targets, has been suggested for ABA (Foyer et al., 2012),
cytokinins (Kushwah and Laxmi, 2014), ethylene (Yanagisawa et al., 2003), jasmonates (Loreti et
al., 2008), salicylic acid (Thibaud et al., 2004), and strigolactones (Li et al., 2016a; Wang et al.,

50
2019). The potential therefore exists that the same pathways could be triggered by the growth
regulators that control the plant stress response and by sugars, linking the previous growth
regulator-induced stromule observations to a sugar-based model of stromule induction. Based on
the apparent correlation between stromule inducing conditions or growth regulators and those
known to be associated with alterations to soluble sugar accumulation or metabolism, sugars
within the cell are an excellent candidate to unify many of the existing reports on stromules and
narrow down potential factors that might promote plastid tubulation.
Comparison between reports on stromule formation and those on the effect of stresses or growth
regulators on metabolites levels must be done with care as a great many factors can influence how
a plant responds to a stress. As an example, salt stress is often but not always accompanied by
changes to soluble sugar levels. The relative change in soluble sugar levels, the type of sugar that
accumulates and how long it takes for a change to be observed can vary based on species, genotype,
tissue, and treatment concentration (Gong et al., 2005; Cramer et al., 2007; Kim et al., 2007; Morsy
et al., 2007; Sanchez et al., 2008; Widodo et al., 2009; Wu et al., 2013). Given this variability in
the response to a single stress condition, it is not reasonable to assume that a treatment that results
in sugar accumulation in one experiment will do so in another if any components of the
experimental setup are altered. Though the theoretical connections between soluble sugars and
stresses that induce stromule formation can be made, any measurement of a correlation between
plastid shape and cellular conditions will require concomitant assessment of both factors, with
imaging and tissue harvest being performed together.
In order to investigate the role of cellular sugars in modifying plastid shape, we investigated the
specificity of the response to various sugars, the potential role of sugar signalling through the use
of sugar analogs, and whether the response is universal among plastid types and tissues. Further,
we examined the effect of endogenous changes to sugar levels on plastid shape and whether the
abiotic stresses that have been reported to induce stromule formation can be correlated with a
change in cellular sugar.
51
3.2 Results 3.2.1 Confocal imaging of chloroplasts influences plastid behaviour
It has been previously suggested that increased temperature can influence plastid behaviour by
promoting the formation of protrusions (Holzinger et al., 2007a). Confocal imaging relies on lasers
that have the potential to heat a sample. Prior to investigating the effect of sugars on plastid
behaviour, we therefore assessed the extent to which our imaging setup influenced the behaviour
of our samples. 21-day-old transgenic Arabidopsis plants expressing the stromal tpFNR:GFP
construct (Marques et al., 2003; Marques et al., 2004; Schattat and Klösgen, 2011) were harvested
at the end of the night and regions from five different leaves were continuously imaged for 200
frames each (6 min 33 s). For each frame, the proportion of mesophyll chloroplasts with any
distinguishable outwards projection was determined, then the average proportion was calculated
for 20-frame (39.3 s) intervals. Our imaging conditions quantifiably increased the proportion of
plastids with projections within 80s of imaging, rising from an average of 7.4 ± 4.7% (± 95% CI
in all cases) of chloroplasts producing extensions in the first 20-frame increment (0 to 39.3 s), to
18.0 ± 7.1% in the third increment (78.6 to 117.9 s). When taking image stacks to quantify plastid
extensions, we therefore limited our imaging time in a region to 40 s.
3.2.2 Short and long-term exogenous sucrose feeding induces changes in plastid shape
The induction of stromules from epidermal chloroplasts after short-term sucrose treatment has
previously been reported (Schattat and Klösgen, 2011; Barton et al., 2017), and a similar response
has been seen in mesophyll chloroplasts (Barton et al., 2017). This suggests that plastid extension
in response to exogenous sucrose may be a general feature of plastids. However, the response in
other tissues, in other plastid types and to other timeframes of sugar exposure has not been tested
to date.
The tpFNR:GFP transgenic Arabidopsis line was used to observe plastid responses to exogenously
supplied sucrose. The hypocotyl of Arabidopsis, like the leaves, contains small chloroplasts in the
epidermis and larger ones in the underlying cell layer (Fig. 3.2.1A). 7-day-old plants grown in soil
were harvested at the end of night and placed in a 40 mM sucrose solution for 3 h. In this and all
subsequent experiments involving treatment of 7-day-old plants with a solution, seedlings were
briefly immersed, then allowed to rest such that their hypocotyls were submerged and their
52
cotyledons were floating on the surface of the solution, to minimize effects of hypoxia. This was
carried out in the dark to avoid any effect from photosynthesis-derived sugars. Stromule
frequencies were calculated for an entire imaged region, rather than on a cell-by-cell basis, as
Schattat and Klösgen (2011) found that both methods result in similar stromule frequencies for
the region. Untreated plants showed low hypocotyl stromule frequencies in both chloroplast
populations, with an average of 2.3 ± 1.2% of epidermal plastids and 0.6 ± 0.6% of mesophyll
plastids showing stromules. Treatment for 3 h with water had no effect on this basal stromule level.
The 3 h sucrose treatment increased stromule frequency over 10-fold, with an average of 29.1 ±
5.5% of epidermal plastids and 13 ± 3.0% of mesophyll plastids showing stromules (Fig. 3.2.1B).
Longer-term sucrose feeding, applied through germination and growth of plants for 7 days on
Murashige and Skoog (MS) medium supplemented with 3% sucrose, also resulted in elevated
hypocotyl stromule frequencies. An average of 1.5 ± 0.4% of epidermal chloroplasts and 1.0 ±
0.6% of mesophyll chloroplasts exhibited stromules at the end of the night when grown in the
absence of exogenous sucrose, compared with 25.3 ± 12.0% of epidermal plastids and 7.4 ± 2.5%
of mesophyll plastids in plants grown on sucrose-containing media (Fig. 3.2.1C). Total soluble
carbohydrate analysis showed that in both the seedlings treated with 40 mM sucrose (Fig. 3.2.1D)
and those supplemented with 3% sucrose (Fig. 3.2.1E), the above ground portion accumulated
high soluble carbohydrate levels when compared to the respective controls. Short- and long-term
sugar exposure therefore resulted in increased stromule extension in both of the hypocotyl
chloroplast populations. Stromule formation in response to exogenous sucrose appears common
to epidermal and mesophyll chloroplasts when treated in the dark, regardless of tissue and despite
their differences in size.
Figure 3.2.1. (Next page) An increase in chloroplast stromule frequency occurs in the epidermis and underlying
cell layer of 7-day-old hypocotyls in response to both long and short term exogenous sucrose exposure, and
correlates with an increase in total soluble carbohydrates within the seedlings. A) Representative images of
tpFNR:GFP plants showing similarities between the epidermal (Epi) and mesophyll (Meso) chloroplasts and their
stromule (St) formation between hypocotyl and leaf tissue. B) Treatment of 7-day-old seedlings with 40 mM sucrose
for 3 h resulted in a significant increase in hypocotyl stromule frequency in both the epidermis (p<0.001, N=16) and
the underlying cell layer (p<0.001, N=16) compared to the water control. The water control showed no difference in
frequency from the untreated samples in either cell layer (both p>0.850, N=16). C) 7-day-old seedlings germinated
on media supplemented with 3% sucrose showed a significantly higher hypocotyl stromule frequency than those
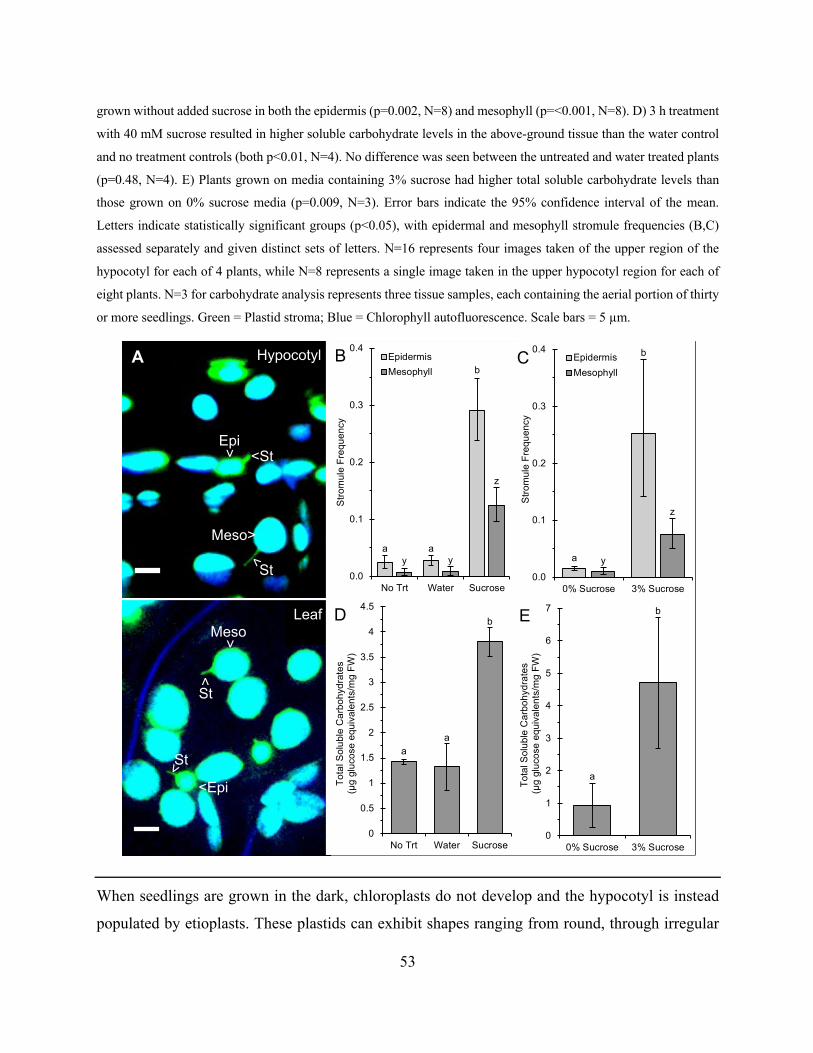
53
grown without added sucrose in both the epidermis (p=0.002, N=8) and mesophyll (p=<0.001, N=8). D) 3 h treatment
with 40 mM sucrose resulted in higher soluble carbohydrate levels in the above-ground tissue than the water control
and no treatment controls (both p<0.01, N=4). No difference was seen between the untreated and water treated plants
(p=0.48, N=4). E) Plants grown on media containing 3% sucrose had higher total soluble carbohydrate levels than
those grown on 0% sucrose media (p=0.009, N=3). Error bars indicate the 95% confidence interval of the mean.
Letters indicate statistically significant groups (p<0.05), with epidermal and mesophyll stromule frequencies (B,C)
assessed separately and given distinct sets of letters. N=16 represents four images taken of the upper region of the
hypocotyl for each of 4 plants, while N=8 represents a single image taken in the upper hypocotyl region for each of
eight plants. N=3 for carbohydrate analysis represents three tissue samples, each containing the aerial portion of thirty
or more seedlings. Green = Plastid stroma; Blue = Chlorophyll autofluorescence. Scale bars = 5 µm.
When seedlings are grown in the dark, chloroplasts do not develop and the hypocotyl is instead
populated by etioplasts. These plastids can exhibit shapes ranging from round, through irregular
a
b
y
z
0.0
0.1
0.2
0.3
0.4
0% Sucrose 3% Sucrose
Str
omul
e Fr
eque
ncy
Epidermis
Mesophyll
a
b
0
1
2
3
4
5
6
7
0% Sucrose 3% Sucrose
Tota
l Sol
uble
Car
bohy
drat
es(µ
g gl
ucos
e eq
uiva
lent
s/m
g FW
)
<
St
Meso
<
St
<
<Epi
Hypocotyl
<St
<St
Epi
<
Meso>a a
b
y y
z
0.0
0.1
0.2
0.3
0.4
No Trt Water Sucrose
Str
omul
e Fr
eque
ncy
Epidermis
Mesophyll
Leaf
A B C
E
aa
b
0
0.5
1
1.5
2
2.5
3
3.5
4
4.5
No Trt Water Sucrose
Tota
l Sol
uble
Car
bohy
drat
es(µ
g gl
ucos
e eq
uiva
lent
s/m
g FW
)
D
54
to elongated. They can have one, several or no apparent plastid bodies, a marked contrast to the
defined plastid body and stromules of chloroplasts (Fig. 3.2.2A). This makes the identification of
stromules challenging, so individual plastids were instead assigned a ‘shape ratio’, defined as their
average width, measured at three equidistant points, divided by their length. This provides a
numerical approximation of their degree of elongation, with values closest to 1 indicating a rounder
plastid, and values approaching 0 indicating an extremely elongated plastid (Fig. 3.2.2B).
Etioplasts in the epidermal and cortical layers of the hypocotyl were not visually distinct and it
was not possible to distinguish plastids sitting on the lower surface of epidermal cells from those
on the upper surface of the cortical cells. Etioplasts were therefore measured as a single population.
Using this system, the effects of exogenous sucrose feeding on etioplasts shape was assessed.
Treatment of etiolated 7-day-old soil-grown seedlings for 3 h with 40 mM sucrose resulted in an
increase in etioplast elongation, with etioplasts in the water control showing an average shape ratio
of 0.55 ± 0.03 and the sucrose treated etioplasts a ratio of 0.48 ± 0.02 (Fig. 3.2.2C). The effect of
sucrose on etioplast shape was more pronounced after long-term sucrose feeding. Etioplasts in the
hypocotyl of etiolated 7-day-old seedlings grown on media containing 3% sucrose had an average
shape ratio of 0.29 ± 0.04, which indicates considerably more elongated plastids than in plants
grown on the 0% sucrose control, where the average ratio was 0.53 ± 0.03 (Fig. 3.2.2D). Etioplasts
therefore exhibited elongation in response to both short- and long-term sucrose exposure. The
response of chloroplasts and etioplasts to sucrose suggests that an increase in plastid extension is
a general response to sucrose feeding in the above ground tissues of Arabidopsis.
Unlike etioplasts, which presented a mixed population of round and elongated plastids, leucoplasts
in the root of 7-day-old seedlings were mostly elongated even in the absence of added sucrose
(Fig. 3.2.2E). The root tissue was thin, and due to the length and close proximity of the plastids,
many of them overlapped sufficiently to prevent the distinction of individual plastids. We were
therefore unable to accurately measure the effect of sucrose on root leucoplasts in either short or
long-term treatments.
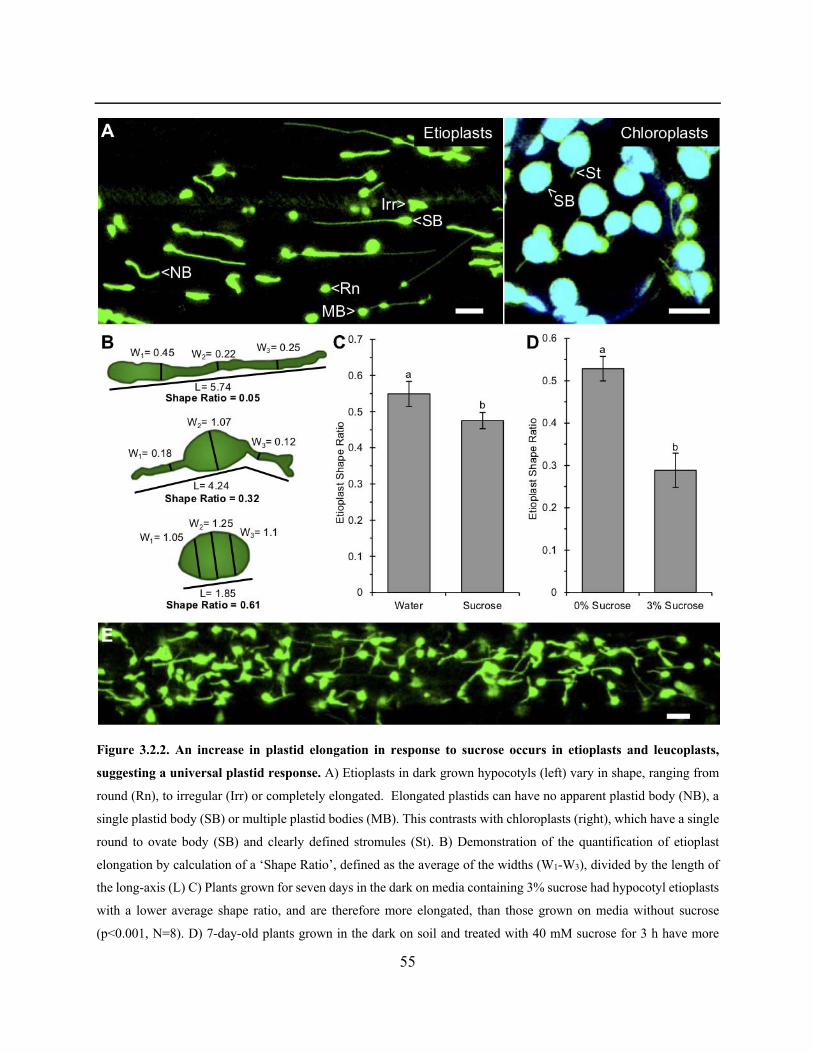
55
Figure 3.2.2. An increase in plastid elongation in response to sucrose occurs in etioplasts and leucoplasts,
suggesting a universal plastid response. A) Etioplasts in dark grown hypocotyls (left) vary in shape, ranging from
round (Rn), to irregular (Irr) or completely elongated. Elongated plastids can have no apparent plastid body (NB), a
single plastid body (SB) or multiple plastid bodies (MB). This contrasts with chloroplasts (right), which have a single
round to ovate body (SB) and clearly defined stromules (St). B) Demonstration of the quantification of etioplast
elongation by calculation of a ‘Shape Ratio’, defined as the average of the widths (W1-W3), divided by the length of
the long-axis (L) C) Plants grown for seven days in the dark on media containing 3% sucrose had hypocotyl etioplasts
with a lower average shape ratio, and are therefore more elongated, than those grown on media without sucrose
(p<0.001, N=8). D) 7-day-old plants grown in the dark on soil and treated with 40 mM sucrose for 3 h have more
56
elongated plastids than those in the water control (p=0.001, N=8). E) Root leucoplasts are closely appressed, elongated
and often have overlapping fluorescent signals. Error bars indicate the 95% confidence interval of the mean. Letters
indicate statistically significant groups (p<0.05). N=8 represents a single image taken in the upper hypocotyl region
for each of eight plants. Green = Plastid stroma; Blue = Chlorophyll autofluorescence. Scale bars = 10 µm.
3.2.3 Changes in plastid shape are induced by sucrose, glucose and maltose, but not other
osmotic agents, metabolically inactive sugar analogs or T6P
A previous study indicated that the stromule response was specific to some sugars as, in addition
to sucrose, glucose was capable of inducing stromule formation while neither fructose nor
mannitol had a significant effect (Schattat and Klösgen, 2011). In contrast, Gray et al. (2012)
reported a significant increase in stromule formation in response to mannitol and other osmotic
agents, and suggested that stromule formation was a general response to stresses mediated by
abscisic acid. This discrepancy warranted further investigation, as each result could suggest a
different pathway through which sugars might influence plastid extension.
The specificity of sucrose and glucose in inducing plastid extension was investigated by treating
21-day-old tpFNR:GFP plants with 40 mM solutions of an expanded list of sugars and osmotic
agents for 3 h. These consisted of the monosaccharides D-glucose, D-fructose, D-mannose and
galactose; the disaccharides sucrose, maltose, and lactose; and the sugar-alcohols sorbitol and
mannitol. In this and all subsequent experiments involving treatment of 21-day-old plants, whole
plants were briefly submerged in the solution, then positioned upside-down and allowed to float
such that the first leaves were submerged. It was found that considerable variation in plastid
behaviour could exist between different regions of the same leaf. For example, in one case the
percentage of epidermal chloroplasts producing stromules in different regions of a single leaf from
a glucose treated plant ranged from 16% to 39%. The regions assessed for each treatment were
therefore distributed to allow for variability both within and between plants, such that one image
stack was taken on each side of the midrib at the adaxial leaf surface in the first two true leaves of
three to four plants. Significant induction of stromule formation from epidermal chloroplasts
occurred in response to glucose, sucrose and maltose. In glucose and maltose treated plants, an
average of 20.4 ± 4.1% and 18.2 ± 3.2% of plastids exhibited stromules, respectively. Stromule
frequency in the plants treated with sucrose was further elevated, with an average of 40.9 ± 3.5%
57
of epidermal chloroplasts showing stromules (Fig. 3.2.3A). In contrast, fructose, galactose, lactose,
and mannose treatment resulted in 5.5 ± 2.6%, 2.8 ± 2.3%, 4.4 ± 2.1% and 3.1 ± 1.8% of epidermal
chloroplasts producing stromules, respectively, none of which were statistically different from the
water control (2.4 ± 1.8%; Fig. 3.2.3A). Plants treated with sorbitol and mannitol also had stromule
frequencies similar to the water control, with an average of 1.7 ± 1.4% (sorbitol) and 1.5 ± 1.5%
(mannitol) of plastids producing stromules (Fig. 3.2.3B).
Whether apoplastic or cellular accumulation of sugars was responsible for the stromule response
was a question raised by Schattat and Klösgen (2011). To assess whether the sugar accumulates
within the cells or the apoplast, we treated 21-day-old leaves with a 200 µM solution of the
fluorescently tagged glucose: 2-NBDG (2-(N-(7-Nitrobenz-2-oxa-1,3-diazol-4-yl)Amino)-2-
Deoxyglucose). It showed a clear fluorescent signal in the cell interior within an hour (Fig. 3.2.3C),
suggesting that even at concentrations significantly lower than our exogenous sugar treatments,
glucose could be taken up into the cell.
Our 40 mM concentration of mannitol was at the lower end of the concentrations used by Gray et
al. (2012) to cause osmotic stress. To further investigate our finding that osmotic agents did not
induce a rapid stromule response in leaves, plants were treated with mannitol or sodium chloride
solutions at concentrations of 40 mM, 80 mM, or 160 mM for 3 h. These treatments all resulted in
epidermal stromule frequencies comparable to the water control and consequently, whether the
change to plastid shape seen by Gray et al. (2012) correlated with cellular sugar could not be
assessed. Sucrose treatment at the same concentrations resulted in a rise stromule frequency.
Interestingly, increased sucrose concentration did not result in a further rise in stromule levels,
with comparable stromule frequencies found at all three concentrations (Fig. 3.2.3D). The 160 mM
concentrations of both mannitol and sodium chloride began to show occasional compromised cells
in the mesophyll, seen as swollen chloroplasts and cells where the stromal GFP had leaked into
the cytoplasm (Fig. 3.2.3E). The sodium chloride treatment also showed small vesicles of stromal
GFP floating in the cell at this concentration, suggesting possible chloroplast breakdown (Fig.
3.2.3F). Concentrations above 160 mM were therefore not investigated.
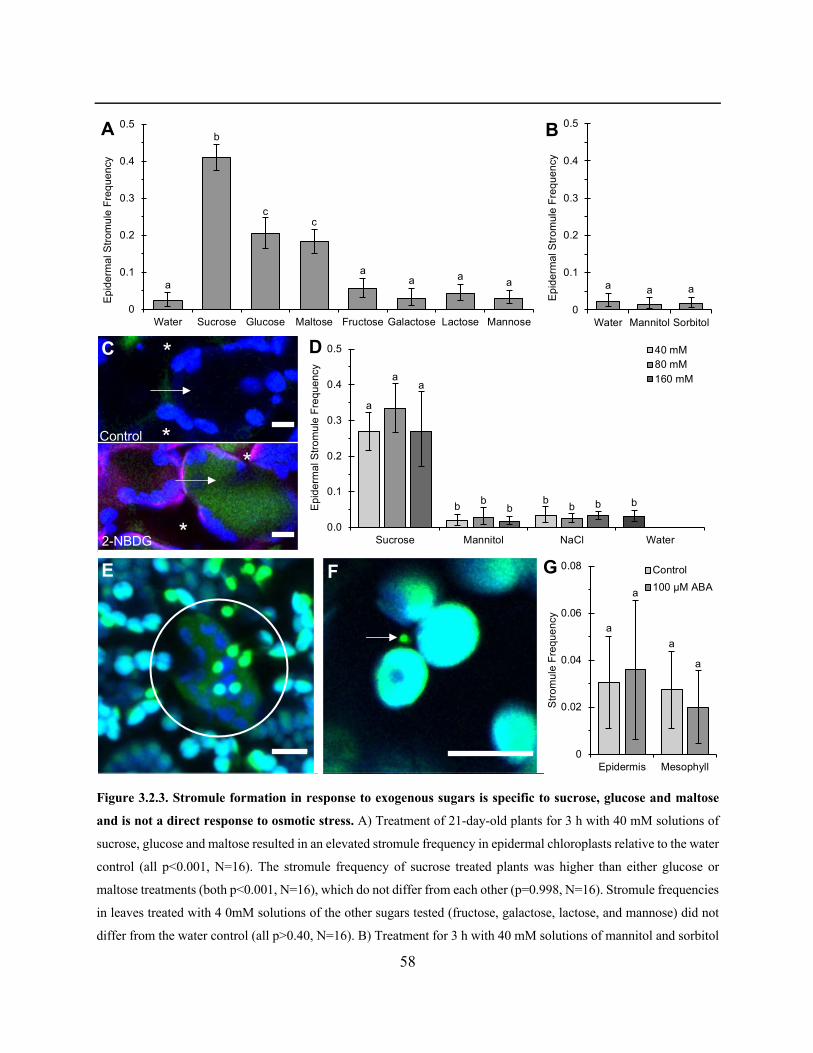
58
Figure 3.2.3. Stromule formation in response to exogenous sugars is specific to sucrose, glucose and maltose
and is not a direct response to osmotic stress. A) Treatment of 21-day-old plants for 3 h with 40 mM solutions of
sucrose, glucose and maltose resulted in an elevated stromule frequency in epidermal chloroplasts relative to the water
control (all p<0.001, N=16). The stromule frequency of sucrose treated plants was higher than either glucose or
maltose treatments (both p<0.001, N=16), which do not differ from each other (p=0.998, N=16). Stromule frequencies
in leaves treated with 4 0mM solutions of the other sugars tested (fructose, galactose, lactose, and mannose) did not
differ from the water control (all p>0.40, N=16). B) Treatment for 3 h with 40 mM solutions of mannitol and sorbitol
a
b
cc
aa a a
0
0.1
0.2
0.3
0.4
0.5
Water Sucrose Glucose Maltose Fructose Galactose Lactose Mannose
Epi
derm
al S
trom
ule
Freq
uenc
y
a a a
0
0.1
0.2
0.3
0.4
0.5
Water Mannitol Sorbitol
Epi
derm
al S
trom
ule
Freq
uenc
y
a
b b b
a
b b
a
b b
0.0
0.1
0.2
0.3
0.4
0.5
Sucrose Mannitol NaCl Water
Epi
derm
al S
trom
ule
Freq
uenc
y
40 mM80 mM160 mM
aa
a
a
0
0.02
0.04
0.06
0.08
Epidermis Mesophyll
Stro
mul
e Fr
eque
ncy
Control100 µM ABA
*
*
**Control
2-NBDG
BA
C D
E F G

59
resulted in epidermal stromule frequencies no different than the water control (both p>0.95, N=16). C) Incubation of
21-day-old wildtype Arabidopsis plants with 200µM 2-NBDG showed accumulation of the fluorescent glucose in the
cell interior (Arrow) rather than the apoplast (*) within an hour of treatment. D) Plants treated for 3 h with
concentrations of mannitol or sodium chloride up to 160 mM had epidermal stromule frequencies no different from
the water control at any concentration (all p>0.90, N=12). Treatment of plants with higher concentrations of sucrose
did not increase stromule frequency beyond that seen in the 40 mM treatment (both p>0.75, N=12). E) 160 mM
mannitol treated plants showed compromised cells where the GFP has leaked from the chloroplasts into the cytosol
(Circle). F) Treatment with 160 mM sodium chloride caused the appearance of small stromal GFP filled vesicles
(Arrow). G) 100 µM ABA treatment for 3h did not have a significant effect on leaf epidermal (p=0.79, N=8) or
mesophyll (p=0.56, N=8) stromule frequency relative to the control. Error bars represent the 95% confidence interval
of the mean. Letters indicate statistically significant groups (p<0.05). N=16 represents four images taken for each of
four plants, two in each of the first two true leaves. N=12 represents four images taken for each of three plants,
distributed as before. N=8 represents two images taken for each of four plants, one in each of the first two true leaves.
Green = Fluorescent glucose (C) or Plastid stroma (E,F); Blue = Chlorophyll autofluorescence. Scale bars = 10µm.
Stromule formation in response to mannitol was postulated to be a response to osmotic stress
mediated by abscisic acid, based on the increased stromule frequency that Gray et al. (2012)
observed in tobacco hypocotyls within 3 h of immersion in 100 µM ABA. We repeated this
experiment with 21-day-old tpFNR:GFP Arabidopsis plants; however, we could not detect any
change in the frequency of stromule. In both the epidermal and mesophyll cells, similar
percentages of chloroplasts were producing stromules between the water control and the 100 µM
ABA treated plants (3.1 ± 2.4% vs. 3.6 ± 3.1% in the epidermis; 2.7 ± 2.0% vs. 2.0 ± 2.0% in the
mesophyll; Fig. 3.2.3G). Therefore, of the tested treatments only certain sugars were capable of
inducing plastid extension and neither abscisic acid nor osmotic agents caused a response within
a comparable timeframe.
Glucose and sucrose play both metabolic and signaling roles within the cell. In order to determine
if sucrose and glucose needed to be metabolically active to induce a response, 21-day-old
Arabidopsis plants were treated for 3 h with 40 mM solutions of glucose and sucrose analogs.
Palatinose (isomaltulose) and turanose are both sucrose analogs that are not readily metabolized
by the plant, but where turanose is a substrate for import by the SUC2 transporter, palatinose is
not (Chandran et al., 2003). Similarly, the glucose analog L-glucose is not efficiently imported,
while 2-deoxy-D-glucose (2-DG) readily enters the cell (Jang and Sheen, 1994). The different
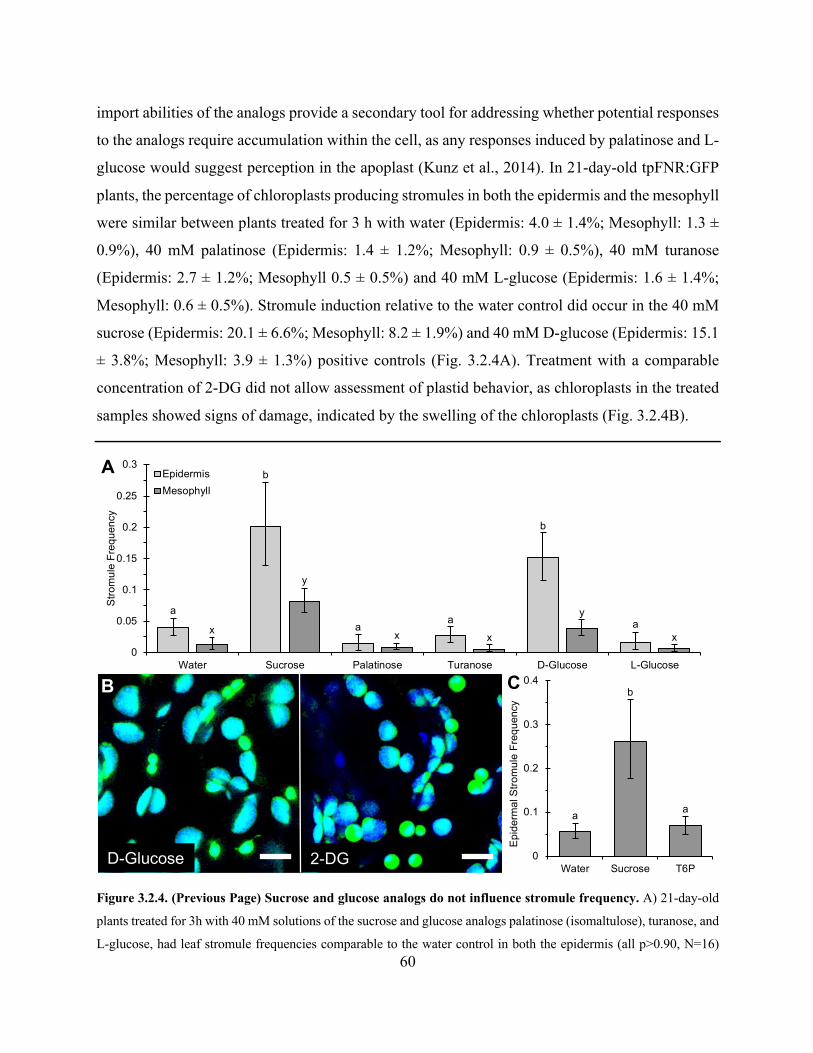
60
import abilities of the analogs provide a secondary tool for addressing whether potential responses
to the analogs require accumulation within the cell, as any responses induced by palatinose and L-
glucose would suggest perception in the apoplast (Kunz et al., 2014). In 21-day-old tpFNR:GFP
plants, the percentage of chloroplasts producing stromules in both the epidermis and the mesophyll
were similar between plants treated for 3 h with water (Epidermis: 4.0 ± 1.4%; Mesophyll: 1.3 ±
0.9%), 40 mM palatinose (Epidermis: 1.4 ± 1.2%; Mesophyll: 0.9 ± 0.5%), 40 mM turanose
(Epidermis: 2.7 ± 1.2%; Mesophyll 0.5 ± 0.5%) and 40 mM L-glucose (Epidermis: 1.6 ± 1.4%;
Mesophyll: 0.6 ± 0.5%). Stromule induction relative to the water control did occur in the 40 mM
sucrose (Epidermis: 20.1 ± 6.6%; Mesophyll: 8.2 ± 1.9%) and 40 mM D-glucose (Epidermis: 15.1
± 3.8%; Mesophyll: 3.9 ± 1.3%) positive controls (Fig. 3.2.4A). Treatment with a comparable
concentration of 2-DG did not allow assessment of plastid behavior, as chloroplasts in the treated
samples showed signs of damage, indicated by the swelling of the chloroplasts (Fig. 3.2.4B).
Figure 3.2.4. (Previous Page) Sucrose and glucose analogs do not influence stromule frequency. A) 21-day-old
plants treated for 3h with 40 mM solutions of the sucrose and glucose analogs palatinose (isomaltulose), turanose, and
L-glucose, had leaf stromule frequencies comparable to the water control in both the epidermis (all p>0.90, N=16)
a
b
aa
b
ax
y
x x
y
x0
0.05
0.1
0.15
0.2
0.25
0.3
Water Sucrose Palatinose Turanose D-Glucose L-Glucose
Stro
mul
e Fr
eque
ncy
EpidermisMesophyll
D-Glucose 2-DG
A
a
b
a
0
0.1
0.2
0.3
0.4
Water Sucrose T6P
Epid
erm
al S
trom
ule
Freq
uenc
y
B C
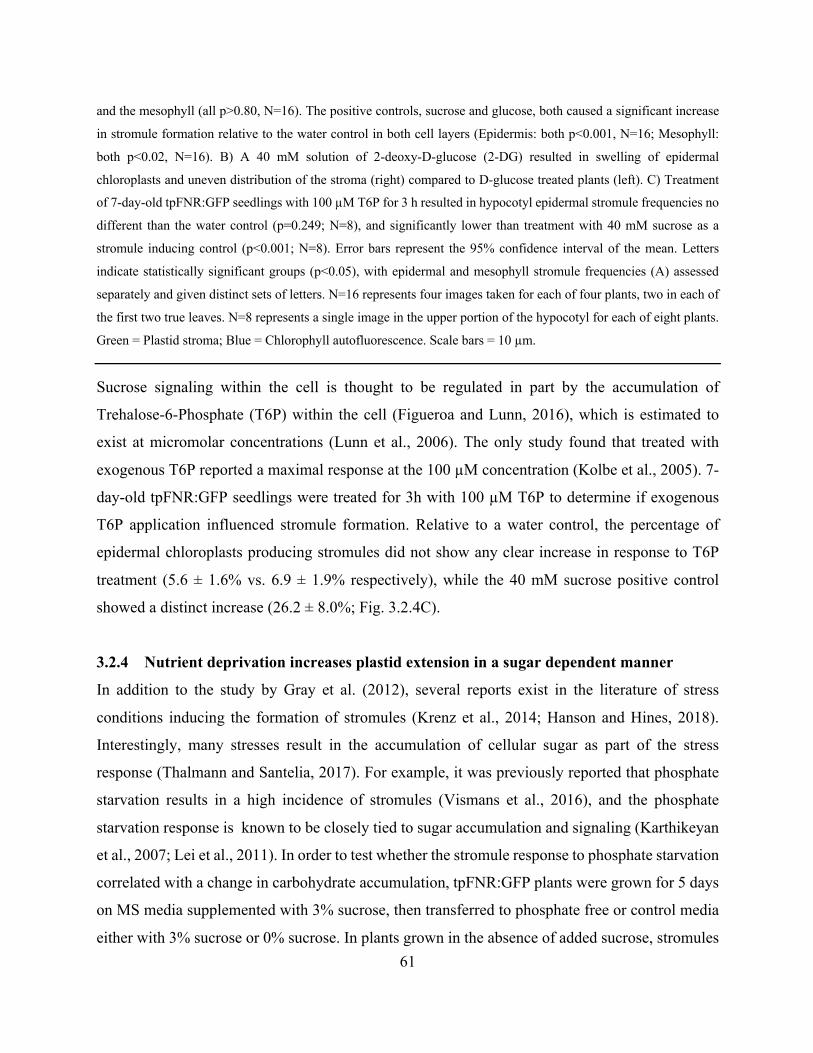
61
and the mesophyll (all p>0.80, N=16). The positive controls, sucrose and glucose, both caused a significant increase
in stromule formation relative to the water control in both cell layers (Epidermis: both p<0.001, N=16; Mesophyll:
both p<0.02, N=16). B) A 40 mM solution of 2-deoxy-D-glucose (2-DG) resulted in swelling of epidermal
chloroplasts and uneven distribution of the stroma (right) compared to D-glucose treated plants (left). C) Treatment
of 7-day-old tpFNR:GFP seedlings with 100 µM T6P for 3 h resulted in hypocotyl epidermal stromule frequencies no
different than the water control (p=0.249; N=8), and significantly lower than treatment with 40 mM sucrose as a
stromule inducing control (p<0.001; N=8). Error bars represent the 95% confidence interval of the mean. Letters
indicate statistically significant groups (p<0.05), with epidermal and mesophyll stromule frequencies (A) assessed
separately and given distinct sets of letters. N=16 represents four images taken for each of four plants, two in each of
the first two true leaves. N=8 represents a single image in the upper portion of the hypocotyl for each of eight plants.
Green = Plastid stroma; Blue = Chlorophyll autofluorescence. Scale bars = 10 µm.
Sucrose signaling within the cell is thought to be regulated in part by the accumulation of
Trehalose-6-Phosphate (T6P) within the cell (Figueroa and Lunn, 2016), which is estimated to
exist at micromolar concentrations (Lunn et al., 2006). The only study found that treated with
exogenous T6P reported a maximal response at the 100 µM concentration (Kolbe et al., 2005). 7-
day-old tpFNR:GFP seedlings were treated for 3h with 100 µM T6P to determine if exogenous
T6P application influenced stromule formation. Relative to a water control, the percentage of
epidermal chloroplasts producing stromules did not show any clear increase in response to T6P
treatment (5.6 ± 1.6% vs. 6.9 ± 1.9% respectively), while the 40 mM sucrose positive control
showed a distinct increase (26.2 ± 8.0%; Fig. 3.2.4C).
3.2.4 Nutrient deprivation increases plastid extension in a sugar dependent manner
In addition to the study by Gray et al. (2012), several reports exist in the literature of stress
conditions inducing the formation of stromules (Krenz et al., 2014; Hanson and Hines, 2018).
Interestingly, many stresses result in the accumulation of cellular sugar as part of the stress
response (Thalmann and Santelia, 2017). For example, it was previously reported that phosphate
starvation results in a high incidence of stromules (Vismans et al., 2016), and the phosphate
starvation response is known to be closely tied to sugar accumulation and signaling (Karthikeyan
et al., 2007; Lei et al., 2011). In order to test whether the stromule response to phosphate starvation
correlated with a change in carbohydrate accumulation, tpFNR:GFP plants were grown for 5 days
on MS media supplemented with 3% sucrose, then transferred to phosphate free or control media
either with 3% sucrose or 0% sucrose. In plants grown in the absence of added sucrose, stromules
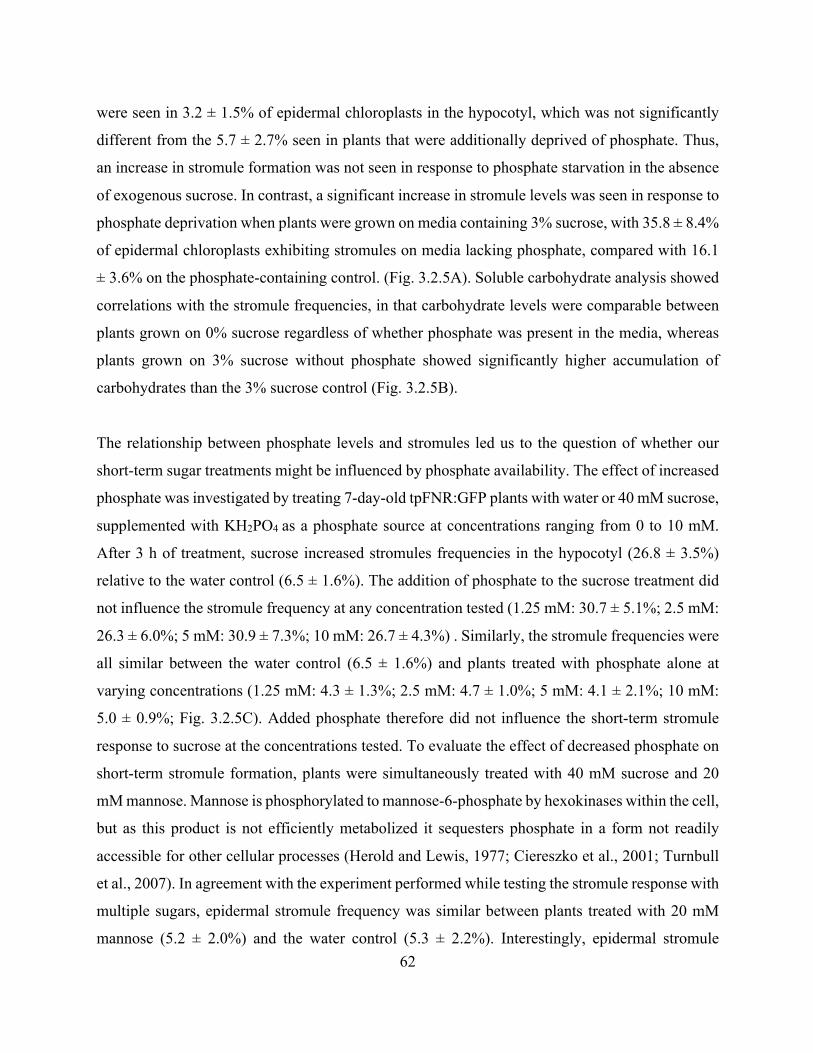
62
were seen in 3.2 ± 1.5% of epidermal chloroplasts in the hypocotyl, which was not significantly
different from the 5.7 ± 2.7% seen in plants that were additionally deprived of phosphate. Thus,
an increase in stromule formation was not seen in response to phosphate starvation in the absence
of exogenous sucrose. In contrast, a significant increase in stromule levels was seen in response to
phosphate deprivation when plants were grown on media containing 3% sucrose, with 35.8 ± 8.4%
of epidermal chloroplasts exhibiting stromules on media lacking phosphate, compared with 16.1
± 3.6% on the phosphate-containing control. (Fig. 3.2.5A). Soluble carbohydrate analysis showed
correlations with the stromule frequencies, in that carbohydrate levels were comparable between
plants grown on 0% sucrose regardless of whether phosphate was present in the media, whereas
plants grown on 3% sucrose without phosphate showed significantly higher accumulation of
carbohydrates than the 3% sucrose control (Fig. 3.2.5B).
The relationship between phosphate levels and stromules led us to the question of whether our
short-term sugar treatments might be influenced by phosphate availability. The effect of increased
phosphate was investigated by treating 7-day-old tpFNR:GFP plants with water or 40 mM sucrose,
supplemented with KH2PO4 as a phosphate source at concentrations ranging from 0 to 10 mM.
After 3 h of treatment, sucrose increased stromules frequencies in the hypocotyl (26.8 ± 3.5%)
relative to the water control (6.5 ± 1.6%). The addition of phosphate to the sucrose treatment did
not influence the stromule frequency at any concentration tested (1.25 mM: 30.7 ± 5.1%; 2.5 mM:
26.3 ± 6.0%; 5 mM: 30.9 ± 7.3%; 10 mM: 26.7 ± 4.3%) . Similarly, the stromule frequencies were
all similar between the water control (6.5 ± 1.6%) and plants treated with phosphate alone at
varying concentrations (1.25 mM: 4.3 ± 1.3%; 2.5 mM: 4.7 ± 1.0%; 5 mM: 4.1 ± 2.1%; 10 mM:
5.0 ± 0.9%; Fig. 3.2.5C). Added phosphate therefore did not influence the short-term stromule
response to sucrose at the concentrations tested. To evaluate the effect of decreased phosphate on
short-term stromule formation, plants were simultaneously treated with 40 mM sucrose and 20
mM mannose. Mannose is phosphorylated to mannose-6-phosphate by hexokinases within the cell,
but as this product is not efficiently metabolized it sequesters phosphate in a form not readily
accessible for other cellular processes (Herold and Lewis, 1977; Ciereszko et al., 2001; Turnbull
et al., 2007). In agreement with the experiment performed while testing the stromule response with
multiple sugars, epidermal stromule frequency was similar between plants treated with 20 mM
mannose (5.2 ± 2.0%) and the water control (5.3 ± 2.2%). Interestingly, epidermal stromule

63
frequency was lower in plants treated with mannose and sucrose together (9.3 ± 2.3%) compared
to sucrose treatment alone (15.5 ± 3.5%; Fig. 3.2.5D), suggesting that the presence of mannose in
some way reduced the effect of sucrose on plastid morphology. The presence of mannose also
created an unusual phenotype in the mesophyll chloroplasts. In the mannose treatment, and more
prominently in the combine mannose-sucrose treatment, the mesophyll chloroplasts showed
bulged regions of stroma too broad to qualify as a stromule or protrusion. Stromal loops, similar
in appearance to stromules but with neither end detached from the chloroplast, were also apparent
(Fig. 3.2.5E).
Figure 3.2.5. Phosphate deprivation increases stromule frequency and soluble carbohydrate accumulation in a
sucrose-dependent manner. A) The hypocotyls of seedlings grown for seven days on media lacking phosphate had
similar epidermal stromule frequencies to the phosphate containing control, so long as no sucrose was provided in the
media (p=0.18, N=20). Phosphate deprivation did result in an elevated stromule frequency when the media was
supplemented with 3% sucrose (p=<0.001, N=20). B) Plants grown on media lacking both phosphate and sucrose had
total soluble carbohydrate levels comparable to the 0% sucrose control (p=0.70, N=3). The absence of phosphate from
the 3% sucrose containing media resulted in significantly higher soluble carbohydrates than the 3% sucrose control
aa
b
c
0
0.1
0.2
0.3
0.4
0.5
Phosphate No Phosphate
Epi
derm
al S
trom
ule
Freq
uenc
y
0% Sucrose3% Sucrose
a a
b
c
0
5
10
15
20
25
Phosphate No Phosphate
Tota
l Sol
uble
Car
bohy
drat
e (µ
g gl
ucos
e eq
uiva
lent
s/m
g FW
)
0% Sucrose
3% Sucrose
A
D
aa a a a
b
bb
b
b
0
0.1
0.2
0.3
0.4
0 mM 1.25mM 2.5mM 5mM 10mM
Epi
derm
al S
trom
ule
Freq
uenc
y
Water40mM Sucrose
a
b
a
c
0
0.05
0.1
0.15
0.2
0.25
Water Sucrose
Epi
derm
al S
trom
ule
Freq
uenc
y
ControlMannose
B E
C
SL>
St>SB
>
64
(p=0.001, N=3). C) The addition of phosphate had no influence on the stromule response in short term (3 h) water (all
p>0.86, N=16) or 40 mM sucrose (All p>0.88, N=16) treated 21-day-old plants at any tested concentration. D) 21-
day-old plants treated for 3 h with 20 mM mannose to sequester some phosphate showed no difference in stromule
frequency from the water control (p=0.94, N=16). When treated simultaneously with 20 mM mannose and 40 mM
sucrose for 3 h, the stromule response was significantly lower than 40 mM sucrose alone (p=0.003, N=16). E)
Treatment with mannose resulted in the appearance of broad stromal bulges (SB), and stromal loops (SL) in the
mesophyll chloroplasts, distinct in appearance from a typical stromule (St). Error bars represent the 95% confidence
interval of the mean. Letters indicate statistically significant groups (p<0.05). N=20 represents two images taken of
the upper region of the hypocotyl for each of ten plants. N=16 represents four images taken for each of four plants,
two in each of the first two true leaves. N=3 for carbohydrate analysis represents three tissue samples, each containing
the aerial portion of twenty or more seedlings. Green = Plastid stroma; Blue = Chlorophyll autofluorescence. Scale
bar = 10 µm.
The correlation of stromule formation and sugar in the long-term phosphate-starved plants may
suggest that the stromules were a response to increased sugar rather than a response specific to
phosphate deprivation. We investigated the specificity of the response by depriving plants of either
nitrogen or potassium, in the presence or absence of added sucrose. Enlarged starch grains were
visible in the nutrient-stressed sugar-supplemented plants. Both stresses showed a stromule
response similar to the phosphate deprived plants. No difference in stromule frequencies was seen
between plants grown on media with 0% sucrose regardless of nutrient deprivation (Potassium vs.
No potassium: 4.3 ± 2.1% vs. 3.7 ± 1.0%; Nitrogen vs. No nitrogen: 2.3 ± 1.7% vs 3.0 ± 2.0%).
Growth on media with 3% sucrose resulted in an elevated stromule frequency in nutrient deprived
plants relative to the control (Potassium vs. No potassium: 9.0 ± 2.0% vs. 19.5 ± 9.3%) ; Nitrogen
vs. No Nitrogen: 12.7 ± 5.0% vs. 40.5 ± 12.1%; Fig. 3.2.6A, B). Total soluble carbohydrate levels
(Fig. 3.2.6C, D) were similarly elevated in nutrient deprived plants exclusively in the presence of
added sucrose. The stromule response to nutrient stress therefore correlated with the accumulation
of carbohydrates in the plant, rather than with the deprivation of nutrients, as nutrient deprivation
in the absence of increased carbohydrates had no effect on stromule frequency.

65
Figure 3.2.6. Nitrogen and potassium deprivation increase stromule frequency and total soluble carbohydrate
levels only in the presence of exogenous sucrose. A) Nitrogen deprivation did not increase stromule frequency in
the absence of supplied sucrose (p=0.66, N=8), but did increase it when the media was supplemented with 3% sucrose
(p<0.001, N=8). B) Total soluble carbohydrate levels were comparable between nitrogen deprived plants and the
control in the absence of added sucrose (p=0.51, N=3), but significantly higher in nitrogen deprived plants when
sucrose is provided (p<0.001; N=3). C) Potassium deprived plants had higher stromule frequencies compared to the
nutrient-containing control in the presence of added sucrose (p=0.02, N=8), but not when grown without added sucrose
(p=0.70, N=8). D) Plants deprived of potassium had higher total soluble carbohydrate levels than control plants when
grown on media containing sucrose (p=<0.001, N=3), but not on media lacking sucrose (p<0.001, N=3). Error bars
represent the 95% CI of the mean. Letters indicate statistically significant groups (p<0.05). N=8 represents a single
image taken in the upper hypocotyl region for each of eight plants. N=3 for carbohydrate analysis represents three
tissue samples, each containing the aerial portion of twenty or more seedlings.
3.2.5 Changes to chloroplast shape in response to light correlate with changes in cellular
sugar, rather than redox stress
Another stress reported to correlate with increased stromule formation is redox stress in the
chloroplast (Brunkard et al., 2015). Redox stress can occur upon exposure to light, when the
photosystems absorb energy faster than it can be transferred, resulting in the production of ROS
aa
b
c
0
0.1
0.2
0.3
0.4
Potassium No Potassium
Stro
mul
e Fr
eque
ncy
0% Sucrose3% Sucrose
a a
b
c
0.0
0.1
0.2
0.3
0.4
0.5
0.6
Nitrogen No Nitrogen
Stro
mul
e Fr
eque
ncy
0% Sucrose3% Sucrose
aa
b
c
0
4
8
12
16
20
Nitrogen No Nitrogen
Tota
l Sol
uble
Car
bohy
drat
e (µ
g gl
ucos
e eq
uiva
lent
s/m
g FW
)
0% Sucrose3% Sucrose
aa
b
c
0
2
4
6
8
10
12
Potassium No Potassium
Tota
l Sol
uble
Car
bohy
drat
e (µ
g gl
ucos
e eq
uiva
lent
s/m
g FW
)
0% Sucrose3% Sucrose
A
B
C
D

66
(Pospíšil, 2016). To date, two studies have reported an increase in stromule frequency during the
daylight hours. Schattat et al. (2012b) propose a link to the accumulation of sugars based on the
correlation with photosynthesis and previous observations of the effect of sugars on the plastid,
and Brunkard et al. (2015) propose a link to redox stress based on experiments with 3-(3,4-
dichlorophenyl)-1,1-dimethylurea (DCMU), which induces ROS production from the
photosystems.
With the aim of clarifying the respective roles of redox stress and sugar accumulation in the diurnal
changes in stromule formation, we floated 21-day-old tpFNR:GFP Arabidopsis plants in either 10
µM DCMU or a 0.1% DMSO control for 3 h. During treatment, plants were either exposed to light
(100 µmol m-2 s-1) to ensure an active pETC or kept in the dark as a control. Plants were also
treated with 40 mM sucrose and 10 µM DCMU simultaneously to test for interactions between
sucrose and redox status. We assessed stromule frequency in both the epidermal and mesophyll
chloroplast populations individually, as their photosynthetic abilities likely differ.
Among the epidermal chloroplast population, we saw an increased stromule frequency in the 0.1%
DMSO control exposed to light (9.7 ± 3.6%) compared to that kept in the dark (2.1 ± 1.4%),
confirming that the light-induced stromule response does occur under our experimental conditions
(Fig. 3.2.7A). Contrary to previous reports, treatment with 10 µM DCMU appeared to prevent this
response, as stromule frequencies were similar between plants treated with DCMU in the light (2.1
± 1.2%) and dark (1.8 ± 1.3%) and the 0.1% DMSO dark control (2.1 ± 1.4%; Fig. 3.2.7A).
Regardless of whether treatment was carried out in the light or the dark, the epidermal chloroplast
population showed a similar increase in stromule frequency in response to treatment with 40mM
sucrose (Light: 37.4 ± 6.1%; Dark: 30.9 ± 3.7%). Fig. 3.2.7B). Treatment with both DCMU and
sucrose, when carried out in the dark, resulted in stromule frequencies that did not differ from the
sucrose control (DCMU + Sucrose: 33.1 ± 6.3%; Sucrose: 30.9 ± 3.7%), however when plants
were treated with both sucrose and DCMU in the light, a reduced stromule induction was observed
(20.3 ± 4.3%; Fig. 3.2.7B). Both the DCMU treatment alone and simultaneous treatment with
sugar therefore suggest that the inhibitor actually reduces stromule frequency in the epidermal
chloroplasts, rather than increasing it.
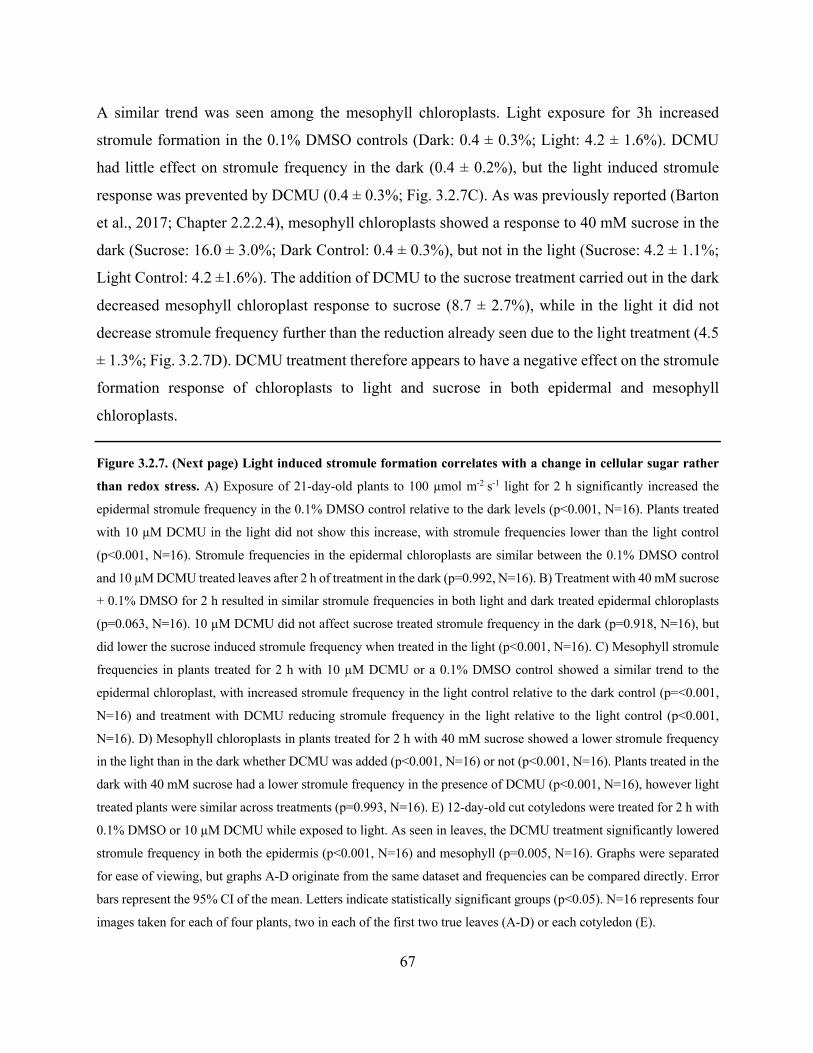
67
A similar trend was seen among the mesophyll chloroplasts. Light exposure for 3h increased
stromule formation in the 0.1% DMSO controls (Dark: 0.4 ± 0.3%; Light: 4.2 ± 1.6%). DCMU
had little effect on stromule frequency in the dark (0.4 ± 0.2%), but the light induced stromule
response was prevented by DCMU (0.4 ± 0.3%; Fig. 3.2.7C). As was previously reported (Barton
et al., 2017; Chapter 2.2.2.4), mesophyll chloroplasts showed a response to 40 mM sucrose in the
dark (Sucrose: 16.0 ± 3.0%; Dark Control: 0.4 ± 0.3%), but not in the light (Sucrose: 4.2 ± 1.1%;
Light Control: 4.2 ±1.6%). The addition of DCMU to the sucrose treatment carried out in the dark
decreased mesophyll chloroplast response to sucrose (8.7 ± 2.7%), while in the light it did not
decrease stromule frequency further than the reduction already seen due to the light treatment (4.5
± 1.3%; Fig. 3.2.7D). DCMU treatment therefore appears to have a negative effect on the stromule
formation response of chloroplasts to light and sucrose in both epidermal and mesophyll
chloroplasts.
Figure 3.2.7. (Next page) Light induced stromule formation correlates with a change in cellular sugar rather
than redox stress. A) Exposure of 21-day-old plants to 100 µmol m-2 s-1 light for 2 h significantly increased the
epidermal stromule frequency in the 0.1% DMSO control relative to the dark levels (p<0.001, N=16). Plants treated
with 10 µM DCMU in the light did not show this increase, with stromule frequencies lower than the light control
(p<0.001, N=16). Stromule frequencies in the epidermal chloroplasts are similar between the 0.1% DMSO control
and 10 µM DCMU treated leaves after 2 h of treatment in the dark (p=0.992, N=16). B) Treatment with 40 mM sucrose
+ 0.1% DMSO for 2 h resulted in similar stromule frequencies in both light and dark treated epidermal chloroplasts
(p=0.063, N=16). 10 µM DCMU did not affect sucrose treated stromule frequency in the dark (p=0.918, N=16), but
did lower the sucrose induced stromule frequency when treated in the light (p<0.001, N=16). C) Mesophyll stromule
frequencies in plants treated for 2 h with 10 µM DCMU or a 0.1% DMSO control showed a similar trend to the
epidermal chloroplast, with increased stromule frequency in the light control relative to the dark control (p=<0.001,
N=16) and treatment with DCMU reducing stromule frequency in the light relative to the light control (p<0.001,
N=16). D) Mesophyll chloroplasts in plants treated for 2 h with 40 mM sucrose showed a lower stromule frequency
in the light than in the dark whether DCMU was added (p<0.001, N=16) or not (p<0.001, N=16). Plants treated in the
dark with 40 mM sucrose had a lower stromule frequency in the presence of DCMU (p<0.001, N=16), however light
treated plants were similar across treatments (p=0.993, N=16). E) 12-day-old cut cotyledons were treated for 2 h with
0.1% DMSO or 10 µM DCMU while exposed to light. As seen in leaves, the DCMU treatment significantly lowered
stromule frequency in both the epidermis (p<0.001, N=16) and mesophyll (p=0.005, N=16). Graphs were separated
for ease of viewing, but graphs A-D originate from the same dataset and frequencies can be compared directly. Error
bars represent the 95% CI of the mean. Letters indicate statistically significant groups (p<0.05). N=16 represents four
images taken for each of four plants, two in each of the first two true leaves (A-D) or each cotyledon (E).
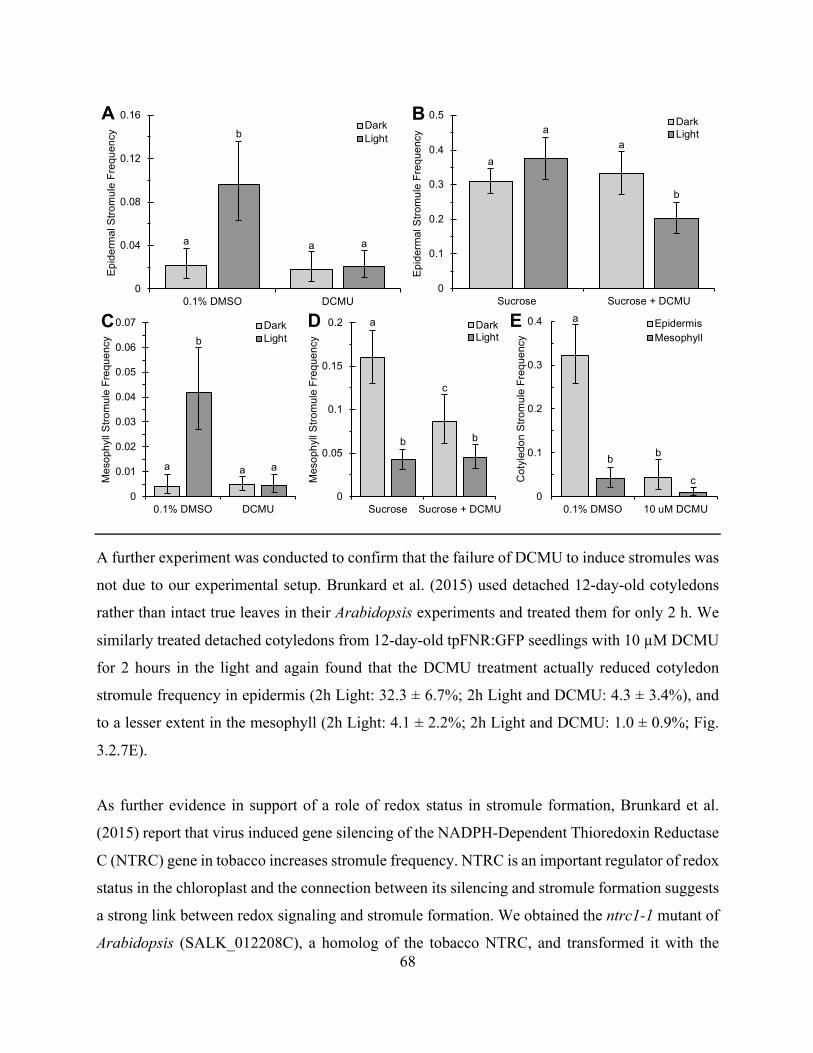
68
A further experiment was conducted to confirm that the failure of DCMU to induce stromules was
not due to our experimental setup. Brunkard et al. (2015) used detached 12-day-old cotyledons
rather than intact true leaves in their Arabidopsis experiments and treated them for only 2 h. We
similarly treated detached cotyledons from 12-day-old tpFNR:GFP seedlings with 10 µM DCMU
for 2 hours in the light and again found that the DCMU treatment actually reduced cotyledon
stromule frequency in epidermis (2h Light: 32.3 ± 6.7%; 2h Light and DCMU: 4.3 ± 3.4%), and
to a lesser extent in the mesophyll (2h Light: 4.1 ± 2.2%; 2h Light and DCMU: 1.0 ± 0.9%; Fig.
3.2.7E).
As further evidence in support of a role of redox status in stromule formation, Brunkard et al.
(2015) report that virus induced gene silencing of the NADPH-Dependent Thioredoxin Reductase
C (NTRC) gene in tobacco increases stromule frequency. NTRC is an important regulator of redox
status in the chloroplast and the connection between its silencing and stromule formation suggests
a strong link between redox signaling and stromule formation. We obtained the ntrc1-1 mutant of
Arabidopsis (SALK_012208C), a homolog of the tobacco NTRC, and transformed it with the
a a
b
a
0
0.04
0.08
0.12
0.16
0.1% DMSO DCMU
Epi
derm
al S
trom
ule
Fre
quen
cyDarkLight
a
aa
b
0
0.1
0.2
0.3
0.4
0.5
Sucrose Sucrose + DCMU
Epi
derm
al S
trom
ule
Fre
quen
cy
DarkLight
a a
b
a
0
0.01
0.02
0.03
0.04
0.05
0.06
0.07
0.1% DMSO DCMU
Mes
ophy
ll S
trom
ule
Fre
quen
cy
DarkLight
a
c
b b
0
0.05
0.1
0.15
0.2
Sucrose Sucrose + DCMU
Mes
ophy
ll S
trom
ule
Fre
quen
cyDarkLight
A B
C D a
bb
c
0
0.1
0.2
0.3
0.4
0.1% DMSO 10 uM DCMUC
otyl
edon
Str
omul
e F
requ
ency
EpidermisMesophyll
E
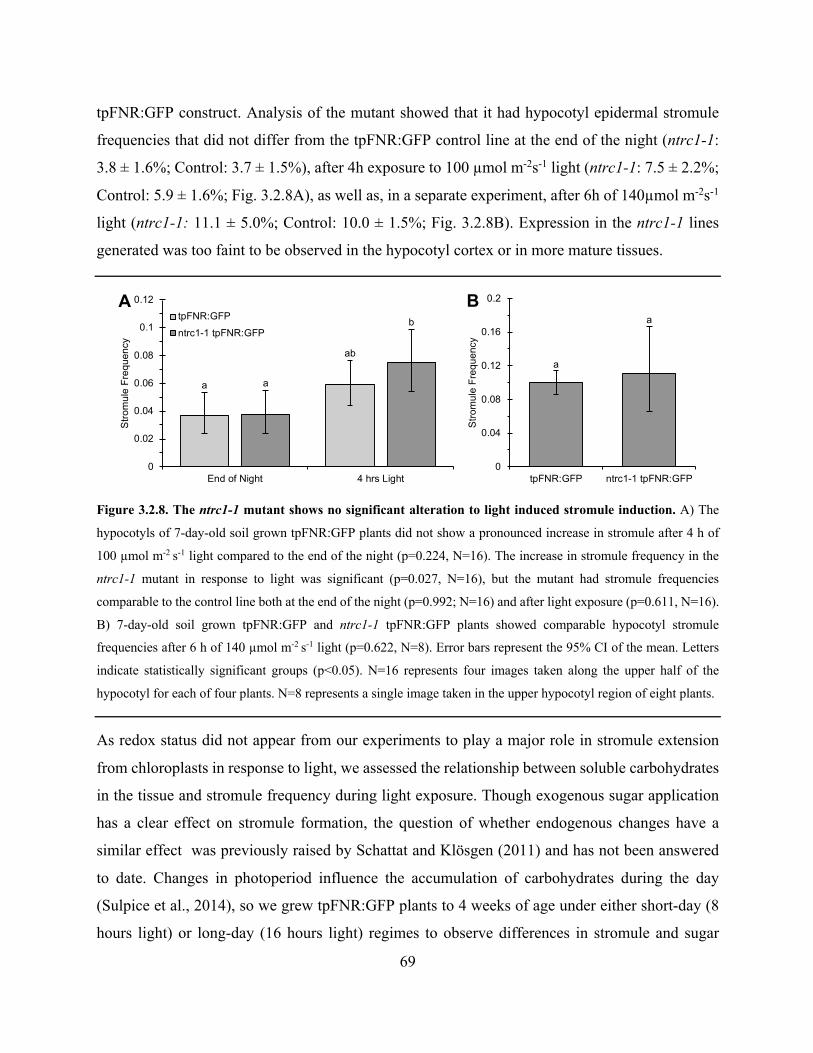
69
tpFNR:GFP construct. Analysis of the mutant showed that it had hypocotyl epidermal stromule
frequencies that did not differ from the tpFNR:GFP control line at the end of the night (ntrc1-1:
3.8 ± 1.6%; Control: 3.7 ± 1.5%), after 4h exposure to 100 µmol m-2s-1 light (ntrc1-1: 7.5 ± 2.2%;
Control: 5.9 ± 1.6%; Fig. 3.2.8A), as well as, in a separate experiment, after 6h of 140µmol m-2s-1
light (ntrc1-1: 11.1 ± 5.0%; Control: 10.0 ± 1.5%; Fig. 3.2.8B). Expression in the ntrc1-1 lines
generated was too faint to be observed in the hypocotyl cortex or in more mature tissues.
Figure 3.2.8. The ntrc1-1 mutant shows no significant alteration to light induced stromule induction. A) The
hypocotyls of 7-day-old soil grown tpFNR:GFP plants did not show a pronounced increase in stromule after 4 h of
100 µmol m-2 s-1 light compared to the end of the night (p=0.224, N=16). The increase in stromule frequency in the
ntrc1-1 mutant in response to light was significant (p=0.027, N=16), but the mutant had stromule frequencies
comparable to the control line both at the end of the night (p=0.992; N=16) and after light exposure (p=0.611, N=16).
B) 7-day-old soil grown tpFNR:GFP and ntrc1-1 tpFNR:GFP plants showed comparable hypocotyl stromule
frequencies after 6 h of 140 µmol m-2 s-1 light (p=0.622, N=8). Error bars represent the 95% CI of the mean. Letters
indicate statistically significant groups (p<0.05). N=16 represents four images taken along the upper half of the
hypocotyl for each of four plants. N=8 represents a single image taken in the upper hypocotyl region of eight plants.
As redox status did not appear from our experiments to play a major role in stromule extension
from chloroplasts in response to light, we assessed the relationship between soluble carbohydrates
in the tissue and stromule frequency during light exposure. Though exogenous sugar application
has a clear effect on stromule formation, the question of whether endogenous changes have a
similar effect was previously raised by Schattat and Klösgen (2011) and has not been answered
to date. Changes in photoperiod influence the accumulation of carbohydrates during the day
(Sulpice et al., 2014), so we grew tpFNR:GFP plants to 4 weeks of age under either short-day (8
hours light) or long-day (16 hours light) regimes to observe differences in stromule and sugar
a
ab
a
b
0
0.02
0.04
0.06
0.08
0.1
0.12
End of Night 4 hrs Light
Stro
mul
e Fr
eque
ncy
tpFNR:GFPntrc1-1 tpFNR:GFP
a
a
0
0.04
0.08
0.12
0.16
0.2
tpFNR:GFP ntrc1-1 tpFNR:GFPSt
rom
ule
Freq
uenc
y
A B
70
accumulation. Measurements of stromule frequency and total soluble carbohydrate levels were
taken 0 h, 4 h and 8 h into the light period. Plants grown under long-day conditions had a fairly
consistent level of soluble carbohydrates throughout the first 8 h of the light period (0 h: 3.21 ±
0.95; 4 h: 3.16 ± 0.36; 8 h: 3.73 ± 0.76 µg glucose equivalents per mg FW; Fig. 3.2.9A), as well
as a consistent stromule frequency in the mesophyll cells (0 h: 5.8 ± 2.6%; 4 h: 5.0 ± 1.7%; 8 h:
5.0 ± 1.9%; Fig. 3.2.9B) and in the epidermal pavement cells (0 h: 12.4 ± 2.1%; 4 h: 15.6 ± 3.5%;
8 h: 11.8 ± 1.7%; Fig. 3.2.9C).
Short-day grown plants had lower carbohydrate levels than ones grown under long-day conditions
at all time-points (Fig. 3.2.9A). The stromule frequency in mesophyll cells, which make up the
bulk of the leaf tissue analyzed for carbohydrates, was similarly lower at all time-points under
short-day conditions than in long-day grown plants (Fig. 3.2.9B). In contrast to the consistent
carbohydrate levels seen through the first 8 h of light in long-day grown plants, short-day grown
plants showed a significant increase in soluble carbohydrate levels between 0h and 4h of light,
then remained consistent through the 8 h time-point (0 h: 1.42 ± 0.13; 4 h: 2.47 ± 0.59; 8 h: 2.24
± 0.46 µg glucose equivalents per mg FW; Fig. 3.2.9A). Mesophyll stromule frequencies did not
differ significantly throughout the day, though there was a noticeable drop at the 8 h timepoint (0
h: 2.6 ± 0.8%; 4 h: 2.9 ± 0.9%; 8 h: 1.7 ± 0.4%; Fig. 3.2.9B). In contrast, epidermal stromule
frequencies rose gradually throughout the day, though this difference only showed a statistically
significant rise between 0 h and 4 h of light (0 h: 8.7 ± 1.0%; 4 h: 13.7 ± 2.7%; 8 h: 16.8 ± 2.6%;
Fig. 3.2.9C). Our soluble carbohydrate analysis could not distinguish between epidermal and
mesophyll cells, which complicated analysis of differing stromule frequency patterns between
these tissues in short-day grown plants. It was, however, noted that often when there was a
discrepancy between the pattern of carbohydrate accumulation and the mesophyll stromule
response, the epidermal response could explain the inconsistency under a model where the
response is related to sugar accumulation within a cell or tissue. For example, the rise in
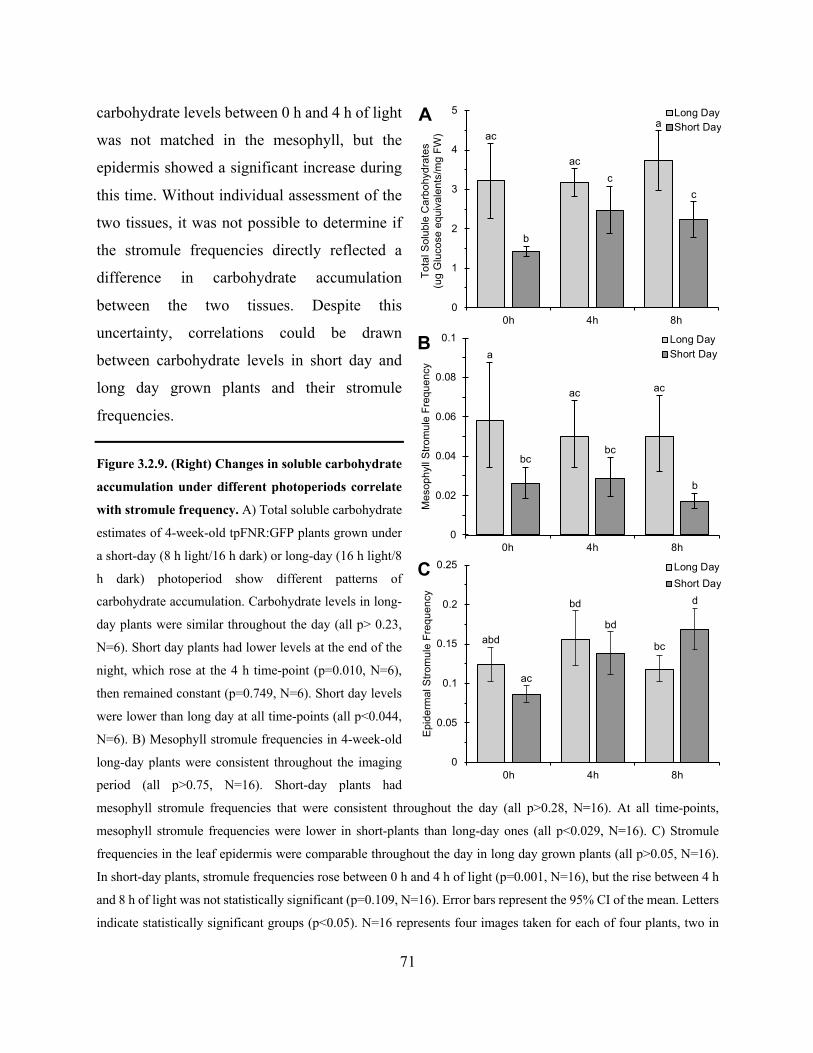
71
carbohydrate levels between 0 h and 4 h of light
was not matched in the mesophyll, but the
epidermis showed a significant increase during
this time. Without individual assessment of the
two tissues, it was not possible to determine if
the stromule frequencies directly reflected a
difference in carbohydrate accumulation
between the two tissues. Despite this
uncertainty, correlations could be drawn
between carbohydrate levels in short day and
long day grown plants and their stromule
frequencies.
Figure 3.2.9. (Right) Changes in soluble carbohydrate
accumulation under different photoperiods correlate
with stromule frequency. A) Total soluble carbohydrate
estimates of 4-week-old tpFNR:GFP plants grown under
a short-day (8 h light/16 h dark) or long-day (16 h light/8
h dark) photoperiod show different patterns of
carbohydrate accumulation. Carbohydrate levels in long-
day plants were similar throughout the day (all p> 0.23,
N=6). Short day plants had lower levels at the end of the
night, which rose at the 4 h time-point (p=0.010, N=6),
then remained constant (p=0.749, N=6). Short day levels
were lower than long day at all time-points (all p<0.044,
N=6). B) Mesophyll stromule frequencies in 4-week-old
long-day plants were consistent throughout the imaging
period (all p>0.75, N=16). Short-day plants had
mesophyll stromule frequencies that were consistent throughout the day (all p>0.28, N=16). At all time-points,
mesophyll stromule frequencies were lower in short-plants than long-day ones (all p<0.029, N=16). C) Stromule
frequencies in the leaf epidermis were comparable throughout the day in long day grown plants (all p>0.05, N=16).
In short-day plants, stromule frequencies rose between 0 h and 4 h of light (p=0.001, N=16), but the rise between 4 h
and 8 h of light was not statistically significant (p=0.109, N=16). Error bars represent the 95% CI of the mean. Letters
indicate statistically significant groups (p<0.05). N=16 represents four images taken for each of four plants, two in
abd
bd
bc
ac
bd
d
0
0.05
0.1
0.15
0.2
0.25
0h 4h 8h
Epi
derm
al S
trom
ule
Fre
quen
cy
Long Day
Short Day
a
ac ac
bcbc
b
0
0.02
0.04
0.06
0.08
0.1
0h 4h 8h
Mes
ophy
ll S
trom
ule
Fre
quen
cy
Long DayShort Day
ac
ac
a
b
c
c
0
1
2
3
4
5
0h 4h 8h
Tot
al S
olub
le C
arbo
hydr
ates
(u
g G
luco
se e
quiv
alen
ts/m
g F
W)
Long DayShort Day
A
B
C
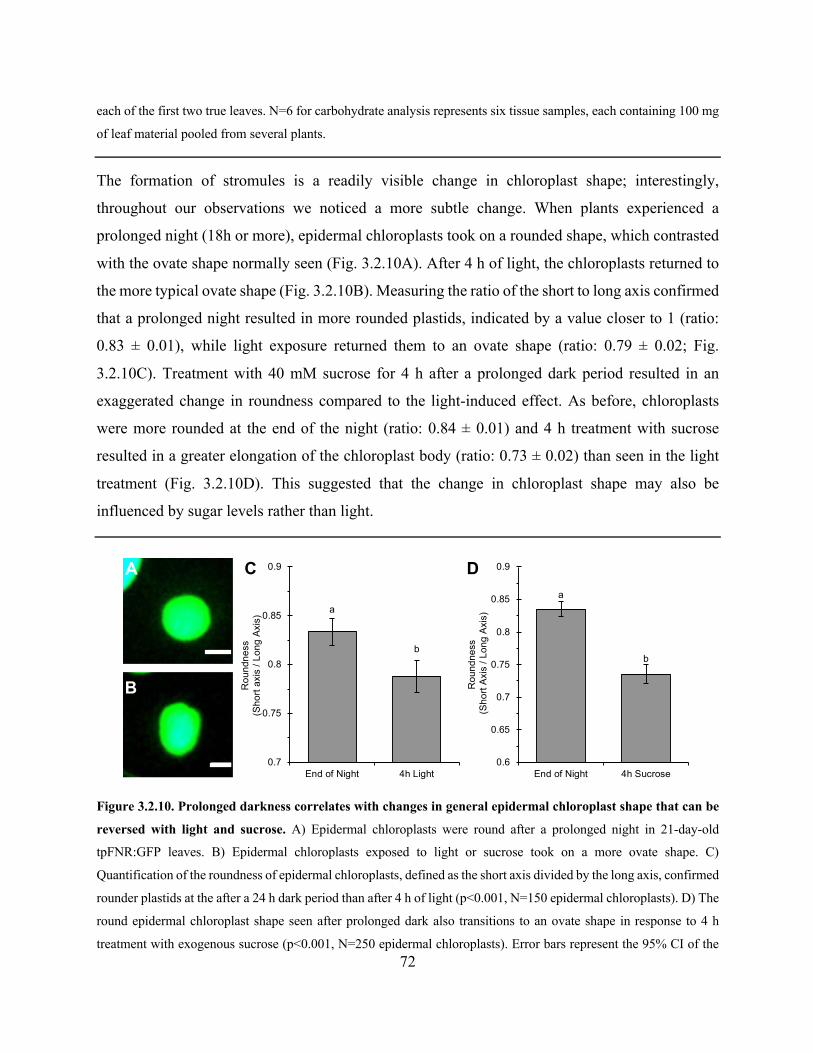
72
each of the first two true leaves. N=6 for carbohydrate analysis represents six tissue samples, each containing 100 mg
of leaf material pooled from several plants.
The formation of stromules is a readily visible change in chloroplast shape; interestingly,
throughout our observations we noticed a more subtle change. When plants experienced a
prolonged night (18h or more), epidermal chloroplasts took on a rounded shape, which contrasted
with the ovate shape normally seen (Fig. 3.2.10A). After 4 h of light, the chloroplasts returned to
the more typical ovate shape (Fig. 3.2.10B). Measuring the ratio of the short to long axis confirmed
that a prolonged night resulted in more rounded plastids, indicated by a value closer to 1 (ratio:
0.83 ± 0.01), while light exposure returned them to an ovate shape (ratio: 0.79 ± 0.02; Fig.
3.2.10C). Treatment with 40 mM sucrose for 4 h after a prolonged dark period resulted in an
exaggerated change in roundness compared to the light-induced effect. As before, chloroplasts
were more rounded at the end of the night (ratio: 0.84 ± 0.01) and 4 h treatment with sucrose
resulted in a greater elongation of the chloroplast body (ratio: 0.73 ± 0.02) than seen in the light
treatment (Fig. 3.2.10D). This suggested that the change in chloroplast shape may also be
influenced by sugar levels rather than light.
Figure 3.2.10. Prolonged darkness correlates with changes in general epidermal chloroplast shape that can be
reversed with light and sucrose. A) Epidermal chloroplasts were round after a prolonged night in 21-day-old
tpFNR:GFP leaves. B) Epidermal chloroplasts exposed to light or sucrose took on a more ovate shape. C)
Quantification of the roundness of epidermal chloroplasts, defined as the short axis divided by the long axis, confirmed
rounder plastids at the after a 24 h dark period than after 4 h of light (p<0.001, N=150 epidermal chloroplasts). D) The
round epidermal chloroplast shape seen after prolonged dark also transitions to an ovate shape in response to 4 h
treatment with exogenous sucrose (p<0.001, N=250 epidermal chloroplasts). Error bars represent the 95% CI of the
a
b
0.7
0.75
0.8
0.85
0.9
End of Night 4h Light
Rou
ndne
ss
(Sho
rt ax
is /
Long
Axi
s)
a
b
0.6
0.65
0.7
0.75
0.8
0.85
0.9
End of Night 4h Sucrose
Rou
ndne
ss(S
hort
Axis
/ Lo
ng A
xis)
A D
B
C
73
mean. Letters indicate statistically significant groups (p<0.05). Green = Plastid Stroma; Blue = Chlorophyll
autofluorescence. Scale bars = 2 µm.
The correlation between soluble carbohydrate accumulation and changes to plastid shape seems
consistent; however, many of the conditions that result in increased soluble carbohydrates likely
also correlate with an increase in starch within the plastid. Starch formation was seen in the nutrient
stressed plants in our experiments, especially during phosphate and nitrogen deprivation, and is a
well-documented effect of nutrient stressed (MacNeill et al., 2017). Additionally, light exposure
results in the formation of transitory starch from photosynthates (Zeeman et al., 2007), and
exogenous sugars similarly have been reported to increase starch synthesis (Lunn et al., 2006). As
starch synthesis could displace the stroma and exert an internal force on the plastid envelope, we
assessed its role in plastid shape.
3.2.6 Stromule formation increases in response to endogenous sugar accumulation and is
independent of starch accumulation
Three mutants were selected for the initial analysis into the effect of starch on stromule extension.
The two low-starch mutants adp-glucose pyrophosphorylase 1-1 (adg1-1; Lin et al., 1988; Wang
et al., 1998) and phosphoglucomutase 1 (pgm1; Caspar et al., 1985) are defective in the pathway
responsible for creating the starch building-block ADP-glucose, while the high starch starch excess
1 (sex1; Caspar et al., 1991) mutant is impaired in starch degradation. These mutant lines were
transformed with the tpFNR:GFP construct to produce stable transgenic lines with the chloroplast
stroma labelled. Despite their differences in starch formation, the adg1-1, pgm1 and sex1 mutants
all accumulate high soluble sugar compared to WT plants during day (Caspar et al., 1985; Caspar
et al., 1991; Gibon et al., 2004; Kunz et al., 2010; Schmitz et al., 2012). This allowed us to assess
whether the presence or absence of starch influences stromule formation, while simultaneously
providing a more in-depth assessment of the effect of changes in endogenous sugar levels on
plastid morphology.
The stromule frequency and total soluble carbohydrate levels in 6-week-old mutant and control
plants were compared over the course of a short day (8 h light/16 h darkness). Stromule frequency
was assessed in the adaxial leaf surface at 0, 2, 4, and 8 h into the light period. The stromule
74
response was consistent over time in control plants, as assessment on three subsequent days
provided comparable frequencies at all time-points. Epidermal and mesophyll stromule
frequencies for the control plants therefore represent the combined data from three separate days
of analysis. Among the epidermal chloroplasts, the same trend of stromule formation was seen
across all the mutants and the control, with the lowest levels at the end of the night and a
progressive increase throughout the day. The adg1-1 and pgm1 mutants had comparable
frequencies to each other but were higher than the control and sex1 mutant at all time-points.
Stromule frequencies in sex1 were comparable to the control at the end of the night period and
after 2 h of light, but higher at the 4 h and 8 h time-points (Fig. 3.2.11A). As adg1-1 and pgm1 are
similar in reported sugar and starch phenotypes and showed similar epidermal stromule
frequencies, pgm1 was selected as the representative low-starch mutant for assessment of
mesophyll stromule frequencies and total carbohydrate levels.
Figure 3.2.11. (Next Page) Stromule frequency is not significantly influenced by the absence or presence of
starch. A) Epidermal stromule frequencies in the leaves of 6-week-old short day grown tpFNR:GFP control plants,
as well as in the adg1-1, pgm1, and sex1 mutants rose consistently throughout the day. The adg1-1 and pgm1 mutants
were comparable to each other at all timepoints but higher than both the control and the sex1 mutant. The sex1 mutant
had similar frequencies to the control at the first two timepoints, but was higher at both the middle and end of the day.
B) Stromule frequencies in the mesophyll cells show a diurnal pattern distinct from the epidermal chloroplasts. In the
control line, stromule frequency rose for the first 4 h, then dropped at the end of the day. The same pattern was seen
in the sex1 mutant, though the stromule frequencies were slightly higher than the control and significantly higher at
the 4 h timepoint. In the pgm1 mutant, the mesophyll stromule frequencies appeared to plateau after 2 h and did not
show the drop at the 8 h timepoint. C) Total soluble carbohydrate analysis of the control and mutant plants revealed
accumulation patterns similar to mesophyll stromule frequencies for the control and sex1 mutant, with a gradual
increase in soluble carbohydrates followed by a drop at the end of the day. The drop was however less pronounced
that that seen with the stromule frequencies. In the pgm1 mutant, soluble carbohydrates rose consistently throughout
the day. Error bars represent the 95% CI of the mean. Letters represent significant differences (p<0.05) between
control and mutant lines at a single time-point; new letters were chosen for each time-point. An asterisk (*) represents
a significant difference from the previous time-point within a single line. For carbohydrate analysis tissue was pooled
from several plants, N=3 for the mutants, N=9 for the control. For stromule frequencies, N=16 for the mutants,
representing four images taken for each of four plants, two in each of the first two true leaves. N=48 for the control,
representing the pooled data from three days.

75
In the control, stromules in the mesophyll increased between 0 h and 4 h of light, but then dropped
significantly at the 8 h time-point. The sex1 mutant showed a similar pattern of stromule
frequencies. At the end of the night, the sex1 mesophyll stromule frequency was similar to the
control. After 4 h of light, stromule frequency in the mesophyll chloroplasts of sex1 was higher
than seen in the control, but the frequency dropped back to control levels at the 8 h time-point (Fig.
3.2.11B). In addition to the formation of stromules, the mesophyll of sex1 contained looped
structures that resemble those described previously in the mannose treated plants that were not
counted as stromules during the analysis. In the pgm1 mutant, mesophyll stromule frequency was
comparable to the control at the end of the night, and then rose within the first two hours of light
a
*e h
*mb
f
*i
n
b
*f
*i
n
a
*e
*j
*o
0
0.2
0.4
0.6
0.8
1
0 2 4 8
Epid
erm
al S
trom
ule
Freq
uenc
y
Hours of Light
Controlpgm1adg1-1sex1
a
*e
h
*m
a
*f hi n
a
*ef
i
*m
0.00
0.05
0.10
0.15
0 2 4 8
Mes
ophy
ll St
rom
ule
Freq
uenc
y
Hours of Light
Controlpgm1sex1
a e
*h m
a
*f
*i
n
a
*f j *
o
0
3
6
9
0 2 4 8
Tota
l Sol
uble
Car
bohy
drat
es(u
g gl
ucos
e eq
uiva
lent
s/m
g FW
)
Hours of Light
Controlpgm1sex1
A
B
C
* *
*
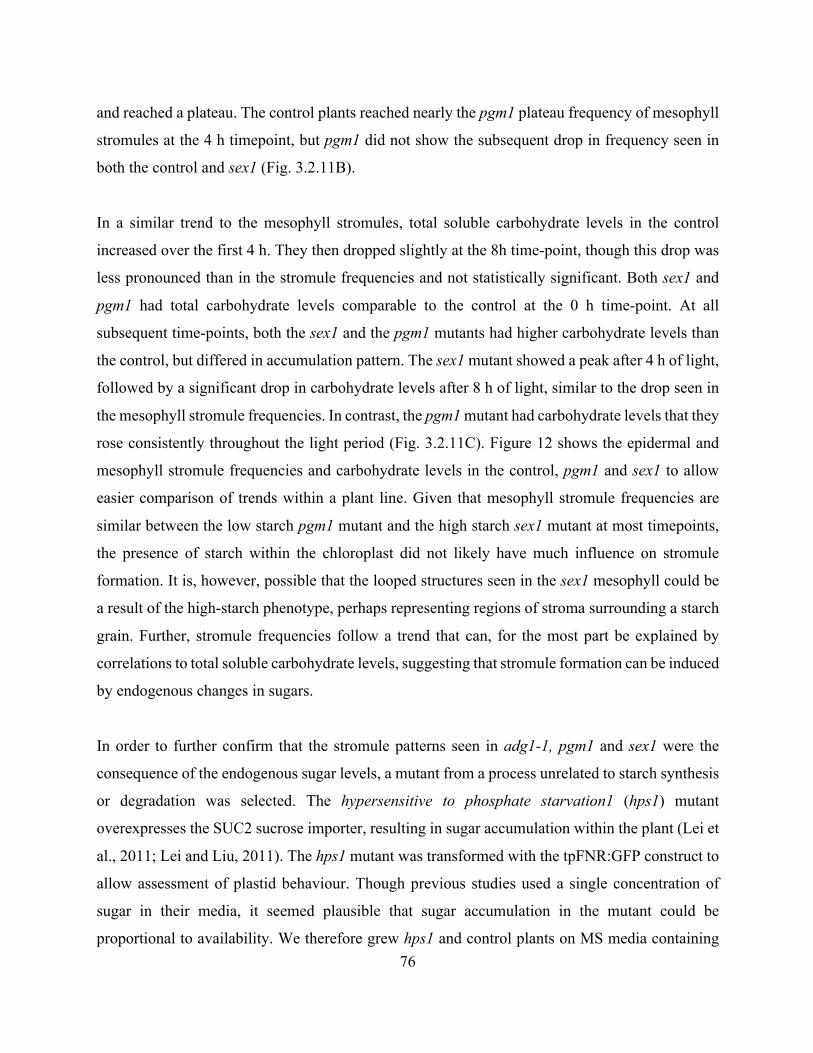
76
and reached a plateau. The control plants reached nearly the pgm1 plateau frequency of mesophyll
stromules at the 4 h timepoint, but pgm1 did not show the subsequent drop in frequency seen in
both the control and sex1 (Fig. 3.2.11B).
In a similar trend to the mesophyll stromules, total soluble carbohydrate levels in the control
increased over the first 4 h. They then dropped slightly at the 8h time-point, though this drop was
less pronounced than in the stromule frequencies and not statistically significant. Both sex1 and
pgm1 had total carbohydrate levels comparable to the control at the 0 h time-point. At all
subsequent time-points, both the sex1 and the pgm1 mutants had higher carbohydrate levels than
the control, but differed in accumulation pattern. The sex1 mutant showed a peak after 4 h of light,
followed by a significant drop in carbohydrate levels after 8 h of light, similar to the drop seen in
the mesophyll stromule frequencies. In contrast, the pgm1 mutant had carbohydrate levels that they
rose consistently throughout the light period (Fig. 3.2.11C). Figure 12 shows the epidermal and
mesophyll stromule frequencies and carbohydrate levels in the control, pgm1 and sex1 to allow
easier comparison of trends within a plant line. Given that mesophyll stromule frequencies are
similar between the low starch pgm1 mutant and the high starch sex1 mutant at most timepoints,
the presence of starch within the chloroplast did not likely have much influence on stromule
formation. It is, however, possible that the looped structures seen in the sex1 mesophyll could be
a result of the high-starch phenotype, perhaps representing regions of stroma surrounding a starch
grain. Further, stromule frequencies follow a trend that can, for the most part be explained by
correlations to total soluble carbohydrate levels, suggesting that stromule formation can be induced
by endogenous changes in sugars.
In order to further confirm that the stromule patterns seen in adg1-1, pgm1 and sex1 were the
consequence of the endogenous sugar levels, a mutant from a process unrelated to starch synthesis
or degradation was selected. The hypersensitive to phosphate starvation1 (hps1) mutant
overexpresses the SUC2 sucrose importer, resulting in sugar accumulation within the plant (Lei et
al., 2011; Lei and Liu, 2011). The hps1 mutant was transformed with the tpFNR:GFP construct to
allow assessment of plastid behaviour. Though previous studies used a single concentration of
sugar in their media, it seemed plausible that sugar accumulation in the mutant could be
proportional to availability. We therefore grew hps1 and control plants on MS media containing
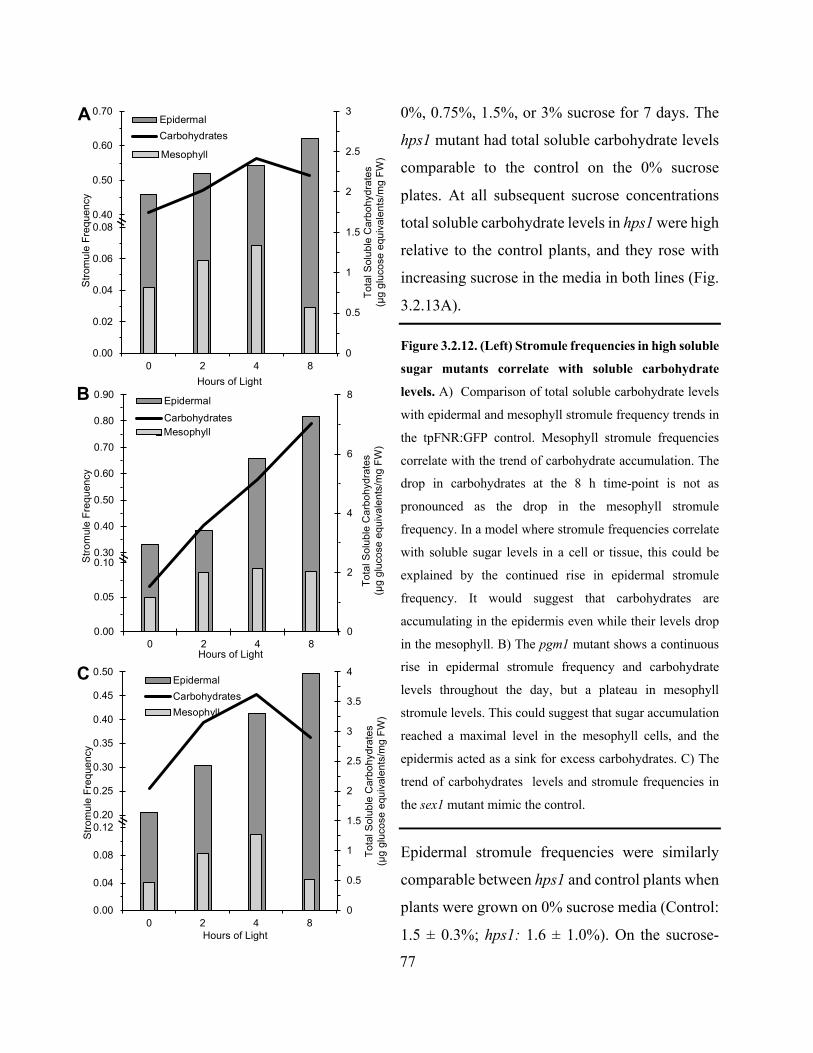
77
0%, 0.75%, 1.5%, or 3% sucrose for 7 days. The
hps1 mutant had total soluble carbohydrate levels
comparable to the control on the 0% sucrose
plates. At all subsequent sucrose concentrations
total soluble carbohydrate levels in hps1 were high
relative to the control plants, and they rose with
increasing sucrose in the media in both lines (Fig.
3.2.13A).
Figure 3.2.12. (Left) Stromule frequencies in high soluble
sugar mutants correlate with soluble carbohydrate
levels. A) Comparison of total soluble carbohydrate levels
with epidermal and mesophyll stromule frequency trends in
the tpFNR:GFP control. Mesophyll stromule frequencies
correlate with the trend of carbohydrate accumulation. The
drop in carbohydrates at the 8 h time-point is not as
pronounced as the drop in the mesophyll stromule
frequency. In a model where stromule frequencies correlate
with soluble sugar levels in a cell or tissue, this could be
explained by the continued rise in epidermal stromule
frequency. It would suggest that carbohydrates are
accumulating in the epidermis even while their levels drop
in the mesophyll. B) The pgm1 mutant shows a continuous
rise in epidermal stromule frequency and carbohydrate
levels throughout the day, but a plateau in mesophyll
stromule levels. This could suggest that sugar accumulation
reached a maximal level in the mesophyll cells, and the
epidermis acted as a sink for excess carbohydrates. C) The
trend of carbohydrates levels and stromule frequencies in
the sex1 mutant mimic the control.
Epidermal stromule frequencies were similarly
comparable between hps1 and control plants when
plants were grown on 0% sucrose media (Control:
1.5 ± 0.3%; hps1: 1.6 ± 1.0%). On the sucrose-
0
0.5
1
1.5
2
2.5
3
0.00
0.10
0.20
0.30
0.40
0.50
0.60
0.70
Tot
al S
olub
le C
arbo
hydr
ates
(µ
g gl
ucos
e eq
uiva
lent
s/m
g F
W)
Epidermal
Carbohydrates
0.00
0.02
0.04
0.06
0.08
0 2 4 8
Str
omul
e F
requ
ency
Hours of Light
Mesophyll
=
0
2
4
6
8
0.00
0.10
0.20
0.30
0.40
0.50
0.60
0.70
0.80
0.90
Tot
al S
olub
le C
arbo
hydr
ates
(µg
gluc
ose
equi
vale
nts/
mg
FW
)
Epidermal
Carbohydrates
0.00
0.05
0.10
0 2 4 8
Str
omul
e F
requ
ency
Hours of Light
Mesophyll
=
0
0.5
1
1.5
2
2.5
3
3.5
4
0.00
0.05
0.10
0.15
0.20
0.25
0.30
0.35
0.40
0.45
0.50
Tot
al S
olub
le C
arbo
hydr
ates
(µg
gluc
ose
equi
vale
nts/
mg
FW
)
Hours of Light
Epidermal
Carbohydrates
0.00
0.04
0.08
0.12
0 2 4 8
Str
omul
e F
requ
ency
Mesophyll
=
A
B
C
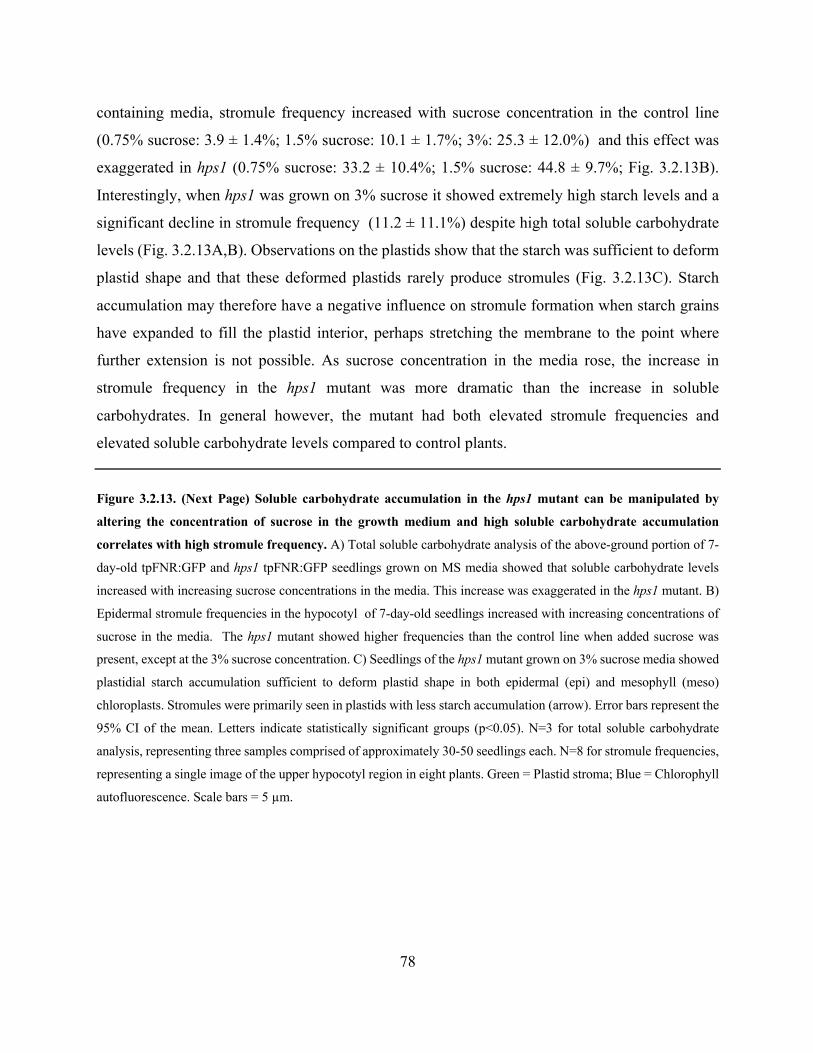
78
containing media, stromule frequency increased with sucrose concentration in the control line
(0.75% sucrose: 3.9 ± 1.4%; 1.5% sucrose: 10.1 ± 1.7%; 3%: 25.3 ± 12.0%) and this effect was
exaggerated in hps1 (0.75% sucrose: 33.2 ± 10.4%; 1.5% sucrose: 44.8 ± 9.7%; Fig. 3.2.13B).
Interestingly, when hps1 was grown on 3% sucrose it showed extremely high starch levels and a
significant decline in stromule frequency (11.2 ± 11.1%) despite high total soluble carbohydrate
levels (Fig. 3.2.13A,B). Observations on the plastids show that the starch was sufficient to deform
plastid shape and that these deformed plastids rarely produce stromules (Fig. 3.2.13C). Starch
accumulation may therefore have a negative influence on stromule formation when starch grains
have expanded to fill the plastid interior, perhaps stretching the membrane to the point where
further extension is not possible. As sucrose concentration in the media rose, the increase in
stromule frequency in the hps1 mutant was more dramatic than the increase in soluble
carbohydrates. In general however, the mutant had both elevated stromule frequencies and
elevated soluble carbohydrate levels compared to control plants.
Figure 3.2.13. (Next Page) Soluble carbohydrate accumulation in the hps1 mutant can be manipulated by
altering the concentration of sucrose in the growth medium and high soluble carbohydrate accumulation
correlates with high stromule frequency. A) Total soluble carbohydrate analysis of the above-ground portion of 7-
day-old tpFNR:GFP and hps1 tpFNR:GFP seedlings grown on MS media showed that soluble carbohydrate levels
increased with increasing sucrose concentrations in the media. This increase was exaggerated in the hps1 mutant. B)
Epidermal stromule frequencies in the hypocotyl of 7-day-old seedlings increased with increasing concentrations of
sucrose in the media. The hps1 mutant showed higher frequencies than the control line when added sucrose was
present, except at the 3% sucrose concentration. C) Seedlings of the hps1 mutant grown on 3% sucrose media showed
plastidial starch accumulation sufficient to deform plastid shape in both epidermal (epi) and mesophyll (meso)
chloroplasts. Stromules were primarily seen in plastids with less starch accumulation (arrow). Error bars represent the
95% CI of the mean. Letters indicate statistically significant groups (p<0.05). N=3 for total soluble carbohydrate
analysis, representing three samples comprised of approximately 30-50 seedlings each. N=8 for stromule frequencies,
representing a single image of the upper hypocotyl region in eight plants. Green = Plastid stroma; Blue = Chlorophyll
autofluorescence. Scale bars = 5 µm.
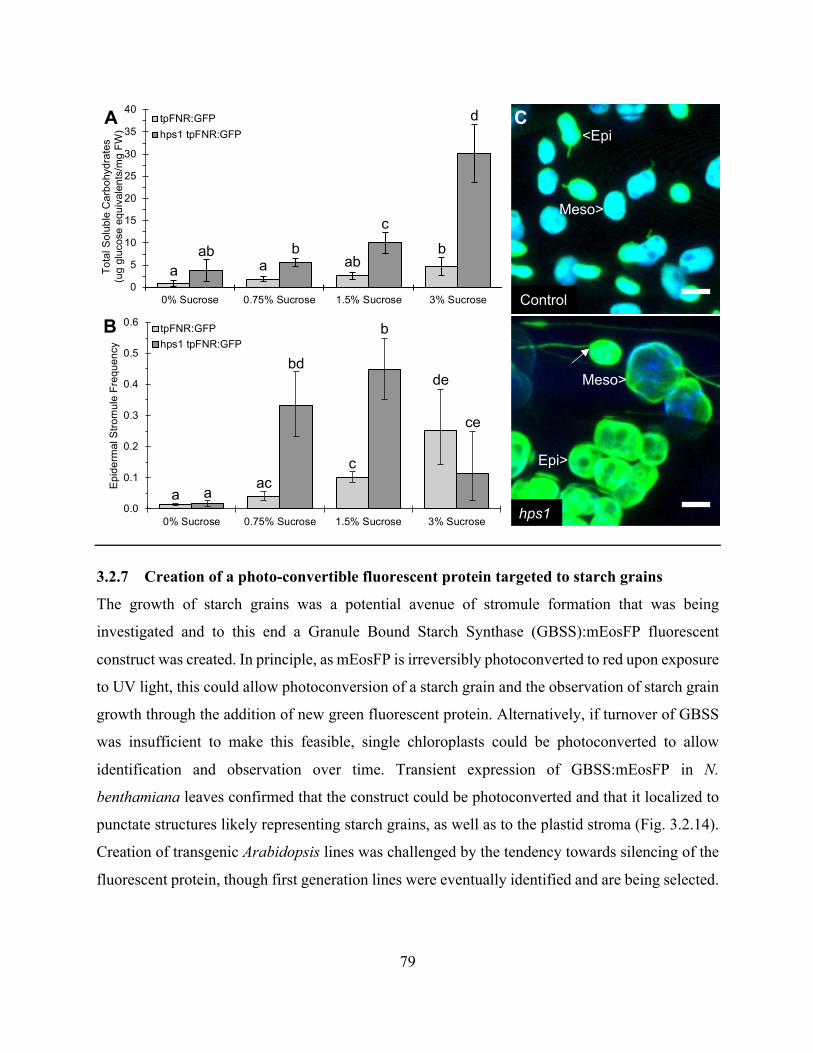
79
3.2.7 Creation of a photo-convertible fluorescent protein targeted to starch grains
The growth of starch grains was a potential avenue of stromule formation that was being
investigated and to this end a Granule Bound Starch Synthase (GBSS):mEosFP fluorescent
construct was created. In principle, as mEosFP is irreversibly photoconverted to red upon exposure
to UV light, this could allow photoconversion of a starch grain and the observation of starch grain
growth through the addition of new green fluorescent protein. Alternatively, if turnover of GBSS
was insufficient to make this feasible, single chloroplasts could be photoconverted to allow
identification and observation over time. Transient expression of GBSS:mEosFP in N.
benthamiana leaves confirmed that the construct could be photoconverted and that it localized to
punctate structures likely representing starch grains, as well as to the plastid stroma (Fig. 3.2.14).
Creation of transgenic Arabidopsis lines was challenged by the tendency towards silencing of the
fluorescent protein, though first generation lines were eventually identified and are being selected.
a a abbab b
c
d
0
5
10
15
20
25
30
35
40
0% Sucrose 0.75% Sucrose 1.5% Sucrose 3% Sucrose
Tota
l Sol
uble
Car
bohy
drat
es
(ug
gluc
ose
equi
vale
nts/
mg
FW)
tpFNR:GFPhps1 tpFNR:GFP
aac
c
de
a
bd
b
ce
0.0
0.1
0.2
0.3
0.4
0.5
0.6
0% Sucrose 0.75% Sucrose 1.5% Sucrose 3% Sucrose
Epid
erm
al S
trom
ule
Freq
uenc
y
tpFNR:GFPhps1 tpFNR:GFP
A
B
C
Control
hps1
Epi>
Meso>
Meso>
<Epi
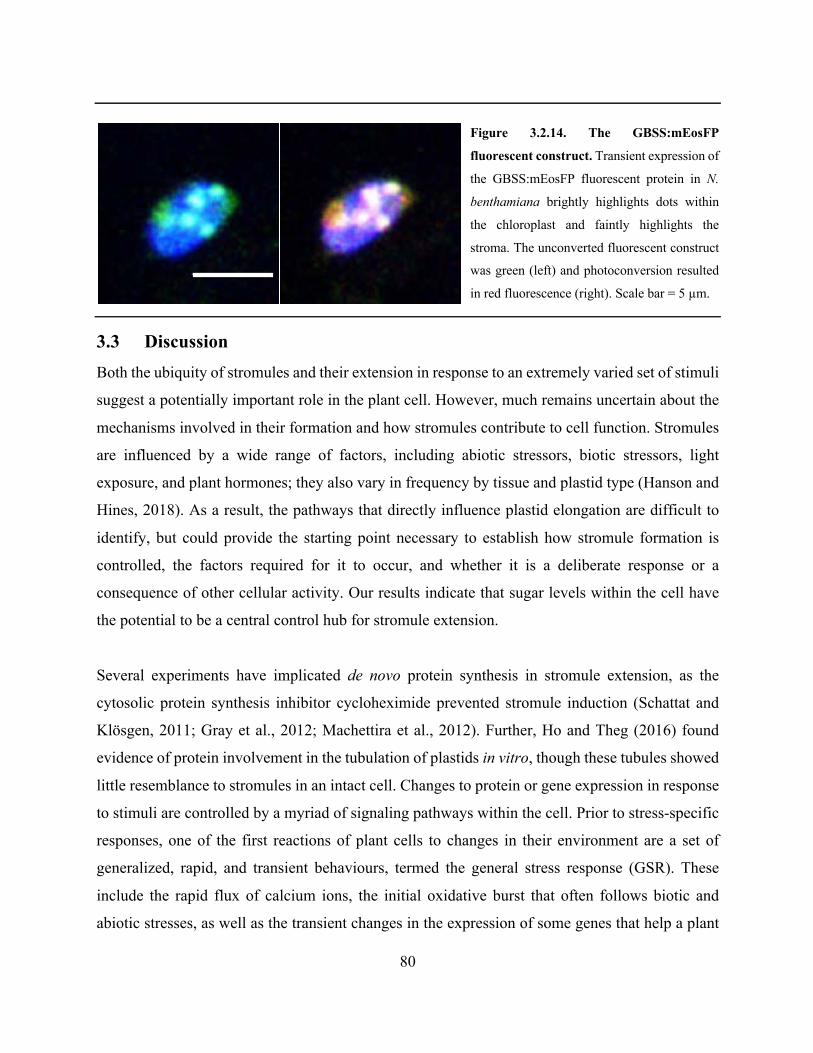
80
Figure 3.2.14. The GBSS:mEosFP
fluorescent construct. Transient expression of
the GBSS:mEosFP fluorescent protein in N.
benthamiana brightly highlights dots within
the chloroplast and faintly highlights the
stroma. The unconverted fluorescent construct
was green (left) and photoconversion resulted
in red fluorescence (right). Scale bar = 5 µm.
3.3 Discussion Both the ubiquity of stromules and their extension in response to an extremely varied set of stimuli
suggest a potentially important role in the plant cell. However, much remains uncertain about the
mechanisms involved in their formation and how stromules contribute to cell function. Stromules
are influenced by a wide range of factors, including abiotic stressors, biotic stressors, light
exposure, and plant hormones; they also vary in frequency by tissue and plastid type (Hanson and
Hines, 2018). As a result, the pathways that directly influence plastid elongation are difficult to
identify, but could provide the starting point necessary to establish how stromule formation is
controlled, the factors required for it to occur, and whether it is a deliberate response or a
consequence of other cellular activity. Our results indicate that sugar levels within the cell have
the potential to be a central control hub for stromule extension.
Several experiments have implicated de novo protein synthesis in stromule extension, as the
cytosolic protein synthesis inhibitor cycloheximide prevented stromule induction (Schattat and
Klösgen, 2011; Gray et al., 2012; Machettira et al., 2012). Further, Ho and Theg (2016) found
evidence of protein involvement in the tubulation of plastids in vitro, though these tubules showed
little resemblance to stromules in an intact cell. Changes to protein or gene expression in response
to stimuli are controlled by a myriad of signaling pathways within the cell. Prior to stress-specific
responses, one of the first reactions of plant cells to changes in their environment are a set of
generalized, rapid, and transient behaviours, termed the general stress response (GSR). These
include the rapid flux of calcium ions, the initial oxidative burst that often follows biotic and
abiotic stresses, as well as the transient changes in the expression of some genes that help a plant
81
recover from or prevent cellular damage (Kültz, 2005; Walley et al., 2007; Walley and Dehesh,
2010; Bjornson et al., 2016). The increased expression of GSR genes can be detected in as little as
five minutes, and changes to protein levels within half an hour. The response is temporary and
returns to near basal levels within about six hours (Walley et al., 2007; Bjornson et al., 2014). The
broad range of biotic and abiotic stresses that promote stromules and the rapidity of the responses
sometimes seen raises the possibility that stromules are a component of the GSR. This would be
in keeping with their proposed role in improving the efficiency of exchange between the plastid
and the rest of the cell (Hanson and Hines, 2018), as changes to metabolism often accompany
stress conditions. Exogenous sucrose is the most easily replicated stromule-inducing condition,
and can cause stress to the plant by negatively influencing photosynthesis (Eckstein et al., 2012).
We found that plastid elongation in response to exogenous sucrose exposure occurred across each
plastid population and tissue tested, including the epidermal chloroplasts and mesophyll
chloroplasts of both the leaves and the hypocotyl, and the etioplasts in dark grown seedlings. A
stromule response can be detected within an hour of treatment and is sustained for at least 5 hours
(Barton et al., 2017; Chapter 2.2.2), placing it within the timeframe expected for a GSR. However,
growth with prolonged exposure to sucrose revealed that the stromule response was sustained over
the course of days, as long as total soluble carbohydrate levels remained elevated. Despite the
generalized nature of plastid elongation in response to most stresses reported to date, the sustained
response makes it unlikely that stromules are part of the transient GSR.
There are many potential fates of sucrose within the cell, as it is important as both a metabolite
and a signaling compound. In order to more clearly establish how sucrose might be influencing
plastid shape, we determined whether the response depended on treatment concentration,
confirmed the specificity of the sucrose response, and used sugar analogs to investigate the
potential contribution of sugar signaling. Our chosen concentration for testing was based on
previous experiments, which found that stromule frequency does not continue to rise at exogenous
sucrose concentrations above 40 mM (Schattat and Klösgen, 2011). This was consistent with our
observations that sucrose concentrations up to 160 mM had no greater effect on stromules than the
40 mM treatment. The cytosolic concentration of sucrose varies considerably depending on species
and time of day, with reported estimates ranging between 10 and 100 mM (Gerhardt et al., 1987;
Winter et al., 1993; Winter et al., 1994; Büssis and Heineke, 1998; Nadwodnik and Lohaus, 2008).
82
Several experiments have shown that exogenously applied sucrose is actively taken up by the plant
and a 40 mM concentration is within the linear region of influx rates (Fondy and Geiger, 1977;
Giaquinta, 1977; Lichtner and Spanswick, 1981; Maynard and Lucas, 1982). Therefore, the
concentrations used in our study should be biologically relevant and the sugar should be readily
taken up into the tissue. The experiments previously done on the uptake of exogenous sucrose
suggest that it continues to rise in a linear fashion at concentrations well above 40 mM (Fondy and
Geiger, 1977; Giaquinta, 1977; Lichtner and Spanswick, 1981; Maynard and Lucas, 1982). This
favours the saturation of either a signaling mechanism or a metabolic pathway as an explanation
for the plateau in stromule induction at higher concentrations sucrose. However, the possibility
that there is a limit to sucrose uptake cannot be ruled out by our experiments.
Schattat and Klösgen (2011) found that in addition to sucrose, glucose was capable of stromule
induction, while fructose was not. This suggests some degree of specificity to the response, but no
other sugars were tested in the study. After treating with a broader panel of sugars, we found that
two disaccharide sugars, sucrose and maltose, and the monosaccharide glucose were capable of
inducing stromule extension, while the other sugars and sugar-alcohols tested had little effect. The
glucose moiety is the first evident common feature between the three sugars capable of eliciting a
stromule response; lactose, although it contains a glucose moiety, elicited no response, but it is not
typically metabolized by the plant (Loreti et al., 2000). Though the commonality of glucose among
these sugars may suggest that it is the compound most directly linked to stromule induction,
glucose is less effective at inducing stromules than sucrose among both epidermal and mesophyll
chloroplast populations, and maltose showed a similar reduction in efficacy. Other studies have
found parallel phenomenon, where sucrose induced the expression of a gene more strongly than
glucose or maltose. They attribute this to the activation of independent sucrose and glucose
signaling pathways (Koornneef and Smeekens, 2005; Karthikeyan et al., 2007), but a specificity
for sucrose could also account for this distinction, as it would require that the glucose or maltose
be converted before it could influence stromule formation. Studies using radioactively labelled
glucose have shown that a substantial amount of the label was detected in sucrose molecules within
an hour of exposure, suggesting rapid conversion of exogenously applied glucose to sucrose
(Giaquinta, 1977; Dieuaide-Noubhani et al., 1995). Stromules can therefore be reliably induced by
83
exogenously applied glucose-containing metabolically active sugars, with sucrose producing the
strongest response.
The effect of changes to endogenous sugar levels on stromule extension has not been previously
investigated. Using several methods of altering soluble sugar accumulation, we noted a
synchronization between stromule frequency and endogenous carbohydrate levels. It is understood
that plants adjust their photosynthetic output and carbon utilization, as well as their rate of starch
synthesis and breakdown, according to photoperiod in order to ensure a steady carbon supply
throughout the night (Sulpice et al., 2014). Here we found that whole leaf soluble carbohydrate
levels were consistent throughout the first 8 hours of the daylight period in long day grown plants,
and similarly, stromule frequencies in the epidermis and mesophyll were steady throughout this
period. In short day conditions, soluble carbohydrate levels and stromule frequencies were lower
overall than in long days. A different accumulation pattern was noted in short days, with the trends
being more pronounced in the older greenhouse grown plants than in the younger plants used for
comparison to long day growth. Soluble carbohydrate levels rose during the first four hours, which
was mirrored by epidermal and mesophyll stromule frequencies, but at the end of the 8 hour day,
the stromule pattern in the epidermal and mesophyll tissues diverged. The mesophyll makes up
the bulk of the tissue used for carbohydrate analysis, and both mesophyll stromule and soluble
carbohydrate levels dropped at the end of the day, though the drop in stromule frequency was much
more pronounced than the drop in carbohydrates. Interestingly, Sulpice et al. (2014) report that in
short day grown plants, glucose levels remained high at the end of the day, but there was a
significant drop in sucrose levels at this time. This difference in accumulated sugars could explain
why a pronounced drop in mesophyll stromules was accompanied by only a small change in
soluble carbohydrates and provide support for the idea that stromule frequency is associated
specifically with sucrose levels in the plant. However, future work needs to be done to confirm
this, using a carbohydrate analysis technique that allows the distinction between different sugar
types. Though mesophyll stromule frequencies dropped at the end of a short day, epidermal
stromule frequencies continued to rise. A similar difference between epidermal and mesophyll
stromule responses was seen in response to exogenous sucrose in the light, both in our study and
in previous experiments (Barton et al., 2017). It was speculated that this may reflect a differential
accumulation of sugars between the tissues, as the mesophyll must maintain a lower level of
84
soluble sugars to avoid feedback inhibition of photosynthesis, while the epidermis is generally
considered heterotrophic and could act as a sink for excess sugar from the mesophyll (Barton et
al., 2017). We were not able to confirm this theory, as attempts to separate sufficient quantities of
epidermal and mesophyll tissues to allow for individual measurement were unsuccessful, but it
remains an avenue of future research.
The link between endogenous sugar and stromules was further highlighted in mutants with
elevated sugar levels. Disruption in the synthesis of starch precursor sugars in adg1-1 and pgm1
gives them elevated soluble carbohydrate levels during the day but not at night (Caspar et al., 1985;
Lin et al., 1988). Our measurements confirmed this high soluble carbohydrate phenotype in pgm1
under our growth conditions, with the divide between control and mutant sugar levels growing
throughout the day. Accordingly, mesophyll stromule levels in pgm1 were comparable to the
control at the beginning of the day and became elevated within the first couple hours. After that
point however, mesophyll stromule frequency plateaued despite the continued rise in sugars. It is
possible that the plateau in mesophyll stromule frequency, but continued rise of soluble
carbohydrates, is another indicator of a primary role of sucrose in stromule extension. Several
studies report that in both adg1 and pgm1 a larger portion of the soluble sugar accumulated is in
the form of glucose, while sucrose levels remain more similar to control plants (Blasing, 2005;
Messerli et al., 2007; Hofmann et al., 2011; Schmitz et al., 2012; Izumi et al., 2013), mirroring
what we saw for stromule frequencies in our experiments.
The sex1 mutant may be of particular interest for future studies dissecting the role of individual
sugars, as we found that it has soluble carbohydrate levels below that of the pgm1 mutant, but its
mesophyll stromule frequencies were similar or slightly higher. The proportion of sucrose relative
to glucose was found to be higher in sex1 than pgm1 in two studies (Messerli et al., 2007; Hofmann
et al., 2011) and this might partially explain the comparatively elevated stromule frequencies under
a sucrose-based stromule extension model. The accumulation of starch in the mesophyll could also
contribute to an increase in stromule frequency, as displacement of the stroma might exert an
outward force on the membrane; however, any effect is likely minimal since pgm1 produces no
starch but has comparable mesophyll stromule frequencies.
85
The hps1 mutant overexpresses the SUC2 sucrose symporter and consequently accumulates high
levels of sucrose throughout its tissue (Lei et al., 2011). We found that the soluble carbohydrate
levels in the mutant could be manipulated by the sucrose content in the growth media, and that the
corresponding increase in stromule frequencies was extremely pronounced. Though the relative
levels of different sugars could not be detected using our methods, the hps1 mutant was reported
by Lei et al. (2011) to have glucose levels below that of control plants but high amounts of sucrose,
and Dasgupta et al. (2014) similarly found that SUC2 overexpressing plants had unaltered glucose
but elevated sucrose levels. The overaccumulation specifically of sucrose reported to occur in
hps1, combined with the pronounced stromule response, provides further evidence of a sucrose-
specific mechanism for inducing stromules. Interestingly, at the highest concentration of sucrose
in the media and the highest levels of soluble carbohydrates, stromule frequency dropped
substantially in the hps1 mutant. Under these conditions, plastids in the mutant were filled with
starch to the extent that the grains could be seen to deform the membrane. This likely accounts for
the reduced extension of stromules as, at a sufficiently high membrane tension, tubules can no
longer be drawn-out from a membrane (Leduc et al., 2004). Thus, even when sugar accumulation
favours stromules, the plastid membrane may be physically incapable of further extension. Sucrose
and glucose, should it play any role, have the potential to influence plastid extension in one of
three ways: signaling, metabolism, or direct membrane interactions.
Non-metabolizable sugar analogs are often used to dissect the contribution of sugar signaling to
cellular responses. We used three different glucose analogs to assess the contribution of glucose
signaling to plastid extension. L-glucose, which is not readily taken up into the cell, has been used
to establish whether apoplastic glucose accumulation is sufficient to induce a response (Kunz et
al., 2014), as sensors at the plasma membrane can initiate signaling cascades in response to
elevated extracellular glucose levels (Li and Sheen, 2016). The lack of response to this analog in
our experiments indicates that uptake of glucose into the cell is required for stromule induction.
Of the intracellular glucose-signaling sensors, Hexokinase1 (HXK1) has the strongest link to
stromule induction, as it is involved in the signaling pathways of hormones such as ABA, ethylene,
and cytokinin (Sheen, 2014; Li and Sheen, 2016), each of which have been implicated in increasing
stromule frequency (Gray et al., 2012; Erickson et al., 2014). Mannose and 2-DG are HXK1
substrates whose phosphorylated products are not readily metabolized. They are frequently used
86
to dissect the respective roles of signaling and metabolism in glucose-based responses (Pego et al.,
1999; Loreti et al., 2001; Ciereszko and Kleczkowski, 2002; Tiessen et al., 2003; Rosa et al., 2009;
Hei et al., 2018). 2-DG was not informative as it had negative effects on cell health at micromolar
concentrations. Mannose treatment did not affect stromule frequency and it is therefore unlikely
that hexokinase-dependent glucose signaling is involved in stromule extension. This does not rule
out the potential involvement of the hexokinase-independent glucose signaling sensors. The
glucose-activated TOR kinase and glucose-inactivated KIN10/11 sensors are thought to detect
glycolytic metabolites and energy (Sheen, 2014). Mutation or RNA silencing is currently required
to assess the role of these sensors and might be an avenue for future research, but the lack of an
HXK-based response, despite its involvement in hormone signaling pathways reported to induce
stromules, combined with the exogenous and endogenous changes to stromule frequency that seem
more closely tied to sucrose than glucose, seem to point away from glucose as the signal for
stromule extension.
The current understanding of the mechanism of sucrose signaling is more complex. It is thought
to be mediated in part by T6P, with elevated or decreased sucrose levels resulting in a
corresponding change in T6P, which in turn is sensed by the cell and incites changes to protein
activation or gene expression (Lunn et al., 2006; Delatte et al., 2011; Martins et al., 2013; Nunes
et al., 2013; Yadav et al., 2014). The exact mechanism by which T6P acts is uncertain. It is
generally thought that it inhibits the activity of SNF-related protein kinase 1 (SnRK1; Zhang et
al., 2009; Delatte et al., 2011; Nunes et al., 2013; Schluepmann et al., 2012), a key player in the
phosphorylation of enzymes and of transcription factors that contribute to carbon metabolism,
nutrient assimilation, and stress (Halford et al., 2003; Ghillebert et al., 2011; Emanuelle et al.,
2016), but there are some inconsistencies in the evidence supporting this connection (Figueroa
and Lunn, 2016). The levels of T6P and sucrose are tightly correlated (Lunn et al., 2006; Yadav et
al., 2014). The amount of T6P within the plant is reported to rise more substantially after treatment
with exogenous sucrose than other sugars, but this rise and the corresponding changes to
expression can be inhibited by cycloheximide (Yadav et al., 2014). The stronger response to
sucrose as compared to glucose and the requirement for de novo protein synthesis closely reflect
observations on stromule formation, making T6P-mediated sugar signaling of particular interest.
Short-term treatment with the T6P precursor trehalose did not increase T6P levels in Arabidopsis
87
leaves in another study (Yadav et al., 2014), so we chose to attempt treatment with T6P itself. It is
normally present within the cell in extremely low concentrations (Lunn et al., 2006) and is rarely
used as a direct treatment, but a previous study did find that feeding 100 µM T6P to isolated
chloroplasts influenced redox-activation of AGPase within 15 min (Kolbe et al., 2005). Using the
same concentration, but a 3 h treatment time, we did not observe any change to stromule frequency
in response to T6P. Though this could suggest that T6P-based sucrose signaling was not involved
in stromule extension, we were not able to assess whether T6P was successfully taken up into the
tissue nor could any literature be found on T6P uptake into, or transport between, cells. Our
experiments therefore do not rule out the possibility of T6P involvement in stromule extension.
Yadav et al. (2014) found that overexpression of trehalose-6-phosphate synthase resulted in
elevated T6P, but not sucrose or glucose. Follow-up experiments to assess stromule frequency in
a TPS overexpressing plant line would help provide confirmation on whether sucrose acts through
T6P-based signaling to induce stromules.
It is thought that there are also T6P independent sucrose signaling pathways mediated by sucrose
symporters or sucrose synthases (Li and Sheen, 2016; Sakr et al., 2018). Two sucrose analogs,
turanose and palatinose, are metabolically inactive and do not influence T6P levels (Yadav et al.,
2014); though many sucrose-related genes are unaffected by one or both of these analogs (Sinha
et al., 2002; Koornneef and Smeekens, 2005; Gonzali et al., 2006; Karthikeyan et al., 2007), they
can induce the expression of some genes for which metabolism is not required. Turanose is a
substrate for more than one plasma membrane-localized sucrose transporter and can enter the cell
(Chandran et al., 2003; Kühn and Grof, 2010), while palatinose is not readily taken up into the
cell. They can both, however, influence protein activation and the expression of some genes
(Fernie et al., 2001; Atanassova et al., 2003; Tiessen et al., 2003; Koornneef and Smeekens, 2005;
Kunz et al., 2014), suggesting the potential presence of both apoplastic and intracellular T6P-
independent sensing mechanisms. In our experiments, neither turanose nor palatinose had an effect
on plastid behaviour, indicating that the effect of sucrose on stromules requires sucrose
metabolism. We were therefore unable to find any evidence for a role of sugar signaling in
stromule extension, but T6P-mediated signaling remains a point of interest due to the parallel
responses to sucrose and cycloheximide between T6P levels and stromule extension.
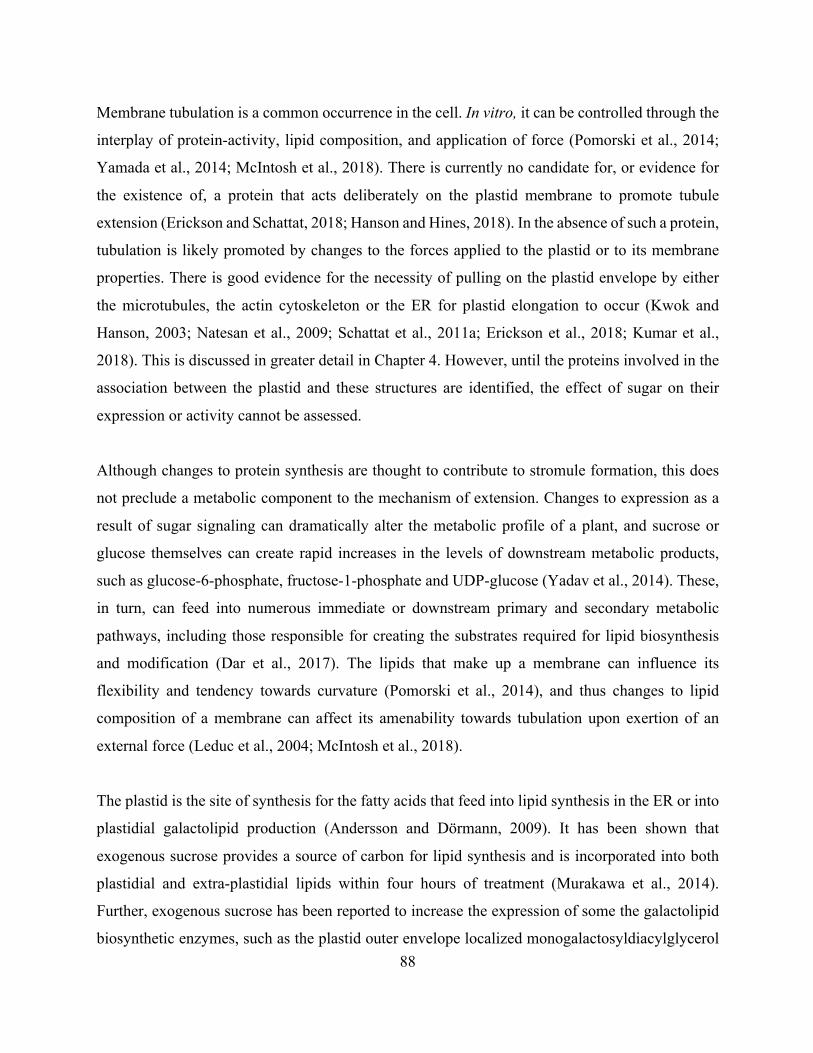
88
Membrane tubulation is a common occurrence in the cell. In vitro, it can be controlled through the
interplay of protein-activity, lipid composition, and application of force (Pomorski et al., 2014;
Yamada et al., 2014; McIntosh et al., 2018). There is currently no candidate for, or evidence for
the existence of, a protein that acts deliberately on the plastid membrane to promote tubule
extension (Erickson and Schattat, 2018; Hanson and Hines, 2018). In the absence of such a protein,
tubulation is likely promoted by changes to the forces applied to the plastid or to its membrane
properties. There is good evidence for the necessity of pulling on the plastid envelope by either
the microtubules, the actin cytoskeleton or the ER for plastid elongation to occur (Kwok and
Hanson, 2003; Natesan et al., 2009; Schattat et al., 2011a; Erickson et al., 2018; Kumar et al.,
2018). This is discussed in greater detail in Chapter 4. However, until the proteins involved in the
association between the plastid and these structures are identified, the effect of sugar on their
expression or activity cannot be assessed.
Although changes to protein synthesis are thought to contribute to stromule formation, this does
not preclude a metabolic component to the mechanism of extension. Changes to expression as a
result of sugar signaling can dramatically alter the metabolic profile of a plant, and sucrose or
glucose themselves can create rapid increases in the levels of downstream metabolic products,
such as glucose-6-phosphate, fructose-1-phosphate and UDP-glucose (Yadav et al., 2014). These,
in turn, can feed into numerous immediate or downstream primary and secondary metabolic
pathways, including those responsible for creating the substrates required for lipid biosynthesis
and modification (Dar et al., 2017). The lipids that make up a membrane can influence its
flexibility and tendency towards curvature (Pomorski et al., 2014), and thus changes to lipid
composition of a membrane can affect its amenability towards tubulation upon exertion of an
external force (Leduc et al., 2004; McIntosh et al., 2018).
The plastid is the site of synthesis for the fatty acids that feed into lipid synthesis in the ER or into
plastidial galactolipid production (Andersson and Dörmann, 2009). It has been shown that
exogenous sucrose provides a source of carbon for lipid synthesis and is incorporated into both
plastidial and extra-plastidial lipids within four hours of treatment (Murakawa et al., 2014).
Further, exogenous sucrose has been reported to increase the expression of some the galactolipid
biosynthetic enzymes, such as the plastid outer envelope localized monogalactosyldiacylglycerol

89
(MGDG) synthases MDG2 and MGD3 (Murakawa et al., 2014). Localized accumulation of
MGDG is thought to contribute to curvature in the thylakoid membrane (Rast et al., 2015). It is
possible that increased localized accumulation of this lipid at its site of synthesis in the plastid
outer envelope, as a result of the influence of sucrose on both gene expression and substrate
availability, could promote regions of curvature at the outer envelope as well. Based on in vitro
experiments, curved regions of membranes have the potential to assist in the recruitment of
proteins (Vanni et al., 2014) or reduce membrane tension (Rangamani et al., 2014). Hypothetically,
regions with altered lipid composition could provide targets for any proteins that assist in stromule
formation, which have been proposed to exist (Ho and Theg, 2016) but whose actual contribution
and identity are currently uncertain. Alternatively, they could facilitate the pulling out of a
stromule by an external structure, a process which is thought to contribute to stromule formation
(Hanson and Sattarzadeh, 2011), as reduced membrane tension increases the number of tubules
formed by pulling on a membrane in vitro (Koster et al., 2003; Leduc et al., 2004; Shi and
Baumgart, 2015; McIntosh et al., 2018). Localized changes to lipid composition, as a result of
sucrose-induced changes to both metabolism and gene expression, could therefore provide either
targeting for, or changes to regional amenability to, stromule extension. The desaturation of fatty
acid tails can also influence membrane properties and there are diurnal rises in levels of unsaturated
and polyunsaturated fatty acids in Arabidopsis (Ekman et al., 2007; Dar et al., 2017). These rises
appear to begin shortly after light exposure and levels of unsaturated fatty acids plateau between
four and eight hours into the light period (Ekman et al., 2007), which correlates with the rise in
stromule formation that we see accompanying the first four hours of light exposure. Given the
above-described effects on membrane tension on the amenability of a membrane to tubulation, it
would be interesting to investigate if an increase in stromule frequencies correlates with an increase
in unsaturated lipids under other conditions. The sugars that induce stromules could work in a two-
pronged approach, both increasing the expression of genes involved in relevant metabolic
pathways and feeding substrates into the same pathways, with the end result of influencing the
properties of the plastid membrane to promote stromule formation.
Sugar signaling and metabolism may both contribute to stromule extension, but the direct effect
of soluble sugars on the membrane should also be taken into consideration. Sugars have been
shown in vitro to influence membrane properties through direct interactions with the membrane
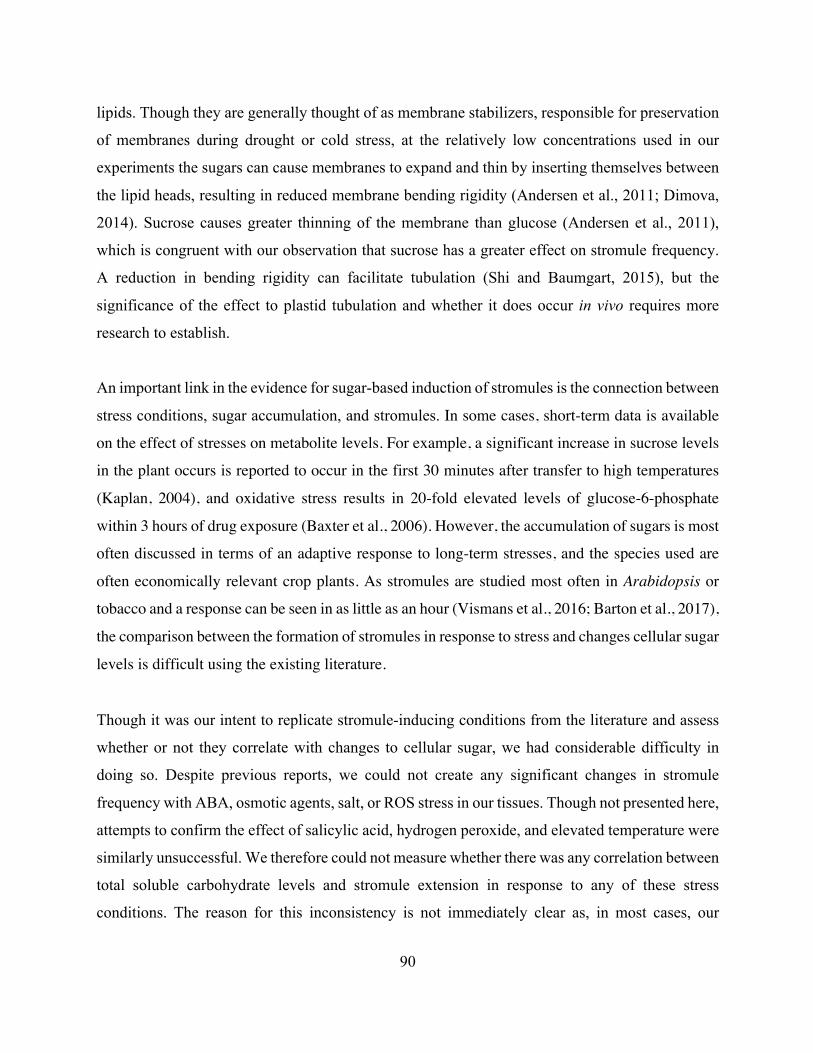
90
lipids. Though they are generally thought of as membrane stabilizers, responsible for preservation
of membranes during drought or cold stress, at the relatively low concentrations used in our
experiments the sugars can cause membranes to expand and thin by inserting themselves between
the lipid heads, resulting in reduced membrane bending rigidity (Andersen et al., 2011; Dimova,
2014). Sucrose causes greater thinning of the membrane than glucose (Andersen et al., 2011),
which is congruent with our observation that sucrose has a greater effect on stromule frequency.
A reduction in bending rigidity can facilitate tubulation (Shi and Baumgart, 2015), but the
significance of the effect to plastid tubulation and whether it does occur in vivo requires more
research to establish.
An important link in the evidence for sugar-based induction of stromules is the connection between
stress conditions, sugar accumulation, and stromules. In some cases, short-term data is available
on the effect of stresses on metabolite levels. For example, a significant increase in sucrose levels
in the plant occurs is reported to occur in the first 30 minutes after transfer to high temperatures
(Kaplan, 2004), and oxidative stress results in 20-fold elevated levels of glucose-6-phosphate
within 3 hours of drug exposure (Baxter et al., 2006). However, the accumulation of sugars is most
often discussed in terms of an adaptive response to long-term stresses, and the species used are
often economically relevant crop plants. As stromules are studied most often in Arabidopsis or
tobacco and a response can be seen in as little as an hour (Vismans et al., 2016; Barton et al., 2017),
the comparison between the formation of stromules in response to stress and changes cellular sugar
levels is difficult using the existing literature.
Though it was our intent to replicate stromule-inducing conditions from the literature and assess
whether or not they correlate with changes to cellular sugar, we had considerable difficulty in
doing so. Despite previous reports, we could not create any significant changes in stromule
frequency with ABA, osmotic agents, salt, or ROS stress in our tissues. Though not presented here,
attempts to confirm the effect of salicylic acid, hydrogen peroxide, and elevated temperature were
similarly unsuccessful. We therefore could not measure whether there was any correlation between
total soluble carbohydrate levels and stromule extension in response to any of these stress
conditions. The reason for this inconsistency is not immediately clear as, in most cases, our
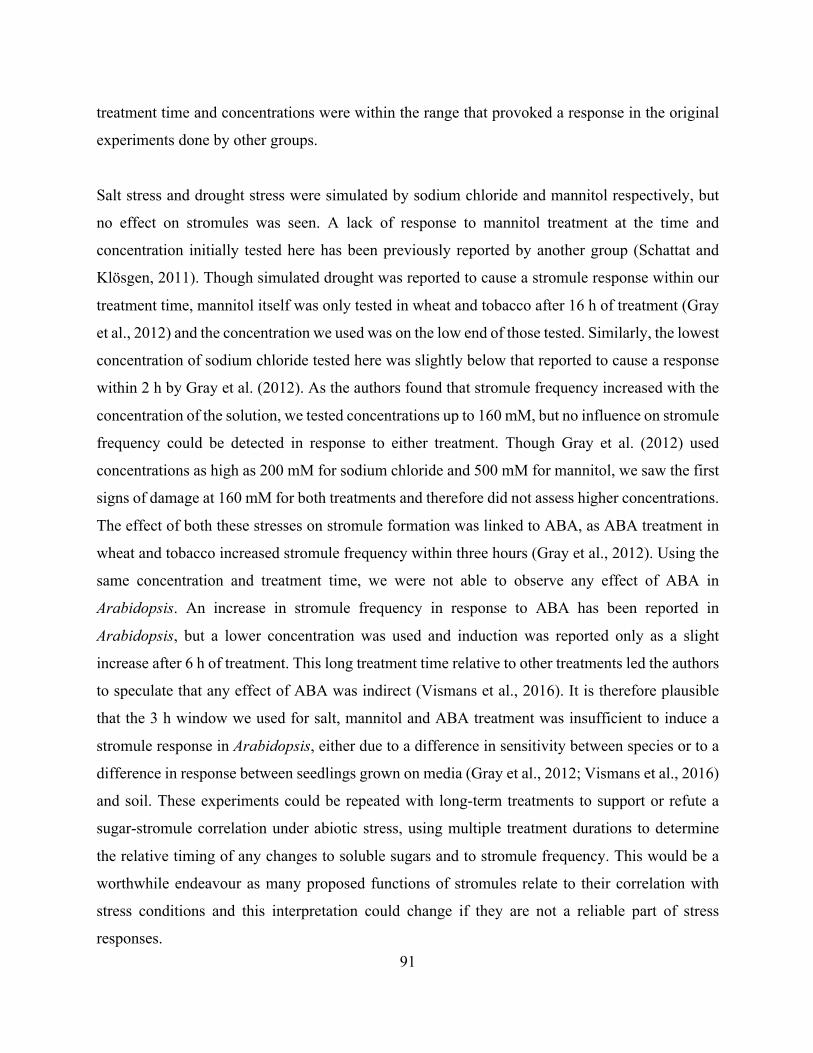
91
treatment time and concentrations were within the range that provoked a response in the original
experiments done by other groups.
Salt stress and drought stress were simulated by sodium chloride and mannitol respectively, but
no effect on stromules was seen. A lack of response to mannitol treatment at the time and
concentration initially tested here has been previously reported by another group (Schattat and
Klösgen, 2011). Though simulated drought was reported to cause a stromule response within our
treatment time, mannitol itself was only tested in wheat and tobacco after 16 h of treatment (Gray
et al., 2012) and the concentration we used was on the low end of those tested. Similarly, the lowest
concentration of sodium chloride tested here was slightly below that reported to cause a response
within 2 h by Gray et al. (2012). As the authors found that stromule frequency increased with the
concentration of the solution, we tested concentrations up to 160 mM, but no influence on stromule
frequency could be detected in response to either treatment. Though Gray et al. (2012) used
concentrations as high as 200 mM for sodium chloride and 500 mM for mannitol, we saw the first
signs of damage at 160 mM for both treatments and therefore did not assess higher concentrations.
The effect of both these stresses on stromule formation was linked to ABA, as ABA treatment in
wheat and tobacco increased stromule frequency within three hours (Gray et al., 2012). Using the
same concentration and treatment time, we were not able to observe any effect of ABA in
Arabidopsis. An increase in stromule frequency in response to ABA has been reported in
Arabidopsis, but a lower concentration was used and induction was reported only as a slight
increase after 6 h of treatment. This long treatment time relative to other treatments led the authors
to speculate that any effect of ABA was indirect (Vismans et al., 2016). It is therefore plausible
that the 3 h window we used for salt, mannitol and ABA treatment was insufficient to induce a
stromule response in Arabidopsis, either due to a difference in sensitivity between species or to a
difference in response between seedlings grown on media (Gray et al., 2012; Vismans et al., 2016)
and soil. These experiments could be repeated with long-term treatments to support or refute a
sugar-stromule correlation under abiotic stress, using multiple treatment durations to determine
the relative timing of any changes to soluble sugars and to stromule frequency. This would be a
worthwhile endeavour as many proposed functions of stromules relate to their correlation with
stress conditions and this interpretation could change if they are not a reliable part of stress
responses.
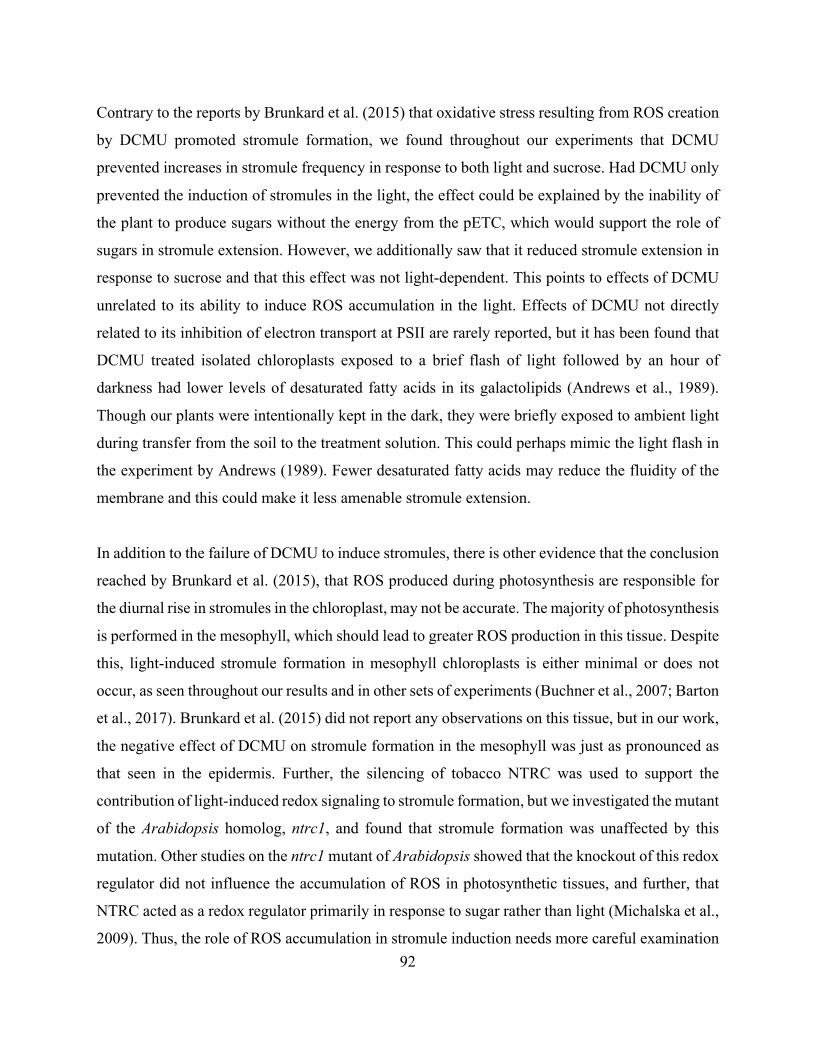
92
Contrary to the reports by Brunkard et al. (2015) that oxidative stress resulting from ROS creation
by DCMU promoted stromule formation, we found throughout our experiments that DCMU
prevented increases in stromule frequency in response to both light and sucrose. Had DCMU only
prevented the induction of stromules in the light, the effect could be explained by the inability of
the plant to produce sugars without the energy from the pETC, which would support the role of
sugars in stromule extension. However, we additionally saw that it reduced stromule extension in
response to sucrose and that this effect was not light-dependent. This points to effects of DCMU
unrelated to its ability to induce ROS accumulation in the light. Effects of DCMU not directly
related to its inhibition of electron transport at PSII are rarely reported, but it has been found that
DCMU treated isolated chloroplasts exposed to a brief flash of light followed by an hour of
darkness had lower levels of desaturated fatty acids in its galactolipids (Andrews et al., 1989).
Though our plants were intentionally kept in the dark, they were briefly exposed to ambient light
during transfer from the soil to the treatment solution. This could perhaps mimic the light flash in
the experiment by Andrews (1989). Fewer desaturated fatty acids may reduce the fluidity of the
membrane and this could make it less amenable stromule extension.
In addition to the failure of DCMU to induce stromules, there is other evidence that the conclusion
reached by Brunkard et al. (2015), that ROS produced during photosynthesis are responsible for
the diurnal rise in stromules in the chloroplast, may not be accurate. The majority of photosynthesis
is performed in the mesophyll, which should lead to greater ROS production in this tissue. Despite
this, light-induced stromule formation in mesophyll chloroplasts is either minimal or does not
occur, as seen throughout our results and in other sets of experiments (Buchner et al., 2007; Barton
et al., 2017). Brunkard et al. (2015) did not report any observations on this tissue, but in our work,
the negative effect of DCMU on stromule formation in the mesophyll was just as pronounced as
that seen in the epidermis. Further, the silencing of tobacco NTRC was used to support the
contribution of light-induced redox signaling to stromule formation, but we investigated the mutant
of the Arabidopsis homolog, ntrc1, and found that stromule formation was unaffected by this
mutation. Other studies on the ntrc1 mutant of Arabidopsis showed that the knockout of this redox
regulator did not influence the accumulation of ROS in photosynthetic tissues, and further, that
NTRC acted as a redox regulator primarily in response to sugar rather than light (Michalska et al.,
2009). Thus, the role of ROS accumulation in stromule induction needs more careful examination
93
before any conclusions should be drawn, and no evidence was found here that favours ROS
accumulation over sugar accumulation an explanation for increases in stromules in response to
light.
Although the effect of several stresses reported to increase stromule frequency could not be
repeated, we were able to confirm the induction of stromules in response to phosphate starvation
(Wozny, 2015; Vismans et al., 2016). Transfer for seven days to media lacking a phosphate source
resulted in a noticeable increase in stromule frequency, but this effect was unique to plants with
an exogenous source of sugars. Plants grown in the absence of sucrose had stromule frequencies
unaffected by phosphate availability. The involvement of sugars in the plant’s response to
phosphate starvation has been well established. Phosphate starvation is known to increase the
accumulation of sugars within the plant, especially when sucrose is provided (Franco-Zorrilla et
al., 2005; Müller et al., 2005; Müller et al., 2007; Chiou and Lin, 2011; Lei et al., 2011). This was
seen in our phosphate-deprived plants, which accumulated high soluble carbohydrate levels when
there was sucrose present in the media. The expression pattern of many genes associated with the
phosphate starvation response can be imitated by sugar treatment regardless of phosphate status
(Müller et al., 2005; Karthikeyan et al., 2007; Müller et al., 2007; Lei et al., 2011; Dasgupta et al.,
2014; Murakawa et al., 2014). This response is believed to be HXK-independent (Franco-Zorrilla
et al., 2005; Müller et al., 2005) and specific to sucrose rather than other sugars. Karthikeyan et al.
(2007) found that the induction of phosphate starvation genes was most pronounced in response
to sucrose, while glucose caused a lower level of induction, and that they were unaffected by non-
metabolizable analogs. Interestingly, this mimics our observations on the effect of these sugars
and analogs on stromules. Further, in plants that overexpress sucrose transporters, including the
hps1 mutant in which we saw high stromule frequencies, sucrose is over-accumulated while
glucose levels are either unaffected (Dasgupta et al., 2014) or reduced (Lei et al., 2011). In both
cases this resulted in a physical phosphate starvation phenotype and corresponding changes to
phosphate starvation induced genes. The accumulation of sucrose is therefore capable of
mimicking many, though not all (Jain et al., 2007; Müller et al., 2007), of the plant’s responses to
phosphate starvation. This all supports the idea that the increase in stromule frequency seen in
response to phosphate starvation is an effect of the increased accumulation of sugars in the tissue,
94
rather than a consequence of the phosphate stress, and that stromule induction in response to sugars
is specific to sucrose.
Much of the metabolism and transport of sugars within the cell involves phosphorylation or
counter-exchange with inorganic phosphate respectively (Griffiths et al., 2016), and therefore a
sudden influx of sugars has the potential to disturb the phosphate levels or distribution within the
cell. Given the link between phosphate deprivation, sucrose, and stromules, we wanted to assess
whether phosphate availability contributes to the stromule response in our short-term sucrose
treatments. In addition to its role as a glucose analog in sugar-signaling studies, mannose is often
used to sequester phosphate, as it is not readily metabolized after it is phosphorylated to mannose-
6-phosphate by HXK. While mannose was not capable of inducing stromules, suggesting the
process is not signaled through HXK, it resulted in a decrease in the production of stromules in
response to sucrose. The apparent reduction in the stromule response to sucrose seems contrary to
positive correlation between stromule formation and the accumulation of sucrose under phosphate
starvation conditions. However, several studies have reported that mannose can substantially
reduce the uptake of exogenous sucrose into plant tissues at concentrations and timeframes similar
to those used in our experiments (Garrard and Humphreys, 1969; Humphreys, 1973; Lucas and
Wilson, 1987; Wilson and Lucas, 1987). Thus, the reduction of stromule frequency may be
unrelated to the sequestration of phosphate and instead influenced by reduced sucrose levels.
Interestingly, mannose treatment resulted in the formation of stromule-like looped structures
reminiscent of the chloroplast pockets observed under salinity stress and in cold-adapted species
(Giełwanowska et al., 2005; Giełwanowska et al., 2015; Yamane et al., 2018). Typical stromule
extension is postulated to involve the actin cytoskeleton (Kwok and Hanson, 2004a; Natesan et
al., 2009), and mannose has been shown to alter actin structure after 12 h of treatment (Banaś et
al., 2010). The effect of mannose in a shorter timeframe was not tested, so an effect on the actin
cytoskeleton in our experimental conditions can only be surmised, but altered cytoskeletal
structure provides a potential explanation for the unique plastid behaviour observed with mannose
treatment. In support of stromule formation being a direct response to sugar rather than being
influenced by phosphate status, the addition of a phosphate source to short-term sucrose treatments
also did not influence stromule frequency. Phosphate availability was therefore not a contributing
factor in the rapid response of a cell to increased sugar levels.
95
The hps1 mutant, identified in a screen for phosphate starvation responsive mutants, has been
reported to be hypersensitive to nitrogen and potassium starvation as well as phosphate starvation,
as a consequence of its over-accumulation of sucrose (Lei and Liu, 2011). We therefore decided
to assess whether these nutrient stresses influenced either the accumulation of soluble
carbohydrates or stromule numbers. In accordance with the phosphate starvation results, the plants
accumulated higher levels of soluble carbohydrates under both potassium and nitrogen deprivation
conditions, and this response was once again dependent on the presence of sucrose in the media.
Stromule frequencies mirrored soluble carbohydrate levels throughout the experiment in both the
controls and the nutrient stressed conditions. This supports the proposal by Lei and Liu (2011) that
sucrose is central to the response of multiple nutrient deficiencies, and our hypothesis that
stromules are a response to the sucrose that accumulates under stress conditions rather than the
stress itself.
The results presented here show a strong correlation between sugar levels in the cell and stromule
frequency. Changes to stromule frequencies track changes to soluble carbohydrate levels across
both exogenous sugar treatments and endogenous factors such as photoperiod, mutations in sugar
processing or transport, and nutrient stresses. This response is independent of all sugar signaling
factors tested, but there is good direct and circumstantial evidence for the primary involvement of
sucrose in the process and the contribution of sucrose signaling through T6P cannot be ruled out.
Though the function and mechanism of formation of stromules remain speculative, the
identification of sucrose as a common factor between multiple conditions that increase stromule
frequency provides a much narrower avenue for future research than previously available.
96
3.4 Methods 3.4.1 Plant material and growth conditions
The plant lines used and their acquisition or creation are described in Appendix 1. Arabidopsis
seeds were sterilized in a 20% bleach solution for 10 min and rinsed three times with sterile water
in preparation for sowing. Seeds were distributed either on sterilized soil (Sunshine Mix LA4) in
tissue culture boxes (Phytotechnology, Culture Vessel, Stericon, 32 oz) or, where specified for an
experiment, on MS media (Murashige and Skoog, 1962). For all experiments except those
concerning nutrient deprivation, MS media with Gamborg Vitamins (Phytotechnology M404) was
prepared using ultrapure water according to manufacturer’s instructions, supplemented with 0%,
0.75%, 1.5% or 3% sucrose (Bio Basic SB0498), and solidified with 1.5 g/L Phytagel (Sigma
P8169). Seeds were stratified for 2 days at 4°C.
Plants used at 7-days-old and 21-days-old were kept on the substrate upon which they were sown
for the duration of growth. Plants were either wrapped in foil to maintain darkness for experiments
on etiolated seedlings, or grown in a long-day light regime (16 h light – 8 h dark) with fluorescent
light levels of 100 µmol m-2 s-1. Ambient temperature was maintained at 21°C. For experiments
on 4-week-old and 6-week-old plants, 7-day-old seedlings were selected for a strong fluorescence
signal and transferred to individual 2-inch square pots containing Sunshine Mix LA4 and grown
in controlled growth chambers. In the chamber, fluorescent lights were set to an intensity of 120
µmol m-2 s-1 at bench height on a short day (8 h light – 16 h dark) or long day (16 h light – 8 h
dark) regime. A night temperature of 19°C and a day temperature of 21°C was maintained.
3.4.2 Confocal microscopy
Plants 21-days-old and under were gently removed from the growth substrate and imaged whole.
Four- and six-week-old plants were too large to fit on a slide and whole leaves were therefore
detached at the base of the petiole and imaged immediately. Plants were mounted either in tap
water or in the treatment solution (e.g. 40 mM sucrose-treated plants were mounted in 40 mM
sucrose) and imaged using a Leica TCS-SP5 confocal microscopy system equipped with a 488 nm
Ar laser and a 543 nm HeNe Laser. GFP fluorescence was acquired between 500-520 nm,
photoconverted red mEosFP fluorescence between 570-620 nm, and chlorophyll autofluorescence
between 660-750 nm. mEosFP was photo-converted by 10 to 15 second exposure to a mercury
97
lamp with the Leica fluorescence filter set D (Excitation 355 to 425 nm). ImageJ (Schneider et al.,
2012) and Microsoft Powerpoint were used for all image and video processing.
3.4.3 Assessment of the effect of imaging on chloroplasts
Plants of the tpFNR:GFP line were grown in a long day light regime for 21 days in tissue culture
boxes and then taken for imaging at the end of the night period. Whole plants were mounted on
slides in tap water and covered gently with a coverslip. Brightfield light was used to focus rapidly
on the mesophyll of a true leaf and then image acquisition was started immediately. An x-y-t
timelapse was taken for 200 continuous frames in each of 5 leaves, each from individual plants.
Each frame took 1.935s to acquire, resulting in 6 min 33 second total imaging time per region. For
assessment of chloroplast response to imaging, the number of mesophyll chloroplasts that
remained in focus for the entire imaging period was counted for each video (n=16 to 18
chloroplasts), and then in each frame the number of chloroplasts that had any visible outward
projection of the stroma was counted. Dividing the number of chloroplasts with projections by the
total number of chloroplasts gave the proportion of chloroplasts in each frame with a membrane
extension. This was then averaged in 20-frame increments and plotted against the imaging time to
visualize any changes in the formation of chloroplast projections over time.
3.4.4 Measuring plastid pleomorphy
In the literature, multiple definitions have been provided as to what constitutes a protrusion or a
stromule formed from a plastid, with stromules typically defined as long, thin tubules and
protrusions as shorter, wider projections. As time-lapse imaging has revealed that in Arabidopsis
protrusions can develop into stromules and vice-versa (Delfosse et al., 2016), we chose to consider
both as snapshots of the general phenomenon of plastid pleomorphy. Further, neither of these terms
could be reliably applied to plastid types with no permanently defined plastid body, such as
etioplasts or leucoplasts. The terms stromule and protrusion were therefore used colloquially rather
than through the application of a specific set of criteria in this study.
Imaging for quantification of plastid pleomorphy was conducted by taking an x-y-z stack through
the epidermis and mesophyll of each region, with a step size of 0.99 µm. No region was imaged
for more than 40 seconds, to minimize the effect of imaging on the plastid. The number and
98
location of the regions imaged varied depending on plant age and tissue and are detailed for each
experiment in the associated figure caption. Each image stack was compressed in the z-direction
using the ‘Standard Deviation Z-projection’ function in ImageJ (Schneider et al., 2012) to create
a single image in which plastid pleomorphy could be assessed.
In order to quantify plastid pleomorphy in chloroplasts, stromule frequencies were used. Using the
Cell Counter plugin in ImageJ [Kurt De Vos (University of Sheffield;
https://imagej.nih.gov/ij/plugins/cell-counter.html, 2001], the number of chloroplasts with any
visible outward projection from the chloroplast body, regardless of length or width, and the number
of chloroplasts without any projections were counted. The number of chloroplasts with projections
was then divided by the total number of chloroplasts in the image. This gave the proportion of
chloroplasts in the region exhibiting extensions, called the stromule frequency. Epidermal and
mesophyll chloroplast populations were assessed independently.
The degree of elongation in etioplasts was assessed using a shape ratio. For each etioplast in a Z-
projected image, ImageJ (Schneider et al., 2012) was used to measure the length, as well as the
width at three evenly spaced positions. Dividing the average width by the length gave a shape ratio
from 0 to 1, with 0 representing an extremely elongated etioplast and 1 representing a round
etioplast. The determination of the shape ratio is shown diagrammatically in Figure 3.2.2B.
Epidermal and mesophyll etioplasts were not easily distinguished by shape or position and were
therefore counted together. The average shape ratio of the etioplasts in an area was calculated and
statistical tests were performed as for chloroplast stromule frequency, but without data
transformation.
3.4.5 Statistical analysis
Stromule frequencies were transformed using the arcsin(Ö) function for statistical analysis to
normalize the data, as outlined by Schattat and Klösgen (2011). Statistical significance between
treatments or conditions was assessed with stromule frequency or shape ratio as the dependent
variable and the relevant condition(s) or plant background as the independent variable(s). Analysis
of data with a single comparison was performed using a two-tailed Welch’s t-test. One-way
ANOVA with a post-hoc Tukey HSD test was used for data with multiple comparisons but a single
99
independent variable. A two-way ANOVA with a post-hoc Tukey HSD test was used for
comparisons with two independent variables. a=0.05 was used for all tests. Averages and 95% CI
(using the t-distribution) were calculated for the transformed data and back-transformed for
representation in graphs. Transformation of data and calculation of averages and confidence
intervals was carried out in Microsoft Excel, and statistical tests for comparison of samples were
done in R (https://www.r-project.org/). The data presented are single representative datasets, but
the experiments were performed two to three times to ensure that the trends were repeatable.
3.4.6 Treatment of plants to assess stromule responses
Plants were taken at the end of night for treatment, unless a period of light is specified for an
experiment. Treatment with solutions was carried out by first briefly immersing the whole plant
or seedling, unless otherwise specified, in the solution. For assessment in the hypocotyl of 7-day-
old seedlings, the seedlings were then floated such that the hypocotyl was submerged but the
cotyledons were floating on the surface. 21-day-old were floated upside-down in the solutions, to
ensure that the leaves to be imaged were submerged. The plants were then left in the solutions in
the dark at room temperature for 3 h, unless specified otherwise for an experiment. All solutions
of sugars, sugar alcohols, sugar analogs and sodium chloride were prepared in deionized water and
made fresh for each experiment (Sucrose – BioBasic SB0498, D-Glucose – Sigma G8270; D-
fructose – Sigma F0127 ; D-mannose – Bio Basic MB0554; Galactose – Fisher G1-100; Maltose
– BDH Limited 29131; Lactose – Sigma 17814; D-mannitol – Phytotechnology M562; Sorbitol –
Fisher BP439; 2-Deoxy-D-glucose – Sigma D8375; L-glucose – Sigma G5500; D-turanose –
Sigma T2754; Palatinose – Sigma P2007; NaCl - Fisher S271), with the exception of T6P
(Carbosynth OT11513), for which a 1 mM stock was prepared in ultrapure water and stored at -
20°C. A 10 mM stock solution of ABA (Sigma A1049) was made in 50% methanol. For the
fluorescent glucose (2-NBDG; Invitrogen Molecular Probes N13195) a 200 mM stock was
prepared in DMSO. A 10 mM DCMU (Diuron – Aldrich D2425) stock was prepared in DMSO.
All stock dilutions were done with deionized water, and the equivalent amount of DMSO/methanol
was added to the deionized water control for each experiment.
100
3.4.7 Measurement of total soluble carbohydrates
The soluble carbohydrate measurement procedure was adapted from two existing protocols
(DuBois et al., 1956; Buysse and Merckx, 1993). Plant tissue was collected in 2 mL screwcap
tubes with a 3.2 mm chrome steel ball inside (BioSpec Pro 11079132C). Tissue fresh weight was
recorded and then the tubes were frozen in liquid nitrogen and stored at -80°C until use.
Approximately 100 mg of tissue was collected for each sample, which typically represented 30 to
50 7-day-old seedlings, 5 to 6 21-day-old plants, 4 to 5 leaves from older control plant tissue, or
around 10 to 15 leaves from short-day grown mutant plants. In the latter two cases, the leaves were
selected from multiple plants. Tissue was collected in triplicate for each treatment or timepoint to
be assessed.
The frozen tissue was loaded into the tube holders for the Retsch MM301 mixer, which were pre-
cooled on ice. The tissue was ground at 30-s for 1 min, tissue was refrozen in liquid nitrogen and
then the process was repeated once. After the second round of grinding, the tissue was immediately
returned to liquid nitrogen. Extraction of carbohydrates was carried out with hot ethanol. Prior to
commencing the extraction, 500 mL of 80% ethanol was prepared, as this was generally sufficient
to complete all subsequent steps, and changes in the concentration could influence the accuracy of
measurements. 500 µL of 80% ethanol was added to each sample, vortexed briefly, and kept at
78°C for 10 min. Samples were vortexed again, and the tissue was pelleted by centrifugation at
12,000 rpm for 5 min. The supernatant was then transferred to fresh, labelled 2 mL screw-cap
tubes. This was repeated twice more, adding the supernatant to the same tube each time, such that
1.5 mL of extract was obtained per sample. The volume for each sample was then brought up to 2
mL with 80% ethanol. For samples with high total soluble carbohydrates, dilution was sometimes
necessary to ensure values within the standard curve. Typically, a five times dilution was
performed, but this was reassessed if the reading obtained in the carbohydrate estimate was not
well-centered on the standard curve.
Total soluble carbohydrates in the ethanol extract were measured using the Phenol-Sulfuric Acid
method (DuBois et al., 1956), as optimized for an 80% ethanol extract by Buysse and Merckx.
(1993). All subsequent steps were performed in a fume hood. 100 mL of 28% (w/w) phenol (Fisher
A92) in ultrapure water was prepared, mixed briefly and left until the solution became clear, with
101
two distinct phases visible. The standard curve was prepared with a range of 10 to 100 µg/mL of
D-glucose, with a new standard curve created for each batch of samples processed. First, a 10
mg/mL D-glucose solution was prepared in 80% ethanol (100 mg D-glucose into 10 mL 80%
ethanol), then this was diluted 10x to create a 1 mg/mL stock (1 mL 10 mg/mL D-glucose into 9
mL of 80% ethanol). A second 10x dilution was carried out to create 50 mL of 0.1 mg/mL D-
glucose solution (5 mL of 1mg/mL D-glucose into 45 mL 80% ethanol), which was used as the
stock to create the standard curve. 10 mL samples were created with concentrations from 10 µg/mL
to 100 µg/mL in 10 µg/mL increments. From this point, the protocol was the same for samples
extracted from tissue and those prepared for the standard curve. For each sample, as well as for an
80% ethanol blank, 500 µL was placed into three test tubes, to allow for three technical replicates.
500 µL of 28% phenol was pipetted directly into the bottom of each tube. The phenol was mixed
vigorously before addition to each tube to maintain an even suspension. In a steady, rapid stream,
2.5 mL of concentrated sulfuric acid (Fisher A300) was added to each tube using a 5 mL pipette,
ensuring that the acid went directly into the bottom of the tube with sufficient force to mix the
solutions. Mixing of the tubes, either individually or by shaking the entire rack by hand, resulted
in high variability between the technical replicates, presumably due to uneven mixing, and was
avoided. Development of the yellow coloration was complete after 15 min, after which 250 µL
from each tube was loaded into a 96-well plate (Corning Costar Assay Plate 9017) and absorbances
were read at 490 nm using a Thermo Scientific Muliskan Go microplate spectrophotometer.
In order to create the standard curve, the absorbance values (three technical replicates per
concentration) were plotted as the dependent variable against the concentration (µg/mL glucose)
and the linear equation of the line of best fit was determined. This equation was used to convert
absorbances from the extracted samples to µg/mL glucose equivalents. For each sample, the three
replicates were then averaged, and the average values multiplied by 2 (for 2 mL volume used in
the initial extraction) and by any subsequent dilution factor to give the total µg of glucose
equivalents extracted. The total µg of glucose equivalents for each sample was then divided by the
fresh tissue weight recorded during tissue harvesting to give the micrograms of glucose-
equivalents per milligram of fresh weight (FW) in the original tissue.
102
3.4.8 Nutrient deprivation experiments
Nutrient deprivation experiments were done in partnership with Michael Wozny. Media lacking
phosphate was prepared by M Wozny using a micronutrient solution (Sigma M0529) and a
solution of Gamborg’s vitamins (Sigma G1019) according to manufacturer’s instructions, as well
as individual solutions of the macronutrients (Final concentrations: 1650 g/L NH4NO3; 332.2 g/L
CaCl2; 180.7 g/L MgSO4; 1900 g/L KNO3). For the phosphate-containing control medium, 170
g/L of KH2PO4 was added. A detailed protocol for the preparation for the phosphate deprivation
media is described in the thesis of M. Wozny (2015). Media for potassium deprivation experiments
was prepared using the MS modified basal salt mixture without nitrogen, potassium or phosphate
(Phytotechnology M407). Media lacking potassium had NaH2PO4•2H2O (195 g/L) and NH4NO3
(2400 g/L) added, and control media additionally had 1495 g/L KCl. Nitrogen deprivation media
were prepared using MS media without nitrogen (Caisson MSP21), and 2400 g/L NH4NO3 was
added to control media. For all three nutrient deprivation experiments, control and nutrient lacking
media were prepared with 0% and with 3% sucrose and were solidified with 1% tissue culture
grade agar (Caisson A038). Seeds were plated on MS media with 3% sucrose and were grown for
5 days before transfer to the media prepared for the nutrient deprivation experiments (Nutrient 3%
sucrose; Nutrient 0% sucrose; No nutrient 3% sucrose; No nutrient 0% sucrose). 7 days after
transfer, tissue was harvested for carbohydrate estimates and seedlings were imaged for stromule
frequencies.
3.4.9 Cloning and transient expression of GBSS1:mEosFP
The GBSS1 (At1G39200) sequence was obtained by PCR (High Fidelity PCR Enzyme Mix,
Thermo Scientific K0191) from cDNA using a forward primer with a Sal1 site introduced (5’-
GGTCGACATGGCAACTGTGACTGCTTCTT-3’) and a reverse primer (5’-
GGTACCCGGCGTCGCTACGTTCTCCTT-3’) with a Kpn1 site introduced and the stop codon
removed. cDNA was prepared from mRNA isolated using the Spectrum Plant Total RNA Kit
(Sigma STRN50) with the RevertAid First Strand cDNA Synthesis Kit (Thermo Scientific K1621;
oligo dT primers). The mEosFP sequence was amplified from the tpFNR:mEosFP construct with
a forward primer than introduced a Knp1 site (5’-GGTACCATGAGTGCGATTAAGCCAGACA-
3’) and a reverse primer with an Xba1 site and a stop codon (5’-
TCTAGATTATCGTCTGGCATTGTCAGGCA-3’). The amplified GBSS and mEosFP coding
103
sequences and were extracted from the agarose gel after separation by electrophoresis using the
EZ-10 Spin Column DNA Gel Extraction Kit (Bio Basic BS353). The following modifications
were made to the manufacturer’s protocol in these and all subsequent extractions of DNA from
agarose gels: the melted gel in binding buffer was run through the column twice rather than
immediately discarding the flow-through; centrifugation time for each wash step was increased
from 1 min to 2 min; after the final wash, the time for the additional centrifugation step was
increased to 3 min; pre-warmed (50°C) sterile ultrapure water was used for elution rather than
elution buffer; DNA was eluted by adding 17 µL of water to the column and heating at 50°C for 2
min prior to centrifugation, then this was repeated once to give approximately 30 µL of eluted
DNA in water. Sequences amplified by PCR were cloned into the pGEM-T Easy Vector System
(Promega A1360).
The mEosFP sequence was digested from the pGEM-T Easy vector at the Kpn1 and XbaI sites
and ligated (T4 DNA ligase; Invitrogen 15224017) into the multiple cloning site (MCS) of the
binary pCAMBIA1300 vector at the same sites. Both GBSS in pGEM-T Easy and the pCAMBIA
vector containing mEosFP were digested with Sal1 and Kpn1 and the GBSS sequence was ligated
into the pCAMBIA vector. The entire GBSS:mEosFP fragment was cut out using the Sal1 and
Xba1 sites and ligated into a PSO022 intermediate vector at the compatible Xho1 (compatible with
Sal1) and Spe1 (compatible with Xba1) sites present in the MCS. This destroyed the sites, but the
intermediate vector had Xba1 and Sac1 sites that bordered the inserted GBSS:mEosFP sequence.
This allowed ligation into a modified pCAMBIA1300 vector between the CaMV35S promoter and
a Nos terminator sequence to create the final construct in a binary vector.
At each step of the cloning, the ligated DNA was transformed into Escherichia coli (E. coli) DH5a
using the heat shock method. Ligations were diluted 5x in sterile ultrapure water and 50 µL of the
diluted ligation was mixed gently with 100 µL of E. coli competent cells and then left on ice for
15 min. The cells were placed at 42°C for 60 s, returned to ice for 5 min, and then 500 µL of
lysogeny broth (LB) media (Bertani, 1951; Bertani, 2004) was added. Cells were shaken gently at
37°C for 45 min to 3h and pelleted by centrifugation at 12,000 rpm for 2 min. All but
approximately 50 µL of the supernatant was removed, the tubes were vortexed to resuspend the
bacteria and the entire volume was plated on antibiotic-containing LB media (5 g/L Yeast extract
104
- Bio Basic G0961; 10 g/L NaCl – Fisher S271; 10 g/L Tryptone – Bio Basic G211 ) solidified
with 1.5% agar (Bio Basic G1253). Colonies that grew after incubation overnight at 37°C on the
antibiotic-containing media (Kanamycin for pCAMBIA1300; Ampicillin for pGEM-T Easy) were
used to inoculate 5 mL overnight liquid cultures in LB with antibiotics. Plasmid DNA was isolated
from the E. coli cultures using the EZ-10 Spin Column DNA Miniprep Kit (Bio Basic BS614).
The same modifications were made to the on-column steps as for the gel extraction kit, except that
elution was done in 40 µL of the provided Elution Buffer. The presence of the ligated fragment
was confirmed with restriction digestion.
The final GBSS:mEosFP was transformed into Agrobacterium tumefaciens GV3101 using
electroporation. 2 µL of plasmid DNA was added to 50 µL of electrocompetent Agrobacterium,
put in an electroporation cuvette (Molecular BioProducts 5510-11) and electroporated using the
BioRad Gene Pulser II Electroporation System (Settings: 200 W, 25 µF, 1.8 kV). 1 mL of YEB
media was added to the cells and they were incubated at 28°C with gentle shaking for 2h before
pelleting by centrifugation at 12,000 rpm for 2 min. All but 50 µL of the supernatant was removed,
the agrobacterium was resuspended and plated on solid YEB media with antibiotics (100 µg/mL
Rifampicin and 25 µg/mL Gentamycin for Agrobacterium strain GV3101, 50 µg/mL Kanamycin
for pCAMBIA), and then incubated for 2 days at 28°C. Plates were then stored at 4°C until use.
YEB media consisted of 5 g/L beef extract (Bio Basic BB0114), 1 g/L yeast extract, 5 g/L peptone
(Bio Basic G213), 5 g/L sucrose and 0.3 g/L MgSO4•7H2O (Fisher M63) in deionized water and
was solidified using agar.
Transient infiltration of GBSS:mEosFP was conducted by resuspending a scoop agrobacterium
from the plates in Agrobacterium infiltration media (AIM). AIM was prepared using a 0.5 M stock
of 2-(N-morpholino)ethanesulfonic acid (MES; pH 5.3; Bio Basic MB0611), a 1 M stock of MgCl2
(Fisher M33) and a 1 M stock of acetosyringone (Aldrich D134406), all prepared in ultrapure
water. To create the AIM solution 500 µL of the MES stock, 500 µL of the MgCL2 stock and 7.5
µL of the acetosyringone stock were added to 50 mL of deionized water. The bacteria were
incubated in the AIM solution for 1 to 2 ho at room temperature, then diluted with AIM to an
OD600 of 0.8. Using a 1 mL syringe (Fisher Norm-Ject 14-817-25), the solution was infiltrated into
105
the underside of well-watered tobacco leaves. Expression was checked on the second day after
infiltration.
Transgenic Arabidopsis plants were initiated using the floral dip method (Clough and Bent, 1998).
Overnight 250 mL cultures of YEB (Antibiotics: Rifampicin, Gentamycin, Kanamycin) were
initiated with Agrobacterium containing the GBSS1:mEosFP construct. When cultures were
cloudy (1 to 2 days), the bacteria were pelleted in 50 mL centrifuge tubes by spinning at 3000 rpm
for 20 min. Bacteria were resuspended in resuspension solution (50 µL/L Silwet, 50 g/L sucrose
in deionized water), and diluted to a total volume of 100 mL in a 100 mL graduated cylinder, or in
a larger volume in a 500 mL beaker if the plants had large inflorescence stalks. The inflorescence
of each plant (12 to 15 plants per construct) had mature siliques cut off and then all flowering
portions were submerged in the resuspended bacteria for 45 sec, with gentle swirling. After
dipping, plants were left on their side overnight to prevent pooling of bacteria on any leaf surfaces,
and then reoriented the next day. Harvested seeds were selected on 25 µg/mL Hygromycin (for the
pCAMBIA1300 vector), and expression of the fluorescent construct was confirmed visually for
each hygromycin resistant seedling.
106
4 Plastid pleomorphy and the endoplasmic reticulum 4.1 Introduction Introduction
In recent decades, live-imaging has revealed that the cell interior is a dynamic environment, with
organelles and other cellular structures exhibiting both movement and changes in form. This is
especially evident in plastids, which can vary in function, structure, and dynamics between plastid
types and tissues (Wise, 2007; Pyke, 2009). The pleomorphic nature of plastids has long been
established (Esau, 1944; Reviewed in Gray et al., 2001), but since the introduction of fluorescent
proteins as a tool for studying the living cell, the physical responses of plastids to stimuli has
become an increasingly prominent area of plastid biology. This began with the description of long,
thin stroma-filled tubules that are bound by both envelope membranes and can extend from plastids
under some conditions (Köhler et al., 1997); in subsequent studies these structures were termed
‘stromules’ (Köhler and Hanson, 2000). Short, wide plastid projections, termed ‘protrusions’, have
also been reported to form from chloroplasts. There is some speculation that they are distinct in
structure and function from stromules (Buchner et al., 2007; Lütz and Engel, 2007; Buchner et al.,
2015); however, observations of single chloroplasts over time suggest that protrusions can extend
into stromules and stromules can form protrusions as they retract (Delfosse et al., 2016). Though
the terms stromule and protrusion are useful from a descriptive point of view, they both appear to
be part of a continuous spectrum of plastid shapes. This spectrum ranges from the relatively
consistent form of the chloroplast, where protuberances of varying lengths and widths can extend
from the ‘mobile jacket’ (Spencer and Wildman, 1962) surrounding the thylakoid grana, to the
complete tubulation sometimes exhibited by etioplasts and leucoplasts.
Since the first description of stromules, many studies have focused on identifying treatments that
can promote or prevent the elongation of plastids, with the goal of determining the function of
plastid tubulation within the cell and how it occurs. These reports are summarized in Appendix 2.
Though many functions have been proposed, including assisting with the transfer of
macromolecules between plastids, increasing the surface area shared between the plastid and the
surrounding cytoplasm, enhancing interactions with other organelles, dispersing reactive oxygen
species, and recycling plastidial components during stress (Reviewed in Hanson and Hines, 2018),
107
the function of stromules remains largely speculative at this juncture and so too does the
mechanism by which they are created. Here we focus on the mechanistic aspect of plastid
tubulation.
Tubular membrane structures are common within the eukaryotic cell. For instance, in addition to
the formation of stromules from plastids, tubular membranes create the cortical network of the ER
(Sparkes et al., 2009b; Park and Blackstone, 2010), characterize mitochondrial (Jaipargas et al.,
2015) and peroxisomal form under some conditions (Schrader and Fahimi, 2004; Barton et al.,
2014), and are a critical step in the formation of vesicles (Reviewed in Jarsch et al., 2016).
Consequently, much research has been done, most often using in vitro membrane systems, to
understand what factors can promote or inhibit membrane curvature and tubulation (Reviewed in
McMahon and Boucrot, 2015). Individually, proteins, lipid composition, and pulling or pushing
on a membrane have each been shown to influence the tubulation of artificial membrane bilayers.
It is not immediately apparent whether artificial bilayer experiments can be directly correlated to
the double bilayer that bounds the plastid, but common behaviours do exist. For example, the
formation of tubules as a result of high protein concentrations has been reported for artificial
vesicles (Shi and Baumgart, 2015; Chen et al., 2016), isolated chloroplasts (Ho and Theg, 2016)
and chloroplasts within a living cell (Breuers et al., 2011). The effect of each proteins, lipids, and
physical forces should therefore be considered when contemplating potential mechanisms of
plastid tubulation.
The ways in which proteins and lipids can promote membrane curvature or tubulation are
numerous and often intertwined (Figure 4.1.1). In general, proteins can directly promote the
formation of curvature through one of the following mechanisms: the formation of asymmetry
between membrane leaflets as a result of partial insertion into the bilayer, the bending of the
membrane as a result of transmembrane proteins with a wedge-shaped profile, the crowding of
proteins or protein domains at a single side of the bilayer, or the formation of a curved scaffold
around a membrane (McMahon and Boucrot, 2015). Asymmetric protein distribution in the plastid
envelope as a result of significant membrane protein overexpression can induce the formation of
tubules in transgenic plants (Breuers et al., 2012; Machettira et al., 2012), but there is currently
little evidence for a naturally-occurring protein-based system for the extension of stromules
108
(Erickson and Schattat, 2018). Mutation of the only known plastid-associated protein believed to
cause mechanical constriction does not significantly affect the formation of stromules (Holzinger
et al., 2008) and despite decades of research, the only mutant identified to date that lacks stromules
has swollen chloroplasts due to compromised ion channels (Haswell and Meyerowitz, 2006). A
recent study presented the most direct evidence to date for the involvement of proteins in stromule
extension, suggesting that an unidentified protein over 100 kDa in size can induce stromule
formation in isolated chloroplasts (Ho and Theg, 2016). However, the mass of beaded tubules
shown to emanate from single chloroplasts was more reminiscent of the tubules seen in in vitro
systems in response to osmotic shrinkage (Viallat et al., 2004; Sanborn et al., 2012; Okano et al.,
2018) than of the more consistent stromule shape and dynamics seen in an intact cell. Further, Ho
and Theg (2016) saw plastid tubulation with a concentrated plant protein extract. In an in vitro
setup, even proteins that have no membrane association can cause tubulation in a concentration-
dependent manner by crowding the membrane surface (Chen et al., 2016). It must be considered
whether the structures seen were a consequence of the experimental setup rather than a
representation of stromule formation applicable to intact cells. Given that little evidence has been
found to date, it is unlikely that there is a simple protein-based explanation for stromule formation.
Figure 4.1.1 (Next Page) Protein interactions and lipid composition affect membrane curvature. A) A basic
phospholipid bilayer tends toward a flat configuration. B) Partial insertion of proteins into one leaflet of the bilayer
creates asymmetry that promotes membrane bending. C) Transmembrane proteins with non-rectangular shapes can
act as wedges in a bilayer and create membrane curvature. D) Crowding of peripheral proteins on one side of the
bilayer can force membrane bending. E) Proteins that partially or completely span the membrane can have large extra-
membrane domains that can bend a membrane by crowding the surface. F) Some proteins, such as BAR-domain
proteins and dynamin family proteins, form a curved scaffold around the membrane surface and cause bending or
constriction. G) Top: Lipid bilayers in a cell are non-homogenous in lipid composition. The geometry of a lipid
molecule influences its shape in a bilayer with some promoting bilayer formation (blue) and others promoting
curvatures (purple, green). Middle left: Flipases can transfer lipids from one leaflet of the bilayer to the other, and
have the potential to create asymmetry. Middle right: Lipases remove a tail chain from a lipid to create lysolipids
(purple). Bottom: Localized concentrations of curvature-promoting lipids can promote membrane bending. Compiled
from Farsad and De Camilli, 2003; McMahon and Boucrot, 2015; and Pomorski et al. 2014.
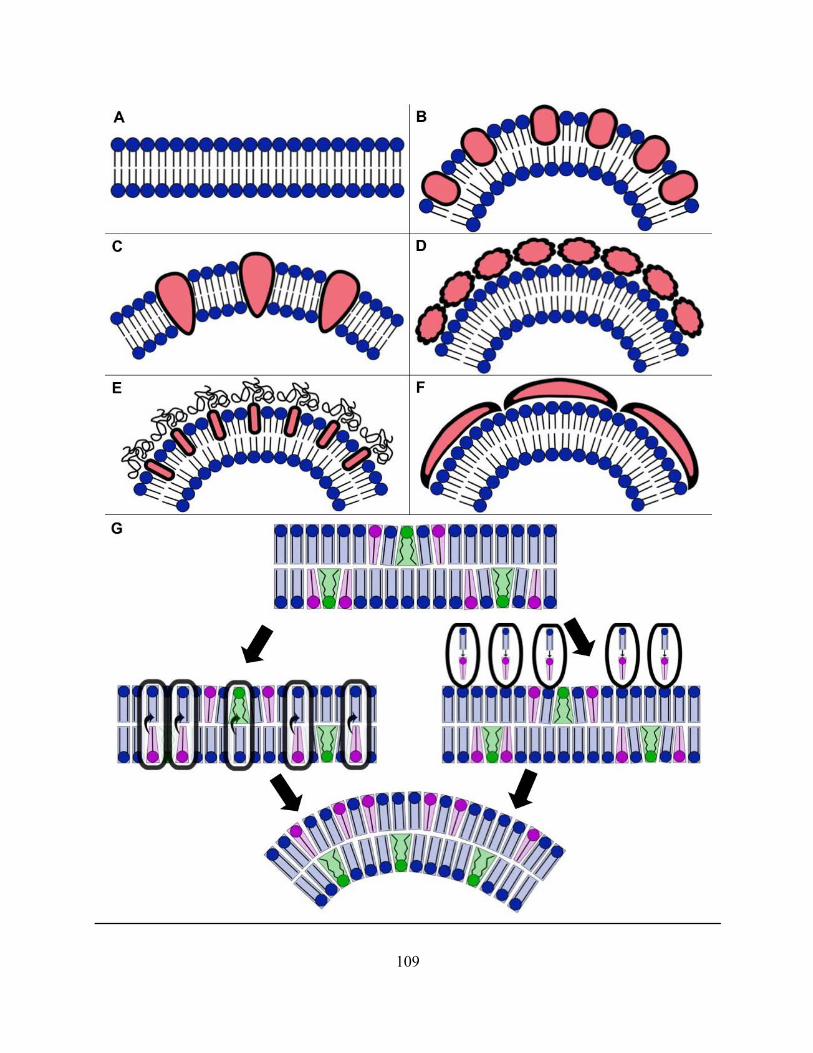
109
110
Proteins can also potentially promote membrane tubulation by causing localized changes to lipid
composition through lipase or translocase activity (Farsad and De Camilli, 2003; Pomorski et al.,
2014). The identity of the lipids that make up a membrane contributes substantially to its
behaviour. Individual lipids are proposed to have shapes determined by the proportional size of
the head group to the tail chains, and each lipid species can be classified as promoting bilayer
formation, positive curvature, or negative curvature. For example, lysolipids have a single tail
chain attached to a wider headgroup, giving them a triangular shape that can contribute to curvature
in a region. In contrast, phosphatidylcholine has a cylindrical shape that preferentially forms a flat
bilayer, as it has two tail groups of approximately equal width to the headgroup (Suetsugu et al.,
2014). In addition to affecting membrane curvature through lipid geometry, lipid composition also
influences membrane tension. Many studies support that reduced tension in a membrane increases
the frequency of tubules formed as a result of protein activity or external forces, and that there is
a maximum tension above which no tubules can be formed (Koster et al., 2003; Leduc et al., 2004;
Rangamani et al., 2014; Shi and Baumgart, 2015; McIntosh et al., 2018). The individual roles of
lipids and proteins in membrane tubulation are potentially inseparable in the complex environment
of a living cell. Proteins can influence membranes either directly or by altering lipid composition,
but conversely, lipid composition in an area can influence the recruitment or assembly of proteins
(Pomorski et al., 2014; Simunovic and Voth, 2015). Though specific players have not yet been
identified, both components may contribute to the amenability of a cellular membrane to
tubulation; however, neither can completely account for the dynamics of a plastid in a living cell.
Plastid tubules can rapidly extend, retract, and branch in what often appears to be a directed,
tensioned manner (Gunning, 2005). Pulling or pushing on a membrane has been shown to cause
similar extension and branching of membrane tubules. Most evidence for tubulation as a result of
pushing on a membrane comes from studying plasma membrane extension in animal cells, where
the actin cytoskeleton deforms the membrane outwards as it polymerizes (Jarsch et al., 2016).
There are few structures within a plastid capable of exerting an outward directional force. Though
one division protein has been shown to create filaments within a plastid, this could only be
demonstrated under conditions of protein overexpression (Vitha et al., 2001; Erickson and
Schattat, 2018) and no other filamentous structures are known to date. In the previous chapter, it
was demonstrated that the accumulation of inclusions, such as starch, within a plastid has little
111
correlation with the frequency of stromule extension, suggesting that neither these inclusions, nor
the general stromal displacement that they cause, contribute to stromule formation. No other
internal plastid structures, such as the thylakoids or nucleoids, provide a strong candidate for
creating a directional force and it is therefore improbable that a force from within the plastid is
responsible for tubule extension.
The behaviour of plastid tubules within a cell does resemble in vitro studies on the tubulation of
membranes due to pulling by cytoskeletal motor proteins. Most of these studies focused on kinesin
motors and the microtubules, as these form the primary transport system in animal cells (Roux et
al., 2002; Koster et al., 2003; Leduc et al., 2004). However, myosin motors can also cause
tubulation (Yamada et al., 2014; McIntosh et al., 2018) and the coordinated behaviour of both
myosins and kinesins results in a greater number and length of tubules than when either acts alone
(McIntosh et al., 2018). The involvement of both cytoskeletal systems in stromule formation from
plastids in living cells was proposed shortly after the initial characterization of stromules (Kwok
and Hanson, 2003); however, in the subsequent decades much conflicting data has been presented.
Several investigations have sought to study the physical relationship between plastids and the
cytoskeletal systems, and to influence cytoskeletal structure or motor protein function in order to
assess whether they are involved in stromule extension. The cytoskeletal disruption section of
Appendix 2 summarizes the related conditions and treatments for which the influence on stromule
formation has been reported.
Early work on the association between the actin cytoskeleton and mesophyll chloroplasts describes
the alignment of some chloroplasts with thick actin bundles and the formation of ‘basket-like’
structures of actin around others (Kwok and Hanson, 2003; Kwok and Hanson, 2004a). In more
recent studies, a cage of short actin filaments surrounding all mesophyll chloroplasts is described
(Kadota et al., 2009; Kong et al., 2013). This actin cage is implicated in both chloroplast
positioning within the cell and chloroplast movement in response to light (Kandasamy and
Meagher, 1999; Kadota et al., 2009; Kong et al., 2013). In the epidermis, chloroplasts are often in
close proximity to, or embedded within, long actin filaments (Kwok and Hanson, 2004a; Barton
et al., 2017), but no cage of short actin filaments has been described in the literature despite photo-
relocation behaviour similar to mesophyll chloroplasts (Higa et al., 2014).
112
Actin rearrangement has been correlated with changes to plastid shape, as stromules often align
completely or partially along actin bundles (Kwok and Hanson, 2004a; Barton et al., 2017). In
general, the disruption of the actin-myosin system has a negative effect on stromule formation.
Reduced numbers of stromules have been reported in response to drugs that disrupt actin structure
or myosin function (Latrunculin B (LatB), cytochalasin D, 2,3-butanedione 2-monoxime; Natesan
et al., 2009; Kwok and Hanson, 2003), to the silencing of Tobacco myosin XI (Natesan et al.,
2009), to the overexpression of the Tobacco myosin XI-2 cargo domain (Natesan et al., 2009), and
to the overexpression of dominant-negative Arabidopsis myosin XI-2 and XI-K constructs (Bross
et al., 2017). At least one study, however, has observed little effect of the actin-disrupting drug
cytochalasin D on stromule formation despite high drug concentrations relative to other reports
(Kumar et al., 2018). Similarly, Lat B was shown to have no effect on the formation of protrusions
from mesophyll chloroplasts in alpine species (Holzinger et al., 2007b).
Despite most evidence suggesting an involvement of the actin-myosin system in plastid tubulation,
results on the association of myosins with the plastid surface are inconclusive. No full length
myosin has been found that associates with plastids, and experiments on complete myosin tails or
large truncations similarly showed no plastidial localizations (Reisen and Hanson, 2007; Avisar et
al., 2009). One group did find that a portion of the tail domain of Arabidopsis myosin XI-F (myosin
XI-5), smaller than the truncated constructs used in the study by Reisen and Hanson (2007),
localized to the plastid, peroxisomes, and Golgi vesicles, as did the corresponding myosin-XI
sequence from Tobacco (Sattarzadeh et al., 2009, 2013); however, given that the larger truncations
of the same region show no such localization, nor does the complete tail or the full length myosin,
the extent to which myosin XI-F binds to the plastid under normal conditions is unclear. Another
group reported that the tail region of the Tobacco myosin XI-2 associates with both chloroplasts
and mitochondria (Natesan et al., 2009), but others instead report an endoplasmic ER localization
(Yokota et al., 2009; Sparkes et al., 2011) and the most closely related Arabidopsis homolog
(myosin XI-2/MYA2; Natesan et al., 2009) is reported to localize to peroxisomes, small vesicles,
undefined structures, or the plasma membrane depending on the study (Li and Nebenführ, 2007;
Reisen and Hanson, 2007; Avisar et al., 2009; Griffing et al., 2014). Overall, it has been generally
accepted that an undisrupted actin-myosin system is required for normal stromule extension,
113
though the exact mechanism by which the two interact is unclear given the inconsistent
localizations reported for the myosin motors.
In the earliest investigations into the role of cytoskeletal elements on the extension of stromules,
both the actin filaments and the microtubules were implicated. Stromule length was seen to
decrease after treatment with drugs that affected either the actin cytoskeleton (Cytochalasin D,
LatB) or the microtubules (amiprophosmethyl, oryzalin), with an additive effect when both
cytoskeletal structures were disrupted simultaneously (Kwok and Hanson, 2003). Despite this, the
actin cytoskeleton alone was the focus for many years, likely due to the inability to repeat the
effects of microtubule-disrupting drugs on stromules in two subsequent studies (Holzinger et al.,
2007b; Natesan et al., 2009). It is only recently that the possibility of a role for microtubules in
stromule formation has once again been suggested. Unlike the clear association with the actin
cytoskeleton, chloroplasts often appear to be on a distinct visual plane from the microtubules
(Kandasamy and Meagher, 1999; Barton et al., 2017); however, some alignment between
microtubules and stromule trajectory does occur (Barton et al., 2017; Erickson et al., 2018; Kumar
et al., 2018). Erickson et al. (2018) performed a thorough investigation of correlated stromule-
microtubule dynamics and found that stromule behaviour could be classified into two categories:
the rapid formation of transient stromules that showed no apparent microtubule association and
were presumed based on extension velocities to be actin-associated, and the slow formation of
more persistent stromules that were visually correlated with microtubules. The link between
stromule extension and microtubules was echoed by Kumar et al. (2018), who reported similar
visual observations of correlated stromule-microtubule dynamics. They found that microtubule
bundling increased stromule frequency, but their results on microtubule disruption were less clear,
concluding a negative effect on stromule formation after short-term oryzalin treatment, but an
increase in the speed of extension and no change to stromule length after longer treatments. This
latter result agrees with the observations by Erickson et al. (2018) that the stromule population
skews towards non-microtubule-based extension when microtubules are disrupted. Interestingly,
no correlation was seen between stromule extension and the actin filaments, and disruption of the
actin cytoskeleton had no influence on stromule frequency in their study, contrary to several
previous reports. The authors suggest that the actin cytoskeleton plays a role in anchoring
stromules that are extended along microtubules, rather than contributing directly to the outwards
114
movement of stromules, but the reason for the continued stromule extension after disruption of the
microtubules is unclear.
There are therefore three main groups of cytoskeleton-based stromule formation studies: those that
suggest a unique role for the actin cytoskeleton in stromule extension, those that favor microtubule-
based stromule extension with potential anchoring on actin filaments, and those that suggest that
both cytoskeletal elements contribute to plastid tubulation. In addition to the cytoskeleton, the ER
has been put forth as a cellular structure that may provide the pulling force for stromule formation
(Schattat et al., 2011a). This has the potential to unify the conflicting results in the literature. The
ER spans the entire cell, surrounding the nucleus, forming a cortical network of tubules that
undergo constant rearrangement, and traversing the cell in rapidly streaming transvacuolar strands
(Sparkes et al., 2009b; Griffing, 2010). The behaviour of the ER has been shown in several studies
to rely on both the actin-myosin system and the microtubules, in addition to a host of ER-associated
proteins (Reviewed in Sparkes et al., 2011; Griffing et al., 2017).
There are few reports of visual actin-ER correlation, but the actin cytoskeleton and myosin motors
are considered the primary contributors to ER structure and dynamics, with the presence of actin
filaments, myosin XI motors and ATP/GTP being sufficient to tubulate ER vesicles in vitro and
create a network similar in appearance to that seen in intact cells (Yokota et al., 2011). Full length
myosin XI-K has been shown to be ER-associated both through fluorescent localization and co-
fractionation (Yokota et al., 2009; Ueda et al., 2010; Peremyslov et al., 2012) and the ER is
considerably less dynamic in myosin XI-K knockout mutants, with defects seen in the formation
of cytoplasmic (transvacuolar) and cortical ER strands. A slight reduction in the rate of ER
streaming is also seen in mya1 (myosin XI-1)/mya2 (myosin XI-2) double mutant plants, and
myosin triple mutants (xi-k xi-1 xi-2) show structural defects including ER aggregates and thick
ER sheets distinct in appearance from the typical cisternae (Ueda et al., 2010), suggesting that
these three myosins (XI-K, XI-1, XI-2) are significant contributors to ER behaviour.
Overexpression studies, where expressed myosins are thought to cause competition with functional
myosins for binding sites, also link myosin XI-1 and XI-K to ER dynamics (Sparkes et al., 2009a;
Ueda et al., 2010; Griffing et al., 2014). Microtubules have been implicated to a lesser extent in
ER behaviour. Drug-based disruption of microtubules alters the ER in the cortical region of
115
elongating algal cells (Foissner et al., 2009), and influences the organization of the ER during
mitosis in gymnosperms (Zachariadis et al., 2003). In Arabidopsis, many ER tubule junctions that
remain static over time seem to correlate with the position of microtubules, suggesting that they
have a role ER anchoring and branching (Hamada et al., 2012; Hamada et al., 2014), and they have
been found to contribute to ER extension, though less rapidly than actin-associated rearrangement
(Hamada et al., 2014)
When considering the current knowledge on the effect of cytoskeletal disruption on stromules and
on the ER, as well as on the myosin motors thought to be involved, many commonalities become
apparent. Due to the close association between actin, microtubules, and ER dynamics, drug
treatments used to observe the effect of cytoskeletal disruption on the formation of stromules can
also influence ER behaviour. Indeed, the drugs used in stromule studies to influence the actin-
myosin system (BDM, cytochalasin D, and LatB) have all been shown to affect the ER, resulting
in a reduction in ER rearrangement, a reduction in streaming, or changes to structure (Šamaj et al.,
2000; Sparkes et al., 2009a; Yokota et al., 2009; Ueda et al., 2010; Lin et al., 2014). Interestingly,
it is myosin XI-2 and myosin XI-K that have been implicated in stromule extension (Natesan et
al., 2009; Bross et al., 2017), and these are the same myosins believed to be responsible for
rearrangement of the ER tubular network (Ueda et al., 2010). Similar to the varying reports of their
effect on stromule formation, the effect of microtubule disrupting drugs on the ER varies between
studies. In some cases, oryzalin appears to have no visual effect on the ER (Sparkes et al., 2009a;
Yokota et al., 2009), while in others it can result in decreased dynamics (Foissner et al., 2009), ER
vesiculation (Langhans et al., 2009), or a reduction in ER tubule junctions (Hamada et al., 2012).
Other microtubule drugs also vary in consequence between studies, having either little effect
(propyzamide, taxol; Yokota et al., 2009; Foissner et al., 2009) or resulting in slowing of
rearrangement followed by significant ER breakdown (colchicine; Allen and Brown, 1988). The
two types of stromules, slow and fast extending, are believed to extend along the microtubules and
actin respectively (Erickson et al., 2018), and similarly ER tubules can extend slowly along
microtubules and more rapidly along actin (Hamada et al., 2014). The ER is therefore a viable
candidate to exert a pulling force on the plastid membrane when the existing literature is taken into
account, and the case is made stronger by the close association between these two organelles.
116
In addition to shared biochemical pathways, largely involving the biosynthesis or modification of
lipids (Block and Jouhet, 2015), plastids and the ER share close physical associations. In algae,
chloroplasts are surrounded by a continuous sheet of ER (Reviewed in Gibbs, 1981), while in ferns
and vascular plants the ER remains closely associated with the plastid (Douce and Joyard, 1979;
Gibbs, 1981; Schattat et al., 2011a), but takes the form of tubules and cisternae rather than a
complete sheet. The amount of ER in close proximity to the plastid varies by cell type and age,
with younger, secretory, or reproductive cells showing greater ER-plastid association than more
mature tissues. These reports are summarized in Table 4.1. In vascular plants, direct contact
between the ER and the plastid outer envelope has been seen in electron micrographs (Wooding
and Northcote, 1965a; Wooding and Northcote, 1965b; Wooding and Northcote, 1965c; Pacini
and Cresti, 1976; Abreu and Santos, 1977; Kaneko and Keegstra, 1996), and continuity between
these two membranes occurs in ferns and liverworts (Diers, 1966; Cran and Dyer, 1973; Crotty
and Ledbetter, 1973). The hemifusion of ER and chloroplast membranes has been proposed as
early as 1979 (Douce and Joyard, 1979) as a potential method of lipid transfer between the two
organelles, and there is increasing evidence supporting the existence of ER-plastid MCS, often
referred to in the literature as Plastid Associated Membranes (PLAMs; Andersson et al., 2007).
Consistent contamination of isolated chloroplast fractions by the ER has been reported in
Arabidopsis and Pisum sativum (Kjellberg et al., 2000; Andersson et al., 2007), and this led
Andersson et al. (2007) to devise an experiment using laser tweezers to measure the strength of
the ER-plastid connection. They found that plastids could be pulled away from the ER with forces
above 400 pN without detachment, which was considered sufficient to suggest protein-protein
interactions. Further supporting this, the application of the protease trypsin resulted in detachment
using considerably less force. Biochemical evidence also supports connectivity between the two
organelles. Mutants in several steps of the chloroplast-based synthesis of tocopherols can be
complemented by expression of the missing enzyme within the ER, indicating that nonpolar
substrates were readily shared back and forth between the two organelles (Mehrshahi et al., 2013).
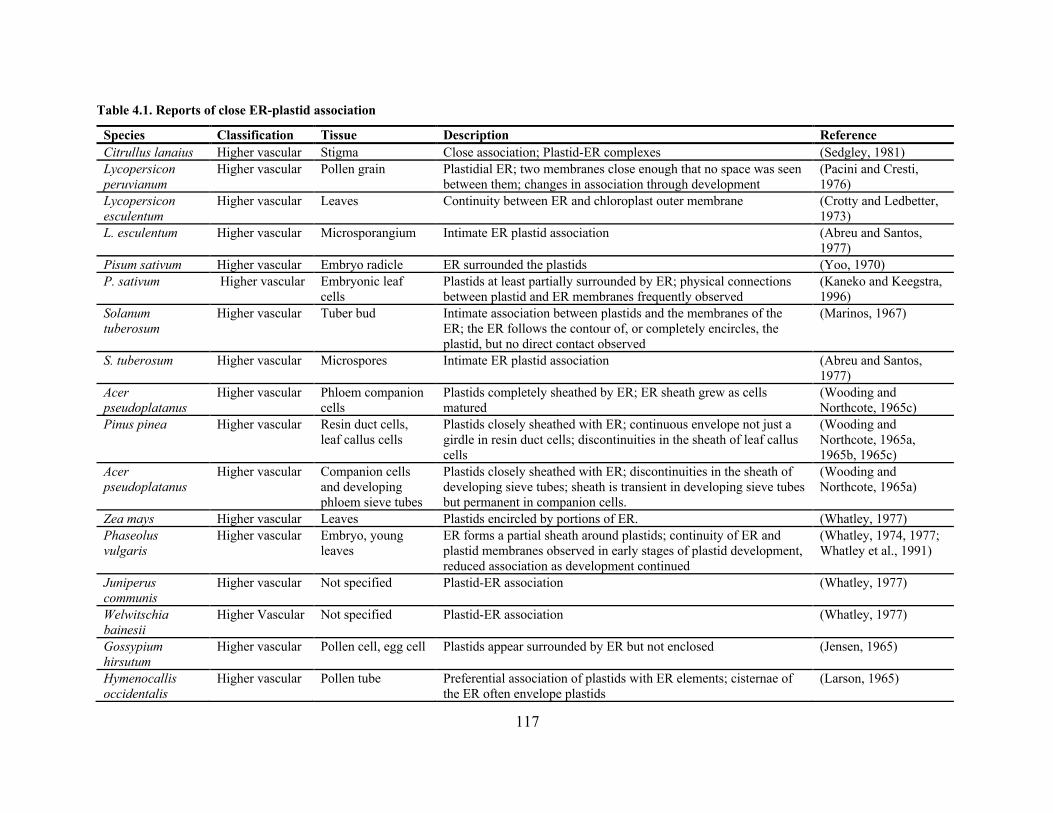
117
Table 4.1. Reports of close ER-plastid association
Species Classification Tissue Description Reference Citrullus lanaius Higher vascular Stigma Close association; Plastid-ER complexes (Sedgley, 1981) Lycopersicon peruvianum
Higher vascular Pollen grain Plastidial ER; two membranes close enough that no space was seen between them; changes in association through development
(Pacini and Cresti, 1976)
Lycopersicon esculentum
Higher vascular Leaves Continuity between ER and chloroplast outer membrane (Crotty and Ledbetter, 1973)
L. esculentum Higher vascular Microsporangium Intimate ER plastid association (Abreu and Santos, 1977)
Pisum sativum Higher vascular Embryo radicle ER surrounded the plastids (Yoo, 1970) P. sativum Higher vascular Embryonic leaf
cells Plastids at least partially surrounded by ER; physical connections between plastid and ER membranes frequently observed
(Kaneko and Keegstra, 1996)
Solanum tuberosum
Higher vascular Tuber bud Intimate association between plastids and the membranes of the ER; the ER follows the contour of, or completely encircles, the plastid, but no direct contact observed
(Marinos, 1967)
S. tuberosum Higher vascular Microspores Intimate ER plastid association (Abreu and Santos, 1977)
Acer pseudoplatanus
Higher vascular Phloem companion cells
Plastids completely sheathed by ER; ER sheath grew as cells matured
(Wooding and Northcote, 1965c)
Pinus pinea Higher vascular Resin duct cells, leaf callus cells
Plastids closely sheathed with ER; continuous envelope not just a girdle in resin duct cells; discontinuities in the sheath of leaf callus cells
(Wooding and Northcote, 1965a, 1965b, 1965c)
Acer pseudoplatanus
Higher vascular Companion cells and developing phloem sieve tubes
Plastids closely sheathed with ER; discontinuities in the sheath of developing sieve tubes; sheath is transient in developing sieve tubes but permanent in companion cells.
(Wooding and Northcote, 1965a)
Zea mays Higher vascular Leaves Plastids encircled by portions of ER. (Whatley, 1977) Phaseolus vulgaris
Higher vascular Embryo, young leaves
ER forms a partial sheath around plastids; continuity of ER and plastid membranes observed in early stages of plastid development, reduced association as development continued
(Whatley, 1974, 1977; Whatley et al., 1991)
Juniperus communis
Higher vascular Not specified Plastid-ER association (Whatley, 1977)
Welwitschia bainesii
Higher Vascular Not specified Plastid-ER association (Whatley, 1977)
Gossypium hirsutum
Higher vascular Pollen cell, egg cell Plastids appear surrounded by ER but not enclosed (Jensen, 1965)
Hymenocallis occidentalis
Higher vascular Pollen tube Preferential association of plastids with ER elements; cisternae of the ER often envelope plastids
(Larson, 1965)
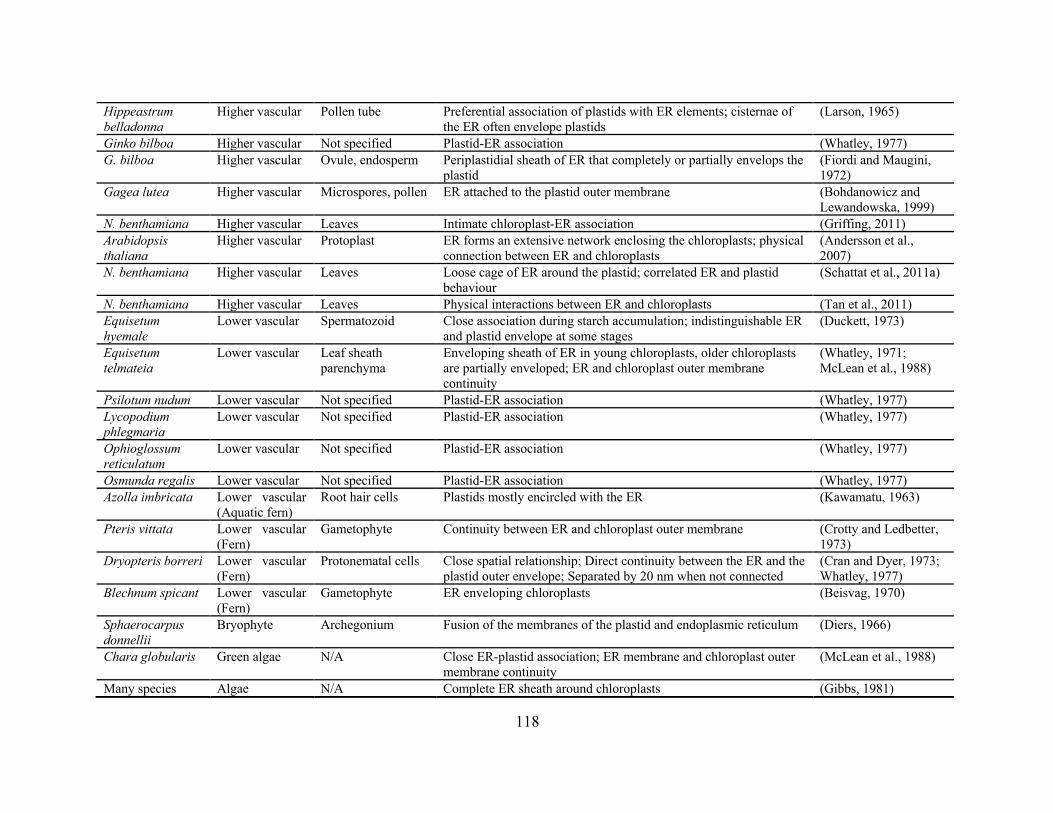
118
Hippeastrum belladonna
Higher vascular Pollen tube Preferential association of plastids with ER elements; cisternae of the ER often envelope plastids
(Larson, 1965)
Ginko bilboa Higher vascular Not specified Plastid-ER association (Whatley, 1977) G. bilboa Higher vascular Ovule, endosperm Periplastidial sheath of ER that completely or partially envelops the
plastid (Fiordi and Maugini, 1972)
Gagea lutea Higher vascular Microspores, pollen ER attached to the plastid outer membrane (Bohdanowicz and Lewandowska, 1999)
N. benthamiana Higher vascular Leaves Intimate chloroplast-ER association (Griffing, 2011) Arabidopsis thaliana
Higher vascular Protoplast ER forms an extensive network enclosing the chloroplasts; physical connection between ER and chloroplasts
(Andersson et al., 2007)
N. benthamiana Higher vascular Leaves Loose cage of ER around the plastid; correlated ER and plastid behaviour
(Schattat et al., 2011a)
N. benthamiana Higher vascular Leaves Physical interactions between ER and chloroplasts (Tan et al., 2011) Equisetum hyemale
Lower vascular Spermatozoid Close association during starch accumulation; indistinguishable ER and plastid envelope at some stages
(Duckett, 1973)
Equisetum telmateia
Lower vascular Leaf sheath parenchyma
Enveloping sheath of ER in young chloroplasts, older chloroplasts are partially enveloped; ER and chloroplast outer membrane continuity
(Whatley, 1971; McLean et al., 1988)
Psilotum nudum Lower vascular Not specified Plastid-ER association (Whatley, 1977) Lycopodium phlegmaria
Lower vascular Not specified Plastid-ER association (Whatley, 1977)
Ophioglossum reticulatum
Lower vascular Not specified Plastid-ER association (Whatley, 1977)
Osmunda regalis Lower vascular Not specified Plastid-ER association (Whatley, 1977) Azolla imbricata Lower vascular
(Aquatic fern) Root hair cells Plastids mostly encircled with the ER (Kawamatu, 1963)
Pteris vittata Lower vascular (Fern)
Gametophyte Continuity between ER and chloroplast outer membrane (Crotty and Ledbetter, 1973)
Dryopteris borreri Lower vascular (Fern)
Protonematal cells Close spatial relationship; Direct continuity between the ER and the plastid outer envelope; Separated by 20 nm when not connected
(Cran and Dyer, 1973; Whatley, 1977)
Blechnum spicant Lower vascular (Fern)
Gametophyte ER enveloping chloroplasts (Beisvag, 1970)
Sphaerocarpus donnellii
Bryophyte Archegonium Fusion of the membranes of the plastid and endoplasmic reticulum (Diers, 1966)
Chara globularis Green algae N/A Close ER-plastid association; ER membrane and chloroplast outer membrane continuity
(McLean et al., 1988)
Many species Algae N/A Complete ER sheath around chloroplasts (Gibbs, 1981)

119
Much of the current understanding of MCS comes from mammalian and yeast systems
(Andersson, 2013; Prinz, 2014), where contacts between the ER and the plasma membrane, as well
as between the ER and mitochondria, are relatively well characterized. However, there is
considerable variability in structure between MCS from different kingdoms and between different
organelles (Andersson, 2013), and the protein complexes involved often do not have clear plant
homologs (Pérez-Sancho et al., 2016). Despite the general acceptance of their existence, little is
currently known about the structure of ER-plastid MCS (Pérez-Sancho et al., 2016). The potential
protein-protein interactions reported by Andersson et al. (2007) may suggest the involvement of
tethering proteins, which would be consistent with the general structure of MCS (Pérez-Sancho et
al., 2016), but none have currently been identified.
The Brassica napus lipase BnCLIP1, is reported to localize to small dots on the chloroplast surface
that often correspond to regions of visual ER-plastid overlap. It is the only protein to date that is
postulated to localize directly to ER-plastid MCS (Tan et al., 2011). Other proteins have been
discussed in conjunction with the MCS, but their direct localization is not yet supported. For
instance, isolation of PLAMs showed them to be enriched with ER proteins such as NADH-
dependent cytochrome c reductase and phosphatidylcholine synthase, but it is unclear if these are
a direct component of the MCS structure or are simply more prevalent in the nearby ER (Andersson
et al., 2007). A protein of trigalactosyldiacylglycerol (TGD) family, TGD4, has been implicated
in ER-plastid lipid transport (Xu et al., 2008) and is often discussed in conjunction with lipid
transport at ER-plastid MCS (Pérez-Sancho et al., 2016), but the localization appears to be to the
general ER rather than to distinct subdomains (Xu et al., 2008). In addition to potential protein
tethering, the argument for hemifusion of the ER membrane and the plastid outer envelope at MCS
has also been made. This was based on the ready transfer of at least seven non-polar intermediates
between the two organelles, which it was proposed would otherwise require a host of yet-
unidentified transport proteins (Mehrshahi et al., 2013; Mehrshahi et al., 2014). The understanding
of plastid-ER MCS structure will hopefully become clearer as research progresses, but there is
sufficient evidence already in place to indicate that the attachment between the two organelles is
strong enough for the ER to pull on the plastid membrane as it rearranges along the underlying
cytoskeletal system.
120
Some visual correlations between ER rearrangement and plastid tubulation have already by drawn
in Tobacco plants transiently transformed with ER- and plastid-targeted fluorescent proteins. The
tip of an extending stromule was always seen to associate with the ER, and extension often
occurred within an ER channel, which emanated outwards from an ER cage surrounding the
plastid, or alongside rapidly streaming cytoplasmic ER. Similarly, the extension of branches from
an existing stromule was accompanied by the extension of an ER tubule and branching occurred
at angles that correspond to those in the cortical ER network (Schattat et al., 2011a, 2011b).
In this study we establish whether the relationship between the ER and plastid tubulation holds in
stable transgenics, across species, and in other tissues, as well as whether differences in ER
structure are associated with altered plastid behaviour. We also examine the visual relationship
between the ER and less common plastid phenotypes, discuss the relationship between the actin
cytoskeleton and the ER, and investigate the localization of the putative MCS marker BnCLIP1.
121
4.2 Results 4.2.1 The ER network
Prior to evaluating any correlation between ER and plastid behaviour, we observed the ER in
Arabidopsis to establish its basic structure under our conditions and determine if different tissues
or growth conditions could be used to alter ER form. An Arabidopsis transgenic line expressing a
lumenal RFP:ER (Sinclair et al., 2009) was used to observe ER dynamics within the cell. The
characterization was undertaken in the upper epidermal surface of 21-day-old leaves and of 7-day-
old dark or light grown hypocotyls. Neither the lower epidermal surface nor the mesophyll cells
were used for assessment where avoidable. These cell surfaces were in close enough proximity to
get overlapping fluorescent signals, resulting in the simultaneous visualization of the ER from two
separate cell layers. General ER dynamics were consistent between cell types. The ER at the cortex
of the cells was comprised of an extremely dynamic network of tubules that came together at three-
way or four-way junctions. This created a mesh of polygons of varying sizes and shapes. Figure
4.2.1 highlights the dynamics of tubule rearrangement. New polygons were created by the
extension of a branch from an existing tubule. This branch either connected to another tubule or
retracted, though it could remain an unconnected projection for a considerable length of time
before doing either. Polygons could be disassembled through ER rearrangement, typically when
one or two sides of a polygon slid inwards until they merged with the other tubules. This resulted
in a single larger polygon where two previously existed.
The ER mesh within a cell typically had clusters of small polygons distributed among larger ones,
rather than an even distribution of morphologies. Also interspersed within this dynamic mesh were
flattened sheets of ER, called cisternae (Fig. 4.2.2A), which when filled with small gaps formed
fenestrated sheets (Fig. 4.2.2B). Though small transient cisternae or fenestrated sheets were
occasionally seen in the tissues observed for ER characterization, large ones were uncommon.
Regions of active streaming, ranging in size from a single tubule to large bulks of ER, occurred
within the cortical ER and could change their path over time (Fig. 4.2.2C). Rapidly streaming ER
was also present in the cytoplasmic strands that traversed the cell (Fig. 4.2.2D). Large spindle-
shaped ER bodies, dilated cisternae known to occur within the Brassicales (Nakano et al., 2014),
could move rapidly through the cytoplasmic or cortical regions of streaming, but remained static
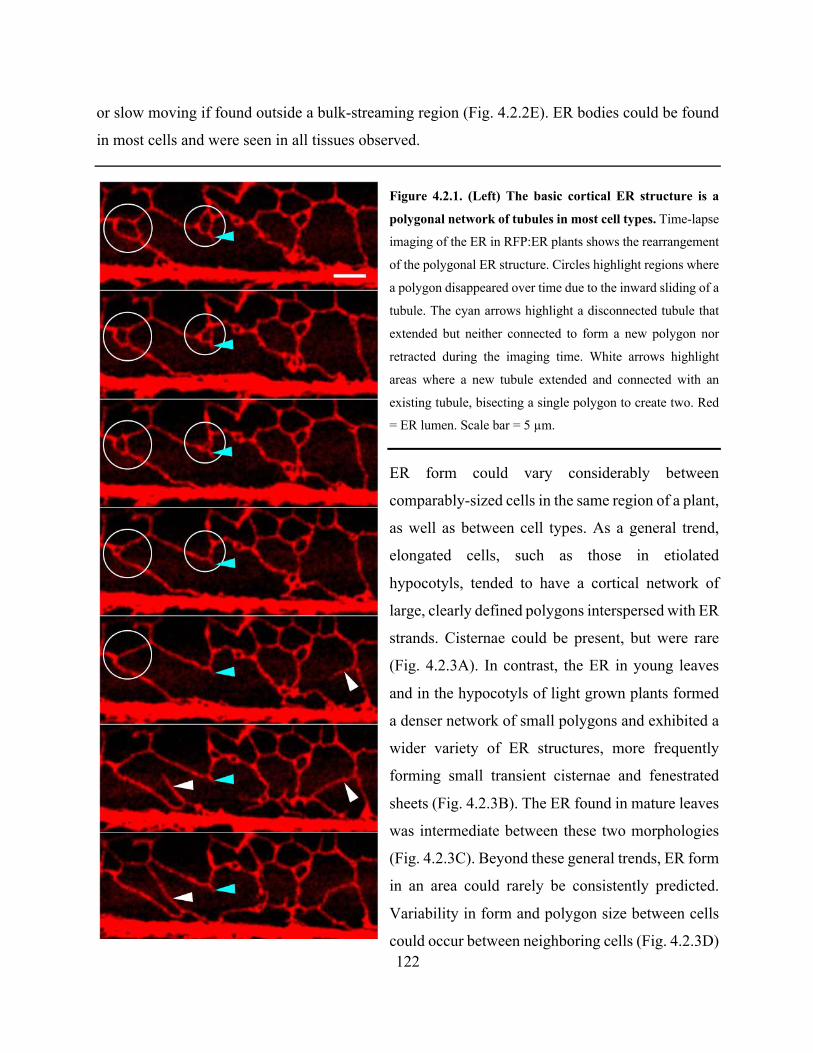
122
or slow moving if found outside a bulk-streaming region (Fig. 4.2.2E). ER bodies could be found
in most cells and were seen in all tissues observed.
Figure 4.2.1. (Left) The basic cortical ER structure is a
polygonal network of tubules in most cell types. Time-lapse
imaging of the ER in RFP:ER plants shows the rearrangement
of the polygonal ER structure. Circles highlight regions where
a polygon disappeared over time due to the inward sliding of a
tubule. The cyan arrows highlight a disconnected tubule that
extended but neither connected to form a new polygon nor
retracted during the imaging time. White arrows highlight
areas where a new tubule extended and connected with an
existing tubule, bisecting a single polygon to create two. Red
= ER lumen. Scale bar = 5 µm.
ER form could vary considerably between
comparably-sized cells in the same region of a plant,
as well as between cell types. As a general trend,
elongated cells, such as those in etiolated
hypocotyls, tended to have a cortical network of
large, clearly defined polygons interspersed with ER
strands. Cisternae could be present, but were rare
(Fig. 4.2.3A). In contrast, the ER in young leaves
and in the hypocotyls of light grown plants formed
a denser network of small polygons and exhibited a
wider variety of ER structures, more frequently
forming small transient cisternae and fenestrated
sheets (Fig. 4.2.3B). The ER found in mature leaves
was intermediate between these two morphologies
(Fig. 4.2.3C). Beyond these general trends, ER form
in an area could rarely be consistently predicted.
Variability in form and polygon size between cells
could occur between neighboring cells (Fig. 4.2.3D)
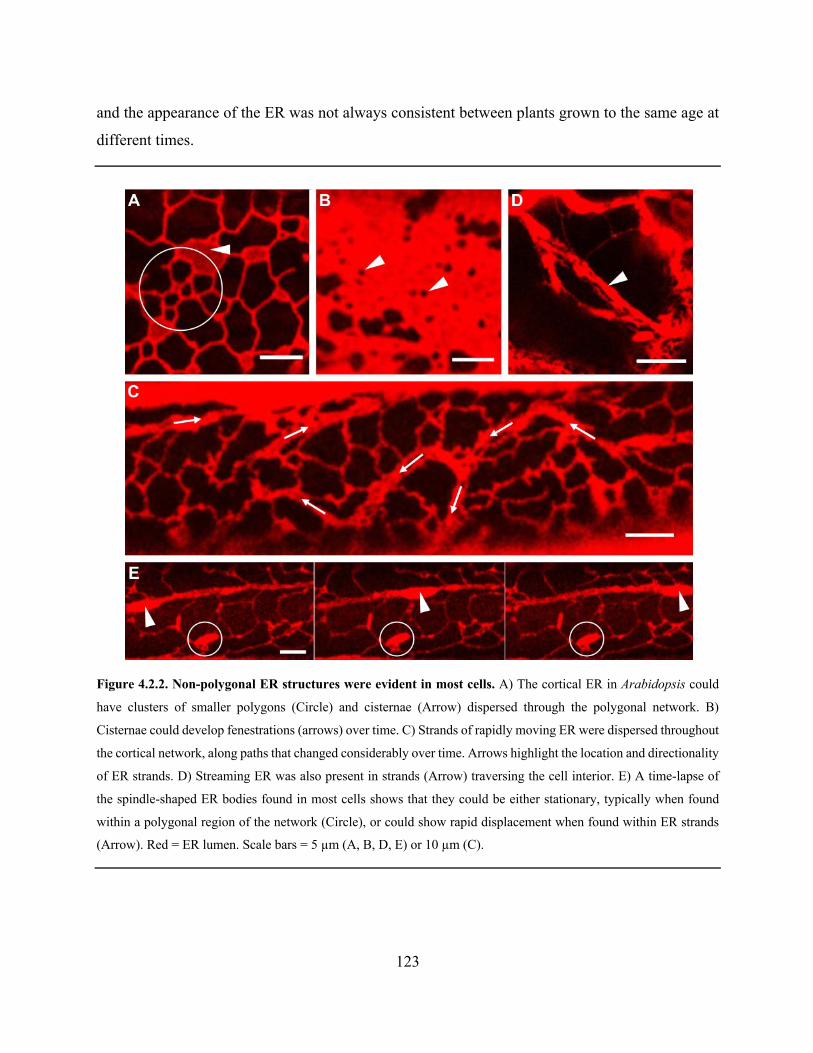
123
and the appearance of the ER was not always consistent between plants grown to the same age at
different times.
Figure 4.2.2. Non-polygonal ER structures were evident in most cells. A) The cortical ER in Arabidopsis could
have clusters of smaller polygons (Circle) and cisternae (Arrow) dispersed through the polygonal network. B)
Cisternae could develop fenestrations (arrows) over time. C) Strands of rapidly moving ER were dispersed throughout
the cortical network, along paths that changed considerably over time. Arrows highlight the location and directionality
of ER strands. D) Streaming ER was also present in strands (Arrow) traversing the cell interior. E) A time-lapse of
the spindle-shaped ER bodies found in most cells shows that they could be either stationary, typically when found
within a polygonal region of the network (Circle), or could show rapid displacement when found within ER strands
(Arrow). Red = ER lumen. Scale bars = 5 µm (A, B, D, E) or 10 µm (C).
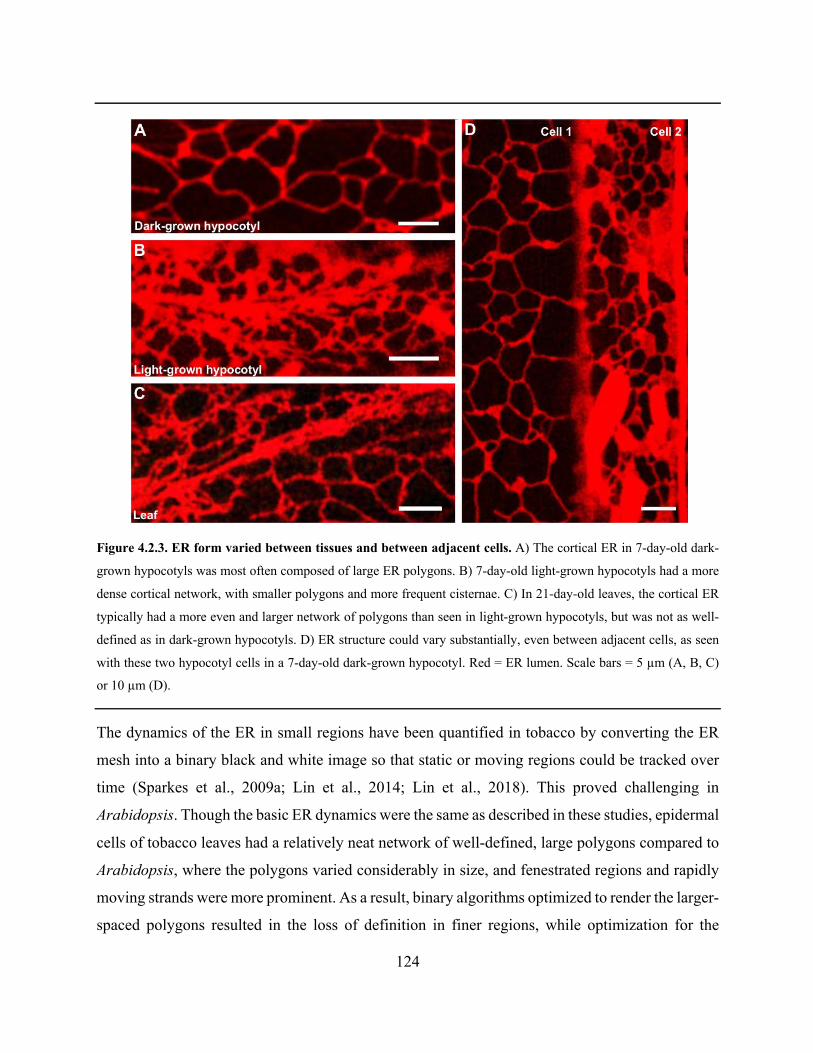
124
Figure 4.2.3. ER form varied between tissues and between adjacent cells. A) The cortical ER in 7-day-old dark-
grown hypocotyls was most often composed of large ER polygons. B) 7-day-old light-grown hypocotyls had a more
dense cortical network, with smaller polygons and more frequent cisternae. C) In 21-day-old leaves, the cortical ER
typically had a more even and larger network of polygons than seen in light-grown hypocotyls, but was not as well-
defined as in dark-grown hypocotyls. D) ER structure could vary substantially, even between adjacent cells, as seen
with these two hypocotyl cells in a 7-day-old dark-grown hypocotyl. Red = ER lumen. Scale bars = 5 µm (A, B, C)
or 10 µm (D).
The dynamics of the ER in small regions have been quantified in tobacco by converting the ER
mesh into a binary black and white image so that static or moving regions could be tracked over
time (Sparkes et al., 2009a; Lin et al., 2014; Lin et al., 2018). This proved challenging in
Arabidopsis. Though the basic ER dynamics were the same as described in these studies, epidermal
cells of tobacco leaves had a relatively neat network of well-defined, large polygons compared to
Arabidopsis, where the polygons varied considerably in size, and fenestrated regions and rapidly
moving strands were more prominent. As a result, binary algorithms optimized to render the larger-
spaced polygons resulted in the loss of definition in finer regions, while optimization for the
125
smaller regions or fenestrations resulted in the loss of connectivity in the larger polygons. Further,
our RFP:ER probe had a low signal-to-noise ratio in most cells, resulting in a high background
signal that complicated computerized detection of faint tubules. For these reasons, fine ER
dynamics were not quantified for comparison in most experiments, and average ER polygon size
was instead used to identify large-scale differences in ER structure.
Based on the observed differences in ER structure between tissues, a relationship between more
expanded cells and an ER network with large, clearly defined polygons appeared to exist. As our
observations had shown that 7-day-old seedlings grown in light or in dark had considerable
differences in ER appearance, we used these conditions to evaluate whether this correlated with a
difference in cell size. Further, plants were grown for 4 days in the dark, then gradually transitioned
to light over 3 days as an intermediate condition. The average area, length, width and ER polygon
area of the hypocotyl epidermal cells were measured for each growth condition. With the exception
of cell width, which was thinner in the dark than in the light, the cells showed comparable areas,
lengths, and widths across the three conditions (Fig. 4.2.4A). Despite these similarities in cell size,
ER polygon size was different in each treatment. Dark grown plants had the largest polygon area
(13.0 ± 3.1µm), light grown plants had the smallest (3.6 ± 0.4µm) and dark-to-light transitioned
plants had an intermediate polygon area (6.5 ± 1.2µm; Fig. 4.2.4B,C). The size of the ER polygons
therefore appeared to change with the differing growth conditions, rather than correlating
specifically with cell size.
Figure 4.2.4. (Next Page) ER polygon size correlated with growth condition rather than cell size. A) Arabidopsis
seedlings were grown for 7 days under 100 µmol m-2 s-1 light, for 7 days in the dark, or transitioned to light for three
days after four days in dark. Hypocotyl epidermal cells had similar epidermal cell areas, cell widths and cell lengths
between treatments under our growth conditions, with the increased cell width in light grown plants compared to dark
grown ones being the only significant difference (p=0.011, N=3). B) Average ER polygon area differed among the
treatments. Dark grown plants had larger polygons than either the light-grown plants (p<0.001; N=3) or transitioned
plants (p<0.001; N=3), and light-grown plants had smaller ER polygons than transitioned plants (p=0.027; N=3). C)
Representative images of the ER in each treatment highlight the different ER appearances, with large polygons in
dark-grown plants, small polygons in light-grown plants and intermediate sized polygons in plants transitioned from
dark to light. Error bars represent the 95% confidence interval of the mean. Letters represent statistically significant
groups (p<0.05). N=3 represents 3 plants, with 20 cells (A) or 150-200 ER polygons (B) measured per plant. Red =
ER lumen. Scale bars = 5 µm.
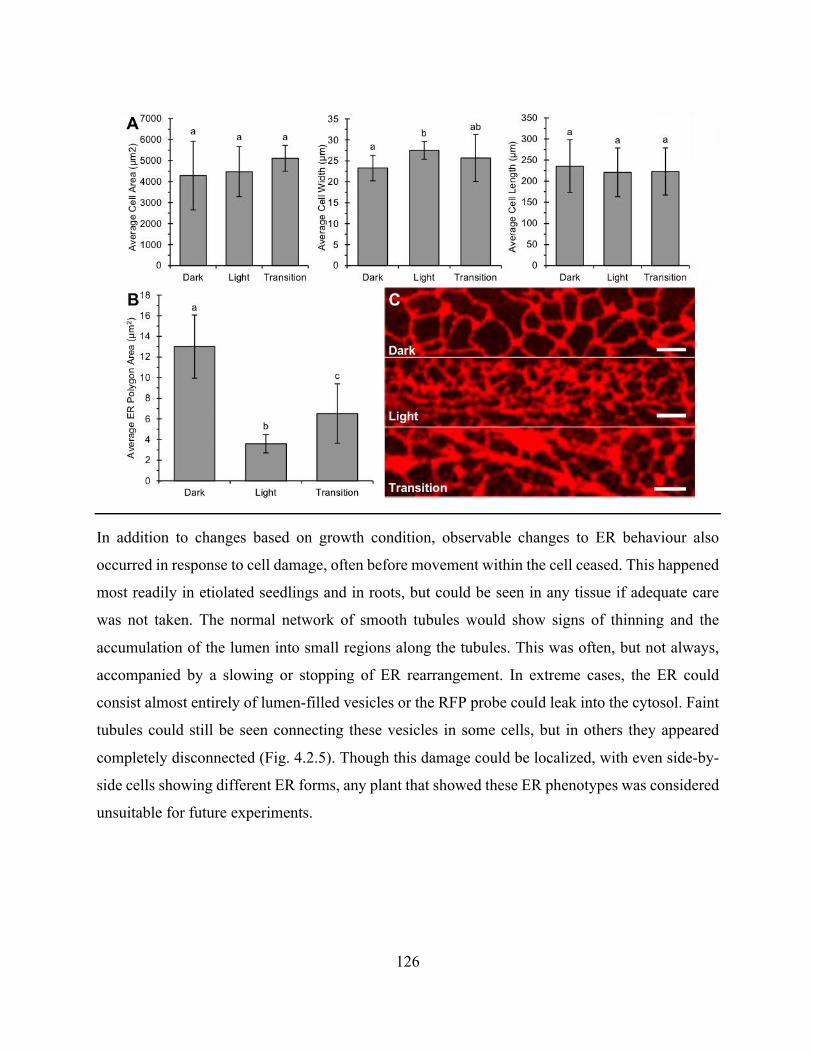
126
In addition to changes based on growth condition, observable changes to ER behaviour also
occurred in response to cell damage, often before movement within the cell ceased. This happened
most readily in etiolated seedlings and in roots, but could be seen in any tissue if adequate care
was not taken. The normal network of smooth tubules would show signs of thinning and the
accumulation of the lumen into small regions along the tubules. This was often, but not always,
accompanied by a slowing or stopping of ER rearrangement. In extreme cases, the ER could
consist almost entirely of lumen-filled vesicles or the RFP probe could leak into the cytosol. Faint
tubules could still be seen connecting these vesicles in some cells, but in others they appeared
completely disconnected (Fig. 4.2.5). Though this damage could be localized, with even side-by-
side cells showing different ER forms, any plant that showed these ER phenotypes was considered
unsuitable for future experiments.
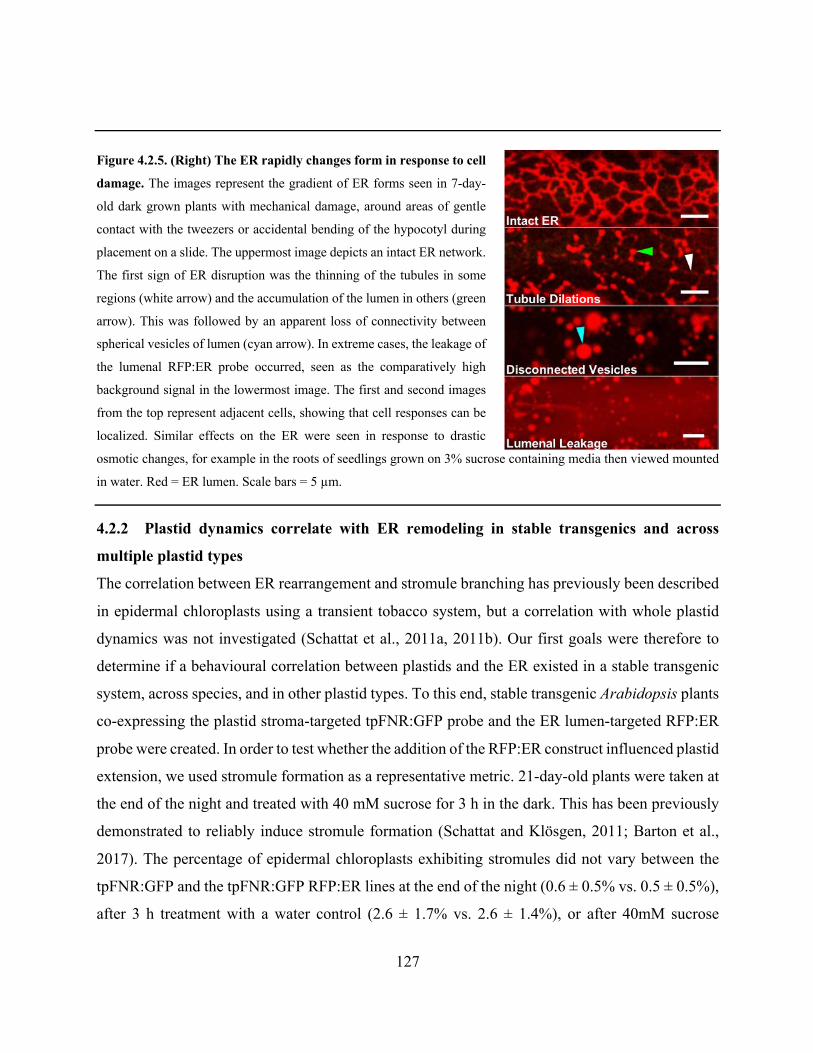
127
Figure 4.2.5. (Right) The ER rapidly changes form in response to cell
damage. The images represent the gradient of ER forms seen in 7-day-
old dark grown plants with mechanical damage, around areas of gentle
contact with the tweezers or accidental bending of the hypocotyl during
placement on a slide. The uppermost image depicts an intact ER network.
The first sign of ER disruption was the thinning of the tubules in some
regions (white arrow) and the accumulation of the lumen in others (green
arrow). This was followed by an apparent loss of connectivity between
spherical vesicles of lumen (cyan arrow). In extreme cases, the leakage of
the lumenal RFP:ER probe occurred, seen as the comparatively high
background signal in the lowermost image. The first and second images
from the top represent adjacent cells, showing that cell responses can be
localized. Similar effects on the ER were seen in response to drastic
osmotic changes, for example in the roots of seedlings grown on 3% sucrose containing media then viewed mounted
in water. Red = ER lumen. Scale bars = 5 µm.
4.2.2 Plastid dynamics correlate with ER remodeling in stable transgenics and across
multiple plastid types
The correlation between ER rearrangement and stromule branching has previously been described
in epidermal chloroplasts using a transient tobacco system, but a correlation with whole plastid
dynamics was not investigated (Schattat et al., 2011a, 2011b). Our first goals were therefore to
determine if a behavioural correlation between plastids and the ER existed in a stable transgenic
system, across species, and in other plastid types. To this end, stable transgenic Arabidopsis plants
co-expressing the plastid stroma-targeted tpFNR:GFP probe and the ER lumen-targeted RFP:ER
probe were created. In order to test whether the addition of the RFP:ER construct influenced plastid
extension, we used stromule formation as a representative metric. 21-day-old plants were taken at
the end of the night and treated with 40 mM sucrose for 3 h in the dark. This has been previously
demonstrated to reliably induce stromule formation (Schattat and Klösgen, 2011; Barton et al.,
2017). The percentage of epidermal chloroplasts exhibiting stromules did not vary between the
tpFNR:GFP and the tpFNR:GFP RFP:ER lines at the end of the night (0.6 ± 0.5% vs. 0.5 ± 0.5%),
after 3 h treatment with a water control (2.6 ± 1.7% vs. 2.6 ± 1.4%), or after 40mM sucrose
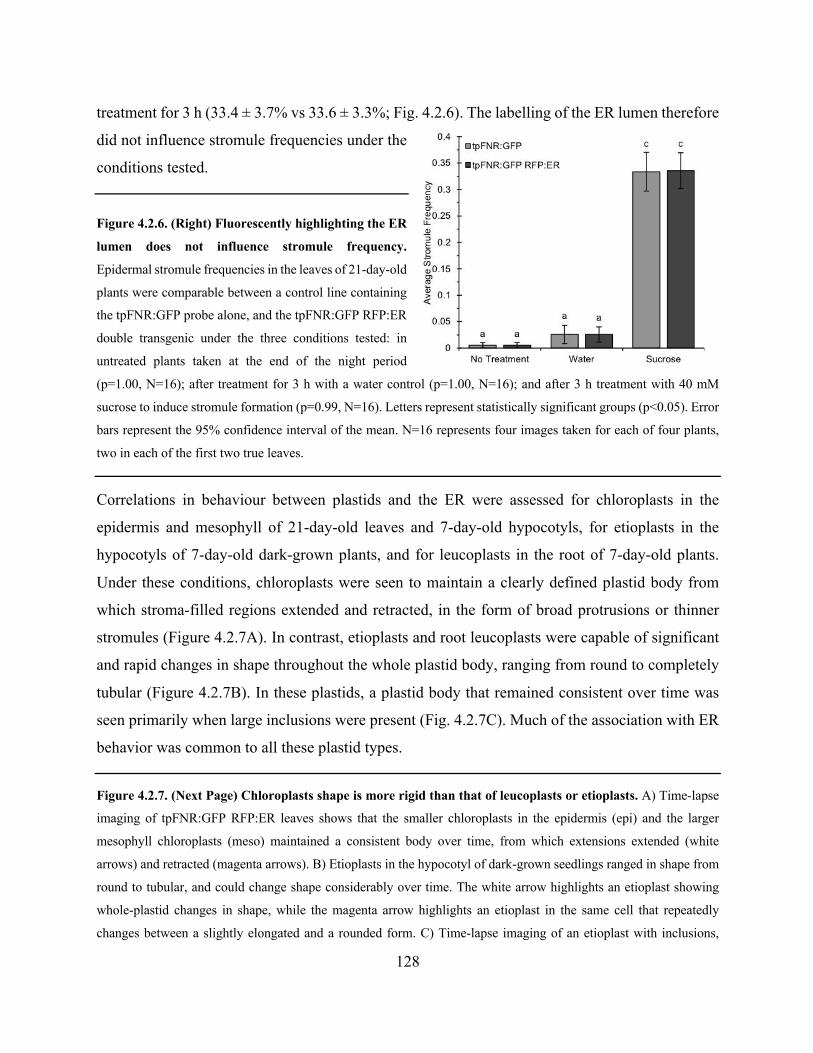
128
treatment for 3 h (33.4 ± 3.7% vs 33.6 ± 3.3%; Fig. 4.2.6). The labelling of the ER lumen therefore
did not influence stromule frequencies under the
conditions tested.
Figure 4.2.6. (Right) Fluorescently highlighting the ER
lumen does not influence stromule frequency.
Epidermal stromule frequencies in the leaves of 21-day-old
plants were comparable between a control line containing
the tpFNR:GFP probe alone, and the tpFNR:GFP RFP:ER
double transgenic under the three conditions tested: in
untreated plants taken at the end of the night period
(p=1.00, N=16); after treatment for 3 h with a water control (p=1.00, N=16); and after 3 h treatment with 40 mM
sucrose to induce stromule formation (p=0.99, N=16). Letters represent statistically significant groups (p<0.05). Error
bars represent the 95% confidence interval of the mean. N=16 represents four images taken for each of four plants,
two in each of the first two true leaves.
Correlations in behaviour between plastids and the ER were assessed for chloroplasts in the
epidermis and mesophyll of 21-day-old leaves and 7-day-old hypocotyls, for etioplasts in the
hypocotyls of 7-day-old dark-grown plants, and for leucoplasts in the root of 7-day-old plants.
Under these conditions, chloroplasts were seen to maintain a clearly defined plastid body from
which stroma-filled regions extended and retracted, in the form of broad protrusions or thinner
stromules (Figure 4.2.7A). In contrast, etioplasts and root leucoplasts were capable of significant
and rapid changes in shape throughout the whole plastid body, ranging from round to completely
tubular (Figure 4.2.7B). In these plastids, a plastid body that remained consistent over time was
seen primarily when large inclusions were present (Fig. 4.2.7C). Much of the association with ER
behavior was common to all these plastid types.
Figure 4.2.7. (Next Page) Chloroplasts shape is more rigid than that of leucoplasts or etioplasts. A) Time-lapse
imaging of tpFNR:GFP RFP:ER leaves shows that the smaller chloroplasts in the epidermis (epi) and the larger
mesophyll chloroplasts (meso) maintained a consistent body over time, from which extensions extended (white
arrows) and retracted (magenta arrows). B) Etioplasts in the hypocotyl of dark-grown seedlings ranged in shape from
round to tubular, and could change shape considerably over time. The white arrow highlights an etioplast showing
whole-plastid changes in shape, while the magenta arrow highlights an etioplast in the same cell that repeatedly
changes between a slightly elongated and a rounded form. C) Time-lapse imaging of an etioplast with inclusions,
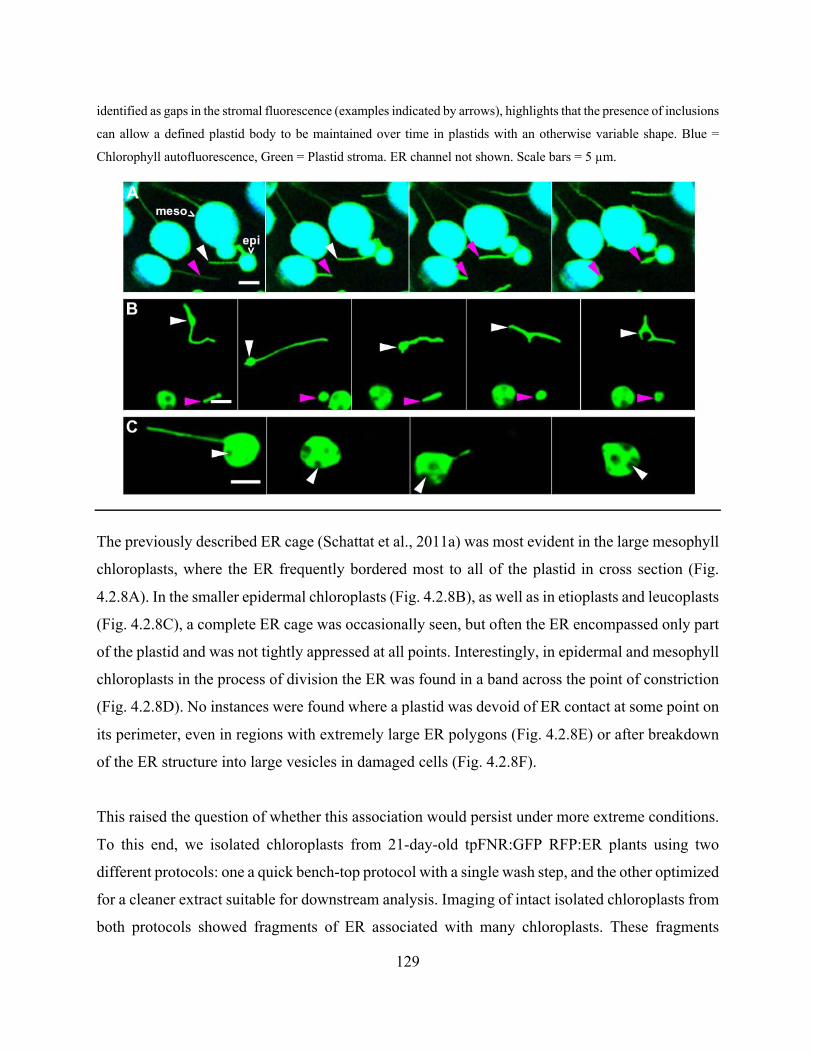
129
identified as gaps in the stromal fluorescence (examples indicated by arrows), highlights that the presence of inclusions
can allow a defined plastid body to be maintained over time in plastids with an otherwise variable shape. Blue =
Chlorophyll autofluorescence, Green = Plastid stroma. ER channel not shown. Scale bars = 5 µm.
The previously described ER cage (Schattat et al., 2011a) was most evident in the large mesophyll
chloroplasts, where the ER frequently bordered most to all of the plastid in cross section (Fig.
4.2.8A). In the smaller epidermal chloroplasts (Fig. 4.2.8B), as well as in etioplasts and leucoplasts
(Fig. 4.2.8C), a complete ER cage was occasionally seen, but often the ER encompassed only part
of the plastid and was not tightly appressed at all points. Interestingly, in epidermal and mesophyll
chloroplasts in the process of division the ER was found in a band across the point of constriction
(Fig. 4.2.8D). No instances were found where a plastid was devoid of ER contact at some point on
its perimeter, even in regions with extremely large ER polygons (Fig. 4.2.8E) or after breakdown
of the ER structure into large vesicles in damaged cells (Fig. 4.2.8F).
This raised the question of whether this association would persist under more extreme conditions.
To this end, we isolated chloroplasts from 21-day-old tpFNR:GFP RFP:ER plants using two
different protocols: one a quick bench-top protocol with a single wash step, and the other optimized
for a cleaner extract suitable for downstream analysis. Imaging of intact isolated chloroplasts from
both protocols showed fragments of ER associated with many chloroplasts. These fragments

130
ranged in size from small dots or patches on the perimeter (Fig. 4.2.9A) to pieces large enough to
surround a significant portion of a chloroplast. The larger ER structures associated with the
chloroplasts could appear as a solid mass (Fig. 4.2.9B), retain the appearance of a polygonal ER
cage (Fig. 4.2.9C), or show a combination of these two forms (Fig. 4.2.9D). Associated ER could
be seen on both mesophyll chloroplasts, and on chloroplasts most likely from the epidermis based
on their smaller size and dense stroma (Fig. 4.2.9E). This association was maintained after the
integrity of the chloroplast membrane was compromised, as the ER vesicles remained in the same
position if a chloroplast ruptured during imaging (Fig. 4.2.9F). In extremely rare cases, a stromule
(Fig. 4.2.10A) or short protrusion on an isolated chloroplast was seen (Fig. 4.2.10B); however,
these structures were either static or showed dynamics distinct from those typically seen inside a
cell, swaying about freely in regions where the liquid on the slide was moving (Fig. 4.2.10C). We
did not observe the formation of any new extensions and saw only existing structures. The ER and
the plastid therefore appeared to share a connection of sufficient strength to survive the isolation
process intact.
Figure 4.2.8. (Next Page) The ER associates with various plastid types in stable transgenic Arabidopsis plants
with labelled ER lumen and plastid stroma. A) The ER in tpFNR:GFP RFP:ER plants formed a complete cage
around most mesophyll chloroplasts when observed in cross-section (Arrow). B) The ER around epidermal
chloroplasts could form an almost complete cage (upper), or could be more loosely associated (lower). C) Etioplasts
in dark grown seedlings could be completely (upper) or partially (lower) encased by the ER. The arrow in the lower
image indicates a region where the ER aligns with only one side of the elongated etioplast. D) Dividing chloroplasts
in the mesophyll (left) and the epidermis (right), identified by their bi-lobed form, had a band of ER across the point
of constriction (arrows). E) Plastids were seen to associated with the ER even in regions with extremely large
polygons, as seen in the hypocotyls of dark grown plants. F) The ER-plastid association was maintained in cells where
ER breakdown had occurred, seen as small vesicles of ER lumen associated with the plastid surface (arrows). Images
A-D show both the merged (plastid-ER) channel and individual ER channel for comparison. Red = ER lumen, Green
= Plastid stroma (Str), Blue = Chlorophyll autofluorescence (Chl). Scale bars = 5 µm.
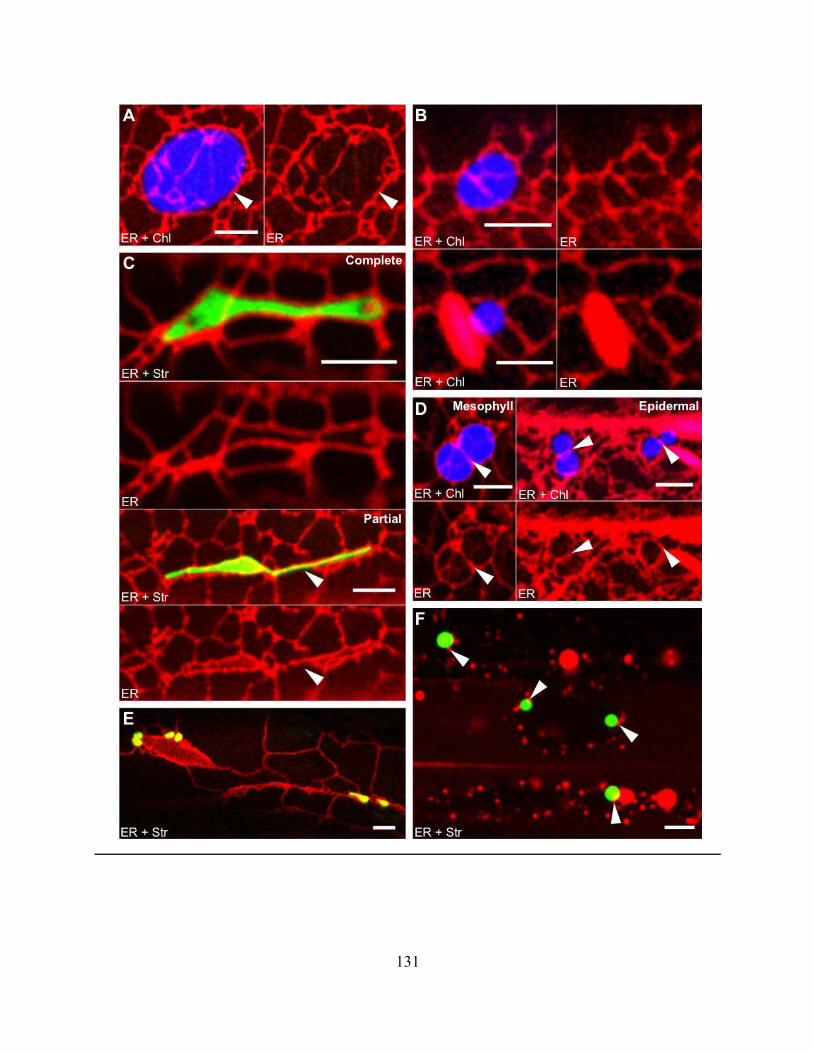
131
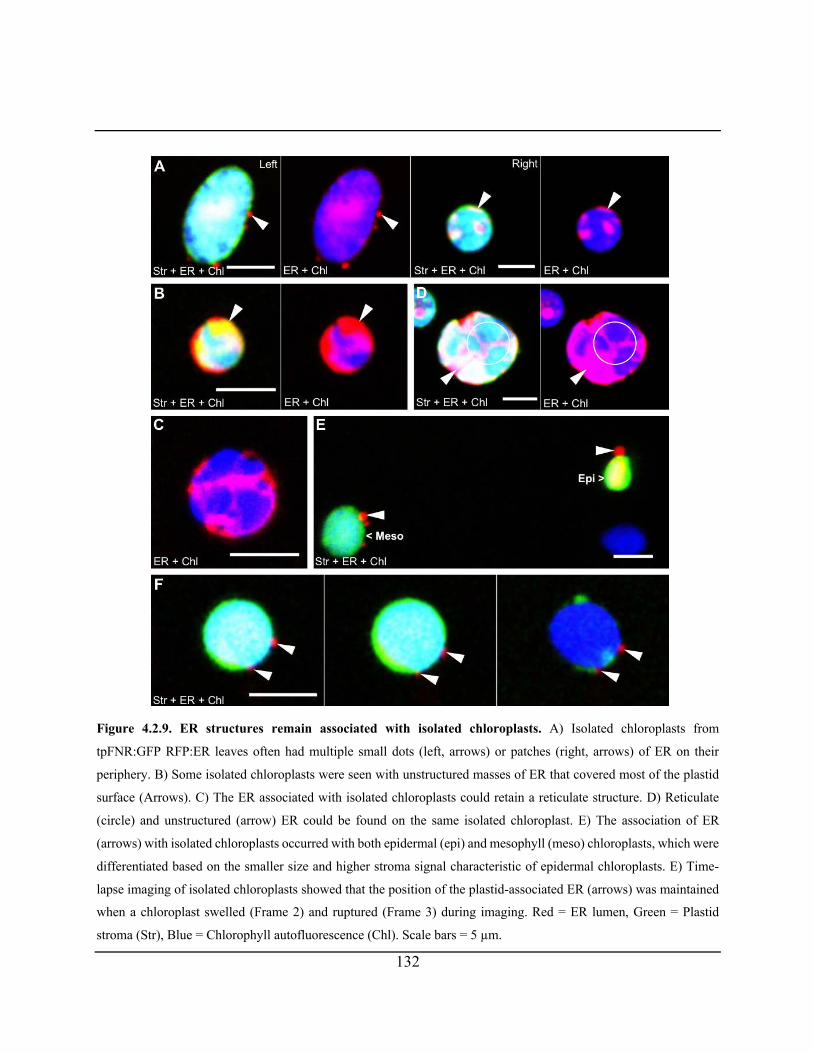
132
Figure 4.2.9. ER structures remain associated with isolated chloroplasts. A) Isolated chloroplasts from
tpFNR:GFP RFP:ER leaves often had multiple small dots (left, arrows) or patches (right, arrows) of ER on their
periphery. B) Some isolated chloroplasts were seen with unstructured masses of ER that covered most of the plastid
surface (Arrows). C) The ER associated with isolated chloroplasts could retain a reticulate structure. D) Reticulate
(circle) and unstructured (arrow) ER could be found on the same isolated chloroplast. E) The association of ER
(arrows) with isolated chloroplasts occurred with both epidermal (epi) and mesophyll (meso) chloroplasts, which were
differentiated based on the smaller size and higher stroma signal characteristic of epidermal chloroplasts. E) Time-
lapse imaging of isolated chloroplasts showed that the position of the plastid-associated ER (arrows) was maintained
when a chloroplast swelled (Frame 2) and ruptured (Frame 3) during imaging. Red = ER lumen, Green = Plastid
stroma (Str), Blue = Chlorophyll autofluorescence (Chl). Scale bars = 5 µm.
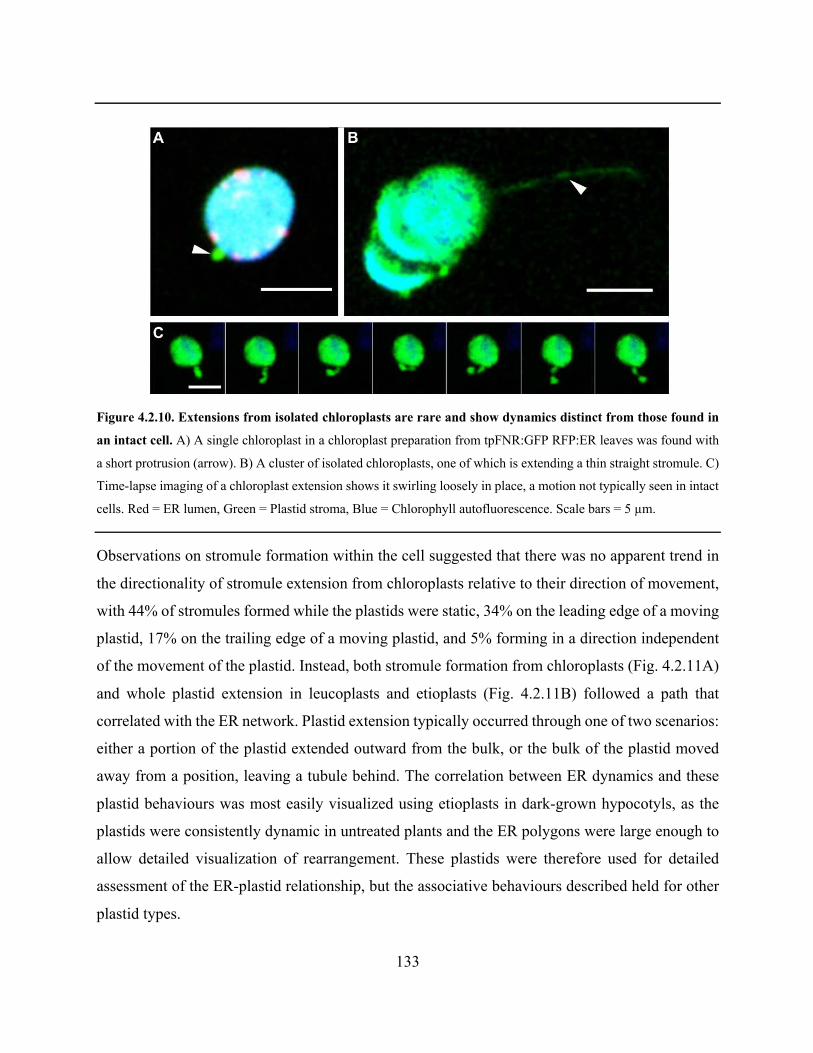
133
Figure 4.2.10. Extensions from isolated chloroplasts are rare and show dynamics distinct from those found in
an intact cell. A) A single chloroplast in a chloroplast preparation from tpFNR:GFP RFP:ER leaves was found with
a short protrusion (arrow). B) A cluster of isolated chloroplasts, one of which is extending a thin straight stromule. C)
Time-lapse imaging of a chloroplast extension shows it swirling loosely in place, a motion not typically seen in intact
cells. Red = ER lumen, Green = Plastid stroma, Blue = Chlorophyll autofluorescence. Scale bars = 5 µm.
Observations on stromule formation within the cell suggested that there was no apparent trend in
the directionality of stromule extension from chloroplasts relative to their direction of movement,
with 44% of stromules formed while the plastids were static, 34% on the leading edge of a moving
plastid, 17% on the trailing edge of a moving plastid, and 5% forming in a direction independent
of the movement of the plastid. Instead, both stromule formation from chloroplasts (Fig. 4.2.11A)
and whole plastid extension in leucoplasts and etioplasts (Fig. 4.2.11B) followed a path that
correlated with the ER network. Plastid extension typically occurred through one of two scenarios:
either a portion of the plastid extended outward from the bulk, or the bulk of the plastid moved
away from a position, leaving a tubule behind. The correlation between ER dynamics and these
plastid behaviours was most easily visualized using etioplasts in dark-grown hypocotyls, as the
plastids were consistently dynamic in untreated plants and the ER polygons were large enough to
allow detailed visualization of rearrangement. These plastids were therefore used for detailed
assessment of the ER-plastid relationship, but the associative behaviours described held for other
plastid types.

134
Figure 4.2.11. Plastid extension correlates with the movement of ER tubules in multiple plastid types. A) Time-
lapse imaging of a mesophyll chloroplast in tpFNR:GFP RFP:ER leaves shows a stromule (white arrows) extending
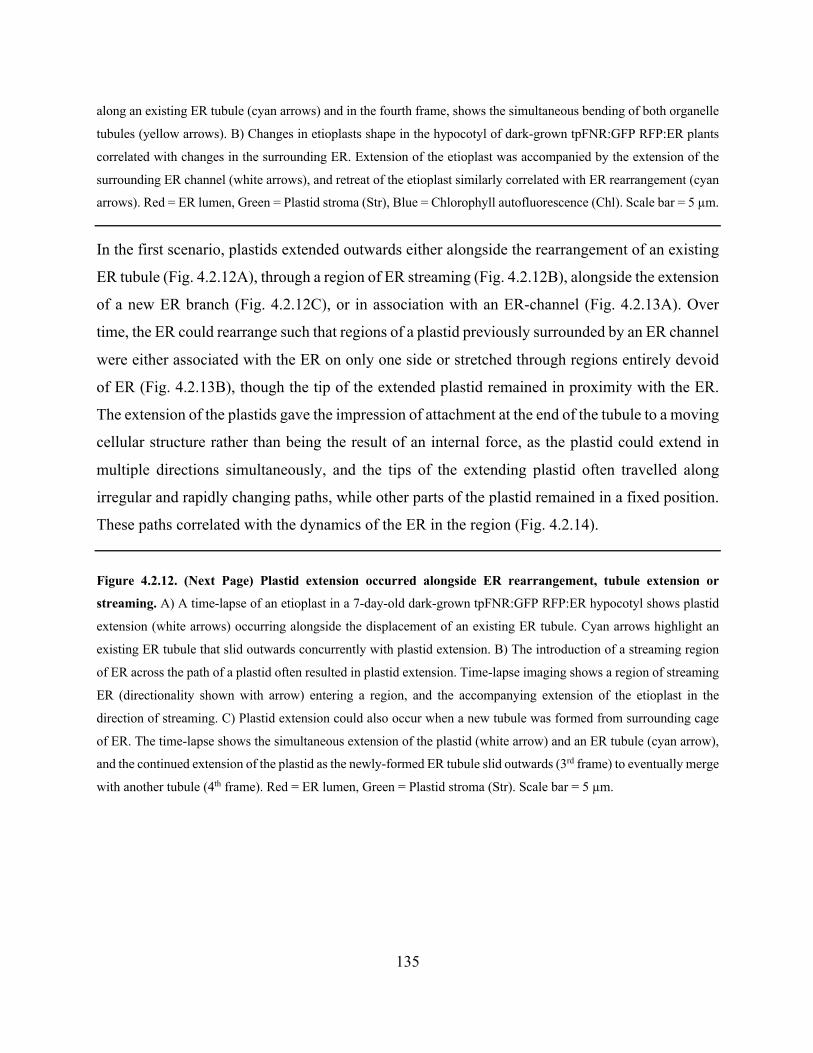
135
along an existing ER tubule (cyan arrows) and in the fourth frame, shows the simultaneous bending of both organelle
tubules (yellow arrows). B) Changes in etioplasts shape in the hypocotyl of dark-grown tpFNR:GFP RFP:ER plants
correlated with changes in the surrounding ER. Extension of the etioplast was accompanied by the extension of the
surrounding ER channel (white arrows), and retreat of the etioplast similarly correlated with ER rearrangement (cyan
arrows). Red = ER lumen, Green = Plastid stroma (Str), Blue = Chlorophyll autofluorescence (Chl). Scale bar = 5 µm.
In the first scenario, plastids extended outwards either alongside the rearrangement of an existing
ER tubule (Fig. 4.2.12A), through a region of ER streaming (Fig. 4.2.12B), alongside the extension
of a new ER branch (Fig. 4.2.12C), or in association with an ER-channel (Fig. 4.2.13A). Over
time, the ER could rearrange such that regions of a plastid previously surrounded by an ER channel
were either associated with the ER on only one side or stretched through regions entirely devoid
of ER (Fig. 4.2.13B), though the tip of the extended plastid remained in proximity with the ER.
The extension of the plastids gave the impression of attachment at the end of the tubule to a moving
cellular structure rather than being the result of an internal force, as the plastid could extend in
multiple directions simultaneously, and the tips of the extending plastid often travelled along
irregular and rapidly changing paths, while other parts of the plastid remained in a fixed position.
These paths correlated with the dynamics of the ER in the region (Fig. 4.2.14).
Figure 4.2.12. (Next Page) Plastid extension occurred alongside ER rearrangement, tubule extension or
streaming. A) A time-lapse of an etioplast in a 7-day-old dark-grown tpFNR:GFP RFP:ER hypocotyl shows plastid
extension (white arrows) occurring alongside the displacement of an existing ER tubule. Cyan arrows highlight an
existing ER tubule that slid outwards concurrently with plastid extension. B) The introduction of a streaming region
of ER across the path of a plastid often resulted in plastid extension. Time-lapse imaging shows a region of streaming
ER (directionality shown with arrow) entering a region, and the accompanying extension of the etioplast in the
direction of streaming. C) Plastid extension could also occur when a new tubule was formed from surrounding cage
of ER. The time-lapse shows the simultaneous extension of the plastid (white arrow) and an ER tubule (cyan arrow),
and the continued extension of the plastid as the newly-formed ER tubule slid outwards (3rd frame) to eventually merge
with another tubule (4th frame). Red = ER lumen, Green = Plastid stroma (Str). Scale bar = 5 µm.
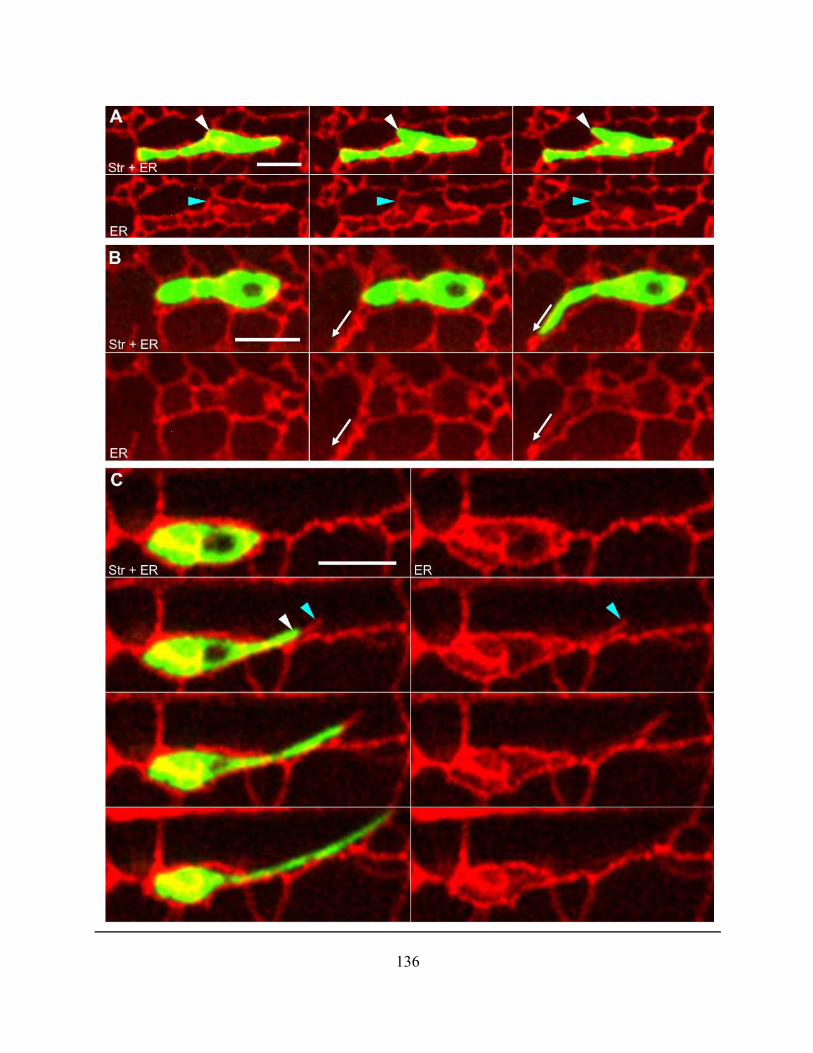
136
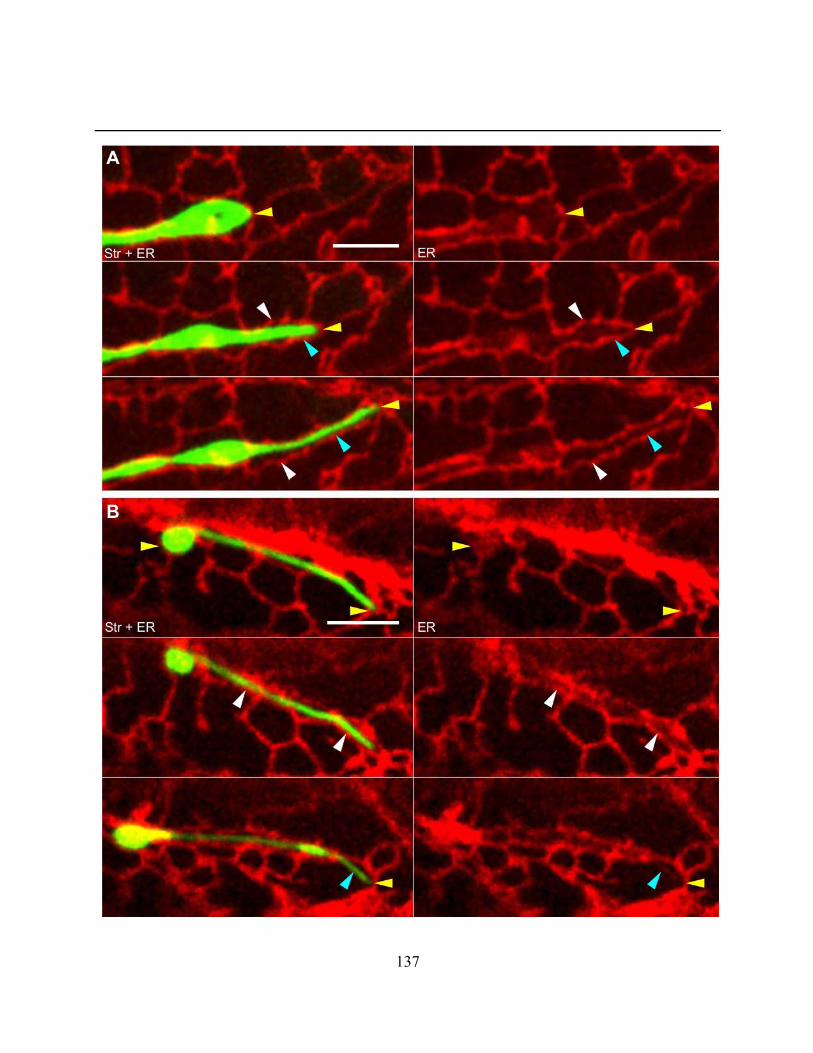
137

138
Figure 4.2.13. (Previous Page) Plastid extension could occur alongside the formation of an ER channel, but
channels could also form and dissolve around a previously extended region of a plastid. A) A time-lapse shows
extension of an etioplast concurrent with the formation of an ER channel in the hypocotyl of a 7-day-old dark grown
tpFNR:GFP RFP:ER seedling. The ER could be loosely associated with (white arrow) or tightly appressed to (cyan
arrow) the plastid, but the tip of the plastid remained in
proximity with the ER (magenta arrow). B) An elongated
etioplast that was temporarily static during time-lapse
imaging showed that the ER could rearrange to form a
channel where none previously existed (white arrows) or an
existing ER channel could dissolve such that the plastid had
regions with no apparent ER association (cyan arrows). The
ends of the plastid however remained adjacent to the ER
(yellow arrows) even when other portions of the plastid had
no ER association. Red = ER lumen, Green = Plastid stroma
(Str). Scale bar = 5 µm.
Figure 4.2.14. (Right) Plastid elongation occurs along
irregular paths suggestive of an external directional
force. An etioplast near the junction of two streaming
regions of ER shows recurring extension and retraction
along an essentially triangular path. The impression gained
is of attachment to a moving structure at the tip of the
plastid, with repeated plastid extension up the vertical ER
stream, followed by retraction to the fixed position of the
plastid body, then extension along the horizontal ER stream
until the vertical stream is again encountered. In the final
frame, plastid extension occurred beyond the vertical ER
stream, with only a slight upward bend indicating its
position (magenta arrow). White arrows highlight direction
of plastid movement in the frame, cyan arrows highlight the
regions and directionality of ER streaming. Red = ER
lumen, Green = Plastid stroma (Str). Scale bar = 5 µm.
The second scenario of plastid extension, where the bulk of a plastid moved away and a stromule
remained behind, was more easily visualized in chloroplasts due to the consistent plastid body.
This scenario arose most frequently when a rapidly streaming ER strand encountered a plastid.

139
Though this often resulted in the rapid displacement of the
entire plastid, occasionally a portion remained anchored at the
original position and was stretched into a tubule as the rest of
the plastid was pulled away with the rapidly moving ER (Fig.
4.2.15).
Figure 4.2.15. (Left) Plastid extension could occur when the plastid
body was pulled away from a fixed point, often correlating plastid
interaction with a rapidly streaming region of ER. An epidermal
chloroplast observed over time in the hypocotyl of a 7-day-old tpFNR:GFP
RFP:ER light grown plant shows the extension of a portion of a plastid
outwards from the body (white arrows), as well as the production of plastid
tubule as the body moves away from a fixed anchor point (cyan arrow). In
both cases, the extension occurred along a streaming region of ER
(directionality indicated by long arrow). Red = ER lumen, Green = Plastid
stroma, Blue = Chlorophyll autofluorescence. Scale bar = 5 µm.
The transient anchoring of plastids has been previously
described (Gunning et al., 2005) and it appeared from both the
scenarios of plastid extension described here that the plastids
were anchored at multiple points to a mobile cellular structure,
with these anchors underlying many aspects of plastid
dynamics. Without a marker to specifically highlight the
anchor points, it was not possible to conclusively determine
their number or how transient of a structure they represented, but anchor points could often be
identified through the way a plastid moved over time. If a streaming region of ER or a moving ER
body encountered a tubular plastid between two anchors, the plastid could briefly bow outwards
and highlight the two static points (Fig. 4.2.16A). Potential anchors could also be highlighted when
a plastid extended away from the long axis, or if a plastid was caught up in an ER stream and
stretched to highlight one or several anchor points. In some cases, the plastid stretched until it was
too thin to visualize but became visible again if it moved back towards the original anchor position,
suggesting the anchors were strong enough to counter a pulling force (Fig. 4.2.16B). It may
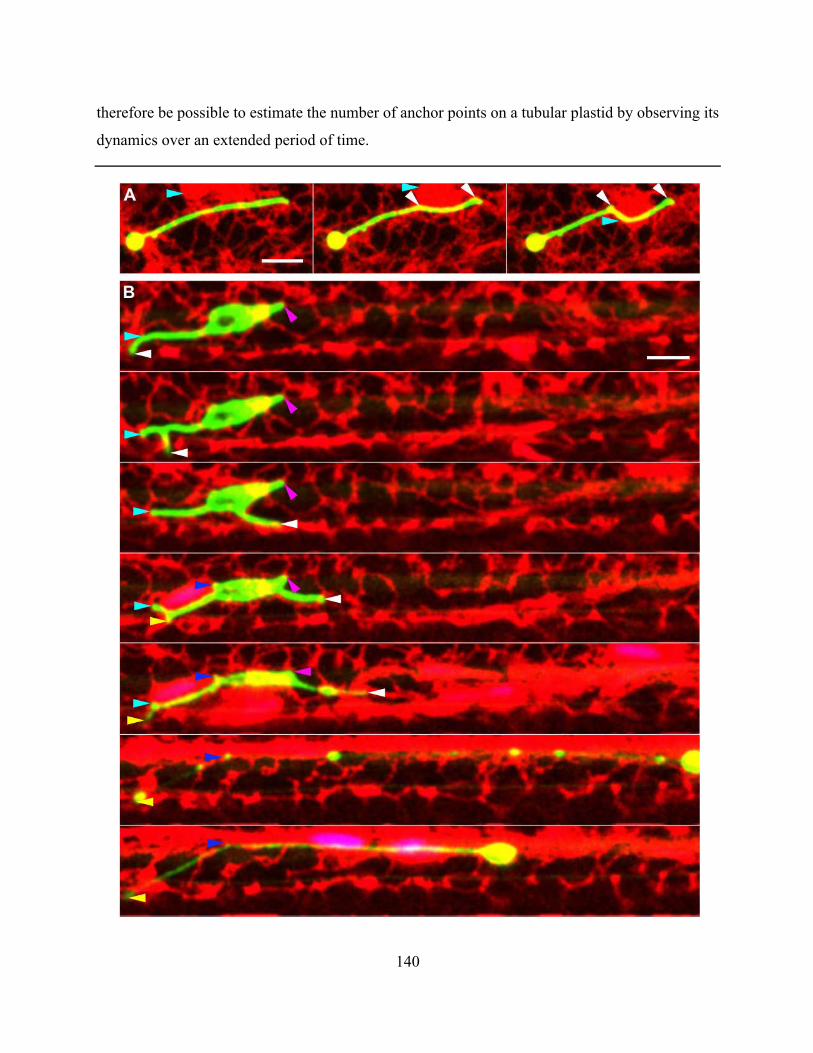
140
therefore be possible to estimate the number of anchor points on a tubular plastid by observing its
dynamics over an extended period of time.
141
Figure 4.2.16. (Previous Page) Plastid dynamics highlight the location of potential anchor points between the
plastids and another cellular structure. A) An etioplast in the hypocotyl of 7-day-old dark-grown tpFNR:GFP
RFP:ER reveals two anchor points (white arrows) as it bows due to the interaction with a passing ER body (cyan
arrow). B) Visualization of an etioplast over time reveals putative anchor points as it is pulled in several directions at
once or stretches out. The position of likely anchor points are highlighted in each frame, with arrows of the same color
in multiple frames indicating the same anchor point as it moved over time. Anchor points are no longer highlighted
once their position is not evident from plastid behavior. As seen in the final two frames, plastids could extend a
considerable distance when caught up in a streaming region of ER, stretching until the plastid was thin enough for the
stroma to be barely visible, but would then snap back. The snapback motion suggested that the anchor point pulling
the plastid outwards may have disconnected, allowing the plastid to move back in the direction of its original position,
maintained by other anchor points. It appeared that the anchor points all corresponded with an position where the ER
and plastid were in close proximity, though in some cases the tip of the plastid was out of focus and the correlation
could not be clearly resolved (white arrow in the second frame, yellow arrow in the last two frames). Red = ER lumen,
Green = Plastid stroma (Str). Scale bars = 5 µm.
Based on time-lapse videos of 10 tubular etioplasts, there was an average of 5.4 ± 1.4 anchor points
per plastid. This however assumes that the tip of every extension that occurred over time, as well
as any other fixed point seen during plastid movement, represents an anchor point that remained
consistent in position on the plastid over time and that all anchor points were highlighted during
the imaging period. The estimates may therefore not be precise, as the points are only highlighted
in dynamic regions of a plastid and might change in number or position during the viewing period.
For example, when plastids retracted it could occur as a gradual shift in position, typically with
the tip of the plastid remaining in proximity to an ER tubule that was moving towards the plastid
body as the ER rearranged, or the plastid could snap back quickly, giving the impression of a rapid
release of tension. If the plastid is indeed anchored to the ER or another cellular structure, this
could be explained by the sudden release of the plastid from an anchor point, after which it could
either snap back to another anchor or to the plastid body (Fig. 4.2.17). The anchors visualized
almost always corresponded with the position of ER tubules near the plastid perimeter, though
rarely it was noted that a stromule could remain anchored after the ER was no longer visible in the
region. There was therefore a considerable degree of alignment between ER and plastid behaviour,
so we next investigated whether changes to ER structure could influence plastid form.

142
Figure 4.2.17. Plastid tubules could rapidly retract to either a secondary position that corresponded with an
ER tubule or all the way to the plastid body. A time-lapse of an etioplast in a dark-grown tpFNR:GFP RFP:ER
hypocotyl shows the tip of an extended region of a plastid quickly snapping back to a another position without the ER
rearranging in the direction of retraction, giving the impression of the sudden detachment of one anchor point and
retreat to another. This second point also corresponded to position where the plastid and ER were in close proximity
(cyan arrows). Afterwards, the plastid extension retained this position for a period of time before beginning to extend
outwards again. Eventually, the tip of the plastid once again rapidly retracted, but this time it returned all the way to
the plastid body. As it was snapping back, the tubule gained a wobbly appearance as though tension was lost, seen in
the second last frame. Red = ER lumen, Green = Plastid stroma (Str). Scale bars = 5 µm.
143
4.2.3 The degree of plastid extension correlates with changes to the size of the ER mesh
As previously mentioned, the area of the polygons that make up the ER mesh could differ between
tissues. In 7-day-old etiolated tpFNR:GFP RFP:ER plants, the ER in the hypocotyl was observed
to consist of larger polygons than in light grown plants of the same age. However, as etiolated
plants contained etioplasts and light grown plants contain chloroplasts, plastid elongation was not
comparable between these conditions. In our observation on dark grown plants, a gradient of
polygon sizes was seen progressing down the hypocotyl. This provided us with a system to assess
whether the size of the polygons in the ER network correlated with any changes to plastid
behaviour. Image stacks were taken at consistent positions approximately 100 µm, 900 µm, 1700
µm and 2500 µm from the point where the hypocotyl and cotyledons diverged in 7-day-old dark
grown plants. The average ER polygon size and shape ratio of the plastids (as defined in Section
3.2.2) in each region were measured. ER polygon size increased the greater the distance from the
cotyledons, with average polygon areas of 3.2 ± 4 µm2, 9.0 ± 6.3 µm2, 17.3 ± 8.2 µm2, and 27.4 ±
7.5 µm2 progressing from the upper to lower regions measured. The plastids became less elongated
the greater the distance from the cotyledons, with average shape ratios of 0.26 ± 0.08, 0.39 ± 0.07,
0.59 ± 0.09 and 0.65 ± 0.15 in the same regions (Fig. 4.2.18A). The presence of smaller ER
polygons therefore corresponded with more elongated plastids, while regions with ER larger
polygons were dominated by more rounded plastids (Fig. 4.2.18B). Analysis of individual
etioplasts and the ER surrounding them was undertaken to determine if this correlation held at a
subcellular level. The shape ratios of individual etioplasts distributed throughout an etiolated
hypocotyl were determined. For ease of comparison these shape ratio values, ranging from 0 to 1,
were divided into five even categories with Category 1 plastids being the most round (shape ratios
0.8 to 1) and Category 5 plastids the most elongated (shape ratios 0 to 0.2). The area of the ten ER
polygons nearest to each plastid was measured and averaged. When the plastid category was
plotted against the average ER polygon area around plastids in that category, it was found that
round plastids tended to be embedded within larger ER polygons, while more elongated plastids
tended to be embedded in smaller ER polygons (Fig. 4.2.18C). Increased ER polygon size
therefore corresponded with rounder etioplasts and smaller polygons with more elongated
etioplasts both within a region and at the level of individual etioplasts.
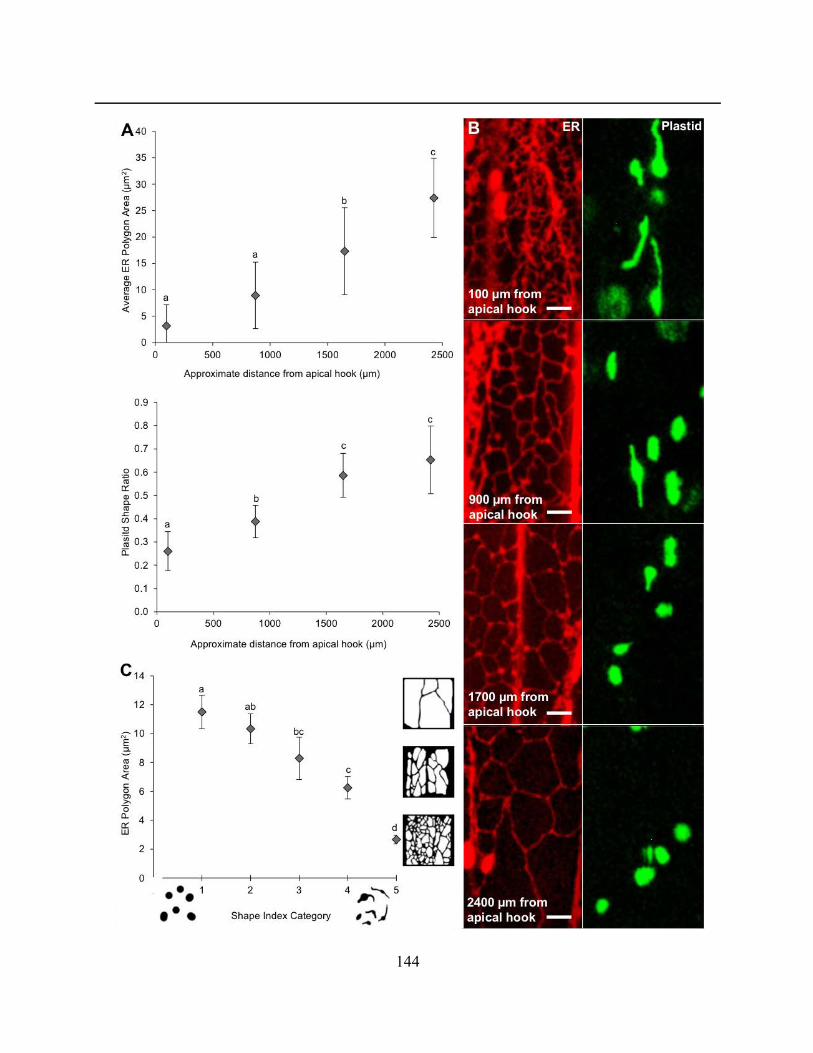
144
145
Figure 4.2.18. (Previous Page). Elongated etioplasts are associated with regions of smaller ER polygons. A) ER
polygon size and plastid shape were evaluated in four regions progressing down the hypocotyls of 7-day-old dark-
grown tpFNR:GFP RFP:ER seedlings. The shape ratio (average width at three points/length) of 50 etioplasts and the
area of 200 ER polygons was measured and averaged for each region in three seedlings. Progressing down the
hypocotyl from the apical hook, ER polygons (upper graph) became larger in size while etioplasts (lower graph)
became more round, as indicated by an increased shape ratio. B) Representative images of the ER (left) and etioplasts
(right) in the four hypocotyl regions with estimated distances from the apical hook, showing small ER polygons and
elongated plastids in the upper hypocotyl progressing to large ER polygons and rounded plastids as distance from the
apical hook increased. C) The relationship between ER polygon size and plastid shape was assessed at the individual
plastid level by determining the shape ratio of each plastid and measuring the area of the closest 10 ER polygons.
Plastid shape ratios were evenly divided into five categories to simplify visualization. The average ER polygon size
around round (Category 1) plastids was considerably larger than that around the most elongated (Category 5) plastids.
Red = ER lumen, Green = Plastid stroma. Scale bars = 5 µm. Error bars represent the 95% confidence interval of the
mean. Letters represent statistically significant groups (p<0.05). N=3 plants (A) or 75 plastids (C).
The correlation between plastid extension and the size of the polygons in the ER network was next
investigated in chloroplasts, to see if the trend held across plastid types. As sucrose induces
stromule formation, we used this treatment to assess any accompanying changes in ER structure.
21-day-old tpFNR:GFP RFP:ER plants were taken at the end of the night and either kept in soil in
the dark for 3h as an untreated control, treated for 3h with water, or treated for 3h with 40mM
sucrose. Epidermal stromule frequencies and ER polygon size were measured for each condition.
The percent of chloroplasts producing stromules was lowest in the untreated plants (1.4 ± 1.1%),
where the ER polygons were smallest (7.8 ± 1.1 µm). The water treated had slightly higher
stromule numbers (4.9 ± 2.8%), and slightly larger ER polygons (10.4 ± 2.5µm), while the sucrose
treated plants had the most stromules (37.6 ± 3.8%) and the largest ER polygons (15.5 ± 2.7µm;
Fig. 4.2.19A). As this trend was opposite to that seen with etioplasts, we assessed ER dynamics to
determine if a change occurred distinct from polygon size. The RFP:ER probe has a high
background signal, which made it poorly suited to assessment of ER dynamics. We therefore
created stable transgenic lines expressing a GFP:ER construct (Haseloff et al., 1997), for which
the imaging settings could be more easily optimized to reduce background noise. 21-day-old plants
were taken at the end of the night and imaged either untreated, or after treatment for 3h with water
or 40mM sucrose. For each treatment, 16 regions were evaluated, with four images taken at 30s
intervals in each. The images were then converted to binary images (black and white) and the
146
“Temporal Color Code” function in FIJI was used to compare the images from a region in pairs
(ie. Image 1 vs. Image 2; Image 2 vs. Image 3; Image 3 vs. Image 4). This function assigns a color
to each image and then overlays them. When two images are compared in this way, regions that
overlap and therefore have not changed in the 30s between images, appear white, while regions
that differ between the two images are colored (Fig. 4.2.19B). We could therefore measure the
percent of the area covered by the ER that remained unchanged in 30s and we averaged this
percentage across the three sequential image pairs to get an average percent for the region. This
gave us a representation of how active ER rearrangement was in an area. Using this technique, we
found that there was little difference in ER activity between the three conditions, with 54.8 ± 2.4%
of the ER remaining static in untreated plants, 56.9 ± 3.1% in water treated plants and 57.3 ± 4.0%
in sucrose treated plants (Fig. 4.2.19C). There was therefore no measured change in ER
rearrangement between sucrose treated plants and the controls, and in chloroplast containing-
tissues an increase in stromule frequency occurred in conjunction with a general increase in ER
polygon area; this trend was opposite of that seen for etioplasts. Analysis of the ER polygons
surrounding individual chloroplasts was complicated by the tendency of epidermal chloroplasts to
sit on the lower cell surface, where the ER in the epidermis and the mesophyll are
indistinguishable. Whether the trend held at the level of an individual chloroplast was therefore
not assessed.
Figure 4.2.19. (Next Page) Sucrose treatment increased chloroplast stromule frequency and ER polygon size,
but did not significantly impact ER rearrangement. A) Stromule frequencies in 21-day-old leaves increased
slightly after 3h water compared to the untreated control (p=0.009, N=16) as did the area of ER polygons at the upper
epidermal cell surface, though the change was not statistically significant for the ER (p=0.13, N=6). Sucrose treatment
resulted in an elevated stromule frequency relative to both controls (both p<0.001, N=16) as well as an increase in ER
polygon area (both p<0.002, N=6). B) The proportion of the ER that remained static over time was assessed by
individually colouring two images, taken 30 s apart, then overlaying the images. White regions represent places
occupied by the ER at both time-points, while coloured regions changed during the 30s between frames. C) The
proportion of static ER was quantified by obtaining percentage of all the ER pixels (non-black pixels) in the overlay
image that were white. A consistent percentage was found in untreated, 3h water treated and 3h 40mM sucrose treated
leaves, suggesting that ER rearrangement was similar between treatments (N=20). Error bars represent the 95%
confidence interval of the mean. Letters represent statistically significant groups (p<0.05). N=16 represents two
regions in each of the first two leaves of four plants. N=6 represents a single region in each of the first true leaves of
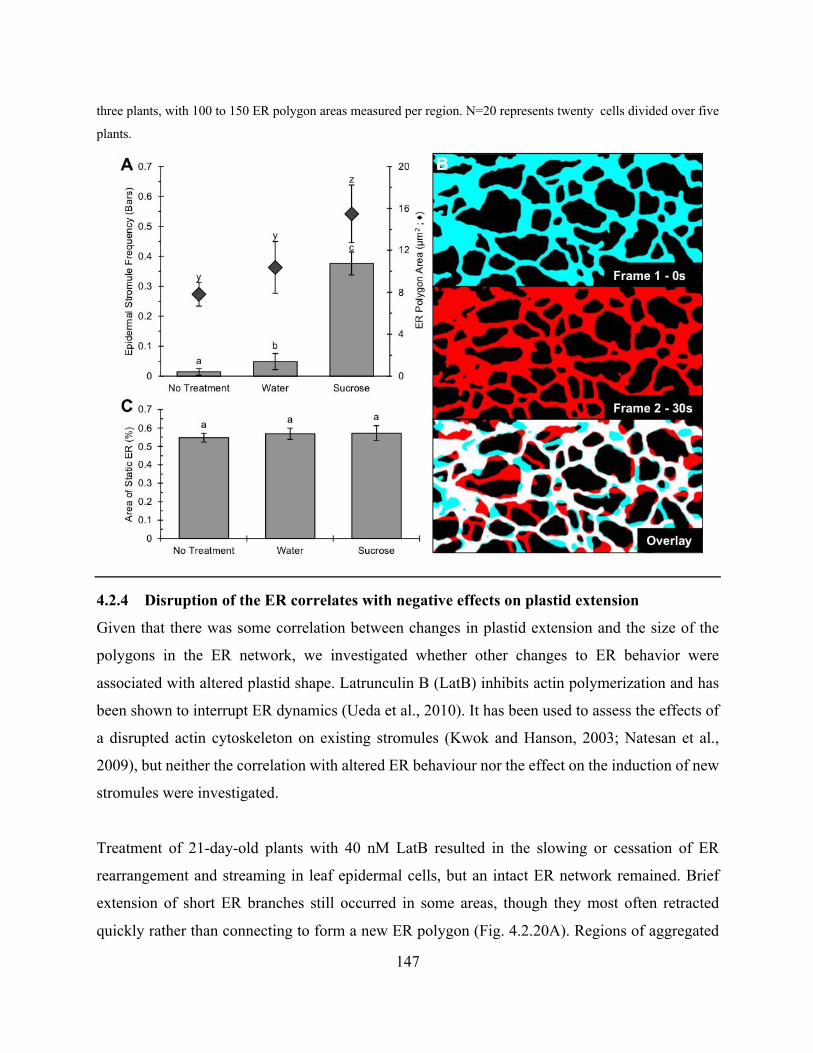
147
three plants, with 100 to 150 ER polygon areas measured per region. N=20 represents twenty cells divided over five
plants.
4.2.4 Disruption of the ER correlates with negative effects on plastid extension
Given that there was some correlation between changes in plastid extension and the size of the
polygons in the ER network, we investigated whether other changes to ER behavior were
associated with altered plastid shape. Latrunculin B (LatB) inhibits actin polymerization and has
been shown to interrupt ER dynamics (Ueda et al., 2010). It has been used to assess the effects of
a disrupted actin cytoskeleton on existing stromules (Kwok and Hanson, 2003; Natesan et al.,
2009), but neither the correlation with altered ER behaviour nor the effect on the induction of new
stromules were investigated.
Treatment of 21-day-old plants with 40 nM LatB resulted in the slowing or cessation of ER
rearrangement and streaming in leaf epidermal cells, but an intact ER network remained. Brief
extension of short ER branches still occurred in some areas, though they most often retracted
quickly rather than connecting to form a new ER polygon (Fig. 4.2.20A). Regions of aggregated
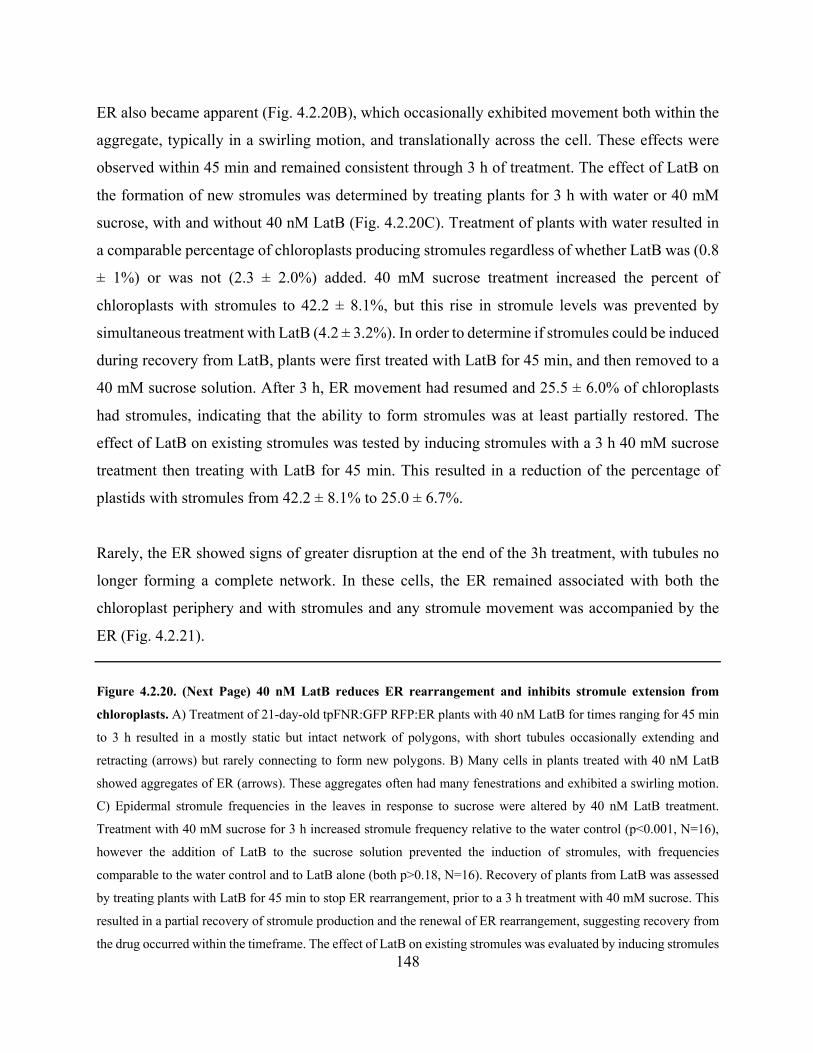
148
ER also became apparent (Fig. 4.2.20B), which occasionally exhibited movement both within the
aggregate, typically in a swirling motion, and translationally across the cell. These effects were
observed within 45 min and remained consistent through 3 h of treatment. The effect of LatB on
the formation of new stromules was determined by treating plants for 3 h with water or 40 mM
sucrose, with and without 40 nM LatB (Fig. 4.2.20C). Treatment of plants with water resulted in
a comparable percentage of chloroplasts producing stromules regardless of whether LatB was (0.8
± 1%) or was not (2.3 ± 2.0%) added. 40 mM sucrose treatment increased the percent of
chloroplasts with stromules to 42.2 ± 8.1%, but this rise in stromule levels was prevented by
simultaneous treatment with LatB (4.2 ± 3.2%). In order to determine if stromules could be induced
during recovery from LatB, plants were first treated with LatB for 45 min, and then removed to a
40 mM sucrose solution. After 3 h, ER movement had resumed and 25.5 ± 6.0% of chloroplasts
had stromules, indicating that the ability to form stromules was at least partially restored. The
effect of LatB on existing stromules was tested by inducing stromules with a 3 h 40 mM sucrose
treatment then treating with LatB for 45 min. This resulted in a reduction of the percentage of
plastids with stromules from 42.2 ± 8.1% to 25.0 ± 6.7%.
Rarely, the ER showed signs of greater disruption at the end of the 3h treatment, with tubules no
longer forming a complete network. In these cells, the ER remained associated with both the
chloroplast periphery and with stromules and any stromule movement was accompanied by the
ER (Fig. 4.2.21).
Figure 4.2.20. (Next Page) 40 nM LatB reduces ER rearrangement and inhibits stromule extension from
chloroplasts. A) Treatment of 21-day-old tpFNR:GFP RFP:ER plants with 40 nM LatB for times ranging for 45 min
to 3 h resulted in a mostly static but intact network of polygons, with short tubules occasionally extending and
retracting (arrows) but rarely connecting to form new polygons. B) Many cells in plants treated with 40 nM LatB
showed aggregates of ER (arrows). These aggregates often had many fenestrations and exhibited a swirling motion.
C) Epidermal stromule frequencies in the leaves in response to sucrose were altered by 40 nM LatB treatment.
Treatment with 40 mM sucrose for 3 h increased stromule frequency relative to the water control (p<0.001, N=16),
however the addition of LatB to the sucrose solution prevented the induction of stromules, with frequencies
comparable to the water control and to LatB alone (both p>0.18, N=16). Recovery of plants from LatB was assessed
by treating plants with LatB for 45 min to stop ER rearrangement, prior to a 3 h treatment with 40 mM sucrose. This
resulted in a partial recovery of stromule production and the renewal of ER rearrangement, suggesting recovery from
the drug occurred within the timeframe. The effect of LatB on existing stromules was evaluated by inducing stromules
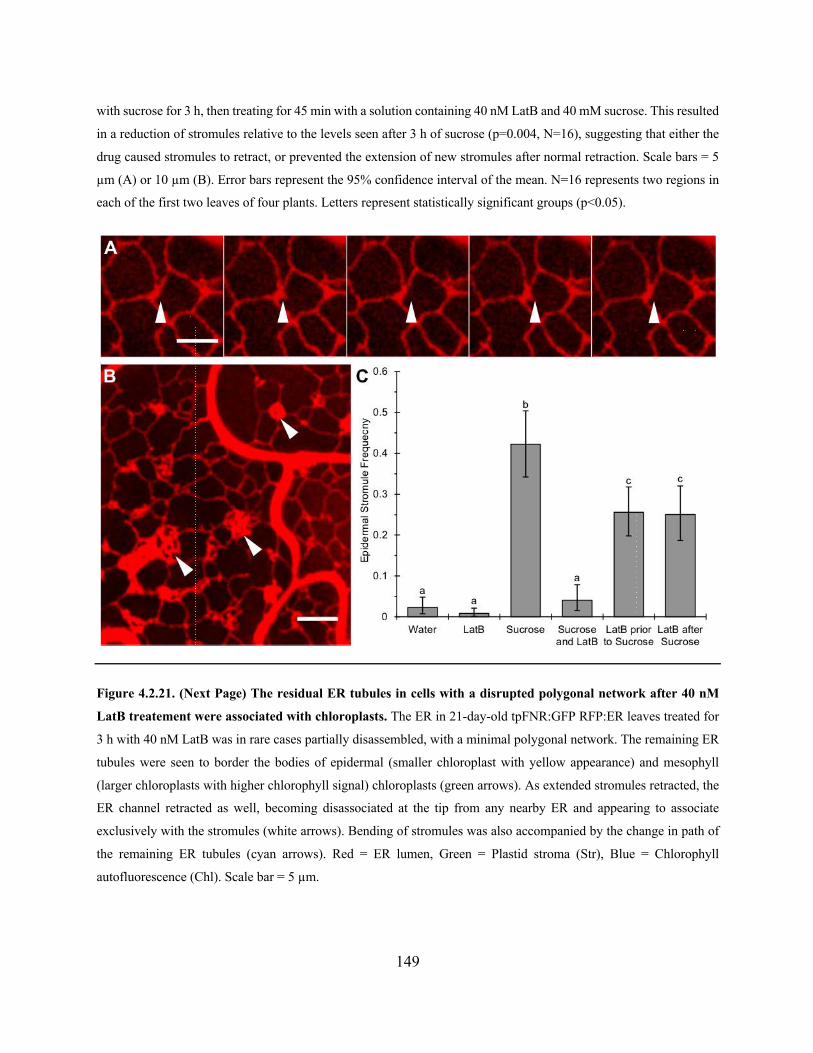
149
with sucrose for 3 h, then treating for 45 min with a solution containing 40 nM LatB and 40 mM sucrose. This resulted
in a reduction of stromules relative to the levels seen after 3 h of sucrose (p=0.004, N=16), suggesting that either the
drug caused stromules to retract, or prevented the extension of new stromules after normal retraction. Scale bars = 5
µm (A) or 10 µm (B). Error bars represent the 95% confidence interval of the mean. N=16 represents two regions in
each of the first two leaves of four plants. Letters represent statistically significant groups (p<0.05).
Figure 4.2.21. (Next Page) The residual ER tubules in cells with a disrupted polygonal network after 40 nM
LatB treatement were associated with chloroplasts. The ER in 21-day-old tpFNR:GFP RFP:ER leaves treated for
3 h with 40 nM LatB was in rare cases partially disassembled, with a minimal polygonal network. The remaining ER
tubules were seen to border the bodies of epidermal (smaller chloroplast with yellow appearance) and mesophyll
(larger chloroplasts with higher chlorophyll signal) chloroplasts (green arrows). As extended stromules retracted, the
ER channel retracted as well, becoming disassociated at the tip from any nearby ER and appearing to associate
exclusively with the stromules (white arrows). Bending of stromules was also accompanied by the change in path of
the remaining ER tubules (cyan arrows). Red = ER lumen, Green = Plastid stroma (Str), Blue = Chlorophyll
autofluorescence (Chl). Scale bar = 5 µm.
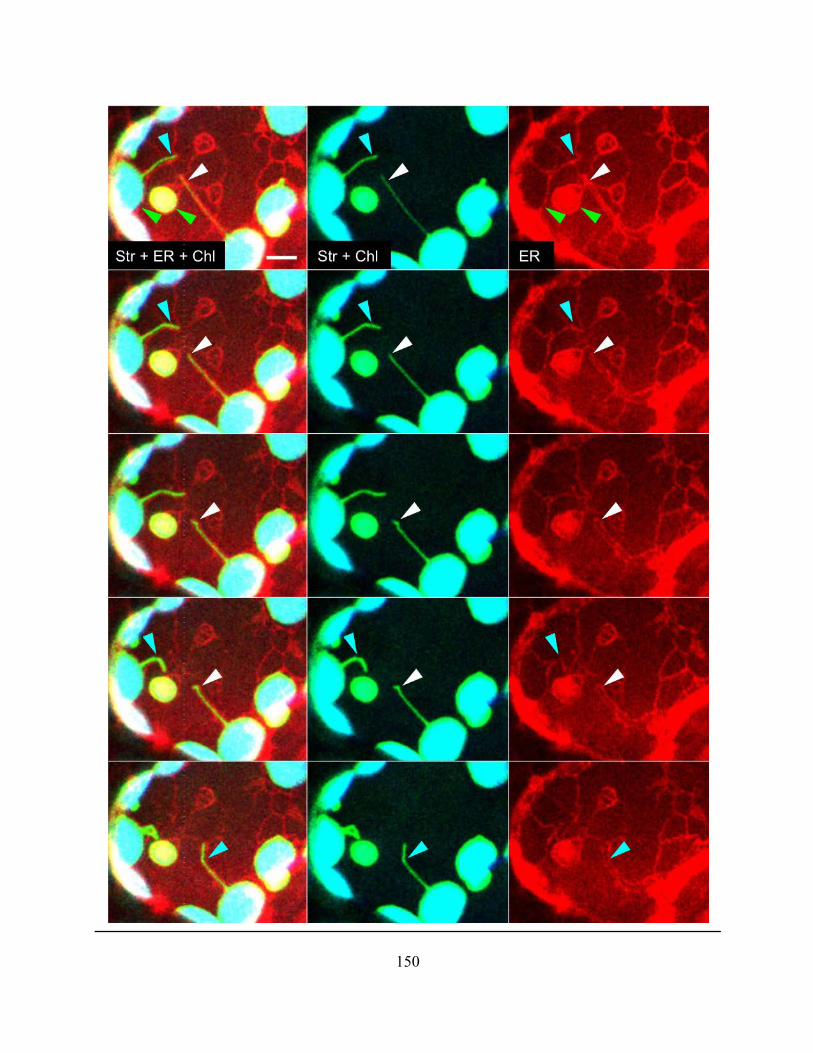
150
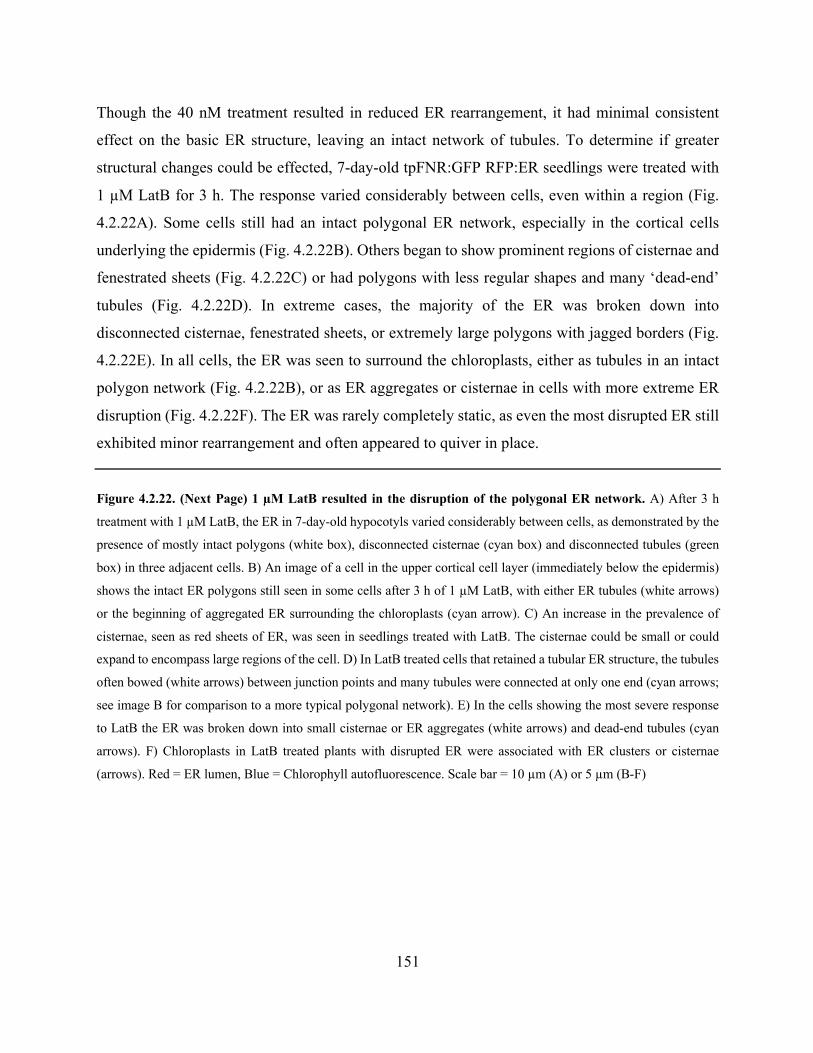
151
Though the 40 nM treatment resulted in reduced ER rearrangement, it had minimal consistent
effect on the basic ER structure, leaving an intact network of tubules. To determine if greater
structural changes could be effected, 7-day-old tpFNR:GFP RFP:ER seedlings were treated with
1 µM LatB for 3 h. The response varied considerably between cells, even within a region (Fig.
4.2.22A). Some cells still had an intact polygonal ER network, especially in the cortical cells
underlying the epidermis (Fig. 4.2.22B). Others began to show prominent regions of cisternae and
fenestrated sheets (Fig. 4.2.22C) or had polygons with less regular shapes and many ‘dead-end’
tubules (Fig. 4.2.22D). In extreme cases, the majority of the ER was broken down into
disconnected cisternae, fenestrated sheets, or extremely large polygons with jagged borders (Fig.
4.2.22E). In all cells, the ER was seen to surround the chloroplasts, either as tubules in an intact
polygon network (Fig. 4.2.22B), or as ER aggregates or cisternae in cells with more extreme ER
disruption (Fig. 4.2.22F). The ER was rarely completely static, as even the most disrupted ER still
exhibited minor rearrangement and often appeared to quiver in place.
Figure 4.2.22. (Next Page) 1 µM LatB resulted in the disruption of the polygonal ER network. A) After 3 h
treatment with 1 µM LatB, the ER in 7-day-old hypocotyls varied considerably between cells, as demonstrated by the
presence of mostly intact polygons (white box), disconnected cisternae (cyan box) and disconnected tubules (green
box) in three adjacent cells. B) An image of a cell in the upper cortical cell layer (immediately below the epidermis)
shows the intact ER polygons still seen in some cells after 3 h of 1 µM LatB, with either ER tubules (white arrows)
or the beginning of aggregated ER surrounding the chloroplasts (cyan arrow). C) An increase in the prevalence of
cisternae, seen as red sheets of ER, was seen in seedlings treated with LatB. The cisternae could be small or could
expand to encompass large regions of the cell. D) In LatB treated cells that retained a tubular ER structure, the tubules
often bowed (white arrows) between junction points and many tubules were connected at only one end (cyan arrows;
see image B for comparison to a more typical polygonal network). E) In the cells showing the most severe response
to LatB the ER was broken down into small cisternae or ER aggregates (white arrows) and dead-end tubules (cyan
arrows). F) Chloroplasts in LatB treated plants with disrupted ER were associated with ER clusters or cisternae
(arrows). Red = ER lumen, Blue = Chlorophyll autofluorescence. Scale bar = 10 µm (A) or 5 µm (B-F)
152
153
Treatment of the seedlings for 3h with water or 40mM sucrose, with and without 1 µM LatB was
carried out to determine if this more drastic ER phenotype correlated with any noticeable changes
to plastid behaviour. Both in plants treated with water and with sucrose, the presence of LatB in
the solution decreased the percent of epidermal chloroplasts with stromules, from 8.7 ± 2.8% to
2.1 ± 0.8% in the water treated plants and from 47.4 ± 4.5% to 13.0 ± 3.3% in the sucrose treated
plants (Fig. 4.2.23A). The higher concentration of LatB did not, however, eliminate plastid
extensions despite the more severe effects on the ER. It did appear that the stromules present in
the plants simultaneously treated with sucrose and LatB were consistently shorter than those in
plants treated with sucrose alone. Quantification of stromule length confirmed this observation,
with an average stromule length of 4.5 ± 0.7 µm in plants treated 40 mM sucrose alone compared
to an average length of 2.2 ± 0.2 µm in the presence of sucrose and LatB (Fig. 4.2.23B). When
stromules were observed using time-lapse imaging in LatB treated plants, they were either static
or seen to retract but no instances of a newly extending stromule were found. In the sucrose and
LatB treated plants it was also noted that stromules were most prevalent in regions that maintained
a more intact ER network, when compared with regions where the ER was disordered (Fig.
4.2.23C). The effects of LatB on the ER therefore ranged from a cessation of rearrangement to the
disruption of ER structure, but the ER always remained at least partially intact. Similarly, LatB
did not eliminate the presence of stromules, but rather altered frequency and behaviour, and it
highlighted the tendency of disrupted ER to associate with the plastid. An early study reported that
microtubule disruption had a negative effect on stromules (Kwok and Hanson, 2003), so two drugs
that influence the microtubules, taxol and oryzalin, were also assessed for their impact on stromule
extension in response to sucrose and on ER structure and dynamics. In preliminary experiments,
neither 5 µM nor 10 µM concentrations of either drug had a clear effect on stromules or the ER
within 3 h in 7-day-old light grown hypocotyls. Therefore, only the experiments on the actin
cytoskeleton were carried forward.

154
Figure 4.2.23. 1 µM LatB reduces stromule frequency and stromule length in response to 40mM sucrose. A) 7-
day-old tpFNR:GFP RFP:ER seedlings were treated for 3h with water or 40 mM sucrose, both alone and with 1 µM
LatB, in order to determine the effect of higher LatB concentrations on stromule formation. LatB reduced stromule
levels in both water treated (p<0.001, N=16) and sucrose treated seedlings (p<0.001, N=16) relative to the plants
treated without LatB. Stromule induction by sucrose was prevented by the 1 µM LatB treatment, as the frequency did
not differ from plants treated with water alone (p=0.09, N=16). B) Average stromule length was considerably shorter
in plants treated with 40 mM sucrose and 1 µM LatB than in plants treated only with 40mM sucrose (p<0.001; N=100
stromules). C) In the regions imaged for assessment of stromule frequencies, a general trend was noted wherein areas
with a more intact polygonal network (left) had higher regional stromule frequencies than areas where the ER structure
was disturbed (right). Error bars represent the 95% confidence interval of the mean. N=16 represents four regions
spanning the upper half of the hypocotyls of four seedlings. Letters represent statistically significant groups (p<0.05).
Red = ER lumen. Scale bars = 10 µm.
155
An association between ER disorder and reduced stromule induction was further investigated
using the secretory inhibitor Brefeldin A (BFA), which has been reported to induce the formation
of cisternae and spherical structures termed ‘BFA bodies’ in the ER (Boevink et al., 1999; Sparkes
et al., 2010). 7-day-old light-grown tpFNR:GFP RFP:ER seedlings were treated with 100 µM BFA
for times ranging from 3 h to overnight to assess the impact of BFA on our plants. The ER network
in these plants showed little change beyond slight dilations in some tubules (Fig. 4.2.24A). As an
alternate system, we tested whether 7-day-old etiolated seedlings were more sensitive to the effects
of BFA and saw that, though many cells had some polygonal ER structure remaining, motile BFA
bodies or beaded ER tubules were present in hypocotyl epidermal cells after 3 h of treatment with
100 µM BFA (Fig. 4.2.24B). Measurement of the plastids revealed that etioplasts were less
elongated overall after treatment with BFA (Shape ratio = 0.66 ± 0.06) than in plants treated with
a water control (Shape ratio = 0.53 ± 0.04; Fig. 4.2.24C). Most plastids that remain elongated after
BFA treatment were associated with the ER-enclosed nucleus (Fig. 4.2.24D) or seen along faint
tubules (Fig. 4.2.24E). These tubules were only visible at an increased zoom and resolution
however, and in stacks taken at a lower zoom for shape analysis, no ER tubules were visible in
some cells. It was therefore not possible to confirm that faint ER tubules correlated with every
elongated etioplast.
Figure 4.2.24. (Next Page) BFA caused minor changes to ER structure and reduced etioplast elongation in dark
grown hypocotyls. A) Treatment of 7-day-old light-grown tpFNR:GFP RFP:ER seedlings with 100 µM BFA for
times ranging from 3 h to 18 h had little effect on ER structure in the hypocotyl, with small dilations in the ER tubules
(arrows) as the only change. B) Etiolated 7-day-old seedlings were more sensitive to BFA, with more pronounced
dilation of ER tubules (white arrow), the appearance of small cisternae (green arrow) and prominent BFA bodies (cyan
arrow) within 3 h of treatment. C) Analysis of etioplast shape ratio in the hypocotyl of BFA treated and control dark
grown seedlings showed an increase in shape ratio after 3 h in the BFA treated plants, indicating that etioplast
elongation was reduced by BFA treatment (p=0.003, N=4). D) Elongated etioplasts in BFA treated seedlings were
often associated with the nucleus (Nu). E) Faint ER tubules (arrows) corresponded with many elongated etioplasts in
the cell cortex of BFA treated plants. Red = ER lumen (ER); Green = Plastid stroma (Str). Scale bars = 5 µm. N=4
represents four seedlings with 100 etioplasts measured per seedling. Letters represent statistically significant groups
(p<0.05). Error bars represent the 95% confidence interval of the mean.
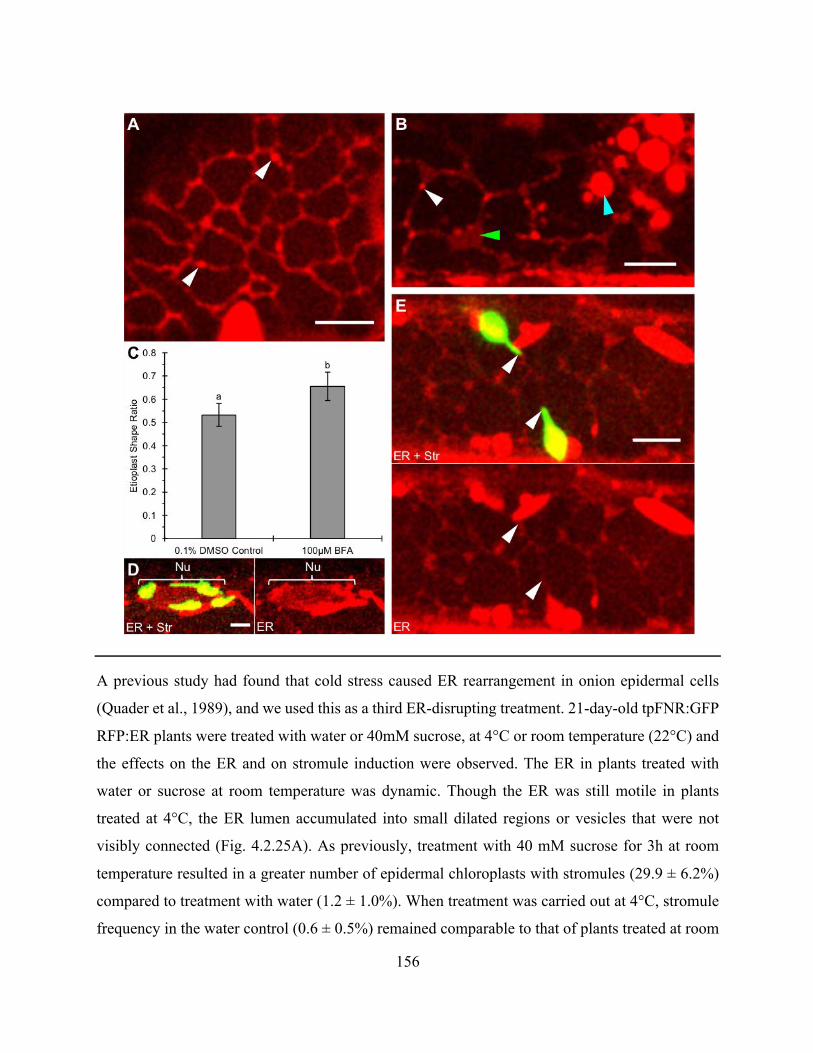
156
A previous study had found that cold stress caused ER rearrangement in onion epidermal cells
(Quader et al., 1989), and we used this as a third ER-disrupting treatment. 21-day-old tpFNR:GFP
RFP:ER plants were treated with water or 40mM sucrose, at 4°C or room temperature (22°C) and
the effects on the ER and on stromule induction were observed. The ER in plants treated with
water or sucrose at room temperature was dynamic. Though the ER was still motile in plants
treated at 4°C, the ER lumen accumulated into small dilated regions or vesicles that were not
visibly connected (Fig. 4.2.25A). As previously, treatment with 40 mM sucrose for 3h at room
temperature resulted in a greater number of epidermal chloroplasts with stromules (29.9 ± 6.2%)
compared to treatment with water (1.2 ± 1.0%). When treatment was carried out at 4°C, stromule
frequency in the water control (0.6 ± 0.5%) remained comparable to that of plants treated at room
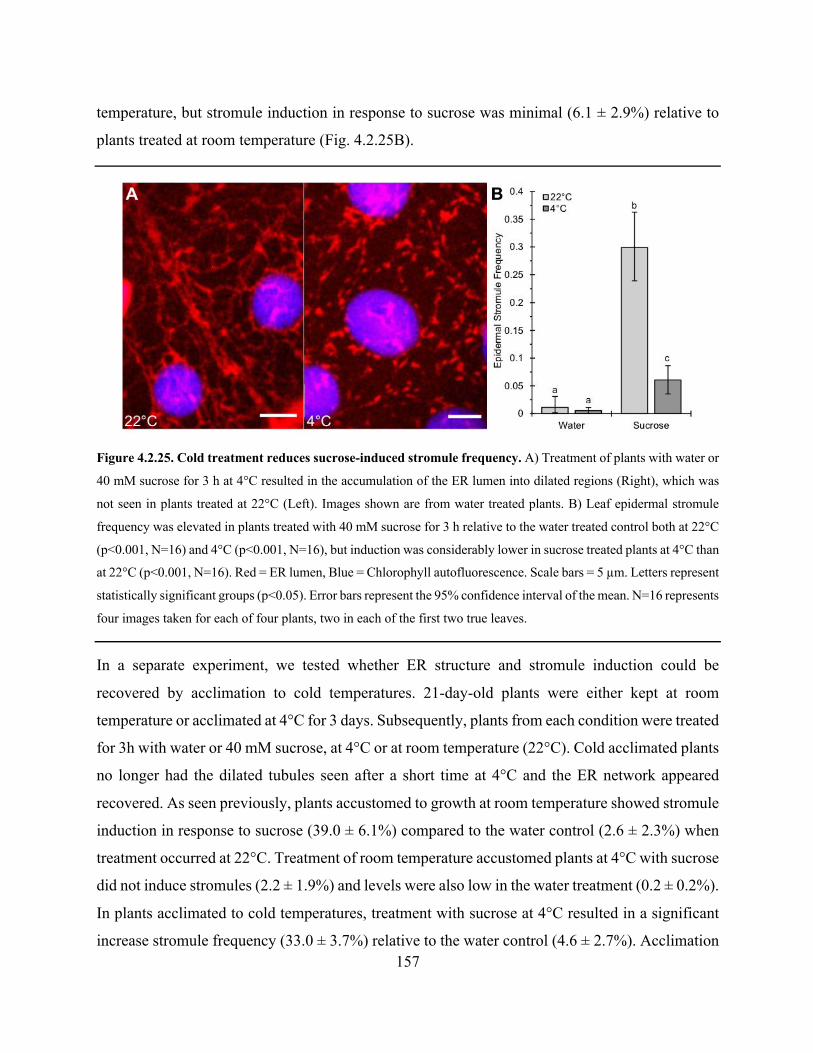
157
temperature, but stromule induction in response to sucrose was minimal (6.1 ± 2.9%) relative to
plants treated at room temperature (Fig. 4.2.25B).
Figure 4.2.25. Cold treatment reduces sucrose-induced stromule frequency. A) Treatment of plants with water or
40 mM sucrose for 3 h at 4°C resulted in the accumulation of the ER lumen into dilated regions (Right), which was
not seen in plants treated at 22°C (Left). Images shown are from water treated plants. B) Leaf epidermal stromule
frequency was elevated in plants treated with 40 mM sucrose for 3 h relative to the water treated control both at 22°C
(p<0.001, N=16) and 4°C (p<0.001, N=16), but induction was considerably lower in sucrose treated plants at 4°C than
at 22°C (p<0.001, N=16). Red = ER lumen, Blue = Chlorophyll autofluorescence. Scale bars = 5 µm. Letters represent
statistically significant groups (p<0.05). Error bars represent the 95% confidence interval of the mean. N=16 represents
four images taken for each of four plants, two in each of the first two true leaves.
In a separate experiment, we tested whether ER structure and stromule induction could be
recovered by acclimation to cold temperatures. 21-day-old plants were either kept at room
temperature or acclimated at 4°C for 3 days. Subsequently, plants from each condition were treated
for 3h with water or 40 mM sucrose, at 4°C or at room temperature (22°C). Cold acclimated plants
no longer had the dilated tubules seen after a short time at 4°C and the ER network appeared
recovered. As seen previously, plants accustomed to growth at room temperature showed stromule
induction in response to sucrose (39.0 ± 6.1%) compared to the water control (2.6 ± 2.3%) when
treatment occurred at 22°C. Treatment of room temperature accustomed plants at 4°C with sucrose
did not induce stromules (2.2 ± 1.9%) and levels were also low in the water treatment (0.2 ± 0.2%).
In plants acclimated to cold temperatures, treatment with sucrose at 4°C resulted in a significant
increase stromule frequency (33.0 ± 3.7%) relative to the water control (4.6 ± 2.7%). Acclimation
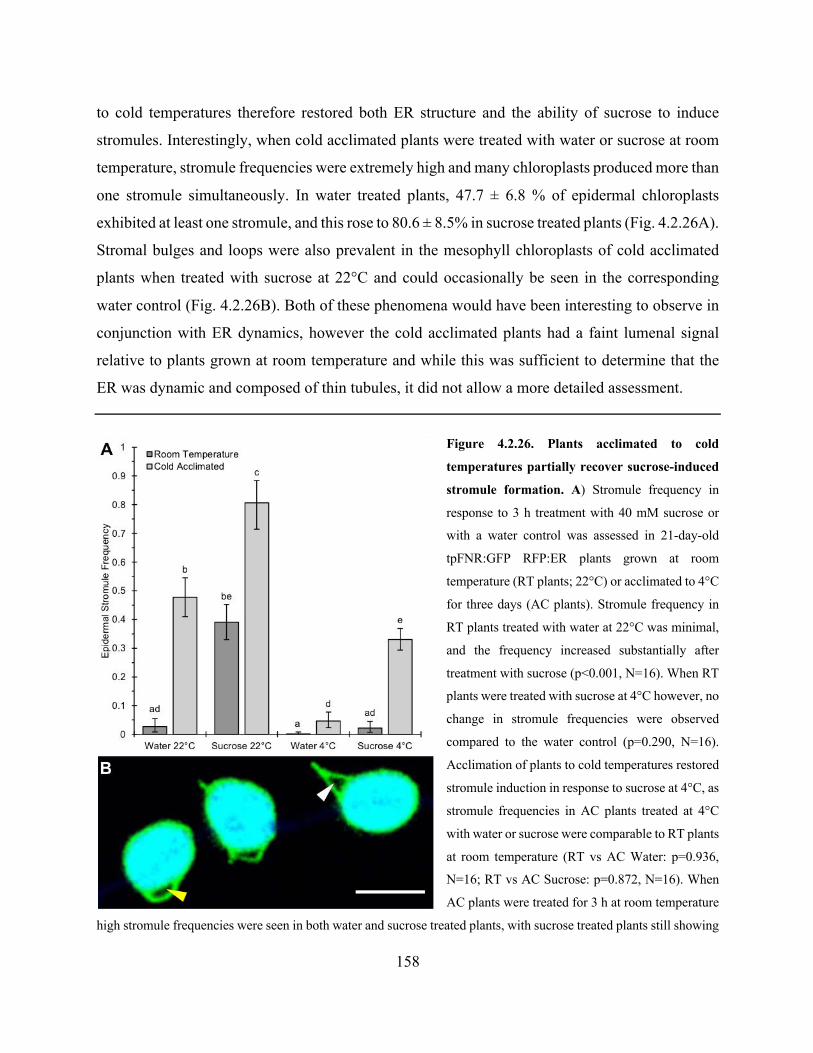
158
to cold temperatures therefore restored both ER structure and the ability of sucrose to induce
stromules. Interestingly, when cold acclimated plants were treated with water or sucrose at room
temperature, stromule frequencies were extremely high and many chloroplasts produced more than
one stromule simultaneously. In water treated plants, 47.7 ± 6.8 % of epidermal chloroplasts
exhibited at least one stromule, and this rose to 80.6 ± 8.5% in sucrose treated plants (Fig. 4.2.26A).
Stromal bulges and loops were also prevalent in the mesophyll chloroplasts of cold acclimated
plants when treated with sucrose at 22°C and could occasionally be seen in the corresponding
water control (Fig. 4.2.26B). Both of these phenomena would have been interesting to observe in
conjunction with ER dynamics, however the cold acclimated plants had a faint lumenal signal
relative to plants grown at room temperature and while this was sufficient to determine that the
ER was dynamic and composed of thin tubules, it did not allow a more detailed assessment.
Figure 4.2.26. Plants acclimated to cold
temperatures partially recover sucrose-induced
stromule formation. A) Stromule frequency in
response to 3 h treatment with 40 mM sucrose or
with a water control was assessed in 21-day-old
tpFNR:GFP RFP:ER plants grown at room
temperature (RT plants; 22°C) or acclimated to 4°C
for three days (AC plants). Stromule frequency in
RT plants treated with water at 22°C was minimal,
and the frequency increased substantially after
treatment with sucrose (p<0.001, N=16). When RT
plants were treated with sucrose at 4°C however, no
change in stromule frequencies were observed
compared to the water control (p=0.290, N=16).
Acclimation of plants to cold temperatures restored
stromule induction in response to sucrose at 4°C, as
stromule frequencies in AC plants treated at 4°C
with water or sucrose were comparable to RT plants
at room temperature (RT vs AC Water: p=0.936,
N=16; RT vs AC Sucrose: p=0.872, N=16). When
AC plants were treated for 3 h at room temperature
high stromule frequencies were seen in both water and sucrose treated plants, with sucrose treated plants still showing
159
the higher frequency. B) Long stromal projections with regions lacking a fluorescent signal (white arrow) and shorter
loops of stroma (yellow arrow) were prevalent in AC plants treated at room temperature with sucrose, and were also
seen to a lesser extent in the water control. Letters represent statistically significant groups (p<0.05). Error bars
represent the 95% confidence interval of the mean. N=16 represents four images taken for each of four plants, two in
each of the first two true leaves. Green = Stroma, Blue = Chlorophyll autofluorescence. Scale bar = 10 µm.
Cold treatment, LatB treatment, and treatment with BFA all resulted in alterations to ER form and
reduced plastid extension. The recovery of the ER after either cold acclimation or removal from
LatB solution was also accompanied by the recovery of stromule induction. However, as
previously mentioned, there is research that suggests the actin-myosin system as the basis for
stromule extension (Kwok and Hanson, 2003; Natesan et al., 2009; Sattarzadeh et al., 2009), and
cold temperatures and BFA have both been associated with changes to actin structure in plant cells
(Pokorná et al., 2004; Hörmanseder et al., 2005), while LatB is a drug that binds G-actin monomers
to inhibit actin polymerization (Coué et al., 1987).
4.2.5 Association of the ER and the actin cytoskeleton
The rearrangement of the ER network in plant cells is understood to rely on myosins and the actin
cytoskeleton based on drug and mutation studies (Knebel et al., 1990; Liebe and Menzel, 1995;
Sparkes et al., 2009a; Ueda et al., 2010; Sparkes et al., 2011), but a visual characterization of the
actin-ER relationship was not found in the literature. We therefore investigated the visual
correlation between the actin cytoskeleton and the ER as a precursor to assessing the actin-ER-
plastid relationship. A stable double transgenic GFP:mTalin RFP:ER (Barton et al., 2017) was
used, which highlighted both the actin cytoskeleton and the ER lumen. The differences in ER
structure often seen between cells were accentuated in the GFP:mTalin RFP:ER line, and similarly
the form of the actin cytoskeleton was extremely variable. Fainter bundles could sometimes be
resolved amongst the brighter ones, but in many areas the actin cytoskeleton appeared as patches
of diffuse GFP signal rather than a defined structure. While some ER tubules did have underlying
actin filaments, it was not possible to directly relate most ER tubules to an actin filament. There
were also many actin filaments that had no apparent ER association (Fig. 4.2.27). Some repeated
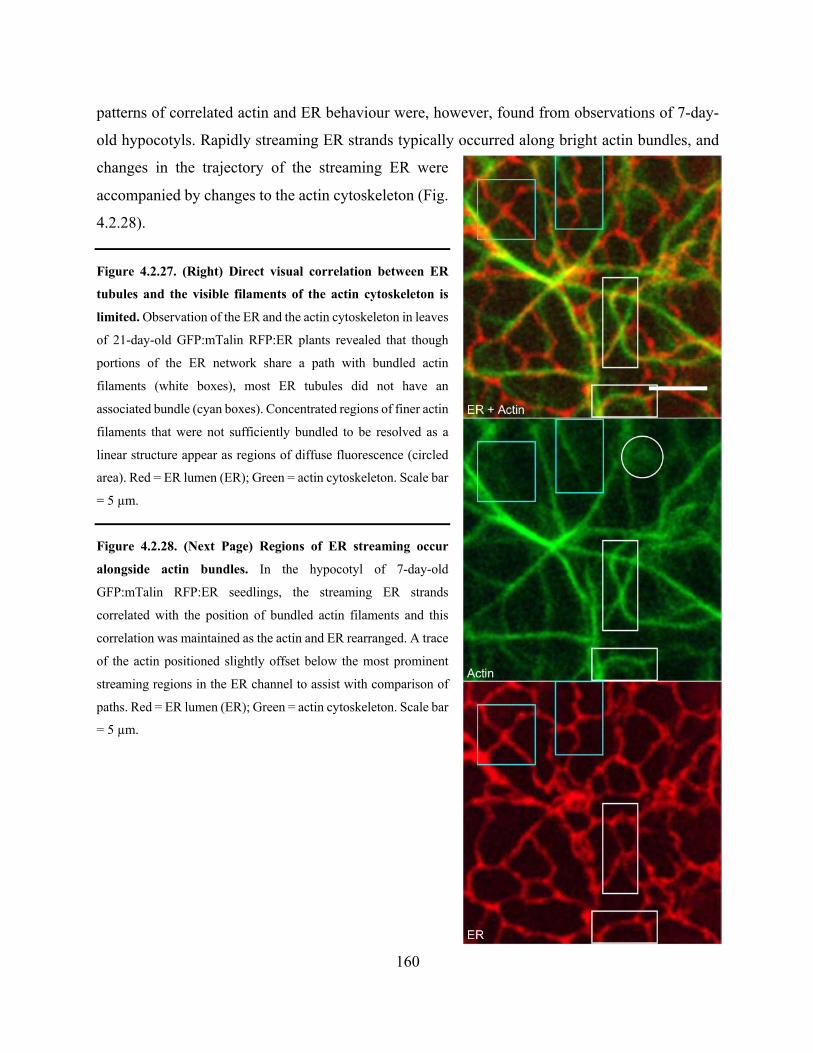
160
patterns of correlated actin and ER behaviour were, however, found from observations of 7-day-
old hypocotyls. Rapidly streaming ER strands typically occurred along bright actin bundles, and
changes in the trajectory of the streaming ER were
accompanied by changes to the actin cytoskeleton (Fig.
4.2.28).
Figure 4.2.27. (Right) Direct visual correlation between ER
tubules and the visible filaments of the actin cytoskeleton is
limited. Observation of the ER and the actin cytoskeleton in leaves
of 21-day-old GFP:mTalin RFP:ER plants revealed that though
portions of the ER network share a path with bundled actin
filaments (white boxes), most ER tubules did not have an
associated bundle (cyan boxes). Concentrated regions of finer actin
filaments that were not sufficiently bundled to be resolved as a
linear structure appear as regions of diffuse fluorescence (circled
area). Red = ER lumen (ER); Green = actin cytoskeleton. Scale bar
= 5 µm.
Figure 4.2.28. (Next Page) Regions of ER streaming occur
alongside actin bundles. In the hypocotyl of 7-day-old
GFP:mTalin RFP:ER seedlings, the streaming ER strands
correlated with the position of bundled actin filaments and this
correlation was maintained as the actin and ER rearranged. A trace
of the actin positioned slightly offset below the most prominent
streaming regions in the ER channel to assist with comparison of
paths. Red = ER lumen (ER); Green = actin cytoskeleton. Scale bar
= 5 µm.
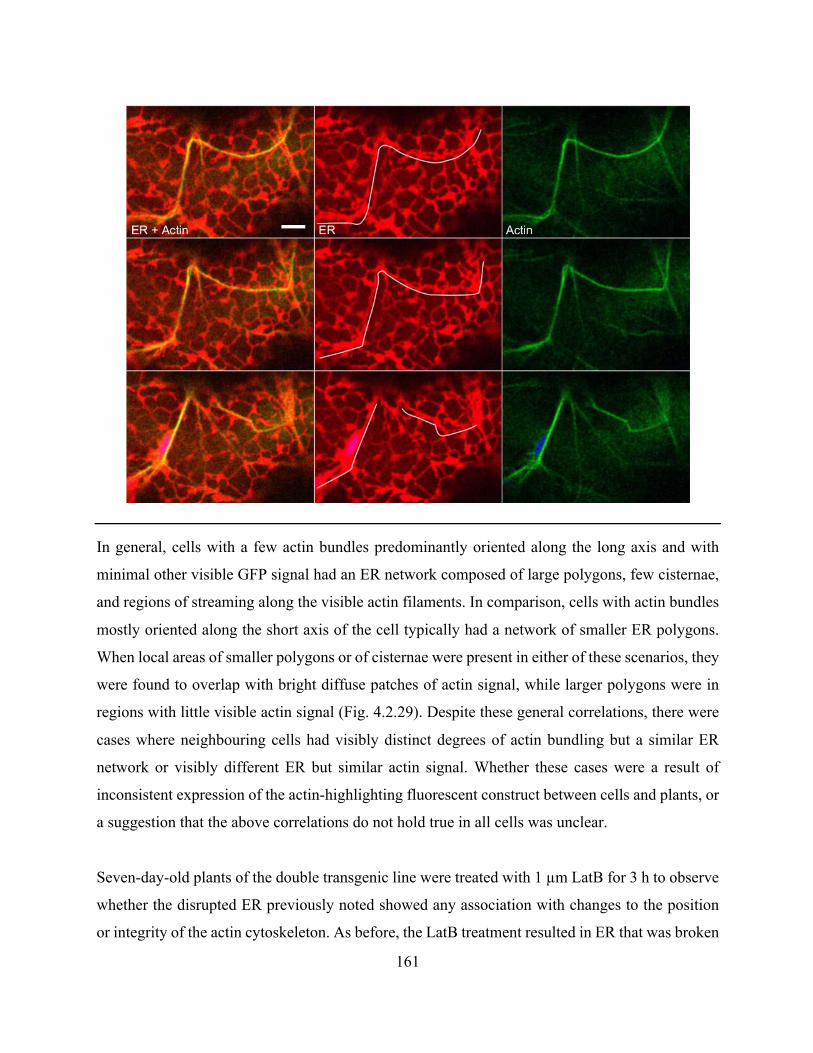
161
In general, cells with a few actin bundles predominantly oriented along the long axis and with
minimal other visible GFP signal had an ER network composed of large polygons, few cisternae,
and regions of streaming along the visible actin filaments. In comparison, cells with actin bundles
mostly oriented along the short axis of the cell typically had a network of smaller ER polygons.
When local areas of smaller polygons or of cisternae were present in either of these scenarios, they
were found to overlap with bright diffuse patches of actin signal, while larger polygons were in
regions with little visible actin signal (Fig. 4.2.29). Despite these general correlations, there were
cases where neighbouring cells had visibly distinct degrees of actin bundling but a similar ER
network or visibly different ER but similar actin signal. Whether these cases were a result of
inconsistent expression of the actin-highlighting fluorescent construct between cells and plants, or
a suggestion that the above correlations do not hold true in all cells was unclear.
Seven-day-old plants of the double transgenic line were treated with 1 µm LatB for 3 h to observe
whether the disrupted ER previously noted showed any association with changes to the position
or integrity of the actin cytoskeleton. As before, the LatB treatment resulted in ER that was broken
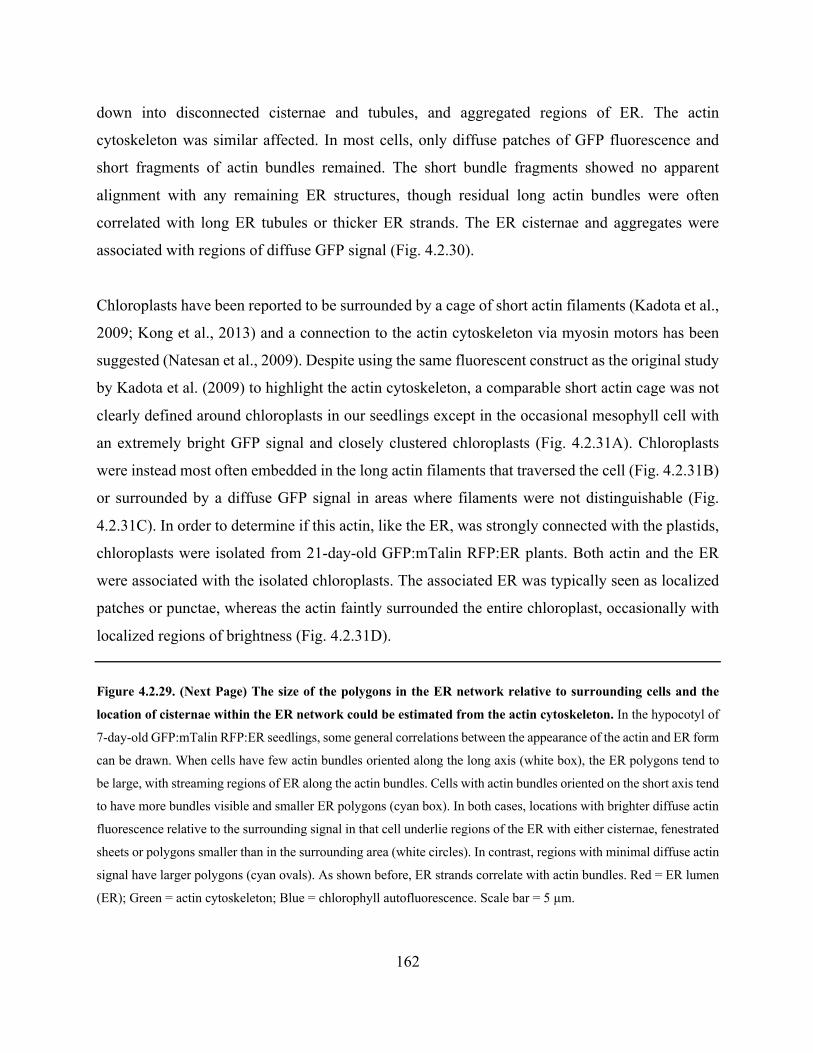
162
down into disconnected cisternae and tubules, and aggregated regions of ER. The actin
cytoskeleton was similar affected. In most cells, only diffuse patches of GFP fluorescence and
short fragments of actin bundles remained. The short bundle fragments showed no apparent
alignment with any remaining ER structures, though residual long actin bundles were often
correlated with long ER tubules or thicker ER strands. The ER cisternae and aggregates were
associated with regions of diffuse GFP signal (Fig. 4.2.30).
Chloroplasts have been reported to be surrounded by a cage of short actin filaments (Kadota et al.,
2009; Kong et al., 2013) and a connection to the actin cytoskeleton via myosin motors has been
suggested (Natesan et al., 2009). Despite using the same fluorescent construct as the original study
by Kadota et al. (2009) to highlight the actin cytoskeleton, a comparable short actin cage was not
clearly defined around chloroplasts in our seedlings except in the occasional mesophyll cell with
an extremely bright GFP signal and closely clustered chloroplasts (Fig. 4.2.31A). Chloroplasts
were instead most often embedded in the long actin filaments that traversed the cell (Fig. 4.2.31B)
or surrounded by a diffuse GFP signal in areas where filaments were not distinguishable (Fig.
4.2.31C). In order to determine if this actin, like the ER, was strongly connected with the plastids,
chloroplasts were isolated from 21-day-old GFP:mTalin RFP:ER plants. Both actin and the ER
were associated with the isolated chloroplasts. The associated ER was typically seen as localized
patches or punctae, whereas the actin faintly surrounded the entire chloroplast, occasionally with
localized regions of brightness (Fig. 4.2.31D).
Figure 4.2.29. (Next Page) The size of the polygons in the ER network relative to surrounding cells and the
location of cisternae within the ER network could be estimated from the actin cytoskeleton. In the hypocotyl of
7-day-old GFP:mTalin RFP:ER seedlings, some general correlations between the appearance of the actin and ER form
can be drawn. When cells have few actin bundles oriented along the long axis (white box), the ER polygons tend to
be large, with streaming regions of ER along the actin bundles. Cells with actin bundles oriented on the short axis tend
to have more bundles visible and smaller ER polygons (cyan box). In both cases, locations with brighter diffuse actin
fluorescence relative to the surrounding signal in that cell underlie regions of the ER with either cisternae, fenestrated
sheets or polygons smaller than in the surrounding area (white circles). In contrast, regions with minimal diffuse actin
signal have larger polygons (cyan ovals). As shown before, ER strands correlate with actin bundles. Red = ER lumen
(ER); Green = actin cytoskeleton; Blue = chlorophyll autofluorescence. Scale bar = 5 µm.

163
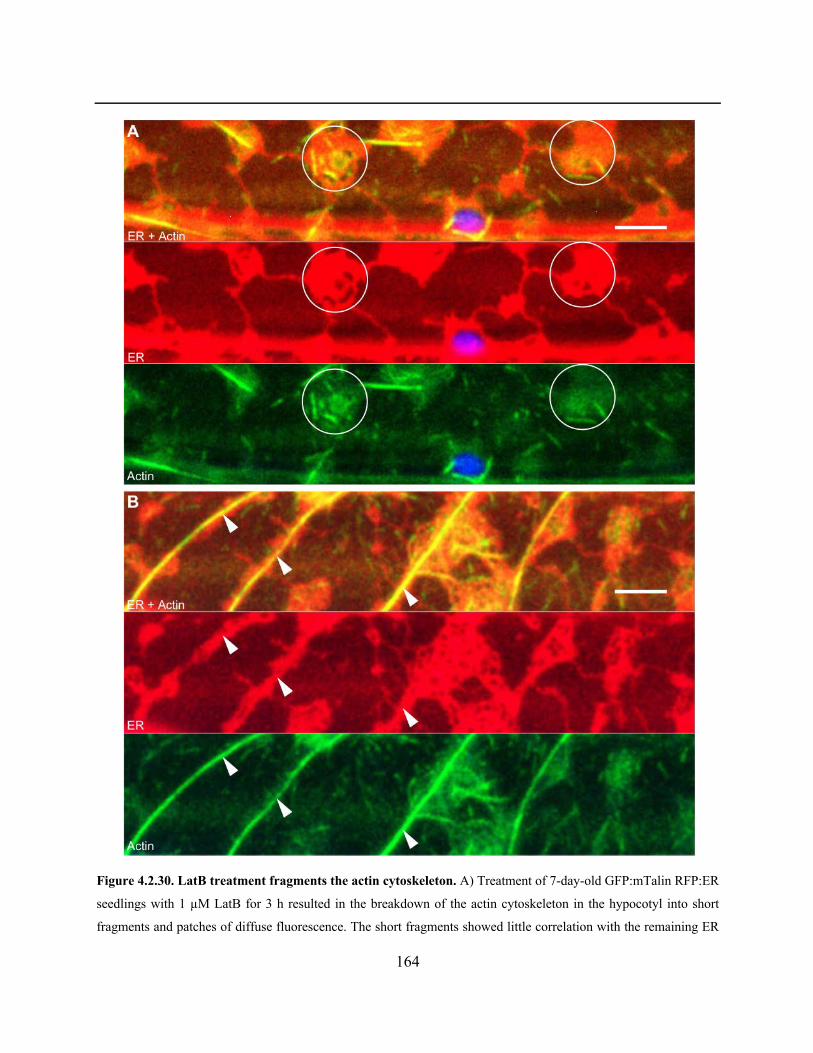
164
Figure 4.2.30. LatB treatment fragments the actin cytoskeleton. A) Treatment of 7-day-old GFP:mTalin RFP:ER
seedlings with 1 µM LatB for 3 h resulted in the breakdown of the actin cytoskeleton in the hypocotyl into short
fragments and patches of diffuse fluorescence. The short fragments showed little correlation with the remaining ER
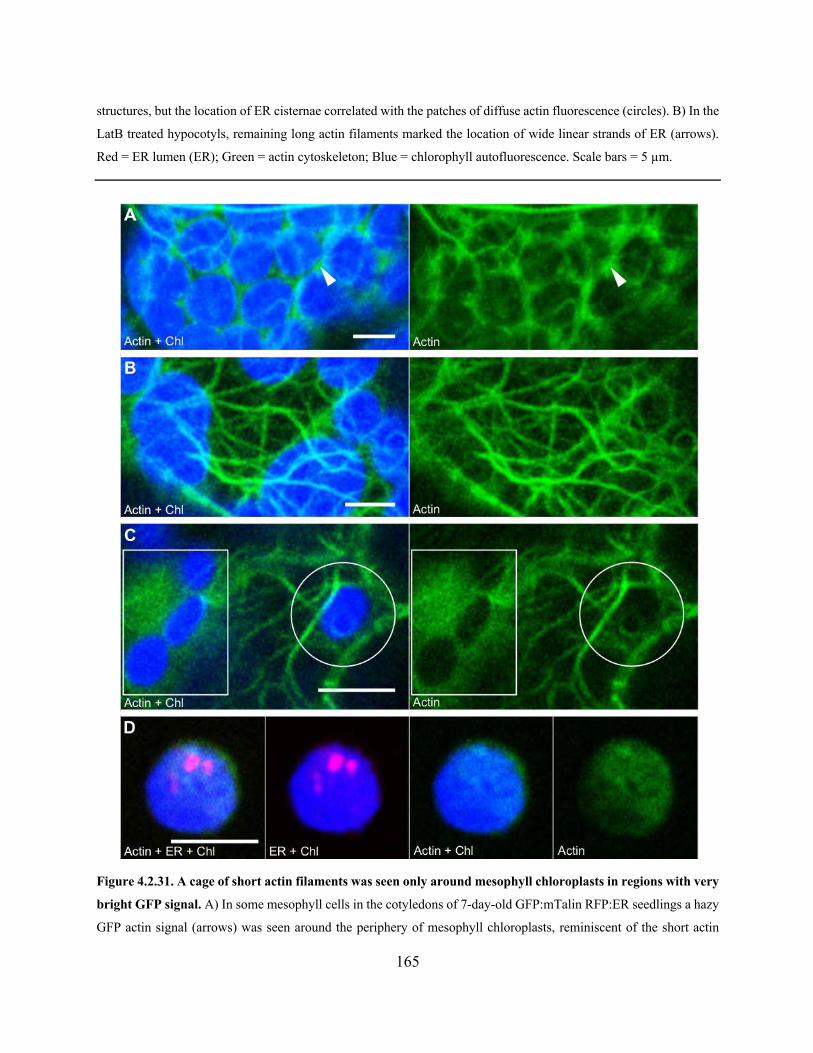
165
structures, but the location of ER cisternae correlated with the patches of diffuse actin fluorescence (circles). B) In the
LatB treated hypocotyls, remaining long actin filaments marked the location of wide linear strands of ER (arrows).
Red = ER lumen (ER); Green = actin cytoskeleton; Blue = chlorophyll autofluorescence. Scale bars = 5 µm.
Figure 4.2.31. A cage of short actin filaments was seen only around mesophyll chloroplasts in regions with very
bright GFP signal. A) In some mesophyll cells in the cotyledons of 7-day-old GFP:mTalin RFP:ER seedlings a hazy
GFP actin signal (arrows) was seen around the periphery of mesophyll chloroplasts, reminiscent of the short actin
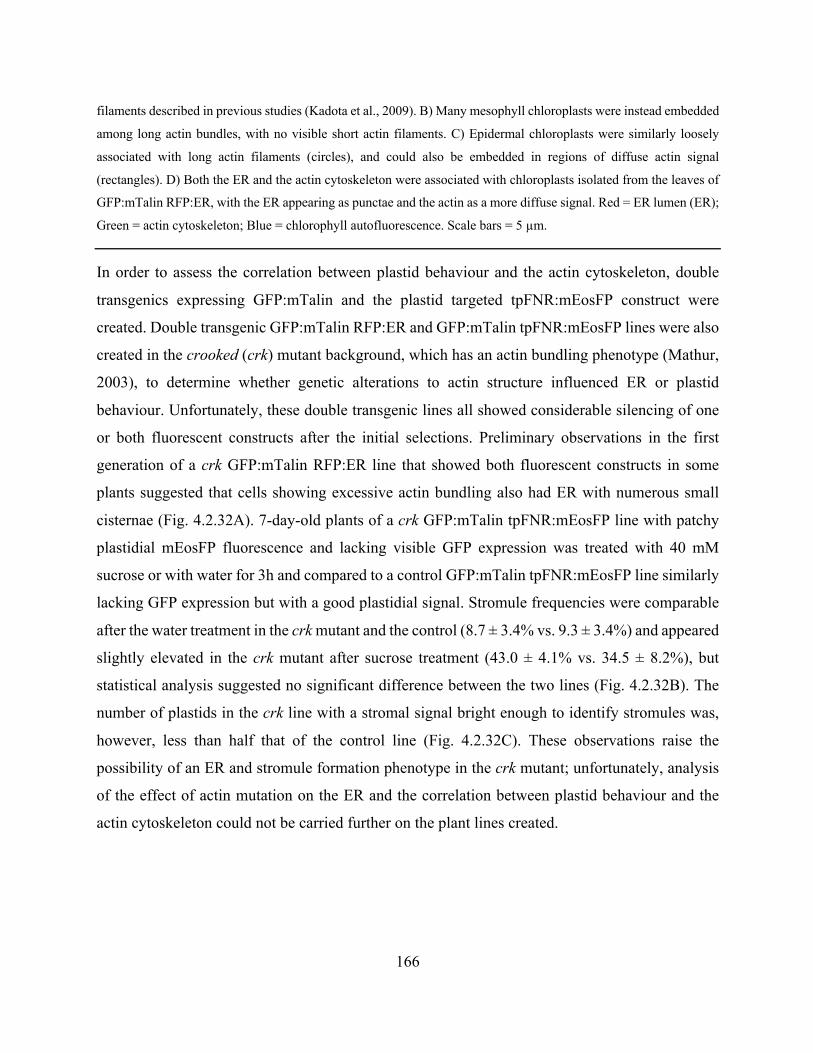
166
filaments described in previous studies (Kadota et al., 2009). B) Many mesophyll chloroplasts were instead embedded
among long actin bundles, with no visible short actin filaments. C) Epidermal chloroplasts were similarly loosely
associated with long actin filaments (circles), and could also be embedded in regions of diffuse actin signal
(rectangles). D) Both the ER and the actin cytoskeleton were associated with chloroplasts isolated from the leaves of
GFP:mTalin RFP:ER, with the ER appearing as punctae and the actin as a more diffuse signal. Red = ER lumen (ER);
Green = actin cytoskeleton; Blue = chlorophyll autofluorescence. Scale bars = 5 µm.
In order to assess the correlation between plastid behaviour and the actin cytoskeleton, double
transgenics expressing GFP:mTalin and the plastid targeted tpFNR:mEosFP construct were
created. Double transgenic GFP:mTalin RFP:ER and GFP:mTalin tpFNR:mEosFP lines were also
created in the crooked (crk) mutant background, which has an actin bundling phenotype (Mathur,
2003), to determine whether genetic alterations to actin structure influenced ER or plastid
behaviour. Unfortunately, these double transgenic lines all showed considerable silencing of one
or both fluorescent constructs after the initial selections. Preliminary observations in the first
generation of a crk GFP:mTalin RFP:ER line that showed both fluorescent constructs in some
plants suggested that cells showing excessive actin bundling also had ER with numerous small
cisternae (Fig. 4.2.32A). 7-day-old plants of a crk GFP:mTalin tpFNR:mEosFP line with patchy
plastidial mEosFP fluorescence and lacking visible GFP expression was treated with 40 mM
sucrose or with water for 3h and compared to a control GFP:mTalin tpFNR:mEosFP line similarly
lacking GFP expression but with a good plastidial signal. Stromule frequencies were comparable
after the water treatment in the crk mutant and the control (8.7 ± 3.4% vs. 9.3 ± 3.4%) and appeared
slightly elevated in the crk mutant after sucrose treatment (43.0 ± 4.1% vs. 34.5 ± 8.2%), but
statistical analysis suggested no significant difference between the two lines (Fig. 4.2.32B). The
number of plastids in the crk line with a stromal signal bright enough to identify stromules was,
however, less than half that of the control line (Fig. 4.2.32C). These observations raise the
possibility of an ER and stromule formation phenotype in the crk mutant; unfortunately, analysis
of the effect of actin mutation on the ER and the correlation between plastid behaviour and the
actin cytoskeleton could not be carried further on the plant lines created.

167
Figure 4.2.32. The crk GFP:mTalin tpFNR:mEosFP lines available show a slightly elevated stromule frequency
in response to sucrose but have expression too inconsistent for confirmation. A) The actin bundling phenotype
of the crk mutant was apparent in 7-day-old crk GFP:mTalin RFP:ER seedlings when compared with the GFP:mTalin
RFP:ER control. In several cells observed, this was accompanied by the increased appearance of cisternae in the
mutant but the observation could not be confirmed due to silencing of the fluorescent constructs during repeat
experiments. B) Epidermal stromule frequencies in the hypocotyl of 7-day-old control GFP:mTalin tpFNR:mEosFP
and crk GFP:mTalin tpFNR:mEosFP plants were similar to each other both after 3 h treatment with 40 mM sucrose
(p=0.181, N=16) and after treatment with a water control (p=0.995, N=16). C) Expression of the stromal
tpFNR:mEosFP was faint and inconsistent in the crk mutant relative to the control. This reduced the number of
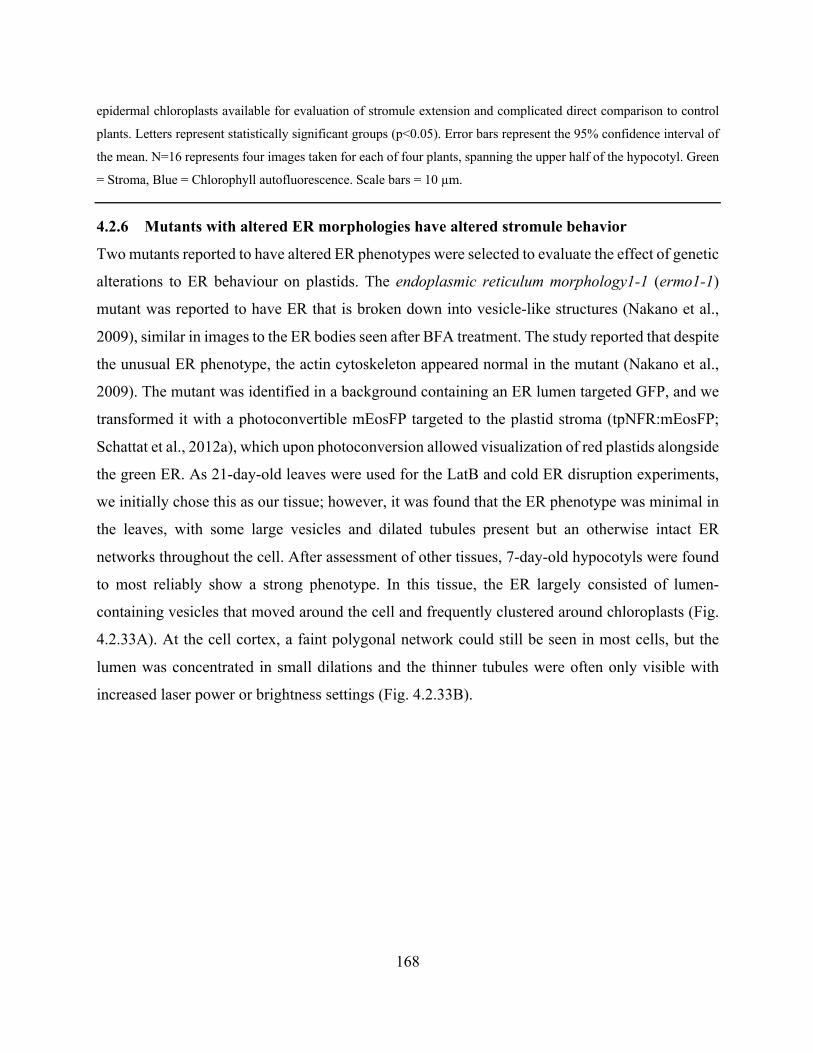
168
epidermal chloroplasts available for evaluation of stromule extension and complicated direct comparison to control
plants. Letters represent statistically significant groups (p<0.05). Error bars represent the 95% confidence interval of
the mean. N=16 represents four images taken for each of four plants, spanning the upper half of the hypocotyl. Green
= Stroma, Blue = Chlorophyll autofluorescence. Scale bars = 10 µm.
4.2.6 Mutants with altered ER morphologies have altered stromule behavior
Two mutants reported to have altered ER phenotypes were selected to evaluate the effect of genetic
alterations to ER behaviour on plastids. The endoplasmic reticulum morphology1-1 (ermo1-1)
mutant was reported to have ER that is broken down into vesicle-like structures (Nakano et al.,
2009), similar in images to the ER bodies seen after BFA treatment. The study reported that despite
the unusual ER phenotype, the actin cytoskeleton appeared normal in the mutant (Nakano et al.,
2009). The mutant was identified in a background containing an ER lumen targeted GFP, and we
transformed it with a photoconvertible mEosFP targeted to the plastid stroma (tpNFR:mEosFP;
Schattat et al., 2012a), which upon photoconversion allowed visualization of red plastids alongside
the green ER. As 21-day-old leaves were used for the LatB and cold ER disruption experiments,
we initially chose this as our tissue; however, it was found that the ER phenotype was minimal in
the leaves, with some large vesicles and dilated tubules present but an otherwise intact ER
networks throughout the cell. After assessment of other tissues, 7-day-old hypocotyls were found
to most reliably show a strong phenotype. In this tissue, the ER largely consisted of lumen-
containing vesicles that moved around the cell and frequently clustered around chloroplasts (Fig.
4.2.33A). At the cell cortex, a faint polygonal network could still be seen in most cells, but the
lumen was concentrated in small dilations and the thinner tubules were often only visible with
increased laser power or brightness settings (Fig. 4.2.33B).
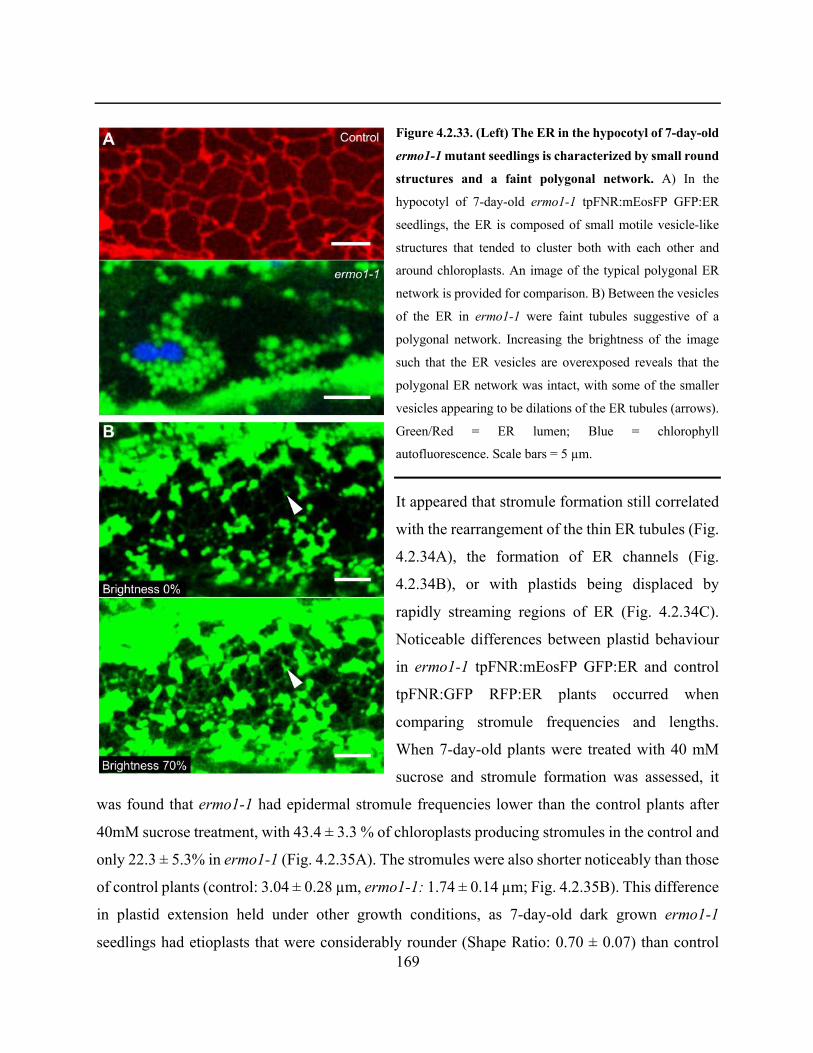
169
Figure 4.2.33. (Left) The ER in the hypocotyl of 7-day-old
ermo1-1 mutant seedlings is characterized by small round
structures and a faint polygonal network. A) In the
hypocotyl of 7-day-old ermo1-1 tpFNR:mEosFP GFP:ER
seedlings, the ER is composed of small motile vesicle-like
structures that tended to cluster both with each other and
around chloroplasts. An image of the typical polygonal ER
network is provided for comparison. B) Between the vesicles
of the ER in ermo1-1 were faint tubules suggestive of a
polygonal network. Increasing the brightness of the image
such that the ER vesicles are overexposed reveals that the
polygonal ER network was intact, with some of the smaller
vesicles appearing to be dilations of the ER tubules (arrows).
Green/Red = ER lumen; Blue = chlorophyll
autofluorescence. Scale bars = 5 µm.
It appeared that stromule formation still correlated
with the rearrangement of the thin ER tubules (Fig.
4.2.34A), the formation of ER channels (Fig.
4.2.34B), or with plastids being displaced by
rapidly streaming regions of ER (Fig. 4.2.34C).
Noticeable differences between plastid behaviour
in ermo1-1 tpFNR:mEosFP GFP:ER and control
tpFNR:GFP RFP:ER plants occurred when
comparing stromule frequencies and lengths.
When 7-day-old plants were treated with 40 mM
sucrose and stromule formation was assessed, it
was found that ermo1-1 had epidermal stromule frequencies lower than the control plants after
40mM sucrose treatment, with 43.4 ± 3.3 % of chloroplasts producing stromules in the control and
only 22.3 ± 5.3% in ermo1-1 (Fig. 4.2.35A). The stromules were also shorter noticeably than those
of control plants (control: 3.04 ± 0.28 µm, ermo1-1: 1.74 ± 0.14 µm; Fig. 4.2.35B). This difference
in plastid extension held under other growth conditions, as 7-day-old dark grown ermo1-1
seedlings had etioplasts that were considerably rounder (Shape Ratio: 0.70 ± 0.07) than control
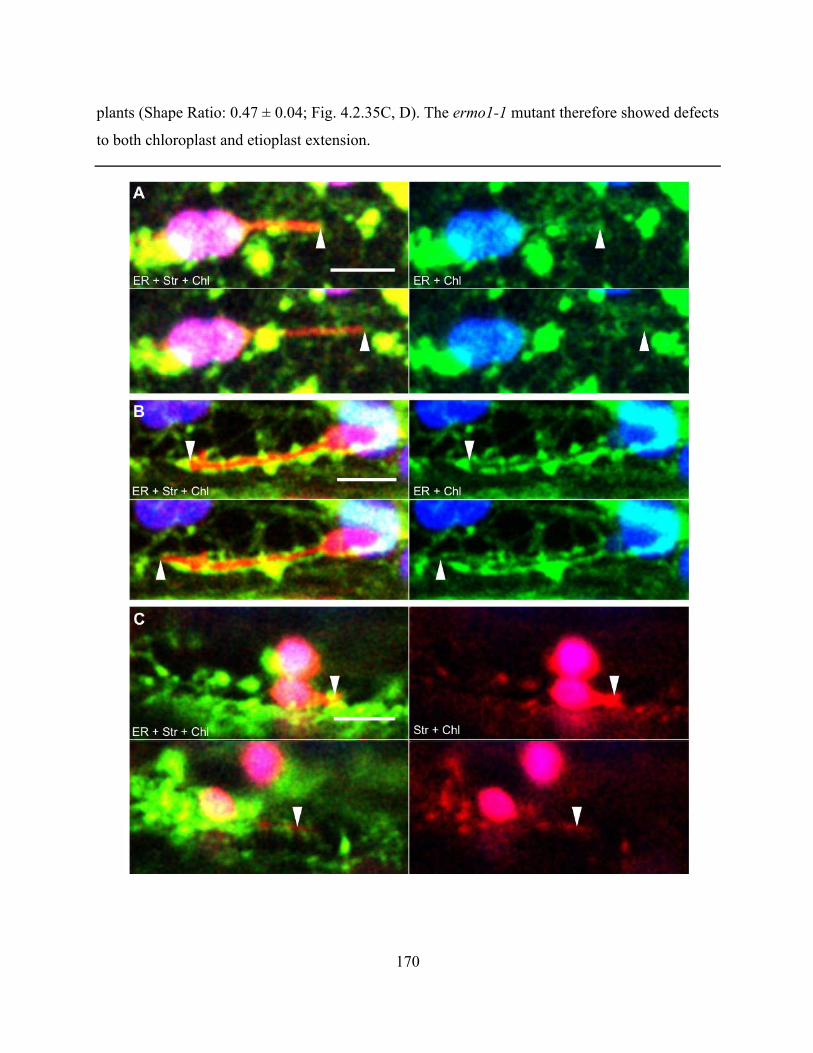
170
plants (Shape Ratio: 0.47 ± 0.04; Fig. 4.2.35C, D). The ermo1-1 mutant therefore showed defects
to both chloroplast and etioplast extension.
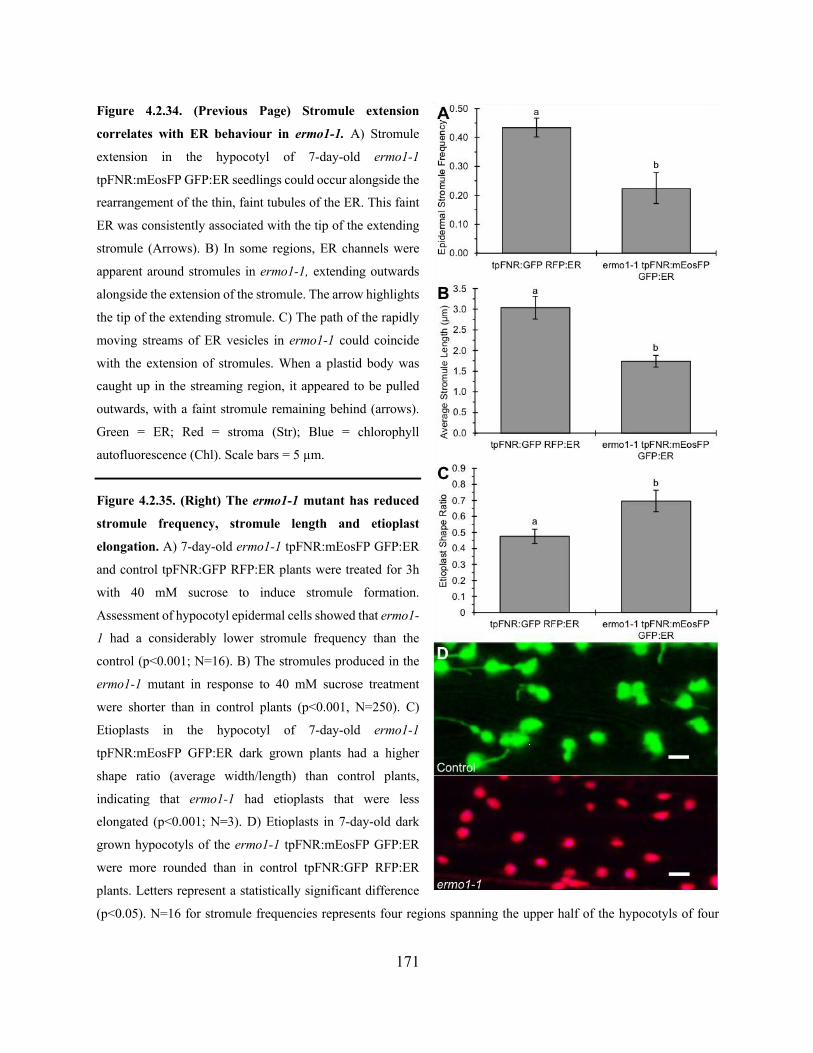
171
Figure 4.2.34. (Previous Page) Stromule extension
correlates with ER behaviour in ermo1-1. A) Stromule
extension in the hypocotyl of 7-day-old ermo1-1
tpFNR:mEosFP GFP:ER seedlings could occur alongside the
rearrangement of the thin, faint tubules of the ER. This faint
ER was consistently associated with the tip of the extending
stromule (Arrows). B) In some regions, ER channels were
apparent around stromules in ermo1-1, extending outwards
alongside the extension of the stromule. The arrow highlights
the tip of the extending stromule. C) The path of the rapidly
moving streams of ER vesicles in ermo1-1 could coincide
with the extension of stromules. When a plastid body was
caught up in the streaming region, it appeared to be pulled
outwards, with a faint stromule remaining behind (arrows).
Green = ER; Red = stroma (Str); Blue = chlorophyll
autofluorescence (Chl). Scale bars = 5 µm.
Figure 4.2.35. (Right) The ermo1-1 mutant has reduced
stromule frequency, stromule length and etioplast
elongation. A) 7-day-old ermo1-1 tpFNR:mEosFP GFP:ER
and control tpFNR:GFP RFP:ER plants were treated for 3h
with 40 mM sucrose to induce stromule formation.
Assessment of hypocotyl epidermal cells showed that ermo1-
1 had a considerably lower stromule frequency than the
control (p<0.001; N=16). B) The stromules produced in the
ermo1-1 mutant in response to 40 mM sucrose treatment
were shorter than in control plants (p<0.001, N=250). C)
Etioplasts in the hypocotyl of 7-day-old ermo1-1
tpFNR:mEosFP GFP:ER dark grown plants had a higher
shape ratio (average width/length) than control plants,
indicating that ermo1-1 had etioplasts that were less
elongated (p<0.001; N=3). D) Etioplasts in 7-day-old dark
grown hypocotyls of the ermo1-1 tpFNR:mEosFP GFP:ER
were more rounded than in control tpFNR:GFP RFP:ER
plants. Letters represent a statistically significant difference
(p<0.05). N=16 for stromule frequencies represents four regions spanning the upper half of the hypocotyls of four
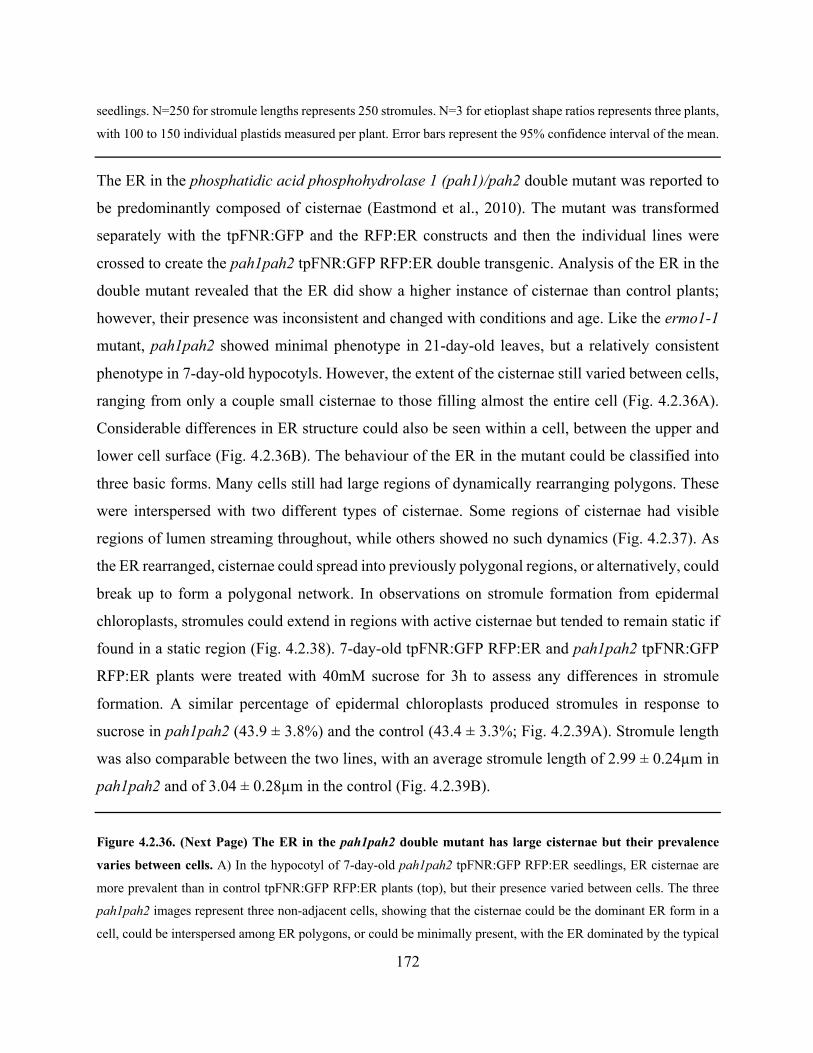
172
seedlings. N=250 for stromule lengths represents 250 stromules. N=3 for etioplast shape ratios represents three plants,
with 100 to 150 individual plastids measured per plant. Error bars represent the 95% confidence interval of the mean.
The ER in the phosphatidic acid phosphohydrolase 1 (pah1)/pah2 double mutant was reported to
be predominantly composed of cisternae (Eastmond et al., 2010). The mutant was transformed
separately with the tpFNR:GFP and the RFP:ER constructs and then the individual lines were
crossed to create the pah1pah2 tpFNR:GFP RFP:ER double transgenic. Analysis of the ER in the
double mutant revealed that the ER did show a higher instance of cisternae than control plants;
however, their presence was inconsistent and changed with conditions and age. Like the ermo1-1
mutant, pah1pah2 showed minimal phenotype in 21-day-old leaves, but a relatively consistent
phenotype in 7-day-old hypocotyls. However, the extent of the cisternae still varied between cells,
ranging from only a couple small cisternae to those filling almost the entire cell (Fig. 4.2.36A).
Considerable differences in ER structure could also be seen within a cell, between the upper and
lower cell surface (Fig. 4.2.36B). The behaviour of the ER in the mutant could be classified into
three basic forms. Many cells still had large regions of dynamically rearranging polygons. These
were interspersed with two different types of cisternae. Some regions of cisternae had visible
regions of lumen streaming throughout, while others showed no such dynamics (Fig. 4.2.37). As
the ER rearranged, cisternae could spread into previously polygonal regions, or alternatively, could
break up to form a polygonal network. In observations on stromule formation from epidermal
chloroplasts, stromules could extend in regions with active cisternae but tended to remain static if
found in a static region (Fig. 4.2.38). 7-day-old tpFNR:GFP RFP:ER and pah1pah2 tpFNR:GFP
RFP:ER plants were treated with 40mM sucrose for 3h to assess any differences in stromule
formation. A similar percentage of epidermal chloroplasts produced stromules in response to
sucrose in pah1pah2 (43.9 ± 3.8%) and the control (43.4 ± 3.3%; Fig. 4.2.39A). Stromule length
was also comparable between the two lines, with an average stromule length of 2.99 ± 0.24µm in
pah1pah2 and of 3.04 ± 0.28µm in the control (Fig. 4.2.39B).
Figure 4.2.36. (Next Page) The ER in the pah1pah2 double mutant has large cisternae but their prevalence
varies between cells. A) In the hypocotyl of 7-day-old pah1pah2 tpFNR:GFP RFP:ER seedlings, ER cisternae are
more prevalent than in control tpFNR:GFP RFP:ER plants (top), but their presence varied between cells. The three
pah1pah2 images represent three non-adjacent cells, showing that the cisternae could be the dominant ER form in a
cell, could be interspersed among ER polygons, or could be minimally present, with the ER dominated by the typical
173
polygonal reticulum. B) ER form in 7-day-old pah1pah2 hypocotyls could vary within a cell, with the images showing
a number of cisternae on the upper surface of an epidermal cell but a primarily polygonal ER on the lower surface of
the same cell. Red = ER lumen. Scale bars = 10 µm
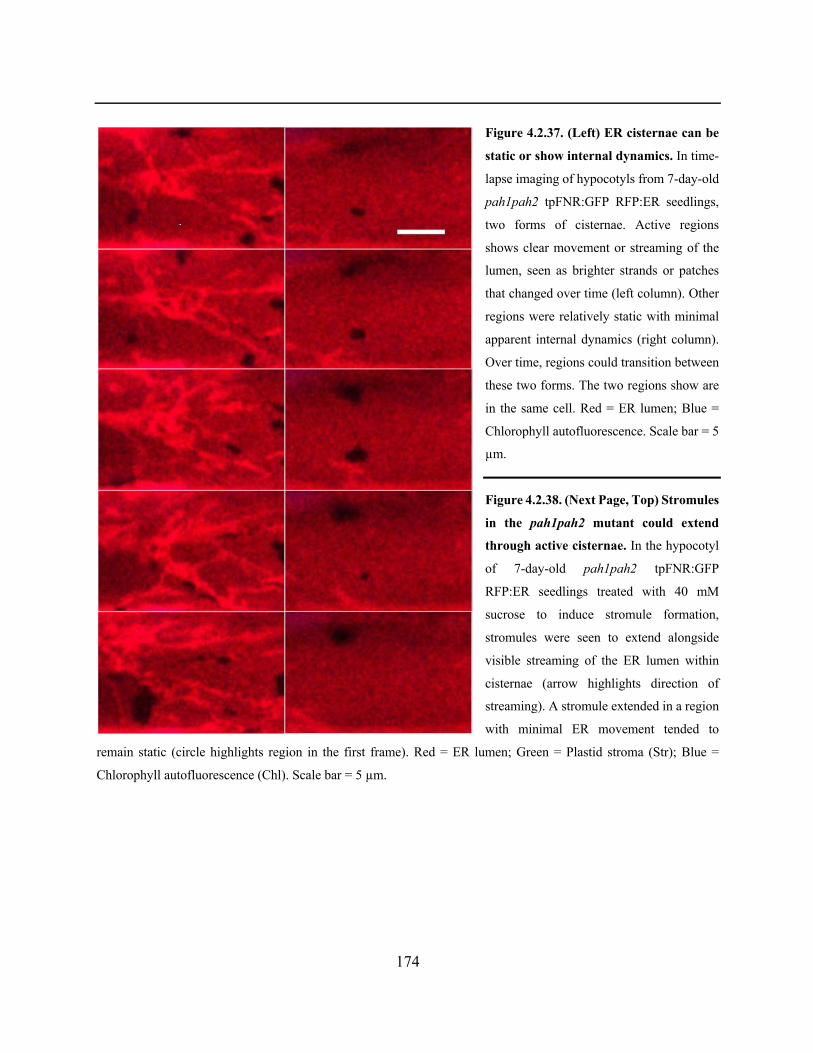
174
Figure 4.2.37. (Left) ER cisternae can be
static or show internal dynamics. In time-
lapse imaging of hypocotyls from 7-day-old
pah1pah2 tpFNR:GFP RFP:ER seedlings,
two forms of cisternae. Active regions
shows clear movement or streaming of the
lumen, seen as brighter strands or patches
that changed over time (left column). Other
regions were relatively static with minimal
apparent internal dynamics (right column).
Over time, regions could transition between
these two forms. The two regions show are
in the same cell. Red = ER lumen; Blue =
Chlorophyll autofluorescence. Scale bar = 5
µm.
Figure 4.2.38. (Next Page, Top) Stromules
in the pah1pah2 mutant could extend
through active cisternae. In the hypocotyl
of 7-day-old pah1pah2 tpFNR:GFP
RFP:ER seedlings treated with 40 mM
sucrose to induce stromule formation,
stromules were seen to extend alongside
visible streaming of the ER lumen within
cisternae (arrow highlights direction of
streaming). A stromule extended in a region
with minimal ER movement tended to
remain static (circle highlights region in the first frame). Red = ER lumen; Green = Plastid stroma (Str); Blue =
Chlorophyll autofluorescence (Chl). Scale bar = 5 µm.

175
Figure 4.2.39. Stromules in the pah1pah2 mutant could extend through active cisternae. In the hypocotyl of 7-
day-old pah1pah2 tpFNR:GFP RFP:ER seedlings treated with 40 mM sucrose to induce stromule formation, stromules
were seen to extend alongside visible streaming of the ER lumen within cisternae (arrow highlights direction of
streaming). A stromule extended in a region with minimal ER movement tended to remain static (circle highlights
region in the first frame). Red = ER lumen; Green = Plastid stroma (Str); Blue = Chlorophyll autofluorescence (Chl).
Scale bar = 5 µm.
176
4.2.6.1 Transient dilation and gaps in fluorescence of tubular extensions coincide with the
position of ER tubules
In stromules extending from chloroplasts and in tubular regions of leucoplasts, transient dilations
are occasionally seen, which have been termed GFP “packets” in previous studies (Köhler et al.,
2000; Pyke and Howells, 2002). We found that in 50 instances of dilated plastid tubules, in 46
cases the dilations occurred while a stromule or whole plastid was in the process of extending,
while in the other four cases the whole plastid was moving, but no clear change in length could be
seen. Dilations did not appear to occur during retraction of an extension. The dilations could be
maintained for a period of time if the tubule remained extended but disappeared if the tubule
retracted (Fig. 4.2.40A). If a plastid extended and retracted several times in rapid succession,
dilations could either appear in the same or in distinct positions. When they were observed in the
tpFNR:GFP RFP:ER line, an ER tubule was seen to cross at the leading edge (Fig. 4.2.40B) or at
both sides of many dilations (Fig. 4.2.40C).
Observations of the dilation dynamics and the correlation with ER tubules gave the impression
that the dilations were caused by a backup of the flow of stroma within an extending plastid. This
raised the question of whether the dilations occurred in other tubular structures rather than being a
plastid-specific behaviour. The abnormal peroxisome morphology 1-1 (apm1-1) mutant has
tubular peroxisomes as a result of a division defect (Mano et al., 2004). As with tubular plastidial
structures, elongated peroxisomes showed transient dilations and these occurred during elongation
or movement but not during retraction. A correlation between dilations and the crossing of an ER
tubule was often seen (Fig. 4.2.40D). Transient dilations were therefore a common feature of
tubular structure in the cell rather than a plastid-specific phenomenon, and their position often
corresponded with the intersection of the extending tubules and the ER regardless of the organelle
being observed.
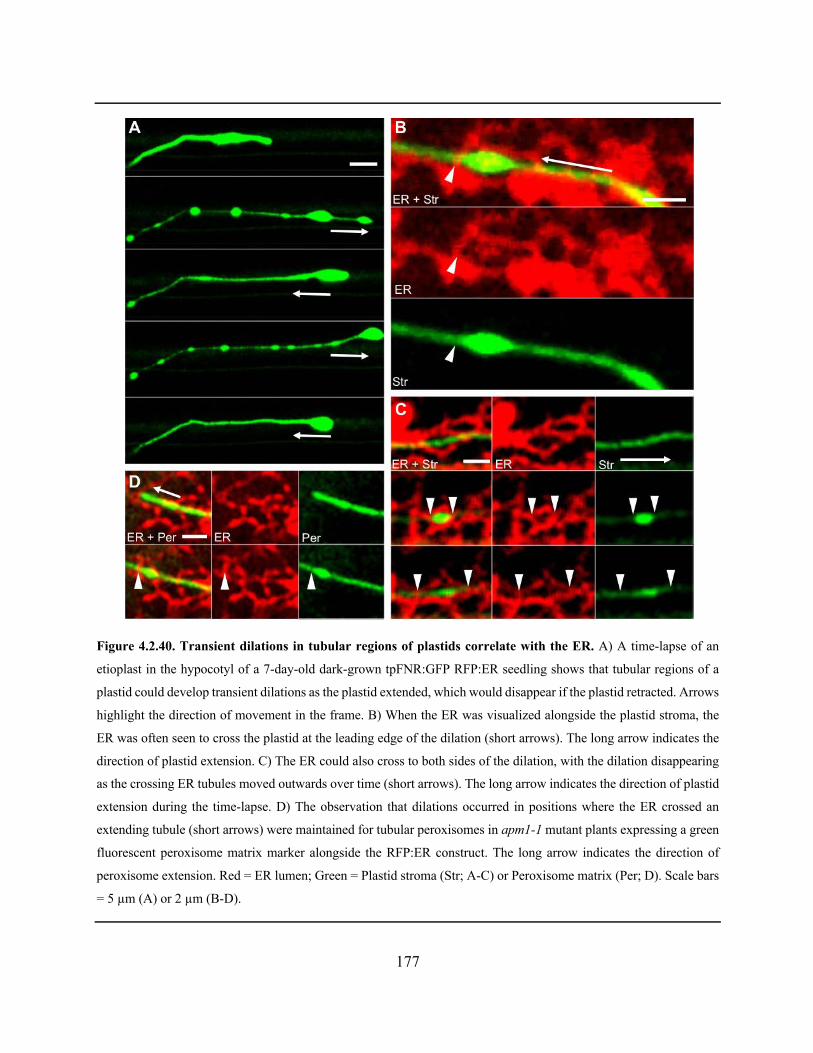
177
Figure 4.2.40. Transient dilations in tubular regions of plastids correlate with the ER. A) A time-lapse of an
etioplast in the hypocotyl of a 7-day-old dark-grown tpFNR:GFP RFP:ER seedling shows that tubular regions of a
plastid could develop transient dilations as the plastid extended, which would disappear if the plastid retracted. Arrows
highlight the direction of movement in the frame. B) When the ER was visualized alongside the plastid stroma, the
ER was often seen to cross the plastid at the leading edge of the dilation (short arrows). The long arrow indicates the
direction of plastid extension. C) The ER could also cross to both sides of the dilation, with the dilation disappearing
as the crossing ER tubules moved outwards over time (short arrows). The long arrow indicates the direction of plastid
extension during the time-lapse. D) The observation that dilations occurred in positions where the ER crossed an
extending tubule (short arrows) were maintained for tubular peroxisomes in apm1-1 mutant plants expressing a green
fluorescent peroxisome matrix marker alongside the RFP:ER construct. The long arrow indicates the direction of
peroxisome extension. Red = ER lumen; Green = Plastid stroma (Str; A-C) or Peroxisome matrix (Per; D). Scale bars
= 5 µm (A) or 2 µm (B-D).
178
Another characteristic occasionally seen in extended plastid tubules were small regions of minimal
to no stromal fluorescence in an apparently continuous tubule. These gaps were most easily
observed in etioplasts in 7-day-old dark grown seedlings. They could form during or after
extension and could be maintained as a plastid extended, retracted or moved. Observations in the
tpFNR:GFP RFP:ER line revealed that the regions of a tubule lacking fluorescence typically
correlated with regions where an ER tubule (Fig. 4.2.41A) or a streaming ER strand crossed the
plastid. When a gapped region moved, a corresponding change in the position of the ER was noted,
such that the crossing of the ER and the gap in the fluorescence stayed together (Fig. 4.2.41B).
Further, a gap in a tubular etioplast could split into two simultaneous with the splitting of a
streaming region of ER (Fig. 4.2.41C) or the divergence of a single ER polygon into two (Fig.
4.2.41D). Two common variations in the form of tubular plastid extensions, the formation of
dilations and of gaps in stromal fluorescence, were therefore correlated with regions where the
plastid and the ER intersected.
Figure 4.2.41. (Next Page) Gaps in stromal fluorescence within a tubular region of plastid correlated with the
ER. A) An etioplast in the hypocotyl of a dark-grown 7-day-old tpFNR:GFP RFP:ER seedling shows gaps in
fluorescence in a tubular region that correspond to regions of ER crossing (arrows). B) A gap in stromal fluorescence
that correlates with a position of ER streaming shifts alongside the movement of the streaming ER. C) As one
streaming region of ER splits into two and then rejoins, the gaps in fluorescence in a plastid crossed by the ER strands
do so as well. Arrows indicate the trajectory of the ER strands. D) The splitting of one gap in a plastid tubule into two
could occur alongside the rearrangement of the ER tubules. The lower two rows of images show an enlarged view of
the area in the white box, with the upper one showing a tracing of the ER tubules in the region to simplify comparison.
The arrows highlight a single ER tubule spreading into two simultaneously with the formation and spreading of two
gaps in plastid fluorescence. Red = ER lumen; Green = Plastid stroma (Str). Scale bars = 5µm.
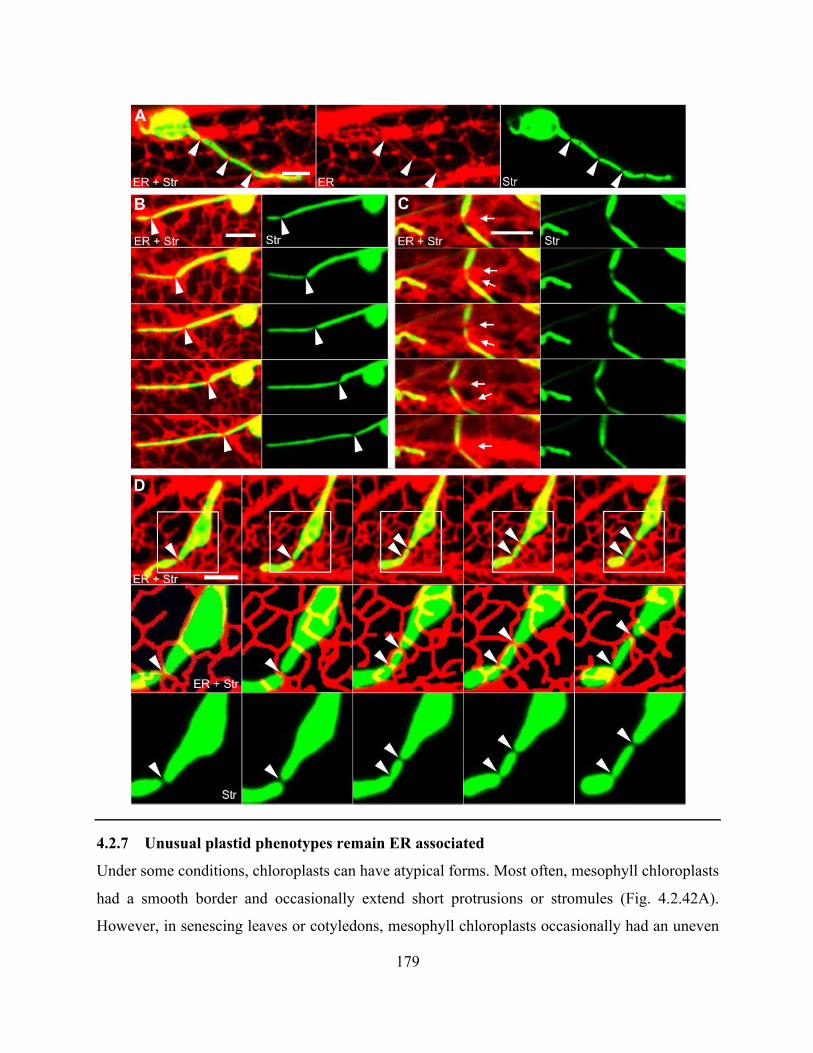
179
4.2.7 Unusual plastid phenotypes remain ER associated
Under some conditions, chloroplasts can have atypical forms. Most often, mesophyll chloroplasts
had a smooth border and occasionally extend short protrusions or stromules (Fig. 4.2.42A).
However, in senescing leaves or cotyledons, mesophyll chloroplasts occasionally had an uneven
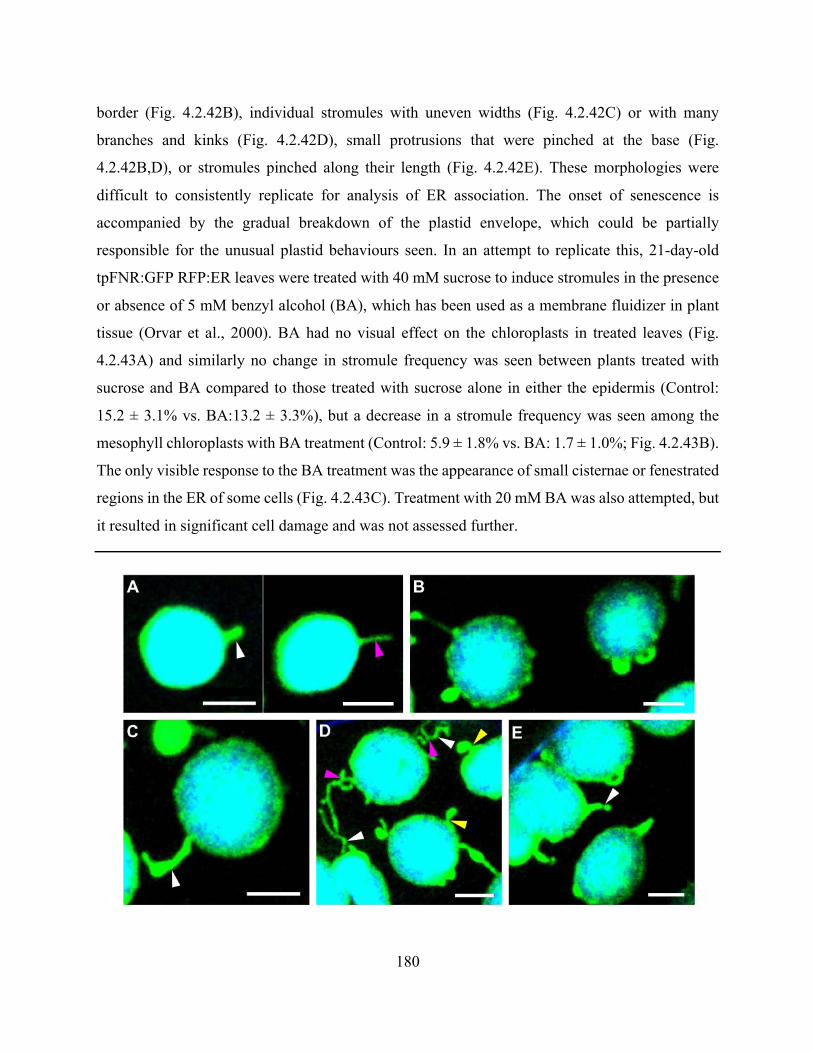
180
border (Fig. 4.2.42B), individual stromules with uneven widths (Fig. 4.2.42C) or with many
branches and kinks (Fig. 4.2.42D), small protrusions that were pinched at the base (Fig.
4.2.42B,D), or stromules pinched along their length (Fig. 4.2.42E). These morphologies were
difficult to consistently replicate for analysis of ER association. The onset of senescence is
accompanied by the gradual breakdown of the plastid envelope, which could be partially
responsible for the unusual plastid behaviours seen. In an attempt to replicate this, 21-day-old
tpFNR:GFP RFP:ER leaves were treated with 40 mM sucrose to induce stromules in the presence
or absence of 5 mM benzyl alcohol (BA), which has been used as a membrane fluidizer in plant
tissue (Orvar et al., 2000). BA had no visual effect on the chloroplasts in treated leaves (Fig.
4.2.43A) and similarly no change in stromule frequency was seen between plants treated with
sucrose and BA compared to those treated with sucrose alone in either the epidermis (Control:
15.2 ± 3.1% vs. BA:13.2 ± 3.3%), but a decrease in a stromule frequency was seen among the
mesophyll chloroplasts with BA treatment (Control: 5.9 ± 1.8% vs. BA: 1.7 ± 1.0%; Fig. 4.2.43B).
The only visible response to the BA treatment was the appearance of small cisternae or fenestrated
regions in the ER of some cells (Fig. 4.2.43C). Treatment with 20 mM BA was also attempted, but
it resulted in significant cell damage and was not assessed further.
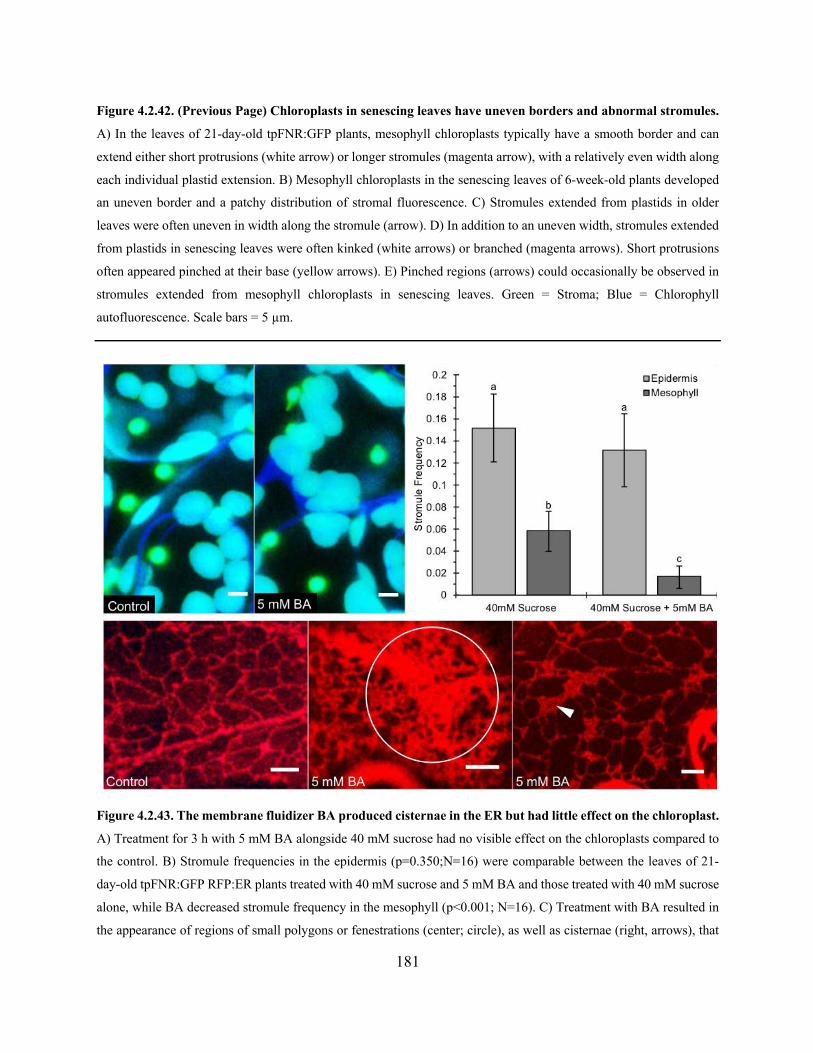
181
Figure 4.2.42. (Previous Page) Chloroplasts in senescing leaves have uneven borders and abnormal stromules.
A) In the leaves of 21-day-old tpFNR:GFP plants, mesophyll chloroplasts typically have a smooth border and can
extend either short protrusions (white arrow) or longer stromules (magenta arrow), with a relatively even width along
each individual plastid extension. B) Mesophyll chloroplasts in the senescing leaves of 6-week-old plants developed
an uneven border and a patchy distribution of stromal fluorescence. C) Stromules extended from plastids in older
leaves were often uneven in width along the stromule (arrow). D) In addition to an uneven width, stromules extended
from plastids in senescing leaves were often kinked (white arrows) or branched (magenta arrows). Short protrusions
often appeared pinched at their base (yellow arrows). E) Pinched regions (arrows) could occasionally be observed in
stromules extended from mesophyll chloroplasts in senescing leaves. Green = Stroma; Blue = Chlorophyll
autofluorescence. Scale bars = 5 µm.
Figure 4.2.43. The membrane fluidizer BA produced cisternae in the ER but had little effect on the chloroplast.
A) Treatment for 3 h with 5 mM BA alongside 40 mM sucrose had no visible effect on the chloroplasts compared to
the control. B) Stromule frequencies in the epidermis (p=0.350;N=16) were comparable between the leaves of 21-
day-old tpFNR:GFP RFP:ER plants treated with 40 mM sucrose and 5 mM BA and those treated with 40 mM sucrose
alone, while BA decreased stromule frequency in the mesophyll (p<0.001; N=16). C) Treatment with BA resulted in
the appearance of regions of small polygons or fenestrations (center; circle), as well as cisternae (right, arrows), that
182
were not present in control plants. Red = ER lumen; Green = Plastid stroma; Blue = Chlorophyll autofluorescence.
Scale bars = 5 µm. Letters represent a statistically significant difference (p<0.05). N=16 represents four plants, with
two regions imaged in the first two leaves for each plant. Error bars represent the 95% confidence interval of the mean.
In order to evaluate ER behaviour around more varied plastid shapes we therefore selected three
mutants. The maltose excess (mex1) mutant was reported to show a chlorotic phenotype and
unusual chloroplast morphology due to an inability to export the starch breakdown product,
maltose, from the chloroplast (Niittylä et al., 2004; Stettler et al., 2009). Immutans (im) was
characterized as a variegated mutant with both leucoplasts and chloroplasts in aerial tissues
(Wetzel et al., 1994; Aluru et al., 2001). The accumulation and replication of chloroplasts 6 (arc6)
mutant was reported to exhibit large unusually shaped chloroplasts due to a defect in division, as
well as having a high number of stromules (Pyke et al., 1994; Holzinger et al., 2008), and has
plastid morphology that varies by cell type (Fujiwara et al., 2018). For each of these mutants, we
generated stable transgenic lines expressing the RFP:ER construct and lines expressing the
tpFNR:GFP construct. The lines were crossed to create double transgenic tpFNR:GFP RFP:ER
mutants in which the ER lumen and the plastid stroma were simultaneously highlighted.
The mex1 tpFNR:GFP plants showed an age-dependent gradient of chloroplast morphologies. In
both control and mex1 lines, 21-day-old plants had three pairs of true leaves and a pair of
cotyledons. The control line showed similar mesophyll chloroplast behaviour across all aerial
tissues. Chloroplasts had a smooth border and the extension of broad or thin extensions was
relatively rare, though more common in cotyledons than in the true leaves (Fig. 4.2.44A). In
contrast, the mex1 mutant showed this normal chloroplast behaviour only in the youngest leaves
in most plants. Mesophyll chloroplasts in the second set of true leaves began to show unusual
behaviours. They had more frequent stromules (Fig. 4.2.44B), vesicles of stroma not visibly
connected to a plastid (Fig. 4.2.44B), stromules and whole chloroplasts with uneven borders (Fig.
4.2.44C), looped regions of stroma extending from the chloroplast body or found within an
extended stromule (Fig. 4.2.44D), and small protrusions with pinched bases (Fig. 4.2.44D). In the
oldest leaves and cotyledons, many mesophyll chloroplasts were swollen, with a clear spatial
distinction between the fluorescent signals from the chlorophyll and from the stroma. Starch grains
present in these plastids tended to be found only in the chlorophyll-containing regions (Fig.
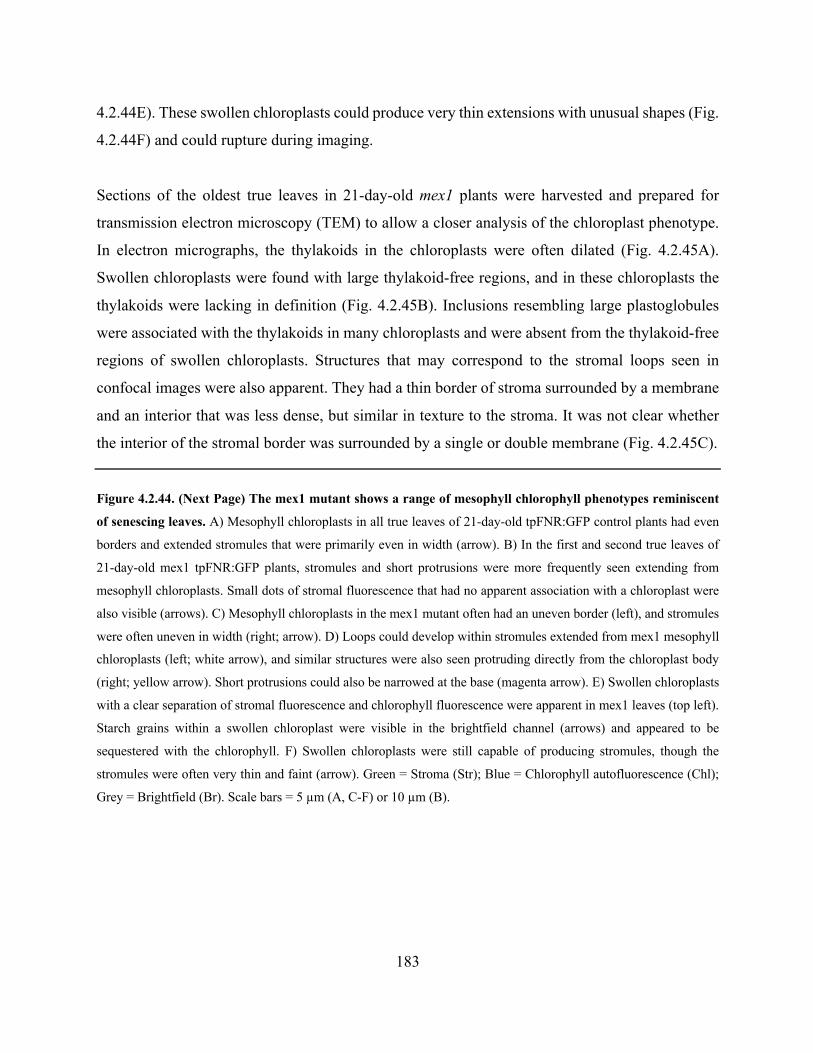
183
4.2.44E). These swollen chloroplasts could produce very thin extensions with unusual shapes (Fig.
4.2.44F) and could rupture during imaging.
Sections of the oldest true leaves in 21-day-old mex1 plants were harvested and prepared for
transmission electron microscopy (TEM) to allow a closer analysis of the chloroplast phenotype.
In electron micrographs, the thylakoids in the chloroplasts were often dilated (Fig. 4.2.45A).
Swollen chloroplasts were found with large thylakoid-free regions, and in these chloroplasts the
thylakoids were lacking in definition (Fig. 4.2.45B). Inclusions resembling large plastoglobules
were associated with the thylakoids in many chloroplasts and were absent from the thylakoid-free
regions of swollen chloroplasts. Structures that may correspond to the stromal loops seen in
confocal images were also apparent. They had a thin border of stroma surrounded by a membrane
and an interior that was less dense, but similar in texture to the stroma. It was not clear whether
the interior of the stromal border was surrounded by a single or double membrane (Fig. 4.2.45C).
Figure 4.2.44. (Next Page) The mex1 mutant shows a range of mesophyll chlorophyll phenotypes reminiscent
of senescing leaves. A) Mesophyll chloroplasts in all true leaves of 21-day-old tpFNR:GFP control plants had even
borders and extended stromules that were primarily even in width (arrow). B) In the first and second true leaves of
21-day-old mex1 tpFNR:GFP plants, stromules and short protrusions were more frequently seen extending from
mesophyll chloroplasts. Small dots of stromal fluorescence that had no apparent association with a chloroplast were
also visible (arrows). C) Mesophyll chloroplasts in the mex1 mutant often had an uneven border (left), and stromules
were often uneven in width (right; arrow). D) Loops could develop within stromules extended from mex1 mesophyll
chloroplasts (left; white arrow), and similar structures were also seen protruding directly from the chloroplast body
(right; yellow arrow). Short protrusions could also be narrowed at the base (magenta arrow). E) Swollen chloroplasts
with a clear separation of stromal fluorescence and chlorophyll fluorescence were apparent in mex1 leaves (top left).
Starch grains within a swollen chloroplast were visible in the brightfield channel (arrows) and appeared to be
sequestered with the chlorophyll. F) Swollen chloroplasts were still capable of producing stromules, though the
stromules were often very thin and faint (arrow). Green = Stroma (Str); Blue = Chlorophyll autofluorescence (Chl);
Grey = Brightfield (Br). Scale bars = 5 µm (A, C-F) or 10 µm (B).
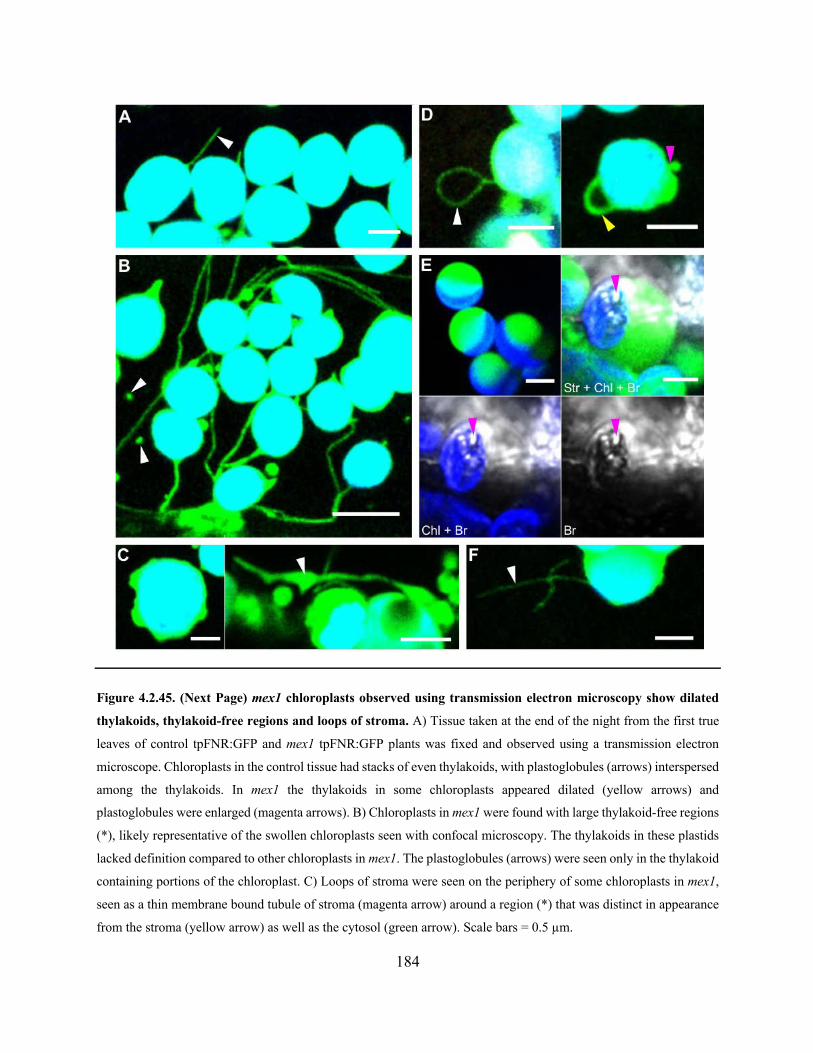
184
Figure 4.2.45. (Next Page) mex1 chloroplasts observed using transmission electron microscopy show dilated
thylakoids, thylakoid-free regions and loops of stroma. A) Tissue taken at the end of the night from the first true
leaves of control tpFNR:GFP and mex1 tpFNR:GFP plants was fixed and observed using a transmission electron
microscope. Chloroplasts in the control tissue had stacks of even thylakoids, with plastoglobules (arrows) interspersed
among the thylakoids. In mex1 the thylakoids in some chloroplasts appeared dilated (yellow arrows) and
plastoglobules were enlarged (magenta arrows). B) Chloroplasts in mex1 were found with large thylakoid-free regions
(*), likely representative of the swollen chloroplasts seen with confocal microscopy. The thylakoids in these plastids
lacked definition compared to other chloroplasts in mex1. The plastoglobules (arrows) were seen only in the thylakoid
containing portions of the chloroplast. C) Loops of stroma were seen on the periphery of some chloroplasts in mex1,
seen as a thin membrane bound tubule of stroma (magenta arrow) around a region (*) that was distinct in appearance
from the stroma (yellow arrow) as well as the cytosol (green arrow). Scale bars = 0.5 µm.
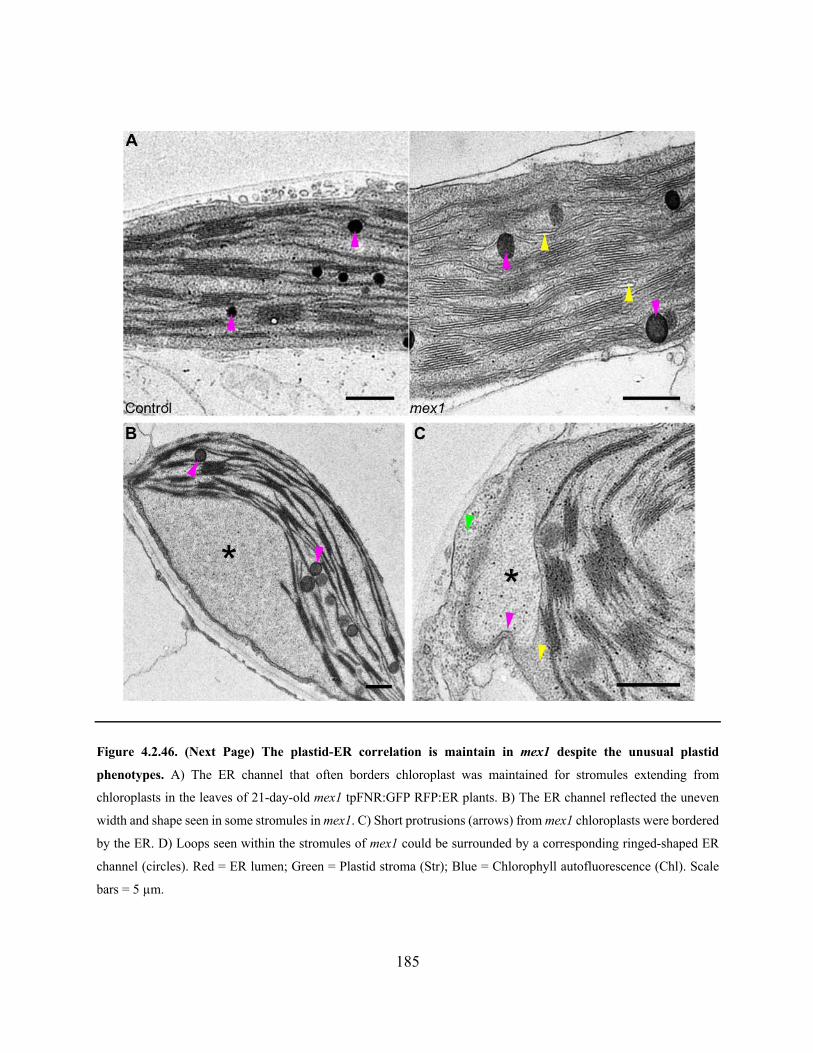
185
Figure 4.2.46. (Next Page) The plastid-ER correlation is maintain in mex1 despite the unusual plastid
phenotypes. A) The ER channel that often borders chloroplast was maintained for stromules extending from
chloroplasts in the leaves of 21-day-old mex1 tpFNR:GFP RFP:ER plants. B) The ER channel reflected the uneven
width and shape seen in some stromules in mex1. C) Short protrusions (arrows) from mex1 chloroplasts were bordered
by the ER. D) Loops seen within the stromules of mex1 could be surrounded by a corresponding ringed-shaped ER
channel (circles). Red = ER lumen; Green = Plastid stroma (Str); Blue = Chlorophyll autofluorescence (Chl). Scale
bars = 5 µm.
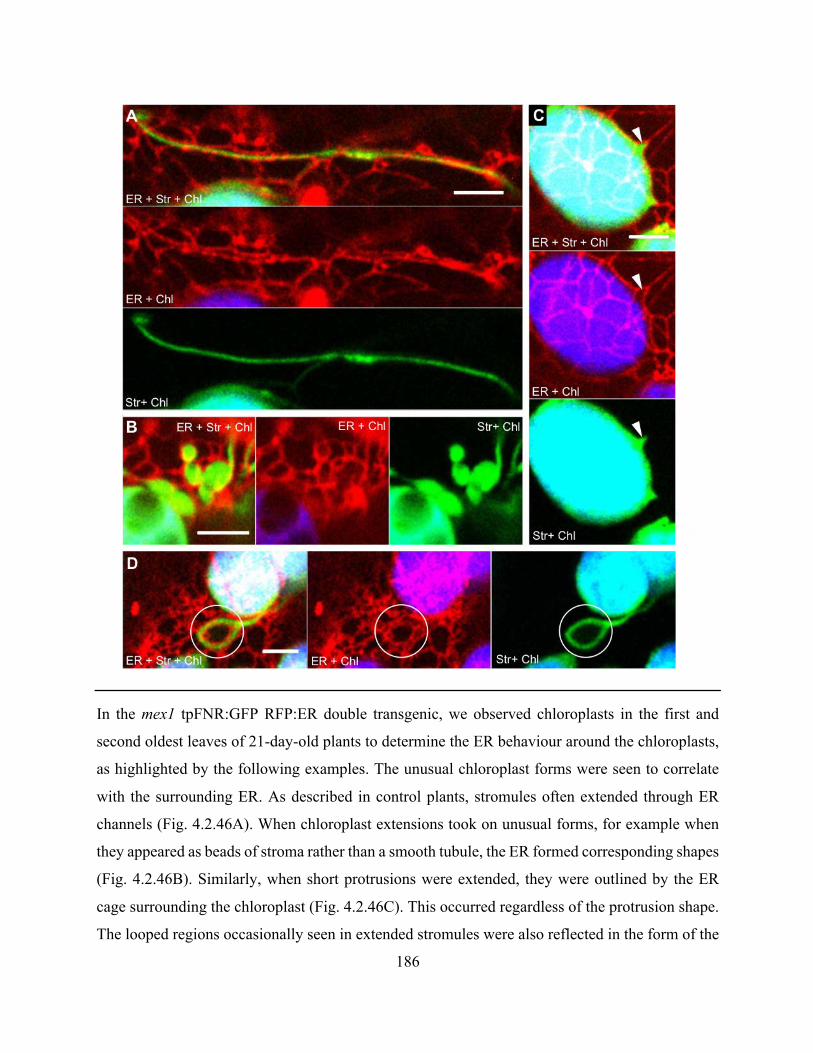
186
In the mex1 tpFNR:GFP RFP:ER double transgenic, we observed chloroplasts in the first and
second oldest leaves of 21-day-old plants to determine the ER behaviour around the chloroplasts,
as highlighted by the following examples. The unusual chloroplast forms were seen to correlate
with the surrounding ER. As described in control plants, stromules often extended through ER
channels (Fig. 4.2.46A). When chloroplast extensions took on unusual forms, for example when
they appeared as beads of stroma rather than a smooth tubule, the ER formed corresponding shapes
(Fig. 4.2.46B). Similarly, when short protrusions were extended, they were outlined by the ER
cage surrounding the chloroplast (Fig. 4.2.46C). This occurred regardless of the protrusion shape.
The looped regions occasionally seen in extended stromules were also reflected in the form of the
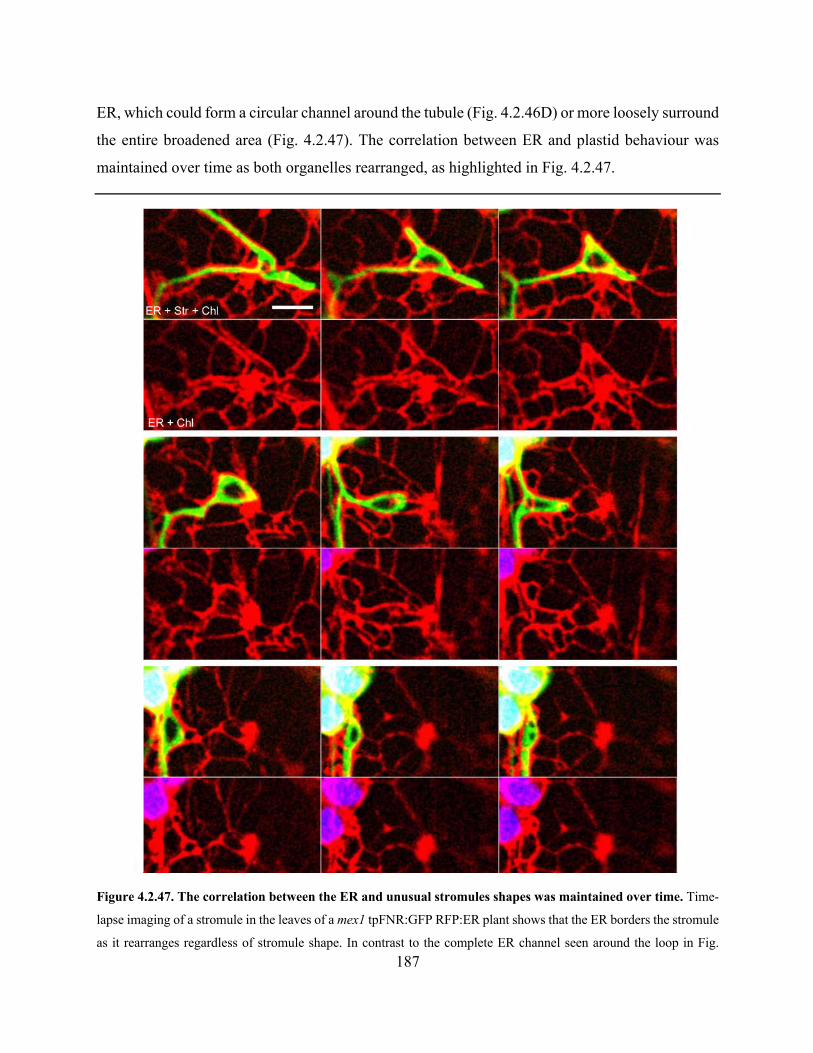
187
ER, which could form a circular channel around the tubule (Fig. 4.2.46D) or more loosely surround
the entire broadened area (Fig. 4.2.47). The correlation between ER and plastid behaviour was
maintained over time as both organelles rearranged, as highlighted in Fig. 4.2.47.
Figure 4.2.47. The correlation between the ER and unusual stromules shapes was maintained over time. Time-
lapse imaging of a stromule in the leaves of a mex1 tpFNR:GFP RFP:ER plant shows that the ER borders the stromule
as it rearranges regardless of stromule shape. In contrast to the complete ER channel seen around the loop in Fig.
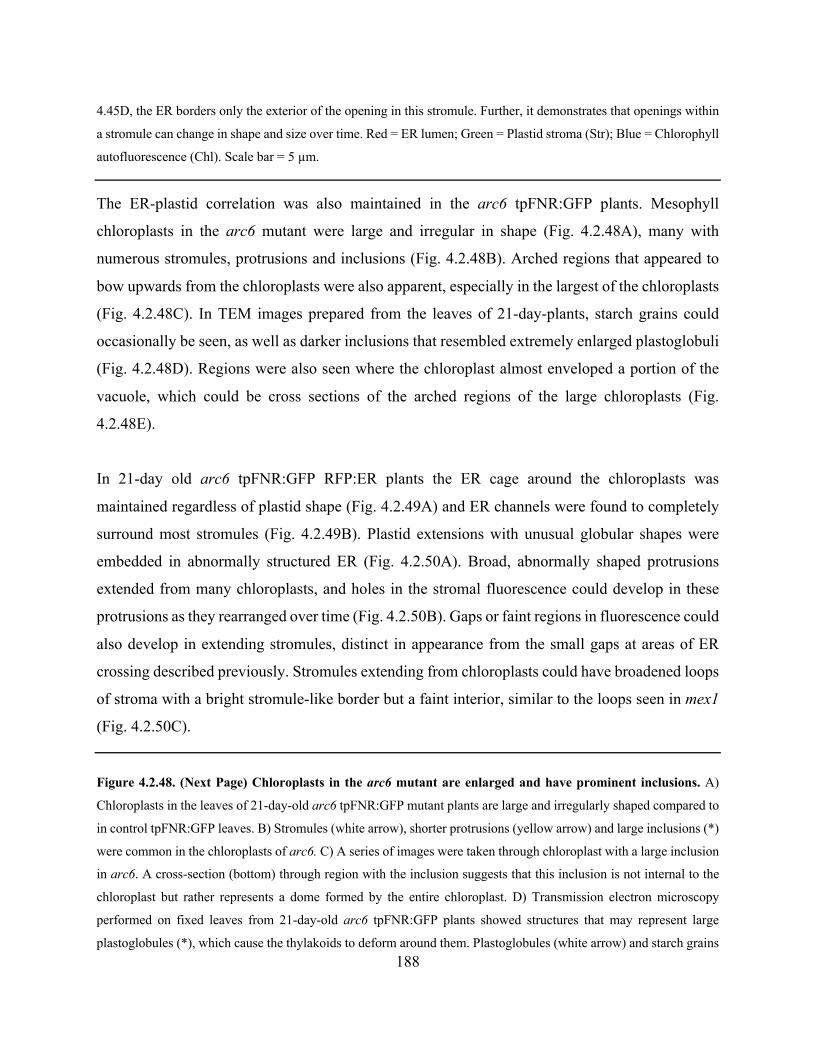
188
4.45D, the ER borders only the exterior of the opening in this stromule. Further, it demonstrates that openings within
a stromule can change in shape and size over time. Red = ER lumen; Green = Plastid stroma (Str); Blue = Chlorophyll
autofluorescence (Chl). Scale bar = 5 µm.
The ER-plastid correlation was also maintained in the arc6 tpFNR:GFP plants. Mesophyll
chloroplasts in the arc6 mutant were large and irregular in shape (Fig. 4.2.48A), many with
numerous stromules, protrusions and inclusions (Fig. 4.2.48B). Arched regions that appeared to
bow upwards from the chloroplasts were also apparent, especially in the largest of the chloroplasts
(Fig. 4.2.48C). In TEM images prepared from the leaves of 21-day-plants, starch grains could
occasionally be seen, as well as darker inclusions that resembled extremely enlarged plastoglobuli
(Fig. 4.2.48D). Regions were also seen where the chloroplast almost enveloped a portion of the
vacuole, which could be cross sections of the arched regions of the large chloroplasts (Fig.
4.2.48E).
In 21-day old arc6 tpFNR:GFP RFP:ER plants the ER cage around the chloroplasts was
maintained regardless of plastid shape (Fig. 4.2.49A) and ER channels were found to completely
surround most stromules (Fig. 4.2.49B). Plastid extensions with unusual globular shapes were
embedded in abnormally structured ER (Fig. 4.2.50A). Broad, abnormally shaped protrusions
extended from many chloroplasts, and holes in the stromal fluorescence could develop in these
protrusions as they rearranged over time (Fig. 4.2.50B). Gaps or faint regions in fluorescence could
also develop in extending stromules, distinct in appearance from the small gaps at areas of ER
crossing described previously. Stromules extending from chloroplasts could have broadened loops
of stroma with a bright stromule-like border but a faint interior, similar to the loops seen in mex1
(Fig. 4.2.50C).
Figure 4.2.48. (Next Page) Chloroplasts in the arc6 mutant are enlarged and have prominent inclusions. A)
Chloroplasts in the leaves of 21-day-old arc6 tpFNR:GFP mutant plants are large and irregularly shaped compared to
in control tpFNR:GFP leaves. B) Stromules (white arrow), shorter protrusions (yellow arrow) and large inclusions (*)
were common in the chloroplasts of arc6. C) A series of images were taken through chloroplast with a large inclusion
in arc6. A cross-section (bottom) through region with the inclusion suggests that this inclusion is not internal to the
chloroplast but rather represents a dome formed by the entire chloroplast. D) Transmission electron microscopy
performed on fixed leaves from 21-day-old arc6 tpFNR:GFP plants showed structures that may represent large
plastoglobules (*), which cause the thylakoids to deform around them. Plastoglobules (white arrow) and starch grains
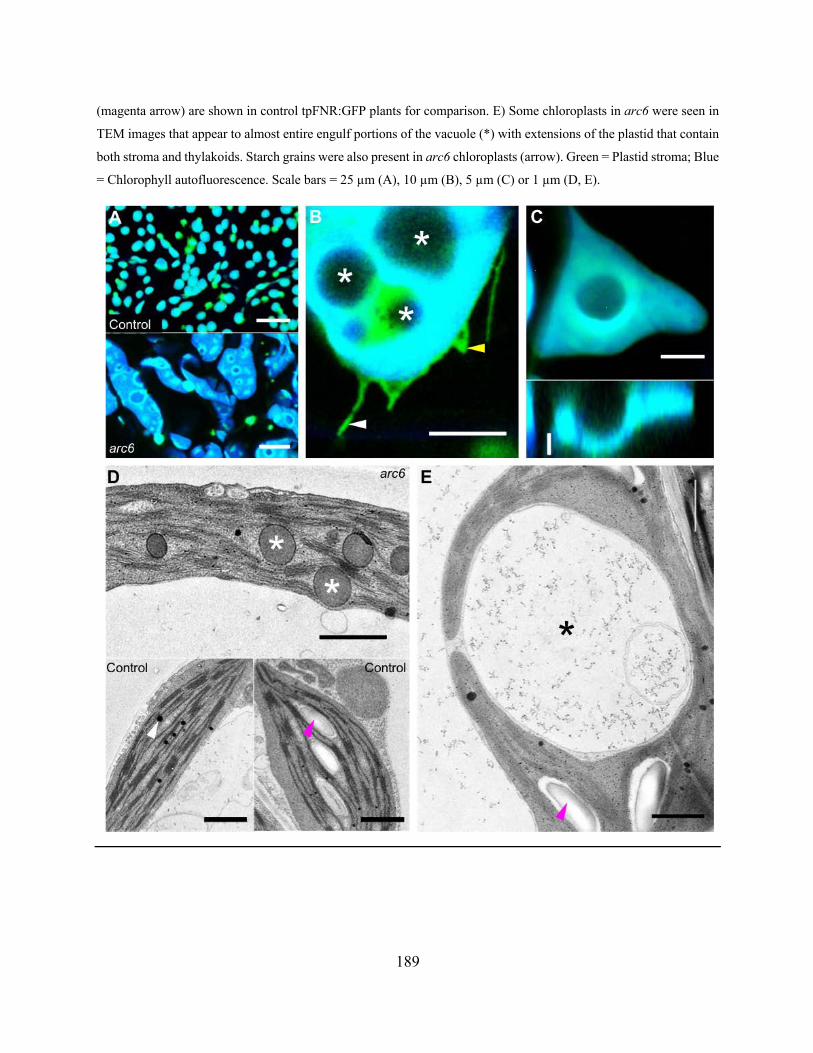
189
(magenta arrow) are shown in control tpFNR:GFP plants for comparison. E) Some chloroplasts in arc6 were seen in
TEM images that appear to almost entire engulf portions of the vacuole (*) with extensions of the plastid that contain
both stroma and thylakoids. Starch grains were also present in arc6 chloroplasts (arrow). Green = Plastid stroma; Blue
= Chlorophyll autofluorescence. Scale bars = 25 µm (A), 10 µm (B), 5 µm (C) or 1 µm (D, E).
190
Figure 4.2.49. The ER cage around chloroplasts and the ER channel around stromules were maintained in arc6
despite the large chloroplast size. A) A mesophyll chloroplast in the leaves of a 21-day-old arc6 tpFNR:GFP
RFP:ER plant has an ER cage (arrows) despite its enlarged size and unusual shape. B) Stromules in the arc6 mutant
often spanned the cell, but they remained associated with the ER along their length. Red = ER lumen; Green = Plastid
Stroma; Blue = Chlorophyll autofluorescence. Scale bars = 5 µm.
Figure 4.2.50. (Next Page) Abnormal plastid structures occurred often in arc6 and correlated with atypical
regions of ER. A) A region of oddly clustered plastid stroma in the epidermis of a 21-day-old arc6 tpFNR:GFP
RFP:ER plant was associated with similar clustering of the ER in the region. B) Chloroplasts in arc6 often produced
unusually shaped protrusions that could develop openings (arrows) similar to those seen in mex1. C) The openings
could also be present in stromules in arc6. The ER bordered both the thin portion of the stromule and the broadened
region. Stromules in arc6 also developed occasional regions of faint fluorescence that had no apparent correlation
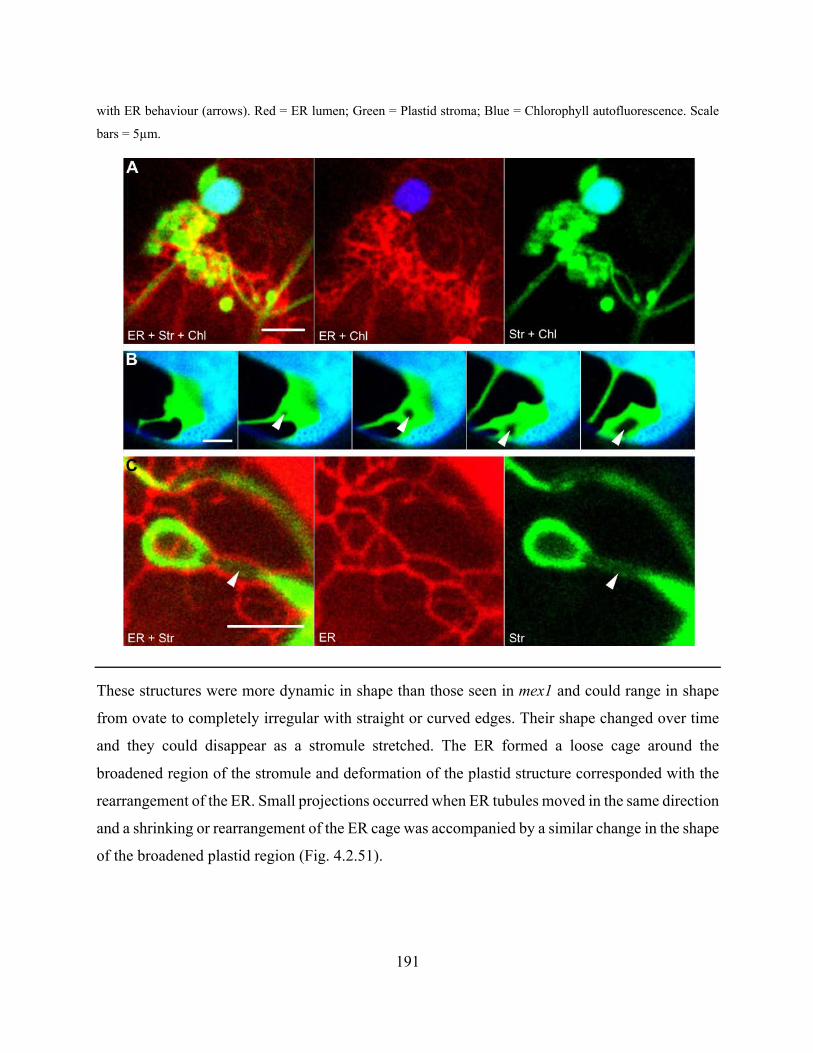
191
with ER behaviour (arrows). Red = ER lumen; Green = Plastid stroma; Blue = Chlorophyll autofluorescence. Scale
bars = 5µm.
These structures were more dynamic in shape than those seen in mex1 and could range in shape
from ovate to completely irregular with straight or curved edges. Their shape changed over time
and they could disappear as a stromule stretched. The ER formed a loose cage around the
broadened region of the stromule and deformation of the plastid structure corresponded with the
rearrangement of the ER. Small projections occurred when ER tubules moved in the same direction
and a shrinking or rearrangement of the ER cage was accompanied by a similar change in the shape
of the broadened plastid region (Fig. 4.2.51).
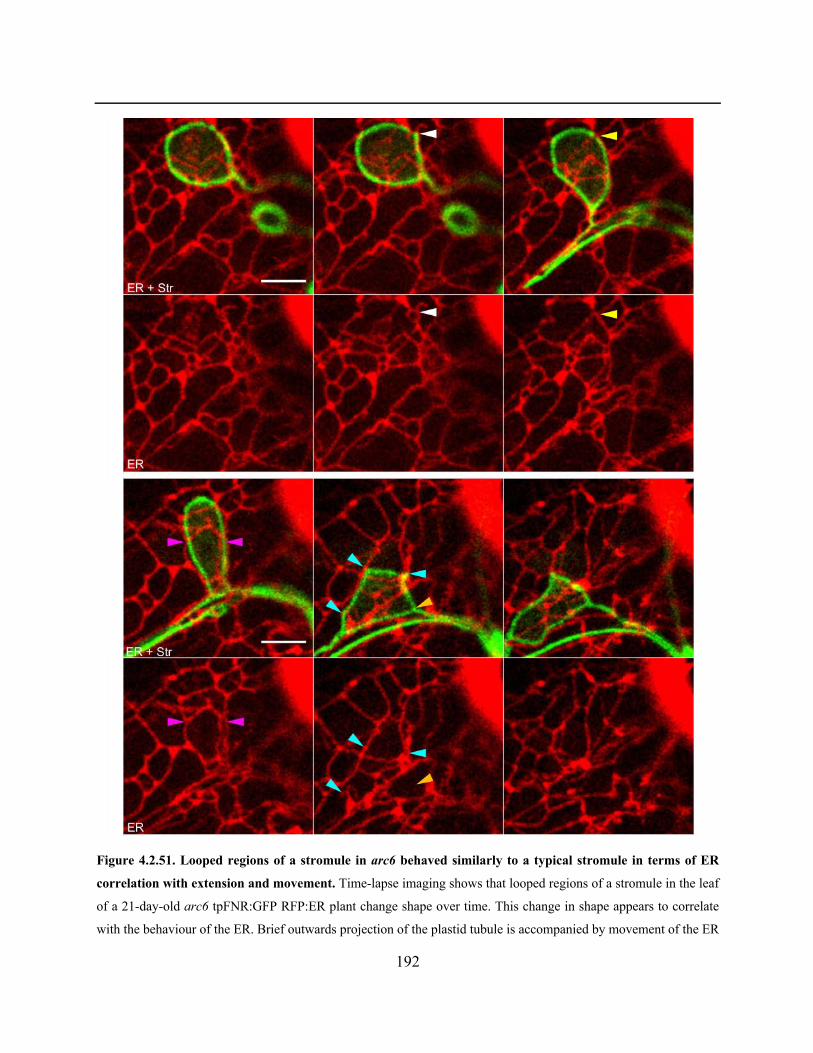
192
Figure 4.2.51. Looped regions of a stromule in arc6 behaved similarly to a typical stromule in terms of ER
correlation with extension and movement. Time-lapse imaging shows that looped regions of a stromule in the leaf
of a 21-day-old arc6 tpFNR:GFP RFP:ER plant change shape over time. This change in shape appears to correlate
with the behaviour of the ER. Brief outwards projection of the plastid tubule is accompanied by movement of the ER
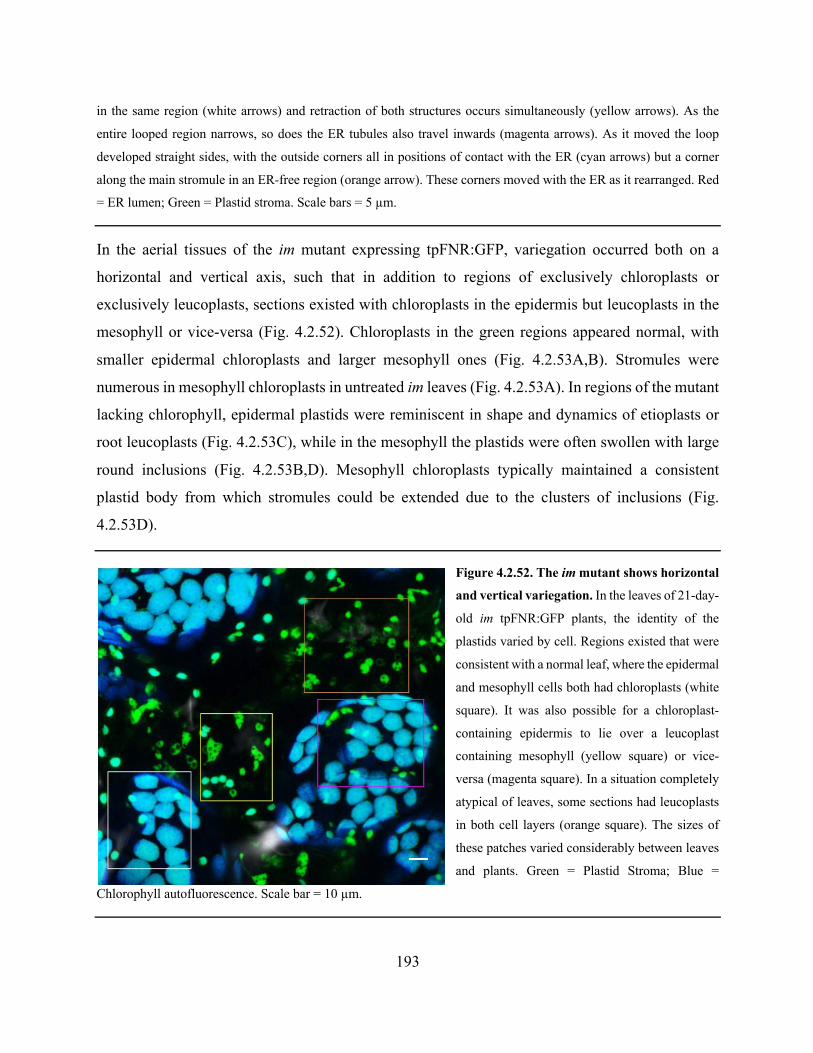
193
in the same region (white arrows) and retraction of both structures occurs simultaneously (yellow arrows). As the
entire looped region narrows, so does the ER tubules also travel inwards (magenta arrows). As it moved the loop
developed straight sides, with the outside corners all in positions of contact with the ER (cyan arrows) but a corner
along the main stromule in an ER-free region (orange arrow). These corners moved with the ER as it rearranged. Red
= ER lumen; Green = Plastid stroma. Scale bars = 5 µm.
In the aerial tissues of the im mutant expressing tpFNR:GFP, variegation occurred both on a
horizontal and vertical axis, such that in addition to regions of exclusively chloroplasts or
exclusively leucoplasts, sections existed with chloroplasts in the epidermis but leucoplasts in the
mesophyll or vice-versa (Fig. 4.2.52). Chloroplasts in the green regions appeared normal, with
smaller epidermal chloroplasts and larger mesophyll ones (Fig. 4.2.53A,B). Stromules were
numerous in mesophyll chloroplasts in untreated im leaves (Fig. 4.2.53A). In regions of the mutant
lacking chlorophyll, epidermal plastids were reminiscent in shape and dynamics of etioplasts or
root leucoplasts (Fig. 4.2.53C), while in the mesophyll the plastids were often swollen with large
round inclusions (Fig. 4.2.53B,D). Mesophyll chloroplasts typically maintained a consistent
plastid body from which stromules could be extended due to the clusters of inclusions (Fig.
4.2.53D).
Figure 4.2.52. The im mutant shows horizontal
and vertical variegation. In the leaves of 21-day-
old im tpFNR:GFP plants, the identity of the
plastids varied by cell. Regions existed that were
consistent with a normal leaf, where the epidermal
and mesophyll cells both had chloroplasts (white
square). It was also possible for a chloroplast-
containing epidermis to lie over a leucoplast
containing mesophyll (yellow square) or vice-
versa (magenta square). In a situation completely
atypical of leaves, some sections had leucoplasts
in both cell layers (orange square). The sizes of
these patches varied considerably between leaves
and plants. Green = Plastid Stroma; Blue =
Chlorophyll autofluorescence. Scale bar = 10 µm.
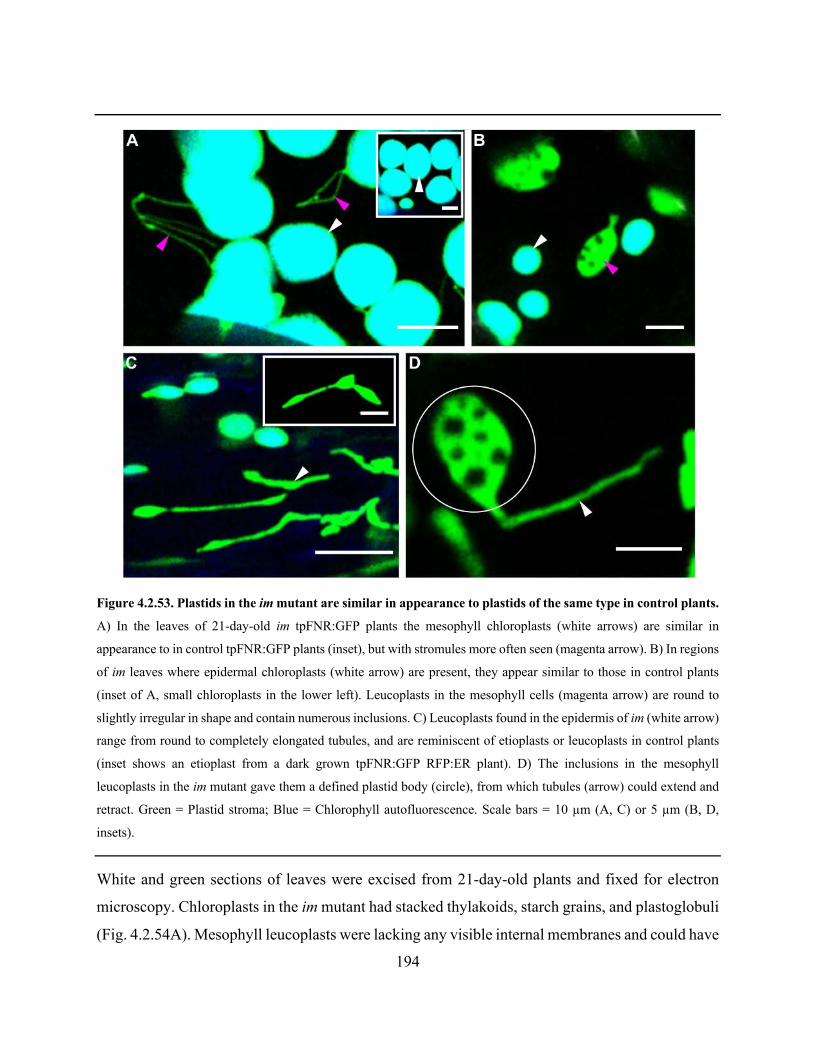
194
Figure 4.2.53. Plastids in the im mutant are similar in appearance to plastids of the same type in control plants.
A) In the leaves of 21-day-old im tpFNR:GFP plants the mesophyll chloroplasts (white arrows) are similar in
appearance to in control tpFNR:GFP plants (inset), but with stromules more often seen (magenta arrow). B) In regions
of im leaves where epidermal chloroplasts (white arrow) are present, they appear similar to those in control plants
(inset of A, small chloroplasts in the lower left). Leucoplasts in the mesophyll cells (magenta arrow) are round to
slightly irregular in shape and contain numerous inclusions. C) Leucoplasts found in the epidermis of im (white arrow)
range from round to completely elongated tubules, and are reminiscent of etioplasts or leucoplasts in control plants
(inset shows an etioplast from a dark grown tpFNR:GFP RFP:ER plant). D) The inclusions in the mesophyll
leucoplasts in the im mutant gave them a defined plastid body (circle), from which tubules (arrow) could extend and
retract. Green = Plastid stroma; Blue = Chlorophyll autofluorescence. Scale bars = 10 µm (A, C) or 5 µm (B, D,
insets).
White and green sections of leaves were excised from 21-day-old plants and fixed for electron
microscopy. Chloroplasts in the im mutant had stacked thylakoids, starch grains, and plastoglobuli
(Fig. 4.2.54A). Mesophyll leucoplasts were lacking any visible internal membranes and could have

195
multiple types of inclusions, including starch grain, clusters of plastoglobuli, and large vacuole-
like structures (4.2.54B). In two separate instances, cross sections of projections were obtained
from leucoplasts and they appeared devoid of these inclusions (Fig. 4.2.54C).
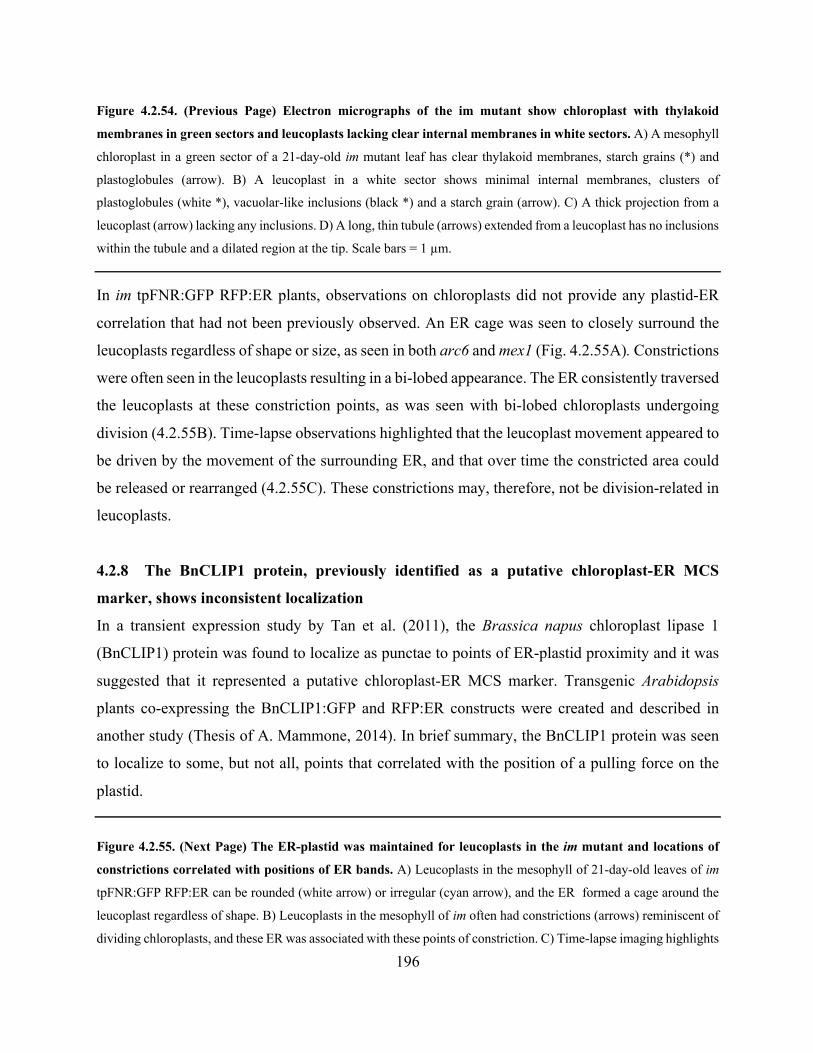
196
Figure 4.2.54. (Previous Page) Electron micrographs of the im mutant show chloroplast with thylakoid
membranes in green sectors and leucoplasts lacking clear internal membranes in white sectors. A) A mesophyll
chloroplast in a green sector of a 21-day-old im mutant leaf has clear thylakoid membranes, starch grains (*) and
plastoglobules (arrow). B) A leucoplast in a white sector shows minimal internal membranes, clusters of
plastoglobules (white *), vacuolar-like inclusions (black *) and a starch grain (arrow). C) A thick projection from a
leucoplast (arrow) lacking any inclusions. D) A long, thin tubule (arrows) extended from a leucoplast has no inclusions
within the tubule and a dilated region at the tip. Scale bars = 1 µm.
In im tpFNR:GFP RFP:ER plants, observations on chloroplasts did not provide any plastid-ER
correlation that had not been previously observed. An ER cage was seen to closely surround the
leucoplasts regardless of shape or size, as seen in both arc6 and mex1 (Fig. 4.2.55A). Constrictions
were often seen in the leucoplasts resulting in a bi-lobed appearance. The ER consistently traversed
the leucoplasts at these constriction points, as was seen with bi-lobed chloroplasts undergoing
division (4.2.55B). Time-lapse observations highlighted that the leucoplast movement appeared to
be driven by the movement of the surrounding ER, and that over time the constricted area could
be released or rearranged (4.2.55C). These constrictions may, therefore, not be division-related in
leucoplasts.
4.2.8 The BnCLIP1 protein, previously identified as a putative chloroplast-ER MCS
marker, shows inconsistent localization
In a transient expression study by Tan et al. (2011), the Brassica napus chloroplast lipase 1
(BnCLIP1) protein was found to localize as punctae to points of ER-plastid proximity and it was
suggested that it represented a putative chloroplast-ER MCS marker. Transgenic Arabidopsis
plants co-expressing the BnCLIP1:GFP and RFP:ER constructs were created and described in
another study (Thesis of A. Mammone, 2014). In brief summary, the BnCLIP1 protein was seen
to localize to some, but not all, points that correlated with the position of a pulling force on the
plastid.
Figure 4.2.55. (Next Page) The ER-plastid was maintained for leucoplasts in the im mutant and locations of
constrictions correlated with positions of ER bands. A) Leucoplasts in the mesophyll of 21-day-old leaves of im
tpFNR:GFP RFP:ER can be rounded (white arrow) or irregular (cyan arrow), and the ER formed a cage around the
leucoplast regardless of shape. B) Leucoplasts in the mesophyll of im often had constrictions (arrows) reminiscent of
dividing chloroplasts, and these ER was associated with these points of constriction. C) Time-lapse imaging highlights
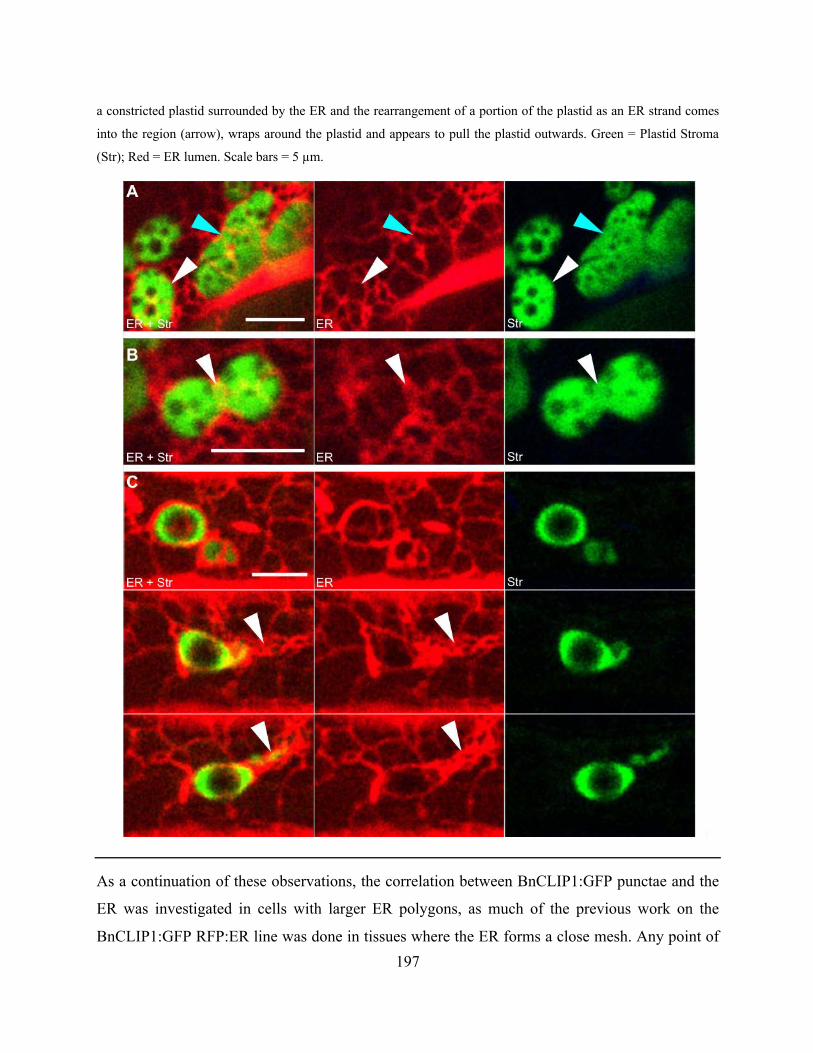
197
a constricted plastid surrounded by the ER and the rearrangement of a portion of the plastid as an ER strand comes
into the region (arrow), wraps around the plastid and appears to pull the plastid outwards. Green = Plastid Stroma
(Str); Red = ER lumen. Scale bars = 5 µm.
As a continuation of these observations, the correlation between BnCLIP1:GFP punctae and the
ER was investigated in cells with larger ER polygons, as much of the previous work on the
BnCLIP1:GFP RFP:ER line was done in tissues where the ER forms a close mesh. Any point of
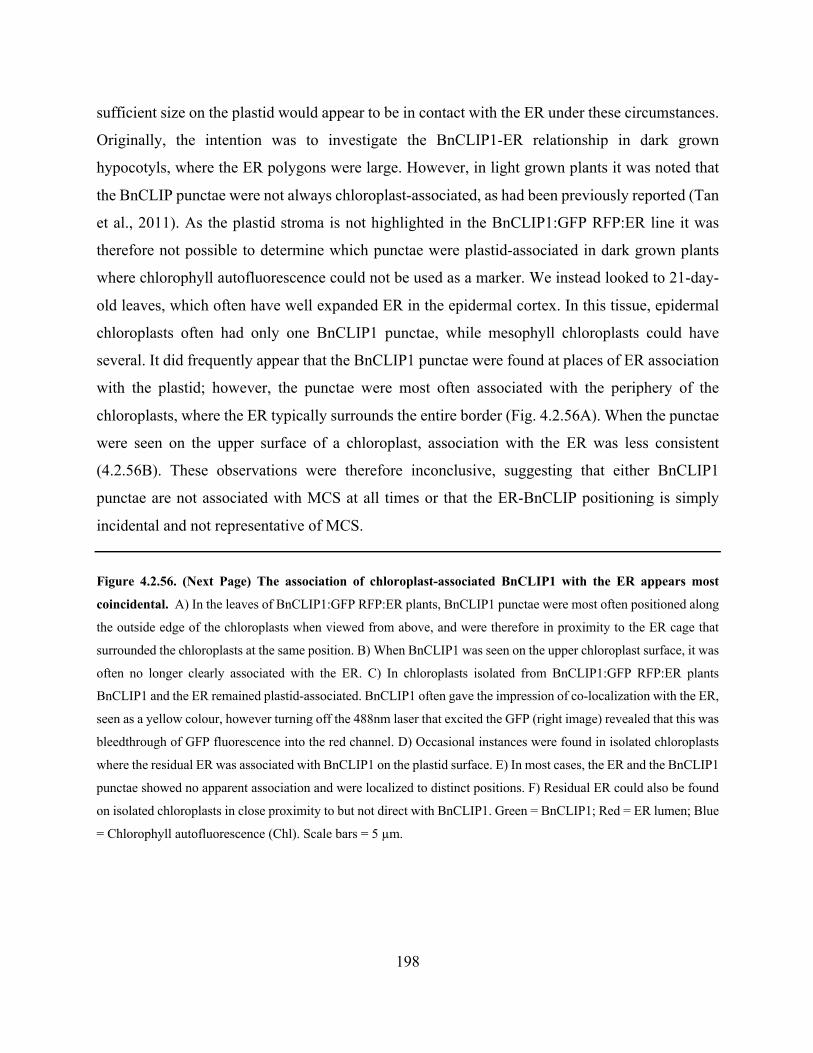
198
sufficient size on the plastid would appear to be in contact with the ER under these circumstances.
Originally, the intention was to investigate the BnCLIP1-ER relationship in dark grown
hypocotyls, where the ER polygons were large. However, in light grown plants it was noted that
the BnCLIP punctae were not always chloroplast-associated, as had been previously reported (Tan
et al., 2011). As the plastid stroma is not highlighted in the BnCLIP1:GFP RFP:ER line it was
therefore not possible to determine which punctae were plastid-associated in dark grown plants
where chlorophyll autofluorescence could not be used as a marker. We instead looked to 21-day-
old leaves, which often have well expanded ER in the epidermal cortex. In this tissue, epidermal
chloroplasts often had only one BnCLIP1 punctae, while mesophyll chloroplasts could have
several. It did frequently appear that the BnCLIP1 punctae were found at places of ER association
with the plastid; however, the punctae were most often associated with the periphery of the
chloroplasts, where the ER typically surrounds the entire border (Fig. 4.2.56A). When the punctae
were seen on the upper surface of a chloroplast, association with the ER was less consistent
(4.2.56B). These observations were therefore inconclusive, suggesting that either BnCLIP1
punctae are not associated with MCS at all times or that the ER-BnCLIP positioning is simply
incidental and not representative of MCS.
Figure 4.2.56. (Next Page) The association of chloroplast-associated BnCLIP1 with the ER appears most
coincidental. A) In the leaves of BnCLIP1:GFP RFP:ER plants, BnCLIP1 punctae were most often positioned along
the outside edge of the chloroplasts when viewed from above, and were therefore in proximity to the ER cage that
surrounded the chloroplasts at the same position. B) When BnCLIP1 was seen on the upper chloroplast surface, it was
often no longer clearly associated with the ER. C) In chloroplasts isolated from BnCLIP1:GFP RFP:ER plants
BnCLIP1 and the ER remained plastid-associated. BnCLIP1 often gave the impression of co-localization with the ER,
seen as a yellow colour, however turning off the 488nm laser that excited the GFP (right image) revealed that this was
bleedthrough of GFP fluorescence into the red channel. D) Occasional instances were found in isolated chloroplasts
where the residual ER was associated with BnCLIP1 on the plastid surface. E) In most cases, the ER and the BnCLIP1
punctae showed no apparent association and were localized to distinct positions. F) Residual ER could also be found
on isolated chloroplasts in close proximity to but not direct with BnCLIP1. Green = BnCLIP1; Red = ER lumen; Blue
= Chlorophyll autofluorescence (Chl). Scale bars = 5 µm.
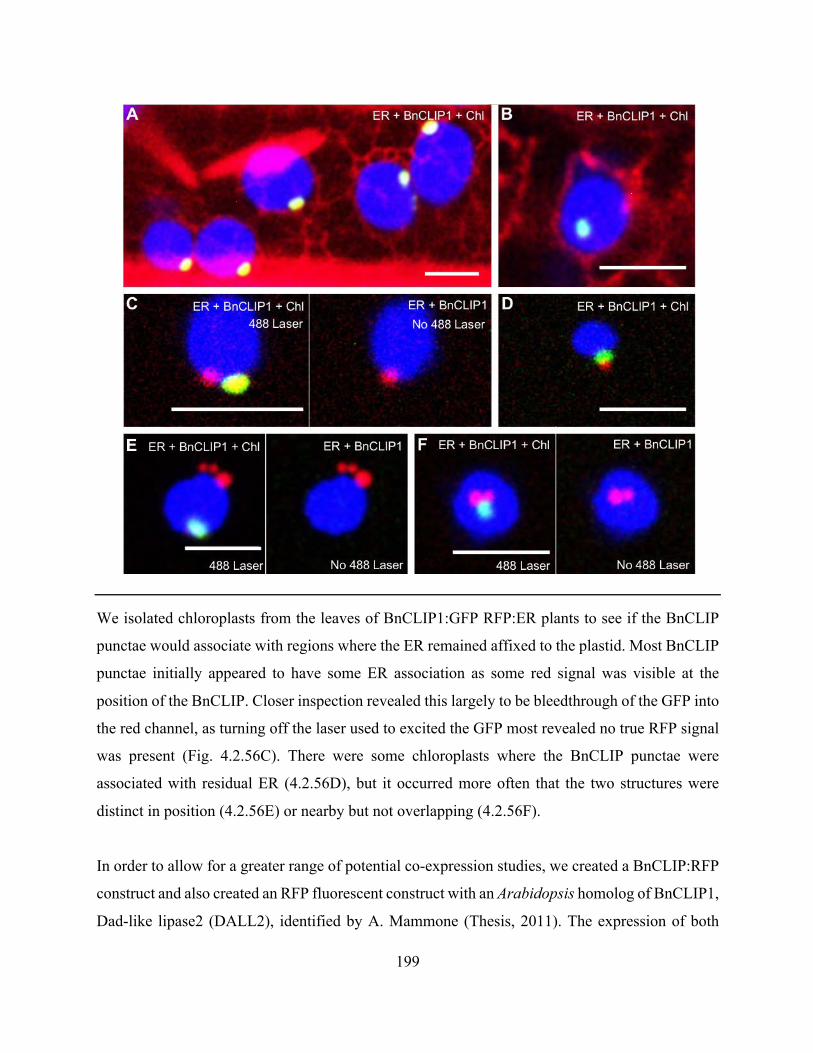
199
We isolated chloroplasts from the leaves of BnCLIP1:GFP RFP:ER plants to see if the BnCLIP
punctae would associate with regions where the ER remained affixed to the plastid. Most BnCLIP
punctae initially appeared to have some ER association as some red signal was visible at the
position of the BnCLIP. Closer inspection revealed this largely to be bleedthrough of the GFP into
the red channel, as turning off the laser used to excited the GFP most revealed no true RFP signal
was present (Fig. 4.2.56C). There were some chloroplasts where the BnCLIP punctae were
associated with residual ER (4.2.56D), but it occurred more often that the two structures were
distinct in position (4.2.56E) or nearby but not overlapping (4.2.56F).
In order to allow for a greater range of potential co-expression studies, we created a BnCLIP:RFP
construct and also created an RFP fluorescent construct with an Arabidopsis homolog of BnCLIP1,
Dad-like lipase2 (DALL2), identified by A. Mammone (Thesis, 2011). The expression of both
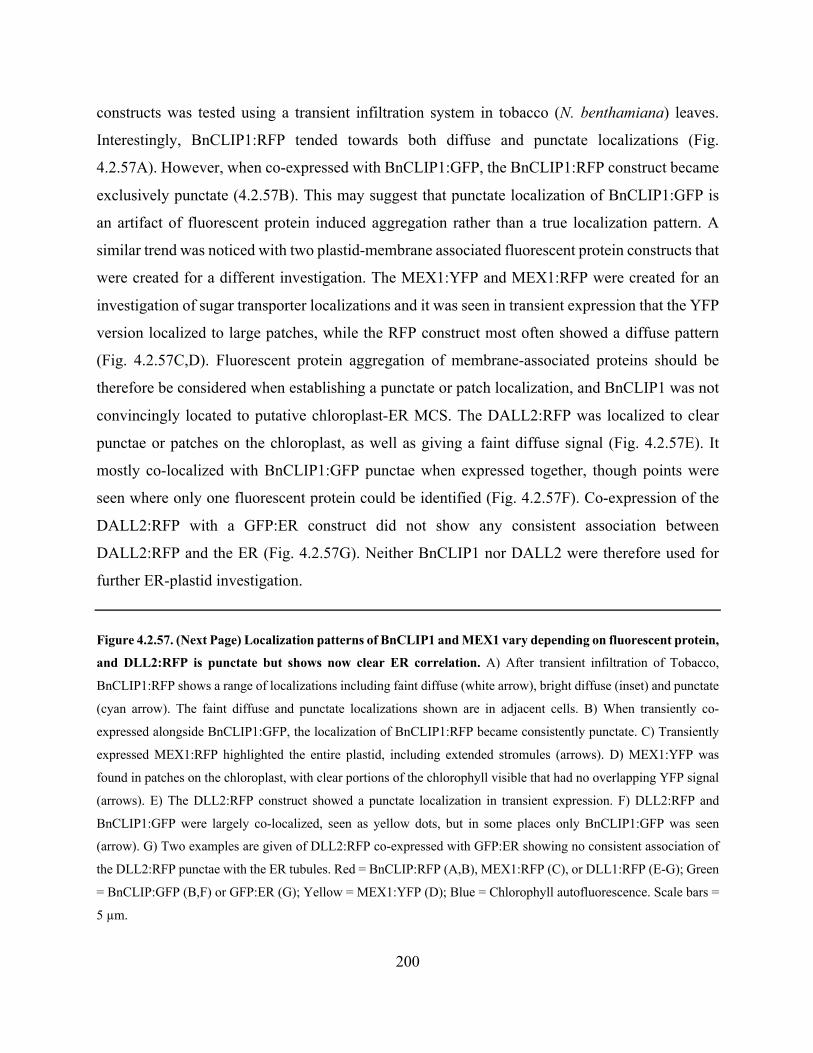
200
constructs was tested using a transient infiltration system in tobacco (N. benthamiana) leaves.
Interestingly, BnCLIP1:RFP tended towards both diffuse and punctate localizations (Fig.
4.2.57A). However, when co-expressed with BnCLIP1:GFP, the BnCLIP1:RFP construct became
exclusively punctate (4.2.57B). This may suggest that punctate localization of BnCLIP1:GFP is
an artifact of fluorescent protein induced aggregation rather than a true localization pattern. A
similar trend was noticed with two plastid-membrane associated fluorescent protein constructs that
were created for a different investigation. The MEX1:YFP and MEX1:RFP were created for an
investigation of sugar transporter localizations and it was seen in transient expression that the YFP
version localized to large patches, while the RFP construct most often showed a diffuse pattern
(Fig. 4.2.57C,D). Fluorescent protein aggregation of membrane-associated proteins should be
therefore be considered when establishing a punctate or patch localization, and BnCLIP1 was not
convincingly located to putative chloroplast-ER MCS. The DALL2:RFP was localized to clear
punctae or patches on the chloroplast, as well as giving a faint diffuse signal (Fig. 4.2.57E). It
mostly co-localized with BnCLIP1:GFP punctae when expressed together, though points were
seen where only one fluorescent protein could be identified (Fig. 4.2.57F). Co-expression of the
DALL2:RFP with a GFP:ER construct did not show any consistent association between
DALL2:RFP and the ER (Fig. 4.2.57G). Neither BnCLIP1 nor DALL2 were therefore used for
further ER-plastid investigation.
Figure 4.2.57. (Next Page) Localization patterns of BnCLIP1 and MEX1 vary depending on fluorescent protein,
and DLL2:RFP is punctate but shows now clear ER correlation. A) After transient infiltration of Tobacco,
BnCLIP1:RFP shows a range of localizations including faint diffuse (white arrow), bright diffuse (inset) and punctate
(cyan arrow). The faint diffuse and punctate localizations shown are in adjacent cells. B) When transiently co-
expressed alongside BnCLIP1:GFP, the localization of BnCLIP1:RFP became consistently punctate. C) Transiently
expressed MEX1:RFP highlighted the entire plastid, including extended stromules (arrows). D) MEX1:YFP was
found in patches on the chloroplast, with clear portions of the chlorophyll visible that had no overlapping YFP signal
(arrows). E) The DLL2:RFP construct showed a punctate localization in transient expression. F) DLL2:RFP and
BnCLIP1:GFP were largely co-localized, seen as yellow dots, but in some places only BnCLIP1:GFP was seen
(arrow). G) Two examples are given of DLL2:RFP co-expressed with GFP:ER showing no consistent association of
the DLL2:RFP punctae with the ER tubules. Red = BnCLIP:RFP (A,B), MEX1:RFP (C), or DLL1:RFP (E-G); Green
= BnCLIP:GFP (B,F) or GFP:ER (G); Yellow = MEX1:YFP (D); Blue = Chlorophyll autofluorescence. Scale bars =
5 µm.
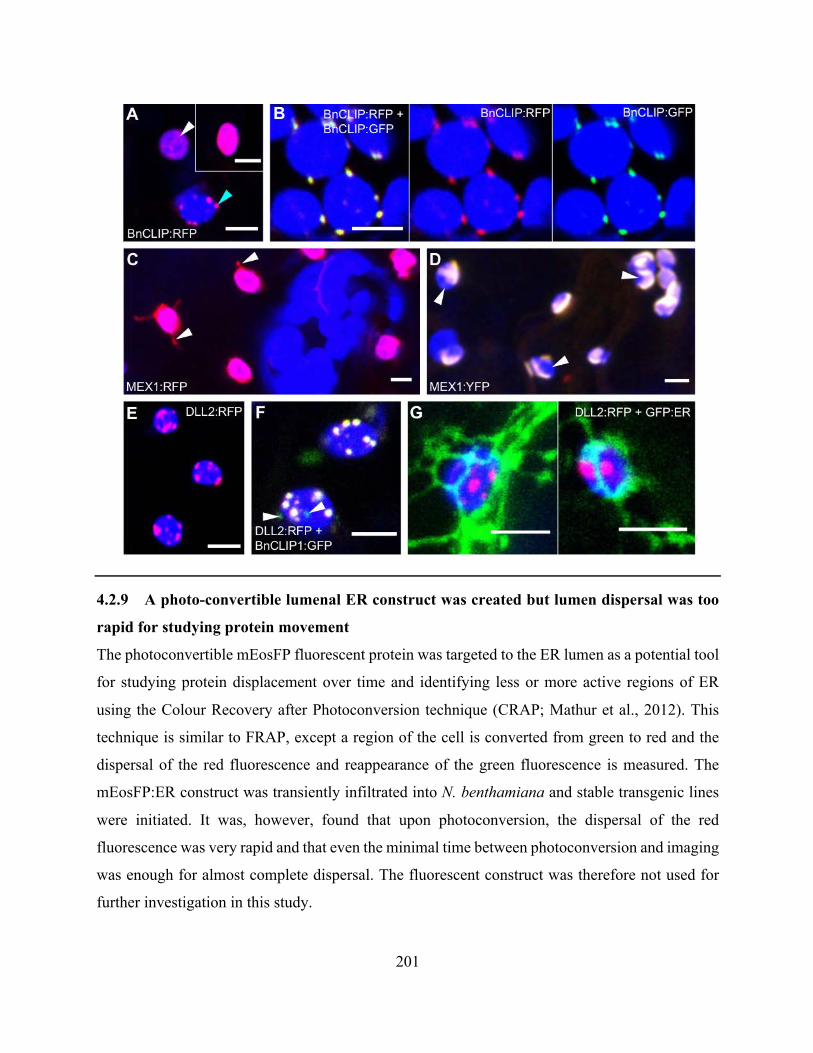
201
4.2.9 A photo-convertible lumenal ER construct was created but lumen dispersal was too
rapid for studying protein movement
The photoconvertible mEosFP fluorescent protein was targeted to the ER lumen as a potential tool
for studying protein displacement over time and identifying less or more active regions of ER
using the Colour Recovery after Photoconversion technique (CRAP; Mathur et al., 2012). This
technique is similar to FRAP, except a region of the cell is converted from green to red and the
dispersal of the red fluorescence and reappearance of the green fluorescence is measured. The
mEosFP:ER construct was transiently infiltrated into N. benthamiana and stable transgenic lines
were initiated. It was, however, found that upon photoconversion, the dispersal of the red
fluorescence was very rapid and that even the minimal time between photoconversion and imaging
was enough for almost complete dispersal. The fluorescent construct was therefore not used for
further investigation in this study.
202
4.3 Discussion Though stromules are a characteristic feature of the plastid, shared among plastid types and
throughout the higher plants, much remains mysterious about their function and creation. Several
cellular structures have been implicated in pulling on the envelope to create a stromule, specifically
the actin cytoskeleton, microtubules, and ER, but the true contribution of each of these structures,
as well as how they might connect with the plastid, remains unresolved. Stromules are transient in
nature and extend from only a fraction of the plastids in a cell at any given time. Any attempt to
understand their mechanism of formation must take these features into account. Further
complicating the matter, experiments designed to assess the role of the cytoskeletal elements on
stromule extension have often presented opposing results (Appendix 2). The ER presents the most
interesting but least investigated candidate for explaining how stromules might be pulled out from
the plastid, as it provides both a workable model and remains consistent with previously reported
observations. Here we found that there is a strong degree of association between the dynamics of
the ER and all aspects of plastid behaviour, and that disruption of ER structure has a negative effect
on the extension of stromules. We propose a model wherein the ER is the primary source of the
pulling force that results in stromule extension.
Through the simultaneous observation of both organelles, we found that that plastid tubulation
correlates with the rearrangement of the surrounding ER, regardless of plastid type, and that this
persists even with the more atypical plastid morphologies seen in the arc6, mex1, and im mutants.
Etioplasts allowed the most detailed investigation of these dynamics, as they are capable of the
most varied behaviors, with many etioplasts changing form rapidly and continuously without
requiring additional treatment. As was previously reported (Schattat et al., 2011a), the ER formed
a cage around the plastid, and plastids often extended through channels in the ER, confirming that
those observations held true in stable transgenics and across multiple plastid types. Most often,
there was continuous visual association between the extending plastid tip and the ER as the channel
formed, but in rare cases the channel seemed to form in advance of the stromule. The inner and
outer plastid envelope are connected at contact sites (Cremers et al., 1988; Pain et al., 1988; Schnell
et al., 1990; Schnell and Blobel, 1993), but not much could be found about the frequency of these
sites around the plastid nor the strength of the attachment. The outer envelope alone can however
203
create tubular structures under some conditions (Machettira et al. 2012). It is possible that if the
pulling force is exerted on the envelope at a location with few connections between the envelopes,
that the outer membrane might extend ahead of the inner, and this may explain the occasional gap
in fluorescence between the ER and the plastid.
Another reason that etioplasts provide an attractive model plastid for studying coordinated ER-
plastid behaviour is that etiolated hypocotyls provide a consistent gradient of ER morphologies.
Just below the cotyledons the ER was always composed of small polygons and cisternae, with
numerous streaming regions, and the polygons became progressively larger the further down the
hypocotyl one looked until there might be only a few ER polygons per cell. In etiolated plants
growing on soil, the cotyledons are the only significant source of stored carbon, and this gradient
in ER behaviour could be the result of the cell’s proximity to this carbon source. More readily
available carbon substrates means that there is a greater ability to synthesize the lipids, and more
building blocks for the ER membranes. Further, there appears to be a general trend wherein the
ER in differentiating or less expanded cells is more dense than in mature, expanded cells (Ridge
et al., 1999; Stefano et al., 2014). The larger ER polygons towards the base of the hypocotyl
allowed us to confirm that even when there is minimal ER, no plastid was ever seen that lacked
some form of ER association, even if it was simply a single tubule running alongside a small round
etioplast. These small round etioplasts made up the majority of the plastid population when ER
polygons were large, and they became increasingly elongated and dynamic the closer to the
cotyledons they were located and the smaller the ER polygons became. This might in part be
explained by the greater availability of substrates for membrane synthesis, creating plastids with
greater flexibility, but it also shows a strong correlation between increased plastid elongation and
increased potential for ER-plastid connectivity. This is further supported by the observation that
even within a cell, the smaller the ER polygons in a region, the more elongated the plastids tended
to be.
The ER is proposed to be connected to plastid by MCS, which may involve protein components
and membrane hemifusion (Andersson et al., 2007; Mehrshahi et al., 2013; Mehrshahi et al., 2014),
and provide a strong point of contact resistant to separation by physical forces (Andersson et al.,
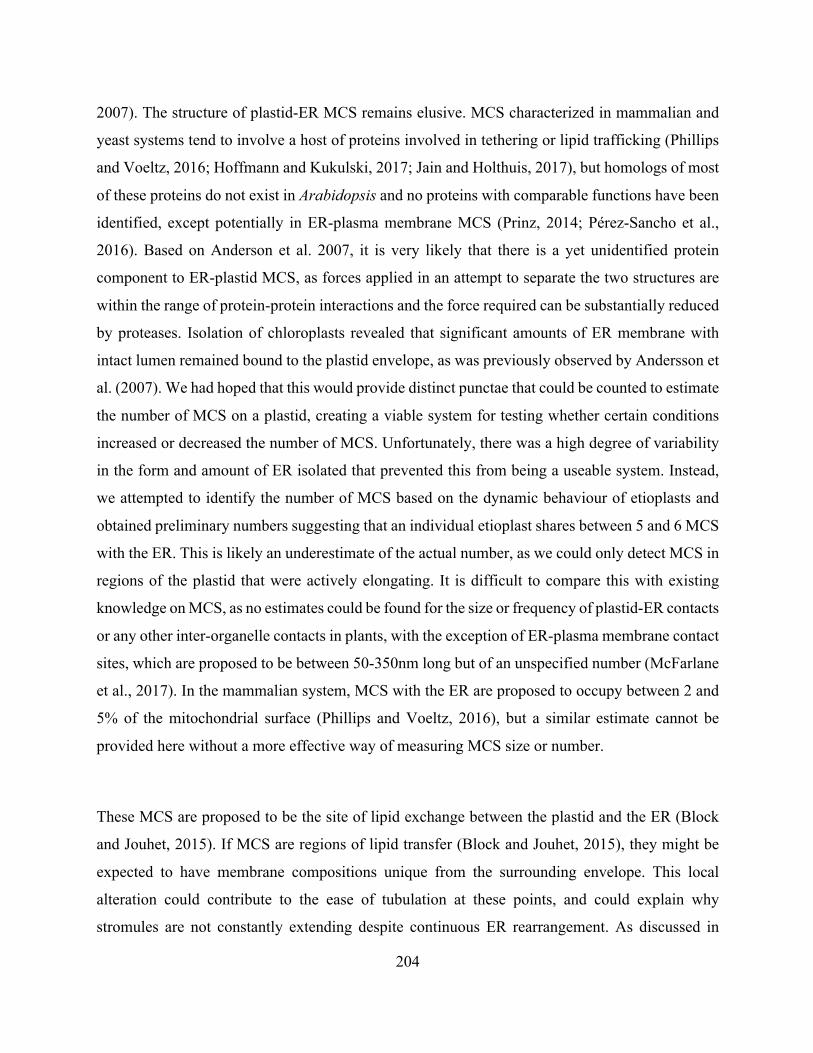
204
2007). The structure of plastid-ER MCS remains elusive. MCS characterized in mammalian and
yeast systems tend to involve a host of proteins involved in tethering or lipid trafficking (Phillips
and Voeltz, 2016; Hoffmann and Kukulski, 2017; Jain and Holthuis, 2017), but homologs of most
of these proteins do not exist in Arabidopsis and no proteins with comparable functions have been
identified, except potentially in ER-plasma membrane MCS (Prinz, 2014; Pérez-Sancho et al.,
2016). Based on Anderson et al. 2007, it is very likely that there is a yet unidentified protein
component to ER-plastid MCS, as forces applied in an attempt to separate the two structures are
within the range of protein-protein interactions and the force required can be substantially reduced
by proteases. Isolation of chloroplasts revealed that significant amounts of ER membrane with
intact lumen remained bound to the plastid envelope, as was previously observed by Andersson et
al. (2007). We had hoped that this would provide distinct punctae that could be counted to estimate
the number of MCS on a plastid, creating a viable system for testing whether certain conditions
increased or decreased the number of MCS. Unfortunately, there was a high degree of variability
in the form and amount of ER isolated that prevented this from being a useable system. Instead,
we attempted to identify the number of MCS based on the dynamic behaviour of etioplasts and
obtained preliminary numbers suggesting that an individual etioplast shares between 5 and 6 MCS
with the ER. This is likely an underestimate of the actual number, as we could only detect MCS in
regions of the plastid that were actively elongating. It is difficult to compare this with existing
knowledge on MCS, as no estimates could be found for the size or frequency of plastid-ER contacts
or any other inter-organelle contacts in plants, with the exception of ER-plasma membrane contact
sites, which are proposed to be between 50-350nm long but of an unspecified number (McFarlane
et al., 2017). In the mammalian system, MCS with the ER are proposed to occupy between 2 and
5% of the mitochondrial surface (Phillips and Voeltz, 2016), but a similar estimate cannot be
provided here without a more effective way of measuring MCS size or number.
These MCS are proposed to be the site of lipid exchange between the plastid and the ER (Block
and Jouhet, 2015). If MCS are regions of lipid transfer (Block and Jouhet, 2015), they might be
expected to have membrane compositions unique from the surrounding envelope. This local
alteration could contribute to the ease of tubulation at these points, and could explain why
stromules are not constantly extending despite continuous ER rearrangement. As discussed in
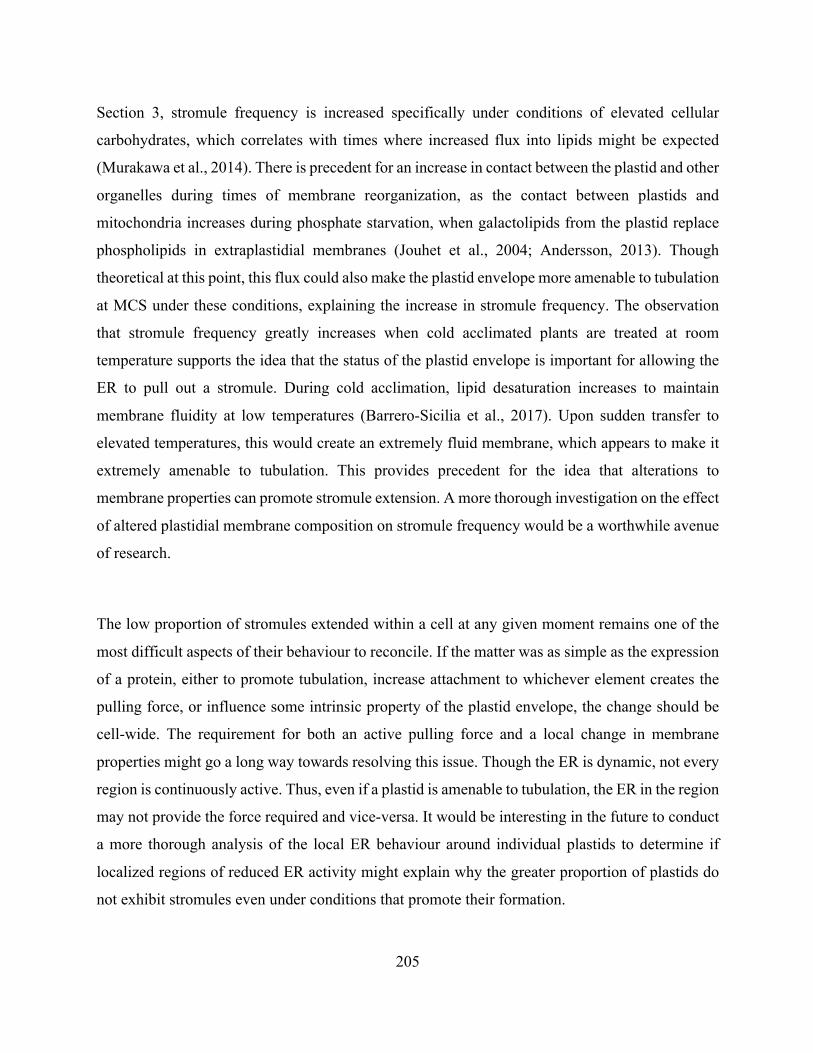
205
Section 3, stromule frequency is increased specifically under conditions of elevated cellular
carbohydrates, which correlates with times where increased flux into lipids might be expected
(Murakawa et al., 2014). There is precedent for an increase in contact between the plastid and other
organelles during times of membrane reorganization, as the contact between plastids and
mitochondria increases during phosphate starvation, when galactolipids from the plastid replace
phospholipids in extraplastidial membranes (Jouhet et al., 2004; Andersson, 2013). Though
theoretical at this point, this flux could also make the plastid envelope more amenable to tubulation
at MCS under these conditions, explaining the increase in stromule frequency. The observation
that stromule frequency greatly increases when cold acclimated plants are treated at room
temperature supports the idea that the status of the plastid envelope is important for allowing the
ER to pull out a stromule. During cold acclimation, lipid desaturation increases to maintain
membrane fluidity at low temperatures (Barrero-Sicilia et al., 2017). Upon sudden transfer to
elevated temperatures, this would create an extremely fluid membrane, which appears to make it
extremely amenable to tubulation. This provides precedent for the idea that alterations to
membrane properties can promote stromule extension. A more thorough investigation on the effect
of altered plastidial membrane composition on stromule frequency would be a worthwhile avenue
of research.
The low proportion of stromules extended within a cell at any given moment remains one of the
most difficult aspects of their behaviour to reconcile. If the matter was as simple as the expression
of a protein, either to promote tubulation, increase attachment to whichever element creates the
pulling force, or influence some intrinsic property of the plastid envelope, the change should be
cell-wide. The requirement for both an active pulling force and a local change in membrane
properties might go a long way towards resolving this issue. Though the ER is dynamic, not every
region is continuously active. Thus, even if a plastid is amenable to tubulation, the ER in the region
may not provide the force required and vice-versa. It would be interesting in the future to conduct
a more thorough analysis of the local ER behaviour around individual plastids to determine if
localized regions of reduced ER activity might explain why the greater proportion of plastids do
not exhibit stromules even under conditions that promote their formation.
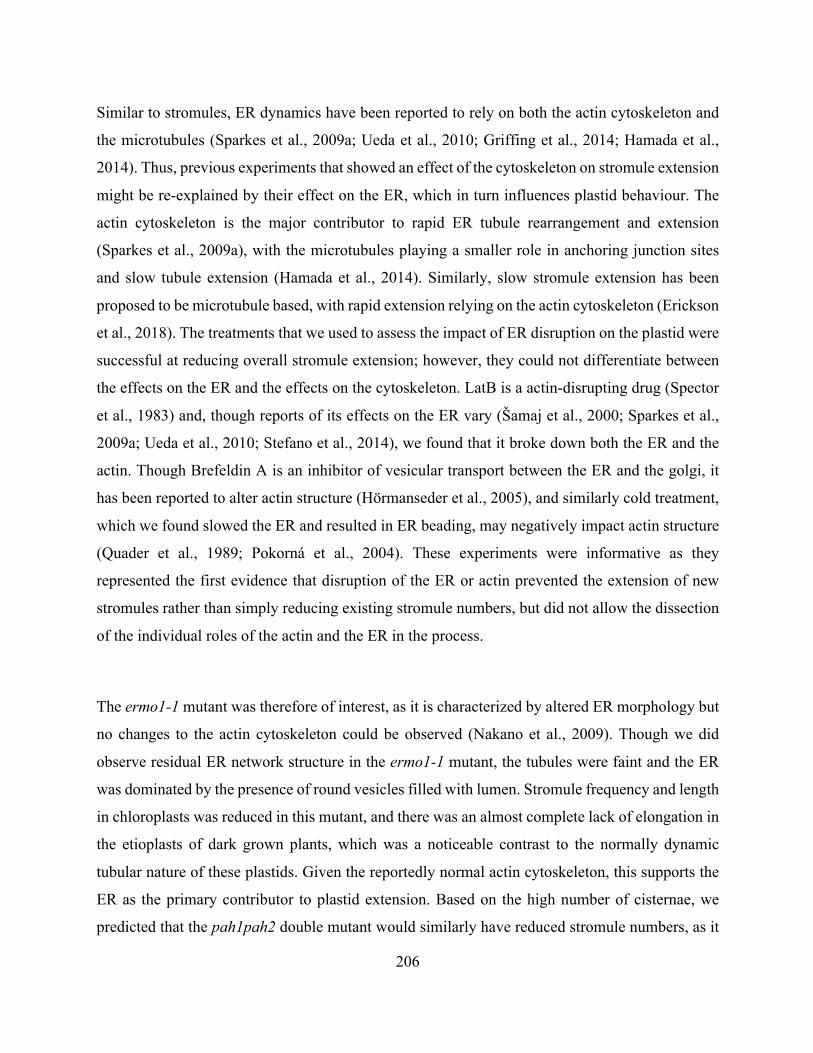
206
Similar to stromules, ER dynamics have been reported to rely on both the actin cytoskeleton and
the microtubules (Sparkes et al., 2009a; Ueda et al., 2010; Griffing et al., 2014; Hamada et al.,
2014). Thus, previous experiments that showed an effect of the cytoskeleton on stromule extension
might be re-explained by their effect on the ER, which in turn influences plastid behaviour. The
actin cytoskeleton is the major contributor to rapid ER tubule rearrangement and extension
(Sparkes et al., 2009a), with the microtubules playing a smaller role in anchoring junction sites
and slow tubule extension (Hamada et al., 2014). Similarly, slow stromule extension has been
proposed to be microtubule based, with rapid extension relying on the actin cytoskeleton (Erickson
et al., 2018). The treatments that we used to assess the impact of ER disruption on the plastid were
successful at reducing overall stromule extension; however, they could not differentiate between
the effects on the ER and the effects on the cytoskeleton. LatB is a actin-disrupting drug (Spector
et al., 1983) and, though reports of its effects on the ER vary (Šamaj et al., 2000; Sparkes et al.,
2009a; Ueda et al., 2010; Stefano et al., 2014), we found that it broke down both the ER and the
actin. Though Brefeldin A is an inhibitor of vesicular transport between the ER and the golgi, it
has been reported to alter actin structure (Hörmanseder et al., 2005), and similarly cold treatment,
which we found slowed the ER and resulted in ER beading, may negatively impact actin structure
(Quader et al., 1989; Pokorná et al., 2004). These experiments were informative as they
represented the first evidence that disruption of the ER or actin prevented the extension of new
stromules rather than simply reducing existing stromule numbers, but did not allow the dissection
of the individual roles of the actin and the ER in the process.
The ermo1-1 mutant was therefore of interest, as it is characterized by altered ER morphology but
no changes to the actin cytoskeleton could be observed (Nakano et al., 2009). Though we did
observe residual ER network structure in the ermo1-1 mutant, the tubules were faint and the ER
was dominated by the presence of round vesicles filled with lumen. Stromule frequency and length
in chloroplasts was reduced in this mutant, and there was an almost complete lack of elongation in
the etioplasts of dark grown plants, which was a noticeable contrast to the normally dynamic
tubular nature of these plastids. Given the reportedly normal actin cytoskeleton, this supports the
ER as the primary contributor to plastid extension. Based on the high number of cisternae, we
predicted that the pah1pah2 double mutant would similarly have reduced stromule numbers, as it
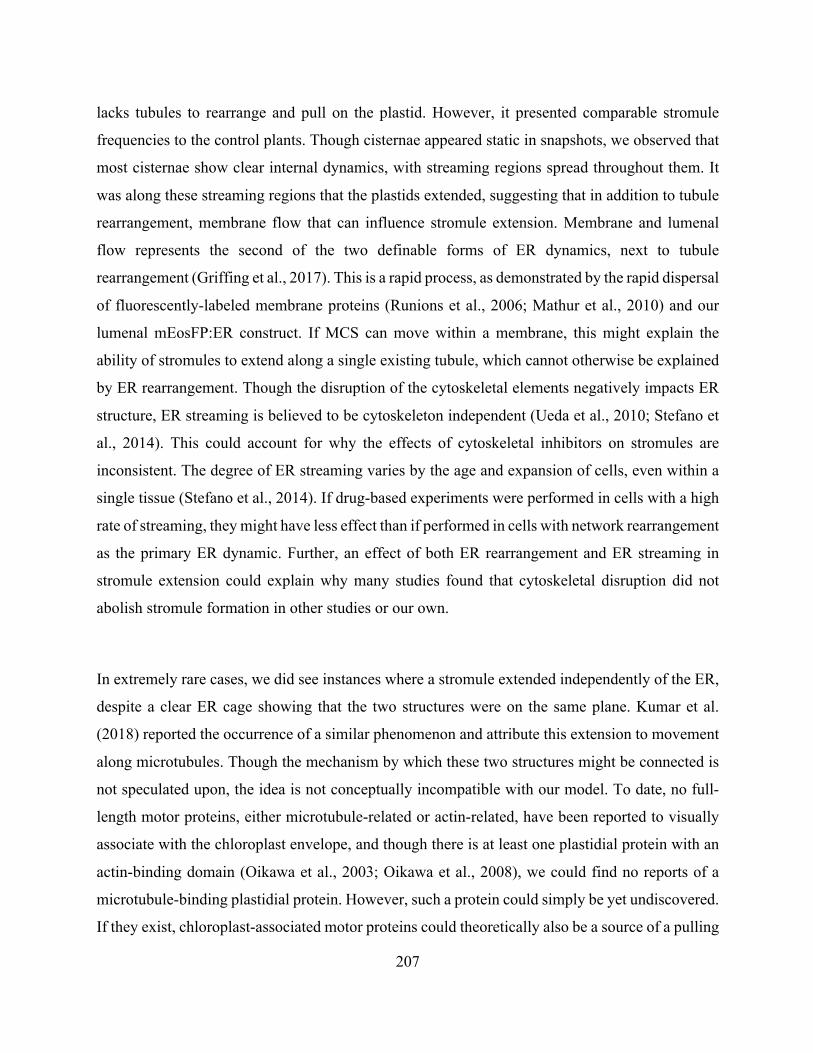
207
lacks tubules to rearrange and pull on the plastid. However, it presented comparable stromule
frequencies to the control plants. Though cisternae appeared static in snapshots, we observed that
most cisternae show clear internal dynamics, with streaming regions spread throughout them. It
was along these streaming regions that the plastids extended, suggesting that in addition to tubule
rearrangement, membrane flow that can influence stromule extension. Membrane and lumenal
flow represents the second of the two definable forms of ER dynamics, next to tubule
rearrangement (Griffing et al., 2017). This is a rapid process, as demonstrated by the rapid dispersal
of fluorescently-labeled membrane proteins (Runions et al., 2006; Mathur et al., 2010) and our
lumenal mEosFP:ER construct. If MCS can move within a membrane, this might explain the
ability of stromules to extend along a single existing tubule, which cannot otherwise be explained
by ER rearrangement. Though the disruption of the cytoskeletal elements negatively impacts ER
structure, ER streaming is believed to be cytoskeleton independent (Ueda et al., 2010; Stefano et
al., 2014). This could account for why the effects of cytoskeletal inhibitors on stromules are
inconsistent. The degree of ER streaming varies by the age and expansion of cells, even within a
single tissue (Stefano et al., 2014). If drug-based experiments were performed in cells with a high
rate of streaming, they might have less effect than if performed in cells with network rearrangement
as the primary ER dynamic. Further, an effect of both ER rearrangement and ER streaming in
stromule extension could explain why many studies found that cytoskeletal disruption did not
abolish stromule formation in other studies or our own.
In extremely rare cases, we did see instances where a stromule extended independently of the ER,
despite a clear ER cage showing that the two structures were on the same plane. Kumar et al.
(2018) reported the occurrence of a similar phenomenon and attribute this extension to movement
along microtubules. Though the mechanism by which these two structures might be connected is
not speculated upon, the idea is not conceptually incompatible with our model. To date, no full-
length motor proteins, either microtubule-related or actin-related, have been reported to visually
associate with the chloroplast envelope, and though there is at least one plastidial protein with an
actin-binding domain (Oikawa et al., 2003; Oikawa et al., 2008), we could find no reports of a
microtubule-binding plastidial protein. However, such a protein could simply be yet undiscovered.
If they exist, chloroplast-associated motor proteins could theoretically also be a source of a pulling
208
force, or a cytoskeletal binding protein could anchor a portion of the plastid envelope to a
polymerizing cytoskeletal element and exert a force as the element grew. Though we propose the
ER as the primary physical force behind stromule extension, due to the logical potential for altered
membrane properties at MCS and high degree of co-alignment between them, the cell interior is
an extremely dynamic environment and plastids are believed to share connections with other
organelles as well. It is therefore possible that other structures may additionally influence the
envelope.
Two other groups have reported the existence of stromules extending from isolated chloroplasts
(Brunkard et al., 2015; Ho and Theg, 2016), which would contradict our observations that an active
ER network is required for stromule extension. However, in our chloroplast preparations we saw
structures resembling stromules only twice, and their appearance and dynamics were distinct from
what we observe in an intact cell. Rather than existing as a thin tubule with directed, tensioned
movement, these stromule-like structures were beaded, short and appeared to sway aimlessly. A
careful assessment of the videos provided by Brunkard et al. (2015) and Ho and Theg (2016) shows
a similar pattern of loosely tensioned bulges that extended extremely slowly or showed atypical
behaviour. While there is perhaps a protein or other explanation for how these stromules remained
in existence or formed during isolation, they are not representative of the stromule behaviours we
see in an intact cell, supporting the theory that extra-plastidial structures control stromule
extension.
Our observations with BnCLIP highlight the importance of careful fluorescent probe selection
when determining localization and suggest that a punctate localization should be confirmed with
at least two fluorescent protein fusions. Though previously reported to be a putative MCS marker
(Tan et al., 2011), the mostly stromal localization of the RFP construct and related Arabidopsis
homologs, as well as their tendency to aggregate into punctae when co-expressed with
BnCLIP:GFP, suggests that the previously reported BnCLIP localization might be an artifact of
fluorescent protein aggregation. Further, when we observed the punctae in both isolated
chloroplasts and in cells with larger ER polygons, there was no consistent association between
209
BnCLIP:GFP and the ER. We could therefore find nothing to support the identity of BnCLIP as
an MCS marker.
Based on our observations and those in the literature, we propose a model in which stromule
extension relies on the coordination of plastidial and extra-plastidial factors, with the ER as a
central player in the process. The plastid is in constant physical association with a number of large
cellular structures. The close physical and metabolic connections suggest that the ER is a
substantial part of this contact, but association also exists with the plasma membrane, actin
cytoskeleton, microtubules, and other organelles. Depending on the connectivity with, and
dynamics of, these cellular components in the moment, they could also act either to anchor or to
pull on the plastid. However, these forces would be expected to be continuous within the constantly
moving environment of the cell when the presence of stromules is inconsistent and inducible.
There is therefore likely a contribution of the plastid membrane’s amenability towards stromule
extension in a region towards whether a pulling force will create a stromule.
210
4.4 Methods 4.4.1 Plant material and growth conditions
Appendix 1 details the plant lines used in this study and their origins. Seeds were sterilized, sown,
and grown as described in Section 3.4.1.
4.4.2 Confocal microscopy
Section 3.4.2 details how plants were mounted on microscope slides, the imaging setup, and the
software used for image and video processing. Collected emission from the fluorescent proteins
were consistent with section 3.4.2, however the RFP fluorescence was collected at a narrower
range (590-620) than red mEosFP, to reduce bleed-through from the green fluorescence in double
transgenic plants, and YFP was collected between 530 and 550 nm.
4.4.3 Assessment of the association between ER polygon size and cell size
tpFNR:GFP RFP:ER plants were grown on soil for 7 days either in the dark or under 100 µmol m-
2s-1 light, or grown for four days in the dark followed by three days of slow transition to light. On
the first day of transition, the seedlings were transferred to the light and covered with brown paper
towel. The second day the paper towel was replaced with a piece of white paper, which was
removed on the third day. Direct transition from dark to light was attempted but greening of
chloroplasts did not occur. Stacks of images were taken through the epidermis of the hypocotyl of
3 plants per growth condition, with a step size of 0.99 µm. Cell length, width and area for 20 cells
per plant. Average ER polygon area was measured by tracing the interior of a polygon, with 150
to 200 polygons measured per plant. Measurements were done using ImageJ (Schneider et al.,
2012). Averages were calculated for each plant and 95% confidence intervals (based on a t-
distribution) were determined based on the averages of the three plants per condition in Microsoft
Excel. The differences between conditions were assessed using one-way ANOVA on the plant
averages with a post-hoc TukeyHSD test in R (https://www.r-project.org/).
4.4.4 Imaging and assessment of ER dynamics and correlation with plastids
General observations on ER dynamics and their correlation with plastids were made in the RFP:ER
and tpFNR:GFP RFP:ER plant lines. Imaging was done at the uppermost epidermal surface of the
leaves or hypocotyl unless specific assessment of the mesophyll was required for an experiment,
211
as the ER in the lower epidermal surface and the upper mesophyll surface often overlapped. Time-
lapse (x-y-t) images were taken at 1.935s imaging time per frame with minor adjustments made to
maintain focus throughout the imaging time. Single frame (x-y) images or image stacks (x-y-z)
were taken to highlight specific features, such as the cage of ER around the plastid. Image stacks
were flattened using the Standard Deviation Z-Projection function in ImageJ (Schneider et al.,
2012). Quantification of ER in response to treatment with 40 mM sucrose was done in 21-day-old
leaves of the GFP:ER plant line, which was more easily visualized with a low background signal.
Time lapse images were acquired of a region of ER, with four frames taken at 30 s intervals. In
ImageJ, the time-lapse was cropped to include only in focus ER. A sequence of whole-image
modifications was performed in ImageJ on each time-lapse in order to brighten tubules and reduce
background signal: Multiply (factor =1.5); Despeckle; Gaussian Blur (factor=2); Multiply
(factor=1.5); Subtract Background (Radius 30; Sliding paraboloid); Gaussian Blur (factor=2). This
essentially performs two rounds of brightening all pixels, reducing noise and smoothing edges to
get an evenly bright network, with minimal loss of fainter regions or merging of bright ones. The
time-lapses were then converted to binary images (threshold 50-255), resulting in all pixels being
either black or white, and frames within a time-lapse were divided into sequential pairs of images
using the Make Substack function (Stacks: Image1 and 2; Image 2 and 3; Image 3 and 4). On each
pair of images, the Temporal Color Code function (LUT=Spectrum) was used to create a single
image in which images of the ER taken 30s apart were superimposed in two distinct colours (Frame
1 = Cyan, Frame 2 = Red). Regions of the ER that were white represented regions that remained
unchanged, and by measuring the percentage of those pixels compared to the total pixels occupied
the ER in the second frame (red and white pixels combined), the proportion of the ER that remained
static over the 30 s between frames could be quantified. The Color Inspector 3D function gives
graphical and numerical representations of the colour distribution of the pixels in an image and
was used to obtain the number of pixels of each colour (Barthel, 2006). The percent of static ER
was calculated for each image pair and averaged to give a value for the entire time-lapse. This was
done for 20 regions of ER, divided evenly over five plants.
4.4.5 Estimation of anchor point numbers
Potential anchor points were assessed by observing individual etioplasts as they rearranged over
time. The frames in a time-lapse video were displayed in one screen using the Make Montage
212
function in Image J (Schneider et al., 2012). This allowed easier visual tracking of potential anchor
points as the chloroplast moved. Movement of the chloroplast that was likely anchor-point
associated, such as forward extension, branching or kinking of tubules were identified in the
frames they occurred with a dot on the plastid surface. The dots were carried over into subsequent
frames until the total number of potential anchor points could be counted in the final frame. In
cases where the etioplast exhibited extreme changes in shape, the assumption was made that the
anchor point remained in the same relative position on the plastid surface and the new position of
the dot was visually estimated accordingly. If the plastid branched or kinked at the position of an
existing dot, even one whose new position was an estimate, it was not counted as a new point. This
was done for 10 etioplasts and the number of points per etioplast was averaged and the 95% CI
(using the Student’s T-Distribution) was calculated.
4.4.6 Measuring plastid pleomorphy
The criteria and techniques for quantifying plastid pleomorphy were the same as those defined in
Section 3.4.4, with stromule frequency used for chloroplasts and a shape ratio used for etioplasts.
4.4.7 Statistical Analysis
Statistical analysis was performed as outlined in Section 3.4.5.
4.4.8 Treatment of plants to assess ER behaviour and plastid responses
The technique of treatment for 7-day-old and 21-day-old plants with solutions was the same as
described in Section 3.4.5. For all experiments, plants were taken at the end of the night and kept
in darkness for the duration of the treatment. All solutions were prepared, or stocks diluted, in
deionized water and made fresh on the day of the experiment. When drug stocks were made in a
solvent other than water, the equivalent amount of the solvent was added to the experimental
controls. The LatB (CalBiochem 428020) stock was made in ethanol at a concentration of 2.5 mM,
the BFA (Invitrogen B7450) stock at a concentration of 20 mM in ethanol. 20 mM benzyl alcohol
was prepared by mixing 100 µL of benzyl alcohol (Sigma 305197) with 50 mL of deionized water.
213
4.4.9 Measurement of the correlation between ER polygon size and plastid extension
Dark-grown 7-day-old hypocotyls had ER polygon sizes that varied depending on the region of
the hypocotyl observed. Four consistent positions in the hypocotyl were identified by imaging step
by step down the hypocotyl, taking image stacks (x-y-z) in the first, fifth, ninth and thirteenth
position. This equated to approximately 800 µm between stacks. Stacks were taken in three plants
In each stack, the shape ratios of 50 etioplasts and the areas of 200 ER polygons were measured.
ER polygons were selected by drawing equally sized rectangles in random locations within the
image and measuring all polygons in the selected regions until 200 polygons were reached. The
correlation between the shape ratio of individual etioplasts and the size of the ER polygons in the
surrounding area was assessed by measuring the shape ratio of 75 etioplasts and measuring the
average area of ten ER polygons either directly in contact with or in the area immediately
surrounding, each plastid. Based on their shape ratio, etioplasts were divided into five categories
evenly spanning the values from 0 to 1 (e.g. Category 1: 0.81 to 1.0, Category 2: 0.61 to 0.8 etc.).
The ER polygon areas associated with each etioplast were averaged across the category and plotted
against the shape ratio categories.
4.4.10 Chloroplast isolation
4.4.10.1 Solutions
Homogenization buffer (20 mM tricine – BioShop TRI001; 0.4 M sorbitol – Fisher BP439; 10 mM
ethylenediaminetetraacetic acid (EDTA) – BioShop EDT001; 10 mM sodium bicarbonate – Fisher
S233; 0.1% (w/v) bovine serum albumin (BSA) – Bio Basic AD0023; 50 mM sodium ascorbate –
BioShop ASO705) was prepared by adding 1.797g tricine, 36.434 g sorbitol, 1.861 g EDTA and
0.420 g of sodium bicarbonate to a final volume of 500 mL in ultrapure water. On the day of use,
0.25g of BSA and 2.467g of sodium ascorbate were added and the pH of the solution brought to
8.4 with 10 M potassium hydroxide. Percoll Buffer (40 mM tricine; 0.7 M sorbitol; 5 mM
magnesium chloride (Fisher M33); 2.5 mM EDTA) was prepared by adding 0.719g tricine, 12.752
g sorbitol, 0.102 g magnesium chloride and 0.093g EDTA to a final volume of 100 mL of ultrapure
water. The pH of the solution was brought to 7.8 with 10 M potassium hydroxide. Wash Buffer
(20 mM tricine; 0.4 M sorbitol; 5 mM magnesium chloride; 2.5 mM EDTA) was prepared by
214
dissolving 1.79g tricine, 36.434 g sorbitol, 0.508 g magnesium chloride and 0.4653 g EDTA in a
final volume of 500 mL ultrapure water. The pH was brought to 7.8 with 10M potassium
hydroxide.
4.4.10.2 Chloroplast isolation method 1
The protocol for chloroplast isolation was adapted from Salvi et al. (2011) and Ferro et al. (2003)
by members of the lab of Dr. T. Akhtar. All flasks, beakers, tubes and solutions were pre-chilled
on ice. Percoll gradients were initiated prior to tissue harvest, by adding 17.5 mL of percoll buffer
and 17.5 mL of Percoll (GE Life Sciences 17089101) to a clear 50 mL centrifuge tube, then
centrifuging in a fixed-angle rotor for 40 min at 20,000 rpm with the brake off. Prepared gradients
were stored on ice until use. Whole 3- to 5-week-old plants were harvested and immediately
submerged in homogenization buffer in a plastic beaker (approximately 100 g of homogenization
buffer was needed for 10 g of tissue). Harvested tissue was chopped finely using sharp, clean
scissors, then filtered into a clean chilled beaker through six layers of cheesecloth (Fisher S04824).
The tissue remaining in the cheesecloth was removed to the plastid beaker, 100 mL of
homogenization buffer was added and the tissue was homogenized with a Polytron (Kinematica)
three times for 4-5 seconds at medium speed. The material was filtered again through cheesecloth,
then all of the filtrate was gently divided into 50 mL round-bottom tubes on ice using a motorized
pipette (Fisherbrand Powerpette Plus) and 25 mL serological pipettes (Fisherbrand 12-676-10K).
The chloroplasts were pelleted by centrifugation at 2070 g at 4°C for 3 min in a swinging bucket
rotor. The supernatant was discarded, and each pellet was resuspended in 1 mL of wash buffer
with a cut-off transfer pipette. The resuspended pellet was gently layered on the surface of a percoll
gradient, and then centrifuged for 15 min at 2000 g (4°C) in a swinging bucket rotor with the brake
off. Centrifuged gradients should have two clear bands, with the lower band representing intact
chloroplasts. The upper layer was removed using a transfer pipette and using a new cut-off transfer
pipette, the intact chloroplast band was transferred to a clean 50 mL round-bottom tube. Intact
chloroplasts were diluted approximately 4-fold with wash buffer, splitting the chloroplasts
between two tubes if necessary, then pelleted at 1500 g (4°C) for 5 min in a swinging bucket rotor.
The supernatant was discarded and the pellet(s) washed twice more by resuspending the pellet
gently in 10 mL wash buffer (cut-off transfer pipette), pelleting (1500 g, 4°C, 5 min, swinging
215
bucket rotor) and discarding the supernatant. Chloroplasts were resuspended a final time in 10 mL
of wash solution and visualized.
4.4.10.3 Chloroplast isolation method 2
A quick, small scale chloroplast isolation protocol was modified from the above method for rapid
visualization of chloroplasts. All solutions and equipment were used at room temperature. Two-
step percoll gradients were prepared prior to tissue harvest by adding 80% percoll (2 mL percoll,
0.5 mL percoll buffer) to the bottom of a 15 mL conical tube, then layering 40% percoll (2 mL
percoll, 3 mL percoll buffer) gently on top. Whole 21-day-old plants were cut finely with sharp
scissors in approximately 5 mL of homogenization buffer and filtered through six layers of
cheesecloth into a small (50 mL) beaker. The tissue in the cheesecloth was recovered, resuspended
in 5 mL of homogenization buffer, quickly cut up further and filtered again through the
cheesecloth. This was repeated twice more. The filtrate was pelleted at 1000 g for 5 min in a
swinging bucket rotor. The supernatant was discarded, the pellet gently resuspended in 500 µL of
homogenization buffer, and then loaded onto the surface of the percoll gradient. The gradients
were centrifuged (1500 g, 5 min, swinging bucket rotor) and the green band at the interface
between the two percoll concentrations (intact chloroplasts) was transferred to a clean 15 mL
falcon tube. The intact chloroplasts were diluted 4-fold in wash buffer, pelleted (1000 g, 5 min,
swinging bucket rotor), resuspended in 500 µL of wash buffer and visualized.
4.4.11 Electron microscopy
4.4.11.1 Preparation of solutions for fixation and embedding
A 0.2 M solution of sodium phosphate monobasic (NaH2PO4; Fisher BP329) was prepared by
dissolving 24g of NaH2PO4 in a final volume of 1L ultrapure water. 28.4 g of sodium phosphate
dibasic (Na2HPO4; Fisher S374) was dissolved in a final volume of 1L ultrapure water to create a
0.2 M solution. Both sodium phosphate solutions were stored at 4°C for several months.
Sorenson’s Phosphate Buffer (0.2 M) was prepared fresh for each use by mixing 23 mL of 0.2 M
NaH2PO4 and 77 mL of Na2HPO4. This solution was diluted in ultrapure water to create 50 mL of
0.1 M Sorenson’s Buffer.
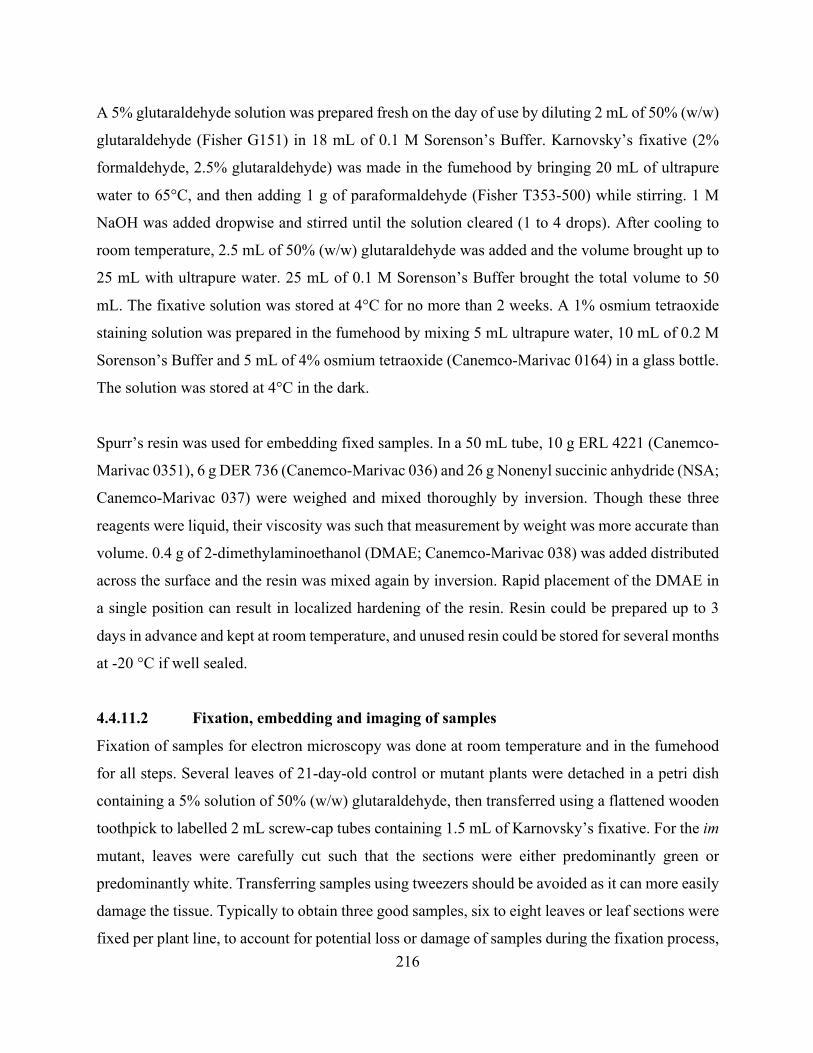
216
A 5% glutaraldehyde solution was prepared fresh on the day of use by diluting 2 mL of 50% (w/w)
glutaraldehyde (Fisher G151) in 18 mL of 0.1 M Sorenson’s Buffer. Karnovsky’s fixative (2%
formaldehyde, 2.5% glutaraldehyde) was made in the fumehood by bringing 20 mL of ultrapure
water to 65°C, and then adding 1 g of paraformaldehyde (Fisher T353-500) while stirring. 1 M
NaOH was added dropwise and stirred until the solution cleared (1 to 4 drops). After cooling to
room temperature, 2.5 mL of 50% (w/w) glutaraldehyde was added and the volume brought up to
25 mL with ultrapure water. 25 mL of 0.1 M Sorenson’s Buffer brought the total volume to 50
mL. The fixative solution was stored at 4°C for no more than 2 weeks. A 1% osmium tetraoxide
staining solution was prepared in the fumehood by mixing 5 mL ultrapure water, 10 mL of 0.2 M
Sorenson’s Buffer and 5 mL of 4% osmium tetraoxide (Canemco-Marivac 0164) in a glass bottle.
The solution was stored at 4°C in the dark.
Spurr’s resin was used for embedding fixed samples. In a 50 mL tube, 10 g ERL 4221 (Canemco-
Marivac 0351), 6 g DER 736 (Canemco-Marivac 036) and 26 g Nonenyl succinic anhydride (NSA;
Canemco-Marivac 037) were weighed and mixed thoroughly by inversion. Though these three
reagents were liquid, their viscosity was such that measurement by weight was more accurate than
volume. 0.4 g of 2-dimethylaminoethanol (DMAE; Canemco-Marivac 038) was added distributed
across the surface and the resin was mixed again by inversion. Rapid placement of the DMAE in
a single position can result in localized hardening of the resin. Resin could be prepared up to 3
days in advance and kept at room temperature, and unused resin could be stored for several months
at -20 °C if well sealed.
4.4.11.2 Fixation, embedding and imaging of samples
Fixation of samples for electron microscopy was done at room temperature and in the fumehood
for all steps. Several leaves of 21-day-old control or mutant plants were detached in a petri dish
containing a 5% solution of 50% (w/w) glutaraldehyde, then transferred using a flattened wooden
toothpick to labelled 2 mL screw-cap tubes containing 1.5 mL of Karnovsky’s fixative. For the im
mutant, leaves were carefully cut such that the sections were either predominantly green or
predominantly white. Transferring samples using tweezers should be avoided as it can more easily
damage the tissue. Typically to obtain three good samples, six to eight leaves or leaf sections were
fixed per plant line, to account for potential loss or damage of samples during the fixation process,
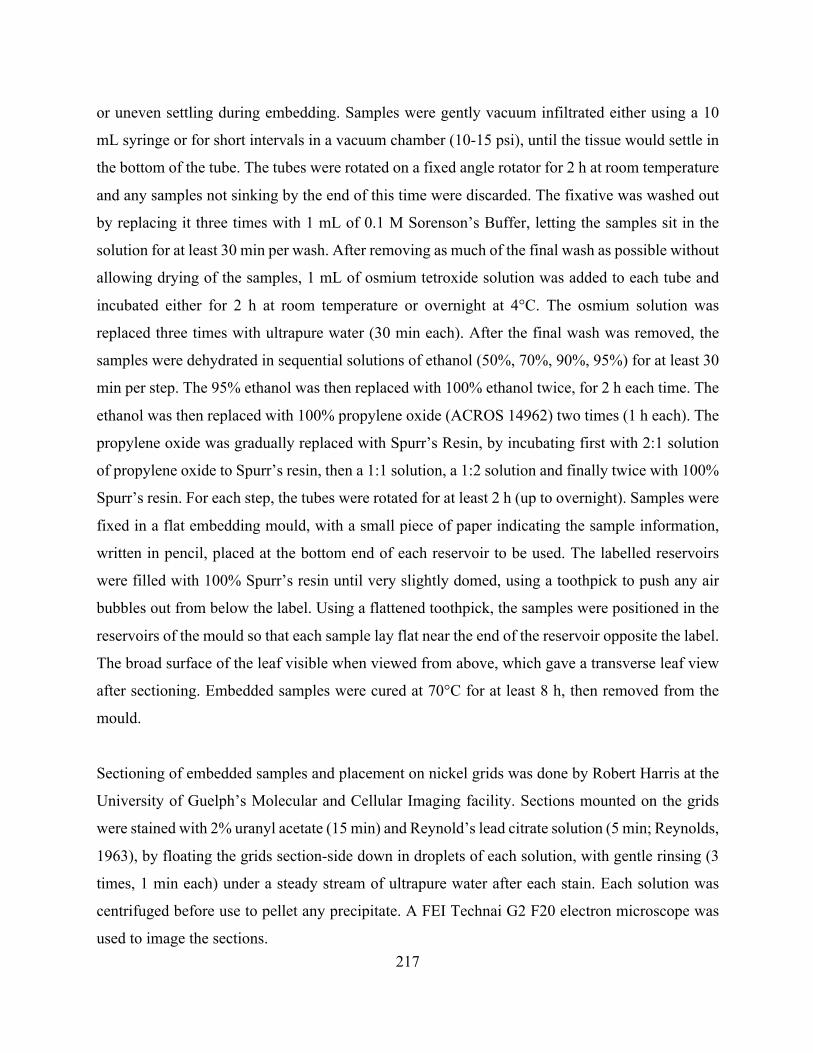
217
or uneven settling during embedding. Samples were gently vacuum infiltrated either using a 10
mL syringe or for short intervals in a vacuum chamber (10-15 psi), until the tissue would settle in
the bottom of the tube. The tubes were rotated on a fixed angle rotator for 2 h at room temperature
and any samples not sinking by the end of this time were discarded. The fixative was washed out
by replacing it three times with 1 mL of 0.1 M Sorenson’s Buffer, letting the samples sit in the
solution for at least 30 min per wash. After removing as much of the final wash as possible without
allowing drying of the samples, 1 mL of osmium tetroxide solution was added to each tube and
incubated either for 2 h at room temperature or overnight at 4°C. The osmium solution was
replaced three times with ultrapure water (30 min each). After the final wash was removed, the
samples were dehydrated in sequential solutions of ethanol (50%, 70%, 90%, 95%) for at least 30
min per step. The 95% ethanol was then replaced with 100% ethanol twice, for 2 h each time. The
ethanol was then replaced with 100% propylene oxide (ACROS 14962) two times (1 h each). The
propylene oxide was gradually replaced with Spurr’s Resin, by incubating first with 2:1 solution
of propylene oxide to Spurr’s resin, then a 1:1 solution, a 1:2 solution and finally twice with 100%
Spurr’s resin. For each step, the tubes were rotated for at least 2 h (up to overnight). Samples were
fixed in a flat embedding mould, with a small piece of paper indicating the sample information,
written in pencil, placed at the bottom end of each reservoir to be used. The labelled reservoirs
were filled with 100% Spurr’s resin until very slightly domed, using a toothpick to push any air
bubbles out from below the label. Using a flattened toothpick, the samples were positioned in the
reservoirs of the mould so that each sample lay flat near the end of the reservoir opposite the label.
The broad surface of the leaf visible when viewed from above, which gave a transverse leaf view
after sectioning. Embedded samples were cured at 70°C for at least 8 h, then removed from the
mould.
Sectioning of embedded samples and placement on nickel grids was done by Robert Harris at the
University of Guelph’s Molecular and Cellular Imaging facility. Sections mounted on the grids
were stained with 2% uranyl acetate (15 min) and Reynold’s lead citrate solution (5 min; Reynolds,
1963), by floating the grids section-side down in droplets of each solution, with gentle rinsing (3
times, 1 min each) under a steady stream of ultrapure water after each stain. Each solution was
centrifuged before use to pellet any precipitate. A FEI Technai G2 F20 electron microscope was
used to image the sections.
218
4.4.12 Cloning of BnCLIP1:RFP, DALL2:RFP, MEX1:R/YFP and mEosFP:ER
The general cloning protocols, products and reagents were the same as described in Section 3.4.8.
BnCLIP1:RFP was created by first PCR amplifying the BnCLIP1 (FJ461591) sequence from the
BnCLIP1:GFP construct obtained from Tan et al., (2011) using a forward primer that introduced
an Xba1 site (5’-TCTAGAATGGCTACCATTCCTTCCCACAAC-3’) and a reverse primer that
introduced an Spe1 site (5’-ACTAGTTGAAGGGTGATGGAGTTGGGTGAG-3’). RFP was
amplified from an existing RFP construct with a forward primer that introduced an Spe1 site (5’-
ACTAGTATGGCCTCCTCCGAGGACGTC-3’) and a reverse primer that introduced a Sac1 site
and a stop codon (5’-GAGCTCTCAGGCGCCGGTGGAGTGGCG-3’). The RFP was ligated into
a modified pCAMBIA vector containing a CaMV 35S promoter and a Nos terminator, with an
existing calnexinTMD:mEosFP fluorescent construct between Xba1 and Spe1 sites (Mathur et al.,
2010). Spe1 and Sac1 sites were located after the existing fluorescent construct. Next,
calnexinTMD:mEosFP was removed from the vector by digesting with Xba1 and Spe1, and
BnCLIP1 ligated in its place to create the BnCLIP1:RFP construct. Because Xba1 and Spe1
produce compatible ends, the digested vector backbone was dephosphorylated (Shrimp Alkaline
Phosphatase – Thermo 78390500UN) to prevent self-ligation and restriction enzyme sites internal
to the BnCLIP1 sequence were used to confirm its orientation in the vector.
The DALL2 (At1G51440) CDS was PCR amplified from cDNA using a forward primer that
introduced an Xba1 site (5’-GTCTAGAATGGCTTCTCTATCTTTACCAAT-3’) and a reverse
primer that introduced a BamHI site and removed the stop codon (5’-
GGATCCAGTCGTTGTGGGTTTAAAATTATC-3’), and ligated into the pGEM-T Easy vector
system. From this vector, the DALL2 fragment was cut out using these sites and ligated into a
modified pCAMBIA1300 vector (modified from calnexinTMD:mEosFP (Mathur et al., 2010))
already containing a CaMV 35S promoter, an in-frame mRFP, and a Nos terminator to create the
DALL2:RFP construct.
The MEX1 (At5G17520) CDS was amplified from cDNA using a forward primer that introduced
an Xba1 site (5’-TCTAGAATGGAAGGTAAAGCCATCGCGACG-3’) and a reverse primer that
introduced a BamHI site and removed the stop codon (5’-
219
GGATCCCGGTCCAAAAACAAGTTCTTTCAA-3’). The CDS was ligated into pGEM-T Easy,
cut out at the BamHI and Xba1 sites and ligated into modified pCAMBIA1300 vectors containing
a CaMV 35S promoter, an in-frame RFP or YFP sequence, and a Nos terminator to create the
MEX1:RFP and MEX1:YFP constructs.
The mEosFP:ER construct was created by first PCR amplifying the mEosFP sequence from the
tpFNR:mEosFP construct using a forward primer that introduced a Sal1 site (5’-
GTCGACAGTGCGATTAAGCCAGACATGAAG-3’) and a reverse primer that added the ER
retention amino acid sequence HDEL, a stop codon and the Sac1 restriction site (5-
GAGCTCTTAGAGTTCATCATGTCGTCTGGCA-3’). The CaMV 35S promoter and an in-
frame ER signal sequence was PCR amplified from the RFP:ER (Sinclair et al., 2009) construct
with a forward primer that introduced a HindIII restriction site (5’-
AAGCTTGCATGCCTGCAGGTCAACATGGTG-3’) and a reverse primer that introduced a Sal1
site (5’-GGTCGACGGCCGAGGATAATGATAGGAGAA-3’). The PCR products were ligated
into the pGEM-T Easy vector system. First, the CaMV 35S promoter with ER signal sequence was
ligated at the introduced restriction sites into a modified pCAMBIA1300 vector with an existing
Nos terminator, and then the mEosFP:HDEL sequence was ligated between the promoter and the
terminator at the Sal1 and Sac1 restriction sites to create the final mEosFP:ER construct.
Transient infiltration of constructs and initiation of transgenic plants was performed as described
in section 3.4.8.

220
5 General Discussion The plastid is an undeniably important organelle, both to the function of the plant and consequently
to all the organisms that rely on plants for their survival. Despite the large amount of research that
has gone into understanding the biochemical pathways to which plastids contribute, much less is
known about how their physical behaviour contributes to their function. Plastid elongation,
whether in the form of thin stromules extending from a plastid body or the elongation of entire
plastids, is common to all plastid types and throughout the higher plants (Hanson and Sattarzadeh,
2008; Hanson and Hines, 2018), which could suggest an important role in plastid function.
Stromules are proposed to assist in the exchange of materials between the plastid and either the
cytosol or other organelles, especially under conditions of stress (Hanson and Hines, 2018). This
theory is based primarily on correlative observations of stromule induction under a considerable
number of stress conditions or in response to related signaling factors, such as hormones or ROS.
Direct confirmation of this is limited by many factors, not the least of which is the lack of
understanding of what causes them to form and the mechanism by which it occurs. Identifying the
mechanism by which a stromule forms and the cellular components involved could go a long way
towards understanding whether they are a deliberate structure with a role in improving plastid
efficiency under conditions requiring increased transport into or out of the plastid, or whether they
are simply a consequence of plastid interactions with the dynamic environment inside the cell.
The number of conditions and plant hormones reported to influence stromule extension is
overwhelming and difficult to explain without a point of convergence in the stress pathways
involved (Appendix 2), especially considering that several hormones reported to increase stromule
frequency can act antagonistically to each other in stress responses (Sewelam et al., 2016). It has
been established in our research, as well as by Vismans et al. (2016) and Brunkard et al. (2015),
that it is possible to measure a general increase in stromule frequency in as little as an hour and to
have a significant response within 1 to 3 h of exposure to a stimulus. This provides an approximate
timeframe for a rapid stromule response that should be kept in mind in future studies. If a response
is possible within a couple hours, then observations of increased stromule frequency after longer
time-periods likely suggest that the treatment itself is not directly activating stromule extension,
221
but rather that a downstream factor is involved. Our observations here suggest that this downstream
factor may be an increase in cellular sugar levels.
A rise in soluble sugars in response to stresses often occurs due to perturbed carbohydrate
metabolism (Rosa et al., 2009; Sami et al., 2016) and most hormones rely on sugar signaling to
initiate some of the associated changes to protein expression (Ljung et al., 2015; Sakr et al., 2018).
Combined with observations that sucrose and glucose could act independently of their osmotic
effects to increase stromule frequency, this made cellular sugar an attractive prospect for a
common element among stromule-inducing conditions. Here we found that an increase in the
frequency or degree of plastid tubulation appears to occur in conjunction with elevated levels of
soluble sugars within the cell and we present sucrose as a potential control hub for this
phenomenon. We were able to confirm, at least in the case of several nutrient stresses, that stromule
extension indeed correlates not with the stress itself, but with associated changes to carbohydrate
levels within the cell. The identification of sugar as an important player in stromule extension, as
well as the rapidity and reliability of the response, provides direction for future research on how
plastid behaviour might influence its function. Further, this may support the proposed role of
stromules in increasing the efficiency of exchange between the plastid and the surrounding cell.
As the primary source of carbohydrates in the plant, whether through synthesis or storage, plastids
are constantly exchanging sugars with their surroundings. The rise and fall of stromule frequencies
in concert with situations where exchange might be expected to increase could suggest a specific
role under these conditions, though again only speculatively.
Given the apparent involvement of carbohydrate levels in plastid behavior, it is important to
consider both tissue and plastid type when studying stromules. A plastid in a heterotrophic cell
might respond differently to environmental factors than a plastid in an autotrophic one, as the
differences in metabolism between the two may alter either carbohydrate levels or how the cell
responds to them. Indeed, though our work here raises questions about the conclusions of their
work, Brunkard et al. (2015) suggest that the plastid response to light may change with plastid
identity, and we similarly saw light-dependent differences in the response to exogenous sucrose
between leaf plastid populations. For this reason, we felt it necessary to clarify the identity of the
222
plastids in the epidermis of Arabidopsis, which is a commonly chosen tissue for stromule
observations.
Based on all of our observations, made across a wide range of growth conditions, the epidermal
plastids in Arabidopsis unequivocally possess chlorophyll. In electron micrographs, they show
stacked thylakoids, the accumulation of starch and plastoglobules, and coordinated research
conducted in another lab suggests an active photosynthetic electron transport chain. Further, they
are indistinguishable in terms of fluorescent signal from plastids in the guard cells, which are
generally considered chloroplasts. We therefore propose that the pavement cells of Arabidopsis
have chloroplasts. Relatively little work has been done on carbon metabolism in the pavement
cells of Arabidopsis; however, taking the guard cell chloroplasts as models (Lawson, 2009;
Lawson et al., 2014), it is very likely, given their small size and number, that pavement cell
chloroplasts could be insufficient to act as a carbon source to the entire cell, leaving the epidermis
as a heterotrophic tissue despite possessing chloroplasts. Recent research has suggested that
epidermal plastids may have proteomes specialized towards environmental sensing and stress
response rather than photosynthesis (Beltrán et al., 2018; Mackenzie and Kundariya, 2019). This
could explain the occasional difference in stromule response between the epidermis and the
underlying mesophyll despite similar plastid identity. It would be intriguing, though challenging,
to perform a tissue-specific analysis to see if the difference in response is due to differences in the
plastids themselves or differences in the amount of sugar accumulated in each cell type.
One consistent phenomenon observed throughout this work that directly contradicts the current
understanding is the relatively easy induction of stromules from mesophyll chloroplasts. These
plastids are typically thought to produce stromules only rarely (Hanson and Sattarzadeh, 2008),
which, considering that the mesophyll is the primary sugar-producing tissue in the plant, would be
in direct conflict with a role for sugars in the process of stromule extension. We found however
that rather than being absent, mesophyll stromules were simply harder to visualize. Compared to
the brighter, thicker stromules emanating from epidermal chloroplasts, mesophyll stromules were
thin, faint, and often masked by their close proximity to other plastids in the densely-packed
223
environment in a mesophyll cell. When the settings were correct however, they responded
similarly to the epidermis under most conditions tested. This supports the ubiquity of stromules
among plastid types and makes it easier to compare stromule frequency to metabolite analysis from
whole-leaf preparations. We found in general that when the response differed between the
mesophyll and the epidermis, the mesophyll stromule frequency typically followed the
carbohydrate trend more closely. This makes sense as the mesophyll makes up the bulk of the leaf
tissue used, and any differences in sugar accumulation in the epidermis would be masked in a
whole-leaf preparation.
There are many reports in the literature indicating that an inducing condition such as sugar is
insufficient by itself for stromule extension, and that the process requires an extraplastidial force.
The actin cytoskeleton (Kwok and Hanson, 2003; Kwok and Hanson, 2004a; Natesan et al., 2009;
Sattarzadeh et al., 2009), microtubules (Kwok and Hanson, 2003; Kumar et al., 2018), and ER
(Schattat et al., 2011a, 2011b) have each been suggested as candidates for creating this force. Our
work strongly suggests that an active actin cytoskeleton and dynamic ER network are required for
stromule extension. These two cellular structures are themselves intertwined, with the actin
cytoskeleton required for proper ER dynamics in plant cells (Sparkes et al., 2009a; Yokota et al.,
2011; Griffing et al., 2014), so most treatments that influence the one also affect the other, making
it difficult to separate their individual effects. However, the ermo1-1 mutant, has disrupted ER
structure but a normal actin cytoskeleton (Nakano et al., 2009). We found that this mutant has
defects in stromule production from chloroplasts and etioplasts that are mostly round rather than
elongated, which supports that the ER is the likely point to which the plastids are connected. Given
the lack of conclusive evidence for a motor protein associated with plastids and the fact that the
same myosins required for ER structure are required for stromule extension, as explained in
Section 4.1, it is probable that the contribution of the actin cytoskeleton to stromule formation is
only indirect, a consequence of its role in ER dynamics.
Given the apparent involvement of increased cellular sugar, de novo protein synthesis (Schattat
and Klösgen, 2011; Gray et al., 2012; Machettira et al., 2012), and the ER for plastid tubulation,
several possible mechanisms are suggested. It is possible that there is a protein mechanistically
224
responsible for membrane tubulation, as suggested by Ho and Theg (2016), which is expressed as
a result of sugar, likely sucrose, signaling. There is precedent for the idea that the ER can assist in
protein-related constriction of a membrane. In mitochondria of mammalian cells, the ER is
believed to wrap around the point of division, reducing the diameter of the mitochondria until it is
small enough to allow the assembly of dynamin-family proteins around the membrane (Friedman
et al., 2011; Murley et al., 2013; Phillips and Voeltz, 2016). The association of ER with the point
of mitochondrial division has also been noted in Arabidopsis (Jaipargas et al., 2015), and
interestingly we noted a similar phenomenon with chloroplasts. There is however little conclusive
evidence to date for a protein involved directly in plastid tubulation (Erickson and Schattat, 2018;
Hanson and Hines, 2018). Further, the dynamics of stromules within the cell, as well as their
extremely transient nature, are more supportive of a role for the ER in pulling on the plastid than
constricting it. First, we do not see a consistent association of the ER suggestive of it wrapping
around a region of plastid membrane. At points where the ER does cross a developing stromule it
is often accompanied by either a dilation or a gap in fluorescence, neither of which we see on a
consistent basis. Further, the extension of stromules along single tubules, the occasional extension
of branches, the considerable length to which a stromule can extend, and their initiation as broad
protrusions that narrow as they extend all argue against a model involving a membrane tubulating
protein as a significant contributor to stromule extension.
An alternative theory is that stromule formation is not the result of direct protein activity, but rather
a combined consequence of the metabolic fate of the sugars and the physical connections that
might contribute to pulling on the plastid envelope. There is considerable evidence supporting the
existence of MCS between the plastid and the ER, which potentially involve both protein tethers
(Andersson et al., 2007) and membrane hemifusion (Mehrshahi et al., 2013). Though the specific
protein composition of these sites remains elusive, they are proposed to be the site of lipid
exchange between these two organelles (Block and Jouhet, 2015). However, the movement of the
ER is continuous in a healthy cell, while stromule formation is often minimal except under specific
conditions. It is plausible that sugar either acts to increase expression of proteins involved in
forming MCS, influencing the number or strength of the connection between the two organelles,
or to alter the composition of the membrane around these sites, changing the amenability of the

225
membrane in the region to tubulation. The first is difficult to assess without knowing the protein
components involved and unfortunately the localization of the one postulated ER-plastid MCS
marker, BnCLIP, turned out to be a potential artifact of fluorescent protein aggregation. However,
on a day-to-day basis, stromules are comparatively scarce, while fatty acid synthesis, turnover, and
inter-organelle exchange is a continuous process (Browse et al., 1986; Li et al., 2016b; Hölzl and
Dörmann, 2019). Though individual MCS are generally considered transient (Jain and Holthuis,
2017), which is supported by the way stromules sometimes snap back from an anchored point, if
lipid exchange between the ER and plastid is continuous, then they must always be connected to
some degree. So while sugar signaling could very well result in an increased number of contact
points, this does not account for the relatively low basal rate of stromule extension.
The most currently testable of the theories is the idea that cellular sugar influences how easily the
plastid membrane can be pulled out. If MCS are the site of lipid transport between membranes, the
lipid composition in the region is likely unique, especially at times of high-flux. The uptake of
sugars has been shown to feed fairly quickly into the synthesis of fatty acids and lipids (Murakawa
et al., 2014), which suggests rapid transfer between the two organelles when sugar levels are
elevated. It has been established in vitro that lipid composition, as well as membrane tension, can
influence how easily a tubule is pulled out from a membrane (Koster et al., 2003; Leduc et al.,
2004; Shi and Baumgart, 2015; McIntosh et al., 2018). If, at times of high flux, the membrane is
locally or generally enriched in lipids that promote tubulation, or even if there is more membrane
and consequently less tension, it may increase the likelihood that the rearrangement of the
associated ER can deform the membrane and initiate stromule extension. It would be an interesting
avenue for future research to see if mutants with altered lipid compositions produce stromules
more or less frequently, as this would provide insight into whether membrane properties are a
significant contributor to plastid elongation.
In conclusion, we propose a testable model for stromule extension wherein stromule extension
requires both an external force and a change to the amenability of the plastid envelopes to
extension. Under this model, elevated sugar levels within the cell alter plastid membrane
composition, either by feeding into lipid synthesis, promoting the expression of associated genes,
226
or both. This creates a membrane that is more amenable to tubulation upon exertion of a pulling
force. The ER is strongly connected to the plastid at discrete points and is the best candidate for
exerting this pulling force, based on both our observations here and the fact that it has the potential
to explain many of the currently conflicting observations on the involvement of cytoskeletal
elements in the literature. This model raises an important, rarely discussed, consideration. If, rather
than being a structure deliberately created in response to a stimulus, stromules result from activity
in the membrane combined with the rearrangement of associated ER, do they necessarily have a
specific function or might they simply be a consequence of the dynamic environment of the cell?
These are certainly not mutually exclusive concepts. A structure formed by happenstance can still
be useful, but we should take care to avoid over-assigning functions to something simply because
it exists.
227
6 References Abreu I, Santos A (1977) Intimate association between endoplasmic reticulum and plastids during microsporogenesis
in Lycopersicum esculentum Mill. and Solanum tuberosum L. J Submicrosc 9: 239–246
Ainsworth EA, Bush DR (2011) Carbohydrate export from the leaf: A highly regulated process and target to enhance
photosynthesis and productivity. Plant Physiol 155: 64-69
Allen NS, Brown DT (1988) Dynamics of the endoplasmic reticulum in living onion epidermal cells in relation to
microtubules, microfilaments, and intracellular particle movement. Cell Motil Cytoskeleton 10: 153–163
Aluru MR, Bae H, Wu D, Rodermel SR (2001) The Arabidopsis immutans mutation affects plastid differentiation
and the morphogenesis of white and green sectors in variegated plants. Plant Physiol 127: 67–77
Andersen HD, Wang C, Arleth L, Peters GH, Westh P (2011) Reconciliation of opposing views on membrane–
sugar interactions. Proc Natl Acad Sci 108: 1874–1878
Andersen KS, Bain JM, Bishop DG, Smillie RM (1972) Photosystem II activity in agranal bundle sheath
chloroplasts from Zea mays. Plant Physiol 49: 461–466
Andersson MX (2013) Chloroplast contact to the endoplasmic reticulum and lipid trafficking. In B Biswal, K
Krupinska, UC Biswal, eds, Plastids Development in Leaves during Growth and Senescence, Advances in
Photosynthesis and Respiration Vol 36, Springer, Dordrecht, pp 155–167
Andersson MX, Dörmann P (2009) Chloroplast membrane lipid biosynthesis and transport. Plant Cell Monographs
Vol 13, Springer, Berlin, Heidelberg, pp 125–158
Andersson MX, Goksör M, Sandelius AS (2007) Optical manipulation reveals strong attracting forces at membrane
contact sites between endoplasmic reticulum and chloroplasts. J Biol Chem 282: 1170–1174
Andrews J, Schmidt H, Heinz E (1989) Interference of electron transport inhibitors with desaturation of
monogalactosyl diacylglycerol in intact chloroplasts. Arch Biochem Biophys 270: 611–622
Atanassova R, Leterrier M, Gaillard C, Agasse A, Sagot E, Coutos-Thevenot P, Delrot S (2003) Sugar-regulated
expression of a putative hexose transport gene in grape. Plant Physiol 131: 326–334
Austin JR (2006) Plastoglobules are lipoprotein subcompartments of the chloroplast that are permanently coupled to
thylakoid membranes and contain biosynthetic enzymes. Plant Cell 18: 1693–1703
Avisar D, Abu-Abied M, Belausov E, Sadot E, Hawes C, Sparkes IA (2009) A comparative study of the
involvement of 17 Arabidopsis myosin family members on the motility of Golgi and other organelles. Plant
Physiol 150: 700–709
Banaś AK, Krzeszowiec W, Dobrucki J, Gabryś H (2010) Mannose, but not glucose or sucrose, disturbs actin
cytoskeleton in Arabidopsis thaliana leaves. Acta Physiol Plant 32: 773–779
Barczak-Brzyżek A, Kiełkiewicz M, Górecka M, Kot K, Karpińska B, Filipecki M (2017) Abscisic Acid
Insensitive 4 transcription factor is an important player in the response of Arabidopsis thaliana to two-spotted
spider mite (Tetranychus urticae) feeding. Exp Appl Acarol 73: 317–326
Barrero-Sicilia C, Silvestre S, Haslam RP, Michaelson L V. (2017) Lipid remodelling: Unravelling the response
to cold stress in Arabidopsis and its extremophile relative Eutrema salsugineum. Plant Sci 263: 194-200

228
Barthel K (2006) 3D-Data Representation with ImageJ. ImageJ User Dev. Conf.
Bartoli A, Galati BG, Tortosa RD (2011) Anatomical studies of the secretory structures: Glandular trichomes and
ducts, in Grindelia pulchella Dunal (Astereae, Asteraceae). Flora 206: 1063–1068
Barton K, Mammone A, Mathur J (2014) Photo-convertible reporters for selective visualization of subcellular
events and interactions, In P Nick, Z Opatrny, eds, Applied Plant Cell Biology, Plant Cell Monographs Vol 22,
Springer, Berlin, Heidelberg, pp 431-453
Barton KA, Schattat MH, Jakob T, Hause G, Wilhelm C, Mckenna J, Máthé C, Runions J, Van Damme D,
Mathur J (2016) Epidermal pavement cells of Arabidopsis have chloroplasts. Plant Physiol 171: 723-726
Barton KA, Wozny MR, Mathur N, Jaipargas E-A, Mathur J (2017) Chloroplast behaviour and interactions with
other organelles in Arabidopsis thaliana pavement cells. J Cell Sci 131: jcs202275
Baxter CJ, Redestig H, Schauer N, Repsilber D, Patil KR, Nielsen J, Selbig J, Liu J, Fernie AR, Sweetlove LJ
(2006) The metabolic response of heterotrophic Arabidopsis cells to oxidative stress. Plant Physiol 143: 312–
325
Beisvag T (1970) An electronmicroscopic investigation of the young gametophyte of the fern Blechnum Spicant (L.)
Roth. Grana 10: 121–135
Bellucci M, De Marchis F, Pompa A (2017) The endoplasmic reticulum is a hub to sort proteins toward
unconventional traffic pathways and endosymbiotic organelles. J Exp Bot 69: 7–20
Beltrán J, Wamboldt Y, Sanchez R, LaBrant EW, Kundariya H, Virdi KS, Elowsky C, Mackenzie SA (2018)
Specialized plastids trigger tissue-specific signaling for systemic stress response in plants. Plant Physiol 178:
672-683
Bertani G (1951) Studies on lysogenesis. I. The mode of phage liberation by lysogenic Escherichia coli. J Bacteriol
62: 293–300
Bertani G (2004) Lysogeny at mid-twentieth century: P1, P2, and other experimental systems. J Bacteriol 186: 595–
600
Bisalputra T, Downton WJS, Tregunna B (1969) The distribution and ultrastructure of chloroplasts in leaves
differing in photosynthetic carbon metabolism. I. Wheat, sorghum, and aristida (Gramineae). Can J Bot 47: 15-
21
Biswal B, Mohapatra PK, Biswal UC, Raval MK (2012) Leaf senescence and transformation of chloroplasts to
gerontoplasts. In JJ Eaton-Rye, BC Tripathy, TD Sharkey, eds, Photosynthesis, Advances in Photosynthesis and
Respiration Vol 34, Springer, Netherlands, Dordrecht, pp 217–230
Bjornson M, Benn G, Song X, Comai L, Franz AK, Dandekar AM, Drakakaki G, Dehesh K (2014) Distinct roles
for mitogen-activated protein kinase signaling and CALMODULIN-BINDING TRANSCRIPTIONAL
ACTIVATOR3 in regulating the peak time and amplitude of the plant general stress response. Plant Physiol
166: 988–996
Bjornson M, Dandekar A, Dehesh K (2016) Determinants of timing and amplitude in the plant general stress
response. J Integr Plant Biol 58: 119–126
229
Blasing OE (2005) Sugars and circadian regulation make major contributions to the global regulation of diurnal gene
expression in Arabidopsis. Plant Cell 17: 3257–3281
Block MA, Jouhet J (2015) Lipid trafficking at endoplasmic reticulum-chloroplast membrane contact sites. Curr
Opin Cell Biol 35: 21–29
Boevink P, Martin B, Oparka K, Cruz SS, Hawes C (1999) Transport of virally expressed green fluorescent protein
through the secretory pathway in tobacco leaves is inhibited by cold shock and brefeldin A. Planta 208: 392–
400
Bohdanowicz J, Lewandowska B (1999) Participation of endoplasmic reticulum in the unequal distribution of
plastids during generative cell formation in Gagea lutea (L.) Ker.-Haw. (Liliaceae). Acta Biol Cracoviensia 41:
177–183
Bowes BG, Mauseth JD (2008) Plant Structure – A Colour Guide 2nd Edition. BG Bowes, JD Mauseth, eds, London,
UK, Manson Publishing
Breuers FKH, Bräutigam A, Geimer S, Welzel UY, Stefano G, Renna L, Brandizzi F, Weber APM (2012)
Dynamic remodeling of the plastid envelope membranes – A tool for chloroplast envelope in vivo localizations.
Front Plant Sci 3: 7
Breuers FKH, Bräutigam A, Weber APM (2011) The plastid outer envelope – a highly dynamic interface between
plastid and cytoplasm. Front Plant Sci 2: 97
Bross CD, Howes TR, Rad SA, Kljakic O, Kohalmi SE (2017) Subcellular localization of Arabidopsis arogenate
dehydratases suggests novel and non-enzymatic roles. J Exp Bot 68: 1425–1440
Browse J, Warwick N, Somerville CR, Slack CR (1986) Fluxes through the prokaryotic and eukaryotic pathways
of lipid synthesis in the “16:3” plant Arabidopsis thaliana. Biochem J 235: 25-31
Brunkard JO, Runkel AM, Zambryski PC (2015) Chloroplasts extend stromules independently and in response to
internal redox signals. Proc Natl Acad Sci 112: 10044–10049
Buchner O, Holzinger A, Lütz C (2007) Effects of temperature and light on the formation of chloroplast protrusions
in leaf mesophyll cells of high alpine plants. Plant Cell Environ 30: 1347–1356
Buchner O, Moser T, Karadar M, Roach T, Kranner I, Holzinger A (2015) Formation of chloroplast protrusions
and catalase activity in alpine Ranunculus glacialis under elevated temperature and different CO2/O2 ratios.
Protoplasma 252: 1613–1619
Büssis D, Heineke D (1998) Acclimation of potato plants to polyethylene glycol-induced water deficit II. Contents
and subcellular distribution of organic solutes. J Exp Bot 49: 1361–1370
Buysse J, Merckx R (1993) An improved colorimetric method to quantify sugar content of plant tissue. J Exp Bot
44: 1627–1629
Caplan JL, Mamillapalli P, Burch-Smith TM, Czymmek K, Dinesh-Kumar SP (2008) Chloroplastic protein
NRIP1 mediates innate immune receptor recognition of a viral effector. Cell 132: 449–462
Caplan JL, Kumar AS, Park E, Padmanabhan MS, Hoban K, Modla S, Czymmek K, Dinesh-Kumar SP (2015)
Chloroplast stromules function during innate immunity. Dev Cell 34: 45–57
230
Caspar T, Huber SC, Somerville C (1985) Alterations in growth, photosynthesis, and respiration in a starchless
mutant of Arabidopsis thaliana (L.) deficient in chloroplast phosphoglucomutase activity. Plant Physiol 79: 11–
17
Caspar T, Lin T-P, Kakefuda G, Benbow L, Preiss J, Somerville C (1991) Mutants of Arabidopsis with altered
regulation of starch degradation. Plant Physiol 95: 1181–1188
Chandran D, Reinders A, Ward JM (2003) Substrate Specificity of the Arabidopsis thaliana Sucrose Transporter
AtSUC2. J Biol Chem 278: 44320–44325
Charuvi D, Kiss V, Nevo R, Shimoni E, Adam Z, Reich Z (2012) Gain and loss of photosynthetic membranes
during plastid differentiation in the shoot apex of Arabidopsis. Plant Cell 24: 1143-1157
Chen Z, Atefi E, Baumgart T (2016) Membrane shape instability induced by protein crowding. Biophys J 111:
1823–1826
Chiang YH, Zubo YO, Tapken W, Kim HJ, Lavanway AM, Howard L, Pilon M, Kieber JJ, Schaller GE (2012)
Functional characterization of GATA transcription factors GNC and CGA1 reveals their key role in chloroplast
development, growth, and division in Arabidopsis. Plant Physiol 160: 332-348
Chiou T, Lin S (2011) Signaling network in sensing phosphate availability in plants. Annu Rev Plant Biol 62: 185–
206
Chudakov DM, Matz M V, Lukyanov S, Lukyanov KA (2010) Fluorescent proteins and their applications in
imaging living cells and tissues. Physiol Rev 90: 1103–1163
Ciereszko I, Johansson H, Hurry V, Kleczkowski LA (2001) Phosphate status affects the gene expression, protein
content and enzymatic activity of UDP-glucose pyrophosphorylase in wild-type and pho mutants of
Arabidopsis. Planta 212: 598–605
Ciereszko I, Kleczkowski LA (2002) Glucose and mannose regulate the expression of a major sucrose synthase gene
in Arabidopsis via hexokinase-dependent mechanisms. Plant Physiol Biochem 40: 907–911
Clough SJ, Bent AF (1998) Floral dip: A simplified method for Agrobacterium-mediated transformation of
Arabidopsis thaliana. Plant J 16: 735–743
Coué M, Brenner SL, Spector I, Korn ED (1987) Inhibition of actin polymerization by latrunculin A. FEBS Lett
213: 316–318
Cramer GR, Ergül A, Grimplet J, Tillett RL, Tattersall EAR, Bohlman MC, Vincent D, Sonderegger J, Evans
J, Osborne C, et al (2007) Water and salinity stress in grapevines: Early and late changes in transcript and
metabolite profiles. Funct Integr Genomics 7: 111–134
Cran DG, Dyer AF (1973) Membrane continuity and associations in the fern Dryopteris borreri. Protoplasma 76:
103–108
Cremers FFM, Voorhout WF, Vanderkrift TP, Leunissenbijvelt JJM, Verkleij AJ, Cremers AFM (1988)
contact sites between outer and inner envelope membranes in chloroplasts. Ultramicroscopy 24: 334–340
Crotty WJ, Ledbetter MC (1973) Membrane continuities involving chloroplasts and other organelles in plant cells.
Science 182: 839–841
231
Dar AA, Choudhury AR, Kancharla PK, Arumugam N (2017) The FAD2 gene in plants: Occurrence, regulation,
and role. Front Plant Sci 8: 1789
Dasgupta K, Khadilkar AS, Sulpice R, Pant B, Scheible WR, Fisahn J, Stitt M, Ayre BG (2014) Expression of
sucrose transporter cDNAs specifically in companion cells enhances phloem loading and long-distance transport
of sucrose but leads to an inhibition of growth and the perception of a phosphate limitation. Plant Physiol 165:
715–731
Dekker JP, Boekema EJ (2005) Supramolecular organization of thylakoid membrane proteins in green plants.
Biochim Biophys Acta Bioenerg 1706: 12–39
Delatte TL, Sedijani P, Kondou Y, Matsui M, de Jong GJ, Somsen GW, Wiese-Klinkenberg A, Primavesi LF,
Paul MJ, Schluepmann H (2011) Growth arrest by trehalose-6-phosphate: an astonishing case of primary
metabolite control over growth by way of the SnRK1 signaling pathway. Plant Physiol 157: 160–174
Delfosse K, Wozny MR, Anderson C, Barton KA, Mathur J (2018) Evolving views on plastid pleomorphy. In V
Sahi, F Baluska, eds, Concepts in Cell Biology – History and Evolution, Plant Cell Monographs Vol 23, pp
185–204
Delfosse K, Wozny MR, Jaipargas E-A, Barton KA, Anderson C, Mathur J (2016) Fluorescent protein aided
insights on plastids and their extensions: A critical appraisal. Front Plant Sci 6: 1253
Diers L (1966) On the plastids, mitochondria, and other cell constituents during oogenesis of a plant. J Cell Biol 28:
527–543
Dieuaide-Noubhani M, Raffard G, Canioni P, Pradet A, Raymond P (1995) Quantification of compartmented
metabolic fluxes in Maize root tips using isotope distribution from 13C- or 14C-labeled glucose. J Biol Chem
270: 13147–13159
Dimova R (2014) Recent developments in the field of bending rigidity measurements on membranes. Adv Colloid
Interface Sci 208: 225-234
Dixit R, Cyr R (2004) The cortical microtubule array: From dynamics to organization. Plant Cell 16: 2546-2552
Douce R, Joyard J (1980) Structure and function of the plastid envelope. Adv Bot Res 7: 1-116
DuBois M, Gilles KA, Hamilton JK, Rebers PA, Smith F (1956) Colorimetric method for determination of sugars
and related substances. Anal Chem 28: 350–356
Duckett JG (1973) An ultrastructural study of the differentiation of the spermatozoid of Equisetum. J Cell Sci 12:
95–129
Dupree P, Pwee K, Gray J (1991) Expression of photosynthesis gene promoter fusions in leaf epidermal cells of
transgenic tobacco plants. Plant J 1: 115–120
Eastmond PJ, Quettier A-L, Kroon JTM, Craddock C, Adams N, Slabas AR (2010) PHOSPHATIDIC ACID
PHOSPHOHYDROLASE1 and 2 regulate phospholipid synthesis at the endoplasmic reticulum in Arabidopsis.
Plant Cell 22: 2796–2811
Eckstein A, Zieba P, Gabryś H (2012) Sugar and light effects on the condition of the photosynthetic apparatus of
Arabidopsis thaliana cultured in vitro. J Plant Growth Regul 31: 90–101
232
Ekman A, Bülow L, Stymne S (2007) Elevated atmospheric CO(2) concentration and diurnal cycle induce changes
in lipid composition in Arabidopsis thaliana. New Phytol 174: 591–599
Emanuelle S, Doblin MS, Stapleton DI, Bacic A, Gooley PR (2016) Molecular insights into the enigmatic metabolic
regulator, SnRK1. Trends Plant Sci 21: 341–353
Erickson JL, Adlung N, Lampe C, Bonas U, Schattat MH (2018) The Xanthomonas effector XopL uncovers the
role of microtubules in stromule extension and dynamics in Nicotiana benthamiana. Plant J 93: 856–870
Erickson JL, Kantek M, Schattat MH (2017) Plastid-nucleus distance alters the behavior of stromules. Front Plant
Sci 8:1135
Erickson JL, Schattat MH (2018) Shaping plastid stromules — Principles of in vitro membrane tubulation applied
in planta. Curr Opin Plant Biol 46: 48–54
Erickson JL, Ziegler J, Guevara D, Abel S, Klösgen RB, Mathur J, Rothstein SJ, Schattat MH (2014)
Agrobacterium-derived cytokinin influences plastid morphology and starch accumulation in Nicotiana
benthamiana during transient assays. BMC Plant Biol 14: 127
Esau K (1944) Anatomical and cytological studies on beet mosaic. J Agric Res 69, 69: 95–117
Evans IM, Rus AM, Belanger EM, Kimoto M, Brusslan JA (2010) Dismantling of Arabidopsis thaliana mesophyll
cell chloroplasts during natural leaf senescence. Plant Biol 12: 1–12
Exposito-Rodriguez M, Laissue PP, Yvon-Durocher G, Smirnoff N, Mullineaux PM (2017) Photosynthesis-
dependent H2O2 transfer from chloroplasts to nuclei provides a high-light signalling mechanism. Nat Commun
8: 4
Farsad K, De Camilli P (2003) Mechanisms of membrane deformation. Curr Opin Cell Biol 15: 372–381
Faull AF (1935) Elaioplasts in Iris: A morphological study. J Arnold Arbor 57: 225–267
Fernie AR, Roessner U, Geigenberger P (2001) The sucrose analog palatinose leads to a stimulation of sucrose
degradation and starch synthesis when supplied to discs of growing potato tubers. Plant Physiol 125: 1967–1977
Ferro M, Salvi D, Brugière S, Miras S, Kowalski S, Louwagie M, Garin J, Joyard J, Rolland N (2003) Proteomics
of the chloroplast envelope membranes from Arabidopsis thaliana. Mol Cell Proteomics 2: 325–345
Fester T, Strack D, Hause B (2001) Reorganization of tobacco root plastids during arbuscule development. Planta
213: 864–868
Figueroa CM, Lunn JE (2016) A tale of two sugars: Trehalose 6-phosphate and sucrose. Plant Physiol 172: 7–27
Fiordi AC, Maugini E (1972) Observations on certain plastids of the ovule of Ginkyo biloba. Caryologia 25: 189–
197
Foissner I, Menzel D, Wasteneys GO (2009) Microtubule-dependent motility and orientation of the cortical
endoplasmic reticulum in elongating characean internodal cells. Cell Motil Cytoskeleton 66: 142–155
Fondy BR, Geiger DR (1977) Sugar selectivity and other characteristics of phloem loading in Beta vulgaris L. Plant
Physiol 59: 953–960
Foyer CH, Neukermans J, Queval G, Noctor G, Harbinson J (2012) Photosynthetic control of electron transport
and the regulation of gene expression. J Exp Bot 63: 1637–1661
233
Foyer CH, Shigeoka S (2010) Understanding oxidative stress and antioxidant functions to enhance photosynthesis.
Plant Physiol 155: 93–100
Franco-Zorrilla JM, Martin AC, Leyva A, Paz-Ares J (2005) Interaction between phosphate-starvation, sugar, and
cytokinin signaling in Arabidopsis and the roles of cytokining receptors CRE1/AHK4 and AHK3. Plant Physiol
138: 847–857
Frederick SE, Newcomb EH (1969) Microbody-like organelles in leaf cells. Science 163: 1353-1355
Friedman JR, Lackner LL, West M, DiBenedetto JR, Nunnari J, Voeltz GK (2011) ER tubules mark sites of
mitochondrial division. Science 334: 358-362
Friml J, Jones AR (2010) Endoplasmic reticulum: The rising compartment in auxin biology. Plant Physiol 154: 458–
462
Fujiwara MT, Yasuzawa M, Kojo KH, Niwa Y, Abe T, Yoshida S, Nakano T, Itoh RD (2018) The Arabidopsis
arc5 and arc6 mutations differentially affect plastid morphology in pavement and guard cells in the leaf
epidermis. PLoS ONE 13: e0192380
Gao H, Metz J, Teanby NA, Ward AD, Botchway SW, Coles BC, Pollard MR, Sparkes I (2016) In vivo
quantification of peroxisome tethering to chloroplasts in tobacco epidermal cells using optical tweezers. Plant
Physiol 170: 263-272
Garrard LA, Humphreys TE (1969) The effect of d-mannose on sucrose storage in the corn scutellum: Evidence
for two sucrose transpsort mechanisms. Phytochemistry 8: 1065–1077
Gerhardt R, Stitt M, Heldt HW (1987) Subcellular metabolite levels in apinach leaves : Regulation of sucrose
synthesis during diurnal alterations in photosynthetic partitioning. Plant Physiol 83: 399–407
Ghillebert R, Swinnen E, Wen J, Vandesteene L, Ramon M, Norga K, Rolland F, Winderickx J (2011) The
AMPK/SNF1/SnRK1 fuel gauge and energy regulator: Structure, function and regulation. FEBS J 278: 3978–
3990
Ghosh S, Mahoney SR, Penterman JN, Peirson D, Dumbroff EB (2001) Ultrastructural and biochemical changes
in chloroplasts during Brassica napus senescence. Plant Physiol Biochem 39: 777–784
Giaquinta R (1977) Phloem loading of sucrose. Plant Physiol 59: 750–755
Gibbs SP (1981) The chloroplast endoplasmic reticulum: Structure, function and evolutionary significance. Int Rev
Cytol 71: 49–100
Gibon Y, Bläsing OE, Palacios-Rojas N, Pankovic D, Hendriks JHM, Fisahn J, Höhne M, Günther M, Stitt M
(2004) Adjustment of diurnal starch turnover to short days: Depletion of sugar during the night leads to a
temporary inhibition of carbohydrate utilization, accumulation of sugars and post-translational activation of
ADP-glucose pyrophosphorylase. Plant J 39: 847–862
Giełwanowska I, Pastorczyk M, Kellmann-Sopyła W, Górniak D, Górecki RJ (2015) Morphological and
ultrastructural changes of organelles in leaf mesophyll cells of the Arctic and Antarctic plants of Poaceae family
under cold influence. Arctic Antarct Alp Res 47: 17–25
234
Giełwanowska I, Szczuka E, Bednara J, Górecki R (2005) Anatomical features and ultrastructure of Deschampsia
antarctica (Poaceae) leaves from different growing habitats. Ann Bot 96: 1109–1119
Gómez-Ariza J, Campo S, Rufat M, Estopà M, Messeguer J, Segundo BS, Coca M (2007) Sucrose-mediated
priming of plant defense responses and broad-spectrum disease resistance by overexpression of the maize
Pathogenesis-related PRms protein in rice plants. Mol Plant-Microbe Interact 20: 832–842
Gong Q, Li P, Ma S, Indu Rupassara S, Bohnert HJ (2005) Salinity stress adaptation competence in the
extremophile Thellungiella halophila in comparison with its relative Arabidopsis thaliana. Plant J 44: 826–839
Gonzali S, Loreti E, Solfanelli C, Novi G, Alpi A, Perata P (2006) Identification of sugar-modulated genes and
evidence for in vivo sugar sensing in Arabidopsis. J Plant Res 119: 115–123
Gray JC, Hansen MR, Shaw DJ, Graham K, Dale R, Smallman P, Natesan SKA, Newell CA (2012) Plastid
stromules are induced by stress treatments acting through abscisic acid. Plant J 69: 387–398
Gray JC, Sullivan JA, Hibberd JM, Hansen MR (2001) Stromules: Mobile protrusions and interconnections
between plastids. Plant Biol 3: 223–233
Griffing LR (2010) Networking in the endoplasmic reticulum. Biochem Soc Trans 38: 747–753
Griffing LR (2011) Laser stimulation of the chloroplast/endoplasmic reticulum nexus in tobacco transiently produces
protein aggregates (Boluses) within the endoplasmic reticulum and stimulates local ER remodeling. Mol Plant
4: 886–895
Griffing LR, Gao HT, Sparkes I (2014) ER network dynamics are differentially controlled by myosins XI-K, XI-C,
XI-E, XI-I, XI-1, and XI-2. Front Plant Sci 5: 218
Griffing LR, Lin C, Perico C, White RR, Sparkes I (2017) Plant ER geometry and dynamics: biophysical and
cytoskeletal control during growth and biotic response. Protoplasma 254: 43–56
Griffiths CA, Paul MJ, Foyer CH (2016) Metabolite transport and associated sugar signalling systems underpinning
source/sink interactions. Biochim Biophys Acta 1857: 1715–1725
Gunning, B., Koenig, F. and Govindjee (2007). A dedication to pioneers of research on chloroplast structure. In R
Wise, J Hoober, eds, The Structure and Function of Plastids, Springer, Netherlands, pp xxiii-xxxi
Gunning BES (2005) Plastid stromules: Video microscopy of their outgrowth, retraction, tensioning, anchoring,
branching, bridging, and tip-shedding. Protoplasma 225: 33–42
Halford NG, Hey S, Jhurreea D, Laurie S, McKibbin RS, Paul M, Zhang Y (2003) Metabolic signalling and
carbon partitioning: Role of Snf1-related (SnRK1) protein kinase. J Exp Bot 54: 467-475
Hamada T, Tominaga M, Fukaya T, Nakamura M, Nakano A, Watanabe Y, Hashimoto T, Baskin TI (2012)
RNA processing bodies, peroxisomes, golgi bodies, mitochondria, and endoplasmic reticulum tubule junctions
frequently pause at cortical microtubules. Plant Cell Physiol 53: 699–708
Hamada T, Ueda H, Kawase T, Hara-Nishimura I (2014) Microtubules contribute to tubule elongation and
anchoring of endoplasmic reticulum, resulting in high network complexity in Arabidopsis. Plant Physiol 166:
1869–1876
235
Hans J, Hause B, Strack D, Walter MH (2004) Cloning, characterization, and immunolocalization of a mycorrhiza-
inducible 1-deoxy-d-xylulose 5-phosphate reductoisomerase in arbuscule-containing cells of maize. Plant
Physiol 134: 614–624
Hanson MR, Hines KM (2018) Stromules: Probing formation and function. Plant Physiol 176: 128–137
Hanson MR, Sattarzadeh A (2008) Dynamic morphology of plastids and stromules in angiosperm plants. Plant Cell
Environ 31: 646–657
Hanson MR, Sattarzadeh A (2011) Stromules: recent insights into a long neglected feature of plastid morphology
and function. Plant Physiol 155: 1486–1492
Haseloff J, Siemering KR, Prasher DC, Hodge S (1997) Removal of a cryptic intron and subcellular localization of
green fluorescent protein are required to mark transgenic Arabidopsis plants brightly. Proc Natl Acad Sci 94:
2122–2127
Haswell ES, Meyerowitz EM (2006) MscS-like proteins control plastid size and shape in Arabidopsis thaliana. Curr
Biol 16: 1–11
Hawes C, Kiviniemi P, Kriechbaumer V (2015) The endoplasmic reticulum: A dynamic and well-connected
organelle. J Integr Plant Biol 57: 50–62
Hei S, Liu Z, Huang A, She X (2018) The regulator of G-protein signalling protein mediates D-glucose-induced
stomatal closure via triggering hydrogen peroxide and nitric oxide production in Arabidopsis. Funct Plant Biol
45: 509–518
Herbers K, Meuwly P, Métraux JP, Sonnewald U (1996) Salicylic acid-independent induction of pathogenesis-
related protein transcripts by sugars is dependent on leaf developmental stage. FEBS Lett 397: 239–244
Herold A, Lewis DH (1977) Mannose and green plants: occurance, physiology and metabolism, and use as a tool to
study the role of orthophosphate. New Phytol 79: 1–40
Higa T, Suetsugu N, Kong S-G, Wada M (2014) Actin-dependent plastid movement is required for motive force
generation in directional nuclear movement in plants. Proc Natl Acad Sci 111: 4327–4331
Higaki T, Kutsuna N, Okubo E, Sano T, Hasezawa S (2006) Actin microfilaments regulate vacuolar structures and
dynamics: Dual observation of actin microfilaments and vacuolar membrane in living tobacco BY-2 cells. Plant
Cell Physiol 47: 839-852
Ho J, Theg SM (2016) The formation of stromules in vitro from chloroplasts isolated from Nicotiana benthamiana.
PLoS One 11: e0146489
Hodges M, Dellero Y, Keech O, Betti M, Raghavendra AS, Sage R, Zhu X-G, Allen DK, Weber APM (2016)
Perspectives for a better understanding of the metabolic integration of photorespiration within a complex plant
primary metabolism network. J Exp Bot 67: 3015-3026
Hoffmann PC, Kukulski W (2017) Perspective on architecture and assembly of membrane contact sites. Biol Cell
109: 400–408
Hofmann J, Börnke F, Schmiedl A, Kleine T, Sonnewald U (2011) Detecting functional groups of arabidopsis
mutants by metabolic profiling and evaluation of pleiotropic responses. Front Plant Sci 2: 82

236
Holzinger A, Buchner O, Lütz C, Hanson MR (2007a) Temperature-sensitive formation of chloroplast protrusions
and stromules in mesophyll cells of Arabidopsis thaliana. Protoplasma 230: 23–30
Holzinger A, Kwok EY, Hanson MR (2008) Effects of arc3, arc5 and arc6 mutations on plastid morphology and
stromule formation in green and nongreen tissues of Arabidopsis thaliana. Photochem Photobiol 84: 1324–1335
Holzinger A, Wasteneys GO, Lütz C (2007b) Investigating cytoskeletal function in chloroplast protrusion formation
in the Arctic-Alpine plant Oxyria digyna. Plant Biol 9: 400–410
Hölzl G, Dörmann P (2019) Chloroplast lipids and their biosynthesis. Annu Rev Plant Biol 70: 51-81
Hörmanseder K, Obermeyer G, Foissner I (2005) Disturbance of endomembrane trafficking by brefeldin A and
calyculin A reorganizes the actin cytoskeleton of Lilium longiflorum pollen tubes. Protoplasma 227: 25–36
Humphreys TE (1973) Sucrose transport at the tonoplast. Phytochemistry 12: 1211–1219
Irish VF (2008) The Arabidopsis petal: a model for plant organogenesis. Trends Plant Sci 13: 430–436
Ishida H, Yoshimoto K, Izumi M, Reisen D, Yano Y, Makino A, Ohsumi Y, Hanson MR, Mae T (2008)
Mobilization of rubisco and stroma-localized fluorescent proteins of chloroplasts to the vacuole by an ATG
gene-dependent autophagic process. Plant Physiol 148: 142–155
Itoh RD, Fujiwara MT (2010) Regulation of leucoplast morphology in roots: Interorganellar signaling from
mitochondria? Plant Signal Behav 5: 856–859
Itoh RD, Yamasaki H, Septiana A, Yoshida S, Fujiwara MT (2010) Chemical induction of rapid and reversible
plastid filamentation in Arabidopsis thaliana roots. Physiol Plant 139: 144–158
Izumi M, Hidema J, Makino A, Ishida H (2013) Autophagy contributes to nighttime energy availability for growth
in Arabidopsis. Plant Physiol 161: 1682–1693
Jain A, Holthuis JCM (2017) Membrane contact sites, ancient and central hubs of cellular lipid logistics. Biochim
Biophys Acta Mol Cell Res 1864: 1450–1458
Jain A, Poling MD, Karthikeyan AS, Blakeslee JJ, Peer WA, Titapiwatanakun B, Murphy AS, Raghothama
KG (2007) Differential effects of sucrose and auxin on localized phosphate deficiency-induced modulation of
different traits of root system architecture in Arabidopsis. Plant Physiol 144: 232–247
Jaipargas E-A, Barton KA, Mathur N, Mathur J (2015) Mitochondrial pleomorphy in plant cells is driven by
contiguous ER dynamics. Front Plant Sci 6: 783
Jaipargas E.-A, Mathur, N, Bou Daher D, Wasteneys GO, Mathur J (2016) High light intensity leads to increased
peroxule-mitochondra interactions in plants. Front Cell Dev Biol 4: 6
Jang J-C, Sheen J (1994) Sugar sensing in higher plants. Plant Cell 6: 1665–1679
Jarsch IK, Daste F, Gallop JL (2016) Membrane curvature in cell biology: An integration of molecular mechanisms.
J Cell Biol 214: 375–387
Jarvis P, López-Juez E (2013) Biogenesis and homeostasis of chloroplasts and other plastids. Nat Rev Mol Cell Biol
14: 787-802
Jarvis P (2007) The proteomes of chloroplasts and other plastids. In J Samaj, J Thelen, eds, Plant Proteomics.
Springer-Verlag, Berlin, Heidelberg, pp 207–225
Jensen WA (1965) The ultrastructure and composition of the egg and central cell of cotton. Am J Bot 52: 781–797
237
Jiang T, Oh ES, Bonea D, Zhao R (2017) HSP90C interacts with PsbO1 and facilitates its thylakoid distribution
from chloroplast stroma in Arabidopsis. PLoS One 12: e0190168
Joo JH, Wang S, Chen JG, Jones AM, Fedoroff NV (2005) Different signaling and cell death roles of heterotrimeric
G protein α and β subunits in the Arabidopsis oxidative stress response to ozone. Plant Cell 17: 957-970
Jouhet J, Maréchal E, Baldan B, Bligny R, Joyard J, Block MA (2004) Phosphate deprivation induces transfer of
DGDG galactolipid from chloroplast to mitochondria. J Cell Biol 167: 863-874
Kadota A, Yamada N, Suetsugu N, Hirose M, Saito C, Shoda K, Ichikawa S, Kagawa T, Nakano A, Wada M
(2009) Short actin-based mechanism for light-directed chloroplast movement in Arabidopsis. Proc Natl Acad
Sci 106: 13106–13111
Kandasamy MK, Meagher RB (1999) Actin-organelle interaction: Association with chloroplast in Arabidopsis leaf
mesophyll cells. Cell Motil Cytoskeleton 44: 110–118
Kaneko Y, Keegstra K (1996) Plastid biogenesis in embryonic pea leaf cells during early germination. Protoplasma
195: 59–67
Kang SG, Price J, Lin PC, Hong JC, Jang JC (2010) The Arabidopsis bZIP1 transcription factor is involved in
sugar signaling, protein networking, and DNA binding. Mol Plant 3: 361–373
Kaplan F (2004) Exploring the temperature-stress metabolome of Arabidopsis. Plant Physiol 136: 4159-4168
Karthikeyan AS, Varadarajan DK, Jain A, Held MA, Carpita NC, Raghothama KG (2007) Phosphate starvation
responses are mediated by sugar signaling in Arabidopsis. Planta 225: 907–918
Kawamatu S (1963) Electron microscope observations on the root hair cell of Azolla imbricata Nakai. Cytologia
(Tokyo) 28: 12–20
Kim JK, Bamba T, Harada K, Fukusaki E, Kobayashi A (2007) Time-course metabolic profiling in Arabidopsis
thaliana cell cultures after salt stress treatment. J Exp Bot 58: 415–424
Kjellberg JM, Trimborn M, Andersson M, Sandelius AS (2000) Acyl-CoA dependent acylation of phospholipids
in the chloroplast envelope. Biochim Biophys Acta Mol Cell Biol Lipids 1485: 100–110
Knebel W, Quader H, Schnepf E (1990) Mobile and immobile endoplasmic reticulum in onion bulb epidermis cells:
Short- and long-term observations with a confocal laser scanning microscope. Eur J Cell Biol 52: 328–340
Köhler RH, Cao J, Zipfel WR, Webb WW, Hanson MR (1997) Exchange of protein molecules through connections
between higher plant plastids. Science 267: 2039–2043
Köhler RH, Hanson MR (2000) Plastid tubules of higher plants are tissue-specific and developmentally regulated. J
Cell Sci 113: 81–89
Köhler RH, Schwille P, Webb WW, Hanson MR (2000) Active protein transport through plastid tubules: velocity
quantified by fluorescence correlation spectroscopy. J Cell Sci 113: 3921–3930
Kojo KH, Fujiwara MT, Itoh RD (2009) Involvement of AtMinE1 in plastid morphogenesis in various tissues of
Arabidopsis thaliana. Biosci Biotechnol Biochem 73: 2632–2639
Kolbe A, Tiessen A, Schluepmann H, Paul M, Ulrich S, Geigenberger P (2005) Trehalose 6-phosphate regulates
starch synthesis via posttranslational redox activation of ADP-glucose pyrophosphorylase. Proc Natl Acad Sci
U S A 102: 11118–11123
238
Kong S-G, Arai Y, Suetsugu N, Yanagida T, Wada M (2013) Rapid severing and motility of chloroplast-actin
filaments are required for the chloroplast avoidance response in Arabidopsis. Plant Cell 25: 572–590
Koornneef M, Meinke D (2010) The development of Arabidopsis as a model plant. Plant J 61: 909–921
Koornneef M, Smeekens S (2005) Sucrose-specific induction of anthocyanin biosynthesis in Arabidopsis requires
the MYB75 / PAP1 gene 1. Society 139: 1840–1852
Koster G, VanDuijn M, Hofs B, Dogterom M (2003) Membrane tube formation from giant vesicles by dynamic
association of motor proteins. Proc Natl Acad Sci 100: 15583–15588
Kowalewska Ł, Mazur R, Suski S, Garstka M, Mostowska A (2016) Three-dimensional visualization of the
tubular-lamellar transformation of the internal plastid membrane network during runner bean chloroplast
biogenesis. Plant Cell 28: 875–891
Krenz B, Guo TW, Kleinow T (2014) Stromuling when stressed! Acta Soc Bot Pol 83: 325–329
Kühn C, Grof CPL (2010) Sucrose transporters of higher plants. Curr Opin Plant Biol 13: 288–298
Kültz D (2005) Molecular and evolutionary basis of the cellular stress response. Annu Rev Physiol 67: 225–257
Kumar AS, Park E, Nedo A, Alqarni A, Ren L, Hoban K, Modla S, McDonald JH, Kambhamettu C, Dinesh-
Kumar SP, et al (2018) Stromule extension along microtubules coordinated with actin-mediated anchoring
guides perinuclear chloroplast movement during innate immunity. Elife 7: e23625
Kunz HH, Häusler RE, Fettke J, Herbst K, Niewiadomski P, Gierth M, Bell K, Steup M, Flügge UI, Schneider
A (2010) The role of plastidial glucose-6-phosphate/phosphate translocators in vegetative tissues of Arabidopsis
thaliana mutants impaired in starch biosynthesis. Plant Biol 12: 115–128
Kunz S, Pesquet E, Kleczkowski LA (2014) Functional dissection of sugar signals affecting gene expression in
Arabidopsis thaliana. PLoS One 9: e100312
Kushwah S, Laxmi A (2014) The interaction between glucose and cytokinin signal transduction pathway in
Arabidopsis thaliana. Plant Cell Environ 37: 235–253
Kwok EY, Hanson MR (2003) Microfilaments and microtubules control the morphology and movement of non-
green plastids and stromules in Nicotiana tabacum. Plant J 35: 16–26
Kwok EY, Hanson MR (2004a) In vivo analysis of interactions between GFP-labeled microfilaments and plastid
stromules. BMC Plant Biol 4: 2
Kwok EY, Hanson MR (2004b) Plastids and stromules interact with the nucleus and cell membrane in vascular
plants. Plant Cell Rep 23: 188–195
Langhans M, Niemes S, Pimpl P, Robinson DG (2009) Oryzalin bodies: In addition to its anti-microtubule
properties, the dinitroaniline herbicide oryzalin causes nodulation of the endoplasmic reticulum. Protoplasma
236: 73–84
Larson DA (1965) Fine-structural changes in the cytoplasm of germintating pollen. Am J Bot 52: 139–154
Lawson T (2009) Guard cell photosynthesis and stomatal function. New Phytol 181: 13-24
Lawson T, Simkin AJ, Kelly G, Granot D (2014) Mesophyll photosynthesis and guard cell metabolism impacts on
stomatal behaviour. New Phytol 203: 1064–1081
239
Leduc C, Campas O, Zeldovich KB, Roux A, Jolimaitre P, Bourel-Bonnet L, Goud B, Joanny J-F, Bassereau
P, Prost J (2004) Cooperative extraction of membrane nanotubes by molecular motors. Proc Natl Acad Sci 101:
17096–17101
Lei M, Liu D (2011) Sucrose regulates plant responses to deficiencies in multiple nutrients. Plant Signal Behav 6:
1247–1249
Lei M, Liu Y, Zhang B, Zhao Y, Wang X, Zhou Y, Raghothama KG, Liu D (2011) Genetic and genomic evidence
that sucrose is a global regulator of plant responses to phosphate starvation in Arabidopsis. Plant Physiol 156:
1116–1130
Li GD, Pan LN, Jiang K, Takahashi I, Nakamura H, Xu YW, Asami T, Shen RF (2016a) Strigolactones are
involved in sugar signaling to modulate early seedling development in Arabidopsis. Plant Biotechnol 33: 87–97
Li JF, Nebenführ A (2007) Organelle targeting of myosin XI is mediated by two globular tail subdomains with
separate cargo binding sites. J Biol Chem 282: 20593–20602
Li L, Sheen J (2016) Dynamic and diverse sugar signaling. Curr Opin Plant Biol 33: 116–125
Li N, Xu C, Li-Beisson Y, Philippar K (2016) Fatty acid and lipid transport in plant cells. Trends Plant Sci 21: 145–
158
Li Y (2006) Establishing glucose- and ABA-regulated transcription networks in Arabidopsis by microarray analysis
and promoter classification using a Relevance Vector Machine. Genome Res 16: 414–427
Lichtner FT, Spanswick RM (1981) Sucrose uptake by developing soybean cotyledons. Plant Physiol 68: 693–698
Liebe S, Menzel D (1995) Actomyosin-based motility of ER and chloroplasts in Vallisneria mesophyll cells. Biol cell
85: 207–222
Liebers M, Grübler B, Chevalier F, Lerbs-Mache S, Merendino L, Blanvillain R, Pfannschmidt T (2017)
Regulatory shifts in plastid transcription play a key role in morphological conversions of plastids during plant
development. Front Plant Sci 8: 23
Lin C, Lemarchand L, Euler R, Sparkes I (2018) Modeling the geometry and dynamics of the endoplasmic
reticulum network. IEEE/ACM Trans Comput Biol Bioinforma 15: 377–386
Lin C, Zhang Y, Sparkes I, Ashwin P (2014) Structure and dynamics of ER: Minimal networks and biophysical
constraints. Biophys J 107: 763–772
Lin T-P, Caspar T, Somerville CR, Preiss J (1988) A starch deficient mutant of Arabidopsis thaliana with low
ADP-glucose pyrophosphorylase activity lacks one of the two subunits of the enzyme. Plant Physiol 88: 1175–
1181
Ljung K, Nemhauser JL, Perata P (2015) New mechanistic links between sugar and hormone signalling networks.
Curr Opin Plant Biol 25: 130–137
Logan DC, Leaver CJ (2000) Mitochondria-targeted GFP highlights the heterogeneity of mitochondrial shape, size
and movement within living plant cells. J Exp Bot 51: 865-871
Lohse S, Schliemann W, Ammer C, Kopka J, Strack D, Fester T (2005) Organization and metabolism of plastids
and mitochondria in arbuscular mycorrhizal roots of Medicago truncatula. Plant Physiol 139: 329–340
240
Lopez-Juez E, Pyke KA (2005) Plastids unleashed: Their development and their integration in plant development.
Int J Dev Biol 49: 557–577
Loreti E, Alpi a, Perata P (2000) Glucose and disaccharide-sensing mechanisms modulate the expression of alpha-
amylase in barley embryos. Plant Physiol 123: 939–948
Loreti E, De Bellis L, Alpi A, Perata P (2001) Why and how do plant cells sense sugars? Ann Bot 88: 803–812
Loreti E, Povero G, Novi G, Solfanelli C, Alpi A, Perata P (2008) Gibberellins, jasmonate and abscisic acid
modulate the sucrose-induced expression of anthocyanin biosynthetic genes in Arabidopsis. New Phytol 179:
1004–1016
Lucas WJ, Wilson C (1987) Influence of Mannose on the apoplasmic retrieval systems of source leaves. Plant Physiol
85: 423–429
Lunn JE, Feil R, Hendriks JHM, Gibon Y, Morcuende R, Osuna D, Scheible W-R, Carillo P, Hajirezaei M-R,
Stitt M (2006) Sugar-induced increases in trehalose 6-phosphate are correlated with redox activation of ADP-
glucose pyrophosphorylase and higher rates of starch synthesis in Arabidopsis thaliana. Biochem J 397: 139–
148
Lütz C, Engel L (2007) Changes in chloroplast ultrastructure in some high-alpine plants: Adaptation to metabolic
demands and climate? Protoplasma 231: 183–192
Maass D, Arango J, Wüst F, Beyer P, Welsch R (2009) Carotenoid crystal formation in Arabidopsis and carrot
roots caused by increased phytoene synthase protein levels. PLoS One 4: e6373
MacDonald MS (2003) Selected photobiological responses. In Photobiology of Higher Plants, pp. 274-301. John
Wiley and Sons Ltd, Chichester, pp 274-301
Machettira AB, Groß LE, Tillmann B, Weis BL, Englich G, Sommer MS, Königer M, Schleiff E (2012) Protein-
induced modulation of chloroplast membrane morphology. Front Plant Sci 2: 118
Mackenzie, SA, Kundariya, H (2019) Organellar protein multi-functionality and phenotypic plasticity in plants. Phil
Trans R Soc B 375: 20190182
MacNeill GJ, Mehrpouyan S, Minow MAA, Patterson JA, Tetlow IJ, Emes MJ (2017) Starch as a source , starch
as a sink: the bifunctional role of starch in carbon allocation. J Exp Bot 68: 4433–4453
Mano S, Nakamori C, Kondo M, Hayashi M, Nishimura M (2004) An Arabidopsis dynamin-related protein,
DRP3A, controls both peroxisomal and mitochondrial division. Plant J 38: 487–498
Marinos NG (1967) Multifunctional plastids in the meristematic region of potato tuber buds. J Ultrasructure Res 17:
91–113
Marques JP, Dudeck I, Klösgen RB (2003) Targeting of EGFP chimeras within chloroplasts. Mol Genet Genomics
269: 381–387
Marques JP, Schattet MH, Hause G, Dudeck I, Klösgen RB (2004) In vivo transport of folded EGFP by the
ΔpH/TAT-dependent pathway in chloroplasts of Arabidopsis thaliana. J Exp Bot 55: 1697–1706
Martins MCM, Hejazi M, Fettke J, Steup M, Feil R, Krause U, Arrivault S, Vosloh D, Figueroa CM, Ivakov
A, et al (2013) Feedback inhibition of starch degradation in Arabidopsis leaves mediated by trehalose 6-
phosphate. Plant Physiol 163: 1142–1163
241
Mathur J (2003) Arabidopsis CROOKED encodes for the smallest subunit of the ARP2/3 complex and controls cell
shape by region specific fine F-actin formation. Development 130: 3137–3146
Mathur J (2005) The ARP2/3 complex: giving plant cells a leading edge. Bioessays 27: 377-387
Mathur J, Griffiths S, Barton K, Schattat MH (2012) Green-to-red photoconvertible mEosFP-aided live imaging
in plants. Methods Enzymol 504: 163–181
Mathur J, Radhamony R, Sinclair AM, Donoso A, Dunn N, Roach E, Radford D, S. Mohammad Mohaghegh
P, Logan DC, Kokolic K, et al (2010) mEosFP-based green-to-red photoconvertible subcellular probes for
plants. Plant Physiol 154: 1573–1587
Maynard JW, Lucas WJ (1982) Sucrose and glucose uptake into Beta vulgaris leaf tissues. Plant Physiol 70: 1436–
1443
McDonald KL (2014) Out with the old and in with the new: rapid specimen preparation procedures for electron
microscopy of sectioned biological material. Protoplasma 251: 429–448
McFarlane HE, Lee EK, Van Bezouwen LS, Ross B, Rosado A, Samuels AL (2017) Multiscale structural analysis
of plant ER-PM contact sites. Plant Cell Physiol 58: 478–484
McIntosh BB, Pyrpassopoulos S, Holzbaur ELF, Ostap EM (2018) Opposing kinesin and myosin-I motors drive
membrane deformation and tubulation along engineered cytoskeletal networks. Curr Biol 28: 236-248
McLean B, Whatley JM, Juniper BE (1988) Continuity of chloroplast and endoplasmic reticulum membranes in
Chara and Equisetum. New Phytol 109: 59–65
McMahon HT, Boucrot E (2015) Membrane curvature at a glance. J Cell Sci 128: 1065–1070
Mehrshahi P, Johnny C, DellaPenna D (2014) Redefining the metabolic continuity of chloroplasts and ER. Trends
Plant Sci 19: 501–507
Mehrshahi P, Stefano G, Andaloro JM, Brandizzi F, Froehlich JE, DellaPenna D (2013) Transorganellar
complementation redefines the biochemical continuity of endoplasmic reticulum and chloroplasts. Proc Natl
Acad Sci 110: 12126–12131
Messerli G, Nia P V., Trevisan M, Kolbe A, Schauer N, Geigenberger P, Chen J, Davison AC, Fernie AR,
Zeeman SC (2007) Rapid classification of phenotypic mutants of Arabidopsis via metabolite fingerprinting.
Plant Physiol 143: 1484–1492
Meurer J, Grevelding C, Westhoff P, Reiss B (1998) The PAC protein affects the maturation of specific chloroplast
mRNAs in Arabidopsis thaliana. Mol Gen Genet 258: 342–351
Michalska J, Zauber H, Buchanan BB, Cejudo FJ, Geigenberger P (2009) NTRC links built-in thioredoxin to
light and sucrose in regulating starch synthesis in chloroplasts and amyloplasts. Proc Natl Acad Sci 106: 9908–
9913
Moore SLM (1888) On epidermal chlorophyll. J Bot 25: 358–363
Morsy MR, Jouve L, Hausman JF, Hoffmann L, Stewart JMD (2007) Alteration of oxidative and carbohydrate
metabolism under abiotic stress in two rice (Oryza sativa L.) genotypes contrasting in chilling tolerance. J Plant
Physiol 164: 157–167
242
Müller R, Morant M, Jarmer H, Nilsson L, Nielsen TH (2007) Genome-wide analysis of the Arabidopsis leaf
transcriptome reveals interaction of phosphate and sugar metabolism. Plant Physiol 143: 156–171
Müller R, Nilsson L, Nielsen LK, Nielsen TH (2005) Interaction between phosphate starvation signalling and
hexokinase-independent sugar sensing in Arabidopsis leaves. Physiol Plant 124: 81–90
Munekage YN (2016) Light harvesting and chloroplast electron transport in NADP-malic enzyme type C4 plants.
Curr Opin Plant Biol 31: 9–15
Murakawa M, Shimojima M, Shimomura Y, Kobayashi K, Awai K, Ohta H (2014)
Monogalactosyldiacylglycerol synthesis in the outer envelope membrane of chloroplasts is required for
enhanced growth under sucrose supplementation. Front Plant Sci 5: 280
Murashige T, Skoog F (1962) A revised medium for rapid growth and bioassays with tobacco tissue cultures. Physiol
Plant 15: 473-797
Murley A, Lackner LL, Osman C, West M, Voeltz GK, Walter P, Nunnari J (2013) ER-associated mitochondrial
division links the distribution of mitochondria and mitochondrial DNA in yeast. Elife 2013: e00422
Nadwodnik J, Lohaus G (2008) Subcellular concentrations of sugar alcohols and sugars in relation to phloem
translocation in Plantago major, Plantago maritima, Prunus persica, and Apium graveolens. Planta 227: 1079–
1089
Nakano RT, Matsushima R, Ueda H, Tamura K, Shimada T, Li L, Hayashi Y, Kondo M, Nishimura M, Hara-
Nishimura I (2009) GNOM-LIKE1/ERMO1 and SEC24a/ERMO2 are required for maintenance of
endoplasmic reticulum morphology in Arabidopsis thaliana. Plant Cell 21: 3672–3685
Nakano RT, Yamada K, Bednarek P, Nishimura M, Hara-Nishimura I (2014) ER bodies in plants of the
Brassicales order: biogenesis and association with innate immunity. Front Plant Sci 5: 73
Natesan SKA, Sullivan JA, Gray JC (2009) Myosin XI is required for actin-associated movement of plastid
stromules. Mol Plant 2: 1262–1272
Niittylä T, Messerli G, Trevisan M, Chen J, Smith AM, Zeeman SC (2004) A previously unknown maltose
transporter essential for starch degradation in leaves. Science 303: 87–89
Nunes C, O’Hara LE, Primavesi LF, Delatte TL, Schluepmann H, Somsen GW, Silva AB, Fevereiro PS,
Wingler A, Paul MJ (2013) The Trehalose 6-phosphate/SnRK1 signaling pathway primes growth recovery
following relief of sink limitation. Plant Physiol 162: 1720–1732
Oikawa K, Kasahara M, Kiyosue T, Kagawa T, Suetsugu N, Takahashi F, Kanegae T, Niwa Y, Kadota A, Wada
M (2003) Chloroplast Unusual Positioning1 is essential for proper chloroplast positioning. Plant Cell 15: 2805-
2815
Oikawa K, Yamasato A, Kong S-G, Kasahara M, Nakai M, Takahashi F, Ogura Y, Kagawa T, Wada M (2008)
Chloroplast outer envelope protein CHUP1 is essential for chloroplast anchorage to the plasma membrane and
chloroplast movement. Plant Physiol 148: 829–842
Okano T, Inoue K, Koseki K, Suzuki H (2018) Deformation modes of giant unilamellar vesicles encapsulating
biopolymers. ACS Synth Biol 7: 739–747
243
Orvar BL, Sangwan V, Omann F, Dhindsa RS (2000) Early steps in cold sensing by plant cells: the role of actin
cytoskeleton and membrane fluidity. Plant J 23: 785–794
Osuna D, Usadel B, Morcuende R, Gibon Y, Bläsing OE, Höhne M, Günter M, Kamlage B, Trethewey R,
Scheible WR, et al (2007) Temporal responses of transcripts, enzyme activities and metabolites after adding
sucrose to carbon-deprived Arabidopsis seedlings. Plant J 49: 463-471
Pacini E, Cresti M (1976) Close association between plastids and endoplasmic reticulum cisterns during pollen grain
development in Lycopersicon peruvianum. J Ultrasructure Res 57: 260–265
Paila YD, Richardson LG, Schnell DJ (2015) New insights into the mechanism of chloroplast protein import and
its integration with protein quality control, organelle biogenesis and development. J Mol Biol 427: 1038–1060
Pain D, Kanwar YS, Blobel G (1988) Identification of a receptor for protein import into chloroplasts and its
localization to envelope contact zones. Nature 331: 232–237
Pancaldi S, Bonora A, Dall’Olio G, Bruni A, Fasulo MP (1996) Ageing of Euglena chloroplasts in vitro I.
Variations in pigment pattern and in morphology. J Exp Bot 47: 49–60
Pandey A, Sharma M, Pandey GK (2016) Emerging roles of strigolactones in plant responses to stress and
development. Front Plant Sci 7: 434
Park SH, Blackstone C (2010) Further assembly required: construction and dynamics of the endoplasmic reticulum
network. EMBO Rep 11: 515–521
Pego J V, Weisbeek PJ, Smeekens SC (1999) Mannose inhibits Arabidopsis germination via a hexokinase-mediated
step. Plant Physiol 119: 1017–1023
Peremyslov V V., Klocko AL, Fowler JE, Dolja V V. (2012) Arabidopsis myosin XI-K localizes to the motile
endomembrane vesicles associated with F-actin. Front Plant Sci 3: 184
Pérez-Sancho J, Tilsner J, Samuels AL, Botella MA, Bayer EM, Rosado A (2016) Stitching organelles:
Organization and function of specialized membrane contact sites in plants. Trends Cell Biol 26: 705–717
Phillips MJ, Voeltz GK (2016) Structure and function of ER membrane contact sites with other organelles. Nat Rev
Mol Cell Biol 17: 69–82
Pokorná J, Schwarzerová K, Zelenková S, Petrásek J, Janotová I, Capková V, Opatrny Z (2004) Sites of actin
filament initiation and reorganization in cold-treated tobacco cells. Plant Cell Environ 27: 641–653
Pomorski TG, Nylander T, Cárdenas M (2014) Model cell membranes: Discerning lipid and protein contributions
in shaping the cell. Adv Colloid Interface Sci 205: 207–220
Pospíšil P (2016) Production of reactive oxygen species by photosystem II as a response to light and temperature
stress. Front Plant Sci 7: 1950
Prasher DC, Eckenrode VK, Ward WW, Prendergast FG, Cormier MJ (1992) Primary structure of the Aequorea
victoria green-fluorescent protein. Gene 111: 229–233
Prinz WA (2014) Bridging the gap: Membrane contact sites in signaling, metabolism, and organelle dynamics. J Cell
Biol 205: 759–769
Pyke K (2007) Plastid biogenesis and differentiation. In R Bock, ed, Cell and Molecular Biology of Plastids, Topics
in Current Genetics Vol 19, Springer, Berlin, Heidelberg, pp 1–28
244
Pyke KA (2009) Plastid Biology. Cambridge University Press, Cambridge
Pyke KA, Howells CA (2002) Plastid and stromule morphogenesis in Tomato. Ann Bot 90: 559–566
Pyke KA, Leech RM (1994) A genetic analysis of chloroplast division and expansion in Arabidopsis thaliana. Plant
Physiol 104: 201-207
Pyke KA, Rutherford SM, Robertson EJ, Leech RM (1994) arc6, a fertile Arabidopsis mutant with only two
mesophyll cell chloroplasts. Plant Physiol 106: 1169–1177
Quader H, Hofmann A, Schnepf E (1989) Reorganization of the endoplasmic reticulum in epidermal cells of onion
bulb scales after cold stress: Involvement of cytoskeletal elements. Planta 177: 273–280
Quilichini TD, Douglas CJ, Lacey Samuels A (2014) New views of tapetum ultrastructure and pollen exine
development in Arabidopsis thaliana. Ann Bot 114: 1189–1201
Raghavendra AS, Padmasree K (2003) Beneficial interactions of mitochondrial metabolism with photosynthetic
carbon assimilation. Trends Plant Sci 8: 546-553
Rangamani P, Mandadap KK, Oster G (2014) Protein-induced membrane curvature alters local membrane tension.
Biophys J 107: 751–762
Rast A, Heinz S, Nickelsen J (2015) Biogenesis of thylakoid membranes. Biochim Biophys Acta Bioenerg 1847:
821–830
Rédei GP (1967) Biochemical aspects of a genetically determined variegation in Arabidopsis. Genetics 56: 431-443
Reisen D, Hanson MR (2007) Association of six YFP-myosin XI-tail fusions with mobile plant cell organelles. BMC
Plant Biol 7: 6
Rérie WG, Feldmann KA, Marks MD (1994) The GLABRA2 gene encodes a homeodomain protein required for
normal trichome development in Arabidopsis. Genes Dev 8: 1388-1399
Reynolds ES (1963) The use of lead citrate stain at high pH as an electron-opaque stain in electron microscopy. J Cell
Biol 17: 208
Ridge RW, Uozumi Y, Plazinski J, Hurley UA, Williamson RE (1999) Developmental transitions and dynamics
of the cortical ER of Arabidopsis cells seen with green fluorescent protein. Plant Cell Physiol 40: 1253-1261
Robertson EJ, Rutherford SM, Leech RM (1996) Characterization of chloroplast division using the Arabidopsis
mutant arc5. Plant Physiol 112: 149–159
Rodríguez-Villalón A, Gas E, Rodríguez-Concepción M (2009) Colors in the dark: A model for the regulation of
carotenoid biosynthesis in etioplasts. Plant Signal Behav 4: 965–967
Rolland N, Curien G, Finazzi G, Kuntz M, Maréchal E, Matringe M, Ravanel S, Seigneurin-Berny D (2012)
The biosynthetic capacities of the plastids and integration between cytoplasmic and chloroplast processes. Annu
Rev Genet 46: 233–264
Rosa M, Prado C, Podazza G, Interdonato R, González JA, Hilal M, Prado FE (2009) Soluble sugars:
Metabolism, sensing and abiotic stress. Plant Signal Behav 4: 388–393
Ross JHE, Milanesi C, Murphy DJ, Cresti M (2000) Rapid-freeze fixation and substitution improves tissue
preservation of microspores and tapetum in Brassica napus. Sex Plant Reprod 12: 237–240

245
Roux A, Cappello G, Cartaud J, Prost J, Goud B, Bassereau P (2002) A minimal system allowing tubulation with
molecular motors pulling on giant liposomes. Proc Natl Acad Sci 99: 5394–5399
Runions J, Brach T, Kühner S, Hawes C (2006) Photoactivation of GFP reveals protein dynamics within the
endoplasmic reticulum membrane. J Exp Bot 57: 43–50
Sage TL, Sage RF (2009) The functional anatomy of Rice leaves: Implications for refixation of photorespiratory CO2
and efforts to engineer C4 photosynthesis into rice. Plant Cell Physiol 50: 756-772
Sagisaka S (2008) The proliferation of amyloplasts in meristematic cells of developing stolons of potato and apple
callus: Progenitors of proplastids. J Plant Physiol 165: 1678–1690
Sakr S, Wang M, Dédaldéchamp F, Perez-Garcia M-D, Ogé L, Hamama L, Atanassova R (2018) The sugar-
signaling hub: Overview of regulators and interaction with the hormonal and metabolic network. Int J Mol Sci
19: 2506
Salema R, Badenhuizen NP (1967) The production of reserve starch granules in the amyloplasts of Pellionia
daveauana N. E. Br. J Ultrastruct Res 20: 383–399
Salvi D, Moyet L, Seigneurin-Berny D, Ferro M, Joyard J, Rolland N (2011) Preparation of envelope membrane
fractions from Arabidopsis chloroplasts for proteomic analysis and other studies. Methods Mol Bio 775: 189-
206
Šamaj J, Peters M, Volkmann D, Baluška F (2000) Effects of myosin ATPase inhibitor 2,3-butanedione 2-
monoxime on distributions of myosins, F-actin, microtubules, and cortical endoplasmic reticulum in maize root
apices. Plant Cell Physiol 41: 571–582
Sami F, Yusuf M, Faizan M, Faraz A, Hayat S (2016) Role of sugars under abiotic stress. Plant Physiol Biochem
109: 54–61
Sanborn J, Oglȩcka K, Kraut RS, Parikh AN (2012) Transient pearling and vesiculation of membrane tubes under
osmotic gradients. Faraday Discuss 161: 167–176
Sanchez DH, Siahpoosh MR, Roessner U, Udvardi M, Kopka J (2008) Plant metabolomics reveals conserved and
divergent metabolic responses to salinity. Physiol Plant 132: 209–219
Sattarzadeh A, Krahmer J, Germain AD, Hanson MR (2009) A myosin XI tail domain homologous to the yeast
myosin vacuole-binding domain interacts with plastids and stromules in nicotiana benthamiana. Mol Plant 2:
1351–1358
Sattarzadeh A, Schmelzer E, Hanson MR (2013) Arabidopsis myosin XI sub-domains homologous to the yeast
myo2p organelle inheritance sub-domain target subcellular structures in plant cells. Front Plant Sci 4: 407
Schattat M, Barton K, Baudisch B, Klosgen RB, Mathur J (2011a) Plastid Stromule Branching Coincides with
Contiguous Endoplasmic Reticulum Dynamics. Plant Physiol 155: 1667–1677
Schattat M, Barton K, Mathur J (2011b) Correlated behavior implicates stromules in increasing the interactive
surface between plastids and ER tubules. Plant Signal Behav 6: 715–718
Schattat MH, Barton KA, Mathur J (2014) The myth of interconnected plastids and related phenomena.
Protoplasma 252: 359–371
246
Schattat MH, Griffiths S, Mathur N, Barton K, Wozny MR, Dunn N, Greenwood JS, Mathur J (2012a)
Differential coloring reveals that plastids do not form networks for exchanging macromolecules. Plant Cell 24:
1465–1477
Schattat MH, Klösgen RB (2011) Induction of stromule formation by extracellular sucrose and glucose in epidermal
leaf tissue of Arabidopsis thaliana. BMC Plant Biol 11: 115
Schattat MH, Klösgen RB, Mathur J (2012b) New insights on stromules: Stroma filled tubules extended by
independent plastids. Plant Signal Behav 7: 1132–1137
Schattat MH, Barton KA, Mathur J (2015) The myth of interconnected plastids and related phenomena.
Protoplasma 252: 359–371
Schellmann S, Hülskamp M (2005) Epidermal differentiation: trichomes in Arabidopsis as a model system. Int J
Dev Biol 49: 579-584
Schimper AFW (1883) Über die entwickelung der chlorophyllköerner und farbköerper. Bot Zeit 41: 105–113
Schimper AFW (1885) Die entwickelung und gliederung des chromatophorensystems. In H Fitting, W Pfeffer, N
Pringsheim, E Strasburger, eds, Jahrbücher Für Wissenschaftliche Botanik, Borntraeger, Berlin, pp. 2-49
Schluepmann H, Berke L, Sanchez-Perez GF (2012) Metabolism control over growth: A case for trehalose-6-
phosphate in plants. J Exp Bot 63: 3379–3390
Schmitz J, Schöttler MA, Krueger S, Geimer S, Schneider A, Kleine T, Leister D, Bell K, Flügge UI, Häusler
RE (2012) Defects in leaf carbohydrate metabolism compromise acclimation to high light and lead to a high
chlorophyll fluorescence phenotype in Arabidopsis thaliana. BMC Plant Biol 12: 8
Schneider CA, Rasband WS, Eliceiri KW (2012) NIH Image to ImageJ: 25 years of image analysis. Nat Methods
9: 671–675
Schnell DJ, Blobel G (1993) Identification of intermediates in pathway of protein import into chlotoplasts and thier
localization to envelop contact sites. J Cell Biol 120: 103–115
Schnell J, Blobel G, Pain D (1990) The chloroplast import receptor is an integral membrane protein of chloroplast
envelope membrane contact sites. J Cell Biol 111: 1825–1838
Schrader M, Fahimi HD (2004) Mammalian peroxisomes and reactive oxygen species. Histochem Cell Biol 122:
383–393
Sedgley M (1981) Ultrastructure and histochemistry of the watermelon stigma. J Cell Sci 48: 137–146
Sewelam N, Kazan K, Schenk PM (2016) Global plant stress signaling: Reactive oxygen species at the cross-road.
Front Plant Sci 7: 187
Sheen J (2014) Master regulators in plant glucose signaling networks. J Plant Biol 57: 67–79
Shi Z, Baumgart T (2015) Membrane tension and peripheral protein density mediate membrane shape transitions.
Nat Commun 6: 5974
Shimomura O, Johnson FH, Saiga Y (1962) Extraction, purification and properties of Aequorin, a bioluminescent
protein from the luminous hydromedusan, Aequorea. J Cell Comp Physiol 59: 223–239
Simunovic M, Voth GA (2015) Membrane tension controls the assembly of curvature-generating proteins. Nat
Commun 6: 7219
247
Sinclair AM, Trobacher CP, Mathur N, Greenwood JS, Mathur J (2009) Peroxule extension over ER-defined
paths constitutes a rapid subcellular response to hydroxyl stress. Plant J 59: 231–242
Sinha AK, Hofmann MG, Romer U, Kockenberger W, Elling L, Roitsch T (2002) Metabolizable and non-
metabolizable sugars activate different signal transduction pathways in tomato. Plant Physiol 128: 1480–1489
Solymosi K, Keresztes A (2013) Plastid structure, diversification and interconversions II. Land plants. Curr Chem
Biol 6: 187–204
Solymosi K, Lethin J, Aronsson H (2018) Diversity and plasticity of plastids in land plants. In E Maréchal, ed,
Plastids. Methods in Molecular Biology Vol 1829, Humana Press, New York, NY, pp 55–72
Solymosi K, Schoefs B (2010) Etioplast and etio-chloroplast formation under natural conditions: The dark side of
chlorophyll biosynthesis in angiosperms. Photosynth Res 105: 143–166
Sparkes I, Hawes C, Frigerio L (2011) FrontiERs: Movers and shapers of the higher plant cortical endoplasmic
reticulum. Curr Opin Plant Biol 14: 658–665
Sparkes I, Runions J, Hawes C, Griffing L (2009a) Movement and remodeling of the endoplasmic reticulum in
nondividing cells of tobacco leaves. Plant Cell 21: 3937–3949
Sparkes I, Tolley N, Aller I, Svozil J, Osterrieder A, Botchway S, Mueller C, Frigerio L, Hawes C (2010) Five
Arabidopsis reticulon isoforms share endoplasmic reticulum location, topology, and membrane-ahaping
properties. Plant Cell 22: 1333–1343
Sparkes IA, Frigerio L, Tolley N, Hawes C (2009b) The plant endoplasmic reticulum: a cell-wide web. Biochem J
423: 145–155
Spector I, Shochet NR, Kashman Y, Groweiss A (1983) Latrunculins: Novel marine toxins that disrupt
microfilament organization in cultured cells. Science 219: 493–495
Spencer D, Wildman SG (1962) Observations on the structure of grana-containing chloroplasts and a proposed model
of chloroplast structure. Aust J Biol Sci 15: 599–610
Stefano G, Renna L, Brandizzi F (2014) The endoplasmic reticulum exerts control over organelle streaming during
cell expansion. J Cell Sci 127: 947–953
Stettler M, Eicke S, Mettler T, Messerli G, Hörtensteiner S, Zeeman SC (2009) Blocking the metabolism of starch
breakdown products in Arabidopsis leaves triggers chloroplast degradation. Mol Plant 2: 1233–1246
Suetsugu S, Kurisu S, Takenawa T (2014) Dynamic shaping of cellular membranes by phospholipids and
membrane-deforming proteins. Physiol Rev 94: 1219–1248
Sulpice R, Flis A, Ivakov AA, Apelt F, Krohn N, Encke B, Abel C, Feil R, Lunn JE, Stitt M (2014) Arabidopsis
coordinates the diurnal regulation of carbon allocation and growth across a wide range of photoperiods. Mol
Plant 7: 137–155
Suppanz I, Sarnighausen E, Reski R (2007) An integrated physiological and genetic approach to the dynamics of
FtsZ targeting and organisation in a moss, Physcomitrella patens. Protoplasma 232: 1–9
Suzuki T, Tsunekawa S, Koizuka C, Yamamoto K, Imamura J, Nakamura K, Ishiguro S (2013) Development
and disintegration of tapetum-specific lipid-accumulating organelles, elaioplasts and tapetosomes, in
Arabidopsis thaliana and Brassica napus. Plant Sci 207: 25–36

248
Szymanski DB, Lloyd AM, Marks MD (2000) Progress in the molecular genetic analysis of trichome initiation and
morphogenesis in Arabidopsis. Trends Plant Sci 5: 214-219
Tan X, Wang Q, Tian B, Zhang H, Lu D, Zhou J (2011) A Brassica napus lipase locates at the membrane contact
sites involved in chloroplast development. PLoS One 6: e26831
Tejos RI, Mercado AV, Meisel LA (2010) Analysis of chlorophyll fluorescence reveals stage specific patterns of
chloroplast-containing cells during Arabidopsis embryogenesis. Biol Res 43: 99-111
Thalmann M, Santelia D (2017) Starch as a determinant of plant fitness under abiotic stress. New Phytol 214: 943–
951
Thibaud MC, Gineste S, Nussaume L, Robaglia C (2004) Sucrose increases pathogenesis-related PR-2 gene
expression in Arabidopsis thaliana through an SA-dependent but NPR1-independent signaling pathway. Plant
Physiol Biochem 42: 81–88
Thomson WW, Whatley JM (1980) Development of nongreen plastids. Annu Rev Plant Physiol 31: 375–394
Tiessen A, Prescha K, Branscheid A, Palacios N, McKibbin R, Halford NG, Geigenberger P (2003) Evidence
that SNF1-related kinase and hexokinase are involved in separate sugar-signalling pathways modulating post-
translational redox activation of ADP-glucose pyrophosphorylase in potato tubers. Plant J 35: 490–500
Ting JTL, Wu SSH, Ratnayake C, Huang AHC (1998) Constituents of the tapetosomes and elaioplasts in Brassica
campestris tapetum and their degradation and retention during microsporogenesis. Plant J 16: 541–551
Tirlapur UK, Dahse I, Reiss B, Meurer J, Oelmüller R (1999) Characterization of the activity of a plastid-targeted
green fluorescent protein in Arabidopsis. Eur J Cell Biol 78: 233–240
Turnbull TL, Warren CR, Adams MA (2007) Novel mannose-sequestration technique reveals variation in
subcellular orthophosphate pools do not explain the effects of phosphorus nutrition on photosynthesis in
Eucalyptus globulus seedlings. New Phytol 176: 849–861
Tuteja N (2007) Abscisic acid and abiotic stress signaling. Plant Signal Behav 2: 135–138
Ueda H, Yokota E, Kutsuna N, Shimada T, Tamura K, Shimmen T, Hasezawa S, Dolja V V., Hara-Nishimura
I (2010) Myosin-dependent endoplasmic reticulum motility and F-actin organization in plant cells. Proc Natl
Acad Sci 107: 6894–6899
Uzelac B, Janošević D, Simonović A, Motyka V, Dobrev PI, Budimir S (2016) Characterization of natural leaf
senescence in tobacco (Nicotiana tabacum) plants grown in vitro. Protoplasma 253: 259–275
Vanni S, Hirose H, Barelli H, Antonny B, Gautier R (2014) A sub-nanometre view of how membrane curvature
and composition modulate lipid packing and protein recruitment. Nat Commun 5: 4916
Veley KM, Marshburn S, Clure CE, Haswell ES (2012) Mechanosensitive channels protect plastids from
hypoosmotic stress during normal plant growth. Curr Biol 22: 408–413
Verma V, Ravindran P, Kumar PP (2016) Plant hormone-mediated regulation of stress responses. BMC Plant Biol
16: 86
Viallat A, Dalous J, Abkarian M (2004) Giant lipid vesicles filled with a gel: Shape instability induced by osmotic
shrinkage. Biophys J 86: 2179–2187
249
Vismans G, van der Meer T, Langevoort O, Schreuder M, Bouwmeester H, Peisker H, Dörman P, Ketelaar T,
van der Krol A (2016) Low-phosphate induction of plastidal stromules is sependent on atrigolactones but not
on the canonical strigolactone signaling component MAX2. Plant Physiol 172: 2235–2244
Vitha S, McAndrew RS, Osteryoung KW (2001) FtsZ ring formation at the chloroplast division site in plants. J Cell
Biol 153: 111–119
Vothknecht UC, Westhoff P (2001) Biogenesis and origin of thylakoid membranes. Biochim Biophys Acta Mol Cell
Res 1541: 91–101
Walley JW, Coughlan S, Hudson ME, Covington MF, Kaspi R, Banu G, Harmer SL, Dehesh K (2007)
Mechanical stress induces biotic and abiotic stress responses via a novel cis-element. PLoS Genet 3: 1800–1812
Walley JW, Dehesh K (2010) Molecular mechanisms regulating rapid stress signaling networks in Arabidopsis. J
Integr Plant Biol 52: 354–359
Wang Q, Ni J, Shah F, Liu W, Wang D, Yao Y, Hu H, Huang S, Hou J, Fu S, et al (2019) Overexpression of the
stress-inducible SsMAX2 promotes drought and salt resistance via the regulation of redox homeostasis in
Arabidopsis. Int J Mol Sci 20: 837
Wang SM, Lue WL, Yu TS, Long JH, Wang CN, Eimert K, Chen J (1998) Characterization of ADG1, an
Arabidopsis locus encoding for ADPG pyrophosphorylase small subunit, demonstrates that the presence of the
small subunit is required for large subunit stability. Plant J 13: 63–70
Waters MT, Fray RG, Pyke KA (2004) Stromule formation is dependent upon plastid size, plastid differentiation
status and the density of plastids within the cell. Plant J 39: 655–667
Westrate LM, Lee JE, Prinz WA, Voeltz GK (2015) Form follows function: The importance of endoplasmic
reticulum shape. Annu Rev Biochem 84: 791–811
Wetzel CM, Jiang C-Z, Meehan LAJ, Voytas DF, Rodermel SR (1994) Nuclear-organelle interactions: the
immutans variegation mutant of Arabidopsis is plastid autonomous and impaired in carotenoid biosynthesis.
Plant J 6: 161–175
Whatley JM (1977) Variations in the basic pathway of chloroplast development. New Phytol 78: 407–420
Whatley JM (1974) Chloroplast development in primary leaves of Phaseolus vulgaris. New Phytol 73: 1097–1110
Whatley JM (1971) The chloroplasts of Equisetum telmateia ERHR: A possible developmental sequence. New Phytol
70: 1095–1102
Whatley JM, McLean B, Juniper BE (1991) Continuity of chloroplast and endoplasmic reticulum membranes in
Phaseolus vulgaris. New Phytol 117: 209–217
Widodo, Patterson JH, Newbigin E, Tester M, Bacic A, Roessner U (2009) Metabolic responses to salt stress of
barley (Hordeum vulgare L.) cultivars, Sahara and Clipper, which differ in salinity tolerance. J Exp Bot 60:
4089–4103
Wiedenmann J, Oswald F, Nienhaus GU (2009) Fluorescent proteins for live cell imaging: Opportunities,
limitations, and challenges. IUBMB Life 61: 1029–1042
Wilson C, Lucas WJ (1987) Influence of internal sugar levels on apoplasmic retrieval of exogenous sucrose in source
leaf tissue. Plant Physiol 84: 1088–1095
250
Wingler A, Roitsch T (2008) Metabolic regulation of leaf senescence: Interactions of sugar signalling with biotic and
abiotic stress responses. Plant Biol 10: 50–62
Winter H, Robinson DG, Heldt HW (1993) Subcellular volume and metabolic concentrations in barley leaves.
Planta 191: 180–190
Winter H, Robinson DG, Heldt HW (1994) Subcellular volumes and metabolite concentrations in spinach leaves.
Planta 193: 530–535
Wise RR (2007) The Diversity of Plastid Form and Function. In RR Wise, JK Hoober, eds, The Structure and Function
of Plastids, Advances in Photosynthesis and Respiration Vol 23, Springer, Dordrecht, pp 3–26
Woo KC, Anderson JM, Boardman NK, Downton WJS, Osmond CB, Thorne SW (1970) Deficient photosystem
II in agranal bundle sheath chloroplasts of C4 plants. Proc Natl Acad Sci 67: 18–25
Wooding FBP, Northcote DH (1965a) Association of the endoplasmic reticulum and the plastids in Acer and Pinus.
Am J Bot 52: 526–531
Wooding FBP, Northcote DH (1965b) The fine structure of the mature resin canal cells of Pinus pinea. J
Ultrasructure Res 13: 233–244
Wooding FBP, Northcote DH (1965c) The fine structure and development of the companion cell of the phloem of
Acer Pseudoplatanus. J Cell Biol 24: 117–128
Wozny MR (2015) Subcellular responses of plant cells to phosphate starvation and exogenous sucrose supply. Thesis,
Department of Molecular and Cellular Biology, University of Guelph, Ontario, Canada
Wu D, Cai S, Chen M, Ye L, Chen Z, Zhang H, Dai F, Wu F, Zhang G (2013) Tissue metabolic responses to salt
stress in wild and cultivated Barley. PLoS One 8: e55431
Xu C, Fan J, Cornish AJ, Benning C (2008) Lipid trafficking between the endoplasmic reticulum and the plastid in
Arabidopsis requires the extraplastidic TGD4 protein. Plant Cell 20: 2190–204
Yadav UP, Ivakov A, Feil R, Duan GY, Walther D, Giavalisco P, Piques M, Carillo P, Hubberten HM, Stitt M,
et al (2014) The sucrose-trehalose 6-phosphate (Tre6P) nexus: Specificity and mechanisms of sucrose
signalling. J Exp Bot 65: 1051–1068
Yamada A, Mamane A, Lee-Tin-Wah J, Di Cicco A, Prévost C, Lévy D, Joanny JF, Coudrier E, Bassereau P
(2014) Catch-bond behaviour facilitates membrane tubulation by non-processive myosin 1b. Nat Commun 5:
3624
Yamane K, Mitsuya S, Taniguchi M, Miyake H (2012) Salt-induced chloroplast protrusion is the process of
exclusion of ribulose-1,5-bisphosphate carboxylase/oxygenase from chloroplasts into cytoplasm in leaves of
rice. Plant Cell Environ 35: 1663–1671
Yamane K, Oi T, Enomoto S, Nakao T, Arai S, Miyake H, Taniguchi M (2018) Three-dimensional ultrastructure
of chloroplast pockets formed under salinity stress. Plant Cell Environ 41: 563–575
Yanagisawa S, Yoo S-D, Sheen J (2003) Differential regulation of EIN3 stability by glucose and ethylene signalling
in plants. Nature 425: 521–525
251
Yokota E, Ueda H, Hashimoto K, Orii H, Shimada T, Hara-Nishimura I, Shimmen T (2011) Myosin XI-
dependent formation of tubular structures from endoplasmic reticulum isolated from tobacco cultured BY-2
cells. Plant Physiol 156: 129–143
Yokota E, Ueda S, Tamura K, Orii H, Uchi S, Sonobe S, Hara-Nishimura I, Shimmen T (2009) An isoform of
myosin XI is responsible for the translocation of endoplasmic reticulum in tobacco cultured BY-2 cells. J Exp
Bot 60: 197–212
Yoo BY (1970) Ultrastructural changes in cells of pea embryo radicles during germination. J Cell Biol 45: 158–171
Zachariadis M, Quader H, Galatis B, Apostolakos P (2003) Organization of the endoplasmic reticulum in dividing
cells of the gymnosperms Pinus brutia and Pinus nigra, and of the pterophyte Asplenium nidus. Cell Biol Int
27: 31–40
Zeeman SC, Smith SM, Smith AM (2007) The diurnal metabolism of leaf starch. Biochem J 401: 13–28
Zeeman SC, Tiessen A, Pilling E, Kato KL, Donald AM, Smith AM (2002) Starch synthesis in Arabidopsis.
Granule synthesis, composition, and structure. Plant Physiol 129: 516–529
Zhang Y, Primavesi LF, Jhurreea D, Andralojc PJ, Mitchell RAC, Powers SJ, Schluepmann H, Delatte T,
Wingler A, Paul MJ (2009) Inhibition of SNF1-related protein kinase1 activity and regulation of metabolic
pathways by trehalose-6-phosphate. Plant Physiol 149: 1860–1871
Zhu M, Lin J, Ye J, Wang R, Yang C, Gong J, Liu Y, Deng C, Liu P, Chen C, et al (2018) A comprehensive
proteomic analysis of elaioplasts from citrus fruits reveals insights into elaioplast biogenesis and function. Hortic
Res 5: 6
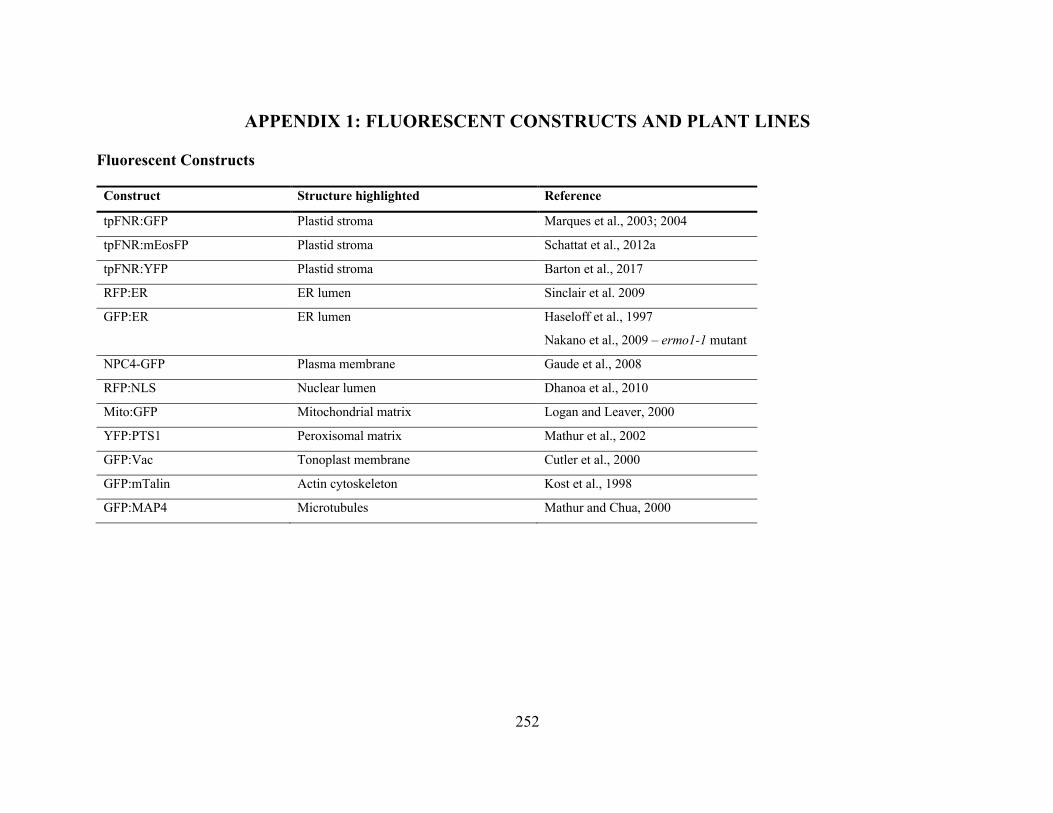
252
APPENDIX 1: FLUORESCENT CONSTRUCTS AND PLANT LINES
Fluorescent Constructs
Construct Structure highlighted Reference
tpFNR:GFP Plastid stroma Marques et al., 2003; 2004
tpFNR:mEosFP Plastid stroma Schattat et al., 2012a
tpFNR:YFP Plastid stroma Barton et al., 2017
RFP:ER ER lumen Sinclair et al. 2009
GFP:ER ER lumen Haseloff et al., 1997
Nakano et al., 2009 – ermo1-1 mutant
NPC4-GFP Plasma membrane Gaude et al., 2008
RFP:NLS Nuclear lumen Dhanoa et al., 2010
Mito:GFP Mitochondrial matrix Logan and Leaver, 2000
YFP:PTS1 Peroxisomal matrix Mathur et al., 2002
GFP:Vac Tonoplast membrane Cutler et al., 2000
GFP:mTalin Actin cytoskeleton Kost et al., 1998
GFP:MAP4 Microtubules Mathur and Chua, 2000
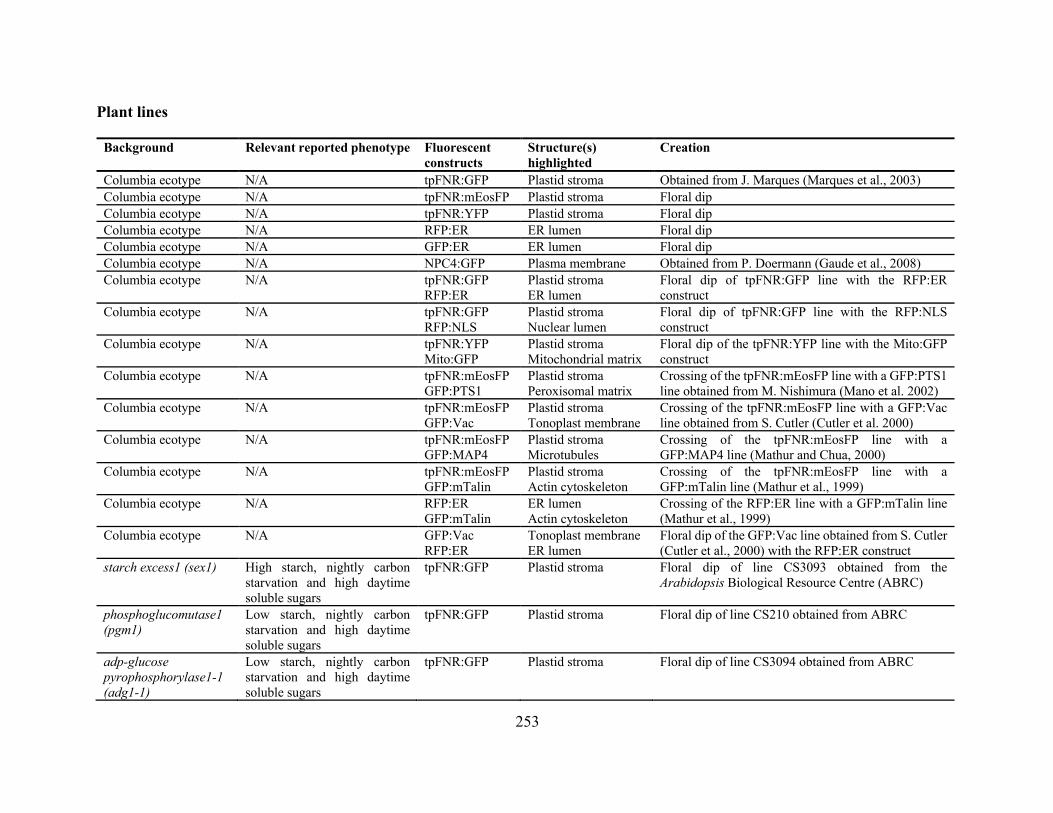
253
Plant lines
Background Relevant reported phenotype Fluorescent constructs
Structure(s) highlighted
Creation
Columbia ecotype N/A tpFNR:GFP Plastid stroma Obtained from J. Marques (Marques et al., 2003) Columbia ecotype N/A tpFNR:mEosFP Plastid stroma Floral dip Columbia ecotype N/A tpFNR:YFP Plastid stroma Floral dip Columbia ecotype N/A RFP:ER ER lumen Floral dip Columbia ecotype N/A GFP:ER ER lumen Floral dip Columbia ecotype N/A NPC4:GFP Plasma membrane Obtained from P. Doermann (Gaude et al., 2008) Columbia ecotype N/A tpFNR:GFP
RFP:ER Plastid stroma ER lumen
Floral dip of tpFNR:GFP line with the RFP:ER construct
Columbia ecotype N/A tpFNR:GFP RFP:NLS
Plastid stroma Nuclear lumen
Floral dip of tpFNR:GFP line with the RFP:NLS construct
Columbia ecotype N/A tpFNR:YFP Mito:GFP
Plastid stroma Mitochondrial matrix
Floral dip of the tpFNR:YFP line with the Mito:GFP construct
Columbia ecotype N/A tpFNR:mEosFP GFP:PTS1
Plastid stroma Peroxisomal matrix
Crossing of the tpFNR:mEosFP line with a GFP:PTS1 line obtained from M. Nishimura (Mano et al. 2002)
Columbia ecotype N/A tpFNR:mEosFP GFP:Vac
Plastid stroma Tonoplast membrane
Crossing of the tpFNR:mEosFP line with a GFP:Vac line obtained from S. Cutler (Cutler et al. 2000)
Columbia ecotype N/A tpFNR:mEosFP GFP:MAP4
Plastid stroma Microtubules
Crossing of the tpFNR:mEosFP line with a GFP:MAP4 line (Mathur and Chua, 2000)
Columbia ecotype N/A tpFNR:mEosFP GFP:mTalin
Plastid stroma Actin cytoskeleton
Crossing of the tpFNR:mEosFP line with a GFP:mTalin line (Mathur et al., 1999)
Columbia ecotype N/A RFP:ER GFP:mTalin
ER lumen Actin cytoskeleton
Crossing of the RFP:ER line with a GFP:mTalin line (Mathur et al., 1999)
Columbia ecotype N/A GFP:Vac RFP:ER
Tonoplast membrane ER lumen
Floral dip of the GFP:Vac line obtained from S. Cutler (Cutler et al., 2000) with the RFP:ER construct
starch excess1 (sex1) High starch, nightly carbon starvation and high daytime soluble sugars
tpFNR:GFP Plastid stroma Floral dip of line CS3093 obtained from the Arabidopsis Biological Resource Centre (ABRC)
phosphoglucomutase1 (pgm1)
Low starch, nightly carbon starvation and high daytime soluble sugars
tpFNR:GFP Plastid stroma Floral dip of line CS210 obtained from ABRC
adp-glucose pyrophosphorylase1-1 (adg1-1)
Low starch, nightly carbon starvation and high daytime soluble sugars
tpFNR:GFP Plastid stroma Floral dip of line CS3094 obtained from ABRC

254
maltose excess1 (mex1) High maltose, chlorosis tpFNR:GFP Plastid stroma Floral dip of mutant background obtained from T.R. Hahn (Cho et al., 2011)
maltose excess1 (mex1) High maltose, chlorosis tpFNR:GFP RFP:ER
Plastid stroma ER lumen
Mutant background obtained from T.R. Hahn (Cho et al., 2011). Floral dip of mutant to create single transgenic lines for each construct. Crossed to created double transgenic line
hypersensitive to phosphate starvation1 (hps1)
Overexpression of sucrose transporter resulting in soluble sugar accumulation
tpFNR:GFP Plastid stroma Floral dip of mutant line obtained from D. Liu (Lei et al., 2011)
NADPH-dependent thioredoxin reductase c 1-1 (ntrc1-1KO)
tpFNR:GFP Plastid stroma Floral dip of line SALK_012208C obtained from ABRC
endoplasmic reticulum morphology1-1 (ermo1-1)
ER broken mostly down into vesicles
tpFNR:mEosFP GFP:ER
Plastid stroma ER lumen
ermo1-1 mutant containing a GFP:ER construct was obtained from I. Hara-Nishimura. The tpFNR:mEosFP construct was introduced by floral dip
Phosphatidic acid phosphohydrolase (pah) 1/pah2
ER largely composed of cisternae rather than tubules
tpFNR:GFP RFP:ER
Plastid stroma ER lumen
Mutant background obtained from P. Eastmond (Eastmond et al., 2010). Single transgenic mutant lines for each construct were created by floral dip, then crossed to create the double transgenic line
crooked (crk) Hypocotyl cells that curl away from the surface
N/A N/A Mutant line (Mathur et al., 2003)
crooked (crk) F-actin polymerization and filament branching
GFP:mTalin RFP:ER
Actin cytoskeleton ER lumen
Single construct lines created by crossing mutant background with Columbia background construct lines and selecting for homozygosity based on phenotype. Single transgenic mutant lines crossed to create double transgenic.
crooked (crk) F-actin polymerization and filament branching
GFP:mTalin tpFNR:mEosFP
Actin cytoskeleton ER lumen
Single construct lines created by crossing mutant background with Columbia background construct lines and selecting for homozygosity based on phenotype. Single transgenic mutant lines crossed to create double transgenic.
Wurm (wrm)
F-actin polymerization and filament branching. Hypocotyl cells that curl away from the surface
N/A N/A Mutant line (Mathur et al., 2003)
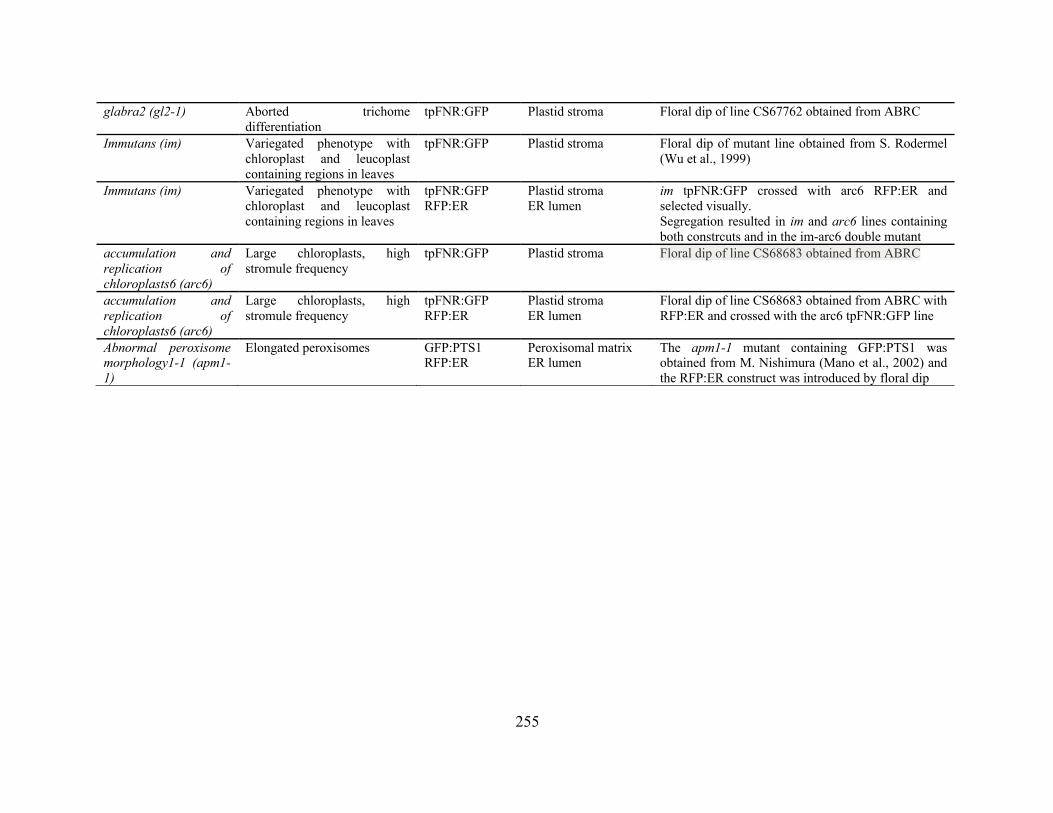
255
glabra2 (gl2-1)
Aborted trichome differentiation
tpFNR:GFP Plastid stroma Floral dip of line CS67762 obtained from ABRC
Immutans (im) Variegated phenotype with chloroplast and leucoplast containing regions in leaves
tpFNR:GFP Plastid stroma Floral dip of mutant line obtained from S. Rodermel (Wu et al., 1999)
Immutans (im) Variegated phenotype with chloroplast and leucoplast containing regions in leaves
tpFNR:GFP RFP:ER
Plastid stroma ER lumen
im tpFNR:GFP crossed with arc6 RFP:ER and selected visually. Segregation resulted in im and arc6 lines containing both constrcuts and in the im-arc6 double mutant
accumulation and replication of chloroplasts6 (arc6)
Large chloroplasts, high stromule frequency
tpFNR:GFP Plastid stroma Floral dip of line CS68683 obtained from ABRC
accumulation and replication of chloroplasts6 (arc6)
Large chloroplasts, high stromule frequency
tpFNR:GFP RFP:ER
Plastid stroma ER lumen
Floral dip of line CS68683 obtained from ABRC with RFP:ER and crossed with the arc6 tpFNR:GFP line
Abnormal peroxisome morphology1-1 (apm1-1)
Elongated peroxisomes GFP:PTS1 RFP:ER
Peroxisomal matrix ER lumen
The apm1-1 mutant containing GFP:PTS1 was obtained from M. Nishimura (Mano et al., 2002) and the RFP:ER construct was introduced by floral dip
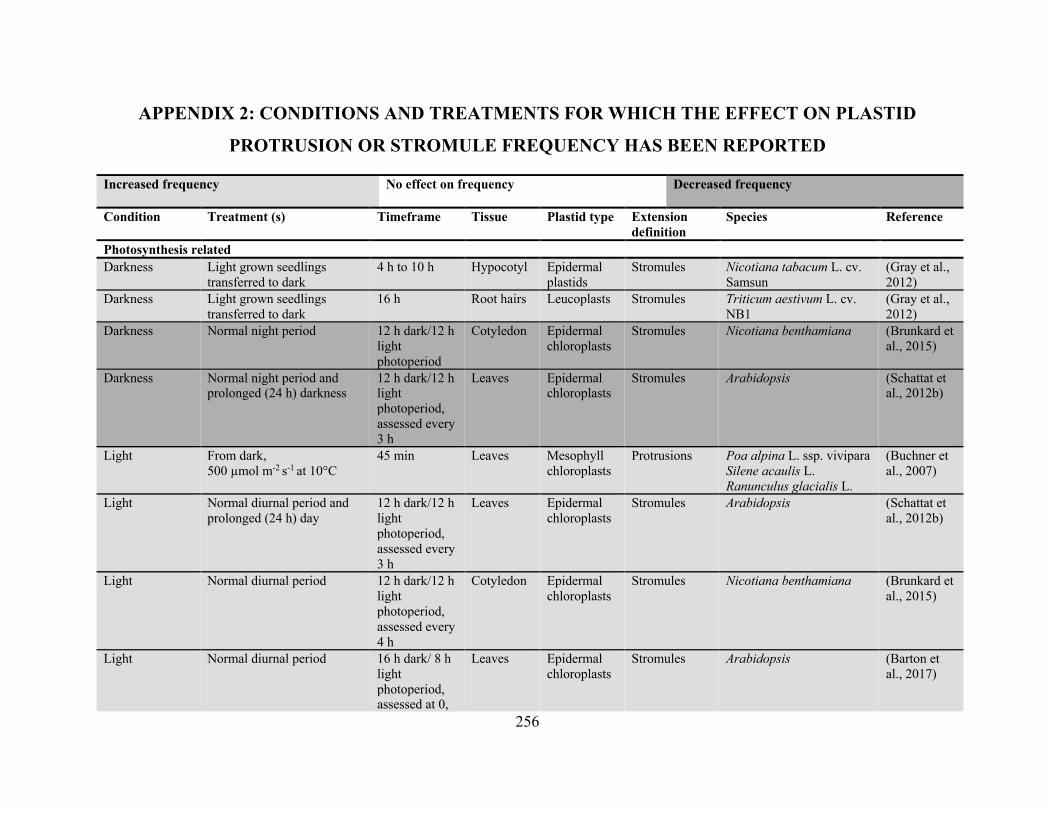
256
APPENDIX 2: CONDITIONS AND TREATMENTS FOR WHICH THE EFFECT ON PLASTID
PROTRUSION OR STROMULE FREQUENCY HAS BEEN REPORTED
Increased frequency No effect on frequency
Decreased frequency
Condition Treatment (s) Timeframe Tissue
Plastid type Extension definition
Species Reference
Photosynthesis related Darkness Light grown seedlings
transferred to dark 4 h to 10 h Hypocotyl Epidermal
plastids Stromules Nicotiana tabacum L. cv.
Samsun (Gray et al., 2012)
Darkness Light grown seedlings transferred to dark
16 h Root hairs Leucoplasts Stromules Triticum aestivum L. cv. NB1
(Gray et al., 2012)
Darkness Normal night period 12 h dark/12 h light photoperiod
Cotyledon Epidermal chloroplasts
Stromules Nicotiana benthamiana (Brunkard et al., 2015)
Darkness Normal night period and prolonged (24 h) darkness
12 h dark/12 h light photoperiod, assessed every 3 h
Leaves Epidermal chloroplasts
Stromules Arabidopsis (Schattat et al., 2012b)
Light
From dark, 500 µmol m-2 s-1 at 10°C
45 min Leaves Mesophyll chloroplasts
Protrusions Poa alpina L. ssp. vivipara Silene acaulis L. Ranunculus glacialis L.
(Buchner et al., 2007)
Light Normal diurnal period and prolonged (24 h) day
12 h dark/12 h light photoperiod, assessed every 3 h
Leaves Epidermal chloroplasts
Stromules Arabidopsis (Schattat et al., 2012b)
Light Normal diurnal period 12 h dark/12 h light photoperiod, assessed every 4 h
Cotyledon Epidermal chloroplasts
Stromules Nicotiana benthamiana (Brunkard et al., 2015)
Light Normal diurnal period 16 h dark/ 8 h light photoperiod, assessed at 0,
Leaves Epidermal chloroplasts
Stromules Arabidopsis (Barton et al., 2017)
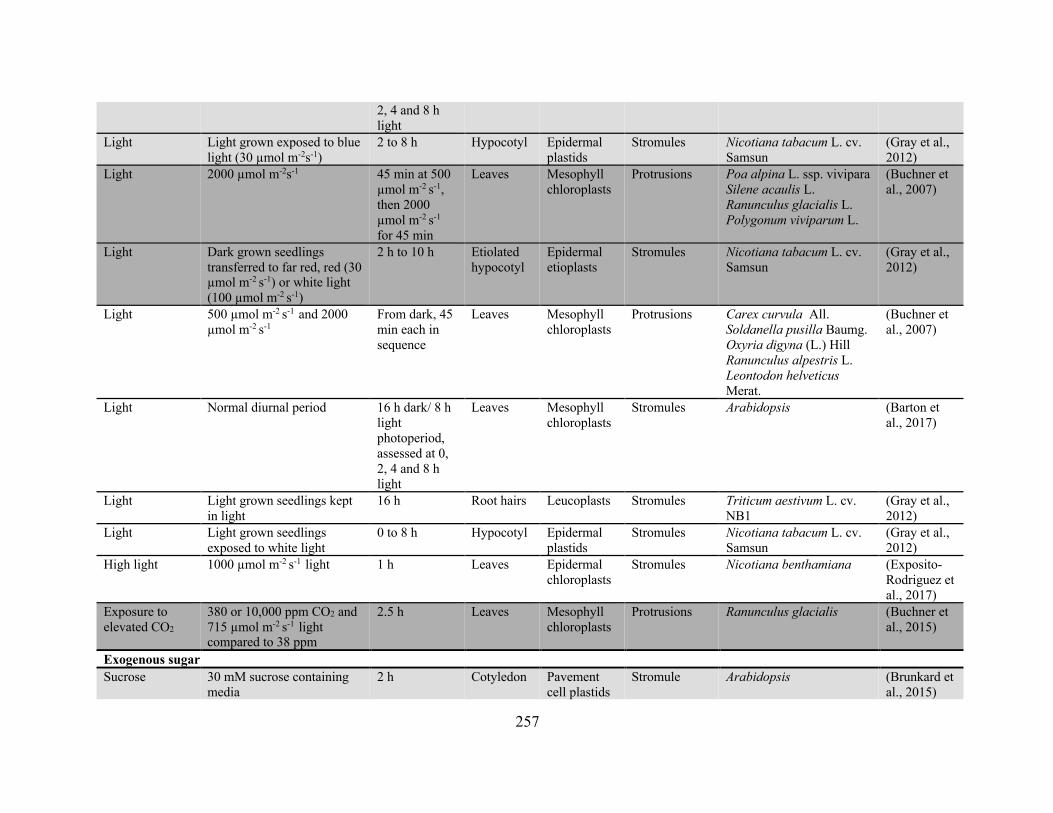
257
2, 4 and 8 h light
Light Light grown exposed to blue light (30 µmol m-2s-1)
2 to 8 h Hypocotyl Epidermal plastids
Stromules Nicotiana tabacum L. cv. Samsun
(Gray et al., 2012)
Light 2000 µmol m-2s-1 45 min at 500 µmol m-2 s-1, then 2000 µmol m-2 s-1 for 45 min
Leaves Mesophyll chloroplasts
Protrusions Poa alpina L. ssp. vivipara Silene acaulis L. Ranunculus glacialis L. Polygonum viviparum L.
(Buchner et al., 2007)
Light Dark grown seedlings transferred to far red, red (30 µmol m-2 s-1) or white light (100 µmol m-2 s-1)
2 h to 10 h Etiolated hypocotyl
Epidermal etioplasts
Stromules Nicotiana tabacum L. cv. Samsun
(Gray et al., 2012)
Light 500 µmol m-2 s-1 and 2000 µmol m-2 s-1
From dark, 45 min each in sequence
Leaves Mesophyll chloroplasts
Protrusions Carex curvula All. Soldanella pusilla Baumg. Oxyria digyna (L.) Hill Ranunculus alpestris L. Leontodon helveticus Merat.
(Buchner et al., 2007)
Light Normal diurnal period 16 h dark/ 8 h light photoperiod, assessed at 0, 2, 4 and 8 h light
Leaves Mesophyll chloroplasts
Stromules Arabidopsis (Barton et al., 2017)
Light Light grown seedlings kept in light
16 h Root hairs Leucoplasts Stromules Triticum aestivum L. cv. NB1
(Gray et al., 2012)
Light Light grown seedlings exposed to white light
0 to 8 h Hypocotyl Epidermal plastids
Stromules Nicotiana tabacum L. cv. Samsun
(Gray et al., 2012)
High light 1000 µmol m-2 s-1 light 1 h Leaves Epidermal chloroplasts
Stromules Nicotiana benthamiana (Exposito-Rodriguez et al., 2017)
Exposure to elevated CO2
380 or 10,000 ppm CO2 and 715 µmol m-2 s-1 light compared to 38 ppm
2.5 h Leaves Mesophyll chloroplasts
Protrusions Ranunculus glacialis (Buchner et al., 2015)
Exogenous sugar Sucrose 30 mM sucrose containing
media 2 h Cotyledon Pavement
cell plastids Stromule Arabidopsis (Brunkard et
al., 2015)
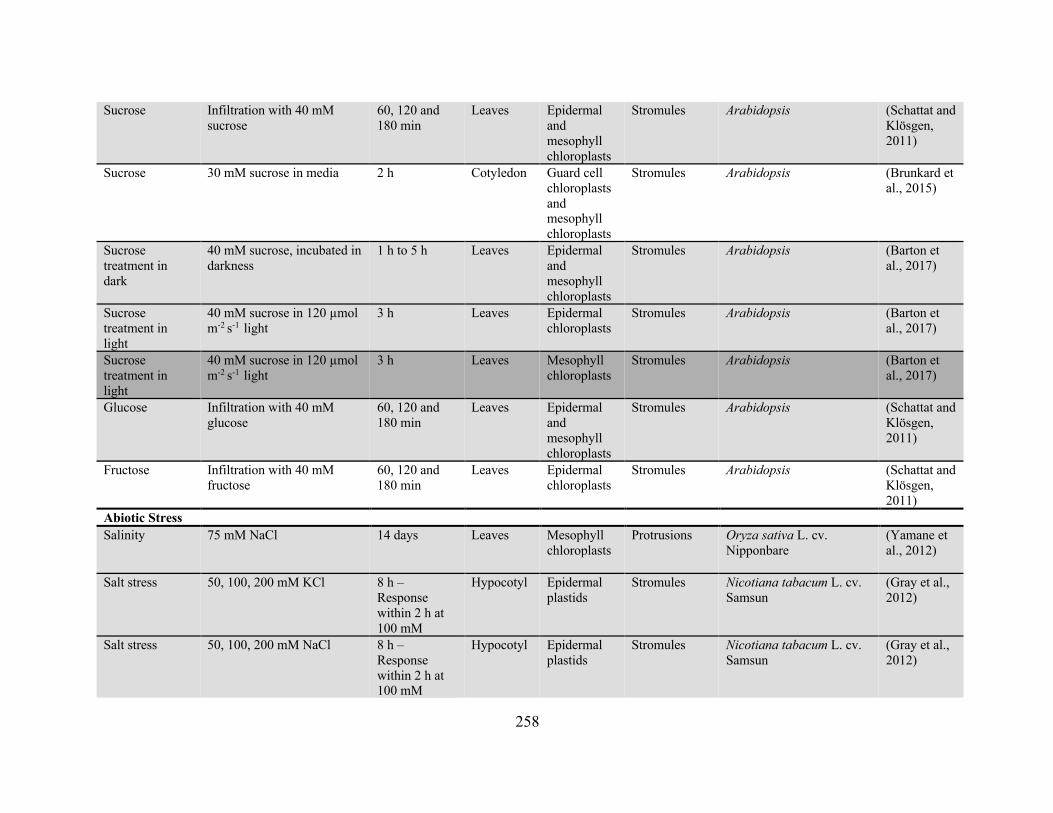
258
Sucrose Infiltration with 40 mM sucrose
60, 120 and 180 min
Leaves Epidermal and mesophyll chloroplasts
Stromules Arabidopsis (Schattat and Klösgen, 2011)
Sucrose 30 mM sucrose in media 2 h Cotyledon Guard cell chloroplasts and mesophyll chloroplasts
Stromules Arabidopsis (Brunkard et al., 2015)
Sucrose treatment in dark
40 mM sucrose, incubated in darkness
1 h to 5 h Leaves Epidermal and mesophyll chloroplasts
Stromules Arabidopsis (Barton et al., 2017)
Sucrose treatment in light
40 mM sucrose in 120 µmol m-2 s-1 light
3 h Leaves Epidermal chloroplasts
Stromules Arabidopsis (Barton et al., 2017)
Sucrose treatment in light
40 mM sucrose in 120 µmol m-2 s-1 light
3 h Leaves Mesophyll chloroplasts
Stromules Arabidopsis (Barton et al., 2017)
Glucose Infiltration with 40 mM glucose
60, 120 and 180 min
Leaves Epidermal and mesophyll chloroplasts
Stromules Arabidopsis (Schattat and Klösgen, 2011)
Fructose Infiltration with 40 mM fructose
60, 120 and 180 min
Leaves Epidermal chloroplasts
Stromules Arabidopsis (Schattat and Klösgen, 2011)
Abiotic Stress Salinity
75 mM NaCl 14 days Leaves Mesophyll chloroplasts
Protrusions Oryza sativa L. cv. Nipponbare
(Yamane et al., 2012)
Salt stress 50, 100, 200 mM KCl 8 h – Response within 2 h at 100 mM
Hypocotyl Epidermal plastids
Stromules Nicotiana tabacum L. cv. Samsun
(Gray et al., 2012)
Salt stress 50, 100, 200 mM NaCl 8 h – Response within 2 h at 100 mM
Hypocotyl Epidermal plastids
Stromules Nicotiana tabacum L. cv. Samsun
(Gray et al., 2012)
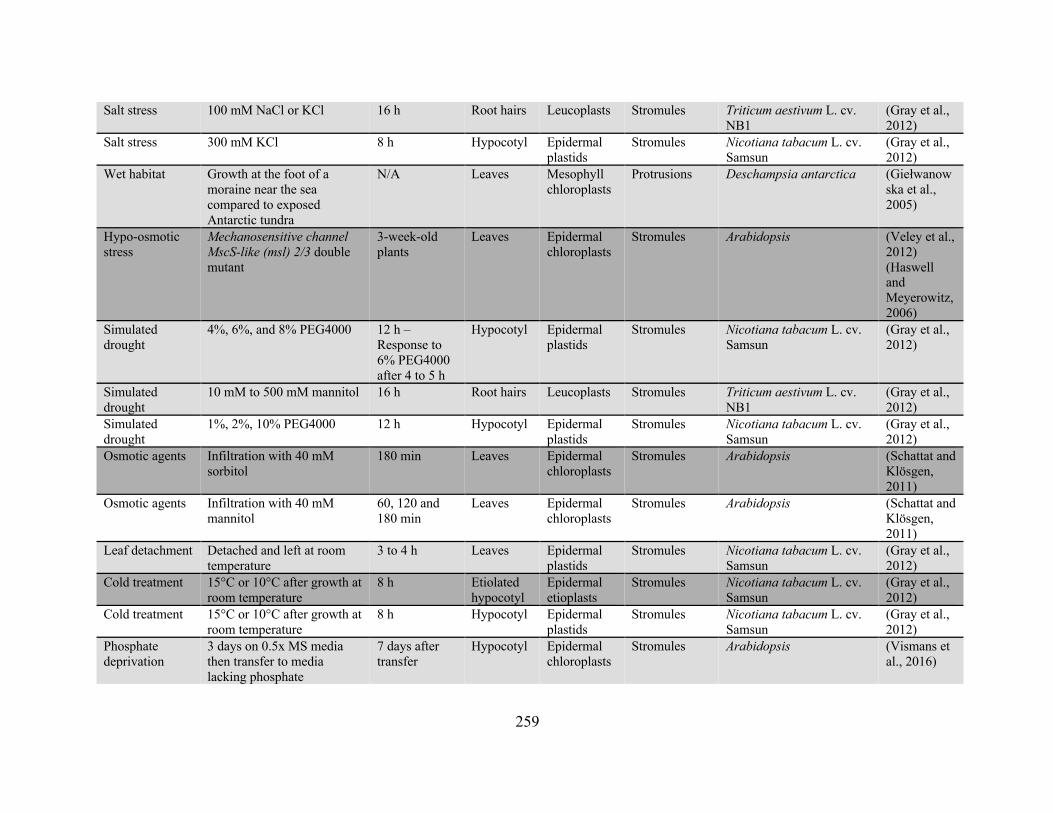
259
Salt stress 100 mM NaCl or KCl 16 h Root hairs Leucoplasts Stromules Triticum aestivum L. cv. NB1
(Gray et al., 2012)
Salt stress 300 mM KCl 8 h Hypocotyl Epidermal plastids
Stromules Nicotiana tabacum L. cv. Samsun
(Gray et al., 2012)
Wet habitat Growth at the foot of a moraine near the sea compared to exposed Antarctic tundra
N/A Leaves Mesophyll chloroplasts
Protrusions Deschampsia antarctica (Giełwanowska et al., 2005)
Hypo-osmotic stress
Mechanosensitive channel MscS-like (msl) 2/3 double mutant
3-week-old plants
Leaves Epidermal chloroplasts
Stromules Arabidopsis (Veley et al., 2012) (Haswell and Meyerowitz, 2006)
Simulated drought
4%, 6%, and 8% PEG4000 12 h – Response to 6% PEG4000 after 4 to 5 h
Hypocotyl Epidermal plastids
Stromules Nicotiana tabacum L. cv. Samsun
(Gray et al., 2012)
Simulated drought
10 mM to 500 mM mannitol 16 h Root hairs Leucoplasts Stromules Triticum aestivum L. cv. NB1
(Gray et al., 2012)
Simulated drought
1%, 2%, 10% PEG4000 12 h Hypocotyl Epidermal plastids
Stromules Nicotiana tabacum L. cv. Samsun
(Gray et al., 2012)
Osmotic agents Infiltration with 40 mM sorbitol
180 min Leaves Epidermal chloroplasts
Stromules Arabidopsis (Schattat and Klösgen, 2011)
Osmotic agents Infiltration with 40 mM mannitol
60, 120 and 180 min
Leaves Epidermal chloroplasts
Stromules Arabidopsis (Schattat and Klösgen, 2011)
Leaf detachment Detached and left at room temperature
3 to 4 h Leaves Epidermal plastids
Stromules Nicotiana tabacum L. cv. Samsun
(Gray et al., 2012)
Cold treatment 15°C or 10°C after growth at room temperature
8 h Etiolated hypocotyl
Epidermal etioplasts
Stromules Nicotiana tabacum L. cv. Samsun
(Gray et al., 2012)
Cold treatment 15°C or 10°C after growth at room temperature
8 h Hypocotyl Epidermal plastids
Stromules Nicotiana tabacum L. cv. Samsun
(Gray et al., 2012)
Phosphate deprivation
3 days on 0.5x MS media then transfer to media lacking phosphate
7 days after transfer
Hypocotyl Epidermal chloroplasts
Stromules Arabidopsis (Vismans et al., 2016)
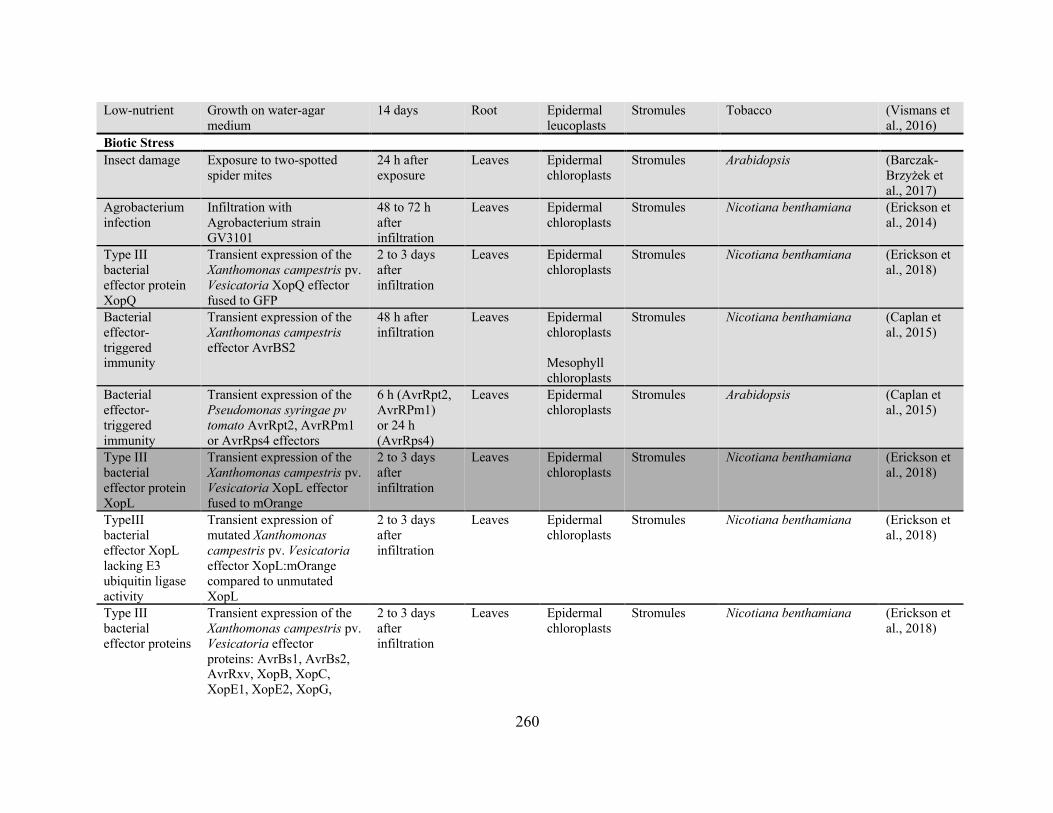
260
Low-nutrient Growth on water-agar medium
14 days Root Epidermal leucoplasts
Stromules Tobacco (Vismans et al., 2016)
Biotic Stress Insect damage Exposure to two-spotted
spider mites 24 h after exposure
Leaves Epidermal chloroplasts
Stromules Arabidopsis (Barczak-Brzyżek et al., 2017)
Agrobacterium infection
Infiltration with Agrobacterium strain GV3101
48 to 72 h after infiltration
Leaves Epidermal chloroplasts
Stromules Nicotiana benthamiana (Erickson et al., 2014)
Type III bacterial effector protein XopQ
Transient expression of the Xanthomonas campestris pv. Vesicatoria XopQ effector fused to GFP
2 to 3 days after infiltration
Leaves Epidermal chloroplasts
Stromules Nicotiana benthamiana (Erickson et al., 2018)
Bacterial effector-triggered immunity
Transient expression of the Xanthomonas campestris effector AvrBS2
48 h after infiltration
Leaves Epidermal chloroplasts Mesophyll chloroplasts
Stromules Nicotiana benthamiana (Caplan et al., 2015)
Bacterial effector-triggered immunity
Transient expression of the Pseudomonas syringae pv tomato AvrRpt2, AvrRPm1 or AvrRps4 effectors
6 h (AvrRpt2, AvrRPm1) or 24 h (AvrRps4)
Leaves Epidermal chloroplasts
Stromules Arabidopsis (Caplan et al., 2015)
Type III bacterial effector protein XopL
Transient expression of the Xanthomonas campestris pv. Vesicatoria XopL effector fused to mOrange
2 to 3 days after infiltration
Leaves Epidermal chloroplasts
Stromules Nicotiana benthamiana (Erickson et al., 2018)
TypeIII bacterial effector XopL lacking E3 ubiquitin ligase activity
Transient expression of mutated Xanthomonas campestris pv. Vesicatoria effector XopL:mOrange compared to unmutated XopL
2 to 3 days after infiltration
Leaves Epidermal chloroplasts
Stromules Nicotiana benthamiana (Erickson et al., 2018)
Type III bacterial effector proteins
Transient expression of the Xanthomonas campestris pv. Vesicatoria effector proteins: AvrBs1, AvrBs2, AvrRxv, XopB, XopC, XopE1, XopE2, XopG,
2 to 3 days after infiltration
Leaves Epidermal chloroplasts
Stromules Nicotiana benthamiana (Erickson et al., 2018)

261
XopH, XopI, XopJ, XopK, XopM, XopO, XopP, XopS, XopV, each fused to GFP
N-mediated viral effector-triggered immunity
Transient expression of the 50 kDA helicase domain of the Tobacco Mosaic Virus fused to the Citrine fluorescent protein (p50:Citrine) in the presence of the N-gene
46 h after infiltration
Leaves Epidermal chloroplasts Mesophyll chloroplasts
Stromules Nicotiana benthamiana (Caplan et al., 2015)
Arbuscular mycorrhizal colonization
Inoculation with Glomus intraradices
Not clearly specified
Roots Leucoplasts Stromules/ plastid network
Nicotiana tabacum L. (Fester et al., 2001)
Arbuscular mycorrhizal colonization
Inoculation with Glomus intraradices
30, 60 or 90 days after inoculation
Roots Leucoplasts Stromules/ plastid network
Medicago truncatula (Lohse et al., 2005)
Arbuscular mycorrhizal colonization
Inoculation with Glomus intraradices or Glomus mosseae
At least 4 weeks after inoculation
Roots Leucoplasts Stromules/ plastid network
Zea mays (Hans et al., 2004)
Plant Hormones and Signaling Molecules Strigolactones Submersion of max3-9
strigolactone biosynthesis mutant in 10 or 25 µM GR24
1 to 2 h Hypocotyl Epidermal chloroplasts
Stromules Arabidopsis (Vismans et al., 2016)
Strigolactones High strigolactone mutant (max2-1)
3-day-old seedlings
Hypocotyl Epidermal chloroplasts
Stromules Arabidopsis (Vismans et al., 2016)
Strigolactones 0.3 µM and 3.3 µM GR24 1.5 h Leaf disc guard cells
Guard cell chloroplasts
Stromules Tobacco (Vismans et al., 2016)
Strigolactones 33 µM GR24 1.5 h Leaf disc guard cells
Chloroplasts Stromules Tobacco (Vismans et al., 2016)
Inhibition of strigolactone biosynthesis
5 µM D2 36 h Hypocotyl Epidermal chloroplasts
Stromules Arabidopsis (Vismans et al., 2016)
Inhibition of strigolactone biosynthesis
Strigolactone biosynthesis mutant (max3-9)
3-day-old seedlings
Hypocotyl Epidermal chloroplasts
Stromules Arabidopsis (Vismans et al., 2016)
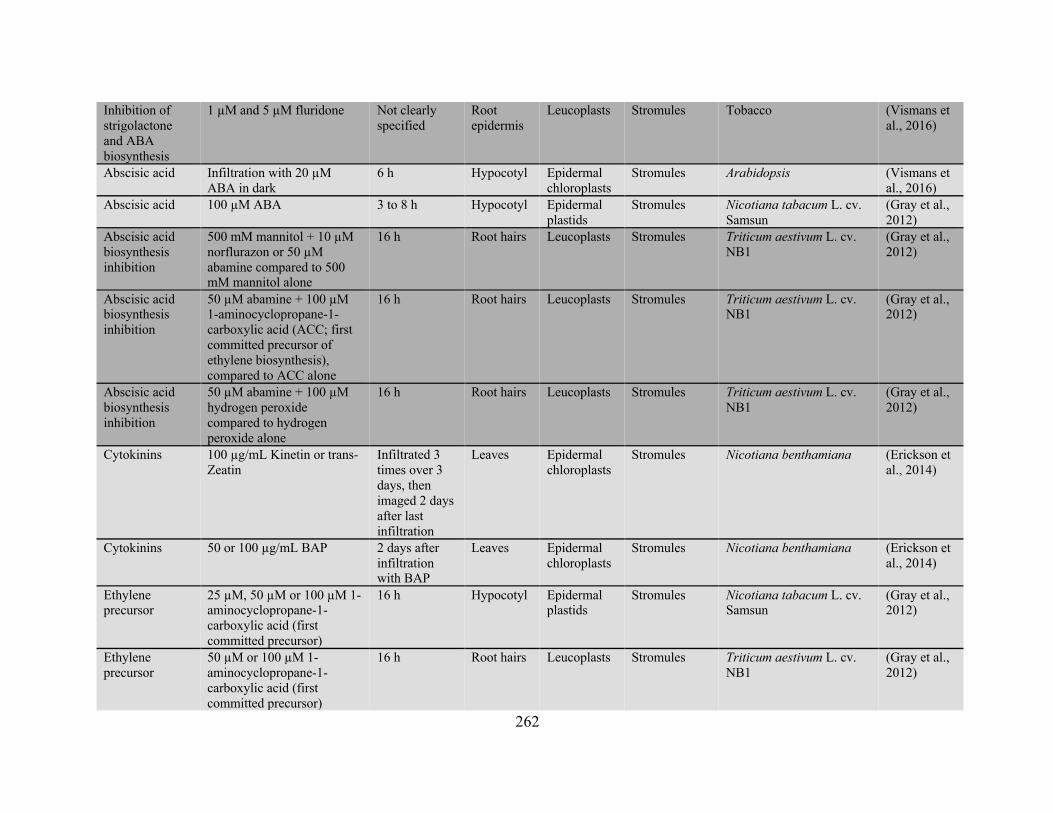
262
Inhibition of strigolactone and ABA biosynthesis
1 µM and 5 µM fluridone Not clearly specified
Root epidermis
Leucoplasts Stromules Tobacco (Vismans et al., 2016)
Abscisic acid Infiltration with 20 µM ABA in dark
6 h Hypocotyl Epidermal chloroplasts
Stromules Arabidopsis (Vismans et al., 2016)
Abscisic acid 100 µM ABA 3 to 8 h Hypocotyl Epidermal plastids
Stromules Nicotiana tabacum L. cv. Samsun
(Gray et al., 2012)
Abscisic acid biosynthesis inhibition
500 mM mannitol + 10 µM norflurazon or 50 µM abamine compared to 500 mM mannitol alone
16 h Root hairs Leucoplasts Stromules Triticum aestivum L. cv. NB1
(Gray et al., 2012)
Abscisic acid biosynthesis inhibition
50 µM abamine + 100 µM 1-aminocyclopropane-1-carboxylic acid (ACC; first committed precursor of ethylene biosynthesis), compared to ACC alone
16 h Root hairs Leucoplasts Stromules Triticum aestivum L. cv. NB1
(Gray et al., 2012)
Abscisic acid biosynthesis inhibition
50 µM abamine + 100 µM hydrogen peroxide compared to hydrogen peroxide alone
16 h Root hairs Leucoplasts Stromules Triticum aestivum L. cv. NB1
(Gray et al., 2012)
Cytokinins 100 µg/mL Kinetin or trans-Zeatin
Infiltrated 3 times over 3 days, then imaged 2 days after last infiltration
Leaves Epidermal chloroplasts
Stromules Nicotiana benthamiana (Erickson et al., 2014)
Cytokinins 50 or 100 µg/mL BAP 2 days after infiltration with BAP
Leaves Epidermal chloroplasts
Stromules Nicotiana benthamiana (Erickson et al., 2014)
Ethylene precursor
25 µM, 50 µM or 100 µM 1-aminocyclopropane-1-carboxylic acid (first committed precursor)
16 h Hypocotyl Epidermal plastids
Stromules Nicotiana tabacum L. cv. Samsun
(Gray et al., 2012)
Ethylene precursor
50 µM or 100 µM 1-aminocyclopropane-1-carboxylic acid (first committed precursor)
16 h Root hairs Leucoplasts Stromules Triticum aestivum L. cv. NB1
(Gray et al., 2012)

263
Ethylene inhibition
30 or 120 µM silver nitrate 16 h Hypocotyl Epidermal plastids
Stromules Nicotiana tabacum L. cv. Samsun
(Gray et al., 2012)
Ethylene inhibition
1 or 5 µM silver nitrate 16 h Root hairs Leucoplasts Stromules Triticum aestivum L. cv. NB1
(Gray et al., 2012)
Methyl jasmonate
100 µM methyl jasmonate 16 h Root hairs Leucoplasts Stromules Triticum aestivum L. cv. NB1
(Gray et al., 2012)
Methyl jasmonate treatment
10 µM methyl jasmonate 16 h Root hairs Leucoplasts Stromules Triticum aestivum L. cv. NB1
(Gray et al., 2012)
Salicylic acid Infiltration with 1 mM INA (Salicylic acid analog)
26 to 72 h Leaves Epidermal chloroplasts
Stromules Nicotiana benthamiana (Caplan et al., 2015)
Salicylic acid Infiltration with 1 mM INA (Salicylic acid analog)
22 h Leaves Epidermal chloroplasts
Stromules Arabidopsis (Caplan et al., 2015)
Salicylic acid 100 µM INA 1 h Protoplasts Mesophyll chloroplasts
Stromules Arabidopsis (Caplan et al., 2015)
Salicylate 100 µM or 1 mM salicylate 16 h Root hairs Leucoplasts Stromules Triticum aestivum L. cv. NB1
(Gray et al., 2012)
Salicylate 1 mM salicylate in dark grown plants
2 to 8 h Hypocotyl Epidermal etioplasts
Stromules Nicotiana tabacum L. cv. Samsun
(Gray et al., 2012)
Salicylate 1 mM salicylate light grown plants transferred to dark
4 to 8 h Hypocotyl Epidermal etioplasts
Stromules Nicotiana tabacum L. cv. Samsun
(Gray et al., 2012)
ROS stress Redox stress 10 µM DCMU (induces
singlet oxygen) or 12 µM DBMIB (induces superoxide)
2 h Cotyledon Guard cell chloroplasts
Stromules Arabidopsis (Brunkard et al., 2015)
Redox stress 10 µM DCMU or 12 µM DBMIB
2 h Cotyledon Epidermal chloroplasts
Stromules Nicotiana benthamiana (Brunkard et al., 2015)
Redox stress Virus induced gene silencing of redox status regulator NbNTRC
2 weeks after infiltration
Leaves Epidermal chloroplasts
Stromules Nicotiana benthamiana (Brunkard et al., 2015)
Redox stress 10 µM DCMU or 12 µM DBMIB
2 h Cotyledon Pavement cell plastids
Stromules Arabidopsis (Brunkard et al., 2015)
Inhibition of mitochondrial respiration
50 µM Antimycin A 5 min to 2 h Root cortex
Leucoplasts Plastid filamentation
Arabidopsis (Itoh et al., 2010)
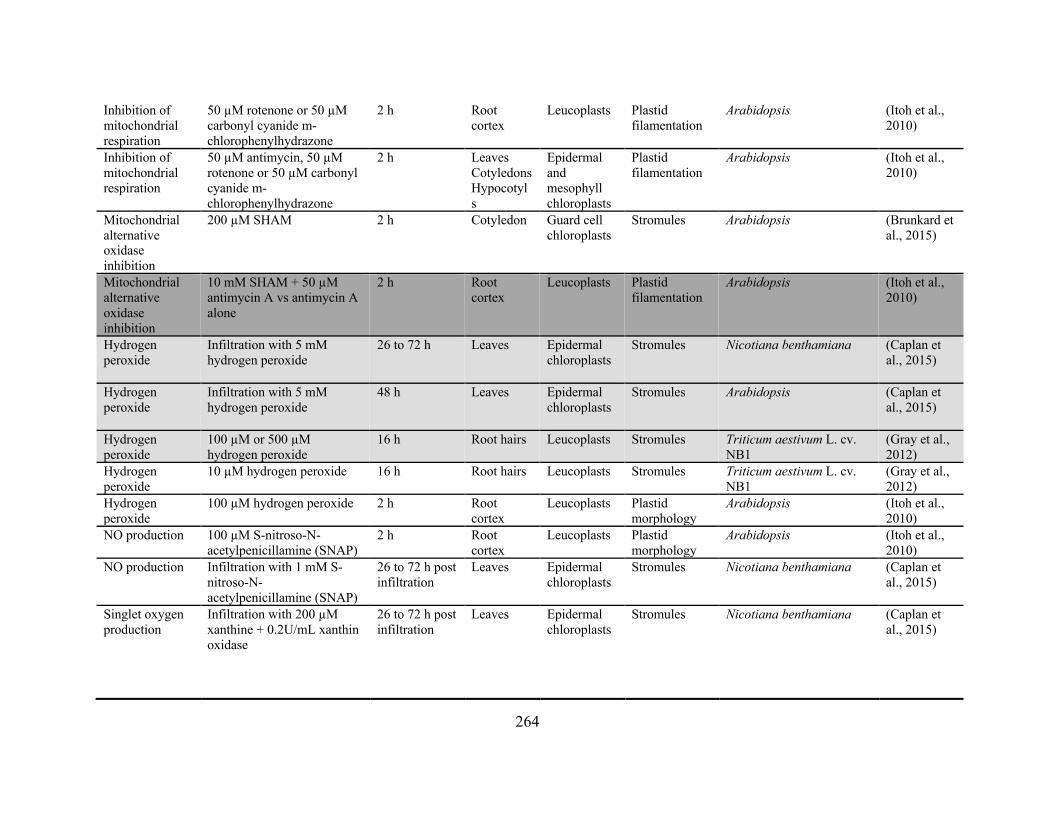
264
Inhibition of mitochondrial respiration
50 µM rotenone or 50 µM carbonyl cyanide m-chlorophenylhydrazone
2 h Root cortex
Leucoplasts Plastid filamentation
Arabidopsis (Itoh et al., 2010)
Inhibition of mitochondrial respiration
50 µM antimycin, 50 µM rotenone or 50 µM carbonyl cyanide m-chlorophenylhydrazone
2 h Leaves Cotyledons Hypocotyls
Epidermal and mesophyll chloroplasts
Plastid filamentation
Arabidopsis (Itoh et al., 2010)
Mitochondrial alternative oxidase inhibition
200 µM SHAM 2 h Cotyledon Guard cell chloroplasts
Stromules Arabidopsis (Brunkard et al., 2015)
Mitochondrial alternative oxidase inhibition
10 mM SHAM + 50 µM antimycin A vs antimycin A alone
2 h Root cortex
Leucoplasts Plastid filamentation
Arabidopsis (Itoh et al., 2010)
Hydrogen peroxide
Infiltration with 5 mM hydrogen peroxide
26 to 72 h Leaves Epidermal chloroplasts
Stromules Nicotiana benthamiana (Caplan et al., 2015)
Hydrogen peroxide
Infiltration with 5 mM hydrogen peroxide
48 h Leaves Epidermal chloroplasts
Stromules Arabidopsis (Caplan et al., 2015)
Hydrogen peroxide
100 µM or 500 µM hydrogen peroxide
16 h Root hairs Leucoplasts Stromules Triticum aestivum L. cv. NB1
(Gray et al., 2012)
Hydrogen peroxide
10 µM hydrogen peroxide 16 h Root hairs Leucoplasts Stromules Triticum aestivum L. cv. NB1
(Gray et al., 2012)
Hydrogen peroxide
100 µM hydrogen peroxide 2 h Root cortex
Leucoplasts Plastid morphology
Arabidopsis (Itoh et al., 2010)
NO production 100 µM S-nitroso-N-acetylpenicillamine (SNAP)
2 h Root cortex
Leucoplasts Plastid morphology
Arabidopsis (Itoh et al., 2010)
NO production Infiltration with 1 mM S-nitroso-N-acetylpenicillamine (SNAP)
26 to 72 h post infiltration
Leaves Epidermal chloroplasts
Stromules Nicotiana benthamiana (Caplan et al., 2015)
Singlet oxygen production
Infiltration with 200 µM xanthine + 0.2U/mL xanthin oxidase
26 to 72 h post infiltration
Leaves Epidermal chloroplasts
Stromules Nicotiana benthamiana (Caplan et al., 2015)
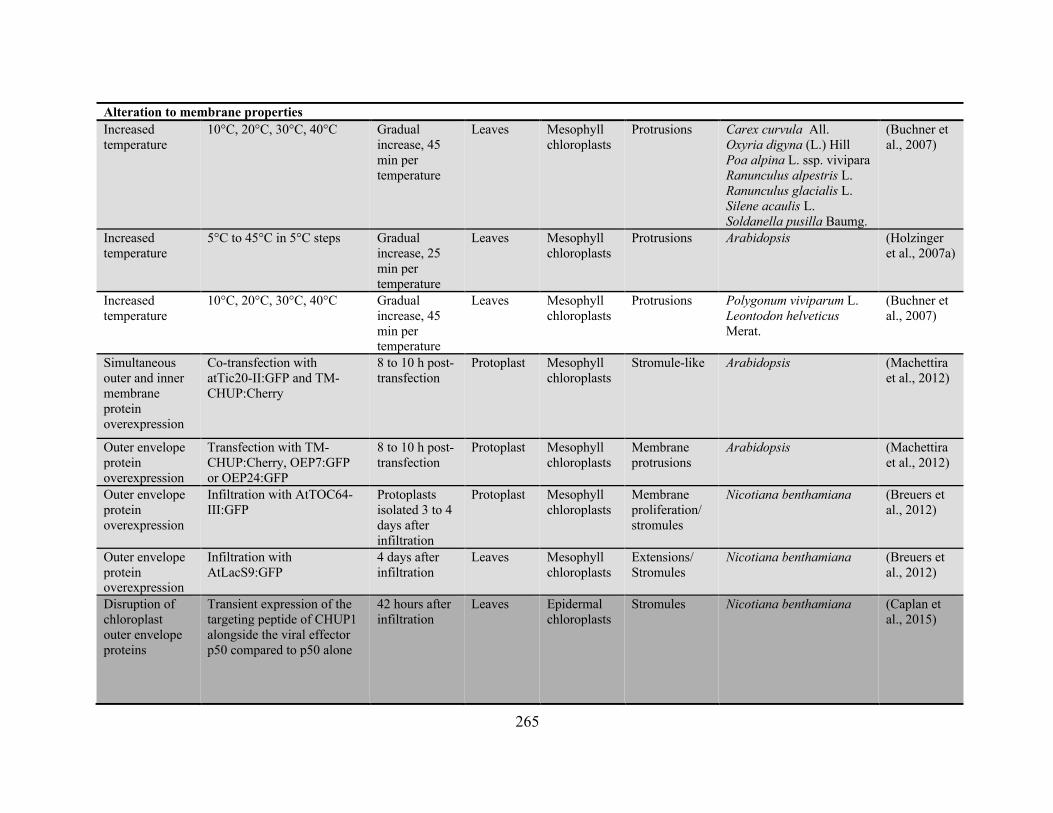
265
Alteration to membrane properties Increased temperature
10°C, 20°C, 30°C, 40°C Gradual increase, 45 min per temperature
Leaves Mesophyll chloroplasts
Protrusions Carex curvula All. Oxyria digyna (L.) Hill Poa alpina L. ssp. vivipara Ranunculus alpestris L. Ranunculus glacialis L. Silene acaulis L. Soldanella pusilla Baumg.
(Buchner et al., 2007)
Increased temperature
5°C to 45°C in 5°C steps Gradual increase, 25 min per temperature
Leaves
Mesophyll chloroplasts
Protrusions Arabidopsis (Holzinger et al., 2007a)
Increased temperature
10°C, 20°C, 30°C, 40°C Gradual increase, 45 min per temperature
Leaves Mesophyll chloroplasts
Protrusions Polygonum viviparum L. Leontodon helveticus Merat.
(Buchner et al., 2007)
Simultaneous outer and inner membrane protein overexpression
Co-transfection with atTic20-II:GFP and TM-CHUP:Cherry
8 to 10 h post-transfection
Protoplast Mesophyll chloroplasts
Stromule-like Arabidopsis (Machettira et al., 2012)
Outer envelope protein overexpression
Transfection with TM-CHUP:Cherry, OEP7:GFP or OEP24:GFP
8 to 10 h post-transfection
Protoplast Mesophyll chloroplasts
Membrane protrusions
Arabidopsis (Machettira et al., 2012)
Outer envelope protein overexpression
Infiltration with AtTOC64-III:GFP
Protoplasts isolated 3 to 4 days after infiltration
Protoplast Mesophyll chloroplasts
Membrane proliferation/ stromules
Nicotiana benthamiana (Breuers et al., 2012)
Outer envelope protein overexpression
Infiltration with AtLacS9:GFP
4 days after infiltration
Leaves Mesophyll chloroplasts
Extensions/ Stromules
Nicotiana benthamiana (Breuers et al., 2012)
Disruption of chloroplast outer envelope proteins
Transient expression of the targeting peptide of CHUP1 alongside the viral effector p50 compared to p50 alone
42 hours after infiltration
Leaves Epidermal chloroplasts
Stromules Nicotiana benthamiana (Caplan et al., 2015)
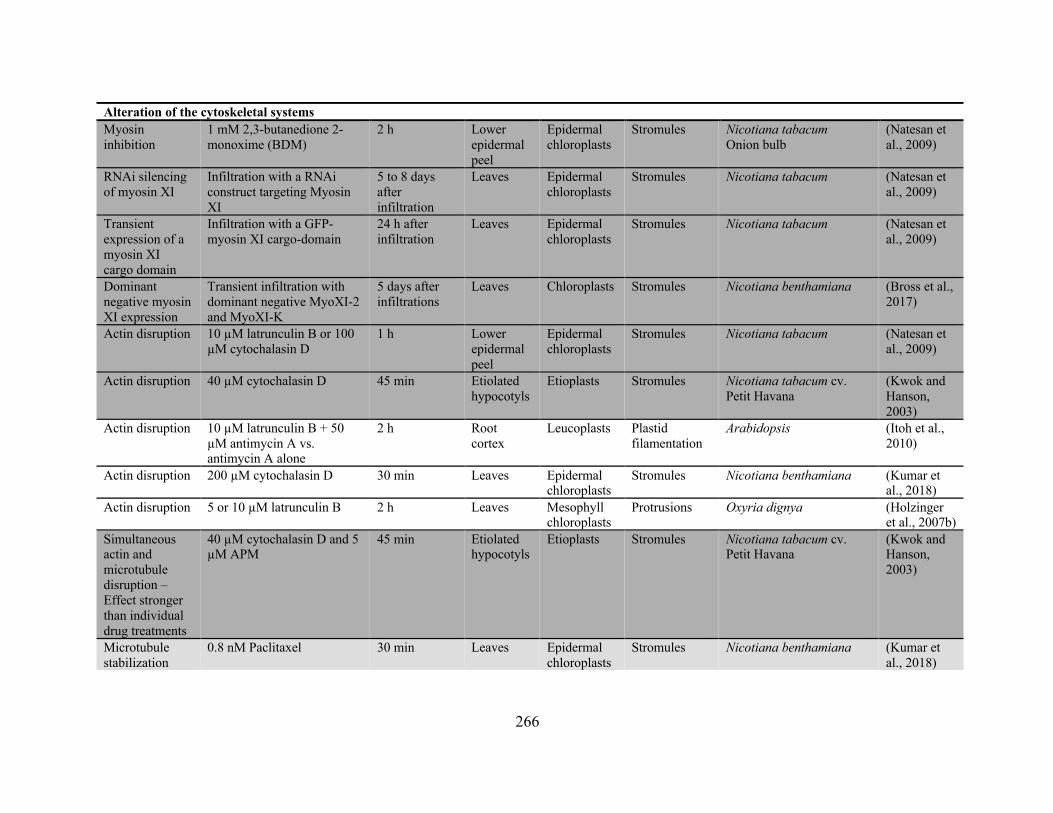
266
Alteration of the cytoskeletal systems Myosin inhibition
1 mM 2,3-butanedione 2-monoxime (BDM)
2 h Lower epidermal peel
Epidermal chloroplasts
Stromules Nicotiana tabacum Onion bulb
(Natesan et al., 2009)
RNAi silencing of myosin XI
Infiltration with a RNAi construct targeting Myosin XI
5 to 8 days after infiltration
Leaves Epidermal chloroplasts
Stromules Nicotiana tabacum
(Natesan et al., 2009)
Transient expression of a myosin XI cargo domain
Infiltration with a GFP-myosin XI cargo-domain
24 h after infiltration
Leaves Epidermal chloroplasts
Stromules Nicotiana tabacum
(Natesan et al., 2009)
Dominant negative myosin XI expression
Transient infiltration with dominant negative MyoXI-2 and MyoXI-K
5 days after infiltrations
Leaves Chloroplasts Stromules Nicotiana benthamiana (Bross et al., 2017)
Actin disruption 10 µM latrunculin B or 100 µM cytochalasin D
1 h Lower epidermal peel
Epidermal chloroplasts
Stromules Nicotiana tabacum
(Natesan et al., 2009)
Actin disruption 40 µM cytochalasin D 45 min Etiolated hypocotyls
Etioplasts Stromules Nicotiana tabacum cv. Petit Havana
(Kwok and Hanson, 2003)
Actin disruption 10 µM latrunculin B + 50 µM antimycin A vs. antimycin A alone
2 h Root cortex
Leucoplasts Plastid filamentation
Arabidopsis (Itoh et al., 2010)
Actin disruption 200 µM cytochalasin D 30 min Leaves Epidermal chloroplasts
Stromules Nicotiana benthamiana (Kumar et al., 2018)
Actin disruption 5 or 10 µM latrunculin B 2 h Leaves Mesophyll chloroplasts
Protrusions Oxyria dignya (Holzinger et al., 2007b)
Simultaneous actin and microtubule disruption – Effect stronger than individual drug treatments
40 µM cytochalasin D and 5 µM APM
45 min Etiolated hypocotyls
Etioplasts Stromules Nicotiana tabacum cv. Petit Havana
(Kwok and Hanson, 2003)
Microtubule stabilization
0.8 nM Paclitaxel 30 min Leaves Epidermal chloroplasts
Stromules Nicotiana benthamiana (Kumar et al., 2018)
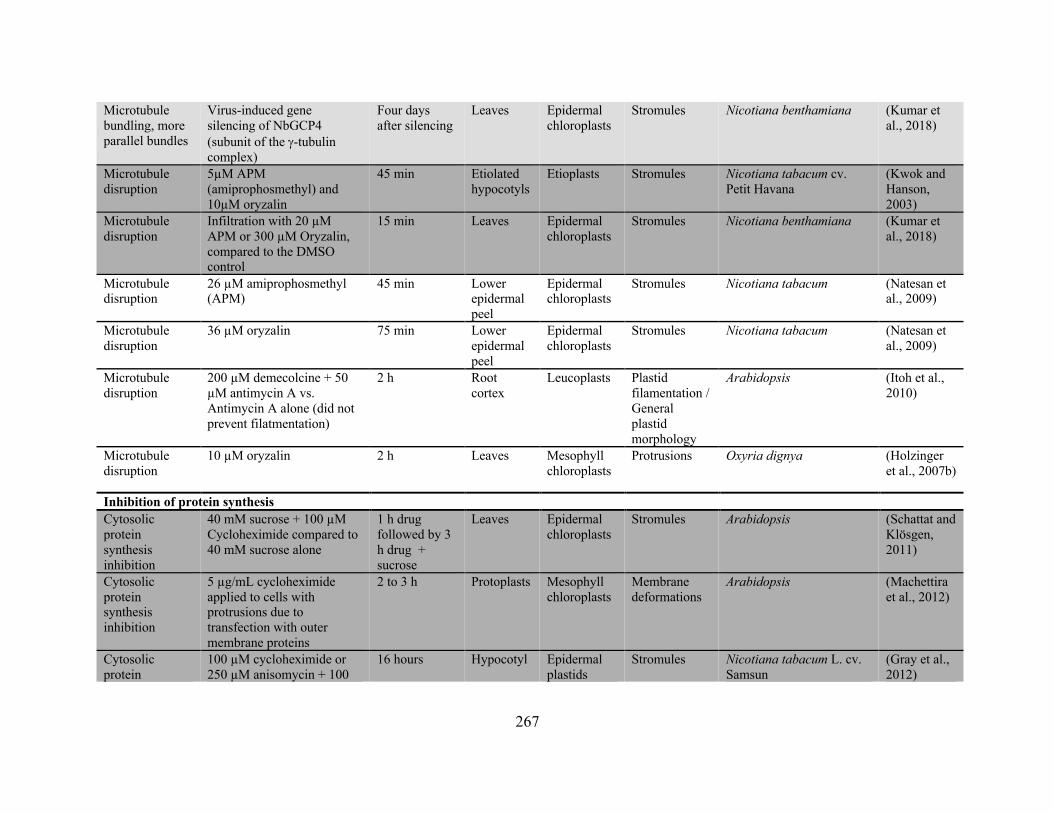
267
Microtubule bundling, more parallel bundles
Virus-induced gene silencing of NbGCP4 (subunit of the g-tubulin complex)
Four days after silencing
Leaves Epidermal chloroplasts
Stromules Nicotiana benthamiana (Kumar et al., 2018)
Microtubule disruption
5µM APM (amiprophosmethyl) and 10µM oryzalin
45 min Etiolated hypocotyls
Etioplasts Stromules Nicotiana tabacum cv. Petit Havana
(Kwok and Hanson, 2003)
Microtubule disruption
Infiltration with 20 µM APM or 300 µM Oryzalin, compared to the DMSO control
15 min Leaves Epidermal chloroplasts
Stromules Nicotiana benthamiana (Kumar et al., 2018)
Microtubule disruption
26 µM amiprophosmethyl (APM)
45 min Lower epidermal peel
Epidermal chloroplasts
Stromules Nicotiana tabacum
(Natesan et al., 2009)
Microtubule disruption
36 µM oryzalin 75 min Lower epidermal peel
Epidermal chloroplasts
Stromules Nicotiana tabacum
(Natesan et al., 2009)
Microtubule disruption
200 µM demecolcine + 50 µM antimycin A vs. Antimycin A alone (did not prevent filatmentation)
2 h Root cortex
Leucoplasts Plastid filamentation / General plastid morphology
Arabidopsis (Itoh et al., 2010)
Microtubule disruption
10 µM oryzalin 2 h Leaves Mesophyll chloroplasts
Protrusions Oxyria dignya (Holzinger et al., 2007b)
Inhibition of protein synthesis Cytosolic protein synthesis inhibition
40 mM sucrose + 100 µM Cycloheximide compared to 40 mM sucrose alone
1 h drug followed by 3 h drug + sucrose
Leaves Epidermal chloroplasts
Stromules Arabidopsis (Schattat and Klösgen, 2011)
Cytosolic protein synthesis inhibition
5 µg/mL cycloheximide applied to cells with protrusions due to transfection with outer membrane proteins
2 to 3 h Protoplasts Mesophyll chloroplasts
Membrane deformations
Arabidopsis (Machettira et al., 2012)
Cytosolic protein
100 µM cycloheximide or 250 µM anisomycin + 100
16 hours Hypocotyl Epidermal plastids
Stromules Nicotiana tabacum L. cv. Samsun
(Gray et al., 2012)
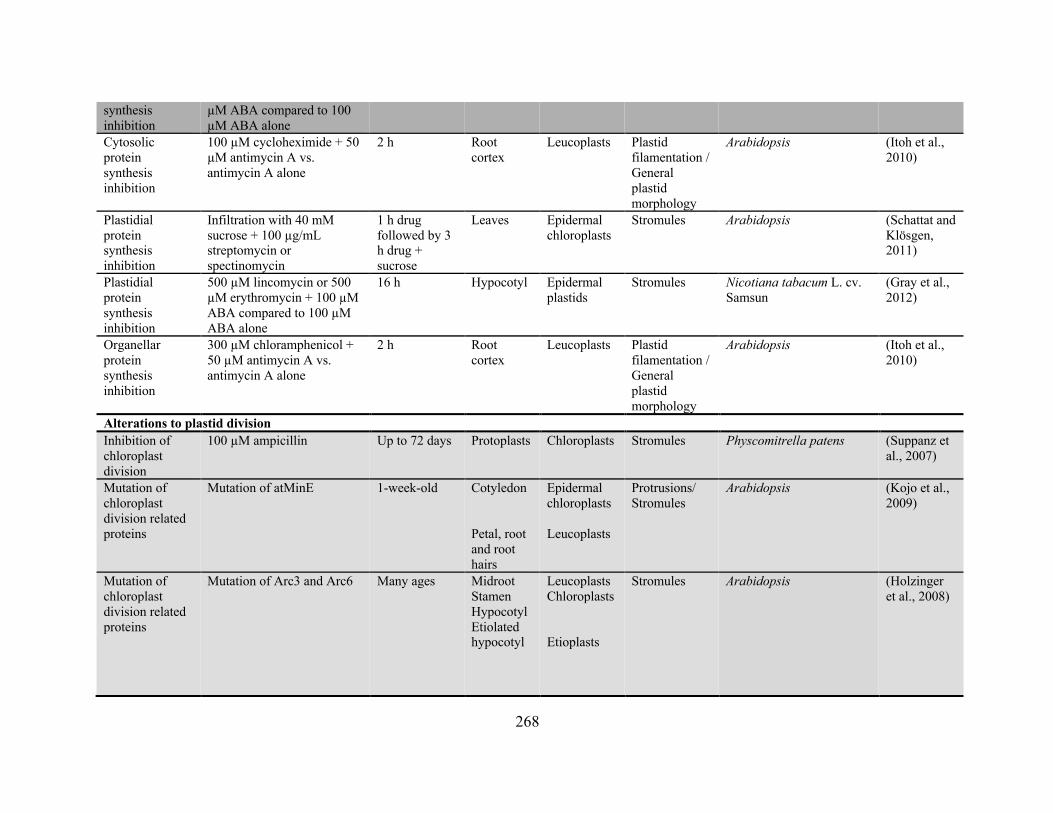
268
synthesis inhibition
µM ABA compared to 100 µM ABA alone
Cytosolic protein synthesis inhibition
100 µM cycloheximide + 50 µM antimycin A vs. antimycin A alone
2 h Root cortex
Leucoplasts Plastid filamentation / General plastid morphology
Arabidopsis (Itoh et al., 2010)
Plastidial protein synthesis inhibition
Infiltration with 40 mM sucrose + 100 µg/mL streptomycin or spectinomycin
1 h drug followed by 3 h drug + sucrose
Leaves Epidermal chloroplasts
Stromules Arabidopsis (Schattat and Klösgen, 2011)
Plastidial protein synthesis inhibition
500 µM lincomycin or 500 µM erythromycin + 100 µM ABA compared to 100 µM ABA alone
16 h Hypocotyl Epidermal plastids
Stromules Nicotiana tabacum L. cv. Samsun
(Gray et al., 2012)
Organellar protein synthesis inhibition
300 µM chloramphenicol + 50 µM antimycin A vs. antimycin A alone
2 h Root cortex
Leucoplasts Plastid filamentation / General plastid morphology
Arabidopsis (Itoh et al., 2010)
Alterations to plastid division Inhibition of chloroplast division
100 µM ampicillin Up to 72 days Protoplasts Chloroplasts Stromules Physcomitrella patens (Suppanz et al., 2007)
Mutation of chloroplast division related proteins
Mutation of atMinE 1-week-old Cotyledon Petal, root and root hairs
Epidermal chloroplasts Leucoplasts
Protrusions/ Stromules
Arabidopsis (Kojo et al., 2009)
Mutation of chloroplast division related proteins
Mutation of Arc3 and Arc6 Many ages Midroot Stamen Hypocotyl Etiolated hypocotyl
Leucoplasts Chloroplasts Etioplasts
Stromules Arabidopsis (Holzinger et al., 2008)
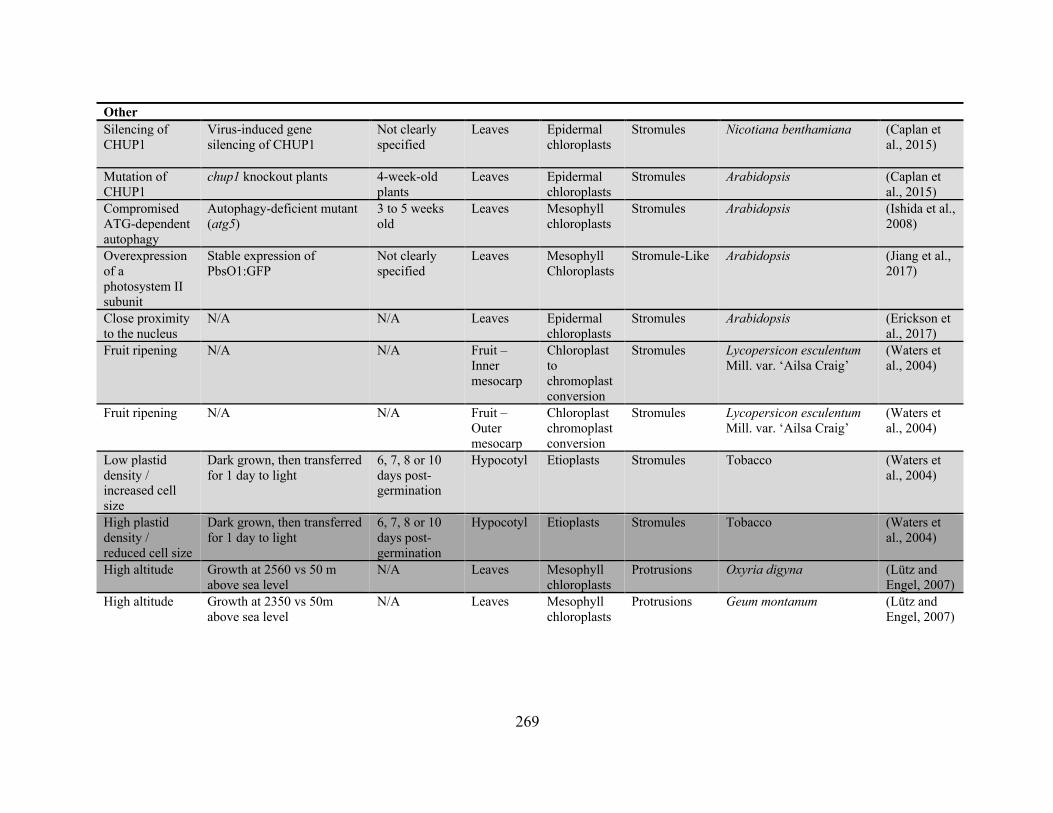
269
Other Silencing of CHUP1
Virus-induced gene silencing of CHUP1
Not clearly specified
Leaves Epidermal chloroplasts
Stromules Nicotiana benthamiana (Caplan et al., 2015)
Mutation of CHUP1
chup1 knockout plants 4-week-old plants
Leaves Epidermal chloroplasts
Stromules Arabidopsis (Caplan et al., 2015)
Compromised ATG-dependent autophagy
Autophagy-deficient mutant (atg5)
3 to 5 weeks old
Leaves Mesophyll chloroplasts
Stromules Arabidopsis (Ishida et al., 2008)
Overexpression of a photosystem II subunit
Stable expression of PbsO1:GFP
Not clearly specified
Leaves Mesophyll Chloroplasts
Stromule-Like Arabidopsis (Jiang et al., 2017)
Close proximity to the nucleus
N/A N/A Leaves Epidermal chloroplasts
Stromules Arabidopsis (Erickson et al., 2017)
Fruit ripening N/A N/A Fruit –Inner mesocarp
Chloroplast to chromoplast conversion
Stromules Lycopersicon esculentum Mill. var. ‘Ailsa Craig’
(Waters et al., 2004)
Fruit ripening N/A N/A Fruit – Outer mesocarp
Chloroplast chromoplast conversion
Stromules Lycopersicon esculentum Mill. var. ‘Ailsa Craig’
(Waters et al., 2004)
Low plastid density / increased cell size
Dark grown, then transferred for 1 day to light
6, 7, 8 or 10 days post-germination
Hypocotyl Etioplasts Stromules Tobacco (Waters et al., 2004)
High plastid density / reduced cell size
Dark grown, then transferred for 1 day to light
6, 7, 8 or 10 days post-germination
Hypocotyl Etioplasts Stromules Tobacco (Waters et al., 2004)
High altitude Growth at 2560 vs 50 m above sea level
N/A Leaves Mesophyll chloroplasts
Protrusions Oxyria digyna (Lütz and Engel, 2007)
High altitude Growth at 2350 vs 50m above sea level
N/A Leaves Mesophyll chloroplasts
Protrusions Geum montanum (Lütz and Engel, 2007)
Copyright © 2022 FDOKUMEN