UG ETD Template - University of Guelph Atrium
188
Exploring the Effects of Precision Livestock Farming Notification Mechanisms on Dairy Farmers by Muhammad Muhaiminul Islam A Thesis presented to The University of Guelph In partial fulfilment of requirements for the degree of Master of Science in Computer Science Guelph, Ontario, Canada © Muhammad Muhaiminul Islam, August 2020
-
Upload
khangminh22 -
Category
Documents
-
view
3 -
download
0
Transcript of UG ETD Template - University of Guelph Atrium
Exploring the Effects of Precision Livestock Farming
Notification Mechanisms on Dairy Farmers
by
Muhammad Muhaiminul Islam
A Thesis
presented to
The University of Guelph
In partial fulfilment of requirements
for the degree of
Master of Science
in
Computer Science
Guelph, Ontario, Canada
© Muhammad Muhaiminul Islam, August 2020
ABSTRACT
EXPLORING THE EFFECTS OF PRECISION LIVESTOCK FARMING
NOTIFICATION MECHANISMS ON DAIRY FARMERS
Muhammad Muhaiminul Islam
University of Guelph, 2020
Advisor:
Stacey D. Scott
Modern dairy farms are increasingly adopting technologies to monitor animal health and
welfare and send notifications to farmers when issues arise. These precision livestock
farming (PLF) technologies promise increased animal health and farm productivity. Yet,
few studies exist on the effects of these technologies on those who use them. Studies
from Europe show the 24/7 nature of potential PLF notifications can make farmers feel
always “on call”, increasing their overall stress levels. This thesis conducted an initial
online survey of 18 dairy farmers in Ontario, Canada, to explore their experiences with
PLF notifications. Reported benefits of PLF technologies include improved animal
health and dairy products, labour benefits, and ease of data collection. The study also
uncovered weaknesses of PLF notifications, including information uncertainty and
overload, false alerts, inappropriate timing, and mismatches between information
content and communication mediums used. Design recommendations are presented to
improve PLF notification mechanisms.

iii
DEDICATION
This work is dedicated to my parents and my only lovely sister – thank you for your
guide, love and support.

iv
ACKNOWLEDGEMENTS
My most profound gratitude goes to my supervisor, Dr. Stacey D. Scott, for her support,
care and direction throughout the research. I am grateful to you for all the open doors
that you have managed for me during this degree procedure, and I anticipate
proceeding to work together.
I am gigantically thankful to Dr. David Flatla for being my advisory committee member
and providing tremendous support during my research. I am also thankful to my thesis
examiner Dr. Daniel Gillis for providing thoughtful feedback on my thesis document. I
must also thank Dr. Tom Wright and Dr. Evan Fraser for their support during my
research.
I would also like to thank Makinde Ayoola for helping and providing useful suggestions
to me throughout my research and other daily life situations while I moved to Canada. I
would like to thank my parents for boosting me to concentrate on my study and my
lovely sister for mental support. My gratitude to my friends who always helped me to
keep myself mentally healthy and without them it was not possible for me to stay in
Canada alone.
This research would not have been conceivable without the cooperation of the Ontario
dairy farmers, retailers and everyone who helped me in my research, especially in
distributing my online survey. My participants managed time from their busy schedule to
fill my survey, and I am cordially thankful to them for that.
Finally, I want to show my gratitude to the University of Guelph and NSERC for
providing funds to conduct this research.

v
TABLE OF CONTENTS
Contents
Abstract ................................................................................................................................................................. ii
Dedication ............................................................................................................................................................ iii
Acknowledgements .............................................................................................................................................. iv
Table of Contents................................................................................................................................................... v
List of Tables ......................................................................................................................................................... ix
List of Figures ......................................................................................................................................................... x
List of Acronyms ................................................................................................................................................. xiii
List of Appendices ............................................................................................................................................... xiv
Introduction .................................................................................................................................... 1
2.1 Motivation ................................................................................................................................................ 4
2.2 Research Questions, Objectives and Scope ................................................................................................ 6
2.3 Thesis Outline ........................................................................................................................................... 8
Background ..................................................................................................................................... 9
3.1 Systematic Literature Search ..................................................................................................................... 9
3.1.1 Inclusion and Exclusion Criteria ...................................................................................................... 10
3.2 Overview of PLF Technology .................................................................................................................... 11
3.2.1 Impact of Automated Milking Systems ........................................................................................... 13
vi
3.2.2 Impact of Mastitis Detection Technologies ..................................................................................... 16
3.2.3 Impact of Lameness Detection Technologies .................................................................................. 18
3.2.4 Impact of Estrus Detection ............................................................................................................. 19
3.2.5 Impact of Calving Time Detection................................................................................................... 21
3.2.6 Effects of Activity Monitoring Technologies.................................................................................... 22
3.3 Are PLF Notifications a Source of Stress? ................................................................................................. 27
3.4 Information Overload.............................................................................................................................. 28
3.5 Technologies are not User-centric ........................................................................................................... 29
3.6 Importance of Proper Notification Management ..................................................................................... 29
3.7 Summary ................................................................................................................................................ 31
Research Methodology ................................................................................................................. 33
4.1 Regional Context..................................................................................................................................... 33
4.2 Study Methodology ................................................................................................................................. 36
4.2.1 Survey Design ................................................................................................................................ 36
4.2.2 Survey Procedure .......................................................................................................................... 38
4.2.3 Survey Distribution ........................................................................................................................ 39
4.3 Interview Design ..................................................................................................................................... 44
4.4 Survey Participants ................................................................................................................................. 44
4.5 Data Collection and Analysis ................................................................................................................... 47
4.6 Summary ................................................................................................................................................ 49
Results .......................................................................................................................................... 50
5.1 Participants Receiving Notifications from Specific PLF Technologies ......................................................... 50
5.2 Type of Information Received by the Farmers .......................................................................................... 53
5.3 Actions Taken by the Farmers ................................................................................................................. 56
5.4 Benefits of PLF Technologies ................................................................................................................... 58
5.5 Challenges of PLF Technologies ............................................................................................................... 60
vii
5.6 Number of Notifications .......................................................................................................................... 62
5.7 Perceived Stress Levels Related to PLF Notifications ................................................................................. 63
5.8 Notification Mediums ............................................................................................................................. 68
5.9 Overall Stress Related Effects of PLF Notifications.................................................................................... 72
5.10 Overall Positive and Negative Effects of PLF Notifications ................................................................... 73
5.11 Findings Related to ACTDS .................................................................................................................. 75
5.12 Chapter Summary .............................................................................................................................. 78
Discussion ..................................................................................................................................... 79
6.1 Information Management ....................................................................................................................... 79
6.1.1 Information Uncertainty ................................................................................................................ 80
6.1.2 Inappropriate Communication Timing ............................................................................................ 81
6.1.3 Communication Medium ............................................................................................................... 82
6.2 Ineffective Representation of Information ............................................................................................... 87
6.2.1 Notification Management .............................................................................................................. 87
6.2.2 Information Overload .................................................................................................................... 90
6.3 Effects of PLF Notifications on Farmers .................................................................................................... 92
6.3.1 Are Notifications a Source of Stress? .............................................................................................. 92
6.3.2 Strategies to Overcome Stress ....................................................................................................... 95
6.4 Discussion on Miscellaneous Findings ...................................................................................................... 96
6.5 Summary ................................................................................................................................................ 99
Conclusion .................................................................................................................................. 100
7.1 Scholarly Contributions ......................................................................................................................... 100
7.2 Limitations and Challenges ................................................................................................................... 106
7.3 Future Work ......................................................................................................................................... 108
7.4 Concluding Remarks.............................................................................................................................. 110

viii
References ......................................................................................................................................................... 111
Appendices ........................................................................................................................................................ 129
ix
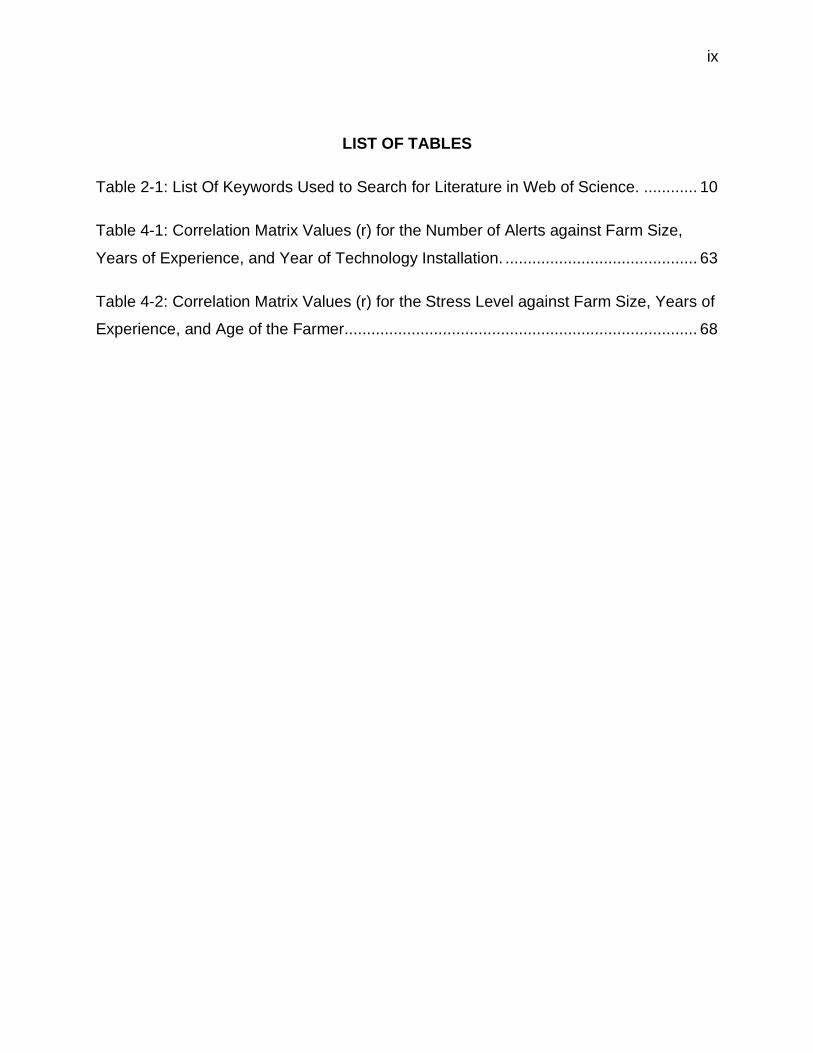
LIST OF TABLES
Table 2-1: List Of Keywords Used to Search for Literature in Web of Science. ............ 10
Table 4-1: Correlation Matrix Values (r) for the Number of Alerts against Farm Size,
Years of Experience, and Year of Technology Installation. ........................................... 63
Table 4-2: Correlation Matrix Values (r) for the Stress Level against Farm Size, Years of
Experience, and Age of the Farmer............................................................................... 68
x
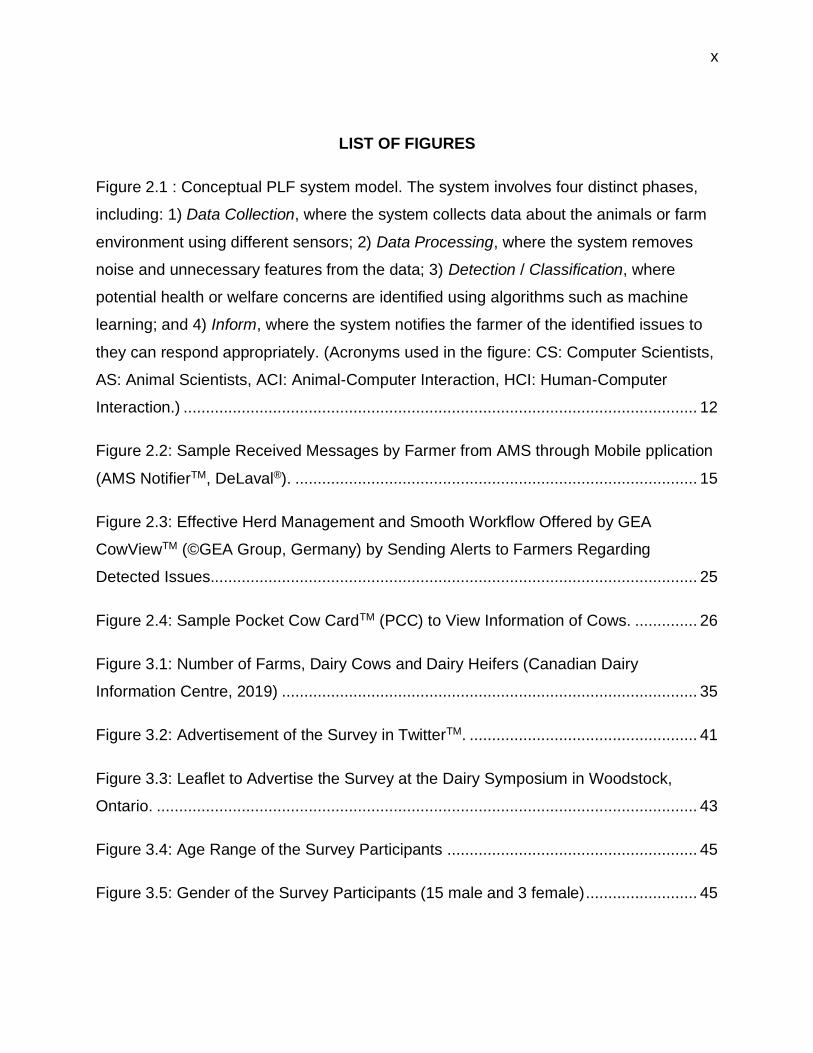
LIST OF FIGURES
Figure 2.1 : Conceptual PLF system model. The system involves four distinct phases,
including: 1) Data Collection, where the system collects data about the animals or farm
environment using different sensors; 2) Data Processing, where the system removes
noise and unnecessary features from the data; 3) Detection / Classification, where
potential health or welfare concerns are identified using algorithms such as machine
learning; and 4) Inform, where the system notifies the farmer of the identified issues to
they can respond appropriately. (Acronyms used in the figure: CS: Computer Scientists,
AS: Animal Scientists, ACI: Animal-Computer Interaction, HCI: Human-Computer
Interaction.) ................................................................................................................... 12
Figure 2.2: Sample Received Messages by Farmer from AMS through Mobile pplication
(AMS NotifierTM, DeLaval®). .......................................................................................... 15
Figure 2.3: Effective Herd Management and Smooth Workflow Offered by GEA
CowViewTM (©GEA Group, Germany) by Sending Alerts to Farmers Regarding
Detected Issues............................................................................................................. 25
Figure 2.4: Sample Pocket Cow CardTM (PCC) to View Information of Cows. .............. 26
Figure 3.1: Number of Farms, Dairy Cows and Dairy Heifers (Canadian Dairy
Information Centre, 2019) ............................................................................................. 35
Figure 3.2: Advertisement of the Survey in TwitterTM. ................................................... 41
Figure 3.3: Leaflet to Advertise the Survey at the Dairy Symposium in Woodstock,
Ontario. ......................................................................................................................... 43
Figure 3.4: Age Range of the Survey Participants ........................................................ 45
Figure 3.5: Gender of the Survey Participants (15 male and 3 female) ......................... 45

xi
Figure 3.6: Role of the Participants in the Farm ............................................................ 46
Figure 3.7: Years of Dairy Farming Experience of the Participants ............................... 47
Figure 4.1: Number of Participants Using the Technologies on Their Farms. ............... 51
Figure 4.2: Number of Participants Receive Notifications from the Technologies. ........ 52
Figure 4.3: Type of Information Received by AMS Users. ............................................. 54
Figure 4.4: Types of Information Received by AHDS Users. ......................................... 55
Figure 4.5: Information Received by the Farmers from AAMS. ..................................... 56
Figure 4.6: Actions Taken by Farmers After Getting Alerts from AMS. ......................... 57
Figure 4.7: Actions Taken by Farmers After Getting Alerts from AAMS. ....................... 58
Figure 4.8: Benefits of PLF Technologies. .................................................................... 59
Figure 4.9: Challenges of PLF Technologies. ............................................................... 60
Figure 4.10: Summary Statistics of the Responses Related to Stress before Receiving a
Notification. ................................................................................................................... 65
Figure 4.11: Stress Scale vs. Number of Response (knowing they might receive a
notification). ................................................................................................................... 65
Figure 4.12: Summary Statistics of the Responses Related to Stress after Receiving a
Notification. ................................................................................................................... 67
Figure 4.13: Stress Scale vs. Number of Response (after receiving a notification). ...... 67
Figure 4.14: Reported Communication Mediums Used by Different PLF Technologies.
...................................................................................................................................... 70
xii
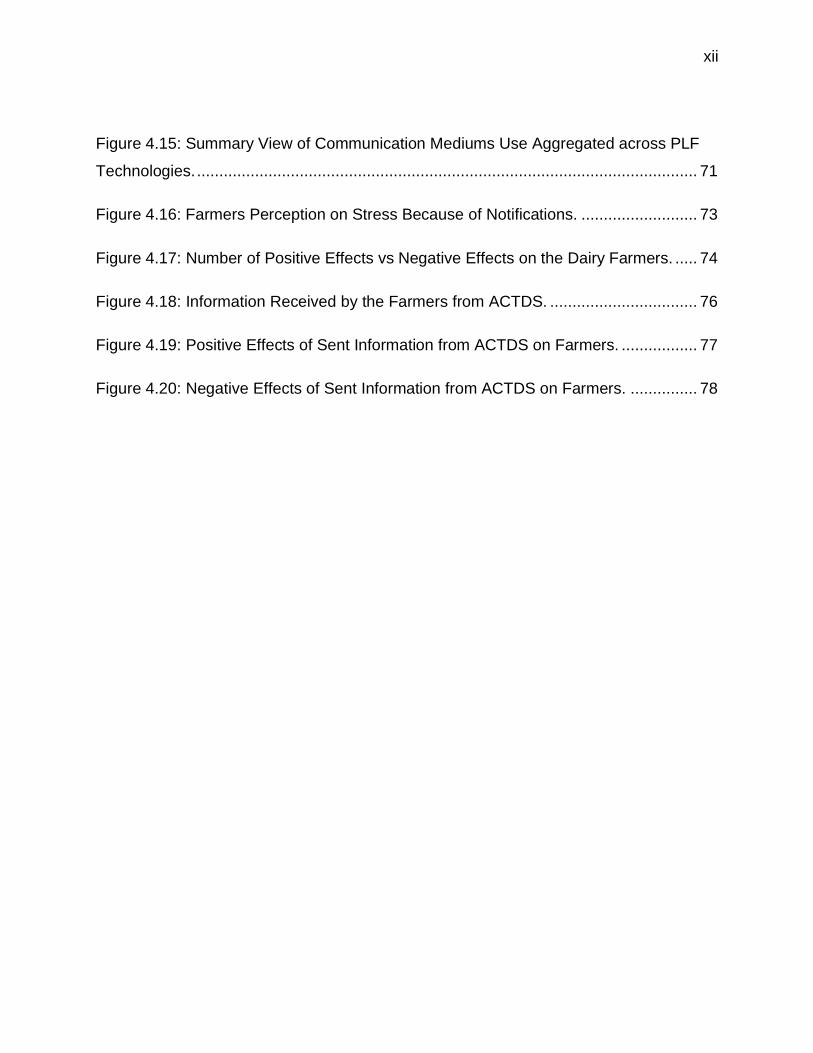
Figure 4.15: Summary View of Communication Mediums Use Aggregated across PLF
Technologies. ................................................................................................................ 71
Figure 4.16: Farmers Perception on Stress Because of Notifications. .......................... 73
Figure 4.17: Number of Positive Effects vs Negative Effects on the Dairy Farmers. ..... 74
Figure 4.18: Information Received by the Farmers from ACTDS. ................................. 76
Figure 4.19: Positive Effects of Sent Information from ACTDS on Farmers. ................. 77
Figure 4.20: Negative Effects of Sent Information from ACTDS on Farmers. ............... 78
xiii
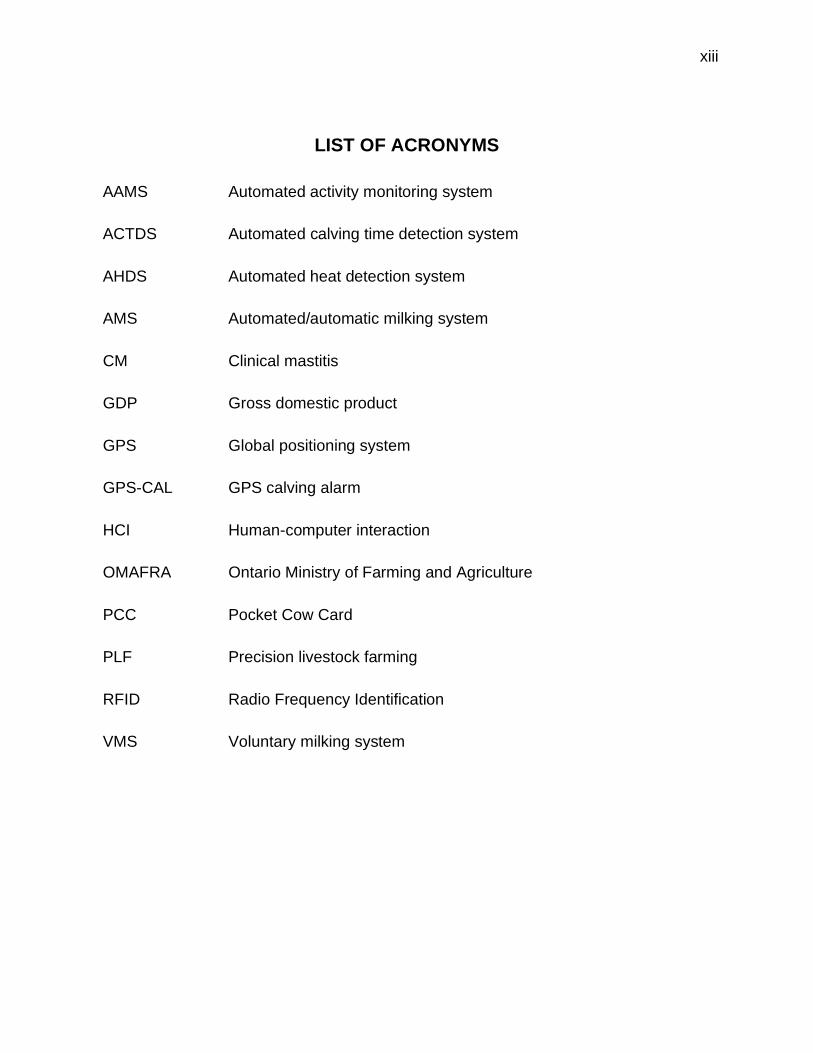
LIST OF ACRONYMS
AAMS Automated activity monitoring system
ACTDS Automated calving time detection system
AHDS Automated heat detection system
AMS Automated/automatic milking system
CM Clinical mastitis
GDP Gross domestic product
GPS Global positioning system
GPS-CAL GPS calving alarm
HCI Human-computer interaction
OMAFRA Ontario Ministry of Farming and Agriculture
PCC Pocket Cow Card
PLF Precision livestock farming
RFID Radio Frequency Identification
VMS Voluntary milking system
xiv
LIST OF APPENDICES
APPENDIX A: Survey Questions and Responses…………………………………… 129
APPENDIX B: Research Ethics Approval for the Study…….…………..…………… 166
APPENDIX C: Email and Verbal Recruitment Script………………….……………… 167
APPENDIX D: Letter of Information and Consent Form………..……….…………… 168
APPENDIX E: Sample Python Code to Calculate Correlation Matrix ……………… 171
APPENDIX F: Interview Questions ………………………………..……….…………… 174
1
Introduction
There is a universal trend towards streamlining and enhancing farming practices in both
livestock and crop farming by utilizing various state-of-the-art technologies to automate
different farm processes. This modern style of farming is commonly called precision
agriculture (Bongiovanni & Lowenberg-Deboer, 2004) and precision livestock farming
(PLF) (Berckmans, 2014), referring to crop and livestock farming respectively. PLF
involves the integration of software and hardware technologies that offer easier animal
farm management by monitoring individual animals 24/7 on farms (Wathes et al., 2008).
PLF technologies aim to improve the health and welfare issues of animals by reporting
abnormal issues of any animal to farm staff when any abnormality arises so they can
take appropriate actions based on the reported issue (Berckmans, 2014). Thus, farmers
can manage larger herds with reduced physical workload and labour costs and,
consequently, helping to meet the global demand of increasing herd sizes to feed
increasing world populations (Rutten et al., 2013).
PLF technologies use sensors to monitor animal behaviours and the state of the farm
environment, process the information using algorithms, and generate reports or send
alerts to the farm staff if necessary (Halachmi et al., 2019). However, in order for PLF
technologies to be effective, they must transform the raw data they collect into
meaningful information that is communicated to farmers in a form and manner that can
be utilized effectively in their decision-making processes related to farm operations or
animal care (Halachmi et al., 2019). Information from PLF technologies are often
2
automatically sent to farm staff in the form of notifications or alerts through various
communication mediums (e.g., automated phone call, text message, dashboard
application software) to make staff aware of new or ongoing animal or farm environment
situations.
Prior research from Europe has shown that such automated communications can be a
source of stress and can increase the mental workload for farm staff if the
communications are not designed or managed effectively (Désire C & Hostiou, 2015;
Hansen, 2015). Ndour et al.’s (2017) recent review of advanced dairy farm technologies
concluded that “mental workload (stress) can sometimes be increased [when PLF are
used] due to the complexity of the information involved in managing the multiple alarms
or alerts and equipment failures…if the tools are not adapted to farmers’ needs and
skills, PLF can also lead to negative impacts on farmers and animals.” (p. 273).
To date, no studies have investigated whether automated communications from PLF
technologies can be a source of stress for dairy farmers in Canada. As farming cultures,
practices, and technologies often differ from region to region, it is unclear whether the
existing European studies generalize to Canadian dairy farmers. Thus, this research
focuses on investigating the notification mechanisms of dairy PLF technologies being
used in the Canada to understand the effects of these mechanisms on Canadian dairy
farmers. As various terms can be used by PLF technology manufacturers, and within
the farming industry, for information automatically sent from PLF technologies to
farmers, such as alerts, alarms, warnings, messages, and communications, throughout
the thesis any of these different types of automated communications will be referred to
as notifications, alerts, or communications, interchangeably.
The first step of the research involved a systematic literature review of current
notification mechanisms of dairy PLF technologies to understand the current state-of-
the-art and to help inform the survey design. The next step of the research involved
conducting an online survey with dairy farmers in the local farming region from Ontario,
3
Canada. The originally planned survey data collection, and follow-up interviews, were
cut short due to disruptions in participant recruitment channels due to the COVID-19
pandemic, which forced university research disruptions as well as agri-food related
disruptions in Canada beginning in March 2020. More details about this disruption are
provided in Chapter 3. Due to this disruption, this thesis reports on the data that was
collected before the project shutdown, and due to the limited scope of data collection, is
considered a pilot study for the originally intended larger study. Despite its limited
scope, it still provides some interesting insights on the effect of the notification
mechanisms used in existing dairy PLF technologies, as well on dairy PLF technologies
in general, on the surveyed Ontario farmers.
The systematic literature review found that dairy PLF technologies communicate with
farmers through various mediums such as text messaging, phone calls, emails, and
dashboards in computer applications provided with the installed technologies. The
online survey revealed that the existing communication mechanisms between dairy PLF
technologies and farmers are not perceived as a significant source of stress. Instead,
those technologies were generally reported to make the farmers’ lives less stressful and
provide positive labour-related benefits (reduce labour costs, improve appeal of farm
work, reduce difficulty of farm work). However, the survey also revealed that those
technologies can still sometimes be a source of stress or anxiety for dairy farmers due
to the timing and medium of communication, false alarms, missed alerts, unclear
messages and actions, and unnecessary communications. The pilot data provide some
initial insights into areas for design improvements and directions for future work to better
understand how to meet the informational needs of Ontario dairy farmers. This chapter
provides more details on the motivation for this thesis research, the specific research
question, objectives, and scope of the research, and finally the organization of the
research.
4
1.1 Motivation
Due to expected world population growth that may surpass 9 billion by 2050, experts
estimate that food production will need to be increased by 70 percent to meet the food
demand of future populations (Godfray et al., 2010). Increased competition from global
sourcing of the food supply, rising global demand for food products, and consumer
demand for safe and healthy food products are among many factors driving the
adoption of advanced technologies on Canadian farms (Hendrawan, 2005). PLF is a
rapidly growing research field and industrial sector focused on creating new innovative
technologies to enhance the animal farming (or livestock farming) industry (Banhazi et
al., 2012). The objective of PLF is to evolve technologies for farmers, their animals, and
farms to ameliorate animal health and welfare issues, and improve interaction between
animals and their caretakers using various integrated software and hardware state-of-
the-art technologies (Banhazi et al., 2012). Sensor-based systems in PLF can measure
physiological or behavioural states in animals, interpret detected changes in an animal,
give advice to farmers about the status of an animal’s health and welfare based on
available sensor data and other sources of available data, and, in some cases, can
automatically make decisions on behalf of the farmer (Zafar et al., 2014). As a result,
PLF technologies can reduce labour cost by reducing physical labour (Ndour et al.,
2017; Steeneveld & Hogeveen, 2015). However, recent research has shown that the
adoption of PLF technologies is not yet sufficient to increase food production globally
(Duncan, 2018).
PLF technologies are operated, used, and accessed by the farmers, but farmers’ voices
are seldom heard when those technologies are designed and developed (Hartung et al.,
2017). Recent research shows that current PLF research tends to be technology-centric
instead of being client or farmer-centric (Jago et al., 2013). This issue may create a
barrier for adoption of PLF technologies, if farmers perceive that the technologies do not
meet their needs. Technologies that are not as effective or usable as they could be may
5
also limit the gross profit from farms (Duncan, 2018; Mancini, 2017). Evidence is
emerging from the PLF literature that many PLF innovations are difficult to use and
learn. For instance, a review of livestock farm environment controlling systems (e.g.,
heat and moisture controlling systems) found that managers of these systems were
unable to fully utilize the system due to the complexity of the user interfaces of the
systems and information overload from the systems (Laberge & Rousseau, 2017). This
usability issue made it difficult for farmers to identify what information was most relevant
for their decision making (Laberge & Rousseau, 2017).
A study of PLF deployment in seven dairy farms across Europe found that the farmers
did not mind receiving important and urgent messages about the health and welfare
issues of an animal in real-time, but they found it very frustrating when a system sent a
notification to them about insignificant issues at awkward times, such as the middle of
the night (Hartung et al., 2017). A review on prioritizing alarms found that PLF systems
sometimes generate a high number of false alarms, which can affect farmers’ adoption,
use, and trust in PLF technologies (Dominiak & Kristensen, 2017). Therefore,
notifications management is an essential usability issue that has been identified.
Many PLF articles mention collecting data regarding animal health and welfare issues,
processing those data, and then sending the data to the farmers in the form of
notifications to assist farmers in their decision making (Jago et al., 2013; Rutten et al.,
2013; Wolfert et al., 2017). However, few papers mention specifically how those
notifications were sent to the farmers (Calcante et al., 2014; Hansen, 2015).
Motivated by the recent research that indicated the potential for negative impacts on
farmers, and the lack of details in the literature about how PLF technologies
communicate information to farmers, this thesis aims to better understand what types of
notification mechanisms are being used in current dairy PLF systems. For instance, how
do dairy farmers receive information from the PLF technologies, and what opportunities
6
exist to improve the usability and utility of PLF notification mechanisms using a human-
centered (or farmer-centered) design approach?
1.2 Research Questions, Objectives and Scope
The underlying goal of this research is to shed light on the notification mechanisms of
precision dairy farming technologies that send information about the animals they
monitor to farmers regarding the ongoing situation of the animals on their farms from a
human-centered design perspective using methodologies from the field of human-
computer interaction (HCI). This research aims to understand how to develop more
usable, and effective dairy farming technologies for farmers in terms of their
informational needs. The research also explores how PLF notifications affect dairy
farmers by investigating automated communications to farmers, the communication
mediums used for notifications, the frequency of the automated communications, and
whether any stressful situations arise for farmers due to these notifications.
The results of this research may help precision dairy technology researchers and
practitioners consider more user-centric designs that better meet farmers’ informational
needs and fit into their farming practices and culture. Moreover, it may identify new
opportunities for PLF researchers to improve precision dairy technologies.
To achieve these goals, my specific research question is: “What effects do current
notification mechanisms from dairy precision livestock farming technologies
have on dairy farmers?”
To address the research question, the following research objectives were identified:
1) To understand the current knowledge base regarding PLF notifications in dairy
and other livestock farming, their usability, and known effects on farming
practices by conducting a systematic literature review. The reviewed papers were
7
analyzed from the perspective of understanding the HCI issues of the existing
PLF notification mechanisms.
2) To understand what notification mechanisms are used by PLF technologies
currently deployed on dairy farms in Canada, including what communication
mediums are used for notifications, what informational content is contained in
notifications, what actions farmers perform based on received notifications, and
what are the perceived benefits and limitations are, including stress-related
effects, of current notification mechanisms. This objective was addressed by
conducting an online survey study of dairy farmers in Canada.
3) To identify opportunities to improve the design of notification mechanisms for
precision dairy technologies. This objective was addressed by including relevant
probes in the online survey study, reflecting on patterns revealed by the survey
study data that suggested design flaws, and incorporating research and design
concepts from the broader technology and HCI literature that provide relevant
design alternatives.
The outcomes of this research will shed light on the effect of current automated
notification mechanism on dairy farmers and provide insights on improving future
notification mechanisms for precision dairy farming technologies.
To scope this thesis research, the online survey targeted Ontario farmers as a pilot
study representing Canadian dairy farmers because Ontario farmers represent a
significant portion of the Canadian dairy industry. A recent farm census survey found
that about 320,400 dairy cows are managed on Ontario farms, which is about 32% of all
dairy cows in Canada (968,700) as of 1st July 20191. Surveying farmers in my local
province also allowed me to utilize distribution channels through the University of
1 https://www.dairyinfo.gc.ca/eng/dairy-statistics-and-market-information/farm-statistics/farms-dairy-cows-and-
dairy-heifers/?id=1502467423238
8
Guelph’s agricultural and dairy alumni and strong dairy livestock connections, and local
connections to the Ontario Ministry of Farming and Agriculture (OMAFRA). Finally,
recent research found that there has been a widespread adoption of precision farming
technologies in the Ontario dairy industry (Duncan, 2018). For example, the adoption of
Automatic Milking Robots has skyrocketed by 400% within the last three years. Thus, it
was reasonable to expect that there would be eligible farmers available locally to
participate in the survey who had experience with PLF technologies and with managing
communications from automated notification systems.
1.3 Thesis Outline
This thesis comprises six chapters, including this one. The remaining chapters are
structured as follows. Chapter two briefly overviews the literature on precision dairy
farming technologies and prior studies on their effects on farmers. Chapter three
presents the study methodology, including the survey design, survey distribution
process, description of the participants and data analysis techniques. Chapter four
presents the findings from study objectives perspective. The survey data were analyzed
using Qualtrics®, and correlation analysis was done using Python programming (Python
2 library named ‘pandas’). Chapter four includes results related to the understanding of
current automated notification mechanisms, benefits and challenges of automated
communications and effects of automated communications on the farmers. Chapter five
discusses the findings based on the research question of this study. It reflects on the
research question related to the understanding of current notification mechanisms,
information-sending approaches used in existing technologies, benefits and limitations
of notifications and their information content for the farmers, and farmers’ suggestions
for improving current PLF notification mechanisms. In Chapter six, the scholarly
contributions of the thesis are summarized, the limitations of the work are discussed,
along with the research challenges that were encountered, and recommendations are
made for future work.
9
Background
To provide context for this research and understand the current state-of-the-art in the
notification mechanisms used in PLF dairy systems and their effects on farmers, a
systematic literature review was conducted. This review is focused on understanding
the available technologies in the literature and those commercially available that present
information to the farmers. It also aims to uncover any known effects on farmers and
farm operations from the information presented and the mechanisms used to present
that information. This chapter discusses the gaps in the community’s knowledge of
these issues, and how this thesis research contributes to fulfilling these research gaps.
2.1 Systematic Literature Search
A systematic literature review was conducted in July 2019 and utilized the Web of
Science2 database. The specific search terms that were used are depicted in Table 2-1.
The following query in Web of Science by combining two groups of keywords was used
to retrieve literatures.
Query: TS= (dairy farm OR dairy) AND TS= (notification OR alert OR alarm OR warning
OR inform farmer OR message farmer OR precision livestock farming OR precision
dairy farming OR precision dairy technology OR precision dairy technologies)
This query in the Web of Science yielded 876 publications.
2 webofknowledge.com
10
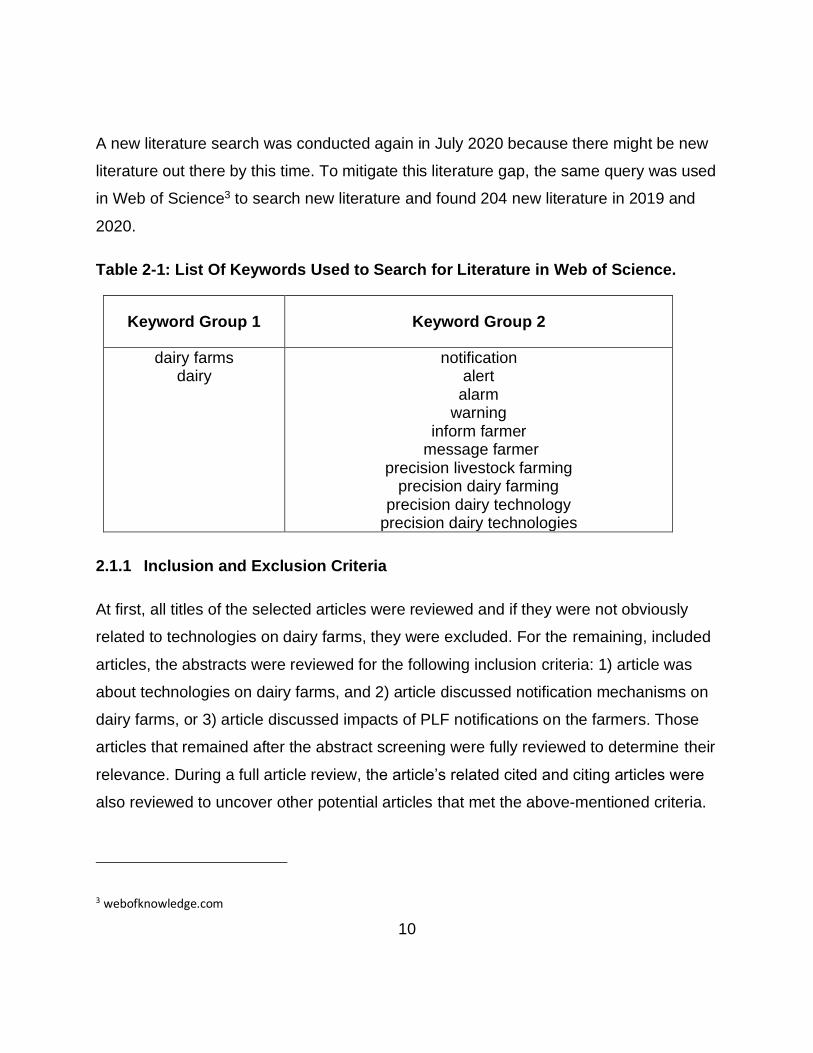
A new literature search was conducted again in July 2020 because there might be new
literature out there by this time. To mitigate this literature gap, the same query was used
in Web of Science3 to search new literature and found 204 new literature in 2019 and
2020.
Table 2-1: List Of Keywords Used to Search for Literature in Web of Science.
Keyword Group 1 Keyword Group 2
dairy farms dairy
notification alert
alarm warning
inform farmer message farmer
precision livestock farming precision dairy farming
precision dairy technology precision dairy technologies
2.1.1 Inclusion and Exclusion Criteria
At first, all titles of the selected articles were reviewed and if they were not obviously
related to technologies on dairy farms, they were excluded. For the remaining, included
articles, the abstracts were reviewed for the following inclusion criteria: 1) article was
about technologies on dairy farms, and 2) article discussed notification mechanisms on
dairy farms, or 3) article discussed impacts of PLF notifications on the farmers. Those
articles that remained after the abstract screening were fully reviewed to determine their
relevance. During a full article review, the article’s related cited and citing articles were
also reviewed to uncover other potential articles that met the above-mentioned criteria.
3 webofknowledge.com
11
After this snowballing process, a total of 48 papers were selected to include in the final
review.
The same procedure was applied for screening the papers found in the literature
search conducted in July 2020. After the title review, 35 papers were selected. While
reviewing the abstracts, some papers were excluded which were already included in the
earlier literature search because there was some overlap. After the abstract review, 15
papers remained. Those articles that remained after the abstract screening were fully
reviewed to determine their relevance and 9 papers remained. For the 9 final selected
papers, those papers that were cited in the selected papers were also checked for
inclusion while going through the articles, resulting in an additional 6 papers added to
the final set. Finally, 15 articles were selected to include in the second review.
2.2 Overview of PLF Technology
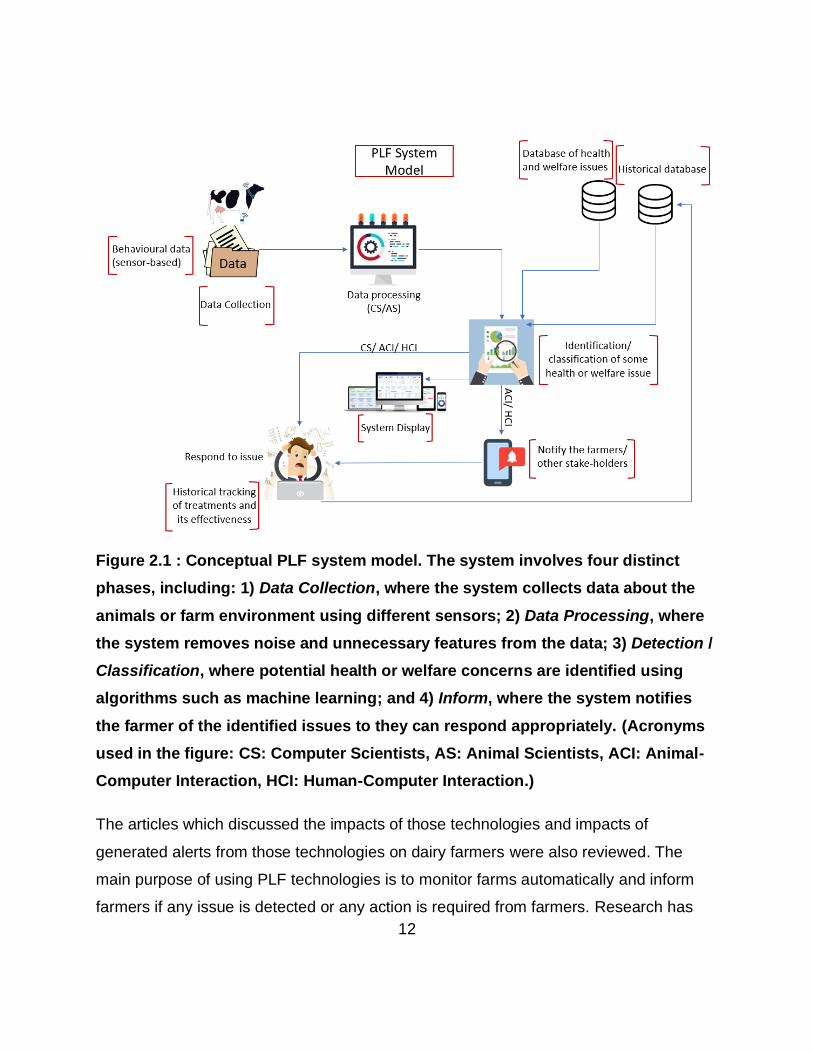
Figure 2.1 shows a conceptual diagram for PLF systems. There are four stages in PLF
systems, including Data Collection using different type of sensors, Data Processing to
remove noise and unnecessary features from data, Detection or classification of some
potential health or welfare concern using algorithms such as machine learning
algorithms, and Inform the farmer in some way such as through phone calls, text
messaging, emails and generating reports. Several technologies and techniques have
been used so far for data collection, data processing, abnormality detection and
informing farmers (Cabrera et al., 2020; Eckelkamp, 2019; Ferris et al., 2020; Newton et
al., 2020). As this research focused on the “Inform” stage of the PLF cycle, the reviewed
articles focus on the technologies and techniques involved in this stage.
12
Figure 2.1 : Conceptual PLF system model. The system involves four distinct
phases, including: 1) Data Collection, where the system collects data about the
animals or farm environment using different sensors; 2) Data Processing, where
the system removes noise and unnecessary features from the data; 3) Detection /
Classification, where potential health or welfare concerns are identified using
algorithms such as machine learning; and 4) Inform, where the system notifies
the farmer of the identified issues to they can respond appropriately. (Acronyms
used in the figure: CS: Computer Scientists, AS: Animal Scientists, ACI: Animal-
Computer Interaction, HCI: Human-Computer Interaction.)
The articles which discussed the impacts of those technologies and impacts of
generated alerts from those technologies on dairy farmers were also reviewed. The
main purpose of using PLF technologies is to monitor farms automatically and inform
farmers if any issue is detected or any action is required from farmers. Research has
13
shown that PLF technologies reduced farmers’ workload (Allain et al., 2016; Ndour et
al., 2017). However, research has also shown that farmers can feel stressed and
overwhelmed because of false and unnecessary notifications received from these
technologies (Dominiak & Kristensen, 2017; Hansen, 2015; Schewe & Stuart, 2015). If
the usability of PLF notification mechanisms are not studied, PLF technologies may be
the source of increased mental workload despite of decreased physical workload. The
following section discusses some PLF technologies and their impacts. An overview is
given for each technology, and its data collection techniques, notification mechanisms, if
known, and any known effects of its notifications are discussed.
2.2.1 Impact of Automated Milking Systems
Automated Milking Systems (AMSs) are used to automatically milk cows on a farm (Tse
et al., 2017). An AMS can recognize an individual cow using the cow’s radio frequency
identification (RFID) tag (attached to their ear) and then use a robotic arm to
automatically affix to the cow’s udders and complete the milking process. By
recognizing each individual cow registered with the system, the AMS can determine if it
is the ideal time to milk that individual cow, or whether it is too early for further milking
(typically cows are milked twice, or during certain phases of pregnancy, three times a
day). While the cow is being milked at the AMS, the AMS dispenses high quality feed to
improve the cow’s experience at the AMS.
An AMS has various sensors which are integrated with the milk collection container and
robotic arm to guarantee quality milk since it will spontaneously check the udder and
milk contents to find irregularities inside the milk while milking and after every session of
milking (Tse et al., 2017). AMSs also can detect certain health issues based on a
content analysis of the milk, including the color of milk, amount of milk, milk fat, milk
protein, and presence or number of certain biologicals in the milk (King & DeVries,
2018). AMS can ensure a safe amount of milk yield so that milk production is
14
maximized, and so the cow is also in good health (King & DeVries, 2018; Tse et al.,
2017). Vital attributes of AMS are to collect data, interpret those data, generate reports
to assist farm management, and create alerts for detected health issues to send to farm
staff (King & DeVries, 2018).
Research has shown that the information can sometimes be overwhelming for farm staff
because AMSs can produce unnecessary alerts (false positives) or sometimes the AMS
detection methods are not sufficient to generate a notification when necessary (false
negatives) (King & DeVries, 2018). A study of AMS systems in Norway found that
farmers adopt AMS to reduce workload and maximize flexibility (Hansen, 2015). The
study also found that farmers also receive a large amount of information about every
cow, and this can be overwhelming for farmers. Moreover, the study found that the
information provided by AMSs were difficult for farmers to use for farm decision-making
and farm operations. In terms of notification mechanisms, the study found AMS
notifications were sent through phone calls. In the initial stages of AMS adoption,
farmers reported feeling stressed because of unnecessary alerts, but with the time
farmers learned how to respond effectively after getting a notification (Hansen, 2015).
Another source of stress found in the study was the feeling farmers had that they were
always on duty because they could receive a notification from their systems at any time,
day or night (Hansen, 2015).
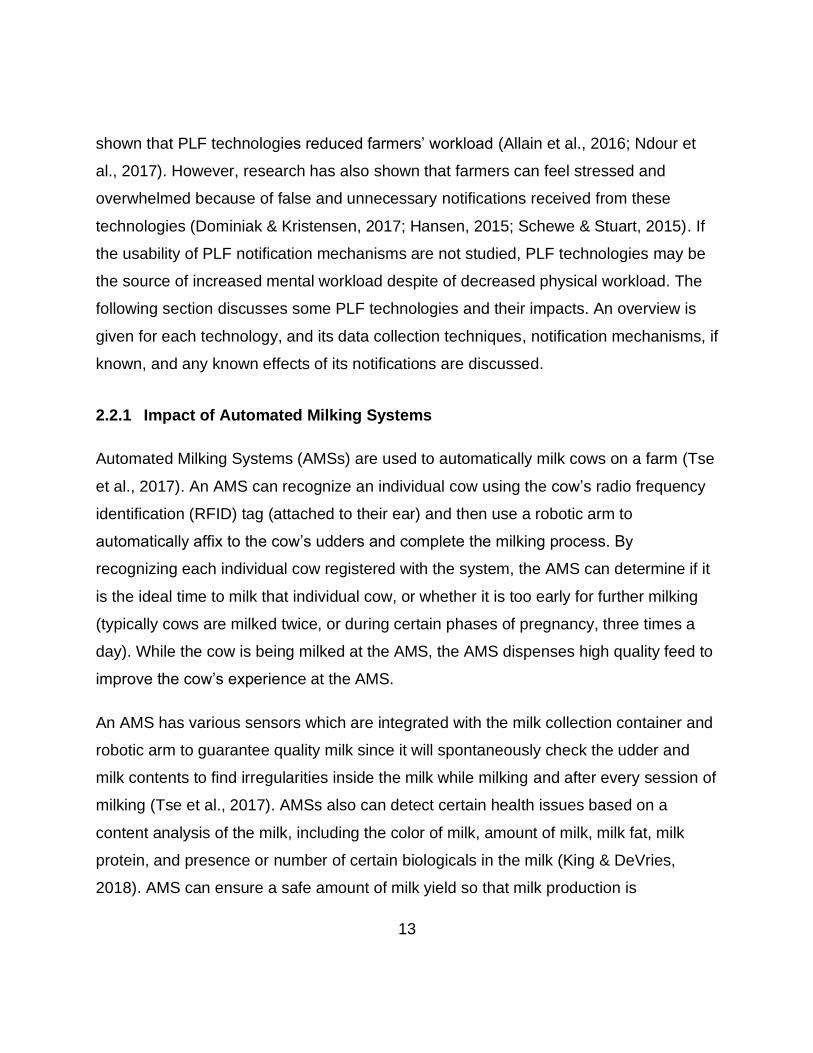
Sending notifications to farmers 24/7 is a very common feature of an AMS. The
commercial AMS sold by DeLaval® (DeLaval VMS™4) has an affiliated mobile software
application for smartphones and tablets, called AMS NotifierTM5, which interfaces with
4 DeLaval®uses the term “voluntary” milking system, ; DeLaval VMSTM product site: https://www.delaval.com/en-
us/our-solutions/milking/vms-series/
5 DeLaval VMSTM app site on Google PlayTM store:
https://play.google.com/store/apps/details?id=com.delaval.ams.notifier&hl=en_CA
15
the AMS to receive its notifications. In the application dashboard, a user can see all the
notifications received in the past (see Figure 2.2). By selecting a specific alert, a user
can check more details about the alert. A user can deactivate notifications for a certain
period whenever they do not want to receive alerts, (e.g., overnight, 11:00 pm - 5:00
am). However, if there is an emergency the user will still receive notifications of high
priority during this deactivation period.
Figure 2.2: Sample Received Messages by Farmer from AMS through Mobile
pplication (AMS NotifierTM, DeLaval®)6.
The Herd Navigator™ (©Lattec I⁄S, Hillerød, Denmark) is used to measure milk
progesterone which can be combined with DeLaval®’s AMS to monitor milk quality
more precisely (M. Saint-Dizier & Chastant-Maillard, 2012). Another commercial dairy
6 App site on Google PlayTM store:
https://play.google.com/store/apps/details?id=com.delaval.ams.notifier&hl=en_CA
16
supplier, Lely®, also has a mobile software application affiliated with its AMS, called Lely
T4C InHerdTM – Cow7, that receives notifications from Lely® AMSs and allows farmers
to check information of individual cows and perform necessary actions.
2.2.2 Impact of Mastitis Detection Technologies
Inflammation of the mammary gland in the cow’s breast or udder, usually because of
bacterial infection, is known as mastitis (Harmon, 1994). Mastitis is a noteworthy
disease that has vital effects economically on dairy farms (Hogeveen et al., 2011;
Nielsen et al., 2010). Mastitis can be the cause of diminished milk quality, reduced milk
production, increased death rates, and increased veterinary or treatment costs (Nielsen
et al., 2010). Discovering mastitis early can lower treatment cost and protect udder
health (Colak et al., 2008; Polat et al., 2010).
Several techniques have been proposed for automatic detection of mastitis. A study by
Khatun et al. (2018) of automatic clinical mastitis (CM) detection used electronic data
(e.g., electrical conductivity, milk yield, milk flowrate, occurrence of incompletely milked)
from AMS support software (DeLaval DelPro™8) to develop a statistical (logistic
regression) model for CM detection. Their model achieved 91% specificity and 90%
accuracy in generating CM notifications.
Kim et al. (2019) used artificial intelligence, specifically, deep learning, algorithms to
analyze data collected from ingestible bio-sensors to detect potential cases of mastitis.
7 Lely’s In-HerdTM-Cow App site on Google PlayTM store:
https://play.google.com/store/apps/details?id=nl.lely.mobile.infocard; Lely’s In-HerdTM application product site:
https://www.lely.com/us/solutions/lely-t4c/lely-t4c-inherd/
8 DeLaval®’s product site: https://www.delaval.com/en-ca/our-solutions/farm-management/delaval-delpro-
applications/

17
Once detected, a notification was sent to farmers through a mobile application that also
allowed farmers to check the cow’s body temperature in real-time upon receiving an
alert. Their system analyzed patterns in a cow’s body temperature to help detect
mastitis and to rule out other possible causes of temperature increases, such as eating,
estrus, or injury. In their study, which monitored 50 cows over six months in Korea, their
system automatically detected 14 of the 15 actual cases and successfully distinguished
between temperature increases due to mastitis and other causes.
Recent research proposed a technology model called ‘The Dairy Brain’ for mastitis
detection, similar to generalized PLF technology model proposed in Figure 2.1, in which
real time data of each individual cow is collected, analyzed using algorithms,
abnormalities are detected through decision tools, and farmers are notified about
mastitis if detected (Cabrera et al., 2020; Ferris et al., 2020). Upon receiving a mastitis
alert from any PLF technology, farmers monitor the cow’s health and welfare condition
in person (Steeneveld & Hogeveen, 2015) and call a veterinarian for thorough checkup
and proper treatment, if necessary. When a cow is under treatment, rumen temperature
and real-time temperature are continuously measured to observe the recovery of the
cow (Kim et al., 2019).
Sometimes mastitis detection systems generate false alerts and the alert timing is not
convenient for farmers. A study by Mollenhorst et al. (2012) that investigated farmer’s
preferences of mastitis detection systems design features found that farmers’ desire
fewer false alerts, alerts that will be delivered at appropriate times, and alerts that focus
on critical cases. It is irritating for farmers to receive false alerts from a system and it
may create negative impressions of the technologies. The timing of the first alert is
crucial for farmers because after receiving the alert farmers will start observing the cow
closely. Therefore, system should send alerts at an appropriate time based on the
urgency level. If an alert needs immediate action it should be sent immediately
regardless what is the time at that moment. The system should detect any abnormality

18
at early stage and send alerts to the farmers at appropriate times, so they have enough
time for treatment before the disease becoming severe (Mollenhorst et al., 2012).
2.2.3 Impact of Lameness Detection Technologies
Being “lame” refers to an animal being unable to walk without difficulty due to an injury
or illness affecting the leg or foot (Oxford English Dictionary online9). Lameness in a
cow is a common indicator of a wide variety of health disorders and can cause
economic losses for the farm (Kossaibati & Esslemont, 1997). Lameness is believed to
be the third most costly disease of dairy cows after mastitis and reduced fertility (Enting
et al., 1997). Therefore, detecting lameness at early stage is cost effective for the
farmers (Enting et al., 1997). Cattle behaviour, such as lying time and frequency,
feeding time, motion score based on overall movement of a cow, number of steps, and
standing time and frequency, can be used to detect lameness of a cow because a lame
cow will eat less, stand less and lay more (de Mol et al., 2013).
Several techniques have been used to automatically detect lameness, such as image
processing and infrared thermography, accelerometer sensors embedded in a wearable
collar or leg band, ground-based pressure or weight-based systems, feeding behaviour,
grooming behaviour, AMSs and milk production (Alsaaod et al., 2019). A recent study in
Brazil found that precipitation impacted normal lying behaviour, decreasing lying times,
and, thus, this factor should be considered in analysis of lying behaviour when studying
lameness (Thompson et al., 2019). Automatic detection of abnormal locomotion
behaviour (gait and posture) has also been used to detect lame cows (Van Nuffel et al.,
2015). A recent study by Taneja et al. (2020) in Ireland showed that a system collect
accelerometric data and use machine learning, data analysis tools, and cloud
9 https://www.lexico.com/en/definition/lame
19
computing to detect lameness. The system could detect lameness three days before it
could be visually noticeable to the farmers with 87% accuracy.
When lameness is detected in a cow, the farmer is informed through lameness alert
reporting about the specific cow on the specific day (de Mol et al., 2013). Taneja et al.’s
(2020) system integrated a mobile application through which farmers receive
notifications whenever a lame cow is detected. Lameness alerts can be translated into
user friendly reports and whenever farmers receive alerts regarding a cow, the cow is
observed in person to validate the automatic lameness detection (Alsaaod et al., 2019).
After validation, farmers check the cow and do the locomotion scoring (a scoring system
to rate the severity of injury) to update the locomotion score of the detected lame cow
(de Mol et al., 2013). Based on identification provided by the automatic detection
system, farmers can treat the cow, if needed (Alsaaod et al., 2019).
2.2.4 Impact of Estrus Detection
Dairy farms rely on the breeding cycle of cows for their milk production (De Vries, 2006).
According to Dairy Farmers of Ontario, a cow produces milk for about ten months after
giving birth to a calf, and then will stop producing milk for about two months in
preparation for the birth of her next calf (Farm and Food Care Ontario, 2012). A cow’s
gestation period is nine months. If a cow does not become pregnant again within the
first month or two after giving birth to a calf, then there may be a longer “dry” period
before the next calf is born and the cow can rejoin the milking herd (Farm and Food
Care Ontario, 2012). Thus, accurately detecting when a cow is in estrus (or in heat) and
is sexually receptive for breeding is an essential part of dairy farm operations (Fodor &
Ózsvári, 2019). Breeding on Canadian dairy farms is primarily done via artificial
insemination for simplicity and safety (for both farmers and the animals) (Farm and
Food Care Ontario, 2012).
20
Behavioural changes, such as increased excitability, aggression, or mounting other
cattle can happen during sexual receptivity (Reith & Hoy, 2018). Sexual receptivity can
last for 2h to 48h depending of the breed, and estrus can be detected by identifying
those behavioural changes with different intensity (Orihuela, 2000). Several techniques
are used to detect those behavioural changes. Example commercial technologies used
to detect estrus include:
• pedometers attached to the leg to monitor activity, such as Pedo-Plus (Afimilk®,
Israel) (Galon, 2010) and CowScoutTM Leg10 (©GEA Group, Germany),
• ingestible electronic “pills” called boluses that detects metabolic changes in the
cow’s gut, such as DVM Bolus (©DVM Systems, USA) (Dolecheck et al., 2015),
• collar-based multi-sensor (including accelerometer) systems that monitor
behaviour, such as Heatime® HR™ Tag (©SCR, Israel) (Dolecheck et al.,
2015), and
• accelerometer-based systems mounted to a cow’s ear RFID tag (Mayo et al.,
2019), such as CowManager®11 (Wisconsin, USA).
A study in Israel used accelerometers to detect estrus event of a cow (Valenza et al.,
2012). Alerts are generated from these technologies when estrus is detected and when
the system determines a cow should be inseminated. Moreover, some technologies
generate reports based on data analysis and later, those reports, and alerts are used to
observe a cow for insemination (Mayo et al., 2019).
A study by Talukder et al. (2015) comparing different estrus detection approaches (body
temperature detected by infrared thermography or accelerometer and acoustic sensing
10 https://www.gea.com/en/products/milking-farming-barn/dairymilk-milking-cluster/cow-sensor/activity-
detection-cowscout.jsp
11 https://www.cowmanager.com/en-us/Solution/Modules#fertility
21
(via a collar)) in a pasture context reported that alerts would be generated when estrus
was detected but the paper did not discuss how those alerts would be sent and who
would receive them. A study by Mayo et al. (2019), mentioned that all estrus detecting
technologies report data at specified times each day (twice in a day, every 2 hours,
every one hour, every 15 minutes, every 5 minutes) but how the data were reported was
not detailed.
2.2.5 Impact of Calving Time Detection
Calving time is the time when a cow gives birth to a calf. Detecting calving accurately is
very important for farmers to ensure the health and welfare of the mother cows and
newly born calves because crucial situations such as difficulties giving birth and death
of a calf can be experienced during calving time (Mee, 2004). It is even more important
to know the exact calving time and location of a cow when the cows are outdoor
(Calcante et al., 2014). There will be economic loss if a cow is not properly taken care
during calving because health hazards might occur to the newly born calf or mother cow
(Inchaisri et al., 2010). Some changes occur before calving such as hormonal changes,
relaxation of pelvic ligaments, tail relaxation, changes in the udder, decrease in body
temperature, vaginal temperature changes and other vaginal changes, lying time,
number of steps, feeding and rumination behaviour changes (Marie Saint-Dizier &
Chastant-Maillard, 2015).
Several commercial technologies are now available to detect approaching calving time,
including intra-vaginal thermometer, inclinometers and accelerometers to detect
behavioural changes, and abdominal belt to detect uterine contractions (Marie Saint-
Dizier & Chastant-Maillard, 2015). Similar to estrus detection technologies, when any
sign of calving is detected, the technologies send an alert to the farmers through text
messaging and/or phone call about the imminent calving (Marie Saint-Dizier &
Chastant-Maillard, 2015).
22
Recent research used the Afimilk Silent Herdsman® collar (now called AfiCollar®12) and
eating time and tail-mounted AxivityTM13 accelerometers to detect calving time (Miller et
al., 2020). They used a combination of sensors to collect rumination and eating time
data and tail raise events, and then used machine learning to identify calving events. A
study by Zehner et al. (2019) analyzed rumination time and jaw movement using a
Naïve Bayes classifier to detect calving time 1 hour prior to the actual calving time.
Vel’PhoneTM14 is commercial product from Denmark that uses a vaginal sensor to
remotely send a cow’s vaginal temperature to alert a farmer when it predicts calving is
going to start (Rutten et al., 2013). GPS calving alarm (GPS-CAL) was introduced by
Calcante et al. (2014) for detecting calving time outdoors. This device can identify the
exact calving time and inform farmers through SMS (text messaging). The message
contains the event hour and date, animal ID, and location of the animal. The farmer can
import the GPS location into a common map application on a mobile phone to get visual
instructions to help reach the cow quickly and then the farmer can take necessary
action(s) after reaching the cow (Calcante et al., 2014).
2.2.6 Effects of Activity Monitoring Technologies
Many technologies and techniques have been used to monitor activities such as lying,
rumination and standing time, heat events, and calving time of dairy cows to detect
abnormal behaviour of a cow (Løvendahl & Chagunda, 2010; Müller & Schrader, 2003;
Stangaferro et al., 2016; Vázquez Diosdado et al., 2015). Abnormal activity or changes
in normal behaviour is an indication of disease or events, such as calving or estrus
(Müller & Schrader, 2003). Historically, physical observation or video recordings were
12 https://www.afimilk.com/cow-monitoring
13 https://axivity.com/
14 http://velphone.dk/

23
used to monitor dairy cows, (Müller & Schrader, 2003; Schwarz et al., 2002). For
instance, a system integrating camera and software was designed in France to record
movement and interaction of cows during day and night using infrared camera (M.
Saint-Dizier & Chastant-Maillard, 2012). Those technologies can be time consuming,
labour intensive, and error prone (Müller & Schrader, 2003; Schwarz et al., 2002).
Therefore, automatic activity monitoring can help monitor cows 24/7, with significantly
less labour.
VIEWER is a software technology integrated with a camera to graphically present
behavioural situation of cows (Schwarz et al., 2002). Müller and Schrader (2003) used
accelerometers attached to the hind legs of cows and video recording to monitor cattle
activity. López-Gatius et al. (2005) used a pedometer to detect walking activity of cows.
An increasing trend in activity monitoring is to use sophisticated algorithms, and
increasingly, artificial intelligence to analyze patterns in the movement data collected
from accelerometers, GPS, and other sensors. Løvendahl’s and Chagunda (2010) used
a thresholding approach to detect pregnancy and estrus based on activity collected from
a commercial neck-mounted activity monitoring collar. A training period was used to
determine appropriate thresholds. Martiskainen et al. (2009) developed a multi-class
support vector machine algorithm to detect several behaviours (standing, lying,
ruminating, feeding, normal and lame walking, lying down, and standing up) of dairy
cows from collar-mounted accelerometer data. Tri-axial accelerometer data has been
used in a decision tree algorithm to identify biologically important behaviours (standing,
feeding, lying) and transitions between activities (lying and standing) (Vázquez
Diosdado et al., 2015).
In a study by Gonzalez (2015), a decision tree algorithm was used to classify
behaviours such as foraging, ruminating, traveling, resting and other active behaviours.
They used data from collar-mounted motion and GPS sensors for classification of the
above-mentioned behaviours. Data was collected from the sensors with high frequency
24
to increase the accuracy of the analysis and help to detect frequent changes of
behaviour. The use of the neck collar, as opposed to a leg-mounted sensor, allowed
them to detect differences in the body and neck positions and detect activity more
accurately.
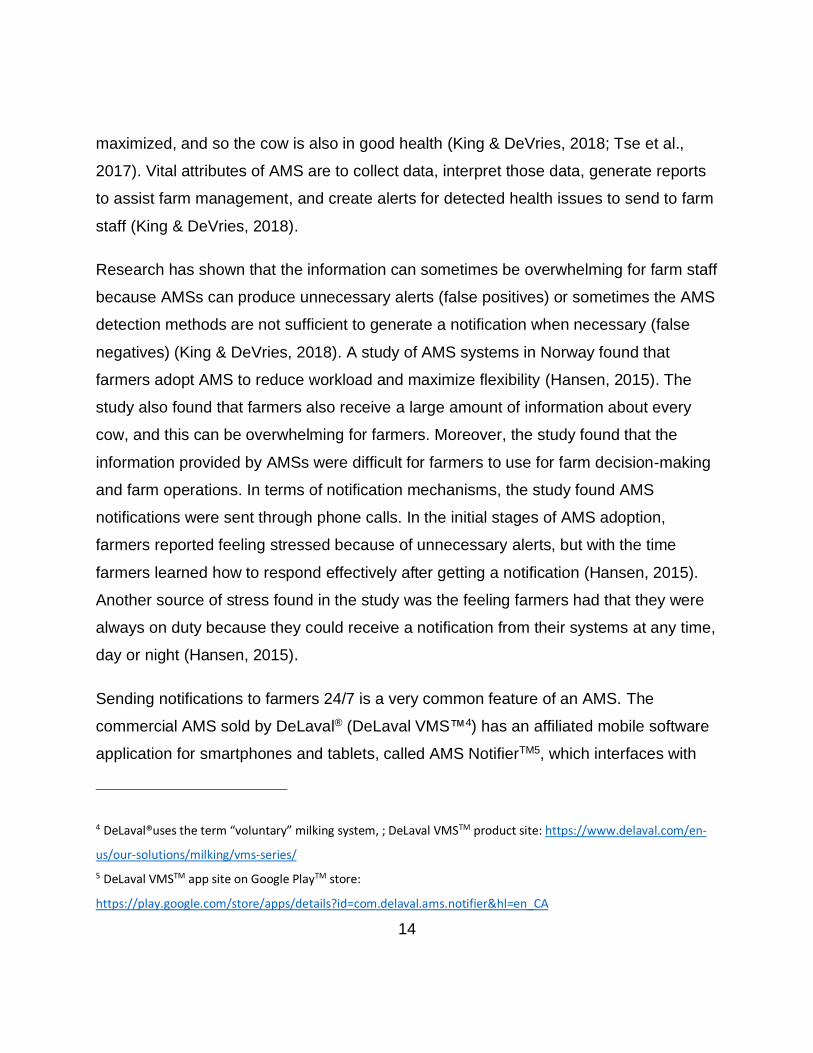
The CowViewTM system is a commercial collar-based activity monitoring system that
monitors cow activity and fertility (Hartung et al., 2017; Tullo et al., 2016). GEA
CowViewTM15 (©GEA Group, Germany) can be used to detect heat for insemination,
mange overall health issues, observe behaviours, and manage workflow. As shown in
Figure 2.3, this system is designed to be an all-in-one solution for easy management of
a dairy farm (Tullo et al., 2016). It can automatically show the zone-related position of
each cow in the barn using a virtual map of the barn and monitors the activity of each
cow via collar-mounted tags (Hartung et al., 2017; Tullo et al., 2016). It can detect
movement and resting patterns which allow farmers to identify the time for insemination
and detection of lameness (Hartung et al., 2017). Its real-time monitoring can detect
abnormal issues and notify farmers by sending notifications to their smart phones,
including the cow ID. The data collected by the GEA CowViewTM system can be
accessed through a mobile app or viewed on a computer desktop. The cow with
detected lameness or heat can be observed immediately or during next milking time for
validation of detected situation (Hartung et al., 2017).
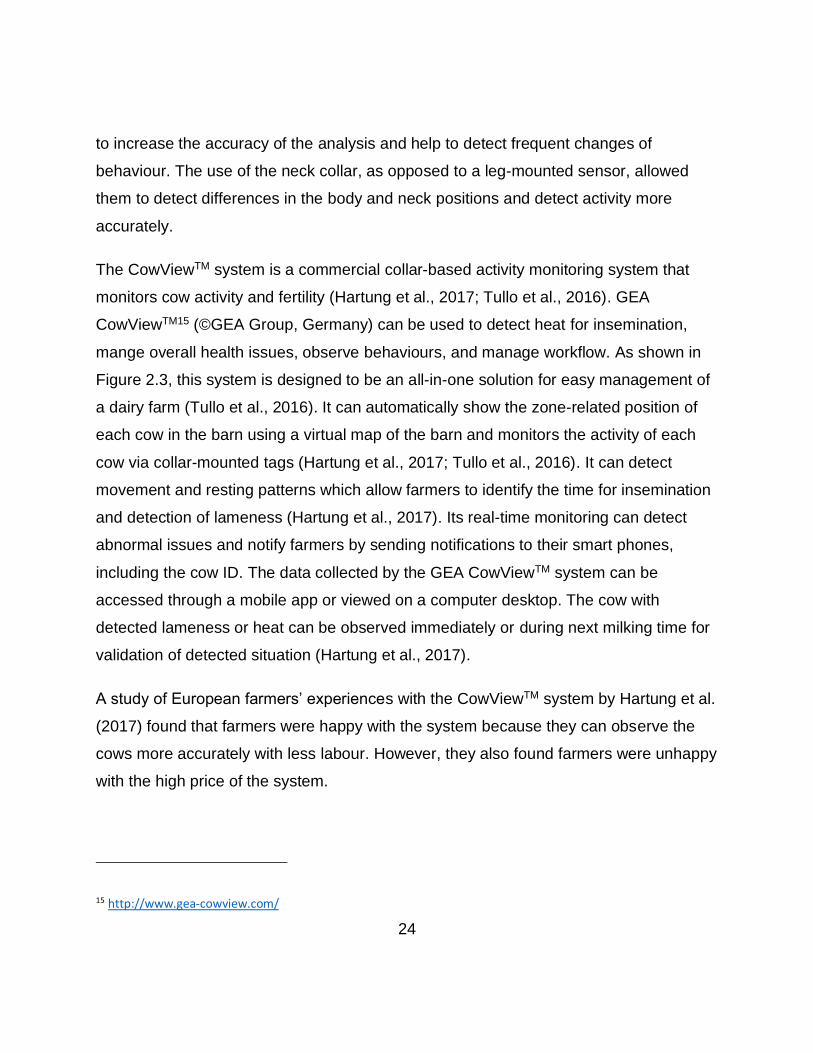
A study of European farmers’ experiences with the CowViewTM system by Hartung et al.
(2017) found that farmers were happy with the system because they can observe the
cows more accurately with less labour. However, they also found farmers were unhappy
with the high price of the system.
15 http://www.gea-cowview.com/
25
Figure 2.3: Effective Herd Management and Smooth Workflow Offered by GEA
CowViewTM (©GEA Group, Germany) by Sending Alerts to Farmers Regarding
Detected Issues16.
Dairycomp30517 (©Valley Agricultural Software, USA) is data management software
which is used in many farms to manage activities in the farms. As of 2012, this was the
most used data management software on dairy farms in the USA (Wenz & Giebel,
2012). The system can calculate a “cow value” that represents the value of a particular
cow in term of future profit versus being replaced by a heifer (Sorge et al., 2007). The
system calculate the “cow value” based on unusual activities such as lameness caused
by different kinds of diseases such as mastitis and metritis (Wenz & Giebel, 2012).
16 https://www.gea.com/en/binaries/DariyFarming_CowView_Brochure_EN_0315_tcm11-21890.pdf
17 http://www.vas.com/dairycomp.html
26
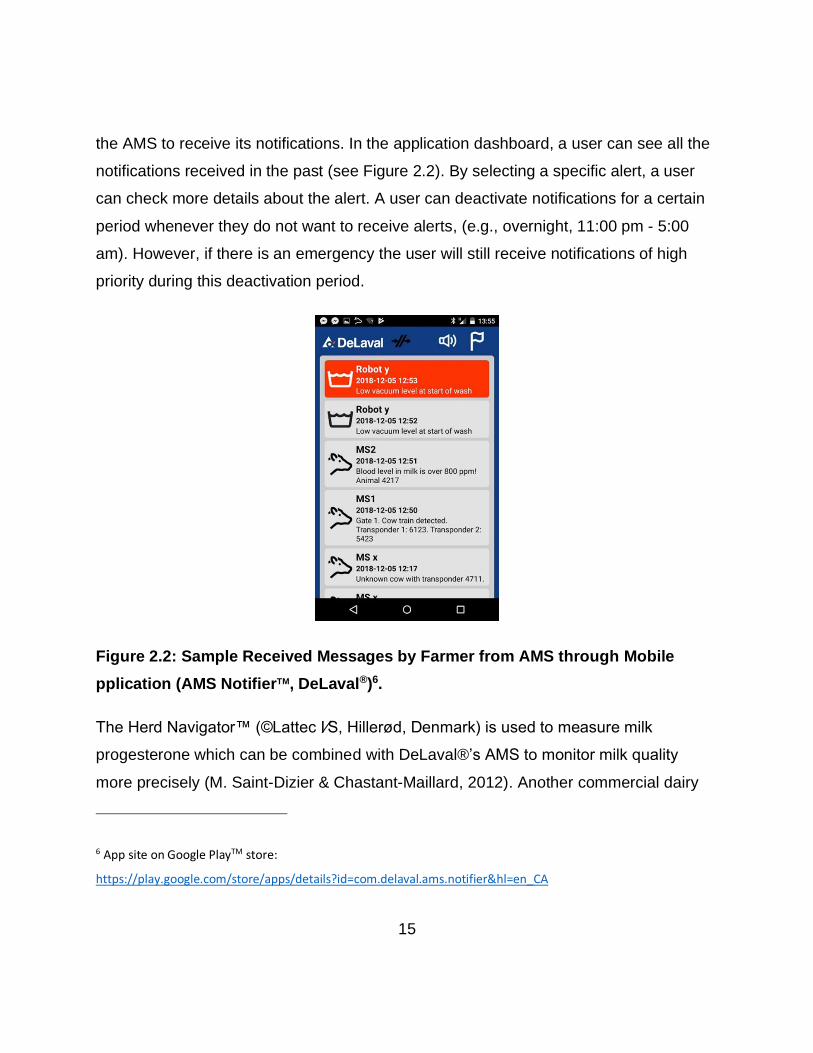
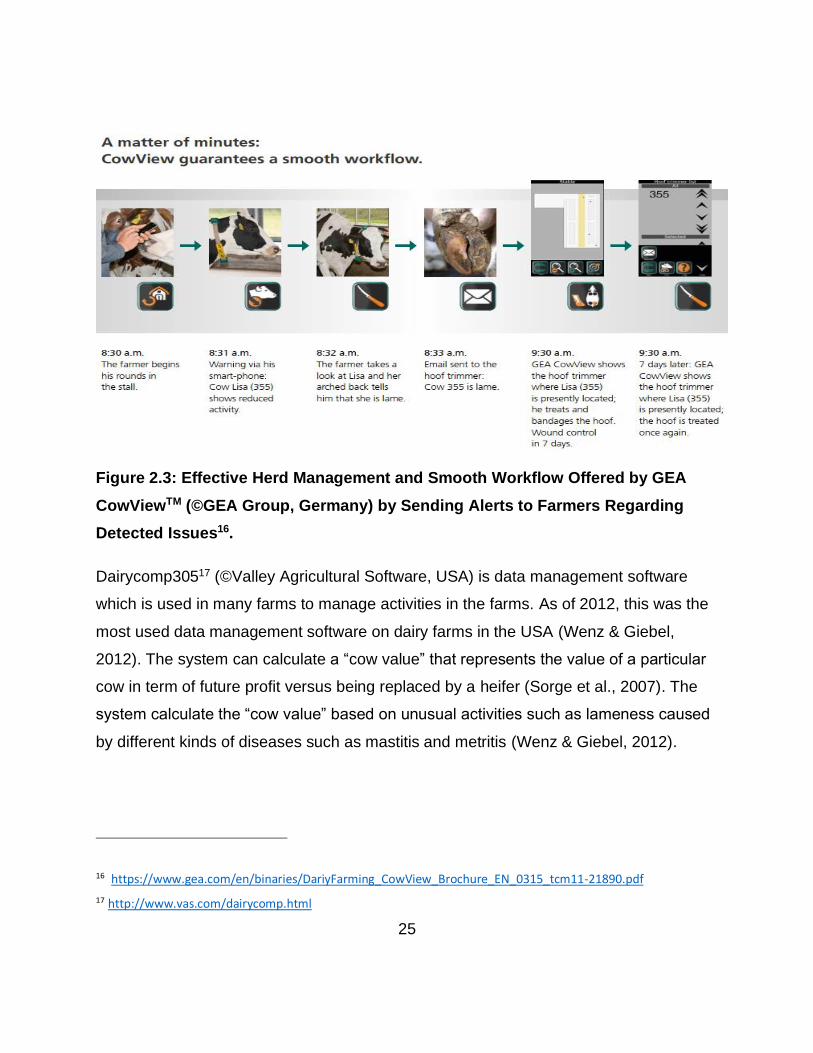
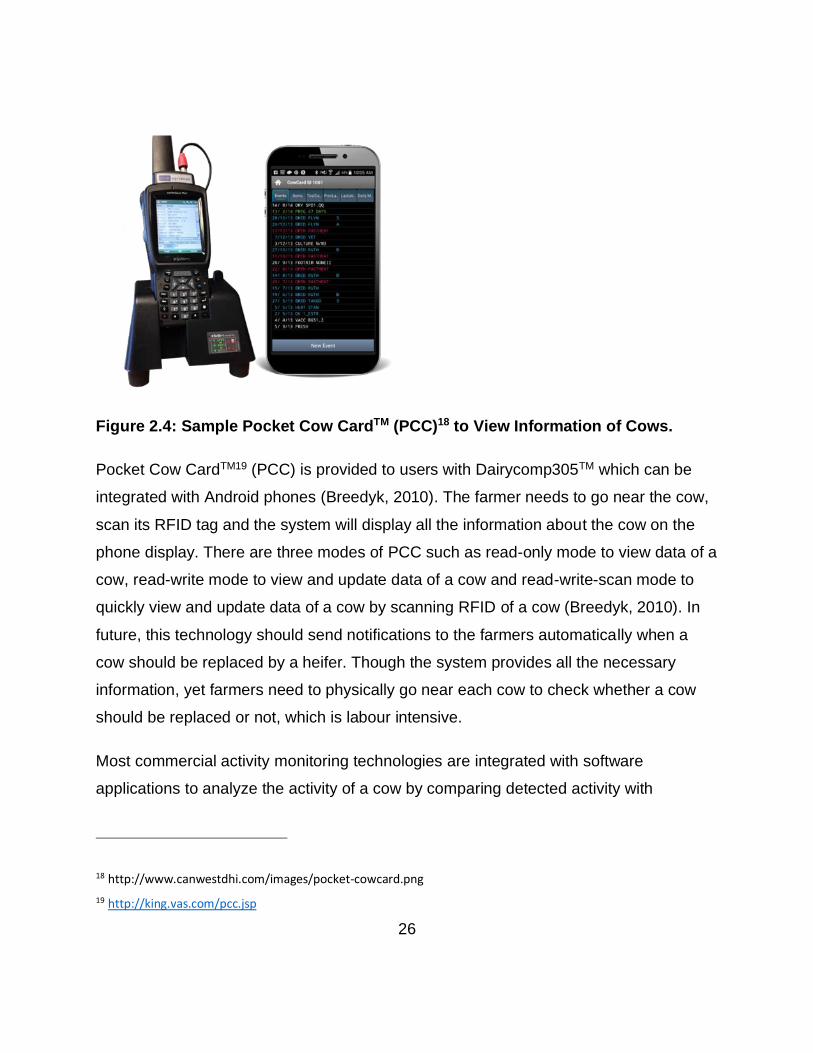
Figure 2.4: Sample Pocket Cow CardTM (PCC)18 to View Information of Cows.
Pocket Cow CardTM19 (PCC) is provided to users with Dairycomp305TM which can be
integrated with Android phones (Breedyk, 2010). The farmer needs to go near the cow,
scan its RFID tag and the system will display all the information about the cow on the
phone display. There are three modes of PCC such as read-only mode to view data of a
cow, read-write mode to view and update data of a cow and read-write-scan mode to
quickly view and update data of a cow by scanning RFID of a cow (Breedyk, 2010). In
future, this technology should send notifications to the farmers automatically when a
cow should be replaced by a heifer. Though the system provides all the necessary
information, yet farmers need to physically go near each cow to check whether a cow
should be replaced or not, which is labour intensive.
Most commercial activity monitoring technologies are integrated with software
applications to analyze the activity of a cow by comparing detected activity with
18 http://www.canwestdhi.com/images/pocket-cowcard.png
19 http://king.vas.com/pcc.jsp
27
expected activity of that cow (M. Saint-Dizier & Chastant-Maillard, 2012). Some
technologies trigger alerts if deviation in activity is detected for a cow. For example,
DairyPlanTM (©GEA Group, Germany) is a commercial technology to detect estrus
which send alerts when estrus is detected (Hockey et al., 2010). ThermobolusTM
(©Medria Solutions, France) and RadcoTM (©Verdor NV, Oelegem, Belgium) are
commercial technologies to monitor body temperature (M. Saint-Dizier & Chastant-
Maillard, 2012).
2.3 Are PLF Notifications a Source of Stress?
PLF technologies are used to reduce physical labour of farmers, yet at the same time,
alerts sent to farmers from PLF technologies can sometimes be a source of stress if the
alerts are not managed effectively (Ndour et al., 2017). Excessive and unnecessary
alerts can increase farmers’ mental workload (Hansen, 2015; Ndour et al., 2017).
Therefore, prioritizing alerts is necessary to make it easier for a farmer to know which
alerts require a response and how quickly they should respond (Hansen, 2015).
There are also situations where PLF technologies reduce farmer’s mental workload
because some health concerns that are not easily observable by the farmer can be
measured by the PLF technologies, such as vaginal temperature for artificial
insemination, body temperature, heart rate, and exact calving time (Allain et al., 2016).
Yet, even such useful notifications from PLF technologies may be stressful if not
received in an appropriate manner or at an appropriate time.
Thus, overall, information received from PLF technologies in the form of notifications
can sometimes be a source of stress for farmers if the notification mechanisms are not
well designed. This thesis looks at the experiences Ontario dairy farmers have with
existing on-farm notification mechanisms from PLF technologies, and the associated
level of stress, if any, farmers experience from these systems.
28
2.4 Information Overload
In general, the technologies mentioned above produce and accumulate a large quantity
of data, frequently for long intervals of time, and often in real-time (Schewe & Stuart,
2015). PLF researchers have started utilizing different big data processing methods for
analyzing various process-generated, machine-generated, and human-generated
assorted data associated with their farms (Wolfert et al., 2017). Notwithstanding, it may
be hard to use that information in decision-making due to disorderly and large amounts
of data. Research has shown that some technologies are complex for farmers to use
regularly as these technologies provide such large amounts of information without clear
recommended action (Borchers & Bewley, 2015; Russell & Bewley, 2013). Therefore,
that information cannot always be utilized in their decision-making processes (Schewe
& Stuart, 2015), which can negatively affect farmers’ view of PLF technologies
integration with their farms (Ndour et al., 2017).
Data presentation to users (farmers) is an important issue to keep in mind while
designing technology. Appropriate visualization techniques should be used to present
data to farmers so they can understand and interpret data easily to make effective
decisions for their farms and animals (Gutiérrez et al., 2019). A research group from the
University of Wisconsin-Madison proposed a system named ‘Dairy Brain’ which collects
data of cows from all perspectives, analyzes, and presents these data in a form that
farmers can use to make decisions (Cabrera et al., 2020). The core concept is to use
one technology to detect all animal and farm issues instead of a suite of specific
technologies designed a specific purpose to help reduce the complexity of farm
management (Cabrera et al., 2020). While developing PLF technologies in future,
experienced data science specialists should be hired to work on simple and appropriate
representation of data for decision making (Wolfert et al., 2017). The data displaying
and representing strategies can be evaluated by some data representation experts to
29
represent data in a more understandable way to farmers in future technologies (Russell
& Bewley, 2013).
2.5 Technologies are not User-centric
The PLF field is starting to observe and report that integration of these emerging
technologies on farms might be hampered by the absence of client-focused (ranchers
and animals) design since most PLF technology design is technology- and profit-driven
and not user-centric (Jago et al., 2013). Emerging research has discovered that some
PLF technologies provide restricted utility to farmers and the interface of some
technologies are largely dissimilar to the interfaces of other similar traditional
technologies (Jago et al., 2013). As a result, these technologies are not as beneficial to
farmers in their farm management decision-making as they were designed to be
(Laberge & Rousseau, 2017). Thus, standard guidelines must be set up to guide the
structure and incorporation of different PLF technologies for more effective decision-
making by farmers to ensure that PLF technologies provide the highest benefit to
farmers (Dudi, 2005). A PLF adoption study in Australia found that farmers believe that
involving them more directly in the design process of PLF innovations would help to
make PLF technologies easier to learn and use, and to better address their farm
operation needs (Jago et al., 2013).
2.6 Importance of Proper Notification Management
From an HCI perspective, it is very important to send notifications at an appropriate time
through an appropriate medium with relevant information (Mehrotra et al., 2015). A
person might receive many notifications from various sources such as text messaging,
social media, emails, and mobile applications (Pielot et al., 2014). Receiving excessive
notifications can reduce a person’s productivity and can impact negatively on
psychological well-being. For instance, notifications can cause inattention and
30
hyperactivity-symptoms related to Attention Deficit Hyperactivity Disorder (Kushlev et
al., 2016). In healthcare settings, excessive alerts from medical devices can cause
healthcare workers to disable, silence, or ignore device alerts due to “alert fatigue”,
leading to critical situation being missed (Graham & Cvach, 2010).
A notification has two sides, such as the useful information it provides to the users and
the interruption users experience in their ongoing tasks (Bailey et al., 2000; Czerwinski
et al., 2002; Kern & Schiele, 2003). Notification senders usually do not consider the
interruption that users might feel upon receiving the notification though those senders
have the intention to help users by providing information (Adamczyk & Bailey, 2004). A
user may receive a notification while doing an important or complex task that needs
intense user attention.
Sometimes notifications can have negative effects on the user’s emotional state (Bailey
et al., 2001; Zijlstra et al., 1999). Moreover, receiving an irrelevant or non-urgent
notification can distract the user from an important task and which might lead the user to
not do the task properly (Zijlstra et al., 1999). For instance, receiving a non-urgent
notification while doing a decision-making task can cause a person to make a poor
decision (McFarlane & Latorella, 2002; Speier et al., 2003).
Due to the fact that farmers often adopt different types of PLF technologies, they may
receive notifications from various sources, and receive these notifications while doing
other important work. Receiving an irrelevant notification or excessive notifications while
doing important tasks may reduce their overall productivity or work quality and may be
irritating for them as well. Therefore, notifications from PLF technologies should also be
effectively managed so the farmers receive only relevant notifications through
appropriate mediums at appropriate times.
Several techniques have been proposed in the HCI literature to help users manage
notifications sent from various sources. For instance, notifications can be classified
31
based on their level of importance. The timing a notification is sent can be decided
based on the importance of the notification (Dabbish & Baker, 2003). One project
developed a system named ‘Phylter’ which used physiological sensing to understand
the cognitive state of the user and decide whether to send a notification to the user at
that moment or not (Afergan et al., 2015). Another project developed a system named
‘Scope’ which displayed notifications to the user in different areas of a display, based on
the importance of a notification from various sources (Van Dantzich et al., 2002). The
more important a notification was the more towards center the notification would be
displayed. Different visual icons were used to highlight important part of a notification to
attract the user’s attention towards the important section of the notification.
Another approach is to allow users to modify the system settings to determine the timing
of receiving a specific notification (Kushlev et al., 2016). Kern and Schiele (2003)
proposed a system that decided whether or not a notification would be sent to the user
based on the importance of the notification, the activity of the user, the social activity of
the user (talking with someone), the social situation (in a bus), and location of the user.
They noted that only one factor alone might not be enough to make best decision, thus,
multiple factors could be used to make an appropriate decision.
The study conducted in this thesis found some of the challenges noted by prior
notification researchers, including sometimes excessive or irrelevant notifications sent
from PLF technologies, and notifications being sent at undesirable times. These findings
are discussed in Chapters 4 and 5.
2.7 Summary
From the above discussion, it can be summarized that an ideal PLF technology will
collect data, process the collected data, decide based on analysis using some decision
tools or algorithms, and notify farmers if necessary. This study focused on the last part
of PLF technologies which is notifying farmers. All the parts of PLF technologies are
32
equally important because without proper data collection and analysis, an effective
decision cannot be made. The notifications are also important because based on the
received notifications farmers decide what to do with their animals or farms. Therefore,
proper notification management is important in PLF technologies.
This chapter focused on PLF technologies in development and available commercially,
and when possible, discussed the notification mechanism of these technologies and
their known impacts. From the literature, it is found that technologies send notifications
to the farmers with useful information. However, it is also observed that the technologies
sometimes send false and excessive information. As a result, farmers can feel stressed
and inundated. Also, technologies send notifications through inappropriate mediums at
inappropriate time. Consequently, farmers might miss urgent alerts or be interrupted by
unnecessary notifications while doing an important task. Therefore, this research
investigated the current notification mechanism to understand the benefits and
challenges of it. The study also provided some strategies to overcome the challenges to
make PLF technologies more usable, effective, and less stressful.
33
Research Methodology
This chapter describes the methodology used in this research. The first section
describes the context of the province of Ontario as the target region for understanding
the effects of PLF notifications in the broader landscape of Canada. Then, the study
methodology is described, including the survey design, procedure, and distribution
techniques. The originally planned interview is also described. A summary of the survey
participants is provided, and the chapter finishes by describing the quantitative and
qualitative data analysis techniques used in the study.
3.1 Regional Context
Canadian dairy industries contribute around $18.9B annually to Canadian gross
domestic product (GDP) and $3.6B in taxes annually, and create roughly 215,000 full-
time job opportunities (Dairy Farmers of Canada, 2016)20. There were 10,371 dairy
farms in Canada and 968,700 dairy cows managed on those farms in 2019. The
provinces of Quebec and Ontario are significant dairy delivering regions, producing 37%
and 33% of Canada's milk supply with 4,925 and 3,446 dairy farms respectively
20 https://www.dairyfarmers.ca/annualreport/wp-content/uploads/2016/01/2015-2016_Dairy_Sector_Issues.pdf
34
(Canadian Dairy Information Centre, 2019)21. Therefore, dairy farms in Ontario provide
significant contributions to the Canadian GDP and economy.
By and large, 66% of the output from Canadian dairy farms is sold as crude milk
whereas the remaining 33% is refined into other dairy items, for example, cheese,
butter, and processed milk (Vergé et al., 2013). Dairy production provides a vital
contribution to Ontario’s gross agricultural production. Dairy commodities are the
dominant products produced by Ontario according to an analysis of market receipts
(OMAFRA, 2016)22. There is a growing trend in Canada for the number of dairy farms to
decrease year over year, whereas the average size of remaining farms is increasing
with the average farm size being 89 cows (Dairy Farmers of Canada, 2019)23. On the
other hand, the precision farming technology integration on dairy farms is also rising day
by day to ensure increased quality dairy production by farms. For example, a survey of
Ontario dairy producers reported that the number of AMS integration on the farms has
skyrocketed to 400% within last three years (OMAFRA, 2016)24. This extensive amount
of precision farming technology integration on farms has sown the seeds for new
opportunities to explore the effects of those recently integrated technologies on dairy
farmers (Kutter et al., 2011).
Ontario provides a fascinating prospect to investigate the integration of PLF
technologies on the dairy farms with a specific spotlight on the effect of those PLF
technologies on the dairy farmers. Figure 3.1 shows that Ontario dairy farms have a
vital contribution to the Canadian dairy industry. This driving, vigorous and diverse
21 https://www.dairyinfo.gc.ca/eng/dairy-statistics-and-market-information/farm-statistics/farms-dairy-cows-and-
dairy-heifers/?id=1502467423238
22 http://www.omafra.gov.on.ca/english/stats/agriculture_summary.htm#income
23 https://dairyfarmersofcanada.ca/en/canadian-dairy-farms-come-all-sizes
24 http://www.omafra.gov.on.ca/english/livestock/dairy/facts/surveyrobotic.htm
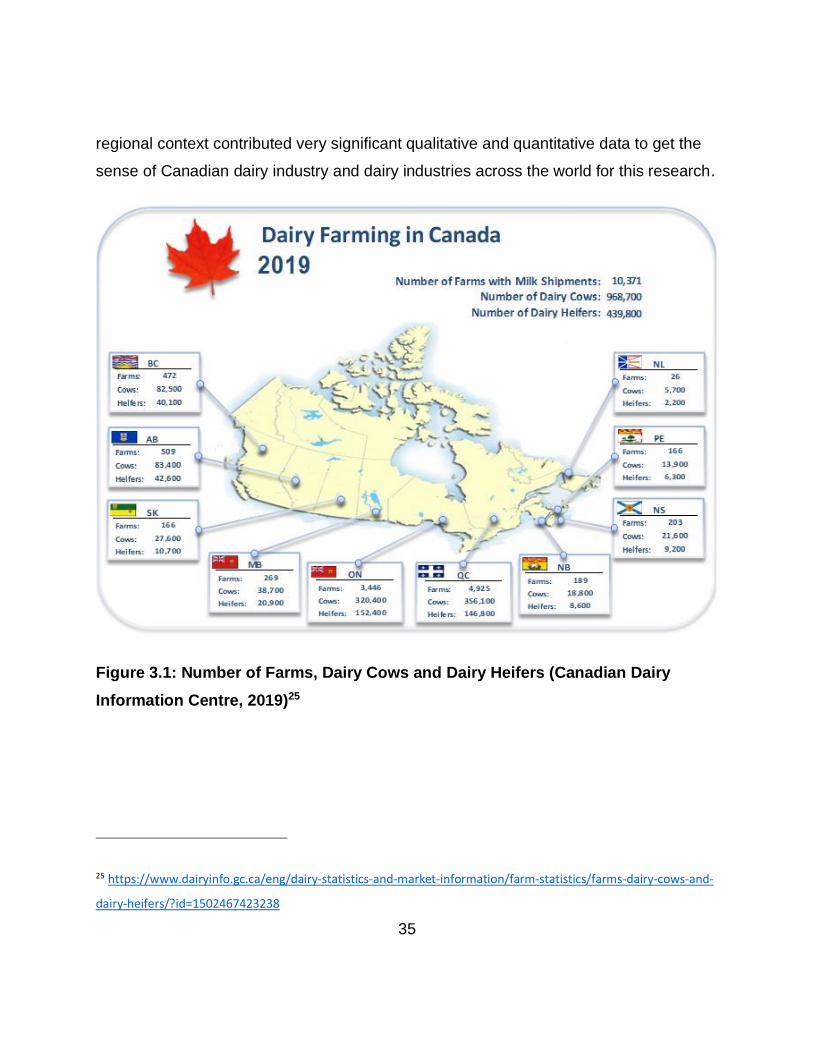
35
regional context contributed very significant qualitative and quantitative data to get the
sense of Canadian dairy industry and dairy industries across the world for this research.
Figure 3.1: Number of Farms, Dairy Cows and Dairy Heifers (Canadian Dairy
Information Centre, 2019)25
25 https://www.dairyinfo.gc.ca/eng/dairy-statistics-and-market-information/farm-statistics/farms-dairy-cows-and-
dairy-heifers/?id=1502467423238
36
3.2 Study Methodology
The originally planned study involved two phases of data collection including conducting
an online survey and conducting phone interviews. Unfortunately, due to complications
arising from the COVID-19 pandemic that forced major societal disruptions during the
first phase, only the online survey phase was partially completed and phase two was
cancelled completely. Data collection for the online survey was in progress when
complete societal shutdowns occurred due to the COVID-19 pandemic in March of
2020. This shutdown introduced many challenges for recruiting survey and interview
participants in the farming sector, as they were dealing with many complexities of
redesigning their production processes to maintain essential food supplies during the
pandemic. Thus, data collection was halted out of respect for the challenges farmers
were experiencing. To address the research goal, both qualitative and quantitative data
were collected. This chapter presents the methodology for both phases, but only results
from the partial phase one data collection are presented in Chapter 4. Due to the
cancelled interviews, fewer qualitative data were collected than planned. However, the
survey still provided some initial opinions and experiences with current notification
mechanisms of PLF technologies on dairy farms. Both the survey and interview
methods were reviewed and approved by the University of Guelph’s Research Ethics
Office (REB# 19-10-006).
3.2.1 Survey Design
Survey is the most frequently utilized technique to gather a wide range of input from a
targeted population (Kabir, 2016). Thus, this form of data collection was selected for
data collection from dairy farmers. The initial survey questions were made based the
knowledge from literature review and online research of the dairy and PLF fields. These
survey questions were reviewed by HCI experts to get initial feedback on survey design
and usability. A revised set of survey questions were then circulated to a dairy research
37
chair in the School of Animal Biosciences at Guelph and a dairy industry expert from the
Ontario Ministry of Agriculture, Food and Rural Affairs (OMAFRA), who both work
closely with the dairy industry to get their feedback on the survey content and design.
Their feedback was used to create an amended set of survey questions.
The survey consisted of a total of 63 questions, with 7 questions related to different
aspects of the informed consent process (and participation eligibility). The remaining, 56
questions were used to collect the main survey data. In practice, as expected from the
background research, most participants only saw a subset of these questions,
depending on which technologies they were using on their farm. In fact, only one
participant reported using four technologies (mentioned below), and therefore, was
exposed to all questions. Also, the questions in each of the technology sections were
highly similar, facilitating survey completion. Therefore, after completing one section,
subsequent sections were not expected to take as long to fill out. The average time was
15.5 minutes to complete the entire survey, which was below the expected 25-30
minutes.
The survey had six main sections. The first section collected demographic information
about the participants. The next four sections related to the current notification
mechanisms used in each of the following commonly used dairy PLF technologies:
- Automated milking system (AMS),
- Automated heat detection system (AHDS),
- Automated calving time detection system (ACTDS), and
- Automated activity monitoring system (AAMS).
At the beginning of each of these sections, the participant was asked if they used the
specific technology on their farm and whether they received notifications from it. If they
38
responded yes to both questions, then a longer set of questions probing deeper about
their experiences with notifications from that technology were shown. If the participant
answered no to either question, then the survey would skip to the next section. The set
of questions in each section were designed to be as similar as possible, to enhance the
usability of the survey. They included questions related to duration of using a
technology, number of messages they receive from the technology on a typical week,
medium of receiving those alerts, type of information they receive, actions they perform
after receiving alerts, pros and cons of the current notification mechanism and their
comments on the current notification mechanism.
The final section of the survey probed any additional technologies they may use and
receive notifications from on the farm, about the overall stress caused by notification
mechanisms of their PLF technologies, and, finally, any overall comments or
suggestions they may have about improving PLF notification mechanisms.
The full list of survey questions is included in Appendix A.
The survey was implemented using Qualtrics®, an online platform to create and
distribute survey. Qualtrics® has some built in tools which offer data analysis after data
collection and that saved time for data entry and data transfer since data collection and
analysis is performed in the same platform. Collected survey data helped to explore
current notification mechanisms of PLF technologies on the dairy farms and provided
insights from farmers on the improvement of current notification mechanisms, as will be
discussed more in Chapter 4.
3.2.2 Survey Procedure
Survey distribution advertisements contained a link to the survey or a barcode or both.
Scanning the barcode or clicking the link navigated the interested participants to the
survey page. When a participant navigated to the survey page, the consent summary
39
would appear first, and the link of the full consent was also provided with the summary.
The first question was whether a participant agrees with the consent or not. This
question was mandatory to answer; without answering the question, participants were
not allowed to proceed forward. If participants disagree with the consent, the survey
ended by thanking to show interest in participating in the study. In the next section,
there was a question related to age, and when participants selected age as under 18,
they were not allowed to proceed to the survey. The survey ended by thanking them
and mentioned that the study is for adults only.
If participants consented, and were over 18, then they completed the survey at their
own pace. In the last section of the survey, participants were asked if they wanted to be
entered into a draw for a $40 prepaid credit card. If so, they provided their contact
information. They were also asked if they were willing to be contacted to participate in a
follow-up interview. If so, they provided their contact information. During the survey,
participants could skip any question, except the consent and age questions due to the
University ethics protocol. In the end, participants could review their responses and
submit their answers. Then the participants were thanked for the participation. The full
informed consent form is included in Appendix D.
3.2.3 Survey Distribution
The survey was advertised through a number of channels, primarily through social
media and dairy industry contacts. A dairy farmers organization that visited farms
regularly for milk analysis purposes had originally agreed to help advertise our study
through their distribution network. However, they withdrew their support due to
complications arising from the pandemic that increased their and their clients’ workload
and stress levels. A Facebook group, named “Farmers of Ontario”26 , which has 2.2k
26 https://www.facebook.com/groups/FarmersOfOntario
40
plus members, was joined and the survey advertisement was posted there. The social
media study announcement was posted on TwitterTM accounts of my supervisor, me,
various University of Guelph Communications channels, including the Ontario
Agricultural College and the Dairy at Guelph research group, and OMAFRA dairy
contacts. These tweets were retweeted by several dairy industry contacts, including the
dairy farmers as followers.
The uncontrolled instrument distribution method was used to distribute the survey in
TwitterTM because the tweet can be reached to anyone. But when it was tweeted, the
announcement stated that the survey was only for dairy farmers of Ontario, but still,
anyone could voluntarily participate. I have communicated with my friends who are
connected with dairy farmers and asked them to distribute the survey among them.
Figure 3.2 shows an example of the survey distribution through TwitterTM.
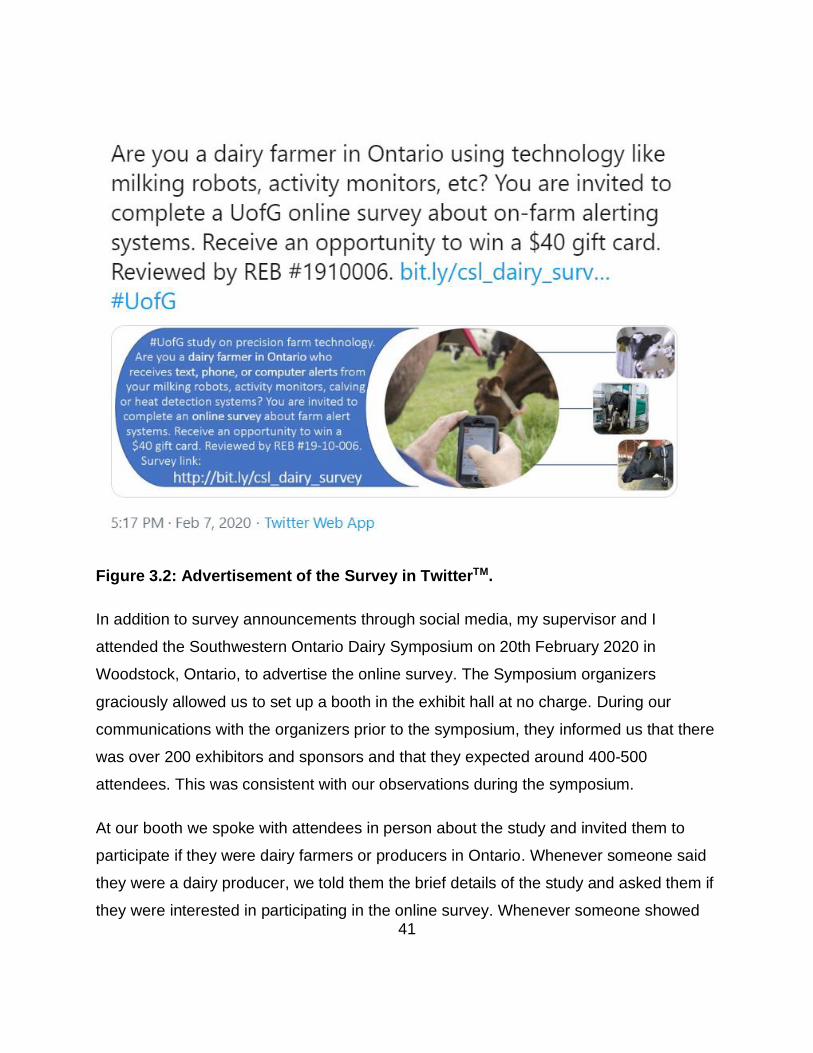
41
Figure 3.2: Advertisement of the Survey in TwitterTM.
In addition to survey announcements through social media, my supervisor and I
attended the Southwestern Ontario Dairy Symposium on 20th February 2020 in
Woodstock, Ontario, to advertise the online survey. The Symposium organizers
graciously allowed us to set up a booth in the exhibit hall at no charge. During our
communications with the organizers prior to the symposium, they informed us that there
was over 200 exhibitors and sponsors and that they expected around 400-500
attendees. This was consistent with our observations during the symposium.
At our booth we spoke with attendees in person about the study and invited them to
participate if they were dairy farmers or producers in Ontario. Whenever someone said
they were a dairy producer, we told them the brief details of the study and asked them if
they were interested in participating in the online survey. Whenever someone showed
42
interest, we provided them a leaflet that included the study advertisement with the study
website and QR code they could scan to access the website. We also had a few laptops
available for them to complete the study on-site, but no one took that option. We have
followed snowball sampling in this case by asking them if they can distribute the leaflet
to other dairy farmers. Afterward, we have provided more leaflets if they showed interest
in distributing the survey to other dairy farmers. Figure 3.3 shows the distributed leaflet
to interested participants.
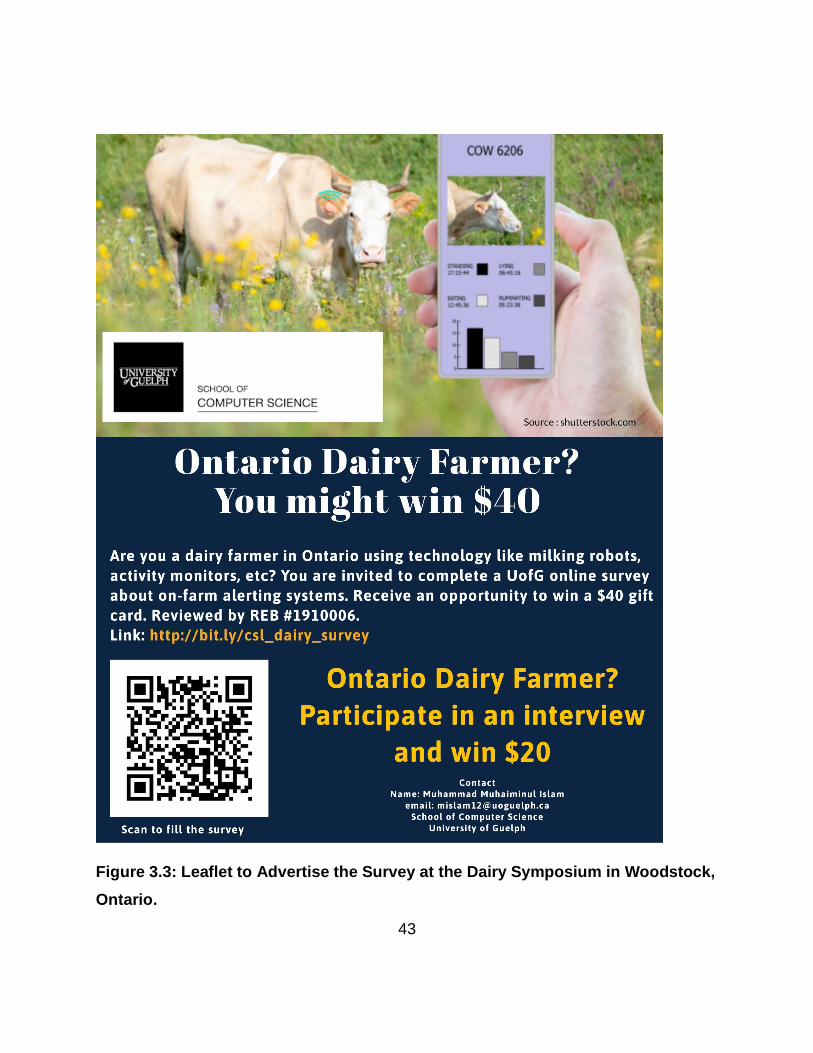
43
Figure 3.3: Leaflet to Advertise the Survey at the Dairy Symposium in Woodstock,
Ontario.

44
From Facebook groups and pages, I also found some dairy farmers who have
commented in several posts, and I sent them a message regarding participation in the
survey. I have also asked admins of some dairy-related pages to promote the survey
through their page. I have also contacted dairy technology retailers to distribute the
survey, and two of them distributed the survey in their channel. The survey was online
from 6th February 2020 to 31st March 2020.
3.3 Interview Design
As mentioned earlier, conducting phone interviews with dairy farmers was planned in
this study to collect qualitative data, which would provide depth and insights about the
current notification mechanism of PLF technologies. The phone interview was planned
because it is time and cost-effective and provides similar data to face to face interviews.
Phone interviews would provide comprehensive qualitative data about the pros and
cons of the current notification mechanism, which later would help to identify some
significant insights. Moreover, the phone interview mitigates the gap in data collection
through the survey. The phone interview's planned duration was 20-40 minutes, and the
phone interviews were supposed to be audio recorded for further analysis. The
interview questions are provided in the Appendix F.
3.4 Survey Participants
All the participants of the survey were dairy farmers of Ontario, Canada. All participants
were 18 years old or above. It was ensured that the participants are 18 years or above
to fulfill the Research Ethics Board's age requirements. In total, 18 complete, valid
responses were collected. The following diagrams (Figure 3.4- Figure 3.7) depict the
demographics of the survey participants.
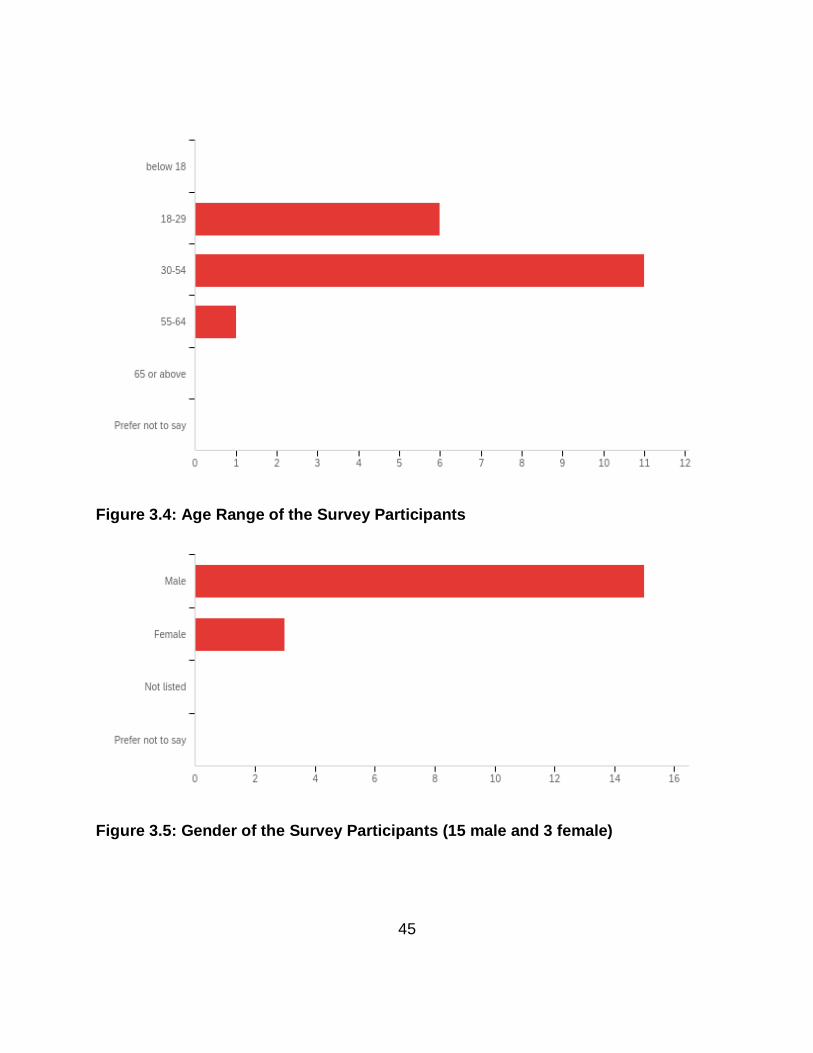
45
Figure 3.4: Age Range of the Survey Participants
Figure 3.5: Gender of the Survey Participants (15 male and 3 female)
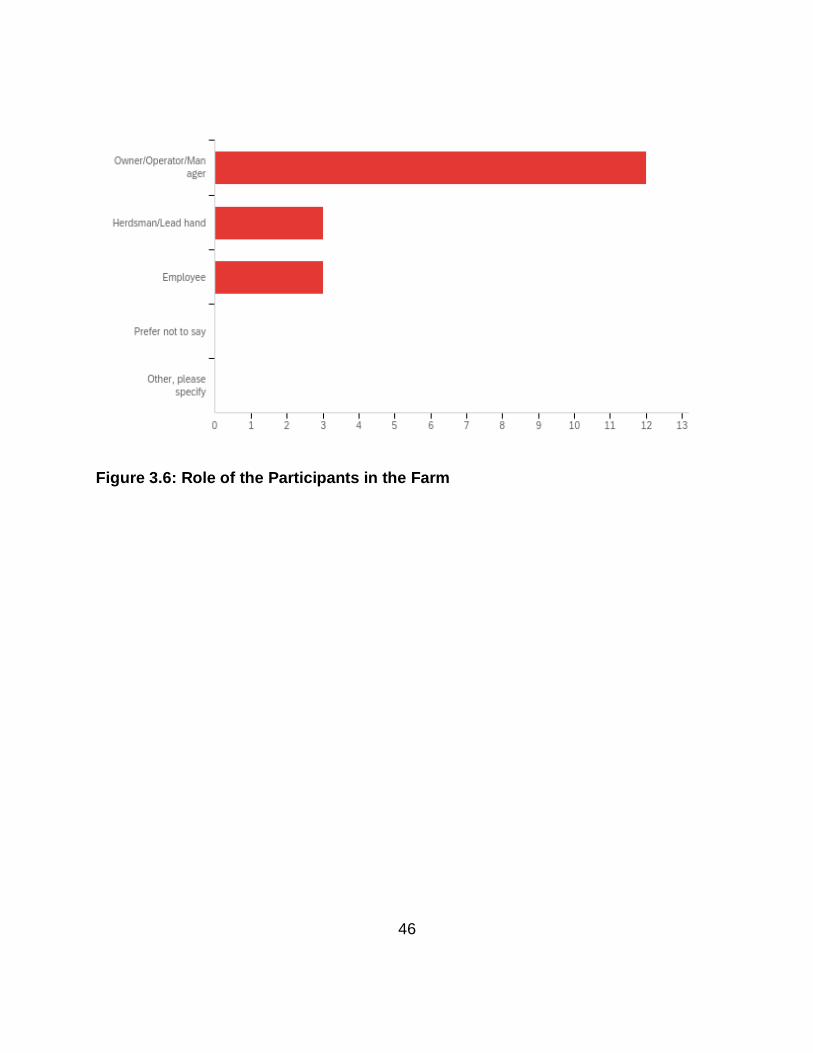
46
Figure 3.6: Role of the Participants in the Farm

47
Figure 3.7: Years of Dairy Farming Experience of the Participants
Five participants were chosen at random to receive a $40 gift card among the 18 survey
participants. The five chosen participants were contacted via their provided contact
information and asked their preferred way of money transfer. According to the study
plan and ethics approval, gift credit cards were supposed to be sent but due to COVID-
19 pandemic, the most convenient and safest way was chosen based on discussion
with each participant for monetary transaction.
3.5 Data Collection and Analysis
Qualitative and quantitative data were collected through the survey by using close-
ended and open-ended questions through the Qualtrics® online survey platform, on the
topics discussed in Section 3.2.1. As discussed above, the survey data was collected
48
through the Qualtrics® online survey tool. By the end of the data collection period, a total
of 51 survey records were recorded. The collected survey records were reviewed for
validity. First, incomplete surveys were deleted in accordance with the information
provided on the informed consent form. For instance, there were a few cases where the
participants started the survey but did not submit their responses via the submission
button. Also, unusual surveys such as those completed within 2-3 minutes, far less time
that reasonably expected to carefully read the questions and respond thoughtfully, were
deleted to increase reliability of the data. To account for surveys that may have been
completed for the potential prize and potentially be non-farming participants, only survey
records that included reasonable, logical response patterns, and topic-relevant free form
comments were included in the data analysis. A response was also culled for
irrelevancy if the responses mentioned that they do not use any technologies. Initial
data culling resulted in 21 complete, valid records. An additional three responses were
culled during the analysis as the responses were from outside of the Ontario province.
This left a total of 18 complete, valid survey records that were included in the data
analysis.
When the data collection was completed, data analysis was started using the built-in
tools in Qualtrics®. Using the Qualtrics® built-in tools, some basic graphs and charts
such as frequency statistics, bar charts were generated and min, max and mean were
also calculated where it was applicable. Some data were moved to Microsoft Excel® to
generate more understandable and controlled bar charts based on the research
question. Afterwards, the data were exported from Qualtrics® to a common-separate
values (CSV) formatted file for further statistical analysis. Correlation analysis was done
using Python 2 built in function named ‘corr()’ in the library named ‘Pandas’ to
determine the relationship between demographics or other data and the number of
notifications such as the relation between duration of using a technology and the
number of notifications received. Correlation analysis was also used to determine
relationship between stress level of the farmers and their demographics. Linear
49
correlation (Pearson correlation) was used to investigate whether there were any linear
relationships between the variables. Python was used because it has some easy to use
libraries which provide features to draw relational diagrams from data. A sample python
code for correlation analysis is included in Appendix E.
3.6 Summary
In this chapter, the detailed methodology of the research has been discussed. To
conclude, Ontario plays a vital role in the Canadian dairy industry and running a study
on Ontario dairy farms will provide a better sense of the Canadian dairy industry. An
online survey was an appropriate study method since an online survey is cost-effective,
gives maximum reachability, and is less challenged to analyze data because data is
automatically organized and saved while being collected. The survey helped to
understand the current notification mechanism of dairy farming technologies. Using a
survey, more data could be collected since for most of the questions, participants need
to select from options rather than write something from their own. Moreover, the survey
is a better way to start with whenever a new field is explored. The participants were
recruited through different channels such as email, TwitterTM, Facebook®, set up a table
in a symposium. In the next section, the findings by analyzing the collected qualitative
and quantitative data will be presented.

50
Results
The study focused on two objectives. The first objective was to understand the current
notification mechanism of four frequently used dairy farming technologies: automated
milking systems (AMSs), automated heat detection systems (AHDSs), automated
calving time detection systems (ACTDSs), and automated activity monitoring systems
(AAMSs). The second objective was to investigate the positive and negative effects,
including potential stresses, that PLF notification mechanisms have on farmers.
This chapter presents that findings from the data analysis of the online survey, including
the usage of the four technologies, information received by the farmers, actions taken
by the farmers upon receiving information from PLF technologies, benefits and
challenges of PLF technologies, understanding on the average number of alerts farmers
receive weekly, farmers’ perceptions on stress caused by ineffective communications,
communication mediums, and their overall impressions of PLF technologies. The full
dataset collected from the survey are included in Appendix A.
4.1 Participants Receiving Notifications from Specific PLF
Technologies
The survey started with a few demographics questions followed by questions related to
each of the four PLF technologies. The technology-specific questions started with AMS
(milking), followed by AHDS (heat detection), ACTDS (calving time) and then AAMS
(activity monitoring). Figure 4.1 summarizes the number of participants who reported
using each technology, and Figure 4.2 summarizes the number of participants who
reported receiving notifications from each technology.
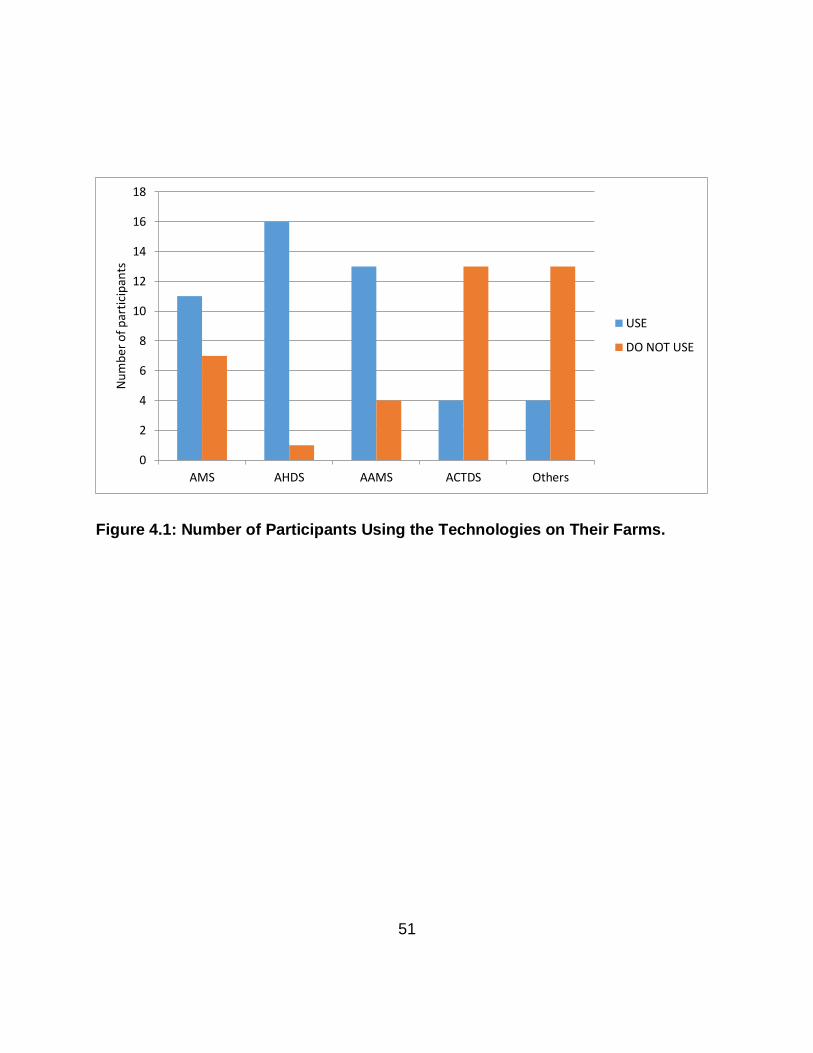
51
Figure 4.1: Number of Participants Using the Technologies on Their Farms.
0
2
4
6
8
10
12
14
16
18
AMS AHDS AAMS ACTDS Others
Nu
mb
er o
f p
arti
cip
ants
USE
DO NOT USE

52
Figure 4.2: Number of Participants Receive Notifications from the Technologies.
In total, eighteen participants responded to the AMS questions, with 11 participants
(61%) reporting that they use AMS on their farms. Among the eleven AMS users, three
participants (27%) use one AMS, five participants (46%) use two AMSs, and three
participants (27%) use three AMSs. Out of eleven AMS users, ten participants (91%)
reported that they receive notification from their AMS(s), and only one participant (9%)
reported that they do not receive notifications from their AMS(s).
In total, seventeen participants responded to the AHDS questions, and among them, 16
participants (94%) said they use AHDS on their farms. All sixteen participants (94%)
also reported that they receive alerts from their AHDS.
In total, seventeen participants responded to the ACTDS questions, and among them,
four participants (24%) said they use ACTDS on their farms. While five participants
reported that they receive alerts from their ACTDS (29%), the data shows the follow-up
questions from the additional participant were left blank; thus, it is assumed they
0
2
4
6
8
10
12
14
16
18
AMS AHDS AAMS ACTDS
Nu
mb
er o
f P
arti
cip
ants
Receive alerts Do not receive alerts
53
selected this “receive notifications” in error. Given the small sample size of ACTDS
users in the survey, the ACTDS data is omitted from the following analyses, and
reported separately in Section 4.11.
Seventeen participants responded to the AAMS questions, and among them, 13
participants (76%) mentioned that they use AAMS on their farms. Among them, six
participants (46%) answered that they receive notification from their AAMS, and eight
participants (56%) responded that they do not.
The participants were also asked whether they use and receive notifications from any
other technologies beyond the above four technologies. Four participants replied that
they use other technologies such as Rumination, SCC indication and conductivity, Milk
temperature, Ketosis and mastitis alerts to desktop, and Automated feeding systems
(Lely Vector and Rovibec were specifically mentioned).
4.2 Type of Information Received by the Farmers
Figure 4.3 depicts the type of information farmers receive from AMS. The figure shows
that most of the notifications farmers get are about cow activities such as rumination
and lameness (9/11), system failures (7/11), or cows in heat (7/11). They also get
notifications about cows overdue for milking (3/11), substances in the milk (3/11), cases
of mastitis (3/11), and abnormal cow temperature (2/11). Participants also reported
several other types of information, in addition to the pre-defined information types,
including the weight of the cow, feeding system issues, and calving distress.
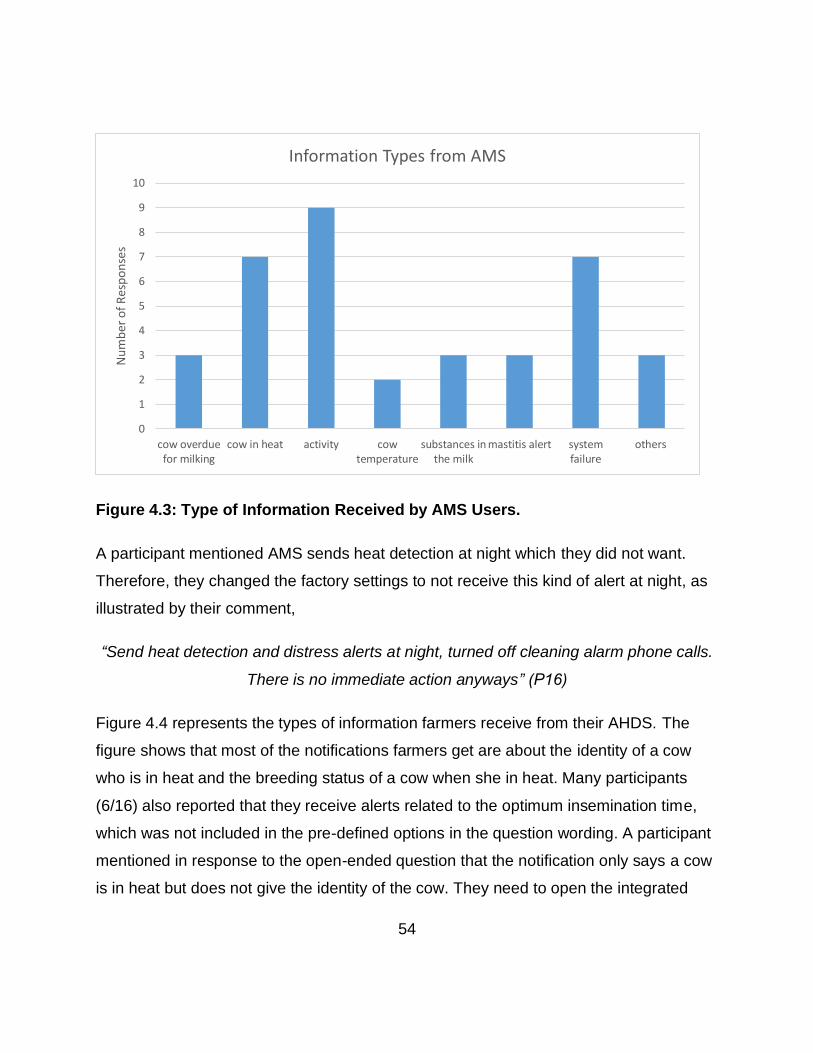
54
Figure 4.3: Type of Information Received by AMS Users.
A participant mentioned AMS sends heat detection at night which they did not want.
Therefore, they changed the factory settings to not receive this kind of alert at night, as
illustrated by their comment,
“Send heat detection and distress alerts at night, turned off cleaning alarm phone calls.
There is no immediate action anyways” (P16)
Figure 4.4 represents the types of information farmers receive from their AHDS. The
figure shows that most of the notifications farmers get are about the identity of a cow
who is in heat and the breeding status of a cow when she in heat. Many participants
(6/16) also reported that they receive alerts related to the optimum insemination time,
which was not included in the pre-defined options in the question wording. A participant
mentioned in response to the open-ended question that the notification only says a cow
is in heat but does not give the identity of the cow. They need to open the integrated
0
1
2
3
4
5
6
7
8
9
10
cow overduefor milking
cow in heat activity cowtemperature
substances inthe milk
mastitis alert systemfailure
others
Nu
mb
er o
f R
esp
on
ses
Information Types from AMS

55
application with AHDS to know which cow the notification about, as their comment
illustrates,
“Just says ‘cow in heat’ must open app to find out which cow and breeding status” (P5)
Figure 4.4: Types of Information Received by AHDS Users.
Figure 4.5 shows the type of information farmers receive from their AAMS. The figure
shows that most farmers (11/13) reported receiving notifications about unusual activity
timing such as unusual lying, standing, ruminating and walking time. Participants also
reported receiving notifications about heat events (4/11) and calving time detection
(1/11). One participant reported that their AAMS sent notifications about inactivity in
their cows, which was not a pre-defined option in the question wording. No farmer
reported receiving notifications about the location of the cow, which is a known feature
of newer commercial AAMS systems.
0
2
4
6
8
10
12
14
16
Identity of a cow location of a cow breeding status others
Nu
mb
er o
f R
esp
on
ses
Information Types from AHDS

56
Figure 4.5: Information Received by the Farmers from AAMS.
4.3 Actions Taken by the Farmers
Figure 4.6 represents actions taken by farmers upon receiving notifications from AMS.
As the figure shows, most of the time farmers check the system (8/11) and reset the
system if necessary (3/11). These findings are consistent with the fact that, as reported
in the previous section, farmers receive many notifications regarding system failure.
Many farmers (5/11) reported checking a cow after receiving an AMS notification about
a cow. In the other section, farmers reported checking the system upon receiving
notifications to determine action.
0
2
4
6
8
10
12
cow position unusual activitytiming
heat detection calving timedetection
others
Nu
mb
er o
f R
esp
on
ses
Information Types from AAMS

57
Figure 4.6: Actions Taken by Farmers After Getting Alerts from AMS.
Figure 4.7 depicts actions taken by farmers upon receiving alerts from AAMS. This
figure shows that three commonly reported actions were to check the cow with the
reported issue (4/6), provide necessary care to the cow (4/6), and apply medicine if
necessary (4/6). Sometimes they contact their veterinarian (3/6) and separate the cow
with issues from other cows, if necessary (2/6).
Actions upon receiving alerts from the special-purpose PLF technologies, AHDS and
ACTDS, were not collected since after receiving an alert from the system the actions
are more obvious: Farmers usually check the cow and take necessary steps for
insemination or calving once the detected heat or calving is confirmed.
0
1
2
3
4
5
6
7
8
9
cow check system check reset system others
Nu
mb
er o
f R
esp
on
ses
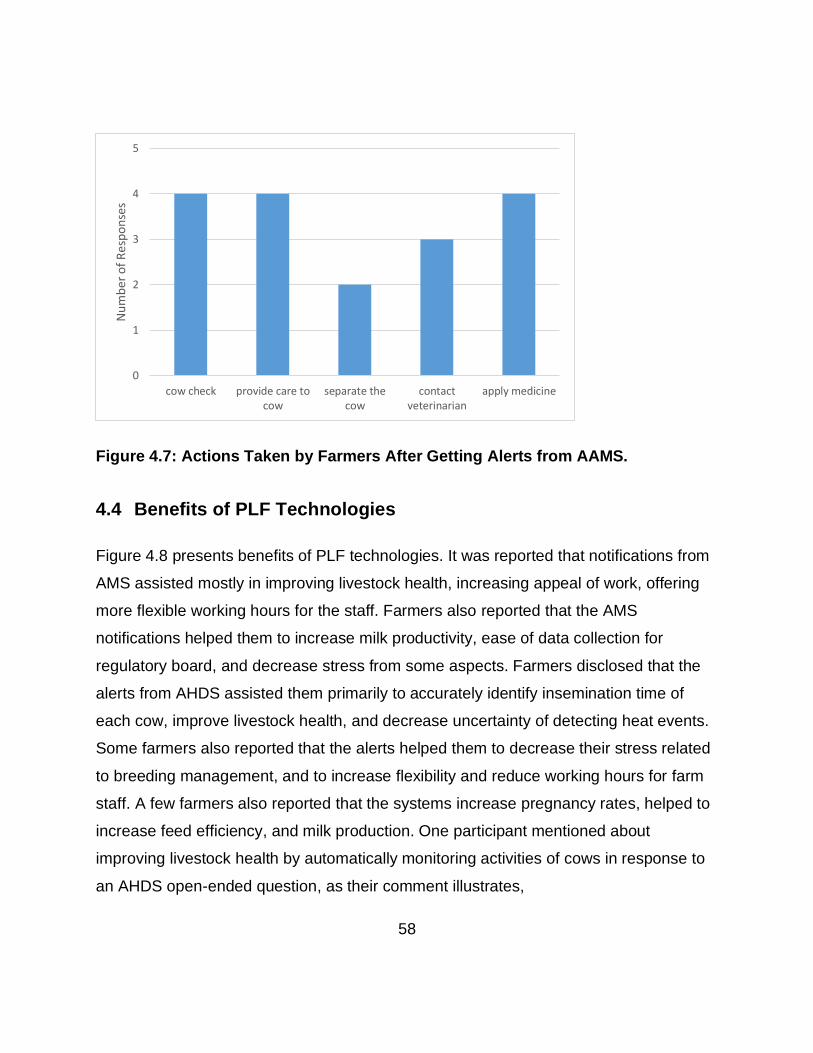
58
Figure 4.7: Actions Taken by Farmers After Getting Alerts from AAMS.
4.4 Benefits of PLF Technologies
Figure 4.8 presents benefits of PLF technologies. It was reported that notifications from
AMS assisted mostly in improving livestock health, increasing appeal of work, offering
more flexible working hours for the staff. Farmers also reported that the AMS
notifications helped them to increase milk productivity, ease of data collection for
regulatory board, and decrease stress from some aspects. Farmers disclosed that the
alerts from AHDS assisted them primarily to accurately identify insemination time of
each cow, improve livestock health, and decrease uncertainty of detecting heat events.
Some farmers also reported that the alerts helped them to decrease their stress related
to breeding management, and to increase flexibility and reduce working hours for farm
staff. A few farmers also reported that the systems increase pregnancy rates, helped to
increase feed efficiency, and milk production. One participant mentioned about
improving livestock health by automatically monitoring activities of cows in response to
an AHDS open-ended question, as their comment illustrates,
0
1
2
3
4
5
cow check provide care tocow
separate thecow
contactveterinarian
apply medicine
Nu
mb
er o
f R
esp
on
ses
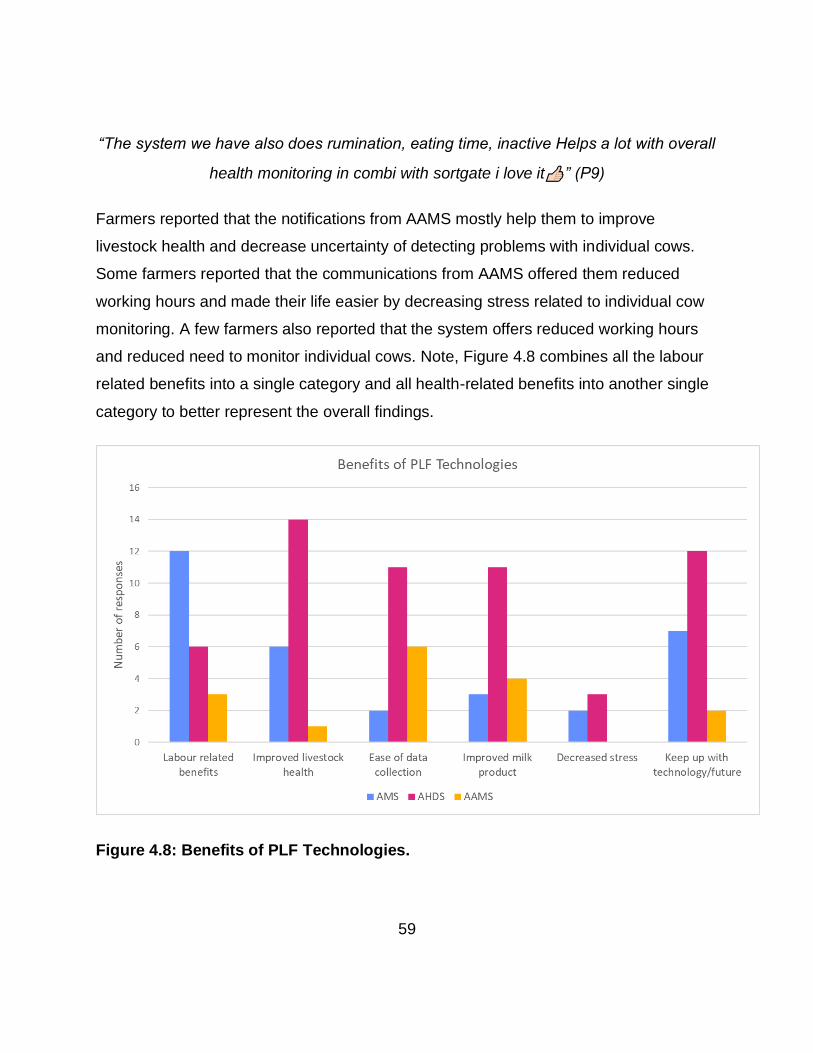
59
“The system we have also does rumination, eating time, inactive Helps a lot with overall
health monitoring in combi with sortgate i love it ” (P9)
Farmers reported that the notifications from AAMS mostly help them to improve
livestock health and decrease uncertainty of detecting problems with individual cows.
Some farmers reported that the communications from AAMS offered them reduced
working hours and made their life easier by decreasing stress related to individual cow
monitoring. A few farmers also reported that the system offers reduced working hours
and reduced need to monitor individual cows. Note, Figure 4.8 combines all the labour
related benefits into a single category and all health-related benefits into another single
category to better represent the overall findings.
Figure 4.8: Benefits of PLF Technologies.

60
4.5 Challenges of PLF Technologies
Figure 4.9 summarizes the challenges farmers face while using PLF technologies on
their farms. Note, the figure combines all reported challenges related to unclear
messages, including unclear topic/subject of message, unclear cow identification, and
unclear required response for reported issue into a single category “unclear messages /
cow / required response” to simply the chart and better represent the overall findings.
Figure 4.9: Challenges of PLF Technologies.
The most commonly reported challenge with AMS notifications is to identify the subject
or the topic of the received message since sometimes the messages are too generic.
Some farmers also reported that the timing of sent messages from AMS sometimes
interrupt more important work or life activities. Farmers also reported that sometimes
the medium of communication is not effective. A few farmers reported that they
sometimes miss important notifications because of the timing and medium of
61
communication and sometimes they feel stressed because they feel they might receive
notifications at any moment. In response to an open-ended question, one participant
mentioned that the voice in the phone call was not clear and another participant
suggested the system should generate more alerts to make the system more reliable,
as shown in their comments below:
“The voice is not always clear and the responsiveness to confirming and resetting the
system when you push the appropriate button is not great.” (P2)
“There needs to be more robot alarms added as a fail safe.” (P16)
AHDS users reported few challenges with the notifications from their systems, with 6/16
participants explicitly adding comments like “no challenges” and “no challenges, very
happy with alert system”. However, a few farmers reported that medium the system
uses to send the information is not always effective, the timing of received messages
sometimes interrupts more important work or life activities, and sometimes false alerts
(false positives) are sent or no alert (false negative) is sent even though a cow is in
heat. A participant mentioned about inappropriate communication timing from their
AHDS in response to an open-ended question, as shown in their comment,
“I wish refresh of data would be more current. Mostly 4 hours behind, sometimes 2. i.c.
if it is 10am now, the last data point showing is 6 or 8am” (P2)
Another participant reported receiving many false alerts from their AHDS and
sometimes receiving inaccurate data from the technology. However, on balance, they
felt the technology was still valuable despite these issues, as shown in their comment,
“I feel like there are a lot of bugs because we do receive false alerts all the time and
sometimes the readings are incorrect. It does allow us to save time and makes our job
easier” (P17)
62
No AHDS users reported feeling stressed because of their AHDS notifications.
The most common challenges reported by AAMS users related to uncertainty of the
message, including whether the reported issue is urgent or not, which cow the message
is talking about, and sometimes the message is too generic or unclear to understand
what problem is being reported. Moreover, they sometimes receive false alerts from
their AAMS and sometimes miss messages about abnormal cow activity. In response to
an open-ended question, one participant commented that their AAMS sometimes takes
too long to report abnormal behaviour, as illustrated by their comment,
“Sometimes it does not alert me soon enough. There is a time delay where it waits to
see 2 days of decreased inactivity before an alert. Hoping to contact company to make
a change on this.” (P11)
Overall, there were far fewer challenges reported than benefits across the AMS, AHDS,
and AAMS notification systems (105 reported benefits versus 28 reported challenges),
with several farmers explicitly reporting “no challenges”. This suggests that the benefits
gained by these technologies and their related notification mechanisms outweigh the
challenges they pose. However, the identified challenges in this section still provide
insights into potential design improvements that could be made, as discussed further in
Chapter 5.
4.6 Number of Notifications
A correlation analysis was conducted using Python on some of the collected
demographic data and the reported number of notifications received across all PLF
technologies. Table 4.1 represents the correlation matrix of the number of notifications
against farm size, years of experience, and installation year. Two variables are
considered weakly related if the correlation coefficient (r) is |r| < 0.35, moderately
related if 0.36 < |r| < 0.67, and strongly related if |r| > 0.67 (Robert D. Mason, Douglas
63
A. Lind, 1983). A positive correlation indicates that with the increment of one value the
other will also increase, while a negative value indicates with the increment of one the
other one will decrease.
A moderate positive relationship was found between the number of notifications and
farm size (r=0.435). Logically, it could be expected that a larger farm size (i.e. one with
more cows) might receive more notifications; however, the lack of a strong correlation
between these factors may be due to the fact that some farmers with large farms may
have adopted some of the strategies discussed below to minimize received alerts. It
may also be due to the relatively small sample size of the survey.
Only weak correlations were found for the other tested factors. A weak negative
relationship was found between number of notifications and years of experience (r=-
0.209), and an almost negligible negative relationship was found between number of
notifications and years of installation of that technology (r=-0.042). The sample Python
code for calculating correlation coefficient and results are given in Appendix E.
Table 4-1: Correlation Matrix Values (r) for the Number of Alerts against Farm
Size, Years of Experience, and Year of Technology Installation.
Farm Size Years of experience Year of installation
Number of alerts 0.435 -0.209 -0.042
4.7 Perceived Stress Levels Related to PLF Notifications
In the last section of the survey, participants were asked to rate on a 11-point scale how
stressed they feel during their daily activities knowing that they might receive alerts from
any of their farm technologies and the responses are depicted in Figure 4.10 and Figure
4.11. The scale anchors were as follows, 0 = not at all stress, 10 = extremely stressed.
64
As the figures show, all 15 farmers who responded to this question rated their stress
level 5 or below, and most farmers (13/15) answered 3 or below. The mean stress
rating was 1.88, which was very low overall. Therefore, from the data, it can be
concluded that farmers are not that stressed by thinking they might receive notifications
at any moment from their dairy farming technologies. One participant commented in an
open-ended follow-up question about the cause of the stress/anxiety,
“Not many alarms = no stress” (P15)
However, other participants commented that they feel stressed knowing they might
receive a notification from their farm technologies at any moment and they mentioned
they feel stressed because they have to drop what they are currently doing after
receiving an alert or notification, as illustrated by the participant comments,
“Could be away from the farm and receive an urgent alert you may have to leave an
event for if there is no one else available to fix the alert” (P5)
“Having to drop what your doing to investigate” (P2)
Therefore, some farmers do not leave far from the farm without someone on call. But
this type of stress was present to the same degree before installing the alert system. It
implies that farmers never feel off duty without someone on call, as illustrated by the
participant comment,
“Not leave far from the farm without someone on call. This stress was present to the
same degree before installing the alert system.” (P5)
Sometimes farmers are stressed because they might receive notifications related to
system breakdown, which is expensive to fix. On the other hand, there might be
production loss because cows might not be milked during the technology breakdown
period, as illustrated by the participants comment,
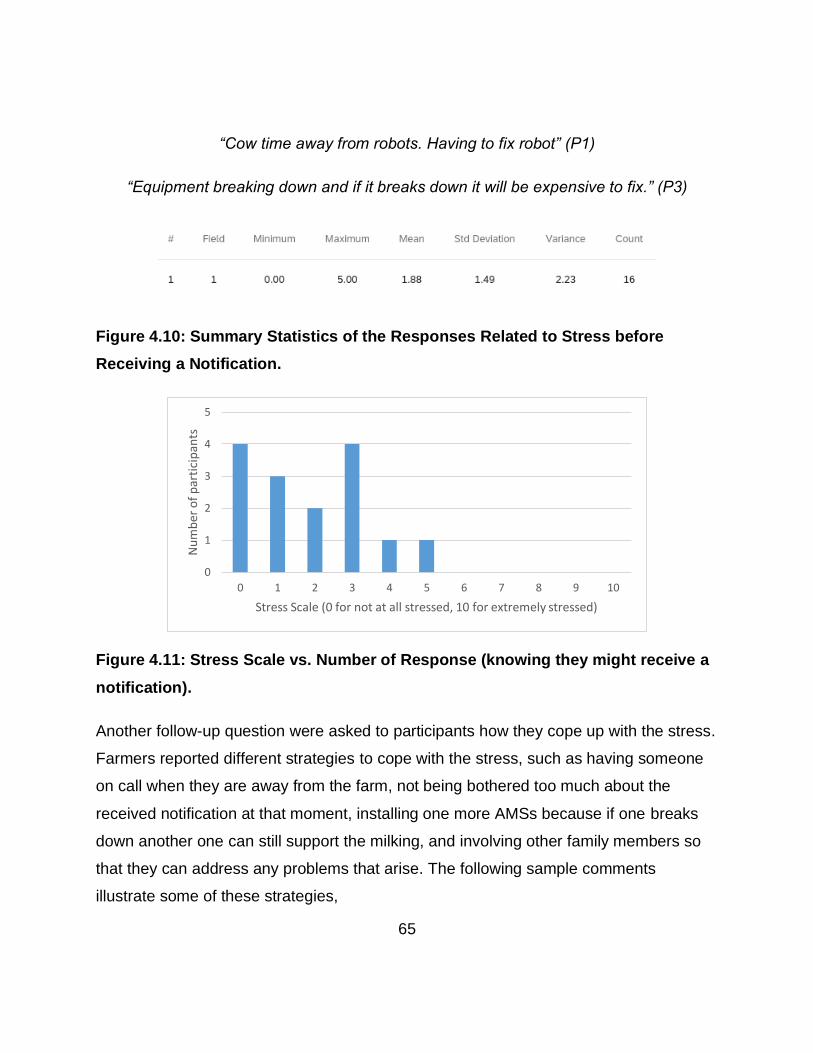
65
“Cow time away from robots. Having to fix robot” (P1)
“Equipment breaking down and if it breaks down it will be expensive to fix.” (P3)
Figure 4.10: Summary Statistics of the Responses Related to Stress before
Receiving a Notification.
Figure 4.11: Stress Scale vs. Number of Response (knowing they might receive a
notification).
Another follow-up question were asked to participants how they cope up with the stress.
Farmers reported different strategies to cope with the stress, such as having someone
on call when they are away from the farm, not being bothered too much about the
received notification at that moment, installing one more AMSs because if one breaks
down another one can still support the milking, and involving other family members so
that they can address any problems that arise. The following sample comments
illustrate some of these strategies,
0
1
2
3
4
5
0 1 2 3 4 5 6 7 8 9 10
Nu
mb
er o
f p
arti
cip
ants
Stress Scale (0 for not at all stressed, 10 for extremely stressed)
66
“You just let it go and deal with it when it works best, or the next time you are in the
barn” (P10)
“Take a deep breath. Our robots are under capacity as well so we know if one breaks
that they can use the other one while we get it up and running.” (P1)
Participants were also asked to rate on an 11-point scale (0=not at all stressed,
10=extremely stressed) how stressed they feel during their daily lives when they receive
notifications from any of their PLF technologies. Their responses are shown in Figure
4.12 and Figure 4.13. Of the 14 participants who responded to this question, 12
participants rated their stress level below 5, with half (7/12) rating their stress level
either 0 or 1. Two participants rated their stress level 6 or 7. The mean rating for the
responses was 2.14, slightly higher than their average stress level prior to notifications,
but still a fairly low level of stress. Therefore, it can be concluded from the data that
farmers are not that stressed due to the information they receive from dairy farming
technologies.
In a follow-up open-ended question about the cause of the reported stress, participants
reported a variety of reasons for this stress, including the fact that alerts are often about
something bad, they are sometimes sent at bad times, such as midnight, and stress due
to an alert being about equipment breakdowns while the farmer is away from the farm,
as illustrated in the following comments,
“I worry that the alert will be something bad and when I hear it i always stop what Im
doing and look and during that time period I get nervous and increased anxiety” (P17)
“Getting up in the middle of the night” (P16)
“Not stressed until check to get more detail. Then depending on the alert could be no
stress or urgent.” (P5)

67
“Robot is broken. Needs fixing and I’m at work.” (P1)
Figure 4.12: Summary Statistics of the Responses Related to Stress after
Receiving a Notification.
Figure 4.13: Stress Scale vs. Number of Response (after receiving a notification).
Participants were also asked a follow-up question about how they cope with the stress.
Farmers reported various coping strategies, such as changing the settings of their
device to receive effective alerts, installing additional robots (AMSs) to cope with the
stress of breakdowns, installing one more devices to better support farm operation.
Some farmers also reported getting better at handling alerts in more effective way as
they get used to the device over time. Sample participant comments include,
“As I get more used to receiving alerts (we just started less than a year ago) I start to
feel less anxious. I also changed the alerts on my device so it just vibrates” (P17)
“Most are not urgent, so frequency of urgent alerts is low which mitigates stress” (P5)
0
0.5
1
1.5
2
2.5
3
3.5
4
4.5
0 1 2 3 4 5 6 7 8 9 10
Nu
mb
er o
f p
arti
cip
ants
Stress Scale (0 for not stressed and 10 for extremely stressed)
68
“Other robot can manage while I am at work. Milking 65 cows on 2 robots” (P1)
Collected data were analyzed to determine possible demographic factors in the stress
levels reported by farmers due to PLF notifications. Table 4.2 represents correlation
matrix between stress level and years of farming experience, age of farmer, and size of
farm (number of cows). The correlation coefficient (r) for stress level and years of
experience is r=-0.710, suggesting a strong negative relationship between stress level
and years of experience in dairy farming. Thus, as farming experience increased, the
reported stress level decreased. A moderate negative relationship (r=-0.481) was found
between stress level and age, indicating that older farmers experience less stress,
potentially because they get more experience with handling the stress. A weak positive
relationship (r=0.201) was found between farm size (numbers of cows) and stress. As
mentioned in the previous section, it might be expected that larger farms would receive
more alerts, introducing more potential for stress. However, farmers on large farms may
have also developed better strategies for notification management, such as adjusting
factory settings to minimize alerts.
Table 4-2: Correlation Matrix Values (r) for the Stress Level against Farm Size,
Years of Experience, and Age of the Farmer.
Years of farming experience
Age of farmer Farm size
Stress -0.710 -0.481 0.201
4.8 Notification Mediums
From the literature, background research on available commercial technologies in
Chapter 2, and informal conversations with dairy industry experts, it was anticipated that
current PLF technologies used four main communication mediums to convey
notifications to farmers: text messaging, phone call, email, and displaying information in
69
the dashboard of the PLF technology’s associated computer application system for their
desktop, tablet, or mobile computer. The study confirmed this expectation. Participants
reported that these four mediums were currently used to send information to the farmers
from their current dairy farming technologies. Figure 4.14 and Figure 4.15 show the
reported usage of these notification mediums by PLF technologies. Most AMS users
(7/11) reported that they received notifications through phone calls, four participants
reported that they received notifications through their application dashboard, and a few
participants reported that they received notification through text messaging (1/11) and
email (1/11). Note, that some participants reported receiving notifications multiple ways
from their AMS (e.g., by phone calls and application dashboard).
Among the AHDS users, most participants (12/16) reported that they received
notifications through their application dashboard, some participants (4/16) reported
receiving notifications through text messaging, and one farmer reported receiving
notifications through email. In a free-form comment, one participant who reported
receiving text messages from the survey options clarified that they meant the AHDS
system sends alerts using their native mobile phone alerting system via the AHDS
mobile application system. No AHDS users reported receiving notifications by phone
call.
Overall, far fewer AAMS users reported receiving notifications from their systems (only
6 out of 13 AAMS users reported receiving notifications (alerts or alarms) from their
system). Of these participants, most of them (4/6) reported receiving notifications
through the application dashboard. One farmer reported receiving notifications through
text messaging and one farmer reported receiving notifications through email. No AAMS
users reported receiving notifications by phone call.
As Figure 4.14 shows, the application dashboard is used most often across PLF
technologies as a communication medium, whereas other mediums such as phone call,
text messaging, and email are not used as frequently. The study data also show that, at
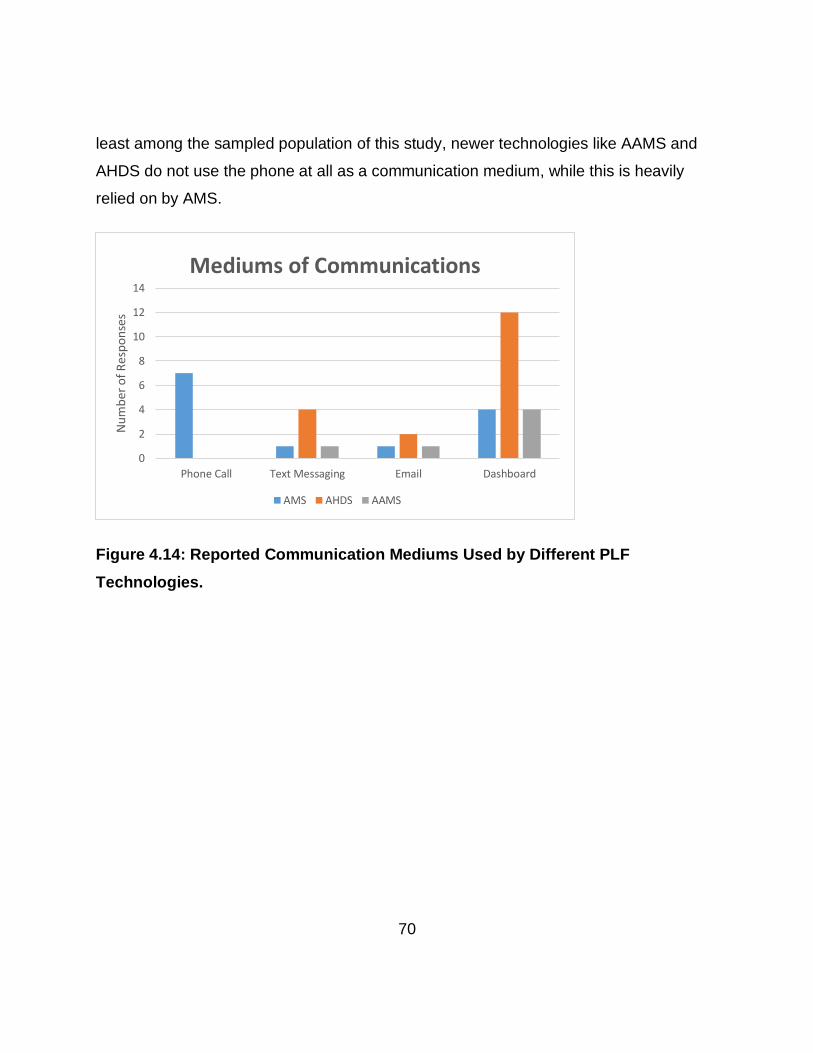
70
least among the sampled population of this study, newer technologies like AAMS and
AHDS do not use the phone at all as a communication medium, while this is heavily
relied on by AMS.
Figure 4.14: Reported Communication Mediums Used by Different PLF
Technologies.
0
2
4
6
8
10
12
14
Phone Call Text Messaging Email Dashboard
Nu
mb
er o
f R
esp
on
ses
Mediums of Communications
AMS AHDS AAMS
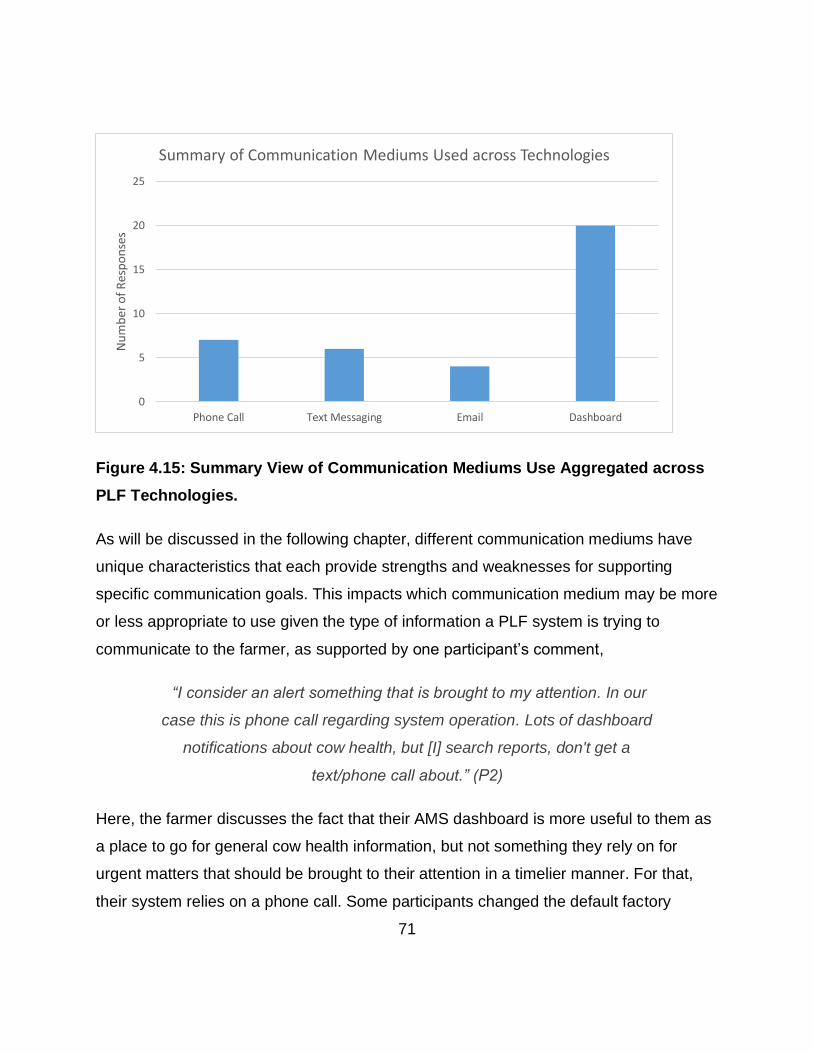
71
Figure 4.15: Summary View of Communication Mediums Use Aggregated across
PLF Technologies.
As will be discussed in the following chapter, different communication mediums have
unique characteristics that each provide strengths and weaknesses for supporting
specific communication goals. This impacts which communication medium may be more
or less appropriate to use given the type of information a PLF system is trying to
communicate to the farmer, as supported by one participant’s comment,
“I consider an alert something that is brought to my attention. In our
case this is phone call regarding system operation. Lots of dashboard
notifications about cow health, but [I] search reports, don't get a
text/phone call about.” (P2)
Here, the farmer discusses the fact that their AMS dashboard is more useful to them as
a place to go for general cow health information, but not something they rely on for
urgent matters that should be brought to their attention in a timelier manner. For that,
their system relies on a phone call. Some participants changed the default factory
0
5
10
15
20
25
Phone Call Text Messaging Email Dashboard
Nu
mb
er o
f R
esp
on
ses
Summary of Communication Mediums Used across Technologies
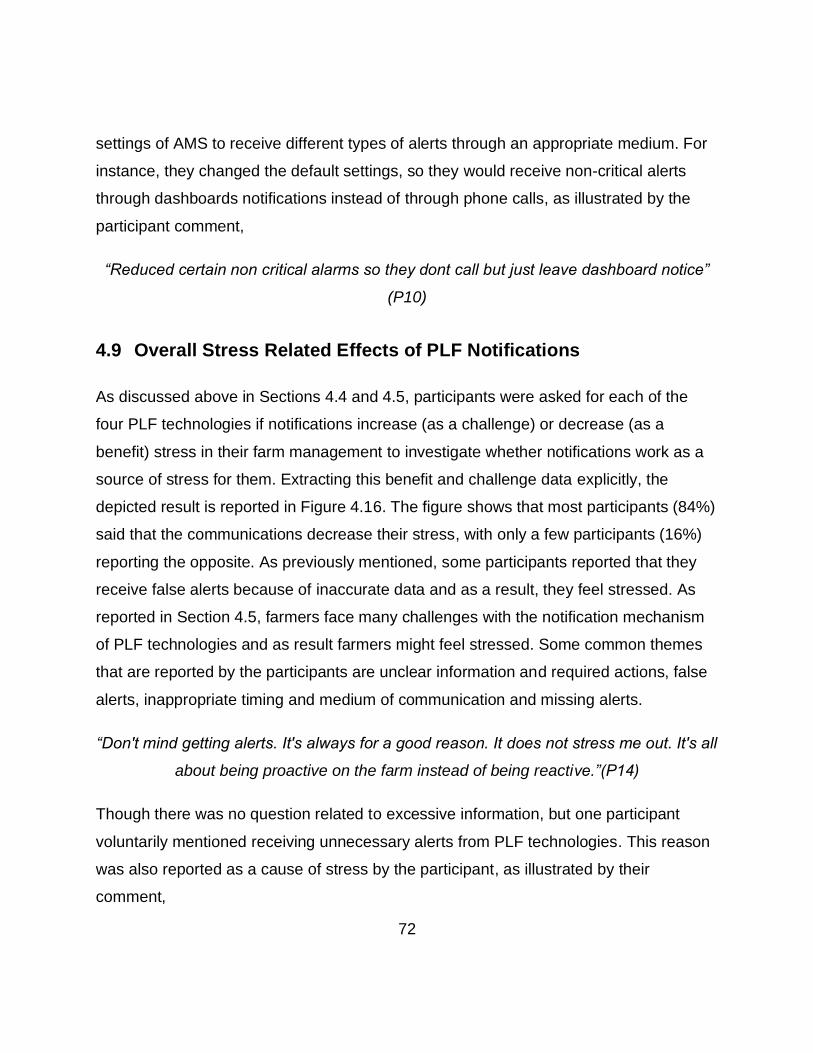
72
settings of AMS to receive different types of alerts through an appropriate medium. For
instance, they changed the default settings, so they would receive non-critical alerts
through dashboards notifications instead of through phone calls, as illustrated by the
participant comment,
“Reduced certain non critical alarms so they dont call but just leave dashboard notice”
(P10)
4.9 Overall Stress Related Effects of PLF Notifications
As discussed above in Sections 4.4 and 4.5, participants were asked for each of the
four PLF technologies if notifications increase (as a challenge) or decrease (as a
benefit) stress in their farm management to investigate whether notifications work as a
source of stress for them. Extracting this benefit and challenge data explicitly, the
depicted result is reported in Figure 4.16. The figure shows that most participants (84%)
said that the communications decrease their stress, with only a few participants (16%)
reporting the opposite. As previously mentioned, some participants reported that they
receive false alerts because of inaccurate data and as a result, they feel stressed. As
reported in Section 4.5, farmers face many challenges with the notification mechanism
of PLF technologies and as result farmers might feel stressed. Some common themes
that are reported by the participants are unclear information and required actions, false
alerts, inappropriate timing and medium of communication and missing alerts.
“Don't mind getting alerts. It's always for a good reason. It does not stress me out. It's all
about being proactive on the farm instead of being reactive.”(P14)
Though there was no question related to excessive information, but one participant
voluntarily mentioned receiving unnecessary alerts from PLF technologies. This reason
was also reported as a cause of stress by the participant, as illustrated by their
comment,
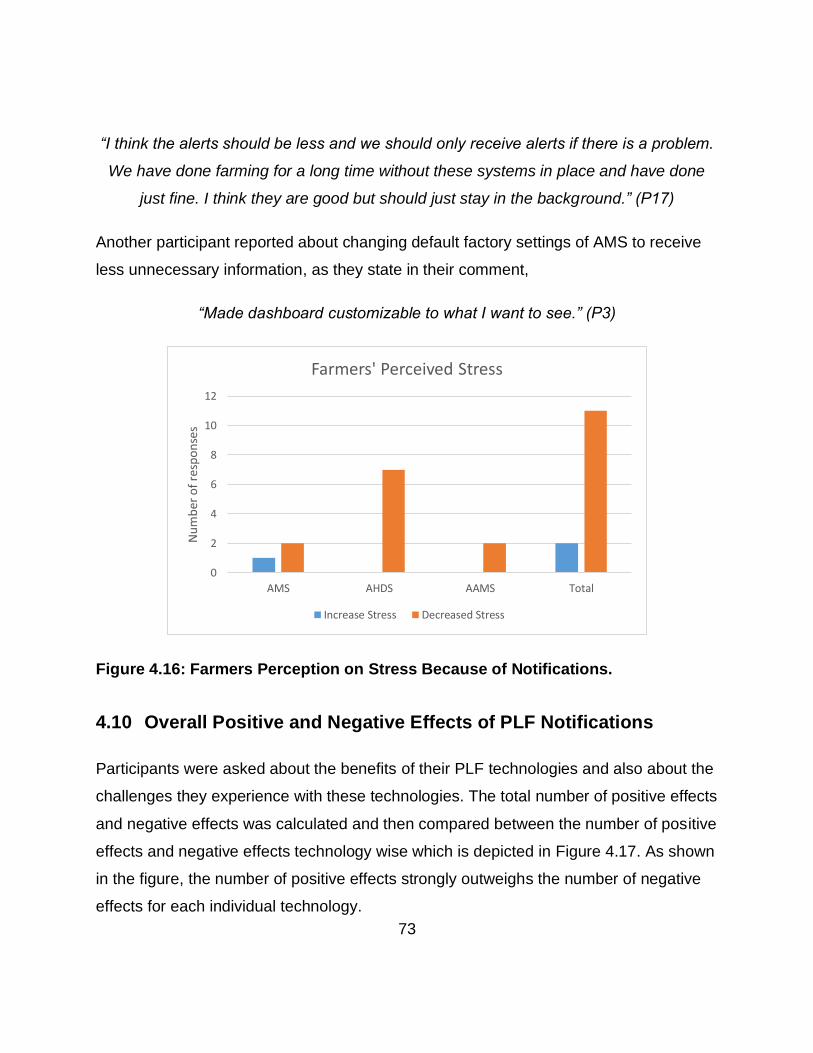
73
“I think the alerts should be less and we should only receive alerts if there is a problem.
We have done farming for a long time without these systems in place and have done
just fine. I think they are good but should just stay in the background.” (P17)
Another participant reported about changing default factory settings of AMS to receive
less unnecessary information, as they state in their comment,
“Made dashboard customizable to what I want to see.” (P3)
Figure 4.16: Farmers Perception on Stress Because of Notifications.
4.10 Overall Positive and Negative Effects of PLF Notifications
Participants were asked about the benefits of their PLF technologies and also about the
challenges they experience with these technologies. The total number of positive effects
and negative effects was calculated and then compared between the number of positive
effects and negative effects technology wise which is depicted in Figure 4.17. As shown
in the figure, the number of positive effects strongly outweighs the number of negative
effects for each individual technology.
0
2
4
6
8
10
12
AMS AHDS AAMS Total
Nu
mb
er o
f re
spo
nse
s
Farmers' Perceived Stress
Increase Stress Decreased Stress
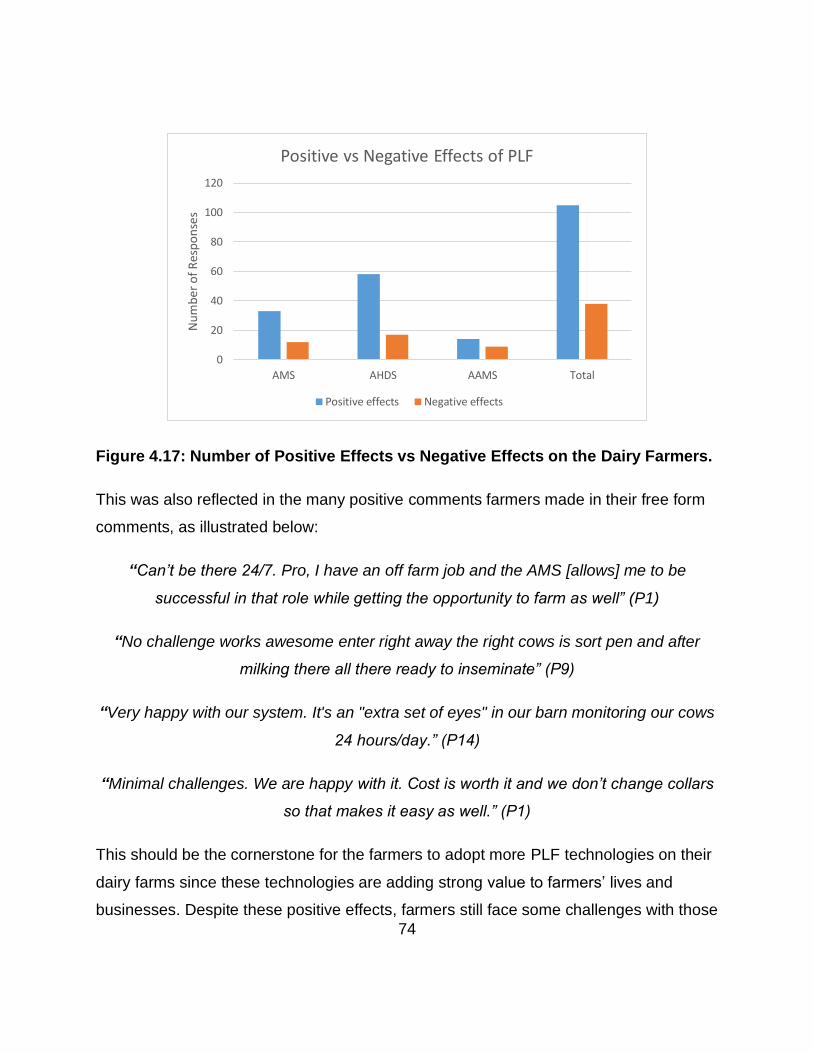
74
Figure 4.17: Number of Positive Effects vs Negative Effects on the Dairy Farmers.
This was also reflected in the many positive comments farmers made in their free form
comments, as illustrated below:
“Can’t be there 24/7. Pro, I have an off farm job and the AMS [allows] me to be
successful in that role while getting the opportunity to farm as well” (P1)
“No challenge works awesome enter right away the right cows is sort pen and after
milking there all there ready to inseminate” (P9)
“Very happy with our system. It's an "extra set of eyes" in our barn monitoring our cows
24 hours/day.” (P14)
“Minimal challenges. We are happy with it. Cost is worth it and we don’t change collars
so that makes it easy as well.” (P1)
This should be the cornerstone for the farmers to adopt more PLF technologies on their
dairy farms since these technologies are adding strong value to farmers’ lives and
businesses. Despite these positive effects, farmers still face some challenges with those
0
20
40
60
80
100
120
AMS AHDS AAMS Total
Nu
mb
er o
f R
esp
on
ses
Positive vs Negative Effects of PLF
Positive effects Negative effects
75
technologies. Therefore, there is still scope to improve these technologies from
functional and design perspectives to make the technologies more effective and easier
for farmers to use. In addition to the challenges experienced by farmers previously
reported, the following comments were provided by participants when probed for
potential design improvements that could better support their farm management and
decision making,
“Adjusting the time of when the alert is being made in relation to decreased cow activity,
generally relating in a health issue that needs to be addressed sooner.” (P11)
“Having team viewer27 on robots and manage technology from afar. More mobile
technology with robot.” (P1)
“I think the alerts should be less and we should only receive alerts if there is a problem.”
(P17)
“Additional alarms need to be added.” (P16)
As reflected in these comments, farmers have a variety of opinions about the features
they would like to have in their PLF notifications, including more alarms AND fewer
alarms. The implications of these disparate findings will be discussed in Chapter 5.
4.11 Findings Related to ACTDS
In this section, ACTDS data are presented separately since there was only four
participants who reported that they are used and received notifications from the
27 It is likely this comment refers to the commercial TeamViewer® (©TeamViewer, Germany) software applications
that allows remote control and sharing of a computer desktop interface (https://www.teamviewer.com).
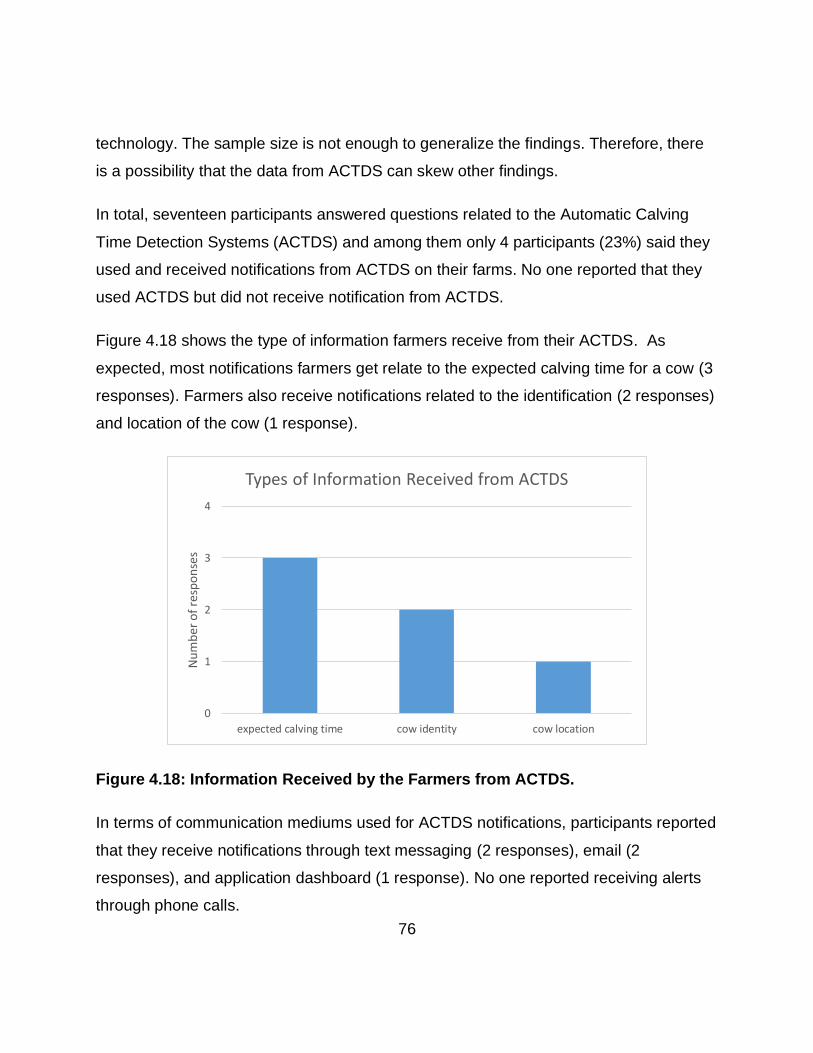
76
technology. The sample size is not enough to generalize the findings. Therefore, there
is a possibility that the data from ACTDS can skew other findings.
In total, seventeen participants answered questions related to the Automatic Calving
Time Detection Systems (ACTDS) and among them only 4 participants (23%) said they
used and received notifications from ACTDS on their farms. No one reported that they
used ACTDS but did not receive notification from ACTDS.
Figure 4.18 shows the type of information farmers receive from their ACTDS. As
expected, most notifications farmers get relate to the expected calving time for a cow (3
responses). Farmers also receive notifications related to the identification (2 responses)
and location of the cow (1 response).
Figure 4.18: Information Received by the Farmers from ACTDS.
In terms of communication mediums used for ACTDS notifications, participants reported
that they receive notifications through text messaging (2 responses), email (2
responses), and application dashboard (1 response). No one reported receiving alerts
through phone calls.
0
1
2
3
4
expected calving time cow identity cow location
Nu
mb
er o
f re
spo
nse
s
Types of Information Received from ACTDS

77
Figure 4.19 depicts the reported benefits of ACTDS communications. Participants
reported that ACTDS notifications assisted them to accurately identify calving time of
each cow (3/4 responses) and decrease uncertainty around expected calving time (3/4
responses). They also reported general improvement in livestock health (3/4
responses), and labour related benefits (3/4 responses), such as reduced working hours
and easier to attract others to work on their farm. No farmer reported that the ACTDS
notifications decreased their stress.
Figure 4.19: Positive Effects of Sent Information from ACTDS on Farmers.
Figure 4.20 shows the reported challenges with ACTDS notifications. Participants
encounter several challenges, including they receive too many false alerts from the
system (2/4 responses), the system increases their stress (1/4 responses), the
communication medium is not effective sometimes (1/4 responses), the timing of
received messages sometimes interrupt more important work or life activities (1/4
0
1
2
3
4
Labour relatedbenefits
Improvedlivestock health
Accurately identifycalving time
Decreaseduncertainty
of calving time
Decreasedstress
Keep up withtechnology/future
Nu
mb
er o
f re
spo
nse
s
Benefits of ACTDS
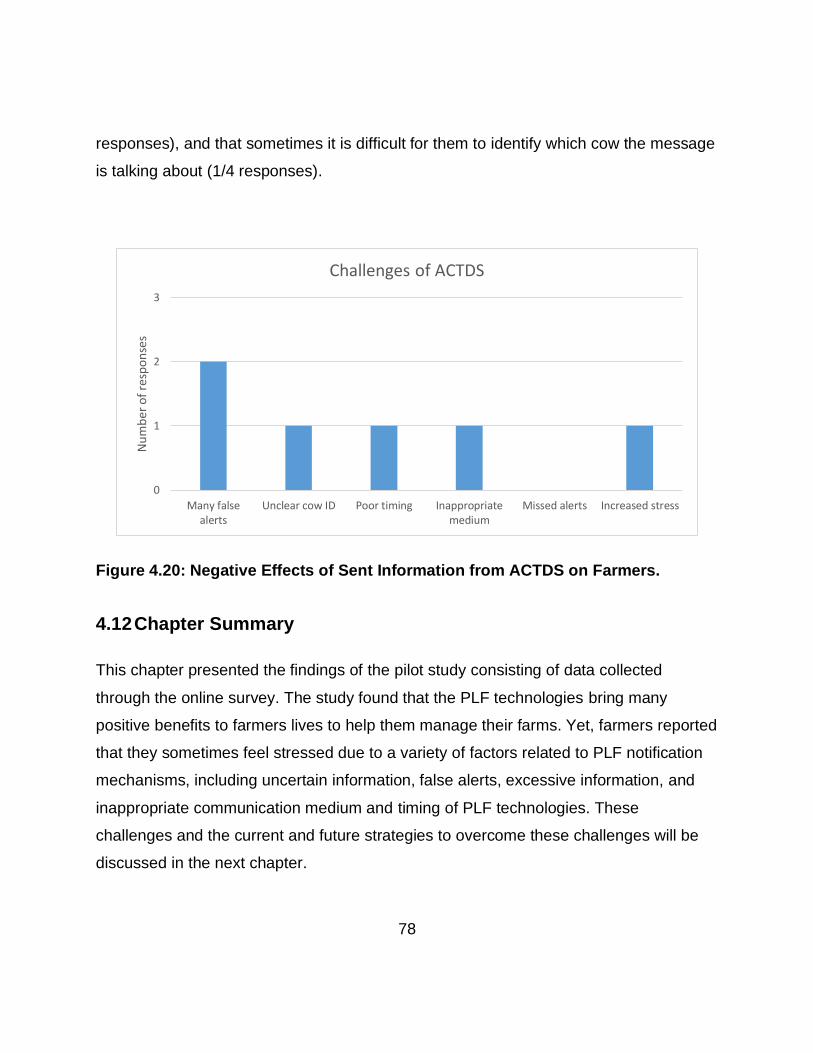
78
responses), and that sometimes it is difficult for them to identify which cow the message
is talking about (1/4 responses).
Figure 4.20: Negative Effects of Sent Information from ACTDS on Farmers.
4.12 Chapter Summary
This chapter presented the findings of the pilot study consisting of data collected
through the online survey. The study found that the PLF technologies bring many
positive benefits to farmers lives to help them manage their farms. Yet, farmers reported
that they sometimes feel stressed due to a variety of factors related to PLF notification
mechanisms, including uncertain information, false alerts, excessive information, and
inappropriate communication medium and timing of PLF technologies. These
challenges and the current and future strategies to overcome these challenges will be
discussed in the next chapter.
0
1
2
3
Many falsealerts
Unclear cow ID Poor timing Inappropriatemedium
Missed alerts Increased stress
Nu
mb
er o
f re
spo
nse
s
Challenges of ACTDS

79
Discussion
As discussed in Chapter 2, early PLF studies have revealed that dairy farmers
sometimes feel stressed due to notifications received from dairy PLF technologies.
Many factors are involved in this stress, including but not limited to the ineffective
representation of an individual animal’s information to the dairy farmers, technology
breakdown, and uncertainty around received information. Therefore, this research
investigated current notification mechanisms of commonly used dairy farming
technologies on Ontario dairy farms. This chapter revisits the research question
proposed in Chapter 1, “What effects do current notification mechanisms from
dairy precision livestock farming technologies have on dairy farmers?” and
discusses what insights the research findings provided in terms of answering this
question. The research findings are also discussed in the context of the existing
literature. Finally, potential design implications the study findings have for the improving
the utility and usability of future dairy PLF notification mechanisms are discussed from
the perspective of Human-Computer Interaction (HCI).
5.1 Information Management
Collecting information is not the only task of PLF technologies; additionally, these
technologies should process the information accurately and effectively using
appropriate models and algorithms developed from farmers' perspectives (King &
DeVries, 2018). Afterwards, that information should be passed to the farmers through
effective medium(s) at an appropriate time so that farmers can make profitable
decisions for their farms and animals to increase farm productivity and gross profit.
However, this pilot study revealed that sometimes the information received from PLF
notifications are not effective, or useful for making effective decisions for farm
80
operations or animal care. The study revealed several communication challenges
between farmers and PLF technologies, as discussed below.
5.1.1 Information Uncertainty
The study revealed that farmers sometimes receive vague or unclear information from
their PLF technologies. This results in uncertainty about what, if any, action they should
take after receiving a notification message. This finding is consistent with previous
studies on PLF technologies that also found that farmers were sometimes unsure of the
content or meaning of PLF notifications (e.g., (Borchers & Bewley, 2015; Russell &
Bewley, 2013). As reported in Chapter 4, after receiving a notification, eight out of 11
farmers who use AMS technology on their farms reported that it was sometimes
necessary to check the system for more details to determine what actions, if any, were
required in response to a notification from their AMS.
When probed about challenges they have with notifications from their PLF technologies,
four participants reported that they receive unclear messages from their AMS, and one
participant reported receiving vague messages from their AAMS. These findings
suggest that some PLF notification mechanisms are not effectively communicating the
content of their messages. Thus, some reported issues may remain unresolved. Two
participants mentioned that the messages from their AHDS do not reveal cow
identification. Obtaining this information requires additional interactions with the system,
as illustrated in one participant’s comment that a challenge they experience with their
AHDS is the, “lengthy process to get into slow app to find out which cow is in heat” (P5).
Yet, no actions can be taken without this information, as breeding is specific to an
individual cow. As explained in Section 2.2.4, a cow’s heat cycle can last from as little
as 2 hours up to 48 hours; thus, taking actions to find and breed a cow in heat requires
timely action on the farmer’s part. Providing cumbersome steps to help a farmer gather
key information about whether immediate actions are needed seems to be a significant

81
design flaw that warrants improvement. For instance, Participant 5 reported that their
AHDS system only sends a message saying, “cow in heat”, and that they are then
required to “open app to find out which cow and breeding status”. Therefore, there is a
chance of missing heat events and/or the insemination time window, which will reduce
farm productivity and gross farm profit.
Participant 13 reported that the message from their AAMS does not clearly mention the
required action due to unclear messages; therefore, farmers sometimes do not know
what to do. Research from the field of neurobiology has shown that there is a strong
connection between uncertainty and stress and that this type of stress can have
negative health impacts (Peters et al., 2017). While in some cases some more specific
information may be available, but only after additional system interaction (e.g., opening
the software application, navigating to the proper screen, etc.). These additional steps
introduce additional, and potentially, unnecessary cognitive and physical workload.
Thus, whenever key information that is required for decision-making or action it should
be sent with the notification so that farmers has a clear idea about their required action.
The findings of uncertain information from this research is consistent with previous
studies of PLF technologies (Hansen, 2015; Ndour et al., 2017). These studies report
that farmers feel stressed due to the information they receive from PLF technologies.
5.1.2 Inappropriate Communication Timing
A notification should be sent at the right time to help farmers manage their farm better
by making effective decisions based on the received information. Consistent with prior
research (Mollenhorst et al., 2012), this study found that sometimes notifications are
sent at times that are not effective for farmers to make a decision or take an appropriate
action. Three participants reported that they do not get notifications from AMS on time,
and two participants mentioned that they do not receive alerts from AHDS at the
appropriate time.
82
As mentioned above, the notifications from AHDS are time-sensitive because they send
information regarding the heat events of a cow that need to be acted on within a very
small window of time. If the farmers are not notified about the heat event of a cow, or
notified too late, then there will be production loss, as mentioned earlier. Participant 2
reported that the information they receive in their AHDS application is about four hours
behind. This delayed notification also delays timely decision-making and actions needed
to find and breed a cow in heat. For cows with very short heat windows (e.g., 3 hours),
this delay may mean the breeding opportunity is lost.
Similarly, Participant 11, an AAMS user, reported that their system is designed to notify
farmers about abnormal behaviour after two days of “decreased inactivity”. They felt this
was too long to wait to hear about a potential “health issue that needs to be addressed
sooner” and were planning to “contact company to make a change on this”, showing
their displeasure with this feature.
Another issue revealed by the study was “unnecessary” notifications sent to farmers late
at night from AMS, which was frustrating for them. To avoid this, the study revealed that
some farmers (6/11 AMS users) changed the system notification settings from the
factory defaults to reduce non-urgent notifications and notifications that did not require
actions from the farmer (e.g., notifications related to system cleaning), and to manage
the timing of notifications. Therefore, future dairy PLF technology manufacturers should
consider communication timing because it plays a vital role in farmer’s making
appropriate, timely decisions (Bahir et al., 2019). Appropriate notification times will
assist farmers in making the right decision at the right time.
5.1.3 Communication Medium
An urgent issue should be brought to the attention of appropriate person through one or
more mediums so farmers do not miss the issue but at the same time, it should not be
overwhelming to the farmers. Urgent issues should be communicated with farmers
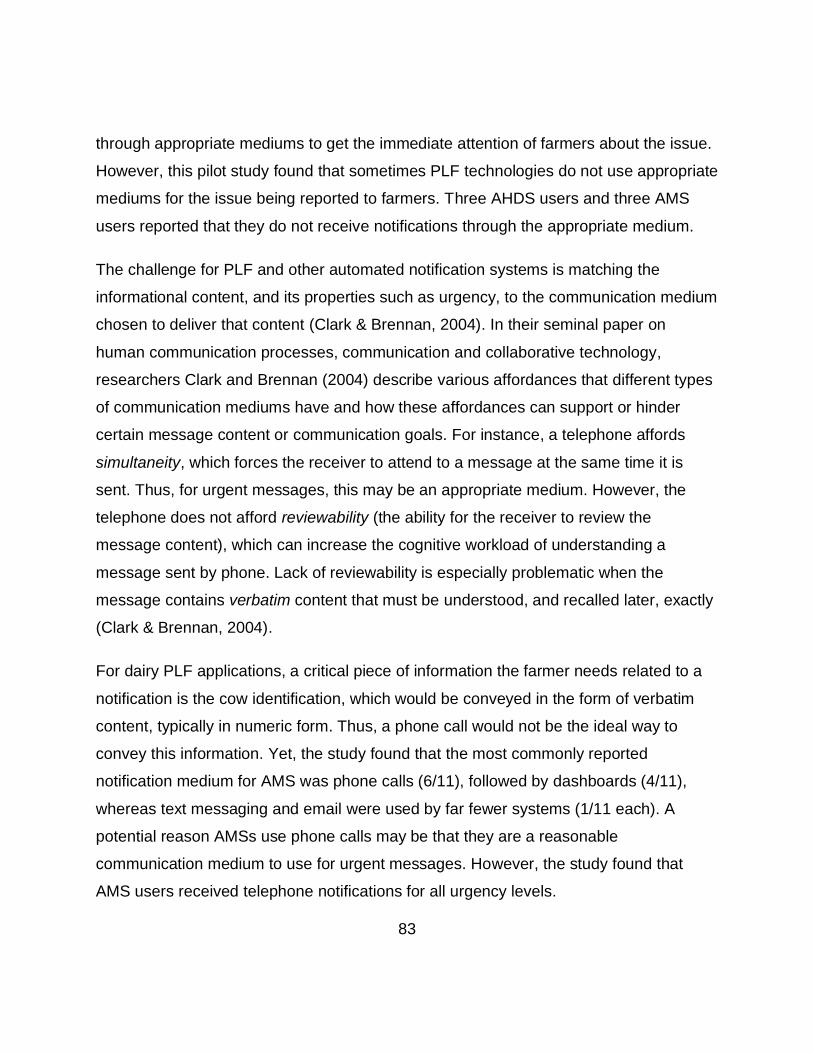
83
through appropriate mediums to get the immediate attention of farmers about the issue.
However, this pilot study found that sometimes PLF technologies do not use appropriate
mediums for the issue being reported to farmers. Three AHDS users and three AMS
users reported that they do not receive notifications through the appropriate medium.
The challenge for PLF and other automated notification systems is matching the
informational content, and its properties such as urgency, to the communication medium
chosen to deliver that content (Clark & Brennan, 2004). In their seminal paper on
human communication processes, communication and collaborative technology,
researchers Clark and Brennan (2004) describe various affordances that different types
of communication mediums have and how these affordances can support or hinder
certain message content or communication goals. For instance, a telephone affords
simultaneity, which forces the receiver to attend to a message at the same time it is
sent. Thus, for urgent messages, this may be an appropriate medium. However, the
telephone does not afford reviewability (the ability for the receiver to review the
message content), which can increase the cognitive workload of understanding a
message sent by phone. Lack of reviewability is especially problematic when the
message contains verbatim content that must be understood, and recalled later, exactly
(Clark & Brennan, 2004).
For dairy PLF applications, a critical piece of information the farmer needs related to a
notification is the cow identification, which would be conveyed in the form of verbatim
content, typically in numeric form. Thus, a phone call would not be the ideal way to
convey this information. Yet, the study found that the most commonly reported
notification medium for AMS was phone calls (6/11), followed by dashboards (4/11),
whereas text messaging and email were used by far fewer systems (1/11 each). A
potential reason AMSs use phone calls may be that they are a reasonable
communication medium to use for urgent messages. However, the study found that
AMS users received telephone notifications for all urgency levels.

84
Another potential reason AMSs use phone calls may be because AMS technology is
substantially older than the other PLF technologies probed in this study, none of which
were reported to use phone calls as a notification medium. AMSs were first introduced
to Ontario dairy farms in 1999 and have seen increasing adoption since then
(Rodenburg, 2012). Certainly 20 years ago, mobile phones were not as ubiquitous in
Ontario as they are today; thus, it makes sense that these systems would have been
built to rely on available communication mediums and technologies used at the time in
farm management: traditional landline phones and desktop computers.
Text messaging may have an advantage over phone calls for providing notifications of
urgent issues, based on the communication affordances discussed above. With the
appropriate native phone notification settings selected on a farmer’s phone, an incoming
message can provide an immediate, attention-getting alert, creating at least a partial
simultaneity affordance. The fact that most modern smartphones allow recent text
messages to be viewed immediately, sometimes without even unlocking the phone,
further creates this affordance. Finally, as a text message can be read and reviewed
multiple times, it provides the reviewability affordance that supports message
interpretation, especially for verbatim message content.
Clark and Brennan also discuss the affordance of audibility, or the ability for people to
hear each other when communicating. While this affordance is often associated with
phone calls, the reality of modern-day telecommunications is that phone calls received
on a mobile phone when someone is in a noisy environment (e.g., in a tractor or other
loud farm setting) or with poor cell phone service, audibility is often compromised. Thus,
text messages may be the better medium, as the entire message is typically received
without issue (as long as some, even intermittent, cell service is available).
Text messaging has also other advantages for notifications. For instance, if a farmer
misses a phone call regarding an urgent issue, it may be appropriate for the system to
use multiple notification mediums, for example, a phone call and text messaging, for
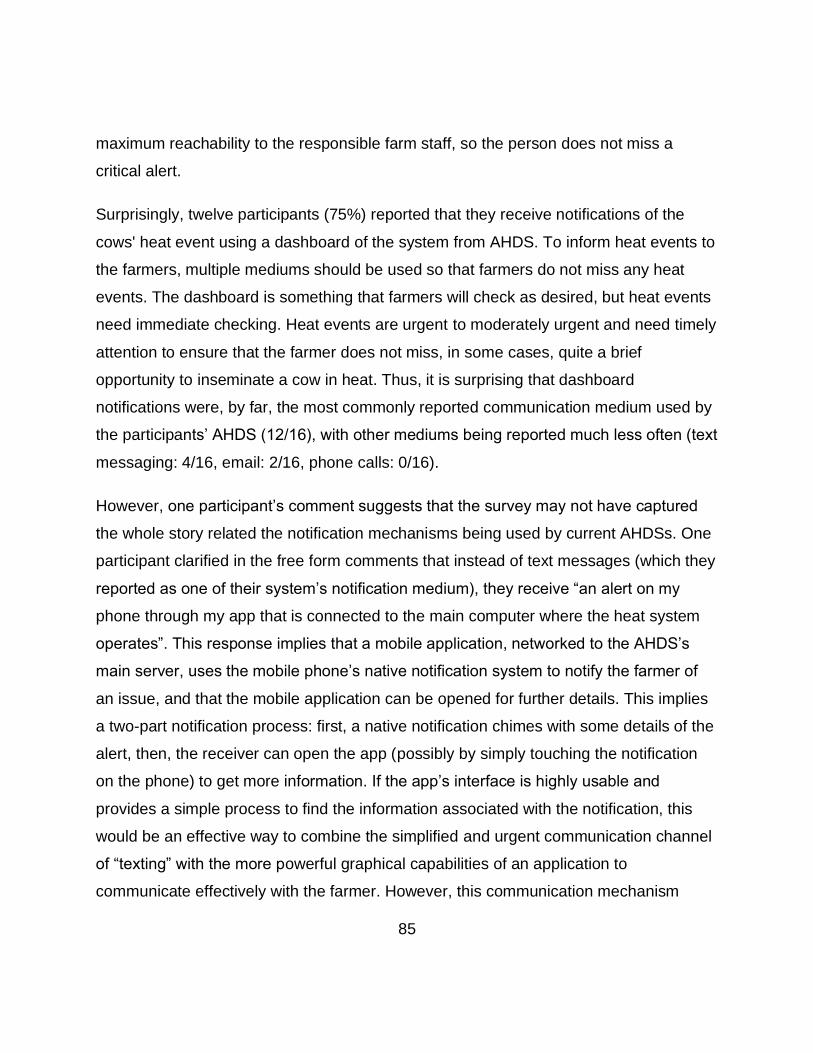
85
maximum reachability to the responsible farm staff, so the person does not miss a
critical alert.
Surprisingly, twelve participants (75%) reported that they receive notifications of the
cows' heat event using a dashboard of the system from AHDS. To inform heat events to
the farmers, multiple mediums should be used so that farmers do not miss any heat
events. The dashboard is something that farmers will check as desired, but heat events
need immediate checking. Heat events are urgent to moderately urgent and need timely
attention to ensure that the farmer does not miss, in some cases, quite a brief
opportunity to inseminate a cow in heat. Thus, it is surprising that dashboard
notifications were, by far, the most commonly reported communication medium used by
the participants’ AHDS (12/16), with other mediums being reported much less often (text
messaging: 4/16, email: 2/16, phone calls: 0/16).
However, one participant’s comment suggests that the survey may not have captured
the whole story related the notification mechanisms being used by current AHDSs. One
participant clarified in the free form comments that instead of text messages (which they
reported as one of their system’s notification medium), they receive “an alert on my
phone through my app that is connected to the main computer where the heat system
operates”. This response implies that a mobile application, networked to the AHDS’s
main server, uses the mobile phone’s native notification system to notify the farmer of
an issue, and that the mobile application can be opened for further details. This implies
a two-part notification process: first, a native notification chimes with some details of the
alert, then, the receiver can open the app (possibly by simply touching the notification
on the phone) to get more information. If the app’s interface is highly usable and
provides a simple process to find the information associated with the notification, this
would be an effective way to combine the simplified and urgent communication channel
of “texting” with the more powerful graphical capabilities of an application to
communicate effectively with the farmer. However, this communication mechanism

86
requires multiple steps for farmers to gather the information they need to make a
decision or take appropriate actions. Thus, the information provided at each step, and
the process from one step to another should be well thought out and streamlined.
The choice of notification medium is important and should be matched to the level of
urgency and also to the informational content of the message (Mehrotra et al., 2015).
For example, PLF notification mechanisms should classify messages into urgent,
moderately urgent, and non-urgent and use different mediums for different levels of
urgency to communicate with the farmers. Likewise, a previous study of notification
management discussed in Section 2.6 proposed to classify notifications into very
urgent, urgent, moderately urgent and not urgent , and timing of sending notifications
can be decided based on the urgency levels (Dabbish & Baker, 2003). This study found
that some existing systems allow for such distinctions, although settings may need to be
changed from the factory default notification settings to select which types of
notifications should be sent when and to which medium. For example, Participant 10, an
AMS user, reported that they modified the system’s default settings to “reduce certain
noncritical alarms” sent by phone call and instead, “just leave dashboard notice[s]” for
these issues.
For extremely urgent issues, use of multiple different communication mediums, such as
phone calls and text messaging or native mobile phone notifications, may help ensure
the farmer are aware of the issue immediately and can take timely action. For instance,
the system could make a phone call for urgent issues and if no one receives the phone
call then the system could send a text message to communicate the issue. However, if
the notification contains verbatim content then it may be better to make a phone call to
communicate the urgency of the issue and also to send an accompanying text message
so that receiver can review the information later. On the other hand, non-urgent
notifications can be sent to the dashboard for farmers to check whenever convenient.
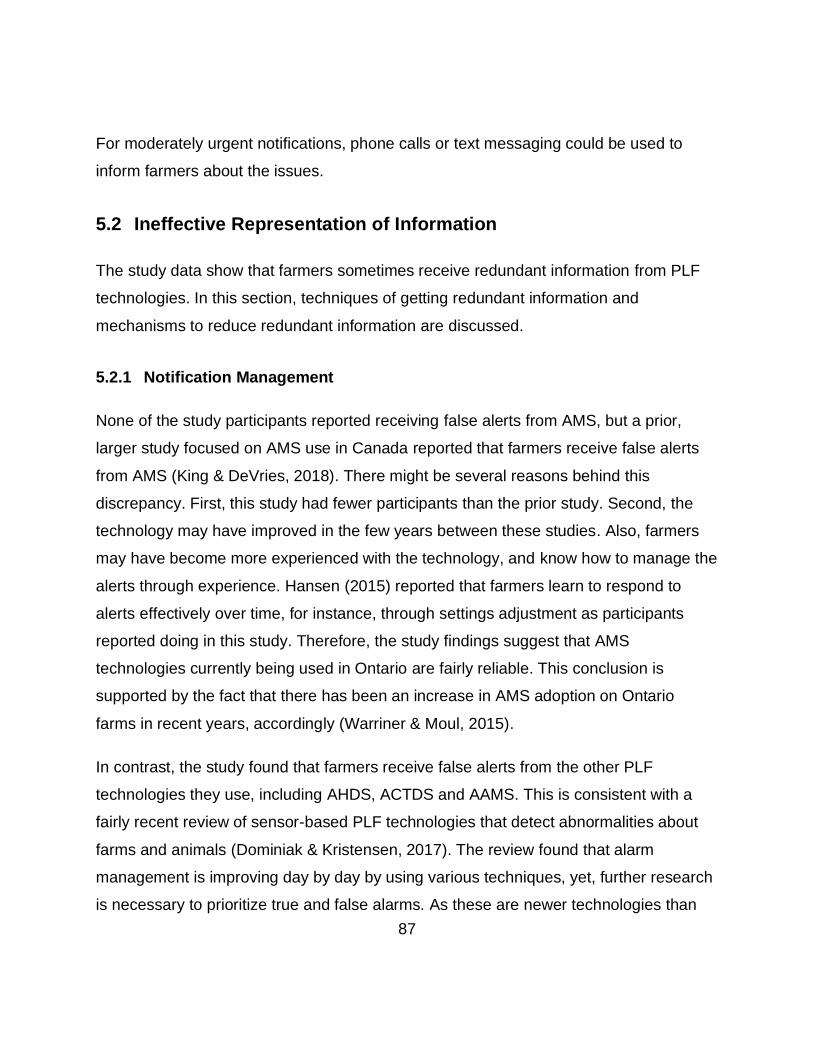
87
For moderately urgent notifications, phone calls or text messaging could be used to
inform farmers about the issues.
5.2 Ineffective Representation of Information
The study data show that farmers sometimes receive redundant information from PLF
technologies. In this section, techniques of getting redundant information and
mechanisms to reduce redundant information are discussed.
5.2.1 Notification Management
None of the study participants reported receiving false alerts from AMS, but a prior,
larger study focused on AMS use in Canada reported that farmers receive false alerts
from AMS (King & DeVries, 2018). There might be several reasons behind this
discrepancy. First, this study had fewer participants than the prior study. Second, the
technology may have improved in the few years between these studies. Also, farmers
may have become more experienced with the technology, and know how to manage the
alerts through experience. Hansen (2015) reported that farmers learn to respond to
alerts effectively over time, for instance, through settings adjustment as participants
reported doing in this study. Therefore, the study findings suggest that AMS
technologies currently being used in Ontario are fairly reliable. This conclusion is
supported by the fact that there has been an increase in AMS adoption on Ontario
farms in recent years, accordingly (Warriner & Moul, 2015).
In contrast, the study found that farmers receive false alerts from the other PLF
technologies they use, including AHDS, ACTDS and AAMS. This is consistent with a
fairly recent review of sensor-based PLF technologies that detect abnormalities about
farms and animals (Dominiak & Kristensen, 2017). The review found that alarm
management is improving day by day by using various techniques, yet, further research
is necessary to prioritize true and false alarms. As these are newer technologies than
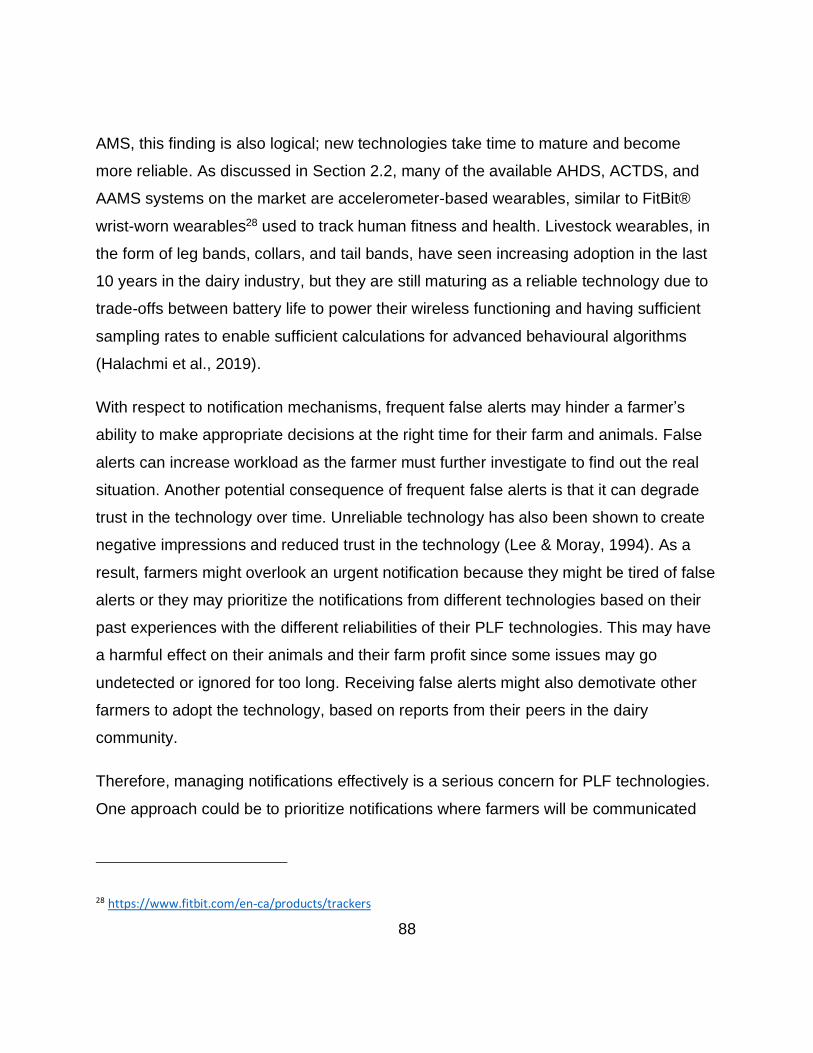
88
AMS, this finding is also logical; new technologies take time to mature and become
more reliable. As discussed in Section 2.2, many of the available AHDS, ACTDS, and
AAMS systems on the market are accelerometer-based wearables, similar to FitBit®
wrist-worn wearables28 used to track human fitness and health. Livestock wearables, in
the form of leg bands, collars, and tail bands, have seen increasing adoption in the last
10 years in the dairy industry, but they are still maturing as a reliable technology due to
trade-offs between battery life to power their wireless functioning and having sufficient
sampling rates to enable sufficient calculations for advanced behavioural algorithms
(Halachmi et al., 2019).
With respect to notification mechanisms, frequent false alerts may hinder a farmer’s
ability to make appropriate decisions at the right time for their farm and animals. False
alerts can increase workload as the farmer must further investigate to find out the real
situation. Another potential consequence of frequent false alerts is that it can degrade
trust in the technology over time. Unreliable technology has also been shown to create
negative impressions and reduced trust in the technology (Lee & Moray, 1994). As a
result, farmers might overlook an urgent notification because they might be tired of false
alerts or they may prioritize the notifications from different technologies based on their
past experiences with the different reliabilities of their PLF technologies. This may have
a harmful effect on their animals and their farm profit since some issues may go
undetected or ignored for too long. Receiving false alerts might also demotivate other
farmers to adopt the technology, based on reports from their peers in the dairy
community.
Therefore, managing notifications effectively is a serious concern for PLF technologies.
One approach could be to prioritize notifications where farmers will be communicated
28 https://www.fitbit.com/en-ca/products/trackers
89
only about relevant issues at appropriate times, as discussed above. For instance, a
study discussed in Section 2.6 proposed to decide whether to send a notification to the
users based on urgency level of the notification, the activity of the user, the social
activity of the user (e.g., talking with someone), the social situation (e.g., on a bus) and
location of the user (Kern & Schiele, 2003). To better understand what “relevant” and
“appropriate” is, user-centric and/or participatory design studies could be conducted by
researchers or manufacturers to better understand farmers’ needs and preferences
regarding notifications from their technologies.
Another approach to improve the utility of the notifications that are sent to farmers or
that appear in the application dashboards may be to rank or prioritize notifications to
help farmers better understand the urgency level of the issue. For instance, issues such
as calving time, insemination time, or severe temperature or lameness, which need
immediate attention, could be ranked highest. In contrast, non-urgent matters, such as
the slightly reduced amount of milk yield, that could be addressed after a specific period
could be ranked lowest. Return on Investment (RoI) or profit should be a key priority
while ranking the alarms and profit can be ensured by ensuring animal health, less
production cost, and high productivity. Therefore, these factors should be considered
while designing ranking systems for PLF notifications.
Ideally, improving the underlying health and behavioural detection accuracy of the
technologies would help reduce the number of false alerts farmers receive. Yet, the
reality is that many PLF technologies are, and will continue to be, less than 100%
reliable for some time. So, notifications from these systems will continue to have errors
(both false positives and false negatives). As this is a known, common problem for early
automation systems across many domains, human factors researchers have proposed
displaying reliability information about automated processes to assist people in
understanding the system state and making more appropriate decisions in light of
automatic notifications (Beller et al., 2013; Wang et al., 2009). A recent study of human-
90
automation collaboration showed that providing people with overall likelihood values of
potential threats automatically detected by the system during a surveillance task found
that people showed an appropriate level of trust and reliance on the automation (rather
than over/under-trusting or under/over-relying on the system) and performed well at the
task (Du et al., 2019). A similar approach could be taken in PLF notification systems,
where notifications are accompanied by an indication of how likely the event is. For
instance, a calving notification could be accompanied by a likelihood score or
confidence value.
5.2.2 Information Overload
Though in this study did not explicitly probe farmers about information overload, a few
farmers reported that they receive unnecessary information from their PLF technologies.
For example, Participant 17 commented that they think that “the alerts should be less,
and we should only receive alerts if there is a problem”. Participant 3 reported that their
AMS sends many unnecessary notifications to the system's dashboard, and that they
adjusted the settings so that only the necessary information is shown. This is consistent
with prior research that has reported that farmers sometimes receive excessive and
unnecessary information from PLF technologies (Borchers & Bewley, 2015; Russell &
Bewley, 2013). As mentioned in Section 2.4, information overload can create negative
impressions of the technologies which produce and send excessive and unnecessary
information.
Receiving unnecessary information is sometimes overwhelming and stressful for
farmers (Dominiak & Kristensen, 2017; Hansen, 2015; Schewe & Stuart, 2015). In
general, receiving unnecessary information can create information fatigue leading to
missing needed information for users to take into account during decision making
(Buchanan & Kock, 2001). A study on information overload from social media found
that users can experience social media fatigue due to information overload, which leads

91
to intermittent use of social media (Fu et al., 2020). PLF technology designers would
want to avoid farmers adopting a similar strategy for handling information overload they
may feel from PLF notifications. Thus, minimizing the amount of unnecessary
information PLF technology send to farmers via notifications, and providing the
information in an effective way, is crucial.
A study on computer-mediated technologies found that communications from the
automated technologies can be overwhelming if the communication systems are not
well structured (Hiltz & Turoff, 1985). As mentioned in Section 2.4, receiving
unnecessary information may also hamper making effective decisions. A study on
smartphone notifications, also discussed in Section 2.6, reported that excessive
notifications can reduce users’ productivity and can negatively impact users’
physiological well-being (Kushlev et al., 2016). Therefore, PLF notifications should be
managed effectively to provide only relevant information. Moreover, the communication
medium used, and the design of the content presented in that medium, should be
structured based on the information need and the ability of the users (Hiltz & Turoff,
1985).
Ensuring that farmers get sufficient, but not overwhelming information for them to make
proper decisions is difficult. Developing effective visualization techniques for PLF
applications and their dashboards may help. For example, the previously discussed
‘Scope’ system (see Section 2.6), presented different information notifications on a
screen spatially arranged based on their importance level, with more important
notifications displayed towards the center of the display (Van Dantzich et al., 2002). In
the case of PLF, a similar visual presentation could be displayed on an application
dashboard with notifications of different urgency spatially organized in a meaningful
manner. This contrasts many PLF notification displays that often list system notifications
in chronological order. Again, however, determining what information is most “relevant”
in different contexts and what information presentations are most appropriate for dairy
92
farmers should be done through user-centric design methodologies, like involving
farmers in participatory design or in iterative design cycles, where designs are evolved
with frequent, and early, involvement of relevant stakeholders (Rogers et al., 2015).
Users also should be provided with the control to manage the information they receive
to reduce information overload since they can control the incoming information
according to their needs (Hiltz & Turoff, 1985). As mentioned in Section 2.4, data
representation experts can evaluate the communication systems to present data in
effective way for the farmers. These techniques can help reduce excessive and
irrelevant information.
5.3 Effects of PLF Notifications on Farmers
PLF technologies have a considerable effect on the farmers, their farm management,
and their daily lifestyles. The results of this pilot study suggest that notifications from
currently used PLF technologies have more positive effects than detrimental effects on
dairy farmers. This finding indicates that dairy farmers should continue to integrate PLF
technologies into their farms in the future. However, the study did uncover some
adverse effects of the communications from PLF on farmers, even with the small
number of participants in this study. Some farmers said that they feel stressed because
of the notifications they receive from PLF technologies. These findings will be discussed
in this section.
5.3.1 Are Notifications a Source of Stress?
As previously mentioned, prior research conducted in Europe found that farmers
sometimes feel stressed because of PLF notifications (Hansen, 2015). Though most
participants in this study reported that they are not stressed because of PLF
notifications, five participants reported stress levels of 3 or above (on a 0-10 scale;
0=not at all stressed, 10=extremely stressed) arising from receiving PLF notifications,
93
and two reported stress levels above 6. Moreover, six participants reported stress levels
of 3 to 5 (same scale as above) related to sometimes feeling stressed knowing that they
might receive a notification at any moment.
Participants also reported that they also sometimes feel stressed upon receiving a
notification based on the type of information in the notification. This finding is consistent
with prior studies (Hansen, 2015; Ndour et al., 2017), which uncovered several reasons
for farmers’ stress, including unclear information, unclear required actions, false alerts,
timing of alerts, and technology breakdowns. Most of these issues were uncovered in
this study, as discussed above, except for technology breakdowns, which were
mentioned as a source of stress by some farmers but were not probed explicitly in this
study. For example, Participant 3, an AMS and AHDS user, commented that it is
stressful when notifications relate to equipment breakdowns because “if it breaks down
it will be expensive to fix”.
Farmers also reported that stress was created when they had to stop what they were
doing to check an issue, or when they receive an alert while off the farm (e.g., attending
an event) and there is no one else available to solve the problem. For example,
Participant 17 commented that when they receive a notification, they always stop what
they are doing and “look [at the notification/app] and during that time period I get
nervous and increased anxiety”. These findings are not surprising, given the nature of
livestock farming, and some of these issues (e.g., if something goes wrong while the
farmer is away from the farm) were sources of stress even before integrating PLF
technologies on the farms. Some participants commented that the PLF notifications
helped reduce some of this stress though. For instance, Participant 1 commented that
their AMS allows them to have an off-farm job while still farming and reported
“decreased stress” as a benefit of their AMS. Yet, the same participant also reported
that their AMS sometimes interrupted more important work or life activities, that
sometimes they missed important / urgent messages from their AMS, and that they
94
experienced increased stress because they could receive a message at any moment.
Thus, it seems that managing stress related to PLF technologies is complex, as the
same technology can both be a source of stress and a means to decrease stress.
As mentioned above, farmers reported sometimes receiving unnecessary alerts in the
middle of the night, which can be very frustrating for them. However, since many
notifications relate to abnormal issues arising from either the equipment or any animal,
the informational content of the notification itself can be a source of anxiety or stress, as
evidenced by Participant 1’s comment about the source of stress they experience from
their AMS, “Robot is broken. Needs fixing and I’m at work”.
In summary, the study findings show that though there are many advantages of PLF
notification, in some cases, notifications work as a source of stress for farmers. A
notifications study from the field of HCI found that notifications sometimes create stress
and interruptions, especially while doing important tasks (Pielot & Rello, 2015). The
correlation analysis presented in Section 4.6 suggest that farm size and years of
experience play important roles in the level of stress experienced by farmers. The
findings show a moderate positive correlation between the size of the farm and the
number of alerts they reported receiving daily (r=0.435). A positive relationship between
these two variables makes sense, as the more cows being managed should logically
produce more issues about which a farmer may be notified. In fact, one would expect a
strong correlation between these variables, stronger than was found. This is likely
explained by the strong negative correlation that was found between the years of
experience of the farmer and the level of stress they experienced related to PLF
notifications (r=-0.709). Over time, many farmers learn to adjust their PLF notification
settings to help better manage the communication medium (or settings of that medium),
the information they receive, and when they receive different types of information. For
instance, Participant 17, an AHDS user, commented that they “changed the alerts on
my device so it just vibrates” to help mange the stress related to receiving PLF
95
notifications. They also mentioned, “As I get more used to receiving alerts (we just
started [with their AHDS] less then a year ago) I start to feel less anxious.” (P17). With
experience, farmers learn better how to deal with notifications and develop strategies to
help manage reduce stress related to receiving PLF notifications, as discussed below.
Though, there will be pros and cons of PLF technologies, the study revealed that the
positive effects of these technologies significantly outweigh the disadvantages, at least
for the study participants. Most of the technologies are at their initial stages and will be
improved day by day.
5.3.2 Strategies to Overcome Stress
The study revealed that, as farmers become familiar with their PLF systems, they find
strategies to cope with the numerous notifications sent by these systems and to help
them manage stress associated with receiving these notifications.
As discussed above, many farmers change the settings on their PLF systems to change
the type, urgency level, timing, or delivery method (i.e. medium) of system notifications
as a means of managing the stress associated with PLF notifications.
Some farmers teach their family members how to operate their farms so that, in case of
the farmers’ absence, their family members can take care of the farm, and if any issue
arises, their family members can handle it. Other farmers reported managing their
stress by keeping themselves relaxed by listening to music while they are working.
Another strategy to manage stress related to PLF systems uncovered in the study was
to install multiple, redundant systems so that if one fails, another one can back it up.
Participants 1 and 2 both reported installing more than one AMS, even when it was not
necessarily due to the number of cows on their farm. This way they have a backup if
one breaks down. If an AMS breaks down, there can be significant milk production loss
and farmers (and their animals) can be very stressed, as evidenced by Participant 2’s
96
explanation of why they installed two robots for their 70 cows, “Before when we had 60
cows on one robot, stress level was extremely high as any downtime was affecting
production, potentially cattle health, and income.”
In the future, technologies should allow users to customize the settings to receive
notifications based on their own preferences. Whenever a technology is installed on a
farm the farm staff should be trained to understand the technology and notification
mechanism so they can understand the notifications better. It will help minimize their
stress when they receive a non urgent notification. As mentioned above, prioritizing
notifications and reducing false alerts by improving the technology may be one strategy
to reduce stress for the farmers (Dominiak & Kristensen, 2017). As mentioned in
Section 5.2.2, adopting design concepts from the ‘Scope’ visualization display (Van
Dantzich et al., 2002), where notifications are spatially arranged based on the urgency
level on the application dashboard screen may be another way to reduce stress.
Notification timing could be determined based on the urgency level of the notifications to
reduce stress as proposed by Dabbish & Baker (2003).
5.4 Discussion on Miscellaneous Findings
Consistent with this study, which found that eleven out of eighteen participants (61.1%)
use AMS on their farm, previous research has found that many Ontario farms use AMS
(Duncan, 2018; Rodenburg, 2012). Surprisingly though, the study also found that AHDS
and AAMS are frequently used as well. Sixteen participants (88.9%) reported using
AHDS on their farms, and thirteen participants (72.2%) said that they use AAMS on
their farms (much fewer (5 participants) reported receiving automated notifications from
their AAMS systems). This finding was unexpected based prior discussions with the
dairy experts and the literature review.
Another surprising finding was that most ACTDS, AHDS and AAMS technologies do not
send the location of the cow to the farmers. In a study of ACTDS in Italy (Calcante et al.,
97
2014), they reported that farmers receive a cow's geographical coordinates when they
receive calving alerts. However, their study was about outdoor farming. In Ontario,
many dairy farms are indoor facilities. Thus, this may be the reason behind not receiving
the cow's location. However, recent PLF innovations, such as the commercial
SmartBow®29 ear tag-based activity monitor (©Zoetis, Austria), provides the precise
location of a cow within a barn setting, visualized in the system’s mobile, tablet or
desktop app, based on an installed network of localization receiver nodes. Based on
discussions I had with Zoetis company representatives, the SmartBow technology was
recently acquired by a start-up in Europe; thus, it seems this type of indoor location
capability is only a recent technology capability. Yet, for large farms especially, having a
cow’s location provided with any notification related to an urgent, time-critical issue
would help facilitate immediate and appropriate actions.
Though return on investment (RoI) is something essential to think about before
integrating any new technologies on a farm (Russell & Bewley, 2013), this is not always
a farmers’ top priority, or only priority, when adopting a technology. In this study, some
farmers reported that they sometimes adopted technologies to go with the flow, to keep
themselves up with the technology, and to change their workload and lifestyles. This
finding is similar to the previous study conducted in Europe (Billon & Pomiès, 2006).
They found that some farmers adopt technology to maintain their status and pride within
their circle. Therefore, technology need not always bring direct financial benefits for
farmers; instead, some technologies can improve their lifestyles, or reduce their mental
and physical workload. In Ontario, farmers need to provide data to the regulatory board
about the milk to ensure that their milk is of good quality. AMS made their life easier to
collect those data about their milk for the regulatory board since the data for regulatory
29 https://www.smartbow.com/
98
board are automatically collected by the AMS and kept available for the regulatory
authority to inspect anytime30.
On the other hand, farmers also get to know the substances and quality of their
produced milk, and that helps them to improve the milk quality. Because if they know
about any unusual content such as somatic cell count, they can resolve this issue by
taking necessary steps like changing feed to enhance or ensure the quality of their
produced milk (Alhussien & Dang, 2018).
A key benefit of the PLF technologies reported in this study was that they helped
farmers manage animals’ health. The study found that all technologies report abnormal
issues to the farmers. This finding is consistent with previous research (Colak et al.,
2008; King & DeVries, 2018; Kossaibati & Esslemont, 1997; Mee, 2004; Tse et al.,
2017). Reporting of abnormal issues has helped to reduce a remarkable amount of
physical workload. Nowadays, farmers do not need to check every individual cow and
equipment separately since they also receive alerts about technology breakdowns.
A few farmers also reported that they miss urgent alerts from technologies, possibly
caused by two main reasons. One reason might be the excessive number of
notifications, which can result in overlooking an urgent alert. Another reason might be
the technology could not detect the issue. Notifications can be classified and prioritized
based on the urgency level as mentioned above to reduce excessive number of
notifications. A notification’s medium and timing should be chosen based on the
urgency level and current situation of the farmers, and notifications can be displayed in
the dashboards based on the urgency level. The number of false positives or false
negatives detected by the system can be reduced by improving the algorithms and by
30 https://www.dairyinfo.gc.ca/eng/acts-regulations-codes-and-standards/automatic-milking-system-
guidelines/?id=1591199898715#fn2-1-rf
99
using the better sensors to collect accurate data. In the future, it should be ensured that
farmers do not miss any urgent alert which needs immediate attention or vital for their
farm management, gross profit, and production.
5.5 Summary
In conclusion, PLF technologies have many positive effects, such as reduced mental
and physical workload, improved livestock health, ease of data collection and improved
milk products. However, many issues and themes were identified in this study, which
should be improved in future PLF notification designs such as uncertainty, false alerts,
missed alerts, inappropriate communication timing and medium, information overload
and increased stress. Uncertainty, false alerts, and missed alerts can be addressed by
improving the technology's performance and accuracy. However, notifications could
also include some indication of the certainty of reported issues to help farmer’s judge
appropriate decision and actions needed to respond to notifications.
PLF notification mechanisms should match appropriate communication mediums with
message content. For instance, urgent messages should use communication mediums
that afford simultaneous communication (i.e. a farmer can receive the message
immediately when it is sent, demanding their attention), or should use multiple,
redundant mediums to ensure that a critical problem is attended to immediately and not
missed. If a message contains verbatim information (e.g., a cow identification number),
using a communication medium that allows the message content to be reviewed (e.g.,
replayed or re-read) will facilitate information comprehension. Also, urgent, time-critical
notifications should contain all relevant information farmers need to make decisions and
take actions. Additional information look-up should be extremely easy and effective to
do, minimizing necessary mental and physical workload.
100
Conclusion
The goals of this research were to understand the existing notification mechanisms
used by PLF technologies to communicate with farmers in the Canadian dairy industry
and to investigate the positive and negative effects of these mechanisms on dairy
farmers. Uncovering this information helped to reveal ways to design better PLF
technologies for the dairy industry. This chapter discusses the scholarly contributions of
this research, limitations of the research regarding its coverage of the landscape of this
topic in Canada, and recommended directions for future work in this domain.
6.1 Scholarly Contributions
This section revisits the thesis research objectives described in Chapter 1 and
discusses the contributions this research has made towards satisfying them.
Objective 1: To understand the current knowledge base regarding PLF notifications in
dairy and other livestock farming, their usability, and known effects on farming practices
by conducting a systematic literature review.
To date, there is no systematic literature review focusing on the notification mechanisms
of dairy farming technologies and their effects on farmers in the literature. Therefore,
this study fills this gap, and satisfies Objective 1, by providing a systematic review on
this topic. This literature review will help kick start future researchers’ knowledge of
notification mechanisms of existing dairy farming technologies and their effects on dairy
farmers. The systematic review will help readers learn the existing knowledge in the
literature about how PLF technologies send notifications to farmers, the timing of
notifications, types of information farmers receive from PLF technologies, and decisions
101
farmers make upon receiving information. The literature review revealed that PLF
technologies sometimes send false alerts and excessive information, causing farmers to
experience stress due to ineffective communication techniques between farmers and
PLF technologies.
Objective 2: To understand what notification mechanisms are used by PLF
technologies deployed on dairy farms in Canada and what the perceived benefits and
limitations are of these technologies, including stress-related effects of current
notification mechanisms.
To address this objective, an online survey and phone interviews of dairy farmers in
Ontario, Canada was designed to gather feedback directly from farmers on their
experiences with these technologies. This study investigated the Canadian dairy
industry through Ontario since Ontario is one of the prominent contributing provinces in
the Canadian dairy industry. User surveys and interviews were chosen as research
methodologies for this research to address the PLF field’s lack of user-centric
knowledge about farmers’ informational needs since farmers’ voices are seldom heard
while developing PLF technologies (Hartung et al., 2017). The study specifically probed
the use of the most popular commercial dairy PLF technologies found in the literature
review, including automated milking system (AMS), automated heat detection system
(AHDS), automated calving time detection system (ACTDS), and automated activity
monitoring system (AAMS). A few other PLF technologies were reported being used by
farmers in the survey’s free form comments, including automated feeding systems, milk
analysis systems that check for milk quality and biologically detected health issues like
ketosis and mastitis.
This thesis presents the findings from the survey of 18 farmers that were collected
before the shutdown due to COVID-19 pandemic and is intended to serve as a pilot
study for a full study at a later date.
102
Despite the limited data that was collected, the study findings still provide many useful
insights on the topic and at least partially satisfy Objective 2. The study revealed that
the most frequently used communication medium used for notification is the dashboard,
i.e., a software application associated with the installed PLF technology that may run on
mobile phone, tablet, or desktop computer, depending on the PLF technology. Other,
less frequently used mediums are phone calls, email, and text messaging. Phone calls
were only used for AMS, whereas AHDS, ACTDS, and AAMS systems notified farmers
through the dashboard, emails, or text messages. Technologies such as AHDS and
AAMS are relatively new and are used on farms to notify farmers about individual
animal health issues.
The study also revealed that sometimes farmers feel stressed because of the
information overload they receive, uncertain information and necessary actions,
ineffective alert management, inappropriate timing and communication medium,
technology breakdown, and missed alerts. A correlation analysis found a relationship
between stress versus experience and age. The analysis suggests that farmers are
more likely to be stressed on larger farms because they typically receive more alerts.
However, the correlation analysis also found that more experienced farmers are less
likely to be stressed. The qualitative findings support this, as they show that many
farmers learn how to handle the stress created by PLF notifications by developing
different strategies to manage them over time. Farmers follow various strategies to
overcome the stress due to inappropriate notification mechanisms. These include
adjusting the system’s factory defaults for notifications to minimize non-critical
notifications, for instance, by sending only urgent notifications to attention-grabbing
communication mediums like phone call or text, and redirecting less urgent notifications
to other mediums, like the dashboard, especially at certain times like overnight. Farmers
also reported installing multiple pieces of equipment to mitigate stresses related to
equipment failures, so that backup is available. Numerous positive benefits of PLF
103
notifications were also uncovered by the survey, including reduced workload, improved
livestock health, ease of data collection, improved milk product and decreased stress.
Objective 3: To identify opportunities for improving the design of notification
mechanisms for precision dairy technologies.
Despite the numerous benefits provided by PLF notifications and coping strategies
farmers have developed to overcome the stress they sometimes experience related to
these notifications, the study also revealed insights that can help improve their design in
the future to help alleviate the stress and unnecessary mental or physical workload they
cause. Addressing these design issues and improving the overall usability and utility of
these notification mechanisms, based on farmers’ informational needs, will help make
these technologies more acceptable to farmers (Russell & Bewley, 2013). Based on the
study findings, the following strategies are recommended to help improve PLF
notification mechanisms. These recommendations are preliminary, due to the limited
nature of this study as a pilot study. Where possible, the recommendations are
grounded in existing design strategies and advice from other fields that have studied
similar types of notification issues to provide a broader basis for generalization beyond
this particular pilot study.
Despite the limitations of a pilot study, many of the study findings are consistent with
prior PLF studies. Thus, the generalizability of these findings to the broader dairy
farming population can be made with some confidence. New findings should be
generalized more cautiously until a study of a larger Ontario, or Canadian, dairy farming
population is conducted. Nonetheless, this study provides evidence of real problems
and benefits experienced by the sampled population. The design advice provided in this
thesis is meant to be general enough to help technology designers build on the insights
gained in this pilot study while gathering further user feedback from those beyond the
sampled population to help build a deeper understanding of the problems Canadian
104
dairy farmers experience with PLF notification mechanisms, all while retaining the
uncovered benefits.
To address the uncovered issues of ineffective notification mechanisms, it is suggested
to better match the communication mediums used by PLF technologies, and the
characteristics of the messages being conveyed in the notifications messages, including
the urgency level, the type of information (e.g., verbatim information), and the timing of
the notification, with the affordances of the communication medium, as discussed in
Section 5.1.3. Further, to address the uncovered challenges related to technology
reliability, especially in newer, still maturing PLF technologies, it is recommended that
notifications incorporate some indication of the likelihood (or the algorithms’ confidence)
of the detected issue to allow farmers to appropriately use the information in decision
making and actions. It is strongly recommended that manufacturers adopt iterative,
user-centric design approaches from the field of HCI or user experience design (Yvonne
et al., 2015) to better incorporate farmers’ needs and preferences into their PLF
notification mechanism designs in the future. These methods can build on the findings
of this thesis and others in the literature, while getting more direct feedback from other
farmers and relevant stakeholders as well.
Iterative design and development techniques (Eastwood et al., 2013) should be used
to create PLF technologies by keeping farmers in the loop for better usability of the
technologies during design and development. Iteratively obtaining feedback directly
from farmers and other relevant stakeholders on specific design concepts and after
each technology deployment can help develop more usable technologies (Jago et al.,
2013). Thus, in each implementation, there will be an improvement in the technology
based on the farmers’ needs and demands. HCI approaches, such as surveys,
interviews, direct observations, and usability testing (Donald & Stephen, 1986;Jan &
Chris, 1999; Kabir, 2016; Rogers et al., 2015) can be used to engage users and
stakeholders effectively in the design and development plan of technology to help
105
designers better understand users’ needs and desires. Another HCI technique that can
be used to help integrate farmers’ needs and desires into PLF technology is
participatory design methods, which integrate domain experts, such as farmers, closely
in the design activities to bring strong domain knowledge and experience to the design
team (Westerlaken & Gualeni, 2016).
Participatory design methods can be used to design PLF technologies involving
farmers since they can bring farming operational knowledge and experience to the PLF
design process. The literature review found a lack of farmer involvement into the design
process of PLF technologies, creating a gap between farmers’ needs and available
technologies. Involving users in the design process will help manufacturers understand
farmers’ needs, which can lead to more appropriate and usable designs for the target
user population (Ashby & Sperling, 1995; Klerkx & Leeuwis, 2008). As farming practices
different from country to country, and even between local regions, manufacturers should
involve farmers from different regions to ensure appropriate domain knowledge is being
integrated into the technology designs. It is also essential to see how farmers interact
with frequently used technologies, such as AMS, to affirm there is a need for
improvement and what explicit aspects should be enhanced for increasing user
satisfaction while interacting with this technology (Mancini, 2017). Otherwise, farmers
will have negative impressions of the technology, which will hinder future adoption of the
PLF technologies.
A simple interface can be a crucial feature to attract the farmers in using technology,
but at the same time necessary functionalities should have to be ensured. This study
revealed that farmers sometimes face information overload and receive unnecessary
information. Therefore, some features such as making common tasks easy, making
communication clear, talking in users’ own language and providing beneficiary shortcuts
should be offered by a technology to make the technology simple to use. Unnecessary
complexity in using technology will hinder farmers from adopting the technology and

106
decrease profit. Simplicity in navigation and functionality will add user friendliness to the
technology and lead to more adoption of the technology on the farms. On the other
hand, PLF technologies should also present as much relevant information as possible to
farmers. Therefore, PLF technologies should maintain minimum complexity but
maximum relevant informational content.
The adoption of technology can be successful with proper training to the farmers about
the technology and enough support from providers (Ndour et al., 2017). Most of the
times, farmers will also consider the return on investment (RoI) before incorporating
technology into their farm (Russell & Bewley, 2013). Though the study revealed that
sometimes farmers incorporate technologies in their farm to go with the flow and keep
themselves up with the technology, RoI is still an important factor to consider as other
research suggests. Therefore, manufacturers should develop more farmer-friendly
technologies which will bring benefits for farmers in some form such as reduced
physical work, improved livestock health, etc. On the other hand, it is clearly desirable if
the technology can bring increased profits, but this is not always necessary. Also, in the
initial stages of incorporating a technology, manufacturers should provide training and
complete guidelines about features and advantages, including RoI, to the farmers for
the technology to be appropriately leveraged on the farms.
6.2 Limitations and Challenges
The main challenge of this study was participant recruitment, and therefore, survey
distribution (at least for the first phase). As mentioned above, the COVID-19 pandemic
introduced a barrier to this process. A key planned distribution channel was a farmer-
based organization in Ontario that could not distribute the survey due to additional
workload introduced by the outbreak. They had around 3,500 dairy farmers in their
network, almost 80% of Ontario dairy farmers. Therefore, the sample size of this study
was small given the total dairy farming population in Ontario. As described in Section
107
3.2.3, the survey was distributed mainly through TwitterTM accounts of colleagues and
University of Guelph connections and communications staff, and connections at the
Ontario Ministry of Agricultural and Rural Affairs (OMAFRA). Additionally, the research
team joined various Ontario farming online social media groups to distribute the survey
beyond their immediate network. Therefore, the survey advertisement reached mostly to
the farmers who use TwitterTM and other social media. Thus, there was a bias in the
survey distribution towards social media users. To remove this bias, the research team
physically attended the Southwestern Ontario Dairy Symposium in Woodstock, Ontario
to advertise the research project using paper flyers that invited farmers to take the
survey online.
Due to the disruption of the survey distribution, the survey did not cover all parts of
Ontario. Of those participants who identified a location, most were from various places
in Southwestern Ontario, and all were from Southern Ontario. The identified locations,
however, did represent areas that would experience a variety of quality of Internet and
cell phone coverage. This is an important factor when considering different experiences
that farmers may have with PLF notifications, as phone calls, text messaging, access to
email or an application dashboard may require some form of cell phone/data service or
WiFi reception if the technology directs to a mobile phone or tablet. Therefore, while the
study is considered a pilot study it may still represent a reasonable representation of the
larger Ontario, or Canadian dairy farming landscape. As mentioned in Section 3.5,
some survey records were culled before data analysis. Unusual surveys were dropped
to increase reliability of the data, but it may be possible that some valid data were
dropped which is very difficult to determine while collecting data through an online
survey.
There was an ambiguity in the design of the survey in skipping questions. In a single
page there were questions related to a single technology, but the last question was
asking whether the participant use the next technology in the survey or not. A
108
participant can skip a single question or can skip all the questions by simply clicking
next button at the lower right corner of the page. For instance, a participant wanted to
skip all the questions related to a single technology, so the participant skipped the full
page. When the participant skipped the full page, the question about whether the
participant use the next technology was also skipped. Therefore, the participant saw the
questions related to the next technology regardless of whether the participant uses the
technology or not. Thus, there was a case where the number of notification receivers
was more than the users of the technology. To remove this ambiguity in the future, the
technology use question for each separate technology should be placed on a separate
page.
6.3 Future Work
It is a vital challenge to adjust the design trade-offs between ease of use and providing
more capabilities while developing a technology for users, or farmers in this case (Dudi,
2005). Manufactures build their technology to ease farm management for the farmers,
but sometimes it creates more difficulties in some cases. For instance, farmers who use
PLF technologies may never feel off duty because they think that they might get a call
anytime or might receive a system notification at any moment (Hansen, 2015). This
study found that farmers often adjust their notification settings to send different
categories of notifications, such as urgent or non-urgent notifications, at different times
and using different communication mediums. The data suggest that not all PLF
technologies allow for these adjustments, or perhaps it is not obvious to the users that
this is possible. This issue should be resolved in future technologies. Also, use of
multiple communication mediums that integrate together to help the workflow of being
notified and then finding out the necessary information for decision making and action
could be used, as one study participant commented their AHDS system uses:
109
“I receive … an alert on my phone through my app that is connected to
the main computer where the heat system operates.” (P11)
Innovators can integrate mobile applications with each of the technologies (AMS,
AAMS, ACTDS, AHDS) to receive alerts through apps on their phones and check the
issues on their phones. Further research is needed, however, to determine the best
combinations of communication mediums to use for notifications regarding different
types of system events and various situational contexts the farmer may be in when
receiving those notifications.
Many participants reported that some notifications are missing key information, e.g., the
cow identification number, or that information was uncertain. Further work is needed to
better determine the critical information that farmers need for each type of notification
situation, as well as improved ways to provide that information to farmers in different
contexts.
Another area of future work is to collect additional survey data to extend this pilot study.
Ideally, partnering with a large dairy organization to help with survey distribution would
help in participant recruitment. Before running the larger study, however, it is worth
gathering more feedback on the survey questions from farmers to increase the
acceptability of the questions by the farmers since one farmer reported ambiguity in the
language of a question in this study. To get deeper insights about dairy technologies
and their effects on the farmers, farmers’ interviews can also be included in future
studies.
An interesting finding that can be explored in the future is that, although ACTDS and
AHDS are very similar types of technologies, participants reported different levels of
stress related to notifications from these two systems. AHDS users reported that they
are pleased and not stressed at all with AHDS notifications. On the other hand, farmers
indicated that ACTDS did not decrease their stress and sometimes increased their
110
anxiety. This issue should be studied in the future in more detail to identify the reason.
ACTDS might be less reliable, or the outcome of this study may not capture the whole
set of experiences with these two technologies due to the small number of participants.
Finally, a single study for a single technology can also be done to precisely learn about
the notification mechanism of that technology in detail, its effect on the farmers and
recommendations to improve the technology. Additional technology research can be
done on communicating reliability information of detected events to users. Many
participants reported receiving false alerts from some of the newer technologies on the
market, including AHDS, ACTDS, and AAMS. These are not yet mature technologies,
so they are not yet capable of providing perfect detection of the issues they monitor. As
discussed in Section 2.6, interesting approaches in the human factors and human-
automation literature suggest that providing users information about the likelihood of the
detected event may help users make appropriate decisions and actions in response to
system notifications. As users can lose trust in unreliable technology over time, further
research on the use of likelihood or confidence in detected PLF events seems
warranted to help users make the most effective use out of these emerging
technologies.
6.4 Concluding Remarks
Although farmers are sometimes stressed because of the current notification systems,
they also assist farmers in several ways, such as improved animal health, flexible and
reduced working hours, ease of data collection, and improved milk products. By
following the recommendations of this study and doing more research in the future,
precision dairy farming technologies can indeed be farmers' friends, not the foe and will
not only be the engineers’ daydreams.
111
REFERENCES
Adamczyk, P. D., & Bailey, B. P. (2004). If not now, when?: The effects of interruption at
different moments within task execution. Conference on Human Factors in
Computing Systems - Proceedings, 6(1), 271–278.
Afergan, D., Hincks, S. W., Shibata, T., & Jacob, R. J. K. (2015). Phylter: A system for
modulating notifications in wearables using physiological sensing. Lecture Notes in
Computer Science (Including Subseries Lecture Notes in Artificial Intelligence and
Lecture Notes in Bioinformatics), 9183, 167–177. https://doi.org/10.1007/978-3-
319-20816-9_17
Alhussien, M. N., & Dang, A. K. (2018). Milk somatic cells, factors influencing their
release, future prospects, and practical utility in dairy animals: An overview.
Veterinary World, 11(5), 562–577. https://doi.org/10.14202/vetworld.2018.562-577
Allain, C., Chanvallon, A., Courties, R., Billon, D., Bareille, N. (2016). Technical,
economic and sociological impacts of an automated estrus detection system for
dairy cows. Precision Dairy Farming, 451–456.
https://prodinra.inra.fr/?locale=en#!ConsultNotice:409563
Alsaaod, M., Fadul, M., & Steiner, A. (2019). Automatic lameness detection in cattle.
Veterinary Journal, 246, 35–44. https://doi.org/10.1016/j.tvjl.2019.01.005
Ashby, J. A., & Sperling, L. (1995). Institutionalizing Participatory, Client‐Driven
Research and Technology Development in Agriculture. Development and Change,
26(4), 753–770. https://doi.org/10.1111/j.1467-7660.1995.tb00573.x
Bahir, R. A., Tractinsky, N., & Parmet, Y. (2019). Effects of visual enhancements and
delivery time on receptivity of mobile push notifications. Conference on Human
Factors in Computing Systems - Proceedings, 5–10.
112
https://doi.org/10.1145/3290607.3312993
Bailey, B. P., Konstan, J. A., & Carlis, J. V. (2000). Measuring the effects of
interruptions on task performance in the user interface. Proceedings of the IEEE
International Conference on Systems, Man and Cybernetics, 2, 757–762.
https://doi.org/10.1109/ICSMC.2000.885940
Bailey, B. P., Konstan, J. a, & Carlis, J. V. (2001). The Effects of Interruptions on Task
Performance, Annoyance, and Anxiety in the User Interface. Proceedings of
INTERACT ’01, 593–601. https://doi.org/10.1109/ICSMC.2000.885940
Banhazi, T. M., Lehr, H., Black, J. L., Crabtree, H., Schofield, P., Tscharke, M., &
Berckmans, D. (2012). Precision Livestock Farming: An international review of
scientific and commercial aspects. International Journal of Agricultural and
Biological Engineering, 5(3), 1–9. https://doi.org/10.3965/j.ijabe.20120503.00?
Beller, J., Heesen, M., & Vollrath, M. (2013). Improving the driver-automation
interaction: An approach using automation uncertainty. Human Factors, 55(6),
1130–1141. https://doi.org/10.1177/0018720813482327
Berckmans, D. (2014). Precision livestock farming technologies for welfare
management in intensive livestock systems. OIE Revue Scientifique et Technique,
33(1), 189–196. https://doi.org/10.20506/rst.33.1.2273
Billon, P., & Pomiès, D. (2006). Le point sur la robotisation de la traite 15 ans après
l’apparition des premiers systèmes dans les fermes Robotic milking 15 years after
its first implementation on commercial farms. Renc. Rech. Ruminants, 1, 13.
http://www.journees3r.fr/IMG/pdf/2006_5_identification-
elec_automatismes_01_Billon.pdf
Bongiovanni, R., & Lowenberg-Deboer, J. (2004). Precision agriculture and

113
sustainability. Precision Agriculture, 5(4), 359–387.
https://doi.org/10.1023/B:PRAG.0000040806.39604.aa
Borchers, M. R., & Bewley, J. M. (2015). An assessment of producer precision dairy
farming technology use, prepurchase considerations, and usefulness. Journal of
Dairy Science, 98(6), 4198–4205. https://doi.org/10.3168/jds.2014-8963
Breedyk, J. (2010). Institution of Presynch Protocol.
https://digitalcommons.calpoly.edu/cgi/viewcontent.cgi?referer=https://www.google.
com/&httpsredir=1&article=1036&context=dscisp
Buchanan, J., & Kock, N. (2001). Information Overload: A Decision Making Perspective.
49–58. https://doi.org/10.1007/978-3-642-56680-6_4
Cabrera, V. E., Barrientos-Blanco, J. A., Delgado, H., & Fadul-Pacheco, L. (2020).
Symposium review: Real-time continuous decision making using big data on dairy
farms. Journal of Dairy Science, 103(4), 3856–3866.
https://doi.org/10.3168/jds.2019-17145
Calcante, A., Tangorra, F. M., Marchesi, G., & Lazzari, M. (2014). A GPS / GSM based
birth alarm system for grazing cows. COMPUTERS AND ELECTRONICS IN
AGRICULTURE, 100, 123–130. https://doi.org/10.1016/j.compag.2013.11.006
Canadian Dairy Information Centre (2019). Number of farms, dairy cows and dairy
heifers. https://www.dairyinfo.gc.ca/eng/dairy-statistics-and-market-
information/farm-statistics/farms-dairy-cows-and-dairy-heifers/?id=1502467423238
Clark, H. H., & Brennan, S. E. (2004). Grounding in communication. Perspectives on
Socially Shared Cognition., 127–149. https://doi.org/10.1037/10096-006
Colak, A., Polat, B., Okumus, Z., Kaya, M., Yanmaz, L. E., & Hayirli, A. (2008). Short
Communication: Early Detection of Mastitis Using Infrared Thermography in Dairy
114
Cows. Journal of Dairy Science, 91(11), 4244–4248.
https://doi.org/10.3168/jds.2008-1258
Czerwinski, M., Cutrell, E., & Horvitz, E. (2002). Instant messaging - An instant threat.
Computer Fraud and Security, 2002(11), 19–20. https://doi.org/10.1016/S1361-
3723(02)01112-0
Dabbish, L. A., & Baker, R. S. (2003). Administrative assistants as interruption
mediators. Conference on Human Factors in Computing Systems - Proceedings,
1020–1021. https://doi.org/10.1145/765891.766127
Dairy Farmers of Canada. (n.d.). Dairy Farmers of Canada “Our Economic
Contribution.” https://dairyfarmersofcanada.ca/en/who-we-are/our-commitments
de Mol, R. M., André, G., Bleumer, E. J. B., van der Werf, J. T. N., de Haas, Y., & van
Reenen, C. G. (2013). Applicability of day-to-day variation in behavior for the
automated detection of lameness in dairy cows. Journal of Dairy Science, 96(6),
3703–3712. https://doi.org/10.3168/jds.2012-6305
De Vries, A. (2006). Economic value of pregnancy in dairy cattle. Journal of Dairy
Science, 89(10), 3876–3885. https://doi.org/10.3168/jds.S0022-0302(06)72430-4
Désire C, & Hostiou, N. (2015). Mémoire de fin d ’ études présenté pour l ’ obtention du
Diplôme d ’ Ingénieur Agronome Option : Elevage en Milieux Difficiles L ’ Elevage
de Précision : changements dans l ’ organisation du travail et la gestion de données
dans des exploitations laitière. Actes Des 4e Rencontres Nationales Sur Le Travail
En Élevage, 5-6 novembre 2015, Dijon, France. Paris : Inra, 62-63.
Dolecheck, K. A., Silvia, W. J., Heersche, G., Chang, Y. M., Ray, D. L., Stone, A. E.,
Wadsworth, B. A., & Bewley, J. M. (2015). Behavioral and physiological changes
around estrus events identified using multiple automated monitoring technologies.
115
Journal of Dairy Science, 98(12), 8723–8731. https://doi.org/10.3168/jds.2015-9645
Dominiak, K. N., & Kristensen, A. R. (2017). Prioritizing alarms from sensor-based
detection models in livestock production - A review on model performance and
alarm reducing methods. In Computers and Electronics in Agriculture (Vol. 133, pp.
46–67). https://doi.org/10.1016/j.compag.2016.12.008
Donald A. Norman, & Stephen W Draper. (1986). User Centered System Design: New
Perspectives on Human-computer Interaction. L. Erlbaum Associates Inc.365
Broadway Hillsdale, NJUnited States.
Du, N., Huang, K. Y., & Yang, X. J. (2019). Not All Information Is Equal: Effects of
Disclosing Different Types of Likelihood Information on Trust, Compliance and
Reliance, and Task Performance in Human-Automation Teaming. Human Factors.
https://doi.org/10.1177/0018720819862916
Dudi Hendrawan. (2005). Penentuan Pola Subsidi dan Sistem Distribusi Pupuk di
Indonesia. Program Pascasarjana Manajemen Dan Bisnis IPB, 33(1), 189–196.
https://doi.org/10.20506/rst.33.1.2273
Duncan, E. (2018). An Exploration of how the Relationship between Farmers and
Retailers influences Precision Agriculture Adoption.
Eastwood, C., Trotter, M., & Scott, N. (2013). Understanding the user: Learning from
on-farm application of precision farming technologies in the Australian livestock
sector. Australian Journal of Multi-Disciplinary Engineering, 10(1), 41–50.
https://doi.org/10.7158/n12-ae04.2013.10.1
Eckelkamp, E. A. (2019). INVITED REVIEW: Current state of wearable precision dairy
technologies in disease detection. Applied Animal Science, 35(2), 209–220.
https://doi.org/10.15232/aas.2018-01801
116
Enting, H., Kooij, D., Dijkhuizen, A. A., Huirne, R. B. M., & Noordhuizen-Stassen, E. N.
(1997). Economic losses due to clinical lameness in dairy cattle. Livestock
Production Science, 49(3), 259–267. https://doi.org/10.1016/S0301-
6226(97)00051-1
Ferris, M. C., Christensen, A., & Wangen, S. R. (2020). Symposium review: Dairy
Brain—Informing decisions on dairy farms using data analytics. Journal of Dairy
Science, 103(4), 3874–3881. https://doi.org/10.3168/jds.2019-17199
Fodor, I., & Ózsvári, L. (2019). Estrus detection and its impact on reproductive and
economic performance in large dairy herds = Az ivarzókeresés gyakorlata, ill.
hatása a szaporodási és gazdasági eredményekre nagy létszámú
tehenészetekben. Animal Welfare, Etológia És Tartástechnológia = Animal Welfare,
Ethology and Housing Systems, 15(1), 18–28.
https://doi.org/10.17205/SZIE.AWETH.2019.1.018
Fu, S., Li, H., Liu, Y., Pirkkalainen, H., & Salo, M. (2020). Social media overload,
exhaustion, and use discontinuance: Examining the effects of information overload,
system feature overload, and social overload. Information Processing and
Management, 57(6). https://doi.org/10.1016/j.ipm.2020.102307
Galon, N. (2010). The use of pedometry for estrus detection in dairy cows in Israel.
Journal of Reproduction and Development, 56(SUPPL.).
https://doi.org/10.1262/jrd.1056S48
Godfray, H. C. J., Beddington, J. R., Crute, I. R., Haddad, L., Lawrence, D., Muir, J. F.,
Pretty, J., Robinson, S., Thomas, S. M., & Toulmin, C. (2010). Food security: The
challenge of feeding 9 billion people. Science, 327(5967), 812–818.
https://doi.org/10.1126/science.1185383
González, L. A., Bishop-Hurley, G. J., Handcock, R. N., & Crossman, C. (2015).
117
Behavioral classification of data from collars containing motion sensors in grazing
cattle. Computers and Electronics in Agriculture, 110, 91–102.
https://doi.org/10.1016/j.compag.2014.10.018
Graham, K. C., & Cvach, M. (2010). Monitor alarm fatigue: Standardizing use of
physiological monitors anddecreasing nuisance alarms. American Journal of
Critical Care, 19(1), 28–34. https://doi.org/10.4037/ajcc2010651
Gutiérrez, F., Htun, N. N., Schlenz, F., Kasimati, A., & Verbert, K. (2019). A review of
visualisations in agricultural decision support systems: An HCI perspective.
Computers and Electronics in Agriculture, 163.
https://doi.org/10.1016/j.compag.2019.05.053
Halachmi, I., Guarino, M., Bewley, J., & Pastell, M. (2019). Smart Animal Agriculture:
Application of Real-Time Sensors to Improve Animal Well-Being and Production.
Annual Review of Animal Biosciences, 7(1), 403–425.
https://doi.org/10.1146/annurev-animal-020518-114851
Hansen, B. G. (2015). Robotic milking-farmer experiences and adoption rate in Jæren,
Norway. Journal of Rural Studies, 41, 109–117.
https://doi.org/10.1016/j.jrurstud.2015.08.004
Harmon, R. J. (1994). Physiology of Mastitis and Factors Affecting Somatic Cell Counts.
Journal of Dairy Science, 77(7), 2103–2112. https://doi.org/10.3168/jds.S0022-
0302(94)77153-8
Hartung, J., Banhazi, T., Vranken, E., & Guarino, M. (2017). European farmers’
experiences with precision livestock farming systems. Animal Frontiers, 7(1), 38–
44. https://doi.org/10.2527/af.2017.0107
Hiltz, S. R., & Turoff, M. (1985). Structuring computer-mediated communication systems
118
to avoid information overload. Communications of the ACM, 28(7), 680–689.
https://doi.org/10.1145/3894.3895
Hockey, C. D., Morton, J. M., Norman, S. T., & McGowan, M. R. (2010). Evaluation of a
neck mounted 2-hourly activity meter system for detecting cows about to ovulate in
two paddock-based australian dairy herds. Reproduction in Domestic Animals,
45(5). https://doi.org/10.1111/j.1439-0531.2009.01531.x
Hogeveen, H., Huijps, K., & Lam, T. J. G. M. (2011). Economic aspects of mastitis: New
developments. New Zealand Veterinary Journal, 59(1), 16–23.
https://doi.org/10.1080/00480169.2011.547165
Inchaisri, C., Jorritsma, R., Vos, P. L. A. M., van der Weijden, G. C., & Hogeveen, H.
(2010). Economic consequences of reproductive performance in dairy cattle.
Theriogenology, 74(5), 835–846.
https://doi.org/10.1016/j.theriogenology.2010.04.008
Jago, J., Eastwood, C., Kerrisk, K., & Yule, I. (2013). Precision dairy farming in
Australasia: Adoption, risks and opportunities. Animal Production Science, 53(9),
907–916. https://doi.org/10.1071/AN12330
Jan Noyes, & Chris Baber. (1999). User-Centred Design of Systems (1st ed.). Springer-
Verlag London.
Kabir, S. M. (2016). METHODS OF DATA COLLECTION. In BASIC GUIDELINES FOR
RESEARCH: An Introductory Approach for All Disciplines (First, pp. 201–275).
Book Zone Publication, Chittagong - 4203, Bangladesh.
Kern, N., & Schiele, B. (2003). Context-aware notification forwearable computing.
Proceedings - International Symposium on Wearable Computers, ISWC, 223–230.
https://doi.org/10.1109/iswc.2003.1241415
119
Khatun, M., Thomson, P. C., Kerrisk, K. L., Lyons, N. A., Clark, C. E. F., Molfino, J., &
García, S. C. (2018). Development of a new clinical mastitis detection method for
automatic milking systems. Journal of Dairy Science, 101(10), 9385–9395.
https://doi.org/10.3168/jds.2017-14310
Kim, H., Min, Y., & Choi, B. (2019). Real-time temperature monitoring for the early
detection of mastitis in dairy cattle: Methods and case researches. Computers and
Electronics in Agriculture, 162(June 2018), 119–125.
https://doi.org/10.1016/j.compag.2019.04.004
King, M. T. M., & DeVries, T. J. (2018). Graduate Student Literature Review: Detecting
health disorders using data from automatic milking systems and associated
technologies. Journal of Dairy Science, 101(9), 8605–8614.
https://doi.org/10.3168/jds.2018-14521
Klerkx, L., & Leeuwis, C. (2008). Institutionalizing end-user demand steering in
agricultural R&D: Farmer levy funding of R&D in The Netherlands. Research Policy,
37(3), 460–472. https://doi.org/10.1016/j.respol.2007.11.007
Kossaibati, M. A., & Esslemont, R. J. (1997). The costs of production diseases in dairy
herds in England. Veterinary Journal, 154(1), 41–51. https://doi.org/10.1016/S1090-
0233(05)80007-3
Kushlev, K., Proulx, J., & Dunn, E. W. (2016). “Silence your phones”: Smartphone
notifications increase inattention and hyperactivity symptoms. Conference on
Human Factors in Computing Systems - Proceedings, 1011–1020.
https://doi.org/10.1145/2858036.2858359
Kutter, T., Tiemann, S., Siebert, R., & Fountas, S. (2011). The role of communication
and co-operation in the adoption of precision farming. Precision Agriculture, 12(1),
2–17. https://doi.org/10.1007/s11119-009-9150-0
120
Laberge, B., & Rousseau, A. N. (2017). Rethinking environment control strategy of
confined animal housing systems through precision livestock farming. Biosystems
Engineering, 155, 96–123. https://doi.org/10.1016/j.biosystemseng.2016.12.005
Lee, J. D., & Moray, N. (1994). Trust, self-Confidence, and operators’ adaptation to
automation. International Journal of Human - Computer Studies, 40(1), 153–184.
https://doi.org/10.1006/ijhc.1994.1007
López-Gatius, F., Santolaria, P., Mundet, I., & Yániz, J. L. (2005). Walking activity at
estrus and subsequent fertility in dairy cows. Theriogenology, 63(5), 1419–1429.
https://doi.org/10.1016/j.theriogenology.2004.07.007
Løvendahl, P., & Chagunda, M. G. G. (2010). On the use of physical activity monitoring
for estrus detection in dairy cows. Journal of Dairy Science, 93(1), 249–259.
https://doi.org/10.3168/jds.2008-1721
Mancini, C. (2017). Towards an animal-centred ethics for Animal–Computer Interaction.
International Journal of Human Computer Studies, 98, 221–233.
https://doi.org/10.1016/j.ijhcs.2016.04.008
Martiskainen, P., Järvinen, M., Skön, J. P., Tiirikainen, J., Kolehmainen, M., &
Mononen, J. (2009). Cow behaviour pattern recognition using a three-dimensional
accelerometer and support vector machines. Applied Animal Behaviour Science,
119(1–2), 32–38. https://doi.org/10.1016/j.applanim.2009.03.005
Mayo, L. M., Silvia, W. J., Ray, D. L., Jones, B. W., Stone, A. E., Tsai, I. C., Clark, J. D.,
Bewley, J. M., & Heersche, G. (2019). Automated estrous detection using multiple
commercial precision dairy monitoring technologies in synchronized dairy cows.
Journal of Dairy Science, 102(3), 2645–2656. https://doi.org/10.3168/jds.2018-
14738
121
McFarlane, D. C., & Latorella, K. A. (2002). The scope and importance of human
interruption in human-computer interaction design. Human-Computer Interaction,
17(1), 1–61. https://doi.org/10.1207/S15327051HCI1701_1
Mee, J. F. (2004). Managing the dairy cow at calving time. 20, 521–546.
https://doi.org/10.1016/j.cvfa.2004.06.001
Mehrotra, A., Musolesi, M., Hendley, R., & Pejovic, V. (2015). Designing content-driven
intelligent notification mechanisms for mobile applications. UbiComp 2015 -
Proceedings of the 2015 ACM International Joint Conference on Pervasive and
Ubiquitous Computing, 813–824. https://doi.org/10.1145/2750858.2807544
Miller, G. A., Mitchell, M., Barker, Z. E., Giebel, K., Codling, E. A., Amory, J. R., Michie,
C., Davison, C., Tachtatzis, C., Andonovic, I., & Duthie, C. A. (2020). Using animal-
mounted sensor technology and machine learning to predict time-to-calving in beef
and dairy cows. Animal, 14(6), 1304–1312.
https://doi.org/10.1017/S1751731119003380
Mollenhorst, H., Rijkaart, L. J., & Hogeveen, H. (2012). Mastitis alert preferences of
farmers milking with automatic milking systems. Journal of Dairy Science, 95(5),
2523–2530. https://doi.org/10.3168/jds.2011-4993
Müller, R., & Schrader, L. (2003). A new method to measure behavioural activity levels
in dairy cows. Applied Animal Behaviour Science, 83(4), 247–258.
https://doi.org/10.1016/S0168-1591(03)00141-2
Ndour, A., Loison, R., Gourlot, J.-P., Ba, K. S., & Clouvel, P. (2017). Biotechnologie,
agronomie, société et environnement = Biotechnology, agronomy, society and
environment : BASE. Biotechnol. Agron. Soc. Environ. 2017, 21(1), 22–35.
http://popups.ulg.ac.be/1780-
4507/index.php?id=13706%0Ahttp://popups.ulg.ac.be/1780-
122
4507/index.php?id=13496
Newton, J. E., Nettle, R., & Pryce, J. E. (2020). Farming smarter with big data: Insights
from the case of Australia’s national dairy herd milk recording scheme. Agricultural
Systems, 181. https://doi.org/10.1016/j.agsy.2020.102811
Nielsen, C., Østergaard, S., Emanuelson, U., Andersson, H., Berglund, B., &
Strandberg, E. (2010). Economic consequences of mastitis and withdrawal of milk
with high somatic cell count in Swedish dairy herds. Animal, 4(10), 1758–1770.
https://doi.org/10.1017/S1751731110000704
Farm & Food Care Ontario (2012). Facts & Figures About Canadian Dairy Cows.
http://www.milk.org/Corporate/PDF/Students-FarmCare_DairyCows.pdf
Orihuela, A. (2000). Some factors affecting the behavioural manifestation of oestrus in
cattle: A review. Applied Animal Behaviour Science, 70(1), 1–16.
https://doi.org/10.1016/S0168-1591(00)00139-8
Peters, A., McEwen, B. S., & Friston, K. (2017). Uncertainty and stress: Why it causes
diseases and how it is mastered by the brain. Progress in Neurobiology, 156, 164–
188. https://doi.org/10.1016/j.pneurobio.2017.05.004
Pielot, M., Church, K., & De Oliveira, R. (2014). An in-situ study of mobile phone
notifications. MobileHCI 2014 - Proceedings of the 16th ACM International
Conference on Human-Computer Interaction with Mobile Devices and Services,
233–242. https://doi.org/10.1145/2628363.2628364
Pielot, M., & Rello, L. (2015). The do not disturb challenge-a day without notifications.
Conference on Human Factors in Computing Systems - Proceedings, 18, 1761–
1766. https://doi.org/10.1145/2702613.2732704
Polat, B., Colak, A., Cengiz, M., Yanmaz, L. E., Oral, H., Bastan, A., Kaya, S., & Hayirli,
123
A. (2010). Sensitivity and specificity of infrared thermography in detection of
subclinical mastitis in dairy cows. Journal of Dairy Science, 93(8), 3525–3532.
https://doi.org/10.3168/jds.2009-2807
Reith, S., & Hoy, S. (2018). Review: Behavioral signs of estrus and the potential of fully
automated systems for detection of estrus in dairy cattle. Animal, 12(2), 398–407.
https://doi.org/10.1017/S1751731117001975
Robert D. Mason, Douglas A. Lind, W. G. M. (1983). Statistics: An Introduction. Duxbury
Pr; Subsequent edition (Oct. 1 1997).
https://doi.org/https://doi.org/10.2307/2685790
Rodenburg, J. (2012). The impact of robotic milking on milk quality, cow comfort and
labour issues.
Russell, R. A., & Bewley, J. M. (2013). Characterization of Kentucky dairy producer
decision-making behavior. Journal of Dairy Science, 96(7), 4751–4758.
https://doi.org/10.3168/jds.2012-6538
Rutten, C. J., Velthuis, A. G. J., Steeneveld, W., & Hogeveen, H. (2013). Invited review:
Sensors to support health management on dairy farms. Journal of Dairy Science,
96(4), 1928–1952. https://doi.org/10.3168/jds.2012-6107
Saint-Dizier, M., & Chastant-Maillard, S. (2012). Towards an Automated Detection of
Oestrus in Dairy Cattle. Reproduction in Domestic Animals, 47(6), 1056–1061.
https://doi.org/10.1111/j.1439-0531.2011.01971.x
Saint-Dizier, Marie, & Chastant-Maillard, S. (2015). Methods and on-farm devices to
predict calving time in cattle. Veterinary Journal, 205(3), 349–356.
https://doi.org/10.1016/j.tvjl.2015.05.006
Schewe, R. L., & Stuart, D. (2015). Diversity in agricultural technology adoption: How

124
are automatic milking systems used and to what end? Agriculture and Human
Values, 32(2), 199–213. https://doi.org/10.1007/s10460-014-9542-2
Schwarz, S., Hofmann, M. H., Gutzen, C., Schlax, S., & Von Der Emde, G. (2002).
VIEWER: A program for visualising, recording, and analysing animal behaviour.
Computer Methods and Programs in Biomedicine, 67(1), 55–66.
https://doi.org/10.1016/S0169-2607(00)00150-4
Sorge, U. S., Kelton, D. F., Lissemore, K. D., Sears, W., & Fetrow, J. (2007). Evaluation
of the Dairy Comp 305 Module “ Cow Value ” in Two Ontario Dairy Herds. Journal
of Dairy Science, 90(12), 5784–5797. https://doi.org/10.3168/jds.2006-0813
Speier, C., Vessey, I., & Valacich, J. S. (2003). The Effects of Interruptions, Task
Complexity, and Information Presentation on Computer-Supported Decision-
Making Performance. Decision Sciences, 34(4), 771–797.
https://doi.org/10.1111/j.1540-5414.2003.02292.x
Stangaferro, M. L., Wijma, R., Caixeta, L. S., Al-Abri, M. A., & Giordano, J. O. (2016).
Use of rumination and activity monitoring for the identification of dairy cows with
health disorders: Part I. Metabolic and digestive disorders. Journal of Dairy
Science, 99(9), 7395–7410. https://doi.org/10.3168/jds.2016-10907
Steeneveld, W., & Hogeveen, H. (2015). 3.1. Use of sensor systems on Dutch dairy
farms. Precision Livestock Farming Applications, 77–86.
https://doi.org/10.3920/978-90-8686-815-5_8
Talukder, S., Thomson, P. C., Kerrisk, K. L., Clark, C. E. F., & Celi, P. (2015).
Evaluation of infrared thermography body temperature and collar-mounted
accelerometer and acoustic technology for predicting time of ovulation of cows in a
pasture-based system. Theriogenology, 83(4), 739–748.
https://doi.org/10.1016/j.theriogenology.2014.11.005
125
Taneja, M., Byabazaire, J., Jalodia, N., Davy, A., Olariu, C., & Malone, P. (2020).
Machine learning based fog computing assisted data-driven approach for early
lameness detection in dairy cattle. Computers and Electronics in Agriculture, 171.
https://doi.org/10.1016/j.compag.2020.105286
Thompson, A. J., Weary, D. M., Bran, J. A., Daros, R. R., Hötzel, M. J., & von
Keyserlingk, M. A. G. (2019). Lameness and lying behavior in grazing dairy cows.
Journal of Dairy Science, 102(7), 6373–6382. https://doi.org/10.3168/jds.2018-
15717
Tse, C., Barkema, H. W., DeVries, T. J., Rushen, J., & Pajor, E. A. (2017). Effect of
transitioning to automatic milking systems on producers’ perceptions of farm
management and cow health in the Canadian dairy industry. Journal of Dairy
Science, 100(3), 2404–2414. https://doi.org/10.3168/jds.2016-11521
Tullo, E., Fontana, I., Gottardo, D., Sloth, K. H., & Guarino, M. (2016). Technical note:
Validation of a commercial system for the continuous and automated monitoring of
dairy cow activity. Journal of Dairy Science, 99(9), 7489–7494.
https://doi.org/10.3168/jds.2016-11014
Valenza, A., Giordano, J. O., Lopes, G., Vincenti, L., Amundson, M. C., & Fricke, P. M.
(2012). Assessment of an accelerometer system for detection of estrus and
treatment with gonadotropin-releasing hormone at the time of insemination in
lactating dairy cows. Journal of Dairy Science, 95(12), 7115–7127.
https://doi.org/10.3168/jds.2012-5639
Van Dantzich, M., Robbins, D., Horvitz, E., & Czerwinski, M. (2002). Scope: Providing
awareness of multiple notifications at a glance. Proceedings of the Workshop on
Advanced Visual Interfaces AVI, 267–281.
https://doi.org/10.1145/1556262.1556306
126
Van Nuffel, A., Zwertvaegher, I., Pluym, L., Van Weyenberg, S., Thorup, V. M., Pastell,
M., Sonck, B., & Saeys, W. (2015). Lameness detection in dairy cows: Part 1. How
to distinguish between non-lame and lame cows based on differences in
locomotion or behavior. Animals, 5(3), 838–860.
https://doi.org/10.3390/ani5030387
Vázquez Diosdado, J. A., Barker, Z. E., Hodges, H. R., Amory, J. R., Croft, D. P., Bell,
N. J., & Codling, E. A. (2015). Classification of behaviour in housed dairy cows
using an accelerometer-based activity monitoring system. Animal Biotelemetry,
3(1). https://doi.org/10.1186/s40317-015-0045-8
Vergé, X. P. C., Maxime, D., Dyer, J. A., Desjardins, R. L., Arcand, Y., & Vanderzaag,
A. (2013). Carbon footprint of Canadian dairy products: Calculations and issues.
Journal of Dairy Science, 96(9), 6091–6104. https://doi.org/10.3168/jds.2013-6563
Wang, L., Jamieson, G. A., & Hollands, J. G. (2009). Trust and reliance on an
automated combat identification system. Human Factors, 51(3), 281–291.
https://doi.org/10.1177/0018720809338842
Warriner, G. K., & Moul, T. M. (2015). Survey of Ontario dairy producers shows
increasing rate of robotic milking herds in the province. Geoforum.
https://doi.org/10.1016/j.geoforum.2014.12.004
Wathes, C. M., Kristensen, H. H., Aerts, J. M., & Berckmans, D. (2008). Is precision
livestock farming an engineer’s daydream or nightmare, an animal’s friend or foe,
and a farmer’s panacea or pitfall? Computers and Electronics in Agriculture, 64(1),
2–10. https://doi.org/10.1016/j.compag.2008.05.005
Wenz, J. R., & Giebel, S. K. (2012). Retrospective evaluation of health event data
recording on 50 dairies using Dairy Comp 305. Journal of Dairy Science, 95(8),
4699–4706. https://doi.org/10.3168/jds.2011-5312

127
Westerlaken, M., & Gualeni, S. (2016). Becoming with: towards the inclusion of animals
as participants in design processes. Proceedings of the Third International
Conference on Animal-Computer Interaction - ACI ’16, 1–10.
https://doi.org/10.1145/2995257.2995392
Wolfert, S., Ge, L., Verdouw, C., & Bogaardt, M. J. (2017). Big Data in Smart Farming –
A review. Agricultural Systems, 153, 69–80.
https://doi.org/10.1016/j.agsy.2017.01.023
Yvonne Rogers; Helen Sharp; Jenny Preece (2015). Interaction design : beyond
human-computer interaction (4th editio). Chichester, W. Sussex : John Wiley &
Sons, cop. 2015.
Zafar, A., Islam, N., & Ahmed, Z. (2014). Computer Standards & Interfaces A review of
wireless sensors and networks ’ applications in agriculture. Computer Standards &
Interfaces, 36(2), 263–270. https://doi.org/10.1016/j.csi.2011.03.004
Zehner, N., Niederhauser, J. J., Schick, M., & Umstatter, C. (2019). Development and
validation of a predictive model for calving time based on sensor measurements of
ingestive behavior in dairy cows. Computers and Electronics in Agriculture, 161,
62–71. https://doi.org/10.1016/j.compag.2018.08.037
Zijlstra, F. R. H., Robert A, R., Leonora, A. B., & Krediet, I. (1999). Temporal factors in
mental work: Effects of interrupted activities. Journal of Occupational and
Organizational Psychology, 72(2), 163–185.
https://doi.org/10.1348/096317999166581

128

129
APPENDICES
APPENDIX A: Survey Questions and Responses
Q4 - What is your age?
`# Field Minimum Maximum Mean Std Deviation Variance Count
1 What is your age? 2.00 4.00 2.70 0.55 0.30 23
# Answer % Count
1 below 18 0.00% 0
2 18-29 34.78% 8
3 30-54 60.87% 14
4 55-64 4.35% 1
5 65 or above 0.00% 0
6 Prefer not to say 0.00% 0
Total 100% 23
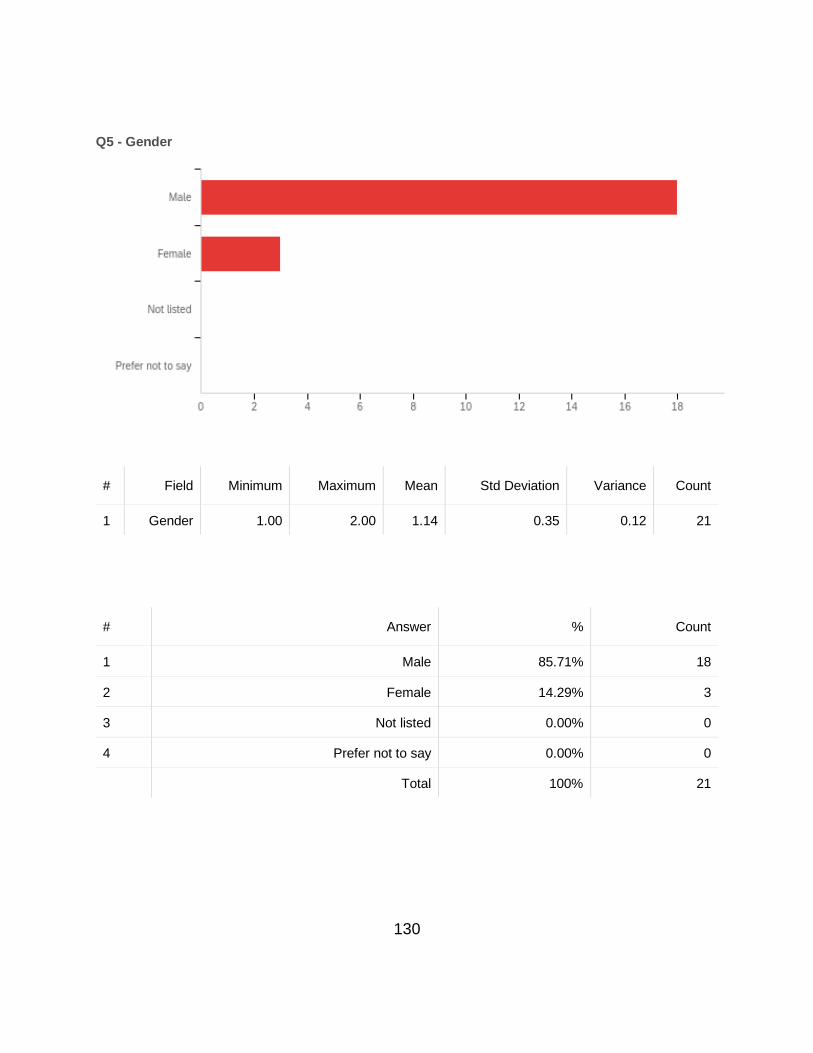
130
Q5 - Gender
# Field Minimum Maximum Mean Std Deviation Variance Count
1 Gender 1.00 2.00 1.14 0.35 0.12 21
# Answer % Count
1 Male 85.71% 18
2 Female 14.29% 3
3 Not listed 0.00% 0
4 Prefer not to say 0.00% 0
Total 100% 21
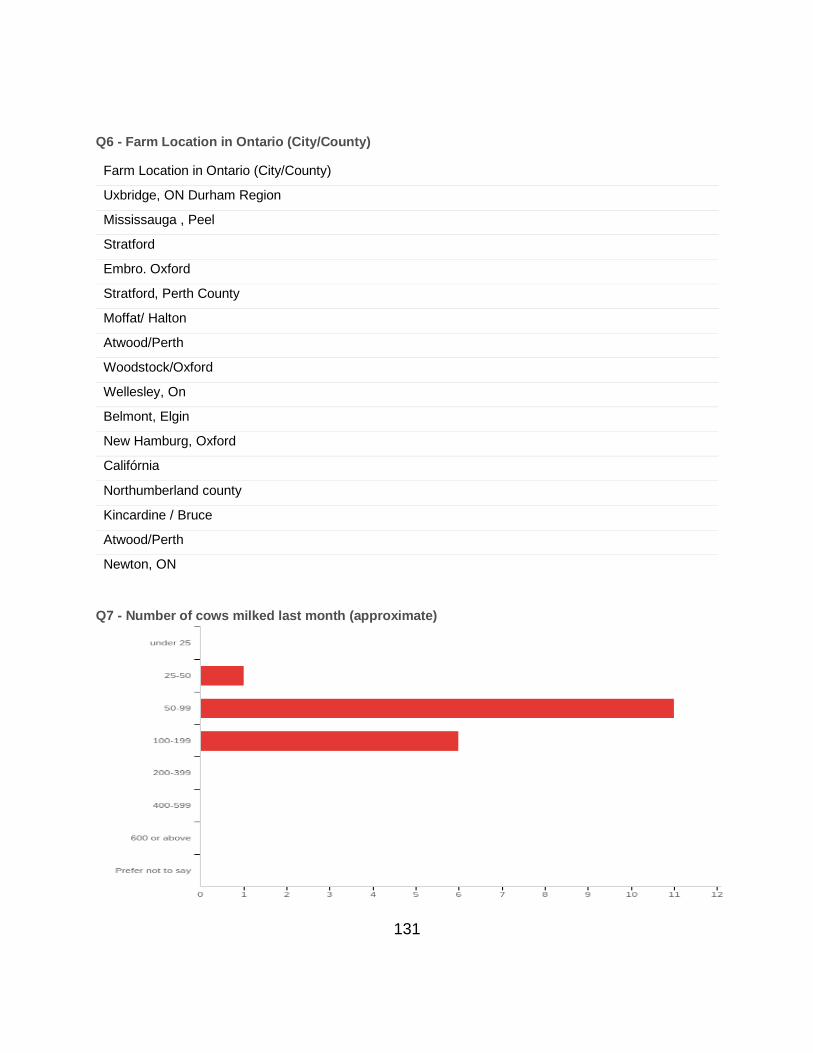
131
Q6 - Farm Location in Ontario (City/County)
Farm Location in Ontario (City/County)
Uxbridge, ON Durham Region
Mississauga , Peel
Stratford
Embro. Oxford
Stratford, Perth County
Moffat/ Halton
Atwood/Perth
Woodstock/Oxford
Wellesley, On
Belmont, Elgin
New Hamburg, Oxford
Califórnia
Northumberland county
Kincardine / Bruce
Atwood/Perth
Newton, ON
Q7 - Number of cows milked last month (approximate)
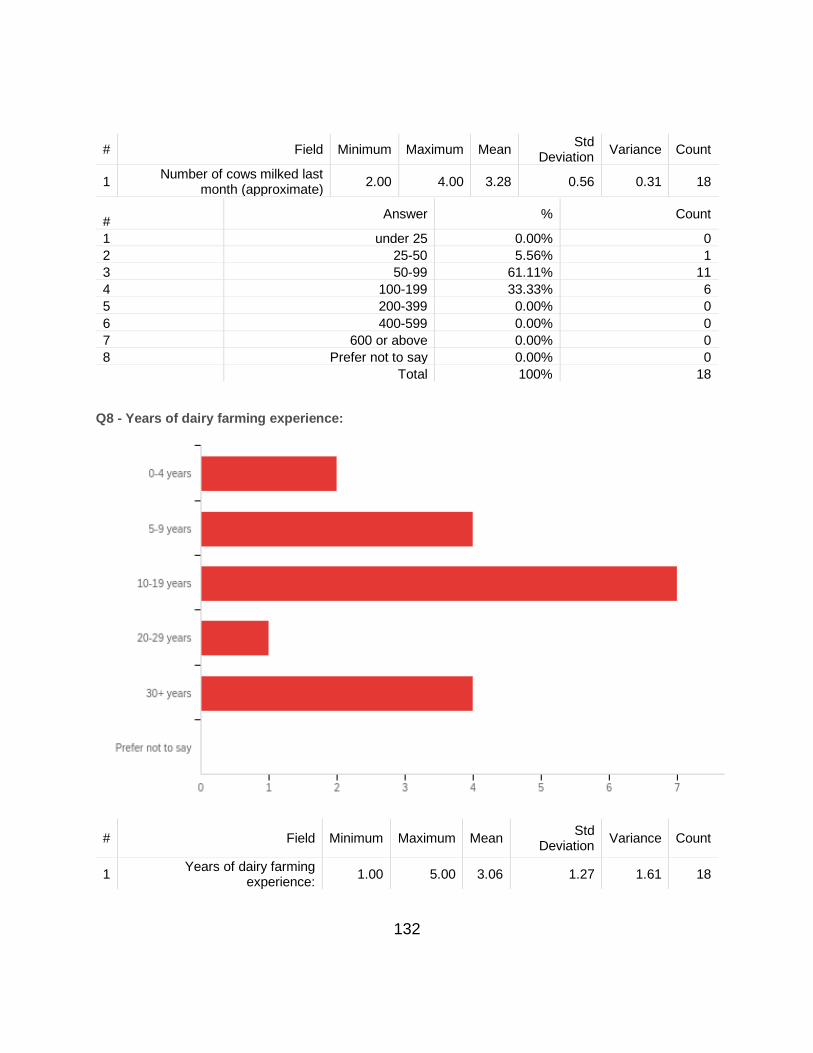
132
# Field Minimum Maximum Mean Std
Deviation Variance Count
1 Number of cows milked last
month (approximate) 2.00 4.00 3.28 0.56 0.31 18
#
Answer % Count
1 under 25 0.00% 0
2 25-50 5.56% 1
3 50-99 61.11% 11
4 100-199 33.33% 6
5 200-399 0.00% 0
6 400-599 0.00% 0
7 600 or above 0.00% 0
8 Prefer not to say 0.00% 0
Total 100% 18
Q8 - Years of dairy farming experience:
# Field Minimum Maximum Mean Std
Deviation Variance Count
1 Years of dairy farming
experience: 1.00 5.00 3.06 1.27 1.61 18

133
# Answer % Count
1 0-4 years 11.11% 2
2 5-9 years 22.22% 4
3 10-19 years 38.89% 7
4 20-29 years 5.56% 1
5 30+ years 22.22% 4
6 Prefer not to say 0.00% 0
Total 100% 18 Q9 - Your primary role on the farm is:
# Field Minimum Maximum Mean Std
Deviation Variance Count
1 Your primary role on the farm is:
- Selected Choice 1.00 3.00 1.50 0.76 0.58 18
#
Answer % Count
1 Owner/Operator/Manager 66.67% 12
2 Herdsman/Lead hand 16.67% 3
3 Employee 16.67% 3
4 Prefer not to say 0.00% 0
5 Other, please specify 0.00% 0
Total 100% 18
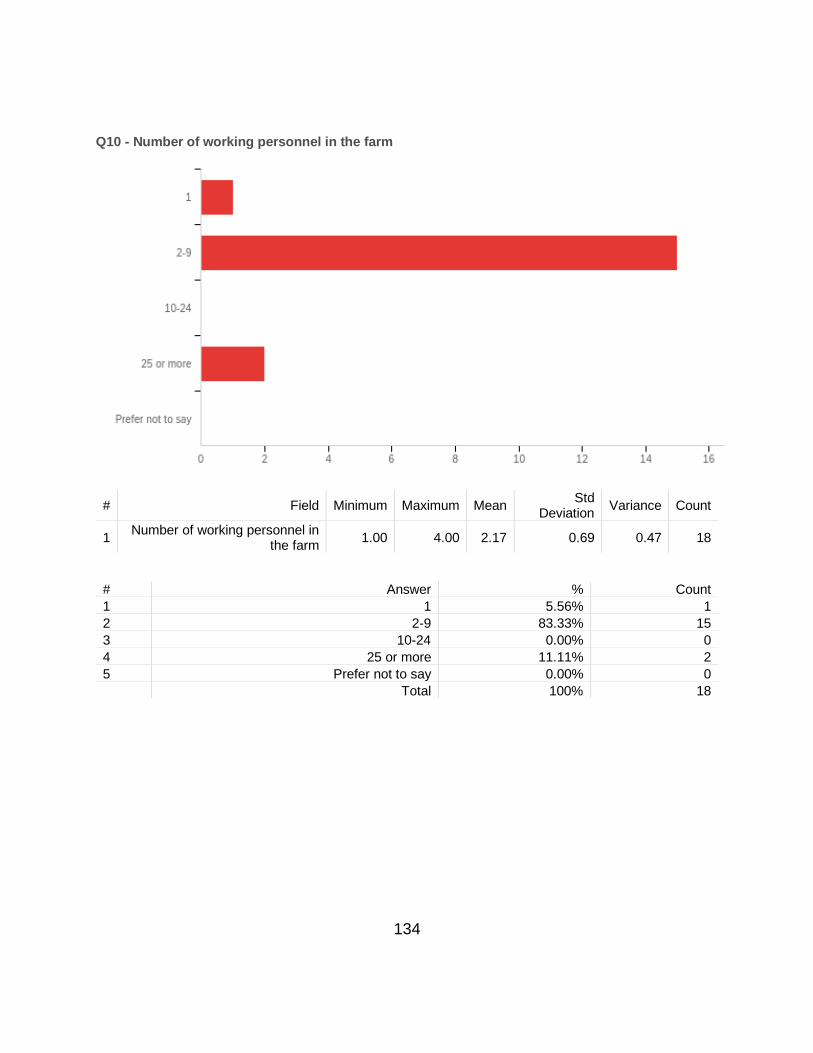
134
Q10 - Number of working personnel in the farm
# Field Minimum Maximum Mean Std
Deviation Variance Count
1 Number of working personnel in
the farm 1.00 4.00 2.17 0.69 0.47 18
# Answer % Count
1 1 5.56% 1
2 2-9 83.33% 15
3 10-24 0.00% 0
4 25 or more 11.11% 2
5 Prefer not to say 0.00% 0
Total 100% 18

135
Q11 - How many Automatic Milking Systems (AMS) (i.e. milking robots) does your farm have, if any?
# Field Minimum Maximum Mean Std
Deviation Variance Count
1
How many Automatic Milking Systems (AMS) (i.e. milking
robots) does your farm have, if any?
1.00 4.00 2.22 1.13 1.28 18
#
Answer % Count
1 0 (we do not have milking robots) 38.89% 7
2 1 16.67% 3
3 2 27.78% 5
4 3 or more 16.67% 3
5 Prefer not to say 0.00% 0
Total 100% 18
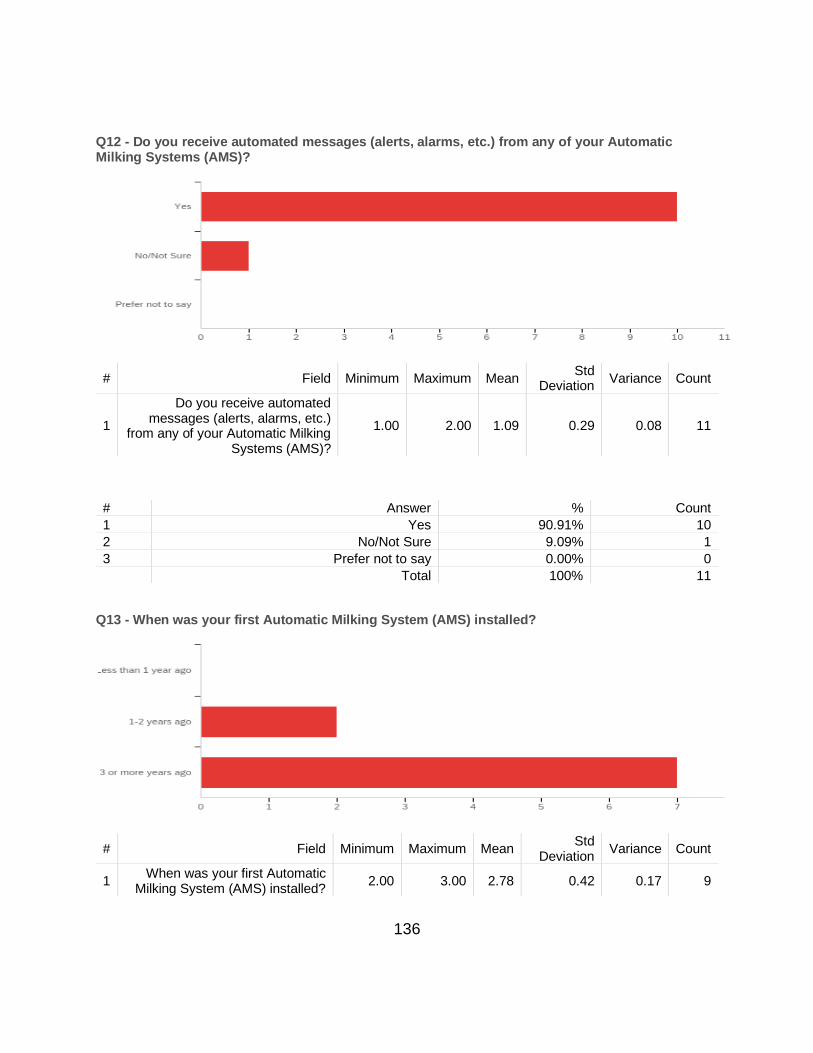
136
Q12 - Do you receive automated messages (alerts, alarms, etc.) from any of your Automatic Milking Systems (AMS)?
# Field Minimum Maximum Mean Std
Deviation Variance Count
1
Do you receive automated messages (alerts, alarms, etc.)
from any of your Automatic Milking Systems (AMS)?
1.00 2.00 1.09 0.29 0.08 11
# Answer % Count
1 Yes 90.91% 10
2 No/Not Sure 9.09% 1
3 Prefer not to say 0.00% 0
Total 100% 11
Q13 - When was your first Automatic Milking System (AMS) installed?
# Field Minimum Maximum Mean Std
Deviation Variance Count
1 When was your first Automatic
Milking System (AMS) installed? 2.00 3.00 2.78 0.42 0.17 9
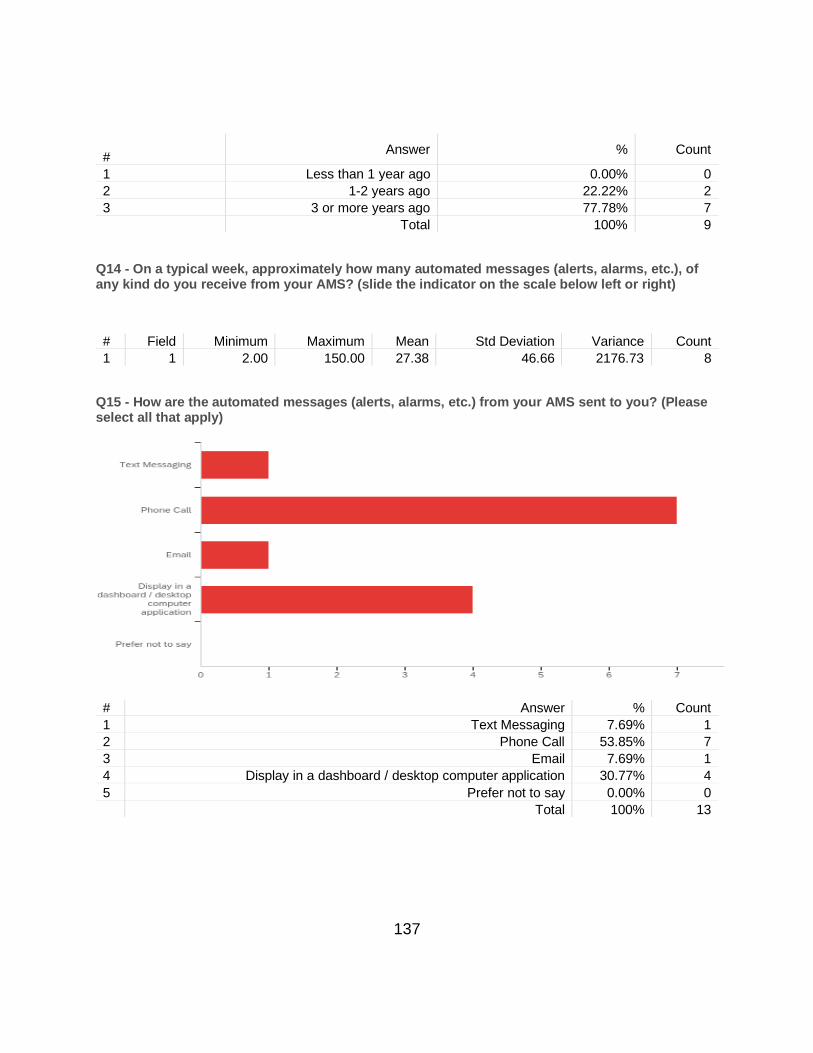
137
#
Answer % Count
1 Less than 1 year ago 0.00% 0
2 1-2 years ago 22.22% 2
3 3 or more years ago 77.78% 7
Total 100% 9
Q14 - On a typical week, approximately how many automated messages (alerts, alarms, etc.), of any kind do you receive from your AMS? (slide the indicator on the scale below left or right)
# Field Minimum Maximum Mean Std Deviation Variance Count
1 1 2.00 150.00 27.38 46.66 2176.73 8
Q15 - How are the automated messages (alerts, alarms, etc.) from your AMS sent to you? (Please select all that apply)
# Answer % Count
1 Text Messaging 7.69% 1
2 Phone Call 53.85% 7
3 Email 7.69% 1
4 Display in a dashboard / desktop computer application 30.77% 4
5 Prefer not to say 0.00% 0
Total 100% 13

138
Q16 - Do you consider the automated messages (alerts, alarms, etc.) from your AMS to be mostly (Please select all that apply):
#
Answer % Cou
nt
1 Urgent 36.36
% 4
2 Moderately urgent
18.18%
2
3 Non-
urgent 45.45
% 5
4 Prefer not to
say 0.00% 0
Total 100% 11 Q17 - Have you modified the automated message (alerts, alarms, etc.) settings on any of your AMS from the factory default?
# Field Minimum Maximum Mean Std
Deviation Variance Count
1
Have you modified the automated message (alerts, alarms, etc.)
settings on any of your AMS from the factory default? - Selected
Choice
1.00 2.00 1.33 0.47 0.22 9
#
Answer % Count
1 Yes (Please explain what modifications you've made) 66.67% 6
2 No 33.33% 3
Total 100% 9
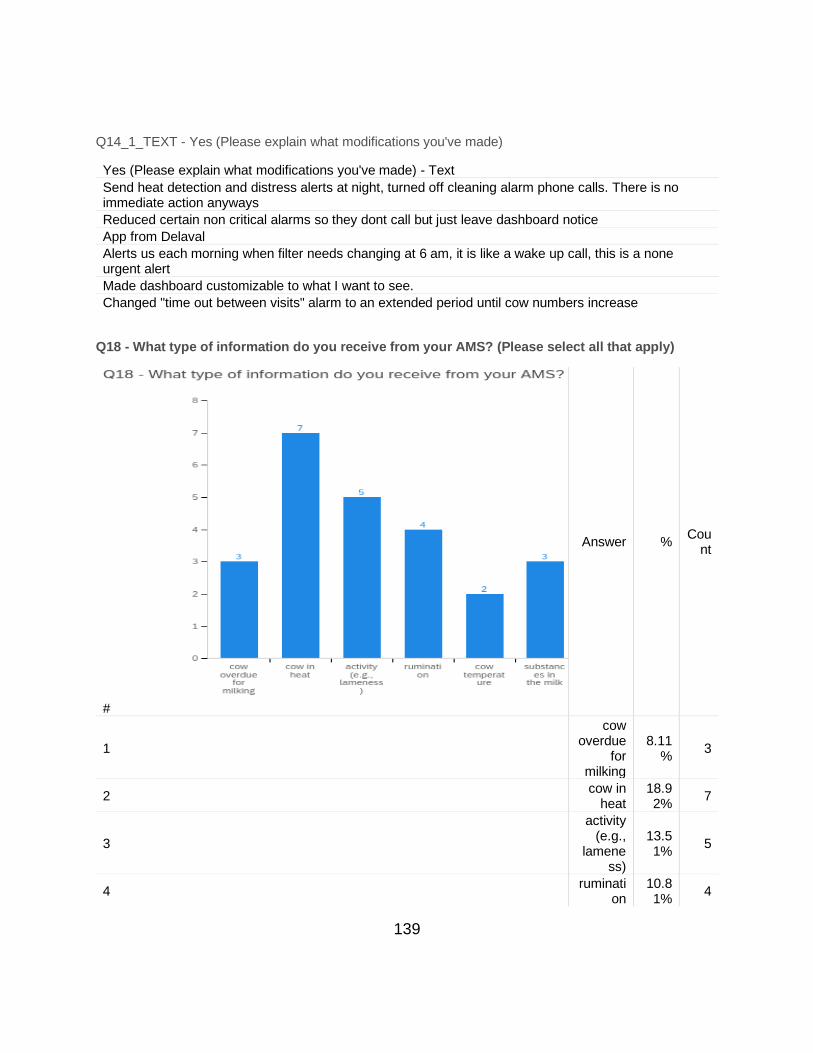
139
Q14_1_TEXT - Yes (Please explain what modifications you've made)
Yes (Please explain what modifications you've made) - Text
Send heat detection and distress alerts at night, turned off cleaning alarm phone calls. There is no immediate action anyways
Reduced certain non critical alarms so they dont call but just leave dashboard notice
App from Delaval
Alerts us each morning when filter needs changing at 6 am, it is like a wake up call, this is a none urgent alert
Made dashboard customizable to what I want to see.
Changed "time out between visits" alarm to an extended period until cow numbers increase
Q18 - What type of information do you receive from your AMS? (Please select all that apply)
#
Answer % Cou
nt
1
cow overdue
for milking
8.11%
3
2 cow in
heat 18.92%
7
3
activity (e.g.,
lameness)
13.51%
5
4 ruminati
on 10.81%
4
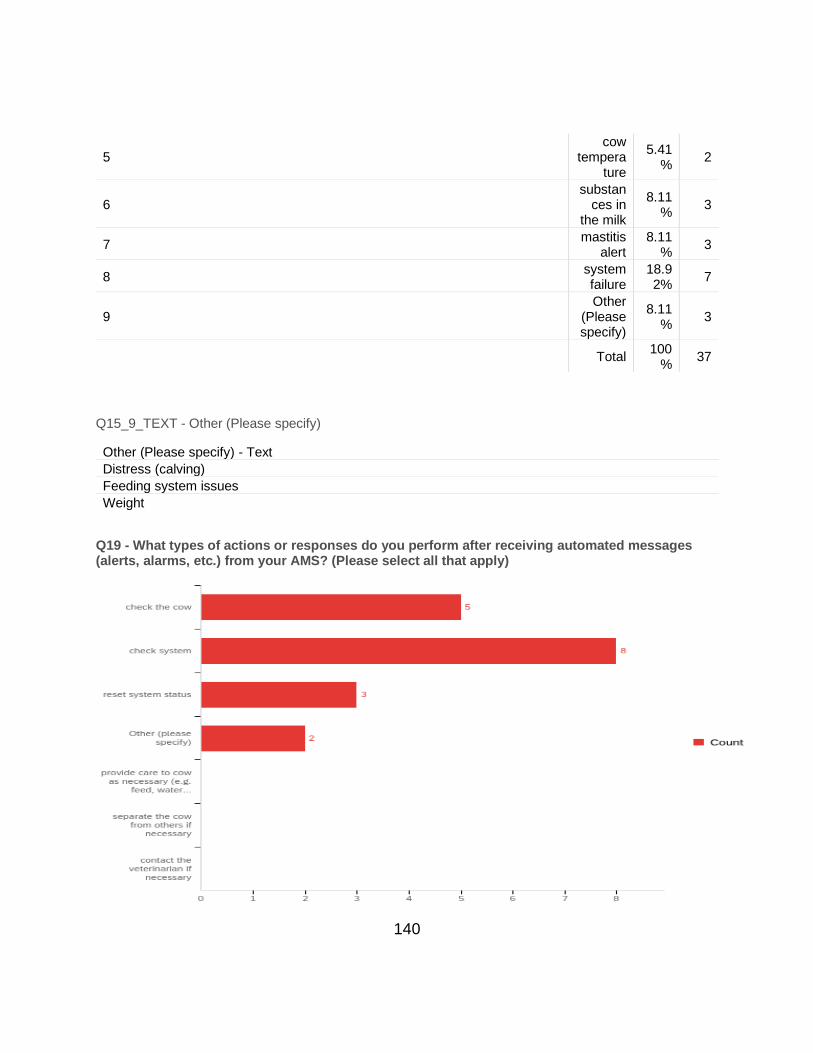
140
5 cow
temperature
5.41%
2
6 substan
ces in the milk
8.11%
3
7 mastitis
alert 8.11
% 3
8 system failure
18.92%
7
9 Other
(Please specify)
8.11%
3
Total 100
% 37
Q15_9_TEXT - Other (Please specify)
Other (Please specify) - Text
Distress (calving)
Feeding system issues
Weight
Q19 - What types of actions or responses do you perform after receiving automated messages (alerts, alarms, etc.) from your AMS? (Please select all that apply)

141
# Answer % Count
1 check the cow 27.78% 5
5 check system 44.44% 8
6 reset system status 16.67% 3
7 Other (please specify) 11.11% 2
2 provide care to cow as necessary (e.g. feed, water, hoof trim, etc.) 0.00% 0
3 separate the cow from others if necessary 0.00% 0
4 contact the veterinarian if necessary 0.00% 0
Total 100% 18
Q16_4_TEXT - Other (please specify)
Other (please specify) - Text
Check system for more details to determine action
I am finding questioning a bit confusing. I consider an alert something that is brought to my attention. In our case this is phone call regarding system operation. Lots of dashboard notifications about cow health, but i search reports, don't get a text/phone call about.
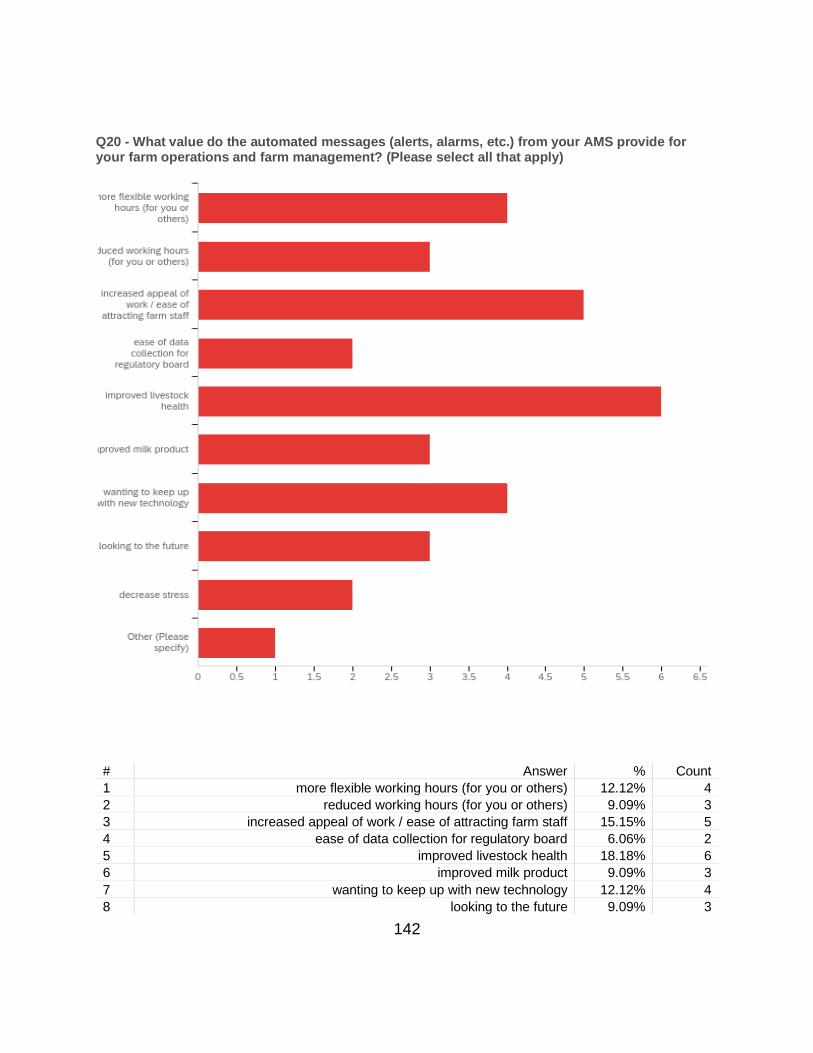
142
Q20 - What value do the automated messages (alerts, alarms, etc.) from your AMS provide for your farm operations and farm management? (Please select all that apply)
# Answer % Count
1 more flexible working hours (for you or others) 12.12% 4
2 reduced working hours (for you or others) 9.09% 3
3 increased appeal of work / ease of attracting farm staff 15.15% 5
4 ease of data collection for regulatory board 6.06% 2
5 improved livestock health 18.18% 6
6 improved milk product 9.09% 3
7 wanting to keep up with new technology 12.12% 4
8 looking to the future 9.09% 3
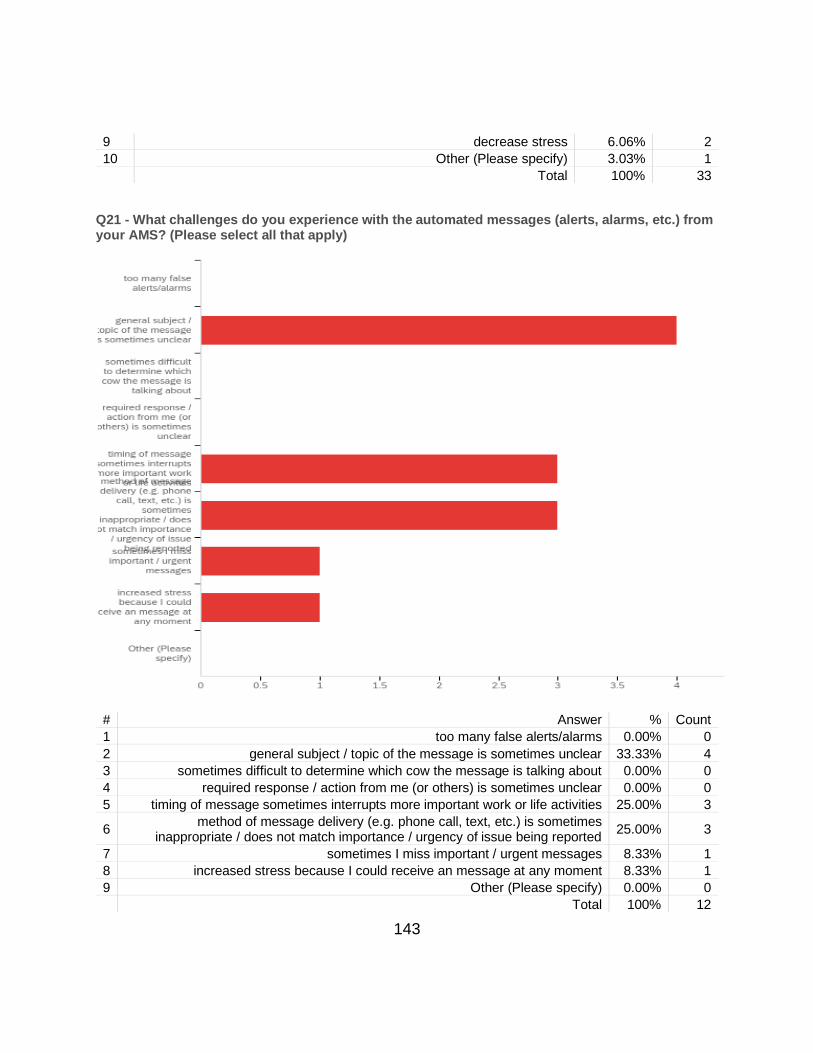
143
9 decrease stress 6.06% 2
10 Other (Please specify) 3.03% 1
Total 100% 33
Q21 - What challenges do you experience with the automated messages (alerts, alarms, etc.) from your AMS? (Please select all that apply)
# Answer % Count
1 too many false alerts/alarms 0.00% 0
2 general subject / topic of the message is sometimes unclear 33.33% 4
3 sometimes difficult to determine which cow the message is talking about 0.00% 0
4 required response / action from me (or others) is sometimes unclear 0.00% 0
5 timing of message sometimes interrupts more important work or life activities 25.00% 3
6 method of message delivery (e.g. phone call, text, etc.) is sometimes
inappropriate / does not match importance / urgency of issue being reported 25.00% 3
7 sometimes I miss important / urgent messages 8.33% 1
8 increased stress because I could receive an message at any moment 8.33% 1
9 Other (Please specify) 0.00% 0
Total 100% 12
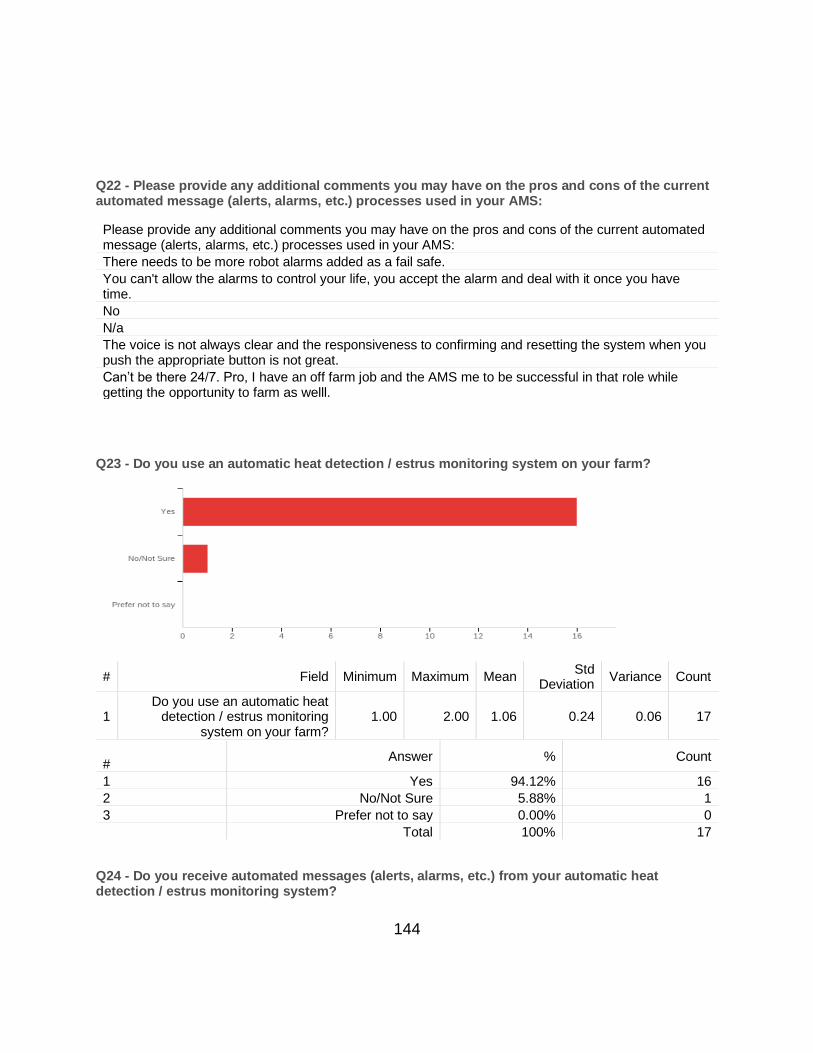
144
Q22 - Please provide any additional comments you may have on the pros and cons of the current automated message (alerts, alarms, etc.) processes used in your AMS:
Please provide any additional comments you may have on the pros and cons of the current automated message (alerts, alarms, etc.) processes used in your AMS:
There needs to be more robot alarms added as a fail safe.
You can't allow the alarms to control your life, you accept the alarm and deal with it once you have time.
No
N/a
The voice is not always clear and the responsiveness to confirming and resetting the system when you push the appropriate button is not great.
Can’t be there 24/7. Pro, I have an off farm job and the AMS me to be successful in that role while getting the opportunity to farm as welll.
Q23 - Do you use an automatic heat detection / estrus monitoring system on your farm?
# Field Minimum Maximum Mean Std
Deviation Variance Count
1 Do you use an automatic heat
detection / estrus monitoring system on your farm?
1.00 2.00 1.06 0.24 0.06 17
#
Answer % Count
1 Yes 94.12% 16
2 No/Not Sure 5.88% 1
3 Prefer not to say 0.00% 0
Total 100% 17
Q24 - Do you receive automated messages (alerts, alarms, etc.) from your automatic heat detection / estrus monitoring system?
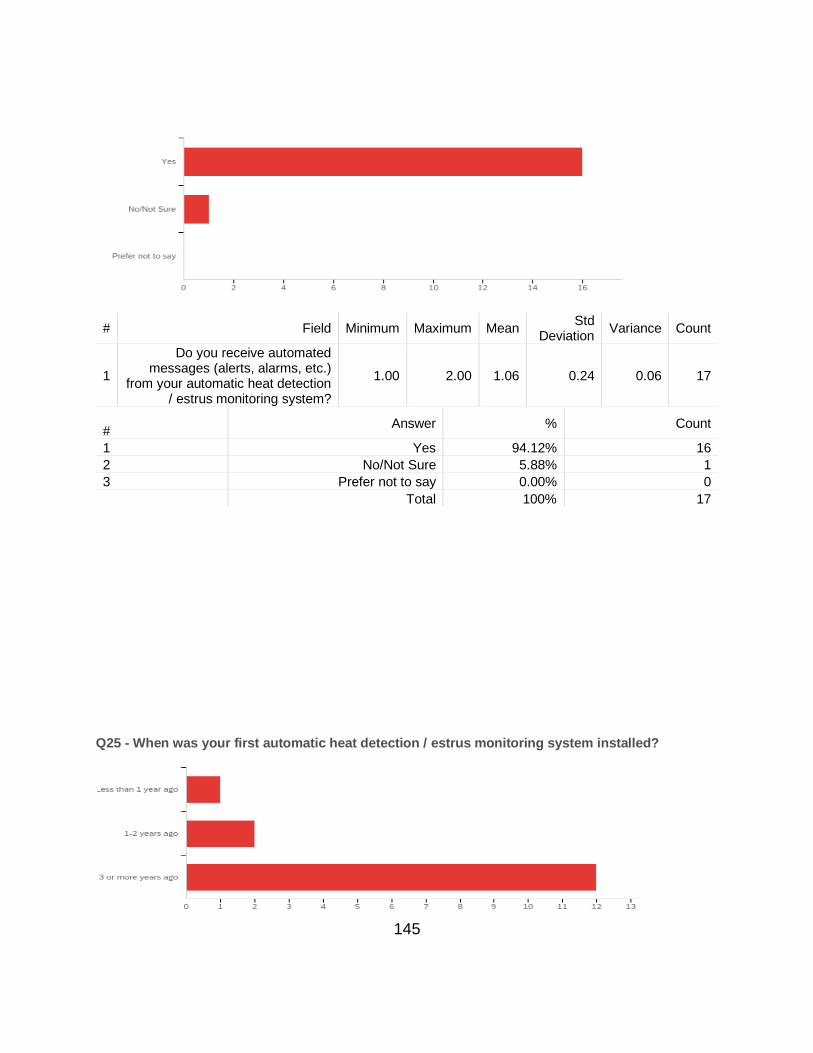
145
# Field Minimum Maximum Mean Std
Deviation Variance Count
1
Do you receive automated messages (alerts, alarms, etc.)
from your automatic heat detection / estrus monitoring system?
1.00 2.00 1.06 0.24 0.06 17
#
Answer % Count
1 Yes 94.12% 16
2 No/Not Sure 5.88% 1
3 Prefer not to say 0.00% 0
Total 100% 17
Q25 - When was your first automatic heat detection / estrus monitoring system installed?
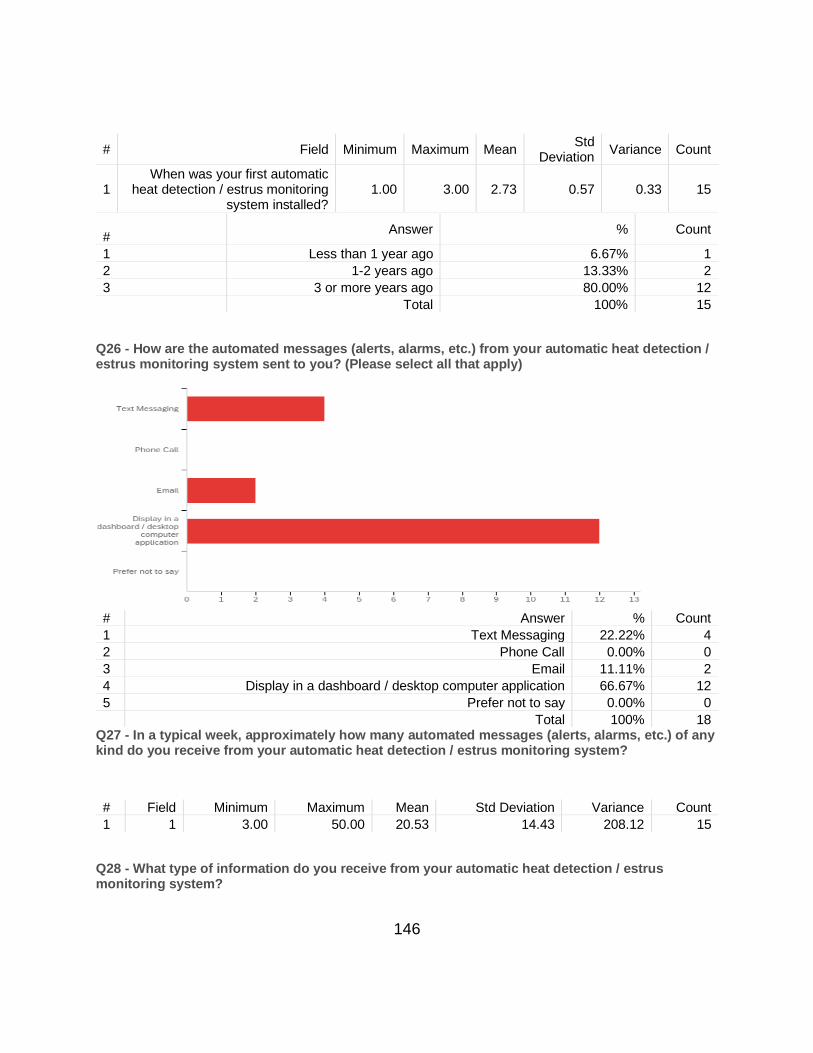
146
# Field Minimum Maximum Mean Std
Deviation Variance Count
1 When was your first automatic
heat detection / estrus monitoring system installed?
1.00 3.00 2.73 0.57 0.33 15
#
Answer % Count
1 Less than 1 year ago 6.67% 1
2 1-2 years ago 13.33% 2
3 3 or more years ago 80.00% 12
Total 100% 15
Q26 - How are the automated messages (alerts, alarms, etc.) from your automatic heat detection / estrus monitoring system sent to you? (Please select all that apply)
# Answer % Count
1 Text Messaging 22.22% 4
2 Phone Call 0.00% 0
3 Email 11.11% 2
4 Display in a dashboard / desktop computer application 66.67% 12
5 Prefer not to say 0.00% 0
Total 100% 18 Q27 - In a typical week, approximately how many automated messages (alerts, alarms, etc.) of any kind do you receive from your automatic heat detection / estrus monitoring system?
# Field Minimum Maximum Mean Std Deviation Variance Count
1 1 3.00 50.00 20.53 14.43 208.12 15
Q28 - What type of information do you receive from your automatic heat detection / estrus monitoring system?
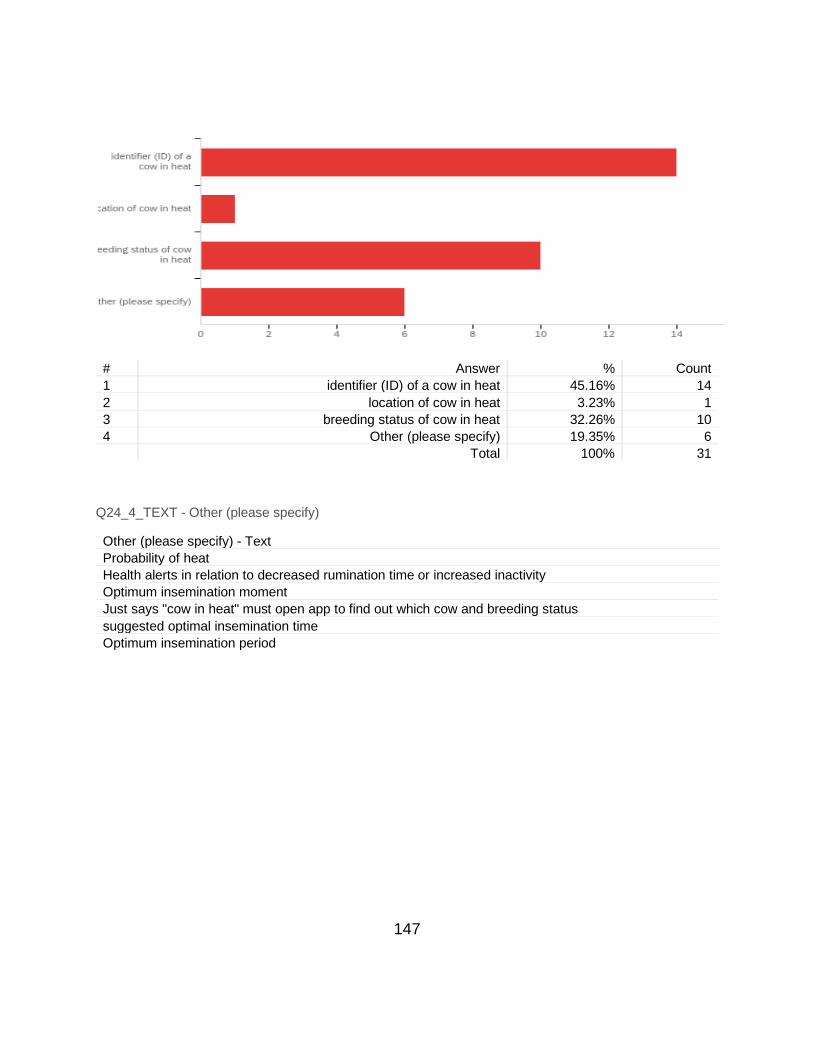
147
# Answer % Count
1 identifier (ID) of a cow in heat 45.16% 14
2 location of cow in heat 3.23% 1
3 breeding status of cow in heat 32.26% 10
4 Other (please specify) 19.35% 6
Total 100% 31
Q24_4_TEXT - Other (please specify)
Other (please specify) - Text
Probability of heat
Health alerts in relation to decreased rumination time or increased inactivity
Optimum insemination moment
Just says "cow in heat" must open app to find out which cow and breeding status
suggested optimal insemination time
Optimum insemination period

148
Q29 - What value do the automated messages (alerts, alarms, etc.) from your automatic heat detection / estrus monitoring system provide for your farm operations / management? (Please select all that apply)

149
# Answer % Count
1 more flexible working hours (for you or others) 6.78% 4
2 reduced working hours (for you or others) 5.08% 3
3 ease of attracting farm staff 0.00% 0
4 improved livestock health 18.64% 11
5 accurately identify insemination time of each cow 23.73% 14
6 decreased uncertainty of detecting heat events 18.64% 11
7 decreased stress related to breeding management 11.86% 7
8 wanting to keep up with new technology 5.08% 3
9 looking to the future 8.47% 5
10 Other (Please specify) 1.69% 1
Total 100% 59 Q26_10_TEXT - Others (Please specify)
Other (Please specify) - Text
High preg rate=lower DIM=higher feed efficiency = more milk
Q30 - What challenges do you experience with the automated messages (alerts, alarms, etc.) from your automatic heat detection / estrus monitoring system? (Please select all that apply)
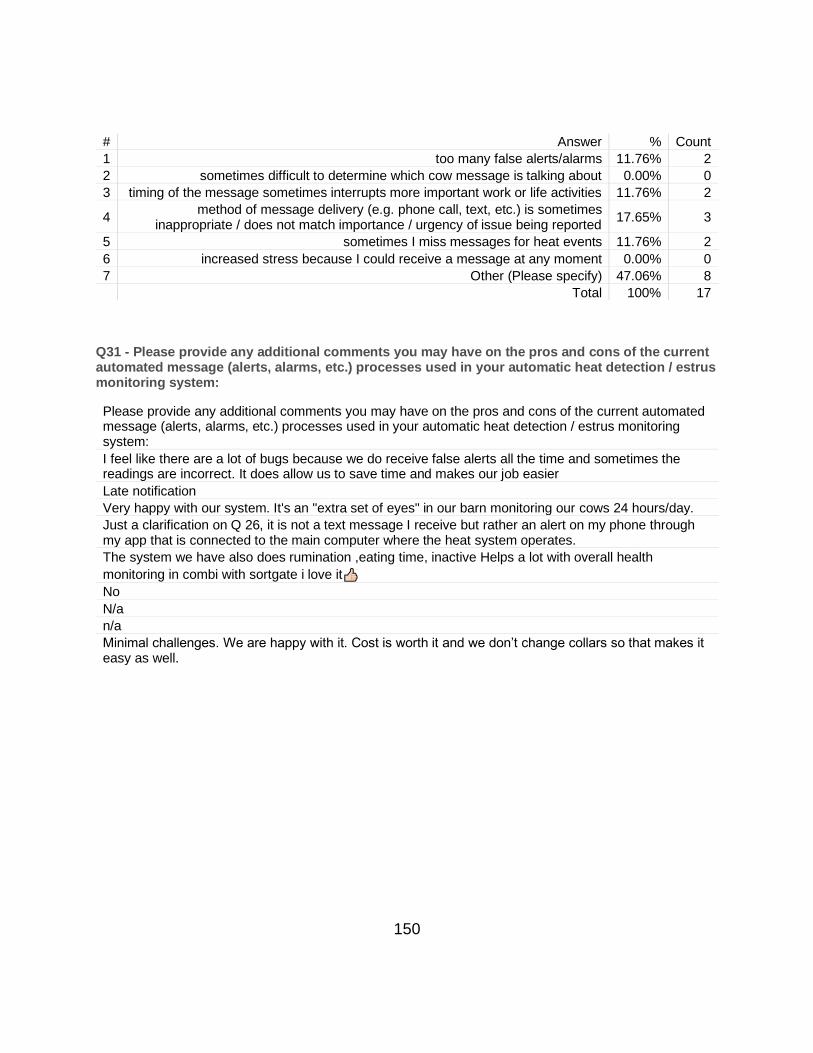
150
# Answer % Count
1 too many false alerts/alarms 11.76% 2
2 sometimes difficult to determine which cow message is talking about 0.00% 0
3 timing of the message sometimes interrupts more important work or life activities 11.76% 2
4 method of message delivery (e.g. phone call, text, etc.) is sometimes
inappropriate / does not match importance / urgency of issue being reported 17.65% 3
5 sometimes I miss messages for heat events 11.76% 2
6 increased stress because I could receive a message at any moment 0.00% 0
7 Other (Please specify) 47.06% 8
Total 100% 17
Q31 - Please provide any additional comments you may have on the pros and cons of the current automated message (alerts, alarms, etc.) processes used in your automatic heat detection / estrus monitoring system:
Please provide any additional comments you may have on the pros and cons of the current automated message (alerts, alarms, etc.) processes used in your automatic heat detection / estrus monitoring system:
I feel like there are a lot of bugs because we do receive false alerts all the time and sometimes the readings are incorrect. It does allow us to save time and makes our job easier
Late notification
Very happy with our system. It's an "extra set of eyes" in our barn monitoring our cows 24 hours/day.
Just a clarification on Q 26, it is not a text message I receive but rather an alert on my phone through my app that is connected to the main computer where the heat system operates.
The system we have also does rumination ,eating time, inactive Helps a lot with overall health
monitoring in combi with sortgate i love it
No
N/a
n/a
Minimal challenges. We are happy with it. Cost is worth it and we don’t change collars so that makes it easy as well.
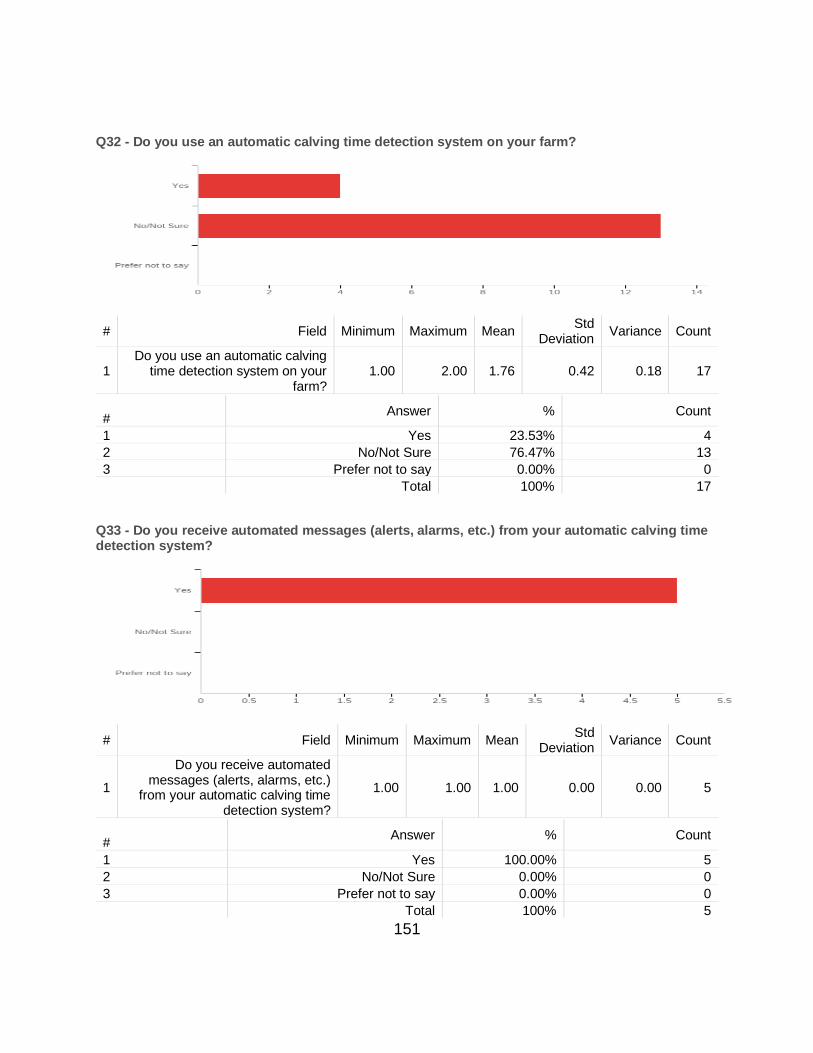
151
Q32 - Do you use an automatic calving time detection system on your farm?
# Field Minimum Maximum Mean Std
Deviation Variance Count
1 Do you use an automatic calving
time detection system on your farm?
1.00 2.00 1.76 0.42 0.18 17
#
Answer % Count
1 Yes 23.53% 4
2 No/Not Sure 76.47% 13
3 Prefer not to say 0.00% 0
Total 100% 17
Q33 - Do you receive automated messages (alerts, alarms, etc.) from your automatic calving time detection system?
# Field Minimum Maximum Mean Std
Deviation Variance Count
1
Do you receive automated messages (alerts, alarms, etc.)
from your automatic calving time detection system?
1.00 1.00 1.00 0.00 0.00 5
#
Answer % Count
1 Yes 100.00% 5
2 No/Not Sure 0.00% 0
3 Prefer not to say 0.00% 0
Total 100% 5
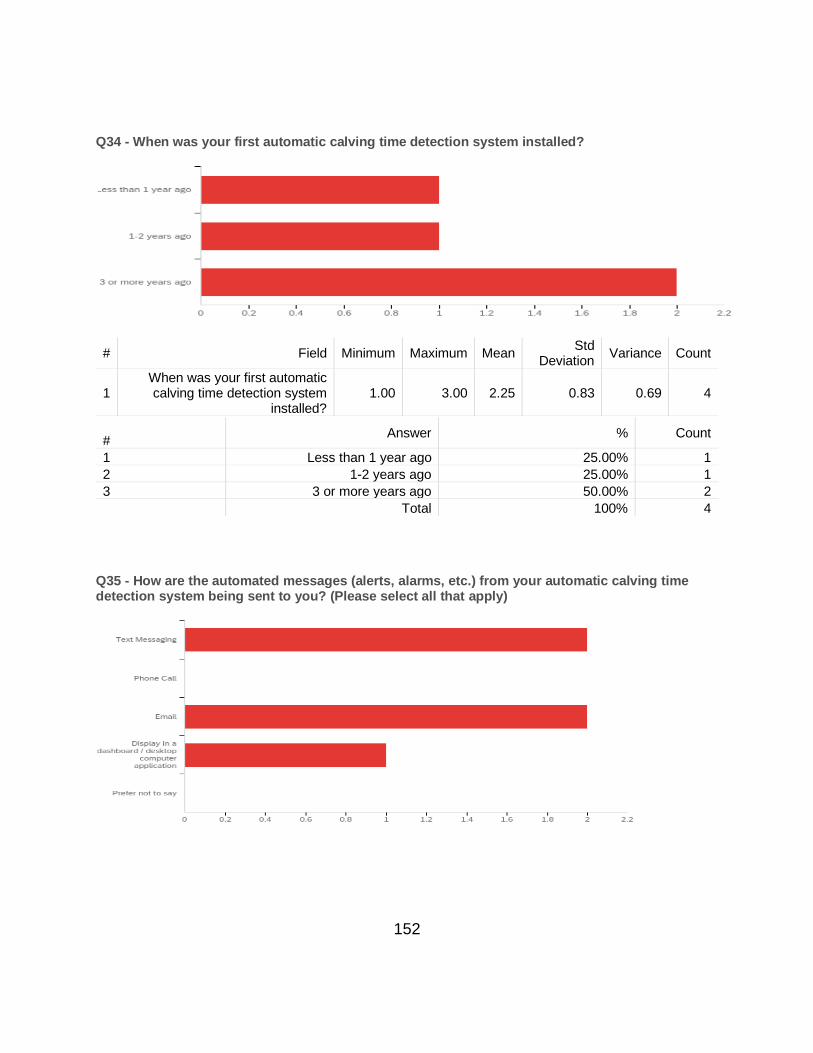
152
Q34 - When was your first automatic calving time detection system installed?
# Field Minimum Maximum Mean Std
Deviation Variance Count
1 When was your first automatic calving time detection system
installed? 1.00 3.00 2.25 0.83 0.69 4
#
Answer % Count
1 Less than 1 year ago 25.00% 1
2 1-2 years ago 25.00% 1
3 3 or more years ago 50.00% 2
Total 100% 4
Q35 - How are the automated messages (alerts, alarms, etc.) from your automatic calving time detection system being sent to you? (Please select all that apply)

153
# Answer % Count
1 Text Messaging 40.00% 2
2 Phone Call 0.00% 0
3 Email 40.00% 2
4 Display in a dashboard / desktop computer application 20.00% 1
5 Prefer not to say 0.00% 0
Total 100% 5
Q36 - On a typical week, how many automated messages (alerts, alarms, etc.) of any kind do you receive from your automatic calving time detection system?
# Field Minimum Maximum Mean Std Deviation Variance Count
1 1 2.00 31.00 16.75 13.77 189.69 4
Q37 - What type of information do you receive from your automatic calving time detection system? (Please select all that apply)
# Answer % Count
1 expected calving time for a cow 50.00% 3
2 identifier (ID) of a calving cow 33.33% 2
3 location of a calving cow 16.67% 1
4 Other (Please specify) 0.00% 0
Total 100% 6

154
Q38 - What value do the automated messages (alerts, alarms, etc.) from automatic calving time detection system provide for your farm operations / management? (Please select all that apply)
# Answer % Count
1 more flexible working hours (for you or others) 0.00% 0
2 reduced working hours (for you or others) 16.67% 2
3 ease of attracting farm staff 8.33% 1
4 improved cow and calf health outcomes 25.00% 3
5 accurately identify calving time of each cow 25.00% 3
6 decreased uncertainty around expected calving time 25.00% 3
7 decreased stress related to calving events 0.00% 0
8 wanting to keep up with new technology 0.00% 0
9 looking to the future 0.00% 0
10 Other (Please specify) 0.00% 0
Total 100% 12
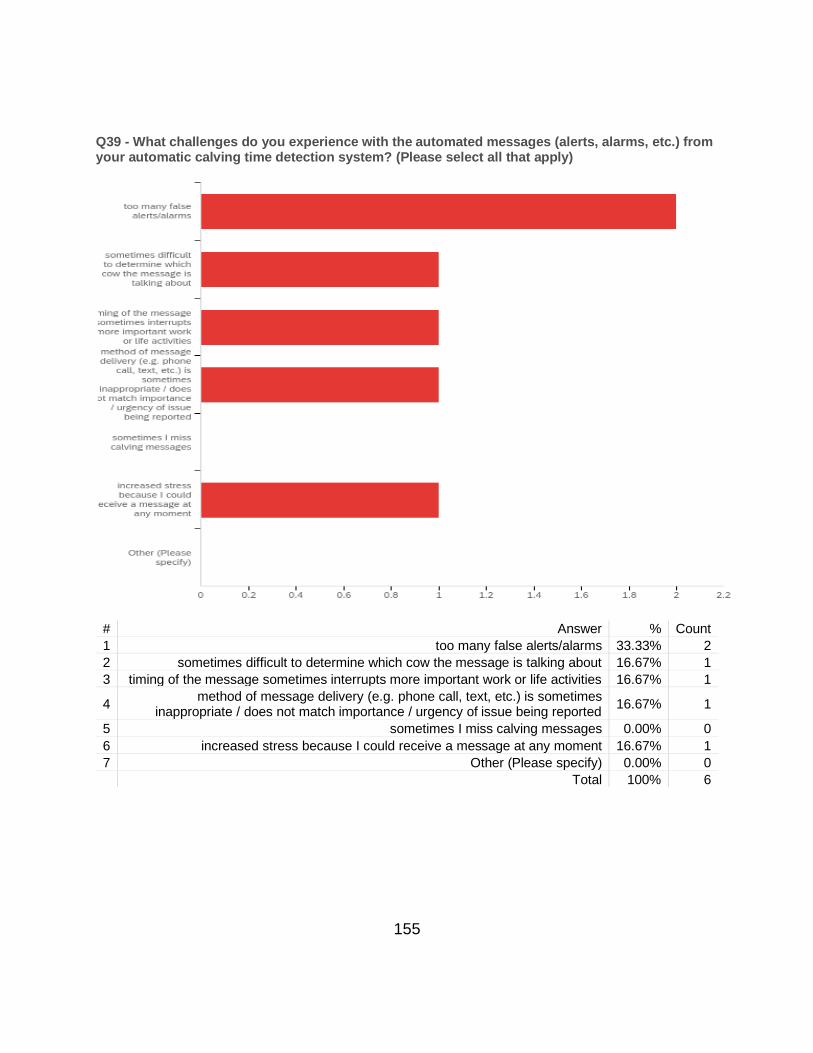
155
Q39 - What challenges do you experience with the automated messages (alerts, alarms, etc.) from your automatic calving time detection system? (Please select all that apply)
# Answer % Count
1 too many false alerts/alarms 33.33% 2
2 sometimes difficult to determine which cow the message is talking about 16.67% 1
3 timing of the message sometimes interrupts more important work or life activities 16.67% 1
4 method of message delivery (e.g. phone call, text, etc.) is sometimes
inappropriate / does not match importance / urgency of issue being reported 16.67% 1
5 sometimes I miss calving messages 0.00% 0
6 increased stress because I could receive a message at any moment 16.67% 1
7 Other (Please specify) 0.00% 0
Total 100% 6
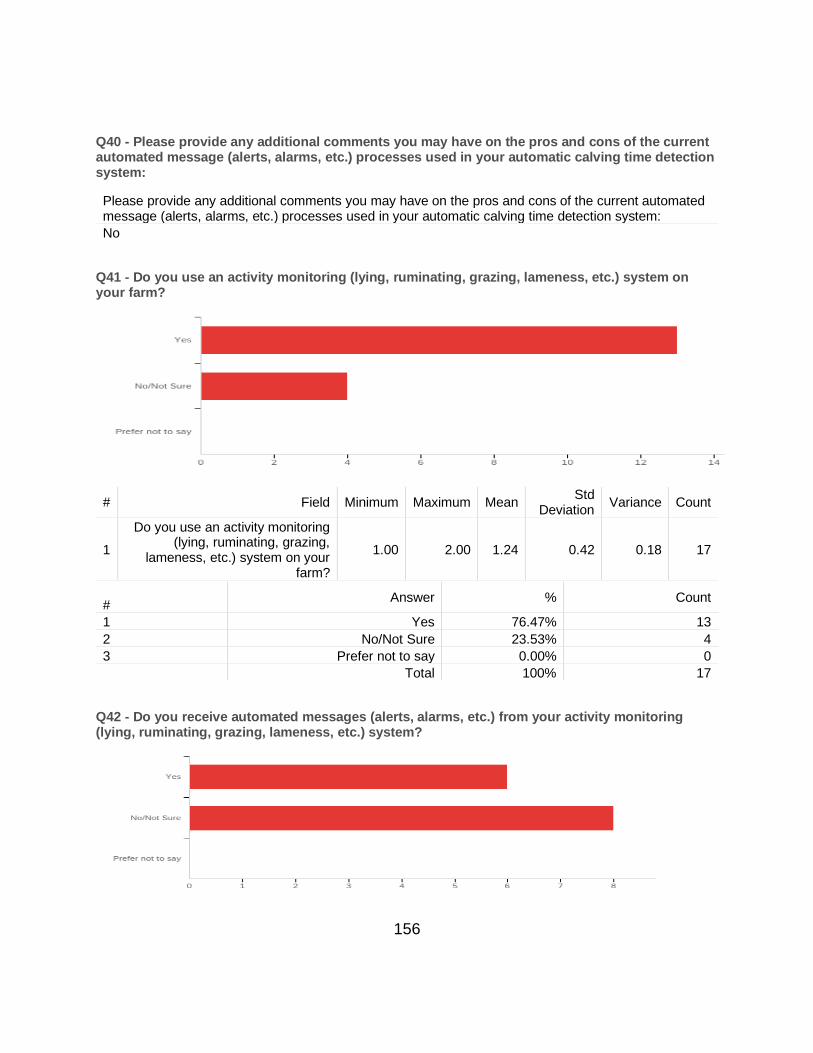
156
Q40 - Please provide any additional comments you may have on the pros and cons of the current automated message (alerts, alarms, etc.) processes used in your automatic calving time detection system:
Please provide any additional comments you may have on the pros and cons of the current automated message (alerts, alarms, etc.) processes used in your automatic calving time detection system:
No
Q41 - Do you use an activity monitoring (lying, ruminating, grazing, lameness, etc.) system on your farm?
# Field Minimum Maximum Mean Std
Deviation Variance Count
1
Do you use an activity monitoring (lying, ruminating, grazing,
lameness, etc.) system on your farm?
1.00 2.00 1.24 0.42 0.18 17
#
Answer % Count
1 Yes 76.47% 13
2 No/Not Sure 23.53% 4
3 Prefer not to say 0.00% 0
Total 100% 17
Q42 - Do you receive automated messages (alerts, alarms, etc.) from your activity monitoring (lying, ruminating, grazing, lameness, etc.) system?
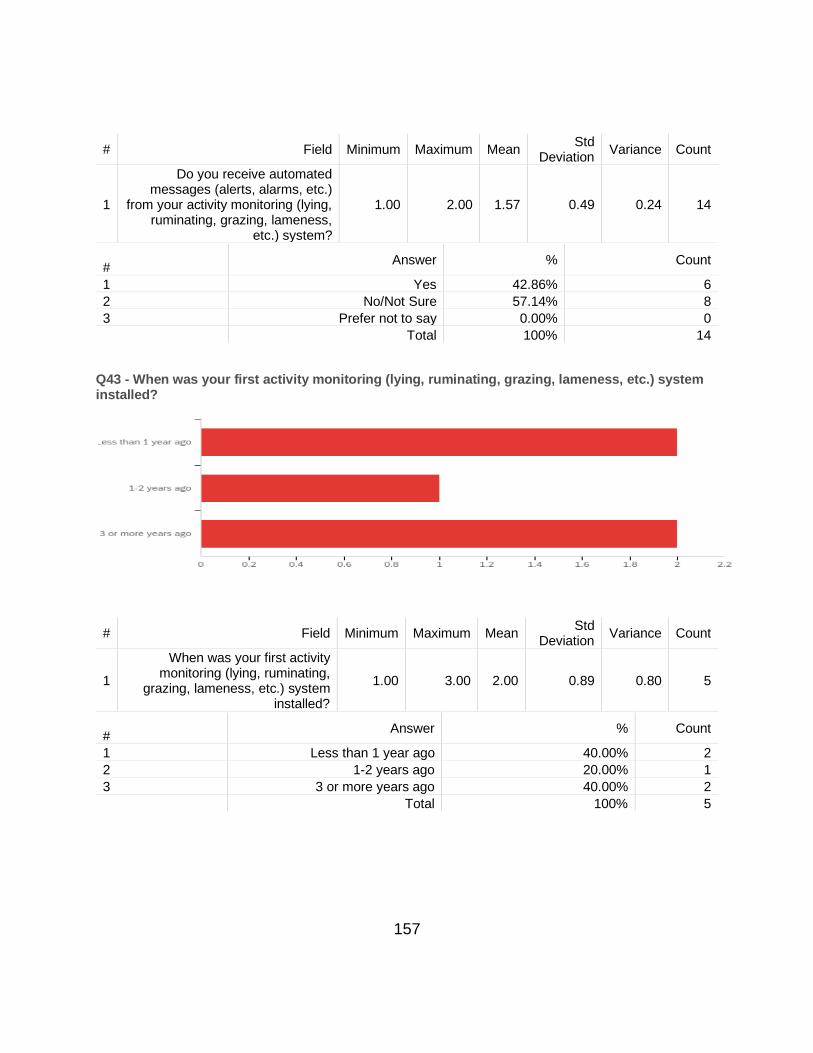
157
# Field Minimum Maximum Mean Std
Deviation Variance Count
1
Do you receive automated messages (alerts, alarms, etc.)
from your activity monitoring (lying, ruminating, grazing, lameness,
etc.) system?
1.00 2.00 1.57 0.49 0.24 14
#
Answer % Count
1 Yes 42.86% 6
2 No/Not Sure 57.14% 8
3 Prefer not to say 0.00% 0
Total 100% 14
Q43 - When was your first activity monitoring (lying, ruminating, grazing, lameness, etc.) system installed?
# Field Minimum Maximum Mean Std
Deviation Variance Count
1
When was your first activity monitoring (lying, ruminating,
grazing, lameness, etc.) system installed?
1.00 3.00 2.00 0.89 0.80 5
#
Answer % Count
1 Less than 1 year ago 40.00% 2
2 1-2 years ago 20.00% 1
3 3 or more years ago 40.00% 2
Total 100% 5
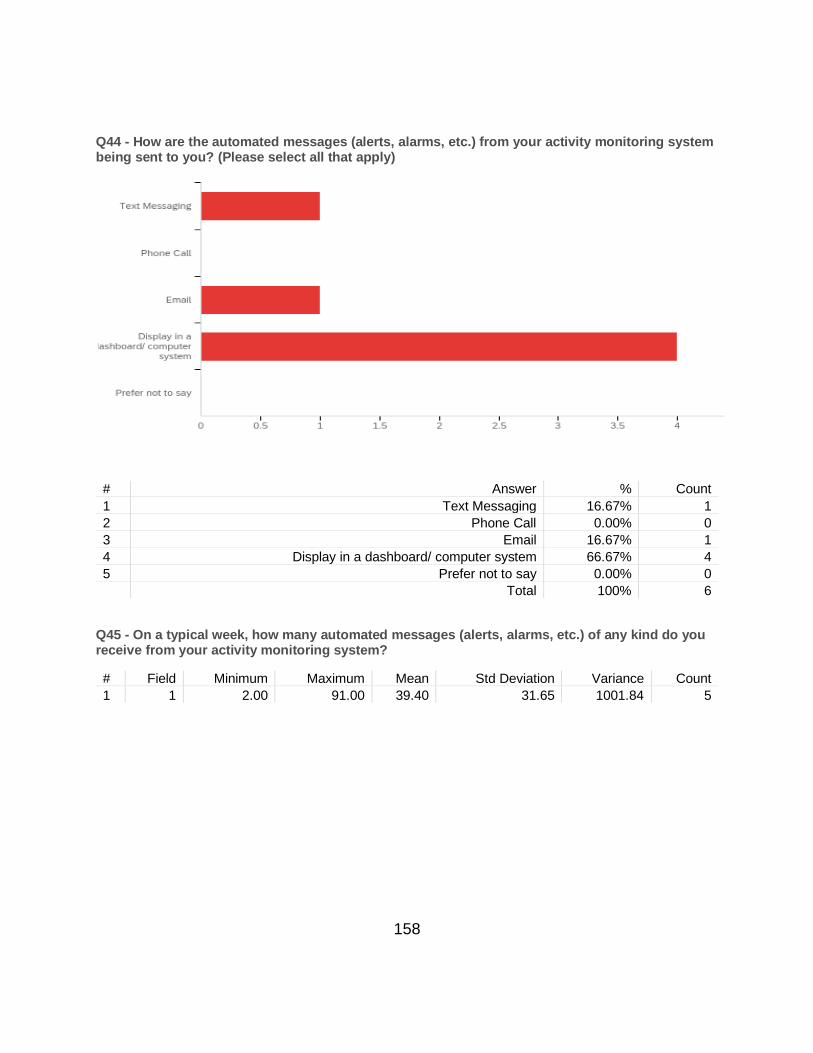
158
Q44 - How are the automated messages (alerts, alarms, etc.) from your activity monitoring system being sent to you? (Please select all that apply)
# Answer % Count
1 Text Messaging 16.67% 1
2 Phone Call 0.00% 0
3 Email 16.67% 1
4 Display in a dashboard/ computer system 66.67% 4
5 Prefer not to say 0.00% 0
Total 100% 6
Q45 - On a typical week, how many automated messages (alerts, alarms, etc.) of any kind do you receive from your activity monitoring system?
# Field Minimum Maximum Mean Std Deviation Variance Count
1 1 2.00 91.00 39.40 31.65 1001.84 5
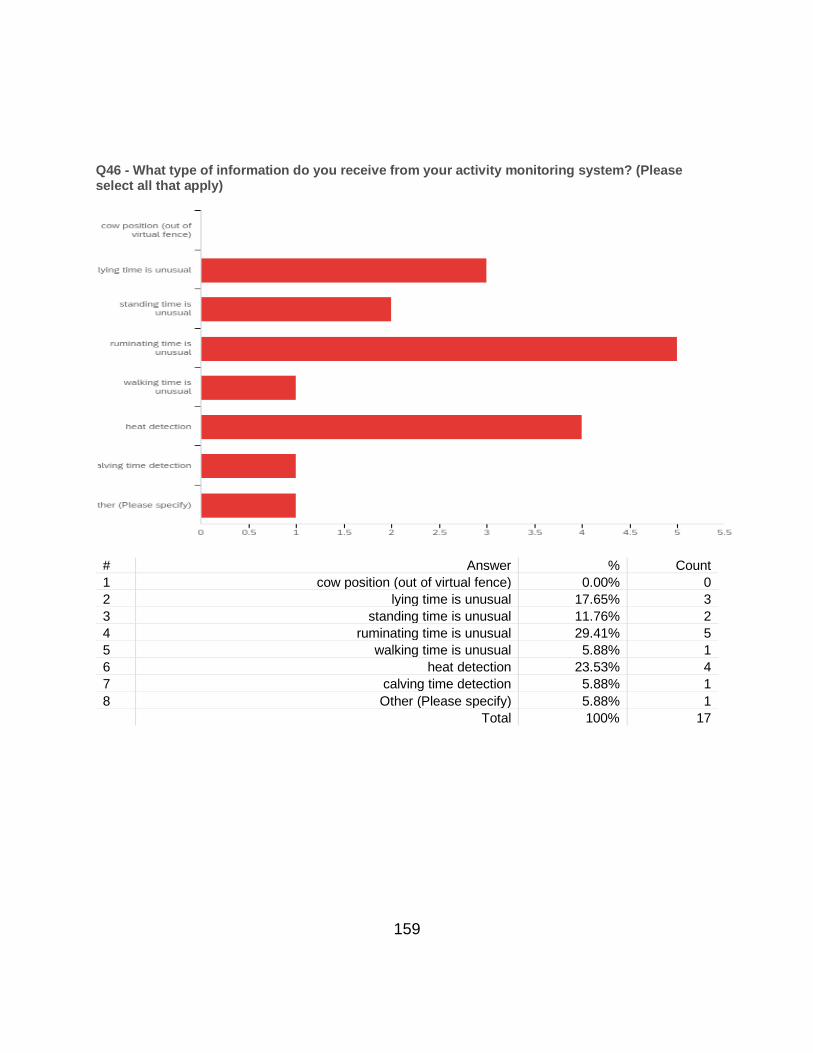
159
Q46 - What type of information do you receive from your activity monitoring system? (Please select all that apply)
# Answer % Count
1 cow position (out of virtual fence) 0.00% 0
2 lying time is unusual 17.65% 3
3 standing time is unusual 11.76% 2
4 ruminating time is unusual 29.41% 5
5 walking time is unusual 5.88% 1
6 heat detection 23.53% 4
7 calving time detection 5.88% 1
8 Other (Please specify) 5.88% 1
Total 100% 17

160
Q47 - What types of actions or responses are required from you after receiving automated messages (alerts, alarms, etc.) from your activity monitoring system? (Please select all that apply)
# Answer % Count
1 check the cow 23.53% 4
2 provide care to cow as necessary (e.g. feed, water, hoof trim, etc.) 23.53% 4
3 separate the cow from others if necessary 11.76% 2
4 contact veterinarian if necessary 17.65% 3
5 apply medicine if necessary 23.53% 4
6 Other (Please specify) 0.00% 0
Total 100% 17
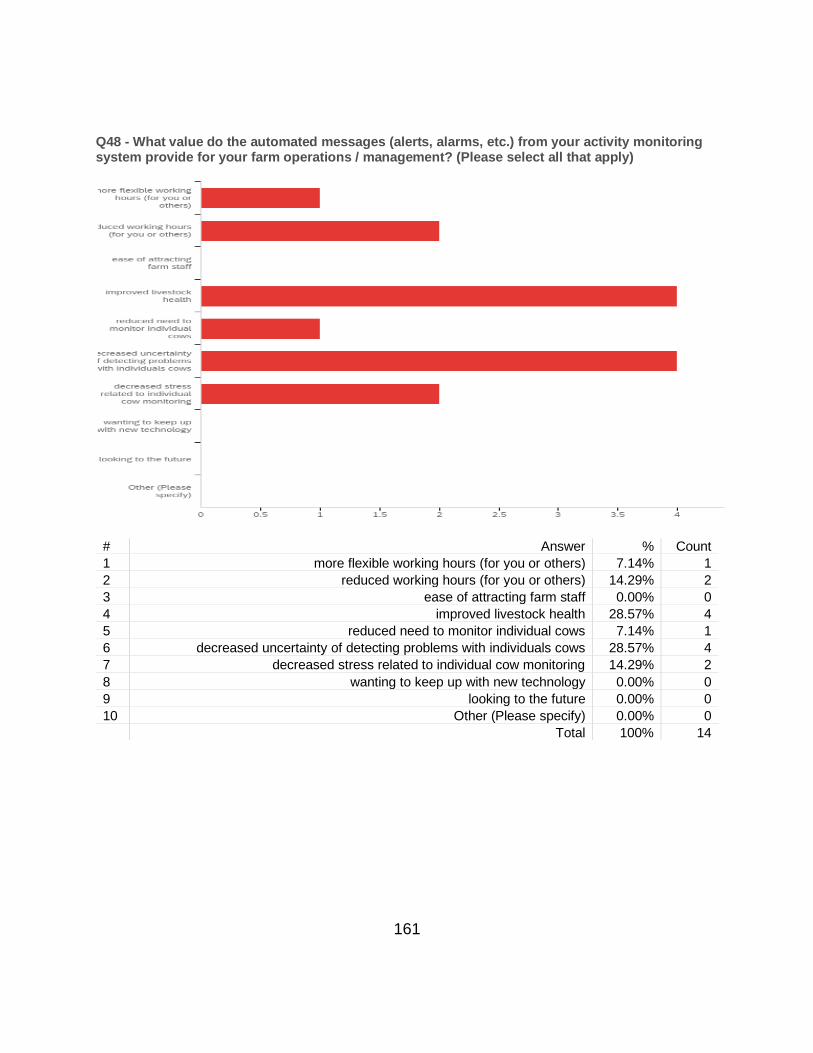
161
Q48 - What value do the automated messages (alerts, alarms, etc.) from your activity monitoring system provide for your farm operations / management? (Please select all that apply)
# Answer % Count
1 more flexible working hours (for you or others) 7.14% 1
2 reduced working hours (for you or others) 14.29% 2
3 ease of attracting farm staff 0.00% 0
4 improved livestock health 28.57% 4
5 reduced need to monitor individual cows 7.14% 1
6 decreased uncertainty of detecting problems with individuals cows 28.57% 4
7 decreased stress related to individual cow monitoring 14.29% 2
8 wanting to keep up with new technology 0.00% 0
9 looking to the future 0.00% 0
10 Other (Please specify) 0.00% 0
Total 100% 14

162
Q49 - What challenges do you experience with the automated messages (alerts, alarms, etc.) from your monitoring system? (Please select all that apply)
# Answer % Count
1 too many false alerts/alarms 11.11% 1
2 general subject / topic of the message is sometimes unclear 11.11% 1
3 sometimes difficult to determine which cow message is talking about 11.11% 1
4 sometimes difficult to know whether message is urgent or not 22.22% 2
5 timing of the message sometimes interrupts more important work or life activities 0.00% 0
6 method of message delivery (e.g. phone call, text, etc.) is sometimes
inappropriate / does not match importance / urgency of issue being reported 0.00% 0
7 sometimes I miss messages about abnormal cows 11.11% 1
8 increased stress because I could receive a message at any moment 0.00% 0
9 Other (Please specify) 33.33% 3
Total 100% 9
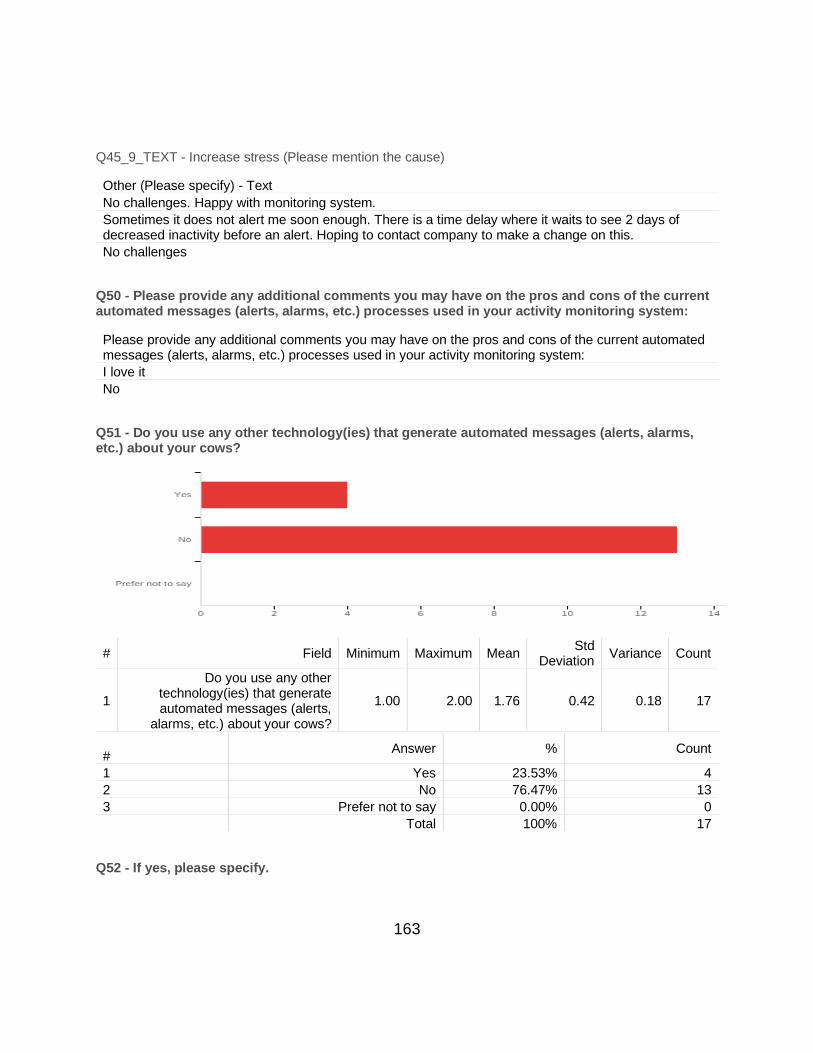
163
Q45_9_TEXT - Increase stress (Please mention the cause)
Other (Please specify) - Text
No challenges. Happy with monitoring system.
Sometimes it does not alert me soon enough. There is a time delay where it waits to see 2 days of decreased inactivity before an alert. Hoping to contact company to make a change on this.
No challenges
Q50 - Please provide any additional comments you may have on the pros and cons of the current automated messages (alerts, alarms, etc.) processes used in your activity monitoring system:
Please provide any additional comments you may have on the pros and cons of the current automated messages (alerts, alarms, etc.) processes used in your activity monitoring system:
I love it
No
Q51 - Do you use any other technology(ies) that generate automated messages (alerts, alarms, etc.) about your cows?
# Field Minimum Maximum Mean Std
Deviation Variance Count
1
Do you use any other technology(ies) that generate automated messages (alerts,
alarms, etc.) about your cows?
1.00 2.00 1.76 0.42 0.18 17
#
Answer % Count
1 Yes 23.53% 4
2 No 76.47% 13
3 Prefer not to say 0.00% 0
Total 100% 17
Q52 - If yes, please specify.
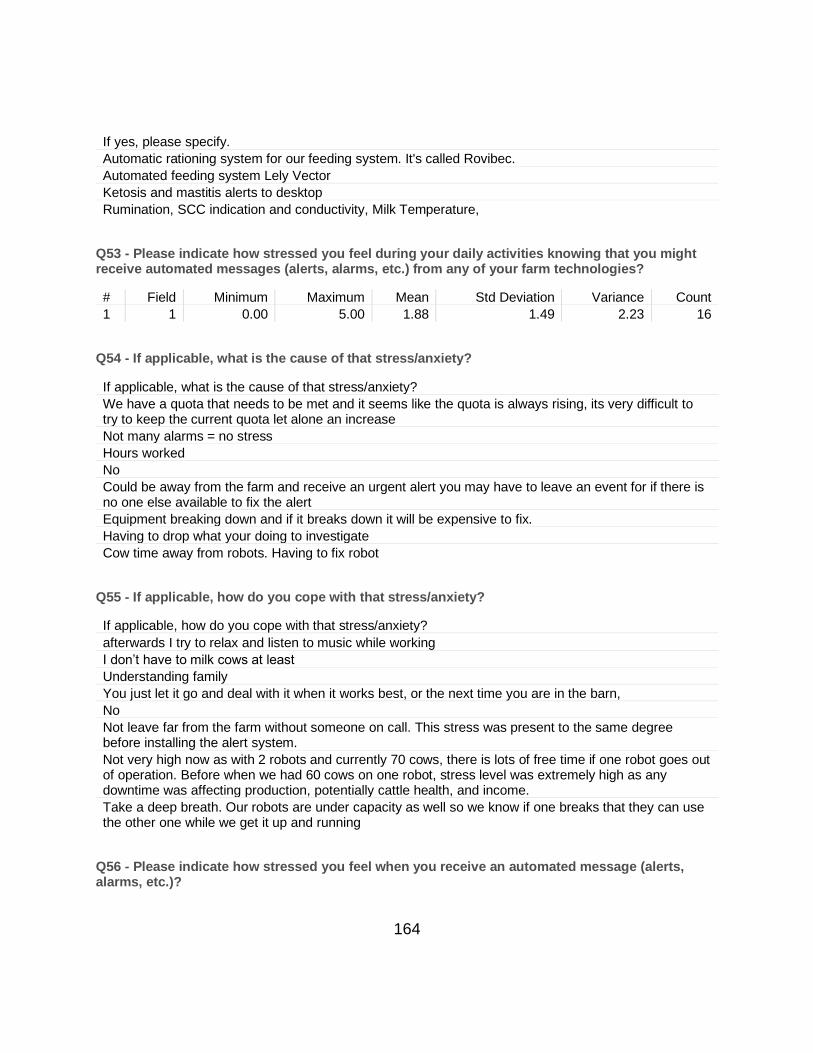
164
If yes, please specify.
Automatic rationing system for our feeding system. It's called Rovibec.
Automated feeding system Lely Vector
Ketosis and mastitis alerts to desktop
Rumination, SCC indication and conductivity, Milk Temperature,
Q53 - Please indicate how stressed you feel during your daily activities knowing that you might receive automated messages (alerts, alarms, etc.) from any of your farm technologies?
# Field Minimum Maximum Mean Std Deviation Variance Count
1 1 0.00 5.00 1.88 1.49 2.23 16
Q54 - If applicable, what is the cause of that stress/anxiety?
If applicable, what is the cause of that stress/anxiety?
We have a quota that needs to be met and it seems like the quota is always rising, its very difficult to try to keep the current quota let alone an increase
Not many alarms = no stress
Hours worked
No
Could be away from the farm and receive an urgent alert you may have to leave an event for if there is no one else available to fix the alert
Equipment breaking down and if it breaks down it will be expensive to fix.
Having to drop what your doing to investigate
Cow time away from robots. Having to fix robot
Q55 - If applicable, how do you cope with that stress/anxiety?
If applicable, how do you cope with that stress/anxiety?
afterwards I try to relax and listen to music while working
I don’t have to milk cows at least
Understanding family
You just let it go and deal with it when it works best, or the next time you are in the barn,
No
Not leave far from the farm without someone on call. This stress was present to the same degree before installing the alert system.
Not very high now as with 2 robots and currently 70 cows, there is lots of free time if one robot goes out of operation. Before when we had 60 cows on one robot, stress level was extremely high as any downtime was affecting production, potentially cattle health, and income.
Take a deep breath. Our robots are under capacity as well so we know if one breaks that they can use the other one while we get it up and running
Q56 - Please indicate how stressed you feel when you receive an automated message (alerts, alarms, etc.)?

165
# Field Minimum Maximum Mean Std Deviation Variance Count
1 1 0.00 7.00 2.14 2.17 4.69 14
Q57 - If applicable, what is the cause of that stress/anxiety?
If applicable, what is the cause of that stress/anxiety?
I worry that the alert will be something bad and when I hear it i always stop what Im doing and look and during that time period I get nervous and increased anxiety
Getting up in the middle of the night
No
Not stressed untill check to get more detail. Then depending on the alert could be no stress or urgent.
Finding out what is wrong.
Robot is broken. Needs fixing and I’m at work. Q58 - If applicable, how do you cope with that stress/ anxiety?
If applicable, how do you cope with that stress/ anxiety?
As I get more used to receiving alerts (we just started less then a year ago) I start to feel less anxious. I also changed the alerts on my device so it just vibrates
Sleep in
No
Most are not urgent, so frequency of urgent alerts is low which mitigates stress
Other robot can manage while I am at work. Milking 65 cows on 2 robots
Q59 - Overall, do you have any additional thoughts on how the current automated message (alerts, alarms, etc.) processes of your farm technologies could better support your farm management and decision making?
Overall, do you have any additional thoughts on how the current automated message (alerts, alarms, etc.) processes of your farm technologies could better support your farm management and decision making?
I think the alerts should be less and we should only receive alerts if there is a problem. We have done farming for along time without these systems in place and have done just fine. I think they are good but should just stay in the background
It works pretty good, additional alarms need to be added
Don't mind getting alerts. It's always for a good reason. It does not stress me out. It's all about being proactive on the farm instead of being reactive.
As mentioned above, adjusting the time of when the alert is being made in relation to decreased cow activity, generally relating in a health issue that needs to be addressed sooner.
No
N/a
Having team viewer on robots and manage technology from afar. More mobile technology with robot.
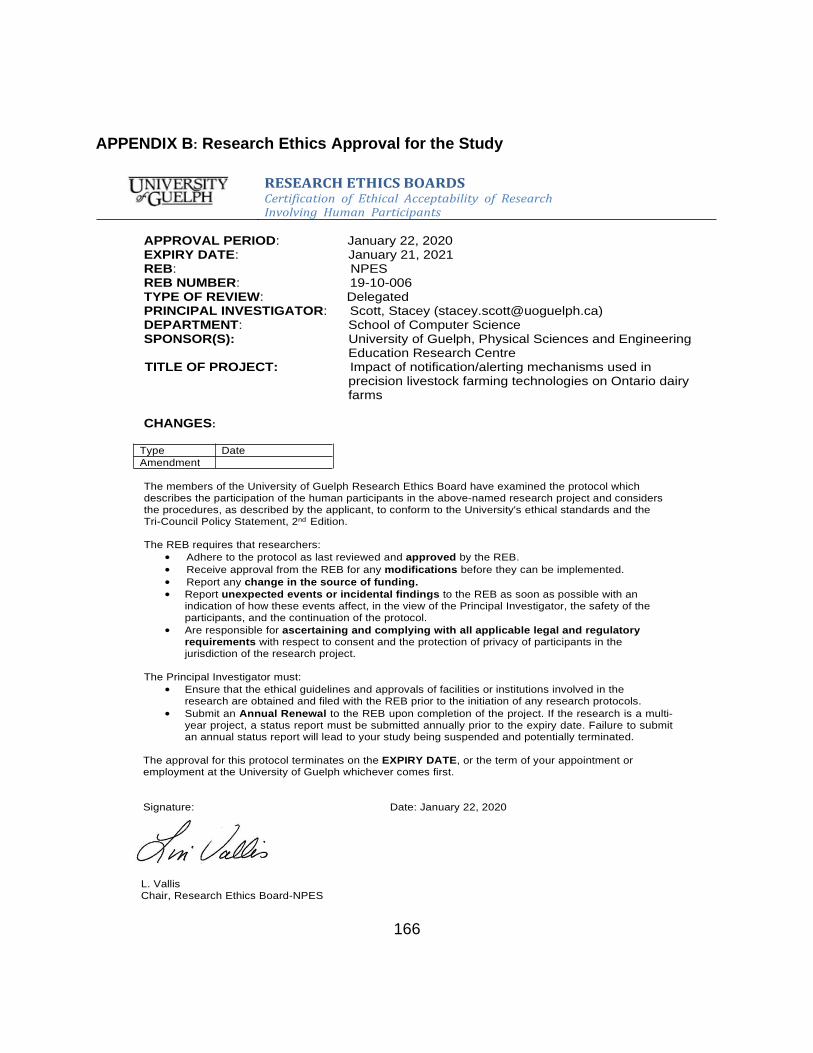
166
APPENDIX B: Research Ethics Approval for the Study
RESEARCH ETHICS BOARDS Certification of Ethical Acceptability of Research Involving Human Participants
APPROVAL PERIOD: January 22, 2020 EXPIRY DATE: January 21, 2021 REB: NPES REB NUMBER: 19-10-006 TYPE OF REVIEW: Delegated PRINCIPAL INVESTIGATOR: Scott, Stacey ([email protected]) DEPARTMENT: School of Computer Science SPONSOR(S): University of Guelph, Physical Sciences and Engineering
Education Research Centre TITLE OF PROJECT: Impact of notification/alerting mechanisms used in
precision livestock farming technologies on Ontario dairy farms
CHANGES:
Type Date
Amendment
The members of the University of Guelph Research Ethics Board have examined the protocol which describes the participation of the human participants in the above-named research project and considers the procedures, as described by the applicant, to conform to the University's ethical standards and the Tri-Council Policy Statement, 2nd Edition.
The REB requires that researchers:
• Adhere to the protocol as last reviewed and approved by the REB.
• Receive approval from the REB for any modifications before they can be implemented.
• Report any change in the source of funding.
• Report unexpected events or incidental findings to the REB as soon as possible with an indication of how these events affect, in the view of the Principal Investigator, the safety of the participants, and the continuation of the protocol.
• Are responsible for ascertaining and complying with all applicable legal and regulatory requirements with respect to consent and the protection of privacy of participants in the jurisdiction of the research project.
The Principal Investigator must:
• Ensure that the ethical guidelines and approvals of facilities or institutions involved in the research are obtained and filed with the REB prior to the initiation of any research protocols.
• Submit an Annual Renewal to the REB upon completion of the project. If the research is a multi- year project, a status report must be submitted annually prior to the expiry date. Failure to submit an annual status report will lead to your study being suspended and potentially terminated.
The approval for this protocol terminates on the EXPIRY DATE, or the term of your appointment or employment at the University of Guelph whichever comes first.
Signature: Date: January 22, 2020
L. Vallis Chair, Research Ethics Board-NPES
167
APPENDIX C: Email and Verbal Recruitment Script
Hello, We are a research group from the University of Guelph, and we are conducting a research study on “Impact of Precision Livestock Farming (PLF) technologies on farmers which send notifications to farmers regarding ongoing situations in the farm”. The study aims to investigate the mechanism of receiving notifications from Precision Livestock Farming (PLF) technologies and impacts of received notifications on dairy farmers to recommend better notification mechanism for dairy farmers. We will be interviewing farmers to understand how notifications are received by dairy farmers from Precision Livestock Farming (PLF) technologies and the impacts of received notifications on dairy farmers by using the questions in the interview of farmers.
If you participate in the interview we will provide pre-paid credit card of 20$. You may stop
your participation any times. We will provide you the summary of our research result through email if you want.
Also, all participant information from this study will remain confidential and not be publicly disclosed. With your consent, the study might be audio recorded so that our research team may refer to the data later, and anonymous quotes may be used in report publications or presentations. This interview should last less than 30 minutes.
This project has been reviewed by the Research Ethics Board of the University of Guelph for compliance with federal guidelines for research involving human participants.
So would you be willing to participate in this study? Thank you for your time. Prof Stacey Scott, Muhammad Muhaiminul Islam.
168
APPENDIX D: Letter of Information and Consent Form
Impact of PLF technologies on farmers which provide information to farmers regarding ongoing situations in the farm
School of Computer Science
University of Guelph
Principal Investigator: Professor Stacey Scott, School of Computer Science ([email protected])
Co - Investigator(s): Muhammad Muhaiminul Islam ([email protected])
Overview
You are being invited to volunteer in a study as part of a School of Computer Science masters research project. We are a research group from the University of Guelph, and we are conducting a research study on “Impact of Precision Livestock Farming (PLF) technologies on farmers which send notifications to farmers regarding ongoing situations in the farm”. The study aims to investigate the mechanism of receiving notifications from Precision Livestock Farming (PLF) technologies and impacts of received notifications on dairy farmers to recommend better notification mechanism for dairy farmers. The principal investigator is Prof. Stacey Scott and co-investigated by Muhammad Muhaiminul Islam.
In this study, we will be surveying farmers to understand how notifications are received by dairy farmers from Precision Livestock Farming (PLF) technologies and the impacts of received notifications on dairy farmers by using the questions in the survey which will be filled up by farmers.
You have been identified as an individual that could assist in the specific goals of this project. If you agree to participate in this study, we will briefly describe our ongoing study to you and then send an online survey to you; we will also call you or send you email or do both for a follow-up interview within 1 month of your completing survey which will be no later than June, 2020 if you indicate that you will like to participate in the follow-up interview on the survey form. We will also send a separate consent form for interview.
Study Details
If you participate in the survey you may win 40$ pre-paid credit card. We will draw a lottery and will provide pre-paid credit cards of 40$ for the lucky 5 persons who has completed the survey. After finishing the survey we will ask you for your phone/email if you want your name in the draw. You may stop at any time if you want but we will enter your name in the lottery only if you complete the survey. Moreover, we will provide you the summary of our research result through email if you want.
If you agree to participate, we will send an online survey to you, which should take less than 30 minutes to complete. If you indicate on the online survey form that you don’t mind us calling you for a follow-up interview, we will schedule interview time only for 30 minutes with you via email and/or phone call.
You may decline to answer particular questions, if you wish, and may withdraw participation in this or any subsequent session at any time. Participants may withdraw their data of completed survey before 1st June, 2020. If
169
you choose to withdraw at any point, all data collected during your session will be destroyed and not used in the study.
Risks
There are no known or anticipated risks to you as a participant in this study.
Confidentiality and Data Retention
All data collected is considered confidential. Codes, rather than names or other identifying information, will be used in notes and/or recordings. Even though we will publish our results in journals/conference, only the investigators will have access to the data collected. Your name or any other personal identifying information will not appear in any publication resulting from this study. However, with your permission, anonymous quotations and pictures may be used. Notes recordings collected during this study will be kept a secure location during the study, and will be destroyed (We will delete all the electronic data and paper data will be shredded by the principal investigator) by the end of my masters finial thesis submission which is not later than December, 2020.
Benefits of the Study
You will have a chance of winning 40$ pre-paid credit card for completing the survey. Moreover, the information you provide will help us understand the benefits and limitations of current PLF technologies for assisting in their farming operations and decision-making. It will also help us to create a guide for innovators to develop more user friendly and efficient technology for the dairy industry that you may use in the future.
Questions
If you have any questions about participation in this study, or would like additional information to assist you in reaching a decision about participation, please contact either Muhammad Muhaiminul Islam at [email protected] or Prof. Stacey Scott at [email protected].
If you have questions regarding your rights and welfare as a research participant in this study (REB# 19-10-006), please contact: Director, Research Ethics; University of Guelph; [email protected]; (519) 824-4120 (ext. 56606)
This project has been reviewed by the Research Ethics Board for compliance with federal guidelines for research involving human participants.

170
Please keep the information above for your records. Return this piece to the researcher.
Consent Form
Project Title: Impact of Precision Livestock Farming (PLF) technologies on farmers which send notifications to farmers regarding ongoing situations in the farm
I agree to participate in a study being conducted by Muhammad Muhaiminul Islam under the supervision of Prof. Stacey Scott for as part of the requirement of his Masters degree, at the University of Guelph. I have made this decision based on the information I have read in this Letter of Information above and have had the opportunity to receive any additional details I wanted about the study. I understand that I may withdraw this consent at any time, without penalty, by telling the researcher. I was informed that, should I choose to complete the entire study, that my responses would be recorded for future data analysis.
This project has been reviewed by the Research Ethics Board at the University of Guelph for compliance with federal guidelines for research involving human participants. I was informed that if I have any questions regarding my rights and welfare as a research participant in this study (REB# 19-10-006), I may contact: the Director, Research Ethics; University of Guelph; [email protected]; (519) 824-4120 (ext. 56606).
With full knowledge of all foregoing, I agree, of my own free will, to participate in this study.
Yes ___ No ___
I agree to have my survey/interview evaluation audio and/or video recorded for future analysis purposes.
Yes ___ No ___
I agree to the use of anonymous quotations in any presentation or report that comes of this study.
Yes ___ No ___
Participant Name: ______________________________________________________ (Please print)
Participant Signature: ___________________________________________________
Witness Name: ________________________________________________________ (Please print)
Witness Signature: _____________________________________________________
Date: ________________________________________________________________
Please return this piece to the researcher.
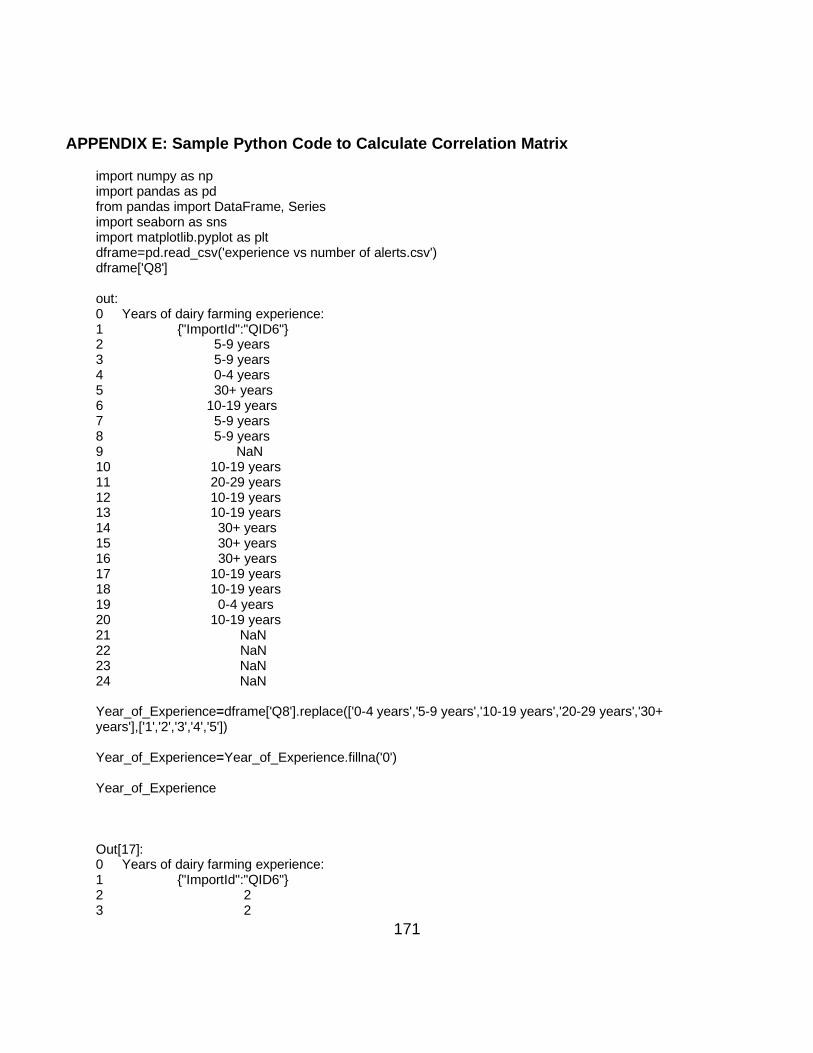
171
APPENDIX E: Sample Python Code to Calculate Correlation Matrix
import numpy as np import pandas as pd from pandas import DataFrame, Series import seaborn as sns import matplotlib.pyplot as plt dframe=pd.read_csv('experience vs number of alerts.csv') dframe['Q8'] out: 0 Years of dairy farming experience: 1 {"ImportId":"QID6"} 2 5-9 years 3 5-9 years 4 0-4 years 5 30+ years 6 10-19 years 7 5-9 years 8 5-9 years 9 NaN 10 10-19 years 11 20-29 years 12 10-19 years 13 10-19 years 14 30+ years 15 30+ years 16 30+ years 17 10-19 years 18 10-19 years 19 0-4 years 20 10-19 years 21 NaN 22 NaN 23 NaN 24 NaN Year_of_Experience=dframe['Q8'].replace(['0-4 years','5-9 years','10-19 years','20-29 years','30+ years'],['1','2','3','4','5']) Year_of_Experience=Year_of_Experience.fillna('0') Year_of_Experience Out[17]: 0 Years of dairy farming experience: 1 {"ImportId":"QID6"} 2 2 3 2
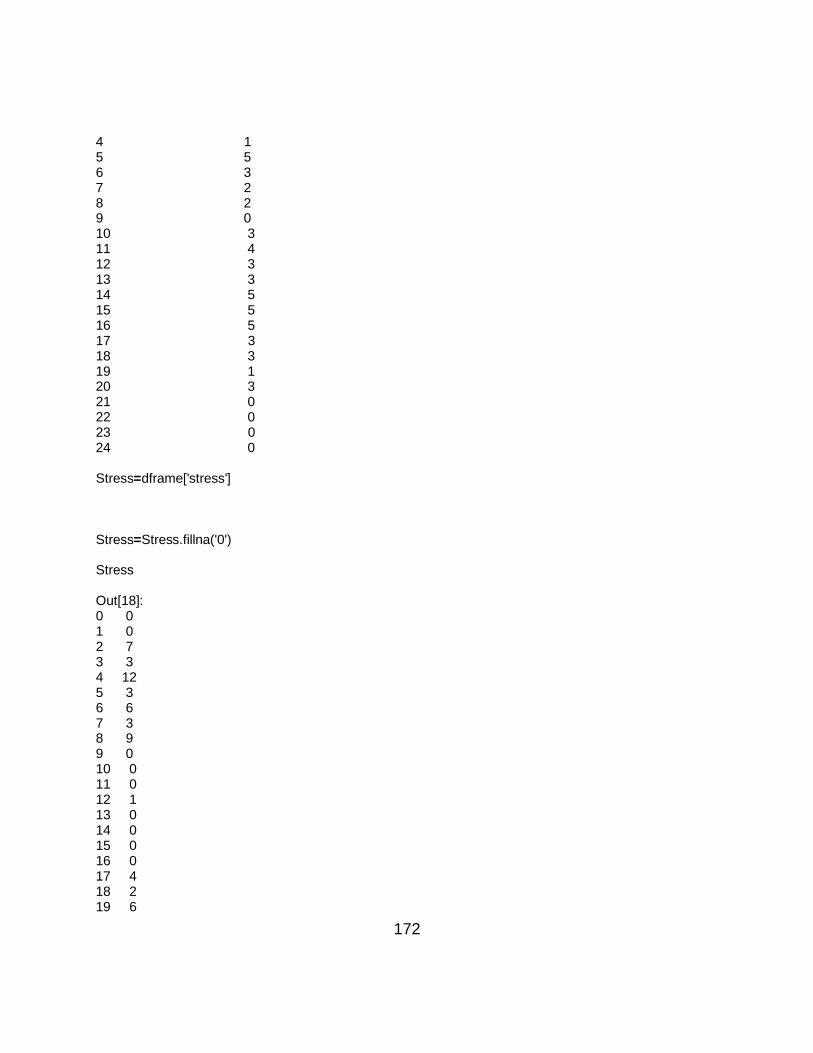
172
4 1 5 5 6 3 7 2 8 2 9 0 10 3 11 4 12 3 13 3 14 5 15 5 16 5 17 3 18 3 19 1 20 3 21 0 22 0 23 0 24 0 Stress=dframe['stress'] Stress=Stress.fillna('0') Stress Out[18]: 0 0 1 0 2 7 3 3 4 12 5 3 6 6 7 3 8 9 9 0 10 0 11 0 12 1 13 0 14 0 15 0 16 0 17 4 18 2 19 6
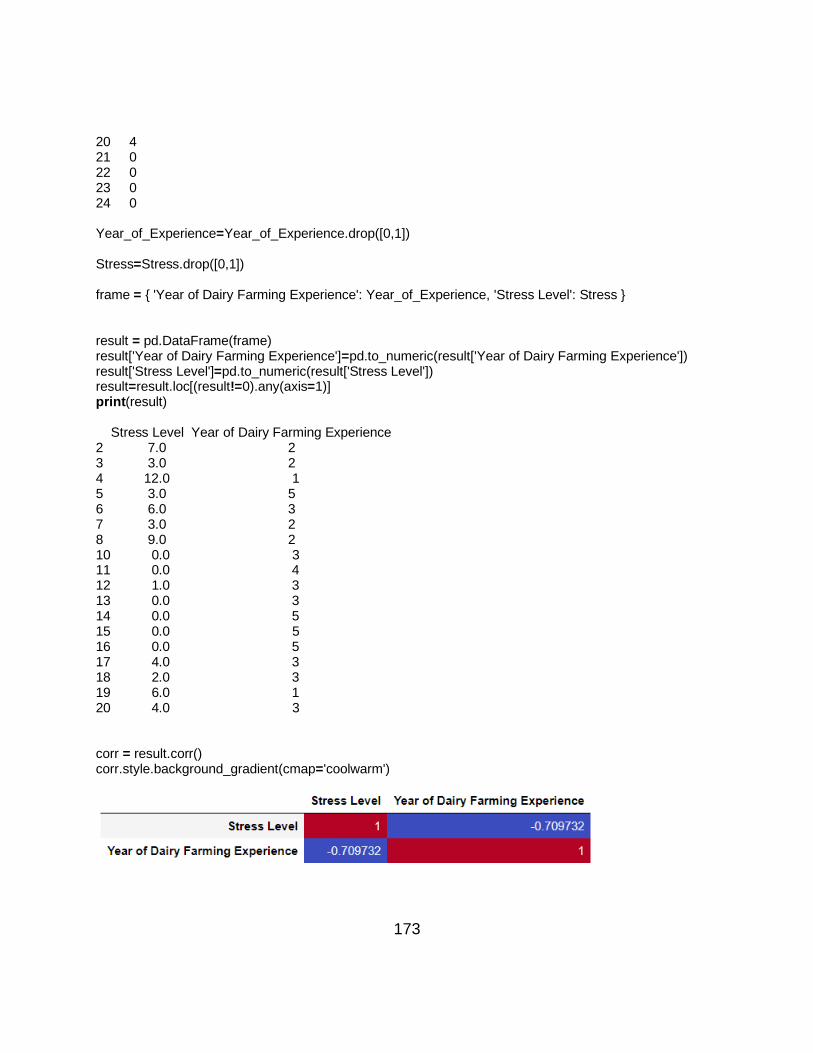
173
20 4 21 0 22 0 23 0 24 0 Year_of_Experience=Year_of_Experience.drop([0,1]) Stress=Stress.drop([0,1]) frame = { 'Year of Dairy Farming Experience': Year_of_Experience, 'Stress Level': Stress } result = pd.DataFrame(frame) result['Year of Dairy Farming Experience']=pd.to_numeric(result['Year of Dairy Farming Experience']) result['Stress Level']=pd.to_numeric(result['Stress Level']) result=result.loc[(result!=0).any(axis=1)] print(result) Stress Level Year of Dairy Farming Experience 2 7.0 2 3 3.0 2 4 12.0 1 5 3.0 5 6 6.0 3 7 3.0 2 8 9.0 2 10 0.0 3 11 0.0 4 12 1.0 3 13 0.0 3 14 0.0 5 15 0.0 5 16 0.0 5 17 4.0 3 18 2.0 3 19 6.0 1 20 4.0 3 corr = result.corr() corr.style.background_gradient(cmap='coolwarm')
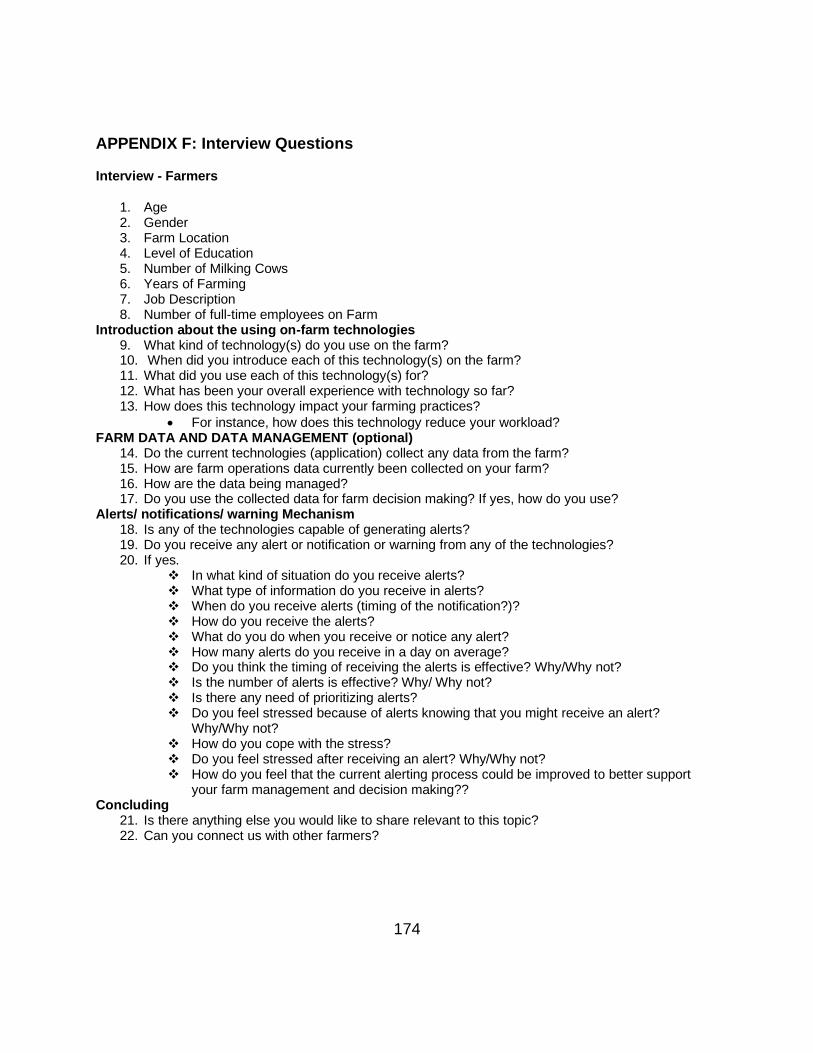
174
APPENDIX F: Interview Questions
Interview - Farmers
1. Age 2. Gender 3. Farm Location 4. Level of Education 5. Number of Milking Cows 6. Years of Farming 7. Job Description 8. Number of full-time employees on Farm
Introduction about the using on-farm technologies 9. What kind of technology(s) do you use on the farm? 10. When did you introduce each of this technology(s) on the farm? 11. What did you use each of this technology(s) for? 12. What has been your overall experience with technology so far? 13. How does this technology impact your farming practices?
• For instance, how does this technology reduce your workload? FARM DATA AND DATA MANAGEMENT (optional)
14. Do the current technologies (application) collect any data from the farm? 15. How are farm operations data currently been collected on your farm? 16. How are the data being managed? 17. Do you use the collected data for farm decision making? If yes, how do you use?
Alerts/ notifications/ warning Mechanism 18. Is any of the technologies capable of generating alerts? 19. Do you receive any alert or notification or warning from any of the technologies? 20. If yes.
❖ In what kind of situation do you receive alerts? ❖ What type of information do you receive in alerts? ❖ When do you receive alerts (timing of the notification?)? ❖ How do you receive the alerts? ❖ What do you do when you receive or notice any alert? ❖ How many alerts do you receive in a day on average? ❖ Do you think the timing of receiving the alerts is effective? Why/Why not? ❖ Is the number of alerts is effective? Why/ Why not? ❖ Is there any need of prioritizing alerts? ❖ Do you feel stressed because of alerts knowing that you might receive an alert?
Why/Why not? ❖ How do you cope with the stress? ❖ Do you feel stressed after receiving an alert? Why/Why not? ❖ How do you feel that the current alerting process could be improved to better support
your farm management and decision making?? Concluding
21. Is there anything else you would like to share relevant to this topic? 22. Can you connect us with other farmers?