Spatial Distribution of Fibrosis Governs Fibrillation Wave Dynamics in the Posterior Left Atrium...
44
ISSN: 1524-4571 Copyright © 2007 American Heart Association. All rights reserved. Print ISSN: 0009-7330. Online TX 72514 Circulation Research is published by the American Heart Association. 7272 Greenville Avenue, Dallas, DOI: 10.1161/CIRCRESAHA.107.153858 published online Aug 17, 2007; Circ. Res. Steve Landas, Gérard Guiraudon, José Jalife, Omer Berenfeld and Jérôme Kalifa Moreno, Matthew Klos, Alexey. V. Zaitsev, Ravi Vaidyanathan, David S. Auerbach, Kazuhiko Tanaka, Sharon Zlochiver, Karen. L. Vikstrom, Masatoshi Yamazaki, Javier Posterior Left Atrium During Heart Failure The Spatial Distribution of Fibrosis Governs Fibrillation Wave Dynamics in the http://circres.ahajournals.org/cgi/content/full/CIRCRESAHA.107.153858/DC1 Data Supplement (unedited) at: http://circres.ahajournals.org located on the World Wide Web at: The online version of this article, along with updated information and services, is http://www.lww.com/reprints Reprints: Information about reprints can be found online at [email protected] 410-528-8550. E-mail: Fax: Kluwer Health, 351 West Camden Street, Baltimore, MD 21202-2436. Phone: 410-528-4050. Permissions: Permissions & Rights Desk, Lippincott Williams & Wilkins, a division of Wolters http://circres.ahajournals.org/subscriptions/ Subscriptions: Information about subscribing to Circulation Research is online at by on May 21, 2011 circres.ahajournals.org Downloaded from
Transcript of Spatial Distribution of Fibrosis Governs Fibrillation Wave Dynamics in the Posterior Left Atrium...

ISSN: 1524-4571 Copyright © 2007 American Heart Association. All rights reserved. Print ISSN: 0009-7330. Online
TX 72514Circulation Research is published by the American Heart Association. 7272 Greenville Avenue, Dallas,
DOI: 10.1161/CIRCRESAHA.107.153858 published online Aug 17, 2007; Circ. Res.
Steve Landas, Gérard Guiraudon, José Jalife, Omer Berenfeld and Jérôme Kalifa Moreno, Matthew Klos, Alexey. V. Zaitsev, Ravi Vaidyanathan, David S. Auerbach,
Kazuhiko Tanaka, Sharon Zlochiver, Karen. L. Vikstrom, Masatoshi Yamazaki, Javier Posterior Left Atrium During Heart Failure
The Spatial Distribution of Fibrosis Governs Fibrillation Wave Dynamics in the
http://circres.ahajournals.org/cgi/content/full/CIRCRESAHA.107.153858/DC1Data Supplement (unedited) at:
http://circres.ahajournals.org
located on the World Wide Web at: The online version of this article, along with updated information and services, is
http://www.lww.com/reprintsReprints: Information about reprints can be found online at
[email protected]. E-mail:
Fax:Kluwer Health, 351 West Camden Street, Baltimore, MD 21202-2436. Phone: 410-528-4050. Permissions: Permissions & Rights Desk, Lippincott Williams & Wilkins, a division of Wolters
http://circres.ahajournals.org/subscriptions/Subscriptions: Information about subscribing to Circulation Research is online at
by on May 21, 2011 circres.ahajournals.orgDownloaded from

The Spatial Distribution of Fibrosis Governs FibrillationWave Dynamics in the Posterior Left Atrium During
Heart FailureKazuhiko Tanaka, Sharon Zlochiver, Karen. L. Vikstrom, Masatoshi Yamazaki, Javier Moreno,
Matthew Klos, Alexey. V. Zaitsev, Ravi Vaidyanathan, David S. Auerbach, Steve Landas,Gerard Guiraudon, Jose Jalife, Omer Berenfeld, Jerome Kalifa
Abstract—Heart failure (HF) commonly results in atrial fibrillation (AF) and fibrosis, but how the distribution of fibrosisimpacts AF dynamics has not been studied. HF was induced in sheep by ventricular tachypacing (220 bpm, 6 to 7weeks). Optical mapping (Di-4-ANEPPS, 300 frames/sec) of the posterior left atrial (PLA) endocardium was performedduring sustained AF (burst pacing) in Langendorff-perfused HF (n7, 4 mol/L acetylcholine; n3, no acetylcholine)and control (n6) hearts. PLA breakthroughs were the most frequent activation pattern in both groups (72.04.6 and90.22.7%, HF and control, respectively). However, unlike control, HF breakthroughs preferentially occurred at thePLAs periphery near the pulmonary vein ostia, and their beat-to-beat variability was greater than control (1.930.14versus 1.470.07 changes/[beats/sec], respectively, P0.05). On histological analysis (picrosirius red), the area ofdiffuse fibrosis was larger in HF (23.40.4%) than control (14.10.6%; P0.001, n4). Also the number and size offibrous patches were significantly larger and their location was more peripheral in HF than control. Computersimulations using 2-dimensional human atrial models with structural and ionic remodeling as in HF demonstrated thatchanges in AF activation frequency and dynamics were controlled by the interaction of electrical waves with clustersof fibrotic patches of various sizes and individual pulmonary vein ostia. During AF in failing hearts, heterogeneousspatial distribution of fibrosis at the PLA governs AF dynamics and fractionation. (Circ Res. 2007;101:000-000.)
Key Words: heart failure atrial fibrillation fibrosis mapping numerical simulations
Atrial fibrillation (AF) is the most common sustainedarrhythmia in adults and is often associated with con-
gestive heart failure (HF), which induces extracellular matrixremodeling involving atrial fibrosis and dilatation.1,2 Yet,how fibrosis contributes to AF mechanisms has not beenthoroughly investigated. Previous experimental and clinicalwork has emphasized a role for fibrosis in arrhythmiamaintenance.3,4 For example, interstitial fibrosis has beenimplicated in abnormalities during atrial pacing in dogs,3 andpatchy fibrosis has been shown to cause activation delays inthe human ventricle.5 In addition, chronic AF patients have anincreased propensity to develop fibrosis at the posterior leftatrium (PLA).4 However, the relation between AF dynamicsat the PLA and the percentage and distribution of fibrosis inHF remains unexplored. Here we have characterized how AFfrequency and dynamics on the endocardial surface of thePLA and pulmonary vein ostia (PVO) are affected by theamount, type (ie, diffuse versus patchy), and spatial distribu-tion of fibrosis in failing hearts. It is our hypothesis that
patchy rather than diffuse fibrosis contributes to wavebreakand intramural rotor formation, and governs the overall AFfrequency and dynamics.
MethodsHeart Failure ModelAll procedures were approved by the SUNY Upstate MedicalUniversity Committee for Humane Use of Animals. HF was inducedin 7 sheep (15 to 25 kg) as previously described6 (see supplementalmaterials, available online at http://circres.ahajournals.org).
Isolated Heart PreparationBoth HF (n10) and control sheep (n6) were anesthetized (Napentobarbital, 35 mg/Kg iv). The chest was opened through amidsternal incision. The heart was excised, placed in cardioplegicsolution, and connected to a Langendorff apparatus for continuousperfusion with Tyrode’s solution at 200 mL/min (36 to 38°C; pH:7.4; 95% O2, 5% CO2). The PLA endocardial surface was exposedthrough a minimal surgical opening in the left atrial appendage(LAA) avoiding any visible coronary branches. In Figure 1A, theincision lines are marked in a representative example (left panel) and
Original received April 10, 2007; revision received July 27, 2007; accepted August 8, 2007.From the Institute for Cardiovascular Research, Department of Pharmacology (K.T., S.Z., K.L.V., M.Y., J.M., M.K., A.V.Z., R.V., D.S.A., S.L., J.J.,
O.B., J.K.), SUNY Upstate Medical University, Syracuse, NY; and Canadian Surgery Technologies and Advanced Robotics (G.G.), University of WesternOntario, London, Ontario, Canada.
K.T., S.Z., and K.L.V. contributed equally to this study.Correspondence to Omer Berenfeld, PhD, Institute for Cardiovascular Research, SUNY Upstate Medical University,750 E Adams St, Syracuse, NY
13210. E-mail [email protected]© 2007 American Heart Association, Inc.
Circulation Research is available at http://circres.ahajournals.org DOI: 10.1161/CIRCRESAHA.107.153858
1 by on May 21, 2011 circres.ahajournals.orgDownloaded from

the mapped area of the PLA that includes the 4 PVO is shown (rightpanel). In a recent study,7 we demonstrated that this procedureenables optical mapping of the PLA endocardium without anyapparent damage to the circulation, and with AF frequencies anddynamics comparable to those observed in intact isolated hearts. In7 HF and 6 control hearts, AF was initiated by burst pacing in thepresence of 4 mol/L ACh. In 3 additional HF hearts, nonsustainedAF and atrial tachycardia (AT) were induced in the absence of ACh(see supplemental materials).
Optical Mapping TechniqueThis technique has been detailed elsewhere8 (see also supplementalmaterials). Briefly, no motion uncoupler was used (the separatorexposing the endocardial surface mechanically restrained the PLA).After a bolus injection of 5 to 10 mL Di-4-ANEPPS (10 mg/mL),one CCD camera (DALSA, CA-D1-0128T-STDL) recorded fluores-cence changes from an area of 5 cm2 at 300 frames/sec to obtain5-second movies (128128 pixels).
Spectral Analysis, Dominant FrequencyDominant frequency (DF) maps for each optical movie were calcu-lated by applying a Fast Fourier Transform (FFT) to the fluorescencesignal recorded at each pixel.9 To assess the location of the maximalDF (DFmax) domain at the PLA we superimposed the DF map and thecorresponding picture of the field of view according to anatomicallandmarks (PVO).
Histological ExaminationHistological analysis of fibrosis was obtained from transmural PLAslices of HF and normal hearts (see supplemental materials fordetails).
Activation PatternsActivation patterns analyses are described in details in the onlinesupplement.
Computer Simulations2D computer models of characteristic PLA sections were developedbased on realistic tissue and fibrosis geometry obtained from thehistological study of control and failing hearts. Control and HFmembrane ion kinetics of the myocytes and fibroblasts in the models
were based on human atrial properties (for details, see supplementalmaterials).
Statistical AnalysisSee online supplement for details on statistical methods. All resultswere expressed as meanSEM; P0.05 was considered statisticallysignificant.
ResultsClinical, Electrocardiographic, andEchocardiographic FindingsAll HF sheep manifested variable degrees of anorexia, leth-argy, tachypnea, and gain of body weight, as well as episodesof atrial tachyarrhythmia at 1826.0 bpm. As shown insupplemental Table I, significant clinical and echocardio-graphic hallmarks of systolic congestive HF were present inall HF sheep.
DF Distribution on the PLAFigure 1 describes the distribution of DFs in the PLA andother regions of the atria. As shown in panel B, duringsustained AF, the frequency of activation at the PLA wassignificantly larger than at the Bachmann bundle (BB) andthe right atrial appendage (RAA) in both HF and control(P0.05). However, as previously,10–12 regional DFmax valuesat all locations (PLA, BB, and RAA) were significantly lowerin the HF group compared with the control group (11.51.3versus 21.11.1 Hz at PLA; 8.10.7 versus 17.01.3 Hz atBB; 8.01.0 versus 13.62.0 Hz at RAA; *: P0.05).Representative examples of DF maps (left panels of Figure1C and 1D for control and HF, respectively) with single pixelrecordings (left traces) and bipolar electrograms (right traces)clearly support such a hierarchical organization. As shown bythe maps, in control the DFmax domain (red) spanned thecenter of the PLA, whereas in HF DFmax was shifted towardthe left inferior PVO. In control hearts, the DFmax area was
Figure 1. A, Atrial preparation and endo-cardial area mapped on the PLA. Left,Sites of LAA incision (yellow dashed lines).Right, Mapped area including 4 PVO.RSPV-right superior pulmonary vein,LSPV-left superior pulmonary vein, RIPV-right inferior pulmonary vein, LIPV-leftinferior pulmonary vein. B, DFmax at PLA,BB and RAA in both groups (*P0.05between HF and control at the 3 locations,#P0.05 between PLA and BB in both HFand control). C, Representative PLA DFmap, single pixel recordings at locations aand b, and electrogram of the right atrialappendage (RAA) in control. D, Represen-tative DF map, single pixel recordings atlocations c and d, and RAA electrogramin HF.
2 Circulation Research October 12, 2007
by on May 21, 2011 circres.ahajournals.orgDownloaded from
1.30.4 cm2, or 25.48.4% of the mapped PLA area.Superposition with an anatomical picture of the PLA similarto that in panel A revealed that in control the DFmax domainextended over the left PVO in 2/6 experiments and over bothleft PVO and center of the PLA in 4/6 experiments. Incontrast, in HF, the DFmax domain spanned an area of 1.10.3cm2 (17.65.5% of the PLA, P0.75) and localized mainlyto the margin of the PLA, enclosing one or several PVO (5/7experiments), or extended over the entire PLA (2/7 experi-ments). Interestingly, in all HF experiments, the signalsrecorded in the DFmax area were more fractionated than thoserecorded in other areas (panel D, trace c compared with traced). Conversely, the signals from the DFmax area in controlhearts were the most regular (panel C, trace a compared withb), in agreement with our recent report.7
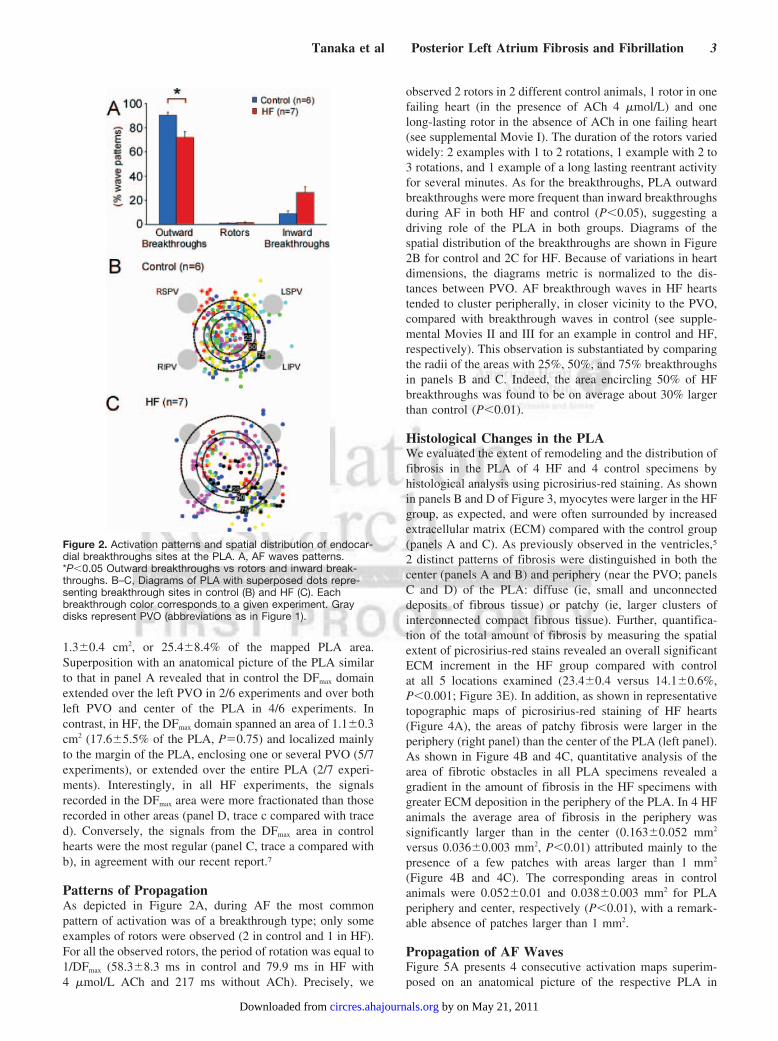
Patterns of PropagationAs depicted in Figure 2A, during AF the most commonpattern of activation was of a breakthrough type; only someexamples of rotors were observed (2 in control and 1 in HF).For all the observed rotors, the period of rotation was equal to1/DFmax (58.38.3 ms in control and 79.9 ms in HF with4 mol/L ACh and 217 ms without ACh). Precisely, we
observed 2 rotors in 2 different control animals, 1 rotor in onefailing heart (in the presence of ACh 4 mol/L) and onelong-lasting rotor in the absence of ACh in one failing heart(see supplemental Movie I). The duration of the rotors variedwidely: 2 examples with 1 to 2 rotations, 1 example with 2 to3 rotations, and 1 example of a long lasting reentrant activityfor several minutes. As for the breakthroughs, PLA outwardbreakthroughs were more frequent than inward breakthroughsduring AF in both HF and control (P0.05), suggesting adriving role of the PLA in both groups. Diagrams of thespatial distribution of the breakthroughs are shown in Figure2B for control and 2C for HF. Because of variations in heartdimensions, the diagrams metric is normalized to the dis-tances between PVO. AF breakthrough waves in HF heartstended to cluster peripherally, in closer vicinity to the PVO,compared with breakthrough waves in control (see supple-mental Movies II and III for an example in control and HF,respectively). This observation is substantiated by comparingthe radii of the areas with 25%, 50%, and 75% breakthroughsin panels B and C. Indeed, the area encircling 50% of HFbreakthroughs was found to be on average about 30% largerthan control (P0.01).
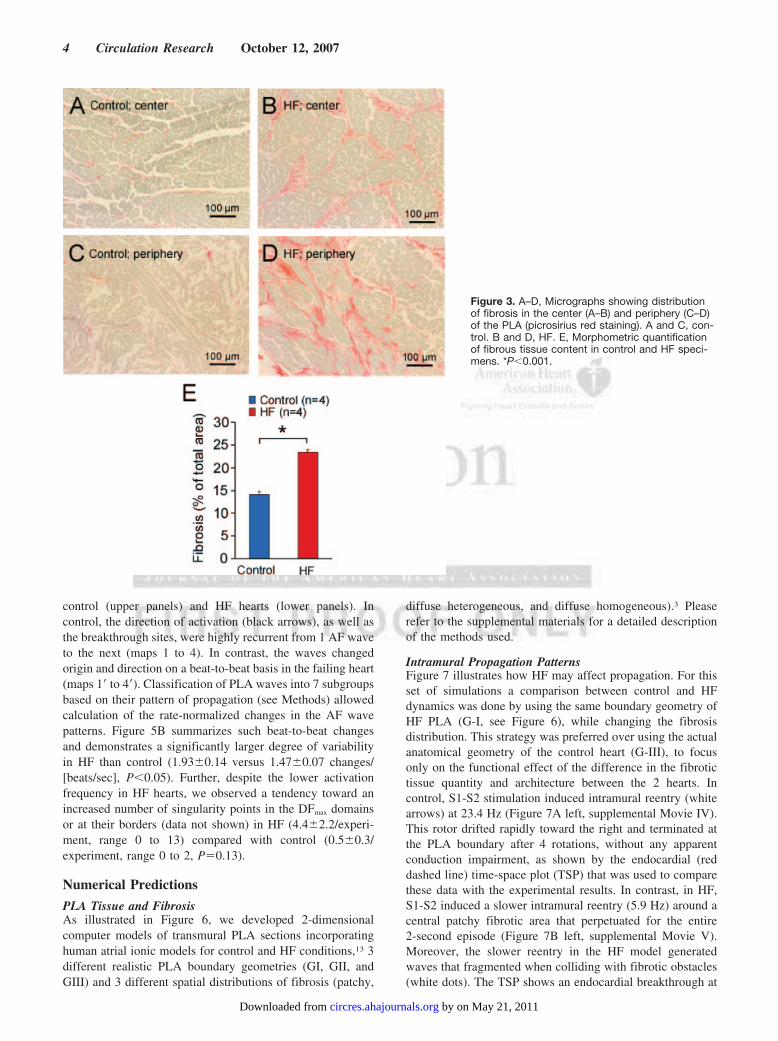
Histological Changes in the PLAWe evaluated the extent of remodeling and the distribution offibrosis in the PLA of 4 HF and 4 control specimens byhistological analysis using picrosirius-red staining. As shownin panels B and D of Figure 3, myocytes were larger in the HFgroup, as expected, and were often surrounded by increasedextracellular matrix (ECM) compared with the control group(panels A and C). As previously observed in the ventricles,5
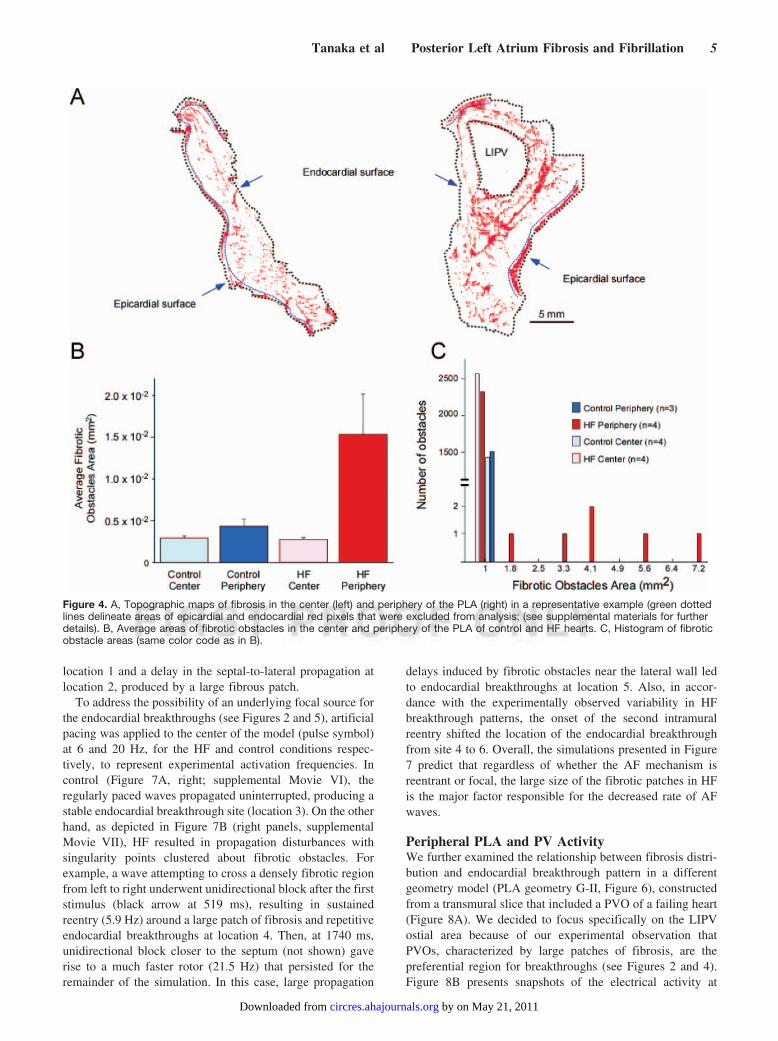
2 distinct patterns of fibrosis were distinguished in both thecenter (panels A and B) and periphery (near the PVO; panelsC and D) of the PLA: diffuse (ie, small and unconnecteddeposits of fibrous tissue) or patchy (ie, larger clusters ofinterconnected compact fibrous tissue). Further, quantifica-tion of the total amount of fibrosis by measuring the spatialextent of picrosirius-red stains revealed an overall significantECM increment in the HF group compared with controlat all 5 locations examined (23.40.4 versus 14.10.6%,P0.001; Figure 3E). In addition, as shown in representativetopographic maps of picrosirius-red staining of HF hearts(Figure 4A), the areas of patchy fibrosis were larger in theperiphery (right panel) than the center of the PLA (left panel).As shown in Figure 4B and 4C, quantitative analysis of thearea of fibrotic obstacles in all PLA specimens revealed agradient in the amount of fibrosis in the HF specimens withgreater ECM deposition in the periphery of the PLA. In 4 HFanimals the average area of fibrosis in the periphery wassignificantly larger than in the center (0.1630.052 mm2
versus 0.0360.003 mm2, P0.01) attributed mainly to thepresence of a few patches with areas larger than 1 mm2
(Figure 4B and 4C). The corresponding areas in controlanimals were 0.0520.01 and 0.0380.003 mm2 for PLAperiphery and center, respectively (P0.01), with a remark-able absence of patches larger than 1 mm2.
Propagation of AF WavesFigure 5A presents 4 consecutive activation maps superim-posed on an anatomical picture of the respective PLA in
Figure 2. Activation patterns and spatial distribution of endocar-dial breakthroughs sites at the PLA. A, AF waves patterns.*P0.05 Outward breakthroughs vs rotors and inward break-throughs. B–C, Diagrams of PLA with superposed dots repre-senting breakthrough sites in control (B) and HF (C). Eachbreakthrough color corresponds to a given experiment. Graydisks represent PVO (abbreviations as in Figure 1).
Tanaka et al Posterior Left Atrium Fibrosis and Fibrillation 3
by on May 21, 2011 circres.ahajournals.orgDownloaded from
control (upper panels) and HF hearts (lower panels). Incontrol, the direction of activation (black arrows), as well asthe breakthrough sites, were highly recurrent from 1 AF waveto the next (maps 1 to 4). In contrast, the waves changedorigin and direction on a beat-to-beat basis in the failing heart(maps 1 to 4). Classification of PLA waves into 7 subgroupsbased on their pattern of propagation (see Methods) allowedcalculation of the rate-normalized changes in the AF wavepatterns. Figure 5B summarizes such beat-to-beat changesand demonstrates a significantly larger degree of variabilityin HF than control (1.930.14 versus 1.470.07 changes/[beats/sec], P0.05). Further, despite the lower activationfrequency in HF hearts, we observed a tendency toward anincreased number of singularity points in the DFmax domainsor at their borders (data not shown) in HF (4.42.2/experi-ment, range 0 to 13) compared with control (0.50.3/experiment, range 0 to 2, P0.13).
Numerical Predictions
PLA Tissue and FibrosisAs illustrated in Figure 6, we developed 2-dimensionalcomputer models of transmural PLA sections incorporatinghuman atrial ionic models for control and HF conditions,13 3different realistic PLA boundary geometries (GI, GII, andGIII) and 3 different spatial distributions of fibrosis (patchy,
diffuse heterogeneous, and diffuse homogeneous).3 Pleaserefer to the supplemental materials for a detailed descriptionof the methods used.
Intramural Propagation PatternsFigure 7 illustrates how HF may affect propagation. For thisset of simulations a comparison between control and HFdynamics was done by using the same boundary geometry ofHF PLA (G-I, see Figure 6), while changing the fibrosisdistribution. This strategy was preferred over using the actualanatomical geometry of the control heart (G-III), to focusonly on the functional effect of the difference in the fibrotictissue quantity and architecture between the 2 hearts. Incontrol, S1-S2 stimulation induced intramural reentry (whitearrows) at 23.4 Hz (Figure 7A left, supplemental Movie IV).This rotor drifted rapidly toward the right and terminated atthe PLA boundary after 4 rotations, without any apparentconduction impairment, as shown by the endocardial (reddashed line) time-space plot (TSP) that was used to comparethese data with the experimental results. In contrast, in HF,S1-S2 induced a slower intramural reentry (5.9 Hz) around acentral patchy fibrotic area that perpetuated for the entire2-second episode (Figure 7B left, supplemental Movie V).Moreover, the slower reentry in the HF model generatedwaves that fragmented when colliding with fibrotic obstacles(white dots). The TSP shows an endocardial breakthrough at
Figure 3. A–D, Micrographs showing distributionof fibrosis in the center (A–B) and periphery (C–D)of the PLA (picrosirius red staining). A and C, con-trol. B and D, HF. E, Morphometric quantificationof fibrous tissue content in control and HF speci-mens. *P0.001.
4 Circulation Research October 12, 2007
by on May 21, 2011 circres.ahajournals.orgDownloaded from
location 1 and a delay in the septal-to-lateral propagation atlocation 2, produced by a large fibrous patch.
To address the possibility of an underlying focal source forthe endocardial breakthroughs (see Figures 2 and 5), artificialpacing was applied to the center of the model (pulse symbol)at 6 and 20 Hz, for the HF and control conditions respec-tively, to represent experimental activation frequencies. Incontrol (Figure 7A, right; supplemental Movie VI), theregularly paced waves propagated uninterrupted, producing astable endocardial breakthrough site (location 3). On the otherhand, as depicted in Figure 7B (right panels, supplementalMovie VII), HF resulted in propagation disturbances withsingularity points clustered about fibrotic obstacles. Forexample, a wave attempting to cross a densely fibrotic regionfrom left to right underwent unidirectional block after the firststimulus (black arrow at 519 ms), resulting in sustainedreentry (5.9 Hz) around a large patch of fibrosis and repetitiveendocardial breakthroughs at location 4. Then, at 1740 ms,unidirectional block closer to the septum (not shown) gaverise to a much faster rotor (21.5 Hz) that persisted for theremainder of the simulation. In this case, large propagation
delays induced by fibrotic obstacles near the lateral wall ledto endocardial breakthroughs at location 5. Also, in accor-dance with the experimentally observed variability in HFbreakthrough patterns, the onset of the second intramuralreentry shifted the location of the endocardial breakthroughfrom site 4 to 6. Overall, the simulations presented in Figure7 predict that regardless of whether the AF mechanism isreentrant or focal, the large size of the fibrotic patches in HFis the major factor responsible for the decreased rate of AFwaves.
Peripheral PLA and PV ActivityWe further examined the relationship between fibrosis distri-bution and endocardial breakthrough pattern in a differentgeometry model (PLA geometry G-II, Figure 6), constructedfrom a transmural slice that included a PVO of a failing heart(Figure 8A). We decided to focus specifically on the LIPVostial area because of our experimental observation thatPVOs, characterized by large patches of fibrosis, are thepreferential region for breakthroughs (see Figures 2 and 4).Figure 8B presents snapshots of the electrical activity at
Figure 4. A, Topographic maps of fibrosis in the center (left) and periphery of the PLA (right) in a representative example (green dottedlines delineate areas of epicardial and endocardial red pixels that were excluded from analysis; (see supplemental materials for furtherdetails). B, Average areas of fibrotic obstacles in the center and periphery of the PLA of control and HF hearts. C, Histogram of fibroticobstacle areas (same color code as in B).
Tanaka et al Posterior Left Atrium Fibrosis and Fibrillation 5
by on May 21, 2011 circres.ahajournals.orgDownloaded from

selected time frames. S1-S2 led to intramural figure-of-eightreentry (22.7 Hz) in an area where fibrosis was sparse (frames94 and 122 ms). Eventually, after 2 full rotations, the left armof the figure-of-eight shifted toward the LIPV. This resultedin counterclockwise reentry around the PVO at a slowerfrequency of 5.8 Hz (frames 288, 359, and 423 ms andsupplemental Movie VIII). Concomitantly, the right arm ofthe initial figure-of-eight generated a wave that traveleddownward and to the left between a very elongated fibroustissue septum and the epicardium. This wave vanished whenit collided with the lowermost border of the sheet, whichrendered the PV reentry dominant. It is noteworthy that thetwo different reentry frequencies that were measured in thissimulation were similar to those obtained for the first geo-metrical model, in which the HF condition and pacingstimulation were applied. Also, similar to the previous sim-ulation, the rapid change of reentry pattern was accompaniedby a rapid change of endocardial breakthrough location, ascan be seen in the endocardial TSP of figure 8B (transitionfrom location 1 to 2). Two representative examples of localelectrograms (a and b) are shown in Figure 8C, demonstratingfractionation and irregularity of the membrane potential ofmyocytes near fibrotic tissue. For comparison, we used amodel with the same HF ionic properties and tissue geometry,but only diffuse fibrosis (supplemental Movie IX). In thiscase a reentrant wave formed after S1-S2 stimulation. It didnot anchor but drifted toward the PLA center where itterminated after 5 rotations by collision with the epicardialboundary.
DiscussionMajor FindingsWe evaluated the consequences of HF remodeling on PLAAF dynamics. Specifically, we examined how the heteroge-
neous HF architecture of PLA fibrosis alters AF wave propaga-tion. Our work represents a substantial extension of previousstudies demonstrating that fibrosis provides a substrate forAF14 because of atrial conduction disturbances,3,15 and show-ing that AF dynamics in HF differs from that in normalhearts.10 A major result of these combined experimental-simulation results was that whether the mechanism of atrialfibrillation is reentrant or focal, the large size of the fibrouspatches in heart failure provides the major factor responsiblefor different dynamics of AF waves in HF versus controlhearts. Here, we demonstrate for the first time that (1) duringAF, endocardial breakthroughs waves, that are by far themost common activation pattern at the PLA in both normaland HF groups, are more variable in HF hearts and distributemore peripherally, closer to the PVO. (2) The amount,distribution, and type of fibrosis are significantly different inHF and control hearts. Importantly, in HF the architecture offibrosis in the PLA consists primarily of patches with thelarger fibrotic obstacles found preferentially in the vicinity ofthe PVO. (3) Both large PLA fibrous patches and the PVO actto anchor reentrant circuits and impair wave propagation togenerate delays, wavebreaks and signal fractionation.
Frequency of Activation and Location ofAF SourcesOur experiments demonstrate that PLA sources maintain AFin both normal and HF hearts. In both groups, AF waves werevisualized as breakthroughs traveling from inside to outsidethe field of view (Figure 2) with a significantly higher DF inthe PLA compared with other atrial areas (Figure 1). Thesedata corroborate previous animal and human find-ings10,12,16–18 confirming that the PLA plays a key role inmaintaining AF activity. Specifically, Wu et al have shown inpatients in permanent AF and organic heart disease thatepicardial AF dynamics was characterized by rapid repetitive
Figure 5. A, Representative activation maps of 4consecutive AF waves at the PLA in HF and con-trol groups. The maps are superposed on a colorpicture of the preparation. The patterns of propa-gation are highly recurrent in control (top) in com-parison to HF (bottom). Abbreviations as in Figure1. B, Number of changes (normalized to the fre-quency) of wave pattern during AF waves in con-trol and HF hearts. *P0.05.
6 Circulation Research October 12, 2007
by on May 21, 2011 circres.ahajournals.orgDownloaded from

activations originating near the PVOs.16 Also, our numericalsimulations show that the activity in HF hearts revolvedaround obstacles, formed by either non-excitable patches offibrosis or one of the PVO, with a cycle length that dependedon the obstacle size (Figures 7B and 8), and was foundsignificantly larger in HF.
Mechanism of AF MaintenanceBoth reentry and focal activities at or near the PV area havebeen shown to sustain AF in the atria of failing doghearts,10,11,18,19 and in the presence of ACh.20–22 Our experi-ments demonstrate that the periostial area (PLA periphery)harbors the largest fibrotic obstacles (Figures 3 and 4), themost breakthrough sites (Figure 2), and the highest frequencydomains. Furthermore, our computer simulations illustratethat the largest fibrotic patches and the PVO are potentialanchoring sites for “micro-anatomical” reentry. Thus, ourresults suggest that the fibrillatory activity in our experimentswas maintained by intramural reentry centered on fibroticpatches and that it appeared at the PLA as breakthroughs.Additional measurement of PLA myocardial thickness, tran-sillumination experiments, as well as a 3D simulation of anintra-atrial scroll presented in the supplemental materialsfurther support this assertion. Nonetheless, we cannot fullyexclude a spontaneous pacemaker or triggered activity mech-anism possibly interacting with an evolving reentry, as asource of AF. This was supported by the simulated triggered
activity in our numerical simulations that yielded reentryimpulse propagation disturbance and anchoring shift (seeFigure 7). Altogether, in HF, the remodeled substrate of thePLA seems to be more important for maintaining AF than thenature of the source, whether reentry or triggered activity.
AF Dynamics in HF and Control: Role of FibrosisAmount and ArchitectureBoth human and animal studies have described the changes ofAF dynamics induced by HF. For instance, local conductionabnormalities attributable to interstitial fibrosis have beenreported in a HF model in dogs,3 and patients in chronic AFhave demonstrated increased interstitial fibrosis in the PLA incomparison with the LAA and also with the PLA of sinusrhythm patients.4 However, to the best of our knowledge, noprevious study has addressed the role of the architecture ofinterstitial fibrosis on PLA impulse propagation during AF.We demonstrate here for the first time that in the PLA majorchanges in AF dynamics are caused by an increased amountand a different architecture of fibrosis caused by HF. Inter-estingly, the fibrotic patches govern AF dynamics at the PLAby playing various roles that are sometimes conflicting innature. First, because of their ability to act as micro-anatomical obstacles they have the propensity to anchorreentrant sources. However, the patches need not be confluentto be the central pivoting attachment of reentry. In additionalsimulations presented in the supplemental materials, we
Figure 6. Two-dimensional computer models of transmural PLA sections. Left, boundary geometries. Middle, fibrosis distribution andtypes. Right, conditions and ionic models configurations.
Tanaka et al Posterior Left Atrium Fibrosis and Fibrillation 7
by on May 21, 2011 circres.ahajournals.orgDownloaded from

demonstrate that a simple heterogeneous distribution ofdiffuse fibrosis can attach a reentry (see supplemental FigureVIA and VIB and supplemental Movies X to XIII) at aspecific PLA location. Second, the existence of large fibroticpatches increases the likelihood of low frequency reentrantactivities. As shown in Figures 1B and 4B, we observedexperimentally larger fibrotic obstacles in failing hearts andcorrespondingly a lower DFmax. Such observations are sup-ported by the numerical experiments shown in Figure 7A and
7B. Third, the patches of fibrosis increase dramatically thevariability and complexity of the patterns. They are, forinstance, responsible for propagation delays and unidirec-tional blocks (see Figure 5A and 5B and Figure 7B).However, it should be noted that the fact that the DFmax islower in HF than in control does not exclude some shorttransitional episodes of fast reentrant activity. In fact, theirability to anchor to obstacles of different size and shape maketransient reentrant sources of various frequencies likely to
Figure 7. Computer simulation in PLA transmuralslices for control (A) and HF (B) conditions. A,Snapshots at several timeframes for cross-fieldstimulation (left) and pacing at a frequency of 20Hz (right), as well as endocardial time-space plots(constructed for the segment marked by the reddashed line as in Davidenko et al).27 Colors indi-cate transmembrane voltage from low (blue) tohigh (red) B, Snapshots at several timeframes forcross-field stimulation (left) and pacing at a fre-quency of 6 Hz (right), as well as endocardial timespace plots. The site of unidirectional block (ub.) ispointed by a black arrow. White circles on theupper voltage maps of panel B indicate sites ofwavebreak.
8 Circulation Research October 12, 2007
by on May 21, 2011 circres.ahajournals.orgDownloaded from

appear sequentially (see Figures 7B, right panel and 8B andsupplemental Movies VII and VIII) or even to coexist (seesupplemental Figure VIA and supplemental Movie X).Fourth, in good accordance with the experimental results(Figure 2B and 2C), the simulations predict that the presenceof PV ectopic activity related to stretch-related lengthening ofthe myocytes might reproducibly initiate a reentrant circuitthat would anchor to fibrotic patches adjacent to the PVO.
Clinical ImplicationsWhereas AF ablation for HF patients has been provenfeasible,23 the difference of AF wave dynamics at the PLA inthose patients had not been previously explored. In this work,we present experimental and computational evidence sug-gesting that the sites of AF sources and their related endo-cardial breakthrough sites appear toward the periostial area ofthe PLA, close to large fibrous patches. These data open anew perspective for improvement of radiofrequency catheterablation procedure for HF patients, suggesting that in HF theouter PLA and areas with large fibrotic obstacles are criticalfor AF maintenance.
LimitationsSustained AF was induced in the presence of 4 mol/L ACh.In the absence of ACh in failing hearts we usually obtainedAT and nonsustained AF episodes. However, detailed anal-ysis of the data obtained in 3 hearts demonstrated that AF-AT
dynamics in the absence of ACh were very similar to those inthe presence of 4 mol/L ACh. As shown in supplementalFigure II, the majority of breakthrough sites were located atthe periphery of the PLA. In the same Figure (see alsosupplemental Movie I), we also demonstrate that duringsustained AF in the absence of ACh a stable rotor anchored inthe vicinity of the LSPV ostium.
Although we show that fibrosis plays a strong role indetermining AF dynamics we cannot exclude additionalmechanisms of frequency slowing and of other AF dynamicschanges in HF hearts, such as anisotropy, heterogeneouscoupling changes as suggested by Qu et al,24 CHF-relatedionic changes,25 reduced IKACh density in the HF sheep atria(similarly to what was reported in humans26). However, asdemonstrated by our simulations in which the same AChlevel and IKACh density were used for both HF and control andby experiments without ACh, fibrous patches were sufficientto decrease dramatically the frequency of activation.
AcknowledgmentsWe thank Jianling Deng, Jiang Jiang, and Sharon E Chase for theirtechnical assistance.
Sources of FundingThis work was supported by grants from the NHLBI (P01-HL39707,R01-HL70074, R01-HL60843, to J.J.; R01-HL087055, to J.K.),American Heart Association postdoctoral fellowships (to J.K.), andSDG (0230311N, to O.B.).
Figure 8. Computer simulation implementing a periostial (LIPV) area of a transmural slice of the PLA from a failing heart. A, Transmural4 m thick slice. Red areas indicate fibrosis. B, Snapshots of electrical activity at timeframes 94, 122, 288, 359, and 423 ms. Reentrywas initiated using S1–S2 stimulation, and spatiotemporal endocardial activity is given as a TSP along the dashed red profile markedon the snapshot at 94 ms. C, Two representative electrograms measured at locations a and b (as marked in Figure 8A).
Tanaka et al Posterior Left Atrium Fibrosis and Fibrillation 9
by on May 21, 2011 circres.ahajournals.orgDownloaded from
DisclosuresNone.
References1. Ehrlich JR, Nattel S, Hohnloser SH. Atrial fibrillation and congestive
heart failure: specific considerations at the intersection of two commonand important cardiac disease sets. J Cardiovasc Electrophysiol. 2002;13:399–405.
2. Nattel S. Driver regions in atrial fibrillation associated with congestiveheart failure: where are they, and what are they telling us? J CardiovascElectrophysiol. 2005;16:1359–1361.
3. Li D, Fareh S, Leung TK, Nattel S. Promotion of atrial fibrillation byheart failure in dogs: atrial remodeling of a different sort. Circulation.1999;100:87–95.
4. Corradi D, Callegari S, Benussi S, Maestri R, Pastori P, Nascimbene S,Bosio S, Dorigo E, Grassani C, Rusconi R, Vettori MV, Alinovi R,Astorri E, Pappone C, Alfieri O. Myocyte changes and their left atrialdistribution in patients with chronic atrial fibrillation related to mitralvalve disease. Hum Pathol. 2005;36:1080–1089.
5. Kawara T, Derksen R, de Groot JR, Coronel R, Tasseron S, LinnenbankAC, Hauer RN, Kirkels H, Janse MJ, de Bakker JM. Activation delayafter premature stimulation in chronically diseased human myocardiumrelates to the architecture of interstitial fibrosis. Circulation. 2001;104:3069–3075.
6. Moreno J, Zaitsev AV, Warren M, Berenfeld O, Kalifa J, Lucca E,Mironov S, Guha P, Jalife J. Effect of remodelling, stretch and ischaemiaon ventricular fibrillation frequency and dynamics in a heart failuremodel. Cardiovasc Res. 2005;65:158–166.
7. Kalifa J, Tanaka K, Zaitsev AV, Warren M, Vaidyanathan R, AuerbachD, Pandit S, Vikstrom KL, Ploutz-Snyder R, Talkachou A, Atienza F,Guiraudon G, Jalife J, Berenfeld O. Mechanisms of wave fractionation atboundaries of high-frequency excitation in the posterior left atrium of theisolated sheep heart during atrial fibrillation. Circulation. 2006;113:626–633.
8. Skanes AC, Mandapati R, Berenfeld O, Davidenko JM, Jalife J. Spatio-temporal periodicity during atrial fibrillation in the isolated sheep heart.Circulation. 1998;98:1236–1248.
9. Baxter WT, Davidenko JM, Loew LM, Wuskell JP, Jalife J. Technicalfeatures of a CCD video camera system to record cardiac fluorescencedata. Ann Biomed Eng. 1997;25:713–725.
10. Okuyama Y, Miyauchi Y, Park AM, Hamabe A, Zhou S, Hayashi H,Miyauchi M, Omichi C, Pak HN, Brodsky LA, Mandel WJ, Fishbein MC,Karagueuzian HS, Chen PS. High resolution mapping of the pulmonaryvein and the vein of Marshall during induced atrial fibrillation and atrialtachycardia in a canine model of pacing-induced congestive heart failure.J Am Coll Cardiol. 2003;42:348–360.
11. Stambler BS, Fenelon G, Shepard RK, Clemo HF, Guiraudon CM. Char-acterization of sustained atrial tachycardia in dogs with rapid ventricularpacing-induced heart failure. J Cardiovasc Electrophysiol. 2003;14:499–507.
12. Fenelon G, Shepard RK, Stambler BS. Focal origin of atrial tachycardiain dogs with rapid ventricular pacing-induced heart failure. J CardiovascElectrophysiol. 2003;14:1093–1102.
13. Courtemanche M, Ramirez RJ, Nattel S. Ionic targets for drug therapyand atrial fibrillation-induced electrical remodeling: insights from a math-ematical model. Cardiovasc Res. 1999;42:477–489.
14. Verheule S, Sato T, Everett T 4th, Engle SK, Otten D, Rubart-von derLohe M, Nakajima HO, Nakajima H, Field LJ, Olgin JE. Increasedvulnerability to atrial fibrillation in transgenic mice with selective atrialfibrosis caused by overexpression of TGF-beta1. Circ Res. 2004;94:1458–1465.
15. Spach MS, Miller WT 3rd, Dolber PC, Kootsey JM, Sommer JR, MosherCE Jr. The functional role of structural complexities in the propagation ofdepolarization in the atrium of the dog. Cardiac conduction disturbancesdue to discontinuities of effective axial resistivity. Circ Res. 1982;50:175–191.
16. Wu TJ, Doshi RN, Huang HL, Blanche C, Kass RM, Trento A, Cheng W,Karagueuzian HS, Peter CT, Chen PS. Simultaneous biatrial comput-erized mapping during permanent atrial fibrillation in patients withorganic heart disease. J Cardiovasc Electrophysiol. 2002;13:571–577.
17. Sanders P, Berenfeld O, Hocini M, Jais P, Vaidyanathan R, Hsu LF,Garrigue S, Takahashi Y, Rotter M, Sacher F, Scavee C, Ploutz-Snyder R,Jalife J, Haissaguerre M. Spectral analysis identifies sites of high-frequency activity maintaining atrial fibrillation in humans. Circulation.2005;112:789–797.
18. Ryu K, Shroff SC, Sahadevan J, Martovitz NL, Khrestian CM, StamblerBS. Mapping of atrial activation during sustained atrial fibrillation in dogswith rapid ventricular pacing induced heart failure: evidence for a role ofdriver regions. J Cardiovasc Electrophysiol. 2005;16:1348–1358.
19. Derakhchan K, Li D, Courtemanche M, Smith B, Brouillette J, Page PL,Nattel S. Method for simultaneous epicardial and endocardial mapping ofin vivo canine heart: application to atrial conduction properties andarrhythmia mechanisms. J Cardiovasc Electrophysiol. 2001;12:548–555.
20. Sarmast F, Kolli A, Zaitsev A, Parisian K, Dhamoon AS, Guha PK,Warren M, Anumonwo JM, Taffet SM, Berenfeld O, Jalife J. Cholinergicatrial fibrillation: I(K, ACh) gradients determine unequal left/right atrialfrequencies and rotor dynamics. Cardiovasc Res. 2003;59:863–873.
21. Burashnikov A, Antzelevitch C. Reinduction of atrial fibrillation imme-diately after termination of the arrhythmia is mediated by late phase 3early afterdepolarization-induced triggered activity. Circulation. 2003;107:2355–2360.
22. Patterson E, Po SS, Scherlag BJ, Lazzara R. Triggered firing in pulmo-nary veins initiated by in vitro autonomic nerve stimulation. HeartRhythm. 2005;2:624–631.
23. Hsu LF, Jais P, Sanders P, Garrigue S, Hocini M, Sacher F, Takahashi Y,Rotter M, Pasquie JL, Scavee C, Bordachar P, Clementy J, HaissaguerreM. Catheter ablation for atrial fibrillation in congestive heart failure.N Engl J Med. 2004;351:2373–2383.
24. Qu Z, Karagueuzian HS, Garfinkel A, Weiss JN. Effects of Na() channeland cell coupling abnormalities on vulnerability to reentry: a simulationstudy. Am J Physiol Heart Circ Physiol. 2004;286:H1310–H1321.
25. Li D, Melnyk P, Feng J, Wang Z, Petrecca K, Shrier A, Nattel S. Effectsof experimental heart failure on atrial cellular and ionic electrophys-iology. Circulation. 2000;101:2631–2638.
26. Koumi S, Arentzen CE, Backer CL, Wasserstrom JA. Alterations inmuscarinic K channel response to acetylcholine and to G protein-mediated activation in atrial myocytes isolated from failing human hearts.Circulation. 1994;90:2213–2224.
27. Davidenko JM, Pertsov AV, Salomonsz R, Baxter W, Jalife J. Stationaryand drifting spiral waves of excitation in isolated cardiac muscle. Nature.1992;355:349–351.
10 Circulation Research October 12, 2007
by on May 21, 2011 circres.ahajournals.orgDownloaded from

1
ONLINE SUPPLEMENT
METHODS
Heart Failure Model
A unipolar pacing lead (St. Jude Medical, Inc.) was inserted into the right ventricular
apex; a pacemaker was implanted and programmed to capture the ventricles at 220
beats/min for 6-7 weeks. For follow-up, clinical signs of heart failure (HF: lethargy,
edema, dyspnea, gain of body weight, loss of appetite) and transthoracic
echocardiographic evaluations (Phillips, Sonos 5500) were monitored weekly. In
particular, echocardiographic left atrial and left ventricular dimensions in the parasternal
long-axis view and left ventricular ejection fraction (Teicholz formula, M-mode) were
recorded. 1 Once parameters became compatible with HF, pacemakers were stopped and
hearts were collected 48 hours afterwards.
Optical Mapping Technique
This technique has been described in detail elsewhere. 2 Briefly, a bolus injection of 5 to
10 mL of the dye Di-4-ANEPPS (10 mg/mL) was used to image the fluorescence
resulting from changes in membrane potential. Three tungsten-halogen light sources, two
for epi-illumination and one for trans-illumination, were utilized to homogeneously
excite the fluorescence of the potentiometric dye. Sustained AF (>5 minutes) was
induced by burst pacing in the continuous presence of acetylcholine (ACh, 4 μM). The
emitted signals from a posterior left atrial (PLA) area of ~5 cm2 were captured by one
CCD camera (DALSA, CA-D1-0128T-STDL) at 300 frames/sec to obtain 5-second
movies (128×128 pixels). Three movies were recorded in each experiment and bipolar
by on May 21, 2011 circres.ahajournals.orgDownloaded from
2
electrograms were obtained continuously from two locations, one in the septal portion of
Bachman’s bundle (BB) and the other in right atrial appendage (RAA).
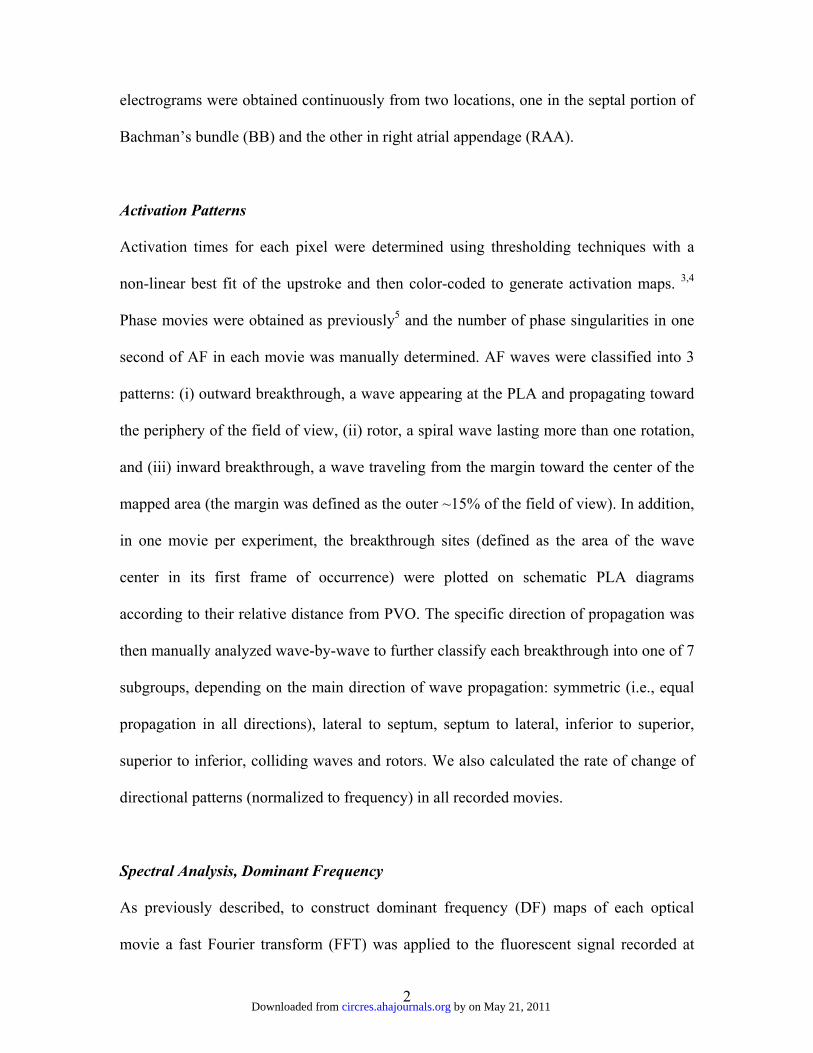
Activation Patterns
Activation times for each pixel were determined using thresholding techniques with a
non-linear best fit of the upstroke and then color-coded to generate activation maps. 3,4
Phase movies were obtained as previously5 and the number of phase singularities in one
second of AF in each movie was manually determined. AF waves were classified into 3
patterns: (i) outward breakthrough, a wave appearing at the PLA and propagating toward
the periphery of the field of view, (ii) rotor, a spiral wave lasting more than one rotation,
and (iii) inward breakthrough, a wave traveling from the margin toward the center of the
mapped area (the margin was defined as the outer ~15% of the field of view). In addition,
in one movie per experiment, the breakthrough sites (defined as the area of the wave
center in its first frame of occurrence) were plotted on schematic PLA diagrams
according to their relative distance from PVO. The specific direction of propagation was
then manually analyzed wave-by-wave to further classify each breakthrough into one of 7
subgroups, depending on the main direction of wave propagation: symmetric (i.e., equal
propagation in all directions), lateral to septum, septum to lateral, inferior to superior,
superior to inferior, colliding waves and rotors. We also calculated the rate of change of
directional patterns (normalized to frequency) in all recorded movies.
Spectral Analysis, Dominant Frequency
As previously described, to construct dominant frequency (DF) maps of each optical
movie a fast Fourier transform (FFT) was applied to the fluorescent signal recorded at
by on May 21, 2011 circres.ahajournals.orgDownloaded from
3
each pixel. The frequency depicting the maximum power was considered to be the DF
and assigned a color between dark blue and red according to its value. The area with the
maximal DF (DFmax domain) was defined as the area corresponding to the highest DF in
that map. 3 To assess the exact location of the DFmax domain at the PLA we superimposed
the DF map and a corresponding digital picture of the field of view according to
anatomical landmarks (pulmonary vein ostia; PVO).
Histological Examination
After optical mapping, hearts were immersed in 10% neutral buffered formalin,
processed for paraffin embedding and 4 µm sections were obtained from blocks spanning
the PLA. Quantitative evaluations of fibrosis were performed on images obtained from 5
different locations in the PLA (left superior pulmonary vein area, left inferior pulmonary
vein area, right superior pulmonary vein area, right inferior pulmonary vein area and
center of the PLA) after staining with picrosirius red. 6 Images were photographed using
either 10x or 2.5x objective, with either a digital 3-chip color CCD camera (DC-330,
DAGE-MTI) installed on a Zeiss Axioplan2e microscope or a 12bit color CCD camera
(Qicam, Qimaging) installed on a Zeiss ACIO imager A1 microscope. Areas occupied by
fibrotic tissue were automatically measured with Bioquant’s Life Science package
software by employing a color thresholding technique. Perivascular, endocardial and
epicardial fibrosis were excluded from the analysis by setting regions of interest. To
determine the sizes of individual fibrotic patches, sections from both the center and
peripheral PLA with comparable planes of section were identified and overlapping
images spanning the entire section were acquired using the Bioquant Automated Imaging
toolkit and Topographer plugin (R & M Biometrics, Inc. Nashville, TN). Fibrotic tissue
by on May 21, 2011 circres.ahajournals.orgDownloaded from
4
was identified using color thresholding and the area occupied by individual fibrotic
patches was automatically measured as described above. For patches that extended
across multiple fields of view, the separate areas were summed manually and the
autoexclude feature of the software was employed to ensure that selected pixels were
measured only once.
Computer Simulations
Computer models of the PLA with realistic 2D geometry, fibrosis distribution and ionic
kinetics were employed (see figure 6 of the main manuscript).
Boundary Geometries
We utilized 2 realistic HF PLA geometries. A general transmural PLA geometry
(geometry G-I, see figure 6, upper left panel) and also the left inferior PVO area of a HF
heart (geometry G-II, see figure 6, middle left panel), reflecting our previous observation
that the latter region was characterized by large patches of fibrosis and the preferential
location of breakthroughs. As a control, a geometry of a normal heart (geometry G-III,
see figure 6 lower left panel) was implemented. The 3 geometry models were extracted
out of histological sections of control and HF PLAs, and were sampled into a spatial
resolution of Δx=Δy=45.5μm (for G-I and G-III) and Δx=Δy=95μm (for G-II).
Fibrosis Distribution
The two distinct fibrosis distributions - patchy and diffuse - were modeled as follows (see
also figure 6, middle panels):
by on May 21, 2011 circres.ahajournals.orgDownloaded from

5
1. Patchy distribution
Patchy distribution was realistically extracted of picrosirius stained histological sections,
where the dyed extra-cellular matrix (ECM) tissue could be easily distinguished by its
characteristic reddish color content. An automatic segmentation procedure was applied,
where each of the image pixels was classified as either external to tissue, myocyte or
fibrotic tissue using a color threshold. The segmented image was passed through an
erosion filter with a square structure element of size 3 pixels, in order to emphasize the
characteristic patchy fibrosis of a HF heart. 7
2. Diffuse fibrosis
Diffusive fibrosis was defined as very small deposits of ECM, in the order of 1
computational cell (~50um), and was artificially added to our models, usually with
random distribution with a pre-defined total number of fibrosis cells. In several
simulations, however, we additionally investigated the effect of homogeneity in the
diffuse fibrosis distribution, and thus compared random versus uniform distribution of
fibrosis, in which the distance between every fibrotic cell and the 4 closest fibrotic cells
was fixed.
HF and Control Conditions
To realistically mimic the HF and control conditions, and in accordance with our
histological findings, we refer to the HF condition as a combination of half patchy and
half diffuse fibrosis and to the control condition as only diffuse fibrosis. The final
fibroblast/myocytes area ratio was approximately 10% in HF condition and 5% in
control.
by on May 21, 2011 circres.ahajournals.orgDownloaded from
6
D
Ionic Models
The temporal values of the transmembrane potential were calculated numerically by
solving the discrete standard reaction-diffusion equation, assuming isotropic tissue and
Neuman boundary conditions, 8 and incorporating human atria ionic kinetics, 9 including
an IkACh formulation from Kneller et al. 10 For the HF model, the ionic channel properties
were modified according to Li et al. 11 The changes included decreases of ICa and IKs by
30%, a decrease of Ito by 50%, and an increase of the sodium/calcium exchanger current
by 45%. In an additional simulation we investigated AF PLA dynamics in HF condition
including a stretch-activated channels (SACs) model. We implemented a commonly
accepted IV relationship of SACs as described by Kamkin et al. in human atrial cells. 12
Referring to this work, the level of 4 μm, corresponding to moderate stretch, was selected
and related to the increased LA diameter measured in HF hearts (see online Table 1). For
all these models, the fibrotic grid cells were computed as non-excitable media, using the
following passive differential equation for describing the local potential, V:
( )VDCR
VVtV
ff
r ∇⋅∇+−
−=∂∂
where C [F] is the capacitance of a fibroblast, taken to be equal to that of a myocyte (25
pF for the present grid size13), Vr=-15.9mV is the resting membrane potential of a
fibroblast14, Rf=4.1GΩ is the passive resistance of a fibroblast, and Df [mm2 ms-1] is an
average diffusive coefficient of the fibrotic tissue. Df was taken as a fraction of D; i.e.
represents electrical coupling within fibroblasts. At the boundary between
fibrotic and myocardial tissue, a geometrical average of diffusion coefficients was taken,
f fD κ=
by on May 21, 2011 circres.ahajournals.orgDownloaded from
7
to maintain current flow conservation, i.e., 2 2
/ 1f f
f f
D Dfibroblast myocyte D DD Dκ
κ⋅+ += =
. We set
to representing some low electrical coupling between fibroblasts and between
the fibrotic tissue and its surrounding myocardial tissue.
0.1fκ =
15 For comparison, we repeated
all simulations with interchanged kinetics, i.e. employing the control ionic kinetics for the
HF fibrosis distribution (10% patchy and diffuse fibrosis) and the HF ionic kinetics for
the control distribution of fibrosis (5% diffuse fibrosis).
Numerical Protocol
Two types of stimulations were applied: 1) S1-S2 cross-field stimulation, and 2) pacing
stimulation with frequencies of 6 and 20 Hz for the HF and control, respectively, which
represent realistic activation frequencies observed experimentally.
Statistical Analysis
Unpaired t-test was used to compare clinical and echocardiographic parameters and the
average area of fibrotic obstacles between center and periphery of the PLA. For
characterization of the spatial distribution of breakthrough sites the Boltzmann equation
was best-fit to each heart and the radii of their 50-percentile were compared with a t-test
after confirming normal distribution (Shapiro-Wilk test). We compared (i) DF values, (ii)
percentages of fibrosis at 5 PLA locations (LSPV, LIPV, RSPV, RIPV, Center), (iii)
percentages of diffuse and patchy fibrosis patterns in control and HF conditions (iv)
average number of each wave type, (v) number of wave pattern changes. The statistical
designs for each respective data comparison were: (i) 2 (condition; control or HF) x 3
(location; PLA, BB or RAA) x 3 (movie; M1 through M3). Frequency data were also
by on May 21, 2011 circres.ahajournals.orgDownloaded from
8
compared by use of a dependent-measures ANOVA, with 2-tailed =0.05. In this
analysis, we used a priori contrasts comparing frequency data in the DFmax area with
those in the BB and RAA regions, (ii) 2 (condition; control or HF) x 5 (location; L1
through L5), (iii) 2 (condition; control or HF) x2 (architecture; diffuse or patchy) (iv) 2
(condition; control or HF) x 3 (wave type; breakthrough, rotor or outwave), (v) 2
(condition; control or HF) x 3 (movie; M1 through M3), dependent-measures ANOVA.
For all repeated ANOVA comparisons we set 2-tailed to 0.05. We used Mauchley’s test
of sphericity on our repeated observations and interpreted Huynh-Feldt-adjusted
significance values in cases in which our data required corrections for non sphericity. A
non parametric Kolmogorov-Smirnov test was employed for group comparisons of areas
of fibrosis patches in the center and periphery of the PLA in normal and HF hearts. All
results were expressed as mean±SEM and p <0.05 was considered statistically significant.
RESULTS
Experimental Results
Breakthrough Sites on the PLA.
Figure OS1 shows all the PLA regions that were analyzed histologically in 3 hearts (A, B
and C respectively). For each heart, a star indicates the areas that harbored the largest
number of breakthroughs as shown also in figure 2C of the main manuscript. These
figures enabled us to compare ostial (panels A and B) and central PLA (panel C) areas.
As expected, most of the breakthroughs occurred where the largest fibrotic obstacles
were observed. These data support our contention that large fibrotic obstacles have the
propensity to attract and anchor in their vicinity the electrical sources of AF.
by on May 21, 2011 circres.ahajournals.orgDownloaded from

9
AF dynamics in the absence of ACh
As presented in the main article, in 7 HF hearts AF was maintained in the presence of 4
μM ACh. To rule out the possibility that ACh, rather than fibrosis, determined the
dynamics of AF in this HF model, we investigated AF dynamics in 3 additional failing
hearts in the absence of ACh, a shown in Figure OS2. Panel A is a diagram of the PLA
similar to that shown in figure 1 of the main paper. Breakthrough sites are represented by
color dots, each color corresponding to a given experiment (n=3). In all experiments, the
majority of breakthrough sites were located at the periphery of the PLA. Panels B and C
show sequential phase maps obtained from a representative experiment during an AF
episode. Panel D shows the corresponding RAA, LSPV and LAA electrograms. In B,
repetitive breakthroughs near the RSPV eventually led to the formation of a stable, long-
lasting rotor that anchored in the vicinity of the LSPV ostium (see movie 1). Similar
results were obtained in all three experiments. Except for the long-lasting rotor shown in
figure OS2B-D, for the most part, in the absence of ACh we usually induced atrial
tachycardia and non-sustained AF episodes in the majority HF hearts. Yet, detailed
analysis of the data in all three hearts demonstrated that while the frequency of AF-AT
was slower, the overall dynamics in the absence were very similar to those in the
presence of 4μM ACh. Altogether, these data demonstrate that the dynamics of atrial
arrhythmias in this heart failure model are governed by fibrosis distribution rather than
ACh concentration.
Mechanisms of breakthrough wave occurrence
PLA breakthroughs were the most frequent activation pattern seen in our HF model
during AF. Two possible electrophysiological mechanisms may account for such
by on May 21, 2011 circres.ahajournals.orgDownloaded from
10
breakthroughs: 1. an intramural scroll wave whose filament orients parallel to the
endocardial wall; 2. rapid, spontaneous pacemaker or triggered discharges from a
localized focus. One relatively straightforward way to differentiate between these two
arrhythmogenic mechanisms would be to carry out simultaneous optical mapping of the
epicardium and endocardium. 16 Unfortunately, the large density fatty tissue on the
epicardial side of the central PLA interfered with the optical signal to the extent that it
precluded us from using such an approach.
Measurements of PLA thickness
As a first step in our effort to elucidate the nature of the endocardial breakthroughs, we
first measured the thickness of the PLA myocardial wall in 8 normal hearts. A scalpel
was used to make cross-sectional cuts; wall thickness was measured at 5 separate
locations using a ruler under a stereoscopic microscope (2.5x). We found the overall
average thickness to be 3.2±0.2 mm; the average minimal thickness was 1.7±0.2 mm
(range 1.5-2.5 mm), in the inferior part of the PLA; the average maximal thickness was
4.7±0.4 mm (range 4.0-6.0 mm), close to both ostia of the superior PVs. Hence, given the
fact that during AF microreentrant sources in the PLA have an average core diameter of
<2 mm, 17,18 such thickness seems to be sufficient to allow enough “elbow room” 19 to
harbor a stable intramural scroll wave whose filament is parallel to the endocardial
surface.
Transillumination experiments
To further investigate whether or not an intramural PLA scroll wave is responsible for the
breakthrough activity, we implemented a transillumination technique at the transition
by on May 21, 2011 circres.ahajournals.orgDownloaded from
11
between the PLA and LAA based on a previously described method. 16,20 This approach
allows detection of areas of low signal amplitude which, when correlated with the
patterns of propagation, can be related to the presence of intramural scroll filaments. In 4
such experiments we introduced a light guide into the intact left atrium through a small
left ventricular opening and across the mitral valve ostium. We focused the filtered light
on the PLA-LAA transitional area, while recording the transilluminated fluorescence
from the epicardial surface. This transitional area was chosen in an effort to avoid the
epicardial fatty region of the central PLA and allow high quality optical recordings. From
the resulting signal, we obtained movies for the construction of amplitude maps and
isochronal maps, as well as time-space plots of the activity. Panel A of figure OS3 shows
data from a representative 1.5-second episode. The isochrone (top) and amplitude
(bottom) maps disclose the presence of two counter-rotating reentrant wavefronts. The
time-space plot, constructed along the horizontal broken line on the map, reveals several
transient episodes of reentrant activity with the typical christmas-tree like pattern18
(highlighted by yellow dashed rectangles and by the magnified red inset). The presence
of an area of low potentiometric dye fluorescence in the center of the time-space plot
during each of these transient episodes is strongly suggestive of reentrant activity. 18 In
all experiments, such patterns were separated from each other by episodes of variable
duration in which spatiotemporally periodic waves entered the field of view from one or
more directions. Altogether, the data shown in panel A indicate the presence of sustained
reentrant activity that transiently entered the field of view, somehow shifted its position
to disappear, and again reappeared intermittently over a period of 1.5 seconds. The fact
that in the epifluorescence recording experiments only breakthrough patterns were seen
on the endocardium is compatible with intramural reentry.
by on May 21, 2011 circres.ahajournals.orgDownloaded from
12
The computer simulations of 3D reentry shown in panel B and C aid us in the
interpretation of such data. A single stationary scroll wave is generated in a cube of
cardiac muscle. On the left, the organizing center of the scroll wave (i.e., the filament) is
perpendicular to the epicardial wall. Epicardial transillumination signals were computed
according to Baxter et al. 16 for simulated 0.5 sec. activation. A time space plot
constructed along the black line reveals the christmas-tree like pattern of sustained
reentry. 18,20 On the lower panel, the scroll wave shifts its position and the filament now is
no longer in the field of view. Under these conditions we no longer see any evidence of
reentry on that wall. Only spatiotemporally periodic breakthroughs are seen with each
rotation of the scroll in the time space plot. Note, however, that the experimental
isochrone map of panel A shows two counter-rotating reentrant waves rather than only
one. As illustrated by the bottom cartoon in panel C, we interpret this pattern as being
compatible with the presence of a U-shaped filament. This clearly would result in figure-
of-eight reentry on the epicardial surface with breakthroughs emerging only on the
endocardial wall. A christmas tree-like pattern of reentry would be observed on a time
space plot drawn for the plane crossing the u-shaped scroll perpendicular to the epicardial
wall. Alternatively, as shown by the top cartoon in panel C, the figure-of-eight reentry
could result from the co-existence of two counter-rotating transmural scroll waves.
However, this interpretation would be incompatible with either the emergence of
breakthroughs with absence of evidence of reentry on the endocardium, or the christmas-
tree like patterns in the time space plots. Altogether, our experimental observations and
accompanying simulations strongly suggest that, even if transiently manifest, relatively
long-lived non-stationary intramural scroll waves occurring within the confines of the
by on May 21, 2011 circres.ahajournals.orgDownloaded from

13
PLA wall are the underlying mechanism of AF, as well as of the endocardial
breakthrough patterns observed in this HF model.
Numerical simulations
Effect of Ionic Remodeling in HF
We determined whether the observed changes in activation rate and pattern between HF
and control conditions (as presented in manuscript figures 7 and 8) could be solely
attributed to the different ionic models. Thus, the simulations were repeated with the
ionic kinetics interchanged, i.e. the HF fibrosis distribution model was run with the
control kinetics, and vice versa. The results are given in online supplemental figures OS4
and OS5. Figure OS4 demonstrates that employing the HF kinetics with the control
geometry (diffuse fibrosis) for the entire transmural PLA model results in activation
patterns similar to those seen in figure 7A. Close inspection revealed only minor changes
in transmembrane voltage traces (not shown). The results for the HF fibrosis distribution
using the control kinetics (figure OS4-B) showed similar activation pattern to figure 7B
when S1-S2 stimulation was applied. On the other hand, pacing gave rise to activation
pattern changes that were different from those in figure 7B. Reentry was stable, with a
frequency of ~5.3 Hz. Closer inspection revealed that the unidirectional block that was
present close to the pacing location when the HF kinetics were applied (marked in figure
7B) ceased to exist when the control kinetics were used. The results of the simulations of
the LIPV ostium area with the interchanged ionic models are given in figure OS5, which
shows an AF wave propagation pattern similar to that seen in figure 8, with a slight
increase in the activation rate (less than 1 Hz). Thus, the simulations show that the unique
architecture of the peripheral transmural PLA, with the PVO and large fibrotic patches in
by on May 21, 2011 circres.ahajournals.orgDownloaded from
14
their vicinity favor intramural reentrant activity at relatively low rates and explain the
experimental observations of increased propensity of constantly changing peripheral
breakthrough sites and patterns in HF. As such, ionic remodeling seems to contribute
little to the decreased reentry frequency and variable AF activation patterns seen in HF.
Effect of Heterogeneous Distribution of Diffuse Fibrosis
Our initial simulations (see figures 7, 8, OS4 and OS5) explored the role of patchy
fibrosis distribution and demonstrated its ability to impinge on normal impulse
propagation and generate delays, unidirectional blocks and anchored reentrant activity.
We also explored the role of the homogeneity of diffuse fibrosis distribution by utilizing
both uniformly (homogeneously) and randomly (heterogeneously) distributed diffuse
fibrosis. We performed simulations with 10% of diffuse fibrosis with uniformly and
randomly distributed fibrosis (see online methods above), utilizing geometry G-I with HF
ionic kinetics. The behavior clearly depended on the homogeneity of fibrosis distribution.
As illustrated by panel A of Figure OS6 (left), when the 10% fibrosis was randomly
distributed, S1-S2 stimulation initiated a reentrant source at 25.5 Hz. Subsequently, at
340 ms, a wavebreak gave rise to a second reentrant source whose frequency was 28.3 Hz
(see also online movie 10). The 2 reentries coexisted throughout the remainder of the
simulation. In comparison, a strictly homogeneous (uniform) distribution of 10% fibrosis
resulted in a drifting rotor that quickly terminated after one rotation (see figure OS6A
right panel and online movie 11). To further evaluate the role of homogeneity in the
distribution of diffuse fibrosis in the control case we repeated the simulations utilizing
geometry G-III of a normal PLA (see figure 6). Here we utilized normal ionic kinetics
and 6% of diffuse fibrosis that was either homogeneously or randomly distributed. As
by on May 21, 2011 circres.ahajournals.orgDownloaded from
15
shown in panel B of Figure OS6, the results were very similar to those obtained with 10%
of fibrosis. Namely, an anchored reentrant activity was observed when fibrosis was
randomly distributed. In contrast, a drifting rotor that terminated rapidly was recorded
when fibrosis was homogeneous (see also online movies 12 and 13).
Effects of SACs on AF dynamics
To investigate the possible role of atrial stretch in AF dynamics during HF, we
implemented conditions for SACs kinetics utilizing geometry G-I, as well as HF kinetics
and fibrosis distribution. The data presented in Figure OS7 compare results obtained in
the absence (panel A) and the presence (panel B) of SACs. As shown in panel B, in the
presence of SACs, the S1-S2 protocol initiated a reentrant source along a different cluster
of fibrotic patches than when SACs were not present (panel A). With SACs, the reentry
anchored more proximally to the PVO (see also online movie 14). The cause of this
change in anchoring site was an increase in the wavelength (2.9 vs 2.2 mm) of the S1
impulse, which created an interaction between the S1 tail and the S2 wavefront resulting
in unidirectional block close to the right PV ostium. Thus, in accordance with the
experiments presented in figure 2B and 2C of the main article, the numerical data predict
that the in the presence of PV ectopic activity stretch-related lengthening of wavelength
might reproducibly initiate a reentrant source that would anchor to fibrotic patches at or
near the PVO.
Effects of Heterocellular Electrical Coupling
In our simulations we have set some low degree of electrical coupling between
fibroblasts and between fibroblasts and myocytes, in correspondence with some recent
by on May 21, 2011 circres.ahajournals.orgDownloaded from
16
evidence of such coupling. 15 Additionally, we have assumed that the fibrotic patches
stained in red in the histological slices are comprised of high-density fibroblasts. Still, in
order to account for the possibility that these patches are merely comprised of insulating
collagenous septa, we have repeated the simulations presented in figure 7 with geometry
G-I without electrical coupling between fibroblasts and myocytes. The results presented
in online movies 15-18 show some interesting differences in dynamics of propagation
compared to figure 7 and the corresponding online movies 3-6. In the control condition,
S1-S2 stimulation resulted in a sustained reentry whereas
References
1. Teichholz LE, Petrillo S, Larson AJ, Klig V. Quantitative assessment of atherosclerosis by electron beam tomography. Am J Cardiol. 2002;90:1416-9.
2. Skanes AC, Mandapati R, Berenfeld O, Davidenko JM, Jalife J. Spatiotemporal periodicity during atrial fibrillation in the isolated sheep heart. Circulation. 1998;98:1236-48.
3. Baxter WT, Davidenko JM, Loew LM, Wuskell JP, Jalife J. Technical features of a CCD video camera system to record cardiac fluorescence data. Ann Biomed Eng. 1997;25:713-25.
4. Gray RA, Pertsov AM, Jalife J. Incomplete reentry and epicardial breakthrough patterns during atrial fibrillation in the sheep heart. Circulation. 1996;94:2649-61.
5. Gray RA, Pertsov AM, Jalife J. Spatial and temporal organization during cardiac fibrillation. Nature. 1998;392:75-8.
6. Junqueira LC, Bignolas G, Brentani RR. Picrosirius staining plus polarization microscopy, a specific method for collagen detection in tissue sections. Histochem J. 1979;11:447-55.
7. Kawara T, Derksen R, de Groot JR, Coronel R, Tasseron S, Linnenbank AC, Hauer RN, Kirkels H, Janse MJ, de Bakker JM. Activation delay after premature stimulation in chronically diseased human myocardium relates to the architecture of interstitial fibrosis. Circulation. 2001;104:3069-75.
8. Pandit SV, Berenfeld O, Anumonwo JM, Zaritski RM, Kneller J, Nattel S, Jalife J. Ionic determinants of functional reentry in a 2-D model of human atrial cells during
by on May 21, 2011 circres.ahajournals.orgDownloaded from
17
simulated chronic atrial fibrillation. Biophys. J 2005;88:3806-21.
9. Courtemanche M, Ramirez RJ, Nattel S. Ionic targets for drug therapy and atrial fibrillation-induced electrical remodeling: insights from a mathematical model. Cardiovasc Res. 1999;42:477-89.
10. Kneller J, Ramirez RJ, Chartier D, Courtemanche M, Nattel S. Time-dependent transients in an ionically based mathematical model of the canine atrial action potential. Am J Physiol Heart Circ Physiol. 2002;282:H1437-51.
11. Li D, Melnyk P, Feng J, Wang Z, Petrecca K, Shrier A, Nattel S. Effects of experimental heart failure on atrial cellular and ionic electrophysiology. Circulation .2000;101:2631-8.
12. Kamkin A, Kiseleva I, Wagner KD, Bohm J, Theres H, Gunther J, Scholz H. Characterization of stretch-activated ion currents in isolated atrial myocytes from human hearts. Pflugers Arch. 2003;446:339-46.
13. Kohl P, Kamkin AG, Kiseleva IS, Noble D. Mechanosensitive fibroblasts in the sino-atrial node region of rat heart: interaction with cardiomyocytes and possible role. Exp Physiol. 1994;79:943-56.
14. Kamkin A, Kiseleva I, Wagner KD, Lammerich A, Bohm J, Persson PB, Gunther J. Mechanically induced potentials in fibroblasts from human right atrium. Exp Physiol. 1999;84:347-56.
15. Kohl P, Camelliti P, Burton FL, Smith GL. Electrical coupling of fibroblasts and myocytes: relevance for cardiac propagation. J Electrocardiol. 2005;38:45-50.
16. Baxter WT, Mironov SF, Zaitsev AV, Jalife J, Pertsov AM. Visualizing excitation waves inside cardiac muscle using transillumination. Biophys J . 2001;80:516-30.
17. Mandapati R, Skanes A, Chen J, Berenfeld O, Jalife J. Stable microreentrant sources as a mechanism of atrial fibrillation in the isolated sheep heart. Circulation. 2000;101:194-9.
18. Pertsov AM, Jalife J. Scroll waves in 3 dimensional muscle. In: Zipes DP, Jalife J, eds. Cardiac electrophysiology, from cell to bedside. W.B Saunders Company; 2000.
19. Winfree AT. Evolving perspectives during 12 years of electrical turbulence. Chaos. 1998;8:1-19.
20. Bernus O, Mukund KS, Pertsov AM. Detection of intra-myocardial scroll waves using absorptive transillumination imaging. . Journal of Biomedical Optics. 2007; 12: 014035
by on May 21, 2011 circres.ahajournals.orgDownloaded from

18
FIGURE AND MOVIE LEGENDS
Figure OS1
A, B, C: Histological analysis of large PV ostial and central PLA areas in three different
hearts (A, B and C). For each heart, a star indicates the areas that harbored the largest
number of breakthroughs, as shown also in figure 2C of the main manuscript.
Figure OS2
Activation patterns and spatial distribution of endocardial breakthroughs sites at the PLA
during atrial tachycardia and AF induced in the absence of ACh perfusion. A: Diagram
of PLA with superposed dots representing breakthrough sites. Each breakthrough color
corresponds to a given experiment (n=3). Grey disks represent PVO (abbreviations as in
figure 1). B and C: AF episode phase movie snapshots of a repetitive breakthrough
pattern located in the vicinity of the RSPV ostium (B) and of a reentrant activity
anchored in the vicinity of the LSPV ostium. D: Corresponding RAA, LSPV and LAA
electrograms.
Figure OS3
A: Transillumination experiment at the PLA-LAA junction. Top left, representative 50
ms isochronal map of epicardial activation during a single rotation of two counter-
rotating waves emanating from an area of low amplitude. Bottom left, snapshot from
amplitude movie showing reentrant waves emanating from low amplitude area. Right, the
corresponding 1.5 sec time space plot, constructed along the white dashed line. Note
transient episodes of christmas-tree like patterns that are enclosed by yellow dashed
by on May 21, 2011 circres.ahajournals.orgDownloaded from
19
boxes. One such box is magnified and reproduced as an inset in red dashed box. B: 3D
simulation of a scroll wave in a cube of atrial tissue and corresponding time space plots.
Upper panel, scroll wave filament is perpendicular to epicardial wall. Lower panel, the
scroll wave filament is no longer in the field of view. Black dashed lines indicate the
location of time space plot construction. C: Schematic showing the different time space
plot patterns that would be observed in case of either an intramural U-shaped scroll
filament or two transmural scroll waves of opposite chirality.
Figure OS4
Computer simulation in PLA transmural slices (geometry G-I), diffuse fibrosis
distribution and HF kinetics (A) and patchy fibrosis distribution with control kinetics (B).
A. Snapshots at several timeframes for cross-field stimulation (left) and pacing at a
frequency of 20 Hz (right), as well as endocardial time-space plots (constructed for the
segment marked by the red dashed line). B. Snapshots at several timeframes for cross-
field stimulation (left) and pacing at a frequency of 6 Hz (right), as well as endocardial
TSPs.
Figure OS5
Computer simulation implementing a peri-ostial (LIPV) area of a PLA transmural slice
(geometry G-II) with patchy fibrosis distribution and control kinetics. Snapshots of
electrical activity at timeframes 94, 122, 288, 359 and 423 ms. Reentry was initiated
using S1-S2 stimulation and spatiotemporal endocardial activity is given as a TSP along
the dashed red profile marked on the snapshot at 94 ms.
by on May 21, 2011 circres.ahajournals.orgDownloaded from
20
Figure OS6
Computer simulation implementing a random (left panels) or uniform (right panels)
distribution of diffuse fibrosis in A: HF PLA geometry (G-I) and 10% of fibrosis, B:
control PLA geometry (G-III) and 6% of fibrosis (see also online movies 11 and 12).
Figure OS7
Computer simulation implementing the geometry of the HF PLA (G-I) and patchy
distribution of 10% fibrosis implementing SACs kinetics (panel B). For comparison,
Panel A shows AF dynamics without SACs kinetics implementation.
Online movie 1
Reentrant activity anchored in the vicinity of the left superior pulmonary vein ostium
during AF induced in the absence of ACh perfusion (see also figure OS2). The wavefront
is depicted in blue-purple and the wavetail is shown in yellow.
Online Movie 2
Phase movie of PLA activation during AF in one representative normal heart showing
very repetitive and centrally located endocardial breakthroughs. Same color code as in
online movie 1.
Online Movie 3
Phase movie of PLA activation during AF in one representative HF heart showing very
changing and peripherally located endocardial breakthroughs. Same color code than for
online movie 1.
by on May 21, 2011 circres.ahajournals.orgDownloaded from

21
Online Movie 4
Numerical Simulation; 2D transmural PLA model. Geometry G-I. Diffuse heterogeneous
5% fibrosis distribution. Transmembrane voltage after S1-S2 stimulation. Voltages scale
is normalized and shown from the lowest (dark blue) to the highest (red). Fibrosis
architecture is artificially colored in red.
Online Movie 5
Numerical Simulation; 2D transmural PLA model. Geometry G-I. Patchy 10% fibrosis
distribution. Transmembrane voltage after S1-S2 stimulation. Voltages scale is
normalized and shown from the lowest (dark blue) to the highest (red). Fibrosis
architecture is artificially colored in red.
Online Movie 6
Numerical Simulation; 2D transmural PLA model. Geometry G-I. Diffuse heterogeneous
5% fibrosis distribution. Transmembrane voltage movie during pacing stimulation at 20
Hz. Voltages scale is normalized and shown from the lowest (dark blue) to the highest
(red). Fibrosis architecture is artificially colored in red.
Online Movie 7
Numerical Simulation; 2D transmural PLA model. Geometry G-I. Patchy 10% fibrosis
distribution. Transmembrane voltage movie during pacing stimulation at 6 Hz. Voltages
scale is normalized and shown from the lowest (dark blue) to the highest (red). Fibrosis
architecture is artificially colored in red.
by on May 21, 2011 circres.ahajournals.orgDownloaded from

22
Online Movie 8
Numerical Simulation; 2D PLA periphery - LIPV ostium model. Geometry G-II. Patchy
10% fibrosis distribution. Transmembrane voltage movie after S1-S2 stimulation.
Voltages scale is normalized and shown from the lowest (dark blue) to the highest (red).
Fibrosis architecture is artificially colored in red.
Online Movie 9
Numerical Simulation; 2D PLA periphery - LIPV ostium model. Geometry G-II. Diffuse
heterogeneous 5% fibrosis distribution. Transmembrane voltage movie after S1-S2
stimulation. Voltages scale is normalized and shown from the lowest (dark blue) to the
highest (red). Fibrosis architecture is artificially colored in red.
Online Movie 10
Numerical Simulation; 2D transmural PLA model. Geometry G-I. Heterogeneous diffuse
10% fibrosis distribution. Transmembrane voltage movie after S1-S2 stimulation.
Voltages scale is normalized and shown from the lowest (dark blue) to the highest (red).
Fibrosis architecture is artificially colored in red.
Online Movie 11
Numerical Simulation; 2D transmural PLA model. Geometry G-I. Homogeneous diffuse
10% fibrosis distribution. Transmembrane voltage movie after S1-S2 stimulation.
by on May 21, 2011 circres.ahajournals.orgDownloaded from
23
Voltages scale is normalized and shown from the lowest (dark blue) to the highest (red).
Fibrosis architecture is artificially colored in red.
Online Movie 12
Numerical Simulation; 2D transmural PLA model. Geometry G-III (control).
Heterogeneous diffuse 6% fibrosis distribution. Transmembrane voltage movie after S1-
S2 stimulation. Voltages scale is normalized and shown from the lowest (dark blue) to
the highest (red). Fibrosis architecture is artificially colored in red.
Online Movie 13
Numerical Simulation; 2D transmural PLA model. Geometry G-III (control).
Homogeneous diffuse 6% fibrosis distribution. Transmembrane voltage movie after S1-
S2 stimulation. Voltages scale is normalized and shown from the lowest (dark blue) to
the highest (red). Fibrosis architecture is artificially colored in red.
Online Movie 14
Numerical Simulation implementing SACs kinetics; 2D transmural PLA model.
Geometry G-I. Patchy 10% fibrosis distribution. Transmembrane voltage movie after S1-
S2 stimulation. Voltages scale is normalized and shown from the lowest (dark blue) to
the highest (red). Fibrosis architecture is artificially colored in red.
Online movie 15
by on May 21, 2011 circres.ahajournals.orgDownloaded from

24
Numerical Simulation zero coupling between myocytes and non myocytes; 2D
transmural PLA model. Geometry G-I. Diffuse heterogeneous 5% fibrosis distribution.
Transmembrane voltage after S1-S2 stimulation. Voltages scale is normalized and shown
from the lowest (dark blue) to the highest (red). Fibrosis architecture is artificially
colored in red.
Online movie 16
Numerical Simulation zero coupling between myocytes and non myocytes; 2D
transmural PLA model. Geometry G-I. Patchy 10% fibrosis distribution. Transmembrane
voltage after S1-S2 stimulation. Voltages scale is normalized and shown from the lowest
(dark blue) to the highest (red). Fibrosis architecture is artificially colored in red.
Online movie 17
Numerical Simulation zero coupling between myocytes and non myocytes; 2D
transmural PLA model. Geometry G-I. Diffuse heterogeneous 5% fibrosis distribution.
Transmembrane voltage movie during pacing stimulation at 20 Hz. Voltages scale is
normalized and shown from the lowest (dark blue) to the highest (red). Fibrosis
architecture is artificially colored in red.
Online movie 18
Numerical Simulation zero coupling between myocytes and non myocytes; 2D
transmural PLA model. Geometry G-I. Patchy 10% fibrosis distribution. Transmembrane
voltage movie during pacing stimulation at 6 Hz. Voltages scale is normalized and shown
by on May 21, 2011 circres.ahajournals.orgDownloaded from

25
from the lowest (dark blue) to the highest (red). Fibrosis architecture is artificially
colored in red.
by on May 21, 2011 circres.ahajournals.orgDownloaded from
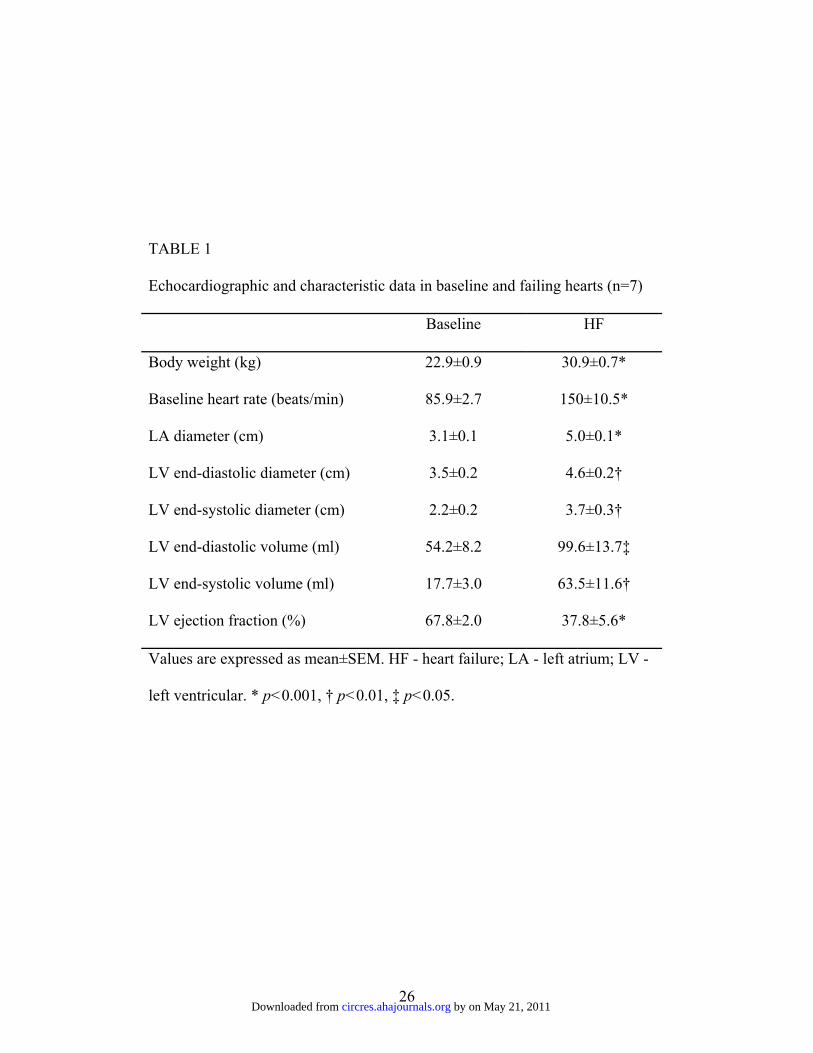
26
TABLE 1
Echocardiographic and characteristic data in baseline and failing hearts (n=7)
Baseline HF
Body weight (kg) 22.9±0.9 30.9±0.7*
Baseline heart rate (beats/min) 85.9±2.7 150±10.5*
LA diameter (cm) 3.1±0.1 5.0±0.1*
LV end-diastolic diameter (cm) 3.5±0.2 4.6±0.2†
LV end-systolic diameter (cm) 2.2±0.2 3.7±0.3†
LV end-diastolic volume (ml) 54.2±8.2 99.6±13.7‡
LV end-systolic volume (ml) 17.7±3.0 63.5±11.6†
LV ejection fraction (%) 67.8±2.0 37.8±5.6*
Values are expressed as mean±SEM. HF - heart failure; LA - left atrium; LV -
left ventricular. * p<0.001, † p<0.01, ‡ p<0.05.
by on May 21, 2011 circres.ahajournals.orgDownloaded from

27
Figure OS1 by on May 21, 2011 circres.ahajournals.orgDownloaded from
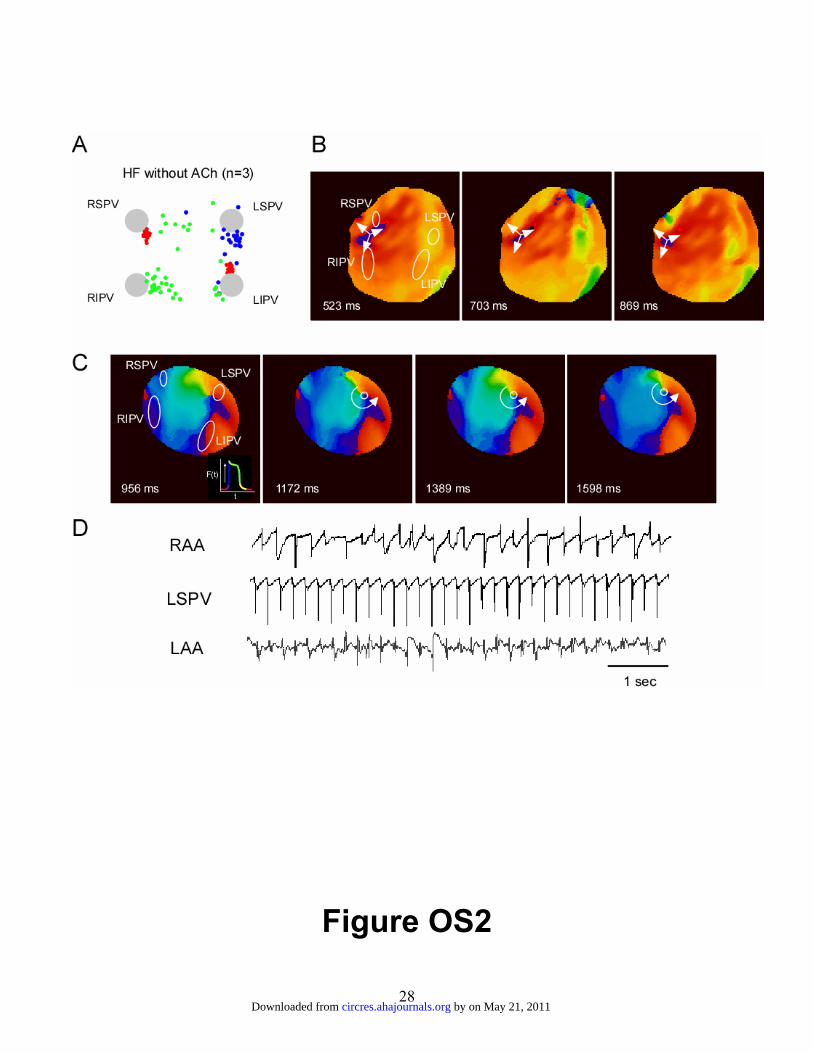
28
Figure OS2
by on May 21, 2011 circres.ahajournals.orgDownloaded from

29
Figure OS3
by on May 21, 2011 circres.ahajournals.orgDownloaded from
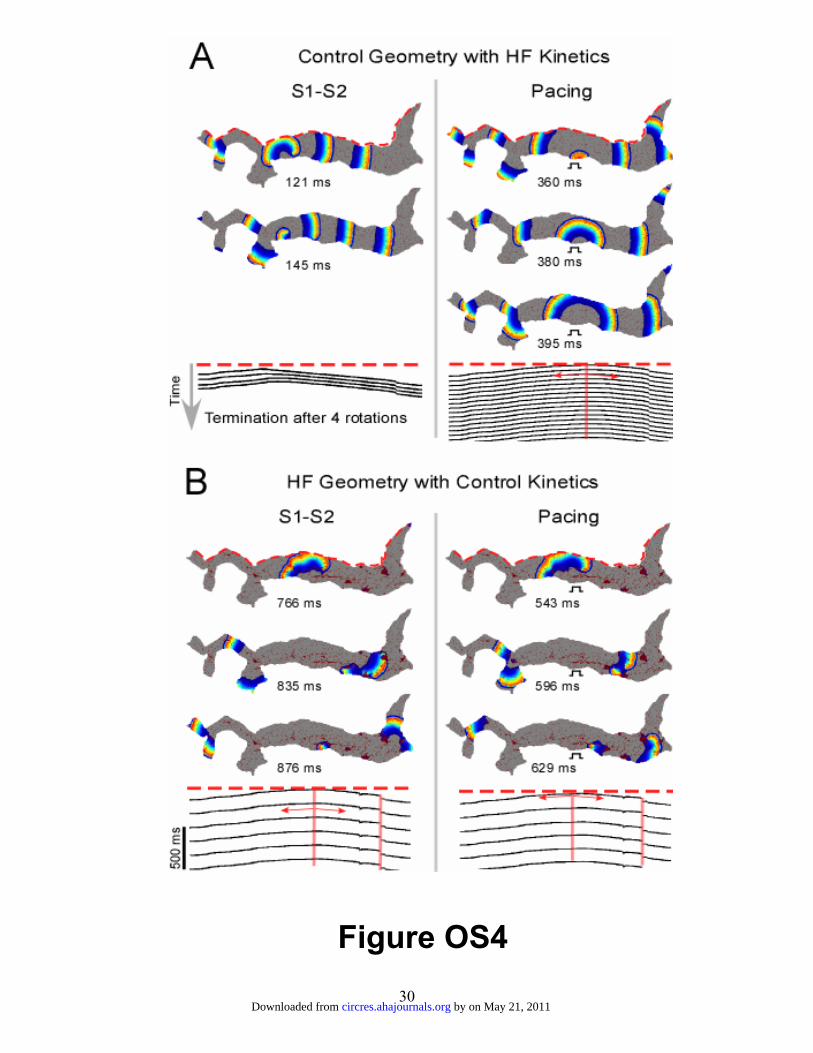
30
Figure OS4
by on May 21, 2011 circres.ahajournals.orgDownloaded from
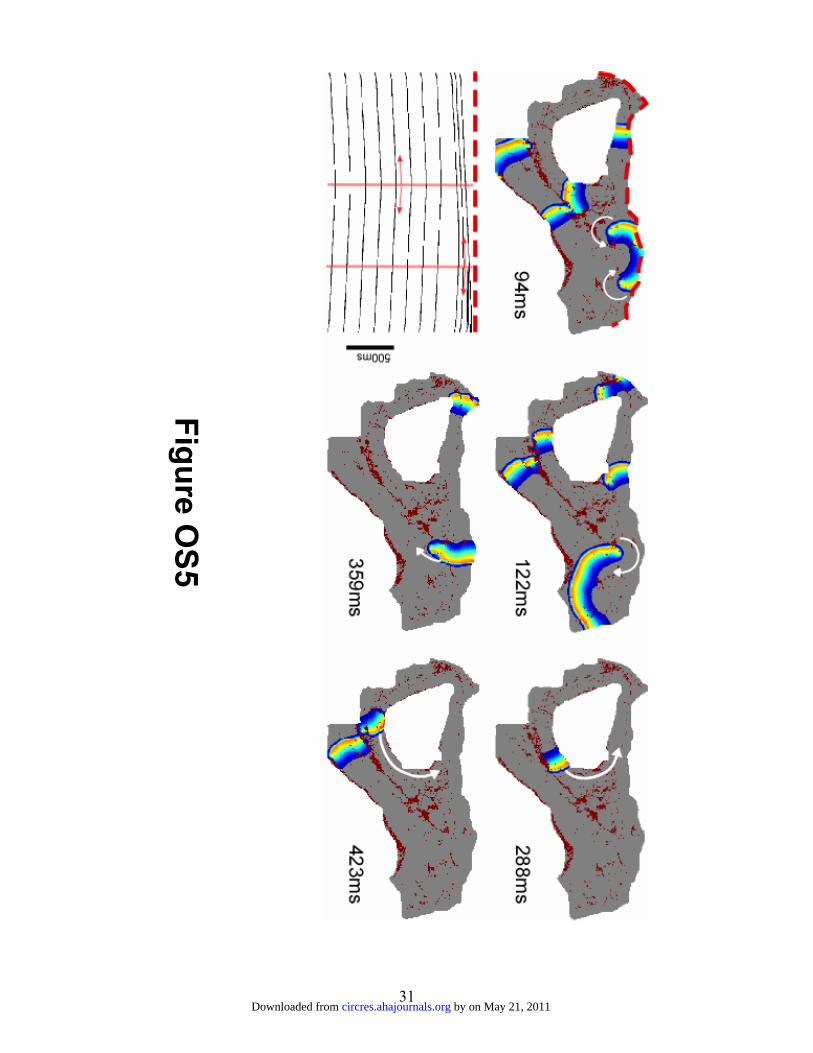
31
Figure OS5
by on May 21, 2011 circres.ahajournals.orgDownloaded from
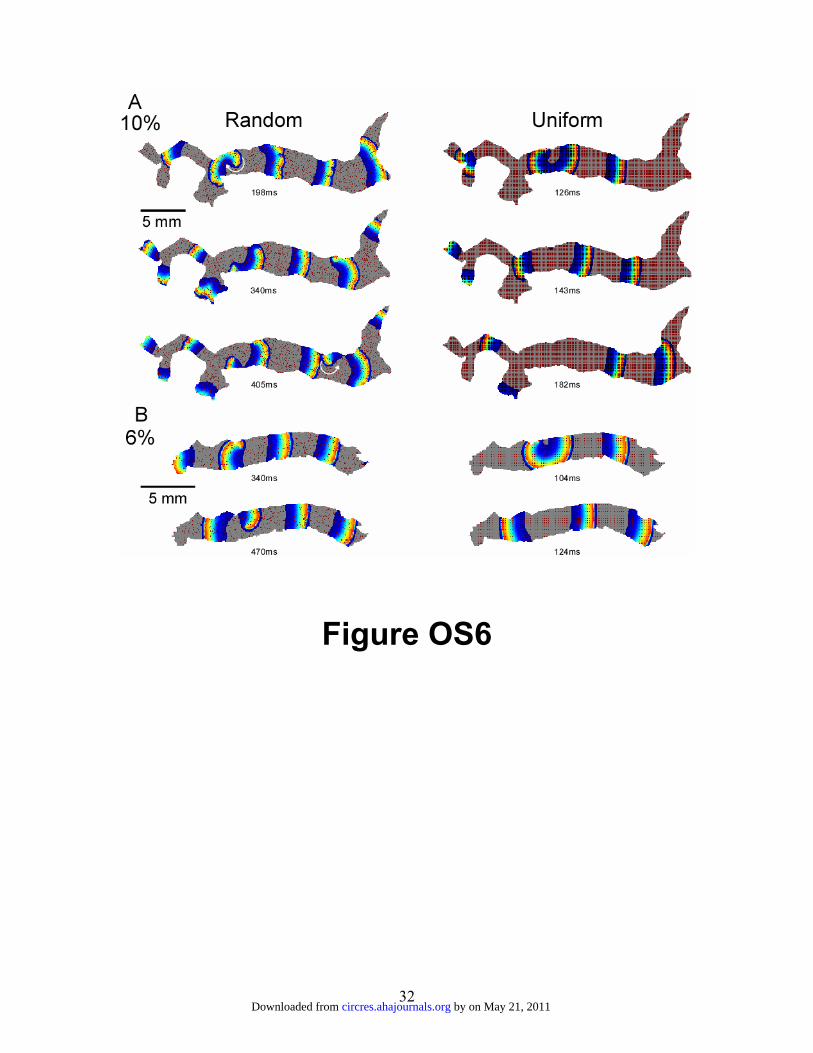
32
Figure OS6
by on May 21, 2011 circres.ahajournals.orgDownloaded from
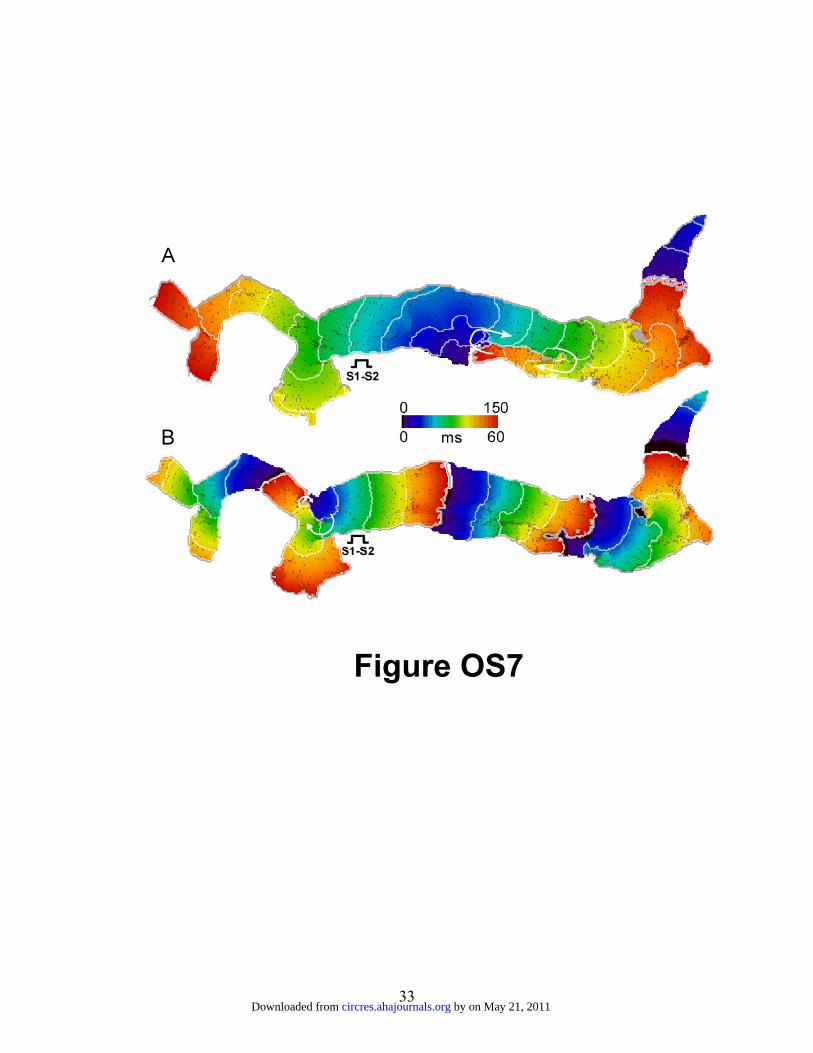
33
Figure OS7
by on May 21, 2011 circres.ahajournals.orgDownloaded from