
Guía de cursos de la preparatoria y la secundaria - Georgetown ISD
Upload
khangminh22Category
view
5download
0
EXPLORING THE STRUCTURE–ACTIVITY RELATIONSHIP OF PLATINUM AND PLATINUM–BASED
ELECTRO–CATALYSTS FOR THE METHANOL ELECTRO–OXIDATION
A Dissertation
submitted to the Faculty of the
Graduate School of Arts and Sciences
of Georgetown University
in partial fulfillment of the requirements for the
degree of
Doctor of Philosophy
in Chemistry
By
Augusta M. Levendorf, M.S.
Washington, DC
December 3, 2013

ii
Copyright 2013 by Augusta M. Levendorf
All Rights Reserved

iii
EXPLORING THE STRUCTURE–ACTIVITY RELATIONSHIP OF PLATINUM AND
PLATINUM–BASED ELECTRO–CATALYTS FOR THE METHANOL
ELECTRO–OXIDATION
Augusta M. Levendorf, M.S.
Thesis Advisor: YuYe J. Tong, D.Sc.
ABSTRACT
This dissertation focuses on fundamental studies to improve the understanding of surface
interactions on Pt electro–catalysts using the methanol oxidation reaction (MOR) as the model
surface sensitive reaction. Advances in preferential control of Pt at the nanoscale to yield
nanocrystalline ensembles have allowed for exploration into the different activity trends between
macroscale and nanoscale materials. The primary aspect of this research focused on synthesizing
preferentially oriented Pt nanocrystals (NCs) with low index surfaces, i.e. 100 and 111
planes, to survey the structure–activity relationship of the NCs for the MOR. Traditional
electrochemical (EC) methods, i.e. cyclic voltammetry (CV) and chronoamperometry (CA), were
employed to evaluate the activity of the electro–catalysts, while in situ infrared (IR) spectroscopy
techniques provided insight into the molecular species present at the electrode–electrolyte
interface that was correlated to the EC data. In situ Thin Film Fourier Transform IR (FT–IR) and
in situ Attenuated Total Reflection–Surface Enhanced IR Absorption Spectroscopy (ATR–
SEIRAS) models were employed. Isolating the principal factors that connect structure and
catalytic functionality on low indexed Pt NCs to enhance activity and stability is of fundamental
importance for improving the viability of fuel cells. A secondary project that emerged from the

iv
work involved investigations on the surfactant, poly(vinylpyrrolidone) (PVP), used in the
synthesis to expose the impact that the PVP exerts at the electrode–electrolyte interface.
Commercially available Pt electro–catalysts served as the polycrystalline reference to contrast
with the observations made on the NC ensembles as well as ideal substrates to investigate the
influence of the surfactant on the interfacial region. This dissertation emphasizes the importance
of in situ measurements for characterization of electro–catalysts. The direct observation of
important molecular species, e.g. interfacial water and carbon intermediates, using vibrational
spectroscopy in the reaction pathways is a critical component to design effective electro–
catalysts. Prospective studies involving polymer species and further investigation on the NC
ensembles are also proposed.

v
ACKNOWLEDGEMENTS
Thank you to Georgetown University and the Department of Chemistry for the
opportunity to pursue my doctoral studies. I express my enormous gratitude to all those who
have helped make this dissertation possible both scientifically and otherwise.
From the Department, I would like to thank Inez, Kay, Mo, Travis and Tabi for their help
with departmental issues and lots of paperwork. Also, I thank Yen and Helen of the stockroom
for making the research possible because we must have the chemicals before the publications.
The Department is so lucky to have you and I am very thankful!
I am grateful to Dr. Tong for accepting me into his research group many moons ago. You
have been a wonderful mentor that is always willing to give support and guidance with the
occasional story or two. Thank you for your tireless work on proposals to obtain funding for us
to perform research, travel to conferences as well as organizing fun group activities like the ski
and boat trips. It has been great fun to be a member of your group, thank you for the memories!
I would like to thank Dr. Weiss, Dr. Warren and Dr. Allison for not only serving on my
committee, but for your advice and guidance over the years. In addition, I would like to thank
Dr. Glick for being my guiding light and helping me find my calling.
I will always be in debt to my group members: Oksana, Ying, Ceren, Dejun, Dianne,
Honghui, Yangwei, Yuan, Melissa and Yanyan. I never would have made it this far without your
knowledge, perspective and suggestions. I would especially like to thank Dejun, Dianne and
Honghui for their fresh outlook and insightful discussions on my research during the past two
years. Also, thank you Thomas, Steven, Ashley, Mathew and Chris for being awesome

vi
undergraduates and reminding me why I started graduate school in the first place. I hope you
guys enjoy the new lab space and all I ask is that you keep it clean!
Thank you to the dear friends made here at Georgetown and in DC, you have always
been there for me and I will always be grateful! Thank you so much to the lifelong friends made
during my PhD study outside of the Tong Group, including Lora, Lisette, David and many more!
I would especially like to acknowledge the Ladies of Foxhall: Kandi, Kristine, Jen, Mahal and
others for the laughter, trash TV, delivery food and nights we shared a bottle of cab! Our fun
memories and laughter will never be forgotten. I will miss you Ladies!
I would like to give enormous thanks to my dear friends and family scattered far and
wide that have shared their support. I would like to thank my extended family for the endless
vote of confidence and especially the from my late Grampa. I am grateful to the Andrews Girls
for reminding that there is a great big beautiful world outside of science to explore and enjoy. I
want to give a Big Thanks to the Big Red for my undergraduate years and friends, especially
Natasha, Ashley and DongEun. Nastahsa without you, my life would have been very different
and I cannot even imagine – thank you! As an honorary member of the Park Group at Cornell, I
would like to thank Jiwoong for his understanding and support during the past six years. I also
want to thank Wei, Carlos, Robin and Lola for being great friends!
I have to thank Cornell Chemistry for bringing Mark into my life. He started as a
chemistry study partner and is now my wonderful husband! The past few years have tested the
strength of our love, but we have survived the roller coaster of our relationship and our research
together. Mark you have brought so much happiness into my life and I am excited for our lives to
finally come together as we embark on the next adventure as husband and wife. There is sure to

vii
be a great many experiences we can finally share together and not apart. Thank you for loving
me and supporting me through all the dramatic, stressful and joyful experiences of the past six
years. I love you and thank you from the bottom of my heart!
I would like to thank the new family members that I have accepted me into their family.
Papa and Mummy have been so generous with their support and advice to Mark and me. Also, I
want to thank Gramma Helen, Gramps Melvin and Dore for taking an active role in our lives.
Moreover, I want to thank my new sister Erin for the endless encouragement with her giggles
and an enthusiastic perspective! We had some terrific times in NYC, Ithaca and Ohio, though I
am looking forward to new memories in Los Angeles and where every the road may lead. So
happy to have you as a sister Stripes!
To my dear little sister, Kelsey, I cannot tell you what a help you have been to me! You
are the best friend in the world – you are an amazing young lady and I am so proud of you. I am
so glad and lucky you are my sister! Even though distance separates us, you have never been
closer to my heart. I love you!
Above all, I want to express my gratitude to my wonderful parents. Thank you so much
to my incredible parents! You both have always being there to listen, to calm, to support, to
laugh…Words are not enough to describe how grateful I am to be your daughter! You have
inspired so much in my life. It is to you that I dedicate this dissertation with love as a small thank
you for all that you have given and done for me.
Sincerely yours,
Augusta

viii
For my Mommy and Daddy

ix
TABLE OF CONTENTS
Chapter 1. Introduction ................................................................................................................... 1
1.1. From Fossil Fuels to Fuel Cells ............................................................................................... 1
1.2. The Methanol Fuel Cell ........................................................................................................... 4
1.3. The Methanol Oxidation Reaction ........................................................................................... 6
1.4. From Macro to Nanoscale Single Crystals ............................................................................ 12
1.5. Overview of Dissertation ....................................................................................................... 17
Chapter 2. Materials and Methods ................................................................................................ 19
2.1. Materials ................................................................................................................................ 19
2.2. Synthetic Methods ................................................................................................................. 20
2.3. Experimental Methods ........................................................................................................... 22
Chapter 3. The Cyclic Voltammetry of the Methanol Electro–oxidation on Pt–based Electro–
catalysts: Harmonizing Electrochemistry and Infrared Spectroscopy .......................................... 26
3.1. Notes and Acknowledgements ............................................................................................... 26
3.2. Introduction ............................................................................................................................ 26
3.3. Results and Discussion .......................................................................................................... 29
3.4. Summary ................................................................................................................................ 35
Chapter 4. Low Index Nanocrystalline Ensembles of Pt Electro–catalysts Protected by
Poly(vinylpyrrolidone): An Electrochemical and in situ FT–IR Investigation ............................ 37
4.1. Notes and Acknowledgements ............................................................................................... 37
4.2. Introduction ............................................................................................................................ 37
4.3. Results and Discussion .......................................................................................................... 39
4.4. Summary ................................................................................................................................ 53
Chapter 5. The Effect of Poly(vinylpyrrolidone) with Different Molecular Weights on Carbon
Supported Pt Electro–catalysts for the Methanol Electro–oxidation ............................................ 55
5.1. Notes and Acknowledgements ............................................................................................... 55
5.2. Introduction ............................................................................................................................ 55
5.3. Results and Discussion .......................................................................................................... 57
5.4. Summary ................................................................................................................................ 70

x
Chapter 6. The Influence of Preferential Surface Structure of Pt Nanocrystals: Electro–catalysts
for the Methanol Oxidation Reaction ........................................................................................... 72
6.1. Notes and Acknowledgements ............................................................................................... 72
6.2. Introduction ............................................................................................................................ 72
6.3. Results and Discussion ...........................................................................................................73
6.4. Summary ................................................................................................................................ 89
Chapter 7. Conclusion ................................................................................................................... 90
7.1. Concluding Remarks ...............................................................................................................90
7.2. Prospective Research ..............................................................................................................93
Appendix A. Overview of Electrochemistry ................................................................................ 97
A.1. Basic Principles ......................................................................................................................97
A.2. Experimental Methods ........................................................................................................ 102
Appendix B. Overview of Infrared Spectroscopy ....................................................................... 105
B.1. Basic Principles ................................................................................................................... 105
B.2. Experimental Methods ........................................................................................................ 107
Appendix C. Curriculum Vitae ................................................................................................... 110
References ................................................................................................................................... 112
1
CHAPTER 1
INTRODUCTION
1.1. From Fossil Fuels to Fuel Cells
Electricity is a cornerstone of contemporary society with strong implications in the socio–
economic and political arenas.1 Prior to the rapid advancement of electrical engineering in the
1800s, electricity was a natural phenomenon. The discovery of the electromagnetic induction
principle by Faraday provided a method to harness electrical energy that is used in present day
electric generators.2-4
Faraday’s principle describes how an electrical current, or voltage, can be
produced in the presence of a changing magnetic field. There were few practical applications for
electrical energy until the Second Industrial Revolution.5, 6
From that point it began to tap into its
potential for industrial and residential use, where today electricity has a ubiquitous presence.
The versatility and widespread use of electrical power in daily life is evident with a quick
count of the devices within eyesight. Electric energy consumption is measured as watt hour (W
hr), which is equivalent to one watt of power expended for one hour of time or 3,600 joules of
energy.7 On a global scale nearly 20% of the power expended in 2010 was in the form of
electricity.8 The world energy demand continues to rise in both developed and developing
nations alike, for example the United States and China consumed 3,798 TW hr and 4,281 TW hr,
respectively, in 2012. Industrialization leads to greater demand for electricity, which is notable in
China, where its usage has increased by a factor of 3.8 over the past twelve years to become the
largest consumer of electrical energy in 2012. Meeting the current and future energy quotas for
the growing population of industrialized nations requires alternative technology for energy
production.9-11
Presently, the global population relies on large immobile power stations that

2
convert mechanical energy into electrical energy using an electrical generator based on Faraday’s
original work.3
Figure 1.1. World electricity generation, adapted from Ref. 8.
Most electric generators are driven by the combustion of nonrenewable sources such as
natural gas, oil and coal. According to the International Energy Agency, fossil fuels contribute to
67.4% of the 21,431 TW hr of global electricity produced in 2010 as shown in Figure 1.1.8 Fossil
fuel–based electricity generation is responsible for a significant portion of the greenhouse gas
emissions, which has been a central figure in the global warming debate.10
Besides carbon
dioxide produced from the burning of the fossil fuels, elements such as sulfur and nitrogen are
also present and lead to other noxious emissions that are culprits in smog and acid rain.8, 12
The fixed quantity of the fossil fuel supply and its adverse environmental effects have led
to an increased use of more sustainable power sources, i.e. wind and solar rays.8, 10
As presented
in Figure 1.1, these renewable sources account for 3.7% of the global electricity generation and
have decidedly increased from a mere 0.6% thirty years ago.8 Unfortunately, greenhouse gas
emissions have continued to rise despite efforts from industry, government and environmental

3
organizations to reduce waste and pollution.8, 10
In response to the demand for energy and the
growth of an environmental consciousness, substantial efforts have been made to find clean and
more efficient power sources by decreasing the dependence on fossil fuels.10, 13
Fuel cell technology is a promising option that can yield electricity with 85% theoretical
efficiency from electrons exchanged during an oxidation reduction reaction.13-15
The fuel cell can
be compared to a continuously running battery because reagents are continually supplied to the
cell so it does not discharge as in the traditional batteries that expire. The first functional fuel
cell, described by Grove in 1839, produced an electric current from the redox reaction between
hydrogen gas and the oxygen in the air using sulfuric acid as the electrolyte.16
Today, fuel cells
also use an electrolyte to allow charge to flow from the oxidation reaction occurring at the anode
to the reduction present at the cathode, while the electrons flow through an external circuit as
illustrated in Figure 1.2. Hydrogen remains the most commonly used fuel because it yields water
as the only waste product when it reacts with oxygen from the air. Different types of fuel cells
exist today that operate using the principles established by Grove’s seminal work.16
The choice of electrolyte differentiates the various fuel cells because it controls the
operation parameters such as temperature range and electrode material, which affects the
practical applications.13, 15
Solid oxide fuel cells (SOFCs), for example, use a ceramic electrolyte
that functions between 800°C and 1000°C, whereas the proton exchange membrane fuel cell
(PEMFC) operates between 60°C and 100°C.17
The hydrogen oxidation reaction requires
different electrode materials to catalyze the reaction due to changes in the activation energies at
these vastly different temperatures. The PEMFCs require precious metal electro–catalysts,
whereas SOFCs use less expensive catalyst materials and thereby reduce the operational costs.
PEMFCs, however, show strong promise as portable power sources that are ideal for small

4
electronics and vehicles because the low working temperature reduces corrosion and other issues
related to proton exchange, which are difficulties for high temperature fuel cells.17, 18
Fuel cells
are capable of producing power on the order of 1–10 W for small electronic devices and
quantities of kW to MW for automobiles and secondary power supplies.13, 17
As with most
technology, there are advantageous aspects and challenges that need to be improved upon in
order to make the fuel cells commercially viable as an alternative energy source.
Figure 1.2. Representative fuel cell, adapted from Ref 14.
1.2. The Methanol Fuel Cell
PEMFCs, in particular, offer convenience in terms of portability, low operational
temperature and electrolyte stability. Success with automobile prototypes powered by hydrogen

5
PEMFCs provide an alternative to petroleum–based fuels in the transportation industry.19
The
anticipated release of several fuel cell vehicles within the next decade and economic incentive
programs in Japan and Europe to build fueling stations for such models mark the beginning of a
new era.19, 20
As a major contributor to greenhouse CO2 emissions due to the Carnot cycle, the
automotive business is an ideal candidate to benefit from the higher efficiencies and benign
waste products, i.e. water and heat.13
Hydrogen as the fuel, however, remains a controversial and
challenging aspect to the commercialization of PEMFCs in vehicles due to storage issues
associated with the high volatility and reactivity.
A small hydrocarbon alcohol such as methanol is an auspicious option that eliminates the
difficulties associated with hydrogen for PEMFCs.21-23
Methanol is the simplest alcohol with a
density of 0.7918 g cm-3
and has a modest boiling point of 64.7°C.24
Methanol has a comparable
energy density to that of commercial gasoline through its six electron redox reaction couple with
oxygen.13, 17, 23
Commonly produced from methane and syngas, which originate from fossil fuels,
the on–going research and improvements in CO2 reduction to generate methanol allows for
recycling of excess CO2.25-27
Moreover, as a lightweight liquid fuel, the existing infrastructure
for gasoline distribution would need little modification and ease the public’s transition.20, 28
Despite the attractiveness of methanol FCs (MFCs), they suffer daunting problems such
as low current densities, i.e. the current per amount of electro–catalyst, methanol crossover, i.e.
diffusion through present PEMs, and expensive precious metal, i.e. platinum, electrodes
necessary for low temperature electro–catalysis.13, 18, 28
Research is ongoing in these and other
problem areas to improve the commercial viability of these fuel cells, but present technology is
encouraging. The direct methanol fuel cell (DMFC), where neat methanol is employed as the
fuel, is identical to the fuel cell illustrated in Figure 1.2 with a PEM as the electrolyte and Pt as

6
the electrode material.21-23
In acidic media, methanol is oxidized at the anode to form carbon
dioxide, while at the cathode oxygen is reduced to form water according to the half–reactions:
CH3OH + H2O → CO2 + 6 H+ + 6 e
- Eqn. 1.1.
O2 + 6 H
+ + 6 e
- → 3 H2O Eqn. 1.2.
The subsequent chapters of this dissertation are focused on the methanol oxidation reaction
(MOR) in acidic electrolytes, thus a summary of the present understanding of the electro–
catalytic reaction mechanism on Pt electro–catalysts follows in the subsequent section.
1.3. The Methanol Oxidation Reaction
The MOR occurs at the electrolyte–electrode surface, thereby the structure of this
interfacial region is quite important to the catalytic activity and selectivity.21, 23
Pt has a face
centered cubic (fcc) crystal structure with different surface planes exposed at the electrode
surface, which are described by Miller indices.29
In general, the more stable planes are the low
index surfaces, i.e. 100, 110 and 111, which are illustrated in Figure 1.3. From the
standard fcc unit cell, the desired low index plane can be obtained by bisecting the unit cell along
specific orientations. For example, the 100 plane is exposed by cutting the unit cell along the
x–axis atoms, shown in pink, while the 111 plane is acquired when the unit cell is sliced
through the x–, y– and x–axes. Below the traditional unit cell is the conventional view of the
exposed surface that highlights the surface symmetry, e.g. the hexagonal packing for the 111
atomic arrangement, that is obtained by rotating the bisected unit cell.

7
Figure 1.3. Traditional fcc unit cells with pink atoms emphasizing the atoms exposed on the
surface plane and the conventional view of the surface atom arrangement for low indexed
crystallographic planes, adapted from Ref 32.
Investigations with well–defined bulk single crystal planes have shown that the MOR in
acidic media, i.e. HClO4 and H2SO4, is sensitive to the surface morphology with activity that
increases in the order of Pt 111 < Pt 110 < Pt 100.21, 30-32
Despite the low intrinsic activity
on the Pt 111 bulk surface, interestingly it tends to be the least susceptible surface to an
intermediate produced during the reaction that deactivates the catalyst. Alternatively, the long–
term tolerance to this poisonous intermediate on Pt 100 single crystals is quite poor, thus it is
easily deactivated over time despite the high intrinsic activity. The surface atomic arrangement
plays a critical role in the reactivity of Pt. Therefore, much effort has gone into elucidating the
structure–activity correlations using Pt model systems composed of macroscale Pt single
crystals.

8
Figure 1.4. Mechanistic pathway for the electro-oxidation of methanol on Pt, adapted from Ref
31.
Investigations with these model systems performed under ultra high vacuum (UHV) and
in the solution phase indicate a dual pathway, summarized in Figure 1.4.30, 31, 33, 34
The dual
pathway depends on the initial dehydrogenation of methanol from the solution, CH3OHsol, which
leads to a carbon or oxygen bound to the metal surface. More specifically, the scission of the
C–H leads to the formation of an adsorbed hydroxymethyl, CH2OHads, whereas the scission of
the O–H bond yields adsorbed methoxy, CH3Oads, as illustrated in Figure 1.4. From this initial
dehydrogenation step, the MOR pathway diverges into the so–called direct or indirect pathway

9
stemming from the CH3Oads or CH2OHads intermediate formed upon the initial dehydrogenation,
respectively. The series of dehydrogenation steps proceeds through non–CO reactive
intermediates and/or an adsorbed CO (COads) intermediate to produce CO2 and other soluble
products. The dual–path mechanism is well–accepted though the exact mechanistic details
remain obscured by the complex nature of the oxidative reaction intermediates and solution
species at the surface.21, 23, 32
The direct pathway provides an efficient conversion to CO2 with soluble intermediates
such as formic acid, methylene glycol and methyl formate.17, 30, 31
Detection of these various
products using differential electrochemical (EC) mass spectroscopic measurements provide an
indication that the direct route is not the dominant reaction mechanism.35, 36
Results show that the
direct pathway is less structure sensitive since 1 to 2 Pt atoms are required to break the O–H
bond.33
Moreover, these small reaction sites are not as influenced by the presence of adsorbing
electrolyte anions, namely perchlorate and (bi)sulfate.31, 37
There is speculation about the reactive intermediate(s) in the direct pathway, which is
complicated by the possible readsorption and subsequent oxidation of soluble products. As seen
in scheme of Figure 1.4 the adsorption of formate (HCOOads) can be traced from the oxidation of
formic acid and methylene glycol. Osawa et al., however, claim that HCOOads is a key
intermediate in the MOR direct pathway.38
Based on a systematic study using in situ infrared
(IR) spectroscopic measurements coupled with EC results on a Pt film, the authors observed the
formation of a new adsorbate, i.e. HCOOads, concurrent with the oxidation of methanol–
generated CO beyond 0.5 VRHE. Despite the numerous investigations into the MOR, the true
active intermediates in the direct pathway remain elusive.

10
The indirect pathway is better understood because it is the dominant reaction mechanism
that proceeds through a series of surface adsorbed intermediates, albeit less efficient.31, 33, 34
This
inefficiency is attributed to what is best described as a poison, namely the formation of COads
upon the dehydrogenation of the adsorbed hydroxymethylyne (COHads).21, 23
The strong bonding
interaction of COads on Pt deactivates or poisons the catalytic reaction site, thus inhibiting the
catalytic turnover of CH3OH. This strength comes from a dual electron donation, firstly from the
bonding 5σCO orbital to the dPt orbitals and secondly from the back–donation of the dPt to the
anti–bonding 2π*CO, as illustrated by the Blyholder model in Figure 1.5.39
The oxidative reaction
turnover rate slows due to the relative stability of COads on Pt in the low potential region below
0.4 VRHE.40, 41
Figure 1.5. Illustration the molecular bonding of CO and Pt according to the Blyholder model,
adapted from Ref 39.
The oxidative removal of this poison has been well documented on Pt and Pt–based
electro–catalysts using various techniques, such as IR spectroscopy and scanning tunneling
microscopy.42-45
In order to expel COads from the surface and recover the reaction sites, COads
combines with an oxygen source, i.e. dissociated water (OHads), and readily undergoes

11
conversion to CO2 that diffuses away from the surface according to a Langmuir–Hinshelwood
type mechanism:46, 47
H2O → OHads + H+ + e
- Eqn. 1.3.
COads + OHads → COOHads Eqn. 1.4.
COOHads → CO2 + H+ + e
- Eqn. 1.5.
Water dissociation on the Pt surface requires potentials higher than 0.4 VRHE that are beyond the
working potential range for DMFC commercialization. One approach is the introduction of a
second more oxophilic metal, i.e. Ru, to serve as a reservoir of oxygenated species to enable Pt
to easily oxidize COads at lower potentials.48-50
Known as the bi–functional mechanism, there has
been a great deal of research into binary to quaternary Pt–based electro–catalysts to improve CO
tolerance.51-53
Moreover, the surface structure plays a larger role in the indirect pathway since the
CH2OHads and subsequent species require an ensemble of 3 to 4 atoms.33
Likewise, the presence
of a strongly adsorbing anions, i.e. (bi)sulfate, inhibits the indirect pathway by blocking the
ensemble sites.31, 54
The atomic arrangement and structural integrity are quite important as it is clearly linked
to the activity and future electro–catalyst designs, but the MOR shares the mechanistic trends
described above. Moreover, the predominant MOR pathway can be somewhat adjusted by
potential applied, as this affects the water and electrolyte anions interaction with the surface
atoms at the interface. A significant portion of the literature and work in this dissertation focus
on understanding and correlating the behavior of COads as a solitary species and as an
intermediary species during the methanol half–reaction with different surface structures. Most of
the current understanding of the MOR and coincidently other fuel cell mechanisms are based on
bulk single crystal Pt studies, though studies at the nanoscale are on the rise.

12
1.4. From Macro to Nanoscale Single Crystals
As a noble metal, Pt exhibits several useful characteristics aside from luster and
malleability, i.e. low toxicity, non–reactivity to oxidation and corrosion resistance, that make it
suitable for various applications.13, 23, 32
Pt is the electro–catalyst of choice for DMFCs because it
is stable in acidic media and displays a unique reactivity towards methanol oxidation at low
temperatures. From a fiscal perspective, it is impractical to use bulk single crystals for
commercial applications because of the high cost associated with metal. For instance, the
average cost of Pt over the past five years was $52.53 per g, reaching a high of $67.43 per g in
August 2011 and $45.27 per g in September 2013.55
Moreover, the electro–oxidation occurs on
the surface of the metal, thus a large surface area to volume ratio is advantageous. The model Pt
systems provide fundamental knowledge about the mechanistic pathway, though real electro–
catalysts must be composed of Pt nanoparticles (NPs).56
NPs exhibit unique size–dependent properties, i.e. quantum confinement and surface
plasmon resonance, which can deviate drastically from the bulk counterparts due to their size
range of 1 to 100 nm and being composed of 100 to 10,000 atoms.56-59
At this small scale, where
the NP diameter and wavelength for the electron become similar, there are changes in the
electronic bandgap that correlate with size changes.57
The quantum size effect is very important
for semiconductor applications, but there is a debate on size versus site in electro–catalysis.57
“Rough surfaces do chemistry” is a memorable quote from Somorjai, a well–known
member of the surface science community, that suggests that the step and defect sites are
responsible for activity.60
As the particle size decreases the long range terrace sites decreases
while the amount of edge and defect sites increases, which should lead to more reactive
surfaces.57
Simply a rise in edge sites does not necessarily lead to more activity, for instance, the

13
MOR is well–documented to exhibit lower activities on smaller particles.61
This particular
inversion of size–structure sensitivity stems from the higher oxophilicity of the smaller Pt NPs
that blocks methanol dissociation and is possibly linked to the decrease of defective step sites.58
Thus, size is a factor for optimizing the activity in addition to the particle morphology.
Figure 1.6. Overview of possible fcc metal particle shapes that are related to the Miller indices
and surface atomic arrangements of the particles, adapted from Ref 71.
In the past two decades, there has been much improvement in synthetic methods to yield
nanometer–sized single crystals, or simply nanocrystals (NCs), of a particular size and desired
shape.61-68
Figure 1.6 illustrates that the shape of a NC, which is bound by specific surface
planes, can be related to the corresponding surface atomic arrangement for fcc crystallographic
planes. For instance, the cubic NCs are bound by the 100 crystallographic planes. Stability is a
major concern for NCs since the most thermodynamically stable surface, i.e. Pt 111, is
generally the least catalytically active low index single crystal surface for the MOR.67, 69
Thus,
most shape control syntheses incorporate a surfactant, namely a polymeric species to stabilize
14
particular surface planes during and after growth.67, 68, 70
The influential work of the El–Sayed
group in 1996 showed that discrete cubic or tetrahedral Pt NCs could be synthesized by adjusting
the relative concentrations of the Pt precursor to the sodium salt of poly(acrylic acid). The
poly(acrylate) polymer serves as the stabilizing agent to obtain NCs chiefly comprised of a single
shape, thereby a single exposed surface plane.70
Since this seminal work, improved wet–
chemistry methods have enabled preferential control of various sized low indexed
crystallographic planes within a single particle.61-63, 66
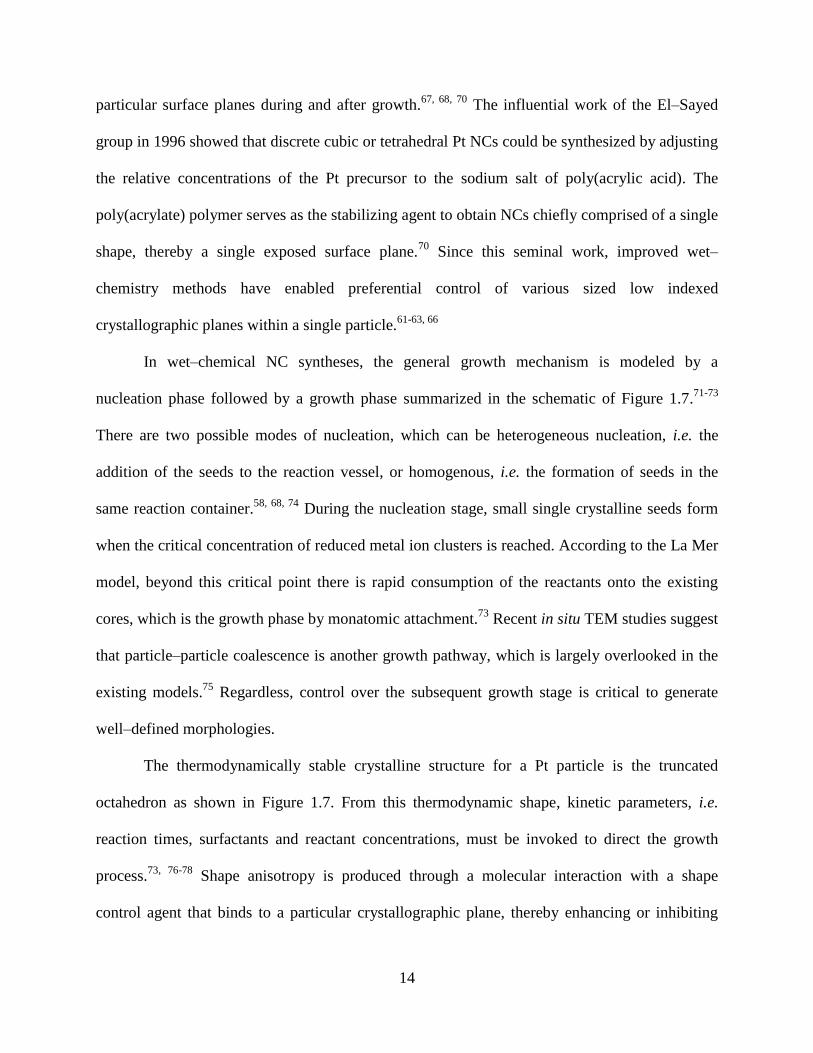
In wet–chemical NC syntheses, the general growth mechanism is modeled by a
nucleation phase followed by a growth phase summarized in the schematic of Figure 1.7.71-73
There are two possible modes of nucleation, which can be heterogeneous nucleation, i.e. the
addition of the seeds to the reaction vessel, or homogenous, i.e. the formation of seeds in the
same reaction container.58, 68, 74
During the nucleation stage, small single crystalline seeds form
when the critical concentration of reduced metal ion clusters is reached. According to the La Mer
model, beyond this critical point there is rapid consumption of the reactants onto the existing
cores, which is the growth phase by monatomic attachment.73
Recent in situ TEM studies suggest
that particle–particle coalescence is another growth pathway, which is largely overlooked in the
existing models.75
Regardless, control over the subsequent growth stage is critical to generate
well–defined morphologies.
The thermodynamically stable crystalline structure for a Pt particle is the truncated
octahedron as shown in Figure 1.7. From this thermodynamic shape, kinetic parameters, i.e.
reaction times, surfactants and reactant concentrations, must be invoked to direct the growth
process.73, 76-78
Shape anisotropy is produced through a molecular interaction with a shape
control agent that binds to a particular crystallographic plane, thereby enhancing or inhibiting
15
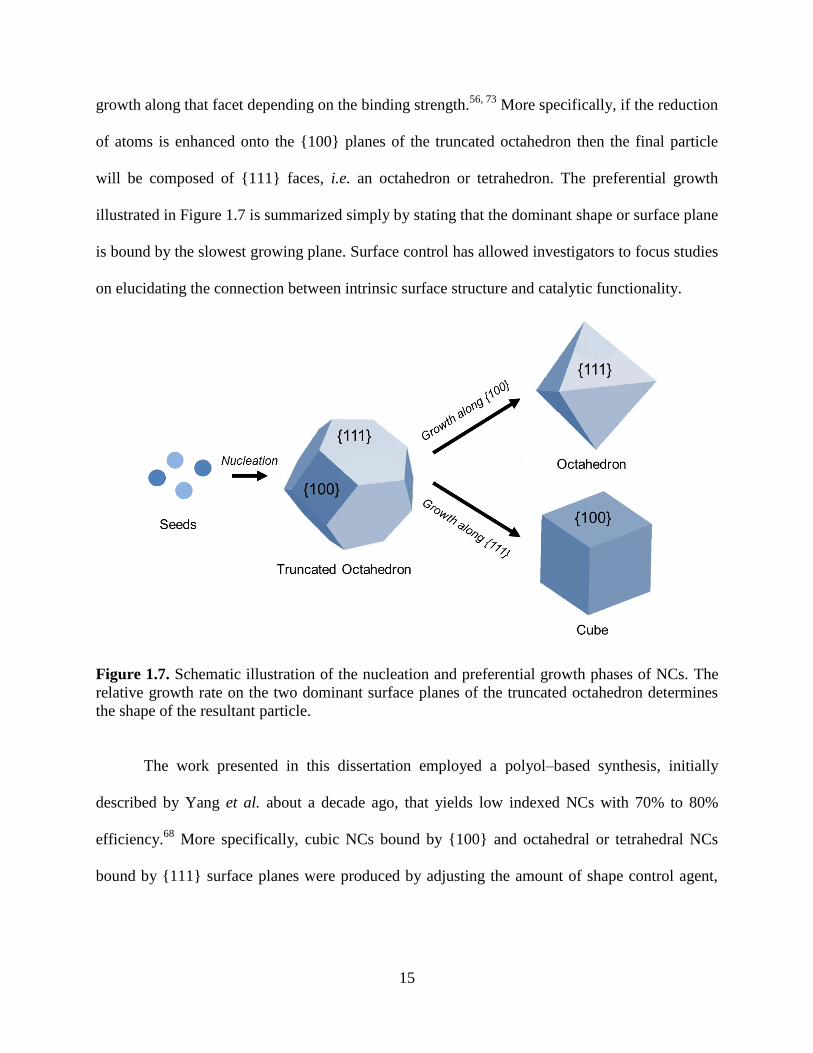
growth along that facet depending on the binding strength.56, 73
More specifically, if the reduction
of atoms is enhanced onto the 100 planes of the truncated octahedron then the final particle
will be composed of 111 faces, i.e. an octahedron or tetrahedron. The preferential growth
illustrated in Figure 1.7 is summarized simply by stating that the dominant shape or surface plane
is bound by the slowest growing plane. Surface control has allowed investigators to focus studies
on elucidating the connection between intrinsic surface structure and catalytic functionality.
Figure 1.7. Schematic illustration of the nucleation and preferential growth phases of NCs. The
relative growth rate on the two dominant surface planes of the truncated octahedron determines
the shape of the resultant particle.
The work presented in this dissertation employed a polyol–based synthesis, initially
described by Yang et al. about a decade ago, that yields low indexed NCs with 70% to 80%
efficiency.68
More specifically, cubic NCs bound by 100 and octahedral or tetrahedral NCs
bound by 111 surface planes were produced by adjusting the amount of shape control agent,

16
AgNO3 introduced into the system. The original synthesis reported that Ag ions direct the growth
mechanism through a galvanic–assisted reduction of Pt summarized as:68
4 Ag0 + H2PtCl6 → 4 AgCl + Pt
0 + 2 HCl Rxn. 4.1.
Reduced silver is known to preferentially adsorb more strongly onto Pt 100 surfaces.79
Thus,
at higher concentrations of AgNO3, there is enhanced growth along the 100 faces, resulting in
NCs bound by 111 facets.
As with most polyol methods, poly(vinylpyrrolidone) (PVP) is incorporated into the
synthesis to serve as a stabilizing surfactant to prevent particle aggregation. Since PVP is widely
used, it is commercially available with a range of molecular weights that consist of the monomer
unit in Figure 1.8. PVP can also act as a shape control agent for other metals, though it stabilizes
both the 100 and 111 Pt surfaces through its carbonyl moiety and it is unclear to which
surface it binds more strongly.80-82
Prior to the start of this dissertation, there were few studies
that discussed the nature of stabilizing agents post synthesis with respect to their influence on the
activity since they were believed to be impediments to catalysis.56, 83
During the course of this
dissertation, the interest in surfactants ability to enhance activity and simultaneously stabilize the
NCs has developed into a new area of research and will be discussed in greater detail later.84-86
Figure 1.8. Monomer unit of PVP.

17
1.5. Overview of Dissertation
Within the broad context introduced in Chapter 1, this dissertation focuses on
fundamental studies to improve the understanding of surface interactions on Pt electro–catalysts
using the MOR as a probe reaction. The primary feature of the research focused on controlling
the shape, size, and local surface composition of low indexed Pt NCs with commercial catalysts
employed as references. A secondary aspect that emerged from the work involved investigations
on the surfactant used in the synthesis in an effort to expose modifications in the interfacial
region as this would influence the EC reactions.
The materials and methods with experimental parameters used throughout the course of
this research are described in Chapter 2. Conventional EC methods, i.e. cyclic voltammetry (CV)
and chronoamperometry (CA), were employed to evaluate the activity of the electro–catalysts.
The finer aspects of the EC techniques are discussed in Appendix A. Additionally, in situ surface
sensitive spectroscopy enabled for direct molecular detection of the adsorbed transients that
corresponds directly with EC measurements, thereby providing a complementary perspective of
the electrode–electrolyte interface.82, 87, 88
There were two in situ IR models used for
measurements, i.e. the Thin Film Fourier Transform IR (FT–IR) and the Attenuated Total
Reflection–Surface Enhanced IR Absorption Spectroscopy (ATR–SEIRAS) model, which are
described in greater detail in Appendix B.
Chapter 3 demonstrates the investigative power of complementary EC measurements
with spectroscopic information. The commercial carbon–supported Pt and PtRu electro–catalysts
exhibited different MOR voltammetric profiles, particularly the cathodic, i.e. negative potential
sweeps, which were subsequently related to the surface intermediates observed during the ATR–

18
SEIRAS measurements. Moreover, the current ratio criterion, a common descriptor in the
literature, as a gauge for tolerance to residual carbonaceous species was discussed.
The remaining Chapters center on the work with preferentially shaped NCs bound
primarily of 100 or by 111 surface planes. Chapter 4 presents an FT–IR investigation on
NCs that are protected by PVP in an effort to identify the reason for a previously observed
enhancement with PVP on 111 NCs. There was no distinct separation between the influence of
shape and surfactant presence, thus, Chapters 5 and 6 consider a single parameter using the more
sensitive ATR–SEIRAS model. Chapter 5 discusses the influence of the surfactant on the activity
and surface adsorbates on commercial carbon–supported Pt. More specifically, the effect of
molecular weight on activity was correlated to notable changes of interfacial water species
observed. Meanwhile, Chapter 6 deals with the MOR on the NCs method after complete removal
of the surfactant to obtain information based solely on the surface structure. As anticipated from
the work presented in Chapter 4, there is a strong indication of an enhanced direct pathway
because of active intermediates being detected.
Lastly, Chapter 7 summaries the results obtained from this dissertation that emphasizes
the importance of in situ measurements for characterization of electro–catalysts.69, 89
The direct
observation of important molecular species, e.g. interfacial water and carbon intermediates, using
vibrational spectroscopy in the reaction pathways is a critical component to design effective
electro–catalysts. Future studies involving polymer species and further investigation on the NC
ensembles are also proposed.

19
CHAPTER 2
MATERIALS AND METHODS
2.1. Materials
All materials were used in the as–received state without further modification unless
otherwise noted in the subsequent text. Glassware and miscellaneous items were cleaned in a
solution of concentrated H2SO4 with a Nochromix additive or in a solution of aqua regia (3:1 of
HCl:HNO3). Ultra–pure Milli–Q water (18.2 MΩ) was used in the following experiments
whenever water was required.
Alfa AECSAr: Dihydrogen hexachloroplatinate hexahydrate (H2PtCl6∙6H2O, 99.9 %
metals basis), sodium thiosulfate pentahydrate (NaS2O3∙5H2O), ammonium fluoride (NH4F) and
hydrofluoric acid (HF).
EMD Chemicals: Sodium sulfite (Na2SO3), nitric acid (HNO3, 70 wt%), ammonium
chloride (NH4Cl).
Electron Microscopy Science: Carbon–coated copper grids (200 mesh).
Fisher Scientific: Acetone, sodium hydroxide (NaOH) and ethylene glycol (EG).
GFS Chemicals: Double distilled sulfuric acid (H2SO4, 96 – 98 wt%) and Perchloric acid
(HClO4, 70 wt%).
Johnson–Matthey: Pt black, carbon-supported Pt (Pt/C) at 40 wt% metal loading and
carbon–supported PtRu (PtRu/C) with Pt at 40 and Ru at 20 wt% metal loadings.
Sigma Aldrich: Poly(vinylpyrrolidone) (PVP) (Mw = 55,000 and 360,000 g mol-1
),
poly(allylamine) (PAA, Mw = 17,000 g mol-1
), 1–methyl–2–pyrrolidone (NMP), Nafion®
perfluorinated ion–exchange resin (Nafion), sodium tetrachloroaurate dihydrate (NaAuCl4∙2H2O,

20
99%), silver nitrate (AgNO3), silver acetate (AgCH3COO), deuterated sulfuric acid (D2SO4, 96 –
98 wt% in D2O), hydrochloric acid (HCl), deuterated perchloric acid (DClO4, 68 wt% in D2O),
hydrogen peroxide (H2O2, 35 wt%), hexanes (>98.5%), methanol (CH3OH, >99.9%).
Warner Graham Company: Ethanol (EtOH, 200 proof).
2.2. Synthetic Methods
2.2.1. Synthesis of Shape Controlled Nanocrystals
The Pt NPs were synthesized in a one–step procedure according to established polyol–
based procedures.68, 90
The NPs ranged from 10 – 12 nm or 5 – 7 nm, depending on the
parameters. In a round bottom flask, 2.5 mL of ethylene glycol (EG) was refluxed for ca. 20 min.
Subsequently, 0.5 mL of 0.002 M or 0.06 M AgNO3 in EG were added to the boiling EG in order
to achieve cubic or octahedral/tetrahedral NPs, respectively. For 10 – 12 nm NPs, 94 μL of 0.375
M PVP (55,000 Mw – 3 mL total) and 47μL of 0.0675M H2PtCl6∙6H2O (1.5 mL total) in EG
were added to the boiling EG solution at 30 s intervals. For smaller 5 – 7 nm particles, 3 mL of
0.375 M PVP (55,000 Mw) then 1.5 mL of 0.0675M H2PtCl6∙6H2O in EG were added to the
boiling EG solution. The reaction solution was refluxed for an additional 10 min then allowed to
cool to room temperature.
2.2.2. Synthesis of PVP Protected Pt/C Nanoparticles
40% Pt/C samples were protected with PVP of 55,000 (PVP55) or 360,000 (PVP360)
molecular weights using a modified one–step procedure according to the polyol based process
described above. In brief, 0.375 M PVP (3 mL total) and 0.0675 M Pt (1.5 mL total) in 40 wt%
Pt/C were added to refluxing 2.5 mL of EG and allowed to reflux for 1 hr before cooling to room
temperature.

21
2.2.3. Purification Procedures
Typically, the reaction solution was centrifuged for 20 min at 6000 rpm to remove the
AgCl precipitate if AgNO3 was used. In order to remove excess EG and PVP, the supernatant
was centrifuged with a triple volume of acetone for 20 min at 6000 rpm until the NPs were
clearly separated. The resulting Pt precipitate was dispersed into ca. 5 mL EtOH via sonication
and then 20 mL of hexanes were added before centrifugation for 20 min at 6000 rpm, which was
repeated at least 3 times until final dispersion into EtOH. One of the following two treatment
methods were applied to the resultant NPs in preparation for EC measurements.
2.2.3.1. Strong Base Method
In batches, the synthesized NPs suspended in EtOH were redispersed into ca. 5 mL of
H2O with 400 – 500 mg NaOH to yield a basic environment that is known to remove a majority
of PVP present on the NPs without damaging the shape. Following overnight exposure to the
basic media, the repetitive centrifugation and precipitation process outlined above was repeated.
2.2.3.2. UV Photo–Oxidation (UVPO) Method
A small proportion of the ethanolic–suspension of NPs was redispersed into about 2 mL
of H2O with 200 – 250 mg NaOH to yield a basic environment. Separately, a basic solution of 10
mL of H2O2 was prepared by adding 200 – 250 mg NaOH and then the solution was bubbled for
at least 10 min with O2 gas. The basic solution of NPs underwent UV irradiation (254 nm) for 1
hr with the addition of ca. 1 mL of O2 saturated H2O2 solution at specific time intervals, typically
every 10 min. After UV exposure, the resultant solution was purified by the repetitive
centrifugation and precipitation process with EtOH and ultimately dispersed in EtOH before
drying overnight in the oven at 60°C.

22
2.3. Experimental Methods
2.3.1. Microscopy Analysis
2.3.1.1. Transmission Electron Microscopy (TEM)
The resultant NPs were characterized by a JEOL-2100 LaB6 microscope at the Nanoscale
Imaging and Spectroscopy Laboratory at UMD College Park or a FEI Tecnai–F30 TEM (FEI,
Holland) at Xiamen University. Selected area electron diffraction (SAED) patterns were
collected for single NPs along with higher resolution TEM images on the FEI Tecnai–F30
model. Shape and size distributions were based on a minimum of 150 counts with the aid of the
ImageJ software.
2.3.1.2. Scanning Electron Microscopy (SEM)
SEM images were taken on a ultra–high resolution SUPRA FE–SEM (Carl Zeiss NTS
GmbH, Germany). NP samples were imaged on grids, identical to the TEM sample preparation,
while the Au film deposited on the Si prism was imaged directly.
2.3.1.3. Atomic Force Microscopy (AFM)
The Nanoscope IIIa Atomic Force Microscope (Digital Instruments, United States)
was used to examine the Au film structure that is deposited on the Si prism. All images were
processed and analyzed with the standard AFM operating software (Nanoscope 4.43r8 and
5.12r3) by Dr. C. Yannette of the Swift Group.
2.3.2. Thermogravimetric Analysis (TGA)
TGA experiments were performed on a SDTQ600 or Q50 TA Instrument. The data were
analyzed with Universal TA Analysis 2000 software to determine weight percent of PVP on the
particle surface. Typically, at least 2 mg of sample was placed into a ceramic pan at room

23
temperature (RT) before the temperature was increased at a rate of 10˚C min-1
to a minimum of
600˚C under a steady flow of nitrogen (20 mL min-1
).
2.3.3. Electrochemical Analysis
Electrochemical (EC) measurements were performed in an Ar–blanketed conventional
three electrode EC cell using a CHI potentiostat (CH Instrument, Inc) that was controlled with
CHI software. The supporting electrolyte solutions were 0.1 M HClO4, 0.1 M H2SO4 and 0.5 M
H2SO4. Commercial Ag/AgCl (1 M) (CH Instrument, Inc) and Pt gauze electrodes were used as
the reference and counter electrodes, respectively. The working electrode was comprised of NPs
that were deposited onto a well–polished 3 mm commercial glassy carbon electrode (GCE)
(BioAnalytical Systems, Inc). The NP deposition involved a dilute suspension of NPs in water
that was drop cast onto the GCE and allowed to air dry.
Cyclic voltammetry (CV) and chronoamperometry (CA) were commonly used to assess
the electrocatalytic activity of the samples. CVs were recorded with a 50 mV s-1
scan rate, unless
specifically noted. The electrode potentials are given in reference to the reversible hydrogen
electrode (RHE) or the Ag/AgCl (1 M) reference electrode, although all data were collected
using the Ag/AgCl. The Ag/AgCl potential, EAg/AgCl, was converted to the RHE potential, ERHE,
using the following equation:
ERHE = EAg/AgCl + Econversion Eqn. 2.1.
The conversion value, Econversion, was determined from the open circuit potential (OCP) of a Pt
wire working electrode and Ag/AgCl reference electrode under gaseous H2 purge for a specific
electrolyte. The currents reported are normalized with respect to the Pt surface area determined
by the hydrogen desorption charge per area. The charge densities, based on Pt single crystal

24
measurements, were 220, 208 and 240 μC cm-2
for polycrystalline, 100 and 111 atomic
arrangements, respectively.91
In a typical experiment, the blank CV was recorded in a potential window until a stable
curve was obtained in the supporting electrolyte. For the shape controlled NPs, it was important
to minimize the surface restructuring due to oxide formation, thus the potential limit was 0.9
VRHE prior to further measurements. Oxidation of adsorbed gaseous carbon monoxide was
performed by holding the potential at 0.0 or 0.1 VAg/AgCl while first saturating the electrolyte with
CO gas for 5 – 10 min oxidation, then purging the solution with Ar gas for 15 – 25 min. Finally,
a CV was recorded within a specific potential window to oxidize or strip the CO from the Pt
surface, which is why this type of measurement is commonly referred to as CO stripping or
COR. CV was employed to measure the intrinsic activity of the Pt particles for the methanol
oxidation reaction (MOR) at 0.1 M or 0.5 M CH3OH concentrations in the electrolytes described
above.
2.3.4. Spectroscopic Analysis
2.3.4.1. UV–Visible Spectroscopy
The UV–Vis spectrophotometer (Agilent 8453) equipped with a photodiode array and a 1
cm quartz cuvette were used to analyze samples in the 200 – 800 nm range. The reference
sample was the solvent, typically EtOH or EG, and NPs were suspended in the reference solvent.
2.3.4.2. Thin Film Fourier Transform Infrared Spectroscopy (FT–IR)
The in situ FT–IR reflection spectroscopic measurements were carried out on a Nexus
870 spectrometer (Nicolet) equipped with an EverGlo IR source and a liquid–nitrogen–cooled
MCT–A detector that was modified to house an EC cell. Potential control was achieved by using
an EG&G 263A potentiostat. The NP suspension was drop cast onto a well–polished GCE that

25
served as the working electrode of the three–electrode IR cell. A saturated calomel electrode
(SCE) and a Pt plate were used as the respective reference and counter electrodes. The thin film
was made when the GCE was pushed against a CaF2 IR window to form a thin layer of solution
(ca. 1 μm). The potential difference spectra were collected during a potential stair step
experiment over the designated potential range. The spectra are shown in the absorbance units
defined as –log [(I – IR)/IR], where I and IR are the spectra taken at the measured and the
reference potentials, respectively. The electro–catalysts were monitored between the potential
step experiments via CV in order to ensure that the system was stable.
2.3.4.3. Attenuated Total Reflection–Surface Enhanced Infrared Absorption Spectroscopy (ATR–
SEIRAS)
The ATR–SEIRAS measurements were collected on a Bruker Vector–22 Infrared
Spectrometer that was modified to house an EC apparatus. The in situ EC measurements were
performed in a modified three electrode EC cell using an EG&G 273A (Princeton Applied
Research) or a CHI potentiostat (CH Instrument, Inc) that was controlled by a computer with
CoreWare (Scribner) or CHI software, respectively. Commercial Ag/AgCl (3M) (CH Instrument,
Inc) and Pt gauze electrodes were used as the reference and counter electrodes, respectively. The
working electrode was comprised of a well–polished Si prism that had a thin Au film chemically
deposited onto the surface.92
The catalysts were deposited directly onto the Au film, in a similar
method to the previously described NP deposition on the GCE for the FT–IR. The same
methodology for FT–IR was used for the ATR–SEIRAS measurements, most notably the
potential step and stability measurements as well as the potential difference method, i.e. –log [(I
– IR)/IR].

26
CHAPTER 3
THE CYCLIC VOLTAMMETRY OF THE METHANOL ELECTRO–OXIDATION ON PT–BASED
ELECTRO–CATALYSTS: HARMONIZING ELECTROCHEMISTRY AND INFRARED SPECTROSCOPY
3.1. Notes and Acknowledgements
This chapter contains work formerly published under: Augusta M. Hofstead–Duffy, De–
Jun Chen, Shi–Gang Sun and YuYe J. Tong, “Origin of the current peak of the negative scan in
the cyclic voltammetry of methanol electro–oxidation on Pt–based electro–catalysts: a revisit to
the current ratio criterion” Journal of Materials Chemistry, 2012, 22, 5205 – 5208.
Tong group research was supported by the NSF (CHE–0923910) and DOE (DE–FG02–
07ER15895), while the Sun group is funded by the NSFC (20921120405, 21021002). D.J.C. was
partially supported through the Chinese Scholar Council (CSC 200963104). The work presented
in this chapter was performed collaboratively at Georgetown University.
3.2. Introduction
This dissertation was focused on fundamental studies to improve the understanding of
surface interactions on Pt electro–catalysts during the MOR. Therefore, it was imperative to
establish a correlation between the EC and interfacial species detected with the newly developed
ATR–SEIRAS instrument.93
The MOR was used a probe reaction to identify the species
contributing to the current profiles observed on carbon–supported Pt at 40 wt% loading (Pt/C)
and carbon–supported Pt:Ru at 40:20 wt% loading (PtRu/C), which exhibit different MOR CV
profiles.17, 49
Moreover, the validity of the current ratio criterion, a common descriptor in the
literature, as a gauge for tolerance to residual carbonaceous species was challenged.53, 94-98

27
A criterion frequently used in the literature to compare CO tolerance and electro–catalytic
activity among Pt–based electro–catalysts for the MOR is the ratio between the peak currents of
the respective anodic (positive) and cathodic (negative) potential scans (PSs), If/Ib, in the MOR
CV.53, 94-98
A CV of the MOR recorded on a commercial 40 wt% Pt/C electro–catalyst illustrates
these current peaks in Figure 3.1. The criterion states that the larger the ratio of If/Ib an electro–
catalyst achieves, the more its CO–tolerance and catalytic activity is improved.
Figure 3.1. The MOR CV on Pt/C recorded in 0.1 M HClO4 + 0.5 M CH3OH. The anodic and
cathodic peak currents are labeled as If and Ib, respectively, and the current beyond the first
anodic peak is labeled as If′.
The origin of such a criterion has generally been attributed to the Manoharan and
Goodenough paper published in 1992 in the Journal of Materials Chemistry.53
The authors
conjectured, in the discussion of a CV similar to Figure 3.1, that Ib ‘‘is primarily associated with
residual carbon species on the surface rather than to the oxidation of freshly chemisorbed
species”. In other words, If does not share the same chemical origin with Ib. If is associated with
freshly chemisorbed species, i.e. the oxidation of freshly CH3OH generated CO that is usually an
intermediate reaction step. The main premises of this assumption were firstly the assignment of
the reaction current beyond the main anodic peak (labeled as If in Figure 3.1) to reaction:

28
Pt=C=O + 2 H2O → Pt–OH + CO2↑+ 3H+ + 3e
- Eqn. 3.1
which was used as the evidence for the existence of the residual carbon species, i.e. Pt=C=O.53
Secondly, it was observed that Ib decreased as the upmost limiting potential of the CV increased.
A careful reading of the original paper and the discussions in the subsequent literature, however,
has convinced us that these premises have been insufficiently justified or rebutted. Further
investigation, therefore, was highly warranted in view of the frequent use of this If/Ib current
ratio criterion.
Figure 3.2. Representative TEM images of the as–received Pt/C (A) and PtRu/C (B) electro–
catalysts provided courtesy of Johnson–Matthey.
In this Chapter, we report a detailed in situ ATR–SEIRAS study of the MOR on two
commercial electro–catalysts (courtesy of Johnson–Matthey), i.e. 40 wt% Pt/C and 40:20 wt%
PtRu/C. The TEM images of the electro–catalysts displayed in Figure 3.2 show that the metal
NPs are similarly sized between 4 and 6 nm on the larger carbon supports. The results presented
here demonstrate that the current ratio If/Ib is an inadequate parameter to gauge the CO–tolerance
and catalytic activity of Pt–based electro–catalysts, thus no longer suitable for this purpose.
Moreover, the resolving power of the combinatorial EC and in situ spectroscopic measurements
is demonstrated for correlating the CV currents with molecular species at the interface, namely
COads and CH3OHads.

29
3.3. Results and Discussion
Figure 3.3 presents the COR (A) and MOR (B) CVs of the as–received Pt/C, unactivated
(as–received) PtRu/C and activated PtRu/C, which were obtained using 0.1 M HClO4 as the
supporting electrolyte and 0.5 M CH3OH for the MOR CVs. The limiting potential in Figure
3.3A was set at 0.7 V to prevent dissolution of Ru from the as–received PtRu/C.99
The MOR CV
of the Pt/C in Figure 3.3B is a reproduction of Figure 3.1 for the ease of comparison. The
activation of the PtRu/C entailed subjecting the sample to multiple potential cycling between
–0.25 and 1.1 V in the presence of 0.5 M CH3OH until a large stable current was reached in the
low potential range of 0.1 – 0.4 V. The activation process adjusted surface components and/or
dissolved surface Ru through which more Pt sites are expected to be exposed, which is suggested
by the increased definition of the hydrogen adsorption/desorption area for activated PtRu/C.50
Figure 3.3. The COR (A) and MOR (B) CVs of the Pt/C (black–solid), unactivated PtRu/C
(blue–dash) and activated PtRu/C (red–dot). The data for the PtRu/C were obtained on the same
sample before and after the activation process.
The COR and MOR CVs of the three samples in Figure 3.3 show the anticipated profiles,
which are in agreement with previously published results of similar systems.41, 50, 100-102
The
significant negative shift of the COR peaks on the PtRu/C as compared to that on the Pt/C in

30
Figure 3.3A is consistent with the bi–functional mechanism and results reported earlier.49, 50, 101,
102 Notice that the width and area of the COR peak on the activated PtRu/C are much narrower
and smaller than those on the unactivated PtRu/C, suggesting faster reaction and higher fraction
of similar CO adsorption sites on the more homogeneous activated surface.
Figure 3.4. The potential difference spectra of the methanol generated COads as a function of
potential on Pt/C (A), unactivated PtRu/C (B) and activated PtRu/C (C) in 0.1 M HClO4 + 0.5 M
CH3OH with the reference spectra at 1.0 V.
As can be seen for the MOR in Figure 3.3B, Ib is comparable to If for the Pt/C, but almost
unobservable for the as–received PtRu/C. Even after activation, Ib on PtRu/C is much smaller
than If. The meaning of this significant decrease in Ib, or complete lack thereof as seen here for
the PtRu/C samples, has been tacitly mentioned in the literature though many questions remain

31
unanswered.31, 35, 103, 104
For the purpose of this work, i.e. identifying the true chemical origin of
Ib, the three samples studied here are good representatives for a wide range of Ib values.
Figure 3.4 shows the in situ ATR–SEIRAS spectra of adsorbed CO (COads) generated
during MOR step measurements from –0.25 to 1.1 to –0.25 V with a potential step of 0.1 V on
the Pt/C, unactivated PtRu/C, and activated PtRu/C samples. For the Pt/C, there was a single
well–defined band whose vibrational frequency varied from ca. 2015 to 2035 cm-1
for the anodic
PS and from about 2040 to 2020 cm-1
for the cathodic PS. These are the typical values for linear
COads on Pt varying due to the Stark tuning effect.50, 102, 105, 106
For the unactivated and activated
PtRu/C, these values are 2005 to 2045 cm-1
and 2025 to 2055 cm-1
for the anodic PS,
respectively, and 2040 to 2015 cm-1
and 2045 to 2030 cm-1
for the cathodic PS, respectively.
Notice that the CO generated during MOR is a result of dehydrogenation of CH3OH, which
occurs predominantly on Pt sites.31, 35, 36
The bands of COads on PtRu/C, however, were split into
two overlapping peaks, which were assigned as COL on Pt and Ru sites with higher and lower
frequency bands, respectively.41, 102, 107
These CO bands were generally broader than those on
Pt/C due primarily to more diversified Pt sites caused by Ru alloying. Remarkably, even though
Ib is negligible for the unactivated PtRu/C, we still detect the presence of COads during the
cathodic PS. This observation indicates that an observation of zero Ib does not necessarily mean
the zero presence of COads.
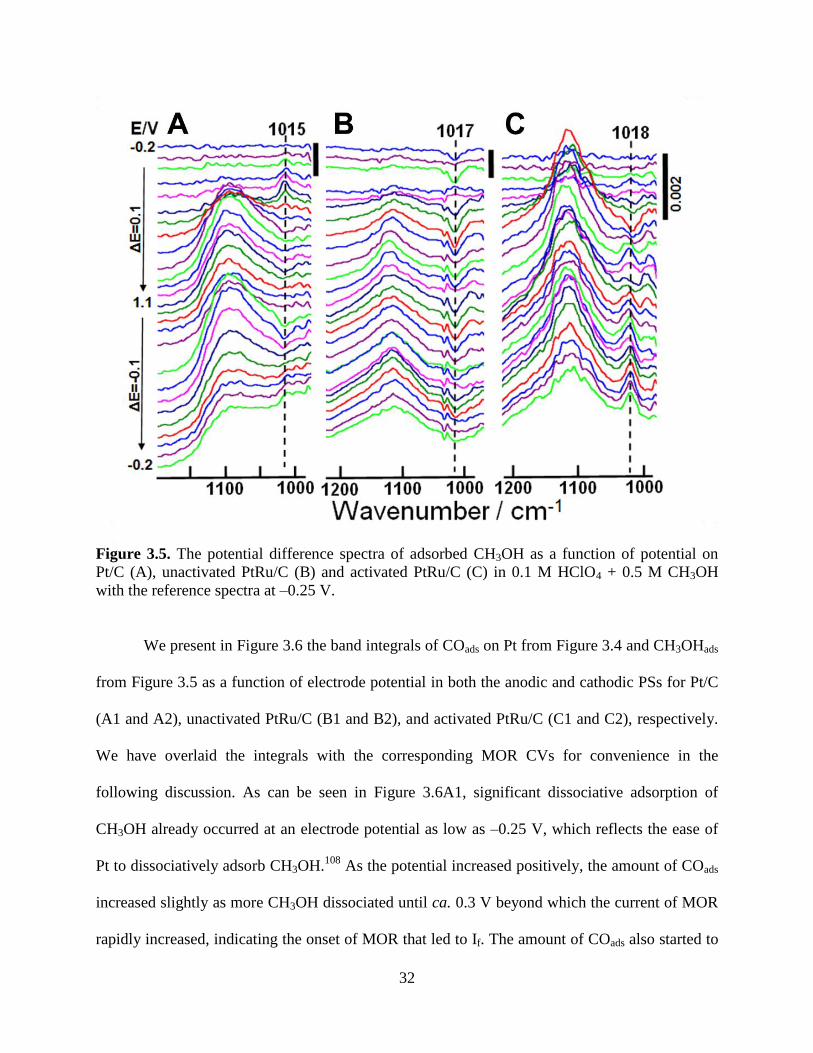
Moreover, the SEIRAS spectra displayed in Figure 3.5 on Pt/C and PtRu/C show a
potential dependent band at ca. 1015 cm-1
in the 0.5 M CH3OH containing 0.1 M HClO4
solution. This band is therefore assigned to the υ(C–O) of the adsorbed methanol (CH3OHads).
This assignment is supported by its current and potential dependent vibration frequency.
32
Figure 3.5. The potential difference spectra of adsorbed CH3OH as a function of potential on
Pt/C (A), unactivated PtRu/C (B) and activated PtRu/C (C) in 0.1 M HClO4 + 0.5 M CH3OH
with the reference spectra at –0.25 V.
We present in Figure 3.6 the band integrals of COads on Pt from Figure 3.4 and CH3OHads
from Figure 3.5 as a function of electrode potential in both the anodic and cathodic PSs for Pt/C
(A1 and A2), unactivated PtRu/C (B1 and B2), and activated PtRu/C (C1 and C2), respectively.
We have overlaid the integrals with the corresponding MOR CVs for convenience in the
following discussion. As can be seen in Figure 3.6A1, significant dissociative adsorption of
CH3OH already occurred at an electrode potential as low as –0.25 V, which reflects the ease of
Pt to dissociatively adsorb CH3OH.108
As the potential increased positively, the amount of COads
increased slightly as more CH3OH dissociated until ca. 0.3 V beyond which the current of MOR
rapidly increased, indicating the onset of MOR that led to If. The amount of COads also started to

33
decrease at –0.3 V, which indicates that this value was also the onset potential for the COR of the
CH3OH generated COads. The amount of COads continued to decrease beyond this point until
being fully oxidized by 0.8 V.
Interestingly, the amount of the CH3OH generated CO on the Pt/C in the cathodic PS as
potential decreased from 1.1 to –0.2 V almost replicated the trend that was observed in the
anodic PS. Since no COads was observed at potentials more positive than 0.8 V in both anodic
and cathodic PSs, the current If′ clearly cannot be associated with reaction 3.1 as originally
proposed.53
Figure 3.6. Band integrals of COads (1) and CH3OHads (2) as a function of potential on Pt/C (A),
unactivated PtRu/C (B) and activated PtRu/C (C) in 0.1 M HClO4 + 0.5 M CH3OH for the
anodic (solid–heavy) and cathodic (open–fine) scans. The heavy and fine curves are for guiding
purposes. The corresponding MOR CVs are overlaid with the band integrals (black–dash).

34
As shown in Figure 3.6A2, during the anodic PS of the MOR CV on Pt/C the amount of
CH3OHads first increased until about 0.3 V, which is the onset potential of MOR as indicated by
the CV. As the current of MOR increased sharply between 0.3 V and the current peak potential
at 0.75 V, the amount of CH3OHads decreased in tandem, but leveled off significantly (even
increased slightly) once the current of MOR decreased beyond 0.75 V. The amount began to
decrease once the current of MOR increased again, leading to If′ at potentials positive to 0.9 V.
Since the SEIRAS measurements indicated clearly that there were no COads at potentials more
positive than 0.8 V, the If′ then must have originated from MOR rather than Eqn. 3.1. In the
cathodic PS started at 1.1 V, the amount of CH3OHads increased as the current of MOR decreased
until about 0.75 V. At this potential, the onset potential of the increasing MOR current, we
observe that the amount of CH3OHads decreased and reached a minimum at the peak potential of
Ib. Beyond this point, CH3OHads increased continuously as the MOR current decreased
eventually to zero.
To review the above discussion, a clear opposite correlation existed between the MOR
current and the amount of CH3OHads on the Pt/C during the MOR CV, i.e. one increased as the
other decreased or vice versa. The amount of CH3OHads showed a nearly perfect opposite
correlation though not necessarily proportional to the rise and fall of the MOR peak current in
Figure 3.6A2. Moreover, the amount of CH3OH–generated COads shown in Figure 3.6A1 did not
show such a correlation. These observations strongly suggest that all the peak currents, If, Ib, and
If′, shared the same chemical origin and were directly associated with ‘‘the oxidation of freshly
chemisorbed species’’, i.e. the oxidation of CH3OHads and not the remaining carbonaceous
species on Pt/C.

35
Despite very different current peak potentials of If and Ib, the same opposite correlations
between the amount of CH3OHads and the MOR current were observed for both unactivated and
activated PtRu/C samples as indicated by the respective arrows in Figure 3.6B2 and C2. As
anticipated, the rise and fall of the CH3OH generated COads showed no correlations with those of
the MOR currents in Figure 3.6B1 and C1. Thus, we can state that the peak currents, i.e. If, Ib,
and If′, shared the same chemical origin and were directly associated with the MOR, but not with
the oxidation of “residual carbon species.” This observation has general ramifications for Pt–
based electro–catalysts.
There are differences, however, between the Pt/C and PtRu/C samples. First, although
CH3OH generated COads was observed at a potential as negative as –0.25 V, its amount
decreased immediately as the potential increased positively. The complete oxidation on PtRu/C
appeared at a potential more negative by ca. 100 mV than that on Pt/C. These observations
indicate more facile oxidation of COads on PtRu/C than on Pt/C. In the cathodic PS, the CH3OH–
generated COads did not appear until the onset of the observable MOR current near 0.5 V. The
corresponding potential on Pt/C was ca. 0.8 V. Unlike the case on the Pt/C, the amount of COads
was much smaller than that generated in the anodic PS, indicating the existence of surface
hysteresis on PtRu/C. Second, the minima of the CH3OHads bands in the cathodic PS in Figure
3.6A2 and C2 are at 0.5 V and 0.3 V for Pt/C and PtRu/C, respectively, which indicates much
higher CO tolerance for the latter.
3.4. Summary
In summary, we have revisited the underlying rationales for the current ratio criterion
through a detailed in situ ATR–SEIRAS study of the MOR on three representative samples, i.e

36
Pt/C, unactivated PtRu/C and activated PtRu/C. Our results have clearly shown that If and Ib
shared the same chemical origin and the current ratio criterion is therefore an inadequate
parameter to gauge CO–tolerance and catalytic activity of Pt–based electro–catalysts for MOR,
thus no longer suitable for this application. We believe that the surface area or mass normalized
values of If and CA current at a given electrode potential in the range of 0.2 or 0.3 V vs.
Ag/AgCl would provide better measures of intrinsic activity for MOR and CO tolerance,
respectively.49

37
CHAPTER 4
LOW INDEX NANOCRYSTALLINE ENSEMBLES OF PT ELECTRO–CATALYSTS PROTECTED BY
POLY(VINYLPYRROLIDONE): AN ELECTROCHEMICAL AND IN SITU FT-IR INVESTIGATION
4.1. Notes and acknowledgements
This work is to be published under: Augusta M. Levendorf, Shi–Gang Sun, YuYe J. Tong.
The results shown were performed at Xiamen University under the guidance of Dr. Shi–Gang
Sun. AML was partially supported by the IRES/DDEP Program (OISE–1130454) and the IMI
Program (DMR–0843934) under the NSF. Sun Group research was funded through the NSFC
(20921120405, 21021002) and research in the Tong Group was supported by the NSF (CHE–
0923910) and DOE (DE–FG02–07ER15895). AML acknowledges the assistance and guidance
from the Sun Group, specifically that of Mr. Jian–Long Lin, Ms. Huang Rui and Mr. Han Jin in
FT–IR, TEM and EC experimentation, respectively.
4.2. Introduction
Single crystal Pt studies have served as the foundation for understanding the MOR
occurring at the anode, which is sensitive to the surface morphology and the exposed
crystallographic planes as outlined in Chapter 1.30-32
These studies have established that the
activity for MOR in acidic media, i.e. HClO4 and H2SO4, increases in the order of Pt 111 <
Pt 110 < Pt 100 for macroscale crystals. Metallic NCs are more attractive for the surface
catalyzed reactions than expensive single crystals because of their unique catalytic properties and
the large surface area to volume ratios.69
Reducing the size of the crystals, however, can
introduce unexpected results, where geometric and electronic effects are presumed to be major

38
contributors.109-111
For example, the MOR trends in acidic media on bulk crystals are reversed for
the trends observed on NCs, i.e. the activity increases in the order of Pt 100 NCs < Pt 110
NCs < Pt 111 NCs.67, 110
Since the pioneering work of El–Sayed that synthesized preferentially controlled Pt NCs,
strategic investigations have been designed to elucidate the relationship between structure and
catalytic activity at the nanoscale.70
A few forerunners in this arena are the Feliu and Sun groups
working with low index and high index surface planes, respectively, of bulk single crystals and
NCs.67, 111
Particle shape has been correlated to the exposed crystallographic planes as shown
earlier in Figure 1.6. Moreover, the CV profiles provide an insight on the atomic arrangement at
the surface.69, 112
Improvements in NC synthesis have enabled fine control of shapes with tunable
size ranges to be synthesized from a diverse array of techniques ranging from thermal
decomposition to potentiometric methods.62, 63, 111
The synthetic route plays a significant role in
the activity and stability of the resultant NCs with the aforementioned modifications in the
geometric and electronic properties.
In this Chapter, we build upon the MOR electro–catalytic activity trends that our group
has observed on low indexed Pt cubes (Pt 100 NCs) as well as octahedrons and tetrahedrons
(Pt 111 NCs) bound chiefly by 100 and 111 surface planes, respectively, that were
synthesized using the polyol method described in Chapter 1.68, 110
Recall that PVP interacts
strongly with the Pt surface, therefore, the eradication of PVP without damaging the structural
integrity of the synthesized NCs has been a challenging endeavor for the electro–catalysis
community.81, 113, 114
Using a strong base treatment to remove most of the surfactant residue, it
was observed that Pt 111 NCs with about 10 to 15 wt% residual PVP showed enhanced MOR
activity compared to polycrystalline Pt black, while Pt 100 NCs were the least active.110
The
39
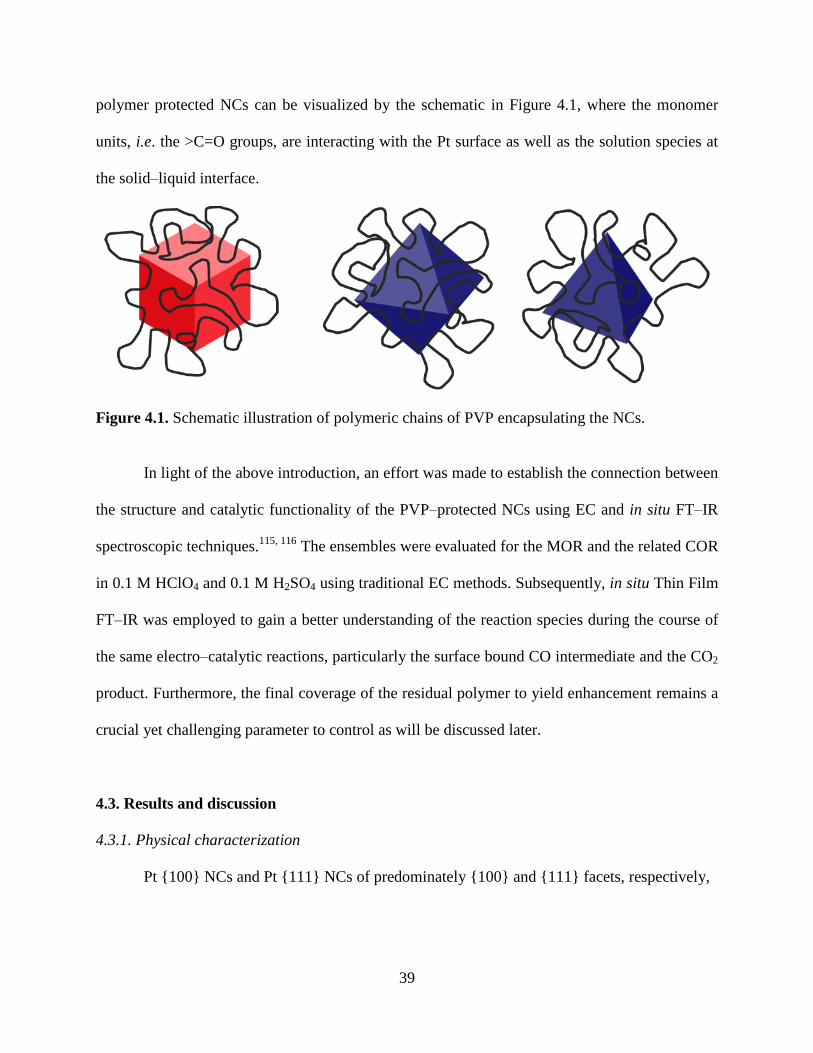
polymer protected NCs can be visualized by the schematic in Figure 4.1, where the monomer
units, i.e. the >C=O groups, are interacting with the Pt surface as well as the solution species at
the solid–liquid interface.
Figure 4.1. Schematic illustration of polymeric chains of PVP encapsulating the NCs.
In light of the above introduction, an effort was made to establish the connection between
the structure and catalytic functionality of the PVP–protected NCs using EC and in situ FT–IR
spectroscopic techniques.115, 116
The ensembles were evaluated for the MOR and the related COR
in 0.1 M HClO4 and 0.1 M H2SO4 using traditional EC methods. Subsequently, in situ Thin Film
FT–IR was employed to gain a better understanding of the reaction species during the course of
the same electro–catalytic reactions, particularly the surface bound CO intermediate and the CO2
product. Furthermore, the final coverage of the residual polymer to yield enhancement remains a
crucial yet challenging parameter to control as will be discussed later.
4.3. Results and discussion
4.3.1. Physical characterization
Pt 100 NCs and Pt 111 NCs of predominately 100 and 111 facets, respectively,

40
were successfully synthesized following a reported polyol–based method.68
The mechanistic
details of regulated growth were discussed in Chapter 1, but in brief the relative growths rates
were controlled through the addition of different Ag+ concentrations into the synthesis mixture.
68
Following repetitive purification via centrifugation, a strong base treatment with NaOH removed
a percentage of PVP from the surface without deforming the morphology. Although the exact
mechanism of removal is unknown, it is likely to proceed through a base–catalyzed hydrolysis
reaction that degrades the polymer ring, thereby, weakening the dominant interaction between
the >C=O of PVP and Pt.82, 117, 118
Figure 4.2. TGA curves of pure PVP (A) compared to the base treated Pt 100 NCs (B) and Pt
111 NCs (C), which highlights the presence of polymer weight loss at 400 to 450°C on the
samples.
The residual polymer on the surface was previously quantified with TGA
measurements.110, 115, 116
The TGA experiments consisted of heating the desired sample to ca.
600 °C and determining the weight loss incurred in the 400 – 450 °C region, which is indicative
of PVP decomposition as seen for the TGA of pure PVP in Figure 4.2A. Here, the estimated
coverage of the PVP based on the weight loss in Figure 4.2 is ca. 7 wt% and ca. 24 wt% for the
Pt 100 NCs and Pt 111 NCs, respectively, following the base treatment. As anticipated from

41
previous studies, PVP seems to have a stronger interaction at the 111 surface sites than 100
that provides greater stability and catalytic enhancement to the Pt 111 NCs.61
TEM images of the synthesized NCs, shown in Figure 4.3, were taken after the base
treatment and demonstrate the benign influence on particle morphology despite the
agglomeration due to loss of surfactant. The Pt 100 NC ensemble was ca. 70% composed of
100 facets, whereas the Pt 111 NC ensemble were ca. 75% bound by 111 surfaces with
average particle sizes of 11.3 ± 1.8 and 9.8 ± 1.7 nm, respectively. The insets in Figure 4.3B, C,
E and F display the selected area electron diffraction (SAED) patterns corresponding to the
higher resolution TEM images of single NPs, which confirm their single crystalline nature,
specifically, the Pt 100 NCs exhibit a 100 arrangement while the Pt 111 NCs display a
hexagonal surface configuration associated with a 111 arrangement.
Figure 4.3. Representative TEM images of synthesized Pt 100 NCs (A–C) and Pt 111 NCs
(D–F) with inset SAED patterns of an individual cube (B, C), octahedron (E) and tetrahedron
(F). The corresponding size and shape distributions are shown for the Pt 100 NCs and Pt
111 NCs following the base treatment.
4.3.2 Electrochemical characterization
A summary of the CV measurements for the commercial Pt black reference, Pt 111
NCs and Pt 100 NCs in 0.1 M H2SO4 and 0.1 M HClO4 are displayed in Figure 4.4. It is

42
important to note that the limiting potential was 1.14 V in the MOR studies in order to minimize
the deformation of the capping agent, which has been shown to act as a promoting agent for the
MOR and FAOR on commercial Pt electro–catalysts.115, 116
Figure 4.4A and 4.4C display the
normal CVs in the unperturbed electrolyte with the anticipated hydrogen redox peaks
corresponding to the morphology in comparison to commercial Pt black, which was the
polycrystalline reference in this study.
Figure 4.4. Normal CVs in 0.1 M HClO4 (A) and 0.1 M H2SO4 (C) and MOR CVs in 0.1 M
HClO4 + 0.1 M CH3OH (B) and in 0.1 M H2SO4 + 0.1 M CH3OH (D) with the corresponding
gaseous CO oxidation curves as insets for Pt black (black–solid), Pt 100 NCs (red–dot) and Pt
111 NCs (blue–dash).
More specifically, the increased 100 terrace sites on the Pt 100 NCs are indicated by
the shoulder that has a more positive potential in the hydrogen region as compared to the other
two samples beyond 0.3 V in both media. The disappearance of the 100 terrace region on the
Pt 111 NCs and lack of a strong 110 peak confirms the distinct morphology difference of

43
these predominately 111 bound NPs that exhibit a strong peak near 0.2 V. Owing to the
presence of PVP on the shape controlled NCs, the sharp redox peaks characteristic of pristine
crystallographic faces are suppressed even in the strongly adsorbing H2SO4 electrolyte, which is
more striking on the Pt 111 NCs with higher PVP coverage.115
Moreover, the lack of sharp
corners on the NCs shown as compared to those published using other synthetic methods, such as
a hydrogen reduction method, should reduce the clarity of the spikes commonly noted in CVs.67,
109, 114 As previously observed with the shaped controlled NCs, the Pt oxidation near 0.8 V was
delayed on the Pt 100 NCs and to a greater extent on the Pt 111 NCs, which is consistent
with single crystal studies as well as the surface being obscured by surfactant.30, 34
The structure sensitivity and reactivity of the COR has been demonstrated on NCs
composed chiefly of 100 and 111 sites.110, 119
The insets of Figure 4.4B and 4.4D show the
CORs, which indicate that COads on the NCs was more difficult to oxidize than the
polycrystalline sample. In the weakly adsorbing HClO4 electrolyte, the 100 and 111 faceted
NC potentials were 0.85 and 0.87 V, respectively, which were higher than the 0.80 V potential
for Pt black. In 0.1 M H2SO4, the electro–catalyst ensemble peak positions shifted to 0.77 V on
Pt black and 0.85 V and 0.90 V for Pt 100 NCs and Pt 111 NCs, respectively, which
covered a wider potential range than that in 0.1 M HClO4. This range is most likely due to the
surface orientation dependence of (bi)sulfate adsorption, whose strength decreases in the order Pt
111 > Pt 100 > Pt 110.37, 120
The stronger the (bi)sulfate adsorption, the more difficult it
becomes to generate oxygen–containing species, thus a more positive potential is needed for the
COR. There was a small overlap of their peaks at similar onset potentials, presumably due to the
small presence of other shapes present in the sample, e.g. about 15 % of the facets were not
111 for the Pt 111 NCs based on the TEM distributions of Figure 4.3. In addition, it is

44
believed that PVP interacts more strongly with the Pt 111 NCs than the Pt 100 NCs, and
thereby could suppress the generation of oxygen–containing species and delay the COR even
further.61
This notion could explain the higher COR peak potential for COads on 111 faceted
NPs compared to the 100 surface in both media.
Separate works, however, indicate little difference, i.e. a potential range of ca. 0.03 V, in
COR peak positions of gaseously COads in 0.1 M H2SO4 when PVP was adsorbed on Pt black
and in 0.5 M H2SO4 as will be discussed in Chapter 5 for PVP–protected carbon–supported Pt
NPs.115, 116
In contrast, there was a large difference, ca. 0.12 V, for the NCs studied here.
Therefore, we believe that the potential shifts are primarily an effect of the morphologically
dependent interactions with COads, anions and not so much an effect of PVP’s presence. The
observations herein suggests that it would be more difficult to electro–oxidize COads on the NCs
at a saturation coverage. However, catalytic activity measurements during the MOR traditionally
yield low CO coverage.
The intrinsic activities of the electro–catalysts for the MOR were investigated using CV
in 0.1 M HClO4 or 0.1 M H2SO4 with 0.1 M CH3OH. The CV current density of the Pt 111
NC ensembles surpassed the Pt black and Pt 100 NCs in both electrolytes. The MOR CVs of
Figure 4.4B in 0.1 M HClO4 display peak current densities of ca. 2.4, 1.5 and 1.0 mA cm-2
for
the Pt 111 NCs, Pt 100 NCs and polycrystalline NPs, respectively. Meanwhile, the MOR
CVs in 0.1 M H2SO4 of Figure 4.4D show lower current densities of ca. 1.9, 1.0 and 0.9 mA cm-2
for the Pt 111 NCs, Pt 100 NCs and Pt black, respectively. As anticipated, the MOR CVs of
the electro–catalysts in Figure 4.4 display lower activity in H2SO4 than HClO4 because the
adsorption of (bi)sulfate anions is greater than perchlorate anions.121, 122

45
As previously reported, the NCs again display a swift and earlier onset for the MOR than
Pt black in both electrolytes.109, 110
This observation suggests an improvement in the MOR by a
non–poisoning intermediate in the low potential window for Pt 111 NCs since it displays an
early onset in both media. This general trend could be related to the electronic influence of PVP
or the surface structure, which could lead to an enhanced oxidation pathway in the low potential
window, perhaps through formic acid or formaldehyde as discussed in the literature.34, 67, 109, 110
Note the coverage of PVP on the Pt 111 NCs is near three times the coverage on the Pt
100 NCs at ca. 7 wt%. In a previous work, we observed over a three–fold increase of the
activity on the Pt 111 NCs over Pt black in both media when the coverage of PVP was ca. 16
wt%, while the Pt 100 NCs were the least active in both media.110
It seems that the PVP has
the ability to promote or inhibit the reaction depending on the surface structure, which will be
discussed in more detail in the subsequent Chapters. This activity comparison stresses the
importance of PVP coverage with this seemingly dual nature of PVP and influence on the
activity.
4.3.3. In situ FT–IR characterization
4.3.3.1. CO Oxidation
Figure 4.5 displays the potential difference spectra for the COR of gaseous COads at
saturation on the electro–catalysts during a stair–step from 0.09 to 1.14 V with a 0.05 V step,
referenced to the upper potential. The spectra clearly indicate the well–documented linearly
bound CO (COL) on all samples with a second lesser band on the Pt 100 NCs in Figure 4.5B
and E and Pt black in Figure 4.5A and D, which is attributed to bridge bound CO (COB). The
COL vibration on Pt black ranged from 2069–2080 cm-1
in 0.1 M HClO4 and likewise ranged
from 2069–2073 cm-1
in 0.1 M H2SO4. The COL band on Pt 100 NCs also showed comparable

46
vibrations between ca. 2063–2070 cm-1
in both media as seen in Figure 4.5B and E. In contrast,
the Pt 111 NCs exhibited initial frequencies that differed by ca. 10 cm-1
in the two electrolytes,
i.e. 2059 and 2050 cm-1
for HClO4 and H2SO4, respectively, which was likely caused by stronger
Figure 4.5. Potential Difference Spectra of gaseously adsorbed CO on Pt black (A, D), Pt 100
NCs (B, E) and Pt 111 NCs (C, F) in 0.1 M HClO4 (A–C) and 0.1 M H2SO4 (D–F) from 0.09
to 1.14 V with a 0.05 V potential step, where the reference was taken at 1.14 V. Spectral ranges
are indicated for CO adsorbed linearly (COL) and bridged (COB).
adsorption of (bi)sulfate anions expected for the 111 surface. The frequencies, however,
converged to similar frequencies of about 2070 cm-1
by the end of the COR. Qualitatively, there

47
is a similarity between the Pt 100 NCs and Pt black with complete oxidation before 0.8 V,
while the Pt 111 NCs were much slower to complete the oxidation, which occurred near 1.0 V.
It is interesting to note the lack of a COB on the 111 faceted ensemble.
The analysis of the normalized integrated COL and CO2 areas as a function of potential
and corresponding Stark tuning plots are displayed in Figure 4.6. As can be seen, the rise of CO2
production correlates well with the decrease of the integrated intensity of the COads band due to
the oxidation process. Integrated areas of CO vibrational bands observed in HClO4, displayed in
Figure 4.6A, indicate a similar onset for COR on Pt black and Pt 100 NCs at ca. 0.5 V with the
oxidation complete before 0.8 V. In contrast, the Pt 111 NCs began a slow oxidation near 0.4
V and a quick descent at 0.8 V with its completion near 1.0 V. Likewise, the integration for COL
in H2SO4 in Figure 4.6C shows a rapid drop at roughly 0.5 V on the Pt 100 NCs and
completion by 0.8 V. In contrast, Pt black and the Pt 111 NCs display a gradual oxidation at
ca. 0.3 V that becomes swift near 0.5 and 0.8 V, respectively, with similar completion potentials
to HClO4.
The analyses of the vibrational frequency dependence on the applied potential, known as
the Stark tuning plots, are displayed in Figure 4.6B and 4.6D. For a specific electrolyte, the COL
stretching frequency was highest for CO on Pt black and lowest for CO on the Pt 111 NCs
with frequency in between for CO on the Pt 100 NCs. Co–adsorbed (bi)sulfate is known to
blue–shift the COL stretching frequency compared to that of COL in HClO4 on Pt 111. A red–
shift, however, in COL stretching frequency was observed here. This occurrence is likely due to
the dilution of overall CO coverage by PVP in HClO4 and a combination of PVP with adsorbed
(bi)sulfate in H2SO4 as it is well–known that decreasing CO coverage decreases the COL
stretching frequency.40, 123
If the local CO coverage does not change or there is no substantial

48
change in molecular dipole–dipole interaction as seen by a given COads molecule, then a positive
electrode potential change will typically lead to a linear blue–shift the COads stretching
frequency, which is defined as the Stark tuning rate. Moreover, the onset of COR will reduce the
amount of COads and if this reduction translates into a universal decrease in local CO coverage,
then a red–shift in COads stretching frequency is expected, leading to the deviation from the
initial linear Stark tuning trend line.
Figure 4.6. The normalized integrated areas as a function of applied potential for gaseously
linear adsorbed CO (solid symbols) and generated CO2 (hollow symbols) in 0.1 M HClO4 (A)
and 0.1 M H2SO4 (C) on Pt black (black–circle), Pt 100 NCs (red–square) and Pt 111 NCs
(blue–triangle). The solid and dotted lines are for guiding purposes. The corresponding Stark
tuning plots with tuning rates for linear CO in 0.1 M HClO4 (B) and 0.1 M H2SO4 (D).
The pattern was followed almost exactly on Pt black, i.e. the onset of deviation from the
Stark tuning trend line coincided with the onset of decreasing CO integrated band intensity. It
was also followed closely on the Pt 111 NCs, where the onset of deviation from the Stark

49
tuning trend line coincided with the onset of the precipitous descent in the CO intensity, but not
with the onset of the slow decline that transpired at much lower potential. In contrast, a clear
deviation from this pattern was observed for COads on the Pt 100 because the onset of deviation
from the linear Stark tuning trend line occurred near 0.3 V, which was about 0.2 V more negative
than the onset of the rapid drop in the CO intensity at ca. 0.5 V.
Moreover, while the range of tuning rates from 19 to 31 cm-1
V-1
for Pt in HClO4 and
H2SO4 are reasonable values, the differences are probably related to their structure and adsorbate
interactions, i.e. anions and polymer.44
According to the Blyholder model for CO, a more
positive increase in applied potential leads to a reduction of charge transfer from the Pt to the
anti-bonding 2п* orbital of CO, thereby increasing the CO bond strength and the frequency
observed.39
This well–documented trend for the Stark tuning rate is followed here, but there is a
striking difference in the initial frequencies of COads at saturation.
In both electrolytes, the vibrational frequency at ca. 0.1 V decreased in the order of Pt
black > Pt 100 NCs > Pt 111 NCs, which is attributed to either the surface structure and/or
polymer influences. In the next Chapter dealing with PVP on commercial Pt/C electro–catalysts
at the same molar ratio used for synthesis here, there was a less than 5 cm-1
difference in
frequencies at the initial potential.115, 116
The large disparity, especially between the
polycrystalline and 111 nano–faceted NCs, suggests that the polymer interactions with
adsorbates alter the frequency likely through variations in dipole coupling and other chemical
effects. The largest difference in the Stark tuning rate between the weak and strong adsorbing
electrolytes was observed for COads on the Pt 111 NCs. This difference is likely a reflection of
the interfacial dependence of the (bi)sulfate adsorption, where the 111 surface shows the
strongest (bi)sulfate adsorption.

50
4.3.3.2. Methanol Oxidation
The potential difference spectra for the CH3OH–generated CO from the MOR on the
electro–catalysts during a stair–step from 0.09 to 1.04 V with a 0.1 V step referenced to the
upper potential are displayed in Figure 4.7. Comparable to the COR spectra, the polycrystalline
NPs and Pt 100 NCs exhibit COL and COB vibrational bands, while the Pt 111 NCs only
display the COL. The lower vibrational band in the 1800 cm-1
region is indicative of COB. In
HClO4, the Pt black, Pt 100 NCs and Pt 111 NCs displayed a COL frequency range of 2029–
2060, 2017–2051 and 1995–2023 cm-1
, respectively, as shown in Figure 4.7A–C. For H2SO4
shown in Figure 4.7D–F, the frequencies range from 2027–2064, 2014–2044 and 2004–2053
cm-1
on the Pt black, Pt 100 NCs and Pt 111 NCs, respectively. These COads vibrational
bands follow a similar trend as seen in the COR, namely that the COads stretching frequency was
lowest on the 111 faceted NCs and greatest on Pt black.
The oxidation trends for COads on the Pt samples during the in situ FT–IR measurements
are summarized in terms of their normalized band areas in Figure 4.8A and C as well as peak
positions in Figure 4.8B and D as a function of applied potential. In the weakly adsorbing
HClO4, the oxidation of COL on Pt black began quickly, while on the Pt 100 NCs there was a
slow oxidation near 0.4 V before rapid decline about 100 mV afterwards. On the Pt 111 NCs
the swift oxidation process was delayed to 0.6 V and completes at ca. 1.0 V, which suggests that
111 would be the least CO tolerant. It is well accepted, however, that the 111 surface is the
most tolerant to CO poisoning and displayed the highest MOR activity as discussed above,
which strongly implies the increased MOR activity is attributable to an enhanced direct pathway,
i.e. the non–CO generating pathway.30, 67, 110

51
Figure 4.7. Potential Difference Spectra of methanol-generated adsorbed CO on Pt black (A, D),
Pt 100 NCs (B, E) and Pt 111 NCs (C, F) in 0.1 M HClO4 + 0.1 M CH3OH (A–C) and 0.1 M
H2SO4 + 0.1 M CH3OH (D–F) from 0.14 to 1.04 V with a 0.1 V potential step with the reference
taken at 1.14 V. Spectral ranges are indicated for linearly CO (COL).
The initial accumulation of COL on the NPs increased in the order of Pt 111 NCs < Pt
black < Pt 100 NCs. In other words, the Pt 100 NCs showed a maximal coverage of COL
before the polycrystalline and Pt 111 NCs. This observation agrees with reports stating that the
111 plane is more tolerant to CO poisoning.30, 110
Despite the differences in their oxidation

52
potentials in HClO4, there is little difference observed in H2SO4 as nearly each sample begins the
COL oxidation at ca. 0.5 V and reaches completion before 1.0 V. During the buildup of COL on
the surfaces, however, the same trend for HClO4 is observed as the Pt 100 NCs accrue COL
faster than Pt black and the Pt 111 NCs. Additionally, the simultaneous oxidation of CO and
production of CO2 was observed as in the COR previously discussed.
Figure 4.8. The normalized integrated areas as a function of applied potential for methanolic
adsorbed CO (solid symbols) and generated CO2 (hollow symbols) in 0.1 M HClO4 + 0.1 M
CH3OH (A) and 0.1 M H2SO4 + 0.1 M CH3OH (C) on Pt black (black–circle), Pt 100 NCs
(red–square) and Pt 111 NCs (blue–triangle). The solid and dotted lines are for guiding
purposes. The corresponding Stark tuning plots with tuning rates for adsorbed CO in 0.1 M
HClO4 + 0.1 M CH3OH (B) and 0.1 M H2SO4 + 0.1 M CH3OH (D).
The Stark tuning plots presented in Figure 4.8B have similar tuning rates of 84, 88 and 78
cm-1
V-1
for the polycrystalline, Pt 100 NCs and Pt 111 NCs in HClO4, respectively. In
Figure 4.8D, the tuning rates in H2SO4 for Pt black, Pt 100 NCs and Pt 111 NCs are 96, 103

53
and 109 cm-1
V-1
, respectively. As anticipated, these Stark tuning rates are much larger than
those observed during the COR in Figure 4.6B and D. This increase is rationalized by lower CO
coverage and two mutual blue–shift effects: the increase in CH3OH–generated CO, i.e. the CO
coverage; and the positive potential shift.
In contrast to observations of gaseously COads for COR in Figure 4.6B and D, the onset of
deviation from the linear Stark tuning trend line coincided with the onset of the decrease of
CH3OH–generated COads in all cases. Although the Stark tuning rates are larger in H2SO4 than in
HClO4 for all three samples, the Pt 111 NCs again showed the greatest difference, which is
consistent with (bi)sulfate adsorption and the higher coverage of PVP. Note the oxidation
process changes the optical properties of the thin–layer, which usually leads to baseline
variations of the IR spectra and consequently uncertainty in spectral analyses. Therefore, the
present investigation was hindered by not being able to observe the behavior of other
intermediates in more detail, specifically the species associated with the direct pathway.
4.4. Summary
In summary, the activities of low indexed Pt electro–catalysts were investigated using EC
and in situ FT–IR measurements for the MOR in two acidic electrolytes. Our studies suggest that
nano–faceted ensembles comprised of ca. 70 % preferential planes can have their intrinsic
activity enhanced or suppressed depending on the coverage of polymer as well as supporting
electrolyte, with increased activity due most likely to the enhanced direct reaction pathway for
MOR. Ensembles of Pt 111 NCs exhibited increased MOR activity, while Pt 100 NCs
displayed decreased activity compared to Pt black. Moreover, the importance of surfactant
coverage was discussed as it relates to the activity of NPs synthesized using polyol–based routes.

54
Thus, surfactant coverage on electro–catalytic samples deserves more attention as coverage can
dramatically alter the resultant activity.
Furthermore, in situ FT–IR spectroscopy also displayed the structure effect of difference
crystallographic planes by monitoring COads at saturation and low coverage. Spectral analysis of
the band areas showed the accumulation of COads on the Pt 111 NCs was inhibited compared
to the other samples, despite the difficulty to oxidize CO at saturation coverage. These FT–IR
observations are linked to the swift rise of the onset potential and prolonged activity in the low
potential limit of the MOR on the NCs, though there was no clear separation of the influence of
surfactant and nano–faceted ensembles.

55
CHAPTER 5
THE EFFECT OF POLY(VINYLPYRROLIDONE) WITH DIFFERENT MOLECULAR WEIGHTS ON
CARBON SUPPORTED PT ELECTRO–CATALYSTS FOR THE METHANOL ELECTRO–OXIDATION
5.1. Notes and acknowledgements
This work was previously published as: Augusta M. Hofstead–Duffy, De–Jun Chen, YuYe
J. Tong, “An in situ Attenuated Total Reflection–Surface Enhanced Infrared Absorption
Spectroscopic Study of Enhanced Methanol Electro–oxidation Activity on Carbon–Supported Pt
Nanoparticles by Poly(vinylpyrrolidone) of Different Molecular Weights” Electrochimica Acta,
2012, 82, 543-549.
The research was supported by the NSF (CHE–0923910) and DOE (DE–FG02–
07ER15895). DJC was partially supported through the Chinese Scholar Council (CSC
200963104). AMH thanks Dr. O. Love from the Tong group for assistance with TGA analysis.
5.2. Introduction
Preferential shape and size control is a significant advancement for electro–catalytic
applications since we can take advantage of both the reaction selectivity offered by controlled
surface orientation and the high surface areas offered by the nanoscale size.56
The past two
decades of research has allowed for particles of unique shapes and sizes to be synthesized
reproducibly from a wide array of techniques.61, 68, 70, 76, 111
For instance, polyol–based methods
provide a scalable method that include a polymeric material, i.e. PVP, during the reduction of Pt
precursors to metal NPs. This synthetic route yields NCs that are protected by PVP as shared in

56
Chapter 4, which makes the influence of surface morphology and/or surfactant role in the
activity and stability difficult to distinguish.
The final surfactant coverage is a challenging parameter to control and the complete
removal of residual PVP without structural damage to the NCs remains a difficult task as
demonstrated in Chapter 4.81, 113, 114
As discussed previously, PVP is utilized as a shape control
and/or a stabilizing agent to prevent agglomeration of particles and is known to interact with
metal surface chiefly through its carbonyl, >C=O, moeity of the polymer that is detectable in the
IR region.80, 82
As illustrated in Figure 5.1, the polymer structure is randomly oriented about the
NP and the molecular weight of the polymer reflects the average chain length of the polymer. As
a surfactant, it has the ability to prohibit or promote surface sites from participating in the
reaction through an electronic and/or geometric effect, while providing stability to the NCs.83, 86,
110, 124
Figure 5.1. Illustration of Pt particles with different polymer structures based on the polymer
molecular weight, i.e. pristine Pt, low molecular weight PVP of 55,000 g mol-1
and high
molecular weight PVP of 360, 000 g mol-1
.
The purpose of this study was to isolate the effect of PVP on a commercial Pt electro–
catalyst using the MOR and related adsorbed gaseous CO electro–oxidation reaction (COR)
since it is difficult to completely remove PVP without morphological deformation.110
The

57
influence of different molecular weights, that is the more frequently used 55,000 Mw (PVP55)
and a heavier chain of 360,000 Mw (PVP360), on commercial carbon–supported 40 wt% Pt
(Pt/C) were probed using EC methods to determine their electro–catalytic effects. In situ ATR–
SEIRAS experiments were used to interrogate the polymer’s influence under the prescribed
reaction conditions. Moreover, a previous work with commercial Pt black modified with PVP
showed significant reactivity enhancement in both MOR and the FAOR.84
The challenging
removal and observed enhancements with PVP convinced us to further explore the possibility of
using surfactants as both a stabilizer and activity promoter for metal electro–catalysts.85, 86, 110, 125
5.3. Results and discussion
5.3.1. Physical Characterization
Figure 5.2. TGA curves of as-synthesized PVP55–Pt/C (red–dot) and as–synthesized PVP360–
Pt/C (blue–dash), which highlights the presence of polymer weight loss at 400 to 450°C on the
samples. The inset displays the TGA curve for the base treated PVP360–Pt/C, which highlights
the decrease of polymer weight loss at 400 to 450°C on the treated compared as–synthesized
sample.

58
Based on the thermograviometric (TGA) experiments displayed in Figure 5.2, the
polymer coverage was ca. 50 and 60 wt% for the as–synthesized PVP55–Pt/C and as–
synthesized PVP360–Pt/C samples, respectively. The NaOH treated PVP360-Pt/C, which was
used in the activity and spectroscopy measurements, was roughly 6 wt% of the heavier polymer,
i.e. 360,000 g mol-1
.
5.3.2. Electrochemical Characterization
CV was used first to probe the interfacial and electro–catalytic modifications of the
commercial Pt/C following surfactant adsorption. Figure 5.3A displays the normal CV curves for
Pt/C, PVP55–Pt/C and PVP360–Pt/C NPs recorded in 0.5 M H2SO4 supporting electrolyte. The
Pt/C exhibited hydrogen redox peaks corresponding to 110 and 100 sites at ca. 0.13 and
0.25 V, which were suppressed in the presence of the adsorbed polymer as seen with other works
and our previous study with PVP on Pt black.83, 84, 124, 126
The EC surface area of the Pt NPs,
which was determined by the hydrogen desorption charge per area of 220 μC cm-2
, was used to
normalize the reported current densities and provide a basis of comparison for electro–catalytic
activity.91
The catalysts were cycled below 0.86 V to minimize surface restructuring before
increasing the high limiting potential for oxidation reactions.
The inset of Figure 5.3A shows the COR CV curves for the samples, where we assume
full coverage of CO on available Pt sites because of the lack of hydrogen desorption peaks prior
to the COR. The peak potentials are 0.858, 0.843 and 0.887 V for Pt/C, PVP55–Pt/C and
PVP360–Pt/C, respectively. Based on this result, there is a slight improvement in COR at nearly
full CO coverage with PVP55 and a decline with PVP360 compared to Pt/C. The broader widths
of the CO peak for polymer–modified samples suggests an increased number of adsorption

59
modes, which is most likely due to the polymeric chains randomly distributed across the Pt
surface.
Figure 5.3. Normal CVs in 0.5 M H2SO4 (A) and MOR CVs in 0.5 M H2SO4 + 0.5 M CH3OH
(B) of Pt/C (black–solid), PVP55-Pt/C (red–dot) and PVP360–Pt/C (blue-dash). Inset of A shows
the gaseous CO oxidation curves, while inset of B displays the CA measurements performed at
0.36 V vs RHE for 1800 s.
The MOR activities for the Pt/C and PVP–modified Pt/C samples are illustrated in the
CVs of Figure 5.3B. No effort was taken in this study to optimize the PVP coverage needed to
obtain an intrinsic reaction enhancement of 150% when Pt black was modified with PVP55.84
Therefore, the commercial Pt/C provided the highest current peak density of 0.583 mA cm-2
in
Figure 5.3B. As anticipated, the heaviest polymer, PVP360, affected the Pt/C activity the most
with ca. 36% decrease in the peak current. Meanwhile, the PVP55–Pt/C lost ca. 7% of its
activity relative to the pristine Pt/C. Simultaneously, the PVP–modified samples exhibited a
negative potential shift of the peak from 0.905 V on the Pt/C to 0.855 and 0.865 V on the
PVP55–Pt/C and PVP360–Pt/C, respectively. The Pt/C, PVP55–Pt/C and PVP360–Pt/C
exhibited similar values for the onset potential of 0.367, 0.373 and 0.393 V, respectively. The
polymer–modified Pt/C, however, showed less blocked hydrogen adsorption sites and yielded
the swiftest rise in current following the onset with the fastest rate on PVP55–Pt/C as seen in

60
Figure 5.4. The latter implies the decreased production of poisonous CO. Indeed, the CA curves
recorded at 0.36 V as shown in the inset of Figure 5.3B suggest CO tolerance improves with
polymeric weight, which were performed in the onset potential region of the electro–catalysts.
The EC experiments in the past and current studies have clearly demonstrated the ability
of PVP to affect the surface conditions and the reaction.84, 110
Interestingly, the polymer
adsorption does not render the electro–catalyst inactive for the MOR. The enhanced CO
tolerance as seen in the CA measurements and rapid current output in the low potential region in
the MOR CV curves by the PVP–modified samples compared to the Pt/C suggests that the
reaction species on the Pt/C surface are being altered by the surface–bound polymer. Our
previous in situ FT–IR investigation on PVP–modified Pt black focused on the vibrational trends
and reactions kinetics of COads and CO2 formation.84
In this work in situ SEIRAS was employed
in an effort to further elucidate and develop plausible explanations related to the modifications of
detectable intermediates and supporting electrolyte interactions in the presence of polymer.
Figure 5.4. Onset potential normalized anodic scan of the MOR CVs in 0.5 M H2SO4 + 0.5 M
CH3OH of Pt/C (black–solid), PVP55–Pt/C (red–dot) and PVP360–Pt/C (blue–dash), which
highlights the early onset of the MOR on the PVP–modified samples.

61
5.3.3. ATR–SEIRAS Characterization
5.3.3.1. CO Oxidation
Figure 5.5 displays the potential difference spectra for the oxidation of gaseously COads
on the Pt/C, PVP55–Pt/C and PVP360–Pt/C during a stair–step measurement from –0.06 to 1.46
V with a 0.05 V step with high (A–C) and low potential references (D–F). The high referenced
Figure 5.5. The potential difference spectra in 0.5 M H2SO4 during the oxidation of adsorbed
gaseous CO on Pt/C (A and D), PVP55–Pt/C (B and E) and PVP360–Pt/C (C and F) with the
reference taken at 1.46 V (A–C) and 0.06 V (D–F). The spectral ranges are indicated for CO
adsorbed as atop, bridged, hollow and multi–bound modes, which are designated as COL, COB,
COH and COM, respectively. The bands attributed to the carbonyl moiety of PVP, >C=O, the
bending mode of water, δ(HOH), and adsorbed (bi)sulfate anions (HSO4-) are labeled.

62
spectra in Figure 5.5A consist of the well–documented linearly bound CO (COL) band, whose
Pt/C frequency ranges from 2045–2070 cm-1
, and a second lesser band attributed to bridge
bonded CO (COB) that shows a vibrational range from 1860–1910 cm-1
. Additionally, the Pt/C
exhibited a small hump towards the ends of the oxidation process near 1855 cm-1
at 0.81 V,
which is associated with CO adsorbed at hollow sites, COH.127
Figure 5.6 shows an example of
the deconvoluted peaks of COads that highlights the bridged and hollow modes. CO was oxidized
from the surface as the potential increased stepwise to 1.46 V with complete oxidation at ca.
1.05 V.
Similar adsorption modes to COads on Pt/C are visible in the spectra of PVP55–Pt/C and
PVP360–Pt/C in Figure 5.5B and Figure 5.5C, respectively. The spectra, however, is more
complex due to the presence of additional vibration modes belonging to PVP. COL provided the
dominant band that ranged between 2045–2060 cm-1
and 2010–2080 cm-1
for the PVP55–Pt/C
and PVP360–Pt/C, respectively, with the latter showing a large red–shift at potentials below
0.7 V as seen in Figure 5.8B. A red–shift was also observed for the COB band in the presence of
polymer compared to the pristine Pt/C with frequency ranges from 1850–1885 cm-1
and 1840–
1895 cm-1
with PVP55 and PVP360, respectively. The corresponding COH hump was also red–
shifted ca. 30 cm-1
to 1829 and 1826 cm-1
at 0.5 V for the PVP55–Pt/C and PVP360–Pt/C,
respectively, according to the deconvoluted spectra in Figure 5.6. A small peak located at
approximately 1700–1710 cm-1
appeared on PVP55–Pt/C that we attributed to a multi–bound
CO, COM.127
In addition to COads, the polymer’s carbonyl, >C=O, exhibited a strong vibration
centered at 1668 and 1678 cm-1
for PVP55 and PVP360, respectively.
The spectra are referenced to the low potential in Figure 5.5D–F, where we can observe
species between 1800 and 950 cm-1
. PVP exhibited bands at ca. 1450 and 1300 cm-1
associated

63
Figure 5.6. Deconvolution of the potential difference spectra for bridged (COB)and hollow
(COH) modes of adsorbed CO at 0.5 V in 0.5 M H2SO4 during the oxidation of adsorbed gaseous
CO on Pt/C (A), PVP55–Pt/C (B) and PVP360–Pt/C (C) with the reference taken at 1.46 V.
with the vibrations of its several moieties, i.e. CH3 and CH2.61, 82
Two adsorption modes of the
(bi)sulfate anion, HSO4-, from the supporting electrolyte on each electro–catalyst were observed
near 1200 and 1100 cm-1
, which have been identified as the three–fold and two–fold modes.128
Notice that the (bi)sulfate anion band appeared much earlier on PVP360–Pt/C than on the other
two samples and was dominated by the two–fold mode. More relevant for the CO oxidation is
the direct observation of the bending vibrational mode of water, δ(HOH), at ca. 1614, 1602 and
1597 cm-1
on the Pt/C, PVP55–Pt/C and PVP360–Pt/C, respectively. The PVP55–Pt/C oxidized
CO completely near 1.05 V in a similar fashion to the Pt/C. The COL on the PVP360–Pt/C,
however, remained on the surface until the high potential limit, which is consistent with the slow
decreasing current tail of the CO stripping peak in the inset of Figure 5.3A. On the other hand,
COB on PVP360–Pt/C was completely oxidized about 50 mV higher than COB on Pt/C and
PVP55–Pt/C.

64
5.3.3.2. Methanol Oxidation
The spectra shown in Figure 5.7 summarize the oxidation of CH3OH on the Pt/C,
PVP55–Pt/C and PVP360–Pt/C during the stair–step measurement with high and low potential
references in Figure 5.7A–C and 5.7D–F, respectively. The high referenced Pt/C spectra in
Figure 5.7A displays a COL band with a frequency range from 2010–2026 cm-1
. The COL band
was also observed in the spectra of the PVP55–Pt/C in Figure 5.6B and PVP360–Pt/C in Figure
5.7C that ranged between 1991–2045 cm-1
and 1988–2072 cm-1
, respectively. In addition, no
bridge–bound CO was observed except for PVP55–Pt/C that exhibited a small peak, most likely
COB, at 1797–1787 cm-1
. Complete oxidation of COL occurred by ca. 1.05 V on the Pt/C and
PVP55–Pt/C as in the gaseously adsorbed CO oxidation and similarly COL lingered on the
PVP360–Pt/C to the high potential limit.
The low referenced spectra of Figure 5.7D–F indicate that the principal adsorption mode
of HSO4- on the Pt/C and PVP360–Pt/C was the two–fold centered near 1100 cm
-1. It seems that
CH3OH had restricted the modes for the supporting electrolyte on the Pt/C more so than the
gaseous CO at saturation. Alternatively, the three–fold and two–fold modes at ca. 1200 and 1100
cm-1
were observed on the PVP55–Pt/C just as in the gaseous CO oxidation. Again, we observed
δ(HOH) at ca. 1595 cm-1
on each electro–catalyst. The >C=O of the PVP55–Pt/C and PVP360–
Pt/C is centered at 1668 and 1678 cm-1
, which showed similar behavior to the >C=O during the
gaseous CO oxidation. Unfortunately, similarities between plausible methanol intermediates
vibrations are indistinguishable from the overlapping polymer bands in the same region as
previously mentioned in the discussion of the CO oxidation.

65
Figure 5.7. The potential difference spectra in 0.5 M H2SO4 + 0.5 M CH3OH during the
methanol oxidation on Pt/C (A and D), PVP55–Pt/C (B and E) and PVP360–Pt/C (C and F) with
the reference taken at 1.46 V (A–C) and 0.06 V (D–F). The spectral ranges are indicated for CO
adsorbed as atop and bridged, which are designated as COL and COB, respectively. The bands
attributed to the carbonyl moiety of PVP, >C=O, the bending mode of water, δ(HOH), and
adsorbed (bi)sulfate anions (HSO4-) are labeled.
5.3.3.3. Influence of PVP Molecular Weights
Figure 5.8 summaries the oxidation trends of COads on the electro–catalyst during the in
situ ATR–SEIRAS measurements in terms of the normalized band areas (A, C, E) and peak
positions (B, D, F) as a function of applied potenial. Figure 5.8A indicates the oxidation of COL
began on the PVP360–Pt/C near 0.4 V, whereas the oxidation on the other two samples was
delayed ca. 0.2 V. Although, the oxidation onset was first achieved with PVP360, the reaction

66
was incomplete until 1.41 V, well beyond the 1.1 V potential for complete oxidation on Pt/C and
PVP55–Pt/C. The vibrational frequency dependence on the applied electric field, commonly
refered to as the Stark tuning effect, for each sample is plotted in Figure 5.8B. The tuning rates
of 36 and 28 cm-1
V-1
are reasonable values for the Pt/C and PVP55–Pt/C given their COL
oxidation similarities.44
In contrast, the PVP360–Pt/C exhibits dual tuning rates below ca. 0.8 V.
The initial rate of 48 cm-1
V-1
changes drastically near 0.4 V to a slope of 70 cm-1
V-1
that
coincides with the onset for COL oxidation. Moreover, we observe a red–shift of the COL
vibration on both the PVP55–Pt/C and Pt/C coincident with the onset of major COR on these two
samples, but the vibration continued to blue–shift on PVP360–Pt/C.
The corresponding COB band areas in Figure 5.7C, also, highlights the disparity among
the three samples. There were small band area variations at potentials less than 0.6 V likely due
to non–oxidative local adsorbate reorganization because no changes in Stark tunng rates were
observed in Figure 5.8D. The main oxidation occurred beyond 0.6 V with the Pt/C and PVP55–
Pt/C following the same COR pattern that began ca. 50 mV sooner than that of the PVP360–
Pt/C. The COR on the Pt/C and PVP55–Pt/C was completed near 1.0 V, while PVP360–Pt/C
near 1.1 V. Figure 5.8D displays the Stark plots for COB, which clearly demonstrates decreased
vibrational freqency as polymer Mw increased. Interestingly, the PVP360–Pt/C and Pt/C share a
similar tuning rates of ca. 60 cm-1
V-1
, but the PVP55–Pt/C shows a lower rate of 44 cm-1
V-1
.
Each electro–catalyst showed an immediate red–shift of COB frequency near 0.85 V at which the
major COR occured, which was not observed for COL on the PVP360–Pt/C.
Additionally, Figure 5.8 recapitulates the methanolic–COL on the samples to emphasize
the different trends from the saturated CO coverage discussed above. As shown in Figure 5.8E,
CO bands appeared on all three samples at the lowest potential, which indicates that they were

67
all active towards dissociatively adsorbed methanol in the order PVP55 > Pt/C > PVP360. The
amount of methanolic–CO increased incrementally as potential shifted positively until reaching
the potential at which the generated CO began being oxidized. Although the onset potential of
COR for methanolic–CO on the Pt/C was as low as 0.3 V, the initial COR was relatively slow
until it joined the descending curve of the PVP55–Pt/C at ca. 0.7 V, whose onset potential was
0.6 V. The most positive onset potential for COR of methanolic–CO at 0.65 V was observed on
the PVP360–Pt/C and similar to that of COB. It is clear from the plot that the methanolic–COL on
the PVP360–Pt/C also remained on the surface until the high potential, just as with gaseous COL.
The Stark plots in Figure 5.8F shows that the vibrational frequencies red–shifted, which was
probably due to lower CO coverage that led to weaker dipole–dipole interaction among COads.
Interestingly, the PVP55 and PVP360 shared very high tuning rates of 73 and 93 cm-1
V-1
,
respectively, which were nearly double the value obtained for the clean Pt/C. The PVP36 exerted
a stronger influence on the vibrational shift than the PVP55. Moreover, there is no evidence of a
sudden red–shift of the COads frequency in the presence of a polymer chain. This observation
suggests that the COR of methanolic–CO might proceed along the peripheries of CO islands.
In an effort to elucidate the direct effect of PVP on surface species, the normalized band
integrals of COL, δ(HOH) and >C=O on individial electro–catalysts were plotted as a function of
applied potential and shown in Figure 5.9. As noted in the spectral analysis, the major difference
between the pristine Pt/C in Figure 5.9A and polymer–modified Pt/Cin Figure 5.9B and C was
the appearance of a >C=O stretching mode. Interestingly, the >C=O moiety behaves similar to
COads and seems to experience an oxidation–like process with an onset near 0.3 V on both the
PVP55–Pt/C and PVP360–Pt/C in Figure 5.9B and C, respectively. The >C=O, however, of
PVP360 undergoes an additional stage at ca. 0.8 V, which ultimately leads to its readsorption on

68
the surface. The unique interaction between the Pt surface and >C=O leads to additional changes
in behavior of COads and δ(HOH).
Figure 5.8. The normalized integrated areas as a function of applied potential and the
corresponding Stark tuning plots with tuning rates for linear CO (A and B) and bridged CO (C
and D) in 0.5 M H2SO4 during the gaseous CO oxidation and for methanolic–linear CO (E and F)
in 0.5 M H2SO4 + 0.5 M CH3OH during the methanol oxidation for Pt/C (black–circle) PVP55–
Pt/C (red–square) and PVP360–Pt/C (blue–triangle).
The band areas of Figure 5.9A and D lack a coherent pattern between the band areas of
δ(HOH) and COL as the latter was being oxidized from the surface to form CO2. Nonetheless,
water is a critical component to COR and coincidentally in the presence of polymer there were

69
Figure 5.9. The normalized integrated areas as a function of applied potential for the bending
water mode (δHOH) (blue-triangle), linearly bound CO, COL (black–circle) and the carbonyl
moiety of PVP, >C=O (red–square), on Pt/C (A and D), PVP55–Pt/C (B and E) and PVP360–
Pt/C (C and F) in 0.5 M H2SO4 during the gaseous CO oxidation (A–C) and in 0.5 M H2SO4 +
0.5 M CH3OH during the methanol oxidation (D–F).
noticeable correlated changes in the δ(HOH) and >C=O bands during the COR. In contrast to the
Pt/C, the results for the polymer–modified samples show an increase in the δ(HOH) mode that
reached a maximum at ca. 0.8 V before decaying to nearly its original surface coverage at high
potential. Increased adsorption of water coincided with the COR and the oxidation–like proccess
of >C=O, which suggests that water was being activated on the surface via intereaction with the
polymer. Similar trends are noted during the oxidation of methanolic–COL, most notably the
correlation between the uptake of δ(HOH) and >C=O.

70
The main difference between the PVP55–Pt/C and PVP360–Pt/C is that the former did
not show a readsorption of >C=O at high potential as the enhanced adsorption of water was
returning to its original level, but the latter did. The onset potentials of the readsorption of >C=O
on the PVP360–Pt/C in Figure 5.9C and F coincided with the potentials at which the Stark tuning
rate showed a change of value at high potential in Figure 5.8B and F, respectively. This
observation in Figure 5.8B and F provides a rational explanation for the continous blue–shift in
vibrational frequency as the amount of COads was decreasing via the COR as the potential
increased, which is quite counterintutive. We believe that the continuous readsorption of >C=O
forced the remaining COL to form rather close packed islands that led to a continuous blue–shift
in COL vibration frequency as potential increased.
5.4. Summary
In summary, the study herein investigated the effect of PVP55 and a longer chain of
PVP360 on Pt/C during the MOR and related gaseous CO oxidations. The electro–catalysts were
probed using EC methods to determine the enhanced long–term CO tolerance of the polymer–
modified samples and small hindrance to the intrinsic activity of Pt/C. In situ ATR–SEIRAS
experiments were used to determine the polymer’s behavior under the prescribed reaction
conditions. We noted the increased adsorption of water in the presence of polymer that coincided
with the oxidation of COads and was strongly correlated to the desorption of surface–bound
>C=O of PVP. This observation may underline the enhanced long–term CO tolerance seen
during the MOR since activated water is a critical component of the reaction. The notable
differences between the adsorbate trends are indicative of adsorbed polymer interactions with the

71
surface, but more interestingly is the strong dependence of the polymer molecular weight Mw
that led to qualitatively different behavior. Understanding the effects of adsorbed PVP on
electro–catalytic reactions is of both fundamental and practical importance due to its widespread
use in syntheses NCs targeted for fuel cell applications.

72
CHAPTER 6
THE INFLUENCE OF PREFERENTIAL SURFACE STRUCTURE OF PT NANOCRYSTALS:
ELECTRO–CATALYSTS FOR THE METHANOL OXIDATION REACTION
6.1. Notes and acknowledgements
This chapter contains work to be published by: Augusta M. Levendorf, Christopher L.
Rom, Yangwei Liu, De–Jun Chen and YuYe J. Tong. The research was supported by the NSF
(CHE–0923910) and the DOE (DE–FG02–07ER15895). AML received support from the NSF
(OISE–1130454) and CLR was supported by a GUROP 2013 summer research grant.
6.2. Introduction
Single crystal Pt studies have served as the foundation for understanding the MOR, which
is sensitive to the surface morphology and the exposed crystallographic planes.30-32
Macroscale
Pt studies have established the activity trends and mechanistic details, however, metallic NCs are
more attractive for practical applications.17, 57, 58, 69
At the nanoscale, the MOR activity increases
in the order of Pt 100 NCs < Pt 110 NCs < Pt 111 NCs.67, 110
Strategic investigations by
Feliu et al., Sun et al. and others continue to probe the relationship between structure and
catalytic activity at the nanoscale.62, 65, 67, 70, 111, 112, 129
In this chapter, we build upon electro–
catalytic activity trends of low indexed NCs with in situ ATR–SEIRAS to gain a molecular
understanding of the adsorbed intermediates and interfacial water on the different surface
morphologies during the course of the reactions.
The work presented herein used a polyol method to synthesize low indexed Pt cubes (Pt
100 NCs) and octahedrons and tetrahedrons (Pt 111 NCs) that are bound chiefly by 100

73
and 111 surface planes, respectively.68, 110
In addition to synthetic control of the shape that has
been correlated to the exposed crystallographic planes as discussed in Chapters 1 and 4,
evaluating the atomic arrangement at the surface is of paramount importance.69
Detailed EC
investigations reported by Feliu et al. have established methods that allow for in situ
characterization of the surface order using irreversible adatom adsorption that more accurately
describes the surface atomic arrangement.67, 112, 130
In view of the recent findings that adsorbed PVP can enhance MOR on Pt through
surface water activation and increasing the direct pathway discussed in Chapters 4 and 5, a
strong effort was made to separate the effect of PVP from that of surface atomic arrangement by
effectively removing the polymer using a UV photo–oxidation technique, which has been a
challenging endeavor.81, 113, 114
TEM and adatom adsorption that will be discussed later, were
useful to qualitatively and quantitatively probe the surface sites on the Pt electro–catalysts. The
ensembles were evaluated for the MOR and the related COR in 0.5 M H2SO4 using the
conventional EC methods and in situ ATR–SEIRAS to correlate activity with reaction
intermediate species.
6.3. Results and discussion
6.3.1. Physical Characterization
Size and shape distributions of the synthesized NCs are displayed in Figure 6.1 along
with representative TEM images. The shape of the particle suggests the existence of preferential
surface planes, i.e. cubes display 100 planes whereas the octahedrons and tetrahedrons exhibit
111 planes. The average size of the Pt 100 NCs and Pt 111 NCs were 10.9 ± 1.4 nm and
11.6 ± 2.0 nm, respectively, with over 70% yield of the desired shape obtained. More

74
specifically, 71.2% of the particles from the Pt 100 NCs were cubes with 100 facets, while
73.2% of the Pt 111 NCs were either octahedrons or tetrahedrons with 111 facets.
Figure 6.1. Representative TEM images of the Pt100 NCs (A) and Pt111 NCs (B)
synthesized along with size and shape distributions based on a minimum of 150 counts. S, C, O
and T denote spherical and random shapes, cubes, octahedrons and tetrahedrons, respectively.
The high degree of monodispersity of the synthesized NCs in Figure 6.1 is attributed to
the presence of residual PVP on the particles following the first purification procedure. Using
thermal analysis, the weight loss due to the decomposition and/or desorption of the remaining
polymer as a function of increasing temperature provides insight into the amount of PVP present
on the particle surface. Figure 6.2 summarizes the TGA measurements performed on the as–
synthesized and UVPO treated NCs. Pure PVP decomposes between 400 and 450°C in the TGA
as indicated by the inset of Figure 6.2B. Thus, the surfactant accounts for 7 wt% and 12 wt% on
the as–synthesized Pt 100 NCs and Pt 111 NCs as seen by the weight loss from 375 to
425°C in

75
Figure 6.2A. Following the unique liquid phase UVPO treatment, the NCs in Figure 6.2B
exhibit no weight loss in this temperature range, which strongly suggests no polymer is present
on the surfaces and are similar to as–received commercial Pt black.
Figure 6.2. TGA curves of as–synthesized (A) and UV treated (B) Pt 100 NCs (red) and Pt
111 NCs (blue) along with unaltered Pt black (black). The inset of B displays the TGA curve
for pure PVP (purple), which highlights the absence of polymer weight loss at 400 to 450°C on
the UVPO treated compared to the 7 wt% and 12 wt% presence of PVP on the as–synthesized Pt
100 NCs and Pt 111 NCs, respectively (A).
Despite the effectiveness of the UVPO method at removing PVP, the adverse effect of
UV exposure on the surface atomic arrangement has been cautioned in the literature.114, 131
There
were no observable changes of the size and shape of the NCs before and after UVPO treatment
as noted by TEM, although the particles were more agglomerated. As mentioned shape suggests
surface arrangement of the NCs, however, it is by no means evidence for the surface
arrangement.131
Moreover, TEM is an ex situ method with a small sample size of the much larger
ensemble that will be used for electro–catalysis. Fortunately, Pt surface structure can be
qualitatively and quantitatively probed in situ using EC analysis of surface reactions and
respective charge distributions.
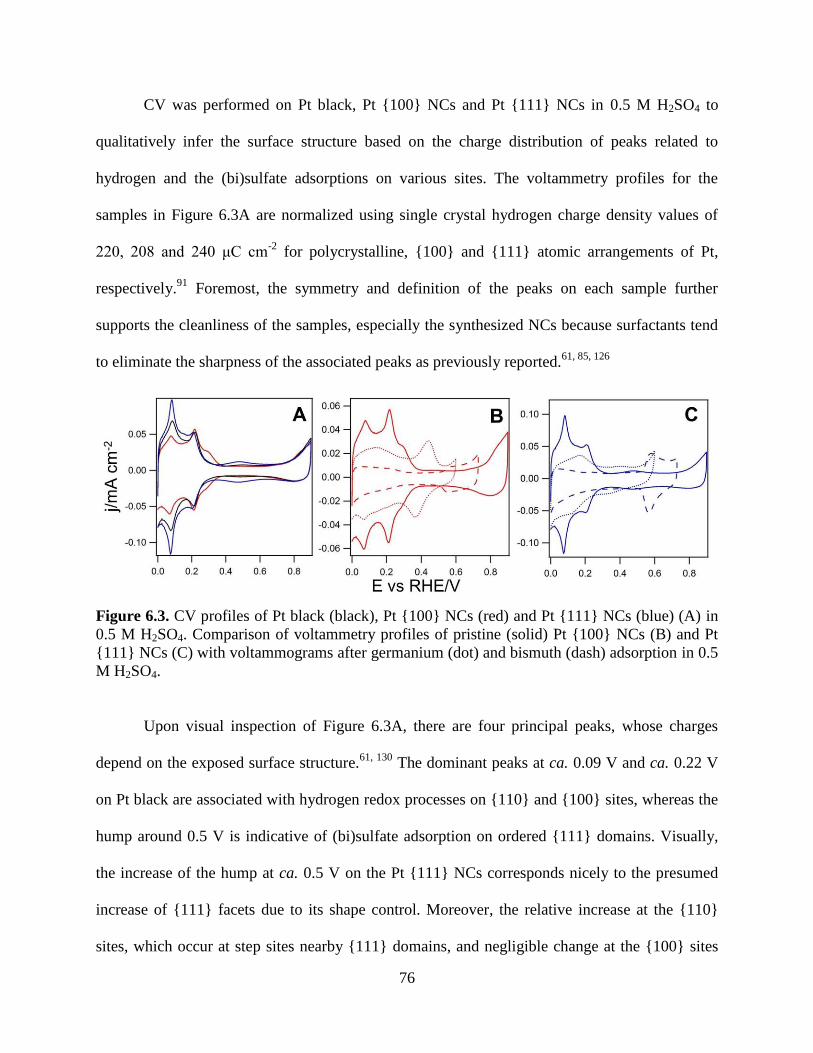
76
CV was performed on Pt black, Pt 100 NCs and Pt 111 NCs in 0.5 M H2SO4 to
qualitatively infer the surface structure based on the charge distribution of peaks related to
hydrogen and the (bi)sulfate adsorptions on various sites. The voltammetry profiles for the
samples in Figure 6.3A are normalized using single crystal hydrogen charge density values of
220, 208 and 240 μC cm-2
for polycrystalline, 100 and 111 atomic arrangements of Pt,
respectively.91
Foremost, the symmetry and definition of the peaks on each sample further
supports the cleanliness of the samples, especially the synthesized NCs because surfactants tend
to eliminate the sharpness of the associated peaks as previously reported.61, 85, 126
Figure 6.3. CV profiles of Pt black (black), Pt 100 NCs (red) and Pt 111 NCs (blue) (A) in
0.5 M H2SO4. Comparison of voltammetry profiles of pristine (solid) Pt 100 NCs (B) and Pt
111 NCs (C) with voltammograms after germanium (dot) and bismuth (dash) adsorption in 0.5
M H2SO4.
Upon visual inspection of Figure 6.3A, there are four principal peaks, whose charges
depend on the exposed surface structure.61, 130
The dominant peaks at ca. 0.09 V and ca. 0.22 V
on Pt black are associated with hydrogen redox processes on 110 and 100 sites, whereas the
hump around 0.5 V is indicative of (bi)sulfate adsorption on ordered 111 domains. Visually,
the increase of the hump at ca. 0.5 V on the Pt 111 NCs corresponds nicely to the presumed
increase of 111 facets due to its shape control. Moreover, the relative increase at the 110
sites, which occur at step sites nearby 111 domains, and negligible change at the 100 sites

77
due to edges and corners demonstrates the preferential order on the surface as 111 facets. In
contrast, the Pt 100 NCs show hardly any anion adsorption indicating the absence of 111
domains, which is further confirmed by the decrease of the current peak related to the 110 sites
and increase of the current assigned to 100 sites. Furthermore, the presence of the current at
ca. 0.3 V indicates the increase in 100 terrace sites that are absent on the Pt black and Pt 111
NCs. Qualitatively, the charge distribution of the voltammetry results approximates that indeed
the atomic surface structure corresponds with the shape of the particles.
For a more quantitative analysis of the atomic arrangements, the particles were probed in
situ using irreversible adatom adsorption of Bi and Ge.130
As described in the literature, the
charge of the Bi redox peak occurring at ca. 0.58 V is proportional to the number of 111
terrace sites, and likewise, the charge from Ge at ca. 0.46 V is related to the 100 terrace sites.
The voltammetry results for the Pt 100 NCs and the Pt 111 NCs are displayed in Figure
6.3B and C, respectively. The propensity for Bi to adsorb more on the Pt 111 NCs and less on
the Pt 100 NCs, while the inverse was observed for Ge adsorption, is additional confirmation
to the preferential surface structure obtained. Following the necessary adjustments, the adatom
charge is correlated to the hydrogen charge of the original voltammetry results, which provides a
percentage of the adatom sensitive sites, i.e. the surface structure.
Figure 6.4 summarizes the quantitative results of the TEM with select HRTEM images
and adatom adsorption measurements, which clearly indicate that the shape controlled NCs are
dominantly composed of the desired facet with long range order. More specifically, the Pt 100
NCs are ca. 40% comprised of 100 terrace sites, which are nearly double the number of 111
sites. Meanwhile, the Pt 111 NCs show ca. 50% being 111 terrace sites. For comparison, the
adatoms were adsorbed on the polycrystalline Pt black, which exhibited no preference for the
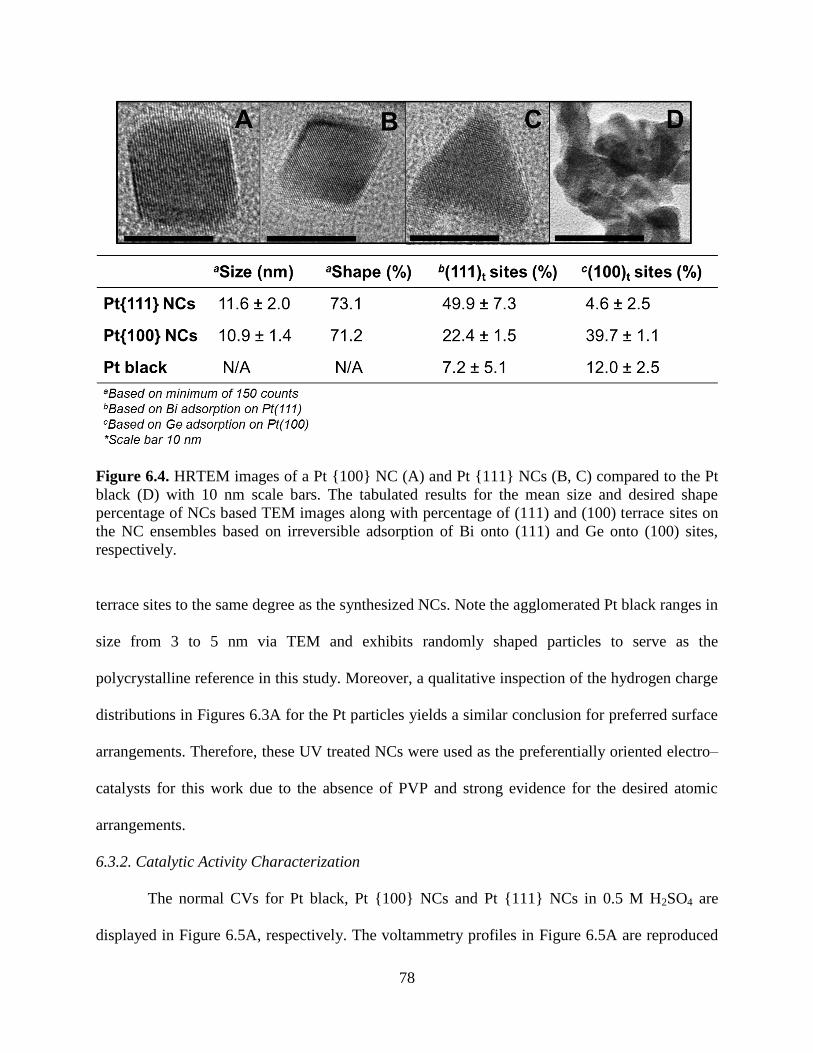
78
Figure 6.4. HRTEM images of a Pt 100 NC (A) and Pt 111 NCs (B, C) compared to the Pt
black (D) with 10 nm scale bars. The tabulated results for the mean size and desired shape
percentage of NCs based TEM images along with percentage of (111) and (100) terrace sites on
the NC ensembles based on irreversible adsorption of Bi onto (111) and Ge onto (100) sites,
respectively.
terrace sites to the same degree as the synthesized NCs. Note the agglomerated Pt black ranges in
size from 3 to 5 nm via TEM and exhibits randomly shaped particles to serve as the
polycrystalline reference in this study. Moreover, a qualitative inspection of the hydrogen charge
distributions in Figures 6.3A for the Pt particles yields a similar conclusion for preferred surface
arrangements. Therefore, these UV treated NCs were used as the preferentially oriented electro–
catalysts for this work due to the absence of PVP and strong evidence for the desired atomic
arrangements.
6.3.2. Catalytic Activity Characterization
The normal CVs for Pt black, Pt 100 NCs and Pt 111 NCs in 0.5 M H2SO4 are
displayed in Figure 6.5A, respectively. The voltammetry profiles in Figure 6.5A are reproduced

79
from Figure 6.3A for ease of discussion. As described above, the dominant 110 and 100
sites occur at ca. 0.09 V and ca. 0.22 V on Pt in H2SO4, while the hump at ca. 0.5 V is indicative
of anion adsorption on the (111) planes and the bump at ca. 0.3 V is characteristic of (100)
terraces.
Figure 6.5. Normal CVs in 0.5 M H2SO4 (A) and MOR CVs in 0.5 M H2SO4 + 0.5 M CH3OH
(B) of Pt black (black), Pt 100 NCs (red) and Pt 111 NCs (blue). Insets show the gaseous
CO oxidation in 0.5 M H2SO4 (A) and the CA measurements over 1800 s at 0.5 V in 0.5 M
H2SO4 + 0.5 M CH3OH (B).
The oxidation of gaseously COads, commonly referred to as CO stripping, on Pt black, Pt
100 NCs and Pt 111 NCs in 0.5 M H2SO4 are displayed in the inset of Figure 6.5A. The
peak potentials in H2SO4 are 0.78 V, 0.76 V and 0.86 V for Pt black, Pt 100 NCs and Pt 111
NCs, respectively with the earliest onset of oxidation occurring on the Pt 100 NCs at 0.60 V,
which is ca. 200 mV earlier than the other two samples. As observed previously, Pt 111 NCs
required the highest potential in order to oxidize COads, while the Pt 100 NCs showed the
broadest peak widths.110
The low onset of CO oxidation on Pt 100 NCs in contrast to the

80
difficulty of oxidation on the Pt 111 NCs would suggest that Pt 100 NCs would be more
active in the electro–oxidation of CH3OH than the Pt 111 NCs in H2SO4.
Upon investigation, however, the intrinsic activity trends for the MOR are not
corresponding to the CO stripping trend, which is apparent from the MOR CVs displayed in
Figure 6.5B. There is a notable structure–activity gap between bulk and nanoscale single crystal
electro–catalytic trends, which continues to be investigated in the literature. For example, bulk
single crystal studies show that Pt 111 exhibits the lowest onset and lowest transient current
for the MOR, while displaying the best CO tolerance compared to Pt 100 single crystals.32, 59,
67 The Pt 111 NCs were more active than the Pt 100 NCs with Pt black in between the two
synthesized samples in H2SO4, which is consistent with previous reports by our group and others
with nanoscale single crystals.67, 110
The onset for oxidation was earliest on the Pt 111 NCs as
well.
Interestingly, the activity in H2SO4 of the Pt 100 NCs treated with the UVPO method
yield a much higher activity than those that retain residual PVP using a different treatment
method discussed in earlier in Chapter 4 and a previously published work.110
Although, the Pt
111 NCs display only slightly improved activities to that report with the surfactant being
present, this confirms the MOR enhancement is a result the ensemble of 111 nano-facets as
was proposed in Chapter 4. Moreover, the insets of Figure 6.5B show the CA measurements
recorded at 0.5 V for 1800 s that follow literature trends for CO tolerance. More specifically, the
greatest tolerance is on the Pt 111 NCs followed by Pt black and lastly the Pt 100 NCs. In
situ ATR–SEIRAS measurements were performed on the electro–catalysts to distinguish the
surface intermediates behavior as it relates to the EC observations in an effort to understand the
activity differences.

81
6.3.3. ATR–SEIRAS Characterization
6.3.3.1. CO Oxidation
The potential difference spectra for the oxidation of gaseous COads in 0.5 M H2SO4 on Pt
black, Pt 111 NCs and Pt 100 NCs during a potential step measurement with 0.1 V steps
from 0 V to 1.2 V are displayed in Figure 6.6 with 1.2 V as the reference. The spectra exhibit the
characteristic linearly bound CO (COL) and bridge bound CO (COB) with frequency ranges from
ca. 2000 cm-1
to 2050 cm-1
and ca. 1850 cm-1
to 1900 cm-1
, respectively, independent of surface
structure. The small band at centered about 1700 cm-1
on the Pt 111 NCs and Pt 100 NCs
has been assigned to multi-bound CO (COM).127
There is a strong bending water vibration on the
Pt surfaces between 1615 cm-1
and 1610 cm-1
labeled as δ(HOH) that is strongest on the Pt black
and weakest on the Pt 100 NCs.
Figure 6.6. Potential dependent ATR–SEIRAS spectra for gaseously adsorbed CO on Pt black
(A), Pt111 NCs (B) and Pt100 NCs (C) in 0.5 M H2SO4 with the reference spectra recorded
at 1.2 V.
Additional confirmation of surface cleanliness is seen by the comparable spectral features
below 1800 cm-1
, i.e. the absence of polymeric bands that were noted in Chapter 5. PVP has been

82
shown to interact mostly through the carbonyl, >C=O, group on the surface of Pt.82
Fortunately,
the >C=O stretching vibration exhibits a prominent IR band between 1660 cm-1
and 1680 cm-1
,
which is indicative of surface adsorbed PVP as discussed in the aforementioned chapter.85
No
such band was observed on the Pt surfaces studied here. Furthermore, the lack of polymer
vibrations related to CH3 and CH2 moieties at 1450 cm-1
and 1300 cm-1
, respectively, support the
effective removal of the surfactant.
Figure 6.7. Normalized integrated areal intensities as a function of applied potential for linear
(COL), bridged (COB) and bending water (HOHbending) during the CO oxidation on Pt black (A),
Pt 111 NCs (B) and Pt 100 NCs (C) in 0.5 M H2SO4. Corresponding potential dependent
frequencies of the COL (circle) and COB (square) on Pt black (black), Pt 111 NCs (blue) and Pt
100 NCs (red) in 0.5 M H2SO4 (D).
Figure 6.7 summaries the CO oxidation trends for the normalized integrated band areas
for COL, COB and δ(HOH) on the electro–catalysts as function of the applied potential in H2SO4.
The overriding contributor to the trends seems to be the Pt metal because the COads behavior is
similar for the three surfaces even though the three have distinct atomic structures. Nonetheless,
COL is more easily oxidized than COB as noted in previous studies with Pt.43, 46
The decrease of
δ(HOH) in the cathodic step experiment corresponds well with the oxidation of COads as has
been reported.85
The COL band intensity decreases slightly below ca. 0.6 V in the so–called pre–
ignition region before the rapid decrease signals quick oxidation or the ignition region.

83
Simultaneously, the COB intensity remains largely unchanged until swift oxidation occurs
beyond ca. 0.6 V. Interestingly, the band intensity of the COB on Pt 100 NCs increases at ca.
0.4 V that is corresponding to the pre–ignition occurring with COL, which suggests CO
conversion process.
It should be noted that CO stripping curves of Figure 6.5 show complete oxidation just
before 1.0 V on the Pt 111 NCs, while for Pt black and Pt 100 NCs it is near 0.85 V in
H2SO4. In contrast the spectra of Figure 6.6 and intensity analysis of Figure 6.7 show complete
oxidation of COads occurring between 1.0 V and 1.1 V in for the electro–catalysts. The disparity
can be attributed to the homogeneous distribution of the lingering CO on the surface that has
high surface mobility instead of the less mobile compact island structure.43
This is most likely
the result of CO adsorption occurring in the hydrogen underpotential deposition (upd) region at 0
V for the IR measurements instead of the 0.3 V located in the double layer. This can lead to
partial oxidation of COads at active sites of weakly bound COL or CO vicinal to these active sites
in the pre–ignition region and surface reorganization with interfacial water, i.e. hydroxyls, just
beyond 0.8 V can lead to large spatial coverage of residual CO species before oxidation is
completed. Moreover, the lack of a δ(HOH) band near 1630 cm-1
indicates that water is
substantially hydrogen bonded in the water adlayer as would be anticipated in an expansive yet
small coverage of COads dispersed over the surface of mostly water.132
The potential dependent frequency shifts show comparable behavior for COL and COB on
the three surfaces, as shown in Figure 6.7D. One could argue a slight modification on the Pt
100 NCs in the presence of (bi)sulfate with much lower tuning rate of 37 cm-1
V-1
for COL in
H2SO4 than the 55 cm-1
V-1
and 58 cm-1
V-1
for Pt black and Pt 111 NCs, respectively. Despite
the evidence for different surface arrangements and in turn the catalytic activities, there is little

84
variability detected by ATR–SEIRAS for these adsorbed species at the high coverage of COads
during the CO stripping measurements.
6.3.3.2. Methanol Oxidation
The potential dependent spectra displayed in Figure 6.8 summarize the oxidation of
CH3OH on Pt black, Pt 111 NCs and Pt 100 NCs during a step measurement from 0 V to 1.2
V to 0 V with 0.1 V potential steps. Spectra shown in Figure 6.8A–C are referenced to the upper
potential of 1.2 V, which is shown as a flat line. In contrast to the CO stripping spectra, the
Figure 6.8. Potential dependent ATR–SEIRAS spectra during the MOR on Pt black (A and D),
Pt 111 NCs (B and E) and Pt 100 NCs (C and F) in 0.5 M H2SO4 + 0.5 M CH3OH with the
reference spectra recorded at 1.2 V (A–C) and at 0.0 V (D–F).

85
CH3OH–generated COads exhibits a lone COL band between 2000 cm-1
and 2060 cm-1
, except on
Pt 100 NCs that display an additional COM peak at ca. 1700 cm-1
. Moreover, there are two
δ(HOH) bands observed during the MOR at ca. 1610 cm-1
and ca. 1650 cm-1
. The former is
assigned to the surface adsorbed water as in the previous section, while the latter has been
attributed to the bending of bulk water.133, 134
From the low referenced spectra shown in Figure 6.8D–F, additional adsorption trends
for intermediate species can be analyzed for the MOR on the Pt surfaces. The presence of a peak
at ca. 1320 cm-1
is related to the υ(OCO) vibration that is indicative of formate present on the
surface at the limiting potential. Formate is considered to be a reactive intermediate in the MOR
pathway, which occurs in the high potential region.38
CH3OHads was detectable at ca. 1015 cm-1
on the electro–catalysts similar to that observed on the commercial samples used in Chapter 3.
Figure 6.9. Potential dependent ATR–SEIRAS spectra of CO2 produced during the MOR on Pt
black (A), Pt 111 NCs (B) and Pt 100 NCs (C) in 0.5 M H2SO4 + 0.5 M CH3OH with the
reference spectra recorded at 0.0 V.
Moreover, from Figure 6.9, the production of CO2 can be observed albeit the molecule
diffuses rapidly from the surface making direct comparison of the oxidized COads and CO2 only a

86
qualitative observation. Moreover, production of CO2 parallels the CO oxidation for the anodic
and cathodic scans in the potential range that CO oxidizes, i.e. potentials beyond 0.6 V, which is
consistent with previous works using the Thin Layer model.84
This diffusion is swiftest in the
strongly adsorbing H2SO4, which presumably forces out lingering CO2 more effectively than
weakly adsorbing electrolytes, i.e. HClO4.
The summary of the MOR trends are displayed in Figure 6.10. As anticipated from the
results of the CO stripping on the electro–catalysts, the potential dependent frequency shifts
show comparable behavior for COL as illustrated in Figure 6.10D. The tuning rates for the anodic
(Ano) and cathodic (Cath) directions are quite similar, which is most likely a manifestation of the
surface being composed of Pt, e.g. Pt black exhibits 57 cm-1
V-1
for both scans.
Figure 6.10. Normalized peak intensities as a function of applied potential for linear CO (black–
circle), interfacial bending water (blue–triangle) and bulk bending water (red–diamond) during
the MOR on Pt black (A), Pt 111 NCs (B) and Pt 100 NCs (C) in 0.5 M H2SO4.
Corresponding potential dependent frequencies of the anodic COL (solid–circle) and cathodic
COL (open–circle) on Pt black (black), Pt 111 NCs (blue) and Pt 100 NCs (red) in 0.5 M
H2SO4 (D).
The peak intensities for COL, interfacial δ(HOH) and bulk δ(HOH) at ca. 2000 to 2050
cm-1
, ca. 1610 cm-1
, ca. 1650 cm-1
, respectively, for the electro–catalysts as function of the
applied potential is provided in Figure 6.10A–C. As mentioned above, for the anodic scan of the
CO stripping, the δ(HOH) at the interface decreases with the simultaneous oxidation of CH3OH–

87
generated COads. The decrease in the interfacial δ(HOH) intensity is also concurrent with the
oxidation of COads during the MOR, most clearly on the Pt black and Pt 111 NCs for both the
anodic and cathodic scans. Bulk δ(HOH) trends do not directly relate to the oxidation trends
since their intensities continue to rise over the potential range. Interestingly, there is a slight
decrease in the bulk δ(HOH) mode in the anodic scan near 0.5 V on Pt 111 NCs. The previous
Chapter showed that the interfacial δ(HOH) was activated in the presence of PVP on commercial
Pt/C, however, in a different study on core–shell NPs the δ(HOH) was insufficient to identify
water activation.41, 85
Figure 6.11. Potential dependent ATR–SEIRAS spectra of the water vibrations (υ(OH)) during
the MOR on Pt black (A), Pt 111 NCs (B) and Pt 100 NCs (C) in 0.5 M H2SO4 + 0.5 M
CH3OH with the reference spectra recorded at 0.0 V.
This prompted investigation into the stretching water, υ(OH), modes between 2500 and
4000 cm-1
, which are displayed in Figure 6.11. Interfacial water has been shown to exhibit three
major stretching modes, υ(OH), depending on the degree of hydrogen bonding, i.e. non–
hydrogen bonded or free water at ca. 3600 cm-1
, weakly hydrogen bonded water at ca. 3400 cm-1

88
and strongly hydrogen bonded or ice–like water at ca. 3000 cm-1
.41, 132, 133
Therefore, the υ(OH)
region was analyzed in order to distinguish the water species, i.e. the activated surface water.
Among the three different types of water in the υ(OH) region, the free water at ca. 3600
cm-1
shows a consistent potential dependence on the Pt surfaces. This is illustrated in Figure
6.12, with the simultaneous oxidation of CH3OH–generated COads and increase of formate
indicated by the υ(OCO) with a decrease in the non–hydrogen water υ(OH) in the anodic scan.
This activated free water corresponds well to the δ(HOH) at 1650 cm-1
of the free water as
discussed above in Figure 6.10. The weakly and strongly hydrogen bonding water showed an
incremental increase over the entire potential range without strong potential dependence.
Figure 6.12. Potential dependent ATR–SEIRAS spectra of the linear CO (black–circle),
interfacial bending water (blue–triangle), non–hydrogen bonded water (purple–square) and
formate (gold–bowtie) during the MOR on Pt black (A), Pt 111 NCs (B) and Pt 100 NCs
(C) in 0.5 M H2SO4 + 0.5 M CH3OH with the reference spectra recorded at 1.2 V.
It is possible as was observed during the CO stripping spectra that the COads remains
relatively mobile on the surface at low coverage since it is CH3OH–generated. The υ(OH) at
3600 cm-1
has been argued to be the activated water at the Pt surface or interfacial water that is
interacting with the COads on the Pt surface.43, 135, 136
Here, it is plausible that this band is linked

89
with the direct pathway of the MOR, which has been suggested to proceed through the formate
intermediate. This can be substantiated by the relative intensities of the υ(OCO) mode, which is
greater on the Pt 111 NCs than the Pt black. There is negligible change in this mode over the
potential scan on the Pt 100 NCs, thus it is difficult to discern if this is due to low
accumulation of formate or rapid oxidation and diffusion of the species. Formate was observed
in the mid to high potential limit, perhaps due to the diffusion from the surface before Pt oxide
formation beyond 1.0 V. Further in situ experimentation is necessary to confirm this aspect, but
based on the spectral features and the potential dependence of this υ(OH) at 3600 cm-1
confirm it
indeed has a role in the MOR on Pt and the source of the Pt 111 NCs activity is an enhanced
direct pathway.
6.4. Summary
In summary, the purpose of this investigation was to extend the established connection
between the structure and catalytic functionality without the influence of surfactant. Therefore,
the UV treated NCs were used as the preferentially oriented electro–catalysts for this work due to
the absence of PVP and strong evidence for the desired atomic arrangements. The effective
removal the surfactant with polyol–based routes (or at least coverage) deserves more attention as
coverage can dramatically alter results as illustrated by the large activity change on clean and
polymer–protected Pt 100 NCs. Despite the evidence for different surface arrangements and in
turn the catalytic activities, there is little variability detected by ATR–SEIRAS for the COads
during the measurements, though analysis of the interfacial water as yielded interesting trends.
There is a notable trend with regards to the interfacial water that indicates that free water is
linked to the presence of formate, an active intermediate in the direct pathway.
90
CHAPTER 7
CONCLUSION
7.1. Concluding Remarks
In conclusion, this dissertation has explored the structure–activity relationship of various
Pt electro–catalysts using complementary EC and surface sensitive IR measurements. The MOR
and related COR were used as model reactions to study this relationship of the solid–liquid
interface. As a surface sensitive reaction, the surface composition of the electro–catalyst leads to
distinctive MOR activities that can be correlated to interfacial species detectable with in situ IR
spectroscopy. This research aimed to expand the current knowledge of factors that influence the
activity of Pt electro–catalysts in order to improve fundamental understanding, thereby,
improving electro–catalyst design and commercial viability of fuel cells.
Since the MOR was a probe reaction, it was prudent to establish a fundamental
understanding of the behavior of interfacial species on commercial Pt/C as outlined in Chapter 3.
From this study of the MOR CV currents, an opportunity arose to corroborate the commonly
used current ratio criterion, If/Ib, by including PtRu/C NPs that have different If/Ib values. The
ATR–SEIRAS results strongly indicate that the MOR CV currents share the same chemical
origin, i.e. newly oxidized CH3OH. The COads in the cathodic current is not incompletely
oxidized carbonaceous species from the anodic sweep, but newly adsorbed CO from the freshly
oxidized methanol. Thus, the current ratio criterion, If/Ib, is an insufficient descriptor of CO–
tolerance for the Pt–based electro–catalysts. The current activity is better described by the anodic
peak current, which seems to be related to the relative amounts of surface Pt and Ru. Moreover,
the long–term CO–tolerance is better described by the CA current in the onset potential region

91
for the MOR. From this early investigation, the importance of complementary in situ information
from EC and IR spectroscopy studies was demonstrated.
With the advance in synthetic control of surface morphology at the nanoscale, there have
been surveys into the why the activity trends differ between macroscale and nanoscale materials.
This dissertation focused on the structure–activity relationship of low index Pt NCs that were
synthesized using a polyol–based method and PVP as a surfactant. The crystalline nature of the
Pt 100 NCs and Pt 111 NCs were initially analyzed using ex situ TEM and SAED in
Chapter 4 and subsequently confirmed in Chapter 6 with in situ CV and adatom adsorption
measurements. Moreover, the ability to remove excess surfactant from the surface using a base
treatment and to completely remove the surfactant with a liquid phase UVPO method was
demonstrated.
The MOR with low indexed Pt electro–catalysts protected by residual PVP was
investigated using EC and in situ FT–IR measurements in Chapter 4. The in situ FT–IR spectral
analysis showed different trends for COads at saturation and low coverage that could be related to
the crystallographic planes or presence of PVP. Although, the MOR activity increased in the
order of Pt 100 NCs < Pt black < Pt 111 NCs in the acidic electrolytes, i.e. HClO4 and
H2SO4, there was no clear separation of the impact of the nano–facets and surfactant on the
activity trends. It was proposed that the increased activity on the Pt 111 NCs was most likely
due to an enhanced direct pathway of the MOR.
In order to delineate the morphological effects from polymer effects, NC ensembles were
treated with a new method that completely removed the surfactant without damaging the
integrity of the NCs. As anticipated from the literature and the work in Chapter 4, the ensembles
discussed in Chapter 6 of Pt 111 NCs showed the highest MOR activity, while Pt 100 NCs

92
displayed the lowest activity compared to the polycrystalline reference. Despite the evidence for
different surface arrangements and in turn the catalytic activities, there was little variability
detected by in situ ATR–SEIRAS for the COads during the measurements, though analysis of
other intermediates yielded more telling trends. Interfacial water trends implicate free water
being linked to the presence of formate, an active intermediate in the direct pathway, most
strongly observed on the Pt 111 NCs.
In Chapter 5, the impact of PVP on commercial Pt/C during the MOR and related
gaseous COR was isolated. The EC measurements showed that the PVP protected electro–
catalysts displayed an enhanced long–term CO tolerance and small decrease in the intrinsic
activity of Pt/C. The in situ ATR–SEIRAS detected the increased adsorption of interfacial water
in the presence of polymer that coincided with the oxidation of COads and was strongly correlated
to the desorption of surface–bound carbonyl of PVP. The notable differences between the
adsorbate trends are indicative of adsorbed polymer interactions with the surface, but more
interestingly is strong activation of interfacial water that is a critical component in the oxidation
of COads as discussed in Chapter 1.
Furthermore, the importance of surfactant coverage relates to the activity of NCs
synthesized using polyol–based routes. The studies suggest that nano–faceted ensembles
comprised of ca. 70% preferential planes can have their intrinsic activity enhanced or suppressed
depending on the coverage of polymer. For instance, the Pt 111 NCs activity was enhanced
with residual PVP, while Pt 100 NCs displayed lower activity in the presence of PVP. Thus,
surfactant coverage on electro–catalytic samples deserves more attention as coverage can
dramatically alter the resultant activity. The polymer coverage is traditionally not addressed in
the literature. The work in this dissertation and recently other groups, however, is beginning to

93
open the discussion. Moreover, the emerging research area that incorporates surfactants to
improve activity and stability of the electro–catalysts is directly related to work herein.
Preferential control of surface atomic arrangements of Pt at the nanoscale has allowed for
exploration into the notable activity difference in activity trends between the macroscale and
nanoscale MOR. Commercially available Pt NPs served as the polycrystalline reference to
contrast with the observations made on the NC ensembles as well as ideal substrates to
investigate the influence of surfactant. In situ FT–IR and ATR–SEIRAS provided insight into the
molecular species present at the electrode–electrolyte interface that was correlated to the EC
results, i.e. the electro–catalyst activities. Isolating the principal factors that connect structure and
catalytic functionality on low indexed Pt NCs to enhance activity and improve stability is of
fundamental importance for improving the viability of FCs. Improving the electro–catalyst cost,
activity and stability are the main areas of research in the electro–catalysis community.
7.2. Prospective Research
7.2.1. Fundamental Studies
According to this dissertation work, the ability to synthesize preferentially controlled
NCs and subsequently remove the residual polymer to yield high quality and clean particles has
been demonstrated. Although, the MOR was the focus of these investigations into the connection
between the surface structure and catalytic functionality in acidic media, there are other surface
sensitive reactions, particularly the formic acid oxidation reaction (FAOR) that could be
investigated by correlating EC and in situ spectroscopy.67, 84, 127
Briefly, the FAOR is also a dual path mechanism that proceeds through a reactive
intermediate pathway and the poisonous CO producing pathway.32, 33, 137, 138
Formic acid remains

94
a competitive alternative to methanol because formic acid is also a liquid fuel that could be
implemented easily into existing infrastructure. Based on single crystal research, the FAOR
activity increases from Pt 111 < Pt polycrystalline < Pt 100. The trend, however, is reversed
at the nanoscale, i.e. Pt 111 NCs are the most active surface. Moreover, the electro–oxidation
of methanol and formic acid in alkaline electrolyte would be an additional research area since the
pH of the system changes the oxidation mechanisms.17, 139
The above pursuit would serve as a
fundamental building block to close the gap between structure–activity at the nanoscale.
7.2.2. Adatom Adsorption
More relevant to the issues of fuel cell viability are related to activity and stability.
Another avenue to pursue on the surfactant–free NCs is adatom adsorption to modify the
electronic structure of the Pt surface, thereby, improve upon the intrinsic activity of Pt.35, 86, 140
The influence of adatom decoration, e.g. Ru, Bi and Sb, have been used on basal electrodes and
polycrystalline Pt NPs.35, 49, 107, 140, 141
Sulfur is an interesting adatom due to the presence in fuel feeds that leads to deactivation
of Pt through surface poisoning, much like CO poisoning. Work by Tong et al. has successfully
demonstrated that the MOR and oxygen reduction reaction (ORR) is enhanced by tuning sulfur
coverage during the spontaneous deposition process by concentration and immersion time on
commercial Pt NPs.142-144
Depending on the resultant coverage, as noted in the previous
discussion with PVP, there was an observed increase in the direct pathway based on the in situ
ATR–SEIRAS results. Expanding upon the electronic modification of sulfur on Pt by
incorporating the preferentially controlled NCs could further understanding on sulfur adsorption
on specific crystallographic planes and the mechanism on enhancement.

95
7.2.3. Surfactant Adsorption
Similar to the adatom adsorption discussed above to tune the activity, is the impact of
surfactant coverage on the activity of Pt.84-86
Moreover, the use of a surfactant stabilizes Pt
surfaces from aggregation and deactivation during the oxidation processes.110
The studies in this
dissertation show that NC ensembles can have the intrinsic activity improved or curbed
depending on the coverage of polymer. For example, the Pt 100 NCs activity was inhibited
with residual PVP, while the UVPO treated Pt 100 NCs displayed better activity in the
absence of polymer. Therefore, the surfactant coverage on electro–catalytic samples deserves
attention as the resultant activity of the metal can be dramatically altered by the electronic
effects.62, 80, 87, 125
Figure 7.1. Common polymers in shape control syntheses with the pKa value of the monomer.
In addition to PVP, there are other common polymers used in shape control synthesis that
include poly(acrylic acid) (PA acid) and poly(allylamine) (PA amine). Figure 7.1 displays these
three polymers and the corresponding pKa values based on the monomer unit. It has been shown
that these polymers can influence the electronic structure of Pd through the hanging group off the
polymer backbone.125
More specifically, there was increased electronic promotion to the Pd with
increasing pKa values, which was inferred by the variation in the COads IR frequency. The
authors also discussed the role of geometric effects, i.e. binding, of the polymers in their

96
discussion of the changes in activity. PVP has been shown be an electron acceptor or donor via
XPS measurements that depends on the size of the Pt NPs, which in turn would alter the
electronic structure of Pt.87
It should be noted that these studies were performed ex situ and
therefore, may not reflect the true nature of the metal surface at the interface. Therefore, it is
reasonable to pursue the influence of such polymers on reaction related to the electro–catalysis
field on Pt NPs and even on the surfactant–free NCs under in situ conditions. This is an emerging
research area that incorporates surfactants not only for stability, but the ultimate activity of the
electro–catalysts.

97
APPENDIX A
OVERVIEW OF ELECTROCHEMISTRY
A.1. Basic Principles145-148
In general, an electrode reaction exists as an oxidation reduction reaction pair or redox
couple. Electrolysis is the electron transfer between an electrode and a molecular species through
the application of an external voltage, which is simply illustrated in Figure A.1. The addition of a
voltage drives the reduction or oxidation of the reactant species and results in a flow of electric
current that can be utilized to provide electricity as discussed in Chapter 1. The efficiency of the
electron transfer is increased by introducing a catalyst, which could be the electrode material
itself or an additive species at the electrode surface. The electro–catalyst aids in the electron
transfer kinetics between the electrode and reactant and/or modifying the thermodynamics for the
prescribed half–reaction. Additional proficiency is made by decreasing the resistance of the
solution with an electrolyte, e.g. H2SO4 or N aOH, to improve current mobility.
EC methods, discussed in detail later, detect the ensemble of electrons involved in the EC
reactions. The general electrode reaction can be complicated by applied voltage, reactivity of the
reactant species, electrode surface morphology and the structure of the interfacial region. For
simplicity, the following discussion describes a single electron transfer process of the molecule
designated as A at a metal electrode.
The driving force behind an EC reaction is the application of a voltage to make the
reaction energetically favorable. Voltage is the energy required to move charge, i.e. joule per
Coulomb (J C-1
). By applying a voltage to a metal electrode, the energy of the electrons in the
metal is changed relative to the Fermi level (EF), i.e. the topmost layer of electrons in filled

98
electron states. The energy of the EF relative to the highest occupied molecular orbital (HOMO)
and lowest unoccupied molecular orbital (LUMO) of the species in solution dictates whether an
electron will flow out of the metal and reduce the species or flow into the metal and oxidize the
species. This concept is illustrated in Figure A.1 by the oxidation or reduction of solution species
A in solution at a Pt electrode by applying a more positive or more negative voltage to change
the EF relative to the initial EF. Therefore, the electrode potential can be likened to a measure of
electrode’s electron energy, which can behave as an electron source or sink depending on the
applied voltage.
Figure A.1. The Fermi level (EF) of a metal along with the highest and lowest molecular orbital
energies (HOMO and LUMO) of a species A in solution. On the left, the EF has a lower value
than the LUMO of A due to application of a more positive voltage, thus the electron jumps from
the molecule to the electrode, i.e. oxidation of A. On the right, the EF is higher the LUMO of A,
thus it is thermodynamically favorable for the electron transfer to occur from the electrode to the
molecule, i.e. the reduction of A. Adapted from Ref. 145.
The electric current produced from the EC reaction is influenced by the potential of an
electrode as qualitatively be discussed above. Current (i) is defined as a change in the charge (Q)

99
over a unit of time (t). Therefore, the current is related to the reaction rate, i.e. the change in
moles of reactant (N) per unit time (t), by
where n is the number of transferred electrons and F is Faraday’s constant, 96485 C mol-1
. Since
the reaction occurs on the metal surface, the EC surface area (ECSA) of the electrode or electro–
catalyst is used to normalize the current and the reaction rate. This step is crucial, as the ECSA
changes from deposition to deposition on the GCE, to compare different sample activities. In the
case of Pt, it is well known that one H atom adsorbs for one Pt atom on the surface. Moreover,
the charge densities associated H adsorption and desorption on specific Pt surface morphologies
with known areas has been well–documented using single crystals. For instance, in this
dissertation the charge densities based on the hydrogen desorption were 220, 208 and 240 μC
cm-2
for polycrystalline, 100 and 111 Pt single crystals, respectively.
Figure A.2. Unnormalized CV of a Pt electrode in 0.5 M H2SO4 with a 50 mV s-1
scan rate.
The following scheme is used to calculate the ECSA of a Pt surface using IgorPro
software based on the hydrogen region highlighted in Figure A.2. Once the waves are loaded, the

100
first step is to subtract the background double layer current from each data point corresponding
to a specific current in time. Next, integrate those subtracted points to obtain the total charge
(QH) in amperes (A) for the hydrogen desorption area. Recall that 1 ampere is equivalent to 1 C
s-1
. Once the QH in amperes has been found, the data collection factor for the potentiostat and the
scan rate measured in V s-1
are used to obtain a QH in coulombs. From this point the appropriate
charge density for the surface is used to determine the ECSA in cm2, which is then used to divide
the original current data to obtain A cm-2
to compare across different samples.
Returning to the discussion of the potential dependence on the rate of reaction, remember
that electron transfer reactions are kinetic processes with rate constants. Note that the observed
current is the net current measured by the potentiostat due to both reduction and oxidation
currents. Thus, the single electron transfer reaction of A with a single ≠ can be described with
rates for both processes as:
As shown in Eqn. A.2, the current is related to the reaction rate, so the rate laws for the one
electron redox processes (assumed to be first order) are
where F is Faraday’s constant and B is the ECSA. Similar to the net current, the net rate is the
difference between the forward reduction process and the backward oxidation step of Eqn. A.3.
A change in the applied potential changes the observed current and the rate constants based on
Eqns. A.4 and A.5, therefore, also display potential dependence.
The Arrenhius equation (Eqn. A.6) studied in general chemistry relates the rate constant
to the activation energy (Ea) of the ≠, also known as the free energy of the ≠ (G≠) with factor (B):

101
According to transition state theory, the free energy diagram for the hypothetical reaction in Eqn.
A.3 qualitatively illustrates the influence of potential on the free energy based on the established
thermodynamic arguments. The free energy diagram in Figure A.3A describes the reaction in
Eqn A.3 with a thermodynamically favorable oxidation process (unfavorable in the reverse
reaction, i.e. reduction of A). In this case, the electrode is behaving as an electron sink for the
lost electron to yield the oxidized produce, A+. If the applied voltage increases more negatively,
the electrode becomes an electron source relative to the HUMO and LUMO of reactant A as
illustrated in Figure A.1 with the EF. This situation makes the reduced product the
thermodynamically favored product as illustrated in the energy diagram in Figure A.3B. Note
that this is simply a qualitative description that relates the EF and free energy, each reaction is
unique and there are many additional changes that could be occurring at the interface.
Figure A.3. Free energy diagrams for the system at thermodynamic equilibrium (A),
thermodynamically favored oxidation process (B) and for the thermodynamically favored
reduction process (C) that are potential dependent.
One of these additional factors present at the interface is mass transport. Recall that the
reactive species must be in close proximity to the electrode surface for electron transfer to occur.
There are three modes of mass transport in EC, i.e. diffusion, convection and migration. In

102
essence, the rate of transport of the reactant can further affect the overall reaction rate and
current yielded, which is described by the concentration variable in Eqns. Eqns. A.4 and A.5.
Rapid diffusion of reactants and products to and away from the electrode surface greatly
enhances the current density.
A.2. Experimental Methods
EC measurements performed in this dissertation were performed in a standard three
electrode cell, which is displayed in Figure A.4. This cell consists of a working electrode (WE), a
counter electrode (CE) and a reference electrode (RE) that are immersed in the electrolyte and
connected to the potentiostat. Current flows between the WE and CE in this configuration, while
no current is passed through the RE. The reaction of interest occurs at the WE, while the current
Figure A.4. Schematic of the conventional three electrode cell. Adapted from Ref. 148.
passes through the CE to complete the circuit. The RE is used to measure and control the
potential of the WE using well–known redox reaction to determine the potential difference. In
this dissertation, the saturated Ag/AgCl electrode was used as the RE, which employs the
following redox reactions:

103
Ag+
(aq) + e- → Ag(s) Eqn. A.7.
AgCl(s) → Ag+
(aq) + Cl-(aq) Eqn. A.8.
to yield the following overall redox reaction:
AgCl(s) + e- → Ag
+(aq) + Cl
-(aq) Eqn. A.9.
In general, the electrode potentials are given in reference to the reversible hydrogen
electrode (RHE) instead of the Ag/AgCl RE, although all data were collected in this dissertation
was measured using the Ag/AgCl. The Ag/AgCl RE potential iss converted to the RHE potential
using Eqn 2.1 as discussed in Chapter 2.
Figure A.5. Waveforms for the CV (A) and CA (B) measurements with the corresponding
output graphs for a reversible single electron transfer CV (B) and CA (D). Adapted from Ref.
145.
The EC measurements performed here consist of cyclic voltammetry (CV) and
chronoamperometry (CA). A potentiostat is an instrument that controls of the voltage applied
between the WE and CE, which self–adjusts the voltage to maintain the potential difference
between the WE and RE as desired by the operator. The generic waveforms and corresponding

104
graphs for the CV and CA experiments are displayed in Figure A.5 are for a reversible single
electron transfer reaction, much like Eqn. A.3.
In CV, the potential is swept between to limiting potentials, V1 and V2, over time as
illustrated in Figure A.5A. The time frame is dependent on the chosen scan rate, which is
measured in V s-1
. The resulting CV profile in Figure A.5B shows the current peak resulting
from the oxidation of A to produce A+ in the positive going scan (anodic) and the reduction of
A+ in the negative going scan (cathodic). The peak shape is due to the mass transport effects, e.g.
the depletion of A at the electrode interface into A+ for the anodic scan. Since this reaction is
reversible, the symmetry of the CV curve is anticipated.
For CA measurements, the current is measured as a function of time as noted in Figure
A.5D. The potential is generally stepped from one potential, V1, to another V2 over a set time,
where the resultant current decays over time. For the case of the reaction described by Eqn. A.3,
V1 is assumed to be a region where A is electro–inactive, i.e. stable as A, whereas the V2 region
is a potential where the oxidation occurs readily such that the only form at the electrode is the
oxidized A+. As the potential is pulsed from V1 to V2, there is a large flux of current produced
from the rapid conversion of A to A+ that decays over time as the concentration of A arriving at
the electrode slows and eventually only A+ is present in the electrode region.
This is a brief introduction to a few basic elements of EC, consult other sources for
greater detail of the principles and methods.

105
APPENDIX B
OVERVIEW OF INFRARED SPECTROSCOPY
B.1. Basic Principles89, 149
Surface sensitive spectroscopy is ideal to study electrode reactions and gain insight into
the molecular behavior of species at the solid–liquid interface. Measurements performed in situ
are quite important since the electrode–electrolyte interface can be substantially altered with the
presence of an applied voltage. The in situ capability enables for direct molecular detection of
the adsorbed transients that corresponds directly with EC cyclic voltammetry measurements,
thereby providing a complementary perspective of the EC interface. This dissertation is focused
on exposing the adsorption properties of nanoscale single crystals during electro–catalytic
reactions using in situ IR to provide direct experimental evidence to account for the different
activity trends. Establishing a more exact nature of the structure–activity relationship would
enable researchers to improve electro–catalyst design.
Figure B.1. Thin Film Fourier Transform (A) and Attenuated Total Reflection–Surface
Enhanced IR Absorption Spectroscopy (B) modes for in situ detection of intermediates. Adapted
from Ref. 149.

106
There are two common models for in situ IR measurements, i.e. the Fourier Transform
(FT–IR) and the Attenuated Total Reflection (ATR) models, which are illustrated in Figure B.1.
The Thin Film mode uses the external reflection geometry as illustrated in the Figure
B.1A, which is made by pressing the WE against the prism yielding a thin layer of solution, a
few μm thick, between the two. Although, the Thin Film is an improvement over the traditional
Infrared Reflection Absorption Spectroscopy (IRAS), there are some concerns for this approach.
One of the inherent complications in the FT–IR mode is the substantial absorption by the
electrolyte since the IR beam must pass through the prism then through the solution to reach the
electrode surface before finally returning to the detector. Moreover, the restriction of mass
transport in the thin layer can drastically alter the local environment with limited concentrations
of reactants and products at the interface. As such, an in situ technique that provides a similar
environment to the standard cell illustrated in Figure A.4 would be advantageous.
Fortunately, advances in surface enhanced spectroscopy, i.e. surface enhanced IR
(SEIRAS), provides an approach to expose the chemical environment at the interface that are
normally combined or obscured by bulk signals of the electrolyte. As seen in Figure B.1B, there
is free mass transport and no complications from the external reflection due to the use of the
ATR mode. Substantial signal enhancements arise from the surface plasmon resonance of the
metal film composed of islands that act as signal amplifiers producing enhancement factors from
10 to 50 for SEIRAS. Although, the exact mechanism of enhancement is undecided, it is
assumed to be a combination of electromagnetic and chemical mechanisms from the light and
metal that contribute to the signal increase.
Additionally, the ATR–SEIRAS in our laboratory has been further modified to enable for
temperature controlled studies as illustrated in Figure B.2. Using a continuous flow of heated or

107
cooled solution through the hollow chamber that encapsulates the reaction solution as indicated
by the blue arrows, it is possible to incorporate temperature studies of the intermediates. For
instance, one could observe intermediates that are typically too fast for IR detection by slowing
the reaction with a cooler temperature.
Figure B.2. Temperature controlled ATR–SEIRAS mode.
B.2. Experimental Methods
B.2.1. Au Film Deposition92
The Au film was deposited onto a silicon prism using a modified electroless deposition
procedure first described by Osawa and company. Firstly, the Si prism is polished sequentially
for about 20 min from 5 µm to 1 µm then 0.3 µm Al2O3 powder. Following sonication in H2O to
remove residual polishing powder, the prism was dried in air. Meanwhile, a H2O bath was
allowed to stabilize at 61.5°C with a prism holder submerged in the bath.
Secondly, the Au plating solution was freshly prepared by combining 1 mL from each of
the starting solutions:

108
A: 0.015 M NaAuCl4•2H2O in 10 mL H2O
B: 0.15 M NaSO3, 0.05 M NaS2O3•5H2O, 0.05 M NH4Cl in 10 mL H2O
C: 0.4 mL 50 % HF in 10 mL H2O
The final plating solution is made by beginning with 1 mL of B then adding 1 mL of A dropwise
while gently mixing so the mixture remains clear then finally adding 1 mL of C.
Figure B.3. Image of the Au film with a dried drop cast of Pt NPs (A), AFM image (B) and scan
analysis (C) performed by Dr. Clare Yannette of the Swift Group along with SEM images (D, E)
of the Au film.
Prior to plating the Si prism, it was first etched in about 3 mL of 5 % NH4F for about 2
min. The prism was rinsed with H2O then edge wrapped with Teflon tape to prevent the plating
solution from spilling over. The wrapped prism was placed into the holder with the face to be
deposited pointing upward and allowed about 5 to 10 min to equilibrate with the H2O bath.
Finally, 1.5 mL of the freshly prepared plating solution was quickly and gently pipetted onto the
prism. Depending on the temperature of the prism at this time, the Au film deposits with 30 sec

109
to 90 sec. Once a golden color is visible, the plating solution is washed away and the prism is
rinsed with H2O. Carefully remove the prism and rinse again before covering the prism to air dry
or blow–drying with inert gas before the drop cast of NPs, which are allowed to dry overnight.
Typically, there is 100 μL of the NP slurry drop cast at a concentration of 100 μg per 100 μL.
Figure B.3 displays the results from a few of the Au films that were analyzed using SEM
and AFM. The Au film has a visible yellow golden color in Figure B.3A yet is stable and does
not peel off with rinsing or blow–drying. From AFM and SEM, the surface is noticeably rough
with varying sized NP islands on the prism surface that leads to the signal enhancement.
B.2.2. In situ IR Measurements
The in situ spectroscopic measurements were performed on spectrometers, the details of
which are given in Chapter 2, that were modified to house an EC cell. Potential control was
achieved by using an potentiostat with the appropriate software. The NP suspension was drop
cast onto a well–polished GCE or a freshly made Au film that served as the WE of the three–
electrode EC cell with proper RE and a Pt CE. It is necessary to run CV measurements on the
film to ensure the stability between measurements and important to note the signal intensity for
each film between IR experiments.
As shown in this work, comparisons and trends in the chemical behavior can be drawn
between the EC and spectroscopic results. The measurements in this dissertation were collected
during a chronoamperometric stair step. The spectra were normalized to a specific reference
spectrum, that is –log[ (I – IR)/IR], where I and IR are the spectra taken at the measured and the
reference potentials, respectively. The spectra are shown in the absorbance units. Generally, it is
necessary to subtract the vibrational gaseous water species prior to further analysis of the data
with the appropriate software.

110
APPENDIX C
CURRICULUM VITAE
Augusta M. Levendorf
Education
Doctorate of Philosophy, Chemistry December 2013
Georgetown University, Washington, DC
Research Advisor: Dr. YuYe J. Tong
Dissertation: Exploring the Structure–Activity Relationship of Platinum and Platinum–based
Electro–catalysts for the Methanol Electro–oxidation
Bachelor of Arts, Chemistry May 2008
Cornell University, Ithaca, NY
Research Advisor: Dr. Carl A. Batt
Publications
Levendorf, A. M.; Rom, C. L.; Liu, Y.; Chen, D. J.; Tong, Y. Y. J. "Electrochemical and in
situ ATR -SEIRAS Investigation of Methanol and Associated CO Electro-oxidation on Low
Index Nano-crystalline Ensembles of Pt Electro-catalysts" in preparation.
Levendorf, A. M.; Sun, S. G.; Tong, Y. Y. J. "Electrochemical and in situ FT-IR Investigation of
Methanol and Associated CO Electro-oxidation on Low Index Nano-crystalline Ensembles of Pt
Electro-catalysts" in preparation.
Hofstead-Duffy, A. M.; Chen, D. J.; Tong, Y. Y. J. "An in situ ATR-SEIRAS Study of Enhanced
Methanol Electro-oxidation Activity on Carbon-Supported Pt Nanoparticles by
Poly(vinylpyrrolidone) of Different Molecular Weights" Electrochimica Acta, 2012, 82, 543-
549.
Hofstead-Duffy, A. M.; Chen, D. J.; Sun, S. G.; Tong, Y. Y. J. "Origin of the Current Peak of
Negative Scan in the Cyclic Voltammetry of Electro-oxidation of Methanol on Pt-Based Electro-
catalysts: A Revisit to the Current Ratio Criterion" Journal of Materials Chemistry, 2012, 22,
5205-5208.
Park, I. S.; Atienza, D. O.; Hofstead-Duffy, A. M.; Chen, D. J.; Tong, Y. Y. J. "Mechanistic
insights on sulfide-adsorption enhanced activity of methanol electro-oxidation on Pt
nanoparticles" ACS Catalysis, 2012, 2, 168–174.

111
Chen, D. J.; Hofstead-Duffy, A. M.; Park, I. S.; Atienza, D. O.; Susut, C.; Sun, S. G.; Tong, Y.
Y. J. “Identification of the most active sites and surface water species: A comparative study of
CO and methanol oxidation reactions on core-shell M@Pt (M=Ru, Au) nanoparticles by in situ
IR spectroscopy” Journal of Physical Chemistry C, 2011, 115, 8735–8743.
Park, I. S.; Xu, B.; Atienza, D. O.; Hofstead-Duffy, A. M.; Allison, T. C.; Tong, Y. Y. J.
“Chemical State of Adsorbed Sulfur on Pt Nanoparticles” (Inside Cover) ChemPhysChem, 2011,
12, 747–752.
Presentations
Hofstead-Duffy, A. M.; Rom, C. L.; Chen, D. J.; Wang, H. H.; Tong, Y. Y. J. “Making use of
surfactants as stabilizers and unconventional promoters in electro-catalysis” Electrochemistry
Conference: Lanzarote, Spain, February 2013, Oral.
Hofstead-Duffy, A. M.; Chen, D. J.; Tong, Y. Y. J. “Fundamental Behavior of
Poly(vinylpyrrolidone) - In-situ ATR-SEIRAS Investigation with Pt-based Electro-catalysts” 63rd
Annual Meeting of the International Society of Electrochemistry: Prague, Czech Republic,
August 2012, Poster.
Hofstead-Duffy, A. M.; Chen, D. J.; Susut, C.; Tong, Y. Y. J. “An in-situ Surface Enhance IR
Investigation of Poly(vinylpyrrolidone) on Pt Nanoparticles” 61st Annual Meeting of the
International Society of Electrochemistry: Nice, France, September 2010, Poster.
Hofstead-Duffy, A. M.; Chen, D. J.; Susut, C.; Tong, Y. Y. J. “An in-situ Surface Enhance IR
Spectroscopic Investigation of Poly(vinylpyrrolidone) on Carbon-Supported Pt Nanoparticles”
84th
Surface Science and Colloid Symposium: Akron, OH, United States, June 2010, Oral.
Hofstead-Duffy, A. M.; Zaluzhna, O.; Susut, C.; Tong, Y. Y. J. “Synthesis and Characterization
of Metal Oxide@Pt Nanoparticles” 238th
ACS National Meeting & Exposition: Washington DC,
United States, August 2009, Oral.
Awards and Affiliations
∙ American Chemical Society, Member, 2009 – Present.
∙ ARCS Metropolitan Washington Chapter Scholar, Achievement Rewards for College
Scientists Foundation, Inc. 2012 – 2013.
∙ Doctoral Dissertation Enhancement Project Fellowship, National Science Foundation
(Award No: OISE-1130454) 2010 – 2012.
∙ International Research Fellowship, International Center for Materials Research at UC
Santa Barbara (Award No: DMR-0843934) 2010 – 2011.

112
REFERENCES
1. Jones, D. A., Electrical engineering: the backbone of society. Science, Measurement and
Technology, IEE Proceedings A 1991, 138, (1), 1-10.
2. Faraday, M., Historical Sketch of Electro-magnetism. Annals of Philosophy 1821, 2, 195-
200, 274-290.
3. Faraday, M., On some new electro-magnetical motions and the theory of magnetism.
Quarterly Journal of Science 1821, 12, 75-96.
4. Chatterjee, S., Michael Faraday: Discovery of Electromagnetic Induction. Resonance
2002, 7, 35-45.
5. Institute of Electrical and Electronics Engineers. Early Applications of Electric Power.
http://www.ieeeghn.org/wiki/index.php/Early_Applications_of_Electric_Power, (accessed Aug
1, 2013).
6. U.S. History Scene. The Second Industrial Revolution, 1870-1914.
http://www.ushistoryscene.com/uncategorized/secondindustrialrevolution/, (accessed Jul 10,
2013).
7. Physical Laboratory of Measurement at NIST. International System of Units.
http://physics.nist.gov/cuu/Units/units.html, (accessed Sept 17, 2013).
8. International Energy Agency. Key World Energy Statistics 2012.
http://www.iea.org/statistics/ (accessed Jul 15, 2013).
9. International Energy Agency. World Energy Outlook 2012: Executive Summary.
http://www.iea.org/statistics/ (accessed Jul 15, 2013).
10. U.S. Energy Information Agency. Annual Energy Outlook 2013 with Projections to 2040.
http://www.eia.gov/forecasts/aeo/, (accessed Aug 1, 2013).
11. Wald, M., Growing Use of Electricity Raises Questions on Supply. New York Times
http://www.nytimes.com/1990/03/21/business/growing-use-of-electricity-raises-questions-on-
supply.html, Mar 1990, (accessed Sept 7, 2013).
12. Science Daily. Fossil Fuel. http://www.sciencedaily.com/articles/f/fossil_fuel.htm,
(accessed Sept 17, 2013).
13. Winter, M.; Brodd, R., What are batteries, fuel cells and supercapacitors? Chem. Rev.
2004, 104, 4245-4269.
14. Kleiner, K., Assault on batteries. Nature 2006, 441, 1046-1047.
15. Smithsonian Institution. Fuell Cells. http://americanhistory.si.edu/fuelcells/intro.htm.
(accessed Aug 2, 2013).
16. Grove, W. R., On Voltaic Series and the Combination of Gases by Platinum.
Philosophical Magazine and Journal of Science 1839, 14, 127-130.
17. Cohen, J. L.; Volpe, D. J.; Abruna, H. D., Electrochemical determination of activation
energies for methanol oxidation on polycrystalline platinum in acidic and alkaline electrolytes.
Phys. Chem. Chem. Phys. 2007, 9, (1), 49-77.
18. Shao, Y.; Yin, G.; Gao, Y., Understanding and approaches for the durability issues of Pt-
based catalysts for PEM fuel cell. J. Power Sources 2007, 171, (2), 558-566.19. U.S.

113
Department of Energy. Recently Tested Vehicles.
http://www.fueleconomy.gov/feg/fcv_sbs.shtml. (accessed Sept 17, 2013).
20. Dumaine, B., Has the fuel cell car's time finally come? Fortune
http://money.cnn.com/2013/08/15/technology/fuel-cell-hydrogen.pr.fortune/index.html, Aug
2013, (accessed Aug 18, 2013).
21. Hamnett, A., Mechanism and electrocatalysis in the direct methanol fuel cell. Catal.
Today 1997, 38, (4), 445-457.
22. Surya Prakash, G. K.; Olah, G. A., Electrocatalysis of Direct Methanol Fuel Cells. From
Fundamentals to Applications. Edited by Hansan Liu and Jiujun Zhang. Angew. Chem. Int. Ed.
49, (37), 6483-6483.
23. Iwasita, T., Electrocatalysis of methanol oxidation. Electrochim. Acta 2002, 47, (22-23),
3663-3674.
24. Methanol MSDS No. BDH-130 [Online]
http://kni.caltech.edu/facilities/msds/methanol.pdf Jan 9, 2006, (accessed Jul 5, 2013).
25. Costentin, C.; Drouet, S.; Robert, M.; Saveant, J.-M., A Local Proton Source Enhances
CO2 Electroreduction to CO by a Molecular Fe Catalyst. Science 2012, 338, (6103), 90-94.
26. Hong, J.; Zhang, W.; Ren, J.; Xu, R., Photocatalytic reduction of CO2: a brief review on
product analysis and systematic methods. Analytical Methods 2013, 5, (5), 1086-1097.
27. Li, C. W.; Kanan, M. W., CO2 Reduction at Low Overpotential on Cu Electrodes
Resulting from the Reduction of Thick Cu2O Films. Journal of the American Chemical Society
2012, 134, (17), 7231-7234.
28. Wagner, F. T.; Lakshmanan, B.; Mathias, M. F., Electrochemistry and the Future of the
Automobile. The Journal of Physical Chemistry Letters 2010, 1, (14), 2204-2219.
29. McQuarrie, D. A.; Simon, J. D., Physical Chemistry: A Molecular Approach. 1st ed.;
University Science Books: Sausalito, CA, 1997.
30. Herrero, E.; Franaszczuk, K.; Wieckowski, A., Electrochemistry of Methanol at Low
Index Crystal Planes of Platinum: An Integrated Voltammetric and Chronoamperometric Study.
J. Phys. Chem. 1994, 98, (19), 5074-5083.
31. Housmans, T. H. M.; Wonders, A. H.; Koper, M. T. M., Structure Sensitivity of
Methanol Electrooxidation Pathways on Platinum: An On-Line Electrochemical Mass
Spectrometry Study. J. Phys. Chem. B 2006, 110, (20), 10021-10031.
32. Markovic, N. M.; Ross Jr, P. N., Surface science studies of model fuel cell
electrocatalysts. Surface Science Reports 2002, 45, (4-6), 117-229.
33. Neurock, M.; Janik, M.; Wieckowski, A., A first principles comparison of the mechanism
and site requirements for the electrocatalytic oxidation of methanol and formic acid over Pt.
Faraday Discussions 2009, 140, 363-378.
34. Cao, D.; Lu, G. Q.; Wieckowski, A.; Wasileski, S. A.; Neurock, M., Mechanisms of
Methanol Decomposition on Platinum: A Combined Experimental and ab Initio Approach. J.
Phys. Chem. B 2005, 109, (23), 11622-11633.
35. Wang, H.; Baltruschat, H., DEMS Study on Methanol Oxidation at Poly- and
Monocrystalline Platinum Electrodes: The Effect of Anion, Temperature, Surface Structure, Ru
Adatom, and Potential. J. Phys. Chem. C 2007, 111, (19), 7038-7048.

114
36. Jusys, Z.; Behm, R. J., Methanol Oxidation on a Carbon-Supported Pt Fuel Cell Catalyst-
A Kinetic and Mechanistic Study by Differential Electrochemical Mass Spectrometry. J. Phys.
Chem. B 2001, 105, 10874-10883.
37. Gamboa-Aldeco, M. E.; Herrero, E.; Zelenay, P. S.; Wieckowski, A., Adsorption of
bisulfate anion on a Pt(100) electrode: A comparison with Pt(111) and Pt(poly). Journal of
Electroanalytical Chemistry 1993, 348, 451-457.
38. Chen, Y. X.; Miki, A.; Ye, S.; Sakai, H.; Osawa, M., Formate, an Active Intermediate for
Direct Oxidation of Methanol on Pt Electrode. J. Am. Chem. Soc. 2003, 125, (13), 3680-3681.
39. Blyholder, G., Molecular Orbital View of Chemisorbed Carbon Monoxide. J. Phys.
Chem. 1964, 68, (10), 2772-2777.
40. Chang, S.-C.; Weaver, M. J., Coverage-dependent dipole coupling for carbon monoxide
adsorbed at ordered platinum(111)-aqueous interfaces: Structural and electrochemical
implications. The Journal of Chemical Physics 1990, 92, (7), 4582-4594.
41. Chen, D. J.; Hofstead-Duffy, A. M.; Park, I. S.; Atienza, D. O.; Susut, C.; Sun, S. G.;
Tong, Y. Y. J., Identification of the most active sites and surface water species: A comparative
study of CO and methanol oxidation reactions on core-shell M@Pt (M=Ru, Au) nanoparticles by
in situ IR spectroscopy J. Phys. Chem. C. 2011.
42. Inukai, J.; Tryk, D. A.; Abe, T.; Wakisaka, M.; Uchida, H.; Watanabe, M., Direct STM
Elucidation of the Effects of Atomic-Level Structure on Pt(111) Electrodes for Dissolved CO
Oxidation. Journal of the American Chemical Society 2013, 135, (4), 1476-1490.
43. Yan, Y.-G.; Yang, Y.-Y.; Peng, B.; Malkhandi, S.; Bund, A.; Stimming, U.; Cai, W.-B.,
Study of CO Oxidation on Polycrystalline Pt Electrodes in Acidic Solution by ATR-SEIRAS.
The Journal of Physical Chemistry C 2011, 115, (33), 16378-16388.
44. Kunimatsu, K.; Sato, T.; Uchida, H.; Watanabe, M., Adsorption/Oxidation of CO on
Highly Dispersed Pt Catalyst Studied by Combined Electrochemical and ATR-FTIRAS
Methods: Oxidation of CO Adsorbed on Carbon-Supported Pt Catalyst and Unsupported Pt
Black. Langmuir 2008, 24, (7), 3590-3601.
45. Mayrhofer, K. J. J.; Arenz, M.; Blizanac, B. B.; Stamenkovic, V.; Ross, P. N.; Markovic,
N. M., CO surface electrochemistry on Pt-nanoparticles: A selective review. Electrochim. Acta
2005, 50, (25-26), 5144-5154.
46. Samjeske̕, G.; Komatsu, K.-i.; Osawa, M., Dynamics of CO Oxidation on a
Polycrystalline Platinum Electrode: A Time-Resolved Infrared Study. The Journal of Physical
Chemistry C 2009, 113, (23), 10222-10228.
47. Lebedeva, N. P.; Koper, M. T. M.; Feliu, J. M.; van Santen, R. A., Mechanism and
kinetics of the electrochemical CO adlayer oxidation on Pt(111). J. Electroanal. Chem. 2002,
524-525, 242-251.
48. Petrii, O. A., Pt-Ru Electrocatalysts for Fuel Cells: A Representative Review. J. Solid
State Electrochem. 2008, 12, 609-642.
49. Du, B.; Rabb, S. A.; Zangmeister, C.; Tong, Y. Y. J., A volcano curve: optimizing
methanol electro-oxidation on Pt-decorated Ru nanoparticles. Phys. Chem. Chem. Phys. 2009,
11, (37), 8231-8239.
115
50. Wang, H.; Alden, L. R.; DiSalvo, F. J.; Abruna, H. D., Methanol Oxidation on PtRu Bulk
Alloys and Carbon-Supported PtRu Nanoparticle Catalysts: A Quantitative DEMS Study.
Langmuir 2009, 15, 7725-7735.
51. Iwasita, T.; Hoster, H.; John-Anacker, A.; Lin, W. F.; Vielstich, W., Methanol Oxidation
on PtRu Electrodes. Influence of Surface Structure and Pt-Ru Atom Distribution. Langmuir
2000, 16, 522-529.
52. Abe, H.; Matsumoto, F.; Alden, L. R.; Warren, S. C.; Abruna, H. D.; DiSalvo, F. J.,
Electrocatalytic Performance of Fuel Oxidation by Pt3Ti Nanoparticles. J. Am. Chem. Soc. 2008,
130, (16), 5452-5458.
53. Manoharan, R.; Goodenough, J. B., Methanol Oxidation in Acid on Ordered NiTi. J.
Mater. Chem. 1992, 2, (8), 875-887.
54. Zeng, D.-M.; Jiang, Y.-X.; Zhou, Z.-Y.; Su, Z.-F.; Sun, S.-G., In situ FTIR spectroscopic
studies of (bi)sulfate adsorption on electrodes of Pt nanoparticles supported on different
substrates. Electrochim. Acta 2010, 55, (6), 2065-2072.
55. Platinum Gram Price Calculator. http://coinapps.com/platinum/gram/calculator/,
(accessed Sept 26, 2013).
56. Xiong, Y.; Wiley, B. J.; Xia, Y., Nanocrystals with Unconventional Shapes—A Class of
Promising Catalysts. Angew. Chem. Int. Ed. 2007, 46, (38), 7157-7159.
57. Koper, M. T. M., Structure sensitivity and nanoscale effects in electrocatalysis.
Nanoscale 2011, 3, (5), 2054-2073.
58. Peng, Z.; Yang, H., Designer platinum nanoparticles: Control of shape, composition in
alloy, nanostructure and electrocatalytic property. Nano Today 2009, 4, (2), 143-164.
59. Xia, X. H.; Iwasita, T.; Ge, F.; Vielstich, W., Structural effects and reactivity in methanol
oxidation on polycrystalline and single crystal platinum. Electrochim. Acta 1996, 41, (5), 711-
718.
60. Somorjai, G. A., The Evolution of Surface Chemistry. A Personal View of Building the
Future on Past and Present Accomplishments. The Journal of Physical Chemistry B 2002, 106,
(36), 9201-9213.
61. Susut, C.; Nguyen, T. D.; Chapman, G. B.; Tong, Y., Shape and size stability of Pt
nanoparticles for MeOH electro-oxidation. Electrochim. Acta 2008, 53, (21), 6135-6142.
62. Fu, G.; Wu, K.; Jiang, X.; Tao, L.; Chen, Y.; Lin, J.; Zhou, Y.; Wei, S.; tang, y.; Lu, T.;
Xia, X., Polyallylamine-Directed Green Synthesis of Platinum Nanocubes. Shape and Electronic
Effect Codependent Enhanced Electrocatalytic Activity. Physical Chemistry Chemical Physics
2013.
63. Peng, Z.; Kisielowski, C.; Bell, A. T., Surfactant-free preparation of supported cubic
platinum nanoparticles. Chemical Communications 2012, 48, (13), 1854-1856.
64. Chen, M.; Wu, B.; Yang, J.; Zheng, N., Small Adsorbate-Assisted Shape Control of Pd
and Pt Nanocrystals. Advanced Materials 2012, 24, (7), 862-879.
65. Yin, A. X.; Min, X. Q.; Zhang, Y. W.; Yan, C. H., Shape-Selective Synthesis and Facet-
Dependent Enhanced Electrocatalytic Activity and Durability of Monodisperse Sub-10 nm
Pt−Pd Tetrahedrons and Cubes. J. Am. Chem. Soc. 2011, 133, (11), 3816-3819.

116
66. Chiu, C.-Y.; Li, Y.; Ruan, L.; Ye, X.; Murray, C. B.; Huang, Y., Platinum nanocrystals
selectively shaped using facet-specific peptide sequences. Nature Chem. 2011, advance online
publication.
67. Solla-Gullon, J.; Vidal-Iglesias, F. J.; Lopez-Cudero, A.; Garnier, E.; Feliu, J. M.; Aldaz,
A., Shape-dependent electrocatalysis: methanol and formic acid electrooxidation on
preferentially oriented Pt nanoparticles. Physical Chemistry Chemical Physics 2008, 10, (25),
3689-3698.
68. Song, H.; Kim, F.; Connor, S.; Somorjai, G. A.; Yang, P., Pt Nanocrystals:Shape Control
and Langmuir-Blodgett Monolayer Formation. J. Phys. Chem. B. 2004, 109, (1), 188-193.
69. Solla-Gullon, J.; Vidal-Iglesias, F. J.; Feliu, J. M., Shape dependent electrocatalysis.
Annual Reports Section "C" (Physical Chemistry) 2011, 107, (0), 263-297.
70. Ahmadi, T. S.; Wang, Z. L.; Green, T. C.; Henglein, A.; El-Sayed, M. A., Shape-
Controlled Synthesis of Colloidal Platinum Nanoparticles. Science 1996, 272, (5270), 1924-
1925.
71. Burda, C.; Chen, X.; Narayanan, R.; El-Sayed, M. A., Chemistry and Properties of
Nanocrystals of Different Shapes. Chemical Reviews 2005, 105, (4), 1025-1102.
72. Lee, H.; Kim, C.; Yang, S.; Han, J.; Kim, J., Shape-Controlled Nanocrystals for Catalytic
Applications. Catalysis Surveys from Asia 2012, 16, (1), 14-27.
73. Xia, Y.; Xiong, Y.; Lim, B.; Skrabalak, S. E., Shape-Controlled Synthesis of Metal
Nanocrystals: Simple Chemistry Meets Complex Physics? Angewandte Chemie International
Edition 2009, 48, (1), 60-103.
74. Personick, M. L.; Langille, M. R.; Zhang, J.; Harris, N.; Schatz, G. C.; Mirkin, C. A.,
Synthesis and Isolation of 110-Faceted Gold Bipyramids and Rhombic Dodecahedra. J. Am.
Chem. Soc. 2011, null-null.
75. Zheng, H.; Smith, R. K.; Jun, Y.-w.; Kisielowski, C.; Dahmen, U.; Alivisatos, A. P.,
Observation of Single Colloidal Platinum Nanocrystal Growth Trajectories. Science 2009, 324,
(5932), 1309-1312.
76. Herricks, T.; Chen, J.; Xia, Y., Polyol Synthesis of Platinum Nanoparticles: Control of
Morphology with Sodium Nitrate. Nano Lett. 2004, 4, (12), 2367-2371.
77. Lim, B.; Lu, X.; Jiang, M.; Camargo, P. H. C.; Cho, E. C.; Lee, E. P.; Xia, Y., Facile
Synthesis of Highly Faceted Multioctahedral Pt Nanocrystals through Controlled Overgrowth.
Nano Lett. 2008, 8, (11), 4043-4047.
78. Petroski, J. M.; Wang, Z. L.; Green, T. C.; El-Sayed, M. A., Kinetically Controlled
Growth and Shape Formation Mechanism of Platinum Nanoparticles. J. Phys. Chem. B. 1998,
102, (18), 3316-3320.
79. Struber, U.; Kastner, A.; Kuppers, J., Growth and properties of thin Ag films on Pt(100)
surfaces. Thin Solid Films 1994, 250, 101-110.
80. Borodko, Y.; Humphrey, S. M.; Tilley, T. D.; Frei, H.; Somorjai, G. A., Charge-Transfer
Interaction of Poly(vinylpyrrolidone) with Platinum and Rhodium Nanoparticles. J. Phys. Chem.
C. 2007, 111, (17), 6288-6295.
81. Crespo-QuECSAda, M.; Andanson, J.-M.; Yarulin, A.; Lim, B.; Xia, Y.; Kiwi-Minsker,
L., UV-Ozone Cleaning of Supported Poly(vinylpyrrolidone)-Stabilized Palladium Nanocubes:
117
Effect of Stabilizer Removal on Morphology and Catalytic Behavior. Langmuir 2011, 27, (12),
7909-7916.
82. Borodko, Y.; Habas, S. E.; Koebel, M.; Yang, P.; Frei, H.; Somorjai, G. A., Probing the
Interaction of Poly(vinylpyrrolidone) with Platinum Nanocrystals by UV-Raman and FTIR. J.
Phys. Chem. B. 2006, 110, (46), 23052-23059.
83. Pietron, J. J.; Garsany, Y.; Baturina, O.; Swider-Lyons, K. E.; Stroud, R. M.; Ramaker,
D. E.; Schull, T. L., Electrochemical Observation of Ligand Effects on Oxygen Reduction at
Ligand-Stabilized Pt Nanoparticle Electrocatalysts. Electrochem. and Solid-State Lett. 2008, 11,
B161-B165.
84. Susut, C.; Chen, D.-J.; Sun, S.-G.; Tong, Y. J., Capping polymer-enhanced
electrocatalytic activity on Pt nanoparticles: a combined electrochemical and in situ IR
spectroelectrochemical study. Phys. Chem. Chem. Phys. 2011, 13, (16), 7467-7474.
85. Hofstead-Duffy, A. M.; Chen, D.-J.; Tong, Y. J., An in situ attenuated total reflection-
surface enhanced infrared absorption spectroscopic study of enhanced methanol electro-
oxidation activity on carbon-supported Pt nanoparticles by poly(vinylpyrrolidone) of different
molecular weights. Electrochimica Acta 2012, 82, (0), 543-549.
86. Tong, Y. J., Unconventional promoters of catalytic activity in electrocatalysis. Chemical
Society Reviews 2012, 41, (24), 8195-8209.
87. Qiu, L.; Liu, F.; Zhao, L.; Yang, W.; Yao, J., Evidence of a Unique Electron Donor-
Acceptor Property for Platinum Nanoparticles as Studied by XPS. Langmuir 2006, 22, (10),
4480-4482.
88. Atienza, D. O.; Allison, T. C.; Tong, Y. J., Spatially Resolved Electronic Alterations As
Seen by in Situ195Pt and 13CO NMR in Ru@Pt and Au@Pt Core-Shell Nanoparticles. The
Journal of Physical Chemistry C 2012, 116, (50), 26480-26486.
89. Osawa, M., Dynamic Processes in Electrochemical Reactions Studied by Surface-
Enhanced Infrared Absorption Spectroscopy (SEIRAS). Bull. Chem. Soc. Jpn. 1997, 70, 2861-
2880.
90. Susut, C.; Tong, Y. Y. J., Size-Dependent Methanol Electro-oxidation Activity of Pt
Nanoparticles with Different Shapes. Electrocatalysis 2011, 2, (2), 75-81.
91. Conway, B. E.; Jerkiewicz, G., Surface orientation dependence of oxide film growth at
platinum single crystals. J. Electroanal. Chem. 1992, 339, 123-146.
92. Miyake, H.; Ye, S.; Osawa, M., Electroless deposition of gold thin films on silicon for
surface-enhanced infrared spectroelectrochemistry. Electrochem. Comm. 2002, 4, (12), 973-977.
93. Susut, C. Tuning the activity of platinum electrocatalysts via size, shape and capping
polymer. Dissertation (Ph.D.), Georgetown University, Washington, DC, 2009.
94. Kang, W.-D.; Wei, Y.-C.; Liu, C.-W.; Wang, K.-W., Enhancement of electrochemical
properties on Pd@Cu/C electrocatalysts toward ethanol oxidation by atmosphere induced surface
and structural alteration. Electrochemistry Communications 2011, 13, (2), 162-165.
95. Yen, C. H.; Shimizu, K.; Lin, Y. Y.; Bailey, F.; Cheng, I. F.; Wai, C. M., Chemical Fluid
Deposition of Pt-Based Bimetallic Nanoparticles on Multiwalled Carbon Nanotubes for Direct
Methanol Fuel Cell Application. Energy & Fuels 2007, 21, (4), 2268-2271.
118
96. Yin, M.; Huang, Y.; Liang, L.; Liao, J.; Liu, C.; Xing, W., Inhibiting CO formation by
adjusting surface composition in PtAu alloys for methanol electrooxidation. Chem. Comm. 2011,
47, 8172-8174.
97. Yoo, E.; Okata, T.; Akita, T.; Kohyama, M.; Nakamura, J.; Honma, I., Enhanced
Electrocatalytic Activity of Pt Subnanoclusters on Graphene Nanosheet Surface. Nano Lett.
2009, 9, (6), 2255-2259.
98. Zhang, L. J.; Wang, Z. Y.; Xia, D. G., Bimetallic PtPb for formic acid electro-oxidation.
J. Alloys and Compounds 2006, 426, (1-2), 268-271.
99. Gavrilov, A. N.; Petrii, O. A.; Mukovnin, A. A.; Smirnova, N. V.; Levchenko, T. V.;
Tsirlina, G. A., Pt-Ru electrodeposited on gold from chloride electrolytes. Electrochim. Acta
2007, 52, (8), 2775-2784.
100. Kim, H.; Rabelo de Moraes, I.; Tremiliosi-Filho, G.; Haasch, R.; Wieckowski, A.,
Chemical state of ruthenium submonolayers on a Pt(111) electrode. Surf. Sci. 2001, 474, (1-3),
L203-L212.
101. Watanabe, M.; Motoo, S., Electrocatalysis by ad-atoms : Part III. Enhancement of the
oxidation of carbon monoxide on platinum by ruthenium ad-atoms. J. Electroanal. Chem. 1975,
60, (3), 275-283.
102. Yajima, T.; Uchida, H.; Watanabe, M., In-situ ATR-FTIR Spectroscopic Study of
Electro-oxidation of Methanol and Adsorbed CO at Pt-Ru Alloy. J. Phys. Chem. B. 2004, 108,
2654-2659.
103. Jiang, J.; Kucernak, A., Solid polymer electrolyte membrane composite microelectrode
investigations of fuel cell reactions. II: voltammetric study of methanol oxidation at the
nanostructured platinum microelectrodeNafion® membrane interface. J. Electroanal. Chem.
2005, 576, (2), 223-236.
104. Wang, X.; Hsing, I. M., Surfactant stabilized Pt and Pt alloy electrocatalyst for polymer
electrolyte fuel cells. Electrochim. Acta 2002, 47, (18), 2981-2987.
105. Gutiérrez, C.; Caram, J. A.; Beden, B., In-situ spectroscopic study of the adsorption of
carbon monoxide on a polycrystalline ruthenium electrode by EMIRS and PMRS. J. Electroanal.
and Interfacial Chem. 1991, 305, (2), 289-299.
106. Zhu, Y.; Uchida, H.; Yajima, T.; Watanabe, M., Attenuated Total Reflection-Fourier
Transform Infrared Study of Methanol Oxidation on Sputtered Pt Film Electrode. Langmuir
2000, 17, (1), 146-154.
107. Lin, W. F.; Zei, M. S.; Eiswirth, M.; Ertl, G.; Iwasita, T.; Vielstich, W., Electrocatalytic
Activity of Ru-Modified Pt(111) Electrodes toward CO Oxidation. J. Phys. Chem. B 1999, 103,
(33), 6968-6977.
108. Li, J. T.; Chen, Q. S.; Sun, S. G., In situ microscope FTIR studies of methanol adsorption
and oxidation on an individually addressable array of nanostructured Pt microelectrodes.
Electrochim. Acta 2007, 52, (18), 5725-5732.
109. Lee, Y.-W.; Han, S.-B.; Kim, D.-Y.; Park, K.-W., Monodispersed platinum nanocubes
for enhanced electrocatalytic properties in alcohol electrooxidation. Chemical Communications
2011, 47, (22), 6296-6298.
110. Susut, C.; Chapman, G. B.; Samjeske, G.; Osawa, M.; Tong, Y. Y. J., An unexpected
enhancement in methanol electro-oxidation on an ensemble of Pt(111) nanofacets: a case of

119
nanoscale single crystal ensemble electrocatalysis. Phys. Chem. Chem. Phys. 2008, 10, 3712-
3721.
111. Tian, N.; Zhou, Z.-Y.; Sun, S.-G.; Ding, Y.; Wang, Z. L., Synthesis of Tetrahexahedral
Platinum Nanocrystals with High-Index Facets and High Electro-Oxidation Activity. Science
2007, 316, (5825), 732-735.
112. Vidal-Iglesias, F. J. Ar n-Ais, R. M. Solla-Gull n, J. Herrero, E. Feliu, J. M.,
Electrochemical Characterization of Shape-Controlled Pt Nanoparticles in Different Supporting
Electrolytes. ACS Catal. 2012, 2, 901-910.
113. Johnson, B. N.; Mutharasan, R., Regeneration of Gold Surfaces Covered by Adsorbed
Thiols and Proteins Using Liquid-Phase Hydrogen Peroxide-Mediated UV-Photooxidation. The
Journal of Physical Chemistry C 2013, 117, (3), 1335-1341.
114. Monzo, J.; Koper, M. T. M.; Rodriguez, P., Removing Polyvinylpyrrolidone from
Catalytic Pt Nanoparticles without Modification of Superficial Order. ChemPhysChem 2012, 13,
(3), 709-715.
115. Hofstead-Duffy, A. M.; Chen, D. J.; Tong, Y. Y. J., An in situ attenuated total reflection-
surface enhanced infrared absorption spectroscopic study of enhanced methanol electro-
oxidation activity on carbon-supported Pt nanoparticles by poly(vinylpyrrolidone) of different
molecular weights. Electrochimica Acta 2012, (0).
116. Susut, C.; Chen, D. J.; Sun, S. G.; Tong, Y. Y. J., Capping polymer-enhanced
electrocatalytic activity on Pt nanoparticles: a combined electrochemical and in situ IR
spectroelectrochemical study. Phys. Chem. Chem. Phys. 2011, 13, (16), 7467-7474.
117. Gassman, P. G.; Hodgson, P. K. G.; Balchunis, R. J., Base-promoted hydrolysis of
amides at ambient temperatures. Journal of the American Chemical Society 1976, 98, (5), 1275-
1276.
118. Flynn, D. L.; Zelle, R. E.; Grieco, P. A., A mild two-step method for the hydrolysis of
lactams and secondary amides. The Journal of Organic Chemistry 1983, 48, (14), 2424-2426.
119. Solla-Gullon, J.; Vidal-Iglesias, F. J.; Herrero, E.; Feliu, J. M.; Aldaz, A., CO monolayer
oxidation on semi-spherical and preferentially oriented (100) and (111) platinum nanoparticles.
Electrochemistry Communications 2006, 8, (1), 189-194.
120. Markovic, N. M.; Gasteiger, H. A.; Ross, P. N., Oxygen Reduction on Platinum Low-
Index Single-Crystal Surfaces in Sulfuric Acid Solution: Rotating Ring-Pt(hkl) Disk Studies. The
Journal of Physical Chemistry 1995, 99, (11), 3411-3415.
121. Lamy, C.; Leger, J. M.; Clavilier, J.; Parsons, R., A Comparative Study of the Oxidation
of CO, HCOOH and CH3OH on Single Crystal Pt Electrodes. J. Electroanal. Chem. 1983, 150,
71-77.
122. Wang, H.; Baltruschat, H., DEMS Study on Methanol Oxidation at Poly- and
Monocrystalline Platinum Electrodes: The Effect of Anion, Temperature, Surface Structure, Ru
Adatom, and Potential. The Journal of Physical Chemistry C 2007, 111, (19), 7038-7048.
123. Park, S.; Tong, Y. Y. J.; Wieckowski, A.; Weaver, M. J., Infrared Spectral Comparison of
Electrochemical Carbon Monoxide Adlayers Formed by Direct Chemisorption and Methanol
Dissociation on Carbon-Supported Platinum Nanoparticles. Langmuir 2002, 18, (8), 3233-3240.

120
124. Zhou, Z.-Y.; Ren, J.; Kang, X.; Song, Y.; Sun, S.-G.; Chen, S., Butylphenyl-
functionalized Pt nanoparticles as CO-resistant electrocatalysts for formic acid oxidation.
Physical Chemistry Chemical Physics 2012, 14, (4), 1412-1417.
125. Jones, S.; Qu, J.; Tedsree, K.; Gong, X.-Q.; Tsang, S. C. E., Prominent Electronic and
Geometric Modifications of Palladium
Nanoparticles by Polymer Stabilizers for Hydrogen Production under
Ambient Conditions. Angew. Chem. Int. Ed. 2012, 51, 11275 –11278.
126. Gatewood, D. S.; Schull, T. L.; Baturina, O.; Pietron, J. J.; Garsany, Y.; Swider-Lyons,
K. E.; Ramaker, D. E., Characterization of Ligand Effects on Water Activation in
Triarylphosphine-Stabilized Pt Nanoparticle Catalysts by X-ray Absorption Spectroscopy. The
Journal of Physical Chemistry C 2008, 112, (13), 4961-4970.
127. Miyake, H.; Okada, T.; Samjeske, G.; Osawa, M., Formic acid electrooxidation on Pd in
acidic solutions studied by surface-enhanced infrared absorption spectroscopy. Phys. Chem.
Chem. Phys. 2008, 10, (25), 3662-3669.
128. Faguy, P. W.; Marinkovic, N. S.; Adzic, R. R., Infrared spectroscopic analysis of anions
adsorbed from bisulfate-containing solutions on Pt(111) electrodes. J. Electroanal. Chem. 1996,
407, 209-218.
129. Zhou, Z.-Y.; Tian, N.; Li, J.-T.; Broadwell, I.; Sun, S.-G., Nanomaterials of high surface
energy with exceptional properties in catalysis and energy storage. Chem. Soc. Rev. 2011, 40,
(7), 4167-4185.
130. Rodriguez, P.; Herrero, E.; Solla-Gullon, J.; Vidal-Iglesias, F. J.; Aldaz, A.; Feliu, J. M.,
Specific surface reactions for identification of platinum surface domains Surface characterization
and electrocatalytic tests. Electrochim. Acta 2005, 50, 4308-4317.
131. Vidal-Iglesias, F. J.; Solla-Gullon, J.; Herrero, E.; Montiel, V.; Aldaz, A.; Feliu, J. M.,
Evaluating the ozone cleaning treatment in shape-controlled Pt nanoparticles: Evidences of
atomic surface disordering. Electrochemistry Communications 2011, 13, (5), 502-505.
132. Osawa, M.; Tsushima, M.; Mogami, H.; Samjeske, G.; Yamakata, A., Structure of Water
at the Electrified Platinum-Water Interface: A Study by Surface-Enhanced Infrared Absorption
Spectroscopy. The Journal of Physical Chemistry C 2008, 112, (11), 4248-4256.
133. Ataka, K.-i.; Osawa, M., In Situ Infrared Study of Water-Sulfate Coadsorption on
Gold(111) in Sulfuric Acid Solutions. Langmuir 1998, 14, (4), 951-959.
134. Yan; Li, Q.-X.; Huo, S.-J.; Ma, M.; Cai, W.-B.; Osawa, M., Ubiquitous Strategy for
Probing ATR Surface-Enhanced Infrared Absorption at Platinum Group Metal - Electrolyte
Interfaces. The Journal of Physical Chemistry B 2005, 109, (16), 7900-7906.
135. Shiroishi, H.; Ayato, Y.; Kunimatsu, K.; Okada, T., Study of adsorbed water on Pt during
methanol oxidation by ATR-SEIRAS (surface-enhanced infrared absorption spectroscopy).
Journal of Electroanalytical Chemistry 2005, 581, (1), 132-138.
136. Cuesta, A., Comments on the paper by H. Shiroishi, Y. Ayato, K. Kunimatsu and T.
Okada entitled "Study of adsorbed water on Pt during methanol oxidation by ATR-SEIRAS
(surface-enhanced infrared absorption spectroscopy)'. J. Electroanal. Chem. 2006, 587, 329-330.
137. Samjeske, G.; Miki, A.; Ye, S.; Osawa, M., Mechanistic Study of Electrocatalytic
Oxidation of Formic Acid at Platinum in Acidic Solution by Time-Resolved Surface-Enhanced
Infrared Absorption Spectroscopy. J. Phys. Chem. B. 2006, 110, (33), 16559-16566.

121
138. Rhee, C. K.; Kim, B.-J.; Ham, C.; Kim, Y.-J.; Song, K.; Kwon, K., Size Effect of Pt
Nanoparticle on Catalytic Activity in Oxidation of Methanol and Formic Acid: Comparison to
Pt(111), Pt(100), and Polycrystalline Pt Electrodes. Langmuir 2009, 25, (12), 7140-7147.
139. Morallón, E.; Rodes, A.; Vázquez, J. L.; Pérez, J. M., Voltammetric and in-situ FTIR
spectroscopic study of the oxidation of methanol on Pt(hkl) in alkaline media. J. Electroanal.
Chem. 1995, 391, (1-2), 149-157.
140. Peng, B.; Wang, H.-F.; Liu, Z.-P.; Cai, W.-B., Combined Surface-Enhanced Infrared
Spectroscopy and First-Principles Study on Electro-Oxidation of Formic Acid at Sb-Modified Pt
Electrodes. J. Phys. Chem. C. 2010, 114, (7), 3102-3107.
141. Friedrich, K. A.; Geyzers, K. P.; Linke, U.; Stimming, U.; Stumper, J., CO Adsorption
and Oxidation on Pt(111) Electrode Modified by Ruthenium Deposition: an IR Spectroscopic
Study. J. Electroanal. Chem. 1996, 402, 123-128.
142. Park, I.-S.; Tong, Y. Y. J., Sulfide–Adsorption-Enhanced Oxygen Reduction Reaction on
Carbon-Supported Pt Electrocatalyst. Electrocatalysis 2013, 4, 117-122.
143. Park, I.-S.; Atienza, D. O.; Hofstead-Duffy, A. M.; Chen, D.; Tong, Y. J., Mechanistic
Insights on Sulfide-Adsorption Enhanced Activity of Methanol Electro-Oxidation on Pt
Nanoparticles. ACS Catalysis 2012, 2, (1), 168-174.
144. Park, I.-S.; Xu, B.; Atienza, D. O.; Hofstead-Duffy, A. M.; Allison, T. C.; Tong, Y. J.,
Inside Cover: Chemical State of Adsorbed Sulfur on Pt Nanoparticles (ChemPhysChem 4/2011).
ChemPhysChem 2011, 12, (4), 722-722.
145. Bard, A. J.; Faulkner, L. R., Electrochemical Methods: Fundamentals and Applications.
2nd ed.; Wiley: 2000.
146. Skoog, D. A.; Holler, F. J.; Crouch, S. R., Principles of Instrumental Analysis 6th ed.;
Cengage Learning: 2006.
147. Calvo, E. J.; Bamford, C. H.; Compton, R. G., Chapter 1 Fundamentals. The Basics of
Electrode Reactions. In Comprehensive Chemical Kinetics, Elsevier: 1986; Vol. Volume 26, pp
1-78.
148. Faulkner, L. R.; Kuwana, T., Electrochemical Characterization of Chemical Systems. In
Physical Methods in Modern Chemical Analysis, Academic Press: 1983; pp 137-248.
149. Osawa, M., In-situ Surface-Enhanced Infrared Spectroscopy of the Electrode/Solution
Interface. In Advances in Electrochemical Science and Engineering, Wiley-VCH Verlag GmbH:
2008; pp 269-314.
Copyright © 2022 FDOKUMEN