Mechanical stiffness as an improved single-cell indicator of osteoblastic human mesenchymal stem...
8
Mechanical stiffness as an improved single-cell indicator of osteoblastic human mesenchymal stem cell differentiation Tom Bongiorno a , Jacob Kazlow b , Roman Mezencev c , Sarah Griffiths d , Rene Olivares-Navarrete e , John F. McDonald c , Zvi Schwartz e , Barbara D. Boyan e , Todd C. McDevitt b,d , Todd Sulchek a,b,d,n a The G. W. Woodruff School of Mechanical Engineering, Georgia Institute of Technology, Atlanta, GA, USA b The Wallace H. Coulter Department of Biomedical Engineering, Georgia Institute of Technology and Emory University, Atlanta, GA, USA c School of Biology, Georgia Institute of Technology, Atlanta, GA, USA d The Parker H. Petit Institute for Bioengineering and Bioscience, Georgia Institute of Technology, Atlanta, GA, USA e School of Engineering, Virginia Commonwealth University, Richmond, VA, USA article info Article history: Accepted 6 November 2013 Keywords: MSC Atomic force microscopy Bone sialoprotein Cell stiffness Osteoblast differentiation Osteocalcin abstract Although it has been established that cellular stiffness can change as a stem cell differentiates, the precise relationship between cell mechanics and other phenotypic properties remains unclear. Inherent cell heterogeneity and asynchronous differentiation complicate population analysis; therefore, single-cell analysis was employed to determine how changes in cell stiffness correlate with changes in molecular biomarkers during differentiation. Design of a custom gridded tissue culture dish facilitated single-cell comparisons between cell mechanics and other differentiation biomarkers by enabling sequential measurement of cell mechanics and protein biomarker expression at the single cell level. The Young’s modulus of mesenchymal stem cells was shown not only to decrease during chemically-induced osteoblast differentiation, but also to correlate more closely with the day of differentiation than did the relative expression of the traditional osteoblast differentiation markers, bone sialoprotein and osteocalcin. Therefore, cell stiffness, a measurable property of individual cells, may serve as an improved indicator of single-cell osteoblast differentiation compared to traditional biological markers. Revelation of additional osteoblast differentiation indicators, such as cell stiffness, can improve identification and collection of starting cell populations, with applications to mesenchymal stem cell therapies and stem cell-based tissue engineering. & 2013 Elsevier Ltd. All rights reserved. 1. Introduction Human mesenchymal stem cells (hMSCs) hold great potential for autologous therapy, highlighted by the properties of immuno- suppression, migration to injured tissues, and tissue repair via soluble factor secretion (Hwang et al., 2009). MSC osteoblast differentiation following bone graft incorporation may facilitate subsequent bone formation (Amini et al., 2012). However, the absence of donor- and anatomical location- independent MSC biomarkers hampers the collection of MSCs from bone marrow or adipose tissue for clinical therapies (Amini et al., 2012), which establishes a need to improve phenotype detection by identifying additional MSC biomarkers. The lack of reliable cell-surface or intracellular markers of terminal MSC osteoblast differentiation precludes techniques such as fluorescence-activated cell sorting from successful phenotype identification. Common markers of MSC osteoblast differentiation, including alkaline phosphatase, osteopontin, and osteonectin, peak prior to mineralization of the extracellular matrix (Aubin and Triffitt, 2002; Vater et al., 2011), and are therefore not optimal for definitive phenotype identification. Two other MSC osteoblast differentiation markers, bone sialoprotein (BSP) and osteocalcin (OCN), are considered to be late osteogenesis markers, but are produced by other cells that form the mineralized matrix (Aubin and Triffitt, 2002; Vater et al., 2011). Isolation of extracellular matrix constituents, such as BSP, OCN, and other common osteo- blastic proteins, requires dissociative, cell-destructive methods. Therefore, locally synthesized proteins are difficult to distinguish from matrix-trapped proteins derived from other sources, such as serum. Altogether, these facts emphasize a need for additional cell-specific osteoblastic markers to identify cell phenotype. Compared to extracellular protein markers, cellular stiffness is easily attributable to individual cells, and thus may serve as a candidate osteoblastic marker. Cellular stiffness has been proposed Contents lists available at ScienceDirect journal homepage: www.elsevier.com/locate/jbiomech www.JBiomech.com Journal of Biomechanics 0021-9290/$ - see front matter & 2013 Elsevier Ltd. All rights reserved. http://dx.doi.org/10.1016/j.jbiomech.2013.11.017 Abbreviations: AFM, atomic force microscopy; bone sialoprotein, BSP; osteocalcin, OCN; hMSC, human mesenchymal stem cell; hMSC-OB, osteoblastic hMSC; hOB, human osteoblast n Corresponding author at: The G. W. Woodruff School of Mechanical Engineer- ing, Georgia Institute of Technology, 771 Ferst Drive, Atlanta, GA 30332, USA. Tel.: þ1 404 385 1887; fax: þ1 404 385 8187. E-mail address: [email protected] (T. Sulchek). Journal of Biomechanics 47 (2014) 2197–2204
Transcript of Mechanical stiffness as an improved single-cell indicator of osteoblastic human mesenchymal stem...
Mechanical stiffness as an improved single-cell indicatorof osteoblastic human mesenchymal stem cell differentiation
Tom Bongiorno a, Jacob Kazlow b, Roman Mezencev c, Sarah Griffiths d,Rene Olivares-Navarrete e, John F. McDonald c, Zvi Schwartz e, Barbara D. Boyan e,Todd C. McDevitt b,d, Todd Sulchek a,b,d,n
a The G. W. Woodruff School of Mechanical Engineering, Georgia Institute of Technology, Atlanta, GA, USAb The Wallace H. Coulter Department of Biomedical Engineering, Georgia Institute of Technology and Emory University, Atlanta, GA, USAc School of Biology, Georgia Institute of Technology, Atlanta, GA, USAd The Parker H. Petit Institute for Bioengineering and Bioscience, Georgia Institute of Technology, Atlanta, GA, USAe School of Engineering, Virginia Commonwealth University, Richmond, VA, USA
a r t i c l e i n f o
Article history:Accepted 6 November 2013
Keywords:MSCAtomic force microscopyBone sialoproteinCell stiffnessOsteoblast differentiationOsteocalcin
a b s t r a c t
Although it has been established that cellular stiffness can change as a stem cell differentiates, theprecise relationship between cell mechanics and other phenotypic properties remains unclear. Inherentcell heterogeneity and asynchronous differentiation complicate population analysis; therefore, single-cellanalysis was employed to determine how changes in cell stiffness correlate with changes in molecularbiomarkers during differentiation. Design of a custom gridded tissue culture dish facilitated single-cellcomparisons between cell mechanics and other differentiation biomarkers by enabling sequentialmeasurement of cell mechanics and protein biomarker expression at the single cell level. The Young’smodulus of mesenchymal stem cells was shown not only to decrease during chemically-inducedosteoblast differentiation, but also to correlate more closely with the day of differentiation than didthe relative expression of the traditional osteoblast differentiation markers, bone sialoprotein andosteocalcin. Therefore, cell stiffness, a measurable property of individual cells, may serve as an improvedindicator of single-cell osteoblast differentiation compared to traditional biological markers. Revelationof additional osteoblast differentiation indicators, such as cell stiffness, can improve identification andcollection of starting cell populations, with applications to mesenchymal stem cell therapies and stemcell-based tissue engineering.
& 2013 Elsevier Ltd. All rights reserved.
1. Introduction
Human mesenchymal stem cells (hMSCs) hold great potentialfor autologous therapy, highlighted by the properties of immuno-suppression, migration to injured tissues, and tissue repair viasoluble factor secretion (Hwang et al., 2009). MSC osteoblastdifferentiation following bone graft incorporation may facilitatesubsequent bone formation (Amini et al., 2012). However, theabsence of donor- and anatomical location- independent MSCbiomarkers hampers the collection of MSCs from bone marrowor adipose tissue for clinical therapies (Amini et al., 2012), whichestablishes a need to improve phenotype detection by identifyingadditional MSC biomarkers.
The lack of reliable cell-surface or intracellular markers ofterminal MSC osteoblast differentiation precludes techniques suchas fluorescence-activated cell sorting from successful phenotypeidentification. Common markers of MSC osteoblast differentiation,including alkaline phosphatase, osteopontin, and osteonectin,peak prior to mineralization of the extracellular matrix (Aubinand Triffitt, 2002; Vater et al., 2011), and are therefore not optimalfor definitive phenotype identification. Two other MSC osteoblastdifferentiation markers, bone sialoprotein (BSP) and osteocalcin(OCN), are considered to be late osteogenesis markers, but areproduced by other cells that form the mineralized matrix (Aubinand Triffitt, 2002; Vater et al., 2011). Isolation of extracellularmatrix constituents, such as BSP, OCN, and other common osteo-blastic proteins, requires dissociative, cell-destructive methods.Therefore, locally synthesized proteins are difficult to distinguishfrom matrix-trapped proteins derived from other sources, such asserum. Altogether, these facts emphasize a need for additionalcell-specific osteoblastic markers to identify cell phenotype.
Compared to extracellular protein markers, cellular stiffness iseasily attributable to individual cells, and thus may serve as acandidate osteoblastic marker. Cellular stiffness has been proposed
Contents lists available at ScienceDirect
journal homepage: www.elsevier.com/locate/jbiomechwww.JBiomech.com
Journal of Biomechanics
0021-9290/$ - see front matter & 2013 Elsevier Ltd. All rights reserved.http://dx.doi.org/10.1016/j.jbiomech.2013.11.017
Abbreviations: AFM, atomic force microscopy; bone sialoprotein, BSP; osteocalcin,OCN; hMSC, human mesenchymal stem cell; hMSC-OB, osteoblastic hMSC; hOB,human osteoblast
n Corresponding author at: The G. W. Woodruff School of Mechanical Engineer-ing, Georgia Institute of Technology, 771 Ferst Drive, Atlanta, GA 30332, USA.Tel.: þ1 404 385 1887; fax: þ1 404 385 8187.
E-mail address: [email protected] (T. Sulchek).
Journal of Biomechanics 47 (2014) 2197–2204
as an indicator of multiple cellular processes, including cancermetastasis (Cross et al., 2007; Darling et al., 2007; Suresh, 2007;Xu et al., 2012) and apoptosis (Hu et al., 2009; Lam et al., 2007), aswell as stem cell differentiation (Chen et al., 2010; Ofek et al.,2009; Pajerowski et al., 2007; Pillarisetti et al., 2011; Tan et al.,2012) and differentiation potential (González-Cruz et al., 2012;Hammerick et al., 2011).
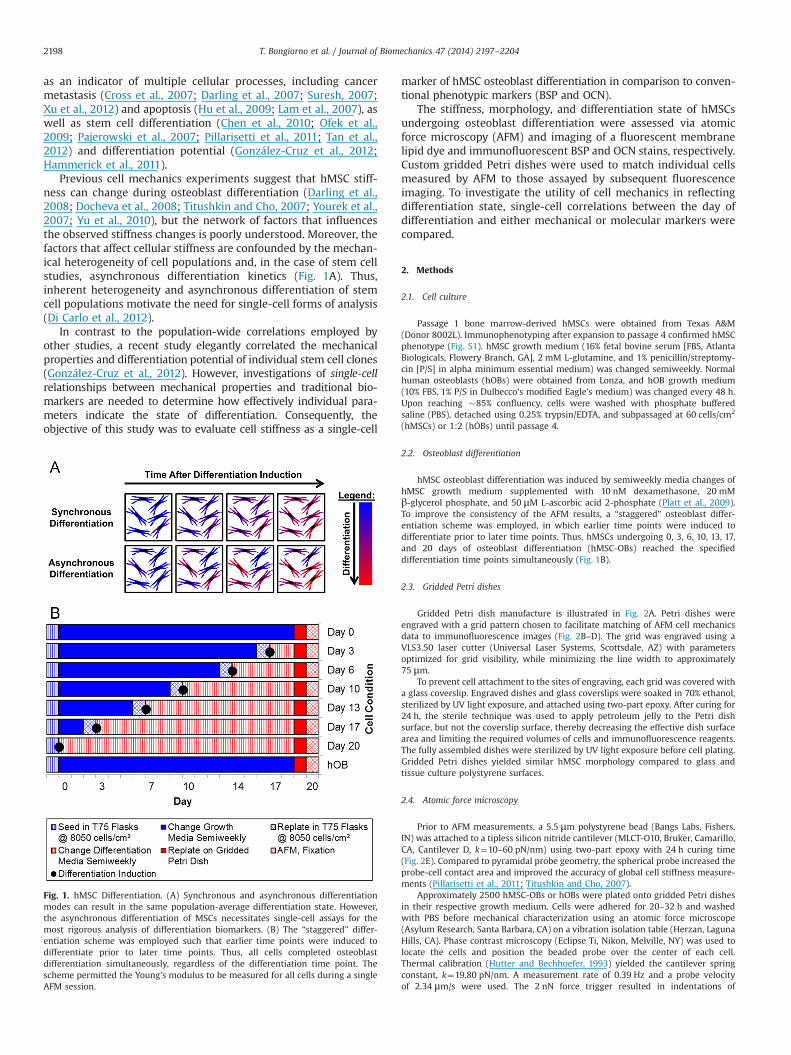
Previous cell mechanics experiments suggest that hMSC stiff-ness can change during osteoblast differentiation (Darling et al.,2008; Docheva et al., 2008; Titushkin and Cho, 2007; Yourek et al.,2007; Yu et al., 2010), but the network of factors that influencesthe observed stiffness changes is poorly understood. Moreover, thefactors that affect cellular stiffness are confounded by the mechan-ical heterogeneity of cell populations and, in the case of stem cellstudies, asynchronous differentiation kinetics (Fig. 1A). Thus,inherent heterogeneity and asynchronous differentiation of stemcell populations motivate the need for single-cell forms of analysis(Di Carlo et al., 2012).
In contrast to the population-wide correlations employed byother studies, a recent study elegantly correlated the mechanicalproperties and differentiation potential of individual stem cell clones(González-Cruz et al., 2012). However, investigations of single-cellrelationships between mechanical properties and traditional bio-markers are needed to determine how effectively individual para-meters indicate the state of differentiation. Consequently, theobjective of this study was to evaluate cell stiffness as a single-cell
marker of hMSC osteoblast differentiation in comparison to conven-tional phenotypic markers (BSP and OCN).
The stiffness, morphology, and differentiation state of hMSCsundergoing osteoblast differentiation were assessed via atomicforce microscopy (AFM) and imaging of a fluorescent membranelipid dye and immunofluorescent BSP and OCN stains, respectively.Custom gridded Petri dishes were used to match individual cellsmeasured by AFM to those assayed by subsequent fluorescenceimaging. To investigate the utility of cell mechanics in reflectingdifferentiation state, single-cell correlations between the day ofdifferentiation and either mechanical or molecular markers werecompared.
2. Methods
2.1. Cell culture
Passage 1 bone marrow-derived hMSCs were obtained from Texas A&M(Donor 8002L). Immunophenotyping after expansion to passage 4 confirmed hMSCphenotype (Fig. S1). hMSC growth medium (16% fetal bovine serum [FBS, AtlantaBiologicals, Flowery Branch, GA], 2 mM L-glutamine, and 1% penicillin/streptomy-cin [P/S] in alpha minimum essential medium) was changed semiweekly. Normalhuman osteoblasts (hOBs) were obtained from Lonza, and hOB growth medium(10% FBS, 1% P/S in Dulbecco’s modified Eagle’s medium) was changed every 48 h.Upon reaching �85% confluency, cells were washed with phosphate bufferedsaline (PBS), detached using 0.25% trypsin/EDTA, and subpassaged at 60 cells/cm2
(hMSCs) or 1:2 (hOBs) until passage 4.
2.2. Osteoblast differentiation
hMSC osteoblast differentiation was induced by semiweekly media changes ofhMSC growth medium supplemented with 10 nM dexamethasone, 20 mMβ-glycerol phosphate, and 50 μM L-ascorbic acid 2-phosphate (Platt et al., 2009).To improve the consistency of the AFM results, a “staggered” osteoblast differ-entiation scheme was employed, in which earlier time points were induced todifferentiate prior to later time points. Thus, hMSCs undergoing 0, 3, 6, 10, 13, 17,and 20 days of osteoblast differentiation (hMSC-OBs) reached the specifieddifferentiation time points simultaneously (Fig. 1B).
2.3. Gridded Petri dishes
Gridded Petri dish manufacture is illustrated in Fig. 2A. Petri dishes wereengraved with a grid pattern chosen to facilitate matching of AFM cell mechanicsdata to immunofluorescence images (Fig. 2B–D). The grid was engraved using aVLS3.50 laser cutter (Universal Laser Systems, Scottsdale, AZ) with parametersoptimized for grid visibility, while minimizing the line width to approximately75 μm.
To prevent cell attachment to the sites of engraving, each grid was covered witha glass coverslip. Engraved dishes and glass coverslips were soaked in 70% ethanol,sterilized by UV light exposure, and attached using two-part epoxy. After curing for24 h, the sterile technique was used to apply petroleum jelly to the Petri dishsurface, but not the coverslip surface, thereby decreasing the effective dish surfacearea and limiting the required volumes of cells and immunofluorescence reagents.The fully assembled dishes were sterilized by UV light exposure before cell plating.Gridded Petri dishes yielded similar hMSC morphology compared to glass andtissue culture polystyrene surfaces.
2.4. Atomic force microscopy
Prior to AFM measurements, a 5.5 μm polystyrene bead (Bangs Labs, Fishers,IN) was attached to a tipless silicon nitride cantilever (MLCT-O10, Bruker, Camarillo,CA, Cantilever D, k¼10–60 pN/nm) using two-part epoxy with 24 h curing time(Fig. 2E). Compared to pyramidal probe geometry, the spherical probe increased theprobe-cell contact area and improved the accuracy of global cell stiffness measure-ments (Pillarisetti et al., 2011; Titushkin and Cho, 2007).
Approximately 2500 hMSC-OBs or hOBs were plated onto gridded Petri dishesin their respective growth medium. Cells were adhered for 20–32 h and washedwith PBS before mechanical characterization using an atomic force microscope(Asylum Research, Santa Barbara, CA) on a vibration isolation table (Herzan, LagunaHills, CA). Phase contrast microscopy (Eclipse Ti, Nikon, Melville, NY) was used tolocate the cells and position the beaded probe over the center of each cell.Thermal calibration (Hutter and Bechhoefer, 1993) yielded the cantilever springconstant, k¼19.80 pN/nm. A measurement rate of 0.39 Hz and a probe velocityof 2.34 μm/s were used. The 2 nN force trigger resulted in indentations of
Fig. 1. hMSC Differentiation. (A) Synchronous and asynchronous differentiationmodes can result in the same population-average differentiation state. However,the asynchronous differentiation of MSCs necessitates single-cell assays for themost rigorous analysis of differentiation biomarkers. (B) The “staggered” differ-entiation scheme was employed such that earlier time points were induced todifferentiate prior to later time points. Thus, all cells completed osteoblastdifferentiation simultaneously, regardless of the differentiation time point. Thescheme permitted the Young’s modulus to be measured for all cells during a singleAFM session.
T. Bongiorno et al. / Journal of Biomechanics 47 (2014) 2197–22042198

250–500 nm for typical cells, corresponding to approximate contact areas of4.3–8.6 μm2. To determine cellular Young’s modulus, IGOR software (Wavemetrics,Portland, OR) was used to apply the Hertzian contact model to the portion of theextension force-displacement curves from 50% to 95% of the maximum indentation,over which range the Young’s modulus was generally independent of indentation.The mean Young’s modulus of three measurements was calculated for each cell,using indentation offset as a free variable and assuming cellular Poisson’s ratio,ν¼0.5.
2.5. Immunofluorescence imaging and image processing
2.5.1. Single-cellCells were fixed, permeabilized, and simultaneously stained for cell membrane
(HCS CellMask Blue, Invitrogen, Carlsbad, CA), BSP (anti-BSP and fluoresceinisothiocyanate-conjugated secondary antibody), and OCN (phycoerythrin-conju-gated anti-OCN), as detailed in the Supplementary Information.
Following immunofluorescence staining, cell identity was determined bylocation within the grid using a Nikon Eclipse Ti microscope under halogen lightillumination and confirmed by comparison to images taken during AFM. Cellmembranes and antibody-labeled BSP and OCN were visualized using the4′,6-diamidino-2-phenylindole, fluorescein isothiocyanate, and tetramethylrhoda-mine isothiocyanate excitation/emission filter sets, respectively. Individual cellswere imaged using a CoolSNAP HQ2 camera (Photometrics, Tuscon, AZ).
The relatively high signal-to-noise ratio of the cell membrane images alloweduse of the ImageJ rolling ball algorithm to subtract the background from eachimage. However, due to substantial background autofluorescence, the BSP and OCNimages were enhanced using a different method of background subtraction. ImageJ(National Institutes of Health, Bethesda, MD) was used to generate backgroundimages for each day of differentiation by averaging the intensity of raw BSP or OCNimages and applying a 25 mm Gaussian blur.
Spread cells have previously been shown to be stiffer than spherical cells(Darling et al., 2008), indicating that morphology may play an important role inapparent cell stiffness; therefore, the morphology of each cell measured by AFMwas quantified. CellProfiler™ (Carpenter et al., 2006) was used to identify the
boundary of each cell by applying a “background global” threshold to eachcorrected cell membrane image. ImageJ was used to characterize cell morphologyby calculating the minor and major axes, Feret’s diameter, perimeter, area, aspectratio, circularity, eccentricity, perimeter:area ratio, and roundness of each cellboundary. Quantification of cell membrane images was validated by the expectedpositive correlations among size descriptors as well as correlations between factors,such as aspect ratio and eccentricity, which are directly mathematically linked (seeSupplementary Information). For each BSP and OCN corrected image, proteinstaining was quantified as the fraction of pixels within the cell boundary thatexceeded a threshold value (“percent area”) (Cregger et al., 2006; Gerger et al.,2004). Quantification of single-cell morphology and protein staining is illustratedin Fig. S2.
2.5.2. Cell populationhMSC-OBs and hOBs were plated at 8050 cells/cm2 on glass coverslips, stained
as described above, and mounted on glass slides prior to imaging. Cell membranes,BSP, and OCN were imaged and background corrected a priori. The boundaries ofnaive hMSCs were identified using a classifier generated by ilastik software(Sommer et al., 2011) and 3-class “Otsu global” thresholding in CellProfiler™, andthe identified region was used for quantification. Since all other hMSC-OBs andhOBs were confluent, the entire image was used for quantification. BSP and OCNstaining was quantified as described above. Threshold values for each fluorescentchannel were identical for single-cell and cell population images.
2.6. Statistics
Due to the unequal sample size, heteroscedasticity, and non-normal distribu-tion of the AFM data, parametric bootstrapping was performed (10,000 iterations)using a MATLAB (MathWorks, Natick, MA) routine. Differences in mean Young’smoduli for the 7 hMSC-OB time points and the hOB sample were compared bybootstrapping one-way ANOVA, yielding p¼0.0002. Post-hoc analysis was per-formed using pairwise, heteroscedastic bootstrapping Student’s t-tests.
Fig. 2. Gridded Petri dish manufacture. (A) The gridded Petri dish design allowed sequential measurement of live-cell stiffness and fluorescent protein biomarker expressionat the single cell level, enabling a cell-by-cell analysis of the relationships among differentiation, mechanical, protein staining, and morphological factors. Force-indentationdata were used to evaluate the Young’s modulus of each cell. (B) Following engraving, the gridded Petri dish was covered with a glass coverslip, which prevented the gridfrom influencing morphology during cell attachment. (C) Magnified region of interest of Panel B, indicated in blue. The design of the grid was chosen to facilitate pinpointingof individual cells during AFM and fluorescence microscopy; scale bar, 750 mm. (D) Magnified region of interest of Panel C, indicated in red. The locations of individual cellswithin the grid were recorded during AFM. Dashed black lines indicate grid; scale bar, 25 μm. (E) AFM stiffness measurements were taken using a beaded cantilever toincrease cell-probe surface area, thereby allowing measurement of bulk cellular Young’s modulus. Scanning electron micrograph; scale bar, 10 μm. (For interpretation of thereferences to color in this figure legend, the reader is referred to the web version of this article.)
T. Bongiorno et al. / Journal of Biomechanics 47 (2014) 2197–2204 2199

225 total cells from the 7 hMSC-OB time points and the hOB sample weretested for pairwise correlations among phenotypic properties. Using JMP software(SAS Institute, Cary, NC), pairwise, nonparametric Spearman’s correlation coeffi-cients were calculated to test for monotonic trends among the 14 single-celldifferentiation, mechanical, protein staining, and morphological variables andamong the day of differentiation and population protein staining variables. Forthe purposes of correlation calculations, the “hOB” time point was considered to beafter Day 20 of hMSC differentiation. Two-tailed p-values (H0: ρ¼0) werecalculated for each correlation coefficient using Student’s t-test.
All obtained p-values were adjusted using Holm’s procedure for multiplecomparisons. Since Holm’s adjusted p-values tend to be conservative, α¼0.10was chosen. Original and adjusted p-values are listed in the SupplementaryInformation.
3. Results
3.1. Cell mechanics
Before investigating the relationships between cellular stiffnessand molecular differentiation biomarkers, stiffness trends duringdifferentiation were examined. The stiffness values of passage4 hMSCs from two donors were not significantly different (Fig. S3,p¼0.368), so donor 8002 L was used for the remainder of the study.Analysis of force-indentation curves generally yielded higherYoung’s moduli for hMSCs than hOBs (Fig. 3A). Although thestiffness data were highly variable (coefficient of variation40.5),stiffness generally decreased during osteoblast differentiation(Fig. 3B). Importantly, Day 20 hMSC-OBs were significantlysofter than naive hMSCs (padjusted¼0.083), but not hOBs (Fig. 3C,padjusted¼1.000).
3.2. Pairwise correlations among single-cell parameters
Spearman’s correlations were calculated among the differentia-tion, mechanical, protein staining, and morphological parameters foreach cell (Fig. 4A). A significant inverse relationship between Young’smodulus and the day of differentiation was supported by the Spear-man’s correlation coefficient (ρ¼�0.214, padjusted¼0.055) and thepartial Spearman’s correlation coefficient (r¼�0.145, p¼0.033,Supplementary Excel Sheet 1), substantiating the observed decreasein stiffness during differentiation. Young’s modulus correlated posi-tively and significantly with major axis, Feret’s diameter, perimeter,and area, but negatively and significantly with circularity, indicatingthat the stiffest cells were generally large and elongated (Fig. 4A).
The strong, positive correlation between single-cell BSP andOCN suggested coordinated protein expression changes, which isexpected since BSP and OCN are both osteoblast differentiationmarkers. However, correlations between the day of differentiationand protein staining for individual cells were weak and not statis-tically significant (BSP, ρ¼0.198, padjusted¼0.107; OCN, ρ¼0.181,padjusted¼0.230). For individual days of differentiation, the correla-tions between protein staining and Young’s modulus were alsoweak (|ρ|o0.45) and not statistically significant (Fig. 4B and S4;BSP, padjusted¼1.000; OCN, padjusted¼0.960).
The increase in BSP and OCN staining intensity during differ-entiation was more pronounced for population than single-cellstaining (Fig. 5). The weak correlations (|ρ|o0.2) between single-cell protein staining and the day of differentiation corroboratedthe weak, not statistically significant correlations between single-cell protein staining and Young’s modulus.
4. Discussion
During chemically-induced hMSC osteoblast differentiation,decreases in cellular stiffness, size, and circularity were observed.Whereas Young’s modulus indicated differentiation of single cells,
staining for BSP and OCN indicated differentiation more robustlyat the population than the single-cell level.
The cellular softening observed during hMSC osteoblast differ-entiation may have resulted from concurrent changes in theunderlying cellular structure. Recent studies predicted stem celldifferentiation fate based on the combination of several actinfilament morphology descriptors (Treiser et al., 2010). F-actinstaining parameters, including mean intensity, total intensity,and the number of F-actin branches, changed during hMSCosteoblast differentiation (Treiser et al., 2010). Furthermore, thecellular softening observed during osteoblast differentiation hasbeen attributed to a simultaneous transition from many thickeractin fibers to a fewer number of thinner actin fibers in hMSCs
Fig. 3. Atomic force microscopy. (A) Three force-indentation curves per cell were fitto the Hertzian contact model to calculate the mean Young’s modulus. Represen-tative force-indentation curves yielded mean Young’s moduli of approximately4.3 kPa for the naive hMSC (blue), and 1.9 kPa for the hOB (red). (B) Young’smodulus generally decreased as osteoblast differentiation progressed, although alarge degree of variation was observed (coefficient of variation40.5). Lines indicatemean7standard error. Day 0, n¼26; Day 6, n¼28; others, n¼30. (C) Statisticalsignificance of mean Young’s modulus differences among the 8 cell conditions isdisplayed. Importantly, Day 20 hMSC-OBs were significantly softer than naivehMSCs, but not hOBs. Holm’s adjusted p-values range from 0 (bright red) to 1(bright blue). Crosshatch pattern indicates that the difference between meanYoung’s moduli is not statistically significant (α¼0.10). (For interpretation of thereferences to color in this figure legend, the reader is referred to the web version ofthis article.)
T. Bongiorno et al. / Journal of Biomechanics 47 (2014) 2197–22042200

(Titushkin and Cho, 2007; Yourek et al., 2007) and amniotic fluid-derived stem cells (Chen et al., 2010). In hMSCs, actin stress fiberswere long, thin, parallel, and oriented along the major axis of thecell; cytoskeletal rearrangement during osteoblast differentiationresulted in hMSC-OBs with thicker, disordered actin filaments(Rodríguez et al., 2004; Titushkin and Cho, 2007; Yourek et al.,2007). Interestingly, the actin organization of the spindle-shaped“rapidly self-renewing” hMSC subset matched the expected hMSC
phenotype, but the “flat cell” hMSC subset matched the osteoblastphenotype (Docheva et al., 2008). The presence of hMSC morphol-ogy subsets indicates the large degree of hMSC heterogeneity,which may partially explain the large degree of stiffness variationobserved in naive hMSCs (Fig. 3B).
To further investigate the notion of cytoskeletal rearrangementduring osteoblast differentiation, raw gene expression data forDay 0, 1, 7, and 10–14 hMSC-OBs and hOBs (Granchi et al., 2010)
Fig. 4. Single-cell correlations. (A) For 225 individual cells, values of the 14 differentiation, mechanical, protein staining, and morphological parameters were determinedfrom AFM data and fluorescence image processing. Staining for BSP and OCN was quantified as the fraction of pixels within the cell boundary that exceeded a threshold value(“percent area”). Pairwise Spearman’s correlation coefficients among the 14 variables are displayed. Spearman’s rank correlation coefficients range from �1 (bright blue) toþ1 (bright red). Crosshatch pattern indicates a correlation that was not statistically significant based on Holm’s adjusted p-values (α¼0.10). Day 0, n¼26; Day 3, n¼29; Day6, n¼24; Day 20, n¼27; hOBs, n¼29; others, n¼30. A significant inverse relationship between Young’s modulus and the day of differentiation was observed. The strong,positive correlation between bone sialoprotein (BSP) and osteocalcin (OCN) staining appears to suggest that BSP and OCN staining both reflect osteoblast differentiation asexpected. However, correlations between the day of differentiation and protein staining were weak and not statistically significant. (B) For each cell condition, the correlationbetween BSP (top, blue) or OCN staining (bottom, red) and Young’s modulus was weak (|ρ|o0.45) and not statistically significant (for other time points, see Fig. S4).(For interpretation of the references to color in this figure legend, the reader is referred to the web version of this article.)
T. Bongiorno et al. / Journal of Biomechanics 47 (2014) 2197–2204 2201

were downloaded from the gene expression omnibus dataset GSE12267 (http://www.ncbi.nlm.nih.gov/geo/) and analyzed by gene setenrichment analysis (GSEA) and differential expression analysis(DEA), as described in the Supplementary Information. GSEA indi-cated that the chromosome, chromatin, and cytoskeleton cellularcomponent ontologies were relevant to the phenotypic differencesbetween hMSCs and hOBs. Furthermore, genes identified by DEA asdifferentially expressed between hMSCs and hOBs were found to be
significantly enriched in cytoskeleton remodeling-related maps (Figs.S5 and S6). Several genes related to actin binding and regulation ofthe actin cytoskeleton were decreased (ACTN1 [α-actinin-1], ACTG2,ACTR2, ANLN, FBLIM1) or increased (TWF1 [twinfilin], ADD3, andGSN [gelsolin]) in hOBs relative to hMSCs (Supplementary ExcelSheet 2). Time course analysis also identified 222 genes withconsistent expression increase during osteoblast differentiation(Supplementary Excel Sheet 3).
Fig. 5. Biomarker changes during hMSC differentiation. (A) The difference in bone sialoprotein (BSP) and osteocalcin (OCN) staining between the representative naive hMSCand hOB images was visually more apparent for population than single-cell images, indicating that BSP and OCN staining may more rigorously indicate osteoblastdifferentiation for cell populations than single cells. Scale bars, 50 μm. (B) BSP and OCN staining did not appear to trend strongly with the day of differentiation for single-cellstaining, but population staining revealed more abundant protein staining for the later days of differentiation (meanþstandard error). (C) Correlations between the day ofdifferentiation and protein staining were weaker for single-cell than population staining. Spearman's rank correlation coefficients range from �1 (bright blue) to þ1 (brightred). Checkerboard pattern indicates a correlation that was not statistically significant based on Holm’s adjusted p-values (α¼0.10). Single-cell data are repeated from Fig. 4A,but Holm’s adjustment was reapplied using N¼3 for purposes of comparison. (For interpretation of the references to color in this figure legend, the reader is referred to theweb version of this article.)
T. Bongiorno et al. / Journal of Biomechanics 47 (2014) 2197–22042202

Gene expression analysis suggested that cytoskeletal remodel-ing during osteoblast differentiation may result from the com-bined effects of reduced G-actin polymerization, reduced F-actincross-linking, and enhanced severing of actin filaments. ReducedG-actin polymerization in hOBs was indicated by decreasedexpression of actin monomers (e.g. ACTG2), twinfilin-mediatedsequestration of G-actin (Ojala et al., 2002), and decreased activityof the Arp2/3 complex. Reduced F-actin cross-linking in hOBs wasindicated by decreased expression of α-actinin-1, which is criticalin leading edge focal adhesion maturation during cell spreading(Kovac et al., 2013). Decreased expression of α-actinin-1 in hOBsmay therefore partially explain the positive correlation betweencell size and stiffness (Fig. 4A). Increased expression of twinfilinand gelsolin suggested enhanced severing of actin filaments inhOBs. Gene expression analysis therefore supported actin cytos-keletal rearrangement during osteoblast differentiation.
Previous work has directly linked actin reorganization to cellstiffness changes. Cells characterized by ordered actin filamentgeometry tended to be stiffer than cells with disordered actinfibers (Ketene et al., 2012; Xu et al., 2012). Furthermore, α-actinin-1, which was increased in hMSCs relative to hOBs, crosslinks actinfilaments and increases the stiffness of the actin filament network(Esue et al., 2009; Xu et al., 1998). Therefore, based solely on actinfiber organization, hMSCs would be expected to soften duringosteoblast differentiation, as shown previously (Chen et al., 2010;Titushkin and Cho, 2007) and in the present study. Furthermore,the connections between cellular stiffness and reported changes incytoskeletal gene expression lend credence to the observed soft-ening during osteoblast differentiation.
The mechanics data of spread morphology hMSCs duringosteoblast differentiation is characterized by a large degree ofvariation (Darling et al., 2008; Docheva et al., 2008; Titushkin andCho, 2007; Yourek et al., 2007). Thus, measures were taken tocontrol substrate-induced stiffening and cell density, which couldotherwise confound stiffness data since naive MSC stiffnessincreases with the duration of growth in vitro (Maloney et al.,2010). Passage 4 cells were used throughout the study to keep thetotal amount of time in vitro constant and reduce confoundingsubstrate-induced stiffness changes. Furthermore, a “staggered”differentiation scheme was employed, allowing all cells to grow ontissue culture polystyrene for an equal amount of time before AFManalysis. Cells were also trypsinized and replated approximately1 day before AFM measurements. Adhesion of the replated cellsmay have resulted in some differences in differentiation fromtraditional induction assays; however, replating at low cell densitylimited morphology changes due to uncontrolled cell-cell contact,which can influence cell mechanics measurements (Efremov et al.,2013). Factors that could otherwise confound stiffness compar-isons between differentiation time points were controlled, whichstrengthens the claim that cell stiffness decreases during osteo-blast differentiation.
BSP and OCN are commonly used to indicate osteoblastdifferentiation, but correlations between the day of differentiationand single-cell protein staining were not significant (Fig. 4A). Thetrend between protein staining and the day of differentiation wasstronger for population staining than single-cell staining (Fig. 5C),which may reflect the extracellular localization of BSP and OCN aswell as the concept of asynchronous osteoblast differentiation.Unlike single-cell staining, population averaged protein stainingcannot detect subsets of cells that express BSP or OCN at any onetime, as previously observed in the formation of nodules prior tohMSC osteoblast differentiation (Aubin and Triffitt, 2002). Young’smodulus may therefore provide additional and improved informa-tion on the osteoblastic state of single cells.
As a label-free property of individual cells, Young’s modulusholds great potential in phenotype identification. Furthermore,
Young’s modulus is attributable to individual suspended cells, andthus potentially lends itself to phenotypic cell sorting applications.Recent developments in cell separation by adhesion (Singh et al.,2013) and stiffness (Hur et al., 2012; Wang et al., 2013) indicatefuture label-free cell sorting capabilities for cases in whichmolecular biomarkers are not fully established. Continued inves-tigation of various differentiation lineages, besides the osteoblastdifferentiation considered in this study, is required to furtherunderstand mechanical differentiation indicators. Additional char-acterization of stiffness and other cell-intrinsic physical propertiespromises to result in the development of novel, label-free cellidentification and sorting capabilities.
Conflict of interest statement
The authors declare no competing financial interests associatedwith this work.
Acknowledgments
The authors gratefully acknowledge Alice Cheng for scanningelectron microscopy and Priya Baraniak for helpful discussions.hMSCs were provided by the Texas A&M Health Science CenterCollege of Medicine Institute for Regenerative Medicine at Scott& White through a Grant from NCRR of the NIH, Grant #P40RR017447. Funding was provided by the National ScienceFoundation, Grant # CBET-0932510, as well as the NSF Stem CellBiomanufacturing IGERT (TB) and the President's UndergraduateResearch Award (JK) at Georgia Tech. The study sponsors were notinvolved in the study design, the collection, analysis, and inter-pretation of data, the writing of the manuscript, or the decision tosubmit the manuscript for publication.
Appendix A. Supplementary material
Supplementary data associated with this article can be found inthe online version at http://dx.doi.org/10.1016/j.jbiomech.2013.11.017.
References
Amini, A.R., Laurencin, C.T., Nukavarapu, S.P., 2012. Bone tissue engineering: recentadvances and challenges. Crit. Rev. Biomed. Eng. 40, 363–408.
Aubin, J.E., Triffitt, J.T., 2002. Mesenchymal stem cells and osteoblast differentiation,Principles of Bone Biology. Academic Press, San Diego, pp. 59–81.
Carpenter, A.E., Jones, T.R., Lamprecht, M.R., Clarke, C., Kang, I.H., Friman, O.,Guertin, D.A., Chang, J.H., Lindquist, R.A., Moffat, J., Golland, P., Sabatini, D.M.,2006. CellProfiler: image analysis software for identifying and quantifying cellphenotypes. Genome Biol., 7; p. R100.
Chen, Q., Xiao, P., Chen, J.N., Cai, J.Y., Cai, X.F., Ding, H., Pan, Y.L., 2010. AFM studies ofcellular mechanics during osteogenic differentiation of human amniotic fluid-derived stem cells. Anal. Sci. 26, 1033–1037.
Cregger, M., Berger, A.J., Rimm, D.L., 2006. Immunohistochemistry and quantitativeanalysis of protein expression. Arch. Pathol. Lab. Med. 130, 1026–1030.
Cross, S.E., Jin, Y.S., Rao, J., Gimzewski, J.K., 2007. Nanomechanical analysis of cellsfrom cancer patients. Nat. Nanotechnol. 2, 780–783.
Darling, E.M., Topel, M., Zauscher, S., Vail, T.P., Guilak, F., 2008. Viscoelasticproperties of human mesenchymally-derived stem cells and primary osteo-blasts, chondrocytes, and adipocytes. J. Biomech. 41, 454–464.
Darling, E.M., Zauscher, S., Block, J.A., Guilak, F., 2007. A thin-layer model forviscoelastic, stress-relaxation testing of cells using atomic force microscopy: docell properties reflect metastatic potential? Biophys. J. 92, 1784–1791.
Di Carlo, D., Tse, H.T.K., Gossett, D.R., 2012. Introduction: why analyze single cells?.In: Lindström, S., Andersson-Svahn, H. (Eds.), Methods in Molecular Biology,vol. 853. Springer (Humana Press), pp. 1–10.
Docheva, D., Padula, D., Popov, C., Mutschler, W., Clausen-Schaumann, H., Schieker,M., 2008. Researching into the cellular shape, volume and elasticity ofmesenchymal stem cells, osteoblasts and osteosarcoma cells by atomic forcemicroscopy. J. Cell. Mol. Med. 12, 537–552.
T. Bongiorno et al. / Journal of Biomechanics 47 (2014) 2197–2204 2203

Efremov, Y.M., Dokrunova, A.A., Bagrov, D.V., Kudryashova, K.S., Sokolova, O.S.,Shaitan, K.V., 2013. The effects of confluency on cell mechanical properties. J.Biomech. 46, 1081–1087.
Esue, O., Tseng, Y., Wirtz, D., 2009. Alpha-actinin and filamin cooperatively enhancethe stiffness of actin filament networks. PLoS ONE 4, e4411.
Gerger, A., Bergthaler, P., Smolle, J., 2004. An automated method for the quantifica-tion and fractal analysis of immunostaining. Cell. Oncol. 26, 125–134.
González-Cruz, R.D., Fonseca, V.C., Darling, E.M., 2012. Cellular mechanical proper-ties reflect the differentiation potential of adipose-derived mesenchymal stemcells. Proc. Natl. Acad. Sci. USA 109, E1523–E1529.
Granchi, D., Ochoa, G., Leonardi, E., Devescovi, V., Baglìo, S.R., Osaba, L., Baldini, N.,Ciapetti, G., 2010. Gene expression patterns related to osteogenic differentiationof bone marrow-derived mesenchymal stem cells during ex vivo expansion.Tissue Eng. Part C, Methods 16, 511–524.
Hammerick, K.E., Huang, Z., Sun, N., Lam, M.T., Prinz, F.B., Wu, J.C., Commons, G.W.,Longaker, M.T., 2011. Elastic properties of induced pluripotent stem cells. TissueEng. Pt. A 17, 495–502.
Hu, M., Wang, J., Zhao, H., Dong, S., Cai, J., 2009. Nanostructure and nanomechanicsanalysis of lymphocyte using AFM: from resting, activated to apoptosis. J.Biomech. 42, 1513–1519.
Hur, S.C., Brinckerhoff, T.Z., Walthers, C.M., Dunn, J.C., Di Carlo, D., 2012. Label-freeenrichment of adrenal cortical progenitor cells using inertial microfluidics. PLoSONE 7, e46550.
Hutter, J.L., Bechhoefer, J., 1993. Calibration of atomic-force microscope tips. Rev.Sci. Instrum. 64, 1868.
Hwang, N.S., Zhang, C., Hwang, Y.S., Varghese, S., 2009. Mesenchymal stem celldifferentiation and roles in regenerative medicine. Wiley Interdiscip. Rev. Syst.Biol. Med. 1, 97–106.
Ketene, A.N., Roberts, P.C., Shea, A.A., Schmelz, E.M., Agah, M., 2012. Actin filamentsplay a primary role for structural integrity and viscoelastic response in cells.Integr. Biol. 4, 540–549.
Kovac, B., Teo, J.L., Mäkelä, T.P., Vallenius, T., 2013. Assembly of non-contractiledorsal stress fibers requires alpha-actinin-1 and Rac1 in migrating andspreading cells. J. Cell Sci. 126, 263–273.
Lam, W.A., Rosenbluth, M.J., Fletcher, D.A., 2007. Chemotherapy exposure increasesleukemia cell stiffness. Blood 109, 3505–3508.
Maloney, J.M., Nikova, D., Lautenschläger, F., Clarke, E., Langer, R., Guck, J., Van Vliet,K.J., 2010. Mesenchymal stem cell mechanics from the attached to thesuspended state. Biophys. J. 99, 2479–2487.
Ofek, G., Willard, V.P., Koay, E.J., Hu, J.C., Lin, P., Athanasiou, K.A., 2009. Mechanicalcharacterization of differentiated human embryonic stem cells. J. Biomech. Eng.131, 061011.
Ojala, P.J., Paavilainen, V.O., Vartiainen, M.K., Tuma, R., Weeds, A.G., Lappalainen, P.,2002. The two ADF-H domains of twinfilin play functionally distinct roles ininteractions with actin monomers. Mol. Biol. Cell 13, 3811–3821.
Pajerowski, J.D., Dahl, K.N., Zhong, F.L., Sammak, P.J., Discher, D.E., 2007. Physicalplasticity of the nucleus in stem cell differentiation. Proc. Natl. Acad. Sci. USA104, 15619–15624.
Pillarisetti, A., Desai, J.P., Ladjal, H., Schiffmacher, A., Ferreira, A., Keefer, C.L., 2011.Mechanical phenotyping of mouse embryonic stem cells: increase in stiffnesswith differentiation. Cell. Reprogr. 13, 371–380.
Platt, M.O., Wilder, C.L., Wells, A., Griffith, L.G., Lauffenburger, D.A., 2009. Multi-pathway kinase signatures of multipotent stromal cells are predictive forosteogenic differentiation: tissue-specific stem cells. Stem Cells 27, 2804–2814.
Rodríguez, J.P., González, M., Rios, S., Cambiazo, V., 2004. Cytoskeletal organizationof human mesenchymal stem cells (MSC) changes during their osteogenicdifferentiation. J. Cell. Biochem. 93, 721–731.
Singh, A., Suri, S., Lee, T., Chilton, J.M., Cooke, M.T., Chen, W., Fu, J., Stice, S.L., Lu, H.,McDevitt, T.C., Garcıa, A.J., 2013. Adhesion strength-based, label-free isolationof human pluripotent stem cells. Nat. Methods 10, 438–444.
Sommer, C., Straehle, C., Kothe, U., Hamprecht, F.A., 2011. Ilastik: InteractiveLearning and Segmentation Toolkit. Presented at the 8th IEEE InternationalSymposium on Biomedical Imaging (ISBI 2011), IEEE. pp. 230–233.
Suresh, S., 2007. Biomechanics and biophysics of cancer cells. Acta Biomater. 3,413–438.
Tan, Y., Kong, C.W., Chen, S., Cheng, S.H., Li, R.A., Sun, D., 2012. Probing themechanobiological properties of human embryonic stem cells in cardiacdifferentiation by optical tweezers. J. Biomech. 45, 123–128.
Titushkin, I., Cho, M., 2007. Modulation of cellular mechanics during osteogenicdifferentiation of human mesenchymal stem cells. Biophys. J. 93, 3693–3702.
Treiser, M.D., Yang, E.H., Gordonov, S., Cohen, D.M., Androulakis, I.P., Kohn, J., Chen,C.S., Moghe, P.V., 2010. Cytoskeleton-based forecasting of stem cell lineagefates. Proc. Natl. Acad. Sci. USA 107, 610–615.
Vater, C., Kasten, P., Stiehler, M., 2011. Culture media for the differentiation ofmesenchymal stromal cells. Acta Biomater. 7, 463–477.
Wang, G., Mao, W., Byler, R., Patel, K., Henegar, C., Alexeev, A., Sulchek, T., 2013.Stiffness dependent separation of cells in a microfluidic device. PLoS ONE 8,e75901.
Xu, J., Wirtz, D., Pollard, T.D., 1998. Dynamic cross-linking by alpha-actinindetermines the mechanical properties of actin filament networks. J. Biol. Chem.273, 9570–9576.
Xu, W., Mezencev, R., Kim, B., Wang, L., McDonald, J., Sulchek, T., 2012. Cell stiffnessis a biomarker of the metastatic potential of ovarian cancer cells. PLoS ONE 7,e46609.
Yourek, G., Hussain, M.A., Mao, J.J., 2007. Cytoskeletal changes of mesenchymalstem cells during differentiation. ASAIO J. 53, 219–228.
Yu, H., Tay, C.Y., Leong, W.S., Tan, S.C.W., Liao, K., Tan, L.P., 2010. Mechanicalbehavior of human mesenchymal stem cells during adipogenic and osteogenicdifferentiation. Biochem. Biophys. Res. Commun. 393, 150–155.
T. Bongiorno et al. / Journal of Biomechanics 47 (2014) 2197–22042204