Pizzas: π or square? psychophysical biases in area estimation
Upload
independentCategory
view
1download
0
arX
iv:h
ep-e
x/06
0103
8v1
23
Jan
2006
Measurement of the Form-Factor Slopes forthe Decay KL → π±e∓ν with the KLOE
Detector
The KLOE Collaboration
F. Ambrosino e, A. Antonelli b M. Antonelli b,1, C. Bacci i,P. Beltrame c, G. Bencivenni b, S. Bertolucci b, C. Bini g,
C. Bloise b, V. Bocci g, F. Bossi b, D. Bowring a, P. Branchini i,R. Caloi g, P. Campana b, G. Capon b, T. Capussela e,
F. Ceradini i, S. Chi b, G. Chiefari e, P. Ciambrone b,S. Conetti a, E. De Lucia b, A. De Santis g, P. De Simone b,
G. De Zorzi g, S. Dell’Agnello b, A. Denig c, A. Di Domenico g,
C. Di Donato e, S. Di Falco j, B. Di Micco i, A. Doria e,M. Dreucci b,2, G. Felici b, A. Ferrari c, M. L. Ferrer b,
G. Finocchiaro b, S. Fiore g, C. Forti b, P. Franzini g, C. Gatti b,3,P. Gauzzi g, S. Giovannella b, E. Gorini d, E. Graziani i,
M. Incagli j, W. Kluge c, V. Kulikov m, F. Lacava g,G. Lanfranchi b, J. Lee-Franzini b,k, D. Leone c, M. Martini b,
P. Massarotti e, W. Mei b, S. Meola e, S. Miscetti b,M. Moulson b, S. Muller c, F. Murtas b, M. Napolitano e,F. Nguyen i, M. Palutan b, E. Pasqualucci g, A. Passeri i,
V. Patera b,f, F. Perfetto e, L. Pontecorvo g, M. Primavera d,P. Santangelo b, E. Santovetti h, G. Saracino e, B. Sciascia b,
A. Sciubba b,f, F. Scuri j, I. Sfiligoi b, T. Spadaro b, M. Testa g,L. Tortora i, P. Valente b, B. Valeriani c, G. Venanzoni b,
S. Veneziano g, A. Ventura d, R. Versaci c, G. Xu b,ℓ,
aPhysics Department, University of Virginia, Charlottesville, VA, USA.
bLaboratori Nazionali di Frascati dell’INFN, Frascati, Italy.
cInstitut fur Experimentelle Kernphysik, Universitat Karlsruhe, Germany.
dDipartimento di Fisica dell’Universita e Sezione INFN, Lecce, Italy.
eDipartimento di Scienze Fisiche dell’Universita “Federico II” e Sezione INFN,
Napoli, Italy
fDipartimento di Energetica dell’Universita “La Sapienza”, Roma, Italy.
gDipartimento di Fisica dell’Universita “La Sapienza” e Sezione INFN, Roma,
Italy.
Preprint submitted to Elsevier Scienze 7 February 2008
hDipartimento di Fisica dell’Universita “Tor Vergata” e Sezione INFN, Roma,
Italy.
iDipartimento di Fisica dell’Universita “Roma Tre” e Sezione INFN, Roma, Italy.
jDipartimento di Fisica dell’Universita e Sezione INFN, Pisa, Italy.
kPhysics Department, State University of New York at Stony Brook, NY, USA.
ℓPermanent address: Institute of High Energy Physics, CAS, Beijing, China.
mPermanent address: Institute for Theoretical and Experimental Physics, Moscow,
Russia.
1 Corresponding author: Mario Antonelli INFN - LNF, Casella postale 13, 00044
Frascati (Roma), Italy; tel. +39-06-94032728, e-mail [email protected]
2 Corresponding author: Marco Dreucci INFN - LNF, Casella postale 13, 00044
Frascati (Roma), Italy; tel. +39-06-94032696, e-mail [email protected]
3 Corresponding author: Claudio Gatti INFN - LNF, Casella postale 13, 00044
Frascati (Roma), Italy; tel. +39-06-94032727, e-mail [email protected]
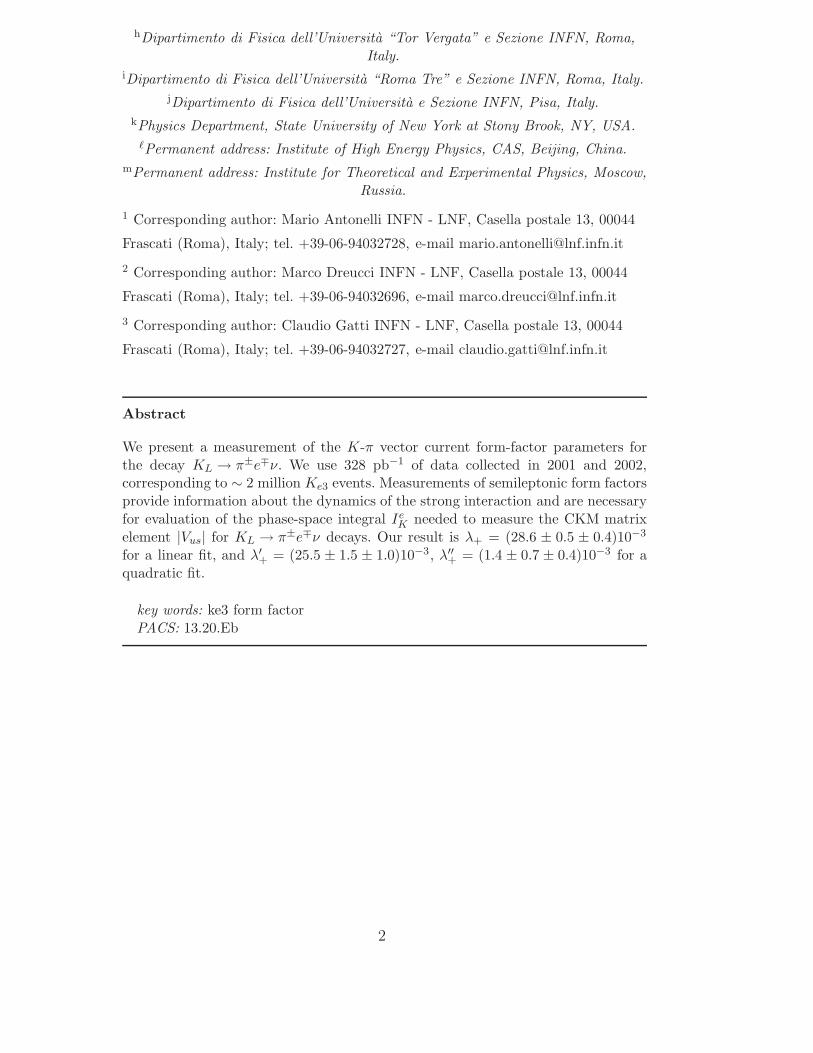
Abstract
We present a measurement of the K-π vector current form-factor parameters forthe decay KL → π±e∓ν. We use 328 pb−1 of data collected in 2001 and 2002,corresponding to ∼ 2 million Ke3 events. Measurements of semileptonic form factorsprovide information about the dynamics of the strong interaction and are necessaryfor evaluation of the phase-space integral Ie
K needed to measure the CKM matrixelement |Vus| for KL → π±e∓ν decays. Our result is λ+ = (28.6 ± 0.5 ± 0.4)10−3
for a linear fit, and λ′+ = (25.5 ± 1.5 ± 1.0)10−3, λ′′
+ = (1.4 ± 0.7 ± 0.4)10−3 for aquadratic fit.
key words: ke3 form factorPACS: 13.20.Eb
2
1 Introduction
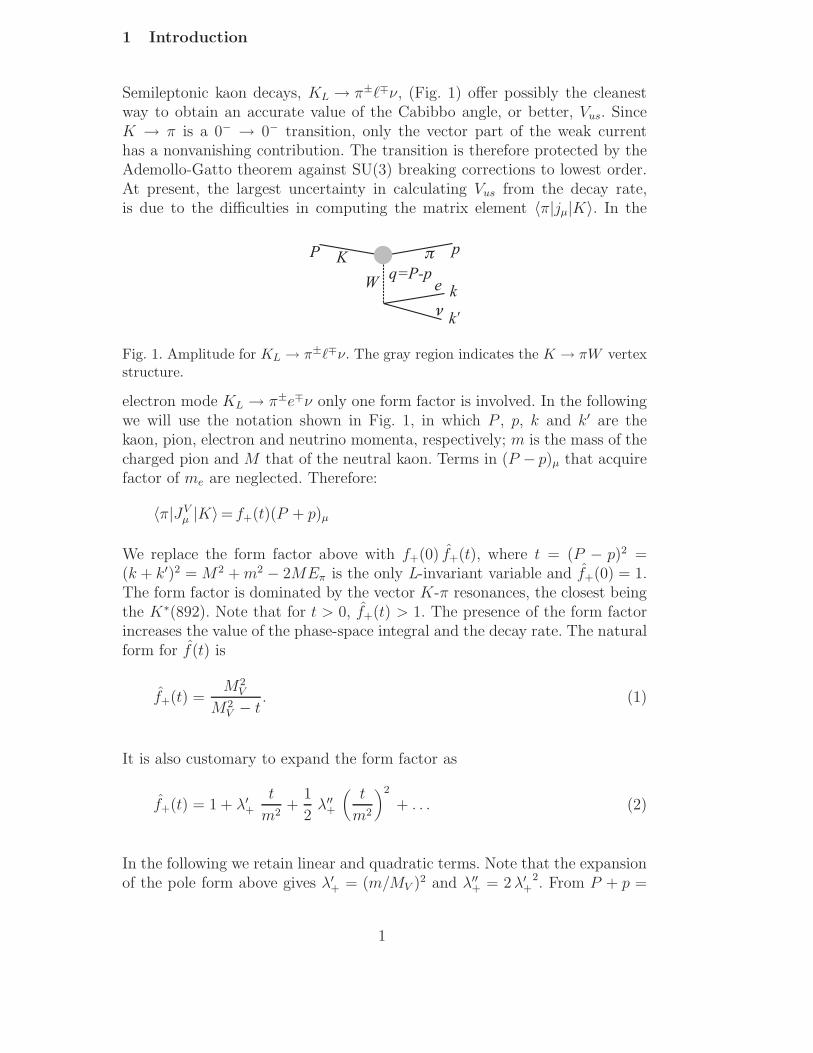
Semileptonic kaon decays, KL → π±ℓ∓ν, (Fig. 1) offer possibly the cleanestway to obtain an accurate value of the Cabibbo angle, or better, Vus. SinceK → π is a 0− → 0− transition, only the vector part of the weak currenthas a nonvanishing contribution. The transition is therefore protected by theAdemollo-Gatto theorem against SU(3) breaking corrections to lowest order.At present, the largest uncertainty in calculating Vus from the decay rate,is due to the difficulties in computing the matrix element 〈π|jµ|K〉. In the
P p
k¢
k
K p
q=P-pW e
n
Fig. 1. Amplitude for KL → π±ℓ∓ν. The gray region indicates the K → πW vertexstructure.
electron mode KL → π±e∓ν only one form factor is involved. In the followingwe will use the notation shown in Fig. 1, in which P , p, k and k′ are thekaon, pion, electron and neutrino momenta, respectively; m is the mass of thecharged pion and M that of the neutral kaon. Terms in (P − p)µ that acquirefactor of me are neglected. Therefore:
〈π|JVµ |K〉= f+(t)(P + p)µ
We replace the form factor above with f+(0) f+(t), where t = (P − p)2 =(k + k′)2 = M2 + m2 − 2MEπ is the only L-invariant variable and f+(0) = 1.The form factor is dominated by the vector K-π resonances, the closest beingthe K∗(892). Note that for t > 0, f+(t) > 1. The presence of the form factorincreases the value of the phase-space integral and the decay rate. The naturalform for f(t) is
f+(t) =M2
V
M2V − t
. (1)
It is also customary to expand the form factor as
f+(t) = 1 + λ′+
t
m2+
1
2λ′′
+
(
t
m2
)2
+ . . . (2)
In the following we retain linear and quadratic terms. Note that the expansionof the pole form above gives λ′
+ = (m/MV )2 and λ′′+ = 2 λ′
+2. From P + p =
1
2P − (k +k′), and neglecting the k +k′ term which is also proportional to me,the amplitude is:
M = 〈πeν|HW |K〉 = 2VusGF f+(0)√
2Pµu(k)γµ(1 − γ5)u(k′)f+(t). (3)
Squaring, summing over spins, and integrating over all variables but the pionenergy, we obtain the pion spectrum
g(z) ∝(
z2 − 4 α)
3
2
(
1 +λ′
+
α(ξ − z) +
λ′′+
2 α2(ξ − z)2
)2
where α = m2/M2, ξ = 1+ α and z = 2 Eπ/M is the normalized pion energy.The spectrum can also be written in terms of t = m2(ξ − z)/α as
h(t) ∝ λ3/2f+(t)2
λ = t 2 − 2 t (M 2 + 2 m 2) + (M 2 − m 2) 2(4)
2 The KLOE detector
The KLOE detector consists of a large, cylindrical drift chamber (DC), sur-rounded by a lead/scintillating-fiber electromagnetic calorimeter (EMC). Asuperconducting coil around the calorimeter provides a 0.52 T field. Thedrift chamber [1] is 4 m in diameter and 3.3 m long. The momentum res-olution is σp⊥/p⊥ ≈ 0.4%. Two-track vertices are reconstructed with a spa-tial resolution of ∼ 3 mm. The calorimeter [2] is divided into a barrel andtwo endcaps. It covers 98% of the solid angle. Cells close in time and spaceare grouped into calorimeter clusters. The energy and time resolutions are
σE/E = 5.7%/√
E (GeV) and σt = 57 ps/√
E (GeV) ⊕ 100 ps, respectively.
The KLOE trigger [3] uses calorimeter and chamber information. For thisanalysis, only the calorimeter signals are used. Two energy deposition abovethreshold (E > 50 MeV for the barrel and E > 150 MeV for the endcaps) arerequired. Recognition and rejection of cosmic-ray events is also performed atthe trigger level. Events with two energy deposition above a 30 MeV thresholdin the outermost calorimeter plane are rejected.
3 Analysis
The 328 pb−1 of 2001-2002 data used in this analysis [4], is divided into 14periods of about 25 pb−1/period. For each data period we have a correspondingsample of Monte Carlo events with approximately the same statistics.
2
Candidate KL events are tagged by the presence of a KS → π+π− decay. TheKL tagging algorithm is fully described in [5] and [6]. The KL momentum,pKL
, is obtained from the kinematics of the φ → KSKL decay, using theKS direction reconstructed from the measured momenta of the decay tracksand the known value of pφ. The resolution is dominated by the beam-energyspread, and amounts to about 0.8 MeV/c. The position of the φ productionpoint, xφ, is determined as the point of closest approach of the KS, propagatedbackward from the KS vertex, to the beam line. The KL line of flight (tagging
line) is then constructed from the KL momentum, pKL= pφ − pKS
, and theposition of the production vertex, xφ.
The efficiency of the tagging procedure depends slightly on the evolution ofthe KL, mainly because the trigger efficiency depends on the KL behavior.To identify events in which the KS by itself satisfies the calorimeter trigger,we require the presence of two clusters from the KS → π+π− decay associatedwith fired trigger sectors (autotrigger). The value of the tagging efficiencyobtained from Monte Carlo is about 40 % and is independent of t to within0.4%.
All tracks in the chamber, after removal of those from the KS decay and theirdescendants, are extrapolated to their points of closest approach to the taggingline. For each track candidate, we evaluate the point of closest approach to thetagging line, xc, and the distance of closest approach, dc. The momentum pc
of the track at xc and the extrapolation length lc are also computed. Trackssatisfying dc < arxy + b, with a = 0.03 and b = 3 cm, and −20 cm < lc < 25cm are accepted as KL decay products, where rxy is the distance of the vertexfrom the origin in the transverse plane. For each sign of charge we consider thetrack with the smallest value of dcto be associated to the KL decay. Startingfrom these track candidates a vertex is reconstructed. The combined trackingand vertexing efficiency for Ke3 decays is about 54%. It is determined fromdata as described in Ref. 5. An event is retained if the vertex is in the fiducialvolume 35 < rxy < 150 cm and |z| < 120 cm.
To remove background from KL → π+π−π0 and KL → π+π− decays with min-imal efficiency loss, we apply loose kinematic cuts: assuming the two tracksto have the pion mass, we require E2
miss − p2miss − M2
π0 < −5000 MeV2 and√
E2miss + p2
miss > 10 MeV, where Emiss and pmiss are the missing energy andmomentum, respectively. A large amount of background from KL → πµν de-cays is rejected using ∆πµ, the lesser value of |Emiss − pmiss| calculated in thetwo hypotheses, πµ or µπ. We retain events only if this variable is greaterthan 10MeV. After the kinematic cuts described above, the efficiency for thesignal is about 96%.
These kinematic criteria do not provide enaugh suppression of the back-ground from KL → π±e∓ν decays with incorrect charge assignment and from
3
KL → πµν decays. We make use of time-of-flight (TOF) information to furtherreduce the contamination.
For the purpose of track-to-cluster association, we define two quantities relatedto the distance between the track, extrapolated to the entry point of thecalorimeter, and the closest cluster: dTC, the distance from the extrapolatedentry point on the calorimeter to the cluster centroid and dTC⊥, the componentof this distance in the plane transverse to the momentum of the track at theentry position. We only consider clusters with dTC⊥ < 30 cm and E >50 MeV.
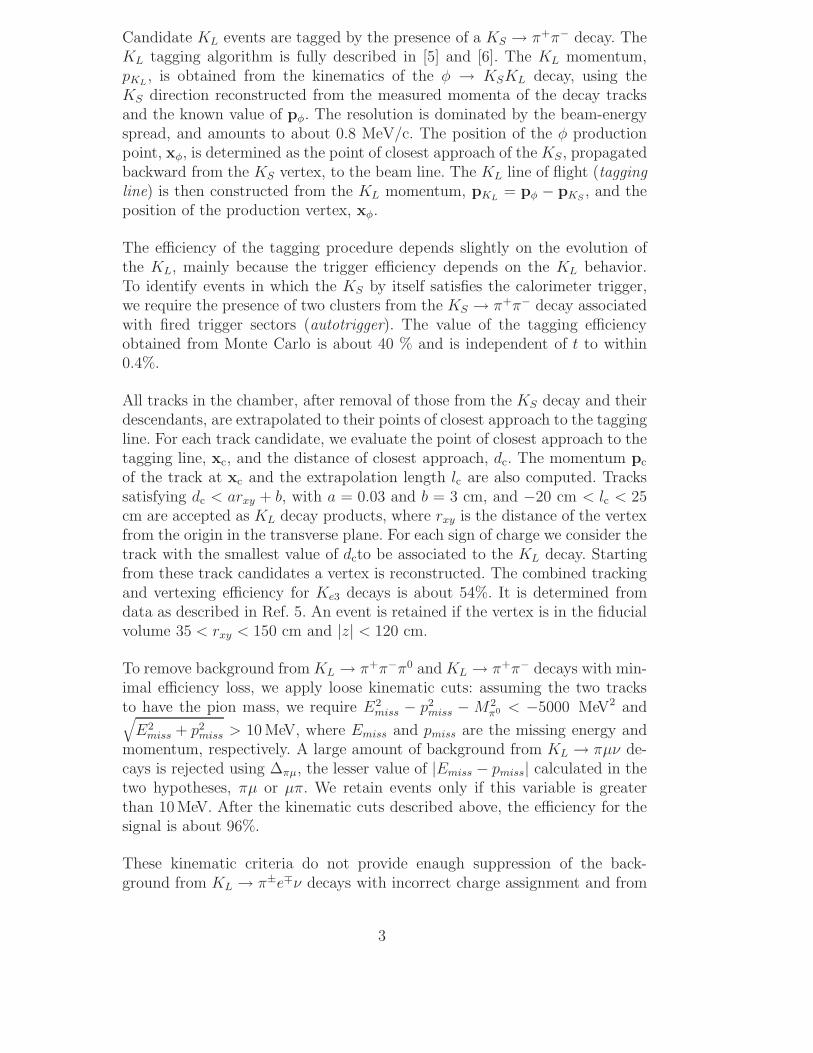
We evaluate the cluster efficiency using the Monte Carlo, and correct it withthe ratio of data and Monte Carlo efficiencies obtained from control samples. Asample of Ke3 events with a purity of 99.5% is selected by means of kinematicsand independent calorimeter information. Figure 2 shows the corrections asa function of t obtained for a single run period. It is worth emphasizing that
0.90
0.92
0.94
0.96
0.98
1.00
1.02
0 1 2 3 4 5 6
t / m2
εDT /εMC
Fig. 2. Cluster efficiency correction for pions (π− in red, π+ in black) on the endcap from control sample. The plot refers to a single period of data taking
if this correction were not taken into account, the effect on λ′+ would be
large (about 20%) and would produce different results for each charge (about15%). For this reason, the analysis is performed separately for each charge.The comparison of the two results provides a first check of the validity of thecorrections.
For each KL decay track with an associated cluster, we define the variable:∆ti = tcl − ti, (i = π, e) in which tcl is the cluster time and ti is the expectedtime of flight, evaluated according to a well-defined mass hypothesis. Theevaluating of ti includes the propagation time from the entry point to thecluster centroid [7]. We determine the e+e− collision time, t0, using the clustersfrom the KS.
4
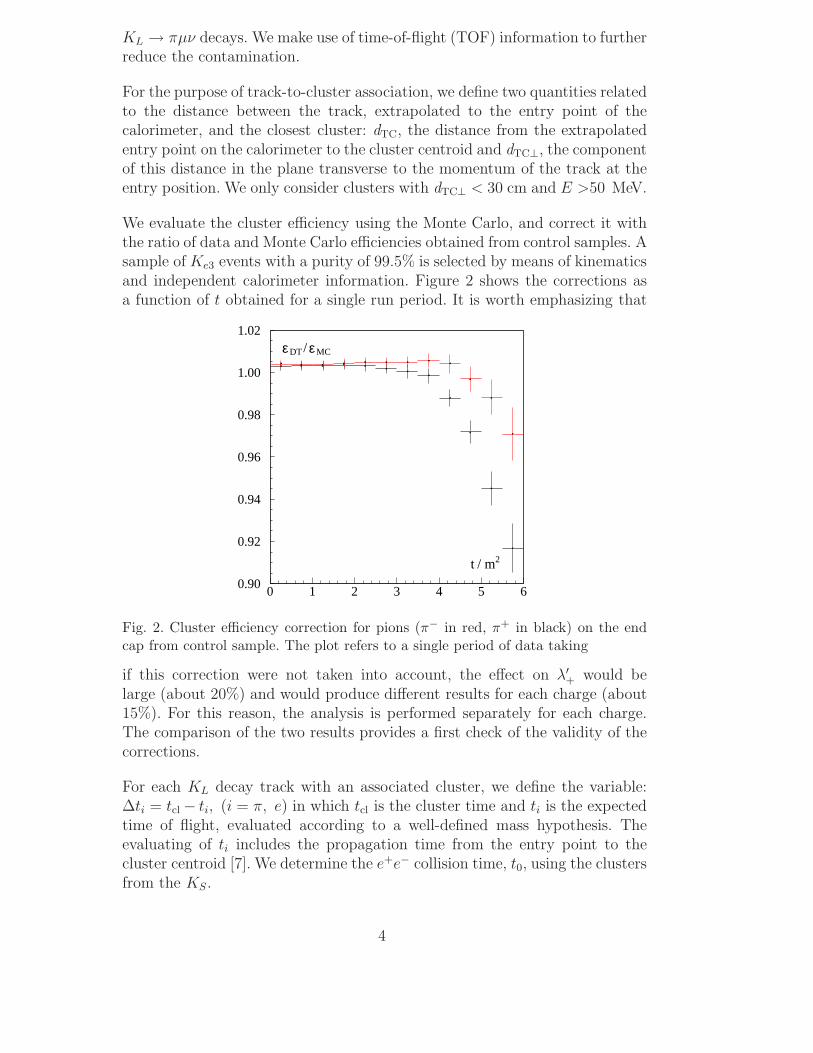
An effective way to select the correct mass assignment, πe or eπ, is obtainedby choosing the lesser of |∆tπ+ − ∆te−| and |∆tπ− − ∆te+ |. After the massassignment has been made, we consider the variables ∆tπ +∆te and ∆tπ−∆te.These are shown in Fig. 3 for signal and background Monte Carlo events. Weselect the signal by using a 2σ cut, where the resolution σ ≃ 0.5 ns. After the
-4
-2
0
2
4
-4 -3 -2 -1 0 1 2
∆te− ∆tπ (ns)
∆te+ ∆tπ (ns)
Fig. 3. Monte Carlo distribution of ∆te +∆tπ versus ∆te−∆tπ. Signal (gray scale),background from opposite sign KL → π±e∓ν (black dot), background from samesign KL → πµν (empty box).
TOF cut we have a contamination of ∼0.7%, almost entirely due to KL → πµνdecays.
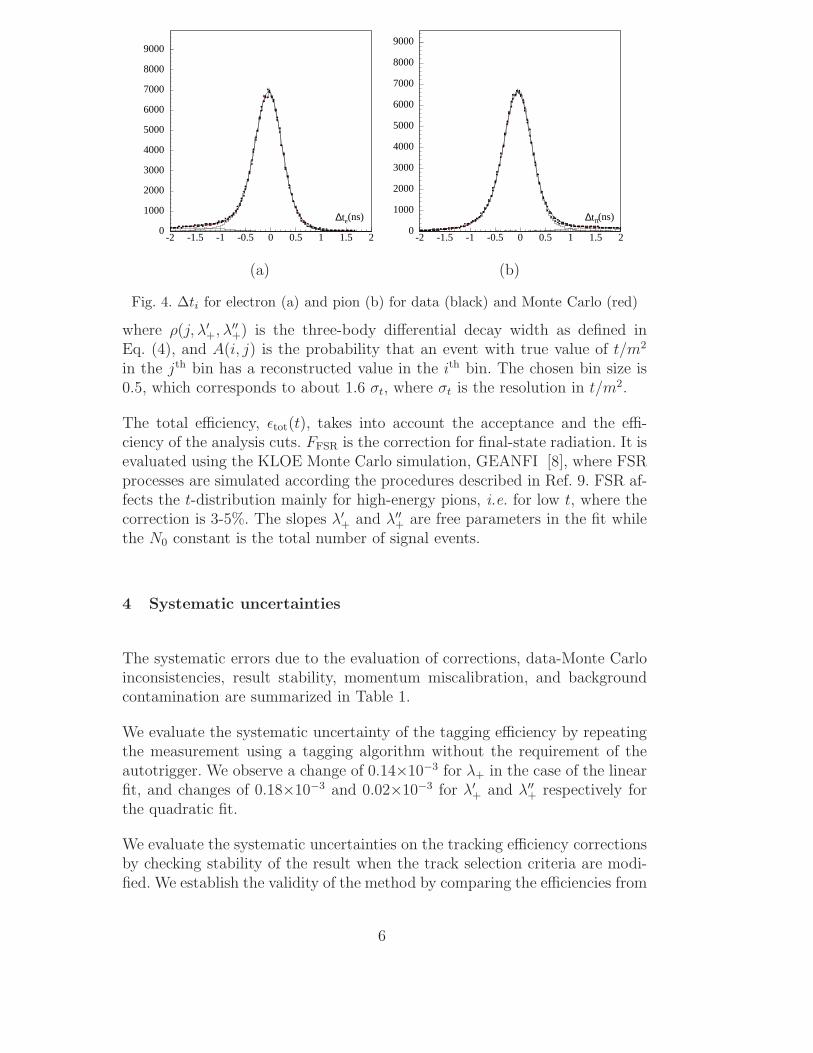
We take the TOF efficiency from the Monte Carlo after correcting the timeresponse of the calorimeter using data control samples [7]. The quality of thiscorrection can be checked by comparing the data and Monte Carlo distribu-tions for ∆te and ∆tπ shown in Fig. 4, obtained from the same control sampleused for the cluster efficiency.
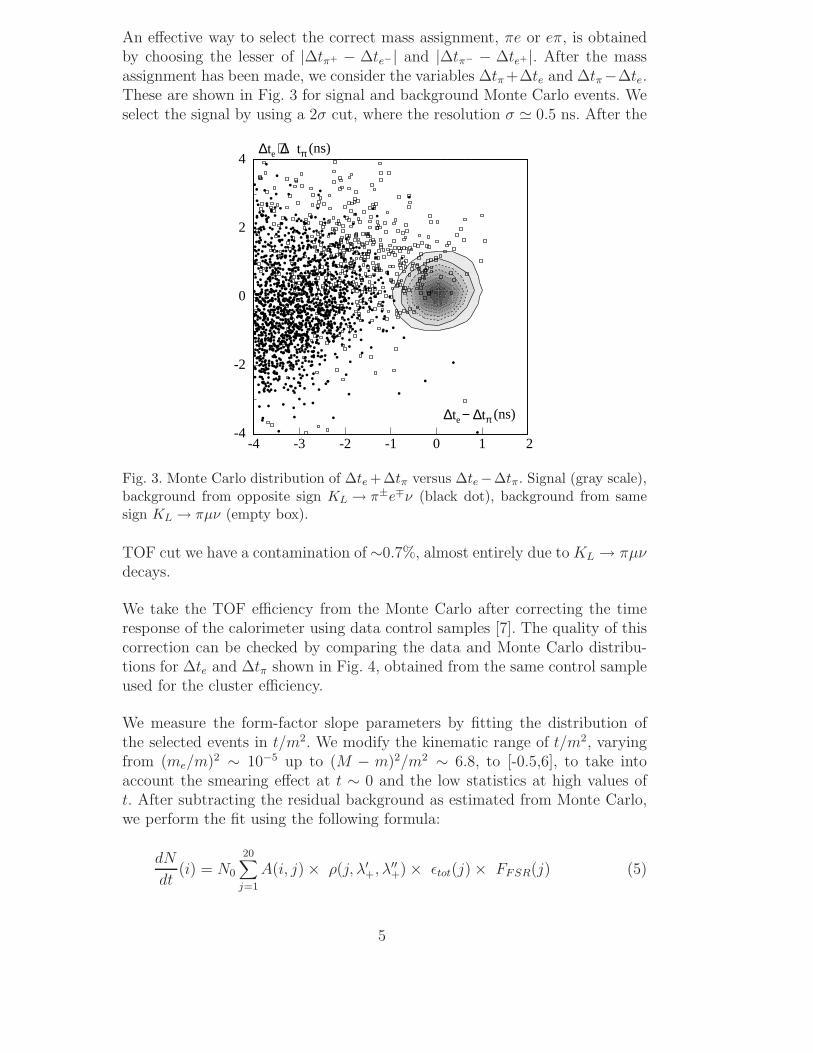
We measure the form-factor slope parameters by fitting the distribution ofthe selected events in t/m2. We modify the kinematic range of t/m2, varyingfrom (me/m)2 ∼ 10−5 up to (M − m)2/m2 ∼ 6.8, to [-0.5,6], to take intoaccount the smearing effect at t ∼ 0 and the low statistics at high values oft. After subtracting the residual background as estimated from Monte Carlo,we perform the fit using the following formula:
dN
dt(i) = N0
20∑
j=1
A(i, j) × ρ(j, λ′+, λ′′
+) × ǫtot(j) × FFSR(j) (5)
5
0
1000
2000
3000
4000
5000
6000
7000
8000
9000
-2 -1.5 -1 -0.5 0 0.5 1 1.5 2
∆te(ns)
0
1000
2000
3000
4000
5000
6000
7000
8000
9000
-2 -1.5 -1 -0.5 0 0.5 1 1.5 2
∆tπ(ns)
(a) (b)
Fig. 4. ∆ti for electron (a) and pion (b) for data (black) and Monte Carlo (red)
where ρ(j, λ′+, λ′′
+) is the three-body differential decay width as defined inEq. (4), and A(i, j) is the probability that an event with true value of t/m2
in the jth bin has a reconstructed value in the ith bin. The chosen bin size is0.5, which corresponds to about 1.6 σt, where σt is the resolution in t/m2.
The total efficiency, ǫtot(t), takes into account the acceptance and the effi-ciency of the analysis cuts. FFSR is the correction for final-state radiation. It isevaluated using the KLOE Monte Carlo simulation, GEANFI [8], where FSRprocesses are simulated according the procedures described in Ref. 9. FSR af-fects the t-distribution mainly for high-energy pions, i.e. for low t, where thecorrection is 3-5%. The slopes λ′
+ and λ′′+ are free parameters in the fit while
the N0 constant is the total number of signal events.
4 Systematic uncertainties
The systematic errors due to the evaluation of corrections, data-Monte Carloinconsistencies, result stability, momentum miscalibration, and backgroundcontamination are summarized in Table 1.
We evaluate the systematic uncertainty of the tagging efficiency by repeatingthe measurement using a tagging algorithm without the requirement of theautotrigger. We observe a change of 0.14×10⁻³ for λ+ in the case of the linearfit, and changes of 0.18×10⁻³ and 0.02×10⁻³ for λ′
+ and λ′′+ respectively for
the quadratic fit.
We evaluate the systematic uncertainties on the tracking efficiency correctionsby checking stability of the result when the track selection criteria are modi-fied. We establish the validity of the method by comparing the efficiencies from
6
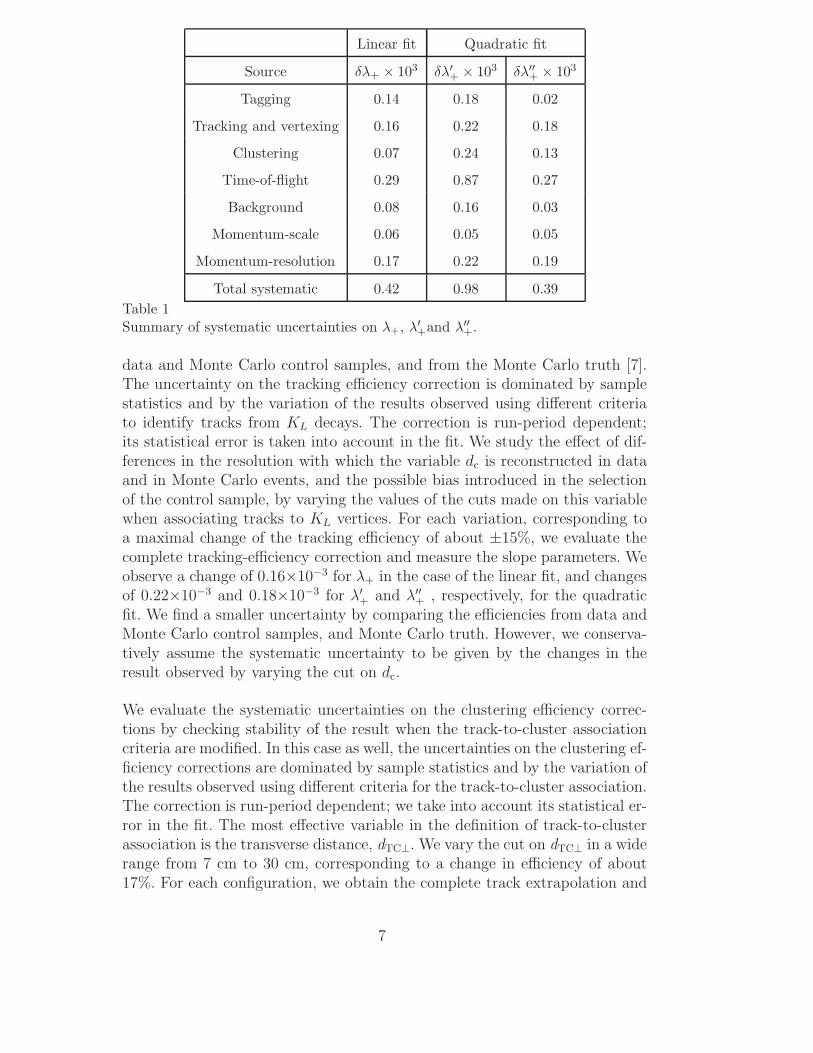
Linear fit Quadratic fit
Source δλ+ × 103 δλ′+ × 103 δλ′′
+ × 103
Tagging 0.14 0.18 0.02
Tracking and vertexing 0.16 0.22 0.18
Clustering 0.07 0.24 0.13
Time-of-flight 0.29 0.87 0.27
Background 0.08 0.16 0.03
Momentum-scale 0.06 0.05 0.05
Momentum-resolution 0.17 0.22 0.19
Total systematic 0.42 0.98 0.39
Table 1Summary of systematic uncertainties on λ+, λ′
+and λ′′+.
data and Monte Carlo control samples, and from the Monte Carlo truth [7].The uncertainty on the tracking efficiency correction is dominated by samplestatistics and by the variation of the results observed using different criteriato identify tracks from KL decays. The correction is run-period dependent;its statistical error is taken into account in the fit. We study the effect of dif-ferences in the resolution with which the variable dc is reconstructed in dataand in Monte Carlo events, and the possible bias introduced in the selectionof the control sample, by varying the values of the cuts made on this variablewhen associating tracks to KL vertices. For each variation, corresponding toa maximal change of the tracking efficiency of about ±15%, we evaluate thecomplete tracking-efficiency correction and measure the slope parameters. Weobserve a change of 0.16×10⁻³ for λ+ in the case of the linear fit, and changesof 0.22×10⁻³ and 0.18×10⁻³ for λ′
+ and λ′′+ , respectively, for the quadratic
fit. We find a smaller uncertainty by comparing the efficiencies from data andMonte Carlo control samples, and Monte Carlo truth. However, we conserva-tively assume the systematic uncertainty to be given by the changes in theresult observed by varying the cut on dc.
We evaluate the systematic uncertainties on the clustering efficiency correc-tions by checking stability of the result when the track-to-cluster associationcriteria are modified. In this case as well, the uncertainties on the clustering ef-ficiency corrections are dominated by sample statistics and by the variation ofthe results observed using different criteria for the track-to-cluster association.The correction is run-period dependent; we take into account its statistical er-ror in the fit. The most effective variable in the definition of track-to-clusterassociation is the transverse distance, dTC⊥. We vary the cut on dTC⊥ in a widerange from 7 cm to 30 cm, corresponding to a change in efficiency of about17%. For each configuration, we obtain the complete track extrapolation and
7
clustering efficiency correction and use it to evaluate the slopes. We observea variation of 0.07×10⁻³ for λ+ in the case of the linear fit, and variationsof 0.24×10⁻³ and 0.13×10⁻³ for λ′
+ and λ′′+ , respectively, in the case of the
quadratic fit. We find a comparable uncertainty for λ′+ and for λ′′
+ by com-paring the efficiencies from data and Monte Carlo control samples, and theMonte Carlo truth.
We study the uncertainty on the Monte Carlo efficiency of the TOF selectionprocedure by measuring it using a pure Ke3 control sample, and using the ratioof data and Monte Carlo efficiencies estimated in this way as a correction. 1
The control sample is selected using tighter kinematic cuts and the calorimeterparticle identification described in Ref. 5. The contamination of the controlsample amounts to 0.4%. When applying the correction, we find a changein the result of 0.29×10⁻³ for λ+ in the case of the linear fit, and changesof 0.87×10⁻³ and 0.27×10⁻³ for λ′
+ and λ′′+ , respectively, in the case of the
quadratic fit. These variations are well within the statistical uncertainties.
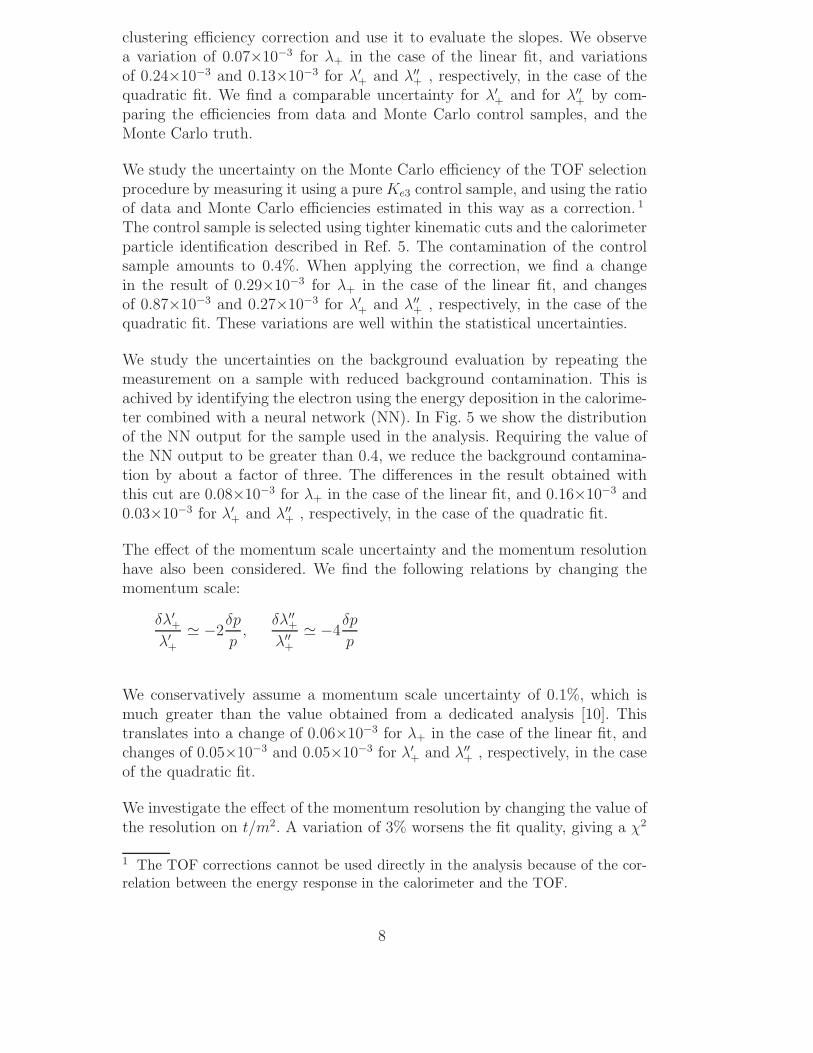
We study the uncertainties on the background evaluation by repeating themeasurement on a sample with reduced background contamination. This isachived by identifying the electron using the energy deposition in the calorime-ter combined with a neural network (NN). In Fig. 5 we show the distributionof the NN output for the sample used in the analysis. Requiring the value ofthe NN output to be greater than 0.4, we reduce the background contamina-tion by about a factor of three. The differences in the result obtained withthis cut are 0.08×10⁻³ for λ+ in the case of the linear fit, and 0.16×10⁻³ and0.03×10−3 for λ′
+ and λ′′+ , respectively, in the case of the quadratic fit.
The effect of the momentum scale uncertainty and the momentum resolutionhave also been considered. We find the following relations by changing themomentum scale:
δλ′+
λ′+
≃ −2δp
p,
δλ′′+
λ′′+
≃ −4δp
p
We conservatively assume a momentum scale uncertainty of 0.1%, which ismuch greater than the value obtained from a dedicated analysis [10]. Thistranslates into a change of 0.06×10⁻³ for λ+ in the case of the linear fit, andchanges of 0.05×10⁻³ and 0.05×10⁻³ for λ′
+ and λ′′+ , respectively, in the case
of the quadratic fit.
We investigate the effect of the momentum resolution by changing the value ofthe resolution on t/m2. A variation of 3% worsens the fit quality, giving a χ2
1 The TOF corrections cannot be used directly in the analysis because of the cor-relation between the energy response in the calorimeter and the TOF.
8
10
102
103
104
-0.5 0 0.5 1 1.5NN output
Fig. 5. NN output distribution for data (dots), Monte Carlo signal (black solid line)and background (red solid line).
probability variation of one standard deviation. The corresponding absolutechanges are 0.17×10⁻³ for λ+ in the case of the linear fit, and 0.22×10⁻³ and0.19×10−3 for λ′
+ and λ′′+ in the case of quadratic fit. Varying the resolution
of t/m2 by a larger amount (6%) gives an unacceptable χ2 probability, about10−9, while nearly the same variations for the fit parameters are observed. Inprinciple, if the distribution has a linear behavior, the slope is insensitive toany smearing due to the resolution. The only effect is due to the depletionof the bins at the boundary of the distribution, which worsens the χ2 of thefit. We have verified that the sensitivity to the momentum resolution is muchsmaller for a reduced fit range.
5 Results
About 2 million Ke3 events were selected. The results of the linear fit obtainedfrom all run periods are given in Table 2. The fit is performed separately forKL → π+e−ν and KL → π−e+ν events to check the reliability of the evalua-tion of the cluster efficiency. The results are consistent only if the respectiveefficiency corrections for each pion charge are applied. Then, combining thetwo charge results and including the systematic uncertainties listed in Table 1we obtain:
λ+ =(28.6 ± 0.5stat. ± 0.4syst.) × 10−3
9
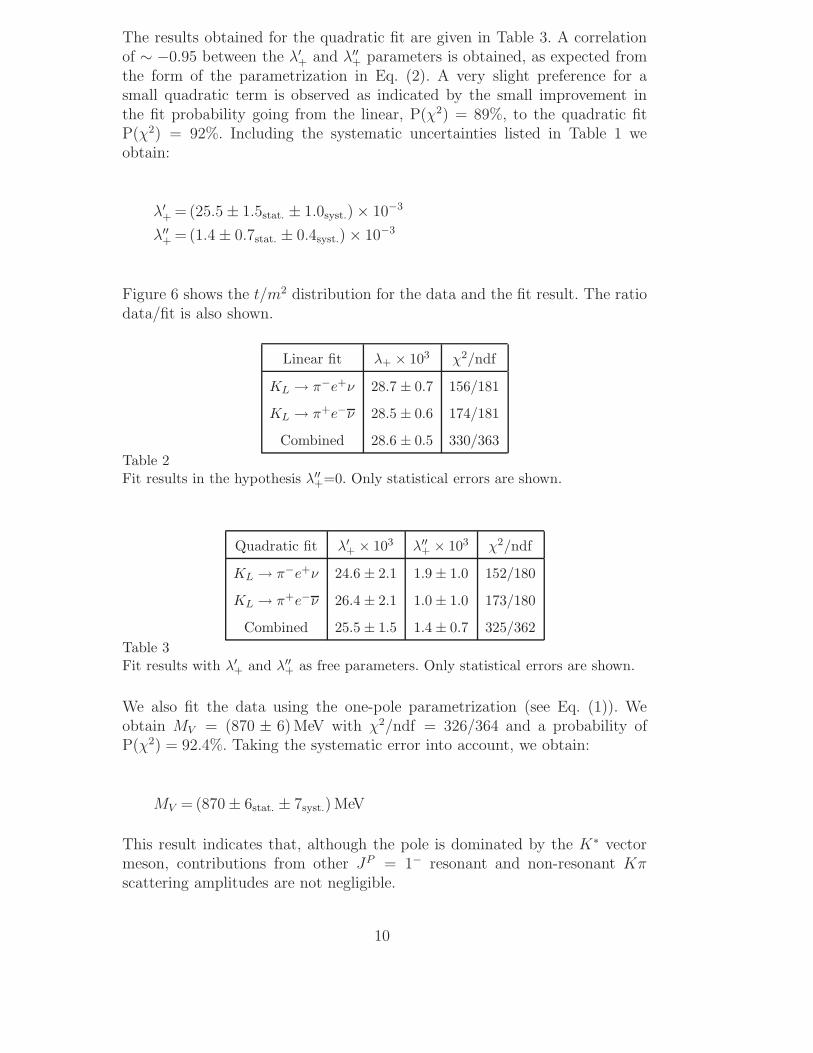
The results obtained for the quadratic fit are given in Table 3. A correlationof ∼ −0.95 between the λ′
+ and λ′′+ parameters is obtained, as expected from
the form of the parametrization in Eq. (2). A very slight preference for asmall quadratic term is observed as indicated by the small improvement inthe fit probability going from the linear, P(χ2) = 89%, to the quadratic fitP(χ2) = 92%. Including the systematic uncertainties listed in Table 1 weobtain:
λ′+ =(25.5 ± 1.5stat. ± 1.0syst.) × 10−3
λ′′+ =(1.4 ± 0.7stat. ± 0.4syst.) × 10−3
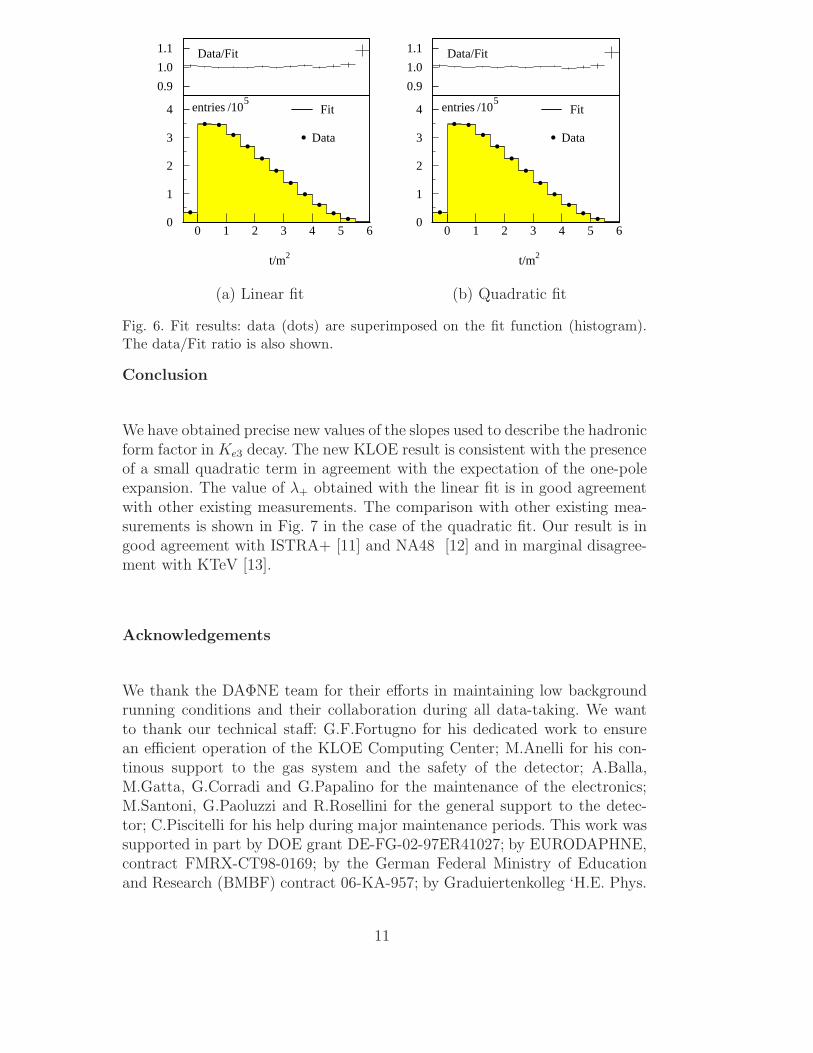
Figure 6 shows the t/m2 distribution for the data and the fit result. The ratiodata/fit is also shown.
Linear fit λ+ × 103 χ2/ndf
KL → π−e+ν 28.7 ± 0.7 156/181
KL → π+e−ν 28.5 ± 0.6 174/181
Combined 28.6 ± 0.5 330/363
Table 2Fit results in the hypothesis λ′′
+=0. Only statistical errors are shown.
Quadratic fit λ′+ × 103 λ′′
+ × 103 χ2/ndf
KL → π−e+ν 24.6 ± 2.1 1.9 ± 1.0 152/180
KL → π+e−ν 26.4 ± 2.1 1.0 ± 1.0 173/180
Combined 25.5 ± 1.5 1.4 ± 0.7 325/362
Table 3Fit results with λ′
+ and λ′′+ as free parameters. Only statistical errors are shown.
We also fit the data using the one-pole parametrization (see Eq. (1)). Weobtain MV = (870 ± 6) MeV with χ2/ndf = 326/364 and a probability ofP(χ2) = 92.4%. Taking the systematic error into account, we obtain:
MV = (870 ± 6stat. ± 7syst.) MeV
This result indicates that, although the pole is dominated by the K∗ vectormeson, contributions from other JP = 1− resonant and non-resonant Kπscattering amplitudes are not negligible.
10
0.9
1.0
1.1 Data/Fit
t/m2
Fit
Data
0
1
2
3
4 entries /105
0 1 2 3 4 5 6
0.9
1.0
1.1 Data/Fit
t/m2
Fit
Data
0
1
2
3
4 entries /105
0 1 2 3 4 5 6
(a) Linear fit (b) Quadratic fit
Fig. 6. Fit results: data (dots) are superimposed on the fit function (histogram).The data/Fit ratio is also shown.
Conclusion
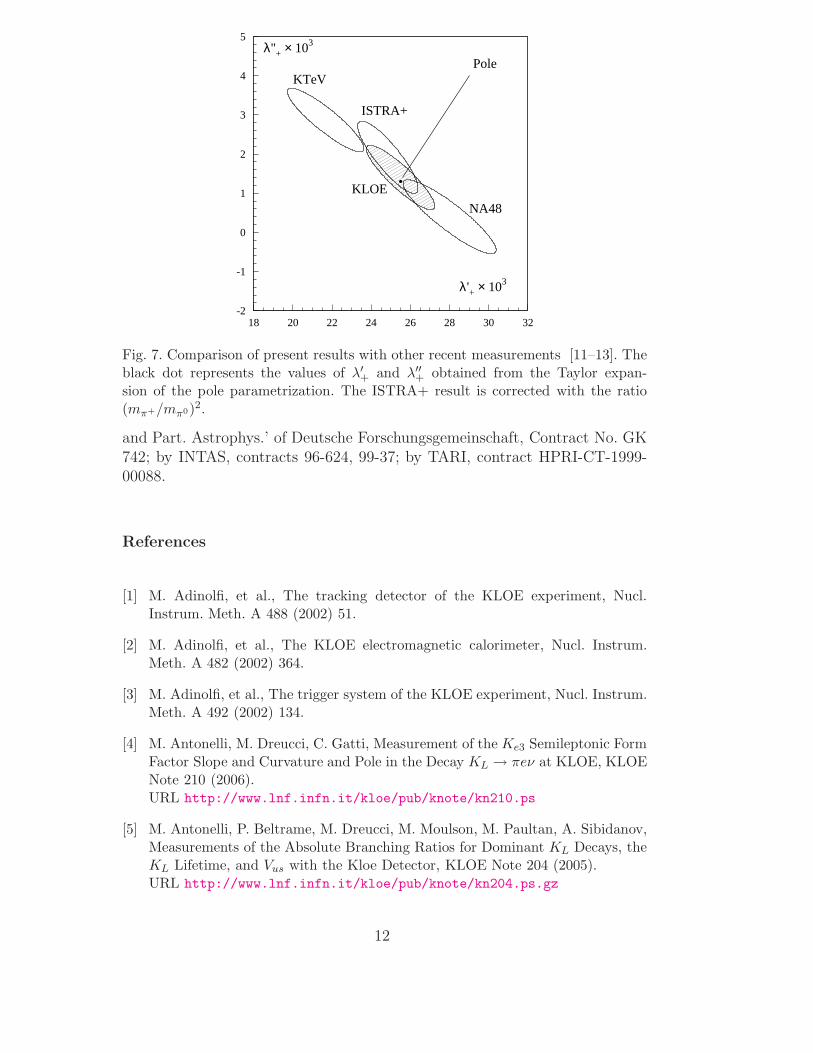
We have obtained precise new values of the slopes used to describe the hadronicform factor in Ke3 decay. The new KLOE result is consistent with the presenceof a small quadratic term in agreement with the expectation of the one-poleexpansion. The value of λ+ obtained with the linear fit is in good agreementwith other existing measurements. The comparison with other existing mea-surements is shown in Fig. 7 in the case of the quadratic fit. Our result is ingood agreement with ISTRA+ [11] and NA48 [12] and in marginal disagree-ment with KTeV [13].
Acknowledgements
We thank the DAΦNE team for their efforts in maintaining low backgroundrunning conditions and their collaboration during all data-taking. We wantto thank our technical staff: G.F.Fortugno for his dedicated work to ensurean efficient operation of the KLOE Computing Center; M.Anelli for his con-tinous support to the gas system and the safety of the detector; A.Balla,M.Gatta, G.Corradi and G.Papalino for the maintenance of the electronics;M.Santoni, G.Paoluzzi and R.Rosellini for the general support to the detec-tor; C.Piscitelli for his help during major maintenance periods. This work wassupported in part by DOE grant DE-FG-02-97ER41027; by EURODAPHNE,contract FMRX-CT98-0169; by the German Federal Ministry of Educationand Research (BMBF) contract 06-KA-957; by Graduiertenkolleg ‘H.E. Phys.
11
λ'+ × 103
λ''+ × 103
KTeV
NA48
KLOE
ISTRA+
Pole
-2
-1
0
1
2
3
4
5
18 20 22 24 26 28 30 32
Fig. 7. Comparison of present results with other recent measurements [11–13]. Theblack dot represents the values of λ′
+ and λ′′+ obtained from the Taylor expan-
sion of the pole parametrization. The ISTRA+ result is corrected with the ratio(mπ+/mπ0)2.
and Part. Astrophys.’ of Deutsche Forschungsgemeinschaft, Contract No. GK742; by INTAS, contracts 96-624, 99-37; by TARI, contract HPRI-CT-1999-00088.
References
[1] M. Adinolfi, et al., The tracking detector of the KLOE experiment, Nucl.Instrum. Meth. A 488 (2002) 51.
[2] M. Adinolfi, et al., The KLOE electromagnetic calorimeter, Nucl. Instrum.Meth. A 482 (2002) 364.
[3] M. Adinolfi, et al., The trigger system of the KLOE experiment, Nucl. Instrum.Meth. A 492 (2002) 134.
[4] M. Antonelli, M. Dreucci, C. Gatti, Measurement of the Ke3 Semileptonic FormFactor Slope and Curvature and Pole in the Decay KL → πeν at KLOE, KLOENote 210 (2006).URL http://www.lnf.infn.it/kloe/pub/knote/kn210.ps
[5] M. Antonelli, P. Beltrame, M. Dreucci, M. Moulson, M. Paultan, A. Sibidanov,Measurements of the Absolute Branching Ratios for Dominant KL Decays, theKL Lifetime, and Vus with the Kloe Detector, KLOE Note 204 (2005).URL http://www.lnf.infn.it/kloe/pub/knote/kn204.ps.gz
12

[6] KLOE Collaboration, F. Ambrosino, et al., Phys. Lett. B 632 (2006) 43.
[7] KLOE Collaboration, F. Ambrosino, et al., Measurement of the branchingfraction and charge asymmetry for the decay KS → πeν with the KLOEdetector, hep-ex/0601026, Submitted to Phys. Lett. B, and references therein .
[8] F. Ambrosino, et al., Data handling, reconstruction, and simulation for theKLOE experiment, Nucl. Instrum. Meth. A 534 (2004) 403.
[9] C. Gatti, Monte Carlo simulation for radiative kaon decays, hep-ph/0507280,accepted by Eur. Phys. J. C, and references therein .
[10] A. Antonelli, et al., The KLOE field map revisited, KLOE Memo 233 (2001).
[11] O. P. Yushchenko, et al., Phys. Lett. B 589 (2004) 111.
[12] NA48 Collaboration, A. Lai, et al., Phys. Lett. B 606 (2004) 1.
[13] KTeV Collaboration, T. Alexopolous, et al., Phys. Rev. D 70 (2004) 092007.
13
Copyright © 2022 FDOKUMEN