Measurement of low-strain material damping and wave velocity with bender elements in the frequency...
10
Can. Geotech. J. 35: 1032–1040 (1998) © 1998 NRC Canada 1032 Measurement of low-strain material damping and wave velocity with bender elements in the frequency domain Diego Brocanelli and Victor Rinaldi Abstract: This paper discusses the application of piezoceramic bender elements for measurement of damping ratio in the frequency domain in a triaxial cell under isotropic confinement. The emitter was excited with a constant voltage and varied frequency sine signal while the phase difference and amplitude in the receiver were measured. The resonant frequency and dynamic characteristics of cell components were analyzed to study the influence of possible additional modes when the modal analysis of a soil sample is performed. Damping ratio and shear wave velocity were determined in a sample of dry silica sand at different confinements from the first resonant mode of the sample. A relationship was found between measured travel time and resonant frequency that satisfies the solution for the general wave equation. The measured damping ratio compares very well with approximated empirical models. It is concluded that the methodology assumed in this work performs satisfactory when the dynamic response of the cell components is properly identified. Key words: wave velocity, shear modulus, material damping, bender elements, frequency analysis, silica sand. Résumé : Cet article discute de l’application des languettes piézocéramiques pour mesurer le rapport d’amortissement dans le domaine de fréquence dans une cellule triaxiale sous un confinement isotrope. L’émetteur a été excité par un signal à voltage constant et à une fréquence sinusoïdale variable alors que la différence de phase et l’amplitude étaient mesurées dans le récepteur. La fréquence résonnante et les caractéristiques dynamiques des composantes de la cellule ont été analysées pour étudier l’influence de modes additionnels possibles lorsque l’analyse modale d’un échantillon de sol est réalisée. Le rapport d’amortissement et la vitesse de l’onde de cisaillement ont été mesurés dans un échantillon de sable de silice sec sous différents confinements à partir du premier mode de résonnance de l’échantillon. L’on a trouvé une relation entre la vitesse de transmission et la fréquence de résonnance qui satisfait la solution de l’équation générale des ondes. Le rapport d’amortissement se compare très bien avec les modèles empiriques approximatifs. L’on conclut que la méthodologie adoptée dans ce travail se comporte de façon satisfaisante lorsque la réponse dynamique des composantes de la cellule est correctement identifiée. Mots clés : vitesse d’onde, module de cisaillement, matériau d’amortissement, languettes piézocéramiques, analyse de fréquence, sable de silice. [Traduit par la Rédaction] Brocanelli and Rinaldi 1040 Introduction There are actually a large number of tests in geotechnical engineering to characterize soils dynamically. All of them differ mainly in the working strain amplitude, boundary con- ditions, and frequency. Woods (1978) presented a compre- hensive review focusing on their applications and comparative advantages with respect to other procedures. Piezoelectric ceramics have been increasingly used in the last three decades to capture and generate waves propagating in engineering materials. In early studies, piezoceramics were employed to generate and receive compression waves V p . Yet, p-wave transducers are highly influenced by pore fluid, and little information on soil structure can be obtained. Recently, piezoceramics have been combined in different forms to increase their sensitivity to generate and receive shear waves and to minimize the effect of compression (Dyvik and Madshus 1985). Such combined forms of piezoceramics are known as bender elements or bimorphs. This electromechanical system consists of two piezoceramic plates that are bonded face to face with a flexible metal con- ductive sheet in between. The shear strain of a pulse gener- ated by a bender element results in less than 10 –3 %, which falls in the elastic range of soil (Brignoli et al. 1996). Bender elements can be set in most soil testing devices, and thus, shear wave velocity can be determined during tests at various stress levels (e.g., Bates 1989; Agarwa and Ishibashi 1991) and using different test boundary conditions. These low-strain dynamic parameters can be used for moni- toring changes in effective stresses and soil structure (e.g., number of particle contact and double layer); for example, Knight and Nolen-Hoeksema (1990) noted the influence of imbibition and drainage processes on wave velocities, Santamarina and Fam (1995) studied changes in soil fabric Received July 9, 1997. Accepted July 21, 1998. D. Brocanelli and V. Rinaldi. Facultad de Ciencias Exactas Fisicas y Naturales, Universidad Nacional de Cordoba, Avenida Velez Sarsfield 1600 Ciudad Universitaria Cordoba 5000, Argentina. Can. Geotech. J. Downloaded from www.nrcresearchpress.com by EESC ESCOLA DE ENGENHARIA on 03/14/14 For personal use only.
-
Upload
independent -
Category
Documents
-
view
4 -
download
0
Transcript of Measurement of low-strain material damping and wave velocity with bender elements in the frequency...

Can. Geotech. J.35: 1032–1040 (1998) © 1998 NRC Canada
1032
Measurement of low-strain material dampingand wave velocity with bender elements in thefrequency domain
Diego Brocanelli and Victor Rinaldi
Abstract: This paper discusses the application of piezoceramic bender elements for measurement of damping ratio inthe frequency domain in a triaxial cell under isotropic confinement. The emitter was excited with a constant voltageand varied frequency sine signal while the phase difference and amplitude in the receiver were measured. The resonantfrequency and dynamic characteristics of cell components were analyzed to study the influence of possible additionalmodes when the modal analysis of a soil sample is performed. Damping ratio and shear wave velocity were determinedin a sample of dry silica sand at different confinements from the first resonant mode of the sample. A relationship wasfound between measured travel time and resonant frequency that satisfies the solution for the general wave equation.The measured damping ratio compares very well with approximated empirical models. It is concluded that themethodology assumed in this work performs satisfactory when the dynamic response of the cell components is properlyidentified.
Key words: wave velocity, shear modulus, material damping, bender elements, frequency analysis, silica sand.
Résumé: Cet article discute de l’application des languettes piézocéramiques pour mesurer le rapport d’amortissementdans le domaine de fréquence dans une cellule triaxiale sous un confinement isotrope. L’émetteur a été excité par unsignal à voltage constant et à une fréquence sinusoïdale variable alors que la différence de phase et l’amplitude étaientmesurées dans le récepteur. La fréquence résonnante et les caractéristiques dynamiques des composantes de la celluleont été analysées pour étudier l’influence de modes additionnels possibles lorsque l’analyse modale d’un échantillon desol est réalisée. Le rapport d’amortissement et la vitesse de l’onde de cisaillement ont été mesurés dans un échantillonde sable de silice sec sous différents confinements à partir du premier mode de résonnance de l’échantillon. L’on atrouvé une relation entre la vitesse de transmission et la fréquence de résonnance qui satisfait la solution de l’équationgénérale des ondes. Le rapport d’amortissement se compare très bien avec les modèles empiriques approximatifs. L’onconclut que la méthodologie adoptée dans ce travail se comporte de façon satisfaisante lorsque la réponse dynamiquedes composantes de la cellule est correctement identifiée.
Mots clés: vitesse d’onde, module de cisaillement, matériau d’amortissement, languettes piézocéramiques, analyse defréquence, sable de silice.
[Traduit par la Rédaction] Brocanelli and Rinaldi 1040
Introduction
There are actually a large number of tests in geotechnicalengineering to characterize soils dynamically. All of themdiffer mainly in the working strain amplitude, boundary con-ditions, and frequency. Woods (1978) presented a compre-hensive review focusing on their applications andcomparative advantages with respect to other procedures.
Piezoelectric ceramics have been increasingly used in thelast three decades to capture and generate waves propagatingin engineering materials. In early studies, piezoceramicswere employed to generate and receive compression wavesVp. Yet, p-wave transducers are highly influenced by porefluid, and little information on soil structure can be obtained.
Recently, piezoceramics have been combined in differentforms to increase their sensitivity to generate and receiveshear waves and to minimize the effect of compression(Dyvik and Madshus 1985). Such combined forms ofpiezoceramics are known as bender elements or bimorphs.This electromechanical system consists of two piezoceramicplates that are bonded face to face with a flexible metal con-ductive sheet in between. The shear strain of a pulse gener-ated by a bender element results in less than 10–3%, whichfalls in the elastic range of soil (Brignoli et al. 1996).
Bender elements can be set in most soil testing devices,and thus, shear wave velocity can be determined during testsat various stress levels (e.g., Bates 1989; Agarwa andIshibashi 1991) and using different test boundary conditions.These low-strain dynamic parameters can be used for moni-toring changes in effective stresses and soil structure (e.g.,number of particle contact and double layer); for example,Knight and Nolen-Hoeksema (1990) noted the influence ofimbibition and drainage processes on wave velocities,Santamarina and Fam (1995) studied changes in soil fabric
Received July 9, 1997. Accepted July 21, 1998.
D. Brocanelli and V. Rinaldi. Facultad de Ciencias ExactasFisicas y Naturales, Universidad Nacional de Cordoba,Avenida Velez Sarsfield 1600 Ciudad Universitaria Cordoba5000, Argentina.
Can
. Geo
tech
. J. D
ownl
oade
d fr
om w
ww
.nrc
rese
arch
pres
s.co
m b
y E
ESC
ESC
OL
A D
E E
NG
EN
HA
RIA
on
03/1
4/14
For
pers
onal
use
onl
y.

© 1998 NRC Canada
Brocanelli and Rinaldi 1033
during diffusion processes, and Fam and Santamarina (1996)monitored the hydration process of clay–cement slurries inan oedometer.
Most of the work presented in the literature assesses theapplicability of bender elements to measure wave velocity inthe time domain. In this method, a pulse is generated by abender element and the travel time is determined when thepulse arrives at a second bender element located at a knowndistance. Difficulties in determining the exact arrival timehave been reported (e.g., see Viggiani and Atkinson 1995).Most of these difficulties were attributed to near field effects,and new forms of identification of the arrival time werepre-sented by Jovicic et al. (1996) and Brignoli et al. (1996).
To our knowledge, no attention has been given in the lit-erature to the measurement of damping ratio with bender el-ements. In this work, a dry sample of silica sand wasprepared and set in a modified triaxial cell with two benderelements mounted at the center of the top and bottom plates.The resonant modes of the bender elements and bottom platewere determined to take place at frequencies higher than 3and 4 kHz, respectively. Therefore, the response of the mea-suring system was linear up to 3 kHz. A constant-amplitudesine wave excitation of varied frequency was used to obtainthe resonant modes of the soil sample in the range from100 Hz to 3 kHz without the influence of additional modes.
The damping ratio was then determined from the resonantcurves in the complex plane diagram. Wave velocity couldbe determined from the first resonant mode once the solu-tion to the wave equation was derived for the cell-samplegeometry. A simplified method was used to determine bothdynamic parameters based on the properties of the Nyquistplot in which only a few points close to the resonant fre-quency are needed.
Triaxial cell
The test triaxial cell in which the sample is subjected to
an isotropic confining pressure and the peripheral devicesused in this work are shown in Fig. 1. Bender elements aremounted at the center of the pedestal and top plate. Signalsare generated by a signal generator with a maximum peak-to-peak amplitude of 20 V. The receiver bender element isconnected to a charge-volt converter (preamplifier), which isfed by a Bruel and Kjaer power supply. The signal is thenamplified and band-pass filtered using a Stanford Researchvoltage amplifier and finally digitized using a Fluke 97oscilloscope-meter. The high limit frequency of the band-pass filter is set at half the sampling rate of the oscilloscope(cutoff frequency) in order to avoid aliasing effects on thecaptured signals, while the low limit frequency is usually setat 100 Hz. The signals can be recorded and visualized in acomputer connected to the oscilloscope. The Fluke 97 is aversatile instrument that works both as an oscilloscope andas a voltmeter. The device can digitize up to 512 samples
Fig. 1. Triaxial cell and peripheral devices developed at Universidad Nacional de Cordoba.
Fig. 2. Pedestal of the triaxial cell and mounting details of thebender element.
Can
. Geo
tech
. J. D
ownl
oade
d fr
om w
ww
.nrc
rese
arch
pres
s.co
m b
y E
ESC
ESC
OL
A D
E E
NG
EN
HA
RIA
on
03/1
4/14
For
pers
onal
use
onl
y.

over a 50 MHz frequency band and allows for the measure-ment of phase difference, frequency, peak-to-peak ampli-tude, and root mean square voltage of the input signals. Allconnections between the external instruments and the benderelements are made using good-quality coaxial cables. In allcases, the outer conductor is grounded to avoid leakage ofthe electric field.
The function of the preamplifier is to convert the outputcharge of the receiver piezoceramics into a voltage. Thus,there is no requirement of a high input impedance amplifier
to obtain a linear response of the receiver bender element,especially at low frequencies (Richart et al. 1970).
A detailed diagram of the bender element mounted in thebase of the cell is presented in Fig. 2. The upper cap is madeof aluminum with a total weight of 75 g. Basically the over-all design of the cell is similar to that presented by Dyvikand Madshus (1985), except that here the bender element iscoated with a conductive silver painting over the insulatingepoxy resin and grounded. Such a modification improvedthe received signal, since electric field propagation gener-ated by the source bender element through the sample wasavoided. It was observed that in a low-noise environment,no averaging and filtering were necessary in the system asdescribed.
Frequency response of bender elementsand cell plates
The bottom plate of the triaxial cell is made of aluminum,as shown in Fig. 2, and is screwed to a heavy steel pedestalhaving a mass of 7 kg. An approximate dynamic equivalentsystem for the bottom plate and bender element is presentedin Fig. 3. Here the influence of a soil sample is not consid-ered for simplicity. The bottom plate is considered here asrigidly fixed to the heavy mass of the pedestal to which it isscrewed. A similar assumption was made for the bender ele-ment. In order to obtain the dynamic behavior of the system,an accelerometer with a linear response between 0.1 Hz and13 kHz was screwed horizontally to the bottom plate. Fig-ure 4 shows the free vibration decay in time and frequencyspectra of the bottom plate in response to an external pulseexcitation given with a lightweight hammer on the top freeend. It can be seen that the natural frequency in this case re-sults in fn ≈ fd = 4.24 kHz.
Once the response of the bottom plate was determined,the dynamic parameters of the source bender element wereobtained by exciting it with a sinusoidal signal of constantvoltage and variable frequency. The response of the wholesystem to this input was then captured by the accelerometer.Figure 5 shows the result. The resonance of the base appearsat 4.24 kHz, while the second peak at 3.17 kHz can be at-tributed to the first mode of the bender element. A similarresponse was obtained for the second bender element in thetop cap, which was mounted in a similar fashion.
© 1998 NRC Canada
1034 Can. Geotech. J. Vol. 35, 1998
Fig. 3. Pedestal and source bender element dynamic model. Thedeformed cross section in the flexural first mode is due to aforce in the right direction.
Fig. 4. (a) Free vibration response in the time domain of thebottom plate; (b) frequency content of the free vibration responseof the bottom plate from Fig. 4a.
Fig. 5. Frequency response of the bottom plate excited by thebender element.
Can
. Geo
tech
. J. D
ownl
oade
d fr
om w
ww
.nrc
rese
arch
pres
s.co
m b
y E
ESC
ESC
OL
A D
E E
NG
EN
HA
RIA
on
03/1
4/14
For
pers
onal
use
onl
y.

The above results clearly show that the mechanical com-ponents of the triaxial cell and bender elements do not yieldresonant peaks at frequencies below 3.17 kHz. This findingis of primary importance because, as shown later in thiswork, the first mode of soil samples tested in the triaxial celltakes place below this upper limiting frequency.
Frequency response of a soil sample inthe triaxial cell: theoretical formulations
First resonant modeA cylindrical soil sample placed in the triaxial cell can be
considered as a fixed-free beam with the mass of the top capattached at the free end. The sample is excited by atransversal force, which in the present case is given by eitherthe upper or the bottom bender element. The basis for theanalysis of the frequency response of the soil sample is theidentification of the different modes of vibration at reso-nance. The partial differential equation of motion for a beamwith the principal axis in thex direction without mass at thetop and excited by a transversal force (p) can be written as(Clough and Penzien 1975)
[1] EIy
xp m
yt
mIA
yx t
∂∂
− − ∂∂
− ∂∂ ∂
4
4
2
2
4
2 2
+ ∂∂
− ∂∂
− ∂∂
−EIKAG x
p my
tEI
KA G tp
2
2
2
2 2
2
2m
yt
∂∂
=2
20
whereE andG are the Young modulus and shear modulus ofelasticity, respectively,m is the mass per unit length of thebeam, which can be any function ofx, A is the transversalarea of the beam,KA is the effective area of shear (for a cir-cular area,K = 0.9), I is the moment of inertia of the area(A), andy is the transversal displacement of the beam.
The first term of eq. [1] represents the influence of flexuredeformation. The second term represents the influence of therotatory inertia (defined by the product of the mass momentof inertia of the section and the angular acceleration). Thethird term corresponds to the influence of shear deformationand the fourth term to the combined effect of shear and rota-tory inertia. The natural frequencies for a beam excited by atransversal force can be obtained from eq. [1] with the ap-propriate boundary conditions. Yet, it is clear from eq. [1]that in the case of long beams, only the first term, whichcorresponds to flexure, can be used to described the motion,while in very short beams, the third term becomes dominant.
Because evaluation of eq. [1] is tedious, a finite elementanalysis was performed for a sample of 3.00 cm length inthe modified triaxial cell. Wave velocityVs = 200 m/s andPoisson ratioν = 0.3 were maintained constant and theweight of the top cap was varied. Figure 6 shows the resul-tant lateral displacement at different heights of the samplefor the first mode of resonance (first mode shape). Displace-ments here have been normalized with respect to the maxi-mum displacement obtained at the top. From this result, it isconcluded that (1) with a relatively light mass at the top, thespecimens deform in perfect shear in the first mode and(2) with the increase of the mass at the top, the shape of the
deformed sample tends to be of flexure. Then, in short speci-mens and when the mass of the top cap can be disregarded,the first resonant mode is of shear, and the angular fre-quency (ωs) at which resonance takes place can be approxi-mated as
[2] ω πs
s= VL2
whereL is the sample length,Vs = (G/ρ)1/2 is the shear wavevelocity of the soil sample,G is the shear modulus, andρ isthe mass density of the soil.
When the effect of the mass could not be neglected, anexpression for the angular natural frequency (ωs) of a cylin-drical rod in the first shear mode was derived from the gen-eral wave eq. [1] and the force equilibrium equations at theboundaries (see Appendix 1):
[3]09. AL
WL
VL
Vs
γ ω ω= s s
s
tan
whereW is the weight of the top cap,γ is the unit weight ofthe soil, andA is the area of the sample. Here, the ratioB =(ωsL)/Vs depends solely on the ratio of the weight of thesample to the weight of the added mass and is independentof the sample length and density. In the derivation of eq. [3],the terms corresponding to the flexure mode and the rotatoryforces in eq. [1] were disregarded; thus the error in the cal-culated frequency will become larger as the weight of themass increases.
For long samples or very large masses of the top cap, thefirst resonant mode of the beam will be predominately offlexure. In such a case, the natural frequency for the flexuremode can be obtained from the Rayleigh approximation ob-tained by Cascante (1995) as
© 1998 NRC Canada
Brocanelli and Rinaldi 1035
Fig. 6. First mode shapes of a fixed-free sample with differentmasses at the top; sample diameterD = 63 mm, heighth =28 mm, shear wave velocityVs = 200 m/s, and densityρ = 17.5 kN/m3.
Can
. Geo
tech
. J. D
ownl
oade
d fr
om w
ww
.nrc
rese
arch
pres
s.co
m b
y E
ESC
ESC
OL
A D
E E
NG
EN
HA
RIA
on
03/1
4/14
For
pers
onal
use
onl
y.

[4] ωfb
to o
2
32
6
3370
2 692
=
+ + +
EI
L m m mlL
mlL
where Ib is the moment of inertia of the sample,mt and mare the mass of the sample and added mass, respectively, andIo is the distance between the top of the sample and the cen-troid of the added mass.
Material viscous dampingMaterial damping (D) for each mode can be determined
from the respective resonant curve (Fig. 7a) by means of thefollowing expression (see Richart et al. 1970):
[5]( )2
1 21 212
22
12
2
2
2 2
2
2
π πD
D
f f
fA
A AD
D−=
−
−−−m m
whereAm is the maximum amplitude andA is the amplitudeat frequenciesf1 and f2 at both sides of the resonant fre-quency fm. For the case of low damping ratio (D), eq. [5]can be simplified to
[6]( )
( )D A
f f
A f A f f A f f A A=
−
− + + −
22
12
224 2
22
12 2
14 4 2 22 16 m m
Further simplification of eq. [6] is obtained if the ampli-tudeA is taken atAm/20.5 and the resonant curve plots sym-metrically with respect tofm:
[7]( )
Df f
f=−2 1
2m
Equation [7] is generally accepted to determine the mate-rial damping of soils from their resonant curve as shown inFig. 7a. The disadvantages of this method are that a largenumber of data points are required to define the resonantcurve, and the resonant amplitudeAm must be accurately de-termined. These conditions make the accurate measurementof damping experimentally difficult with the standard oscil-loscopes and signal generators, especially at high frequen-cies. Thus, an alternative approach to determining materialdamping was given by Ewins (1988). This author showedthat the dynamic mobility (Y) of a single degree of freedomsystem
[8] Yc j k mk m c
( )( )
( ) ( )ω ω ω ω
ω ω= + −
− +
2 2
2 2 2
can be rewritten in terms of its complex components as
[9] ( )Re Im( ) ( )Yc
Yc
−
+ =
1
212
22
where
[10]
Re Im( )( ) ( )
; ( )( )
( ) (Y
ck m c
Yk m
k m=
− += −
− +ω
ω ωω ω
ω ω
2
2 2 2
2 2
2 2 c)2
and m is the mass,c the damping coefficient, andk thespring constant of the system andj = (–1)2.
Equation [9] plots in the complex plane, also known asthe Nyquist plane, as a circle with radius 1/2c as shown inFig. 7b. Then, the material damping (D) can be calculatedfor points close to that corresponding to the maximum am-plitude by means of the following equation (Ewins 1988):
[11] D = −
+
ω ω
ω ω α ω α22
12
0 22
112
2 2tan tan
where ω0 is the angular frequency corresponding to themaximum sweep angular velocity,ω1 andω2 are the angularfrequencies, andα1 andα2 are the angles at both sides ofω0(see Fig. 7b). The main advantage in this case as comparedwith the half-power method is that the circle can be definedwith few data points, which may not necessarily include thatof the maximum amplitude. On the other hand, the methodallows analysis of the influence of close peaks around theresonant mode under study, as they may distort the shape ofthe circle.
© 1998 NRC Canada
1036 Can. Geotech. J. Vol. 35, 1998
Fig. 7. Determination of material damping. (a) Resonant curve;(b) Nyquist plot.
Can
. Geo
tech
. J. D
ownl
oade
d fr
om w
ww
.nrc
rese
arch
pres
s.co
m b
y E
ESC
ESC
OL
A D
E E
NG
EN
HA
RIA
on
03/1
4/14
For
pers
onal
use
onl
y.

Test procedures and results
One sample of dry silica sand was prepared in the modi-fied triaxial cell. The sand tested originated from the ParanaRiver (northeast of Argentina). The main physical parame-ters of the sand are presented in Table 1. The length and thediameter of the sample were obtained from the average offour caliper readings. Table 2 shows the initial geometry andthe density of the sample tested. Isotropic confinement wasapplied with air and the changes in the vertical strain (∆e1)of the sample were measured with an LVDT transducer.Thus, changes in volume were estimated as∆V = 3Vo∆e1,whereVo is the initial volume of the sample.
Pulse test, time domainIn this test, a step pulse was introduced in the bottom
bender element and the signal was recorded when it arrivedat the top bender element. This process was repeated at dif-ferent confinements. A typical result of this test is shown inFig. 8. Identical results were obtained with the top benderelement acting as the source and the bottom bender elementas the receiver. The time of arrival for shear waves was de-termined following the criteria presented by different au-thors (e.g., Dyvik and Madshus 1985; Brignoli et al. 1996;Jovicic et al. 1996) and shown in Fig. 8. Shear wave veloc-ity was then calculated assuming that the travel length forboth types of waves was the distance between the tips of theemitter and receiver bender (Lb). Figure 9 shows the varia-tion of shear wave velocity with the confining pressure forthe samples tested in the time domain. Attenuation or mate-rial damping cannot be obtained from this test.
Sweep test, frequency domainIn this test, the bottom bender element was excited with a
steady sine signal of constant voltage and the amplitude andphase difference were measured at the receiver bender ele-ment. This process was repeated at different frequencies un-til the whole spectrum of the sample response was perfectlydefined. Figure 10b shows a typical result obtained for thesample tested using a confining pressure ofσ3 = 30 kPa. Theresonant mode identified is indicated in the figure. An al-most identical result was obtained from the fast Fouriertransform of the time record of the received signal at the top
bender element when a step pulse was emitted by the bottombender element. Figure 10c shows this result. Minor differ-ences can be attributed to the fact that the real frequencycontent of the input signal introduced by the source benderelement is unknown. This method is faster when comparedwith the sweep in frequency, but the graphical resolution ofthe resonant peaks is associated with duration of the signal.Yet, with a low resolution the method is reliable for identi-fying the resonant modes.
The peak corresponding to shear mode of Fig. 10b and themeasured phase for dry silica sand at a confinement ofσ3 =30 kPa are isolated and plotted in Fig. 11a. The peak of theamplitude is associated with a phase of 90°, and the phasechange before and after the peak is 180°. The result pre-sented in Fig. 11a is plotted in the complex plane inFig. 11b. From this graph, it is possible to observe that themeasured resonance develops as a semicircle that clearly in-dicates that the data correspond to one resonance without theinterference of other peaks.
From eq. [3], it can be seen and that the coefficientB =(ωsL)/Vs is a constant for a given sample, since mass ratio
© 1998 NRC Canada
Brocanelli and Rinaldi 1037
Uniformitycoefficient,Cu
Maximumvoid ratio,emax
Minimumvoid ratio,emin
Specificgravity,Gs
Averageparticle size,D50 (mm)
1.8 0.76 0.35 2.67 0.37
Table 1. Physical parameters of the silica sand tested in thiswork from the Parana River in Argentina.
SampleLength(mm)
Diameter(mm)
Unit weight(kN/m3)
Voidratio,eo
Relativedensity
S1 28.0 63 160 0.66 0.23
Table 2. Initial geometry and conditions of the sample of silicasand tested in this work.
Fig. 8. Determination of arrival times in sample S1 with thetime domain method.
Fig. 9. Variation of shear wave velocity with confinementσ3 ofsample S1 in the time domain and frequency domain.
Can
. Geo
tech
. J. D
ownl
oade
d fr
om w
ww
.nrc
rese
arch
pres
s.co
m b
y E
ESC
ESC
OL
A D
E E
NG
EN
HA
RIA
on
03/1
4/14
For
pers
onal
use
onl
y.

(rM) of the specimen to the added mass remained invariableduring the whole test. Then, shear wave velocity can be de-termined as
[12] VL
Bfs s= 2π
The variation of shear wave velocity with confinement forthe sample tested determined in the frequency domain is pre-sented in Fig. 9. The very good agreement between shear ve-locities determined with both methods can be observed inthis figure.
The material viscous damping for the resonant peak corre-sponding to the shear mode of vibration at each confiningpressure was evaluated by means of eq. [11] and the circleof Nyquist that best fit the measured resonance curves whenplotted in the complex plane. Figure 12 shows the variationof the measured damping ratios with the confining pressurefor the sample tested. Notice that there is a clear trend forthe damping ratio to decrease with the confining pressure.No noticeable difference was observed between the resultsobtained with eqs. [7] and [11] when the resonant peakswere correctly defined.
Discussion of results
Shear wave velocity of granular soil can be expressed interms of the confining pressure by means of the followingempirical expression:
[13] Vs = β σ α( )3
whereβ andα are constants that can be related to the mate-rial stiffness and to the sensitivity of wave velocity with re-spect to the confining pressure, respectively. These constants
© 1998 NRC Canada
1038 Can. Geotech. J. Vol. 35, 1998
Fig. 10. Typical result of measurement in the frequency domain.(a) Received signal in the top bender element when an inputstep pulse is introduced in the bottom bender element. (b) Powerspectrum of the sample obtained by a sweep of sine of constantamplitude and varied frequency. (c) Power spectrum of thereceived signal (Fig. 10a).
Fig. 11. (a) Amplitude and phase of sample S1 atσ3 = 30 kPain the resonance; (b) Nyquist diagram of the peak presented inFig. 11a and plot of the circle that best fits the results.
Fig. 12. Variation of measured material damping in thefrequency domain with confinementσ3 of sample S1 andcomparison with the empirical relationship of Hardin (1965).
Can
. Geo
tech
. J. D
ownl
oade
d fr
om w
ww
.nrc
rese
arch
pres
s.co
m b
y E
ESC
ESC
OL
A D
E E
NG
EN
HA
RIA
on
03/1
4/14
For
pers
onal
use
onl
y.

were determined from regression analysis for the sand in thefrequency and time domains. Table 3 shows the variation ofthese parameters. These results can be compared with theparameters proposed by Hardin and Black (1968) for sands.These authors determined an exponentα = 0.25 and theyfound the following relationship for the constantk:
[14] βγ
= −+
57297
1
( . )e
e
g
whereγ is the unit weight of the soil (kilonewtons per cubicmetre),g is acceleration due to gravity (metres per secondsquared), ande is the void ratio. The value of the mean con-fining pressureσ3 in eq. [14] is given in kilopascals andVsin metres per second. The values of the constantβ deter-mined from eq. [14] for the sample tested are presented inTable 3. From this table, it can be observed that the constantβ obtained from both tests is larger than the value obtainedfrom eq. [14], while the values of exponentα show a rea-sonably good agreement.
The damping ratio determined from the frequency spec-trum at resonance can be compared with that obtained fromthe empirical equation proposed by Hardin (1965):
[15] D A= −( )ζ ση δ3
Here, the values for the constants given by Hardin (1965)areA = 0.985,η = 0.2, andδ = 0.5. The confining pressure(σ3) is given in kilopascals and the shear strain here was as-sumed to beζ = 10–5. As shown in Fig. 12, the measuredvalues are slightly lower than the Hardin relationship. As de-termined by Fratta and Santamarina (1996), radiation damp-ing through the base of the triaxial cell is difficult at thefrequency of the test performed here. These authors con-cluded that for similar materials of the cell components andthe soil specimens as used in this test, the energy dissipatedoutside the sample by radiation was insignificant.
Conclusions and final remarks
The purpose of this work was to establish the applicabilityof bender elements to measure the damping ratio and shearwave velocity of soil samples in the frequency domain. Theapparatus used for testing was a modified triaxial cell. Theboundary conditions for a soil sample placed in the cell wereassumed to be those corresponding to a fixed-free beam withan added mass at the top.
The natural frequencies of bender elements and bottomplate take place at larger frequencies than that of the samplestested; thus, they do not influence the soil frequency re-sponse.
A fundamental finding here is that the damping ratio canbe measured in the frequency domain from the transfer func-tion of the sample determined with an input sine signal of
constant amplitude and varied frequency, if the cell iscarefully calibrated and the mounting and the electrical con-nection of bender elements are adequately performed. Themeasured values of damping ratios showed good agreementwith the empirical relationship proposed by Hardin (1965)for sands.
The effect of the type of membrane plays an importantrole in the determination of wave velocity and damping ra-tio. It was observed that rigid and tight membranes shift thenatural resonance of the samples to larger frequencies andreduce the values of the damping ratio at low confinements.
It is important to note that the frequency at which materialdamping can be determined in the frequency domain will de-pend on the sample length. Short samples are required in or-der to obtain a first resonant mode in shear. For most typesof soils the natural frequencies will be below this limitingfrequency given by resonance of bender elements and bot-tom plate of the triaxial cell. Even though the effect of fre-quency on material damping is still controversial, thismeasurement range is adequate to compare laboratory andin situ results such as those obtained from a crosshole test assuggested by Mok et al. (1988).
Shear wave velocity was determined in the frequency do-main assuming that eq. [3] is satisfied; however, the mass ofthe upper cap must be low enough to avoid the influence offlexure. In the present case, a weight of approximately 50%of the weight of the sample yielded good results.
The sweep in frequency method is the most accurate formfor obtaining the soil transfer function, but it is time-consuming. An alternative was proposed based on the Fou-rier transform of the time record of the received signal at thetop bender element when a step pulse was emitted by thebottom bender element. Another alternative to be consideredis the excitation of the sample with a random signal of widefrequency content as proposed by Aggour et al. (1988) andrecently by Cascante and Santamarina (1997) for the reso-nant column device.
Acknowledgements
This work was supported by grants from the NationalResearch Council of Argentina (CONICET) and the CityCouncil from Cordoba (CONICOR). The authors thanksProfessors Luis Godoy and Carlos Prato for reviewing andcommenting on the manuscript. Reviewers’ suggestions andcomments are gratefully acknowledged.
References
Agarwa, T.K., and Ishibashi, I. 1991. Multi-directional wave veloc-ity by piezoelectric crystals. Recent advances in instrumenta-tion, data adquisition and testing in soil dynamics. AmericanSociety of Civil Engineers, Geotechnical Special PublicationNo. 29, pp. 102–117.
Aggour, M.S., Tawfiq, K.S., and Taha, M.R. 1988. Impulse andrandom testing of soils. Recent advances in ground-motion eval-uation. American Society of Civil Engineers, Geotechnical Spe-cial Publication No. 20, pp. 346–358.
Bates, C.R. 1989. Dynamic soil property measurements duringtriaxial testing. Géotechnique,39: 721–726.
© 1998 NRC Canada
Brocanelli and Rinaldi 1039
Pulse test Sweep test Hardin and Black 1968
Sample β α β α β αS1 153.5 0.28 197.5 0.23 79.9 0.25
Table 3. Parameters determined from regression analysis toevaluate eq. [14] and comparison with the approximations ofHardin and Black (1968).
Can
. Geo
tech
. J. D
ownl
oade
d fr
om w
ww
.nrc
rese
arch
pres
s.co
m b
y E
ESC
ESC
OL
A D
E E
NG
EN
HA
RIA
on
03/1
4/14
For
pers
onal
use
onl
y.
Brignoli, E.G.M., Gotti, M., and Stokoe, K.H. 1996. Measurementof shear waves in laboratory specimens, by means of piezoelec-tric transducers. Geotechnical Testing Journal,19: 384–397.
Cascante, G. 1995. Low strain measurements with mechanical ingeomaterials — implications in geotomography. Ph.D. thesis,University of Waterloo, Waterloo, Ont.
Cascante, G., and Santamarina, J.C. 1997. Low strain measure-ments with a resonant-column apparatus. Geotechnical TestingJournal,20: 29–39.
Clough, R.W., and Penzien, J. 1975. Dynamics of structures.McGraw-Hill Inc., New York, p. 634.
Dyvik, R., and Madshus, C. 1985. Laboratory measurement ofGmax using bender elements. Proceedings, Annual Convention:Advances in the Art of Testing Soils Under Cyclic Conditions,Detroit, Mich. American Society of Civil Engineers, New York.
Ewins, D.J. 1988. Modal testing: theory and practice. ResearchStudies Press Ltd., Letchworth, Hertfordshire, England.
Fam, M.A., and Santamarina, J.C. 1996. Study of clay–cementslurries with mechanical and electromagnetic waves. Journal ofGeotechnical Engineering, ASCE,122: 365–373.
Fratta, D., and Santamarina, J.C. 1996. Wave propagation in soil:multi-mode, wide-band testing in a waveguide device.Geotechnical Testing Journal,19: 130–140.
Hardin, B.O. 1965. The nature of damping in sands. Journal of theSoil Mechanics and Foundations Division, ASCE,91(SM1):63–97.
Hardin, B.O., and Black, W.L. 1965. Vibration modulus of nor-mally consolidated clay. Journal of the Soil Mechanics andFoundation Division, ASCE,95(SM6): 1531–1537.
Jovicic, V., Coop, M.R., and Simic, M. 1996. Objective criteria fordetermining Gmax from bender element tests. Technical note.Géotechnique,46: 357–362.
Knight, R., and Nolen-Hoeksema, R. 1990. A laboratory study ofdependence of elastic wave velocities on pore scale fluid distri-bution, Geophysical Research Letters,17: 1529–1532.
Mok, Y.J., Sanchez Salinero, I., and Stokoe, K.H. 1988. In-situdamping measurements by crosshole seismic method. Recentadvances in ground-motion evaluation. American Society ofCivil Engineers, Geotechnical Special Publication No. 20,pp. 346–358.
Richart, F.E., Jr., Hall, J.R., and Woods, R.D. 1970. Vibration ofsoils and foundations. Prentice-Hall, Inc., Englewood Cliffs,N.J.
Santamarina, J.C., and Fam, M. 1995. Changes in dielectricpermittivity and shear wave velocity during concentration diffu-sion. Canadian Geotechnical Journal,32: 647–659.
Viggiani, G., and Atkinson, J.H. 1995. Interpretation of bender ele-ment tests. Tecnical note. Géotechnique,45: 149–154.
Woods, R.D. 1978. Measurement of dynamics soil properties. Con-ference on Earthquake Enineering and Soil Dynamics, Pasadena,Calif. Geotechnical Engineering Division, American Society ofCivil Engineers, New York, Vol. 1., pp. 91–121.
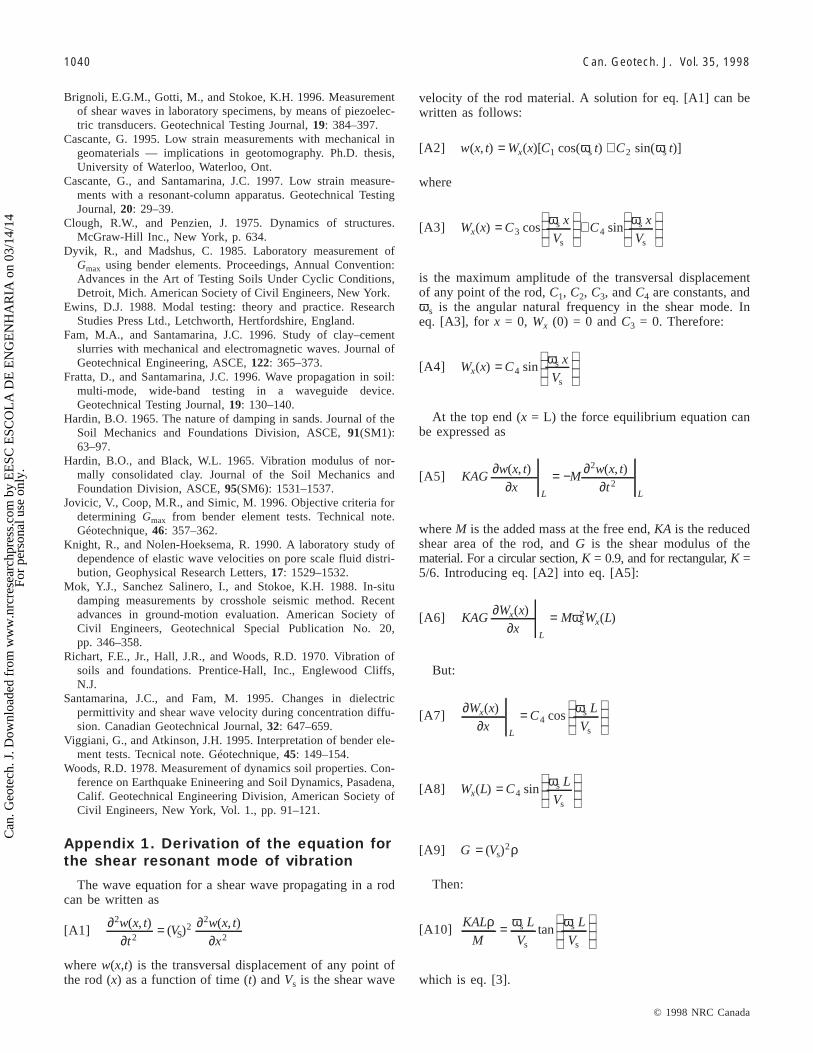
Appendix 1. Derivation of the equation forthe shear resonant mode of vibration
The wave equation for a shear wave propagating in a rodcan be written as
[A1]∂
∂= ∂
∂
2
22
2
2
w x tt
Vw x tx
( , )( )
( , )S
wherew(x,t) is the transversal displacement of any point ofthe rod (x) as a function of time (t) andVs is the shear wave
velocity of the rod material. A solution for eq. [A1] can bewritten as follows:
[A2] w x t W x C t C tx( , ) ( )[ cos( ) sin( )]= +1 2ω ωs s
where
[A3] W x Cx
VC
xV
x( ) cos sin=
+
3 4
ω ωs
s
s
s
is the maximum amplitude of the transversal displacementof any point of the rod,C1, C2, C3, andC4 are constants, andωs is the angular natural frequency in the shear mode. Ineq. [A3], for x = 0, Wx (0) = 0 andC3 = 0. Therefore:
[A4] W x Cx
Vx( ) sin=
4
ωs
s
At the top end (x = L) the force equilibrium equation canbe expressed as
[A5] KAGw x t
xM
w x tt
L L
∂∂
= − ∂∂
( , ) ( , )2
2
whereM is the added mass at the free end,KA is the reducedshear area of the rod, andG is the shear modulus of thematerial. For a circular section,K = 0.9, and for rectangular,K =5/6. Introducing eq. [A2] into eq. [A5]:
[A6] KAGW x
xM W Lx
L
x∂
∂=( )
( )ωs2
But:
[A7]∂
∂=
W xx
CL
Vx
L
( )cos4
ωs
s
[A8] W L CL
Vx( ) sin=
4
ωs
s
[A9] G V= ( )s2ρ
Then:
[A10]KAL
ML
VL
Vρ ω ω=
s
s
s
s
tan
which is eq. [3].
© 1998 NRC Canada
1040 Can. Geotech. J. Vol. 35, 1998
Can
. Geo
tech
. J. D
ownl
oade
d fr
om w
ww
.nrc
rese
arch
pres
s.co
m b
y E
ESC
ESC
OL
A D
E E
NG
EN
HA
RIA
on
03/1
4/14
For
pers
onal
use
onl
y.
This article has been cited by:
1. Kevin Schaeffer, Richard Bearce, Judith Wang. 2013. Dynamic Modulus and Damping Ratio Measurements from Free-FreeResonance and Fixed-Free Resonant Column Procedures. Journal of Geotechnical and Geoenvironmental Engineering 139:12,2145-2155. [CrossRef]
2. M. F. Amaral, A. Viana da Fonseca, S. Rios. 2013. Numerical Methodology to Minimize Resolution and Sensitivity Effects in P-Wave Measurements. Geotechnical Testing Journal 36:2, 20120111. [CrossRef]
3. Chee-Ming Chan. 2012. Variations of Shear Wave Arrival Time in Unconfined Soil Specimens Measured with Bender Elements.Geotechnical and Geological Engineering 30:2, 461-468. [CrossRef]
4. A. Patel, K. K. Singh, D. N. Singh. 2012. Application of Piezoceramic Elements for Determining Elastic Properties of Soils.Geotechnical and Geological Engineering 30:2, 407-417. [CrossRef]
5. Jong-Sub Lee, J. Carlos Santamarina. 2005. Bender Elements: Performance and Signal Interpretation. Journal of Geotechnical andGeoenvironmental Engineering 131:9, 1063-1070. [CrossRef]
Can
. Geo
tech
. J. D
ownl
oade
d fr
om w
ww
.nrc
rese
arch
pres
s.co
m b
y E
ESC
ESC
OL
A D
E E
NG
EN
HA
RIA
on
03/1
4/14
For
pers
onal
use
onl
y.