Focusing of synchrotron radiation by compound refractive lenses made from glassy carbon

ARTICLE
DOI: 10.1002/zaac.201400163
MCX: a Synchrotron Radiation Beamline for X-ray Diffraction LineProfile Analysis
Luca Rebuffi,*[a,b] Jasper R. Plaisier,[a] Mahmoud Abdellatief,[a] Andrea Lausi,[a] andPaolo Scardi[b]
Keywords: Synchrotron radiation; X-ray diffraction; Line Profile Analysis; Nanomaterials; Instrumental profile function
Abstract. The potential of modern methods for X-ray diffraction LineProfile Analysis can be fully exploited with data collected at synchro-tron radiation beamlines, provided that optics and experimental set-upare suitably designed and characterized. The Material Characterizationby X-ray Diffraction beamline, MCX, at Elettra-Sincrotrone Trieste,
Introduction
Modern methods for X-ray Diffraction (XRD) Line ProfileAnalysis (LPA)[1,2] require quality data to obtain detailed andreliable information. Therefore, Synchrotron Radiation (SR),with the high beam brilliance, energy selectivity, and focusingconditions, now routinely available at most facilities, seemsthe most appropriate choice to collect high quality powder dif-fraction data. However, for this to be true, optics and experi-mental set-up should be suitably designed and used. MCX,the Material Characterization by X-ray Diffraction beamline atElettra-Sincrotrone Trieste[3] currently operates in the energyrange from 4 to 21 keV, and hosts optics and instrumentationspecific for LPA of nanostructured materials. It allows investi-gating details of crystalline domain size and shape, lattice de-fects and local atomic displacement of static and dynamic na-ture.
Like most modern SR powder diffraction beamlines, MCXadopts the Debye-Scherrer geometry, with a standard glasscapillary sample holder. MCX design, however, is sufficientlyflexible to host flat-plate geometry too, which may be a conve-nient choice for the absence of signal of the capillary and,in general, to analyze bulk samples, thin films, coatings andsurfaces.
As with any experimental set-up, even a simple powder ge-ometry can be affected by considerable aberrations,[4,5] whichcan be a serious limitation to a correct assessment of the instru-ment contribution to the observed line profiles. In particular,
* Dr. L. RebuffiE-Mail: [email protected]
[a] Elettra-Sincrotrone Trieste S.C.p.AStrada Statale 14, Km 163.534149 Basovizza, Trieste, Italy
[b] Department of Civil, Environmental and Mechanical EngineeringUniversity of TrentoVia Mesiano 7738123 Trento, Italy
© 2014 WILEY-VCH Verlag GmbH & Co. KGaA, Weinheim Z. Anorg. Allg. Chem. 2014, 640, (15), 3100–31063100
may operate with a set-up optimally arranged to study nanostructuredmaterials, investigating details of crystalline domain size and shape,lattice defects, and local atomic displacement of static and dynamicnature. Main features of MCX are briefly discussed and best operatingconditions illustrated by representative case studies.
the Instrumental Profile Function (IPF) needs to be “well-be-having”, i.e., easily represented in convenient form for dataanalysis.
The presented work shows how to get the most out of apowder diffraction beamline to fully exploit LPA, pushing res-olution to the limits. Main features of MCX are briefly dis-cussed with reference to LPA applications: specific attentionis paid to the IPF, which is carefully optimized and determinedin a convenient parametric form; examples of application con-cern a nanocrystalline ball milled metal, a thin film materialwith large crystalline domains and a nanocrystalline fluoridepowder studied in non-ambient conditions.
Experimental Section
The MCX Beamline: The Material Characterization by X-ray Diffrac-tion beamline at Elettra-Sincrotrone, Trieste, supports a wide range ofdiffraction experiments from powders, bulk polycrystalline, thin films,and coating materials. Open to users since 2009, over the past yearsMCX hosted a variety of experiments in different fields, as diverseas structure refinement,[6] residual stress analysis,[7] pair distributionfunctions (PDF) of glasses and amorphous compounds,[8] and tempera-ture dependent studies.[9,10]
Flexibility, which is a keyword of MCX, is provided by the optics ofthe line, consisting of two mirrors and a monochromator: a first Pt-coated cylindrical mirror collimates the beam on the horizontally fo-cusing Si(111) double crystal monochromator with the second crystalmounted on a ESRF model sagittal bender.[11] The second – verticalfocusing – Pt-coated mirror is flat and bendable, with a radius adjusta-ble from 6 km to flat. The overall optical layout works in a strictly 1:1configuration, with the monochromator at 18 m from the source andthe focus, and the mirrors positioned symmetrically around it.
The fixed exit - double crystal monochromator (DCM) consists of twoSi crystals cut along the [111] direction, which can be precisely posi-tioned and oriented in the X-ray beam. Two successive Bragg reflec-tions with an inherent energy resolution of 0.014% [given by the Dar-

MCX: a Synchrotron Radiation Beamline
win angular width of the Si (111) reflection] direct photons of thedesired energy parallel to the incoming beam direction, but offset up-ward (out of the direct Bremsstrahlung beam). The crystals are placedon two independent rotation stages, and the second crystal can betranslated along the beam direction in order to keep the exit heightfixed. The optics of the beamline produce X-rays with energy between4 and 21 keV, which flux at the experiment is shown in Figure 1. Thebeam spot at the experiment can be varied from point focus(0.3�0.3 mm2), to line focus (5 �1 mm2).
Figure 1. Calculated flux (photons per s) at the experiment, relative tothe two energies of the Elettra electron beam: 2.4 GeV (solid line) and2.0 GeV (dotted line).
Two alternative setups are used to conduct the diffraction experiments.First one is based on a 4-circle Huber diffractometer, equipped with ahigh-count rate fast scintillator detector. Either a set of slits or an ana-lyzer crystal (Si(111)) is positioned before the detector to achieve ahigh angular resolution. Both Bragg-Brentano (flat plate) and Debye-Scherrer (capillary) geometry may be employed in the experiments.The sample area is large, thus allowing space for hosting differentenvironmental chambers. As part of the standard equipment, capillariescan be cooled or heated in the 100–1300 K range.
An alternative experimental setup based on a furnace has been devel-oped[12] to provide an atmosphere and temperature controlled environ-ment for powders in capillaries and a temperature controlled environ-ment for thin-film samples. The whole powder pattern is recorded bya translating image plate, as a fast data collection system to followphase transformations and chemical reactions. The furnace in its cur-rent setup allows heating up to 1300 K.
Results and Discussion
MCX Instrumental Profile Function
The Instrumental Profile Function of MCX was experimen-tally determined analyzing the NIST SRM 660a (LaB6) lineprofile standard, using borosilicate glass capillaries (0.1 mmdiameter) in the traditional Debye-Scherrer geometry.
Instrumental peak profiles were described by pseudo-Voigtcurves, adopting a standard parameterization for the depen-dence of peak width and shape on the diffraction angle: Cagli-oti’s equation is used for the FWHM (Full Width at Half Maxi-mum), whereas a parabolic function describes peak shape, inthis case the Lorentz profile fraction η (aka pseudo-Voigt mix-ing parameter):[13–15]
Z. Anorg. Allg. Chem. 2014, 3100–3106 © 2014 WILEY-VCH Verlag GmbH & Co. KGaA, Weinheim www.zaac.wiley-vch.de 3101
FWHM (θ) = �W + Vtanθ + Utan2θ (1)
η (θ) = a + bθ + cθ (2)
The apparent shift of the peak centroid, caused by aber-rations along the beam path, were also parameterized using atanθ polynomial which closely follows Wilson’s formulas:[16]
Δ2θ (θ) = axtan–1θ + bx + cxtanθ + dxtan2θ + extan3θ (3)
Parameters W, V, U, a, b, c, ax, bx, cx, dx, ex were adjustedto best fit experimental data collected for a sufficiently largenumber of LaB6 peaks across the whole accessible 2θ range.Additional aberrations, indirectly affecting the IPF, include a2θ zero error and capillary alignment errors in horizontal andvertical directions.[17,18]
The following paragraphs show the IPF in standard op-erating conditions, which give the best flux available, a set-upchosen by the vast majority of users.
Standard Operating Conditions (SOC)
In order to maximize the flux at the detector, MCX operatesby focusing the beam both in the vertical and in the horizontalplane at the detector level. Vertical divergence is controlledby acting on the second (bendable) mirror, whereas horizontaldivergence is managed by acting on the second (also bendable)crystal of the monochromator. The diffracted beam is colli-mated by setting the slits at a maximum aperture of 0.1 mm,to limit the effects of axial divergence.
Figure 2 shows the LaB6 patterns collected in capillary con-figuration at 15 keV. Details of two low angle peaks are shownto demonstrate the quality of the IPF, which is very closelyreproduced by the simple, symmetrical pseudo-Voigt profile.This provides a reliable parameterization according to Equa-tion (1), Equation (2), and Equation (3), which can easily beused in LPA software,[19,20] and in general, to represent in areasonably accurate way the IPF at any desired diffraction an-gle. It is worth underlining that this favorable condition, unlikebeamlines operating at other SR facilities, can easily be ob-tained across the 4–21 keV energy range and different sampleenvironment conditions available at MCX.
Figure 2. Standard LaB6 powder pattern at 15 keV: experimental data(circles) and fit (line), with their difference (residual, line below). GoFis 0.647. Insets show details of low angle peak profiles (first and sec-ond visible peaks).

L. Rebuffi et al.ARTICLEFigure 3 shows a comparison of instrumental broadening at
different energies. As photon energy is inversely proportionalto the wavelength, Bragg’s law provides for a decrease inFWHM with higher energies; however, this condition is onlyverified at relatively low 2θ angles, whereas other factors inthe powder geometry (e.g., absorption) and beamline set-upmake the general dependence of FWHM on energy more com-plicated, which clearly requires an experimental determinationlike that shown in the presented work.
Figure 3. Instrumental broadening (represented as Full Width at HalfMaximum – FWHM) at different beam energy: 11, 15, and 20 keV.
Optical Characterization of the Instrumental Profile
A more detailed study was made on the IPF at 11 keV beamenergy, with the Si(111) analyser crystal installed on the detec-tor arm. In particular, by acting on the monochromator and onthe second mirror it is possible to reduce, respectively, hori-zontal and vertical divergence of the beam.
As visible in Figure 4, relevant effects can be obtainedworking at the vertical divergence of the beam, i.e. in the planeof the diffraction signal, whereas reducing the horizontal diver-gence has little effect on the peak profile. In Figure 5 it ispossible to see the effect on peak width and shape of defocus-ing the second mirror, so to narrow the instrumental peak pro-file down to 0.012°. While this improvement would of coursebe always desirable, the price to pay to achieve the narrowestinstrumental profile is a 70 % loss of the SOC flux.
Figure 4. Instrumental FWHM vs. 2θ in capillary configuration.Defocusing is given in motor step units from the detector level (motorsstep 0).
www.zaac.wiley-vch.de © 2014 WILEY-VCH Verlag GmbH & Co. KGaA, Weinheim Z. Anorg. Allg. Chem. 2014, 3100–31063102
Figure 5. Effect of defocusing of the second mirror on the peak shapeand width, LaB6 (110) reflection at 15 keV: SOC (circles), Mirror Fo-cus –100000 step (squares) and Mirror Focus –200000 step (triangles).Defocusing is given in motor step units from the detector level (motorsstep 0).
As can be seen from Figure 6, in flat plate configuration,reducing the vertical divergence does not give a similar im-provement on the FWHM as in capillary configuration. Thisis due to a widening of the beam footprint on the sample,which is detrimental with this geometry, as it creates additionalpeak broadening. This is of course a major limitation in practi-cal operation.
Figure 6. Instrumental FWHM vs. 2θ angle in flat-plate configuration.Defocusing is given in motor step units from the detector level (motorsstep 0).
These results confirm, as expected, that the best resolutionand IPF is obtained in the capillary mode, much more effectivein limiting aberrations and instrumental broadening than theflat-plate configuration. The latter, however, has a practicalvalue for specimens that cannot be used in capillary geometry,and is an added value and an asset of MCX in many materialsscience and technology studies.
Domain Size and Dislocation Density in a PlasticallyDeformed Metal Powder
The main advantages of using SR powder diffraction datafor LPA can be appraised in the following study of ball millingeffects on an iron alloy powder. A Fe1.5wt-%Mo powder wasextensively ground (64 h) in a planetary mill,[21] so to finely

MCX: a Synchrotron Radiation Beamline
refine the microstructure and reach high levels of work-harden-ing.[22]
Besides the importance of a narrow, well-behaving IPF andstatistical quality of the data, information must be collected upto high Q (= 4π sinθ/λ), so to encompass as many diffractionpeaks as possible. To better appreciate the relevance of thesefeatures, Figure 7 shows data for the same ball milled samplecollected both on a traditional powder diffractometer and atMCX, with the same 30 s acquisition time per step. Despitethe intrinsic decay of the intensity with q caused by atomicscattering and thermal factors, several additional peaks and dif-fraction orders are visible in the MCX measurement; infor-mation from many peak profiles is highly desirable in LPA, inorder to exploit the anisotropic line broadening effect of latticedefects, like dislocations, and properly separate strain effectsfrom those given by the domain size.
Figure 7. X-ray powder diffraction patterns for a Fe1.5wt-%Mo pow-der after 64 h planetary ball milling, as measured in a traditionalBragg-Brentano diffractometer (using Cu-Kα radiation at 8 keV) andat MCX (with an energy of 15 keV). SR data are easily recognized asmore intense and extended to high Q.
MCX powder data were analyzed by Whole Powder PatternModelling (WPPM),[19,23] assuming spherical domains withlognormally distributed diameters and dislocations in the pri-mary slip-system of (bcc) α-Fe.[22] Refined parameters, besidesunit cell parameter, include mean (�D�) and standard devia-tion (s.d.) of the size distribution, mean dislocation density(ρ), effective outer cut-off radius (Re) and mixing parameter(fraction of edge / screw dislocations, fE). Results are shownin Figure 8, with details on the most intense peak profiles, andin Table 1. Figure 9 shows the distribution of domain dia-meters, with indication of arithmetic (�D�), surface weighted(�D�S), and volume weighted (�D�V) mean values.[24]
The unit cell parameter is larger than the pristine powder[0.28703(5) nm], as a combined effect of progressive contami-nation (grinding media are made of Cr steel) and free volumefrom lattice defects. The ball milling conditions are more se-vere than in previous studies[21,22] and give rather small crys-talline domains and high dislocation density. However a refer-ence figure, �D�√ρ, providing an average number of equiva-lent random dislocations per domain, is around 2 as in previousstudies;[2] the interaction parameter (aka Wilkens parameter,M) being around unity confirms the validity of the hypothesesof the Wilkens theory used in the WPPM,[19,25,26] pointing outa rather strong correlation among dislocations, whose character
Z. Anorg. Allg. Chem. 2014, 3100–3106 © 2014 WILEY-VCH Verlag GmbH & Co. KGaA, Weinheim www.zaac.wiley-vch.de 3103
Figure 8. WPPM results for a ball-milled Fe1.5wt-%Mo (MCX datacollected at 15 keV, capillary mode): experimental data (circle), model(line), and their difference (residual, line below). GoF = 0.81.
Table 1. WPPM results for ball milled Fe1.5 wt-%Mo powder. Seetext for details.
Values
Unit cell parameter a/nm 0.287306(3)�D� /nm 8.2(3)�D�S /nm 9.3(3)�D�V /nm 10.2(4)s.d. /nm 6.4(3)ρ /1015 m–2 46(2)Re /nm 4(1)M a) ≈0.9fE 0.52(1)
a) = Re√ρ.
Figure 9. Spherical domain diameter (D) distribution for the ball-milled Fe1.5wt-%Mo powder of Figure 7 and Figure 8, with indicationof mean sizes (see text for details).
is intermediate between edge and screw, also in agreementwith previous results.[22]
It is also worth noting that the different mean sizes, even ifrepresenting different combinations of the distribution mo-ments[24] are not too different. This is an effect of the relativelynarrow size distribution, a typical feature of high energy grind-ing processes reaching a limit condition when a true nanostruc-ture is formed, with fine, roughly equiaxial and monodispersedomains.[27–30]
L. Rebuffi et al.ARTICLEMicrostructural Properties of CZTS (Cu2ZnSnS4)Thin Films
It was recently shown that the bandgap of CZTS(Cu2ZnSnS4), a p-type semiconductor with kesterite structureshowing promising behavior as absorber in thin film solarcells, depends on stoichiometry and microstructure.[31,32] Thiscorrelation was studied in thin films prepared by sulfurizationof multilayered precursors of ZnS, Cu, and Sn, changing therelative amounts to obtain CZTS layers with different compo-sitions. Crystalline domain size and presence of lattice defectswas studied by LPA: as the available samples were thin filmson glass substrates, the flat-plate geometry at MCX came inparticularly handy.
A preliminary screening of the powder pattern showed thepolycrystalline nature of the CZTS layer, with lack of signifi-cant crystallographic orientations, so that data could be ana-lyzed by WPPM as for any polycrystalline material: layerthickness was sufficient to produce good quality patterns, witha broad halo from the amorphous glass substrate (modelled aspart of the background function). Lattice defects seem not rel-evant in this case, so the refined microstructural parametersonly refer to the crystalline domains, which are again assumedspherical, with sizes distributed according to a gamma func-tion.[32]
A detailed account on this study can be found elsewhere,[31]
but it is worth considering herein the result shown in Fig-ure 10. This sample, having a low tin content and highbandgap (1.62 eV), belongs to a series of CZTS layers whosedomain size is correlated with the stoichiometry.[32] The in-verse proportionality between domain size and peak width setsa limit to the largest domain sizes that LPA can actually mea-sure, and the usually accepted limit is 200 nm or less. The insetof Figure 10 shows details of the most intense peak profile anda comparison with the instrumental profile that clearly demon-strate the refined size (mean value 275(50) nm) is above theconventional upper limit of LPA, but well within the sensitivitylimits for the instrumental setup available at MCX. Currentresearch work on organic compounds confirmed the possibility
Figure 10. WPPM results for a CZTS thin film (sample K275 of [32],�D� = 275(50) nm; data collected at 15 keV, flat-plate geometry):experimental data (circle), model (line), and their difference (residual,line below). GoF = 1.28. Insets show details of the most intense lineprofile (solid line), with a comparison with the instrumental peak pro-file (IPF, dotted line).
www.zaac.wiley-vch.de © 2014 WILEY-VCH Verlag GmbH & Co. KGaA, Weinheim Z. Anorg. Allg. Chem. 2014, 3100–31063104
of measuring large domain sizes, with mean values even above300 nm.[33]
LPA on Non-Ambient Data for a Nanostructured IonicConductor
This example is part of a broader research work on the effectof high energy grinding on fluorides, as typical ionic conduc-tors.[34,35] Nanocrystalline SrF2 (Riedel-de Haen company,99.98%) was analyzed at different temperatures below roomtemperature (RT) to measure the effect of the nanostructure onthe Thermal Expansion Coefficient (TEC). The low tempera-ture region was chosen to avoid annealing effect that mightoccur above RT.
Data were collected at 8 keV on a glass capillary (0.3 mmdiameter) hosted by a cryostat for in-situ XRD (operatingrange: 125 K to RT). The five most intense reflections of SrF2,(111), (220), (311), (222), and (400) were measured at fourtemperatures, using NIST SRM 640a Silicon as unit cell pa-rameter standard for the instrumental calibration.
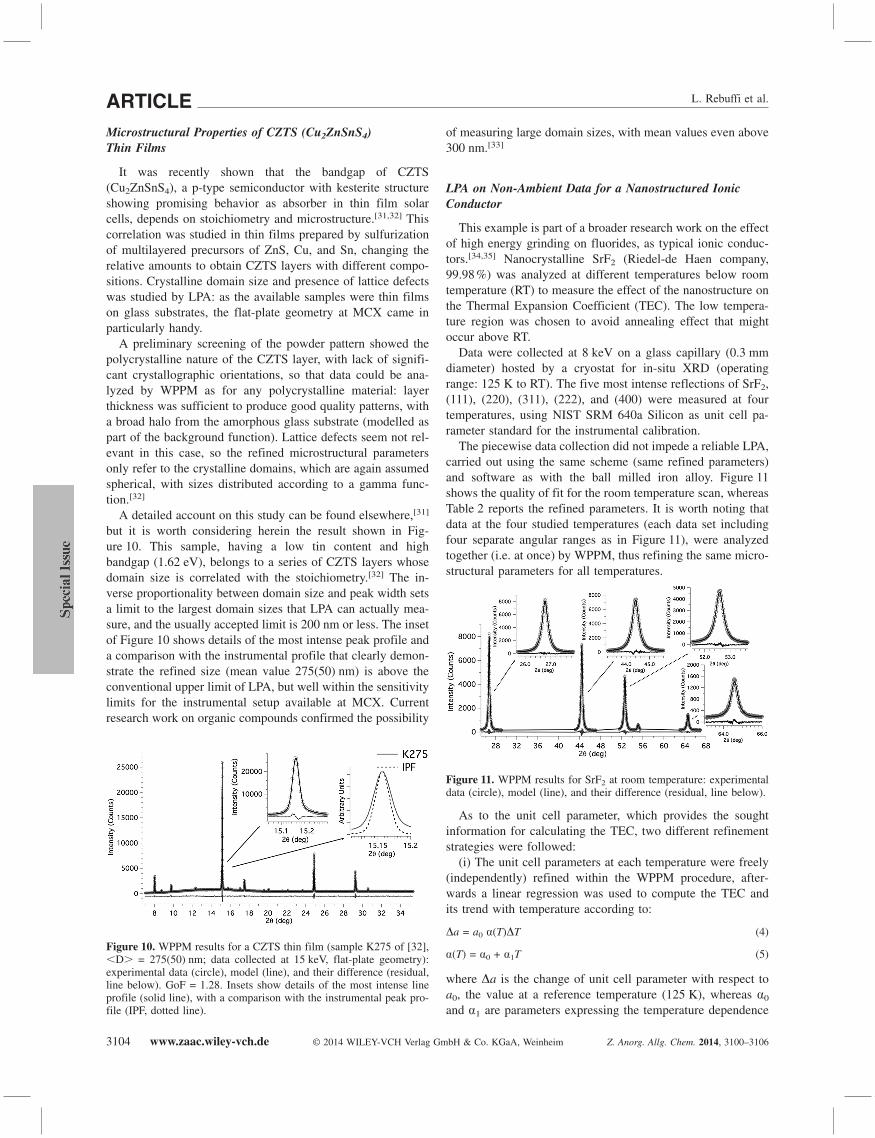
The piecewise data collection did not impede a reliable LPA,carried out using the same scheme (same refined parameters)and software as with the ball milled iron alloy. Figure 11shows the quality of fit for the room temperature scan, whereasTable 2 reports the refined parameters. It is worth noting thatdata at the four studied temperatures (each data set includingfour separate angular ranges as in Figure 11), were analyzedtogether (i.e. at once) by WPPM, thus refining the same micro-structural parameters for all temperatures.
Figure 11. WPPM results for SrF2 at room temperature: experimentaldata (circle), model (line), and their difference (residual, line below).
As to the unit cell parameter, which provides the soughtinformation for calculating the TEC, two different refinementstrategies were followed:
(i) The unit cell parameters at each temperature were freely(independently) refined within the WPPM procedure, after-wards a linear regression was used to compute the TEC andits trend with temperature according to:
Δa = a0 α(T)ΔT (4)
α(T) = α0 + α1T (5)
where Δa is the change of unit cell parameter with respect toa0, the value at a reference temperature (125 K), whereas α0
and α1 are parameters expressing the temperature dependence

MCX: a Synchrotron Radiation Beamline
Table 2. WPPM results for the nanocrystalline SrF2 patterns collectedat 150 K, 200 K, 270 K, and 300 K and analyzed with (i), free unitcell parameters, a, or (ii) adopting a parametric relation for a (Equa-tion (5)). See text for details.
ModelFree Parametric
Lattice parameter a /Å 5.8041(1) 5.8040(1)�D� /nm 13.6(3) 13.6(3)ρ /1015·m–2 2.2(6) 2.30(3)Re /nm 7(3) 7 b)
M 0.82(7) 0.81(3)αo /10–6 8.4(20) 8.699(36)α1 /10–6 K–1 0.0192(83) 0.0191(59)α a) /10–6 K–1 14.2(45) 14.4(18)
a) α = αo + α1T, T = 300 K. b) Refers to a fixed parameter to roomtemperature free model to maintain model stability.
of the TEC, α(T), with α1 expressing the effect of anharmonic-ity;
(ii) A parametric approach was used in the WPPM of thepatterns collected at the four different temperatures. Equation(4) and Equation (5) were used in the WPPM, so to enforcethermal expansion laws during the XRD data modelling. Inthis case, the dislocation model parameter Re was fixed to theroom temperature value of the free model in order to keep theparametric model stability.
Despite the limited profile information and non-ambientdata collection condition, LPA gave a stable and reasonableresult, with a domain size around 14 nm and a limited, butvisible amount of dislocations in the primary slip system ofSrF2 (which has fluorite structure, so �001�{110}).[36] Dislo-cation character is close to pure edge [fE = 0.89(1)], as alsofound in studies on similar fluoride materials.[37]
As shown in Figure 12, refinement strategies (i) and (ii)gave similar results, with a visible effect (α1 � 0) of anhar-monicity. It is worth noting that, as it happens with parametricapproaches, enforcing Equations (4) and (5) tends to reduce(underestimate) the estimated standard deviation (esd) (cf.Table 2). Figure 13 shows that the linear TEC is just a roughapproximation to the observed results: experimental valuesfluctuate about the linear best fit of Equation (5) as a conse-quence of lattice anharmonicity. As a further evidence of thedata modelling, despite the relatively large esd, the measured
Figure 12. Unit cell parameter a as a function of temperature, as ob-tained by WPPM using models (i), free (circles), or (ii), parametricrelation (squares). See text for details.
Z. Anorg. Allg. Chem. 2014, 3100–3106 © 2014 WILEY-VCH Verlag GmbH & Co. KGaA, Weinheim www.zaac.wiley-vch.de 3105
TEC at room temperature is lower than the bulk literaturevalue of 16.4 (10–6 K–1).[38] Both lattice anharmonicity andlower TEC were also observed and discussed in a recent studyon nanocrystalline CaF2.[34] Although the experimental evi-dence on SrF2 is still limited, it seems reasonable that thismight be a common behavior for several fluorides and isomor-phic compounds of CaF2. Further experimental work is re-quired in this context.
Figure 13. Anharmonicity trend with model (i); a linear fit with 90%C.L. bands is shown.
ConclusionsSynchrotron radiation XRD can offer considerable advan-
tages to a Line Profile Analysis, in terms of (i) high statisticaldata quality, (ii) narrow instrumental profile component, and(iii) possibility to enlarge the Ewald sphere (i.e., to measuremore diffraction profiles) by using suitably high energy X-rays. Advantages can also be exploited in non-ambient condi-tions, but for all of this to be true the beamline must be prop-erly designed and operated, in particular to obtain a regularand controlled Instrumental Profile Function across a broadrange of diffraction angles.
Results of this work, also illustrated with three representa-tive cases of study, show that such a profitable condition isavailable at MCX, the Material Characterization by X-ray Dif-fraction beamline at Elettra Sincrotrone Trieste. An importantchallenge for the future is to further improve the operatingconditions to allow reliable measurements of large crystallinedomains, a subject with many possible applications, so to ex-tend the current limits of Line Profile Analysis.
Acknowledgements
We gratefully acknowledge Dr. Cristy Leonor Azanza Ricardo, Dr.Mirco D’Incau, Dr. Claudia Malerba, and Dr. Alberto Mittiga forkindly providing their results and fruitfully collaborating to this work.Many thanks to MCX beamline technician Mr. Giulio Zerauschek forhis continuous support and for providing high quality manufacturingand smart solutions to practical problems.
References[1] Diffraction Analysis of the Microstructure of Materials (Eds.: E. J.
Mittemeijer, P. Scardi), Springer Series in Materials Science,2004.

L. Rebuffi et al.ARTICLE[2] P. Scardi, in: Powder Diffraction: Theory and Practice, (Eds.:
R. E. Dinnebier, S. J. L. Billinge), The Royal Society of Chemis-try, Cambridge, United Kingdom, 2008, pp. 376–413.
[3] http://www.elettra.eu.[4] F. Gozzo, A. Cervellino, N. Leoni, P. Scardi, A. Bergamaschi, B.
Schmitt, Z. Kristallogr. 2012, 225, 616.[5] B. Hinrichsen, R. E. Dinnebier, M. Jansen, in: Powder Diffrac-
tion: Theory and Practice, (Eds.: R. E. Dinnebier, S. J. L.Billinge), The Royal Society of Chemistry, Cambridge, UnitedKingdom, ch. 14, 2008, pp. 414–438.
[6] C. Artini, G. A. Costa, M. Pani, A. Lausi, J. R. Plaisier, J. SolidState Chem. 2012, 190, 24–28.
[7] G. Ivetic, I. Meneghin, E. Troiani, G. Molinari, J. Ocaña, M. Mo-rales, J. Porro, A. Lanciotti, V. Ristori, C. Polese, J. R. Plaisier,A. Lausi, Mater. Sci. Eng. A 2012, 534, 573–579.
[8] G. Cobourne, G. Mountjoy, J. D. Rodriguez-Blanco, L. G.Benning, A. C. Hannon, J. R. Plaisier, J. Non-Cryst. Solids, 2014,in press, DOI:10.1016/j.jnoncrysol.2013.12.023.
[9] G. Ventruti, F. Scordari, G. D. Ventura, F. Bellatreccia, A. F. Gual-tieri, A. Lausi, Phys. Chem. Miner. 2013, 40, 659–670.
[10] G. Diego Gatta, M. Merlini, P. Lotti, A. Lausi, M. Rieder, Micro-porous Mesoporous Mater. 2012, 163, 147–152.
[11] L. Zhang, R. Hustace, O. Hignette, E. Ziegler, A. Freund, J. Syn-chrotron Radiat. 1998, 5, 804–807.
[12] P. Riello, A. Lausi, J. MacLeod, J. R. Plaisier, G. Zerauschek, P.Fornasiero, J. Synchrotron Radiat. 2013, 20, 194–196.
[13] G. Caglioti, A. Paoletti, F. P. Ricci, Nucl. Instrum. Methods 1958,3, 223–228.
[14] P. Scardi, L. Lutterotti, P. Maistrelli, Powder Diffr. 1994, 9, 180–186.
[15] P. Scardi, M. Leoni, J. Appl. Crystallogr. 1999, 32, 671–682.[16] A. J. C. Wilson, Mathematical Theory of X-ray Powder Dif-
fractometry, Eindhoven, The Netherlands, Philips Technical Li-brary, 1963.
[17] R. W. Cheary, A. A. Coelho, J. Appl. Crystallogr. 1998, 31, 851–861; R. W. Cheary, A. A. Coelho, J. Appl. Crystallogr. 1998, 31,862–868.
[18] R. W. Cheary, A. A. Coelho, J. P. Cline, J. Res. NIST 2004, 109,1–25.
[19] P. Scardi, M. Ortolani, M. Leoni, Mater. Sci. Forum 2010, 651,155–171.
[20] Y. H. Dong, P. Scardi, J. Appl. Crystallogr. 2000, 33, 184–189.[21] A. Troian, M. D. Thesis, University of Trento, Italy, 2013.
www.zaac.wiley-vch.de © 2014 WILEY-VCH Verlag GmbH & Co. KGaA, Weinheim Z. Anorg. Allg. Chem. 2014, 3100–31063106
[22] M. D�Incau, M. Leoni, P. Scardi, J. Mater. Res. 2007, 22, 1744–1753.
[23] P. Scardi, M. Leoni, J. Appl. Crystallogr. 2006, 39, 24–31.[24] P. Scardi, M. Leoni, Acta Crystallogr., Sect. A 2001, 57, 604–613.[25] M. Wilkens, Fundamental Aspects of Dislocation Theory, (Eds.:
J. A. Simmons, R. de Wit, R. Bullough) vol. II, Nat. Bur. Stand.,US, Spec. Publ. No 317, Washington, DC. USA, 1195, 1970.
[26] M. Wilkens, Phys. Status Solidi A 1970, 2, 359.[27] R. Z. Valiev, Yu. V. Ivaniesenko, E. F. Rauch, B. Baudelet, Acta
Materialia 1996, 44, 4705–4712.[28] I. Börner, J. Eckert, Mater. Sci. Eng. A 1997, 226–225, 541–545.[29] Y. Xu, Z. G. Liu, M. Uemoto, K. Tsuchiya, Metall. Mater. Trans.
A 2002, 33, 2195–2203.[30] A. Mishra, B. K. Kad, F. Gregori, M. A. Mayers, Acta Materialia
2007, 55, 13–28.[31] C. Malerba, F. Biccari, C. L. Azanza Ricardo, M. Valentini, R.
Chierchia, M. Mueller, A. Santoni, E. Esposito, P. Magiapane, P.Scardi, A. Mittiga, J. Alloys Compd. 2014, 582, 528–534.
[32] C. Malerba, C. L. Azanza Ricardo, M. Valentini, F. Biccari, M.Müller, L. Rebuffi, E. Esposito, P. Mangiapane, P. Scardi, A. Mit-tiga, J. Renewable Sustainable Energy 2014, 6, 011404.
[33] C. Fandaruff, M. A. Segatto Silva, D. C. Galindo Bedor, D. Per-eira de Santana, H. V. Antunes Rocha, C. L. Azanza Ricardo, L.Rebuffi, P. Scardi, S. L. Cuffini, Angew. Chem. 2014, submitted;P. V. S. Lia Fook, M. Broseghini, C. Fandaruff, C. L. AzanzaRicardo, L. Rebuffi, H. V. Antunes Rocha, S. L. Cuffini, P. Scardi,14th European Powder Diffraction Conference (EPDIC 14),Aarhus, Denmark, 15–18 June, 2014, Poster MS07_P67, (http://epdic14.au.dk/fileadmin/epdic14.au.dk/Downloads/BOOK_OF_ABSTRACTS_hyperlinked.pdf).
[34] M. Abdellatief, A. Lausi, J. R. Plaisier, P. Scardi, Metall. Mater.Trans. A 2014, 45, 123–128.
[35] M. Abdellatief, M. Abele, M. Leoni, P. Scardi, J. Appl. Crys-tallogr. 2013, 46, 1049–1057.
[36] A. Muñoz, A. D. Rodriguez, J. Castaing, J. Mater. Sci. 1994, 29,6207.
[37] M. Abdellatief, M. Abele, M. Leoni, P. Scardi, Thin Solid Films2013, 530, 44–48.
[38] T. S. Aurora, S. M. Day, D. O. Pederson, J. Appl. Phys. 1994, 76,2122–2128.
Received: April 10, 2014Published Online: June 12, 2014
Copyright © 2022 FDOKUMEN