Matti Järveläinen Towards In Situ Methods for ...
190
Matti Järveläinen Towards In Situ Methods for Characterization of Porous Materials Julkaisu 1411 • Publication 1411 Tampere 2016
-
Upload
khangminh22 -
Category
Documents
-
view
4 -
download
0
Transcript of Matti Järveläinen Towards In Situ Methods for ...

Matti JärveläinenTowards In Situ Methods for Characterization of PorousMaterials
Julkaisu 1411 • Publication 1411
Tampere 2016

Tampereen teknillinen yliopisto. Julkaisu 1411 Tampere University of Technology. Publication 1411
Matti Järveläinen
Towards In Situ Methods for Characterization of Porous
Materials Thesis for the degree of Doctor of Science in Technology to be presented with due permission for public examination and criticism in Festia Building, Auditorium Pieni Sali 1, at Tampere University of Technology, on the 16th of September 2016, at 12 noon.
Tampereen teknillinen yliopisto - Tampere University of Technology Tampere 2016

ISBN 978-952-15-3801-8 (printed) ISBN 978-952-15-3830-8 (PDF) ISSN 1459-2045

Tampereen teknillinen yliopisto. Julkaisu 1411 Tampere University of Technology. Publication 1411
Matti Järveläinen
Towards In Situ Methods for Characterization of Porous Materials Thesis for the degree of Doctor of Science in Technology to be presented with due permission for public examination and criticism in Festia Building, Auditorium Pieni Sali 1, at Tampere University of Technology, on the 16th of September 2016, at 12 noon.
Tampereen teknillinen yliopisto - Tampere University of Technology Tampere 2016

ISBN 978-952-15-3801-8 ISSN 1459-2045

ii
Abstract
Automation is becoming ever more important in production processes. But its progress
is being hampered because a large part of process control is currently based on tacit
knowledge, which is lost when plant operators retire. To offset this fading of knowledge,
process variables must be quantified, because another change underway is the evident
shift from conventional mass production to lean and green production, which promotes
ordered production flow and rational process optimization by minimizing non-value-
added work. Both of these changes have affected the analysis of materials and neces-
sitated in situ study of processes through their material properties.
All the developed in situ methods in this thesis embody analysis of porous ceramics of
different composition and pore structure, or the extent of added value in unfinished
ceramic structures during powder compression [VII] and colloidal processing [V], in
finished ceramic components in unsintered, high porosity fiber structures [I, III, VI], in
ceramics composed of sintered, low porosity solids [II], and in oriented, lamellar struc-
tures [IV]. From the materials science perspective, the study of these porous ceramics
provides information on their mechanical behavior in relation to pore structure: the ef-
fect of porosity changes in powder structure [VII], the effect of sintering in fibrous struc-
ture [III], and the effect of pore orientation in lamellar structure [IV]. The second investi-
gated regime is the behavior of electrical signals in a porous material in sintered struc-
ture [II], and in suspensions [V]. Third regime is the investigation of local permeability of
a fibrous structure [I, VI].
Whereas this thesis work focused mostly on the concrete development of 6 different
characterization methods—thermal flow permeametry, grit blast-analysis, electrical
pore analysis, adaptive image analysis, and granule bed compression—the results in
the introduction demonstrate a systematic approach to developing process integrable
in situ methods and discuss the relative importance of the methods’ robustness, inte-
grability, reliability, and comprehensiveness. In the regime of materials science, this
work contributes to the analysis of pore characteristics and the effects of pores by
showing results of granule bed strength measurement, the effect of the pore parameter
on compressive strength, the concept of fiber free length, and a strong hypothesis
about the reactions of material interfaces with electrical signals.

iii
Preface
I’ve understood that everything can be predicted with a hundred percent certainty given
that all the variables are known (Laplace’s demon). My take on this are the in situ
methods that measure some occurrences better than anything there was before them.
Still, I do not claim to understand the real world very well, but have made it more pre-
dictable. This has not been my thrive in personal life as I like surprises but the industrial
processes are better without them.
About the publications
Articles [I, III, VI] are based on experiments done in a project that was funded by a cus-
tomer. The project was carried out during 2010-2014 and aimed to increase the under-
standing of variables that dominate the lifespan of fibrous hot gas filter elements, which
are industrially used. A secondary objective was to develop methods, such as those
published, which could be used to analyze the remaining lifetime.
Articles [II, V] are based on experiments done in a project that was carried out during
2012-2014 and funded by the Finnish Funding Agency for Innovation (TEKES) and
steered by Finnish industrial partners Nordkalk, IDO and Outotec. The project focused
on material responses to a multifrequency signal and aimed to develop on site methods
for analysis of industrially produced or industrially used products measuring the func-
tioning of filters, drying of ceramics, homogeneity of powders, and porosity and specific
surface area of materials.
Article [IV] is a collaborative effort with the main author from Stockholm University. Arti-
cle [VII] is based on the development of a method directly funded by an industrial cus-
tomer. Because all the industrially funded work was carried out under a non-disclosure
agreement, the names of some companies, their processes, and the producers of the
studied materials cannot be revealed.
Support
This work has been supported by Tekniikan Edistämissäätiö, Yrjö ja Senja Koivusen
Säätiö, and the work for article [IV] was supported by the Journal of European Ceramic
Society - Young Researcher's funding. The science foundation of Tampere funded the
print costs of this thesis.
iv
Thank you colleagues and co-authors
Professor Emeritus Tapio Mäntylä caused me to start the work leading to this disserta-
tion. Professor Erkki Levänen gave me a brimful of resources to get this finished. Dr.
Arto Ojuva, triggered me to finish this now - soothing to have someone to blame.
Co-authors of the publications and the staff of Department of Materials Science. Espe-
cially Arnold and Saara.
Thank you industrial partners
Although there is no such thing as objective reality or the real world, I’ve always felt the
need for some relevance for the research. This has been offered to me through being
able to test the developed methods in industrial challenges with Juhani Isaksson, Vesa
Helanti, Piia Keitaanniemi, Thomas Kronberg, Bjarne Ekberg and Lars Grönroos.
Thank you family
Jasmina arranged the possibility to work on this thesis in a peaceful environment which
was invaluable during 2015 summer when I was in the writing mode. Jasmina also
drew the sketches of the in situ devices. My father suggested me to start studying ma-
terials science, it suited me well like you predicted. Both of my grandfathers, Vesa and
Toivo, have been urging me to get that cone (kiitos kummallekin isoisälleni, Vesalle ja
Toivolle, kun olette kannustaneet hankkimaan tötterön).
In the archipelago, Storlandet of Nauvo, 11th July, 2016
Matti Järveläinen

v
Contents
Abstract……………………………………………………………………………………… ii
Preface………………………………………………………………………………………. iii
List of Figures………………………………………………………………………………. viii
List of Diagrams …………………………………………………………………………... viii
List of Tables………………………………………………………………………………. ix
List of Publications…………………………………………………………………………. x
Structure of this thesis and definitions of the developed methods…………………… xiv
1 LEAN, IN SITU -MEASUREMENTS AND THIS THESIS ..................................... 1
1.1 Shift to lean process control ............................................................................ 2
1.1.1 An overview of process control ............................................................... 3
1.1.2 Definition, aim and use of lean ............................................................... 4
1.1.3 Lean benefits of in situ measurement ..................................................... 6
1.2 In situ process measurements ......................................................................... 8
1.2.1 Definition and use of in situ measurements ............................................ 9
1.2.2 Sensors ................................................................................................ 12
1.2.3 Literature survey of in situ analysis....................................................... 13
1.3 Research area and method of the thesis ....................................................... 15
1.3.1 In situ measurements in the ceramics industry ..................................... 16
1.3.2 Contribution of this thesis ..................................................................... 16
1.3.3 Specific challenges and research questions in the thesis ..................... 18
1.3.4 Research approach .............................................................................. 20
1.3.5 TUT and the ceramics laboratory ......................................................... 22
2 THEORETICAL BACKGROUND ON PORES, POROSITY AND THEIR
MEASUREMENT ........................................................................................................ 23
2.1 Pores and porosity ........................................................................................ 25
2.1.1 Pores ................................................................................................... 25
2.1.2 Challenge of defining a pore................................................................. 27
2.1.3 Porosity in real life ................................................................................ 29
2.2 Effect of pores and porosity to mechanical features ...................................... 33
2.2.1 Effect of porosity to mechanical features .............................................. 34
2.2.2 Effect of pore characteristics to mechanical strength ............................ 35
2.2.3 Strength of a granular bed under compression ..................................... 36
2.2.4 Mechanical aspects in fibrous materials ............................................... 39
2.3 Effect of pores and porosity to fluid permeability ........................................... 40
vi
2.3.1 Fluid flow in porous media .................................................................... 41
2.3.2 Fluid permeability ................................................................................. 42
2.3.3 Thermal measurement of permeability ................................................. 44
2.3.4 Permeability connection to sorption ...................................................... 44
2.4 Characterization of pores .............................................................................. 45
2.4.1 Porosity and pore size distribution ........................................................ 45
2.4.2 Permeability ......................................................................................... 48
2.4.3 Pore shape and topology ..................................................................... 48
3 MAIN EXPERIMENTAL PROCEDURES AND SAMPLE MATERIALS ............. 51
3.1 Conventional characterization methods ......................................................... 52
3.1.1 General Characterization ..................................................................... 52
3.1.2 Functional pore characterization .......................................................... 53
3.1.3 Dilatometry ........................................................................................... 54
3.2 In situ -characterization methods ................................................................... 54
3.2.1 Grit blasting .......................................................................................... 54
3.2.2 Permeability ......................................................................................... 55
3.2.3 Thermal flow permeameter .................................................................. 56
3.2.4 Image analysis ..................................................................................... 57
3.2.5 Granule bed compression .................................................................... 58
3.2.6 Electrical measurements ...................................................................... 59
3.3 Sample materials used in testing the characterization methods .................... 62
3.3.1 Silicate fiber structure I/III/VI................................................................. 62
3.3.2 Freeze-cast zeolite structure IV ............................................................ 63
3.3.3 Aluminium oxide suspension and sintered aluminium oxide V/II ........... 63
3.3.4 Granulated kaolinite VII ........................................................................ 64
4 COMPARATIVE SUMMARY OF THE RESULTS OF THE ARTICLES ............. 65
4.1 Development of in situ characterization methods .......................................... 66
4.1.1 Thermal flow permeametry I/VI ............................................................ 67
4.1.2 PRBS Porosity analyzer II .................................................................... 70
4.1.3 Grit blaster for fiber structure thermal history III .................................... 72
4.1.4 Automatic pore parameter analyzer IV ................................................. 74
4.1.5 Non-contact suspension analyzer V ..................................................... 76
4.1.6 Granule strength measurement VII....................................................... 77
4.2 Pore- and porosity-related findings ................................................................ 79
4.2.1 Reaction of interfaces to electrical signals II/V ..................................... 79
4.2.2 Fiber-free length III ............................................................................... 80
4.2.3 Effect of pore parameters on compression strength IV ......................... 81

vii
4.2.4 Strength of rigid granules VII ................................................................ 82
5 CONCLUSIONS: IN SITU MEASUREMENT OF PORE-RELATED
CHARACTERISTICS .................................................................................................. 83
5.1 In situ measurements with a systematic approach ........................................ 86
5.1.1 Systematic approach to developing an in situ characterization method 86
5.1.2 Observations of the in situ methods in publications I-VII ....................... 88
5.1.3 Route from laboratory to process ......................................................... 89
5.1.4 Importance of the characteristics of in situ measurement ..................... 91
5.2 Theoretical implications about pore and porosity related findings .................. 92
5.2.1 Conclusions about the reaction of interfaces with electrical signals II/V 93
5.2.2 Conclusions about fiber structure studies III ......................................... 93
5.2.3 Conclusions about the effect of pore parameters on the compression
strength of oriented cellular structures IV ............................................. 94
5.2.4 Conclusions about the strength of rigid granules VII ............................. 94
5.3 Summary ....................................................................................................... 95
REFERENCES ........................................................................................................... 98

viii
List of Figures
Figure 1 Systematic approach used to develop in situ methods. ................................. 20
Figure 2 Pore types..................................................................................................... 27
Figure 3 Sintered alumina structures with different total porosities from top to bottom 33,
18, and 3 % total porosity. Scale bar length is 130 µm. ............................................... 30
Figure 4 Kaolinite powder. Granule surface and cross sections. ................................. 30
Figure 5 Structured zeolite. ......................................................................................... 32
Figure 6 Ceramic fiber structure. ................................................................................. 33
Figure 7 Stress concentration caused by different discontinuities. Lines indicate a
stress field while black areas are the discontinuities. Stress concentrates on the tip of
the discontinuity in the right-most picture. ................................................................... 35
Figure 8 Granule yield stages in [VII]. ......................................................................... 37
Figure 9 Fiber bonding in [III]. ..................................................................................... 40
Figure 10 Sketch of grit blaster. .................................................................................. 55
Figure 11 Sketch of sub-pressure tester. .................................................................... 56
Figure 12 Sketch of Thermal flow permeameter. ......................................................... 57
Figure 13 Sketch of compression tool. ........................................................................ 59
Figure 14 Sketch of impedance analyzer. ................................................................... 60
Figure 15 Sketch of resonator. .................................................................................... 62
Figure 16: Sample materials and in situ methods. ....................................................... 96

ix
List of Diagrams
Diagram 1: Thesis coverage. ........................................................................................ 2
Diagram 2: Process control/Lean and in situ measurement. ......................................... 3
Diagram 3: Aim and use of lean. ................................................................................... 5
Diagram 4: Synergy of lean, process control, and in situ measurement. ....................... 8
Diagram 5: Characteristics and benefits of in situ measurements and their comparison
with traditional offline measurements. ........................................................................... 9
Diagram 6: Organization of the enclosed publications and their links to the framework.
................................................................................................................................... 18
Diagram 7: Pores, porosity, and their measurement (concise version). ....................... 24
Diagram 8: Topics and details in section Pores and porosity ...................................... 25
Diagram 9: Pore effects on mechanical features. ........................................................ 34
Diagram 10: Pore effects on fluid permeability. ........................................................... 41
Diagram 11: Pore characterization. ............................................................................. 45
Diagram 12: Experimental procedures and Materials. ................................................. 52
Diagram 13: Comparative summary. ........................................................................... 66
Diagram 14: All diagrams. ........................................................................................... 84
List of Tables
Table 1 Primary research questions in the enclosed publications. .............................. 19
Table 2: In situ development aspects in the enclosed publications. ............................. 67
Table 3 Sections and research aspects. ..................................................................... 79
Table 4 Summary and example of the systematic approach. ...................................... 87
Table 5 Comparison of in-situ methods. Methods are evaluated from 1-3 (bullets, 3
being the highest grade) on four different attributes. Type & Route columns are
highlighted in red, yellow (italics), or green (bold) according to the readiness of the
device for in situ measurements in an industrial process............................................. 89

x
List of Publications
This thesis is based on the publications listed below, which are later referred to in the
following Roman numerals. The author’s role is given after each publication entry.
I. Järveläinen, M., Keskinen, L., & Levänen, E. (2013). Use of thermal imaging in
characterization of ceramic fiber structures. In 2nd International Conference on
Competitive Materials and Technological Processes. Miskolc: IOP Conf. Series:
Materials Science and Engineering 47. Retrieved from
http://iopscience.iop.org/1757-899X/47/1/012062
The author of this thesis was the corresponding author in writing this publication. He
planned the experiments and developed the thermal flow procedure. In addition, he
carried the research and experiments with the help of the second author and prepared
and analyzed the results.
II. Järveläinen, M., Salpavaara, T., Seppälä, S., Roinila, T., Yli-Hallila, T., Levänen,
E., & Vilkko, M. (2014). Characterization of Porous Ceramics by Using Fre-
quency-Response Method. In World Congress of the International Federation of
Automatic Control (pp. 10012–10017). Cape Town.
http://doi.org/10.3182/20140824-6-ZA-1003.02423
The author of this thesis was the corresponding author in writing this publication. He
wrote the sections on materials science together with the third author. He planned the
experiments and analyzed the results on materials science. With the second author, he
analyzed the link between material characteristics and the material's electrical re-
sponse. Contributions other than those claimed for this thesis are likely to appear in a
future doctoral thesis.
III. Järveläinen, M., Humalamäki, J., Laakso, J., & Levänen, E. (2015). Mechanical
Characterization of Fiber Ceramics: Effect of Temperature. Advanced Engineer-
ing Materials. http://doi.org/http://dx.doi.org/10.1002/adem.201400512
The author of this thesis was the corresponding author for writing this publication. He
planned the experiments and developed the grit blasting-procedure. He also participat-
ed in the experimental work, which was mainly carried out by the second author, with
whom he analyzed the results.

xi
IV. Ojuva, A., Järveläinen, M., Bauer, M., Keskinen, L., Valkonen, M., Akhtar, F., …
Bergström, L. (2015). The mechanical performance and CO2 uptake of ion-
exchanged zeolite A structured by freeze-casting. Journal of European Ceramic
Society, 35(9), 2607–2618. http://doi.org/10.1016/j.jeurceramsoc.2015.03.001
The publication is a result of collaboration between the author of this thesis and Dr.
Ojuva, who was responsible for writing this publication. The author of this thesis
planned the experiments on mechanical measurements and the related image anal-
yses in the publication. He also supervised the related experimental work, analyzed the
results, and participated in writing these sections in the publication. Contributions other
those claimed for this thesis were presented in Arto Ojuva’s doctoral thesis.
V. Salpavaara, T., Järveläinen, M., Seppälä, S., Yli-Hallila, T., Verho, J., Vilkko,
M., … Levänen, E. (2015). Passive resonance sensor based method for moni-
toring particle suspensions. Sensors & Actuators: B. Chemical., 219, 324–330.
http://doi.org/10.1016/j.snb.2015.04.121
The author of this thesis was responsible for the sections on materials science and
wrote them together with the third author. In addition, he designed, planned, and car-
ried out the related suspension measurements together with the main author and
helped analyze the results. Contributions other than those claimed for this thesis are
likely to appear in a future doctoral thesis.
VI. Järveläinen, M., Keskinen, L., Heinonen, S., Kaleva, A., & Levänen, E. (2015).
Thermal Flow Permeametry - A Rapid Method for Finding Local Changes in
Flow Channels. Composites Part A: Applied Science and Manufacturing, 79,
138–145. http://doi.org/10.1016/j.compositesa.2015.09.013
The author of this thesis was the corresponding author for writing this publication. He
also planned the experiments and designed the method for thermal flow permeametry.
He helped the second author carry out the measurement and analyzed the data.
VII. Järveläinen, M., Kaleva, A., Kaitajärvi, A., Laakso, J., Kanerva, U., & Levänen,
E. (2016). Compression curve analysis and compressive strength measurement
of brittle granule beds in lieu of individual granule measurements. Particuology.
http://doi.org/10.1016/j.partic.2015.10.006

xii
The author of this thesis was the corresponding author for writing this publication, ex-
cept for the experimental part, to which the second and the fifth author also contributed.
With the fifth author, the author planned the experimental work and analyzed and for-
mulated all experimental results. Contributions other than those claimed for this thesis
are likely to appear in a future doctoral thesis.

xiii
Structure of this thesis and definitions of the de-veloped methods
The work is arranged into five chapters (X) with sections (X.X) and subsections (X.X.X).
Each chapter introduces the aims and relevance of its sections, and, similarly, each
section the aims and relevance of its subsections.
Many chapters in this thesis are collated in a detailed diagram for the reader to quickly
visualize the junctions of its topics. In the end, the thesis is summarized in a collective
diagram of all its components.
The thesis introduces six in situ methods, which the author developed in cooperation
with other researchers at TUT:
1. Thermal flow permemetry (TFP): this method allows hot air to flow through a
flow porous structure, whose surface heating is measured with a thermal cam-
era to detect local differences in permeability.
2. PRBS porosity analyzer is an electrical impedance analyzer, in which an elec-
trical signal in the form of a pseudo-random binary sequence (PRBS) is injected
into a porous structure to analyze its porosity.’
3. Grit blaster for fiber structure thermal history: in this method glass grit collides
with a porous fiber net to measure its rigidization. Rigidization is linked with
maximum temperature, to which the structure has been subjected.
4. Non-contact suspension analyzers: in this method, a high frequency AC-
electrical field is sent to a suspension. Particles in the suspension change the
resonation frequency of the electrical field, yielding different suspension charac-
teristics linked with the electrical charging of the surfaces.
5. Automatic pore parameter analyzer: In this method a 2d-image of pores is au-
tomatically segmented and feature extracted to find relevant pore parameters.
6. Granule strength measurement: in this method, a granule bed is uniaxially
compressed, and individual granule strength is calculated by analyzing the
compression curve.

1
1 Lean, in situ -measurements and this thesis
This introduction is an overview of the topics of this thesis. Section 1.1, Shift to lean
process control, aims to give a broad perspective on the increasing need for in situ
measurements and to help understand the requirements of current methods.
The section on In situ process measurements focuses on the concrete matter of this
thesis and defines and describes the benefits and obstacles, many of them also seen
in my publications, of in situ measurement. The section continues to present the devel-
opment of sensors that form the core of each measurement and concludes with a lit-
erature review of current in situ measurements and the fields they are used in and
opens up a relatively unstudied field of in situ measurements related to porosity.
The introduction continues with section 1.3, Area of the thesis, which gives the purview
of this thesis, its focus, research approach, and specific challenges. Finally, section 1.4,
Work environment, allows the reader to assess the possible outside incentives to this
work.
The following diagram shows the areas covered in this thesis.

2
Diagram 1: Thesis coverage.
1.1 Shift to lean process control
This subsection gives an overview of how modern production processes are controlled,
how they have been influenced by lean thinking, and how lean thinking is related to in
situ measurement, one of the topics of this thesis (Diagram 2).

3
The subsection explains what is meant by process control and lean and how they have
evolved and where they are used. Then it discusses the benefits of lean and, finally,
links lean with in situ measurement.
The objective here is to help better understand and explain the root cause and principal
ideas that affect in situ measurement.
Diagram 2: Process control/Lean and in situ measurement.
1.1.1 An overview of process control
To understand why in situ measurements must have certain characteristics, it is first
worth taking a look at modern process control, what it is and how it has changed over
the past few years.
In its modern meaning, process control signifies adjusting the value creation process of
a product from raw materials to a finished and valuable product. Control here aims to
optimize the process to spare resources while lowering emissions and enhancing
product quality, process safety, reliability, and plant availability. Increasing the level of
automation aims at a holistic approach to the quality, cost, and time issues of process-
es. [1] Many of these factors are mentioned in the context of the benefits of lean pro-
duction; thus integrating automation to production and business operations [1] is in
good agreement with lean.
When automation is integrated with business, in addition to controlling the processes,
automation aims to optimize, schedule, and plan the processes. This is possible only if
appropriate parameters are measured, operational situations are analyzed, and the
most profitable opportunities are exploited while plant personnel are being informed

4
and their knowledge put to good use. [2] In the core of these multiple operations lies
information on the processes, collected using in situ measurement tools.
1.1.1.1 Development of automation
In industrialized countries, the volume of automation has been increasing in the pro-
cess industry. Chemical, power generation, and petrochemical industries have the
highest volume demand for process automation, but in the pharmaceutical industry it is
increasing the most rapidly [1]. This is evident in the literature review in subsection
1.2.3.
Automation is currently being integrated with the whole supply chain [1] comprising
users, vendors, consultants, and third parties [2]. Artificial intelligence is moving to field
level automation; i.e., actuators and sensors, must now support maintenance and mon-
itoring tasks. In the future, sensors will measure the health of the process, not by man-
aging abnormal situation but by preventing them. [1] These are the straightforward mo-
tivations for developing new in situ tools to support lean principles.
1.1.2 Definition, aim and use of lean
As hinted in the previous subsection, process control often links well with the ideology
of lean that is based on Toyota production system, developed after Ford commenced
mass production. Thus many companies have adapted the lean methodology using the
Toyota Production System as a role model [3]. According to NIST [4], lean is an "im-
provement model that strives to eliminate non-value-added activities" by continuous
improvement, production of materials only on order, and an error-free process. Conse-
quently, lean manufacturing does not rely on long production runs but on a smooth
production flow [5] that reduces inventories, lead-times, and altogether yields improved
productivity and quality [6], which have proved universally applicable. Lean has been
found to provide the means to economically produce large variety in small volumes [7]
and therefore, it has been adopted by a wide range of industries, and it is currently the
"best practice" [8] in developed manufacturing industries [9]. The lean ideology is
shown in Diagram 3.

5
Diagram 3: Aim and use of lean.
In addition, lean has recently been linked with the paradigm of green production, which
seeks to limit the environmental risks [6] caused by manufacturing. This aligns well with
the lean goal of zero waste, efficient use of resources, and prevention of recurrent
problems. [9]
1.1.2.1 Current use of Lean
In [10] the lean is viewed to have been developed from a set of shop-floor techniques
to a holistic corporation culture. According to [6], lean is most actively researched and
developed in the manufacturing sector, but as seen in history and suggested in some
publications in [6], the paradigm will subsequently be adopted in other sectors as well.
Quite recently, companies that use lean have started to expand the ideology to their
supply chains [5]–[7], [10]. Lean is especially effective near the beginning of supply
chain where the fluctuation of demand and over production have less crucial conse-
quences. Closer to the final customer, systems such as agile can yield benefits by in-
creasing the responsiveness to market demand [11].
Independent of the methods, quality and efficiency are necessary in production facili-
ties; thus the technical performance of production equipment must be maximized, pro-
duction disturbances removed, and rapid development of automation and sensors giv-
en better possibilities for advanced maintenance [12]. With that in mind, this thesis in-
troduces in situ methods to assure material stability in raw materials [VII] and during
production [I;V;VI], in the quality of the finished product [I-II;IV;VI], and in the inspection
of current conditions [III]. The thesis in general focuses on the process of creating
modern in situ methods that aim to analyze the production process in support of lean
ideology. These methods are mostly used in the upstream of the supply chain where
the benefits of lean are also most prominent.

6
1.1.3 Lean benefits of in situ measurement
A publication by Forrester et al. [8] points out factors that make companies lean.
Among others, they include elimination of non-value-added activities, pursuance of
zero defects, and pull-order of materials in production. All this calls for redesigning of
factories [5], including the way processes are analyzed and corrected.1
Focusing on the factors that need redesigning, Sundar et al. [13] list non-value-adding
activities as transportation, inventory, motion, waiting, overproduction, over processing,
and defects. In situ measurements seek to eliminate the last two items that cause
symptoms such as [5]
"The reaction stage is typically complete within minutes, yet we continue to process for hours or days",
We have in-process controls that never show a failure, and
(overprocessing is caused by) delay of documents to accompany finished product.
Melton describes a typical example of laboratory analysis, which is necessary for a
particular product but which turns out to be a bottle neck that does not support lean
thinking. The process should be continually monitored for abnormalities and variation,
and the whole production inspected in real-time [13] with the idea that no defects are
passed downstream in the production chain [9]. I claim that these are symptoms of an
incapability to analyze the process in situ.
The above symptoms derive from time-dependent process variations caused by [14]
Changes in process input raw materials,
Process fouling,
Abrasion of mechanic components,
Changes in catalyst activity,
Production of different quality grades,
Changes in the external environment,
1 The new methods of analysis presented in this thesis concern this change.

7
which cause unnecessary usage of material and energy, both identified by Kurdve et al.
[3] as blind spots in today’s application of lean. I claim that many of these blind spots
could be exposed in in situ measurement.
In a more holistic view, [10] acknowledges that in addition to reducing process costs,
lean can increase the perceived customer value that is also addressed as in situ
measuring increases the product quality and decreases the production time.
1.1.3.1 Lean and in situ measurement
The following is a synopsis to help crystallize the strong bond between production pro-
cesses, lean thinking, and in situ measurement. Plainly, process control is increasingly
driven by lean principles and needs automation. Automation in turn needs in situ
measurements. This is shown in Diagram 4 and collated in the following list.
Quality is a function of how well the process is understood. o To be able to understand, one must be able to quantify.
Quantification is also needed in automation, o computers cannot make qualitative decisions.
In lean manufacturing, products must be produced smoothly and only on order. o This means that the supply chain must be agile: in situ methods give direct
feedback to, e.g., suppliers of raw materials. For zero defects, one must understand where they come from.
o root cause analysis in situ on the product line is needed. in situ measurements support lean ideology:
o No post-manufacture, o No quality checks of finished product.
Lot sampling is not effective: o Natural materials vary and must be measured constantly.

8
Diagram 4: Synergy of lean, process control, and in situ measurement.
1.2 In situ process measurements
The previous section discussed the importance of in situ measurement for a great
many companies producing on lean principles. This section deals with in situ –
measurement, its meaning, benefits, and barriers, which are important to recognize for
the design of new methods. The section continues to review the recent development of
sensors, which are in the core of these measurements, and ends with a structured lit-
erature review of in situ measurements of materials.
This section seeks to further the understanding of the modern use and benefits of in
situ measurements (as shown in Diagram 5) and to introduce recent work focused par-
ticularly on pharmaceutics.

9
Diagram 5: Characteristics and benefits of in situ measurements and their comparison with traditional offline measurements.
1.2.1 Definition and use of in situ measurements
As explained above, process control is realized through quantitative feedback, which in
[15] is divided into continuous measurement at a high sampling frequency, delayed
measurements from analytical devices at a fixed sampling rate, and manual laboratory
measurements available at unequal intervals. The first two fall into the domain of in situ
measurement, which is defined by Chanda et al. [16] as something that reveals physi-

10
cal or chemical aspects of materials inline, online, or at the production site,2 as op-
posed to laboratory measurement, which is conducted away from the production site.
Compared to laboratory measurements, in situ measurements characteristically
measure a relatively large proportion of produced materials, which means that
o they must be rapid, measure only a short spectrum, and be highly sensitive to only the variables relevant to effective
quality, and thus o give a more comprehensive picture of production than lot-sampling.
are (partly) integrable with the production process and often o customized, o use probes and o need calibration.
must be o robust, because of rough industrial atmospheres, o reliable, because processes are expensive to interrupt at false alarms,
and o simple so that shop floor staff can be easily trained to use them.
1.2.1.1 Benefits of in situ measurement
The reason for in situ -measuring is that "[Monitoring product quality] online is the key
issue in producing higher quality products, optimizing the production chain, and thereby
improving efficiency." [1] In continuous processes, latency, e.g., end-to-end delay as-
sociated with communication, computation, and actuation, affects the quality and per-
formance of the process [2], and conventional off-line, lot-sampling, laboratory meas-
urements lead to inconsistencies, especially in batch-operations [16]. Online measure-
ment is also advantageous because it does not require difficult sample preparation and
thus eliminates sample representability and markedly increases the sampling rate. [17]
In situ measurement improves or enables [16] study of kinetic reactions, measuring of
hazardous materials and measuring systems that should not be perturbed. These (1)
improve process understanding and help create new processes, (2) scale up smaller
ones, and (3) optimize already established ones. In addition, (4) processes can be
monitored with in situ measurements, which help detect faults, ensure product quality
and throughput, and, finally, enable (5) process control [18].
2 Direct measurements of temperature, pressure, and flow, as they are routine measure-
ments, are excluded from in situ measurements.

11
1.2.1.2 Barriers of in situ measurement
Apart from regulatory elements and attitudes, the biggest obstacle to in situ measure-
ments is the difficulty to integrate them in production processes because both the
hardware integration of sensors and later methods integration to a production system
are hurdles to overcome. Sensors in industry come with problems such as their robust-
ness in hazardous processing environments and implementation of sampling probes in
a process stream. Such problems are currently encountered with dip-tubes [19] and
bottom [20] or side valves of vessels [21]. Wireless technologies will undoubtedly play
a role in this regard. The latter challenges are briefly addressed in the conclusions, but
they are no major problems for in situ measurement developers,3 especially in light of a
third concern, which is the investment cost associated with integrating measurements,
and whether it pays off in lean manufacturing.
The above delimits in brief the domain of in situ measurement and the new methods
presented in this thesis, and focuses on the direct and concrete benefits and barriers of
in situ measurements to give a perspective on how such measurements should be de-
signed. The following provides added insight by introducing the Process Analytical
Technique (PAT) as an apposite frame for in situ measurement.4
1.2.1.3 Process Analytical Technique
In situ process control has been affected by the guidance given in PAT terms and first
introduced in pharmaceutical development by the United States Food and Drug Admin-
istration (FDA). This guidance was formulated to address problems with process insta-
bility and quality, which had become increasingly complex because of multi-factorial
production systems [17]. PAT defines systems that focus on online measurements of
raw materials, intermediates or products and aims to measure the key process pa-
rameters affecting the efficiency of the process or final product quality [17].
PAT uses integrated tools of quality analysis through [22] (1) data analysis with pro-
cess analytical tools, (2) process monitoring and continuous feedback with the aim to
change time-fixed processing to product-state-fixed processing. [22] This again comes
back to the idea of lean production.
3 In industry, engineers must carry out some of this work, for they are already beginning
to understand the possibilities of modern in situ measurement. 4 PAT seems perfectly to match the approach in this thesis in terms of theoretical conjunc-tions, research approach, and contents.

12
According to [17], most PAT applications are still in R&D.5 The PAT trend is increasing
[18] in the pharmaceutical industry, but a similar shift is likely to be seen elsewhere.
The companies mentioned in Preface seem to be in the vanguard of this paradigm shift
towards in situ measurement in their own industries.
1.2.2 Sensors
The above topics addressed in situ measurement as a whole. The following two sub-
sections focus on the core of in situ measurement, the sensors, and conduct the reader
into the core of this thesis.
In general, sensors are becoming increasingly miniaturized and wireless, followed by
lower installation costs and massive amounts of data to process. As a result, many
complex processes are turned from model- to data-driven mode. [23] Consequently,
even more sensing will happen in the future [2]. This again will generate a new wave of
sensors with low-cost microcontrollers providing the necessary functions to create
smart sensors capable of connecting wirelessly to a network and enabling further sen-
sor applications [24], such as those used already to benefit mobility, redundancy, and
compactness6. [24] Recently, wireless networks have been emerging in industrial pro-
duction systems [24], and I claim that this sensor development has opened a door to
devices, such as those presented in this thesis, suitable for in situ measurements.
In production, sensing is divided into soft and hard sensing, both aimed at real-time
quality and process control [25]. Soft sensing means combining sensory feedback, of-
ten measured with conventional sensors, by mathematical means and aiming at com-
prehensive feedback on dynamic industrial processes. Soft sensing, much like hard
sensing, is used to support fault detection, diagnosis, and product control and monitor-
ing [26]. However, I claim that combining conventional process measurements in a new
way is not enough to characterize materials, especially when processes are new and
incompletely understood. This is the reason for developing process-integrated hard
sensors that focus on characterizing a direct phenomenon in contrast to relying on de-
rived parameters from existing sensors. Hard sensors precede soft sensors (not stud-
ied in this thesis), especially in developing new processes, as discussed in publications
[I; III-IV; VI-VII].
5 Such as the techniques presented in this thesis. 6 Typical examples are the consumer goods industry, environmental monitoring, smart
structures entailing home and building automation, and medical and health care. [26]
13
The following review helps the reader contextualize the study of hard sensors and un-
derstand the materials and structural parameters the sensors can characterize.
1.2.3 Literature survey of in situ analysis
The following is an organized literature review using Sciencedirect, Scopus, and
Google Scholar. The review focuses on recent findings on the use of in situ methods
for materials. Many findings are also listed in [17], which is a multi-authored review of
recent PAT technologies. Articles are categorized first according to industries or do-
mains the authors targeted (when possible) and then divided into the parameters they
studied and classified by the principle method their application is based on. In situ
methods about the process manufacturing industry7 are omitted on the basis that they
measured material in a flow state with well-established methods.
The list below classifies the fields mentioned in the articles in the literature survey.
In general, industries that use or produce particulate matter [17], [21], [27]–[29]
chemical industries [17], [30]–[36] bio-process monitoring [17] sterile product production [17] film coating [17] pharmaceutical production [17], [21], [30], [32], [33], [35]–[50] food and nutrition industry[30], [35], [36], [51] agro-chemistry [30] oil and petroleum industry [28], [52]
The list below classifies the methods on the basis of the parameters the authors stud-
ied as classified on their basic measuring principle:
Ultrasonic sensors [27], [30] o to study crystallization: liquid concentration, crystal size (in the range
of 100 - 800 um), and suspension density (5-40 wt %). o ultrasonic resonators are used in drug quantification [37], dispersion
stability studies [37], and in particle size studies [53]
Dielectric constant sensor to detect o phase separations [52] and o solubility [31]
Conduction sensors for o concentration control [32]
Imaging methods such as
7 Term “process manufacturing” is used as an opposite of piece goods production. A typi-cal process manufacturing industry is, for example, the oil industry, where the prod-uct is flowing material, such as continuous suspension or liquid.

14
o endoscopes to monitor crystallization [33] and particle parameters [39], [54]
o diffusing wave spectroscopy: laser technique to measure scattered light intensity
to monitor rheological parameters of emulsions [40], and particle dynamics [51]
Photometric stereo imaging o to study granulation (granule growth) [21] and o drying characteristics [41]
Photofluorecense [55] o to monitor particle parameters
Computed tomography o to analyze solidifying microstructure [56]–[59] o to analyze the deformation behavior of materials [57], [59], [60]
NMRI o to study suspensions [61, pp. 103–106] o to study properties of liquids [62]
Photoacoustic methods o for gas analysis [28]
Magnetic methods using Hall-effect o to analyze the properties of magnetic particles [63], [64]
Capacitive sensing o to detect voids and defects in concrete [65], [66]
Spectroscopic sensors based on o IR-spectroscopy for reaction analysis [22] in adsorption study [34],
supersaturation [35], and concentration [67], o terahertz (far-infrared) spectroscopy to study intermolecular struc-
tures, trace gases, and human imaging [68] o Raman spectroscopy to study super saturation [68], exothermic reac-
tions [42], and particle size [69] o ultraviolet–visible light spectroscopy to monitor reaction completion
[16] o mass spectrometry to analyze gas [16], and o nuclear magnetic resonance spectroscopy to analyze chemical reac-
tion [51] o electrical impedance spectroscopy [70] to study defects in concrete.
The above methods are mostly under in R&D, though some have already been inte-
grated. For example, in [36], multiple in situ methods were used in unison to control
automation. The methods monitor crystal size, shape, and quality, and the parameters
are linked with the production system that controls the process. This is a mature condi-
tion for these in situ methods yet a long way ahead of typical cases, such as those pre-
sented in the enclosed articles.
1.2.3.1 In situ methods for analyzing pores and porosity
The in situ methods in the enclosed articles were developed to analyze pores or their
direct effects on material. Recent and prior contributions to that topic appear in Bawuah
et al., who studied a terahertz transmission pulse and light reflection to quantify the

15
bulk microstructure of pharmaceutical tablets and measured their weight [44] and po-
rosity [44] in-line. Also Lecreps et al. used combination of pressure and flow measure-
ments with extensive modeling to demonstrate porosity gradients of particles during
their flow in a pipe [29]. Other properties indirectly related to porosity and analyzed in
situ are
pharmaceutical tablet surface smoothness by Raman spectroscopy [45] or Near-IR absorbency [49] and its correlation to tablet crushing strength [45] or hardness [49],
pore network analysis with nMRI [71], computed tomography [72], and me-chanical and thermal behavior of materials in situ [72]
use of acoustic vibration methods to find structural surface defects [46], Young's modulus, and Poisson's ratio [47], and
use of ultrasonic to measure Young's modulus [48], and use of acoustic emission to identify phenomena (granular rearrangement and
fragmentation) that take place during powder compaction [50].
1.2.3.2 Observations from the literature review
In conclusion of the above, relatively many methods have been employed for in situ
analysis of material composition, chemical structure, particle size, or chemical reac-
tions but rather few to characterize pores on site, let alone analyze them online, espe-
cially outside the pharmaceutical industry. The literature survey is very centered on the
latter industry, because in situ measurements of process manufacturing were omitted
from the review.
With respect to the latter finding I have identified a lack of in situ measurements par-
ticularly in piece goods production industries other than pharmaceutics.
1.3 Research area and method of the thesis
The above sections outlined the need for and current state of in situ measurements,
and now it is time to concentrate on the specific focus and research method used in
this thesis. The next subsections 1.3.1. (In situ measurements in the ceramics industry)
and 1.3.2 (Contribution of this thesis) state the special focus of the thesis and the rea-
son for it. Subsection 1.3.3. (Specific challenges and research questions in the thesis)
gives a detailed description of the problem while subsection 1.3.4. (Research approach)
elaborates on the approach applied and inspired by systems theory to systematically
approach the industrialization of laboratory measurements, i.e., to make laboratory
measurements in situ. The section is concluded by subtopic 1.3.5 (Innovation man-

16
agement) which introduces the strategic level in developing in situ devices as well as
using the devices later to improve industrial processes.
This section aims to enhance the reader’s understanding of the compass of this work,
the sectors of in situ measurements addressed, and the manner of the measurements.
1.3.1 In situ measurements in the ceramics industry
The above section identified a lack in in situ method applications in piece goods pro-
duction in industries other than pharmaceutics. Ceramics is a particularly interesting
industry in that, to my knowledge, it has not to any large extent adopted in situ method-
ologies; rather, the industry is accustomed to performing functional analyses of finished
goods on the lot principle. Although some leading enterprises in the industry may use
rudimentary in situ methods, such as viscosity meters in the process stage, they pro-
duce rather conventional and indirect functional parameters, which are far from the real
and dominant material parameters. Solid-state in situ analyses are very rare, a situa-
tion that makes the industry an interesting and relatively open play ground for testing
them.
According to a report written by the European Ceramic Industry Association [73], the
European ceramic industry is a global industry leader with some 200 000 workers and
a strategic and future-oriented sector in Europe, aiming in the future to embrace re-
source-efficient and low-emission practices. These goals are achieved by moving away
from the traditional energy sources with process optimization as one key technology.
The report stresses that this is strongly impacted by academic studies geared to break-
through technologies.
The above, combined with my personal experience, render ceramic industry a "new
pharmaceutics"—a second industry ready for a wave of in situ process equipment. The
industry welcomes cooperation with universities and is looking for breakthrough tech-
nologies and new energy sources, both of which call for close understanding of pro-
cesses in the commissioning stage. Above all, process control has been mentioned as
a key technology to be developed.
1.3.2 Contribution of this thesis
The publications enclosed in this thesis focus on making laboratory measurements
accessible to scaled-up production volumes, paying attention to finding methods that
can be integrated in an industrial process or at least methods that are simple or robust
enough to be used on production sites. The links of the enclosed articles with the

17
above objective are shown in Diagram 6. One aim of the methods is that they must be
comprehensive wide-enough view of the production process.
To keep the developed techniques within a phenomenologically and scientifically com-
prehensible frame, I have focused in cases characterizing pores or their effect on the
properties of products. This choice was made based on the fact that pores and porosity
encompass—like it or not—all ceramic materials and are the single most important
reasons for the functional and mechanical properties of ceramics.
The thesis thus contributes in two ways to
1. guinea pigging the possibilities and providing examples of the ways to tailor in-
dustrial in situ methods to answer
a. what characteristics are important in in situ methods,
b. what kind of approach can work in developing the methods, and
2. giving some new knowledge to understand the mechanical and functional ef-
fects of pores in ceramic materials
a. on how pore parameters affect mechanical features,
b. on how electrical signals change in porous ceramics, and
c. on the permeability of fibrous structures.
In summary, all the topics in this thesis aim to create an in situ characterization meas-
urement that measures an aspect related to porosity, pores, or their affects. Individual
challenges are discussed in 1.3.3. (Specific challenges and research questions in the
thesis).

18
Diagram 6: Organization of the enclosed publications and their links to the framework.
1.3.3 Specific challenges and research questions in the thesis
Many industries use various material characterization methods, but they are typically
laboratory measurements, which means that samples are very small in size and results
are not in real time. In addition, laboratory measurement measure too many character-
istics of samples, for example: the process engineer might need to know only the big-
gest pore but mercury porosimetry gives redundant parameters, which are useful for
scientific research, but which complicate the measurement process and lack robust-
ness. In addition, these lot measurements measure only a small volume of the total
process and make it doubtful if the results can be extrapolated. To overcome these
challenges, the enclosed publications target the following processes:
1. preparation of porous structures, focusing on
a. powder mechanics [VII]
b. suspension characteristics [V]
2. analysis of mechanical features of porous structures, focusing on
a. mechanical changes during sintering of fibrous structures [III]
b. correlation of mechanical properties with pore parameters in oriented
structures [IV]
3. non-destructive characterization of porous structures, focusing on

19
a. measuring changes in porosity [II]
b. finding changes in local permeability [I, VI]
Continuing with the topical classification, Table 1 breaks the enclosed articles down
into primary questions about scientific attributes and application (in situ) novelty.
Table 1 Primary research questions in the enclosed publications.
Classification Research aspect Development aspect
1a
Can granule strength be
measured from a granule bed
instead of measuring a single
granule?
Single granule strength measurement
is not feasible/possible. In industrial
production, a robust, comprehensive,
and rapid method is needed.
1b
Can the flocculation of a sus-
pension be measured during
its preparation?
Flocculation, especially in thick sus-
pensions, must be measured with la-
boratory devices; long response time
is not possible in lean production.
2a
How can the rigidization of a
fiber structure be linked with
the structure's thermal history
Thermal history can be measured from
a millimeter size sample with a dila-
tometer, but hardly at all in local rigidi-
zation in a large sample. A new in situ
method is needed.
2b
What is the link between a
structure's pore parameters
and its crushing strength?
Pore structure can be characterized
from a microscope image, but for
quantified data with samples with
many pores, analysis must be auto-
mated.
3a
Is it possible to nondestruc-
tively measure the porosity of
a ceramic sample?
Porosity measurement with the Archi-
medean method or intrusion porosime-
ter method is laborious and slow and
does not reveal closed porosity. A
faster and integrated method is need-
ed.
3b
Can local permeabilities of a
fibrous ceramic structure be
analyzed from a hot air per-
meability measurement using
an IR-camera?
Permeametry can be used to analyze
local variation in a sample, but it is
very slow and difficult to integrate.

20
Collating all the topical questions, this introduction to the thesis focuses on the follow-
ing three main research questions:
1. In situ measurement of processes through materials:
a. Can material characterization be systematically tailored for in situ meas-
urement?
b. How does the robustness, integrability, reliability, and comprehensive-
ness of in situ measurement devices affect the route from design table
to use in processes?
2. Can porosity, pores, and changes in them that affect the functionality and me-
chanical properties of structured materials be analyzed in situ?
1.3.4 Research approach
In the above, some similarities were identified between in situ methods, which can be
refined to a systematic research methodology. The main task is to find a parameter that
dominates the value creating features in production process.
I used a systematic approach (in Fig. 1) to develop the in situ methods in this thesis.
The process involved simple steps, starting from understanding the variables of a pro-
duction process and finding their effect on the material parameters of the products.
Then the key material parameters were pinpointed and a way was determined to com-
prehensively and robustly measure them, and only them. The new method was then
tested in a laboratory and finally integrated into a production system.
Figure 1 Systematic approach used to develop in situ methods.
The approach is a variant of the process described in [17], aimed to develop a PAT tool
for pharmaceutical production. The process used in this thesis emphasizes an aspect

21
of materials science in favor of process engineering and while the focus is in the formal
development method of in situ devices, there is evidently a need for certain innovative
tasks in the development process. These are touched in the following subtopic.
1.3.4.1 Innovation management
To elevate the development of in situ –devices and industrial processes to a broader
context this subsection mentions some existing theories related to innovation and their
management.
According to Bessant and Phillips in [74] managing an innovation is possible with cer-
tain approaches that support the process. Innovations could be approached systemati-
cally, like the in situ device development in Fig. 1. Thus innovating could be a learned
capability for a company given that the ability is flexible, especially in the case of dis-
ruptive innovations where the firm must focus in changing their value network, engi-
neering new processes, finding new supply chains, etc. Teece [75] conceptualized this
potency by introducing an idea of dynamic capabilities that refers to enterprise’s ability
to adapt when facing e.g. new technological opportunities or customer requirements.
Dynamically capable companies can develop processes that enable them to change
and develop together with the changes in their business environment [76]. The capabil-
ity is driven in by implementing an innovative culture that counters the difficulty of codi-
fying the innovation process. For example O’Connor in [76] presents such non-routine
elements and state that caressing them, rather than pursuing a systemic codification
for the process, could better keep the enterprises dynamically capable. This is espe-
cially important in technology driven businesses where innovation is a necessity.
To further incorporate the innovative culture, Bergman and Hagan [77] propose a tech-
nology-driven business strategy, where instead of viewing technologies merely as ena-
bler, they are considered a core input that is taken into an account in strategy formula-
tion in a same level as the customers, markets and competitors. This emphasizes the
exploration of new disruptive technologies even in uncharted business areas. Other
practical methods focus on combining internal and external factors with the aims to
build a rich innovation network that pursues a coordinated knowledge flow combining
[74]: science, technology, market needs, manufacturing capabilities, competitor behav-
ior and regulatory issues. However, this may lead to adapting and improving ideas that
have been developed elsewhere, possibly raising a risk of losing valuable technological
assets. This risk can be controlled with governance structures, controlling the alliance
scope and careful partner selection [78].

22
While not the focus of this thesis the innovation processes explained in this subsection
have been carried out both during the development of in situ –methods and by the
companies who have worked with us. This subtopic might thus help the reader to un-
derstand the angle from which the development processes have been addressed.
However, this will not be discussed further in the thesis. The next subtopic finalizes this
chapter by describing the working environment where the in situ –methods were devel-
oped.
1.3.5 TUT and the ceramics laboratory
This subsection describes the department and laboratory, in which I worked on this
thesis. Articles [I-III; V-VI] were parts of long, industrial projects, whereas [IV; VII] were
smaller projects. The aim is to introduce the work environment for some background
and perspective for the experiments and research conducted there.
All the contributions to the enclosed articles and this thesis were written during my em-
ployment at Tampere University of Technology (TUT). The TUT strategy for 2013–2016
calls for "Technology for the benefit of people and the environment", and its mission is
to be "at the leading edge of technology development and a sought-after collaboration
partner among the scientific and business communities. The University produces com-
petent graduates who enter careers in the different sectors of society". The TUT values
are "Courage, responsibility, and community spirit". Since 2010, TUT has been a foun-
dation-based university with a total funding in 2013 of 157.7 M€, about 50% of it from
external sources. In 2013, TUT had over 10 000 students and almost 2000 employees.
This work was carried out in the Department of Materials Science (DMS), which re-
ceives most of its funding from industry or external sources, and which covers all mate-
rial groups: metals, ceramics, polymers, and composites. Its 2015 turnover was 9.2 M€,
of which 68 % was external funding. The department has about 100 academic employ-
ees, 36 of them post-doctoral students.

23
2 Theoretical background on pores, porosity and their measurement
This thesis is weighed towards applicative approaches for tailoring in situ -
measurements to be used for the reason, and in the areas, described in the earlier
chapter. Each of the presented method has a scientific background in pore and porosi-
ty -related matters and owing to that, this chapter encloses a theoretical overview of
pores, porosity, their measuring and their effects from the materials science point of
view.
The chapter does not aim to be an exhaustive review explaining all the latest theories
but to work as a supportive base against which the results of in situ measurements can
be examined. As such the following theories are a truncated summary of the most
abundant ideas relating to the topics enclosed in the articles, also discussing shortly on
the present research around it.
The chapter is divided in to four separate sections that address the theoretical back-
ground of enclosed articles [I-VII]. The chapter are related to the enclosed articles ac-
cordingly:
1. Pores and porosity, is a general chapter laying definitions but in sub-chapter
2.1.3 porosity links with
a. sintered materials [II]
i. Manufacturing methods: powder [VII], slip casting [II] and colloi-
dal processing [V]
b. porous crystals [IV], and
c. fiber materials [I, III, VI]

24
2. Effect of pores and porosity to mechanical properties, opens with a general
explanation of how porosity affects material strength but then focuses in pore
characteristics at:
a. oriented materials [IV]
b. granular materials [VII]
c. fibrous materials [III]
3. Fluid flow in porous media, focusing mainly in determination of permeability in
the context of
a. fibrous materials [I, VII] and their measuring with thermal flow perme-
ametry,
b. oriented materials [IV]
4. Characterization of pores, is limited to the methods used in the enclosed arti-
cles
a. Porosity
i. Archimedean method [II]
ii. Porosimeter [I, III]
iii. Porometer [I, III]
b. Permeability
i. Permeameter [III]
c. Pore shape
i. Image analysis [II, IV, VII].
The chapters are somewhat separate from each other because the ground for this work
is not in theoretical inspection of pores and porosity but in in situ -measuring only fo-
cusing on themes that are included in the following theoretical frameworks. Still, all
effort is made to categorize and progress the chapter in a non-disruptive flow. The top-
ics are presented in Diagram 7.
Diagram 7: Pores, porosity, and their measurement (concise version).

25
2.1 Pores and porosity
Apart from the nature materials porous structures are fabricated by man. The scope of
this thesis covers the latter focusing on technical ceramics in the form of sintered com-
ponents made by slip casting [II] or powder compaction [VII], fibrous [I, III, VI] and hier-
archical structures [V].
The following sub-chapters define and introduce pores in general and then, acknowl-
edging that the nature of pores in all of the previously mentioned ceramic structures is
different, the chapter continues by focusing on the special characteristics in separate
sub-chapters. In the sub-chapter on sintered ceramics their processing is also ad-
dressed to clarify the background for articles [II, V, VII].
In different fields, the terminology surrounding pores varies without a clear consensus.
This thesis pursues to follow the common terminology used in materials science and
adapts some terms from soil engineering if necessary.
Objective of this chapter is to define the main scientific topics in the thesis, namely
pores, and build a shared background for the results presented later. The topics are
visualized in Diagram 8.
Diagram 8: Topics and details in section Pores and porosity
2.1.1 Pores
According to [79], pore is a relatively small solid-free space or void imbedded in a solid
or semisolid matrix. When pores are fabricated into material its properties change:

26
density decreases while specific surface area increases. [80] These changes introduce
functional properties: such as selective fluid permeability [I, III, VI], thermal and acous-
tic insulation, or sorption [IV]; but at the same time change the mechanical properties
[III, IV, VII].
In a microscopic sense, pores can be classified by their network topologies, connectivi-
ty, and pore topology. [79] A text-book example of pore contains a cavity which is the
relatively wide part in comparison to the narrow portion that is the pore opening sepa-
rating the bodies and controlling the fluid flow [81]. In reality pore shapes are numerous
and in actual cases many shapes are present at different sizes as in [IV]. In order to
differentiate pores by size ranges they are categorized by width in IUPAC [82] accord-
ingly:
Macropore: larger than 50 nm8 Mesopore: between 50 nm and 2 nm Micropore: below 2 nm
Pore width is the radius of the pore's body or its neck [81] depending on the way the
pores are analyzed. The pore sizes are often given as a size distribution diagram that
according to IUPAC [83] is "a distribution of pore volume (or area) with respect to pore
size".
For further characterization, a structure may consist of open porosity9, accessible to
outside and closed, inaccessible porosity [83] that may contain fluids [80, p. 1]. In [83]
the open porosity is distinguished by its interconnectivity, i.e. separating the special
pores that have at least two openings on other sides of the structure. These are called
penetrating pores and they make the porous structure permeable by letting fluids to
pass through it and thus, especially when used for filtration, they are known as flow
pores. The difference between pore types is shown in Fig. 2.
8 Most of the study in this thesis is focused on macropores. 9 A special case of open pores is dead-end (blind) pores that are interconnected only from one side of the medium.

27
Figure 2 Pore types.
The most trivial characteristic of a porous material is the total volume fraction of pores,
i.e. porosity that is calculated by dividing the volume of pores by the volume of bulk [81].
Based on the total volume of different pore types, the following classification is used
[83]:
Bulk or total volume: measured by the external dimensions True volume is the total volume minus the volume of open and closed pores Apparent volume is the bulk volume minus the volume of open porosity
Another common characteristic of porous material is the surface area of the pores
which is often given as a comparative number by stating the specific surface area that
is the interstitial area of pore surfaces per unit mass or volume10. The surface area is
significant to all reactions, such as adsorption [IV] or surface charging [V], that take
place on the surfaces; and affects the fluid flow through porous media [VI]. [79]
2.1.2 Challenge of defining a pore
In light of the previous, determining pore parameters, like has been done in [I-IV; VI-VII],
is relatively straight forward, but as pores may be invisible to the naked eye they need
to be analyzed by experimental techniques yielding macroscopic parameters, such as
10 As stated by Dr. Arto Ojuva: “Surface area might be tricky, since you don’t know directly if you are measuring the inside or the outside. Especially with nanoparticles the external surface area is often a significant fraction of the total pore area. Also, surface area is heavily dependent on the probe molecule (molecule used in surface area measurement). I’m trying to say that you cannot inherently claim that the reported surface area is “the interstitial area of pore surfaces” (whatever that means...)

28
[79]: porosity, pore size, specific surface area or permeability which describe the type
of pores in the measured sample, and depend on the method of characterization.
The conventional characterization methods are further discussed in section 2.4. Char-
acterization of pores, but as an example, a method called intrusion porosimetry that
measures the volume of infiltrated liquid at a certain pressure and calculates the vol-
ume distribution of the sample may not lead to a clear correlation of pore volumes be-
cause the macroscopic parameters represent average behavior of a model sample [79]
and easily underestimate and neglect certain pore characteristics.
The topics in this thesis include structures with heterogeneous pores [I; III; VI; VII] that
are difficult to describe, and when averaging may lead to great errors. The problem is
often evaded by measuring functionally important pore features for instance using an
extrusion porometer instead of mercury porosimeter for structures where fluid flow is
important11.
In real materials the pore morphology may also vary spatially, like in [I, III, VI, VII],
meaning that in certain areas porosity is different. This can be caused e.g. by the man-
ufacturing method [79, p. 32] and lead to doubts on representativeness of a sample
unless these heterogeneities are systematic that is the case in "anisotropic" structures
in [IV]. This question of representativeness is often linked with manufacturing and can
be countered with in situ -measuring.
A main challenge in microscopic pore analysis has been the definition of a pore. [79]
defines a pore as "a portion of pore space bounded by solid surfaces and by planes
erected where the hydraulic radius12 of the pore space exhibits minima". This indicates
that "a pore" may often be an artificial concept. Such as in the enclosed articles that
study open porous structures composed of fibers [I; III; VII] and sintered aluminium
oxide [II]. The pore size alone does not describe the structure but merely works as a
guideline which is also perceivable when looking at the example images of real struc-
tures in the following chapters.
11 Fluid flow depends mostly on the dimensions of the most constricted part of intercon-
nected pores and not their total volume or properties of blind pores which the extrusion porosimeter measures. 12 The book [79] uses hydraulic radius in the meaning of minimum value of area of cross
section divided by the length of perimeter of cross section [79, p. 30].

29
2.1.3 Porosity in real life
Leaving aside the often simplistic way of defining materials by indirectly measured pore
parameters, the following sub-chapters describe the real ceramic structures encoun-
tered in this thesis.
For sintered ceramics the sub-chapter is written from manufacturing perspective to
retain coherency with articles [II, V] that cover related in situ -methods. Other sub-
chapters on porous crystals [IV] and fibrous ceramics [I, III, VI] describe the structures
in general and in comparative manner.
2.1.3.1 Porosity in partially sintered ceramics
In sintered ceramics, conventionally the effort is to reach dense solids as the mechani-
cal properties strongly depend on the porosity. [79, p. 86] Yet, if functionality, like fluid
permeability is striven, pores are fabricated in the material.
Each method under this topic, as the name implies, has a stage where the structure is
sintered but before that the raw material forming is carried out with different manners.
Typical ones include powder compaction and slip casting and both of them, as well as
the majority of all ceramic production methods, exploit raw materials as fine colloids,
susceptible to agglomeration. These finally determine the pore amounts, shapes, and
sizes [80, pp. 13–14].
Sintering
Sintering of a particulate material inflicts particle bonding, neck growth, pore channel
closure, pore rounding and shrinking. Sintering needs to be controlled as for example
due to statistical laws, when porosity decreases under 10 percent, mostly ineffective
porosity is left. [79] Fig. 3 shows how the microstructure changes when sintering tem-
perature is increased. This phenomena, delimiting the functional use of the structure, is
seen in our publication [II] that studies the possibility to use electrical agitation for
online analysis of different porosity levels.

30
Figure 3 Sintered alumina structures with different total porosities from top to bottom 33, 18, and 3 % total porosity. Scale bar length is 130 µm.
Powder compaction
Ceramics with sub-millimeter or sub-micrometer pore size are typically produced by
powder compaction [80, p. 12]. These structures are used for instance for filters, catal-
ysis beds and gas sensors. In order to control the pore properties of the finalized ce-
ramics the understanding of powder forming process is important [80, p. 12]. Powder
compaction process is studied in [VII]. Granules and their internal porosity is shown in
Fig 4.
Figure 4 Kaolinite powder. Granule surface and cross sections.

31
Colloidal processing
Another typical forming method for sintered ceramics that was used for sample materi-
als in [II] is slip casting. In slip casting, where the particles are suspended in a liquid
solution, their surface properties influence the suspension characteristics. Phenomena
surrounding particle-particle interactions are encountered in colloidal processing that is
a typical step when manufacturing porous materials.
Colloid is a heterogeneous mixture of continuous dispersant and discontinuous phase
that classically has a size of 1-1000 nm. For practical reasons the range is often ex-
tended with the main focus in the interactions of particles.13 These interactions result
from the particles being larger than molecules, so that they do not behave like a true
solution, but at the same time being smaller than macroscopic particles14, so that clas-
sical physics cannot be applied, and for instance gravitational force is not great enough
to cause sedimentation. [84]
The above insinuates that non-classical forces act on the particles in a colloidal sus-
pension. In addition to gravity, the particles can move because of forces caused by
convection or Brownian motion but the electrical charges in a stable suspension pre-
vents the sedimentation of the particles. These charges are caused by the inherent
property of the surfaces of inorganic particles to charge in solutions. This invokes coun-
tering ions from the solution to bond on the particle surface which further induce a
loosely bound diffusion layer of cations and anions to surround the particle and the
primary, strongly bound ion layer. Now, the particles with ions surrounding them in a
double layer, repel each other [85]. The electrical interaction between particles affected
by temperature, acidity, and ions in the liquid; are a sum of double layer repulsion and
van-der Waal's attraction. The mentioned variables are exploited when controlling sus-
pension stability, [85] and they are studied by measuring the electrokinetic potential
between the particle including the double layer, and the suspending liquid. Common
device to measure this is zeta potentiometer. [86] Certain results in [IV] imply that an
electrical resonance measurement can be used to study these forces in a suspension
in an online manner.
13 According to [85], in a system where solid particles are dispersed in a liquid, colloidal forces are significant below 40 μm particles. 14 Those visible to the naked eye.

32
2.1.3.2 Porosity in porous crystals
Porosity in sorption materials is typically distinguished by the molecular size pores with-
in the crystals that the structure is composed of. These materials are used for ion-
exchanging, catalysts, molecular sieving or sorption. The intracrystalline porosity is
classified by type into layered, isolated, channeled and interconnected pores [79, p. 89].
Interconnectivity in certain structures, mainly zeolites, is exploited in selective gas sorp-
tion that can be controlled by tailoring the intracrystalline pores.
In article [IV] a zeolite powder was structured for more efficient CO2-capture. An exam-
ple of structured zeolite is presented in Fig. 5. A zeolite crystal has an inherent pore in
its lattice and the size of this pore typically varies within 0.3 and 1.0 nanometers. The
zeolites are composed of silicon and oxygen with some aluminum and the lattice pore
size can be controlled with doping. [87, pp. 5–8]
Figure 5 Structured zeolite.
2.1.3.3 Porosity in fibrous ceramics
A good and well-studied example of a fibrous and porous material is paper. It is distinct
with a large amount of interconnected porosity and usually characterized in terms of
pore radius using air permeability or pore size distribution with different fluid intrusion
and extrusion techniques. [79, pp. 82–83]
Many ceramic fiber structures, included the one present in this thesis (Fig. 7), have
remarkable similarities with the structure of paper but they are far more stable in high

33
temperatures and chemically aggressive atmospheres. Consequently they are used in
hot gas filtration [68] and furnace linings [88].
A distinct demand in filter application is the filter's efficiency to remove particles of cer-
tain size. That depends on the pore size distribution rather than the equivalent pore
radius that is calculated from the permeability. The latter does not reflect the size of the
pores - few large pores have the same equivalent pore size as many small pores. [79,
p. 83] In situ -method in [I; VI] aim to offer a tool for quick verification of existence of
areas with larger porosity. The publication [III] aims to understand why this kind of a
structure turns rigid when heated.
Figure 6 Ceramic fiber structure.
2.2 Effect of pores and porosity to mechanical features
As the previous introductory sections on pores and porosity clarified, the porosity, pore
geometry, and pore size are known to have a major effect on the properties of porous
material [80]. The features under interest on the enclosed publications are mechanical
strength [III, IV, VII] and permeability [I, IV, VI]. The theoretical background of the firstly
mentioned is examined in this section (visualized in Diagram 9) and the second in the
following one.
Objective of this section is to display common theories related to how change in porosi-
ty or pore characteristics affect the compressive strength of heterogeneous structures
and how a granule bed behaves under compression while its porosity is decreasing,

34
and finally inspect how a fibrous structure can be modeled explaining its strength and
elasticity changes when it is heated.
Diagram 9: Pore effects on mechanical features.
2.2.1 Effect of porosity to mechanical features
Amount of porosity has an effect to mechanical properties such as strength and tensile
modulus. This is seen in [IV] and [89], and in plain: increasing porosity means less ma-
terial to carry the loading and subsequent decrease in component strength. This simpli-
fication has led to numerous studies such as [90] that relate porosity with a mechanical
property. Still, most of the parametric relations presented in these studies have an em-
pirical constant that has to be varied when material or manufacturing method is
changed. The empirical factor is needed because the total porosity is not the only con-
tributor to the mechanical characteristics [91] which is clearly seen in [IV], where a
structure containing oriented porosity was found to carry load at in-plane axial com-
pression five times higher with only changing the structure of pores while keeping the
porosity constant.
To inspect this a little deeper, Griffith [92] explained that strength and amount of dis-
continuities in brittle materials are linked by how the stress is concentrated at the loca-
tion of these discontinuities. In other words, the force applied to a structure can only be
conducted through a solid phase and it has to go around or transmit through each dis-
continuity causing force concentration in the vicinity of discontinuities (see Fig 7). The
conduction of force and its concentration close to discontinuities leads to idea, also
originating from Griffith, that the discontinuity's shape and alignment with respect to the
applied load affects the concentration of force as shown in the Figure 7. This concen-
tration takes place also in porous materials and is dependent on the pore shape, size
and orientation. We have used this principle when explaining the strength changes in
[III, IV, VII].

35
Figure 7 Stress concentration caused by different discontinuities. Lines indicate a stress field while black areas are the discontinuities. Stress concentrates on the tip of the discontinuity in the right-most picture.
2.2.2 Effect of pore characteristics to mechanical strength
Looking more closely in the pore characteristics, other than overall porosity, it is quickly
evident that a porous material has to be viewed as a multiphase composite. When it is
strained, the internal stress field is not constant [93, Ch. 1.2] and even the macroscopic
behavior of the structure can vary according to direction and location of the strain. This
is called anisotropic behavior and a typical example of it is a unidirectional fiber com-
posite that has a stiffness of fiber in direction of their axis and stiffness of matrix against
it [94]. In [III], although quite random, the fibers are oriented in certain layers causing
non-linear behavior. Another example of nonlinearity is the oriented zeolite structure
whose compressive strength was modeled in [IV].
2.2.2.1 Modeling of mechanical features
Approaches to model mechanical features are divided as [95]:
1. Composite theory, which is the basic approach in micromechanics, analyzing heterogeneous materials on the basis of their geometries and properties of each separate phase [93, Ch. 1.2]. In context of porous materials this ap-proach is applied by considering pores as one of the phases of the composite.
2. Cellular solids is an approach that assumes the composite possessing a re-peating structure that can be defined as a cell, following that the behavior of such composite is a function of each cells together. The structure is studied in multiple scales15.
15 But the methods in this category can either be homogenized, such as in [158], or they can be modeled with different generalization methods [95].

36
3. Minimum solid area approach assumes that a mechanical parameter can be calculated as a ratio of respective solid and the studied component which is directly proportional to the minimum ratio between solid contact area and the total cross-sectional area.16
In [IV] we have modeled compressive strength of an oriented structure using a cellular
solids approach. When the above approaches were compared the choice was made
based on that the one in question had been used before for such structures [91], [96]
and the fact that our structure was very distinct with separate cells fitting easily to the
framework that is explained in the following.
2.2.2.2 Geometric model for open cellular structures
Our approach in [IV] was to use the model originally published by Ashby [91]. The
model views the cells composed of repeating structures and is mostly aimed for low-
density open-pore cellular solids. It is derived from dimensional parameters of idealized
structure composed of struts, not by modeling real pores. The model is semi-empirical
but it has been fitted with extensive number of different structures.
Basis of the model, described better in [91], is to account for three variables classified
as: material properties, topology of the cells, and relative density of the structure. The
structures are classified either being stretching or bending dominated in which the dif-
ferences are that the strut structure, considered to have locked joints, in a bending
dominated type divides the force in a manner where the struts bend whereas in the
other type they stretch. Focusing on the bending dominated structures; they are de-
fined by low connectivity of the cell joints inducing three competing yield mechanisms:
plastic yield, buckling, or fracture. The failure mechanisms can be predicted when the
cell unit size and the strut modulus are known. The bending dominated structures are
typically weaker especially if they break before their fracture strength which is seen in
[IV] and further modeled using Euler-buckling principle.
2.2.3 Strength of a granular bed under compression
Moving now from mechanics of cellular structures to a structure that is somewhat simi-
lar - composed of repeating units - but is in a dynamic state during application of force,
the modeling becomes more difficult.
16 In addition to pore volume fraction, the approach uses parameters that describe pore morphology and packing [159] from the principle that structures become weak when the solid contact in highly porous structure minimizes [157].

37
The article [VII] addresses the measuring of granule bed strength that is relevant in
certain processing steps when introducing porosity to materials. The theory in powder
compression is relatively well understood but with brittle and small granules the inter-
pretation of the compression curve has been unclear.
The following presents related theories in a broader sense in comparison to the article,
acknowledging the different behavior of rigid granules and uses the earlier presented
force field approach.
2.2.3.1 Compaction stages in compression of brittle granules
The difference between plastic and rigid granules is that the plastic granules deform
during compression. This causes differences in their manner of yielding but certain
similarities prevail. For instance in [97], the compression is found to take place in stag-
es where the granules rearrange and deform, but these do not take place in as distinct
steps as in brittle compression where distinct yield stages can be seen in a compres-
sion curve. The curve plots compressive pressure against strain in a steady-state com-
pression and it is presented in a half-logarithmic scale to emphasize the relative
changes. An example of the stages is seen in Fig. 8.
Figure 8 Granule yield stages in [VII].
During the first stage in the curve the granules deform elastically, pack, and rearrange.
When the rearrangement takes place, the relative density decreases as the granules
achieve a denser packing. During the second stage the compressive strength of the
granules exceeds and they break mainly by fracturing and attrition [98]. The breakage
probability can be described by Weibull-statistics [99] leading to the fact that smaller
granules are relatively stronger and that the steepness and length of the curved region
is affected. A high weibull modulus [100], small size distribution, high packing density
and homogeneity of granules, lead to a steep and short second stage as the granules
break at the same load. [101] The curve is not affected by granule size distribution pro-
vided that the strength of each size is equal [102] but their shape may change it be-
cause it changes the initial relative density [103]. During the third stage the fractured

38
granules rearrange under similar laws as in the first stage and in the final fourth stage
the granule bed has no, or very limited amount of, voids left and the primary particles
and pieces of granules can no longer rearrange. [104] Finally after the compression the
relief of pressure causes the release of elastic transformation leading to a small de-
crease in compact density [105].
2.2.3.2 Force distribution links the bed strength to strength of individual granule
Correlating the granule strength of a single granule measurement with a granule bed
measurement [106] is difficult but not always necessary if a relative analysis is enough.
In single compression, force is transmitted to the granule by a controlled manner in
which the granule is subjected to the most stressed condition by inducing the stress
from its opposite poles [102]. This is not always the case in bed compression where the
division of load is governed by how the force field divides across the granules. Still, in
the both cases the granule breakage is influenced by the same factor that is the size
and orientation of intragranular discontinuities, such as primary particle boundaries,
binder-particle-interfaces, pores, and cracks which function as stress condensers.
The previously mentioned force field division in bed compression is controlled by
shapes and sizes of granules and eventually affected by the partial yield of the bed.
When granules fracture and their size becomes smaller they can divide the stress more
evenly to bigger granules but themselves are exposed to a higher stress level, because
of fewer contact points. [100], [102] As a countering effect the granules undergo size
hardening that is linked with a weibull volume effect rendering the smaller granules
relatively stronger [98].
Because of the above the changes in bed compression curve are smooth as the gran-
ule breakage only causes more force to divide to other nearby granules and adding to
that also the punch geometry and granule's friction against other granules and the die
walls affects the measured compressive strength. The stress is the highest close to
geometric discontinuities of the die and close to the compressing punch. According to
[107] the friction between the die wall and the granules is a more dominant feature than
granule-granule friction. This can lead to unequal force distribution creating local re-
gions of high-stress areas [97].
In [VII] an in situ -measuring method for measuring the bed strength of rigid granules is
refined for being semi-automatized.
39
2.2.4 Mechanical aspects in fibrous materials
Theories on oriented structure made of powder and powder compression have now
been presented. In the first cases it was possible, to some extent, model the structure
but the previous modeling is more difficult as the modeled entities are moving during
compression. In the following, the difficulty comes from the heterogeneity of f iber struc-
ture making the parameterizing enormously difficult.
Fiber structure studied in this thesis [I, III, VI] was a complex network of randomly ori-
ented and kinked fibers that varied in diameter and length. In addition, it contained oth-
er strength increasing phases, such as binder and chopped fibers whose distribution
was not even. Ultimately, the structure was so heterogeneous that no proper models
were found to describe it and it was not totally clear what the results of conventional
mechanical tests indicated.
In the beginning, the problem was compartmentalized via basic approaches to study
fibrous networks [108, p. 28], [109, p. 4]:
Network models: studying typical fiber deformation of a macroscopic entity studying for instance the effect of fiber orientation to the structure. In network model the individual fibers and their connections are modeled.
Continuum models treat the fiber structure as a planar entity assuming that a representative volume of fibers and their connections can be studied as a continuum, i.e. structure can be homogenized.
Molecular model studies the mechanical properties via the physics of molecu-lar bonds omitting the structure's geometrics.
From these approaches the continuum idea was an obvious choice for the simple rea-
son that the modeling of this structure was so complex that network model or molecular
models were considered to need too much detail17. The work did not include modeling
but touched the aspect by proposing a new feature "fiber free length" that is presented
in the following.
2.2.4.1 Continuum model for fiber networks
To explain why a complex fibrous network turns rigid when heated, the network was
studied in the paradigm of continuum modeling, focusing on a mesomechanic ap-
proach where a single fiber, with all its connection to nearby fibers, was chosen as a
mesoelement as in [108, pp. 28–29]. Such a mesoelement is depicted in the Fig. 9 with
17 It could be modeled but the main effort of the project where the study was carried out
was not that.

40
red (the fiber) and green (fiber connections). Because the connection of a standard
mesoelement are multiple and in different angles the strain for one fiber is not uniform.
The free distance of the fiber in the figure is colored with deep red, it is the distance
between the two adjacent connections. When this distance is small in comparison to
fiber width the fibers shear under a load whereas with long distance they are more
prone to bending [108, p. 29]. A similar observation was made in [III].
Figure 9 Fiber bonding in [III].
2.3 Effect of pores and porosity to fluid permeability
The mechanical aspects related to thesis have now been reviewed and next in line are
the matters related to fluid permeability (visualized in Diagram 10) to which the present
chapter focuses. That is an important functionality pursued by adding interconnected
porosity to materials.
The chapter opens with a general sub-chapter presenting the field of fluid flow in po-
rous media but focuses quickly on permeability models relevant for [I, VI], that study
the porous structure of fibrous hot gas filters. In more detail the publications study per-
meability and its relation to pore structure and link those by measuring the heat transfer
of hot gas flowing through the pores. For that reason, heat transfer in porous structure
is also discussed in subsection Thermal measurement of permeability.
Permeability is also under investigation in the structure presented in paper [IV]. The
structure is aimed for CO2-sorption that is controlled by the nanoporosity in the crystal-
line structure of the studied zeolite. The kinetics of sorption processes are affected by
the permeability of larger size flow channels providing the gas on the sorption frontier.
Objective of this chapter is to build a theoretical base on thermal flow permeametry
measurement [I, VI] and as a side note explain how sorption is partially controlled by
permeability. The latter is not in the main focus of this thesis but closely related and
more thoroughly presented in [IV].

41
Diagram 10: Pore effects on fluid permeability.
2.3.1 Fluid flow in porous media
Fluid flow in porous and heterogeneous materials is seen in nature and technological
areas where the most studied are the extraction of oil and gas, spreading of contami-
nants in fluid-saturated soils, separation processes such as filtration [110, p. 1], and
substance transport in biological systems [111]. Many of the theories a rooted from
research on those areas.
A detailed investigation of fluid flow through porous material can be complex because
of heterogeneous microstructure in porous media giving rise to effective fluid flow
properties [110, p. 1]. In plain, flow of fluid through a porous media is governed by:
temperature and pressure dependent external factors such as: o the flow speed of fluid and o the fluid's viscosity, and
structure dependent internal factors such as: o pore tortuousness o specific surface area per unit volume18, and the o structure's thickness.
A fluid can flow through a porous media because of pressure gradient, external body
force or capillary force. [110, p. 5] This thesis is confined to the firstly mentioned,
whose modeling is studied via the most typical material property related to fluid flow --
permeability.
18 The specific surface area is affected by the pore shape, size and topology.

42
2.3.2 Fluid permeability
In this thesis modeling of the flow through a porous media is confined in measuring the
permeability of fibrous network [VI] and roughly predicting its structure on basis of that.
Also zeolite structure is touched [IV].
Permeability19 is the ability of material to transmit fluids [110]. The basis of fluid flow
modeling comes from microscopic level Navier-Stokes equation describing the motion
of newtonian substances. Continuing from that to the macroscopic level Hagen-
Poiseuille equation gives the pressure drop in an incompressible and newtonian fluid in
laminar flow through a long cylindrical pipe of constant cross section. This has then
been refined to describe the flow of fluid through a porous medium showing how the
discharge rate through the pores is proportional to the structures permeability, cross-
sectional area and pressure drop; divided by the length of structure and viscosity of
fluid. This is known as Darcy's law that for incompressible fluid in its integrated form
shows the total discharge rate Q [m3/s]:
𝑄 =−κA(𝑝𝑏−𝑝𝑎)
μL, when κ = permeability of the medium [m2], A = cross-sectional area to
flow [m2], pb-pa = pressure drop over the medium [Pa], µ = viscosity of the flowing medium
[Pa · s], and L is the thickness of the medium [m]
2.3.2.1 Modeling permeability
Permeability of a structure can be predicted with Kozeny-Carman equation [112] that is
a derived equation for fluid velocity coming from experimental modeling of voids in bulk
material.
The equation is analytical and is based on Hagen-Poiseuille making an assumption
that the flow goes through many parallel channels [113] that have the total internal sur-
face equal to particle or pore surfaces. Equation has an empirical coefficient that de-
pends on the porous path [29] and it was generated to predict permeability of a packed
bed, being thus most accurate for a certain particle size distribution and particle shapes
close to spheres [29] in a steady state flow [114]. The Kozeny-Carman equation shows
the permeability Δp [pa] related to medium height L [m]:
19 Permeability is considered to be a material property but some fluids may interact with
the materials changing its permeability [110, p. 7] thus some references report “specific permeabilities” when measuring with a dedicated fluid.

43
Δp
𝐿=
180μ
Φ𝑠2𝐷𝑝
2 (1−ε)2
ε3ʋ
𝑠, when µ = viscosity of the flowing medium Φ2
s = sphericity of the
flow channels D2p = diameter of flow channels ε = porosity of the medium ʋs = superfi-
cial flow velocity
In [114] the equation is refined to apply also for turbulent flow, obtaining a general
equation for pressure drop through a fixed bed of different shaped material and a wide
flow range. Certain analytical models have been prepared especially for fluid flow in
fibrous materials but they are mostly based on simplified geometries where the fibers
are considered as cylindrical rods parallel or against the flow in 2- [115] or 3-
dimensions [116]. In fibrous systems the fibers are taken into account by adding their
volume fractions, fiber diameter and orientation to flow [111].20
2.3.2.2 Washburn equation
Permeability of a structure can be used to measure its pore parameters with liquid in-
trusion and extrusion techniques that are both based on measuring a pressure needed
to replace or displace the analyzed pores with a measuring liquid. This enables the
quantification of pore sizes by using a Washburn equation that links the pressure and
pore diameter with surface tension21 and contact angle between the liquid used for
measuring and the specimen. In extrusion porometry a wetting liquid with very small
contact angle is used whereas intrusion porosimetry uses a liquid, typically mercury,
that has a high contact angle. The Washburn equation shows pore cross-section diam-
eter D:
𝐷 = 4γ cos(θ)
𝑃, when γ = surface tension of the measuring liquid, θ = contact an-
gle of the liquid, P = applied pressure
In the equation a circular pore cross-section and straight flow channels are assumed
but linear correction factors for them can be used. [117]
20 Because the models are very simplified but still need a lot of parametric information, quite impossible to obtain from the heterogeneous fiber structure, and because the function of this thesis is not to build permeability models, we are confined in the original KC-equation using it to roughly predict the flow channel-permeability -correlation. 21 The capability of the surface to resist external force. Typically measured in dynes/cm: for water 72 dyn/cm, for wetting liquid 16 dyn/cm [117], and for mercury 486 dyn/cm.

44
2.3.3 Thermal measurement of permeability
In [I, VI] a fibrous structure that is very heterogeneous is analyzed using a flow of hot
air through it and measuring that with a thermal camera in order to locate the areas of
high permeability seen by the certain area heating faster. The method needs a small
theoretical background on heat transfer in porous structures.
The following is based on a study of heat transfer in stone wool [118] which has a simi-
lar composition and structure in comparison to the one studied in [I, III, IV].
Heat transfer through porous materials in static situation takes place with four mecha-
nisms [118]:
1. Conduction through solid medium 2. Conduction through gas medium 3. Convection due to air in pores 4. Radiation through material and pores
The importance of convection is normally very minimal, and in temperatures below
100 °C, such as in our case, the relative importance of radiation is also very small, so
the both factors can be omitted. The dominating factors are conduction through gas
and fibers which are found equally important to heat transfer [118] in situation where
conduction through gas takes place in non-flow situation. On part of fiber conduction, it
is determined by fiber orientation and the pore shape which affect the heat transfer,
especially when porosity increases [119] but in order to focus on locating the local
permeability we have minimized the effect of heat conduction through fibers by using a
dynamic situation inducing a flow of hot gas through the media in [I, VI].
2.3.4 Permeability connection to sorption
In paper [IV] a zeolite powder was structured for more efficient CO2-capture. The cap-
ture takes place mostly by physisorption directly from a gas flow making the efficiency
of adsorption-desorption cycle important. The efficiency is retarded by intracrystalline
diffusion of gas to active sorption-sites [120]. In simple, the aim was to increase the
effective surface area by having a high permeability to allow large gas volumes to
reach multiple adsorption sites.
The approach in [IV] was to craft oriented flow channels that have higher permeability
than a simple bed of granules. The structure contained laminated walls, thin enough for
rapid adsorption, and so close to each other that no surface area was wasted [87]. The
replacement of powder bed with a structure that had ordered flow channels affected the

45
permeability by lowering the flow channel tortuosity. The effect of tortuosity is seen in
Kozeny-Carman equation in subsection Fluid permeability.
2.4 Characterization of pores
The theoretical areas: effect of pores to strength and fluid flow, have now been covered
and the final section of this chapter follows. The section is written to support the aim of
this work: development of in situ -methods for measuring pore related factors. The
functionality of these in situ -methods was ensured by comparing the results by the
conventional methods presented in this chapter. The links between the methods are
visualized in Diagram 11.
The section also finalizes the theoretical chapter linking the definitions of pore and po-
rosity presented in the beginning by the methods with which they are acquired. The
review is limited to characterization methods that are used to acquire the results pre-
sented in the enclosed publications.
Objective of this chapter is to give an overall description of some important methods
used for characterizing pores. Aim is also to qualitatively compare the characteristics of
different methods.
Diagram 11: Pore characterization.
2.4.1 Porosity and pore size distribution
Porosity and pore size distribution is measured indirectly with functional measurements
by a priori assumption made of pore structure, i.e. assuming the pores are all cylindri-
cal. [79]

46
Typical methods for measuring the distribution are mercury porosimetry and different
extrusion porometers. The mentioned methods measure only the interconnected poros-
ity but certain methods, based on diffraction or scattering can be used to gain infor-
mation about the closed pores and pore structure of a sample [79]. Also pycnometrical
methods such as Archimedean method can be used to measure the total porosity but it
does not yield the distribution.
As various techniques measure different pore size ranges and some can measure the
closed porosity as well, using multiple methods, like intrusion porosimetry, small angle
X-ray scattering, and gas adsorption for pore characterization is useful in some occa-
sions [82].
2.4.1.1 Pycnometry
Measures the volume of fluid displaced on submersion of the sample. Idea originates
from Archimedes' principle with the exception that the measurement may carried out
with gas, such as air [121], but the most typical procedure is to calculate the porosity
simply by measuring the mass of a water saturated sample [79] minus the mass of dry
sample divided by the density of saturating liquid giving the liquid volume that, when
divided by sample volume, gives the sample's porosity. [81] This Archimedean method
was used in [II].
2.4.1.2 Porosimetry
Porosimetry is a popular method for characterizing meso- and macroporous structures
[122]. It is an intrusion method where a non-wetting fluid [122] is forced in to pores of
the sample incrementally by external pressure, meanwhile recording the relation be-
tween the intruded amount and the pressure [81]. Typically the sample is first de-
gassed to remove gas in pores that would hinder the intrusion [123]. Low external
pressures fill only the large pores and progressive pressure increase fills the smaller
one. Pore volume distribution can be calculated from the amount of intruded liquid [79].
By using the Washburn equation [123] also the cumulative pore diameters, mean di-
ameter, pore surface area, based on an idealized cylindrical pore, can be derived [122],
[123]. Based on the sample mass, and the density of mercury, also bulk and skeletal
densities22 of the specimen can be measured [123]. The technique is sensitive to con-
22 Skeletal density is calculated from maximum mercury intrusion volume so it does not include closed pores but pores down to minimum measuring range defined by the maxi-mum pressure that can be used [123].

47
tact angle between the intrusion liquid and the measured sample and because of that
the most common intrusion liquid is mercury that has a high surface tension and a
large contact angle with most of the materials, assuring it does not intrude the sample
without external pressure [79].
Because intrusion porosimetry is based on the dynamic accessibility of liquid in to
pores that is controlled by the pore opening [81] the method is known to underestimate
the void sizes. This is caused by the shielded pores23, but using a model in interpreta-
tion of the results can increase the accuracy [122]. However, the Washburn model of-
fers no distinction between a long cylindrical pore or multiple shorter pores of the same
size. Other challenges in the method are that the sample preparation (drying and air
evacuation) or intrusion liquid pressure [124] may interact with sample and affect the
porosity and typically the sample size is very small. Mercury porosimetry was used in [II,
VI].
2.4.1.3 Porometry
Porometry24 is a method where a low surface tension wetting liquid is let to spontane-
ously fill the pores of a measured specimen followed by its extrusion from the saturated
specimen with a gas pressure induced from one side. In the measurement of saturated
wet sample, no flow takes place until the biggest pore releases the liquid and bubbling
point is reached. Progressively smaller pores are emptied and gas flow increases till
the earlier measured dry and wet curves converge, showing all the pores are empty.
To determine the distribution of interconnected pore throat diameters Washburn equa-
tion [123] is used. From the wet curve a largest through pore is calculated from the
initiation of flow, while mean flow pore size is determined from the intersection of half-
dry curve25 and wet curve, and smallest pore is calculated from the intersection of dry
and wet curves [125].
Porometry typically exaggerates the number of smaller pores and mostly omits the
shielded pores rendering the method more applicable for measuring samples, such as
filters, whose flow channel size is the most important. [122] Only the pores smaller than
23 Such as those shaped like an ink bottle but rather a large network of pores that is inter-connected with a small opening. [160] 24 Also known as extrusion porometry or flow permporometry. 25 Mathematical half of the dry curve

48
bubble point26 can be determined and the method is similarly sensitive to how the wet-
ting liquid interacts with the sample as porosimetry. [122] Extrusion porometry was
used in [II, VI]
2.4.2 Permeability
Measurement of permeability or permeametry can be carried out with various ways, for
example as in ASTM standard [126]. The methods can be classified according to the
fluid that is used. With gas challenges arise from its compressibility and with liquids
from their susceptibility to interact with the measured material.
Basic principle in measuring is that a fluid is ejected through porous material with dif-
ferent flow rates meanwhile measuring the pressure drop over the sample. [79] Using
Darcy's equation the permeability can be calculated.
Also estimates of porosity, mean pore or particle/fiber size, or specific surface area,
can be derived from the measurements by applying derivatives of Kozeny-Carman
function. Both are done in [VI].
2.4.3 Pore shape and topology
Pore shape and topology is difficult to address with functional methods presented earli-
er, though some information on that can be received by comparing the same sample
with intrusion porosimetry and extrusion porometer or modeling permeability to give
some indication on the tortuosity of the flow channel.
Also careful analysis on physical sorption-isotherms, a technique not presented in this
thesis27, can give information on pore shape [127]. Yet, direct measurement of pore
shape and connectivity is carried out by microscopy techniques that offer a high resolu-
tion with the cost of losing spatial information. Measuring the pore size from two di-
mensional image typically underestimates it because the 2d-slice often does not go
through the widest part of the pore. Also the pervasiveness and thus the representa-
tiveness of the method cannot be ushered [81].
26 The point at which the first and the largest flow pore opens. 27 The gas adsorption was not used because most of the effective pore sizes in this thesis are in micron-level whereas the method is most suitable for measuring sizes below 200 nm [120].

49
More pervasive methods that also offer topological information on the structure have a
lower resolution in comparison to microscopy. These techniques are such as computed
tomography [128], magnetic resonance imaging [128], small angle x-ray scattering
[129], and focused ion beam scanning electron microscopy [122]. Also the modern
high-resolution electron microscopy has been used to measure structural features such
as pore shape and connectivity [130]. Most of these techniques, that for characteriza-
tion in materials science are relatively new, are delimited with small scanning volumes
and long measuring times. Although computed tomography and magnetic resonance
imaging was tried they were found non-suitable for the samples that in most of the cas-
es had spatial variation and could not be measured in large volumes.
In the enclosed articles [I, IV, VI, VII] analytical techniques were used to quantitatively
measure properties of micrographs obtained by scanning electron microscopes or
thermal camera.
2.4.3.1 Image analysis
In [131] image analysis is defined as "the set of computer processes designed to codify
a real image, to recognize the most interesting elements, and to highlight the neces-
sary information". The purpose of image analysis is to quantitatively analyze micro-
graphs [122]. It is useful when analyzing a large set of details in multiple images when
doing this by hand would be too time-consuming and tedious or even impossible [132].
Images can be analyzed in 2- or 3-dimension, in grey-scale or in color and the capabili-
ties of analyzing them are diverse [133]. Maybe the most abundant possibility, also
abused in the enclosed articles [I,IV,VI], is the feature extraction where a quantified and
meaningful features are extracted and numerically presented from an image [132].
Such a feature can for example be pore length [IV] or spatial pixel intensity correlating
with temperature [VI].
The process of image analysis is confined in four steps that are completed with differ-
ent methods beyond the topic of this thesis, the step are [131]:
1. image acquisition: carried out e.g. with a microscope and a camera,
2. image processing: typically using filters to remove artifacts or to highlight specific image characteristics,
3. image segmentation: identification and isolation of pixels belonging to same category, and
4. feature extraction.

50
Methodological measures have to be used to [131] ensure that the image size can be
compared to the structure and spatial position, and in homogeneous materials the ob-
servation scale has to be set according to observed feature: pixel size small enough to
detect finest details but magnification on the level for comprehensive analysis.

51
3 Main experimental procedures and sample materials
The following is a standalone chapter shortly visiting some of the methods and devices
used in the enclosed articles. Not all of them are presented, only those that were used
in more than one article or were notably important from the aspect of characterization
of pores and porosity. The chapter is divided into three sections of which the first one
3.1. Conventional characterization methods presents the common commercial methods
that were used, the second 3.2. In situ -characterization methods present in-house
crafted in situ -measuring methods, and the third 3.3 Sample materials used in testing
the characterization methods, describes the materials that were used to test the in-situ
methods.
The aim of the whole chapter is to give a general understanding on the devices and
parameters that were used to run them in the experiments on the enclosed articles.
The reader is referred to study the enclosed articles for mode detailed descriptions.
Diagram 12 recaps the methods and materials presented in this chapter.

52
Diagram 12: Experimental procedures and Materials.
3.1 Conventional characterization methods
The following describes the most important commercial characterization methods that
were used in the enclosed articles. The chapter has sub-chapters withholding micros-
copy and mechanical testing; pore parameter analysis by archimedean method, mercu-
ry porosimetry and extrusion porometry; and finally a description on thermal analysis by
dilatometry.
3.1.1 General Characterization
3.1.1.1 Scanning electron microscopy
All the related microscopical analyzes in [I-VII] were carried out with scanning electron
microscopes. Models that were used were Jeol JSM 6360LV, ULTRAplus; Phillips XL-
30; Carl Zeiss Microscopy GmbH (Germany); JEOL JSM-7001F (Jeol Ltd., Tokyo, Ja-
pan); Hitachi Analytical TableTop Microscope TM3000 (Hitachi High-Technologies Eu-
rope GmbH, Krefeld, Germany).
Prior to imaging, the specimens were prepared by cutting them with suitable tools or
pouring a suitable amount of powder on to a conductive adhesive, and enabling electri-
cal conductance from top of the sample to the sample holder using conductive carbon
cement or copper tape and coating the analyzed surface with carbon or gold using an
evaporator or a sputter. Some samples were also analyzed using Energy-dispersive X-
ray Spectroscopy coupled with the electron microscopes.

53
3.1.1.2 Mechanical testing devices
Compressive materials testing was used in [III, IV, VII]. Testers that were used in the
measurements were Instron 5967 universal testing machine (Instron, Norwood, MA,
USA) and Instron 4505 (Instron Industrial Products, England).
With the devices a load cell having a maximum capacity close to the measured
strength was used when possible to improve accuracy. The compressive testing was
carried out with suitable tools, for instance the granules in [VII] were compressed with a
jig presented in subsection Granule bed compression.
3.1.2 Functional pore characterization
3.1.2.1 Archimedean method
The density and porosity of sintered ceramics were determined by Archimedes method
in [II]. This was performed according to ASTM standard [134]. In the standard a speci-
men is first dried to constant mass and weighed, then saturated by boiling and soaking
in water, and weighed under water, and finally in air. The above weights are used to
determine the porosity and density.
3.1.2.2 Mercury porosimetry
In [I; VI] the pore volume distribution was measured with Micrometrics poresizer 9320
(Micromeritics Instrument Corporation, USA). In the method a small specimen was first
dried and then placed in to a measuring chamber that was filled with mercury. Pressure
in the chamber was first decreased to evacuate air and then mercury was introduced
and pressure increased and the volume of intruded mercury was measured so that the
corresponding pore volume could be calculated. [123] The applied measuring range
was up to 200 MPa that is equal to 0.006 um pore size.
3.1.2.3 Extrusion porometry
In [I; VI] a capillary flow porometer (Porous Materials Inc., Ithaca, NY, USA) was used
to measure the size of flow pores. The measurements were carried out at Porous Ma-
terials Inc28. headquarters where the filter element specimens' dry and wet flow rates
with respective pressures were measured to calculate the corresponding pore throat
28 Porous Materials Inc. Analytical Services Division. 20 Dutch Mill Rd. Ithaca, NY 14850,
USA.

54
diameters [120]. In the measurement a wetting liquid (Galwick, surface tension 15.9
dynes/cm) was used to infiltrate the specimen and tortuosity factor of 0.715 was used
to correct the pore size. Depending on the specimen a maximum pressure from 46-60
kPa correlating to a 1.0-0.8 um pore throat diameter was used.
3.1.3 Dilatometry
In [III, VII] a dilatometer (Model DI-24, Adamel Lhomargy, Roissy en Brie, France) was
used in dynamic mode to measure length changes caused by temperature.
In a dilatometer measurement a specimen cut or compressed into shape of a cylinder
with approximately 20 mm in length was placed between a measuring rod that followed
the change in the specimen length with respect to temperature. After omitting the ther-
mal expansion caused by the measuring rod the results were plotted with temperature
against relative length, and e.g., sintering behavior (initiation temperature and extent)
could be analyzed.
3.2 In situ -characterization methods
Having described all the commercial methods used in more than one of the enclosed
articles in the following all the in situ measurements developed in-house and presented
in the enclosed articles are described.
3.2.1 Grit blasting
In [III] a grit blasting test was devised to gain more understanding about the rigidization
of ceramic fiber structures. In the test, momentum of round 150 - 250 μm glass grit was
adjusted by controlling the feeding pressure so that it eroded a reference sample at a
moderate rate. The erosion was caused by the grit breaking the fibers.
In the method a specimen was placed at a 90° angle towards a grit blaster (model FG
Ghiotto 28HSS with a bottom container) that was used to eject glass grit for 5 seconds
to erode a crater on the sample. Feeding was smoothed with a vibrator and the depth
of the grater was measured using a sliding gauge to observe differences with specimen
that had varying thermal histories. A schematic drawing of the method is shown in Fig.
10.

55
Figure 10 Sketch of grit blaster.
3.2.2 Permeability
In [VI] in-house designed conventional permeameter was used to link the thermal per-
meametry results with permeability. The device had a gate valve for adjusting a laminar
filtered flow that was measured with a flow velocity meter (Schmidt SS30.302,
SCHMIDT Technology) while recording the pressure difference over the specimen with
a manometer (DP measurement TT570SV, UK) connected on the sub-pressure side.
Total measuring error of the unit was experimentally found to be 10 percent of the
reading.
With the device, permeability was measured by drawing air through the component
while the pressure drop over the studied specimen was changed in steps adjusting it
with the gate valve. The measured flow velocity was divided by the specimen's outer
surface area to calculate facial velocity, independent of component size. A schematic
drawing of the method is shown in Fig. 11.

56
Figure 11 Sketch of sub-pressure tester.
3.2.3 Thermal flow permeameter
A thermal flow permeameter (TFP) whose development was the focus in [I; VI] consist-
ed of a thermal camera (FLIR Thermacam PM595, FLIR Systems, Inc., USA), a length
scale made of metallic rods that are visible in IR-images, and an adjustable gas inlet
able to feed air up to 2000 l/min. During the measurement, air at 25 °C was let to flow
through a heater and finally through the monitored specimen. The heater unit could be
heated up to 400 °C but 100 °C air was mostly used with an average face velocity of
5.5 cm/s which in combination caused the specimen to heat between atmospheric
temperature and 70 °C depending on the local permeability. A schematic drawing of
the method is shown in Fig. 12.
The resulting thermal images were analyzed with ImageJ as explained in the subsec-
tion Image analysis.

57
Figure 12 Sketch of Thermal flow permeameter.
3.2.4 Image analysis
To analyze images of thermal camera in [VI] and granules in [VII] a freeware applica-
tion, ImageJ, was used but for pore parameter analysis in the publication [IV] a special
algorithm was coded in an MSc thesis by Masi Valkonen [135].
3.2.4.1 Thermal image analysis
The thermal images were quantified using the following approach. The images, in
which the temperatures were exhibited as brightness variations, were converted to gray
scale and their gray value29 was calculated with image analysis software, ImageJ [136].
Thus, the gray value could be related directly to the surface temperature of the imaged
component and when using the external scale, the selected point or a selected area
could be identified.
29 A unitless indicator of the luminescence, or brightness, of a pixel varying from 0 (black) to 254 (white).

58
3.2.4.2 Granule size and relative density
In [VII] the SEM-micrographs of polished cross sections of granule specimen were ana-
lyzed to find out if the two size ranges of granules had a different shape or apparent
density. To do this a baseline image was converted in to binary with automatic thresh-
olding, and the granules were sectioned according to cross-sectional area using an
algorithm provided in ImageJ. Then the average circularities30 and aspect ratios31 of the
sections were analyzed omitting the granules reaching over the image borders. The
intragranular apparent density was estimated from SEM-image by similarly sectioning
the size fractions and measuring the average gray values32.
3.2.4.3 Pore characteristics analysis
In [IV] the effort was to link pore parameters such as pore area, alignment and round-
ness with the compressive strength of a cellular structure. This was carried out using
an adaptive algorithm that first converted a grayscale SEM-image into a binary one
containing empty pores and dense walls. Then using morphological dilation33 any un-
realistically small features and noise was removed, and an algorithm for a principal
component analysis was used to find the main axis and the center point of the pore.
Orthogonal major and minor axes were then calculated from the pore center point, and
used to draw ellipsoids for each pore in order to quantify the cross-sectional pore width,
pore area, and pore aspect ratio.
3.2.5 Granule bed compression
In [VII] a special tool was used to measure a bed strength of rigid granules. The gran-
ules were compressed with linear plate heads with a uniaxial compression tool. The
apparatus consisted of a top punch, bottom punch and a cylindrical die, with a diameter
of 19.5 mm, where the tested material was poured. The moving surfaces of the tool
were first sprayed with silicone and wiped to control wall friction. The mechanical yield
of the compression tool in the studied range up to 10 kN was negligible. A schematic
drawing of the method is shown in Fig. 13.
30 4π × [Area] / [Perimeter], unity resembling a perfect circle 31 Longest diameter / shortest diameter, unity resembling a perfect circle 32 the sum of the gray values of all the pixels in the selection divided by the number of pix-els 33 Dilation signifies the procedure in which a value of output pixel is changed to the maximum value of all the pixels in the input pixel's neighborhood.

59
Figure 13 Sketch of compression tool.
3.2.6 Electrical measurements
Electrical devices were used to quantify porosity in sintered aluminum oxide by an im-
pedance analyzer using a maximum-length binary sequence signal [II]; and to measure
electrical response of particulate suspension using a resonator [V].
3.2.6.1 Impedance spectroscope
The method for measuring porosity was based on the electric frequency-response
where the analyzed specimen was placed between capacitor plates so that it changed
the permittivity of the capacitor thus porosity changes in dielectric ceramics affecting
their relative permittivities changed the system's frequency response.
The system was built on National Instrument's PCI-6052E measurement card that was
used to send and measure an excitation and to receive the output signal. The system
consisted of a 1-MΩ resistor and a capacitor that formed a first-order low-pass-filter34,
whose output was buffered with an amplifier.
34 A low-pass filter is a filter that passes signals with a frequency lower than a certain cutoff frequency and attenuates signals with frequencies higher than the cutoff frequency.

60
The capacitor was designed to fit a 12 mm thick ceramic specimen between the 3x3
cm electrode areas on both side made of circuit board material. A ground plane on top
of the specimen and under the electrode area, on the other side of the capacitor plane,
made the total capacitance of the system to include that of the capacitor plus the con-
stant stray capacitances of the system.
The input signal was in the form of maximum frequency binary sequence [137] with a
length of 16,383-bit, having an amplitude of 1 V. The sampling rate was 100 kHz. The
input signal was injected into the system four times and a cross-correlation function
was used to compute the frequency response. To eliminate transience and reduce de-
viation in the measurements, the frequency response was calculated from the mean of
the last three of those signals and their responses. A schematic drawing of the method
is shown in Fig. 14.
Figure 14 Sketch of impedance analyzer.
3.2.6.2 Resonator
The method of measuring electrical response of a colloidal suspension was based on a
resonator that had an inductor (coil) - capacitor circuit i.e. LC-circuit that was made of a
7 μm thick etched aluminum pattern that was laminated between two 80 μm thick PET
films. The pattern included a rectangular coil with three turns and two rectangular 1 cm2
surfaces forming a parallel plate capacitor as the laminated film was folded in two and
glued together. The capacitance and the resonance frequency are sensitive to permit-

61
tivity changes making it possible to measure materials brought into close proximity of
the resonator.
To measure suspensions, the resonator circuit was embedded in the bottom of a glass
container and measured by a one-turn reader coil under the container. The reader coil
was connected to a measuring device with a coaxial cable and the measurement was
carried out with an in-house reader device that generated the excitation and reference
signals. The excitation signal was fed to the reader coil and compared against the ref-
erence. The resonator measured the magnitude ratio or gain/loss and the phase differ-
ence between two inputs yielding a resonance curve peaking at a frequency defined by:
the sensor material, design, and the surrounding materials (specimen). The permittivity
of the measured specimen altered the position and shape of the resonance curve. A
schematic drawing of the method is shown in Fig. 15.
The measurements were done by using a 2000-point frequency sweep, ranging from
70 MHz to 90 MHz, the sweep was repeated twice per second. By using this configura-
tion in the selected frequency range, it was possible to measure materials whose per-
mittivity ranged from air to water.
A feature extraction process was used to capture the essential information from the
measured gain response curves consisting of gain values at discrete frequencies. Pol-
ynomial regression was used to describe the shape of the curve in order to locate es-
sential areas linking the changes in the curve to characterized features. Two baseline
ripped features were extracted from a polynomial model: a frequency and a bandwidth
of a dip in the resonance curve. First feature was strongly affected by the relative per-
mittivity of the specimen and the other was linked with dielectric losses.
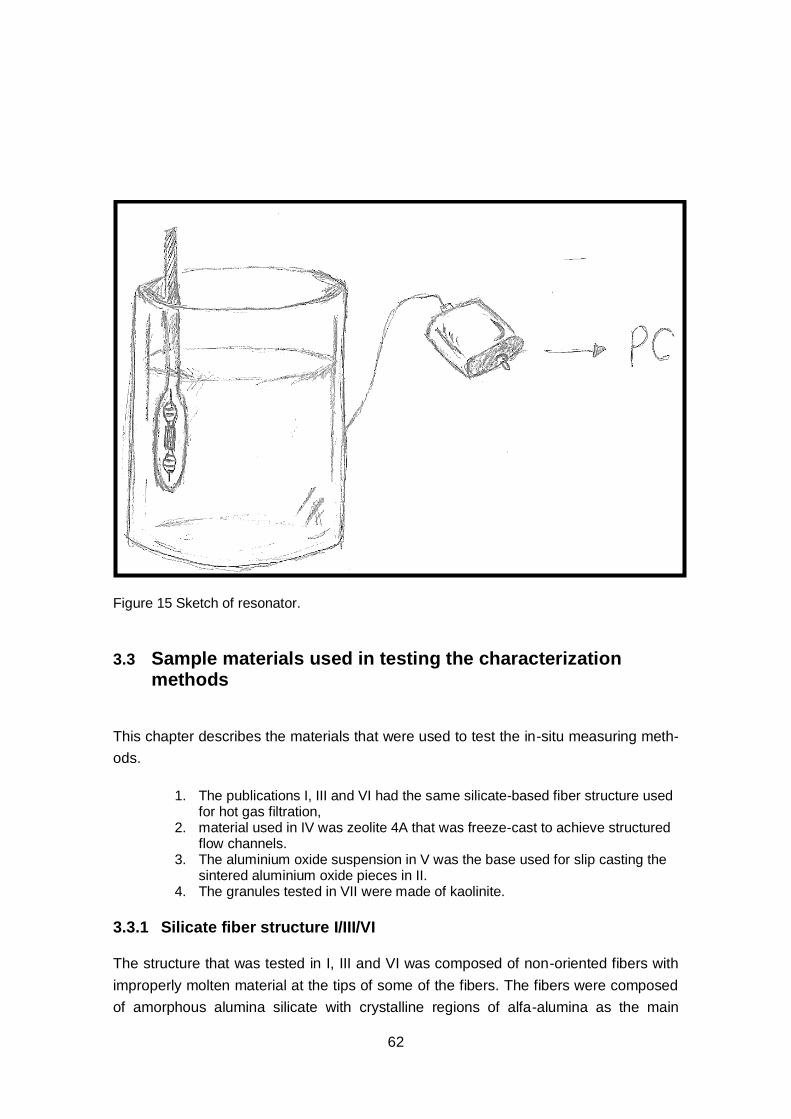
62
Figure 15 Sketch of resonator.
3.3 Sample materials used in testing the characterization methods
This chapter describes the materials that were used to test the in-situ measuring meth-
ods.
1. The publications I, III and VI had the same silicate-based fiber structure used for hot gas filtration,
2. material used in IV was zeolite 4A that was freeze-cast to achieve structured flow channels.
3. The aluminium oxide suspension in V was the base used for slip casting the sintered aluminium oxide pieces in II.
4. The granules tested in VII were made of kaolinite.
3.3.1 Silicate fiber structure I/III/VI
The structure that was tested in I, III and VI was composed of non-oriented fibers with
improperly molten material at the tips of some of the fibers. The fibers were composed
of amorphous alumina silicate with crystalline regions of alfa-alumina as the main

63
phase. Composition of the fibers given by a manufacturer, and supported by our analy-
sis, as 45–60 weight percent SiO2 and 40–55 weight percent Al2O3. The fibers were
bound together with silica. Fiber diameters varied at 1-10 um while the diameters of
improperly molten parts at the tips of the fibers varied from 10 um to 300 um. Fiber
lengths varied from 100 um to 800 um. Mean flow pore size and the average pore size
were both 4 um, indicating all the pores in the average range go through the structure.
The largest flow channel was 39 um in diameters, and open porosity was 80 percent.
Thermal diffusivity was 0.3 mm2/s.
A representative image of the structure can be seen in subsection 2.1.3.3.
3.3.2 Freeze-cast zeolite structure IV
Freeze-cast structures in IV were prepared at Stockholm University by Dr. Arto Ojuva
with a method presented in [138]. The area covered in this thesis was their compres-
sive strength and how it changed as a function of pore parameters which varied as the
cooling rate of the freeze casting apparatus was changed.
"Composite monoliths with a lamellar porous structure were prepared from aqueous
suspensions of zeolite A, bentonite and polyethylene glycol (PEG). The suspensions
were frozen unidirectionally, starting from the bottom of a cylindrical die that was set to
cool at a constant rate. After freezing, the ice was sublimed in a freeze-dryer and the
remaining compact powder body was thermally treated to obtain a mechanically strong
monolith with a continuous and directional porosity" [IV]
A representative image of the structure can be seen in subsection Porosity in porous
crystals.
3.3.3 Aluminium oxide suspension and sintered aluminium oxide V/II
In publications V and II aluminium oxide suspension (slurry) was prepared. In V its solid
and dispersing agent content was analyzed with a resonator. In II the suspension was
slip cast and then the cast pieces were sintered at different temperatures to gain vary-
ing pore structures to test an impedance analyzer.
3.3.3.1 Suspension
Suspensions were made of Al2O3 powder, deionized water, and dispersing agent. Dis-
persing agent was first mixed with water and then alumina powder was added to the
mixture in small increments. The alumina powder had a particle distribution between
0.1 um and 3 um. Suspension with discrete intervals of dispersing agent and particle

64
amount was tested. The final viscosity of the suspension measured at the shear rate of
10 1/s was 1.2 Pa s. The tested suspensions were shear thinning.
A representative image of the suspension preparation and online resonator measure-
ment can be seen in subsection Electical measurements.
3.3.3.2 Slip casting and sintering
The suspension for slip cast pieces was prepared as described above but after ho-
mogenizing the dispersing agent-aluminum oxide -suspension a binder was added to
increase pre-sintering strength of the component and polyethylene glycol was stirred
into the slip to increase processability. The prepared suspension was poured into a
gypsum mold, where the solids compacted to the mold walls as water was removed by
capillary action. The compacted pieces were dried before pre-processing after which
the pieces were sintered at different temperatures to gain varying pore structures.
A representative image of the structures after different sintering temperatures can be
seen in subsection Porosity in partially sintered ceramics.
3.3.4 Granulated kaolinite VII
In VII we tested a common industrially spray-dried granulated kaolinite powder that was
received in a non-sintered state and heat-treated in different temperatures to achieve
comparative test materials. Average size of the granules was close to 40 µm. Based on
image analysis granules above 45 µm were less round than granules below that but
both fractions appeared equally dense when examined from cross sectional cuts under
a scanning electron microscope.
A representative image of the studied granules can be seen in subsection Porosity in
partially sintered ceramics.

65
4 Comparative summary of the results of the articles
In the following, the results collated from the enclosed articles [I-VII] are presented from
two perspectives. The first section views the results as comparative value analysis of in
situ measurements by first making its way to each methods and then contrasting them,
as developed in the enclosed articles, with their laboratory counterparts. In other words,
the chapter is written from the practical angle to demonstrate the special capabilities
and uses of the new methods. The content of this chapter is visualized Diagram 13.
Although the articles contribute mostly to new applications in industrial characterization,
some fundamental discoveries were also made about pores, porosity, and their effects
on materials.35 They are discussed from the materials science perspective in section
4.2. on Pore and porosity related findings.
35 By accident.

66
Diagram 13: Comparative summary.
4.1 Development of in situ characterization methods
The main results in the enclosed articles, except [IV], were used for in situ analysis and
defined to analyze the properties of pores or pore-related functional features. The ob-
jective in [IV] was to understand the compressive strength of a porous structure with
well-defined pores. The task was carried out with an imaging method similar to that
used in [VII] with its attributes aimed at in situ.
The following summarizes the results of the enclosed articles one by one from the in-
dustrial angle. For coherent discussion, the summary is structured so that it first pre-
sents the relevance of each characterization method36 from the system approach an-
gle37 presented in Research Approach, then proceeds to the concrete aims of the
methods, and finally compares a laboratory relative to the industrialized method and
simultaneously introduces the novelties of the new methods. The next section focuses
on the contribution of the articles to materials science.
As discussed in chapter 1 (Lean, in situ measurements and this thesis), in situ charac-
terization must be
1. robust,
36 Note that understanding the relevance was part of the results. 37 Find a material parameter, determine the tracking and reference parameter, and design an industrial characterization method.

67
2. integrable/on site, 3. reliable, and 4. comprehensive.
These features are separately compared with a corresponding laboratory measurement.
In subsection 1.3.3. (Specific challenges and research questions in the thesis), the re-
search topics of each publication were described from the in situ perspective, as below
in table 2. Answers to the questions are individually given in the following subsections.
Table 2: In situ development aspects in the enclosed publications.
Sub-chapter Development aspect
4.1.1. Thermal flow
permeametry I/VI
Permeametry can be used to analyze local variation in a
sample, but it is very slow and difficult to integrate.
4.1.2. PRBS Porosity
analyzer II
Porosity measurement with the Archimedean method or in-
trusion porosimeter method is laborious and slow and does
not reveal closed porosity. A faster and integrated method is
needed.
4.1.3 Grit blaster for
fiber structure thermal
history III
Thermal history can be measured from a millimeter size
sample with a dilatometer, but hardly at all in local rigidiza-
tion in a large sample. A new in situ method is needed.
4.1.4 Automatic pore
parameter analyzer
IV/VII
Pore structure can be characterized from a microscope im-
age but for quantified data with samples with many pores,
analysis must be automated.
4.1.5. Non-contact sus-
pension analyzer V
Flocculation, especially in thick suspensions, must be meas-
ured with laboratory devices; long response time is not pos-
sible in lean production.
4.1.6. Granule strength
measurement VII
Single granule strength measurement is not feasi-
ble/possible. In industrial production, a robust, comprehen-
sive and rapid method is needed.
4.1.1 Thermal flow permeametry I/VI
Relevance
In our industrially funded project, fiber structures were previously analyzed by measur-
ing the total pressure drop over the structure, but it was soon discovered in [I] that the
structure had local variations in permeability, which affected flow properties through the
structure. Later, the mechanical properties were also found to differ locally [III], and

68
local variation in permeability was recognized as the most significant variable for a
tracking parameter for the outlined features.
Evidently, a permeameter could not be used to measure local permeability, because
measurement had to be carried out by blocking and unblocking the structure, which
would have been very laborious. The permeameter was chosen as a reference method,
and a thermal flow permeametry (TFP)38 was developed.
Aim
The focus of TFP was to locate a difference in local permeability in a structure with
permeating porosity. Articles [I, VI] showed that this can be done with the simple ap-
proach of measuring how a hot air flow heats the surface of a structure.
A particular difficulty in this case was that conduction through fiber and gas are equally
dominant in heat transfer [118]; however, we wanted to measure only conduction
through gas and thus link it with the permeability of the structure. We achieved this by
choosing the correct measuring parameters and assuring that conduction through fi-
bers could be ignored.
The method aimed at quick analysis of hot gas filter elements whose permeability was
not always even due to inexact manufacturing or patchy cleaning [139] during use.
Laboratory counterparts of the method
The method's closest laboratory counterparts are different permeameters, such as
those in [126]. The principle of permeameters is presented in subsection 2.4.2
(Permeability), but, in short, permeability is measured by drawing or pushing fluid
through a specimen while the pressure difference caused by the specimen at a specific
flow velocity is measured. If permeability is needed over a certain section of the speci-
men, the other areas must be blocked or a device such as the miniporopermeameter
[140] must be used.
In addition, extrusion porometers and intrusion porosimeters are sometimes used for
similar purposes, although they aim at quantifiable results with hundred-fold smaller
specimens.
38 A method called thermoporometry [161] should not be confused with TFP.

69
Comparison
The research problem and reason for developing TFP was that "permeametry can be
used to analyze local variation in a sample, but it is very slow and difficult to integrate."
The following compares the characteristics of TFP to its laboratory counterparts.
Robustness
A thermal image can be acquired from a distance, thus increasing work safety. This
does not need human involvement and no hazardous substances such as mercury.
The method is robust because it is simple and because it uses only a thermal camera
and hot air flow.
Integrability
Furthermore, the method is non-destructive in contrast to a mercury porosimeter or
extrusion porometry, which may require glue to clamp the sample. Moreover, methods
that use liquids cannot be used with certain specimens.
TFP is quick, though the intention in the articles was not to optimize time, it took only
40 seconds per measurement,39 which facilitates integration into a rapid production
process. Methods such as mercury porosimetry or extrusion porometer take several
minutes for measure a sample plus time to prepare it.
The method can be fully automated, and if hot air must anyway be pushed through the
structure,40 it can be synergistically implemented with production only by adding ther-
mal imaging to the process.
Reliability
Air, being a fluid used for measuring, gives more functional results in certain applica-
tions, such as hot gas filter elements. This is due to the specimen's possible reactions
with liquids, should they be used in the measurement.
Air pressure is the only variable in the process. Other than that, the method has no
consumable parts which increases its reliability.
39 This could be cut down even further if necessary. 40 For instance, to release the component from a mold.

70
Comprehensiveness
The method can measure large material volumes, as shown in our measurement, in
which we used over a 2-m tall component with an outer dimension of 0.15 m. In com-
parison, mercury porosimetry uses samples in a size range of one cubic centimeter.
[128]
The TFP method can locate differences in permeability in a single measurement
through the whole structure, whereas the conventional methods require multiple sam-
ple analyses or blocking of certain sample areas, and the miniporopermeameter is ca-
pable of characterizing only the surface.
4.1.2 PRBS Porosity analyzer II
Relevance
Heat treatment temperature and the duration of sintering together with the initial com-
position and grain size affect the evolution of the porosity of a structure, which in turn
affects the strength and functional properties of porous ceramics. Porosity is thus a
significant material parameter, but typical methods, such as Archimedean or mercury
methods, which use water buoyancy or liquid intrusion as the tracking parameter, are
not industrially feasible, though they could be used as a reference.
Electrical capacitance, a tracking parameter quicker and more non-destructive than the
above, was chosen, and an in situ method was developed to measure it.
Aim
In porosity analysis, the focus was to find an in situ method that could be used for non-
destructive analysis of the total porosity of a ceramic component. Article [II] shows how
an in-house built capacitive measuring device, which used a pseudo-random binary
sequence, could distinguish components whose total porosities were 3, 18, and 33 %.
During its development, the method had no dedicated application; it was developed in
general to analyze changes in porosity in different manufacturing steps, such as sinter-
ing, or to analyze the density of, e.g., mining filters.
Laboratory counterparts of the method
The method's closest laboratory counterpart is the Archimedean method, which was
used to certify the functionality of the electrical method. In addition, mercury porosime-

71
try is related but aims at more quantifiable results. Both related methods are presented
in subsection 2.4.1 Porosity and pore size distribution.
Comparison
Measuring porosity with the Archimedean method or the intrusion porosimeter is labo-
rious and slow and does not reveal closed porosity. Therefore, a faster and more inte-
grated method is necessary.
Robustness
Electrical sensors can be built on nearly any non-porous, electrically insulating material.
Only the electrodes must be exposed to the outside atmosphere.
Integrability
A specimen is measured by placing it between two electrode plates and measuring it
for a couple of seconds. The procedure can be automated and the plates integrated,
e.g., into the transfer clamps used to move the product. With a pseudo-random binary-
sequence signal, measurement can be done in a couple of seconds compared to a
regular frequency sweep, which can take minutes. This enables integrating the meas-
urement into rapid production flow.
Measuring porosity with the Archimedean method takes more than 30 hours according
to the standard in [134], with at least an hour of direct labor time, which renders the
method unsuitable for in situ measurement. Mercury porosimetry uses a toxic fluid and
applies high pressure to the specimen and thus cannot be considered an in situ meth-
od at all.
Reliability
Our method is currently in its early stages of development, but it is expected to meas-
ure the whole porosity by analyzing the total permeability of the sample. Air in the
pores lowers permeability, but also water may interact with the specimen. These ef-
fects can hopefully be counteracted in the future by changing the measuring frequen-
cies so that the specimen need not be dried and that the original specimen can be
measured without evacuation or submersion in liquid. However, [124] questions wheth-
er the mercury porosimeter measure the original structure or an altered sample that
may have been changed in preparation or during measurement. Furthermore, mercury
porosimetry calculations are based on cylindrical ideal pores, which commonly leads
to underestimation of pore size [141].

72
Comprehensiveness
Our method could give information of a 5 cm x 5 cm x 1 cm specimen and could prob-
ably be scaled to measure larger components. In contrast, mercury porosimetry is lim-
ited to a maximum of not more than about 1 square centimeter [141] specimen size.
4.1.3 Grit blaster for fiber structure thermal history III
Relevance
Fibrous structures, studied in [I, III, VI], are known to rigidize in use at high tempera-
tures. Regardless of the reason, rigidization limits the life time of fibrous structures, and
as it takes place locally and in seemingly random areas, a method was needed for in
situ analysis. We hypothesized that rigidization was caused by fibers sintering to each
other, and because of that material elasticity was chosen as the relevant characteristic
to be studied. Rigidization was studied by mechanical testing and resonant frequency
damping analysis but these techniques were not sensitive to rigidization. XRD could
show when amorphous fibers crystallized, but rigidization started before that. Finally,
grit blasting turned out to be sensitive to elasticity changes.
A grit blast, adjusted to break only fibers of low elasticity and thus cause deep dimples
in rigidized structures, was seen to link with the reference sample’s heat treatment
temperature and dilatometer measurement, which were chosen as reference meas-
urements. Dimple depth was chosen as the tracking parameter.
Aim
The grit blaster was designed to be a method that could easily be applied on site to
quickly scan a large area of a fiber structure to determine if it had sustained tempera-
tures beyond its thermal tolerance. The method was based on the idea that the rigidiza-
tion of a fiber network causes the same grit flow to create deep craters in a specimen
that had sustained high temperatures.
The method was needed for quick in situ analysis of hot gas filter elements, which had
to be changed at the end of their life cycle. Initially, the method had been used to ana-
lyze samples from a lot where changes signifying the end of an element's life time were
seen only in certain areas of the filter element, but which were impossible to detect with
methods that could analyze only a fraction of the total specimen volume.

73
Laboratory counterparts of the method
The closest laboratory counterpart was a dilatometer experiment, which I had also de-
veloped at TUT, and which could also estimate the highest temperature to which the
specimen had been subjected. A dilatometer measures the initiation point of sintering.
In the structure studied in [III], certain phase changes could also be used as internal
markers to indicate if a structure had been heated above a certain temperature, these
changes could be seen with x-ray diffraction.
Comparison
Thermal history can be measured from a millimeter size sample with a dilatometer, but
when local rigidization takes place in a large sample, it is almost impossible to measure
the history. Therefore, a new in situ method is necessary.
Robustness
The method used an industrial grade grit blaster and glass grit that was ejected with
compressed air, making the device applicable also at industrial atmosphere. A chal-
lenge with the test setup used in [III] was that the grit blaster could not provide a steady
grit flow for more than 5 seconds; thus we could not use a continuous grit flow for
measurement. This difficulty could have been avoided with a better feed system. In
addition, grit moisture was seen to affect flowability. Otherwise, the system was very
robust and applicable on site.
Integrability
The method was initially intended for an automated testing rig, where the grit blasting
erosion capability would have been adjusted to erode only a specimen with no life time
left. As such, it could be used in the plant for non-destructive analysis, but for now the
method is applicable for destructive lot sample testing on site. Compared to the dila-
tometer, this is still good progress, because the dilatometer had to be used in a labora-
tory and needed sample preparation.
Reliability
The reliability of this method was tested by heating a similar specimen at a different
temperature at 100-200 °C intervals from 400 °C up to 1050 °C. The specimens were
easily distinguishable as they showed a minimal variation in crater depth. Certain relia-
bility problems were encountered with a relatively inexpensive grit blaster, leading to an

74
unsteady grit flow during long blasting sessions. The problem was tackled by limiting
the blasts to five-second bursts.
Comprehensiveness
The method was developed primarily to increase the comprehensiveness of the test in
comparison to dilatometer measurement. In dilatometer measurement, a 20-mm, rod-
shaped sample was heated and cooled while following its length changes. Sample
preparation took about 15 minutes, and a single measurement 7 hours. In grit blasting,
no sample preparation was needed, and one measurement took 5 seconds, plus a
couple of seconds to measure the crater depth. Thus a whole 2-m filter element could
be tested in one axial direction, whereas with a dilatometer the measurement location
had to be guessed, based on how the element looked or felt.
4.1.4 Automatic pore parameter analyzer IV
Relevance
In [IV], it was discovered that with the same porosity, certain structures fabricated with
different parameters had markedly different strength. Closely studied, the structures
revealed that their pores differed in shape from that of the studied material parameter.
The tracking parameter was set as the pore aspect ratio and strength was used as ref-
erence. Pore properties had to be extracted from SEM images, a task beyond human
capability, so a method with in situ characteristics had to be engineered.
Aim
An in-house algorithm was used to analyze images in [IV]. Analysis was based on au-
tomatic segmentation, followed by feature extraction. This procedure was developed to
increase precision in images of hundreds of analyzed objects to obtain quantitative
results by feature analysis. In analytically more straightforward cases in [VI,VII], imageJ
[136] was used, but the zeolite structures in [IV] could not have been easily analyzed
without an adaptive filter and dedicated feature extraction, which are presented in [135].
Laboratory counterparts of the method
The only counterpart of image analysis is to measure features in images by hand,
which is impossible or at least cumbersome with images with many features. In [IV],
different pore size parameters were analyzed from samples, which had straight and
even capillaries; consequently, poro- and porosimeters can be considered counterparts
here, though the two approaches are basically different (as described in Characteriza-

75
tion of pores) when more heterogeneous structures are compared. Two-dimensional
image analysis should thus be viewed mostly as a method to analyze pore shape,
which we aimed to quantify.
Comparison
Pore structures can be characterized from a microscope image, but since in situ analy-
sis aims at quantified data, analysis must be automated.
Robustness
Images used for analysis were automatically preprocessed to enhance their contrast
via adaptive histogram equalization and to remove noise from the images. This method
had an adaptive algorithm, which allowed analysis of difficult images with changes in
contrast or intensity. In addition, supervised learning, a method that taught the algo-
rithm to spot interesting objects in an image, was used to further the applicability of the
method.
Integrability
Extracting features, such as pore dimensions or particle size, from a preprocessed and
segmented image yielded numerical results, which could be directly incorporated in the
work flow after image analysis.
Reliability
To assure the user of the results, the algorithm showed how it recognized pores. In fact,
when tested, the algorithm recognized pores more consistently than any human being.
Comprehensiveness
The method analyzes a whole set of multiple images at once and yields features such
as pore orientation or shape. Similar analysis cannot be carried out by hand.

76
4.1.5 Non-contact suspension analyzer V
Relevance
Colloidal particles are separated due to electrical fields around them. When particles
stick together, gravity causes sedimentation, and the suspension can no longer remain
homogenous. To study the homogeneity of a suspension, the solid content at the bot-
tom was chosen as the material parameters and tracked with changes in resonant fre-
quency, applied with an in-house built LC-circuit. The frequency was referenced with
the amount of added solids and viscosity of the suspension.
Aim
Suspension analysis aimed at in situ measurement of suspensions. Initially, this tech-
nique was tested by measuring the amount of aluminum oxide and dispersing agent in
an aqueous suspension to engineer a method that could be used, e.g., to detect ag-
glomeration or unattached dispersing agent molecules to improve slurry processes.
The first publication on the topic, [V], demonstrated how a feature calculated from a
resonance signal was linked with the amounts of dispersing agent and aluminum oxide
to yield an online method for measuring the relative amounts of both ingredients. If mul-
tiple measuring points could be fixed at different levels, the homogeneity of a suspen-
sion could be analyzed. One publication has been written in Finnish to describe and
market the idea [142].
Laboratory counterparts of the method
Suspensions are analyzed with functional and quantitative methods. Functional meth-
ods, such as rheometry, study the viscosity of a suspension and link it with solid con-
tent and suspension state. Other methods, such as turbidity meters, measure the sus-
pension's solid content usually through changes in the intensity of a light beam. These
methods do not focus on the charges on the surface of particles, whereas the zeta po-
tentiometer measures that by focusing on the difference in the electrical potential be-
tween a fluid and the electrical double layer surrounding a colloidal particle. However,
in [V], we may have linked some high frequency electrical phenomenon with the quanti-
ty of the examined species to electrically measure the percentile amount of aluminum
oxide or dispersing agent.
Comparison
Flocculation, especially in thick suspensions, must be measured with laboratory devic-
es; however, long response time is not possible in lean production.

77
Robustness
Measurement was arranged in a non-contact manner so that an electrode used was
embedded inside the suspension vessel, and so that it could be read through the ves-
sel chassis from outside. We did not need to touch or disturb the process in any way,
which helped maintain sensor integrity.
Integrability
A measurement arranged in a non-contact manner and read through a non-conductive
material can be easily integrated. Raw data can be analyzed using an algorithm to ex-
tract features and thus to automate measurement and give it boundaries to determine
the preferred state of the suspension.
Reliability
The reliability of the method is seen in [V] when reference measurements with isopro-
panol were made between each measurement. The measurement could be easily re-
peated. However, long-term contamination or colloid agglomeration on the electrode
may cause difficulty.
Comprehensiveness
The method can be directly incorporated in a suspension vessel, obviating thus lot
sampling, which might alter the suspension. The measurement gives readings only of
the vicinity of the electrode, but multiple electrodes can be placed in various parts of
the container to determine the homogeneity of the suspension.
4.1.6 Granule strength measurement VII
Relevance
Powders are granulated for numerous reasons, and one important feature of a granule
is its durability in the intended use. Granules have usually plastic binders, which alter
their behavior from rigid granules studied in [VII]. Granules are studied in situ with
methods that focus mainly on flowability [143], shape, or size. Yet granule strength is
one important measure that can be studied by compressing a single granule. This does
not give a very comprehensive picture of how granules behave, nor is it possible with
small granules. Therefore, the compressive strength of a bed of granules was chosen
as the tracking parameter, linked with the breakage of individual granules and using
particle size and SEM images for reference.

78
Aim
In [VII], an in situ measurement method was refined for further semi-automatization for
the bed strength of rigid granules. A large amount of granules was compressed with a
piston to gain a curve that, when examined in a half-logarithmic plot, showed certain
areas linked with granule rearrangement, breakage, and rearrangement of primary par-
ticles.
Laboratory counterparts of the method
Granule strength is studied mainly by individually compressing granules [144], and
studies on bed compression have been limited to non-rigid granules [145]. In situ stud-
ies of granule strength focus on process-relevant dynamic testing methods [143]; thus
their closest counterpart is single granule compression.
Comparison
The strength of a single granule cannot be measured. In industrial production, a robust,
comprehensive, and rapid method is thus necessary.
Robustness
The method uses a simple piston-cylinder tool, which can be inserted in any material
testing device. Interpretation of the results ignores any noise caused by the alignment
or wear of the measuring tool.
Integrability
The compression procedure could be automated and integrated into a granulation unit.
In addition, analysis of the compression curve can be automated with tangential fitting
(presented in [146]).
Reliability
The reliability of the method was addressed in [VII] by measuring the observational
error as 0.5 MPa for compression granulated kaolinite powder with an average strength
of 3.3 MPa. The measured bed strength was affected by granule shape, size, and den-
sity; consequently, whenever the strength must be changed, measurements should be
accompanied by other type of analysis, e.g., SEM.

79
Comprehensiveness
Granules are normally produced by the kilo or ton, and measurement is tailored to ap-
proximately 1 gram of granulated powder, which is a lot type measurement. However,
in comparison to crushing one granule under a microscope, the method can be used
with a robust compression tool, whereby crushing a gram of micron-size granules easi-
ly adds up to crushing millions of granules at a time.
4.2 Pore- and porosity-related findings
An added contribution to materials science is provided in articles [II-V; VII] (as [I; VI] are
purely application oriented). Their contribution is basically related to pores, porosity,
and their affect.
In 1.3.3 (Specific challenges and research questions in the thesis), each publication
topic was introduced in terms of research and described as below. The questions are
individually addressed in the following subsections, which are organized first to sum-
marize and then discuss each result.
Table 3 Sections and research aspects.
Section Research aspect
4.2.1. Reaction of interfaces to
electrical signals II/V
Is it possible to nondestructively measure the po-
rosity of a ceramic sample?
Can the flocculation of a suspension be measured
during its preparation?
4.2.2. Fiber-free length III How can the rigidization of a fiber structure be
linked with the structure's thermal history
4.2.3. Effect of pore parameters
on compression strength IV
What is the link between a structure's pore param-
eters and its crushing strength?
4.2.4 Strength of rigid granules
VII
Can granule strength be measured from a granule
bed instead of measuring a single granule?
4.2.1 Reaction of interfaces to electrical signals II/V
Results of capacitive porosity measurements
Publication [II] focused on using a frequency-response method with a capacitor-type
measuring device. Sintered aluminum oxide plates were placed in the electric field of a

80
capacitor so that the electrical permittivity of the plates affected the capacitance of the
measuring device. The plates were fabricated with an identical slip casting process, but
when sintering temperature was altered, changes appeared in the measured capaci-
tance, this was linked with the amount of total porosity measured with on the Archime-
dean principle.
Discussion of capacitive porosity measurements
From the correlation between porosity and capacitance, we deduced that with alumina
samples sintered at a low temperature capacitance dropped because of increasing
porosity. This indicated that the dielectric constant of the measured sample was affect-
ed by the volume average of the dielectric constants of the materials between the ca-
pacitor plates. In alumina samples with low porosity, a high volume of empty space, i.e.,
pores, containing air lowered the dielectric constant.
Results of resonance-based suspension measurements
Publication [V] focused on using a resonance-based sensor to study the solid content
and the content of dispersing agent in a traditional aqueous suspension. Results show
that the place of the dip in the resonator gain-frequency curve was dominated by the
amount of alumina particles in the suspension, whereas its width was dominated by the
amount of steric dispersing agent. This result was assumed to derive from resonating
ions.
Discussion of resonance-based suspension measurements
In simple terms, the suspension double layer presumably resonates with a high-
frequency electrical field, and the resonance frequency changes with the local amount
of net charge, i.e., the amount of particle surface near the electric field used to probe
the suspension. In detail, the electrical charges of a suspension depend on how parti-
cles and the double layer surrounding them are affected by the balancing ions from the
suspending liquid. Present models and theories also acknowledge non-equilibrium re-
actions affecting the charging and the counter-ions added by the particles and point out
that time-dependent relaxation may be seen with high frequency electric fields. [147]
4.2.2 Fiber-free length III
Results
Publication [III] sought to determine the mechanical characteristics that are linked with
the effect of temperatures lower than those causing crystallization on a fibrous alumi-

81
num silicate structure. This was earlier linked with material phase changes [148], [149],
which could be analyzed by measuring the crystalline structure of material. Methods
that were used to collate a specimen by its mechanical characteristics when heat-
treated at different temperatures were resonant frequency damping analysis, c-ring
compression, and grit blasting. The first two turned out insensitive to the heat treatment
temperature, but grit blasting was highly sensitive with a low deviation in reference
samples. When grit was blasted with identical parameters, the dimple became deeper
at high treatment temperatures.
Discussion
The study of fiber networks in this thesis was confined to creating a mechanical method
for detecting changes in fiber-free length, which was further hypothesized to be linked
with thermal history and presumed to be caused by fibers sintering to each other. The
hypothesis was that the number of contact points increased, which was seen as rigidi-
zation of the fibrous structure, which the mesomechanic model [108, p. 32] explains by
bonds in a single fiber reinforcing and stiffening the structure.
4.2.3 Effect of pore parameters on compression strength IV
Results
Publication [IV] focused on finding a relationship between the pore characteristics and
compressive strength of a structure with oriented porosity. Pore diameters and shapes
of different types were characterized with a microscope, and an adaptive image analy-
sis algorithm and the results were used to explain the changes in the compressive
strengths of corresponding structures. A buckling model predicted reasonably well the
evolution of compressive strength with changing pore parameters.
Discussion
Though all the tested structures were rigid, buckling may have been possible because
the cell wall was much longer than its thickness, and because it was not well supported.
Consequently, the cellular solid approach with buckling behavior in [IV] could be mod-
eled on the Euler principle [150, pp. 635–636] adapted from [96].

82
4.2.4 Strength of rigid granules VII
Results
Publication [VII] studied if the bed compressive strength of micron size and rigid ceram-
ic granules could be derived from load-displacement measurement in cylindrical uniax-
ial compression. This was found to be possible when the load displacement curve was
first converted to pressure-relative density, and when pressure was presented on a
logarithmic scale to highlight regions in the curve. The compression curve had the
highest curvature in the region where the granules broke. Granule breakage was in-
spected with particle size measurement before and after passing the region and by
inspecting microscope images before and after the region.
Discussion
Similar regional behavior as predicted by theory in subsection 2.2.3. (Strength of a
granular bed under compression) was seen in the pressure-relative density curve, indi-
cating that uniaxial compression can be applied to rigid and small granules. A method,
using linear fitting and suggested in [VII], shows approximated bed crushing strength
and can be used as a qualitative characteristic for granule strength. Though we must
keep in mind that in reality granules do not yield to a singular stress but to a stress
span dictated by the uneven stress distribution in the granule bed during the compres-
sion. Stress distribution is affected by range of granule size, shape and strength of in-
dividual granules.

83
5 Conclusions: in situ measurement of pore-related characteristics
This chapter concludes the introduction to this thesis. The first section concludes in situ
development, and the next one continues with a materials science perspective on the
pore and porosity related part covered by the research linked with this thesis. The sub-
sections answer the research questions and give recommendations for further research.
The chapter ends with a final executive summary of the whole introduction.
The thesis features 14 diagrams from the empty Diagram 1 with all the topics to be
covered and then filling the empty domains with topical diagrams 2-13. All these dia-
grams are collated in Diagram 14 on the next spread.

84
Diagram 14: All diagrams.

85
86
5.1 In situ measurements with a systematic approach
In situ measurement is sought for lean production. The first subsection concludes the
systematic approach to in situ measurement and answers research question 1a: “Can
material characterization be systematically tailored for in situ measurement?” Subsec-
tion 5.1.1 (Systematic approach to making a characterization method in situ) collates
and grades the in situ methods developed in this thesis. Subsection 5.1.2 (Observa-
tions of the in situ methods in publications I-VII) suggests how the methods here could
be further developed for use in a process environment and points out the common
characteristics of the methods’ attributes and maturity. The last subsection collates and
generalizes the characteristics of the presented in situ methods and answers research
question 1b: "How do the robustness, integrability, reliability, and comprehensiveness
of in situ measurement devices affect the route from design table to use in processes?”
The following subsections are limited to examining the applicability of the methods in
general, though equally important is to understand where process control can be as-
sisted with in situ measurements. According to [17], many PAT (in situ) techniques are
used in R&D to help understand and perhaps scale up a production process. Such as-
sistance is necessary in relatively new processes, whereas in older and better under-
stood processes in situ measurements can help optimize and automatically control
them. An added incentive for in situ measurements may also come from certain regula-
tory authorities that are actively monitoring some processes [18].
5.1.1 Systematic approach to developing an in situ characterization method
A systematic approach used in developing in situ methods was described in subsection
1.3.4. (Research Approach). The following table summarizes the approach and gives a
concrete example of the development steps taken in V (non-contact suspension ana-
lyzer).

87
Table 4 Summary and example of the systematic approach.
Steps in developing an in situ
characterization method Example from a publication
A manufacture process is studied
from a material perspective and the
most significant material properties of
the process are pointed out.
The homogeneity of a ceramic product is dom-
inated by its suspension stability. Stability is
determined by interfacial electrical charges.
Unstable suspensions flocculate and cause
sedimentation. A sedimented suspension has
more solids on the bottom. Materials parame-
ter: solid content on bottom in comparison to
that on the surface.
Proper tracking parameter(s) are
chosen for property(ies).
A solid content can be tracked online with a
resonator, which interacts probably with the
surface charges of colloidal particles. This in-
teraction affects resonant frequency, which
was chosen as the tracking parameter.
The most suitable characterization
method is chosen for the tracking
parameter.
The local resonant frequency of a suspension
can be measured with an LC-circuit that is
design to probe a limited volume of material
surrounding it.
A new method, better suited for fol-
lowing the tracking parameter and
capable of in online measurement of
a large sample area in an industrial
environment, is developed. The new
method ignores irrelevant properties.
An LC-resonator with a sensor that can be
inserted in a suspension is designed with a
view to its usability in a production facility at-
mosphere. Resonant frequency features are
studied and a certain change in the frequency
curve is linked with a local solid content.
The method’s functionality is ensured
by comparing measured changes in
the tracking parameter with the exist-
ing method.
Other parameters linked with solid content are
suspension viscosity and simply the amount of
solids added in the suspension. Electrical
measurement is tested and adjusted in labora-
tory to correlate results with viscosity and
amount of solids.
The new method is integrated into the
industrial process.
The integration of the measuring device is dis-
cussed in [142].

88
The same approach was used to develop all the devices. It proved applicable to the
task giving a positive answer to the research question 1a. In addition it shows a one
possible approach to others who strive to develop similar in situ measurements.
5.1.2 Observations of the in situ methods in publications I-VII
Chapter I explained how industrial production facilities benefit from in-situ methods
featuring robustness, integrability, reliability, and comprehensiveness. In section IV, I
presented six methods, developed at TUT in cooperation with other researchers, which
exhibit these features in different degrees. The following Table 1 lists the methods and
compares their features to the features of the devices that are currently used for the
same task. The comparison intends to show the success of the development of the
methods, disclose their current state of development, and point the way to their contin-
ued integration, the topic of the next subsection.

89
Table 5 Comparison of in-situ methods. Methods are evaluated from 1-3 (bullets, 3 being the highest grade) on four different attributes. Type & Route columns are highlighted in red, yellow (italics), or green (bold) according to the readi-ness of the device for in situ measurements in an industrial process.
In-situ features
robust-ness
integra-ble
reliable compre-hensive
TYPE Route
I/VI Thermal
Flow Perme-ametry
Continu-ous non-intrusive,
online
Direct integ-ration
II PRBS
Porosity analyzer
Discrete, online
Increase robust.,
Lab testing
III blaster
for fiber thermal history
Discrete, near
produc-tion
Increase reliability
IV Auto pore
parame-ter ana-
lyzer
Discrete, on
product lab
Increase integrability, direct integrat.
V Non-
contact suspen-
sion analyzer
Continu-ous, non-intrusive
online
Increase reliability,
direct integrat.
VII Granule strength measument
Discrete, near
produc-tion
Increase robust.
and reliability
lab testing
5.1.3 Route from laboratory to process
This subsection discusses the choice of the best route for in situ devices from laborato-
ry testing to process. The route begins with a systematic approach to developing a
method and continues to, and later depends on, the method’s balance between robust-
ness, integrability, reliability, and comprehensiveness.

90
5.1.3.1 Route of an in situ device from design to use in processes
This thesis is mostly limited to the development steps of new in situ methods, but the
different integration routes of the methods are compared in the following for future ref-
erence (the reader is referred to "Table 2: Comparison of in-situ methods"):
I/VI: the method is the most comprehensive on the list for quickly measuring a whole product, and it can be easily integrated to its intended use41. Its reliabil-ity is high with a direct route to process integration. The challenge in integra-tion is clear presentation of data and setting acceptable quality limits, which must be carried out at the production plant.
II: compared to existing methods, the porosity analyzer is comprehensive. In its intended use, it can scan a whole product but has problems with integrabil-ity issues coming from the shape limits of the measured pieces42. The system is also quite delicate. For production use, the device must be more robust in mechanical design and its integration must be dealt with. The route is to in-crease its robustness, develop a systematic way of contact with the meas-ured product, and then in the production facility laboratory, test the system in a simulated process environment. It would also help to directly link the cut-off frequency with the measured sample's dielectric constant and to understand the interfacial effect of water on measurement.
III: The grit blaster is a robust tool with no special attention necessary in use. Because it is a destructive method, it is clearly not an online tool, but it can be used next to a production line. However, it has some reliability issues with uneven grit flow and with erosion of the measured structure, which in long term use must be examined for variables other than temperature. Its route to a production line needs laboratory testing for an even grit flow and clarifica-tion of the erosion process. After that, it can be quickly applied on a produc-tion line.
IV: From the method's perspective, the auto pore parameter analyzer is com-prehensive, as it analyzes a whole microscope image at a time. Its reliability has also been found to be high. It is difficult to integrate into a production pro-cess, but in production laboratories, it makes the work flow leaner, especially because it is robust with its self-adaptive algorithm taking care of, e.g., varia-tions in contrast. The route to its in situ use is to hone its user interface for easy introduction to the personnel.
V: The suspension analyzer is a robust and integrable device. The sensor can be directly implanted in a process stream, or it can be used to measure through a container. Its reliability, however, is an issue, since its long-term use may cause dirt to accumulate on the sensors or the container wall. An-other issue is that the processes and the measured quantity are not well un-
41 Hot air is anyway ejected through the structure during manufacturing. 42 The contact between the measuring electrode and the measured product affects meas-urement results.

91
derstood. Its comprehensiveness depends on how many sensors are used at a time. Its route is to increase reliability in direct production line testing and scouting for phenomena that affect the electrical response of the suspension. Research is also needed to understand the reason behind the changes in resonant frequency when particles with surface charges or ions are added in the suspension.
VII: The granule bed strength device is a destructive tool that can be used next to a production line. It is semiautomated, and effort has been made to automate the compression curve analysis. In contrast to measuring one granule at a time, it is quite comprehensive, measuring a statistically signifi-cant number of granules. Its reliability is quite good, but some of its compo-nents depend on the user. Its route to production is to automate it further and build a working user interface to increase its robustness and reliability. The method has been used in [151].
The next subsection concludes on the importance of the different characteristics based
on six case examples.
5.1.4 Importance of the characteristics of in situ measurement
In-situ measurement has clear benefits in industry: faster reaction times yield savings
in sample preparation, transport, and analysis. Integrated characterization also links
with the lean principle of minimizing non-value adding tasks and finding the root causes
for process phenomena. The latter means that a direct measurement reveals the pro-
cess in more detail43, helps understand it more deeply, improves product quality, con-
sistency, and process efficiency, which all contribute to less process waste.
Yet benefits must exceed risks for the industrial partners to be interested in them. Risks
come from investing in a new characterization method that has purchase, installation,
and service costs. To minimize these risks, the route and the way the system is com-
bined with an in situ device must be aligned with the state of maturity of the device. To
answer research question 1b, the following list acknowledges that in situ methods con-
tain to a degree the following attributes, which affect their development route in the
following manner:
Robustness. Robustness of devices is a key issue when the device is in-stalled in production. High robustness results in no need of special attention paid to the surroundings and to the safety/use training of personnel. Instead, highly robust devices can be straightforwardly incorporated in the process.
43 For example, controlling a process based on time or temperature relies on historical data, whereas direct measurement of a process state takes into account variations in the process.

92
Robust devices need less protection when brought near a process. The need, of course, varies with the severity of the production atmosphere
Integrability issues determine if the method can be used online or at-line and also interfere with the compatibility of process control and the way data out-put is handled and results presented. It is also linked with the ease of installa-tion. High integrability devices can work online naturally as part of the pro-cess44.
Reliability is divided into the reliability of the device itself—can it measure what it is supposed to measure—and the reliability of the results: does it measure what it is intended for. This means that the measurement uses a frequency high enough to measure changes, but also that the measured quantity and its relation to the process state is well-understood. Normal fluc-tuation can thus be distinguished from real changes in the process. In addi-tion, the deterioration of the device and how that affects the measurement must also be understood. If reliability is good, the technique can be integrated with process control, depending on integrability.
Comprehensiveness is a key to lean production. It is gained by measuring only the necessary information but measuring it on a scale large enough to truly represent the chosen product state variable45. It also means that the time-scale of the measured changes is smaller than the measurement fre-quency so that changes can be detected. The aim is to measure the whole production volume, though compromises may have to be made.
5.2 Theoretical implications about pore and porosity related findings
This thesis contributes mostly to the far end of applications, but section 4.2. (Pore- and
porosity-related findings) presented some findings on a more scientific paradigm.
In short, besides mechanical properties, pores and porosity affect many functional
properties of a structure and their effects, whether on a manufacturing state or a com-
plete product, must be well understood through characterization. Characterization is a
demanding task, and linking whatever is defined as a pore with the functional features
of the structure is a complex matter. Yet it can be greatly simplified with methods that
focus on the functional definitions of the structure. To do that, one must understand
what to look for with the functionality created with a porous structure. Even with proper
44 Less integrability means in situ devices that can only work near a production line, e.g., measuring a production side stream. 45 In some situations, the process has been instrumented with a device that measures too small a volume to represent variations in the whole product.

93
methods, local characterization challenges may arise from the homogenization of the
structure, because measuring a relatively small volume of the whole can lead to mis-
judging the real variation, which can later result in inferior products.
With the above boundary conditions, the answer to research question 2 “can porosity,
pores, and changes in them that affect the functionality and mechanical properties of
structured materials be analyzed in situ?” is positive, because the result with all the
developed in situ devices were successful.
The following briefly concludes the findings on pore and porosity and gives recommen-
dations for further research on the topics.
5.2.1 Conclusions about the reaction of interfaces with electrical signals II/V
Both of the following cases are important mostly for the manufacturing and quality as-
surance of porous materials.
An impedance analyzer, capable of distinguishing between aluminium oxide plates
with different porosity, was developed in [II]. The reason for the correlation between
impedance and porosity was not studied, but probably the amount of pore interface or
simply the different ratio of air and aluminium oxide affected the permeability of the
plates. Our further studies, yet to be published, report how minute amounts of moisture
can cause what we believe is a form of MWS polarization [152]. This finding may be
used to analyze the amount of effective surface area.
A Resonator, whose capacitance was sensitive to changes in permittivity in the sur-
rounding environment, was used in [V]. Changing permittivity changed the position and
shape of the resonance curve, and the changes were clearly linked with the number of
dispersing agent molecules and aluminium oxide particles. An electric field with a fre-
quency close to 8 *107 Hz seemed to interact with the substances and possibly make
them resonate in some mode to affect dielectric losses in the resonator. Interestingly,
this frequency occurred at the far end of the molecular polarization frequency [153, p.
8], leaving a question open as to whether the connection between polar dispersing
agent molecules and aluminium oxide particles could be monitored as a change in res-
onation frequency. This is definitely an interesting topic for future research.
5.2.2 Conclusions about fiber structure studies III
Fiber-free length refers to fiber mechanics, and we offered it to explain why thermal
treatment rigidifies a fiber network. To continue modeling this (not included in the the-

94
sis), the degree of contact between fibers or a relative bonded area could be stochasti-
cally calculated by determining the network’s porosity [154] or by applying image anal-
ysis to fiber cross-sections [155]. Fiber networks could also be schematically modeled
[154] or studied by computer simulation [156]. Results thereof could directly help opti-
mize the binder used in fibrous structures, but they could also help understand the
origin of the mechanical strength of fibrous networks.
Flow in a fiber network. An interesting further research angle that has only recently
been brought up with the development of computer sciences is the modeling of fluid
flow in complex pore structures. It has been studied by modeling an imaged microstruc-
ture [110] and by artificially generating non-isotropic fiber networks with the finite ele-
ment method [111]. The random structure of a fibrous hot gas filter element provides a
truly challenging study, but it could also be used to optimize flow channels by studying
how the structure changes when the fibers are oriented or changed in size.
5.2.3 Conclusions about the effect of pore parameters on the compres-sion strength of oriented cellular structures IV
The buckling of rigid structures is not an undisputed idea but may be possible especial-
ly on the micron scale. The structure under compression in [IV] consisted of struts that
were only a few microns thick but whose length may reach millimeters and be support-
ed by vertical beams, which also formed due to ice templating. An added incentive to
modeling the behavior of oriented cellular structures is to use digital microstructure
models [157], which until very recently have been limited by imaging resolution and
computational challenges. Our 2d-pore parameter algorithm showed that the pore as-
pect ratio was in this case the parameter that best linked with compressive strength. I
assume that this was due to the aspect ratio changing systematically with the increas-
ing number of support struts, which added to compressive strength.
5.2.4 Conclusions about the strength of rigid granules VII
Optimizing granule production aims to understand the production parameters that af-
fect characteristics such as the compressive strength, shape, and size of granules. The
granules studied in [VII] varied in their characteristics, necessitating measurement of a
representative number of granules. The publication focused mostly on compressive
analysis of multiple granules, moving towards analysis of the compression curve,
where the average compressive force was located based on changes in the compres-
sion rate of the curve. The curve was analyzed semi-automatically on a half-logarithmic
scale, and a correlation with the sintering temperature and a chosen feature in the
curve suggested that the feature could be used to indicate comparative compression

95
strength. The novelty here was that our research proved that analysis could be done
with small and brittle granules. However, parameters such as granule shape and size
affect the feature so that the method may not function universally. Finding means to
calculate the derivate of the compression pressure-relative density curve might help
discover a more precise feature and set research towards automated data analytics.
5.3 Summary
This introduction presented seven peer reviewed articles focused mainly on novel
characterization methods to analyze pores [IV], porosity [II], and the effect of pores on
mechanical parameters [III, IV, VII] and permeability [I, VI], and to characterize the evo-
lution of material parameters in the manufacture of porous materials [V, VII]. Fig. 16
shows the different pore structures of the materials used in the case studies.
The viewpoint of the introduction was written from in situ characterization. In situ
measurement was defined as something that could be carried out in-line, online, or at
least on a production site. The choice of the viewpoint was clear, since all the charac-
terization methods aimed at robust and comprehensive industrial measurement in ex-
change for precise and meticulous laboratory analysis. The pharmaceutical industry
was the first to see the need for in situ measurements, but it has been argued that as
production goes lean, the accompanying straightforward process control requires nec-
essarily robust, integrable, reliable, and comprehensive in situ measurement and pro-
cess sensoring. Fig. 16 shows the developed in situ methods.

96
Figure 16: Sample materials and in situ methods.
The methods were developed systematically in steps that started from understanding
the material parameters linked with the quality of the process and finding a parameter
to track it. The parameter had to be such that it could be measured in situ. The same
approach was used to develop all the methods, proving that it was applicable to the
development task. The methods reached varying states of maturity as to robustness,
integratability, reliability, and comprehensiveness, which determined the way to inte-
grate and use measurements. In total, the development task was an interdisciplinary
mission, covering such matters as process control issues, materials science, and au-
tomation.
The methods presented in the enclosed publications were developed with industrial
partners for a particular task, but they can all be extended to characterize the local
permeability and mechanical properties of fibrous structures, the colloidal state of sus-
pensions, the porosity of consolidated materials, to automatically define a pore pa-
rameter in 2d-images, and to measure the strength of rigid granules. Some fundamen-
tal ideas in materials science were also covered, such as the connection between fiber-
free length and the rigidity of a fibrous structure, interface reactions of materials and

97
electrical signals, a link between pore parameters, and compressive strength in orient-
ed structures.
I believe that the methods here are now at a stage in which industrial partners are nec-
essary for their further development and validation. Thus I end this summary with a
challenge for industry to continue building the characterization methods and this ideol-
ogy with us. I believe that, especially with smart sensors, lean, and industrial internet, a
change in paradigm from industrial laboratory analysis to in situ measurement is virtual-
ly inevitable.

98
References
[1] S.-L. Jämsä-Jounela, “Future trends in process automation,” Annual Reviews in Control, vol. 31, no. 2, pp. 211–220, 2007.
[2] T. Samad, P. McLaughlin, and J. Lu, “System architecture for process automation: Review and trends,” Journal of Process Control, vol. 17, no. 3, pp. 191–201, 2007.
[3] M. Kurdve, M. Zackrisson, M. Wiktorsson, and U. Harlin, “Lean and green integration into production system models - experiences from Swedish industry,” Journal of Cleaner Production, vol. 85, pp. 180–190, 2014.
[4] The National Institute of Standards and Technology (NIST), “Lean and Continuous Improvement,” Services and Initiatives. [Online]. Available:
http://www.nist.gov/mep/services/continuous-improvement/index.cfm. [Accessed: 26-Jun-2015].
[5] T. Melton, “The Benefits of Lean Manufacturing,” Chemical Engineering Research and Design, vol. 83, no. 6, pp. 662–673, 2005.
[6] J. A. Garza-Reyes, “Lean and green – a systematic review of the state of the art literature,” Journal of Cleaner Production, vol. 102, pp. 18–29, 2015.
[7] M. Holweg, “The genealogy of lean production,” Journal of Operations Management, vol. 25, no. 2, pp. 420–437, 2007.
[8] P. Forrester, U. Shimizu, H. Soriano-Meier, J. Garza-Reyes, and L. Basso, “Lean production, market share and value creation in the agricultural machinery sector in Brazil,” Journal of Manufacturing Technology Management, vol. 21, no. 7, pp. 853–871, 2010.
[9] P. J. Martínez-Jurado and J. Moyano-Fuentes, “Lean Management, Supply Chain Management and Sustainability: A Literature Review,” Journal of Cleaner Production, vol. 85, pp. 134–150, 2013.
[10] P. Hines, M. Holweg, and N. Rich, Learning to evolve: A review of contemporary lean thinking, vol. 24, no. 10. 2004.
[11] J. Ben Naylor, M. Naim, and D. Berry, “Leagility: integrating the lean and agile manufacturing in the total supply chain,” International Journal of Production Economics, vol. 62, pp. 107–118, 1999.
[12] J. Riezebos, W. Klingenberg, and C. Hicks, “Lean Production and information technology: Connection or contradiction?,” Computers in Industry, vol. 60, no. 4,
pp. 237–247, 2009. [13] R. Sundar, a. N. Balaji, and R. M. S. Kumar, “A Review on Lean Manufacturing
Implementation Techniques,” Procedia Engineering, vol. 97, pp. 1875–1885,
2014. [14] P. Kadlec, R. Grbić, and B. Gabrys, “Review of adaptation mechanisms for data-
driven soft sensors,” Computers and Chemical Engineering, vol. 35, no. 1, pp. 1–24, 2011.
[15] T. S. Schei, “On-line estimation for process control and optimization applications,” Journal of Process Control, vol. 18, no. 9, pp. 821–828, 2008.
[16] A. Chanda, A. M. Daly, D. a. Foley, M. a. LaPack, S. Mukherjee, J. D. Orr, G. L. Reid, D. R. Thompson, and H. W. Ward, “Industry Perspectives on Process Analytical Technology: Tools and Applications in API Development,” Organic Process Research & Development, 2014.
[17] L. L. Simon, H. Pataki, G. Marosi, F. Meemken, K. Hungerbu, A. Baiker, S. Tummala, B. Glennon, M. Kuentz, G. Steele, H. J. M. Kramer, J. W. Rydzak, Z.

99
Chen, J. Morris, F. Kjell, R. Singh, K. V Gernaey, M. Louhi-kultanen, J. O. Reilly, N. Sandler, O. Antikainen, J. Yliruusi, P. Frohberg, J. Ulrich, R. D. Braatz, T. Leyssens, M. Von Stosch, R. Oliveira, R. B. H. Tan, H. Wu, M. Khan, D. O. Grady, A. Pandey, R. Westra, E. Delle-case, and D. Pape, “Assessment of Recent Process Analytical Technology (PAT) Trends: A Multiauthor Review,” Organic Process Research & Development, vol. 19, pp. 3–62, 2015.
[18] L. L. Simon, “2014: The PAT Trend Is Still Bullish,” Organic Process Research & Development, vol. 19, no. 1, pp. 1–2, 2015.
[19] F. Sistare, L. Pierre Berry, and C. . Mojica, “Process analytical technology: An investment in process knowledge,” Organic Process Research & Development, vol. 9, no. 38, 2005.
[20] T. Lopez, “Robust Dynamic State Estimation of Nonlinear Plants,” AlChE Journal,
vol. 45, no. 1, 1999. [21] T. Närvänen, K. Seppälä, O. Antikainen, and J. Yliruusi, “A new rapid on-line
imaging method to determine particle size distribution of granules.,” AAPS PharmSciTech, vol. 9, no. 1, pp. 282–287, 2008.
[22] R. C. Willis, “Process Analytical Technology,” pp. 21–22, 2004. [23] S. Yin, S. X. Ding, A. Haghani, H. Hao, and P. Zhang, “A comparison study of
basic data-driven fault diagnosis and process monitoring methods on the benchmark Tennessee Eastman process,” Journal of Process Control, vol. 22, no. 9, pp. 1567–1581, 2012.
[24] A. Flammini, P. Ferrari, D. Marioli, E. Sisinni, and A. Taroni, “Wired and wireless sensor networks for industrial applications,” Microelectronics Journal, vol. 40, no. 9, pp. 1322–1336, 2009.
[25] A. Alawi, J. Zhang, and J. Morris, “Multiscale Multiblock Batch Monitoring : Sensor and Process Drift and Degradation,” Organic Process Research & Development, vol. 19, pp. 145–157, 2015.
[26] S. J. Qin, “Survey on data-driven industrial process monitoring and diagnosis,” Annual Reviews in Control, vol. 36, no. 2, pp. 220–234, 2012.
[27] D. Pertig, R. Buchfink, S. Petersen, T. Stelzer, and J. Ulrich, “Inline analyzing of industrial crystallization processes by an innovative ultrasonic probe technique,” Chemical Engineering and Technology, vol. 34, no. 4, pp. 639–646, 2011.
[28] V. Hanyecz, Á. Mohácsi, A. Pogány, A. Varga, Z. Bozóki, I. Kovács, and G. Szabó, “Multi-component photoacoustic gas analyzer for industrial applications,” Vibrational Spectroscopy, vol. 52, no. 1, pp. 63–68, 2010.
[29] I. Lecreps, O. Orozovic, M. Eisenmenger, M. G. Jones, and K. Sommer, “Methods for in-situ porosity determination of moving porous columns and application to horizontal slug flow pneumatic conveying,” Powder Technology,
vol. 253, pp. 710–721, 2014. [30] J. Ulrich and P. Frohberg, “Problems, potentials and future of industrial
crystallization,” Frontiers of Chemical Science and Engineering, vol. 7, no. 1, pp.
1–8, 2013. [31] A. Hourri, M. St-Arnaud, and T. K. Bose, “Solubility of solids in supercritical fluids
from the measurements of the dielectric constant: Application to CO2–naphthalene,” Review of Scientific Instruments, vol. 69, no. 7, p. 2732, 1998.
[32] M. Wijaya Hermanto, A. Phua, P. Shan Chow, and R. B. H. Tan, “Improved C-control of crystallization with reduced calibration effort via conductometry,” Chemical Engineering Science, vol. 97, pp. 126–138, 2013.
[33] L. L. Simon, T. Merz, S. Dubuis, A. Lieb, and K. Hungerbuhler, “In-situ monitoring of pharmaceutical and specialty chemicals crystallization processes

100
using endoscopy-stroboscopy and multivariate image analysis,” Chemical Engineering Research and Design, vol. 90, no. 11, pp. 1847–1855, 2012.
[34] J.-M. Andanson and A. Baiker, “Exploring catalytic solid/liquid interfaces by in situ attenuated total reflection infrared spectroscopy.,” Chemical Society reviews,
vol. 39, no. 12, pp. 4571–4584, 2010. [35] D. D. Dunuwila and K. A. Berglund, “ATR FTIR spectroscopy for in situ
measurement of supersaturation,” Journal of Crystal Growth, vol. 179, no. 1–2, pp. 185–193, 1997.
[36] Z. K. Nagy and R. D. Braatz, “Advances and New Directions in Crystallization Control,” Annual Review of Chemical and Biomolecular Engineering, vol. 3, no. 1, pp. 55–75, 2012.
[37] J. Medendorp, R. G. Buice, and R. a Lodder, “Acoustic-resonance spectrometry as a process analytical technology for the quantification of active pharmaceutical ingredient in semi-solids.,” AAPS PharmSciTech, vol. 7, no. 3, p. 59, 2006.
[38] A. Niederquell and M. Kuentz, “Proposal of stability categories for nano-dispersions obtained from pharmaceutical self-emulsifying formulations,” International Journal of Pharmaceutics, vol. 446, no. 1–2, pp. 70–80, 2013.
[39] L. Simon and A. S. Myerson, “Continuous antisolvent plug-flow crystallization of a fast growing API,” International Symposium on Industrial Crystallization, pp. 3–
6, 2011. [40] A. Niederquell, A. C. Völker, and M. Kuentz, “Introduction of diffusing wave
spectroscopy to study self-emulsifying drug delivery systems with respect to liquid filling of capsules,” International Journal of Pharmaceutics, vol. 426, no. 1–2. pp. 144–152, 2012.
[41] A. Burggraeve, N. Sandler, J. Heinämäki, H. Räikkönen, J. P. Remon, C. Vervaet, T. De Beer, and J. Yliruusi, “Real-time image-based investigation of spheronization and drying phenomena using different pellet formulations,” European Journal of Pharmaceutical Sciences, vol. 44, no. 5, pp. 635–642, 2011.
[42] I. Csontos, H. Pataki, A. Farkas, H. Bata, B. Vajna, Z. K. Nagy, G. Keglevich, and G. J. Marosi, “Feedback control of oximation reaction by inline Raman spectroscopy,” Organic Process Research & Development, p.
140318112940008, 2014. [43] P. Bawuah, P. Silfsten, T. Ervasti, J. Ketolainen, J. A. Zeitler, and K.-E.
Peiponen, “Non-contact weight measurement of flat-faced pharmaceutical tablets using terahertz transmission pulse delay measurements.,” International Journal of Pharmaceutics, vol. 476, no. 1–2, pp. 16–22, 2014.
[44] P. Bawuah, A. Pierotic Mendia, P. Silfsten, P. Pääkkönen, T. Ervasti, J. Ketolainen, J. A. Zeitler, and K. E. Peiponen, “Detection of porosity of pharmaceutical compacts by terahertz radiation transmission and light reflection measurement techniques,” International Journal of Pharmaceutics, vol. 465, no. 1–2, pp. 70–76, 2014.
[45] S. Virtanen, O. Antikainen, and J. Yliruusi, “Determination of the crushing strength of intact tablets using Raman spectroscopy,” International Journal of Pharmaceutics, vol. 360, no. 1–2, pp. 40–46, 2008.
[46] I. Akseli, G. N. Mani, and C. Cetinkaya, “Non-destructive acoustic defect detection in drug tablets,” International Journal of Pharmaceutics, vol. 360, no.
1–2, pp. 65–76, 2008. [47] I. Akseli and C. Cetinkaya, “Air-coupled non-contact mechanical property
determination of drug tablets,” International Journal of Pharmaceutics, vol. 359,
no. 1–2, pp. 25–34, 2008.

101
[48] I. Akseli, D. C. Becker, and C. Cetinkaya, “Ultrasonic determination of Young’s moduli of the coat and core materials of a drug tablet,” International Journal of Pharmaceutics, vol. 370, no. 1–2, pp. 17–25, 2009.
[49] M. J. Taylor, S. Tanna, and T. Sahota, “In vivo study of a polymeric glucose-sensitive insulin delivery system using a rat model.,” Journal of pharmaceutical sciences, vol. 99, no. 10, pp. 4215–4227, 2010.
[50] E. Serris, L. Perier-Camby, G. Thomas, M. Desfontaines, and G. Fantozzi, “Acoustic emission of pharmaceutical powders during compaction,” Powder Technology, vol. 128, no. 2–3, pp. 296–299, 2002.
[51] M. Alexander and D. G. Dalgleish, “Diffusing Wave Spectroscopy of aggregating and gelling systems,” Current Opinion in Colloid and Interface Science, vol. 12,
no. 4–5, pp. 179–186, 2007. [52] A. R. . Goodwin and M. R. Moldover, “Phase border and density determinations
in the critical region of (carbon dioxide+ethane) determined from dielectric permittivity measurements,” The Journal of Chemical Thermodynamics, vol. 29,
no. 12, pp. 1481–1494, 1997. [53] L. S. Ferreira and J. O. Trierweiler, “Modeling and simulation of the polymeric
nanocapsule formation process,” IFAC Proceedings Volumes (IFAC-PapersOnline), vol. 7, no. PART 1, pp. 405–410, 2009.
[54] S. Watano and K. Miyanami, “Image processing for on-line monitoring of granule size distribution and shape in fluidized bed granulation,” Powder Technology, vol.
83, no. 1, pp. 55–60, 1995. [55] E. N. Kaufman and T. C. Scott, “In situ visualization of coal particle distribution in
a liquid fluidized bed using fluorescence microscopy,” Powder Technology, vol.
78, no. 3, pp. 239–246, 1994. [56] N. Limodin, L. Salvo, E. Boller, M. Suéry, M. Felberbaum, S. Gailliègue, and K.
Madi, “In situ and real-time 3-D microtomography investigation of dendritic solidification in an Al–10wt.% Cu alloy,” Acta Materialia, vol. 57, no. 7, pp. 2300–
2310, Apr. 2009. [57] N. Limodin, L. Salvo, M. Suéry, and M. DiMichiel, “In situ investigation by X-ray
tomography of the overall and local microstructural changes occurring during partial remelting of an Al–15.8wt.% Cu alloy,” Acta Materialia, vol. 55, no. 9, pp.
3177–3191, May 2007. [58] S. Terzi, L. Salvo, M. Suéry, N. Limodin, J. Adrien, E. Maire, Y. Pannier, M.
Bornert, D. Bernard, and M. Felberbaum, “In situ X-ray tomography observation of inhomogeneous deformation in semi-solid aluminium alloys,” Scripta Materialia, vol. 61, no. 5, pp. 449–452, Sep. 2009.
[59] S. Terzi, L. Salvo, M. Suéry, and E. Boller, “In situ X-ray microtomography characterization of the entrapped liquid formed during partial remelting of a cold-rolled Al–8 wt.% Cu alloy,” Scripta Materialia, vol. 60, no. 8, pp. 671–674, Apr. 2009.
[60] S. S. Singh, J. J. Williams, P. Hruby, X. Xiao, F. De Carlo, and N. Chawla, “In situ experimental techniques to study the mechanical behavior of materials using X-ray synchrotron tomography,” Integrating Materials and Manufacturing Innovation, vol. 3, no. 1, p. 9, Apr. 2014.
[61] E. Kissa, Dispersions: Characterization, Testing, and Measurement. CRC Press,
1999. [62] H. N. Bachman, J. Lavigne, R. Leveridge, N. Heaton, M. D. Hürlimann, W. J.
Looyestijn, and J. White, “Nucear Magnetic Resonance Comes Out of Its Shell,” Oilfield Review, vol. 20, no. 4, pp. 4–23, 2008.

102
[63] T. Takamura, P. Ko, J. Sharma, R. Yukino, S. Ishizawa, and A. Sandhu, “Magnetic-Particle-Sensing Based Diagnostic Protocols and Applications,” Sensors, vol. 15, no. 6, pp. 12983–12998, 2015.
[64] C. Chaiyachit, S. Satthamsakul, W. Sriratana, and T. Suesut, “Hall Effect Sensor for Measuring Metal Particles in Lubricant,” in Proceedings of the International MultiConference of Engineers and Computer Scientists 2012 Vol II, 2012, vol. II,
no. 2, pp. 14–17. [65] D. Sharma, “Non-destructive Testing of Materials using Capacitive Sensing
Technique,” MIT International Journal of Electronics and Communication Engineering, vol. 1, no. 2, pp. 73–77, 2011.
[66] X. Yin, D. a. Hutchins, G. G. Diamond, and P. Purnell, “Non-destructive evaluation of concrete using a capacitive imaging technique: preliminary modelling and experiments,” Cement and Concrete Research, vol. 40, no. 12, pp. 1734–1743, 2010.
[67] T. Togkalidou, M. Fujiwara, S. Patel, and R. D. Braatz, “Solute concentration prediction using chemometrics and ATR-FTIR spectroscopy,” Journal of Crystal Growth, vol. 231, no. 4, pp. 534–543, 2001.
[68] D. Duffy, M. Barrett, and B. Glennon, “Novel, calibration-free strategies for supersaturation control in antisolvent crystallization processes,” Crystal Growth and Design, vol. 13, no. 8, pp. 3321–3332, 2013.
[69] Y. Hu, H. Wikström, S. R. Byrn, and L. S. Taylor, “Analysis of the Effect of Particle Size on Polymorphic Quantitation by Raman Spectroscopy,” Applied Spectroscopy, vol. 60, pp. 977–984, 2006.
[70] T. Zhang, L. Zhou, H. Ammari, and J. Seo, “Electrical Impedance Spectroscopy-Based Defect Sensing Technique in Estimating Cracks,” Sensors, vol. 15, no. 5,
pp. 10909–10922, 2015. [71] J. B. Wachtman, “Molecular Diffusion to Determine Pore Size Distribution in
Porous Solids,” in 15th Annual Conference on Composites and Advanced Ceramic Materials, 2009, p. 668.
[72] L. Salvo, P. Cloetens, E. Maire, S. Zabler, J. J. Blandin, J. Y. Buffière, W. Ludwig, E. Boller, D. Bellet, and C. Josserond, “X-ray micro-tomography an attractive characterisation technique in materials science,” Nuclear Instruments and Methods in Physics Research, Section B: Beam Interactions with Materials and Atoms, vol. 200, pp. 273–286, 2003.
[73] Ceramic Unie, “Paving the way to 2050,” 2012. [74] J. Bessant and W. Phillips, “Innovation management and dynamic capability,” in
The SAGE handbook of strategic supply management, London: Sage Publications Ltd, 2013, pp. 353–371.
[75] D. J. Teece, “Explicating dynamic capabilities: the nature and microfoundations of (sustainable) enterprise performance,” Strategic Management Journal, vol. 28, pp. 1319–1350, 2007.
[76] G. C. O’Connor, “Major Innovation as a Dynamic Capability: A System Approach,” Journal of product innovation management, vol. 25, no. 4, pp. 313–
330, 2008. [77] S. J. Berman and J. Hagan, “How technology-driven business strategy can spur
innovation and growth,” IEEE Engineering Management Review, vol. 34, no. 3,
pp. 31–37, 2006. [78] D. Li, L. Eden, M. Hitt, and D. Ireland, “Friends , Acquaintances or Strangers ?
Partner Selection in R & D Alliances Bush School Working Paper # 589,” Academy of Management Journal, vol. 51, no. 1, pp. 315–334, 2008.

103
[79] F. A. L. Dullien, Porous Media Fluid Transport and Pore Structure, Second Edi.
San Diego, California: Academic Press, 1991. [80] I. Kozo, K. Sridhar, and N. Makoto, Porous Materials. Springer Science &
Business Media Dordrecht, 1998. [81] J. R. Nimmo, “Porosity and pore size distribution,” Encyclopedia of Soils in the
Environment, pp. 295–303, 2004. [82] A. D. McNaught and A. Wilkinson, Eds., on-line corrected version: Compendium
of Chemical Terminology the “Gold Book,” 2nd verson. Oxford: Blackwell
Scientific Publications. [83] R. Asthana, A. Kumar, and N. B. Dahotre, “Pore Characterization,” in Materials
Processing and Manufacturing Science, Burlington, MA, USA: Academic Press,
2006, pp. 224–227. [84] L. L. Schramm, “Suspension,” Saskatchewan, 2014. [85] R. G. Holdich, “Colloids and agglomeration,” in Fundamentals of particle
technology, Loughborough: Midland Information Technology and Publishing,
2002, pp. 1–16. [86] I. Zeta-Meter, “Zeta Potential : A Complete Course in 5 Minutes,” Zeta-Meter Inc.
Staunton, USA, pp. 1–8. [87] A. Ojuva, “Processing and performance of zeolites for efficient carbon dioxide
separation,” Stockholm University, Doctoral Thesis, 2015. [88] ASM, “Monolithic and Fibrous Refractories,” in ASM Engineered Materials
Handbook, ASM Desk E., ASM International, in ASM Handbooks online, 1995.
[89] X. Chen, S. Wu, and J. Zhou, “Influence of porosity on compressive and tensile strength of cement mortar,” Construction and Building Materials, vol. 40, pp.
869–874, 2013. [90] E. Ryshkewitch, “Compression Strength of Porous Sintered Alumina and
Zirconia,” Journal of the American Ceramic Society, vol. 36, pp. 65–68, 1953. [91] M. F. Ashby, “The properties of foams and lattices.,” Philosophical transactions.
Series A, Mathematical, physical, and engineering sciences, vol. 364, no. 1838,
pp. 15–30, 2006. [92] A. A. Griffith, “The Phenomena of Rupture and Flow in Solids,” Philosophical
Transactions of the Royal Society A: Mathematical, Physical and Engineering Sciences, vol. 221, no. 582–593. pp. 163–198, 1921.
[93] J. Aboudi, S. M. Arnold, and B. A. Bednarcyk, Micromechanics of Composite Materials: A Generalized Multiscale Analysis Approach. 2012.
[94] Z. Hashin, “Analysis of composite materials,” ASME J. Appl. Mech., vol. 50, no.
September, pp. 481–504, 1983. [95] R. Haj-Ali and J. Aboudi, “Nonlinear micromechanical formulation of the high
fidelity generalized method of cells,” International Journal of Solids and Structures, vol. 46, no. 13, pp. 2577–2592, 2009.
[96] M. M. Porter, R. Imperio, M. Wen, M. a. Meyers, and J. McKittrick, “Bioinspired scaffolds with varying pore architectures and mechanical properties,” Advanced Functional Materials, vol. 24, no. 14, pp. 1978–1987, 2014.
[97] G. Aryanpour and M. Farzaneh, “Application of a piston equation to describe die compaction of powders,” Powder Technology, 2015.
[98] R. Pitchumani, O. Zhupanska, G. M. H. Meesters, and B. Scarlett, “Measurement and characterization of particle strength using a new robotic compression tester,” Powder Technology, vol. 143–144, pp. 56–64, 2004.
[99] S. Antonyuk, J. Tomas, S. Heinrich, and L. Mörl, “Breakage behaviour of spherical granulates by compression,” Chemical Engineering Science, vol. 60,

104
pp. 4031–4044, 2005. [100] G. R. McDowell, “ON THE YIELDING AND PLASTIC COMPRESSION OF
SAND,” Journal of the Japanese Geotechnical Society : soils and foundation, vol. 42, no. 1, pp. 139–145, 2002.
[101] J.-H. Song and J. R. G. Evans, “A Die pressing Test for the Estimation of Agglomerate Strength,” Journal of the American Ceramic Society, vol. 77, no. 3,
pp. 806–814, 1994. [102] G. R. McDowell and J. P. de Bono, “On the micro mechanics of one-dimensional
normal compression,” Géotechnique, vol. 63, no. 11, pp. 895–908, 2013.
[103] J. P. de Bono and G. R. McDowell, “An insight into the yielding and normal compression of sand with irregularly-shaped particles using DEM,” Powder Technology, vol. 271, pp. 270–277, 2015.
[104] B. J. Briscoe and N. Özkan, “Compaction behaviour of agglomerated alumina powders,” Powder Technology, vol. 90, pp. 195–203, 1997.
[105] R. D. Carneim and G. L. Messing, “Response of granular powders to uniaxial loading and unloading,” Powder Technology, vol. 115, pp. 131–138, 2001.
[106] M. G. C. Couroyer Z. Ning, C. Couroyer, Z. Ning, and M. Ghadiri, “Distinct element analysis of bulk crushing: effect of particle properties and loading rate,” Powder Technol., vol. 109, pp. 241–254, 2000.
[107] F. Güner, Ö. N. Cora, and H. Sofuoğlu, “Numerical modeling of cold powder compaction using multi particle and continuum media approaches,” Powder Technology, vol. 271, pp. 238–247, 2015.
[108] R. E. Mark, C. C. Habeger, J. Borch, and M. B. Lyne, Handbook of physical testing of paper, 2nd ed. New York/Basel: Marcel Dekker INC, 2001.
[109] J. Tryding, “In-plane fracture of paper,” Report: Lund University of Technology,
1996. [Online]. Available: http://www.lth.se/fileadmin/byggnadsmekanik/publications/tvsm1000/web1008.pdf. [Accessed: 14-Mar-2016].
[110] V. Koivu, “Analysis of Fluid Flow Through Porous Media Based on X-Ray,” University of Oulu, Doctroal Thesis, 2010.
[111] T. Stylianopoulos, A. Yeckel, J. J. Derby, X. J. Luo, M. S. Shephard, E. a. Sander, and V. H. Barocas, “Permeability calculations in three-dimensional isotropic and oriented fiber networks,” Physics of Fluids, vol. 20, no. 12, pp. 1–10,
2008. [112] P. C. Carman, “Fluid flow through granular beds,” Transactions of the Institution
of Chemical Engineers., vol. 15, pp. S32–S48, 1937. [113] R. G. Holdich, “Fluid flow in porous media,” in Fundamentals of particle
technology, Loughborough: Midland Information Technology and Publishing,
2002, pp. 21–28. [114] S. Ergun and a. a. Orning, “Fluid Flow through Randomly Packed Columns and
Fluidized Beds,” Industrial & Engineering Chemistry, vol. 41, no. 6, pp. 1179–
1184, 1949. [115] J. Happel, “Viscous flow relative to arrays of cylinders,” American Institute of
Chemical Engineers, vol. 5, no. 2, pp. 174–177, 1959. [116] G. W. Jackson and D. F. James, “The permeability of fibrous porous media,”
Canadian Society for Chemical Engineering, vol. 64, no. 6, pp. 364–374, 1986.
[117] B. Rimez, “Calculations used in porometry.” Porometer, EKE, Belgium, pp. 1–4, 2013.
[118] A. Karamanos, A. Papadopoulos, and D. Anastasellos, “Heat transfer phenomena in fibrous insulating materials,” Mechanical Engineering, 2006.

105
[Online]. Available: http://www.geolan.gr/sappek/docs/publications/article_6.pdf. [Accessed: 14-Mar-2016].
[119] J. Ordonez-Miranda and J. J. Alvarado-Gil, “Effect of the pore shape on the thermal conductivity of porous media,” Journal of Materials Science, vol. 47, no.
18, pp. 6733–6740, 2012. [120] J. C. Groen, L. a a Peffer, and J. Pérez-Ramírez, “Pore size determination in
modified micro- and mesoporous materials. Pitfalls and limitations in gas adsorption data analysis,” Microporous and Mesoporous Materials, vol. 60, no.
1–3, pp. 1–17, 2003. [121] L. Ruggieri, T. Gea, A. Artola, and A. Sánchez, “Air filled porosity measurements
by air pycnometry in the composting process: A review and a correlation analysis,” Bioresource Technology, vol. 100, no. 10, pp. 2655–2666, 2009.
[122] C. M. Gribble, G. P. Matthews, G. M. Laudone, A. Turner, C. J. Ridgway, J. Schoelkopf, and P. a C. Gane, “Porometry, porosimetry, image analysis and void network modelling in the study of the pore-level properties of filters,” Chemical Engineering Science, vol. 66, no. 16, pp. 3701–3709, 2011.
[123] P. A. Webb, “Poresizer 9320 Data collection, Reduction and Presentation.” Micromeritics, pp. 1–17, 1993.
[124] S. Chatterji, “A discussion of the paper ‘Mercury porosimetry—an inappropriate method for the measurement of pore size distributions in cement-based materials’ by S. Diamond,” Cement and Concrete Research, vol. 31, no. 11, pp.
1657–1658, 2001. [125] Porous Materials INC, “PMI capillary flow porometer,” Product brochure, 2015.
[Online]. Available: http://www.pmiapp.com/products/productPages/capFlow.html. [Accessed: 14-Mar-2016].
[126] ASTM F778, Standard Methods for Gas Flow Resistance Testing of Filtration Media. ASTM, 2007.
[127] Micromeritics, “Gas sorption Analyses,” Product brochure, 2012. [Online].
Available: http://www.micromeritics.com/Product-Showcase.aspx. [Accessed: 14-Mar-2016].
[128] W. C. Bae, S. Patil, R. Biswas, S. Li, E. Y. Chang, S. Statum, D. D. D’Lima, C. B. Chung, and J. Du, “Magnetic resonance imaging assessed cortical porosity is highly correlated with μCT porosity,” Bone, vol. 66, pp. 56–61, 2014.
[129] G. N. Okolo, R. C. Everson, H. W. J. P. Neomagus, M. J. Roberts, and R. Sakurovs, “Comparing the porosity and surface areas of coal as measured by gas adsorption, mercury intrusion and SAXS techniques,” Fuel, vol. 141, pp.
293–304, 2015. [130] Y. Sakamoto, M. Kaneda, O. Terasaki, D. Y. Zhao, J. M. Kim, G. Stucky, H. J.
Shin, and R. Ryoo, “Direct imaging of the pores and cages of three-dimensional mesoporous materials.,” Nature, vol. 408, no. 6811, pp. 449–453, 2000.
[131] J. Martínez-Martínez, D. Benavente, and M. a. García del Cura, “Petrographic quantification of brecciated rocks by image analysis. Application to the interpretation of elastic wave velocities,” Engineering Geology, vol. 90, no. 1–2,
pp. 41–54, 2007. [132] J. Ghiasi-Freez, I. Soleimanpour, A. Kadkhodaie-Ilkhchi, M. Ziaii, M. Sedighi,
and A. Hatampour, “Semi-automated porosity identification from thin section images using image analysis and intelligent discriminant classifiers,” Computers and Geosciences, vol. 45, pp. 36–45, 2012.
[133] J. M. Prats-Montalbán, a. de Juan, and a. Ferrer, “Multivariate image analysis: A review with applications,” Chemometrics and Intelligent Laboratory Systems,

106
vol. 107, no. 1, pp. 1–23, 2011. [134] ASTM, “C373 - 88 Standard Test Method for Water Absorption, Bulk Density,
Apparent Porosity, and Apparent Specific Gravity of Fired Whiteware Products.” pp. 1–3, 1999.
[135] M. Valkonen, “Training based segmentation of electron microscope images,” Tampere University of Technology, MSc Thesis, 2015.
[136] National Institutes of Health, “ImageJ,” Image Processing and Analysis in Java v 1.47J, 2013. [Online]. Available: http://rsbweb.nih.gov/ij/index.html.
[137] M. Vilkko and T. Roinila, “Designing Maximum Length Sequence Signal for Frequency Response Measurement of Switched Mode Converters,” in Nordic Workshop on Power and Industrial Electronics, 2008, pp. 1–6.
[138] A. Ojuva, F. Akhtar, A. P. Tomsia, and L. Bergström, “Laminated adsorbents with very rapid CO2 uptake by freeze-casting of zeolites,” ACS Applied Materials and Interfaces, vol. 5, no. 7, pp. 2669–2676, 2013.
[139] J. Seville, T. G. Chuah, V. Sibanda, and P. Knight, “Gas cleaning at high temperatures using rigid ceramic filters,” Advanced Powder Technology, vol. 14,
no. 6, pp. 657–672, 2003. [140] J. P. Heller and J. V. McLemore, “Miniporopermeameter,” US patent
5,373,7271994. [141] S. Diamond, “Mercury porosimetry An inappropriate method for the
measurement of pore size distributions in cement-based materials,” vol. 30, pp. 1517–1525, 2000.
[142] M. Järveläinen, T. Yli-hallila, T. Salpavaara, J. Verho, M. Vilkko, and E. Levänen, “Kolloidisten suspensioiden online -analysointi: tutkimuksesta liiketoimintaa,” Materia-lehti, vol. 5. Vuorimiesyhdistys-Bergsmannaföreningen ry, pp. 54–57,
2015. [143] J. Clayton, “Reviewing Current Practice in Powder Testing,” Organic Process
Research & Development, p. 140415130544007, 2014.
[144] P. Müller and J. Tomas, “Simulation and calibration of granules using the discrete element method,” Particuology, vol. 12, no. 1, pp. 40–43, 2014.
[145] R.Thyagarajan, G. M. D. Cantin, B. P. Kashyap, and C. J. Bettles, “Modelling compaction behaviour of nickel–phosphorus and nickel–boron electroless coated titanium powders,” Powder Technology, vol. 274, pp. 53–61, 2015.
[146] M. Järveläinen, E. Levänen, and T. Mäntylä, “Use of uniaxial compression in determining the fracture strength of granules in powders.” ECerS XII, 12th Conference of the European Ceramic Society, Stockholm, 2011.
[147] F. Carrique, E. Ruiz-Reina, R. Roa, F. J. Arroyo, and Á. V. Delgado, “General electrokinetic model for concentrated suspensions in aqueous electrolyte solutions: Electrophoretic mobility and electrical conductivity in static electric fields,” Journal of Colloid and Interface Science, vol. 455, no. July, pp. 46–54, 2015.
[148] V. Heuer, G. Walter, and I. Hutchings, “High temperature erosion of fibrous ceramic components by solid particle impact,” Wear, pp. 257–262, 1999.
[149] V. Heuer, G. Walter, and I. . Hutchings, “A study of the erosive wear of fibrous ceramic components by solid particle impact,” Wear, vol. 225–229, pp. 493–501,
Apr. 1999. [150] F. P. Beer, E. R. Johnston, J. T. DeWolf, and D. F. Mazurek, “Mechanics of
Materials (Sixth Edition),” p. 838, 2012. [151] U. Kanerva, T. Suhonen, J. Lagerbom, and E. Levänen, “Evaluation of crushing
strength of spray-dried MgAl2O4 granule beds,” Ceramics International, vol. 41,

107
no. 7, pp. 8494–8500, 2015. [152] M. Samet, V. Levchenko, G. Boiteux, G. Seytre, a. Kallel, and a. Serghei,
“Electrode polarization vs. Maxwell-Wagner-Sillars interfacial polarization in dielectric spectra of materials: Characteristic frequencies and scaling laws,” The Journal of Chemical Physics, vol. 142, no. 19, p. 194703, 2015.
[153] Z. Ahmad, “Polymeric Dielectric Materials,” in Dielectric Material, M. A. Silaghi,
Ed. InTech, 2012, pp. 3–26. [154] D. V. Wilbrink, L. A. A. Beex, and R. H. J. Peerlings, “A discrete network model
for bond failure and frictional sliding in fibrous materials,” International Journal of Solids and Structures, vol. 50, no. 9, pp. 1354–1363, May 2013.
[155] K. Niskanen and H. Rajatora, “Statistical geometry of paper cross-sections,” Journal of Pulp and Paper Science, vol. 28, no. 7, p. 228, 2002.
[156] D. Tsarouchas and A. E. Markaki, “Extraction of fibre network architecture by X-ray tomography and prediction of elastic properties using an affine analytical model,” Acta Materialia, vol. 59, no. 18, pp. 6989–7002, Oct. 2011.
[157] A. P. Roberts and E. J. Garboczi, “Elastic Properties of Model Porous Ceramics,” Journal of the American Ceramic Society, vol. 83, no. 12, pp. 3041–3048, 2000.
[158] L. J. Gibson and M. F. Ashby, Cellular Solids: Structure and Properties, 2nd ed.
Cambridge University Press, 1997. [159] K. U. O’Kelly, a. J. Carr, and B. a O. McCormack, “Minimum solid area models
applied to the prediction of Young’s modulus for cancellous bone,” Journal of Materials Science: Materials in Medicine, vol. 14, no. 4, pp. 379–384, 2003.
[160] S. Wild, “A discussion of the paper ‘mercury porosimetry - An inappropriate method for the measurement of pore size distributions in cement-based materials’ by S. Diamond [1] (multiple letters),” Cement and Concrete Research,
vol. 31, no. 11, pp. 1653–1656, 2001. [161] M. R. Landry, “Thermoporometry by differential scanning calorimetry:
Experimental considerations and applications,” Thermochimica Acta, vol. 433,
no. 1–2, pp. 27–50, 2005.

Publication I
USE OF THERMAL IMAGING IN CHARACTERIZATION OF CE-
RAMIC FIBER STRUCTURES
by
Järveläinen Matti, Keskinen Lassi & Levänen Erkki
IOP Conference Series: Materials Science and Engineering 47 (2013).
http://iopscience.iop.org/1757-899X/47/1/012062

Use of thermal imaging in characterization of ceramic fiber
structures
Matti Järveläinen1, Lassi Keskinen and Erkki Levänen
Department of Materials Science, Tampere University of Technology, P.O.Box 589,
FIN-33101 Tampere, Finland
E-mail: [email protected]
Abstract. Fibrous bodies that contain open porosity can have a very heterogeneous structure
that is difficult to characterize in terms of local flow resistance changes within the same
sample. This article presents a method that is applicable for a quick analysis of flow
distribution even with large samples. In this first attempt to understand how our flow
distribution thermal imaging works, we present how the measuring parameters and the results
correlate with sample’s thickness and density. The results indicate that our method can quickly
make a distinction between areas that have different flow resistances because of variations in
the sample’s density or wall thickness.
1. Introduction
Use of fibrous ceramics is widespread in high temperature applications such as furnace linings [1] and hot gas filter elements [2,3]. In some applications it is necessary to produce an even gas flow
distribution within the same product because in the case of uneven flow distribution the product may
malfunction. In filtration applications the filtration characteristics [4] and the cleaning of filter
elements [5] depend on their structure. In addition, the mechanical characteristics of fibrous bodies are affected by uneven wall thickness and changes in bulk density, which are both difficult to measure.
Conventionally, a permeability measurement [6] is used to analyze the flow resistance and changes
in it. While the conventional methods can be reliable and fast to analyze the sample as a whole, they cannot be easily used to find differences within a same sample. Because of this a method better than
the conventional flow permeability measurement is needed for local permeability analysis.
Thermal imaging has been used in non-destructive testing before [7] but we have invented another
way to take advantage of it. We have noticed that a randomly oriented fibrous structure heats faster in certain areas when hot air flows through it. This takes place due to local differences in the air
permeability that in this case is mostly controlled by the wall thickness and bulk density of the sample.
2. Materials and Methods
2.1. Thermal imaging system
Measurement system that we used is presented in figure 1. The system included a thermal camera
(FLIR Thermacam PM595), length scale, and an adjustable air inlet. Air was blown through a porous sample while its surface was imaged with thermal camera. Air temperature and velocity was varied in
the experiments. Sample dimensions and its thermal diffusivity are presented in table 1.
1 To whom any correspondence should be addressed.
2nd International Conference on Competitive Materials and Technological Processes IOP PublishingIOP Conf. Series: Materials Science and Engineering 47 (2013) 012062 doi:10.1088/1757-899X/47/1/012062
Content from this work may be used under the terms of the Creative Commons Attribution 3.0 licence. Any further distributionof this work must maintain attribution to the author(s) and the title of the work, journal citation and DOI.
Published under licence by IOP Publishing Ltd 1

Figure 1. A schematic presentation of the thermal imaging setup.
2.2. Material The materials in these experiments were composed of non-oriented, silicate based fibers, and some
non-fibrous areas. An example of microstructure of the tested material is shown in figure 2. The fiber
dimensions, size of non-fibrous parts, and material compositions are presented in table 1.
Figure 2. SE-image of the studied fiber structure.
The pore characterization was carried out with capillary flow porometry and mercury porosimetry.
However the highly heterogeneous pore structure and a large size of the samples rendered the exact
characterization of the material very difficult. Table 1 presents the measured pore characteristics.
Table 1. Approximate material parameters.
Dimensions
Length [m] 2.4
Radius [m] 0.2
Wall thickness [m] 0.02
Composition mostly Al2SiO5, CaSiO3 and amorphous SiO2
Microstructure
Fiber diameter [µm] 1 – 10
Fiber length [µm] below 1000
Non-fibrous [µm] 10 – 500
Pore characteristics
Mean flow pore size [µm] 4a
Average pore diameter [µm] 4b
Largest through pore [µm] 39a
Porosity [%] 80b
Thermal diffusivity @200°C [mm2/s] 0.3
c
a PMI capillary flow porometer b Micrometrics poresizer 9320 c NETZSCH 457 MicroFlash
Thermal camera
(Measuring error ± 2%)
Air inlet with adjustable flow velocity
and temperature
Cylindrical
sample with
open bottom
and closed
top end
Length
scale
non-fibrous
areas
2nd International Conference on Competitive Materials and Technological Processes IOP PublishingIOP Conf. Series: Materials Science and Engineering 47 (2013) 012062 doi:10.1088/1757-899X/47/1/012062
2

3. Results
Tested samples behaved in two distinctive ways. In the first type ‘striped’ sample, hot air seemed to
form stripes in the thermal images along the length of the sample, while in the second type ‘spotted’
sample, large cold and hot spots formed. Examples of the two types are presented in the figure 3. The ‘spotted’ type samples were mostly used in the studies but the ‘striped’ sample was used in the
experiment in section 3.2 to show that wall thickness is not the only factor that determines the heating
rate in the samples.
Figure 3. Thermal images of two sample types.
3.1. Effect of measuring variables
Preliminary measurements were carried out in order to see how the measuring variables, air temperature and flow velocity, affect the measurement. In figure 4 a same sample is first heated with a
standard flow rate and temperature (reference), then with a flow velocity twice as high, then with
temperature and flow velocity twice as high, and finally with the air flow from the opposite direction.
Thermal Images
Parameters
[°C]/ [l/min]
Time
[ sec]
Temp. [°C] Max/Min/
Ave
Ref.
100/500 535 69/22/56
2x Flow
100/1000 195 72/23/53
2x Flow
2x Temp 200/1000 90 88/33/63
Flow reversed
200/1000 120 106/51/70
Figure 4. Effect of changing measurement parameters. Time is heating time during image capture.
3.2. Correlation of thickness and temperature variations
Thickness changes and a thermal image of a ‘spotted’ sample are presented in figure 5a. Thickness is measured in seven places across the length of the sample. Another thickness correlation is presented in
figure 5b where in the ‘spotted’ sample it is obvious that the faster heating rate on the left side is
caused by smaller wall thickness and thus higher permeability, whereas in the ‘striped’ sample there is little correlation between the heating rate and wall thickness. In this case the heating rate differences
have to be caused by some other factor, such as density variations between the cold and hot areas.
Striped
Spotted
2nd International Conference on Competitive Materials and Technological Processes IOP PublishingIOP Conf. Series: Materials Science and Engineering 47 (2013) 012062 doi:10.1088/1757-899X/47/1/012062
3

Figure 5a. Sample thicknesses and its thermal image aligned together.
5b. Wall thicknesses measured from three spots, thermal images aligned on the background.
3.3. Correlation of density and temperature variations
Bulk density and a thermal image of a ‘spotted’ sample are presented in figure 6. Density changes were calculated from weights and volume measurements that were carried out from dissected sample
images using image processing methods.
Figure 6. Sample density and its thermal image aligned together.
(b)
(a)
2nd International Conference on Competitive Materials and Technological Processes IOP PublishingIOP Conf. Series: Materials Science and Engineering 47 (2013) 012062 doi:10.1088/1757-899X/47/1/012062
4

3.4. Correlation of density x thickness and temperature variations
Average thickness and density of a ‘spotted’ sample from the above figures 5A and 6 are multiplied
and the result is plotted together with the thermal image in figure 7. This is done in order to find out if
this rough estimate of permeability is a function of both the density and thickness. This estimate does not take into account the pore characteristics that will affect the permeability but it still leads to a
higher correlation than the ones presented before. This is further discussed in section 4.
Figure 7. Sample density times thickness and its thermal image aligned together.
4. Discussion
First thing to notice in the above thermal images is that certain areas of the samples heat faster. In the section 3.1 we showed that this takes place regardless of the gas injection velocity, temperature, and
direction of the gas flow. Together these prove that the heating rate differences are caused by certain
characteristics of the sample, not the measuring setup. In order to find the dominant character that
determines the heating rate in different areas, we visually correlated the thermal images with the local thickness and density of the samples. In the figure 5b the thermal image of a ‘spotted’ sample seemed
to contain hot and cold areas as a result of the variation in thickness of the sample. However, in the
thermal image of the ‘striped’ sample, in the same figure, hot and cold areas were seen regardless of the negligible changes in wall thickness. This led us to understand that the thickness is not the only
factor that controls the heating. After that we studied how density affects the heating rate and the
correlation is presented in figure 6. Visual correlation is a little higher with density than with the wall
thickness that indicates that the density dominates the heating rate over the wall thickness in this study.
Yet even with a ‘spotted’ sample the correlation seems to be the highest with the computational
factor “thickness times density” that is presented in figure 7. Thus it can be deducted that the heating rate, in our particular experiment, is fixed by the relative flow resistance of the sample that is, at least
partially a combination of the samples thickness and density. In this study we examined the samples
only in terms of density and thickness changes but it is obvious that also the factors related to pore characteristics have an important role in the flow resistance as is shown by [8]. These characteristics
are unfortunately difficult to measure in the heterogeneous fiber bodies.
The measurements were carried out with a relatively cool air and high flow velocity which is
especially important if the samples have high thermal diffusivity. With highly diffusive samples the high flow velocity eliminates the possibility of remarkable thermal diffusion [9] through the material
which would have an effect on the measurements. In addition to choosing the right measuring
parameters, we had samples that had a low thermal diffusivity as presented in table 1. Thus we believe that the differences in the heating rates are solely caused by differences in flow distribution of the
2nd International Conference on Competitive Materials and Technological Processes IOP PublishingIOP Conf. Series: Materials Science and Engineering 47 (2013) 012062 doi:10.1088/1757-899X/47/1/012062
5

samples. This is simply the cause of more hot air flowing through the areas where the permeability is
higher, and as the samples surface is comparatively even the more porous areas heat faster. The
highest correlation would undoubtedly be found with the heating rate and permeability as it would also
take into account the effect of pore characteristics. This is still to be studied and takes time because the local permeability distribution is difficult to measure.
5. Conclusions
In this article we presented a method for analysing flow distribution with thermal camera and hot gas. With the acquired results we have formed a basis for thermal permeability measuring. Comparing the
new method to conventional permeability measurement that includes flow and pressure meters, the
new one is faster and can possibly find smaller permeability differences if the measuring parameters
are chosen correctly. Another strength of this investigated method, is that it can spot differences within the same sample. Even difficult, highly heterogeneous samples, such as the ones analysed in this
article, can be measured.
With a small effort this method could be used for instance to ensure an even production quality in terms of permeability of the product or it could be used to analyse local permeability changes, for
instance in filtration applications. Experiments presented in this article were carried out for silicate-
based fibrous ceramics having low density and thermal diffusivity. The method would undoubtedly be applicable also for other samples if the ratio between the permeability and thermal diffusivity of the
them is high enough. In the case of very low ratio, heat conducting through the sample might affect the
results. Even in this case the method might be used if the imaged surface was first coated with highly
heat absorbing material such as graphite that would promote the heating caused by permeability in favour of the heat conducting through the sample.
Acknowledgements
We thank M.Sc’s J. Laakso, A. Ismailov, S. Heinonen and J-P Nikkanen for the help valuable opinions on this study; M.Sc T. Honkola for the idea of thermal imaging and Finnish Foundation for
Technology Promotion for financial support.
References
[1] ASM 1995 Monolithic and Fibrous Refractories ASM Engineered Materials Handbook (ASM International, in ASM Handbooks online)
[2] Heidenreich S 2013 Hot gas filtration – A review Fuel 104 83–94
[3] Seville J, Chuah T G, Sibanda V and Knight P 2003 Gas cleaning at high temperatures using rigid ceramic filters Advanced Powder Technology 14 657–72
[4] Sharma S D and Carras J N 2009 FUELS - HYDROGEN PRODUCTION | Gas Cleaning:
Barrier Filters Encyclopedia of Electrochemical Power Sources ed J Garche (Amsterdam: Elsevier) pp 313–8
[5] Kanaoka C and Amornkitbamrung M 2001 Effect of filter permeability on the release of
captured dust from a rigid ceramic filter surface Powder Technology 118 113–20
[6] ASTM F778 2007 Standard Methods for Gas Flow Resistance Testing of Filtration Media [7] Chrzanowski K and Park S 2001 Evaluation of thermal cameras for non-destructive thermal
testing applications Infrared physics & technology 42 101–5
[8] Mancin S, Zilio C, Cavallini A and Rossetto L 2010 Pressure drop during air flow in aluminum foams International Journal of Heat and Mass Transfer 53 3121–30
[9] Maqsood A, Anis-ur-Rehman M and Gumen V 2000 Thermal conductivity of ceramic fibres as
a function of temperature and press load Journal of Physics D: Applied Physics 33 2057–63
2nd International Conference on Competitive Materials and Technological Processes IOP PublishingIOP Conf. Series: Materials Science and Engineering 47 (2013) 012062 doi:10.1088/1757-899X/47/1/012062
6

Publication II
CHARACTERIZATION OF POROUS CERAMICS BY USING FRE-
QUENCY-RESPONSE METHOD
by
Järveläinen Matti, Salpavaara Timo, Seppälä Sari, Roinila Tomi, Yli-Hallila Teemu,
Levänen Erkki & Vilkko Matti
IFAC Proceeding Volumes, 47, 3 (2014).
http://doi.org/10.3182/20140824-6-ZA-1003.02423
Reprinted from IFAC Proceedings with permission of Elsevier B.V. Copyright © 2016 Elsevier B.V.

Characterizing Porous Ceramics by Frequency-Response Method
M. Järveläinen* T. Salpavaara**
S. Seppälä* T. Roinila** T. Yli-Hallila**
E. Levänen* M. Vilkko**
*Department of Materials Science, Tampere University of Technology, P.O. Box 589, FI-33101 Tampere, Finland
** Department of Automation Science and Engineering, Tampere University of Technology, P.O. Box 692, FI-33101
Tampere, Finland
Abstract: Nondestructively determining pore properties of ceramic materials is essential in many
industrial applications. There are several limitations in the existing characterization methods, so new techniques are required to meet the increasing demands of analysis. This paper examines the possible use
of an electrical frequency-response method based on broadband excitation and Fourier techniques to
characterize porous ceramic materials. The applied method provides a non-destructive, online
characterization technique that is fast and can be applied inexpensively. In this article, ceramic samples
with three different pore characteristics were measured by the frequency-response method that used a
pseudo-random binary sequence. A sample of material was placed between the plates of a capacitor, and
the capacitance was measured. Material properties, such as porosity, influence the permittivity value of
the material. The samples with different porosities can be distinguished by analyzing the capacitance of
the capacitor.
Keywords: capacitors, characterization, density measurements, frequency-response methods, impulse
signals, permittivity, polarization analysis, pseudo random sequences, signal detection
1. INTRODUCTION
The number of ceramic materials used in functional and
construction applications in industrial environments is
continuously increasing. The main reason is their attractive
properties, such as high temperature, chemical resistance,
hardness, and the potential to easily tailor the pore
characteristics in a controlled manner. Ceramic materials are
used in critical process components in challenging
environments, such as in the presence of corrosive acids and
bases, because no other material can withstand the
challenging atmospheres.
This study aims to develop a fast, continuous, online, and
onsite pore characterization method, based on frequency-
response measurements for ceramic materials in industrial
applications. Traditional, nondestructive testing methods
have limitations, such as cost, sample size, and slowness, so
there is a strong need for the frequency-response technique.
In an industrial process, this could mean improving quality
control, safety, and efficiency. In addition to porosity
measurements, this method could have other interesting
applications. Porosity influences other important properties of
ceramics, such as modulus of elasticity (Asmaniet al. 2001), strength (Coble et al. 1956), and thermal insulation ability
(Sumirat et al. 2006). Furthermore, porosity has a functional
purpose in many applications (Studart et al. 2006), such as
ceramic bio-implants (Kamitakahara et al. 2008, Niemelä et
al. 2011), membranes (Ciora et al. 2003, Garmash et al.
1995), drug delivery (Ahuja et al. 2009), solid oxide fuel cells
(Sanson et al. 2008), and absorbent structures (Ojuva et al.
2013, Vasiliev et al. 2010).
The frequency-response method in this article is an electrical
porosity measurement based on different polarization
behaviors of materials in alternating electric fields. As Lira-
Olivares et al. (2000) stated the following polarization types
are encountered in ceramics: Electronic, ionic, dipolar
orientation, and Maxwell-Wagner-Sillars (Lira-Olivares et
al., 2000). According to Richerson (2006), atoms and their
bonding types affect material polarization sensitivity and rate
(Richerson, 2006). These physical phenomena should enable
discrimination of two phases by analyzing the disturbances in
a sample polarity. The applicability of the frequency-response method in porosity measurements is studied by
measuring the behavior of ceramic materials in alternating
electric fields. Vila et al. (1998) found that porosities and
impurities in ceramics influence measured permittivity and
dielectric loss (Vila et al., 1998). This study clarifies how
changes in porosity, such as differences in amounts of air and
solids, affect the measured electrical properties.
The proposed frequency-response analytical method has
several attractive features, such as flexibility in industrial
applications, fastness, size scaling, and potential use as a non-
destructive online tool. An electrical impulse, required as an excitation signal, is easy and straightforward to generate and
use. Calculating the responses is based on simple Fourier
techniques so are easy to implement in practice. We used a
maximum-length binary sequence (MLBS) excitation to
quickly measure a wide frequency band of materials. The
MLBS excitation method is interesting because the energy
density of the excitation is very even across the whole
measuring range. In addition, because the MLBS has only
two different signal values, it can be easily implemented with
a low-cost application.
Proceedings of the 19th World CongressThe International Federation of Automatic ControlCape Town, South Africa. August 24-29, 2014
978-3-902823-62-5/2014 © IFAC 10012

There are no existing methods that fulfill all the above-
mentioned requirements. Mercury porosimetry (Giesche,
2006) analyzes small sample sizes and is destructive.
Computed tomography (Taud et al. 2005) and magnetic
resonance imaging (Fagan et al. 2005) are non-destructive,
but measurements are slow. The same applies to gas-
adsorption methods (Sing et al. 1985). The traditional
Archimedes method can be used for big samples, but the
measurement is time consuming and laborious. None of these
methods can be used for continuous analysis.
2. METHODS AND MATERIALS
For the frequency-response measurement, samples were
manufactured and characterized by Archimedes
measurement. This section is divided into three parts. The
first part considers the sample manufacturing and
characterization, the second part considers signal generation,
and the last part considers the applied equipment and the idea
of the electrical frequency-response method.
2.1 Manufacturing and characterization of alumina samples
To study the functionality and sensitivity of the frequency-
response method to measure porosity, ceramic sample series
with various porosity properties were manufactured and
characterized by the Archimedes method. Samples were
made of aluminum oxide (alumina), because it is a common
technical ceramic with well-known properties. Alumina has
high resistivity and is an electrical insulator. Microstructure and impurities affect the electrical properties of alumina.
The sample series were manufactured by slip casting. By
using three different sintering temperatures, samples with
three different porosities were achieved.
Slip casting of alumina samples. In slip casting, a ceramic
component is produced from a slip containing ceramic
powder, water, and additives. First a dispersing agent (Dispex
A40) was stirred into the water. The dispersing agent worked
as a stabilizer in the slip. Then alumina powder (Al2O3,
Martinswerk MR70) was added to the mixture. After the
powder was stirred until it was homogenous, a binder
(Raisional 116) was added to increase pre-sintering strength of the component. Finally, polyethylene glycol was stirred
into the slip to increase processability.
The prepared slip was poured into a gypsum mold, where the
solid content compacted to the mold walls as water was
removed by capillary action. When the component was
solidified, the mold was removed. Before sintering, the
component is known as a green body. To avoid cracking, the
green body was dried before sintering for 24 hours at 45ºC,
followed by 24 hours at 90ºC.
Sintering. After drying and processing, the green bodies
were heated at high temperatures, where the structure of the ceramics became denser due to diffusion of atoms. This is
called sintering. This also caused the component to shrink.
We selected three different sintering temperatures: 1100ºC,
1300ºC, and 1550ºC. Heat treatment was carried out in two
steps. First, the green bodies were heated at 1ºC/min up to
200ºC, with a 60-minute dwell. The ceramics were then
heated at 1ºC/min up to the sintering temperature, with a 120-
minute dwell. The cooling rate after heating was 5ºC/minute.
After sintering, the samples were characterized by the
Archimedes method. Microstructures were studied by
scanning electron microscopy (SEM) (Phillips XL-30).
Material characterization. Density and porosity properties
of the samples were determined by the Archimedes method.
The test was performed according to ASTM standard (ASTM
Standard C373-88) to four representative samples from each
sintering temperature. The test measured dry mass, saturated
mass, and mass when the sample was suspended in water.
From these values, porosities and densities were determined. Average values of the results are presented in Table 1. A
theoretical density of 3.98g/cm3 was used in the calculations.
Table 1. Results of Archimedes test; porosity properties
of the samples.
Sintering
temperature
[°C]
Bulk
density
[g/cm3]
Apparent
density
[g/cm3]
Open
porosity
[%]
Total
porosity
[%]
1550 3.85 3.86 0.09 3.23
1300 3.27 3.89 15.78 17.94
1100 2.66 3.89 31.62 33.10
In addition to the Archimedes test, the samples were imaged by SEM. The samples were cut, ground, and polished. Fig. 1
shows the sintering shrinkages and microstructures of cross-
sectional areas.
Fig. 1. Sample in green state and after sintering. The length of the black scale bars in the SEM-photos is 10 μm.
2.2 Frequency-response measurement
In steady state, for small-signal disturbances, the analyzed
system is linear and time-invariant. According to basic
control theory, this type of system is fully characterized by its impulse response in the time domain, which can be
transformed to the frequency domain and presented as a
frequency-response function.
Fig. 2. Typical frequency-response-measurement setup.
19th IFAC World CongressCape Town, South Africa. August 24-29, 2014
10013

Fig. 2 shows a typical frequency-response-measurement
setup, in which the device under test, presented by the system
impulse-response function g(t), is to be identified. The
designed excitation is first processed (filtered and amplified
by n[t]), yielding the actual excitation u(t). The device under
test is then perturbed with u(t), yielding the corresponding
output response y(t). The measured signal is corrupted with
noise, presented by v(t). The noise resembles white noise and
is uncorrelated with u(t) and y(t). All the signals are assumed
to be zero-mean sequences. Applying cross correlation
between the sampled input and output responses, an estimate of the frequency-response function is obtained as:
𝐺 𝑒𝑗𝑤 𝑇𝑠 =1
𝛼 𝑅𝑢𝑦 (𝑚)𝑒
−𝑗𝑘𝑤 𝑇𝑠
𝑀−1
𝑘=0
(1)
where M, α, Ts, and Ruy(m) respectively denote the total length of collected data, the variance of u(m), the sampling
interval, and the cross-correlation function between the input
and output signals (James, 2004). The requirement in (1) is
that the system is perturbed with a signal resembling white
noise, such as with maximum-length binary sequence
(MLBS) (Godfrey, 1993). Other frequency-response-
computation techniques can be found (e.g., Pintelon et al.,
2001).
2.3 Maximum-length binary sequence
Pseudo-random binary sequence (PRBS) is a periodic broadband signal with the following properties:
1. The signal has two levels and can switch the level
only at certain event points t = 0, ∆t, 2∆t, ...
2. The change of signal level is predetermined, so that
PRBS is deterministic and experiments are
repeatable.
3. The sequence is periodic with period T = N∆t,
where N is an odd integer
4. Within one period, there are (N + 1)/2 intervals when the signal is at one level and (N − 1)/2
intervals when it is at the other.
A PRBS is based on a sequence of length N. The most
commonly used signals are based on maximum-length
sequences (maximum-length binary sequence [MLBS]). Such
sequences exist for N = 2n − 1, where n is an integer. They
are popular because they can be generated using feedback
shift register circuits, as shown in Fig. 3.
Fig. 3. N-bit shift register with XOR feedback for MLBS generation.
Table 2 shows an example of an output from a shift register
circuit for generating an MLBS of length 24 − 1 = 15. The
feedback is generated from stages 1 and 4. All four columns
in Table 1 produce the same MLBS. The register can be
started with any number other than 0,0,0,0. In the example,
the register starts from 0,0,0,1. Each binary number from
0,0,0,1 to 1,1,1,1 appears exactly once (the sequence starts
repeating after 15 cycles). This is a general result for all
MLBS (Godfrey, 1993). In practice, the values 0 and 1 are
mapped to -1 and +1 to produce a symmetrical MLBS with
an average close to zero.
Table 2: Maximum-length binary sequence from a four-
stage shift register.
Shift Stage 1 Stage 2 Stage 3 Stage 4
1 0 0 0 1
2 1 0 0 0 3 1 1 0 0
4 1 1 1 0
5 1 1 1 1
6 0 1 1 1
7 1 0 1 1
8 0 1 0 1
9 1 0 1 0
10 1 1 1 1
11 0 1 1 0
12 0 0 0 1
13 1 0 0 1 14 0 1 1 0
15 0 0 0 0
16 0 0 0 1
Selection of the feedback connections (stages) is important.
Very few of the possible connections result in a sequence of
the maximum length 2n − 1 (some sequences can be
produced from several different stages). The linear feedback
shift register can be described by a polynomial. The
polynomial has a degree that equals the length of the register
and has coefficients that are either 0 or 1 (depending on the
applied stages). For example, the polynomial of the 15-bit-
length MLBS (4-bit-length shift register) shown in Table 1
has a polynomial x4 + x + 1 (the applied stages are 1 and 4;.
the 1 corresponds to the input of the first bit). A necessary, sufficient condition for the sequence to be maximal length is
that the corresponding polynomial is primitive.
Fig. 4 shows the form of the power spectrum of the MLBS
shown in Table 1. The sequence is generated at 10 kHz and
has signal levels ±1 V. The power spectrum has an envelope
and drops to zero at the generation frequency and its
harmonics. The spectrum is given by
2 2
MLBS 22
1 sin /, 1, 2,...
/
a N q Nq q
N q N
(2)
where q denotes the sequence number of the spectral line, a is
the signal amplitude, and N is the signal length.
19th IFAC World CongressCape Town, South Africa. August 24-29, 2014
10014

Fig. 4. Power spectrum of 15-bit-length MLBS generated at
10 kHz.
The MLBS x has the lowest possible peak factor |x|peak /xrms =
1 regardless of its length. Therefore, the sequence is well-suited for sensitive systems that require small-amplitude
perturbation. Due to the deterministic nature of the sequence,
the signal can be repeated and injected precisely, and the
SNR can be increased by synchronous averaging of the
response periods. Other advantages of the MLBS method
include straightforward generation and design of the
sequence. Because the MLBS has only two signal values, it
can be generated with a low-cost application, the output of
which can only cope with a small number of signal levels.
This is not the case with multi-sine signals, which have an
infinite number of signal levels.
2.4 Measurement system
The method for measuring porosity was based on the electric
frequency-response measurement described in Section 2.2.
The porosity affects the permittivity of a sample, altering the
frequency response of the system. The required electronics of
the measurement system were kept as simple as possible. The
system was built to interface with National Instrument’s PCI-
6052E measurement card. The measurement card sent and measured an excitation of the system and also received the
output signal of the system. The measurement system
consisted of a resistor and a capacitor that formed a first-
order low-pass-filter, presented in Fig. 5. The capacitor was
designed so that the sample could be inserted between the
capacitor plates in a controlled manner.
In the measurement, a sample was placed between the
capacitor plates as a dielectric so that the relative permittivity
of the sample affected the capacitor’s capacitance. The
ceramic samples were 12 mm thick and placed on a 3x3 cm
electrode area that was made of circuit-board material. A ground plane was put on top of the sample. There was
another ground plane under the electrode area on the other
side of the capacitor plane. Due to the measurement
arrangements, the total capacitance of the system consisted of
both the capacitance of the sample capacitor and the system’s
stray capacitance, which was constant. The capacitor was
connected to a 1-MΩ resistor to form a first-order low-pass
filter, whose output was then buffered with an amplifier.
Fig. 5. First-order low-pass filter to measure the porosity of
ceramics. The relative permittivity of samples affects the
filter’s capacitance, shown as C1. C2 represents the constant
stray capacitance.
The MLBS was used as an input signal. The injection was
16,383-bit long and had amplitude of 1 V. The sampling rate
was 100 kHz. The input signal was injected into the system
four times and (1) was used to compute the frequency
response. To eliminate transience and reduce deviation in the
measurements, the frequency response was calculated from
the mean of the last three of those signals and their responses. The higher sampling rate could have improved system
performance, but the measurement card did not enable that.
3. RESULTS AND DISCUSSION
The frequency responses of alumina ceramics with different
porosities were measured. After preparation, the samples
were stored in room atmosphere. Before the measurements,
all samples were oven-dried at 120°C for 24 hours to remove
moisture, which would have interfered with measurements.
After oven-drying, the samples were placed in a desiccator,
where they were allowed to cool to air temperature. In
addition to ceramic samples, the measurements were carried
out with air and a reference sample made of polytetrafluoroethylene (PTFE). With these reference
samples, the functionality of the measurement system was
verified. The calculated magnitude responses are presented in
Fig. 6. In the case of ceramic samples, the presented
magnitude response was a mean of five measurements with
different samples from each porosity group. PTFE was also
measured five times. As presented in Fig. 6, the ceramic
samples gave clearly distinguishable magnitude responses.
19th IFAC World CongressCape Town, South Africa. August 24-29, 2014
10015

Fig. 6. Average magnitude responses of the three alumina
groups having different porosities and the references, air and
PTFE.
For further calculations, we chose the values of -3 dB cut-off
frequencies, which are commonly used to describe the
function of a low-pass filter. The system’s total capacitance also can be determined from this value if resistance R is
known. The total capacitance can be written as follows:
𝐶 =1
2𝜋𝑅𝑓
(3)
Cut-off frequencies and their standard deviations are presented in Table 3. Furthermore, an approximation of the
capacitance caused by the sample was calculated. This was
done by subtracting stray capacitance from the total
capacitance. The stray capacitance was 55.7 pF from
measurements.
Measurements of air, PTFE, and alumina produced expected
results. The measurements showed that when the porosity
increased, the cut-off frequency also increased, so the
samples had lower capacitances. When measuring porous
ceramics, there was more deviation than measuring
nonporous materials such as PTFE. The porous samples were
more prone to variations in air moisture and placement in the
device.
Table 3. Cut-off frequencies of sample materials from
magnitude responses in Fig. 6, -3 dB point, and calculated
capacitances.
Al2O3
3%
Al2O3
18%
Al2O3
33% Air PTFE
-3 dB cut-off
frequency
[Hz]
2412 2497 2580 2826 2759
Deviation of
cut-off
frequencies
[Hz]
10.2 26.4 12.5 0.3 0.5
Total
capacitance
[pF]
66.0 63.7 61.7 56.3 57.7
Capacitance of the sample
[pF]
10.3 8.1 6.0 0.7 2.0
The cut-off frequencies are presented as a function of the
porosities in Fig. 7. There was a clear correlation between the
magnitude response and the porosity. In addition to the relatively small measurement errors, variations were caused
by the material. This is indicated by the horizontal error bars
that denote the porosity variation.
Fig. 7. Average, minimum, and maximum cut-off frequencies
of each sample group, presented as a function of the total
porosities from Table 1.
4. CONCLUSIONS
A frequency-response method, based on broadband excitation
and Fourier techniques, was presented for characterizing porous ceramics. Series of measurements were performed
with different alumina samples. The results included the cut-
off frequencies, which were measured from individual
ceramic samples. The relationship between the cut-off
frequencies and porosities was studied.
There were three groups of samples with different porosities.
The average porosities of the groups were 3 percent, 18
percent, and 33 percent. The results show that the resolution
of the measurement system was sufficient to separate
different porosity groups from each other. Still, the
19th IFAC World CongressCape Town, South Africa. August 24-29, 2014
10016

performance of the measurement system must be increased if
the system is to measure relative permittivity from different
materials.
The presented frequency-response technique can be
efficiently used as a non-destructive tool in online
characterization of porous ceramics. Other advantages
include flexibility, size scaling, and relatively simple
computation algorithms required to compute the responses.
Future research should study the influence of adsorbed water
in porous structure on the electric frequency responses.
REFERENCES
Ahuja, G. and Pathak K. (2009). Porous carriers for
controlled/modulated drug delivery. Indian Journal of
Pharmaceutical Sciences Vol. 71, No. 6, 599–607.
Asmani, M., Kermel, C., Leriche, A., Ourak, M. (2001).
Influence of porosity on Young’s modulus and Poisson’s
ratio in alumina ceramics. Journal of the European
Ceramic Society Vol. 21, 1081–1086.
ASTM Standard C373-88, Standard test method for water
absorption, bulk density, apparent porosity, and apparent
specific gravity of fired whiteware products.
Ciora, R. J. and Liu, P. K. T. (2003). Ceramic membranes for environmental related applications. Fluid/Particle
Separation Journal Vol. 15, No. 1, 51–60.
Coble, R. L. and Kingery W. D. (1956). Effect of porosity on
physical properties of sintered alumina. Journal of
American Ceramic Society Vol. 39, No. 11, 377–385.
Fagan, A. J., Davies, G. R., Hutchison, J. M. S., et al. (2005).
Development of a 3-D, multi-nuclear continuous wave
NMR imaging system. Journal of Magnetic Resonance
Vol. 176, No. 2, 140–150.
Garmash, E.P., Kryuchkov, Y. N. and Pavlikov, V.N. (1995).
Ceramic membranes for ultra- and microfiltration
(review). Glass and Ceramics Vol. 52, No. 6, 150–152. Giesche, H. (2006). Mercury porosimetry: A general
(practical) overview. Particle & Particle Systems
Characterization Vol. 23, No. 1, 9–19.
Godfrey, K. (1991). Design and application of
multifrequency signals. Computing & Control
Engineering Journal Vol. 2, No. 4, 187–195.
Godfrey, K. (1993). Perturbation Signals for System
Identification. Prentice Hall.
James, G. (2004). Advanced Modern Engineering
Mathematics. 3rd ed. Pearson Education Limited.
Kamitakahara, M., Ohtsuki, C. and Miyazaki, T. (2008). Review paper: Behavior of ceramic biomaterials derived
from tricalcium phosphate in physiological condition.
Journal of Biomaterials Application Vol. 23, 197–212.
Lira-Olivares, J., Marcano, D., Lavelle, C. and Sánchez, F. G.
(2000). Determination of porosity by dielectric
permitivity measurements in porous ceramics. Revista
Latinoamericana de Metalurgia y Materiales Vol. 20,
No. 2, 68–79.
Niemelä, T., Aydogan, D. B., Hannula, M., et al. (2011).
Determination of bioceramic filler distribution and
porosity of self-reinforced bioabsorbable composites
using micro-computed tomography. Composites Part A:
Applied Science and Manufacturing Vol. 42, No. 5, 534–
542.
Ojuva, A., Akhtar, F., Tomsia, A. P. and Bergström, L.
(2013). Laminated adsorbents with very rapid CO2
uptake by freeze-casting of zeolites. ACS Applied
Materials & Interfaces Vol. 5, 2669–2676.
Pintelon, R., Schoukens, J. (2001). System Identification: A
Frequency Domain Approach. IEEE Press.
Richerson, D. W. (2006). Modern Ceramic Engineering:
Properties, Processing, and Use in Design. CRC Press.
Sanson, A., Pinasco, P. and Roncari, E. (2008). Influence of pore formers on slurry composition and microstructure
of tape cast supporting anodes for SOFCs. Journal of the
European Ceramic Society Vol. 28, No. 6, 1221–1226.
Sing, K. S., Everett, D., Haul, R. A., et al. (1985). Reporting
physisorption data for gas/solid systems with special
reference to the determination of surface area and
porosity. Pure & Applied Chemistry Vol. 57, No. 4, 603–
619.
Studart, A. R., Gonzenbach, U. T., Tervoort, E. and
Gauckler, L. J. (2006). Processing routes to macroporous
ceramics: A review. Journal of the American Ceramic Society Vol. 89, No. 6, 1771–1789.
Sumirat, I., Ando, Y. and Shimamura, S. (2006). Theoretical
consideration of the effect of porosity on thermal
conductivity of porous materials. Journal of Porous
Materials Vol. 13, No. 3–4, 439–443.
Taud, H., Martinez-Angeles, R., Parrot, J. F. and Hernandez-
Escobedo, L. (2005). Porosity estimation method by X-
ray computed tomography. Journal of Petroleum Science
and Engineering Vol. 47, No. 3–4, 209–217.
Vasiliev, P. O., Ojuva, A., Grins, J. and Bergström, L.
(2010). The effect of temperature on the pulsed current
processing behaviour and structural characteristics of porous ZSM-5 and zeolite Y monoliths. Journal of the
European Ceramic Society Vol. 30, No. 14, 2977–2983.
Vila, R., Gonzalez, M., Molla, J. and Ibarra, A. (1998).
Dielectric spectroscopy of alumina ceramics over a wide
frequency range. Journal of Nuclear Materials Vol. 253,
141–148.
19th IFAC World CongressCape Town, South Africa. August 24-29, 2014
10017

Publication III
MECHANICAL CHARACTERIZATION OF FIBER CERAMICS: EF-
FECT OF TEMPERATURE
by
Järveläinen Matti, Humalamäki Joonas, Laakso Jarmo & Levänen Erkki
Advanced Engineering Materials, 17, 6 (2015), pp. 821–830.
http://dx.doi.org/10.1002/adem.201400512
Reprinted from Advanced Engineering Materials with permission of John Wiley & Sons, Inc., Copyright © 1999 - 2016

DOI: 10.1002/adem.201400512
Mechanical Characterization of Fiber Ceramics: Effect ofTemperature**
By Matti J€arvel€ainen,* Joonas Humalam€aki, Jarmo Laakso and Erkki Lev€anen
1. Introduction
Ceramic fibers are used at high temperatures for thermalinsulation and gas-solid separation. In several gas-filtrationplants, the fiber ceramics have displaced the more advancedceramic materials, such as silicon carbide,[1] because of theirlower price and capability to form filter elements with lowerpressure drop.[2] The use of fibers, instead of granularceramics or metals,[2] in a filter element body is a relativelynew approach that needs attention, especially in monitoringtheir service condition. New monitoring methods are neededbecause the phenomena controlling the lifetime of fibrousfilter elements are different from granular elements. Thedifferences are mostly caused by dissimilar manufacturingmethods. The most basic differences are induced by how themain properties in granular filter elements, porosity, andmechanical strength, are generated. This is carried out by wellunderstood control of granule size and sintering procedure.However, the elements composed of fibers are manufacturedwithout sintering by using a slurry-based vacuum-formingprocess.[3] The sintering stepwith fibrous elements is obviatedby using organic and inorganic binders dedicated to interlinkthe fibers to each other. Leaving out the sintering stage lowersthe cost of fibrous elements, but leads to lowered mechanicalproperties.
Because of the relatively low mechanical properties offibrous elements, it is important to understand how fibrousstructures behave under mechanical load. Several studieshave investigated that with conventional methods, suchas mechanical testing by compressive and four-point bendingtests.[4–6] However, due to the discontinuous and heteroge-neous structure, it is unclear if conventional models, such asWeibull theory, are suitable to describe mechanical propertiesof these fibrous structures. Some authors have also attemptedto characterize fibrous structures by mechanical modeling[7–9]
but the downside of these discrete models is the roughassumption that fibrous structure consists of simple discreteelements connected by nodes. In reality, the structure is much
more complex as the fibers are often randomly oriented andkinked, and fiber diameter and length vary remarkably. Inaddition, other phases, such as binder can be present and arenormally not evenly distributed (Figure 1). All of these factorsimpair the applicability of generalmodels. It is also possible tomeasure the state of single fibers online,[10] but theapplications for that are still far from commercial state.
Due to downsides of conventional mechanical testing andmodeling, newmechanistic approaches have to be developed.We propose erosive-wear testing by grit blasting as a reliableexperimental technique for characterizing these fibrousstructures and demonstrate the technique’s applicability todisplay the effect of thermal loading to fibrous aluminosili-cates. Very few studies are focused on erosive wear of fibrousaluminosilicates.[11,12] Heuer et al. studied high temperatureerosion of amorphous aluminosilicate fibers used in aninsulation application. The insulator felts were either embrit-tled at high temperatures or only erosion-tested at hightemperatures without prior embrittlening. In this case,embrittlement means that the fibrous structure becomes morebrittle, that is, strain corresponding to ultimate strengthdecreases. Heuer noticed that erosion rate increased withtemperature and concluded that there was a significantincrease in erosion rate as the material was heated above990 °C, which was above the temperature where mulliteformed in the material he studied. Furthermore, when thematerial was embrittled by transforming amorphous alumi-nosilicates into cristobalite and mullite in 1,000 h heattreatment at 1,260 °C, the erosion rate was no longer afterthat affected by temperatures between 20 and 1,000 °C. Heuerdid not show that high-temperature erosion tests can be usedto predict ambient erosion of the samples’ heat-treated attemperatures between 20 and 1,000 °C.
The previous studies clearly show that many fibrousstructures undergo embrittlement at high tempera-tures.[4,5,11,12] We add to this by our present study wherewe performed room temperature grit blasting tests to heat-treated aluminosilicates in order to investigate if erosion rateis proportional to their thermal history, as Heuer et al stated.This work is also devoted to determine if mechanicalproperties measured by c-ring testing or acoustic responseby resonant frequency testing can be linked with structuralrigidization. Heuer’s earlier article discusses embrittlement ofthe fibrous structures only after a phase change. We disputethat embrittlement is not just a high-temperature phenome-non linked to crystallization but also occurs at lower
*[*] M. J€arvel€ainen, J. Humalam€aki, J. Laakso, E. Lev€anenDepartment of Materials Science, Tampere University ofTechnology, P.O. Box 589 FIN-33101, Tampere, FinlandE-mail: [email protected]
[**] MSc. Juha-Pekka Nikkanen for proof-reading the article. MSc.TimoHonkola for the idea to use grit-blasting to characterize theceramic samples.
DOI: 10.1002/adem.201400512 © 2015 WILEY-VCH Verlag GmbH & Co. KGaA, Weinheim wileyonlinelibrary.com 1ADVANCED ENGINEERING MATERIALS 2015,
FULL
PAPER

temperatures by other mechanisms, such as sintering andviscous creep in amorphous materials. We propose that thefibers start to adhere by sintering with their neighbors at thedifferent contact points which explains the structuralembrittlement also observed below the crystallization tem-perature. This embrittlement is determined by the fiber’s freelength, that is, the average distance between its contact points.
2. Materials and Methods
2.1. MaterialWe demonstrated functionality of the studied methods
with a tubular component for hot-gas filtration (schematic inFigure 1). According to manufacturer, the componentconsisted of tangled, mainly amorphous aluminosilicatefibers with a mass ratio of 51% SiO2 and 49% Al2O3. Thefibers were bound together with organic and inorganic (silica)binders. The structure was formed from flocked fiber-slurryby vacuum-process.[13]
Figure 1 shows the microstructure of the studied material.Due to the heterogeneity and large size of the investigatedcomponent, the characteristics below contain significantvariations. The randomly oriented fibers were between 1and 10 mm in diameter and shorter than 1,000 mm in length.The fibers were connected with an inorganic binder. Thestructure also contained improperly molten raw material(“shots,” appearance of a drop), easily observed at the tips ofsome of the fibers ranging from 0 to 300 mm. Pores of thecomponent where roughly characterized with a mercuryporosimeter (Micromeritics poresizer 9320) by cutting threerepresentative pieces (125mm3) from the component andmeasuring their effective porosity that was on average 80%(standard deviation 1.9). Average pore diameter was 4 mm(standard deviation 4.3) and the size distribution was widefrom below 1 mm to above 110 mm.
2.2. Heat TreatmentsSamples for c-ring testing, grit blasting, and impulse
excitation were cut from the, initially cylindrical, fibrousaluminosilicate filter elements. After cutting to correct sample
sizes these specimen were heat-treated at 600, 700, 800, 900,and 1,050 °C for 10 h. The heating and cooling rates were5 °Cmin 1. These temperatures were selected to study ifrigidization occurred at relatively low temperatures, espe-cially those below mullite formation.
2.3. Material Characterization
2.3.1. DilatometerDilatometer (Model DI-24, Adamel Lhomargy, Roissy en
Brie, France) measurements with a 10-hour isotherm werecarried out for each heat treatment temperatures to under-stand the sintering behavior of the samples. The samples werecut in radial direction of the filter element, and their size wasthe [sample wall thickness] 7 7 mm2. Wall thickness was20.6 3.3mm.
2.3.2. XRDIn addition to dilatometer tests, XRDwas used to study the
changes in crystalline phases in the heat-treated samples. Themeasurements were carried out at room temperature between10 and 80° angles by step size of 0.013°. The XRD measure-ments were carried out with a PAN analytical Empyrean X-ray diffractometer and monocromatized Cu(alfa) radiation.ICDD card files were used to analyze XRD data.
2.4. Methods
2.4.1. Grit BlastingA sample from the filter element was axially cut into three
120° sections of 30 cm in length. The cut sections were heat-treated in a laboratory furnace. Figure 2 shows an overview ofthe grit-blasting apparatus. Tests were conducted in a cabinet(1). A 120°-cut sample (2) was attached to the sample holder(3) by Velcro tape (4). The grit-blasting gun was model FGGhiotto 28HSS with a bottom container (5) and gun (6) units.The gun barrel (7) length was 83mm and the inner diameterwas 6mm. Air pressure was limited to 0.65 bar, with anoutward relief valve. Glass grit was sucked by this negativepressure from the can into the barrel and blasted at a 90° angleonto the sample surface in 5 s bursts. Blast onset and offsetwas manually controlled with a control valve (8).
Before each blast, the distance from the end of the gunbarrel to the sample surface was adjusted to 35mm. A 5 s-blastwas applied to the sample with previous experimentalparameters. Consistency of the blast was ensured with thefollowing measures: A pressurized, air-operated vibrator toeven grit flow; keeping the glass-grit surface at 60mm fromthemouth of the container; periodic blasting into the referencesample; and periodically mixing and replacing the grit.Finally, the depth of the each crater created by the blast wasmeasured with a slide gauge with 0.01mm accuracy.
The glass grit was round, with diameters between 150 and250 mm. Mass flow of the glass grit was measured byperforming 19 5 s blasts to a 45mm sieve and weighting themass gain of the sieve after each blast.Mass flowvalues varied
Fig. 1. Schematic of the studied filter element and a SEM image of the fibrous structurewith inorganic binder (black arrow) and shot (white arrow).
M. J€arvel€ainen et al./Mechanical Characterization of Fiber Ceramics
2 http://www.aem-journal.com © 2015 WILEY-VCH Verlag GmbH & Co. KGaA, Weinheim DOI: 10.1002/adem.201400512ADVANCED ENGINEERING MATERIALS 2015,
FULL
PAPER

from 1.68 to 2.78 g s 1. Average values and standarddeviations (SDs) were 2.16 and 0.27 g s 1. The mass flowwas not as steady in this grit-blasting setup, intended for on-site measurements, as it would have been in a laboratory-grade erosion system. However, this did not seem to affect theconsistency of the crater depth values. Grit must have acertain momentum to erode material, but increasing massflow does not noticeably affect crater depth.
Particle velocity wasmeasuredwith aHiWatch camera andOseir Spray Monitor software. Figure 2 shows particle-velocity distribution. Velocity of the majority of the particleswas between 14 and 25m s 1. Some particles had highervelocities, up to 32m s 1. Average particle velocity was19.8 3.7m s 1.
2.5. Diametrically Compressive c-Ring Testc-ring testing was carried out in accordance with ASTM C
1323-96.[14] The standard is intended to be used for monolithicadvanced ceramics, but it was applied to fibrous ceramics dueto the lack of suitable and reliable strength-testing proceduresfor heterogeneous materials. Figure 3 shows the schematic ofthe c-ring specimen and strength-test configuration. In ourexperiments, 50 circular specimens of 145.6 6.3mm outerdiameter, 20.6 3.3mm wall thickness, and 20.6 2.8mmheight (b) were cut out from the sample, and 10 circles wereheat-treated at each temperature. The circular samples did nothave exactly round cross-sections due to the manufacturingprocess. There were also variations in wall thicknesses. A slot(L) with length of at least that of the wall thickness was cutfrom the circle so that the part of the ring with the thinnestwall was on the opposite side of the slot. Maximum stresscould be applied to the thinnest side of the ring, ensuring thatall specimens broke down nearly at the same spot. During thetest, the maximum tangential load was located at the outer
surface of the ring, as Figure 3 shows. As the samples broke atthe same place, the calculated hoop strength was comparablebetween each specimen.
Material testing was carried out with an Instron 5967universal testing machine with a 2 kN load cell, with technicalaccuracy of 0.05N. A pre-tension of 2N was used to fastenthe sample between two metal plates, and another wasattached to the load cell. The loading rate was 6mmmin 1,and the test was terminated once there was a drastic drop inthe force-displacement curve. Figure 3 shows an example ofthe stress-strain curve of the sample that was heat-treated at900 °C for 10 h.
Strengths and apparent strains corresponding to ultimatetensile strength were determined from the compression data.Here, apparent strain means vertical displacement of the loadcell during the experiment, rather than true strain, corre-sponding to ultimate strength of the c-ring specimen. Ultimatec-ring strength is given as hoop strength that is derived usingcurved-beam theory and calculated with Equation 1.
sumax ¼P Rbtðr0Þ
ðr0Þ ðraÞðraÞ R
WhereR ¼ ðr0Þ ðriÞ
lnðr0 ÞðriÞ
and ra ¼ðr0ÞþðriÞ
2
In the equations, P is the applied compressive load, ri isinner radius, r0 is outer radius, ra is average radius, b is theaxial thickness shown in Figure 3, t is the radial thickness.[15]
In the experiments, average radius, length, and thicknesswereused to calculate ultimate c-ring strengths. In addition to c-ring strength and apparent strain values, an apparent elasticmodulus or effective rigidity value, given by the slope oflinear region of the c-ring stress (in MPa) versus apparent
Fig. 2. Overview of the grit-blasting apparatus (1) with sample holder (3), sample (2), and grit-blasting gun with grit container (5). Particle velocity distribution in grit-blasting teston the up right corner.
M. J€arvel€ainen et al./Mechanical Characterization of Fiber Ceramics
DOI: 10.1002/adem.201400512 © 2015 WILEY-VCH Verlag GmbH & Co. KGaA, Weinheim http://www.aem-journal.com 3ADVANCED ENGINEERING MATERIALS ,
FULL
PAPER

strain (inmm/mm), was determined to evaluate the effectiverigidity of the discontinuous fibrous material. Indeed, takinginto account such a complex and heterogeneous microstruc-ture, conventional methods of determination of true elasticconstants were not adopted.
2.6. Impulse Excitation TechniqueThe impulse excitation technique[16] was used to determine
resonant frequency values of the heat-treated samples prior tothe grit-blasting experiments. Figure 4 shows the schematicof the resonant-frequency apparatus. Resonant frequencydepends not only on the elastic behavior but is also linked tothe size of specimen.[17] That is why samples were carefullymachined to identical dimensions.
A concave (300 150 mm2 [wall thickness]) 120°-samplewas cut from the original tubular component and it wasplaced on top of a piece of PU foam so that the concave side ofthe sample was lying against it. A microphone was placed at30mm from the other end of the 120° segment of the tubularspecimen and a small rubber mallet was used as the impulsetool. The emitted frequencies were recorded, and dominantresonance frequency was analyzed with custom-madesoftware. Dominant resonant frequency is the frequency peakin the spectrum with the highest amplitude. Dominantresonant frequencies were measured five times for eachheat-treated and non-grit-blasted specimens. Figure 4 shows aschematic presentation of the measuring setup and dominantresonant frequency of the sample heat-treated at 800 °C for10 h. Accuracy of the frequency measurement was experi-mentally found to be 0.1Hz.
3. Results
3.1. Thermal Expansion and ShrinkageFigure 5 shows relative length changes as a function of
temperature for the samples that were heat-treated by holdingthem at target temperatures for 10 h at heating and coolingrates of 5 °Cmin 1. Total shrinkage increased as the heat
treatment temperature increased. Furthermore, the 1,050 °Csample showed rapid change in the sintering curve, starting atabout 970 °C and ending at about 1,020 °C. This was causedby a volumetric phase change to mullite.
Total shrinkage increased with temperature but the steady-state shrinkage rate was highest for the 900 °C sample.Presumably, the amount of softened phase increases at 900 °C,improving viscous flow and the phase’s sintering rate. At1,050 °C, the volumetric-phase change also hampered theshrinkage caused by sintering.
3.2. Crystal StructureFigure 6 shows results of XRD analysis for the heat-treated
samples. At 400 °C, a-alumina (A) was the main crystal phase.The structure also contained a phase at about 30° angle thatcould not be identified, which was possibly some crystallinesilicate. This is indicated by (X). As heat treatment tempera-ture increased to 800 °C, the amount of this unidentified phasegradually increased. At 900 °C, the phase was no longervisible. Mullite peaks were visible in the XRD pattern of thesample heat-treated at 1,050 °C, indicating that most of themullite (M) crystallization took place at somewhere between900 and 1,050 °C. XRD measurements also verified dilatome-ter data that indicated mullite formation started at about1,000 °C. The results agreed with those of Takei et al,[18] whostudied an aluminosilicate fiber with similar composition.
3.3. Grit-Blast ResistanceResults show the applicability of grit-blasting in determin-
ing thermal history of the studied fibrous bodies. We wereinterested if grit-blasting could also be used to studyrigidization of samples that were heat-treated below mull-ite-formation temperature. Figure 10 shows crater depths, andtheir standard deviations, for the heat-treated samples. Craterdepths increased as heat treatment temperature increased.Standard deviations were small, indicating good repeatabilityof the testing method and either homogeneity of the testmaterial or insensibility of the test method to material
Fig. 3. On the left: Stress-strain-curve of the c-ring sample that was heat-treated at 900 °C. On the right: c-ring specimen according to ASTMC 1323-96.[14] Area of maximum stressrastered on the c-ring surface.[28]
M. J€arvel€ainen et al./Mechanical Characterization of Fiber Ceramics
4 http://www.aem-journal.com © 2015 WILEY-VCH Verlag GmbH & Co. KGaA, Weinheim DOI: 10.1002/adem.201400512ADVANCED ENGINEERING MATERIALS 2015,
FULL
PAPER

inhomogeneity. Craters created in samples heat-treated at900 °C showed larger scattering in the crater depths, possiblyimplying that the material was less homogeneous than theother samples. Based on the experiments, grit blasting seemsto be a promising method to determine thermal history of theelements.
3.4. Diametrically Compressive c-Ring StrengthCompressive c-ring tests were conducted on heat-treated
samples to evaluate the sensitivity of this technique to thermalhistory of fibrous structures and if the samples rigidizedwhenheat-treated. Figure 7 shows the results. Similar to grit-blasting tests, values increased as heat treatment temperatureincreased. However, samples heat-treated at 900 °C were an
exception and had lower than average strength than samplesheat-treated at 800 or 1,050 °C. Strength scattering was large,and only 400 and 1,050 °C heat treatments could reliably bedistinguished from each other in terms of strengths.
Figure 7 also plots the effective rigidity values extractedfrom the linear region of the stress–strain curve. The rigidityincreased as heat treatment temperature increased. The valueswidely scattered, and sample heat treatment could not beevaluated based on them. However, temperature caused aslight increase in compressive c-ring strength and rigidity.
3.5. Resonant FrequenciesSimilar to c-ring strength testing, impulse excitation can be
usedtoestimateelasticmodulusofamaterial.Wewereinterested
Fig. 4. Above: schematic of the equipment used to determine dominant-resonant frequencies of the heat-treated samples (ASTM C1259-01).[16] Below: Acoustic-response spectrumand determination of the dominant resonant frequency from the spectrum of the sample heat-treated at 800 °C for 10 h.
Fig. 5. Dilatometer measurement results.
M. J€arvel€ainen et al./Mechanical Characterization of Fiber Ceramics
DOI: 10.1002/adem.201400512 © 2015 WILEY-VCH Verlag GmbH & Co. KGaA, Weinheim http://www.aem-journal.com 5ADVANCED ENGINEERING MATERIALS ,
FULL
PAPER

if therewas amore accurate or repeatablemethod than the c-ringtest to evaluate thermal history offibrous structures. Frequenciesreported in Figure 8 increased as heat treatment temperatureincreased, except for samples heat-treated at 400 or 600 °C, forwhich resonant frequency was roughly equal. Similar to c-ringtesting, the resonant frequency of the sample heat-treated at900 °Chad a lower frequency than samples heat-treated at 800 or1,050 °C. Resonant frequencies had low SD values, implyinggood repeatability of the test method. In addition, the locationwhere the impulse tool hit the specimen did not affect dominantresonant frequency, further improving repeatability and reliabil-ity of the method.
3 4. Discussion
In this work, different on-site techniques for characterizinghighly heterogeneous fibrous ceramics were presented andcompared. The influence of heat treatment temperature (10h,range:400–1050 °C)onmechanicalbehaviorwasalsoexamined.Thegeneralgoalwas to investigate if themethodscanbeused to
determine the maximum temperature the structure wassubjected to as a result of the temperature-caused changes ofmechanicalproperties that areclosely related tomicrostructuralevolution of such structures. Scaled results are presented inFigure 9. Resonant frequency testing had the best repeatabilitybut temperature sensitivity was not good. This method couldonly roughly estimate the thermal history of the samples.Samples heat-treated at 400 and 600 °C show nearly equalresonant frequencies, indicating that the test method was notapplicable todistinguish low-temperatureheat treatments fromeach other. In the samples heat-treated at such low temper-atures, minute variations in the composition, structure, anddimensions of the specimen most likely explained slightlylarger resonant frequency of the sample heat-treated at 400 °C.Resonant frequency is only slightly dependent on the heattreatment temperature. Other factors, perhaps the evidencedphase change, determined the frequency.
Similar to resonant frequency tests, diametrically compres-sive c-ring strength increased as heat treatment temperatureincreased. Strength-test data scattering was large, indicating
Fig. 6. XRD patterns of the heat-treated samples. A refers to a-alumina (Alumina [Rhombohedral]) ICDD no. 04-006-9730) and M to mullite (Mullite [Orthorhombic] ICDD no.98-006-6445). X is an unidentified crystalline phase.
Fig. 7. c-ring strengths and effective rigidity parameter values (calculated from the slope of c-ring stress (MPa) vs. apparent strain [mm/mm]) for the samples heat-treated at differenttemperatures.
M. J€arvel€ainen et al./Mechanical Characterization of Fiber Ceramics
6 http://www.aem-journal.com © 2015 WILEY-VCH Verlag GmbH & Co. KGaA, Weinheim DOI: 10.1002/adem.201400512ADVANCED ENGINEERING MATERIALS 2015,
FULL
PAPER

that method repeatability in determining thermal history offibrous structure is poor. A large number of samples needed tobe tested to estimate the heat treatment temperature. Theaverage elastic moduli in the c-ring test increased slightly asheat treatment temperature increased, implying structuralembrittlement. However, result scattering was vast, which iswhy they could not identify thermal history of the sample.Still, both the elastic moduli and strength showed that thesamples rigidize, especially when the heat treatment temper-ature exceeded the phase-change temperature.
However, the grit-blasting test showed high resolution forthermal-history distinction and its results had a very smallvariation. Crater depths gradually increased as heat treatmenttemperature increased. Crater-depth values followed a
second-order polynomial regression as a function of heattreatment temperature by a coefficient of determinationR2¼ 0.9995. The reason for this unexpectedly fine correlationwith thermal history was that grit-blasting was the onlymethod sensitive to microstructural changes in fiber freelength, while results of the other methods were dominated bystructural inhomogeneities, such as uneven binder distribu-tion seen in Figure 1.
XRD measurements showed that the amount of unidenti-fied crystalline phase increased at 400 to 800 °C. This may bepartially responsible for increased strength, effective rigidity,and resonant-frequency values. The amount of amorphousphase increased at 900 °C, possibly promoting shrinkage viaviscous flow and decreasing strength and resonant frequency.Dilatometer measurements furthermore supported this theo-ry, as isothermal shrinkage rate was highest with the sampleheat-treated at 900 °C. Mullite crystallization at 1,050 °C againincreased strength and resonant frequency, but is responsiblefor the decrease in isothermal shrinkage as the viscous flowwas hampered by the formed mullite. Even so, the grit-blasting strength was not affected by this phase change, butfollowed the sintering temperature. We believe this is due todecreased free length of the fibers.
4.1. Description of Fiber Free LengthC-ring and resonant frequency results can be partially
explained with initial crystallization of an unidentified phase,followed by its disappearance that led to a decrease both instrength and resonant frequency at 900 °C, and finally an
Fig. 8. Resonant frequencies of the samples heat-treated at different temperatures.
Fig. 9. Comparison of the average strengths, ultimate strains, resonant frequencies, and crater depths of the heat-treated samples. SDs of the average values are also plotted in thecolumns.
M. J€arvel€ainen et al./Mechanical Characterization of Fiber Ceramics
DOI: 10.1002/adem.201400512 © 2015 WILEY-VCH Verlag GmbH & Co. KGaA, Weinheim http://www.aem-journal.com 7ADVANCED ENGINEERING MATERIALS ,
FULL
PAPER

increase caused by mullite formation and severe sinteringabove 1,000 °C. However, unlike in c-ring and resonant-frequency tests, the sample heat-treated at 900 °C showed nodecrease in crater depth. It means that this is a differentmechanism from the crystallization which controlled theerosion rate. We believe that fibers sintered to each other andthe increased erosion rates can mainly be explained by
decreased fiber free length, that is, the decrease of the fiber’slength that is between its contact points. Fiber free lengthdecreased as they attached to each other via sintering betweenthe contact points. The length of the fiber subjected to stresscaused by impacting particles in grit-blasting testing de-creased (Figure 10). When this free length decreased, a shortersection of the fiberwas subjected to the same impact force. The
Fig. 10. Crater depths for the samples heat-treated at different temperatures for 10 h. Ten craters were blasted into the sample surface for those heat-treated at 400, 600, 800, and900 °C. Fifteen craters were blasted into the sample heat-treated at 1,050 °C. Below is a schematic of the concept of fiber free length. The contact points (black dots) are caused bysintering of the inorganic glassy phase and are responsible for decreased free length. SEM images of the samples treated at 400 and 1,050 °C.
M. J€arvel€ainen et al./Mechanical Characterization of Fiber Ceramics
8 http://www.aem-journal.com © 2015 WILEY-VCH Verlag GmbH & Co. KGaA, Weinheim DOI: 10.1002/adem.201400512ADVANCED ENGINEERING MATERIALS 2015,
FULL
PAPER

fibers’ capability to absorb impact energy from the glass gritdecreased and the probability of fibers breaking under erosionincreased, leading to deeper craters. In a sense, grit-blastingmeasured the state of fiber stacks, whereas the other methodsmeasured the mechanical integrity of the whole structure.
Craters created in the sample heat-treated at 900 °Cexhibited larger SDs than those created in the samplesheat-treated at lower temperatures. Phase change at 900 °Cshould produce a macroscopically heterogeneous structurebecause the overall composition in the sample is non-homogeneous and that explains larger variations in craterdepths. At 1,050 °C,mullite formationwas also responsible forstructure embrittlement. At 1,050 °C, increased, acceleratederosion rate is caused by the sum of the structure embrittle-ment by mullite crystallization and a decrease of free lengthcaused by sintering of the structure, which is the dominantfeature. Sintering is an irreversible process, so the grit-blastingwill show the peak temperature the structure has beensubjected to.
5. Conclusion
We presented several methods to characterize fibrousaluminosilicate samples heat-treated for 10 h at temperaturesranging from 400 to 1,050 °C. This study’s goal was to developon-site methods to monitor changes of mechanical propertiesof products consisting of such structures. Studied methodsincluded diametrically compressive c-ring strength test,resonant-frequency test, and erosion test by glass-gritblasting. The c-ring test showed an increase in a sample’saverage strength and rigidity as heat treatment temperatureincreased. Similarly, in the impulse-excitation technique,dominant resonant frequency of the sample increased as heattreatment temperature increased. Samples heat-treated at900 °C showed lower strengths, moduli, and resonantfrequencies than did samples heat-treated at 800 and1,000 °C. This was explained by crystalline phase changesbetween the temperatures. However, both the c-ring test andresonant frequency test showed such a large scattering ofthe measured values that the thermal history could not bedistinguished from the data. This was probably because themeasurements were also affected by other factors such asstructural defects within the structure.
Unlike the c-ring strength and resonant-frequency meas-urements, the grit-blasting test accurately and reproduciblydistinguished between different heat treatments. The methodwas fast, accurate, and could probably also characterize howother fibrous ceramics sinter in the analyzed temperaturerange via linking the sintering with the concept of fiber freelength that we proposed in this article. The concept explainedthe high sensitivity of the grit-blasting method. Free-length isthe distance between the fiber contact points to neighboringfibers or other structures. The free length decreased when thesample’s heat treatment temperature increased. This hap-pened because the fibers sintered to each other, creating newcontact points. When the free length decreased, the fibers had
fewer degrees of freedom tomovewhen theywere hit by glassgrit. This was seen as an increase in crater depths in highertemperature.
This paper only discussed the effect of thermal load onmechanical properties of the elements. Also chemicals,especially alkalis, affect properties of fiber ceramics.[19–27]
Further studies should investigate the applicability of themethod when the fibers have been in contact with chemicals.
Received: November 12, 2014Revised: January 27, 2015
[1] S. Schaafhausen, E. Yazhenskikh, J. Eur. Ceram. Soc. 2014,34, 575.
[2] S. Heidenreich, Fuel 2013, 104, 83.[3] R. F. Allen, United States Patent Application Publication
Number 2008/0314012 A1, 2008, US20080314012 A1.[4] J. Humalam€aki, Mechanical Characterization of Fibrous
Ceramic Filter Elements, Tampere University of Techno-logy, Tampere, Finland 2013.
[5] P. Laihonen, Evaluation of Mechanical Integrity of FibrousHot Gas Filter Elements, Tampere University of Technol-ogy, Tampere, Finland 2012.
[6] D. Muller, W. Acchar, G. M. C. Silva, E. A. Moreira,J. R. Coury,M. D.M. Innocentini, D. Hotza, C. R. Rambo,S. Carlos, Cerâmica 2009, 55, 318.
[7] D. V. Wilbrink, L. a. a. Beex, R. H. J. Peerlings, Int. J.Solids Struct. 2013, 50, 1354.
[8] D. Tsarouchas, a. E. Markaki, Acta Mater. 2011, 59, 6989.[9] M. Delince, F. Delannay, Acta Mater. 2004, 52, 1013.[10] S. M. Toffoli, R. L. Lehman, J. Am. Ceram. 2001, 28, 123.[11] V.Heuer, G.Walter, I. Hutchings,Wear 1999, 225–229, 493.[12] V. Heuer, G. Walter, I. Hutchings, Wear 1999, 257.[13] J. S. Zievers, Hot Gas Filter, US Patent number 4, 1990,
968, 467.[14] ASTM C 1323, Ultimate Strenght of Advanced Ceramics
with Diametrally Compressed C-Ring Specimens at AmbientTemperatures, ASTM, West Conshohocken, PA 2014.
[15] C. Brinkman, S. Duffy, Life Prediction Methodologiesand Data for Ceramic Materials, ASTM International,Philadelphia, PA 1994.
[16] ASTM C1259-01, Standard Test Method for DynamicYoung’s Modulus, Shear Modulus, ASTM, West Consho-hocken, PA 2014.
[17] J. Mohapatra, Y. Kamada, H. Kikuchi, 212.8.206.21 2011,21, 159.
[18] Tt. Takei, A. Yasumori, K. Okada, J. Am. Ceram. Soc. 1999,82, 2876.
[20] G. L. B. Stephen, C. Carniglia, in Handb. Ind. Refract.Technol. Princ. Types, Prop. Appl., Noyes Publications,1999, 255.
[21] B. K. Novakovik, Rada, in Adv. Ceram. Use HighlyOxid. or Corros. Environ., Trans Tech, Uetikon-Zuerich,Switerland; Enfield, NH 2001, 121.
M. J€arvel€ainen et al./Mechanical Characterization of Fiber Ceramics
DOI: 10.1002/adem.201400512 © 2015 WILEY-VCH Verlag GmbH & Co. KGaA, Weinheim http://www.aem-journal.com 9ADVANCED ENGINEERING MATERIALS ,
FULL
PAPER

[22] J. C. Lee, H. J. Song, M. J. Park, H. I. Shin, Colloids Surf. APhysicochem. Eng. Asp. 2001, 187–188, 399.
[23] M. Schmucker, P. Mechnich, S. Zaefferer, H. Schneider,J. Eur. Ceram. Soc. 2008, 28, 425.
[24] Y. Wang, J. Liu, Corros. Sci. 2009, 51, 2126.
[25] S. L. Gao, E. M€ader, R. Plonka, Acta Mater. 2007, 55,1043.
[26] M. R’Mili, J. Lamon, Acta Mater. 2011, 59, 2850.[27] J. J. Haslam, F. F. Lange, J. Am. Ceram. Soc. 2006, 89, 985.[28] S. Duffy, J. Test. Eval. 2005, 33, 6.
M. J€arvel€ainen et al./Mechanical Characterization of Fiber Ceramics
10 http://www.aem-journal.com © 2015 WILEY-VCH Verlag GmbH & Co. KGaA, Weinheim DOI: 10.1002/adem.201400512ADVANCED ENGINEERING MATERIALS 2015,
FULL
PAPER

Publication IV
THE MECHANICAL PERFORMANCE AND CO2 UPTAKE OF ION-
EXCHANGED ZEOLITE A STRUCTURED BY FREEZE-CASTING
by
Ojuva Arto, Järveläinen, Matti, Bauer Marcus, Keskinen Lassi, Valkonen Masi,
Akhtar Farid, Levänen Erkki & Bergström Lennart
Journal of European Ceramic Society, 35, 9 (2015), pp. 2607–2618.
http://doi.org/10.1016/j.jeurceramsoc.2015.03.001
Reprinted from Journal of European Ceramic Society with permission of Elsevier B.V. Copyright © 2016 Elsevier B.V.

Available online at www.sciencedirect.com
ScienceDirect
Journal of the European Ceramic Society 35 (2015) 2607–2618
Mechanical performance and CO2 uptake of ion-exchanged zeolite Astructured by freeze-casting
Arto Ojuva a,b, Matti Järveläinen c, Marcus Bauer a, Lassi Keskinen c, Masi Valkonen d,Farid Akhtar a,e, Erkki Levänen c, Lennart Bergström a,∗
a Department of Materials and Environmental Chemistry, Stockholm University, SE-10691 Stockholm, Swedenb Berzelii Center EXSELENT on Porous Materials, Stockholm University, SE-10691 Stockholm, Sweden
c Department of Materials Science, Tampere University of Technology, PO Box 589, FIN-33101 Tampere, Finlandd Department of Signal Processing, Tampere University of Technology, PO Box 589, FIN-33101 Tampere, Finland
e Division of Materials Science, Luleå University of Technology, SE-97187 Luleå, Sweden
Received 21 November 2014; received in revised form 28 February 2015; accepted 2 March 2015Available online 26 March 2015
Abstract
Zeolite 4A has been freeze-cast into highly porous monoliths with a cylindrical shape. The brittle monoliths, with lamellar or columnar pores andwall thicknesses between 8 and 35 m, show a compressive mechanical response along the main pore axis that could be modeled by a bucklingbehavior. The failure strength is proportional to the density and the amount of transverse bridging across lamella, which was shown to be related tothe pore cross-sectional aspect ratio. Monoliths with highly anisotropic pores with a cross-sectional aspect ratio higher than 3 yielded sequentiallyfrom the top surface, whereas monoliths with a pore aspect ratio lower than 3 were found to delaminate into longitudinal splinters. The freeze-castmonoliths show a sharp gas breakthrough front with a 1:9 mixture of CO2 and N2, indicating rapid uptake kinetics of the lamellar structures.© 2015 Elsevier Ltd. All rights reserved.
Keywords: Freeze-casting; Porous ceramics; Mechanical strength; Zeolite A; Laminate
1. Introduction
The growing increase of the emission of anthropogeniccarbon dioxide has put increasing pressure on developing tech-nologies which can rapidly mitigate the emissions and are readilyapplicable to point sources of high emission density, e.g., coal-fired power plants.1–4 The primary challenge in capturing CO2from a flue gas stream containing post-combustion products(mainly N2 and CO2) lies in the cost- and energy-efficient sep-aration of very large volumes of CO2 at a low partial pressure(0.10–0.15 bar) from mainly N2.
While various technologies, such as cryogenic separation5
and amine scrubbing,6 have been proposed for the task, CO2/N2separation using solid sorbents via the established temperature
∗ Corresponding author. Tel.: +46 8 162368; fax: +46 8 152187.E-mail address: [email protected] (L. Bergström).
or pressure swing technologies is a promising route due to its lowenergy demand and material cost.7 Although various promisingsorbent materials have been studied, including metal-organicframeworks,8,9 mesoporous silica,10,11 microporous silicates,12
polymers13–15 and activated carbon,16,17 zeolite adsorbents area robust and widespread group of adsorbents already in usewithin many applications. The regeneration of the physicallyadsorbed gas demands relatively small amounts of energy, typ-ically 40–50 kJ/mol depending on the loading.18
The separation in pressure or temperature swing processesusing adsorbents is achieved by streaming the gas mixturethrough a long adsorbent column, often several cubic metersin volume, and controlling the adsorption affinity of one of thespecies by pressure or temperature. The adsorbent is often in theform of small extruded rods or beads (2–5 mm),11,19 which arepacked on trays or into a bed in the separation column in varioussizes and shapes, depending on the application. The velocityof the adsorption front through the bed will govern the time
http://dx.doi.org/10.1016/j.jeurceramsoc.2015.03.0010955-2219/© 2015 Elsevier Ltd. All rights reserved.

2608 A. Ojuva et al. / Journal of the European Ceramic Society 35 (2015) 2607–2618
allowed for adsorption: the gas flow will typically be stoppedwhen the adsorbing species reaches the far end of the bed, thebed is purged from the adsorbed species, and a new separationcycle begins.
The efficiency, or the total time-dependent uptake, of theadsorbent bed is limited by the micropore diffusion within theadsorbent particles, which depends on the particle size and thethickness of the walls. The pressure profile along the bed shouldbe kept uniform; a large gas flow is enabled by wide channelswith low tortuosity. These demands call for an efficient adsor-bent design to ensure both laminar flow and rapid microporediffusion. Thin lamellar structure with sheet width and spacingat or less than 200 m has been identified by Webley et al.20,21
to enable a rapid and efficient uptake with minimum diffusionresistance and small pressure drop.
However, lamellar monoliths with sheet spacing under a mil-limeter are difficult or impossible to shape by extrusion; previousreports indicate that the smallest spacing for thin walled honey-combs is 700 m.22 Significant reduction of the wall spacingrequires that alternative shaping methods are used. One promis-ing approach is the solvent solidification route: we recentlyshowed that freeze-casting of zeolites23 could yield monolithsfor rapid CO2 uptake with a lamellar structure and sheet widthand spacing below 35 m. The monoliths were produced bydirectional freezing of an aqueous suspension containing zeolite13X and a binder. After the suspension was completely frozen,the ice was removed by sublimation and the remaining lamellarstructure was consolidated by thermal treatment. While zeolite13X is a good adsorbent, it has a relatively low CO2-over-N2selectivity compared with other zeolites, such as the zeolite Achosen for this study.24
The mechanical strength of the adsorbent monoliths needs tobe sufficiently high to sustain stresses induced by handling andfluctuations in pressure and gas flow. Mechanically, a lamellarpore structure can be treated with same mathematical approx-imations as anisotropic open cellular solids, e.g., honeycombceramics and porous wood. These types of structures havebeen studied extensively, e.g., by Ashby and Gibson,25 whohave related the mechanical properties of porous structures tothe properties of the bulk material, scaled by porosity.26 Withincreasing porosity, a number of various failure mechanisms,such as buckling or bending, will dominate the mechanicalresponse.
The mechanical properties of different types of low-densityporous materials have recently been investigated; Donius et al.found the Gibson–Ashby scaling laws to accurately describethe compressive behavior of freeze-cast nanocellulose-clayaerogels.27 Porter et al. found that the Euler buckling is the dom-inating mode of failure for freeze-cast porous titania bodies andrelated the axial compressive strength to the pore aspect ratio.28
Introducing anisotropy in the cell walls by forming them out offlat platelets has also been attempted, and it was found that let-ting the platelets to assemble along the direction of the freezingfront considerably enhanced the mechanical properties as com-pared to spherical particles.29–32 In an interesting study, Tanget al.33 froze a monolith in a cylindrical shape simultaneouslyfrom the bottom of a mold and radially inwards from its sides,
resulting in both axially and radially ordered structures, whichnearly doubled the compressive strength in the radial directionas compared to monoliths with only axial ordering. However,little attention has been given to investigations of the mechan-ical properties of freeze-cast adsorbents produced from porousparticles. The ambition to shape highly anisotropic hierarchi-cally porous structures for gas separation applications requiresthat we understand the failure behavior in detail.
In this work, we have investigated how mechanically stable,anisotropically porous, composite monoliths can be producedby freeze-casting suspensions of zeolite A, bentonite clay andpolyethylene glycol, and the subsequent removal of ice by subli-mation and heat treatment at 1023 K. The mechanical propertiesof the anisotropically porous monoliths has been measured anddiscussed with respect to the dominating failure mechanism. Wehave analyzed cross-sectional images of the monoliths using acomputer algorithm for principal component analysis in order toquantify the pore size and shape and related the pore anisotropyto the mechanical properties of the freeze-cast monoliths. Wehave also determined the suitability of freeze-cast monolithsbased on LTA in its NaA-form (zeolite A) and two differentpotassium-exchanged NaKA-forms for CO2/N2 separation bydetermining the time-dependent gas breakthrough of CO2.
2. Experimental
Zeolite with the framework Linde Type A (LTA) in itssodium-containing form, known as zeolite 4A or NaA, wasobtained as a powder with an average particle size of 2–4 m(Fig. 1) from Luoyang Jianlong Chemical Industrial Co., LTD(Yanshi, Henan, China). Bentonite, which was used as aninorganic binder, and polyethylene glycol (PEG, MW 8000),which was used as an intermittent binder, were both obtainedfrom Sigma–Aldrich (Sigma–Aldrich Chemie GmbH, Buchs,Germany).
The ion-exchange process of NaA into NaKA, adapted fromCheung et al.,34 was carried out in an aqueous mixture of the
Fig. 1. SEM image of NaA (zeolite A) showing cubic particles with a sizedistribution of 2–4 m.

A. Ojuva et al. / Journal of the European Ceramic Society 35 (2015) 2607–2618 2609
zeolite and potassium salt: 10.0 g of zeolite was mixed in1.00 dm3 of de-ionized water in a vessel under continuous stir-ring. Then, depending on the intended exchange ratio, either0.800 g of KCl (Sigma–Aldrich) to produce 17.6% K-exchangedor 0.400 g of KCl to produce 10.2% K-exchanged zeolite A(as determined by energy-dispersive X-ray spectroscopy, EDX),was added and the mixture was stirred for 30 min. The ion-exchanged zeolite was filtered and washed twice with de-ionizedwater, after which the retained powder was dried in an oven at373 K overnight. The elemental composition of the powders wascharacterized in a scanning electron microscope with a field-emission gun (JEOL JSM-7001F, Jeol Ltd., Tokyo, Japan) byenergy-dispersive X-ray spectroscopy.
The rheological measurements were performed at 298 K witha Paar Physica MCR301 rheometer (Anton Paar GmbH, Graz,Austria), using a concentric cylinder geometry. First a pre-shearat 50 s−1 was done during 120 s, after which the suspension wasallowed to rest for 30 s before the shear viscosity was measuredat a rate of 200 s−1 during 360 s.
Before they were freeze-cast, the zeolites were conditionedovernight in a constant climate chamber (KBF 115, BinderGmbH, Germany) at 303 K and 50% relative humidity. Thisconditioning was determined to stabilize the water content to21.3 ± 0.7 wt%, determined by thermogravimetry from roomtemperature to 1173 K, at 10 K/min, using TGA 7 (PerkinElmer,Waltham, USA). The conditioned zeolites were mixed withPEG, bentonite and deionized water (see Table 1) in a millingflask with 5 mm zirconia milling balls and milled overnight inorder to de-agglomerate the suspension. The suspension wasde-aired under stirring at a low vacuum created by a water tapaspirator for 5 min.
The freeze-casting unit was identical to the one described inour previous work,23 consisting of a liquid nitrogen vessel and aprotruding copper rod with a thermocouple and a heater on thetop, controlled by a control unit, Jumo cTron 08 (Jumo GmbH& Co. KG, Germany). The controller allowed the user to set aconstant cooling rate during the casting. The suspension to becast was poured in a cylindrical PTFE die with a copper bottomplate. The die had an inner diameter of 20.0 mm and two dif-ferent heights: 20 and 40 mm. The former were used to preparemonoliths with a precise height for mechanical testing, and thelatter to prepare tall monoliths (30–35 mm) for breakthroughmeasurements.
Table 1The identity of the suspensions and their compositions.
Suspension ID A20 A25 A30 A32
Total inorganic content(wt% dwb)
18.3 22.9 27.4 29.2
DI water (cm3) 100 100 100 100Zeolite A (g) 26.5 36.2 47.7 53.0Bentonite (g) 3.61 4.95 6.51 7.21PEG (g) 3.61 4.95 6.51 7.21
The mass reported on the row for zeolite A was the actual mass of the zeolite thathad been conditioned in a climate chamber, containing 21.3 ± 0.7 wt% water.The relative amounts of bentonite and PEG to the zeolite were kept constant.
The frozen ice/powder compacts were sublimed in a freeze-dryer (Hetosicc, Heto lab equipment, Denmark) at 20–40 Pa for 2days. The resulting porous powder bodies were thermally treatedin a muffle furnace (Nabertherm GmbH, Lilienthal, Germany)under air. The powder bodies were first heated to 823 K at2 K/min, where the temperature was kept constant for 2 h inorder to remove the intermittent organic binder PEG, and thento 1023 K at 10 K/min with no holding time.
Scanning electron microscope images were obtained witha JEOL JSM-7001 F microscope (Jeol Ltd., Tokyo, Japan)and with a Hitachi Analytical TableTop Microscope TM3000(Hitachi High-Technologies Europe GmbH, Krefeld, Germany).Representative pieces were prepared from the middle of themonolith and cut into a suitable size (a few mm) with a scalpeland placed on a conductive holder with Leit-C conductive carboncement (Plano GmbH, Wetzlar, Germany). Finally the pieceswere coated either with a thin layer of gold (JSM-7001F) orcarbon (TM3000) prior to insertion into the microscope.
The mechanical tests were performed with an Instron 5967(Instron, Norwood, MA, USA) mechanical testing device. Themonoliths were placed on a metal plate in a small plasticbag between two rubber pieces to distribute the load moreevenly. The monoliths were compressed with a 2 kN load cellat 10.0 mm/min while the applied force and piston movementwas recorded. The compressive stress for each monolith wascalculated by dividing the measured compressive force with thediameter of the monolith. The compressive strain was calculatedby dividing the initial height of the monolith with its actual heightthat was read from the piston movement during compression.For standard tests, three monoliths from each composition weretested, and the averaged value reported. For Weibull analysismore monoliths were made from the highest and lowest concen-tration suspensions, i.e., A20 and A32, and frozen at either 1.5or 10.0 K/min. For these measurements the plastic bag and therubber pieces could be omitted as the top surfaces of the mono-liths were made flat by grinding with fine sandpaper, and thecompression speed was reduced to 0.50 mm/min. The Weibullanalysis was performed on 3–10 monoliths of each identity.
The time-dependent gas breakthrough tests were performedon a stacked column of freeze-cast monoliths with a total columnlength of 15 cm, as shown in Fig. 2. The monoliths were activatedunder a flow of N2 at a rate of 0.15 L/min at 573 K for 12 h. Afteractivation, the monoliths were cooled to 298 K. At time zero, thegas feed was switched from N2 to 0.15 L/min flow of 10% CO2in N2 using a pneumatic switching valve. The switching timewas less than 0.1 s. The concentration of CO2 in the gas leavingthe column was measured as a function of time using a CO2analyzer (IR 1507 fast response CO2 infrared transducer).
3. Results and discussion
Composite monoliths with a lamellar porous structure wereprepared from aqueous suspensions of zeolite A, bentonite andpolyethylene glycol (PEG). The suspensions were frozen unidi-rectionally, starting from the bottom of a cylindrical die that wasset to cool at a constant rate. After freezing, the ice was sublimedin a freeze-dryer and the remaining compact powder body was

2610 A. Ojuva et al. / Journal of the European Ceramic Society 35 (2015) 2607–2618
Fig. 2. Photograph of the gas breakthrough apparatus (a); and the column (b). The column consists of 6–7 monoliths, with a total length of 15 cm, of A20 withvarying potassium loading frozen at 10 K/min. After activation with N2, a gas mixture containing 10% CO2 was let in the column at 150 ml/min, and the relativeconcentration of CO2 was measured at the outlet.
thermally treated to obtain a mechanically strong monolith witha continuous and directional porosity.
The maximum suspension concentration was determinedfrom rheological measurements. The maximum solids loadingcan be determined by:35
1 − η−1/nr = a′φ + b′ (1)
where ηr is the relative viscosity (viscosity of the suspensiondivided by the viscosity of the solvent, water + PEG), n is aflow parameter, where we used a typical value of 2, ϕ is thesolids loading of the suspension, and a′ and b′ are empiricallydetermined parameters from the rheology measurements. Fig. 3shows that the predicted maximum loading is 31.4 wt%; howeversuspensions with concentrations above 30 wt% were found to betoo viscous for freeze-casting. The highest solids loading thatwe have used was 29.2 wt% dwb.
The crushing strength σ* for a thick-walled anisotropicporous solid (e.g., a honeycomb) can, along its main axis, bedescribed by36:
σ∗ = σs
ρ
ρs
(2)
where σs is the fracture strength of the (non-porous) bulk mate-rial and ρ/ρs is the relative density of the material. Isotropicbrittle foams, where the cell walls also experience bending stress,can be described according to the expression by Ashby andGibson:25,26,37
σ∗ = σsC
(ρ
ρs
)3/2
(3)
where C is an empirical constant relating to the dominant typeof deformation, e.g., 0.65 for brittle foams.37,38 Materials witha low elastic modulus E and a high length to thickness ratio can
fail before fracture at the elastic buckling strength, σel, accordingto39:
σel = EIπ2
k′L2 (4)
where E is the elastic modulus of the material, L is the lengthof the buckling wall or beam, I is the area moment of inertiaof the cross-section of the cell edge or wall28 and k′ describesthe degree of constraints for the attachment points of the wall.The theoretical requirement for buckling to occur is for the fail-ing element, such as a wall with a cross-sectional area Aw, to
Fig. 3. Plot of 1−ηr−1/n versus the total inorganic content for the zeolite-
bentonite-PEG suspension. The circles show the measured values from the foursuspensions (A20, A25, A30, A32) used in the preparation of the monoliths andthe straight line is the linear least squares fit to the data.

A. Ojuva et al. / Journal of the European Ceramic Society 35 (2015) 2607–2618 2611
Fig. 4. Compressive strengths and microstructures of freeze-cast zeolite A-basedmonoliths prepared at a constant cooling rate of 10 K/min. (a) The compres-sive strengths of a series of monoliths made from suspensions with varyingsolids loadings, (b) the SEM graphs from the cross-sections of the monoliths forA20–A32. The scale bar is 100 m.
have a slenderness ratio L/r, where r = √I/Aw, that exceeds a
minimum value39:
L
r> π
√E
σ∗ (5)
Eq. (5) is satisfied for the freeze-cast monoliths when thelength of a free wall section exceeds 200 m, after which thebrittle zeolite/bentonite composite wall will buckle during com-pression.
We have investigated the compressive strengths of severalfreeze-cast monoliths: first we tested two series, one series thatfocused on the influence of the density where monoliths freeze-cast at different suspension concentrations the same cooling rate,and another series that inspected the influence of the cooling rate,at a constant solids loading, on the strength.
Fig. 5. Compressive strengths and microstructures of freeze-cast zeolite A-basedmonoliths prepared from A30-suspensions at cooling rates between 0.5 and10 K/min, showing (a) the compressive strengths of a series of monoliths, and(b) SEM micrographs from the cross-sections of the monoliths. The scale bar is100 m.
Fig. 4 shows that the strength increases proportionally tothe solids loading. This behavior is typical for brittle cellularsolids without bending deformations and thick-walled honey-comb structures. Extending the linear relation to a dense materialsuggests that the maximum strength should be 1110 kPa, andextrapolating down to zero strength suggests the lowest limit forthe solids loading is 16.5 wt%.
Fig. 5a shows that there is a significant difference in thecompressive strengths between the monoliths freeze-cast atslow cooling rates (0.5 or 1.5 K/min) compared to the mono-liths freeze-cast at high cooling rates (5.0 or 10.0 K/min): thecompressive strength drops to approximately one half for themonoliths freeze-cast at slow cooling rates compared to themonoliths that were freeze-cast at high cooling rates. The visibledifferences in the scanning electron micrographs, Fig. 5b, showhow the structure changes for the different cooling rates. Slow

2612 A. Ojuva et al. / Journal of the European Ceramic Society 35 (2015) 2607–2618
Fig. 6. SEM cross-sectional images of the four monoliths: (a) and (b) are A20 frozen at 1.5 and 10 K/min, respectively, and (c) and (d) are A32 frozen at 1.5 and10 K/min, respectively. The scale bar is 100 m.
Fig. 7. Snapshots before (a, c), and after (b, d), of composite freeze-cast zeolite/bentonite monoliths subjected to a compressive strength test. Images (a) and (b) relateto monoliths made from suspension A32 by freezing at 1.5 K/min, and images (c) and (d) relate to monoliths made from suspension A20 by freezing at 1.5 K/min.The surface of the monoliths has been painted with small black dots in order to better follow the deformation of the surface.

A. Ojuva et al. / Journal of the European Ceramic Society 35 (2015) 2607–2618 2613
Fig. 8. Stress–strain curve for monoliths prepared from suspensions; (a) A32 and (b) A20 cooled at 1.5 K/min. The insets show typical SEM micrographs for thestructures.
cooling of the suspensions leads to well-separated ice and zeo-lite/bentonite composite sheets, which creates a monolith withthick and clearly isolated lamella. On the other hand, rapid cool-ing reduces the lamella thickness and increases the number oftransverse bridges or struts between them, to the point where,for the 10.0 K/min monolith, the pores are clearly more roundthan lamellar, and the structure is much more isotropic. Thehigh number of struts will distribute the compressive stress tothe adjoining lamella, whereas a limited number will result in amore localized fracture behavior of the individual lamella.
In order to further probe the stress-strain behavior of themonoliths, four monolith series were prepared from suspensionsof both low and high solids loading at slow and fast cooling: A32at 1.5 and 10.0 K/min and A20 at 1.5 and 10.0 K/min, as shownin Fig. 6.
The compression behavior of the freeze-cast monoliths underincreasing load was carefully recorded with a high-speed cam-era; Fig. 7 shows snapshots before compression and duringfracture of two of the monoliths. Their corresponding stress-strain curves in Fig. 8 show that elastic-brittle26 failure is typicalfor freeze-cast monoliths: the linear elastic region at low stressis controlled by bending of cell walls, and at higher strains thematerial starts to collapse and the stress decreases sequentially.The compression experiment was terminated before the finalregion where the stress starts to increase again due to densifi-cation of the porous structure. Fig. 8 shows that the maximumstress occurs at a much smaller strain for the denser monolith(A32) compared to the less dense monoliths (A20). Fig. 7 showsthat A32 holds together in a coherent piece, breaking graduallyinto thinner and thinner longitudinal splinters, whereas the muchweaker monolith A20 collapse by a process where the thin, rela-tively isolated, lamella fail individually and crumble very closeto the top of the monolith.
We have made an attempt to retrieve more quantitative infor-mation on the pore anisotropy from the SEM graphs with digitalimage analysis. A computer algorithm was used to convert thegrayscale image into a binary one containing empty pores anddense walls. Morphological dilation smoothened out any unreal-istically small features and noise, and an algorithm for a principal
Fig. 9. Cross-sectional SEM images of a monolith frozen at 1.5 K/min fromA32 suspension. The top images display the unprocessed cross-sectional SEMimage, and the bottom image shows the result after image processing, outliningthe pore boundaries. The inset in the bottom image shows details of ellipsoidsthat represent the pores, and the arrows are the semi-major and semi-minor axesof the ellipsoids, or half of the pore major and minor axis, respectively. Aninteractive version of the figure is available as supplementary information.

2614 A. Ojuva et al. / Journal of the European Ceramic Society 35 (2015) 2607–2618
Fig. 10. The maximum compressive strengths of four monoliths with differentwall thicknesses. Each point contains information on which dispersion (A20(open symbols) and A32 (closed symbols)) and what cooling rate (1.5 K/min(diamonds) or 10 K/min (boxes)) the monoliths were freeze-cast at. The errorbars are the standard deviations for the measured wall thicknesses (horizontalbars) and compressive strengths (vertical bars).
component analysis was used to find the main axis and the centerpoint of the pore. Orthogonal major and minor axes were thencalculated from the pore center point, and used to draw ellip-soids for each pore in order to quantify the cross-sectional porewidth, pore area, and pore aspect ratio, individually. A typicalprocessed image is shown in Fig. 9.
As seen in Fig. 10, combining the estimates of wall thick-ness from the image analyses with the compressive strengthsdata shows that even if a high solids loading results in a highstrength, a strong monolith can also be obtained by decreasingthe wall thickness, i.e., by increasing the cooling rate. Increasingthe cooling rate at constant solids loading, i.e., porosity, organizethe lamella into several thin sections, that are much less likelyto contain a flaw big enough to be critical for the entire vol-ume under stress, analogous to the well-known effect in densematerial where the strength increases as the characteristic lengthscale decreases.40
The influence of the pore morphology of freeze-cast mono-liths on the strength was recently investigated by Porter et al.28
who found a correlation between the compressive strength σ*of the porous solid and the pore aspect ratio χ, and showed thatthe strength could be predicted with an expression based on theEuler buckling theory (Eq. (4)) by modifying the expression ofinertia and adding a surface roughness parameter:
σ∗ = πq2E
(k′L)2
(A2
w
3b2
(1
x
)2
+ Aw
2
(1
x
)+ b2
4
)(6)
where q is an empirical factor relating to the surface roughness ofthe lamella, E is the elastic modulus, k’ is a geometry parameter,L is the lamellar wall height, Aw is the wall cross-sectional area
Fig. 11. The compressive mechanical strength σ* versus the average cross-sectional pore aspect ratio of the freeze-cast monoliths. The open symbols denotelow-density monoliths, cast from the A20 suspension, and the closed symbolsdenote high-density monoliths out of A32. Squares indicate a cooling rate of10 K/min and diamonds 1.5 K/min. The blue crosses connected with a dottedline indicate the calculated compressive strengths according to Eq. (6) usingdata from Table 2.
(Aw = ad, a is the pore main axis and d is the wall thickness) andb is the pore minor axis (Table 2).
Fig. 11 shows that the experimental data can be accuratelydescribed with Eq. (6), indicating that the dominating failuremechanism during fracture might indeed be buckling of the verythin and long lamella, even for the columnar monoliths. Themeasured compressive strength data was used to calculate theWeibull distribution (Fig. 12) for the probability of survival, PS,of the monoliths41:
PS = exp
[−(
σ∗
σ0
)m](7)
where σ0 is the characteristic strength of the monolith (thestrength for which the PS is 1/e) and m is the Weibull modu-lus, determined from linear regressions of the series in Fig. 11a.The monoliths produced from the A32 suspensions at coolingrates of 1.5 and 10 K/min had a Weibull moduli of 2.3 and 3.4,respectively, while the weaker monoliths produced from the A20 suspensions at cooling rates of 1.5 and 10 K/min had highermoduli, 6.9 and 7.1, respectively.
The Weibull survival probability plot in Fig. 12b shows that,although the Weibull modulus is comparatively high, the A20monoliths will fail easily already at a low stress, and while theA32 have a higher average strength, the low Weibull modulusshows that the monolith may fail at stresses much lower than theaverage σ*.
In summary, our results suggest that weaker A20 monolithfail at very low compressive stress due to the ease of bendingand buckling of thin, isolated, laminate walls. The monolith A32

A. Ojuva et al. / Journal of the European Ceramic Society 35 (2015) 2607–2618 2615
Table 2Morphological and mechanical properties of monoliths prepared from suspensions with low (A20) and high (A32) concentrations, frozen at slow (1.5 K/min) andfast (10.0 K/min) cooling rates.
A20 1.5 K/min A20 10.0 K/min A32 1.5 K/min A32 10.0 K/min
Pore area AP [m2] 438 112 298 106Wall thickness d [m] 8.70 4.33 18.5 7.03Pore major axis a [m] 45.1 23.6 32.6 20.2Pore minor axis b [m] 11.3 6.70 12.2 8.89Aspect ratio χ 3.98 3.52 2.67 2.27Elastic modulus E [kPa] 479 2270 5930 89,600Compressive strength σ* [kPa] 44.5 90.2 183 977
1.5 K/min has more bridges between the lamella and its failure ismore dependent on crack propagation through an entire longitu-dinal section, ultimately depending on the arrangement of walls.The strongest monolith, A32 10.0 K/min, does not have any dis-tinct lamella, and the compressive energy is dissipated moreevenly, leading to the highest measured σ* of the investigatedmonoliths.
The equilibrium uptake of CO2 in consolidated zeolite NaAmonoliths was determined to be 3.30 mmol/g. The 10.2% K-exchanged NaKA had a lower uptake, 2.91 mmol/g, most likelydue to the decreased micropore volume after ion-exchange. The17.6% K-exchanged monoliths a slow uptake where equilibriumwas not reached after several days.
Time-dependent gas flow through a column filled with freeze-cast adsorbent monoliths is shown in Fig. 13. The initial flowof N2 gas is replaced by a 1:9 CO2:N2 gas mixture at time zeroand the concentration of CO2 is monitored at the end of the col-umn. The region of zero concentration in the gas breakthroughcurve corresponds to the time during which CO2 is completelyadsorbed by the solid, and the region where the concentration
C/C0 lies between zero and one, often called the mass transferzone (MTZ), is the zone where some gas is being adsorbed whilesome gas is flowing past. In a separation column the gas flowwould be turned off at the start of the MTZ, and its sharpness isan indication of how large portion of the bed is still unsaturatedduring the end of the adsorption cycle.
The breakthrough front for the freeze-cast zeolite monolithsshows a rapid increase in the relative CO2 concentration indicat-ing the low resistance to mass transfer and uniform gas flow.42,43
The pure 4A monolith bed (black squares) takes 50 s until CO2is slipping through and a total of 100 s until the bed is saturated,while the 10.2% and 17.6% K-exchanged monoliths show firsttraces of CO2 penetration at 30 s and saturation at 80 s (NaKA10.2%) and 100 s (NaKA 17.6%). These results suggest thatat a flow of 150 cm3/min, 0.25 cm3 (or 0.011 mmol) of CO2 isadsorbed into a monolith with a volume of 47 cm3 every sec-ond until breakthrough, corresponding to a CO2 uptake rate of230 gCo2
/(s m2).The mass transfer coefficients were k = 0.31, 0.29 and
0.17 m/s for the monoliths with a degree of potassium exchange
Fig. 12. The Weibull distribution for the compressive strength σ∗ of freeze-cast monoliths. The Weibull moduli m for different monoliths was obtained using Eq. (6)on the data in (a) and are presented as a survival probability plot in (b). Black open diamonds: A20 1.5 K/min, green open squares: A20 10.0 K/min, blue diamonds:A32 1.5 K/min, red squares: A32 10.0 K/min. (For interpretation of the references to color in this figure legend, the reader is referred to the web version of thisarticle.)

2616 A. Ojuva et al. / Journal of the European Ceramic Society 35 (2015) 2607–2618
Fig. 13. CO2 breakthrough curves for freeze-cast monoliths frozen at10.0 K/min from an A20 suspension of zeolite NaA (black square), 10.2% K-exchanged NaKA (green circle) and 17.6% K-exchanged NaKA (blue triangle).(For interpretation of the references to color in this figure legend, the reader isreferred to the web version of this article.)
of 0%, 10.2% and 17.6%, respectively. These mass transfercoefficients correspond to typical values for isothermal uptake(adsorbate concentration < 1%) of SO2 in packed beds con-sisting of pellets with a diameter below 1 mm.44 We can alsocalculate the effective diffusivities, which for the three dif-ferent ion-exchanged adsorbent monoliths are De = 2.3 × 10−7,2.2 × 10−7, and 1.3 × 10⁻⁷ m2/s.
4. Conclusions
We have evaluated the fracture behavior of freeze-cast zeoliteA composite monoliths under compressive loading for variouspore structures and porosities, and their CO2 uptake kinetics atdifferent potassium exchange ratios. The compressive strengthof the brittle freeze-cast monolith was found to follow the Eulerbuckling mechanism. The strength increases with increasingsolids loading and decreasing cross-sectional pore aspect ratio,which was determined by image analysis. A Weibull analysisof the predicted survival probability at a characteristic strengthrevealed that there are two distinctly different Weibull modulifor the monoliths, one close to 3 and another close to 7. Theformer was linked to an average pore aspect ratio below 3, whilethe higher Weibull moduli relate to monoliths with a pore aspectratio above 3.
We also determined the concentration limits of the aqueouszeolite-based powder suspension for successful freeze-casting.The lower zeolite concentration of the suspension was extrapo-lated from the compressive tests of monoliths frozen at 10 K/min,which were found to be linearly dependent on the solids loading,and a value of 16.5 wt% dwb was obtained. This is close to the
practical lower limit of 18.3 wt% that could be used to produceself-supporting, albeit very fragile, structures.
The sharp front in breakthrough experiments indicate thatthe freeze-cast monoliths have a low mass transfer resistanceand promote a uniform gas flow along the macropore channels.The uptake of CO2 from a 1:9 mixture of CO2 and N2 in a gasbreakthrough experiment was found to be slower for 17.6% thanfor NaA (no ion exchange) or 10.2% K-exchanged zeolite A.
Acknowledgements
This work has been financed by Berzelii Center EXSELENTon Porous Materials. The authors thank Dr. Heikki Huttunenfor advice with the image analysis and Mr. Lauri Niittymäki forperforming the compressive strength tests.
Appendix A. Appendix A Calculation of diffusion frombreakthrough curves
In a parallel laminate system we assume that the axial disper-sion is negligible, so the differential mass balance in a columnof length z becomes
v∂c
∂z+ ∂c
∂t+(
1− ∈∈)
∂q′
∂t= 0 (8)
where c is the concentration of the fluid, ∈ is the total voidfraction, q′ is the loading of the adsorbate in the adsorbent andt is time.
The interstitial velocity ν is:
v = QV ∈S
(9)
where QV is the volumetric flow rate of the fluid and S is thecross-sectional area of the bed.
The analytical solution to describe the concentration of theadsorbate at the end of the column in a breakthrough is adaptedfrom Klinkenberg46:
c
c0= 1
2· erfc
(√ξ − √
τ −√
ξ
8−
√τ
8
)(10)
where the dimensionless bed length ξ is
ξ = kKz
v
(1− ∈
∈)
(11)
where k is the mass-transfer coefficient and K is the Henryconstant of the adsorbate. The dimensionless time τ is
τ = k(t − z
v
)(12)
If we assume that the diffusion in the macropores is muchfaster than the diffusion in the micropores, then the time at whichthe adsorbate reaches the end of the column is governed bythe uptake kinetics and capacity of the adsorbate, which at fastdiffusion and low partial pressures are expressed by the Henryconstant K. The steepness of the curve, i.e., the time it takesto saturate the entire column, is controlled by the mass transferresistance of the lamellae and expressed by the mass-transfer

A. Ojuva et al. / Journal of the European Ceramic Society 35 (2015) 2607–2618 2617
coefficient k. The mass transfer coefficients for the monolithswith three degrees of potassium exchange become k = 0.31, 0.29and 0.17 m/s for 0%, 10.2% and 17.6% NaKA, respectively. Thiscorresponds to typical values for isothermal uptake (adsorbateconcentration < 1%) of SO2 in packed beds consisting of pelletswith a diameter below 1 mm.44 At 10% CO2 we are unlikelyto have an isothermal condition, which lowers the mass transferrate somewhat.
The mass-transfer coefficient k can be divided into the filmand pore mass-transfer coefficients, denoted by kf and kp,respectively.21 They are related by:
1
k= 1
kf
+ 1
kp
(13)
where
kf = Dm · Sh
b(14)
kp = 6De
t(15)
And again t is the width of the laminate wall, b is the poreminor axis, Dm and De are the molecular and effective diffu-sion coefficients, respectively, and Sh is the Sherwood number.The value of Dm = 1.72 × 10⁻⁵ m2/s was taken for CO2 in N2 at303 K from Massman et al.,47 and the Sherwood number for alaminate structure is expressed by:
Sh = A
(1 + 0.139 Sc Re
b
Lc
)0.81
(16)
where A is a parameter relating to the pore channel shape, 2.70for a laminate system was used, and Lc is the length of thecolumn, 0.15 m. The Schmidt number Sc, which relates the kine-matic viscosity (the root of dynamic viscosity and density) to themolecular diffusivity, is determined by:
Sc = μd
Dmρ(17)
where the density of the gas mixture at 303 K is ρ = 0.1 ×ρCo2 + ρN2 = 0.117 Kg/m3, and the dynamic viscosity μd fora 1:9 CO2:N2 mixture is obtained by the Wilke equation:48
μd = μ1
1 + (x2/x1)[1+(μ1/μ2)1/2(M2/M1)1/4]2
(4/√
2[1+(M1/M2)]1/2
+ μ2
1 + (x1/x2)[1+(μ2/μ1)1/2(M1/M2)1/4]2
(4/√
2[1+(M2/M1)]1/2
(18)
Where the values of μ1 = 1.50 × 10⁻⁵ Ns/m2 andμ2 = 1.79 × 10⁻⁵ Ns/m2 for CO2 and N2 were used, respec-tively, and μd = 2.25 × 10⁻⁵ Ns/m2. This results in Sc = 11.2.The Reynolds number Re was calculated from:
Re = (ρu2)
(μdu/L)(19)
Where the superficial velocity u = 7.96 × 10⁻³ m/s and thecharacteristic length L is expressed as the equivalent hydraulic
diameter of a rectangular channel with the dimensions of theaverage lamellar pore, L = 2ab/(a + b) = 1.10 × 10⁻⁵ m. ThusRe = 4.55 × 10⁻⁴, which is well within the laminar flow region.Solving Eq. (16), since both b and Re are so small, the Sher-wood number is dominated by the shape parameter A, andSh = 2.70. Equation (14) then gives kf = 7.63 m/s, and insertingthat into Eq. (13) we obtain, for the three potassium contents0%, 10.2% and 17.6% NaKA, three values of kp, 0.32, 0.30 and0.17 m/s, respectively. Equation (15) then gives us the respec-tive effective diffusivities De = 2.33 × 10⁻⁷, 2.17 × 10⁻⁷, and1.26 × 10−7 m2/s.
Appendix B. Supplementary data
Supplementary data associated with this article can befound, in the online version, at doi:10.1016/j.jeurceramsoc.2015.03.001.
References
1. D’Alessandro DM, Smit B, Long JR. Carbon dioxide capture: prospects fornew materials. Angew Chem Int Ed Engl 2010;49:6058–82.
2. Hedin N, Chen L, Laaksonen A. Sorbents for CO2 capture fromflue gas – aspects from materials and theoretical chemistry. Nanoscale2010;2:1819–41.
3. Samanta A, Zhao A, Shimizu GKH, Sarkar P, Gupta R. Post-combustionCO2 capture using solid sorbents: a review. Ind Eng Chem Res2012;51:1438–63.
4. Wang Q, Luo J, Zhong Z, Borgna A. CO2 capture by solid adsorbentsand their applications: current status and new trends. Energy Environ Sci2011;4:42.
5. Tuinier MJ, van Sint Annaland M, Kramer GJ, Kuipers JAM. Cryogenic cap-ture using dynamically operated packed beds. Chem Eng Sci 2010;65:114–9.
6. Rochelle GT. Amine scrubbing for CO2 capture. Science 2009;325:1652–4.7. Hedin N, Andersson L, Bergström L, Yan J. Adsorbents for the post com-
bustion capture of CO2 using rapid temperature swing or vacuum swingadsorption. Appl Energy 2013;104:418–33.
8. Mason JA, Sumida K, Herm ZR, Krishna R, Long JR. Evaluatingmetal-organic frameworks for post-combustion carbon dioxide capture viatemperature swing adsorption. Energy Environ Sci 2011;4:3030.
9. McDonald TM, et al. Capture of carbon dioxide from air and flue gas in thealkylamine-appended metal-organic framework mmen-Mg2(dobpdc). J AmChem Soc 2012;134:7056–65.
10. Ma J, Liu Q, Chen D, Zhou Y, Wen S. Carbon dioxide adsorptionusing amine-functionalized mesocellular siliceous foams. J Mater Sci2014;49:7585–96.
11. Hahn MW, Steib M, Jentys A, Lercher JA. Tailoring hierarchically struc-tured SiO2 spheres for high pressure CO2 adsorption. J Mater Chem A2014;2:13624.
12. Cheung O, et al. CO2 selective NaMg-CTS-1 and its structural formationfrom the titanium silicate based molecule sieve NaMg-ETS-4. MicroporousMesoporous Mater 2014;198:63–73.
13. Du N, et al. Polymer nanosieve membranes for CO2-capture applications.Nat Mater 2011;10:372–5.
14. Lu W, et al. Porous polymer networks: synthesis, porosity, and applicationsin gas storage/separation. Chem Mater 2010;22:5964–72.
15. Meng QB, Weber J. Lignin-based microporous materials as selectiveadsorbents for carbon dioxide separation. ChemSusChem 2014;7:3312–8,http://dx.doi.org/10.1002/cssc.201402879.
16. Hao G-P, Li W-C, Qian D, Lu A-H. Rapid synthesis of nitrogen-dopedporous carbon monolith for CO2 capture. Adv Mater 2010;22:853–7.
17. Hao W, Björkman E, Lilliestråle M, Hedin N. Activated carbons preparedfrom hydrothermally carbonized waste biomass used as adsorbents for CO2.Appl Energy 2013;112:526–32.

2618 A. Ojuva et al. / Journal of the European Ceramic Society 35 (2015) 2607–2618
18. Cheung O, Hedin N. Zeolites and related sorbents with narrow pores forCO2 separation from flue gas. RSC Adv 2014;4:14480.
19. Akhtar F, Andersson L, Ogunwumi S, Hedin N, Bergström L. Structuringadsorbents and catalysts by processing of porous powders. J Eur Ceram Soc2014;34:1643–66.
20. Rezaei F, Webley PA. Structured adsorbents in gas separation processes. SepPurif Technol 2010;70:243–56.
21. Rezaei F, Webley PA. Optimum structured adsorbents for gas separationprocesses. Chem Eng Sci 2009;64:5182–91.
22. Rezaei F, et al. The effect of wall porosity and zeolite film thickness on thedynamic behavior of adsorbents in the form of coated monoliths. Sep PurifTechnol 2011;81:191–9.
23. Ojuva A, Akhtar F, Tomsia AP, Bergström L. Laminated adsorbents withvery rapid CO2 uptake by freeze-casting of zeolites. ACS Appl Mater Inter-faces 2013;5:2669–76.
24. Akhtar F, Liu Q, Hedin N, Bergström L. Strong and binder free structuredzeolite sorbents with very high CO2-over-N2 selectivities and high capacitiesto adsorb CO2 rapidly. Energy Environ Sci 2012;5:7664.
25. Gibson LJ, Ashby MF. Cellular solids structures and properties. 2nd ed.Cambridge University Press; 1997.
26. Ashby MF, Medalist RFM. The mechanical properties of cellular solids.Metall Mater Trans A 1983;14:1755–69.
27. Donius AE, Liu A, Berglund LA, Wegst UGK. Superior mechanicalperformance of highly porous, anisotropic nanocellulose-montmorilloniteaerogels prepared by freeze casting. J Mech Behav Biomed Mater2014;37C:88–99.
28. Porter MM, Imperio R, Wen M, Meyers MA, McKittrick J. Bioinspiredscaffolds with varying pore architectures and mechanical properties. AdvFunct Mater 2014;24:1978–87.
29. Wegst UGK, Bai H, Saiz E, Tomsia AP, Ritchie RO. Bioinspired structuralmaterials. Nat Mater 2014:1–14, http://dx.doi.org/10.1038/nmat4089.
30. Bouville F, Maire E, Deville S. Lightweight and stiff cellular ceramic struc-tures by ice templating. J Mater Res 2014;29:175–81.
31. Hunger PM, Donius AE, Wegst UGK. Platelets self-assemble into porousnacre during freeze casting. J Mech Behav Biomed Mater 2013;19:87–93.
32. Hunger PM, Donius AE, Wegst UGK. Structure-property-processing corre-lations in freeze-cast composite scaffolds. Acta Biomater 2013;9:6338–48.
33. Tang Y, Miao Q, Qiu S, Zhao K, Hu L. Novel freeze-casting fabrication ofaligned lamellar porous alumina with a centrosymmetric structure. J EurCeram Soc 2014;34:4077–82.
34. Cheung O, Bacsik Z, Liu Q, Mace A, Hedin N. Adsorption kinetics forCO2 on highly selective zeolites NaKA and nano-NaKA. Appl Energy2013;112:1326–36.
35. Liu D-M. Particle packing and rheological property of highly-concentratedceramic suspensions: φm determination and viscosity prediction. J MaterSci 2000;5:5503–7.
36. Zhang J, Ashby MF. The out-of-plane properties of honeycombs. Int J MechSci 1992;34(6):475–89.
37. Gibson LJ. Modelling the mechanical behavior of cellular materials. MaterSci Eng A 1989;110:1–36.
38. Maiti SK, Ashby MF, Gibson LJ. Fracture toughness of brittle cellular solids.Scr Metall 1984;18:213–7.
39. Bazant ZP, Gedolin L. Stability of structures: elastic, inelastic fracture anddamage theories. World Scientific Publishing Co. Pte. Ltd.; 2010. p. 3–19.
40. Griffith AA. The phenomena of rupture and flow in solids. Philos Trans RSoc London 1921;221:163–98.
41. Weibull W. A statistical distribution function of wide applicability. J ApplMech 1951;18:293–7.
42. Mosca A, Hedlund J, Ridha FN, Webley PA. Optimization of syn-thesis procedures for structured PSA adsorbents. Adsorption 2008;14:687–93.
43. Mosca A, Hedlund J, Webley PA, Grahn M, Rezaei F. Structured zeoliteNaX coatings on ceramic cordierite monolith supports for PSA applications.Microporous Mesoporous Mater 2010;130:38–48.
44. Gupta A, Gaur V, Verma N. Breakthrough analysis for adsorption ofsulfur-dioxide over zeolites. Chem Eng Process Process Intensif 2004;43:9–22.
46. Klinkenberg A. Heat transfer in cross-flow heat exchangers and packed beds.Ind Eng Chem 1954;46:2285–9.
47. Massman WJ. A review of the molecular diffusivities of H2O, CO2, CH4,CO, O3, SO2, NH3, N2O, NO, and NO2 in air, O2 and N2 near STP. AtmosEnviron 1998;32:1111–27.
48. Wilke CR. A viscosity equation for gas mixtures. J Chem Phys1950;18:517–9.

Publication V
PASSIVE RESONANCE SENSOR BASED METHOD FOR MONI-
TORING PARTICLE SUSPENSIONS
by
Salpavaara Timo, Järveläinen Matti, Seppälä Sari, Yli-Hallila Teemu, Verho Jarmo,
Vilkko Matti, Lekkala Jukka & Levänen Erkki
Sensors & Actuators: B. Chemical., 219 (2015), pp. 324–330.
http://doi.org/10.1016/j.snb.2015.04.121
Reprinted from Sensors & Actuators B with permission of Elsevier B.V. Copyright © 2016 Elsevier B.V.

Sensors and Actuators B 219 (2015) 324–330
Contents lists available at ScienceDirect
Sensors and Actuators B: Chemical
jo u r nal homep age: www.elsev ier .com/ locate /snb
Passive resonance sensor based method for monitoring particlesuspensions
Timo Salpavaaraa,∗, Matti Järveläinenb, Sari Seppäläb, Teemu Yli-Hallilaa, Jarmo Verhoa,Matti Vilkkoa, Jukka Lekkalaa, Erkki Levänenb
a Department of Automation Science and Engineering, Tampere University of Technology, P.O. Box 692, FI-33101 Tampere, Finlandb Department of Materials Science, Tampere University of Technology, P.O. Box 589, FI-33101 Tampere, Finland
a r t i c l e i n f o
Article history:Received 15 December 2014Received in revised form 2 April 2015Accepted 29 April 2015Available online 19 May 2015
Keywords:Passive resonance sensorInductive couplingSuspensionSlurryComplex permittivity
a b s t r a c t
Control of particle suspensions is needed in several modern industrial processes. A reason for the difficultyin this task has been the lack of a fast and reliable measurement. In this study, we tested the measurementof particle suspension by using a method based on a passive resonance sensor. The relative amounts ofdispersing agent and aluminium oxide in the suspension were varied. The studied method yielded signalswhich depended on the complex permittivity of the suspension. The results indicated that we were ableto measure information that can be used as feedback for the suspension preparation process. In addition,the tested instrumentation was simple and robust and thus this method may allow online measurementsdirectly from the industrial processes.
© 2015 Elsevier B.V. All rights reserved.
1. Introduction
Monitoring and controlling particle suspensions are essentialparts of many modern industrial processes. One example is themanufacturing of technical ceramic components. The use of thesecomponents has increased in challenging applications due to theirability to withstand wear, high temperatures and corrosive envi-ronments better than traditional materials. These components areoften manufactured via processes such as spray drying or slip cast-ing where fine ceramic particles need to be suspended in liquid.The properties of the final components are highly dependent ofthe properties of the suspension [1]. It is important that the sus-pension is homogenous. In other words, the particles and additiveshave to be dispersed evenly in the suspension. Also, the solid con-tent has to be as high as possible and the amounts of additivesshould be precisely at correct level. Thus, to increase efficiency andyield in processes that use suspensions, it is essential to developindustrially capable methods to characterize them.
Despite the fact that the slurry monitoring is an important partof the ceramic component manufacturing process, the commonly
∗ Corresponding author at: Department of Automation Science and Engineer-ing, Tampere University of Technology, P.O. Box 692, Korkeakoulunkatu 3, FI-33101Tampere, Finland. Tel.: +358 40 7166528.
E-mail address: [email protected] (T. Salpavaara).
used quality assurance measurements are difficult and time-consuming. Usually a sample is taken and it is characterized in a lab-oratory. There are also measurement systems that have automaticsampling devices. Typical characterization methods are rheologicalmeasurements [2], centrifugal sedimentation tests [3], particle sizeand size distribution measurements and zeta potential analysis [4].In addition to the challenges of getting representative samples fromhuge vessels, the transport to laboratories and the characterizationtests take time. Thus, the results cannot be acquired in real time andcannot be used as effective feedback for the process. Hence thereis a need for a non-invasive, inexpensive, rapid online-methodthat monitors qualities such as solid content, sedimentationand the effects of the additives. In addition to the traditionalmeasurements, alternative methods have been developed basedon ultrasound [5–7], microwaves [8] and electrical conductivity[9–11].
One other physical property of the materials that can be electri-cally measured is the relative electrical permittivity. This propertydescribes how the electric field is affected by the dielectric mediumcompared with vacuum. The relative permittivity is calculated froma capacitance measurement. The typical form of the capacitive mea-suring element is a coaxial probe [12]. The probes are placed inthe measured media and the measuring electronics or an amplifierhas to be located in the close proximity of the probes to preventnoise pickup and parasitic capacitances. One other challenge ofthis method is to understand and control how the geometry of the
http://dx.doi.org/10.1016/j.snb.2015.04.1210925-4005/© 2015 Elsevier B.V. All rights reserved.

T. Salpavaara et al. / Sensors and Actuators B 219 (2015) 324–330 325
capacitive probe affects the measured results. This can be problem-atic in industrial environments.
The dielectric or capacitive characterization techniques havebeen also tested for monitoring suspended particles [13–17]. In [14]Sjöblom et al. measured complex permittivity by using a dielec-tric sensor. The form of the sensor in these measurements was acapacitive coaxial probe. The dielectric sensor was measured by acomputer controlled system that included a pulse generator andan oscilloscope. By using this method, the features like the sedi-mentation and volume fraction of Al2O3 were monitored. Despitethe obvious advantages, this method, as such, is not popular in theceramic industry to the best of our knowledge.
One variant of a dielectical measurement can be done using pas-sive resonance sensors. The concept of passive resonance sensor hasbeen known since the mid of the last century. In short, the princi-ple of the method is to measure the behaviour of an LC circuit byusing another coil [18]. When the reader coil is placed near to theLC circuit, an inductive link is formed. Because of this link, the res-onance of the LC circuit can be detected when the impedance ofthe reader coil is measured. Different readout methods have beendeveloped but the measurement of the complex impedance usingan impedance analyser is one of the most common in the scientificstudies [19–21]. The concept of passive resonance sensors has twonotable advantages: it allows a short range wireless measurementand the structure of the actual sensor is very simple. The LC circuitcan be measured through non-conductive materials like plastic orglass. However, it should be noted that this method does not allowmaking measurements through metallic container walls and theerrors due the metallic objects in the measurement environmenthave to be investigated. The range of the measurement is relativeto the dimensions of the coils, typically few centimetres. The sim-plicity of the sensor structure allows the use of nonconventionalmaterials and makes the sensor durable and cheap to manufacture.
The applications of the passive resonance sensors range fromsimple pressure sensors to the measurement of chemical [20,22]and even biological variables [23]. The wide range of the appli-cations is due to the fact that most of the typical measurementcan be converted to the measurement of capacitance, resistance orinductance. All those quantities can be measured by using passiveresonance sensors. A typical realization of this concept is a pressuresensor based on a pressure dependent capacitor [18,21,24]. Othertested applications are implantable sensors [18] and the measure-ment of moisture in sand and concrete [25]. The concept has alsobeen used for measuring biopotential signals [26] and pH-value[20]. A new promising application for this concept is in biodegrad-able sensors [27,28].
The passive resonance sensors can be used to monitor the per-mittivity of their environment [19]. In [19] the real and imaginaryparts of the complex permittivity have been calculated from themeasured data with moderate success. This process requires and isdependent on accurate information of the sensor parameters andthe constant that links the geometry of the sensor capacitor andthe permittivity of the environment. The measurement of permit-tivity enables to detect the ratios of components in liquids [19] andgasses [29].
In this study, we investigate the possibilities of passive res-onance sensors to monitor the preparation and composition ofparticle suspension. We selected aluminium oxide slurry as ourtest material since it is a common and well understood example ofparticle suspension. The tested slurry contains water, ceramic par-ticles and additives. The proposed method combines the dielectriccharacterization techniques and a sensitive wireless measurementsystem. Thus we are able to measure slurry that can be used in aslip casting process without a complicated test arrangement. Alsothis method does not need excessive or expensive instrumentationand thus it may be transferred to the industrial environment in
the future. The first goal of this work is to test if this method can beused to measure the volumetric ratio of ceramic particles dispersedin slurry. Secondly, since the use of dispersing agent is needed, itseffects on the measurement are also studied. In this study, we verifythe basic functioning of the measurement method.
2. Methods
The tested measurement method is based on the concept of pas-sive resonance sensors. A magnetic field generated by a reader coilinduces an electrical current to the sensor coil that creates an elec-trical field in the capacitor of the resonance circuit. The createdelectric field also partly passes through the measured substance,in this case slurry. The changes in the permittivity of the slurrywill affect the equivalent capacitance of the sensor. In addition, thecomplex permittivity of the system will cause losses that can bemeasured.
2.1. Measurement setup
The cross-section of the measurement setup is shown inFig. 1(a). The LC circuit tested in this work was made of a 7 mthick etched aluminium pattern which was laminated between two80 m thick PET films. This pattern included a rectangular coil withthree turns. The width of the coil wire was 0.6 mm. The diameter ofthe turns ranged from 14 mm to 21 mm. The pattern also had tworectangular 1 cm2 surfaces which formed a parallel plate capacitorwhen the laminated film was folded in two and glued together. Thisstructure encapsulates the LC circuit. The structure is durable, thinand easy to make. The capacitance and the resonance frequencyof this kind of structure are sensitive to permittivity changes in itsclose proximity. The circuit was glued to the bottom of a glass con-tainer (borosilicate glass, diameter 115 mm, volume 500 ml) andthen the sensor was embedded in the container by pouring a thinlayer of epoxy on the bottom of the container (Fig. 1(b)). The thick-ness of the epoxy on top of the sensor was 0.3 mm. This layer wasused to limit the effect caused by the measured substance on theresonance circuit. Without this layer, the conductivity of the slurrywould cause excessive losses and the resonance of the sensor wouldbe hard to detect. By using this configuration, the measurement
Fig. 1. (a) The cross-section of the encapsulated LC circuit in the measurement con-tainer. (b) Picture of the sensor embedded in epoxy. (c) The lumped element modelof the measurement setup.
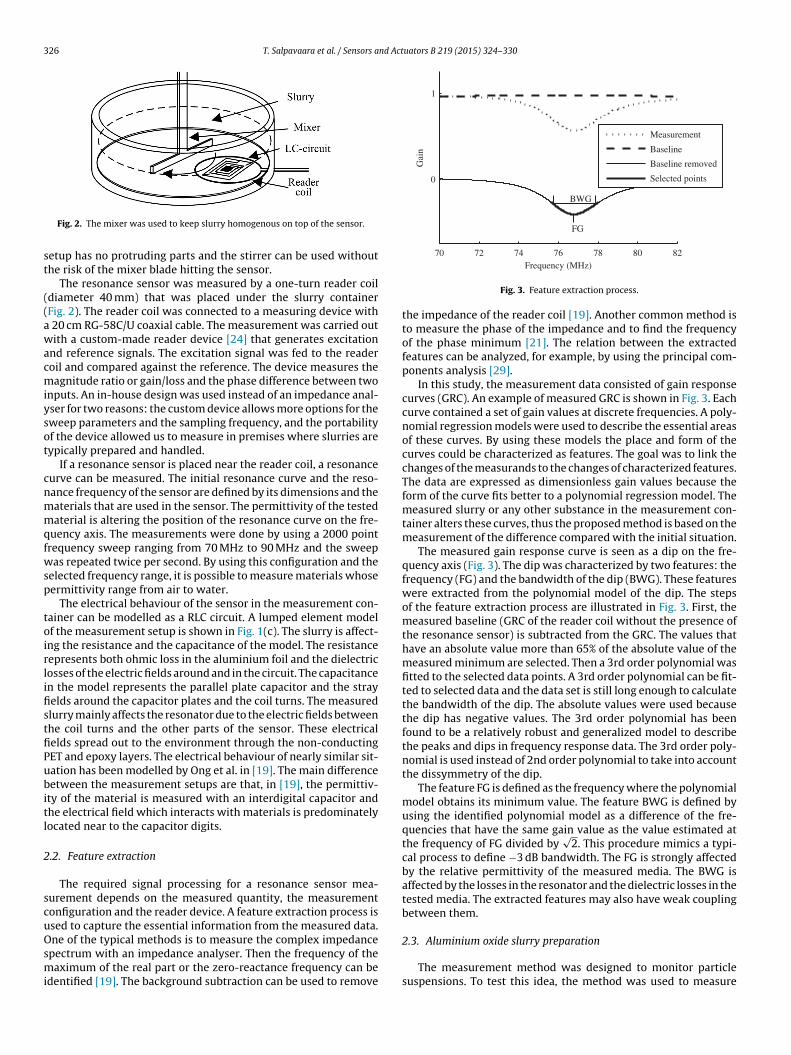
326 T. Salpavaara et al. / Sensors and Actuators B 219 (2015) 324–330
Fig. 2. The mixer was used to keep slurry homogenous on top of the sensor.
setup has no protruding parts and the stirrer can be used withoutthe risk of the mixer blade hitting the sensor.
The resonance sensor was measured by a one-turn reader coil(diameter 40 mm) that was placed under the slurry container(Fig. 2). The reader coil was connected to a measuring device witha 20 cm RG-58C/U coaxial cable. The measurement was carried outwith a custom-made reader device [24] that generates excitationand reference signals. The excitation signal was fed to the readercoil and compared against the reference. The device measures themagnitude ratio or gain/loss and the phase difference between twoinputs. An in-house design was used instead of an impedance anal-yser for two reasons: the custom device allows more options for thesweep parameters and the sampling frequency, and the portabilityof the device allowed us to measure in premises where slurries aretypically prepared and handled.
If a resonance sensor is placed near the reader coil, a resonancecurve can be measured. The initial resonance curve and the reso-nance frequency of the sensor are defined by its dimensions and thematerials that are used in the sensor. The permittivity of the testedmaterial is altering the position of the resonance curve on the fre-quency axis. The measurements were done by using a 2000 pointfrequency sweep ranging from 70 MHz to 90 MHz and the sweepwas repeated twice per second. By using this configuration and theselected frequency range, it is possible to measure materials whosepermittivity range from air to water.
The electrical behaviour of the sensor in the measurement con-tainer can be modelled as a RLC circuit. A lumped element modelof the measurement setup is shown in Fig. 1(c). The slurry is affect-ing the resistance and the capacitance of the model. The resistancerepresents both ohmic loss in the aluminium foil and the dielectriclosses of the electric fields around and in the circuit. The capacitancein the model represents the parallel plate capacitor and the strayfields around the capacitor plates and the coil turns. The measuredslurry mainly affects the resonator due to the electric fields betweenthe coil turns and the other parts of the sensor. These electricalfields spread out to the environment through the non-conductingPET and epoxy layers. The electrical behaviour of nearly similar sit-uation has been modelled by Ong et al. in [19]. The main differencebetween the measurement setups are that, in [19], the permittiv-ity of the material is measured with an interdigital capacitor andthe electrical field which interacts with materials is predominatelylocated near to the capacitor digits.
2.2. Feature extraction
The required signal processing for a resonance sensor mea-surement depends on the measured quantity, the measurementconfiguration and the reader device. A feature extraction process isused to capture the essential information from the measured data.One of the typical methods is to measure the complex impedancespectrum with an impedance analyser. Then the frequency of themaximum of the real part or the zero-reactance frequency can beidentified [19]. The background subtraction can be used to remove
70 72 74 76 78 80 82
0
1
Frequency (MHz)
Gai
n
FG
BWG
Measurement
Baseline
Baseline removed
Selected points
Fig. 3. Feature extraction process.
the impedance of the reader coil [19]. Another common method isto measure the phase of the impedance and to find the frequencyof the phase minimum [21]. The relation between the extractedfeatures can be analyzed, for example, by using the principal com-ponents analysis [29].
In this study, the measurement data consisted of gain responsecurves (GRC). An example of measured GRC is shown in Fig. 3. Eachcurve contained a set of gain values at discrete frequencies. A poly-nomial regression models were used to describe the essential areasof these curves. By using these models the place and form of thecurves could be characterized as features. The goal was to link thechanges of the measurands to the changes of characterized features.The data are expressed as dimensionless gain values because theform of the curve fits better to a polynomial regression model. Themeasured slurry or any other substance in the measurement con-tainer alters these curves, thus the proposed method is based on themeasurement of the difference compared with the initial situation.
The measured gain response curve is seen as a dip on the fre-quency axis (Fig. 3). The dip was characterized by two features: thefrequency (FG) and the bandwidth of the dip (BWG). These featureswere extracted from the polynomial model of the dip. The stepsof the feature extraction process are illustrated in Fig. 3. First, themeasured baseline (GRC of the reader coil without the presence ofthe resonance sensor) is subtracted from the GRC. The values thathave an absolute value more than 65% of the absolute value of themeasured minimum are selected. Then a 3rd order polynomial wasfitted to the selected data points. A 3rd order polynomial can be fit-ted to selected data and the data set is still long enough to calculatethe bandwidth of the dip. The absolute values were used becausethe dip has negative values. The 3rd order polynomial has beenfound to be a relatively robust and generalized model to describethe peaks and dips in frequency response data. The 3rd order poly-nomial is used instead of 2nd order polynomial to take into accountthe dissymmetry of the dip.
The feature FG is defined as the frequency where the polynomialmodel obtains its minimum value. The feature BWG is defined byusing the identified polynomial model as a difference of the fre-quencies that have the same gain value as the value estimated atthe frequency of FG divided by
√2. This procedure mimics a typi-
cal process to define −3 dB bandwidth. The FG is strongly affectedby the relative permittivity of the measured media. The BWG isaffected by the losses in the resonator and the dielectric losses in thetested media. The extracted features may also have weak couplingbetween them.
2.3. Aluminium oxide slurry preparation
The measurement method was designed to monitor particlesuspensions. To test this idea, the method was used to measure

T. Salpavaara et al. / Sensors and Actuators B 219 (2015) 324–330 327
Fig. 4. The slurry preparation processes and the corresponding measurement points. The measurement series 1 monitors changes caused by the increasing dispersing agentconcentration (points 2–11) and the increase of solid content (points 12–19). Series 2 is a repeat of series 1. Series 3 is identical to series 1 and 2, but only a half of thedispersing agent was used this time.
aluminium oxide slurry preparation. The slurries were made ofAl2O3 powder, deionized water, and dispersing agent. First dispers-ing agent (Dispex A40, BASF SE) was dissolved to a small amountof water to ease the dosing of viscous liquid. Then the mixture wasadded to the remaining water in small increments. The dispersingagent worked as a stabilizer in the slurry. Then alumina powder(Martoxid MR70, Al2O3, Martinswerk) was added to the mixture insmall increments. The alumina powder had a particle distributionwhere the majority of the particles are between 0.1 m and 3 m.The mixture was continuously stirred with a plastic blade in orderto maintain its homogeneity. The plastic blade or the stirring speedhad no significant effect on the measurement made with deionizedwater. Three slurry series were measured. The first two series wererepresenting a typical slurry preparation process. In the third series,only a half of dispersing agent was used in order to test its effect onthe measurement. Before each series, isopropanol was measured totest the repeatability of the measurement. The measurement pointsof the slurry preparation are illustrated in Fig. 4. The points werechosen solely to test the measurement method at discrete intervals.All measurements were done in room temperature 23 C.
As a reference, a rheometer (Haake Rheostress RS150, Germany)was used to measure the viscosity of slurry. Because this referenceviscosity measurement requires sampling (6 ml) which reduces thematerial, an identical slurry was prepared and the samples corre-sponding to the measurement points 15, 17 and 19 in Fig. 4 weretaken. Since the viscosity of the tested material changes dramat-ically during the process, the test points were selected at highvolumetric ratios of aluminium oxide in order to use the samemeasurement configuration for all tested samples. The correspond-ing reference viscosities measured at the shear rate of 10 1/s were0.03 Pa s, 0.06 Pa s and 1.2 Pa s. The tested slurry was shear thinningmaterial whose viscosity decreases as the shear rate increase.
3. Results
The gain response curves were measured during the preparationof the aluminium oxide slurry. The process contains two separatephases: the first phase is the addition of dispersing agent and thesecond phase is the addition of aluminium oxide. Separate proce-dures were used to calculate the results of each phase. The resultsof the first phase are compared with deionized water (Step 4a)
and the results of second phase are compared with the deionizedwater/dispersing agent mixture (Step 4b).
The results are obtained with following steps:Step 1: A new sample is prepared.Step 2: 100 gain response curves are measured and averaged.Step 3: Features FG and BWG are extracted.Step 4a: Features of the comparison point (deionized water,
measurement point 1 in Fig. 4) are subtracted from the results.Step 4b: Features of the comparison point (deionized
water/dispersing agent mixture, measurement point 11 in Fig. 4)are subtracted from the results.
3.1. Measurement of dispersing agent
The results of the first process phase are presented in Fig. 5.Each point (except starting points) represents the situation afternew portion of dispersing agent is added and fully mixed. The
−0.8
−0.6
−0.4
−0.2
0
Cha
nge
of F
G (
MH
z)
Series 1Series 2Series 3
0 5 10 15 200
0.2
0.4
0.6
0.8
1
A40 (g/l)
Cha
nge
of B
WG
(M
Hz)
Fig. 5. The changes of the extracted features as the proportional amount of thedispersing agent in water was increased.

328 T. Salpavaara et al. / Sensors and Actuators B 219 (2015) 324–330
0
0.2
0.4
0.6
0.8
1
Cha
nge
of F
G (
MH
z)
Series 1Series 2Series 3
0 10 20 30 40 500
0.1
0.2
0.3
0.4
0.5
0.6
Aluminium oxide (vol% )
Cha
nge
of B
WG
(M
Hz)
Fig. 6. The changes of the features FG and BWG as the volumetric ration of thealuminium oxide in the slurry was increased.
feature FG was decreasing as more dispersing agent was added.Within the tested range, the change of the FG was almost directlyproportional to the concentration. The slope of the linear regres-sion model for all measured data was −35 kHz/(g/l). The relationbetween the concentration of the dispersing agent and the BWGwas non-linear. Repeatability of the features was good in bothcases. One of the likely reasons for the noticed differences was thevariation in the proportioning of the dispersing agent.
3.2. Measurement of aluminium oxide
The extracted features when aluminium oxide was added arepresented in Fig. 6. The relation between the FG and the volumet-ric ratio of aluminium oxide in the slurry was almost linear. Theaverage slope of the increase of FG in all these measurements was18 kHz/vol%. According to these results with two tested concentra-tions, the amount of the dispersing agent only changed the startingpoint of the aluminium oxide measurement (Fig. 7, point 11). The
76 76.5 77 77.5 78 78.5 792
2.2
2.4
2.6
2.8
3
3.2
3.4
3.6
3.8
FG (MHz )
BW
G (
MH
z)
DI water (1)
Isopropanol
Dispersing agent is added (2−11)
Particles are added (12...)
Series 1Series 2Series 3
Fig. 7. The measured slurry preparation processes illustrated in a 2-dimensonalmap of the features FG and BWG. The features of isopropanol were measured as areference.
behaviour of the FG was similar between all the three test series.The largest differences between the linear regression model andthe measured data occur at the higher volume ratios. This may becaused by the non-homogeneity of slurry. The feature BWG cannotbe used as an indicator of the volumetric ratio of the aluminiumoxide in the slurry since the amount of dispersing agent will affectits behaviour.
3.3. Visualization of slurry preparation process
The preparation of aluminium oxide slurry can be visualizedas a 2D map, where the axes are the features FG and BWG. Fig. 7presents the extracted FG and BWG values of the three test seriesand isopropanol that was used as a reference material. This mapalso provides the means to study the repeatability of the measure-ment method. There is an offset in the features measured in plaindeionized water and isopropanol reference between the test series.This may occur due to the changes in the placement of the mea-surement setup, contaminants in the liquids (especially deionizedwater) or changes in the measurement electronics.
An increase in the dispersing agent concentration decreases theFG and increases the BWG. Each increment is clearly distinguish-able even if the added amount is small in comparison with the totalamount of water. The overall behaviour of the measured featuresis similar between the series when aluminium oxide is added. Theaddition increases both extracted features. The series 1 and 2 aresimilar but not identical. In the third series, only half of the amountof the dispersing agent was used and the difference can be seensince the increase of the FG begins from a clearly different point.
4. Discussion
The long polarized molecules of the dispersing agent mayexplain the decrease of the feature FG when dispersing agent wasadded. The dispersing agent also increased the dielectric losseswhich were seen as the increase of the feature BWG. The alu-minium oxide in water-dispersing agent solution increased thefeatures FG and BWG. The increase of the FG may be explainedby the fact that the aluminium oxide (εr ≈ 8–10) has much lowerrelative permittivity than water (εr ≈ 80). Thus slurry with a highvolume fraction of aluminium oxide has lower relative permittiv-ity and in this measurement it led to higher resonance frequencyof the sensor and higher value of the FG. The increase of BWGmay relate to the fact that the dispersing agent molecules attachedthemselves electrically on the aluminium oxide particle’s surfaceand the formed combination interacted with the electrical field as awhole. As a summarization, the results suggest that the origin of thefound changes in the measured features was caused by charging ofmolecules and surfaces and their interaction.
The more detailed electrical model of the measured media andthe sensor and their interaction is left for further studies. The taskhas two major phases. The first one is to create a model that pre-dicts the complex permittivity of the measured media based onthe parameters of the particle suspension such as the volume ratioof particles and the used materials. Modelling of a complex ofwater–alumina-dispersant suspension is a hefty conundrum sinceeven a dielectric model of two-component particulate suspension isa classic problem [13]. This kind of model would help to understandwhich parameters of suspension can be monitored by measuringits complex permittivity. The second phase is to create a modelthat predicts the extracted features based on complex permittiv-ity. The electrical interaction between the sensor and the mediais dependent on the geometry of the measurement capacitor andthus the optimization and modelling should be done when themeasurement method is scaled up for the industrial use. Even as

T. Salpavaara et al. / Sensors and Actuators B 219 (2015) 324–330 329
such, the presented method can be used for clustering, classifica-tion and general quality assessment of particle suspensions as anonline measurement method.
5. Conclusions
The advantage of the presented method is the simple and robuststructure of the sensor. This may ease the installation and mainte-nance of the measurement. In this experimental application, theembedded sensor setup enabled to use the mixer in the vicinityof the sensor helping to maintain the homogeneity of the suspen-sion. These usability features are an advantage when this method istransferred to industrial applications. The presented method showspotential as a tool for monitoring suspensions. The sensitivity ofthe method is adequate to measure even delicate changes in theamount of the dispersing agent and aluminium oxide. Thus the pre-sented method can provide information that can be used to improveslurry preparation processes. In this study, interesting relationsbetween the measurement features and the important parame-ters of slurry were found. In the following research, these relationsshould be further studied and modelled. Another task in the futureis to measure a more extensive set of slurries with the presentedmethod and to compare the results with reference methods likeviscosity measurements and impedance spectroscopy.
Acknowledgements
This work was supported by Finnish Funding Agency for Tech-nology and Innovation, decision number 40223/12. The authors aregrateful for the funding.
References
[1] A. Tsetsekou, C. Agrafiotis, I. Leon, A. Milias, Optimization of the rheologi-cal properties of alumina slurries for ceramic processing applications. Part II.Spray-drying, J. Eur. Ceram. Soc. 21 (4) (2001) 493–506.
[2] B. Bitterlich, C. Lutz, A. Roosen, Rheological characterization of water-basedslurries for the tape casting process, Ceram. Int. 28 (6) (2002) 675–683.
[3] J. Tsubaki, M. Kato, M. Miyazawa, T. Kuma, The effects of the concentration of apolymer dispersant on apparent viscosity and sedimentation behavior of denseslurries, Chem. Eng. Sci. 56 (2001) 3021–3026.
[4] R. Wäsche, M. Naito, V.A. Hackley, Experimental study on zeta potential andstreaming potential of advanced ceramic powders, Powder Technol. 123 (2002)275–281.
[5] J.A. Bamberger, M.S. Greenwood, Measuring fluid and slurry density and solidsconcentration non-invasively, Ultrasonics 42 (April (1–9)) (2004) 563–5677.
[6] J.A. Bamberger, M.S. Greenwood, Using ultrasonic attenuation to monitor slurrymixing in real time, Ultrasonics 42 (April (1–9)) (2004) 145–1488.
[7] M.S. Greenwood, J.A. Bamberger, Measurement of viscosity and shear wavevelocity of a liquid or slurry for on-line process control, Ultrasonics 39 (August(9)) (2002) 623–630.
[8] F.E.I. Yuan, R. Pal, Measurement of solids concentration in aqueous slurriesusing a microwave technique, Chem. Eng. Sci. 50 (22) (1995) 3525–3533.
[9] H.A. Nasr-El-Din, R.S. Mac Taggart, J.H. Masliyah, Local solids concentrationmeasurement in a slurry mixing tank, Chem. Eng. Sci. 51 (8) (1996) 1209–1220.
[10] M. Liu, T. Wang, W. Yu, J. Wang, An electrical conductivity probe method formeasuring the local solid holdup in a slurry system, Chem. Eng. J. 132 (August(1–3)) (2007) 37–46.
[11] M. Spidla, V. Sinevic, M. Jahoda, V. Machon, Solid particle distribution of mod-erately concentrated suspensions in a pilot plant stirred vessel, Chem. Eng. J.113 (October (1)) (2005) 73–82.
[12] A.P. Gregory, R.N. Clarke, Dielectric metrology with coaxial sensors, Meas. Sci.Technol. 18 (May (5)) (2007) 1372–1386.
[13] V.A. Hackley, J. Texter (Eds.), Handbook on Ultrasonic and Dielectric Charac-terization Techniques for Suspended Particles, The American Ceramic Society,Ohio, 1998, pp. 47–74.
[14] B. Pettersen, E. Nodland, J. Sjöblom, A multivariate analysis on the sedimenta-tion of aqueous silica suspensions as studied by means of time domain dielectricspectroscopy, J. Colloid Interface Sci. 214 (June (1)) (1999) 1–7.
[15] A.D. Hollingsworth, D.A. Saville, A broad frequency range dielectric spectrom-eter for colloidal suspensions: cell design, calibration, and validation, J. ColloidInterface Sci. 257 (1) (Jan. 2003) 65–76.
[16] P.J. Beltramo, E.M. Furst, Dielectric spectroscopy of bidisperse colloidal suspen-sions, J. Colloid Interface Sci. 380 (August (1)) (2012) 34–41.
[17] P.J. Beltramo, R. Roa, F. Carrique, E.M. Furst, Dielectric spectroscopy of concen-trated colloidal suspensions, J. Colloid Interface Sci. 408 (October (1)) (2013)54–58.
[18] C.C. Collins, Miniature passive pressure transensor for implanting in the eye,IEEE Trans. Biomed. Eng. 14 (April (2)) (1967) 74–83.
[19] K.G. Ong, C.A. Grimes, C.L. Robbins, R.S. Singh, Design and application of awireless, passive, resonant-circuit environmental monitoring sensor, Sens.Actuators A: Phys. 93 (August (1)) (2001) 33–43.
[20] B.E. Horton, S. Schweitzer, A.J. DeRouin, K.G. Ong, A varactor-based, inductivelycoupled wireless pH sensor, IEEE Sens. J. 11 (April (4)) (2011) 1061–1066.
[21] M.A. Fonseca, J.M. English, M. von Arx, M.G. Allen, Wireless micromachinedceramic pressure sensor for high-temperature applications, J. Microelec-tromech. Syst. 11 (August (4)) (2002) 337–343.
[22] R.A. Potyrailo, N. Nagraj, C. Surman, H. Boudries, H. Lai, J.M. Slocik, N. Kelley-Loughnane, R.R. Naik, Wireless sensors and sensor networks for homelandsecurity applications, Trends Anal. Chem. 40 (November (4)) (2012) 133–145.
[23] M.S. Mannoor, H. Tao, J.D. Clayton, A. Sengupta, D.L. Kaplan, R.R. Naik, N. Verma,F.G. Omenetto, M.C. McAlpine, Graphene-based wireless bacteria detection ontooth enamel, Nat. Commun. 3 (January) (2012) 763.
[24] T. Salpavaara, J. Verho, P. Kumpulainen, J. Lekkala, Readout methods for aninductively coupled resonance sensor used in pressure garment application,Sens. Actuators A: Phys. 172 (December (1)) (2011) 109–116.
[25] J.B. Ong, Z. You, J. Mills-Beale, E.L. Tan, B.D. Pereles, K.G. Ong, A wireless, passiveembedded sensor for real-time monitoring of water content in civil engineeringmaterials, IEEE Sens. J. 8 (December (12)) (2008) 2053–2058.
[26] J. Riistama, E. Aittokallio, J. Verho, J. Lekkala, Totally passive wireless biopoten-tial measurement sensor by utilizing inductively coupled resonance circuits,Sens. Actuators A: Phys. 157 (February (2)) (2010) 313–321.
[27] S.-W. Hwang, H. Tao, D.-H. Kim, H. Cheng, J.-K. Song, E. Rill, M. a Brenckle, B.Panilaitis, S.M. Won, Y.-S. Kim, Y.M. Song, K.J. Yu, A. Ameen, R. Li, Y. Su, M. Yang,D.L. Kaplan, M.R. Zakin, M.J. Slepian, Y. Huang, F.G. Omenetto, J. a Rogers, Aphysically transient form of silicon electronics, Science 337 (September (6102))(2012) 1640–16444.
[28] T. Salpavaara, J. Lekkala, S. Khan, V. Ellä, M. Kellomäki, Biodegradableencapsulation for inductively measured resonance circuit, in: 2012 IEEE12th International Conference on Bioinformatics & Bioengineering (BIBE),November, 2012, pp. 11–13.
[29] R.A. Potyrailo, W.G. Morris, T. Sivavec, H.W. Tomlinson, RFID sensors based onubiquitous passive 13. 56-MHz RFID tags and complex impedance detection,Wirel. Commun. Mob. Comput. 9 (10) (2009) 1318–1330.
Biographies
Timo Salpavaara received his M.Sc. degree in electrical engineering from TampereUniversity of Technology, (TTY), Finland, in 2005. Since 2005 he has been workingas a research scientist at the department of automation science and engineeringat Tampere University of Technology. Currently he is working on his PhD thesis.His research activities include inductively coupled resonance sensors, capacitivesensing and readout electronics.
Järveläinen M.Sc. majored in materials science and minored in industrial manage-ment from which he earlier graduated as a BSc. He works in Tampere University ofTechnology as a project manager and a researcher where he’s interdisciplinary workaligns at the interface of industry and academy. He’s projects deal with complicatedmeasurements involving characterization methods, usually applicable for industrialcomponents used in harsh environments.
Sari Seppälä M.Sc. is a researcher in department of materials science at TampereUniversity of Technology (TUT), Finland. She received her B.Sc. in metallic materi-als and M.Sc. in material research in TUT. Since then she has been working withnon-destructive testing (NDT) methods of ceramic material characterization. Herresearch focuses on understanding dielectric materials’ behaviour in an electricfield, polarization mechanisms and their exploitation in development of frequencyresponse based NDT methods.
Teemu Yli-Hallila received his M.Sc. degree in 2013 from the department of automa-tion science and engineering, Tampere University of Technology (TUT), where he iscurrently working as a researcher. His current research interests include systemidentification, analysis and process control.
Jarmo Verho is a research assistant with the department of automation science andengineering, Tampere University of Technology, Tampere, Finland. He is special-ized in low-noise electronics design and embedded systems. His current researchinterests include sensor networks, radio networks, short-range inductive links, andcapacitive sensing techniques.
Matti Vilkko received the M.Sc. and Lic.Tech. degrees in electrical engineeringand the Dr.Tech. degree in automation engineering from the Tampere Universityof Technology (TUT), Tampere, Finland, in 1989, 1993, and 1999, respectively. Hewas a researcher with the Institute of Automation and Control, TUT, from 1989 to1999, where he is currently a professor with the department of automation scienceand engineering. He was involved in research on scheduling and optimization ofhydrothermal power production. From 2000 to 2003, he held research and devel-opment management positions with Patria Ailon, Inc. and Ailocom, Inc. His currentresearch interests include modelling, simulation, system identification, and processcontrol.

330 T. Salpavaara et al. / Sensors and Actuators B 219 (2015) 324–330
Jukka Lekkala is a professor of automation engineering at Tampere Univer-sity of Technology (TUT), Tampere, Finland. He received his M.Sc.(Eng) degreein electronics and D.Sc.(Eng) degree in biomedical engineering from TUT, in1979 and 1984, respectively. Currently, he is the Head of the department ofautomation science and engineering (ASE) and also leads the research groupof Sensor Technology and Biomeasurements. Prof. Lekkala has more than 130international referee papers and ten patents. Lekkala’s main research activitiesinclude sensors, biosensing systems, sensor materials, instrumentation, and mod-elling.
Prof. Erkki Levänen Dr. Tech. Professor of ceramics materials and head of depart-ment at department of materials science at Tampere University of Technology,Tampere Finland. Professor Levänen’s research interests are in functional ceram-ics especially at the energy and environmental applications. His work ranges frommaterial synthesis to novel processing techniques and advanced characterizationmethods as well as application oriented research. The nanoparticle and thin filmsynthesis include sol–gel, supercritical carbon dioxide assisted synthesis and pyrol-ysis methods aiming to multifunctional materials with enhanced durability andself-recovery.
Publication VI
THERMAL FLOW PERMEAMETRY - A RAPID METHOD FOR
FINDING LOCAL CHANGES IN FLOW CHANNELS
by
Järveläinen Matti, Keskinen Lassi, Heinonen Saara, Kaleva Aaretti & Levänen Erkki
Composites Part A: Applied Science and Manufacturing, 79 (2015), pp. 138–145.
http://doi.org/10.1016/j.compositesa.2015.09.013
Reprinted from Composites Part A with permission of Elsevier B.V. Copyright © 2016 Elsevier B.V.

Thermal flow permeametry – A rapid method for finding local changesin flow channels
Matti Järveläinen ⇑, Lassi Keskinen, Saara Heinonen, Aaretti Kaleva, Erkki LevänenDepartment of Materials Science, Tampere University of Technology, Tampere, P.O. Box 589, FIN-33101, Finland
a r t i c l e i n f o
Article history:Received 25 February 2015Received in revised form 23 August 2015Accepted 20 September 2015Available online 28 September 2015
Keywords:B. AnisotropyB. Physical propertiesB. PorosityD. Non-destructive testing
a b s t r a c t
Solid bodies with flow channels can have very heterogeneous structure, whose local variations aredifficult to analyze. Yet, this can play an important role affecting characteristics, such as, fluid flow prop-erty, strength and heat conductivity. This article presents a method named thermal flow permeametry(TFP) that is applicable for a quick analysis of variations in flow channels, even in meter-sized structures.For illustrating the method, we analyzed the local permeability levels of a large and extremely complexfiber structure. In TFP, hot air is ejected through a structure, while thermal camera measures local surfacetemperature variations during heating. Gray values of the thermal image are then plotted versus thestructures local thickness, density and permeability. We showed that gray values link with local perme-ability, affected by thickness, density and flow channel tortuousness. We also found out that TFP is verysensitive to local changes in flow channels.
2015 Elsevier Ltd. All rights reserved.
1. Introduction
Structures that contain flow channels are important in variousapplications such as composites and functional ceramics. In theformer, the type and homogeneity of flow channels affect thematrix infiltration. This can be modelled [1,2], or studied within situ-methods such as [3], and it has an effect in the final proper-ties of the composite [4–8]. The latter group – functional ceramicsinclude, for example, hot gas filters [9] where the porosity must behomogenous in order to reach even flow characteristics and goodmechanical integrity. The latter characteristics are important inall structures with flow channels but especially in filters becausethey affect the filtration features [10], ease of cleaning the filter[11], and even the mechanical properties [12] of the component.However, these components often contain large variations in theirpermeability which arise from their manufacturing method, forexample vacuum molding of flocked slurry [13], that may inducechanges in wall thickness, bulk density, pore structure, and fiberorientation [14]. These changes can be difficult to measure duringor after the manufacturing process, and for instance, solely thefiber orientation affects the mechanical properties [15] andpermeability of the component [16–18]. Because the variationswill have a large impact on the final properties, both permeability
and strength, it is of great importance to be able to both reducetheir appearance and detect and quantify them in the final product.
Predicting the permeability has been studied before [19–25].Conventionally, permeability measurements [26–28], have beenused for analyzing the flow resistance of components with flowchannels, and while the traditional permeameters are suitable formeasuring the overall permeability, they cannot easily give infor-mation about the structural anisotropy of a measured component.The same applies for many of the new and innovative methods formeasuring permeability or characterizing flow channels in differ-ent situations [29–35]. Although the referenced methods, as wellas [36], can be precise and closer to quantifiable results in similaruse, another method capable to quickly and non-destructively ana-lyze local properties of large components with flow channels usinggas as a measuring medium is needed. This would be beneficial,especially for application where gas flow characteristics dominateand that is the reason we developed thermal flow permeametry(TFP). TFP can be used to locate the permeability variances byinducing a hot air stream through the structure causing its outersurface to heat faster in areas where there is a higher flow. Thecomponent’s surface is monitored in situ with an infra-red camera[37], and variations in the heating rate are constantly measured.The temperature differences on the surface of the measuredstructure are mostly caused by differences in its local permeabilitylevels, which are determined by the pore structure. This gives areal-time image of the component where regions of highpermeability are highlighted as bright areas contrary to dark areas
http://dx.doi.org/10.1016/j.compositesa.2015.09.0131359-835X/ 2015 Elsevier Ltd. All rights reserved.
⇑ Corresponding author.E-mail address: [email protected] (M. Järveläinen).
Composites: Part A 79 (2015) 138–145
Contents lists available at ScienceDirect
Composites: Part A
journal homepage: www.elsevier .com/locate /composi tesa
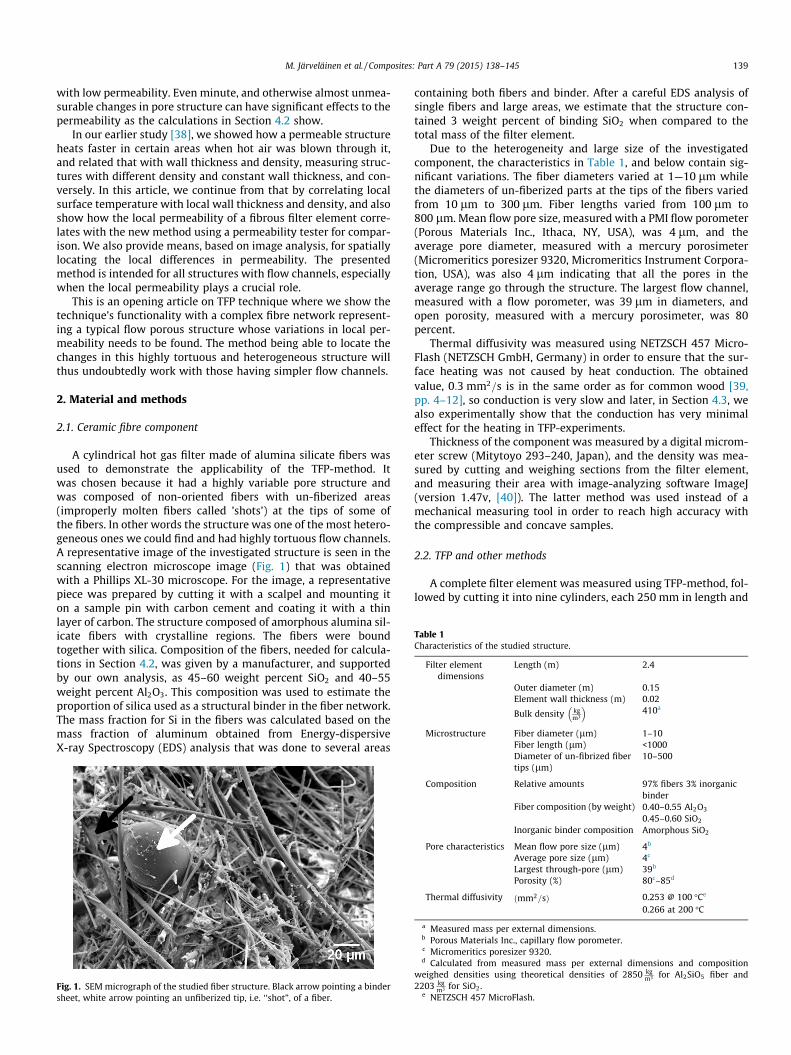
with low permeability. Even minute, and otherwise almost unmea-surable changes in pore structure can have significant effects to thepermeability as the calculations in Section 4.2 show.
In our earlier study [38], we showed how a permeable structureheats faster in certain areas when hot air was blown through it,and related that with wall thickness and density, measuring struc-tures with different density and constant wall thickness, and con-versely. In this article, we continue from that by correlating localsurface temperature with local wall thickness and density, and alsoshow how the local permeability of a fibrous filter element corre-lates with the new method using a permeability tester for compar-ison. We also provide means, based on image analysis, for spatiallylocating the local differences in permeability. The presentedmethod is intended for all structures with flow channels, especiallywhen the local permeability plays a crucial role.
This is an opening article on TFP technique where we show thetechnique’s functionality with a complex fibre network represent-ing a typical flow porous structure whose variations in local per-meability needs to be found. The method being able to locate thechanges in this highly tortuous and heterogeneous structure willthus undoubtedly work with those having simpler flow channels.
2. Material and methods
2.1. Ceramic fibre component
A cylindrical hot gas filter made of alumina silicate fibers wasused to demonstrate the applicability of the TFP-method. Itwas chosen because it had a highly variable pore structure andwas composed of non-oriented fibers with un-fiberized areas(improperly molten fibers called ’shots’) at the tips of some ofthe fibers. In other words the structure was one of the most hetero-geneous ones we could find and had highly tortuous flow channels.A representative image of the investigated structure is seen in thescanning electron microscope image (Fig. 1) that was obtainedwith a Phillips XL-30 microscope. For the image, a representativepiece was prepared by cutting it with a scalpel and mounting iton a sample pin with carbon cement and coating it with a thinlayer of carbon. The structure composed of amorphous alumina sil-icate fibers with crystalline regions. The fibers were boundtogether with silica. Composition of the fibers, needed for calcula-tions in Section 4.2, was given by a manufacturer, and supportedby our own analysis, as 45–60 weight percent SiO2 and 40–55weight percent Al2O3. This composition was used to estimate theproportion of silica used as a structural binder in the fiber network.The mass fraction for Si in the fibers was calculated based on themass fraction of aluminum obtained from Energy-dispersiveX-ray Spectroscopy (EDS) analysis that was done to several areas
containing both fibers and binder. After a careful EDS analysis ofsingle fibers and large areas, we estimate that the structure con-tained 3 weight percent of binding SiO2 when compared to thetotal mass of the filter element.
Due to the heterogeneity and large size of the investigatedcomponent, the characteristics in Table 1, and below contain sig-nificant variations. The fiber diameters varied at 1—10 lm whilethe diameters of un-fiberized parts at the tips of the fibers variedfrom 10 lm to 300 lm. Fiber lengths varied from 100 lm to800 lm.Mean flow pore size, measured with a PMI flow porometer(Porous Materials Inc., Ithaca, NY, USA), was 4 lm, and theaverage pore diameter, measured with a mercury porosimeter(Micromeritics poresizer 9320, Micromeritics Instrument Corpora-tion, USA), was also 4 lm indicating that all the pores in theaverage range go through the structure. The largest flow channel,measured with a flow porometer, was 39 lm in diameters, andopen porosity, measured with a mercury porosimeter, was 80percent.
Thermal diffusivity was measured using NETZSCH 457 Micro-Flash (NETZSCH GmbH, Germany) in order to ensure that the sur-face heating was not caused by heat conduction. The obtainedvalue, 0:3 mm2=s is in the same order as for common wood [39,pp. 4–12], so conduction is very slow and later, in Section 4.3, wealso experimentally show that the conduction has very minimaleffect for the heating in TFP-experiments.
Thickness of the component was measured by a digital microm-eter screw (Mitytoyo 293–240, Japan), and the density was mea-sured by cutting and weighing sections from the filter element,and measuring their area with image-analyzing software ImageJ(version 1.47v, [40]). The latter method was used instead of amechanical measuring tool in order to reach high accuracy withthe compressible and concave samples.
2.2. TFP and other methods
A complete filter element was measured using TFP-method, fol-lowed by cutting it into nine cylinders, each 250 mm in length and
Fig. 1. SEMmicrograph of the studied fiber structure. Black arrow pointing a bindersheet, white arrow pointing an unfiberized tip, i.e. ‘‘shot”, of a fiber.
Table 1Characteristics of the studied structure.
Filter elementdimensions
Length (m) 2.4
Outer diameter (m) 0.15Element wall thickness (m) 0.02
Bulk density kgm3
410a
Microstructure Fiber diameter (lm) 1–10Fiber length (lm) <1000Diameter of un-fibrized fibertips (lm)
10–500
Composition Relative amounts 97% fibers 3% inorganicbinder
Fiber composition (by weight) 0.40–0.55 Al2O3
0.45–0.60 SiO2
Inorganic binder composition Amorphous SiO2
Pore characteristics Mean flow pore size (lm) 4b
Average pore size (lm) 4c
Largest through-pore (lm) 39b
Porosity (%) 80c–85d
Thermal diffusivity ðmm2=sÞ 0.253 @ 100 Ce
0.266 at 200 C
a Measured mass per external dimensions.b Porous Materials Inc., capillary flow porometer.c Micromeritics poresizer 9320.d Calculated from measured mass per external dimensions and composition
weighed densities using theoretical densities of 2850 kgm3 for Al2SiO5 fiber and
2203 kgm3 for SiO2.
e NETZSCH 457 MicroFlash.
M. Järveläinen et al. / Composites: Part A 79 (2015) 138–145 139

further cutting out the sections of the cylinders that were imagedwith thermal camera. Each cylinder section’s thickness was mea-sured and then their bulk density [41] was calculated by weighingand using image analysis to accurately measure the dimensions.Finally, their permeability was measured individually with apermeability testing unit described below. The three variables:thickness, density, and permeability were then correlated withgray values to see how they correlate.
2.2.1. Thermal flow permeability measurementThe thermal imaging setup consisted of a thermal camera (FLIR
Thermacam PM595, FLIR Systems, Inc., USA) with an accuracy of2 percent of the reading, a length scale (scale 20 cm) made ofmetallic rods that are visible in IR-images, and an adjustable gasinlet able to feed air up to 2000 l/min. Air at room temperature(approximately 25 C) flowed through a heater and finally throughthe monitored structure. The heater unit could be heated to 400 C.A schematic presentation of the setup is presented in Fig. 2.
The air flow was set to 1000 Nl/min (norm liters), and the airheating unit was set to 100 C. The heated air at the sample levelwas measured with thin k-type thermocouples and determinedto be homogenous and at the heater set temperature after 80 s.
An example of a thermal image is presented in Fig. 3. Temperaturesin the measured surfaces ranged from 23–72 C, average beingclose to 50 C.
2.3. Quantification of surface temperature
Thermal images, in which the temperatures are exhibited asbrightness variations, were converted to grayscale and their grayvalue – a unitless indicator of the luminescence, or brightness, ofa pixel varying from 0 (black) to 254 (white) – was calculated withimage analysis software, ImageJ [40]. Thus, the gray value relatesdirectly to the surface temperature of the imaged component atthe selected point or a selected area. An example of an imaged sur-face, both in color and grayscale, together with plotted gray value,is presented in Fig. 3. Presented Gray values are the average valuesfrom each position along the horizontal axis of the sample.
2.4. Classical air permeability measurement
Permeability measurements were conducted using a measuringprobe connected to the open end of the measured component. Aschematic presentation of the device can be seen in Fig. 4. Themeasuring probe had a gate valve to adjust the flow velocity anda flow velocity meter (Schmidt SS30.302, SCHMIDT Technology),with 3 percent gain and plus 0.3 percent offset, and a connectionto a hand-held micromanometer (DP measurement TT570SV, UK),with gain of 1 percent and offset of 1.
Air permeability was measured by drawing air through thecomponent while the pressure drop over the studied componentwas adjusted with the gate valve. Air flow velocity was measuredin a flow (after a laminar flow filter) that caused the same pressuredrop, measured by the manometer, over all the measured compo-nents, and the flow was divided with the outer surface area of thecomponent to calculate its facial velocity, which is independent ofcomponent size. Thus the permeabilities could be measured andcompared between the complete component and sections cut fromit.
The total measuring error of the permeability testing unit wasexperimentally found to be 10 percent, which is acceptablebecause the measured permeability variations were two timeshigher.
3. Results
In the present study a fibrous filter element with flow throughit’s structure (presented in Fig. 1 and Table 1) was measured by TFPto show that the method can be used to analyze differences in local
Fig. 2. Schematic presentation of thermal flow permeametry setup. Thermalcamera was fixed on a tripod, 7 m from the imaged component. (For interpretationof the references to colour in this figure legend, the reader is referred to the webversion of this article.)
Fig. 3. Thermal image of measured surface in color and grayscale together with plotted gray value. White/red is hot, black/blue is cold.
140 M. Järveläinen et al. / Composites: Part A 79 (2015) 138–145

permeability and to investigate the method’s sensitivity. In thischapter, the gray values are compared with the element’s localwall thickness, porosity and facial velocity which, owing to themanufacturing method, had more variation in axial direction.These results aim to show how the parameters compare with thegray values. The parameters were measured from 25 cm tallsections cut from a complete element. The reported numbers aremeasured from the area of the thermal image. The use of airpermeability for correlation was chosen as TFP-method also usedair and liquid extrusion or intrusion techniques might have ledto discrepancies in comparison.
3.1. Gray value and thickness
In order to relate the wall thickness to variations in the grayvalue, the filter element was cut into 25 cm long sections, and
the wall thicknesses were measured from both sides of each sec-tion on the center line of the imaged surface. The gray valuesand wall thicknesses were then plotted against the distance inthe element, Fig. 5, it could be seen that the gray value increasedas the wall got thinner, indicating they have a higher surface tem-perature in comparison to thicker areas.
3.2. Gray value and porosity
Fig. 6 shows the gray value and local porosity of the componentplotted versus the distance in the element. In areas of high poros-ity, the gray value is higher, indicating a higher surface tempera-ture. Note that the porosity variation is very small. The porosityis calculated by subtracting from 1 the ratio of the measured den-sity of the porous 25 cm cut sections of size equal to the thermalimage and the density of a respective dense material (see Table 1).
3.3. Gray value and facial velocity
The air flow through the 25 cm sections was then measuredwith the permeability testing unit (Section 2.4) forcing the flowthrough the imaged area of the cylindrical sample by blockingthe other areas with plastic film. In the experiment, the air flowwas adjusted to incur 4 kPa pressure drop, as compared to atmo-spheric pressure, and the corresponding face velocity was calcu-lated based on the flow velocity results and the section’s outersurface area. Fig. 7 shows the gray value and the measured facial
Fig. 4. Schematic presentation of permeability testing unit. (For interpretation ofthe references to colour in this figure legend, the reader is referred to the webversion of this article.)
Fig. 5. Gray value vs. component wall thickness, with the thermal image in the background.
Fig. 6. Gray value vs. component porosity, with the thermal image in the background. qb is measured bulk density, and qt is the weighed average (in Table 1) of theoreticaltrue densities of alumina silicate fiber and silica-binder.
M. Järveläinen et al. / Composites: Part A 79 (2015) 138–145 141

velocity versus the distance in the element. In sections of highfacial velocity, the gray value is also higher.
4. Discussion
4.1. The relative importance of measured properties to the gray value
In the following, we show linear correlations between the grayvalue and the locally measured quantities: thickness, porosity, andfacial velocity. The aim in this is to find out if the factors arelinked with surface heating, not to describe or model the link.
We found out that the gray value, obtained from TFP measure-ments, is the most sensitive to local permeability presented here asfacial velocity in constant pressure drop. The permeability is partlyaffected, but not determined, by wall thickness and porosity. Coin-cidental contribution of the two variables is evident as the correla-tion with gray value is higher if the variables are combined usingEq. (3) that in Appendix A is presented in its original form. In theequation, fluid dynamic viscosity (l), specific surface area per unit
volume Sv , and Kozeny–Carman constant (K) were set constantsleading to a relation that shows how the component’s permeabilitydepends on its thickness and porosity:
DPU0
Le2 2Leþ Le3
ð1Þ
In other words, the relation from Kozeny–Carman equation canbe used to see if the temperature differences, generated on the sur-face, are affected by both the component wall thickness andporosity.
The linear fittings are evaluated by adjusted R-squared andPearson’s correlations, which both indicate the same trends thatcan be seen in Table 2. Only a weak correlation between the wallthickness and gray value exists. Correlations between the porosityand the gray value are higher yet the R-square of 0.37 is still veryweak. Correlation increases to 0.52 with the KC-relation that com-bines the wall thickness and porosity, but the highest correlation of0.79 is found with the facial velocity. This shows that thedifferences in surface heating velocities are dominated by local
Fig. 7. Component gray value vs. facial velocity, with thermal image of the component in the background.
Fig. 8. Linear trend with correlation efficiency (R2), between gray value and wall thickness, porosity, Kozeny–Carman relation, and facial velocity.
142 M. Järveläinen et al. / Composites: Part A 79 (2015) 138–145

air permeability of the element, and other than wall thickness andpermeability, there must also be variables affecting the surfaceheating rate. These must consist of pore structure or pore size dis-tribution that change the flow channels’ tortuousness. For instancein the case of fibrous filters the these characteristics are affected bythe binder [42]. Also the amount of fibre volume fraction has aneffect on the heating through thermal conductivity [43] but thisis countered with high enough air flow velocity as is seen inSection 4.3.
As a summary; considering how the correlation to surface tem-perature increases in each step from wall thickness, through den-sity, towards permeability, it is clearly evident that the presentedTFP method primarily gives information about the local permeabil-ity of the structure, furthermore, it is so sensitive that the othermethods, such as the classical air permeability measurement can-not be unambiguously used as a reference.
4.2. Sensitivity of TFP
As was shown in the previous section, TFP-method can locatepermeability differences of a structure. The permeability is affectedby shape, tortuosity and size of flow channels and is thus linkedwith local porosity. In general, permeability reduces with increas-ing fiber volume fraction [3]. To elucidate this and to numericallyapproximate the TFP-method’s sensitivity to changes in localporosity, a calculation with Kozeny–Carman equation can be used,though it must be noted that Kozeny–Carman, especially in fibrousstructure, is only a coarse predictor of quantified results. It can stillbe used to show how a minute, and many times undetectable,change of porosity can remarkably affect the local permeability,which in turn can be measured with TFP.
The Kozeny–Carman Eq. (3) [44, chap. 3], shows that in additionto the environmental parameters consisting of facial velocity (U0),and fluid dynamic viscosity (l); the structure’s porosity (e), specificsurface area per unit volume (Sv ), and thickness (L) are also con-trolling the pressure drop. The Sv is affected by the pore structureand size, which in our case is difficult to measure or predict,because the fiber structure is heterogeneous with uneven fiberdiameter and the uneven shape, distribution, and size of bindersheets affecting it. The permeability is also affected by the tortu-ousness and shape of the flow channels, which are taken intoaccount with the constant K in the formula. Keeping these in mindthe equation is applied in Appendix A leading to an approximationthat a porosity decrease from 0.85 to 0.80 would cause the pres-sure drop, at constant face velocity, to increase more than twofoldfrom 4.00 kPa to 9.83 kPa. This emphasizes that the TFP-method,although affected by multiple factors related to flow pores, is aboveall highly sensitive to a relatively small changes in porosity.
4.3. Cause of surface temperature gradients during heating
As we have demonstrated via case study, the surface of a struc-ture containing flow channels heats heterogeneously while hot airis ejected through it. This is because its local permeability varieswith the local changes in its pore structure. The temperatureincrease is caused mainly by the high volume flow of hot airthrough the areas with high permeability, and the difference to
areas with low permeability are promoted by the air cooling downwhile taking a longer route through the more tortuous path in thehigh density areas.
The heat conduction through the structure is not an issue,which can be shown by a simple experiment where the inner sur-face of the component was placed against a 80 C surface whileplotting the component’s outer surface temperature together withthe heating element’s temperature. The result is shown in Fig. 9.During the over 15-min measurement the heating element couldincrease the component’s outer surface temperature from 35 Cto 40 C and when taking into account that the TFP measurementswere carried out within first 3 min, marked by blue area in the fig-ure, the effect of conduction can clearly be neglected. The totaltemperature increase in TFP measurement was approximately25 C as compared to plain conduction causing a change less than2 C. The figure also displays the theoretical heating rates causedby conduction, based on the structure’s thermal diffusivity. Thetheoretical temperature curves were calculated with Eq. (2) [45,chap. 6.4], where, in this case, Ti is the initial temperature of thesurface, Ts is the temperature of the heating element, erf ðxÞ isthe Gauss error function, x is the structure’s wall thickness, a isthe measured thermal diffusivity at 100 C and t is time.
Tðx; tÞ ¼ Ts þ ðTi TsÞ erf x2
ffiffiffiffiffiat
p
ð2Þ
The theoretical and experimental heating curves are in goodagreement, especially in the area where the TFP-measurementswere carried out. The overestimation at higher temperatures inthe theoretical curve is caused by cooling of the structures surface,which is not taken into account in the equation.
5. Conclusions
The above experiments have helped to form a basis for thermalflow permeametry. Compared to conventional permeametry, it canlocate local differences within the analyzed area without needingto seal off any areas of the measured component. It is also fasterand capable of finding smaller differences than conventional meth-ods, provided that the measuring parameters, mainly air tempera-ture and flow velocity, are chosen correctly.
The method can be applied with little effort for several uses,such as ensuring an even production quality or analyzing localchanges in specimen whose specific permeability levels have tobe studied with gas, for instance when the specimen cannot
Table 2Correlations calculated from Fig. 8 linear fittings.
Wall thickness Porosity KC-relation Facial velocity
Pearson’s relation 0.61 0.68 0.77 0.91Adjusted R-square 0.26 0.37 0.52 0.79
Fig. 9. Temperature of a heating element touching the inner surface of thecomponent in dashed red and the component’s outer surface temperature in blue.Theoretical heating curves in dashed gray at 80 and 100 C calculated with Eq. (2).(For interpretation of the references to colour in this figure legend, the reader isreferred to the web version of this article.)
M. Järveläinen et al. / Composites: Part A 79 (2015) 138–145 143

withstand liquids. Particularly this can work as an in situ-methodto ensure the quality of a composite pre-preg before infiltrationand may gain synergy when coupled with other methods, suchas [3], or it can be used to study more complex structures suchas fibrous filter elements that need homogeneous flow channels.
The experiments presented in this article were conducted forsilica-based fibrous ceramics with a low density and thermal diffu-sivity. The method would undoubtedly also work for other struc-tures, as long as the ratio between the component’s permeabilityand thermal diffusivity is high enough. If the ratio is too low, theheat conducting through the structure might affect the results.Even in this case, the method might be applicable when usinglow air temperature and high flow velocity combined with a sur-face coating, such as graphite, that would promote heating causedby the air flowing through the structure. Notable is also that thestructure used for measuring had exceptionally complex flowchannels alluding that simpler structures can also be measured.The next step in development of this method is linking the surfaceheating rate with local pore size, followed by a model that correctsthe rate with flow channels’ tortuosity and shape, thus enablingquantifiable results. This should be carried out with structures thathave more defined flow channels.
Acknowledgements
We would like to thank MSc Timo Honkola for the idea of TFP,Dr. Arto Ojuva for a profound proofreading and valuable com-ments, BSc Lauri Niittymäki for the help in permeabilitymeasurement.
Appendix A. Sensitivity estimation with Kozeny–Carmanequation
In Section 4.2 the effect of porosity changing from 0.85 to 0.80causing the permeability to double was based on an estimationwith Kozeny–Carman equation:
DPL
¼ l Kð1 eÞ2S2ve3
" #U0 ð3Þ
For the structure under investigation the Sv can be approxi-mated with Eq. (3), where the variables, collected in Table 3, arethe measured average values presented in results, l is the airdynamic viscosity at the measuring temperature and K is the tortu-osity for fibrous structure given as a constant in [46]. The equationyields 722 m2
m3 for Sv . It is to be noted that assuming the K a constantis not accurate, except in highly porous systems, such as the oneunder inspection where K should not be a dominating factor [47].
Now, using the fiber densities presented earlier and 722 m2
m3 forSv , the approximate size of a fiber-binder block separating the flowchannels, i.e. the area of material between an average sized flowchannel, can be approximated. This is done by calculating howmuch material the structure contains based on the measured bulk
density (qb) and weighed mean theoretical densities of aluminumsilicate fiber and amorphous silicon dioxide in the component.With the given Sv , assuming a cylindrical fiber-binder block withradius (r) in a component weighing (m), by using 2 m
p r , yields adiameter of 402 lm. This is a rough approximation of the averageradius of a continuous section between the flow channels wherethe air cannot pass through.
The sensitivity of TFP-method to changes in porosity can nowbe seen by a simple calculation showing how much the permeabil-ity changes if the porosity would slightly decrease, for instancefrom 0.85 to 0.80. Firstly, this would change the qb from 410 kg
m3
to 431 kgm3 leading, with the same computation principle, to a
change of Sv from 722 m2
m3 to 1204 m2
m3. Now using Eq. (3) again, thepressure drop, with constant face velocity, more than doubles from4.00 kPa to 9.83 kPa. In fact, the change would be even higher dueto the tortuosity, now assumed constant for the sake of simplicity,that in reality increases with decreasing porosity.
References
[1] Simacek P, Advani S. Simulating tape resin infiltration during thermosetpultrusion process. Compos Part A: Appl Sci Manuf 2015;72:115–26. http://dx.doi.org/10.1016/j.compositesa.2015.01.020. <http://linkinghub.elsevier.com/retrieve/pii/S1359835X15000317>.
[2] Sas HS, Wurtzel EB, Simacek P, Advani SG. Effect of relative ply orientation onthe through-thickness permeability of unidirectional fabrics. Compos SciTechnol 2014;96:116–21. http://dx.doi.org/10.1016/j.compscitech.2014.03.007.
[3] Cender Thomas A, Simacek Pavel, Advani Suresh G. Resin film impregnation infabric prepregs with dual length scale permeability. Compos Part A: Appl SciManuf 2013;53:118–28. http://dx.doi.org/10.1016/j.compositesa.2013.05.013.
[4] Levy A, Kratz J, Hubert P. Air evacuation during vacuum bag only prepregprocessing of honeycomb sandwich structures: In-plane air extraction prior tocure. Compos Part A: Appl Sci Manuf 2015;68:365–76. http://dx.doi.org/10.1016/j.compositesa.2014.10.013. <http://linkinghub.elsevier.com/retrieve/pii/S1359835X1400325X>.
[5] Allaoui S, Cellard C, Hivet G. Composites: Part A effect of inter-ply sliding onthe quality of multilayer interlock dry fabric preforms. Compos Part A2015;68:336–45. http://dx.doi.org/10.1016/j.compositesa.2014.10.017.
[6] Qian C, Harper L, Turner T, Warrior N. Structural optimisation of randomdiscontinuous fibre composites: Part 1 methodology. Compos Part A: App SciManuf 2015;68:406–16. http://dx.doi.org/10.1016/j.compositesa.2014.08.024.<http://linkinghub.elsevier.com/retrieve/pii/S1359835X14002577>.
[7] Qian C, Harper L, Turner T, Warrior N. Structural optimisation of randomdiscontinuous fibre composites: Part 2 case study. Compos Part A: Appl SciManuf 2015;68:417–24. http://dx.doi.org/10.1016/j.compositesa.2014.09.004.<http://linkinghub.elsevier.com/retrieve/pii/S1359835X14002772>.
[8] Ivanov DS, Lomov SV. Compaction behaviour of dense sheared wovenpreforms: experimental observations and analytical predictions. Compos PartA: App Sci Manuf 2014;64:167–76. http://dx.doi.org/10.1016/j.compositesa.2014.05.002. <http://linkinghub.elsevier.com/retrieve/pii/S1359835X14001286>.
[9] Heidenreich S. Hot gas filtration a review. Fuel 2013;104:83–94. http://dx.doi.org/10.1016/j.fuel.2012.07.059. <http://linkinghub.elsevier.com/retrieve/pii/S0016236112006199>.
[10] Sharma SD, Carras JN. Fuels – hydrogen production-gas cleaning: barrierfilters. In: Garche J, editor. Encyclopedia of electrochemical powersources. Amsterdam: Elsevier; 2009. p. 313–8.
[11] Kanaoka C, Amornkitbamrung M. Effect of filter permeability on the release ofcaptured dust from a rigid ceramic filter surface. Powder Technol 2001;118(1–2):113–20. http://dx.doi.org/10.1016/S0032-5910(01)00301-1. <http://linkinghub.elsevier.com/retrieve/pii/S0032591001003011>.
[12] Westerheide R, von Der Wehd C, Walch A, Baumgarten J. Vibration behavior ofceramic hot gas filter elements: analysis and characterization of mechanicalproperties. Tech Rep; 2002.
[13] Zievers JS. Hot gas filter; 1990.[14] Yu H, Potter K, Wisnom M. A novel manufacturing method for aligned
discontinuous fibre composites (high performance-discontinuous fibremethod). Compos Part A: Appl Sci Manuf 2014;65:175–85. http://dx.doi.org/10.1016/j.compositesa.2014.06.005. <http://linkinghub.elsevier.com/retrieve/pii/S1359835X14001705>.
[15] Baghaei B, Skrifvars M, Salehi M, Bashir T, Rissanen M, Nousiainen P. Novelaligned hemp fibre reinforcement for structural biocomposites: porosity,water absorption, mechanical performances and viscoelastic behaviour.Compos Part A: Appl Sci Manuf 2014;61:1–12. http://dx.doi.org/10.1016/j.compositesa.2014.01.017. <http://linkinghub.elsevier.com/retrieve/pii/S1359835X14000311>.
[16] Meyer KJ, Hofmann JT, Baird DG. Prediction of short glass fiber orientation inthe filling of an end-gated plaque. Compos Part A: Appl Sci Manuf2014;62:77–86. http://dx.doi.org/10.1016/j.compositesa.2013.12.013. <http://linkinghub.elsevier.com/retrieve/pii/S1359835X13003503>.
Table 3Material parameters used in calculation.
L 0.020 ml 1.983 Pa sa
K 12.81e 0.85U0 0.44 m/sb
qb 410 kgm3
qt 2850 kgm3 for Al2SiO5 fiber and 2203 kg
m3 for SiO2 binder
a Air dynamic viscosity at 25 C.b Avg. superficial velocity on the sample surface in the experiments.
144 M. Järveläinen et al. / Composites: Part A 79 (2015) 138–145

[17] Notta-Cuvier D, Lauro F, Bennani B. An original approach for mechanicalmodelling of short-fibre reinforced composites with complex distributions offibre orientation. Compos Part A: Appl Sci Manuf 2014;62:60–6. http://dx.doi.org/10.1016/j.compositesa.2014.03.016. <http://linkinghub.elsevier.com/retrieve/pii/S1359835X14000888>.
[18] Tsuda T, Ogasawara T, Moon S-Y, Nakamoto K, Takeda N, Shimamura Y, et al.Three dimensional orientation angle distribution counting and calculation forthe mechanical properties of aligned carbon nanotube/epoxy composites.Compos Part A: Appl Sci Manuf 2014;65:1–9. http://dx.doi.org/10.1016/j.compositesa.2014.05.009. <http://linkinghub.elsevier.com/retrieve/pii/S1359835X14001444>.
[19] Liu HL, Hwang WR. Permeability prediction of fibrous porous media withcomplex 3D architectures. Compos Part A: Appl Sci Manuf 2012;43(11):2030–8. http://dx.doi.org/10.1016/j.compositesa.2012.07.024. <http://linkinghub.elsevier.com/retrieve/pii/S1359835X12002254>.
[20] Papathanasiou T. Flow across structured fiber bundles: a dimensionlesscorrelation. Int J Multiphase Flow 2001;27:1451–61. <http://www.sciencedirect.com/science/article/pii/S0301932201000131>.
[21] Chen Z-R. Permeability predictions for woven fabric preforms. J Compos Mater2009;44(13):1569–86. http://dx.doi.org/10.1177/0021998309355888.<http://jcm.sagepub.com/cgi/doi/10.1177/0021998309355888>.
[22] Lundstrom TS. Modeling of power-law fluid flow through fiber beds. J ComposMater 2005;40(3):283–96. http://dx.doi.org/10.1177/0021998305055187.<http://jcm.sagepub.com/cgi/doi/10.1177/0021998305055187>.
[23] Lundstrom TS, Frishfelds V, Jakovics A. A statistical approach to permeability ofclustered fibre reinforcements. J Compos Mater 2004;38(13):1137–49. http://dx.doi.org/10.1177/0021998304042079. <http://jcm.sagepub.com/cgi/doi/10.1177/0021998304042079>.
[24] Kuentzer N, Simacek P, Advani SG, Walsh S. Permeability characterization ofdual scale fibrous porous media. Compos Part A: Appl Sci Manuf 2006;37(11):2057–68. http://dx.doi.org/10.1016/j.compositesa.2005.12.005. <http://linkinghub.elsevier.com/retrieve/pii/S1359835X05004306>.
[25] Lundström T. The permeability of non-crimp stitched fabrics. ComposPart A 2000;31:1345–53. <http://www.sciencedirect.com/science/article/pii/S1359835X00000373>.
[26] ASTM F778. Standard methods for gas flow resistance testing of filtrationmedia. ASTM; 2007. http://dx.doi.org/10.1520/F0778-88R07. <http://www.astm.org/Standards/F778.htm>.
[27] Arbter R, Beraud J, Binetruy C, Bizet L, Bréard J, Comas-Cardona S, et al.Experimental determination of the permeability of textiles: a benchmarkexercise. Compos Part A: Appl Sci Manuf 2011;42(9):1157–68. http://dx.doi.org/10.1016/j.compositesa.2011.04.021. <http://linkinghub.elsevier.com/retrieve/pii/S1359835X11001357>.
[28] Vernet N, Ruiz E, Advani S, Alms J, Aubert M, Barburski M, et al. Experimentaldetermination of the permeability of engineering textiles: benchmark II.Compos Part A: Appl Sci Manuf 2014;61:172–84. http://dx.doi.org/10.1016/j.compositesa.2014.02.010. <http://linkinghub.elsevier.com/retrieve/pii/S1359835X14000505>.
[29] LeBel F, Fanaei AE, Ruiz E, Trochu F. Experimental characterization byfluorescence of capillary flows in dual-scale engineering fabrics. Text Res J2013;83(15):1634–59. http://dx.doi.org/10.1177/0040517512471742.<http://trj.sagepub.com/cgi/doi/10.1177/0040517512471742>.
[30] Lundström T, Gebart B, Sandlund E. In-plane permeability measurements onfiber reinforcements by themulti-cavity parallel flow technique. PolymCompos20(1). <http://onlinelibrary.wiley.com/doi/10.1002/pc.10342/abstract>.
[31] Demaria C, Ruiz E,Trochu F. In-plane anisotropic permeability characterizationof deformed woven fabrics by unidirectional injection. Part I: experimental
results. Polym Compos. http://dx.doi.org/10.1002/pc.20107/abstract. <http://onlinelibrary.wiley.com/doi/10.1002/pc.20107/abstract>
[32] Sharma S, Siginer DA. Permeability measurement methods in porous media offiber reinforced composites. Appl Mech Rev 2010;63(2):020802. http://dx.doi.org/10.1115/1.4001047. <http://appliedmechanicsreviews.asmedigitalcollection.asme.org/article.aspx?articleid=1399595>.
[33] Wu X, Li J, Shenoi RA. A new method to determine fiber transversepermeability. J Compos Mater 2006;41(6):747–56. http://dx.doi.org/10.1177/0021998306067012. <http://jcm.sagepub.com/cgi/doi/10.1177/0021998306067012>.
[34] Stadtfeld HC, Erninger M, Bickerton S, Advani SG. An experimental method tocontinuously measure permeability of fiber preforms as a function offiber volume fraction. J Reinf Plast Compos. http://dx.doi.org/10.1177/073168402128987518.
[35] Nedanov P, Advani S. A method to determine 3D permeability of fibrousreinforcements. J Compos Mater. http://dx.doi.org/10.1106/002199802021462.<http://jcm.sagepub.com/content/36/2/241.short>.
[36] Cender TA, Šimácek P, Advani SG. A method to determine open pore volumewith pulse decay. Appl Phys Lett 2014;105(13):134101. http://dx.doi.org/10.1063/1.4896854. <http://scitation.aip.org/content/aip/journal/apl/105/13/10.1063/1.4896854>.
[37] Chrzanowski K, Park S. Evaluation of thermal cameras for non-destructivethermal testing applications. Infrared Phys Technol 2001;42(2):101–5. <http://www.sciencedirect.com/science/article/pii/S1350449500000621>.
[38] Järveläinen M, Keskinen L, Levänen E. Use of thermal imaging incharacterization of ceramic fiber structures. In: 2nd International conferenceon competitive materials and technological processes, IOP Conf series:materials science and engineering, vol. 47. Miskolc; 2013. <http://iopscience.iop.org/1757-899X/47/1/012062>.
[39] Ross RJ. F. P. Laboratory. Wood handbook: wood as an engineering material.Tech Rep; 2010. <http://www.fpl.fs.fed.us/documnts/fplgtr/fpl_gtr190.pdf>.
[40] National Institutes of Health. ImageJ; 2013. <http://rsbweb.nih.gov/ij/index.html>.
[41] Webb P. Volume and density determinations for particle technologists.Micromeritics Instrument Corp (February). <http://www.anime.micrx.com/Repository/Files/Volume_and_Density_determinations_for_Particle_Technologists.pdf>.
[42] Fernando JA, Chung DDL. Pore structure and permeability of an alumina fiberfilter membrane for hot gas filtration. J Porous Mater 2002;9(3):211–9.<http://apps.isiknowledge.com/full_record.do?product=WOS&search_mode=GeneralSearch&qid=5&SID=Q1ciIkA8El8jK@GNm@7&page=1&doc=2>.
[43] Yu H, Heider D, Advani S. Prediction of effective through-thickness thermalconductivity of woven fabric reinforced composites with embedded particles.Compos Struct 2015;127:132–40. http://dx.doi.org/10.1016/j.compstruct. 2015.03.015. <http://linkinghub.elsevier.com/retrieve/pii/S0263822315001877>.
[44] Holdich RG. Fundamentals of particle technology. Loughborough: MidlandInformation Technology and Publishing; 2002. <http://www.particles.org.uk/particle_technology_book/particle_book.htm>.
[45] Rathore MM, Kapuno RR. Engineering heat transfer. 2nd ed. Sudbury,MA: Jones & Bartlett Learning; 2011.
[46] Li J, Gu Y. Coalescence of oil-in-water emulsions in fibrous and granular beds.Sep Purif Technol 2005;42(1):1–13. http://dx.doi.org/10.1016/j.seppur. 2004.05.006. <http://linkinghub.elsevier.com/retrieve/pii/S138358660400139X>.
[47] Yazdchi K, Srivastava S, Luding S. On the validity of the Carman–Kozenyequation in random fibrous media. In: II International conference on particle-based methods, Barcelona; 2011. <http://doc.utwente.nl/80382/>.
M. Järveläinen et al. / Composites: Part A 79 (2015) 138–145 145

Publication VII
COMPRESSION CURVE ANALYSIS AND COMPRESSIVE
STRENGTH MEASUREMENT OF BRITTLE GRANULE BEDS IN
LIEU OF INDIVIDUAL GRANULE MEASUREMENTS
by
Järveläinen Matti, Kaleva Aaretti, Kaitajärvi Annikka, Laakso Jarmo, Kanerva Ulla &
Levänen Erkki
Particuology (available online) (2016).
http://doi.org/10.1016/j.partic.2015.10.006
Reprinted from Particuology with permission of Elsevier B.V. Copyright © 2016 Else-vier B.V.

Please cite this article in press as: Järveläinen, M., et al. Compression curve analysis and compressive strength measurement of brittlegranule beds in lieu of individual granule measurements. Particuology (2016), http://dx.doi.org/10.1016/j.partic.2015.10.006
ARTICLE IN PRESSG ModelPARTIC-876; No. of Pages 9
Particuology xxx (2016) xxx–xxx
Contents lists available at ScienceDirect
Particuology
j our na l ho me page: www.elsev ier .com/ locate /par t ic
Compression curve analysis and compressive strength measurementof brittle granule beds in lieu of individual granule measurements
Matti Järveläinena,∗, Aaretti Kalevaa, Annikka Kaitajärvib, Jarmo Laaksoa, Ulla Kanervab,Erkki Levänena
a Department of Materials Science, Tampere University of Technology, PO Box 589, FIN-33101 Tampere, Finlandb VTT Technical Research Centre of Finland, Sinitaival 6, PO Box 1300, FI33101 Tampere, Finland
a r t i c l e i n f o
Article history:Received 1 June 2015Received in revised form 28 August 2015Accepted 3 October 2015Available online xxx
Keywords:GranuleMechanical characterizationPressingCompressive strengthSinteringCompression curves
a b s t r a c t
Powders in granulated form are used in various processes to facilitate convenient usage. The durability ofthe formed granules is a crucial parameter, typically evaluated by the compressive strength of the gran-ules. However, especially for granules with a diameter in the order of tens of microns, statistically relevanttesting of individual granules is not a feasible alternative, and in such cases uniaxial bed compression isrequired.
There has not been consensus on whether uniaxial compression of a granule bed can be used to studythe fracture of micron size or brittle granules. In our case study of a bed of sintered kaolinite granuleswith diameters under 100 m, we show how the compressive strength of individual granules can beobtained from the compressive measurement of the entire bed by plotting the relative density versus thelogarithmic pressure scale.
We compressed the kaolinite powder with different loads; microscopy confirmed that below the ana-lyzed strength the granules are intact, though the granules start to fracture in the curved region on thecompression curve. We found that angle-fitting can be used to locate the average compressive strengthon the compression curve and to follow the evolution of strength with sintering temperature. The experi-ments in unison demonstrate that compression curve analysis is applicable for strength analysis of brittlegranules.
© 2016 Chinese Society of Particuology and Institute of Process Engineering, Chinese Academy ofSciences. Published by Elsevier B.V. All rights reserved.
Introduction
Materials in granular form are used in process industries,among others, in the production of mineral, concrete, metallur-gical (Huang, Yi, & Jiang, 2012), pharmaceutical (Yohannes et al.,2015), and food products (Kwan, Wong, & Fung, 2015). Granulesare also used as adsorbents, catalysts (Couroyer, Ning, & Ghadiri,2000; Subero-Couroyer, Ghadiri, Brunard, & Kolenda, 2003), andin ceramic production, pesticides, fertilizers (Leszczuk, 2014),nuclear fuels, and sludges (Antonyuk, Tomas, Heinrich, & Mörl,2005; Carneim & Messing, 2001). Granulation is needed to improvethe flow properties of a powder and at the same time to prepack thepowder to increase its processability (Richerson, Richerson, & Lee,2005). Lower flowability in non-granulated powders as comparedto granules is due to spontaneous agglomeration and relatively
∗ Corresponding author. Tel.: +358 408490194.E-mail address: [email protected] (M. Järveläinen).
higher interaction forces between each particle (Briscoe & Özkan,1997). Granulation also makes it possible to limit a powder’sdusting (Leszczuk, 2014), and control properties such as: shape,chemical composition, size distribution, porosity, internal surfacearea (Antonyuk et al., 2010), and rate of dissolution (Rahmanian,Ghadiri, Jia, & Stepanek, 2009). Granulation also allows the pro-cessor to mix a binder with the granules before compaction, in theearliest processing steps (Müller, Russell, & Tomas, 2015; Terpstra,Pex, & De Vries, 1995). The binders provide lubrication andgreen-state strength prior to densification (Briscoe & Özkan, 1997).
The mechanical durability of a granule determines how well itcan endure stresses that are induced during manufacture, e.g., col-lisions to spray dryer walls, transport, and during use (Antonyuket al., 2005). However, the granulate is not always the final desiredform; for instance in ceramic production a controlled breakagevia pressing of the granules is needed for homogeneous products(Terpstra et al., 1995). Should the granules not break in an orderlyform during compaction, the end-product will contain voids andlocal density changes (Honda & Nonaka, 1998). The granule
http://dx.doi.org/10.1016/j.partic.2015.10.0061674-2001/© 2016 Chinese Society of Particuology and Institute of Process Engineering, Chinese Academy of Sciences. Published by Elsevier B.V. All rights reserved.

Please cite this article in press as: Järveläinen, M., et al. Compression curve analysis and compressive strength measurement of brittlegranule beds in lieu of individual granule measurements. Particuology (2016), http://dx.doi.org/10.1016/j.partic.2015.10.006
ARTICLE IN PRESSG ModelPARTIC-876; No. of Pages 9
2 M. Järveläinen et al. / Particuology xxx (2016) xxx–xxx
Fig. 1. Compression of (a) a single granule, and (b) a bed of granules. Red arrowsshow the force distribution of a granule. (For interpretation of the references to colorin this figure legend, the reader is referred to the web version of this article.)
durability is usually tuned with additives, such as binders andlubricants, and careful control of the processing parameters. Thedurability of powder agglomerates (granulates) can also be impor-tant for processes such as injection molding, where powders in theiras-synthesized form may aggregate and cause discontinuities in thefinal product. In such cases, the durability of the agglomerates mustbe known and accommodated, to ensure that the preprocessing willdeagglomerate the powder (Song & Evans, 1994).
Mechanical durability of granules can be analyzed with func-tional measurements such as impact testing (Antonyuk et al., 2010),Pfosta-apparatus (Leszczuk, 2014), or drop weight testing (Salman& Tomas, 2014). For general analysis, the compressive strength ofgranules can be modeled (Antonyuk et al., 2010; Müller & Tomas,2014; Schilde, Burmeister, & Kwade, 2014), and is often mea-sured by compressing a single granule (Cheong, Adams, Hounslow,& Salman, 2009; Müller et al., 2015; Rahmanian et al., 2009;Rahmanian & Ghadiri, 2013), such as in Fig. 1(a). However, measur-ing a statistically representative amount of single granules may beprohibitive due to large variations in their size, strength, and shape.Very small granules, below 0.5 mm, are particularly difficult to mea-sure even with special tools (Pitchumani, Zhupanska, Meesters, &Scarlett, 2004) or nanoindenters (Raichman, Kazakevich, Rabkin,& Tsur, 2006; Schilde et al., 2014), so these materials are moreconveniently measured in packed beds, as shown in Fig. 1(b).
Measurement of a bed instead of individual granules also givesa better understanding of the uniformity of industrially producedgranules. The bed strength represents the overall strength of anaverage granule, although the result is affected by the often-unevenforce distribution in the bed, which in turn results from the granulestrength, size distribution, and the uniaxial nature of the com-pression. Still, the same principles apply in bed and single granulecompression: size, porosity, and roughness of the granules affectsthe strength (Antonyuk et al., 2005) together with the granuleshape (Pitchumani et al., 2004) and internal imperfections (Subero-Couroyer et al., 2003). In bed compression, the result is also affectedby the granule size distribution and granule friction (Kwan et al.,2015; McDowell & de Bono, 2013). Granule strength can be affectedby cyclic loading (Salman & Tomas, 2014) in a fatigue mecha-nism where a repeated force below the granule’s strength inducesmicrocracks (lowering its strength (Pitchumani et al., 2004)), orcauses hardening (increasing its strength (Antonyuk et al., 2010));the atmosphere also affects granule strength (Cheong et al., 2009;Müller et al., 2015).
Both measuring methods (bed and single compression) forgranule strength are justified. In single-granule compression, astatistically reliable number of granules is needed to measure
Fig. 2. Schematic illustration of a compression curve showing the four stages.
the average granule strength (Subero-Couroyer et al., 2003); evenwith easily measured large granules, it is laborious to achieveconsistent compressive strength values, although some applicableapproaches are now available (Pitchumani et al., 2004; Subero-Couroyer, Ghadiri, Brunard, & Kolenda, 2005). In bed compression,a large number of granules is measured simultaneously, providingthe appropriate statistical characteristics on the first experiment;however, predicting the average properties of a single granule fromthese results is not straightforward due in part to the non-uniformstrain that results from uneven load distribution of a randomlypacked granule bed and a uniaxial compression tool.
In bed compression, the type of granule also has an effect onthe yielding behavior of the bed. Some authors (e.g., Antonyuket al., 2005, 2010; Aryanpour & Farzaneh, 2015; Briscoe & Özkan,1997; Meyer & Faber, 1997; Subero-Couroyer et al., 2005) havestudied large (over 1 mm) granules or granules that behave elas-tically or plastically, such as metals (Thyagarajan, Cantin, Kashyap,& Bettles, 2015), where the shear stresses have an importantrole in bed compression. Even otherwise brittle ceramic powdersoften include a binder (Carneim & Messing, 2001) in the granulesthat causes plastic deformation. Given the above, there is a lackof published information on brittle granules, which would breakinstantaneously without a significant plastic deformation. Here weshow, through a case analysis, that bed compression curve-analysisis applicable for brittle granules with a diameter below 100 m, andwe present a systematic approach to interpreting the compressiontesting results.
Theoretical background
Compression stages
The behavior of granules during compression of a bed, includingdeformation and breakage, exhibits four stages (Briscoe & Özkan,1997; Mort, Sabia, Niesz, & Riman, 1994) that are shown in Fig. 2.The stages appear in steady-state compression due to the increasein pressure that can be identified using a semi-logarithmic plot;presenting the compression behavior either by the relative den-sity or the void fraction versus the logarithmic pressure, the effectof the pressure increase can be distinguished. The density changeis very small until the onset of breakage in stage three, when itbecomes logarithmic, enabling a linear fitting on a half-logarithmicscale (Song & Evans, 1994).
During stage 1, the granules deform elastically, pack, and rear-range. The packing density is governed by the shape and sizedistribution of the granules and influenced by different effects(Kwan et al., 2015), which are beyond the scope of this article. Whenthe rearrangement takes place, the relative density increases as thegranules achieve more dense packing.
During stage 2, the compressive strength of the granules isexceeded and they fracture. Some researchers (see especially

Please cite this article in press as: Järveläinen, M., et al. Compression curve analysis and compressive strength measurement of brittlegranule beds in lieu of individual granule measurements. Particuology (2016), http://dx.doi.org/10.1016/j.partic.2015.10.006
ARTICLE IN PRESSG ModelPARTIC-876; No. of Pages 9
M. Järveläinen et al. / Particuology xxx (2016) xxx–xxx 3
Carneim & Messing, 2001) divide stage 2 into initial and massivegranule yield regimes; in the initial yield regime, compaction rateslows after the rearrangement ends. The compaction rate, i.e., pres-sure change in relation to density change, is calculated (see Mortet al., 1994) by deriving the compression curve where the aver-age crushing strength would be the derivative maximum. Anothermethod (Briscoe & Özkan, 1997), used in this paper, is to find themost-curved region of the half-logarithmic compression curve byangular fitting (presented in the Interpretation of the compressioncurve section).
The compressive strength of a granule is controlled by the sizeand orientation of intragranular discontinuities such as primaryparticle boundaries, binder-particle interfaces, pores, and cracks,which function as stress condensers. According to Pitchumani et al.(2004) the two most important breaking mechanisms are frac-ture (caused by normal forces), and attrition (caused by tangentialforces); a model by McDowell and de Bono (2013) predicts that thevarious fracture mechanisms do not significantly affect measuredaverage compressive strength.
The steepness and length of the second stage curve is related tothe Weibull modulus, size distribution (Song & Evans, 1994), order,and homogeneity of the granules. In principle, granules of smallersize surrounding a larger one can divide the stress more evenlyand the average number of granule contacts between large andsmall granules is reduced during compression, while the numberof contacts with granules of the same size or larger stays con-stant. Continuing with the reasoning by McDowell and de Bono(2013) and McDowell (2002), the small granules are exposed tothe highest stresses due to fewer contact points, however, the gran-ules also become stronger according to the Griffith’s weakest-linktheory known in brittle materials (Pitchumani et al., 2004; Subero-Couroyer et al., 2003), which states that strength is defined by thepre-existing flaws in a brittle material. High Weibull modulus, smallsize distribution, and high packing density lead to a steep and shortstage 2; the granules all break at the same load (Song & Evans, 1994).
Because of the above relationships, the changes in a bed com-pression curve are smooth when compared with the compressioncurve of a single granule, as granule breakage in a bed only causesthe force to be divided more evenly to nearby granules. The punchgeometry (Laity, 2014) and the granule friction against other gran-ules and the die walls (Berg, Jonsén, & Häggblad, 2010) will alsoaffect the measured compressive strength. During compression,stress is highest close to corners of the die and close to the com-pressing punch. According to Güner, Cora, and Sofuoglu (2015),the friction between the die wall and the granules is a moredominant feature than granule–granule friction, which can leadto unequal force distribution creating local regions of high-stressareas (Aryanpour & Farzaneh, 2015). The aspect ratio of the com-pacts (Briscoe & Özkan, 1997) also affects the force distribution.
During stage 3, the fractured granules rearrange under similarlaws as in stage 1, with the distinction that the electrostatic andvan der Waals forces are more significant because of the decreasedparticle size.
During stage 4, the bed has no or few voids left, and the primaryparticles have been compressed close to the theoretical limit ofpacking density (Briscoe & Özkan, 1997). When the load is removed,the relief of pressure causes the release of elastic transformation,leading to a small decrease in compact density (Carneim & Messing,2001).
Force distribution in a bed of granules
In single granule compression, force is transmitted to thegranule in a uniform manner, whereas in a bed compression theload division is governed by how the force field is distributedacross the granules. In general, the granule is in the most stressed
Fig. 3. The granule size distribution measured with laser diffractometer. Before themeasurement, the granules were heat-treated at 930 C for 1 h.
condition when the force is carried to it from neighboring granulesof the same size, as that allows the loading on the opposite polesof the granule (McDowell & de Bono, 2013). Song and Evans (1994)found the strength of a packed bed of particles to be approximately50% greater than the strength of a single particle, but expressingthis relation is quite complex as multiple factors affect the forcedistribution. Thus, our experiments focused on development of asystematic approach to analyzing granules using bed compression,and on showing the method’s applicability in finding the averagevalue for granule breakage.
Materials and methods
Granules used for testing the method
The focus of this study was to determine how well the averagecompressive strength of brittle granules could be determined fromthe uniaxial pressing of a granule bed. For our case study, we chosea common industrially spray-dried material, granulated kaolinitepowder.
The granules were received in a green state and they wereheat-treated with different parameters to achieve comparative testmaterials; all testing was done on heat-treated samples, with theexception of several control samples in the sintering experiments,detailed in the Sintering experiment section. The heat treatmenttemperatures chosen based on sintering behavior of the powder isdiscussed further in the Sintering experiment section. The kaolinitegranules were heated at 100 C/h in a furnace (Entech ECF 20/18,Sweden) and held for 1 h at 560, 780, 830, 880, 930, and 980 C inair atmosphere.
The size distribution of a sample powder was nearly the sameafter heat treatments as before, as shown in Fig. 3.
Characterization
The size distribution of the granules (PSD, particle-size distri-bution) before and after compression was determined by laserdiffractometer (LD, Lecotrac LT100, Germany, or Malvern Mastersizer 3000, UK) with an accuracy of ±0.6%. Tap water was usedas the dispersing medium and ultrasound was used for 60 s fordispersing. The concentration of the suspensions was kept within1–10%. Dispersing time with ultrasound was determined by mea-suring the optical concentration during the treatment; at 60 soptical concentration was no longer changing. The reference gran-ule sizes measured from scanning electron microscope (SEM, JeolJSM 6360LV, Japan) images agreed with the PSD measurements viaLD, verifying the results. Powders from compressed granular bedswere obtained by first crushing the bedwith a spatula.
The morphological features of the kaolinite granules were char-acterized by SEM and a field emission scanning electron microscope
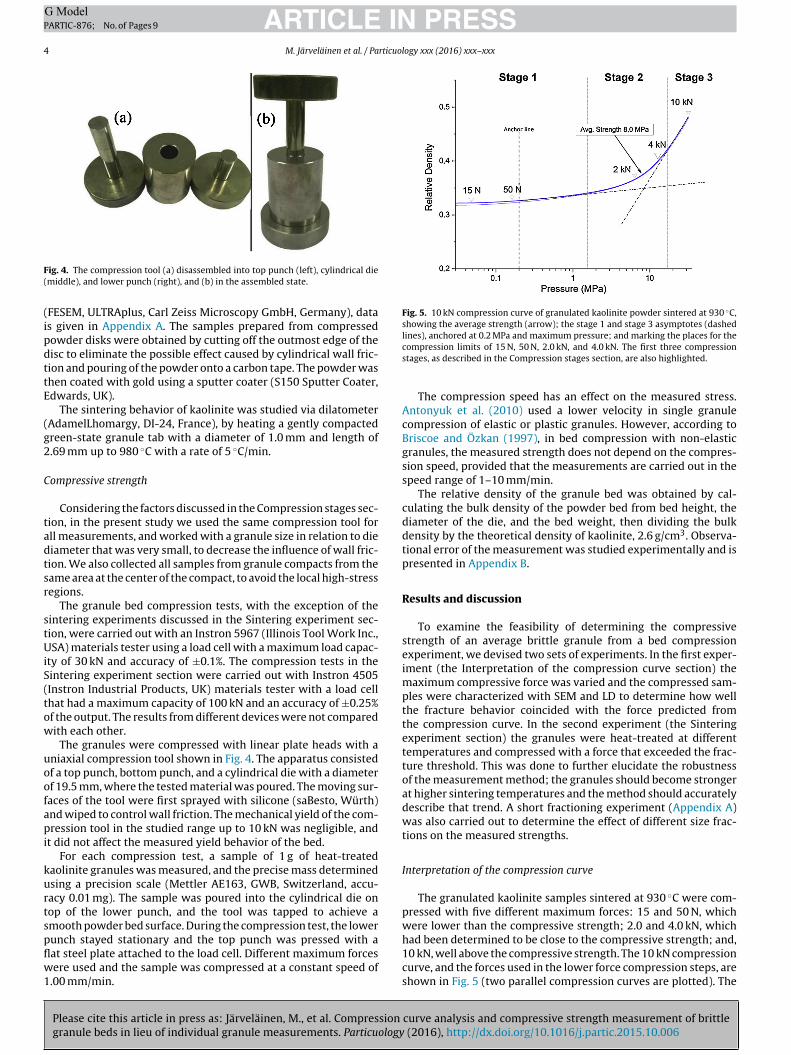
Please cite this article in press as: Järveläinen, M., et al. Compression curve analysis and compressive strength measurement of brittlegranule beds in lieu of individual granule measurements. Particuology (2016), http://dx.doi.org/10.1016/j.partic.2015.10.006
ARTICLE IN PRESSG ModelPARTIC-876; No. of Pages 9
4 M. Järveläinen et al. / Particuology xxx (2016) xxx–xxx
Fig. 4. The compression tool (a) disassembled into top punch (left), cylindrical die(middle), and lower punch (right), and (b) in the assembled state.
(FESEM, ULTRAplus, Carl Zeiss Microscopy GmbH, Germany), datais given in Appendix A. The samples prepared from compressedpowder disks were obtained by cutting off the outmost edge of thedisc to eliminate the possible effect caused by cylindrical wall fric-tion and pouring of the powder onto a carbon tape. The powder wasthen coated with gold using a sputter coater (S150 Sputter Coater,Edwards, UK).
The sintering behavior of kaolinite was studied via dilatometer(AdamelLhomargy, DI-24, France), by heating a gently compactedgreen-state granule tab with a diameter of 1.0 mm and length of2.69 mm up to 980 C with a rate of 5 C/min.
Compressive strength
Considering the factors discussed in the Compression stages sec-tion, in the present study we used the same compression tool forall measurements, and worked with a granule size in relation to diediameter that was very small, to decrease the influence of wall fric-tion. We also collected all samples from granule compacts from thesame area at the center of the compact, to avoid the local high-stressregions.
The granule bed compression tests, with the exception of thesintering experiments discussed in the Sintering experiment sec-tion, were carried out with an Instron 5967 (Illinois Tool Work Inc.,USA) materials tester using a load cell with a maximum load capac-ity of 30 kN and accuracy of ±0.1%. The compression tests in theSintering experiment section were carried out with Instron 4505(Instron Industrial Products, UK) materials tester with a load cellthat had a maximum capacity of 100 kN and an accuracy of ±0.25%of the output. The results from different devices were not comparedwith each other.
The granules were compressed with linear plate heads with auniaxial compression tool shown in Fig. 4. The apparatus consistedof a top punch, bottom punch, and a cylindrical die with a diameterof 19.5 mm, where the tested material was poured. The moving sur-faces of the tool were first sprayed with silicone (saBesto, Würth)and wiped to control wall friction. The mechanical yield of the com-pression tool in the studied range up to 10 kN was negligible, andit did not affect the measured yield behavior of the bed.
For each compression test, a sample of 1 g of heat-treatedkaolinite granules was measured, and the precise mass determinedusing a precision scale (Mettler AE163, GWB, Switzerland, accu-racy 0.01 mg). The sample was poured into the cylindrical die ontop of the lower punch, and the tool was tapped to achieve asmooth powder bed surface. During the compression test, the lowerpunch stayed stationary and the top punch was pressed with aflat steel plate attached to the load cell. Different maximum forceswere used and the sample was compressed at a constant speed of1.00 mm/min.
Fig. 5. 10 kN compression curve of granulated kaolinite powder sintered at 930 C,showing the average strength (arrow); the stage 1 and stage 3 asymptotes (dashedlines), anchored at 0.2 MPa and maximum pressure; and marking the places for thecompression limits of 15 N, 50 N, 2.0 kN, and 4.0 kN. The first three compressionstages, as described in the Compression stages section, are also highlighted.
The compression speed has an effect on the measured stress.Antonyuk et al. (2010) used a lower velocity in single granulecompression of elastic or plastic granules. However, according toBriscoe and Özkan (1997), in bed compression with non-elasticgranules, the measured strength does not depend on the compres-sion speed, provided that the measurements are carried out in thespeed range of 1–10 mm/min.
The relative density of the granule bed was obtained by cal-culating the bulk density of the powder bed from bed height, thediameter of the die, and the bed weight, then dividing the bulkdensity by the theoretical density of kaolinite, 2.6 g/cm3. Observa-tional error of the measurement was studied experimentally and ispresented in Appendix B.
Results and discussion
To examine the feasibility of determining the compressivestrength of an average brittle granule from a bed compressionexperiment, we devised two sets of experiments. In the first exper-iment (the Interpretation of the compression curve section) themaximum compressive force was varied and the compressed sam-ples were characterized with SEM and LD to determine how wellthe fracture behavior coincided with the force predicted fromthe compression curve. In the second experiment (the Sinteringexperiment section) the granules were heat-treated at differenttemperatures and compressed with a force that exceeded the frac-ture threshold. This was done to further elucidate the robustnessof the measurement method; the granules should become strongerat higher sintering temperatures and the method should accuratelydescribe that trend. A short fractioning experiment (Appendix A)was also carried out to determine the effect of different size frac-tions on the measured strengths.
Interpretation of the compression curve
The granulated kaolinite samples sintered at 930 C were com-pressed with five different maximum forces: 15 and 50 N, whichwere lower than the compressive strength; 2.0 and 4.0 kN, whichhad been determined to be close to the compressive strength; and,10 kN, well above the compressive strength. The 10 kN compressioncurve, and the forces used in the lower force compression steps, areshown in Fig. 5 (two parallel compression curves are plotted). The

Please cite this article in press as: Järveläinen, M., et al. Compression curve analysis and compressive strength measurement of brittlegranule beds in lieu of individual granule measurements. Particuology (2016), http://dx.doi.org/10.1016/j.partic.2015.10.006
ARTICLE IN PRESSG ModelPARTIC-876; No. of Pages 9
M. Järveläinen et al. / Particuology xxx (2016) xxx–xxx 5
Fig. 6. SEM-images at two different magnitudes of kaolinite granules heat-treatedat 930 C after the compressive strength test with five different forces.
purpose of this test was to show that the compression curve can beused to inspect the fracture strength of a brittle granule bed.
The compressive strength was measured from the relative den-sity vs. log pressure curve in Fig. 5 by locating the spot wherethe curve has the steepest curvature. With a constant compres-sion speed, this spot marks the place where the relative densityincreases the most rapidly while pressure increase is the slightest.This is the pivoting point where the granule bed is yielding, whichin fragile materials can be directly interpreted as the point of frac-ture, i.e., compressive strength. The spot was located from the curveby extrapolating the linear regressions from compression stages 1and 3 and finding their intercept. To reduce experimental noise,the first linear regression line was anchored to the relative densityat 0.2 MPa. The second was anchored to the relative density at themaximum pressure. The intercept of the two regression lines wastaken as the average compressive strength of the granule bed, asindicated in Fig. 5.
After the compression tests, each powder compact was imagedwith SEM (Fig. 6) and characterized with LD. The initial granule sizeof the powder, presented in Fig. 3, is essentially the same as theparticle size in a powder compressed with 15 N force, presentedtogether with the other particle size fractions in Fig. 7.
The SEM images, Fig. 6, together with the LD results, Fig. 7,show that, below the measured compressive strength of 8.0 MPa,at the 15 and 50 N points, the granules are intact and their sizefractions are similar, whereas granule shreds start to appear at2.0 kN and the number of particles in the small size range starts to
Fig. 7. The differential size distributions of granulated powder heat-treated at930 C after the compressive strength test with five different forces.
increase. At 4.0 kN, which is above the average crushing strengthmeasured from the curve, LD data show that the small size fractionsincrease and simultaneously the number of average-size fractionsdiminishes, showing that the granules have broken. The fracturemarks evident in the SEM images suggest fracturing by normalforces or attrition, which supports the theory by Pitchumani el al.(Pitchumani et al., 2004) that was presented earlier.
The granules fracture at a certain force range during stage 2.According to theory presented earlier (McDowell & de Bono, 2013;McDowell, 2002) this is caused by the size differences of the gran-ules: larger granules can withstand higher loads because they areshielded by the smaller ones. This is evident by the relatively lowerdecrease in the amount of granules in the size range above 60 m.Also, the relatively higher fracture probability of larger granuleshas an effect on the length of the second stage, but in this case itappears to be recessive. The four stages of the compression curve
Fig. 8. The relative density versus the logarithmic experimentally applied pressurefor kaolinite granule beds heat-treated at different sintering temperatures, and theas-received granule bed for reference (“Green”, shown as a solid black line). Thecurves represent the average of three individual measurements, and the arrowsshow the fracture point obtained by the method explained in the Interpretation ofthe compression curve section.

Please cite this article in press as: Järveläinen, M., et al. Compression curve analysis and compressive strength measurement of brittlegranule beds in lieu of individual granule measurements. Particuology (2016), http://dx.doi.org/10.1016/j.partic.2015.10.006
ARTICLE IN PRESSG ModelPARTIC-876; No. of Pages 9
6 M. Järveläinen et al. / Particuology xxx (2016) xxx–xxx
Fig. 9. The compressive strengths measured from kaolinite granules sintered atdifferent temperatures (striped wide bars, observational error as calculated inAppendix B), and the relative densities after compressing with 31 MPa pressure(empty narrow bars).
(Fig. 2) are more distinct in brittle compression than in plastic com-pression; in plastic granule beds, rearrangement and yielding takeplace simultaneously, which is not the case with compression ofbrittle granules.
Obviously the granules fracture within a certain range of com-pression, but the following sintering experiment shows that theaverage point of fracture can be used to follow the changes in com-pressive strength.
Sintering experiment
Green-state kaolinite was heat-treated at five different temper-atures: 560, 780, 830, 930, and 980 C. The heat-treated kaolinitewas then compressed with 10 kN force, well above its compressivestrength. The compression curves are presented in Fig. 8, and theaverage point of fracture for each powder bed is also noted on thecurves, obtained by the method described in the Interpretation ofthe compression curve section. For each of the presented curves,3–5 compression experiments were completed, and the presentedcurves are averages calculated from the point averages of the indi-vidual compressions. Finally, the curves were smoothed using a10 pts moving average.
Fig. 8 shows that, although the absolute position and the shape ofthe curve may change between experiments, the average strength,indicated by the arrows, increases consistently with sinteringtemperature. This temperature-related increase in compressivestrength, along with the change in the relative density with tem-perature of sintering, is summarized in Fig. 9, and the observedstrength increase with increasing sintering temperature shows thevalidity of our method for granule bed strength measurement. Thesintering behavior is briefly analyzed below.
Fig. 10. Dilatometer curve of granulated kaolinite powder under heating, showingthe relative sintering shrinkages at the temperatures at which the compressive testswere carried out.
Although not the focus of this article, a short investigation ofthe nonlinear evolution of sintering strength vs. temperature ofkaolinite granules was carried out to show the feasibility of themeasurement method. Fig. 10 shows that the sintering shrinkagein the isothermal experiment was nonlinear, which explains thenonlinear strength increase—these two properties are known to belinked (Hu & Wang, 2010). The figure shows two shrinkage steps,one at 400–500 C, and another above 800 C; in Flank (1979) theseshrinkage steps are interpreted as a dehydroxylation step and phasechange, respectively. In Appendix C, the sintering shrinkage and bedstrength are correlated.
Conclusions
The difference between plastic granules (such as metals, poly-mers, and green state ceramics) and brittle ones (such as sinteredceramic powders) is the large deformation of plastic granules dur-ing uniaxial compression. The deforming behavior has an effecton the compression curve, but this study shows that the brittlegranules can still be estimated using a similar approach to thatof the plastic granules. Brittle granule compression has distinc-tive stages for each compression phenomenon (stage 1 particlerearrangement, stage 2 particle fracture, stage 3 fractured parti-cle rearrangement, and stage 4 maximum compression), althoughthe fracturing can take place in a wide pressure range.
We have shown via a case study of kaolinite powder that thecompressive mechanical measurement of a bed of brittle, smallgranules (below 100 m) can be used to determine the strengthof an average granule. The study involved two experiments:
• In the first experiment, a granule bed was compressed at con-stant speed with different maximum forces, and the fractureof granules was analyzed after the compression with scanningelectron microscope and LD particle size measurements. Theexperiment showed that by plotting the relative density versusthe logarithmic pressure, the fracture regime of the granules canbe determined and an average compressive strength can be esti-mated by extrapolating the constant density increase rates bothbefore and after the fracture regime.
• In the second experiment, the average strength of a consolidatedkaolinite bed was analyzed using our proposed method, i.e., byplotting the relative density versus the logarithmic pressure. Thisexperiment showed that although the absolute placement of thecurves may vary, and the granules fracture at a range of loads,the average strength, i.e., the flexural spot on the curve locatedwith an angle fitting, can be used to follow the changes in granulestrength.
These experiments validate earlier results on compressive bedstrength by our group (Kanerva, Suhonen, Lagerbom, & Levänen,2015). In addition to the main experiments, the effect of size frac-tions on compressive strength (Appendix A), observational error ofthe method (Appendix B), and correlation of sintering shrinkage tothe bed strength (Appendix C) were analyzed.
Acknowledgements
Help received from Dr. Arto Ojuva in formulating this article isgreatly appreciated.
Appendix A. Fractioning experiment
Green-state kaolinite powder was heat-treated at 930 C andsieved into two fractions using sieves (Retsch, Germany) with open-ing sizes of 25 and 45 m and a sieving machine (Fritsch, Germany).

Please cite this article in press as: Järveläinen, M., et al. Compression curve analysis and compressive strength measurement of brittlegranule beds in lieu of individual granule measurements. Particuology (2016), http://dx.doi.org/10.1016/j.partic.2015.10.006
ARTICLE IN PRESSG ModelPARTIC-876; No. of Pages 9
M. Järveläinen et al. / Particuology xxx (2016) xxx–xxx 7
Fig. A1. SEM images of cross-sectional cuts of kaolinite granules heat-treated at 930 C, at two different magnifications.
Table A1Image analysis results from Fig. A2 showing the standard deviation (SD).
Section Circularity (Fig. A2(a)) Aspect ratio (Fig. A2(a)) Gray value (Fig. A2(b))
25–45 m 0.710 (SD 0.189) 1.444 (SD 0.468) 154.8 (SD 28.3)45 m 0.391 (SD 0.210) 1.907 (SD 0.664) 154.3 (SD 28.5)
Sieving time of 20 min was used to obtain a middle fraction that wasbetween 25 and 45 m, and a large fraction that was above 45 m.These fractions were compressed and their average strengths wereanalyzed in the same manner as in the Interpretation of the com-pression curve section. Strength of the middle fraction was 8.9 MPaand strength of the large fraction was 8.1 MPa. This difference islarger than the observational error.
The variation in granule bed load carrying capability is notsolely dependent on the granule size but may be caused by theirshape and density in the different granule fractions (Rahmanianet al., 2009). The shape affects the flowability and force distribu-tion, and density affects their individual capability in carrying load(Berg et al., 2010; Huang et al., 2012). To compare the shapes anddensities of the two size ranges, cross-sectional samples of thegranules were prepared and imaged with field emission scanningelectron microscopy (FESEM, ULTRAplus, Carl Zeiss MicroscopyGmbH, Germany) in secondary electron mode. The samples wereanalyzed as polished cross sections of granules after they were coldmounted in epoxy (Struers Epofix) in 30-mm-diameter mountingcups. Cold mounting was done in a vacuum impregnator (StruersEpovac) to decrease air bubbles. To dismiss the charging effect, thesample was coated with carbon (Agar turbo carbon coater, model2090).
The SEM images were analyzed to find out if the two size rangesvary in granule shape or apparent density (ImageJ version 1.48 v),using Fig. A1(a) as a baseline. To analyze the shape, the baselineimage was converted to binary form with automatic thresholdingand the granules were partitioned from the images as is seen inFig. A2(a). Granules that had a cross-sectional area the same asa circle having a diameter between 25 and 45 m were markedwith rastered red, and correspondingly those with an area largerthan a 45-m diameter circle were marked with black. Then, theaverage circularities (4 × [Area]/[Perimeter]2, unity resembles aperfect circle)and aspect ratios (unity is a perfect circle) of the twosections were analyzed omitting the granules extending past theimage borders. The results are presented in Table A1 and they,together with the SEM image, clearly show that the higher frac-tion was less round. The intragranular density was estimated fromthe SEM image in Fig. A1(b), by similarly sectioning the small andlarge fractions, which are circled in Fig. A2(b) with dashed red andblack, respectively. The average gray values (the sum of the grayvalues of all the pixels in the selection divided by the number ofpixels) were then calculated and are presented in Table A1. Consid-ering the amount of standard deviations, the average gray valuesof the two sections were effectively equal, indicating there was nodifference in the densities of the two fractions.
Based on these two analyses, it was concluded that the largerfraction being weaker (having lower compressive strength) wasdominantly caused by the fraction’s more uneven shape, which ledto a more heterogeneous force field distribution during the com-pression. Some of the strength variation was possibly also caused bylower relative density at the beginning of compression. This lowerrelative density is caused by the larger volume of voids that the frac-tured bits of granules can later fill (de Bono & McDowell, 2015), andcan be induced for instance by uneven granule shape or removal offiner granule fractions that decreased the relative density at the
Fig. A2. . Images that were used to analyze the shape (a) and density (b) differenceof two size ranges of kaolinite granules.

Please cite this article in press as: Järveläinen, M., et al. Compression curve analysis and compressive strength measurement of brittlegranule beds in lieu of individual granule measurements. Particuology (2016), http://dx.doi.org/10.1016/j.partic.2015.10.006
ARTICLE IN PRESSG ModelPARTIC-876; No. of Pages 9
8 M. Järveläinen et al. / Particuology xxx (2016) xxx–xxx
Fig. A3. Five compression curves of kaolinite samples heat-treated at 780 C, com-pared to discern observational error.
beginning of compression (Yohannes et al., 2015). In our test thefinal relative densities are effectively the same.
Appendix B. Observational error in compressive bedstrength measurement
The observational error was found to be close to ±0.5 MPaby testing the same granulated kaolinite powder that was heat-treated at 780 C, five times and dissembling and assembling theexperimental setup between each compression. Average compres-sive strength was found to be 3.3 MPa while the maximum andminimum were 3.7 and 2.8 MPa, respectively. The five compari-son curves are presented in Fig. A3. The acquired error margin isused in each test. Compressive strength was located by the methodexplained in the Interpretation of the compression curve section.
Appendix C. Correlation of sintering shrinkage and averagebed strength
The evolution of bed strength in relation to sintering shrink-age is seen in Fig. A4, where the result obtained from 980 C isomitted because of the phase change seen in the sintering curve.Similarly to describing the relation between porosity and strength(Subero-Couroyer et al., 2003), this relationship can be describedwith a simple allometric exponential fitting that has a form of = axb where a and b are experimental variables, is the aver-age bed strength and x is the sintering shrinkage. When a is set to3.7119 and b to 0.26989, the chi-square is 0.0295 and correlation
Fig. A4. Sintering shrinkage versus average bed strength with exponential fitting.
coefficient (R2) 0.99213. The exceptionally good fitting, althoughwith a limited number of experiments, gives a clear indication thatthe variables are exponentially linked. The magnitude of experi-mental variables a and b are possibly related to sintering kineticsand could be linked with specific surface area and chemical com-position.
References
Antonyuk, S., Heinrich, S., Tomas, J., Deen, N. G., Van Buijtenen, M. S., & Kuipers, J. A. M.(2010). Energy absorption during compression and impact of dry elastic-plasticspherical granules. Granular Matter, 12(1), 15–47.
Antonyuk, S., Tomas, J., Heinrich, S., & Mörl, L. (2005). Breakage behaviour of spher-ical granulates by compression. Chemical Engineering Science, 60, 4031–4044.
Aryanpour, G., & Farzaneh, M. (2015). Application of a piston equation to describedie compaction of powders. Powder Technology, 277, 120–125.
Berg, S., Jonsén, P., & Häggblad, H. Å. (2010). Experimental characterisation ofCaCO3 powder mix for high-pressure compaction modelling. Powder Technology,203(2), 198–205.
Briscoe, B. J., & Özkan, N. (1997). Compaction behaviour of agglomerated aluminapowders. Powder Technology, 90, 195–203.
Couroyer, C., Ning, Z., & Ghadiri, M. (2000). Distinct element analysis of bulk crus-hing: Effect of particle propertiesand loading rate. Powder Technology, 109,241–254.
Carneim, R. D., & Messing, G. L. (2001). Response of granular powders to uniaxialloading and unloading. Powder Technology, 115, 131–138.
Cheong, Y. S., Adams, M. J., Hounslow, M. J., & Salman, A. D. (2009). Microscopicinterpretation of granule strength in liquid media. Powder Technology, 189(2),365–375.
de Bono, J. P., & McDowell, G. R. (2015). An insight into the yielding and normalcompression of sand with irregularly-shaped particles using DEM. Powder Tech-nology, 271, 270–277.
Flank, W. H. (1979). Behavior of kaolinite pellets at elevated temperatures. Clays andClay Minerals, 27(I), 11L 18.
Güner, F., Cora, Ö. N., & Sofuoglu, H. (2015). Numerical modeling of cold pow-der compaction using multi particle and continuum media approaches. PowderTechnology, 271, 238–247.
Honda, T., & Nonaka, H. (1998). Granulated powder for producing silicon nitridesintered body. U.S. Patent No. 5,854,156.
Hu, L., & Wang, C.-A. (2010). Effect of sintering temperature on compressivestrength of porous yttria-stabilized zirconia ceramics. Ceramics International,36(5), 1697–1701.
Huang, Z., Yi, L., & Jiang, T. (2012). Mechanisms of strength decrease in the initialreduction of iron ore oxide pellets. Powder Technology, 221, 284–291.
Kanerva, U., Suhonen, T., Lagerbom, J., & Levänen, E. (2015). Evaluation of crushingstrength of spray-dried MgAl2O4 granule beds. Ceramics International, 41(7),8494–8500.
Kwan, A. K. H., Wong, V., & Fung, W. W. S. (2015). A 3-parameter packing densitymodel for angular rock aggregate particles. Powder Technology, 274, 154–162.
Laity, P. R. (2014). Effects of punches with embossed features on compactionbehaviour. Powder Technology, 254, 373–386.
Leszczuk, T. (2014). Evaluation of the fertilizer granules strength obtained fromplate granulation with different angle of granulation blade. Acta Mechanica etAutomatica, 8(3), 141–145.
McDowell, G. R. (2002). On the yielding and plastic compression of sand. Journal ofthe Japanese Geotechnical Society: Soils and Foundation, 42(1), 139–145.
McDowell, G. R., & de Bono, J. P. (2013). On the micro mechanics of one-dimensionalnormal compression. Géotechnique, 63, 895–908.
Meyer, L. W., & Faber, I. (1997). Investigations on granular ceramics and ceramicpowder. Journal de Physique, IV(07(C3)). C3–565–C3–570.
Mort, P. R., Sabia, R., Niesz, D. E., & Riman, R. E. (1994). Automatted generation andanalysis of powder compaction diagrams. Powder Technology, 79, 111–119.
Müller, P., Russell, A., & Tomas, J. (2015). Influence of binder and moisture content onthe strength of zeolite 4A granules. Chemical Engineering Science, 126, 204–215.
Müller, P., & Tomas, J. (2014). Simulation and calibration of granules using the dis-crete element method. Particuology, 12(1), 40–43.
Pitchumani, R., Zhupanska, O., Meesters, G. M. H., & Scarlett, B. (2004). Measurementand characterization of particle strength using a new robotic compression tester.Powder Technology, 143–144, 56–64.
Thyagarajan, R., Cantin, G. M. D., Kashyap, B. P., & Bettles, C. J. (2015). Modelling com-paction behaviour of nickel–phosphorus and nickel–boron electroless coatedtitanium powders. Powder Technology, 274, 53–61.
Rahmanian, N., & Ghadiri, M. (2013). Strength and structure of granules producedin continuous granulators. Powder Technology, 233, 227–233.
Rahmanian, N., Ghadiri, M., Jia, X., & Stepanek, F. (2009). Characterisation of gran-ule structure and strength made in a high shear granulator. Powder Technology,192(2), 184–194.
Raichman, Y., Kazakevich, M., Rabkin, E., & Tsur, Y. (2006). Inter-nanoparticlebonds in agglomerates studied by nanoindentation. Advanced Materials, 18(15),2028–2030.
Richerson, D., Richerson, D. W., & Lee, W. E. (2005). Modern ceramic engineering:Properties, processing, and use in design (3rd ed.). New York, NY: CRC Press.

Please cite this article in press as: Järveläinen, M., et al. Compression curve analysis and compressive strength measurement of brittlegranule beds in lieu of individual granule measurements. Particuology (2016), http://dx.doi.org/10.1016/j.partic.2015.10.006
ARTICLE IN PRESSG ModelPARTIC-876; No. of Pages 9
M. Järveläinen et al. / Particuology xxx (2016) xxx–xxx 9
Salman, Aman S., & Tomas, J. (2014). Breakage probability of stressed granules usinga degradation model. Chemical Engineering & Technology, 37(11), 1949–1958.
Schilde, C., Burmeister, C. F., & Kwade, A. (2014). Measurement and simulation ofmicromechanical properties of nanostructured aggregates via nanoindentationand DEM-simulation. Powder Technology, 259, 1–13.
Song, J.-H., & Evans, J. R. G. (1994). A die pressing test for the estimation of agglom-erate strength. Journal of the American Ceramic Society, 77(3), 806–814.
Subero-Couroyer, C., Ghadiri, M., Brunard, N., & Kolenda, F. (2003). Weibull analy-sis of quasi-static crushing strength of catalyst particles. Chemical EngineeringResearch and Design, 81, 953–962.
Subero-Couroyer, C., Ghadiri, M., Brunard, N., & Kolenda, F. (2005). Analysisof catalyst particle strength by impact testing: The effect of manufactur-ing process parameters on the particle strength. Powder Technology, 160(2),67–80.
Terpstra, R. A., Pex, P. P. A., & De Vries, A. (1995). Ceramic processing. New York, NY:Springer Science & Business Media.
Yohannes, B., Gonzalez, M., Abebe, A., Sprockel, O., Nikfar, F., Kang, S., et al. (2015).The role of fine particles on compaction and tensile strength of pharmaceuticalpowders. Powder Technology, 274, 372–378.

ISBN 978-952-15-3801-8ISSN 1459-2045
Tampereen teknillinen yliopisto PL 52733101 Tampere
Tampere University of TechnologyP.O.B. 527FI-33101 Tampere, Finland