Mathematical and Computer Modelling Visualization of synchronous propagation of plant electrical...
9
Mathematical and Computer Modelling 58 (2013) 661–669 Contents lists available at SciVerse ScienceDirect Mathematical and Computer Modelling journal homepage: www.elsevier.com/locate/mcm Visualization of synchronous propagation of plant electrical signals using an optical recording method Yang Qin a , Lan Huang a , An Liu a , Dong-jie Zhao a , Zhong-yi Wang a,b,∗ , Yi-min Liu c , Tong-lin Mao c a College of Information and Electrical Engineering, China Agricultural University, Beijing 100083, China b Key Laboratory of Modern Precision Agriculture System Integration Research, Ministry of Education, China Agricultural University, Beijing, 100083, China c State Key Laboratory of Plant Physiology and Biochemistry, Department of Plant Sciences, College of Biological Sciences, China Agricultural University, Beijing 100193, China article info Article history: Received 29 September 2011 Accepted 26 October 2011 Keywords: Optical recording Plant electrical signals Voltage-sensitive dye Signal processing abstract Optical recording is widely used in electrophysiology research of animal cells, providing a good reference for the measurement of plant electrical signals at the multi-cell level. The aim of this research is to develop a method for monitoring the dynamic synchronous electrical activity in plant cells. Using a leaf strip of Vicia faba L as the specimen, a voltage-sensitive dye (VSD) and a stereo fluorescent microscope were applied to acquire an optical image time series, considering the different biological nature of the plant cell from the animal cell. Subsequently, the synchronous variation trend of the dye fluorescence intensity was extracted and observed through image analysis using self-designed signal processing procedures. This proved the feasibility of a visualization method of synchronous propagation of plant electrical signals. © 2011 Elsevier Ltd. All rights reserved. 1. Introduction As an initial response to exterior stimuli, the electrical signal of the plant carries important information on the electrical activity in the physiological processes of the plant [1]. Conventional electrophysiology approaches, including intracellular and extracellular measurements, and the patch clamp technique have been used to investigate the ionic mechanisms in plant cell membranes [2–5], and the ionic mechanism model based on the modified Hodgkin–Huxley equation has been proposed [6]. Advances in plant electrophysiology, plant cell biology, molecular biology, and sensory ecology will be discussed in the framework of initiated discipline of plant sciences, namely plant neurobiology [7–9]. Although synchronization of bioelectrical activities is an intriguing aspect of animal neuron systems, whether it is a behavior of plant system is a problem warranting further study. Moreover, the electrical signal transmission in plants could be long- distance, systemic and nonlinearly dynamic [10–12]. So it is necessary to monitor the dynamic synchronous variation of multi-cell electrical signals. This needs multi-site detection at high temporal and spatial resolution instead of a single-site detection using conventional approaches. In recent years, optical recording, especially optical mapping with a VSD, has been widely used in detecting the bioelec- trical activity of animal cells [13–18]. The advance in VSD and opto-electric (E-O) systems has expanded the application of optical recording in the field of electrophysiology research. First, the VSD’s efficiency in converting the electrical activity to ∗ Corresponding author at: College of Information and Electrical Engineering, China Agricultural University, Beijing 100083, China. Tel.: +86 010 62737778; fax: +86 010 62737778. E-mail address: [email protected] (Z.Y. Wang). 0895-7177/$ – see front matter © 2011 Elsevier Ltd. All rights reserved. doi:10.1016/j.mcm.2011.10.036
Transcript of Mathematical and Computer Modelling Visualization of synchronous propagation of plant electrical...

Mathematical and Computer Modelling 58 (2013) 661–669
Contents lists available at SciVerse ScienceDirect
Mathematical and Computer Modelling
journal homepage: www.elsevier.com/locate/mcm
Visualization of synchronous propagation of plant electrical signalsusing an optical recording methodYang Qin a, Lan Huang a, An Liu a, Dong-jie Zhao a, Zhong-yi Wang a,b,∗, Yi-min Liu c,Tong-lin Mao c
a College of Information and Electrical Engineering, China Agricultural University, Beijing 100083, Chinab Key Laboratory of Modern Precision Agriculture System Integration Research, Ministry of Education, China Agricultural University, Beijing, 100083, Chinac State Key Laboratory of Plant Physiology and Biochemistry, Department of Plant Sciences, College of Biological Sciences, China Agricultural University, Beijing100193, China
a r t i c l e i n f o
Article history:Received 29 September 2011Accepted 26 October 2011
Keywords:Optical recordingPlant electrical signalsVoltage-sensitive dyeSignal processing
a b s t r a c t
Optical recording is widely used in electrophysiology research of animal cells, providinga good reference for the measurement of plant electrical signals at the multi-cell level.The aim of this research is to develop a method for monitoring the dynamic synchronouselectrical activity in plant cells. Using a leaf strip of Vicia faba L as the specimen, avoltage-sensitive dye (VSD) and a stereo fluorescent microscope were applied to acquirean optical image time series, considering the different biological nature of the plant cellfrom the animal cell. Subsequently, the synchronous variation trend of the dye fluorescenceintensity was extracted and observed through image analysis using self-designed signalprocessing procedures. This proved the feasibility of a visualizationmethod of synchronouspropagation of plant electrical signals.
© 2011 Elsevier Ltd. All rights reserved.
1. Introduction
As an initial response to exterior stimuli, the electrical signal of the plant carries important information on theelectrical activity in the physiological processes of the plant [1]. Conventional electrophysiology approaches, includingintracellular and extracellular measurements, and the patch clamp technique have been used to investigate the ionicmechanisms in plant cell membranes [2–5], and the ionic mechanism model based on the modified Hodgkin–Huxleyequation has been proposed [6]. Advances in plant electrophysiology, plant cell biology, molecular biology, and sensoryecology will be discussed in the framework of initiated discipline of plant sciences, namely plant neurobiology [7–9].Although synchronization of bioelectrical activities is an intriguing aspect of animal neuron systems, whether it is a behaviorof plant system is a problem warranting further study. Moreover, the electrical signal transmission in plants could be long-distance, systemic and nonlinearly dynamic [10–12]. So it is necessary to monitor the dynamic synchronous variation ofmulti-cell electrical signals. This needs multi-site detection at high temporal and spatial resolution instead of a single-sitedetection using conventional approaches.
In recent years, optical recording, especially optical mapping with a VSD, has been widely used in detecting the bioelec-trical activity of animal cells [13–18]. The advance in VSD and opto-electric (E-O) systems has expanded the application ofoptical recording in the field of electrophysiology research. First, the VSD’s efficiency in converting the electrical activity to
∗ Corresponding author at: College of Information and Electrical Engineering, China Agricultural University, Beijing 100083, China. Tel.: +86 01062737778; fax: +86 010 62737778.
E-mail address:[email protected] (Z.Y. Wang).
0895-7177/$ – see front matter© 2011 Elsevier Ltd. All rights reserved.doi:10.1016/j.mcm.2011.10.036

662 Y. Qin et al. / Mathematical and Computer Modelling 58 (2013) 661–669
Fig. 1. Diagram of optical image acquisition. The optical image is seen as a matrix, in which the pixel or pixel region A is an element, filled with differentdepths of red color. The red depth equates to optical signal intensity, so the signal intensity of A is changing with the membrane potential PA at intervalsof 2 ms. (For interpretation of the references to colour in this figure legend, the reader is referred to the web version of this article.)
optical signals has been confirmed in cardiac and neural electrophysiology research, which is considered as a preconditionfor high-resolutionmeasurement [19–22], and second, there has been somemature train of thinking in the systemdesign foroptical signal acquisition and processing, including resolution of the photodetector, light source and filters, signal-to-noiseratio (S/N), instrumentation interfaces, etc. [23–26].
Therefore, it is reasonable to introduce optical recording to study the electrical activity in plant cells with the followingconsiderations. (1) The selected VSD should have the capability to bind to the cell membrane across the cell wall of theplant cell, and the wavelength of the emitted fluorescence should avoid the chlorophyll autofluorescence at wavelengthsof 650–700 nm. (2) The electrical activity in plant cells is slow (minutes) [27], so the optical signal distortion caused byphotobleaching cannot be avoided, and it is necessary to eliminate the bleaching bias. (3) The CCD camera with inherenthigh spatial resolution and msec temporal resolution is appropriate for the detection of the converted optical signals fromslow electrical activity in plant cells. The S/N would be much improved on condition that the shape of each cell can be seenin the acquired image, allowing the use of averaging of gray values in selected pixels [28]. From the above, all indicationssupport the feasibility of optical recording to investigate the propagation of electrical signals in plants; the analysis of opticalimages may provide strong evidence for this, as shown in Fig. 1.
The purpose of the present study was to develop a non-contact optical recording method of bioelectrical signalmapping and spatiotemporal analysis of synchronous propagation of these signals. To investigate the signal propagation,a visualization procedure was proposed. In this work, we focused on these issues: (1) optical image acquisition; (2) theconversion of VSD signals to membrane potential; (3) mapping of bioelectrical activation.
2. Mapping of bioelectrical activation from fluorescence images
2.1. The conversion of VSD signals to membrane potential
The optical images were an output image time series, from which the time course of dye fluorescence was extracted ingray values of selected pixels. First, a pixel region was cropped from the 1st frame of the image time series, and the averagegray value (AG) of the pixels, the location and the size of the region was calculated and recorded. Then, referring to the1st image, the AGs of other images in the same region were calculated and recorded. The record of the gray-time changesrepresented the changes of dye fluorescence in the region during the optical recording.
Afterward, the first 10 values and the last 10 values of the recordwere used to fit the dye self-photobleaching attenuationcurve with fitting function aebx [29], to give the result of:
ln ab
= {[1, x]T [1, x]}−1
[1, x]T lnG, where x is a column vectorconsisting of the acquisition time (s) of the image time series, with the first element 0, and G is a column vector consistingof the corresponding recorded values. Then, the fitting values were calculated, and subtracted from the recorded valuesto obtain the relative gray change value (GC), with the elimination of the bias caused by plant autofluorescence and dyephotobleaching. Finally, to indicate the potential variation trend, the normalization (1F/F ) should be implemented [30],where F represents the recorded value of the selected position when ice stimulus was imposed. Since the fluorescenceintensity of the dye was inversely proportional to the membrane polarization, 1F is the opposite number of GC . Finally, thedata of the selected position provide 1F/F , representing the membrane potential induced by ice stimulus.
2.2. Optical image analysis to obtain the bioelectrical activation
The quality of dye staining was not the same in different tissue areas of the specimen. In non-cell areas, the fluorescenceintensity carried no information of the membrane potential. Therefore, it was necessary to find and record the gray values

Y. Qin et al. / Mathematical and Computer Modelling 58 (2013) 661–669 663
Fig. 2. Optical image analysis interface. All the signal processing procedures were organized via these buttons: ‘‘Pixel Region’’ is for manually selecting thepixel region in the image. ‘‘Fit Correction’’ is for bleaching curve fit and calculation of GC . ‘‘1F/F ’’ is for normalization of GC . ‘‘Spearman’’ is for selectionof the reference to calculate Rs . ‘‘Change Trend’’ is for auto-selection of effective regions in the images and display of 1F/F for all the effective regions in3D-view.
Fig. 3. The signal processing procedures of one ‘‘effective region’’. AG, GC , and1F/F were explained in Section 3.1. (1)–(6) represents the signal processingprocedures in Section 3.1: (1) select the pixel region; (2) average the gray value; (3) fit the bleaching curve and calculate GC; (4) Spearman correlationcoefficient calculation; (5) normalization1F/F ; (6) set the reference to calculate Rs . Red represents effective region (n×n× t). In the AG axis, the red curverepresents the fitting curve, and the blue curve represents the gray-time curve. r represents the reference value of the Spearman correlation coefficient.The 1F/F values of all the effective regions were kept in a new image matrix time series (p × q × t), where p = x/n, q = y/n. (For interpretation of thereferences to colour in this figure legend, the reader is referred to the web version of this article.)
of the effective regions carrying information of membrane potential. According to Section 2.1, the effective regions shouldfit the gray-time curve well (R2 > 0.9) and have a similar variation trend with ice-induced electrical signals. This could beproved using the Spearman correlation coefficient (Rs): Rs = 1 − 6
ni=1 d
2i /(n
3− n), di represents the difference between
the ith element in selected GC and sampled GC , and n is the length of GC [31]. The reference value of Rs was determinedaccording to the experience from repeated experiments. For searching efficiency, we used the Matlab R⃝ environment toimplement these analyses, and signal processing procedures were organized as a GUI, as shown in Fig. 2.
To automatically search the effective regions, the image time series (x × y × t pixels) were divided into n × n × t pixelareas, where t represents the time interval. Each pixel area was averaged to a t × 1 vector. Then the first 10 elementsand the last 10 elements of the vector were used to fit the bleaching curve, and R2 of the fitting curve and the gray-timecurve were calculated, to decide whether the Rs should be done. The effective regions (R2 > 0.9, Rs > Reference Value)were normalized to obtain the 1F/F , while 1F/F of other areas was set to 0. All the signal processing procedures weredescribed in Section 3.1, and1F/F of all the effective regions were kept in a new imagematrix time series (p×q× t), wherep = x/n, q = y/n, as shown in Fig. 3. Considering that the variation trend is well displayed using the trend of peak values,all the elements with maxima in each new image were kept while others were set to 0. Finally, each new image matrix wasdisplayed in a 3D plot and saved. This automatic process was organized via ‘‘Change Trend’’ button in the GUI (Fig. 2), andwas described in Fig. 4.

664 Y. Qin et al. / Mathematical and Computer Modelling 58 (2013) 661–669
Fig. 4. Software process of auto-searching and analysis of ‘‘effective regions’’.
3. Experimental protocol
All the specimens were of epidermis strip (10 mm × 5 mm) isolated from fully expanded leaves of 3–4 weeks-old Viciafaba L; then it was floated in darkness on an incubation solution for 3–4 h. The composition of the solution was (mM):

Y. Qin et al. / Mathematical and Computer Modelling 58 (2013) 661–669 665
(a) The manual selection. (b) 1F/F of the selected area.
(c) The record of ice-induced membrane potential.
Fig. 5. The sample for calculation of the Spearman correlation coefficient.
2.5 Hepes (pH 6.5), 10 sucrose, 0.5 CaCl2, 1.0 KCl [32]. The selected VSD di-4-ANEPPS, with excitation wavelength of 496nm and emission wavelength of 705 nm, was dissolved in 1 mM of DMSO as a stock solution and kept frozen [33]. For theexperiment, the required amount of the stock solution was dissolved in an incubation solution. Finally, the specimen wasloaded with the incubation solution containing 5 µm VSD for 20 min at room temperature before optical recording. In thepreliminary study, some specimens were used for a control experiment, using glass microelectrode as an electrophysiologymethod in order to get the data of membrane potential evoked by ice stimulus, as a reference for optical signals. Moreover,some specimens were soaked in 5% sucrose for 10 min at room temperature to investigate the capability of VSD to bind themembrane across the cell wall. The resulting plasmolization proved that the dye could bind to themembrane across the cellwall, in agreement with other research [34]. More details are given in our other work [35].
4. Optical image acquisition
The specimen was an unfolded epidermis strip isolated from Vicia faba L, loaded with experimental solution (5 µmVSD)contained in a chamber mounted on the stage of a fluorescence stereo microscope (AZ100, Nikon, Tokyo, Japan). The cooledCCD camera of the microscope had a resolution of 2560 × 1920 photopixels. Each pixel corresponded to a tissue area of14 µm × 14 µm. The excitation and emission filters used passed light lengths of 450–490 nm at 40 ± 1 µmol/(m2 s) and510–560 nm at 1150 ± 1 µmol/(m2 s), respectively. The camera detected the epifluorescence through the filter (>590 or560 nm) and got the image projected by 4× objectives (0.12 NA, Nikon), 8× optical zoom and 10× eyepiece (0.6 NA, Nikon)in 1280× 960 pixel size at 10 Hz (0.1 s/frame). The kinetics of dye bleaching for the specimenwas illuminated at 5 s intervalsover 7 min to acquire the image time series. At the end of the 9th interval, the ice stimulus was applied to the edge of thestrip (on the right side of the image) with a 9 mm3 ice slice of frozen experimental solution. To detect the small change inthe fluorescence intensity, the output image format was set to TIFF with a 16-bit grayscale.
666 Y. Qin et al. / Mathematical and Computer Modelling 58 (2013) 661–669
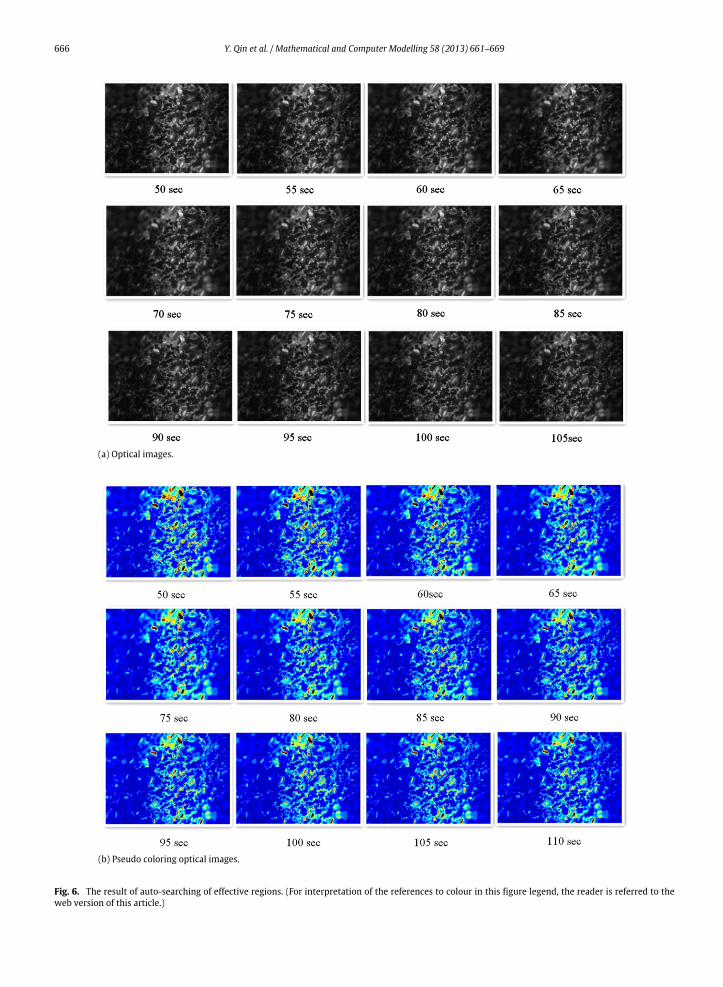
(a) Optical images.
(b) Pseudo coloring optical images.
Fig. 6. The result of auto-searching of effective regions. (For interpretation of the references to colour in this figure legend, the reader is referred to theweb version of this article.)

Y. Qin et al. / Mathematical and Computer Modelling 58 (2013) 661–669 667
(c) The variation trend of 1F/F in the 3D plot, red represents the max of 1F/F and blue represents the min. The acquisition time of the pictureswere shown.
Fig. 6. (continued)
5. Results and discussions
Twenty optical images were required to fit the bleaching curve. For Section 2, the image time series included 85 images.However, images after the 80th image were totally dark, carrying no useful information of fluorescence. So the images usedin the experiment were an 80-image time series without the last five, while the first 10 images and the last 10 imagesselected to fit were 1st–10th and 71st–80th, respectively. Then, a sample was manually selected to set the reference valueof the Spearman correlation coefficient, taking the ice-induced membrane potential from the preliminary work, as shownin Fig. 5, as a reference. The GC of the sample was used in auto-searching to calculate Rs and reference value of Rs was set to0.6.
In the auto-searching procedures, the images (1280 × 960 × 80 pixels) were divided into 3072 areas, each area has20 × 20 × 80 pixels, and the searching was implemented along the x-axis. The 1F/F of effective regions was kept in anew image matrix (64 × 48 × 80). Then all the elements with maxima in each new image were kept while others wereset to 0, and each new image matrix was displayed in a 3D plot, where the right side in the x–y plane corresponded to theright side of the optical image. Fig. 6 shows the searching results in Fig. 6(c), with the optical images in Fig. 6(a) and theirpseudo coloring in Fig. 6(b). Comparing the variation trend in the 3D plot to the color changes in the pseudo coloring ofthe optical images in Fig. 6, peaks of 1F/F occurred on the right side at the 50th s, and kept moving to the other side. Thisindicated the propagation of ice-inducedmembrane potential in cells of the optical image, while the pseudo color tended tobe blue in accordance with the attenuation of fluorescence intensity. Therefore, the synchronous propagation of membranepotential contained in the optical signals was extracted and observed. The results showed a variation trend of 1F/F , andthe 1F/F of each effective region was saved, which set the stage for further study on the propagation path of the plantelectrical signals. The temporal and spatial variation of electrical activities in all effective regions with a maxima of 1F/Fduring optical recordingwere shown in Video_1.wmv, where the lower left quarter in x–y plane of the 3D plot correspondedto the top right quarter of optical images, to be seen clearly.
6. Conclusion
In summary, the normalization1F/F was applied to convert the variation of the optical signal in VSD fluorescence imagetime series to electrical signal variations, and using the Spearman correlation coefficient (Rs) accompanied with R2, theeffective regions carrying information of the membrane potential were found; then the temporal and spatial variation of
668 Y. Qin et al. / Mathematical and Computer Modelling 58 (2013) 661–669
electrical activities, seen as the peak synchronous propagation, were described in the 3D plot of the image time series. It isthe application of optical recording to detect plant electrical signals for the first time. The visualization of the synchronouspropagation of plant electrical signals may support the new concept of plant neurobiology from integrated electrical signalsof stimulus perception of plants. The bias caused by dye photobleaching and other autofluorescence was eliminated in thesignal processing procedures, but the ratio of GC to the electrical signal intensity was not clear. So the quantitative analysisof the propagation needs further study.
Acknowledgments
This research was supported by the National Natural Science Foundation of China (Grant 61072016).
Appendix. Supplementary data
Supplementary material related to this article can be found online at doi:10.1016/j.mcm.2011.10.036.
References
[1] J. Fromm, S. Lautner, Electrical signals and their physiological significance in plants, Plant Cell Environment 30 (2007) 249–257.[2] K. Trebacz, W. Simonis, G. Schönknecht, Cytoplasmic Ca2+ , K+ , Cl− , and NO−3 activities in the liverwort Conocephalum conicum L. at rest and during
action potentials, Plant Physiology 106 (1994) 1073–1084.[3] A. Carpaneto, N. Ivashikina, V. Levchenko, E. Krol, E. Jeworutzki, J.K. Zhu, R. Hedrich, Cold transiently activates calcium-permeable channels in
Arabidopsis mesophyll cells, Plant Physiology 143 (2007) 487–494.[4] R. Hedrich, D. Becker, Green circuits—the potential of plant specific ion channels, Plant Molecular Biology 26 (1994) 1637–1650.[5] P. Thuleau, M. Moreau, J.I. Schroeder, R. Ranjeva, Recruitment of plasma membrane voltage-dependent calcium-permeable channels in carrot cells,
The EMBO Journal 13 (1994) 5843–5847.[6] Z.Y. Wang, L. Huang, X.F. Yan, C. Wang, Z.L. Xu, R.F. Hou, X.J. Qiao, A theory model for description of the electrical signals in plant part I, in: IFIP
International Federation for Information Processing 258, in: Computer And Computing Technologies in Agriculture, vol. I, Springer, 2008, pp. 637–643.[7] F. Baluška, S. Mancuso, Plant neurobiology from stimulus perception to adaptive behavior of plants, via integrated chemical and electrical signaling,
Plant Signaling & Behavior 4 (2009) 475–476.[8] F. Baluška, S. Mancuso, Plant neurobiology: from sensory biology, via plant communication, to social plant behavior, Cogn Process 10 (S1) (2009)
S3–S7.[9] P.C. Struik, X.Y. Yin, H. Meinke, Perspective plant neurobiology and green plant intelligence: science, metaphors and nonsense, Journal of the Science
of Food and Agriculture 88 (2008) 363–370.[10] F. Baluška, S. Mancuso, Deep evolutionary origins of neurobiology, Communicative & Integrative Biology 2 (2009) 60–65.[11] E.Masi,M. Ciszak, G. Stefano, L. Renna, E. Azzarello, C. Pandolfi, S.Mugnai, F. Baluška, F.T. Arecchi, S.Mancuso, Spatiotemporal dynamics of the electrical
network activity in the root apex, PNAS 106 (2009) 4048–4053.[12] K. Trebacz, H. Dziubinska, E. Krol, Electrical signals in long-distance communication in plants, in: F. Baluska, S. Mancuso, D. Volkmann (Eds.),
Communication in Plants-Neuronal Aspects of Plant Life, 2006, pp. 277–290.[13] S.M. Yang, T. Doi, M. Asako, A. Matsumoto, T. Yamashita, Optical recording of membrane potential in dissociatedmouse vestibular ganglion cells using
a voltage-sensitive dye, Auris Nasus Larynx 27 (2000) 15–21.[14] D.Maric, I. Maric, J.L. Barker, Dual videomicroscopic imaging ofmembrane potential and cytosolic calciumof immunoidentified embryonic rat cortical
cells, Methods 21 (2000) 335–347.[15] W.N. Frost, J. Wang, C.J. Brandon, A stereo-compound hybrid microscope for combined intracellular and optical recording of invertebrate neural
network activity, Journal of Neuroscience Methods 162 (2007) 148–154.[16] G. Bu, H. Adams, E.J. Berbari, M. Rubart, Uniform action potential repolarization within the sarcolemma of in situ ventricular cardiomyocytes,
Biophysical Journal 96 (2009) 2532–2546.[17] W. Jin, R.J. Zhang, J.Y. Wu, Voltage-sensitive dye imaging of population neuronal activity in ortical tissue, Journal of NeuroscienceMethods 115 (2002)
13–27.[18] A.R. Cinelli, High-definition mapping of neural activity using voltage-sensitive dyes, Methods 21 (2000) 349–372.[19] D. Sung, J. Somayajula-Jagai, P. Cosman, R. Mill, A.D. Mcculloch, Phase shifting prior to spatial filtering enhances optical recordings of cardiac action
potential propagation, Annals of Biomedical Engineering 29 (2001) 854–861.[20] R. Arora, M.K. Das, D.P. Zipes, J. Wu, Optical mapping of cardiac arrhythmias (review article), Indian Pacing and Electrophysiology Journal 3 (2003)
187–196.[21] K. Sato, M. Kinoshita, Y. Momose-Sato, Optical mapping of spatiotemporal emergence of functional synaptic connections in the embryonic chick
olfactory pathway, Neuroscience 144 (2007) 1334–1346.[22] D. Ghezzi, A. Pedrocchi, A. Menegon, S. Mantero, F. Valtorta, G. Ferrigno, PhotoMEA: an opto-electronic biosensor for monitoring in vitro neuronal
network activity, BioSystems 87 (2007) 150–155.[23] S. Rohr, Optical mapping of microscopic impulse propagation, in: Quantitative Cardiac Electrophysiology, Marcel Dekker Inc., New York, 2002,
pp. 507–554.[24] D.S. Rosenbaum, F.G. Akar, The electrophysiology substrate for reentry: unique insights from high-resolution optical mapping with voltage sensitive
dyes, in: Quantitative Cardiac Electrophysiology, Marcel Dekker Inc., New York, 2002, pp. 555–580.[25] I.R. Efimov, Y. Cheng, Opticalmapping of cardiac stimulation: fluorescent imagingwith a photodiode array, in: Quantitative Cardiac Electrophysiology,
Marcel Dekker Inc., New York, 2002, pp. 507–554.[26] R.A. Gray, I. Banville, Video imaging of fibrillation and defibrillation, in: Quantitative Cardiac Electrophysiology, Marcel Dekker Inc., New York, 2002,
pp. 623–660.[27] D.J. Zhao, Z.Y. Wang, J. Li, X. Wen, A. Liu, L. Huang, Research on key issue in extracellular recording in plant based modeling and experiment, SCIENTIA
SINICA: Informationis 40 (2010) 133–142.[28] T. Tominaga, Y. Tominaga, H. Yamada, G.Matsumoto,M. Ichikawa, Quantification of optical signalswith electrophysiological signals in neural activities
of Di-4-ANEPPS stained rat hippocampal slices, Journal of Neuroscience Methods 102 (2000) 11–23.[29] F. Dupuy, J. Casas, A.G. Bagnères, C.R. Lazzari, OpenFluo: a free open-source software for optophysiological data analyses, Journal of Neuroscience
Methods 183 (2009) 195–201.[30] K. Takagaki, M.T. Lippert, B. Dann, T. Wanger, F.W. Ohl, Normalization of voltage-sensitive dye signal with functional activity measures, PLoS ONE
(2008) E4041.

Y. Qin et al. / Mathematical and Computer Modelling 58 (2013) 661–669 669
[31] M. Klemm, J. Haueisen, G. Ivanova, Independent component analysis: comparison of algorithms for the investigation of surface electrical brain activity,Medical and Biological Engineering and Computing 47 (2009) 106–110.
[32] J.T.M. Elzenga, H.B.A. Prins, V.E. Van, Light-inducedmembrane potential changes of epidermal andmesophll cells in growing leaves of Pisum sativum,Planta 197 (1995) 127–134.
[33] Molecular Probes, Inc. Molecular Probes Products Manual, Revised: 24-March-2006.[34] O. Toshiyuki, S. Junpei, N. Hirohisa, Potential-modulated fluorescence spectroscopy of the membrane potential-sensitive dye di-4-ANEPPS at the
1,2-dichloroethane/water interface, Analytical and Bioanalytical Chemistry 395 (2009) 1055–1061.[35] A. Liu, Detection system of electrical activity signal in plant cell network based on optical recording, Dissertation, China Agreculture University, 2011.