Materials for Electrochemical Energy Conversion and Storage
177
Materials for Electrochemical Energy Conversion and Storage by Molly M. MacInnes A dissertation submitted in partial fulfillment of the requirements for the degree of Doctor of Philosophy (Chemistry) in the University of Michigan 2020 Doctoral Committee: Professor Nicolai Lehnert, Co-Chair Professor Stephen Maldonado, Co-Chair Professor Zhan Chen Assistant Professor Charles McCrory Assistant Professor Nirala Singh
-
Upload
khangminh22 -
Category
Documents
-
view
2 -
download
0
Transcript of Materials for Electrochemical Energy Conversion and Storage

Materials for Electrochemical Energy Conversion and Storage
by
Molly M. MacInnes
A dissertation submitted in partial fulfillment
of the requirements for the degree of
Doctor of Philosophy
(Chemistry)
in the University of Michigan
2020
Doctoral Committee:
Professor Nicolai Lehnert, Co-Chair
Professor Stephen Maldonado, Co-Chair
Professor Zhan Chen
Assistant Professor Charles McCrory
Assistant Professor Nirala Singh

ii
To my parents, Ian and Michele, and to my sister and brother, Corinne and Joe.
Dedication

iii
I would first like to acknowledge the support and mentorship of my two advisors, Professor
Nicolai Lehnert and Professor Stephen Maldonado. Through your guidance I have grown as a
scientist and as a professional. I learned a great deal about mentorship from both of you.
Furthermore, I want to thank you for your support of my professional development and outreach
goals, without which my time in graduate school would have had much less meaning.
To the members of the Lehnert lab and the Maldonado lab, past and present: thank you for
always being welcoming, supportive, and non-judgmental (except where it was necessary). I will
miss the banter and sarcasm that pervaded the Maldonado lab, and I will miss the long road trips
and occasional board games with the Lehnert lab and the camaraderie and antics we had at
conferences together. In particular I want to thank Dr. Shawn Eady, who was my very first mentor
in graduate school. Shawn is one of the kindest and most patient people I know, not to mention a
fantastic researcher. Shawn taught me the first things I knew about electrochemistry and had the
patience to remind me how a Schlenk line works, among other basic laboratory skills that I had
forgotten. When I think of people who are able to coolly proceed in the face of a mountain of
responsibilities, I think of Shawn, and through my graduate career I have tried to emulate that
ability. Furthermore, I want to thank the three people in the Maldonado lab who have been the
biggest mentors to me over the years. Dr. Susu Lee, Dr. Josh Demuth, and Dr. Sofiya Hlynchuk.
Susu and Josh seemed to have a vast well of knowledge between the two of them that I could
always pick at. I learned a great deal from both of them and they were always willing to talk and
bounce around ideas with me. Sofiya was with me for most of my time in graduate school. She
was someone I always felt comfortable coming to with a question, whether it was about research,
school, or personal problems. Sofiya made my time in grad school so much more enjoyable than
it would have been without her and her absence this past year has been difficult.
I want to thank the staff in the chemistry department and elsewhere at the University of
Michigan. In particular I want to thank Liz Oxford, Katie Foster, Roy Wentz, Tracy Stevenson,
Acknowledgements

iv
and the staff at (MC)2 for always being positive and welcoming, excelling at their jobs, and
generally making all of our lives easier.
All my friends, both in Ann Arbor and scattered across the rest of the world have been of
the utmost importance to me over the past five years. I am so grateful to have so many generous
and loving people to share in my successes and comfort me in my failures. There are too many
names that I would like to list here, so instead I just want to say thank you to you all.
I want to thank all the professors who taught me at Oberlin College, especially Professor
Rebecca Whelan, my former academic adviser, and the late Professor Jesse Rowsell, my former
research advisor who mentored me for my honors thesis project. Additionally, I want to thank Dr.
Stosh Kozimor and Kevin Boland who were my mentors in my very first research experience
during a summer internship at the Los Alamos National Lab. It was during this summer that I
discovered a passion for scientific research and that is partly thanks to both of them.
And lastly, I want to thank my family. Without you I would be nowhere near where I am
now. I have received nothing but love and support from all of you. I’m so happy I could spend the
last five years living within the same state as at least three of you, and the last two years living
within the same walls as one of you. Thank you so much for everything you have done for me, for
your unconditional love and support. I love you all so much.

v
Table of Contents
Dedication ii
Acknowledgements iii
List of Tables vii
List of Figures viii
Abstract xvi
Chapter 1. Introduction 1
1.1 A societal need for clean energy 1
1.2 Photoelectrochemical cells for solar energy conversion. 5
1.3 Heterogeneous molecular electrocatalysis. 7
1.4 Reduced graphene oxide. 14
1.6 Other redox species for electrochemical energy storage 21
1.7 Scope of thesis 22
Chapter 2. Reduction of Graphene Oxide Thin Films by Cobaltocene and
Decamethylcobaltocene 24
2.1 Introduction 24
2.2 Experimental. 27
2.3 Results. 31
2.4 Discussion 44
2.5 Conclusions. 48
Chapter 3. Physisorption of a Molecular Proton Reduction Electrocatalyst on Thin Graphitic
Films 50
3.1 Introduction 50

vi
3.2 Experimental 51
3.3 Results 54
3.4 Discussion 59
3.5 Conclusions 62
Chapter 4. Reduced Graphene Oxide Thin Films Embedded with a Molecular Catalyst: Kinetic
Considerations 64
4.1 Introduction 64
4.2 Experimental 66
4.3 Results 69
4.5 Conclusions 79
Chapter 5. Discovery of an Unusually Stable Reduced Viologen via Synergistic Folding and
Encapsulation 80
5.1 Introduction 80
5.2 Experimental. 82
5.3 Results. 86
5.4 Discussion. 98
5.5 Conclusions. 104
Chapter 6. Future Work 106
6.1 Covalent grafting small molecules to RGO thin films 106
6.2 In situ x-ray absorption measurements on adsorbed cobalt bis(dichlorobenzenedithiolate) 112
6.3 Heterogeneous photoelectrocatalysis using p-GaP photoelectrodes with an electrocatalyst adsorbed
to an RGO thin film 118
6.4 Passivation of n-Si photoelectrodes with RGO thin films 123
6.5 Graphene oxide self-assembled monolayers on silicon oxide surfaces 128
Chapter 7. Summary and Conclusions 131
8. Bibliography 138

vii
Table 1.1 Reported molecular proton reduction catalysts immobilized on inert electrodes. ........ 11
Table 1.2 Reported molecular proton reduction catalysts immobilized on semiconductor
photocathodes under illumination. ................................................................................................ 12
Table 2.1 Reported methods for the preparation of reduced graphene oxide and the resulting
conductivities ................................................................................................................................ 25
Table 2.2 Resistance and conductivities of GO and RGO films prepared under different
conditions, measured by four-point probe. ................................................................................... 32
Table 2.3 X-ray Photoelectron C 1s Spectra Fitting Results for As-prepared and Reduced
Graphene Oxide Filmsa ................................................................................................................. 35
Table 2.4 Raman Spectra for As-prepared and Reduced Graphene Oxide Filmsa,b ..................... 39
Table 5.1 Voltammetric features for 2, 3, and MV alone and in the presence of cucurbiturils as
shown in Figure 5.1....................................................................................................................... 91
List of Tables

viii
Figure 1.1 Three methods for solar water splitting: (a) electrolysis of water driven by an external
photovoltaic, (b) photoelectrochemical water splitting, (c) photochemical water splitting. .......... 3
Figure 1.2 Example scheme of solar energy converted first (a) through the redox reaction A →
A- followed by (b) conversion to H2 by electron transfer through a proton reduction catalyst. ..... 5
Figure 1.3 Example setup of a water-splitting electrolysis cell. ..................................................... 8
Figure 1.4 Structure of 1. .............................................................................................................. 13
Figure 1.5 Structures of graphene (left) and RGO (right). ........................................................... 15
Figure 1.6 Scheme showing the synthetic steps to obtain RGO from graphite powder. Double
bonds are omitted for the sake of clarity. ...................................................................................... 16
Figure 1.7 Sample set of XP C1s spectra of GO (top), RGO (middle), and graphite (bottom) that
have been fitted with a series of Gaussian-Lorentzian peaks. ...................................................... 17
Figure 1.8 Sample Raman spectra of GO (top), RGO (middle), and graphite (bottom). The D, G,
and G’ bands are indicated. A 785 nm Raman laser excitation was used to collect these spectra.
....................................................................................................................................................... 19
Figure 1.9 Sample AFM images of (a) individual sheets of GO and (b) a thicker film of RGO on
silicon wafer surfaces. ................................................................................................................... 20
Figure 1.10 Encapsulation of methyl viologen radicals by cucurbit[7]uril (left) and
cucurbit[8]uril (right). ................................................................................................................... 21
Figure 2.1 Atomic force microscopy (AFM) images and height profiles of representative GO and
RGO films used for four-point probe resistivity measurements. AFM image of (a) a GO film on
glass, (c) a GO film treated with cobaltocene & TFA on glass, (e) a GO film treated with
decamethylcobaltocene on glass, and (g) a GO film treated with just TFA on glass. Height
profiles along the lines denoted as 1 are shown in (b), (d), (f), and (h), respectively. Scale bars: 2
μm. ................................................................................................................................................ 29
Figure 2.2 a) Photograph of (1) a clean glass microscope slide; (2) a GO film deposited on a
glass slide; (3) a GO film on glass treated with cobaltocene; (4) a GO film on glass treated with
cobaltocene & TFA; and (5) a GO film on glass treated with decamethylcobaltocene. b)
Corresponding transmittance spectra of the films 2-5 in (a). Scale bar: 1 cm. ............................. 31
List of Figures

ix
Figure 2.3 (Top) Absorption spectra of cobaltocene in acetonitrile before (black line) and after
(red line) addition of one molar equivalent of trifluoroacetic acid. (Bottom) Absorption spectra of
cobaltocenium in acetonitrile. ....................................................................................................... 33
Figure 2.4 Representative high-resolution C 1s X-ray photoelectron spectra of an as-cast GO film
and after 30 minute immersions in solutions of cobaltocene, cobaltocene & TFA, and
decamethylcobaltocene, respectively. Thin vertical dashed lines are guides for the eye indicating
the binding energies used for the five individual peaks (blue, purple, orange, green, and violet
lines) used to generate the fit (solid red line). The backgrounds used to generate the fits are
shown as thick dashed lines. ......................................................................................................... 34
Figure 2.5 Representative Co 2p XP spectra of RGO films treated with cobaltocene & TFA (top)
and films treated with decamethylcobaltocene (bottom). The black lines correspond to freshly
prepared RGO films and the red lines correspond to the same films after soaking in the
respective solvents for several days. The solvents used for this removal of cobalt species was
acidified acetonitrile in the case of films treated with cobaltocene & TFA and dichloromethane in
the case of films treated with decamethylcobaltocene. ................................................................. 36
Figure 2.6 Representative energy dispersive x-ray spectra (EDS) of an as-cast GO film on silicon
and after 30 minute immersions in solutions of cobaltocene, cobaltocene & TFA, and
decamethylcobaltocene, respectively. ........................................................................................... 37
Figure 2.7 Representative Raman spectra of an as-cast GO film and after 30 minute immersions
in solutions of cobaltocene, cobaltocene & TFA, and decamethylcobaltocene, respectively. All
raw spectra were normalized to the intensity of the peak near 1320 cm-1. The intensity of the
spectra between 2200 and 3200 cm-1 has been increased by an order of magnitude to better
visualize the peaks in this region. The scale bar highlights the intensity above the baseline of the
overlap region between the D and G peaks. ................................................................................. 39
Figure 2.8 Contact mode atomic force micrographs of (a) an as-cast GO film and after 30 minute
immersions in solutions of (b) cobaltocene, (c) cobaltocene & TFA, and (d)
decamethylcobaltocene, respectively. Scale bars: 2 μm. .............................................................. 41
Figure 2.9 a, c) GO films deposited on indium thin films evaporated onto glass. b) The film in (a)
after immersion in 50% HI solution for 30 seconds. d) The film in (c) after treatment with
cobaltocene & TFA. Scale bar: 1 cm. ........................................................................................... 42
Figure 2.10 (a) and (c) GO films patterned on paper. (b) The film in (a) after immersion in 50%
HI solution for 30 seconds. (d) The film in (c) after treatment with cobaltocene & TFA. Scale
bar: 1 cm ....................................................................................................................................... 42
Figure 2.11 Absorption spectra and cyclic voltammetric responses of GO and RGO films after
immersion in 50 mM methanol solutions for 15 minutes followed by rinsing with neat methanol.
a) Absorption spectrum for crystal violet adsorbed on a GO film and b) the corresponding
voltammetric responses before and after crystal violet adsorption. c) Absorption spectrum for
crystal violet adsorbed on an RGO film prepared by reduction with cobaltocene and d) the
corresponding voltammetric responses for the RGO film before and after crystal violet
adsorption. e) Absorption spectrum for crystal violet adsorbed on an RGO film prepared by

x
reduction with cobaltocene and TFA and f) the corresponding voltammetric responses for the
RGO film type before and after crystal violet adsorption. g) Absorption spectrum for crystal
violet adsorbed on an RGO film prepared by reduction with decamethylcobaltocene and h) the
corresponding voltammetric responses for the RGO film type before and after crystal violet
adsorption. Voltammetric responses were recorded in acetonitrile containing 0.1 M
tetrabutylammonium perchlorate and 40 mM TFA. Scan rate: 10 mV s-1. .................................. 43
Figure 3.1 Co 2p XP spectra of RGO (blue), MWCNT (red), and graphene (black) after soaking
in a 5 mM solution of 1. ................................................................................................................ 55
Figure 3.2 Cyclic voltammetry of various graphitic thin films after soaking in a 5 mM solution of
1 in acetonitrile for >1 hr with (top) and without (bottom) a Nafion capping layer. Supporting
electrolyte was deaerated 0.1 M KPF6 (black), with 2 mM TFA (red), 4 mM TFA (blue), 6 mM
TFA (green), or 8 mM TFA (orange). The dashed black curves are graphitic surfaces with no 1
adsorbed in 8 mM TFA. The vertical dashed lines are guides for the eye to show shift in onset of
current with a Nafion capping layer. The scan rate was 50 mV/s. ............................................... 56
Figure 3.3 Repeated voltammetric cycling of an fd-RGO film that had been soaked in a 5 mM
solution of 1 in acetonitrile for > 1hr. Supporting electrolyte was deaerated 0.1 M KPF6 with 10
mM TFA (left) and 50 mM TFA (right). The scan rate was 50 mV/s. ......................................... 56
Figure 3.4 Atomic force micrographs (left) and optical photographs (right) of a dropcasted GO
thin film (top), a polished graphite rod (middle), and a freeze-dried GO film (bottom). The RMS
roughness values calculated for each of these materials are 12 nm for GO, 104 nm for graphite,
and 262 nm for fd-RGO. ............................................................................................................... 57
Figure 3.5 Scanning electron micrographs of a freeze-dried GO film on a silicon wafer. Cross
section view is on the left. The middle and right images are top down views at different
magnifications. .............................................................................................................................. 57
Figure 3.6 AFM images of Nafion thin films cast on a silicon wafer, an RGO film, single layer
graphene, and a MWCNT film. The insets are the height profiles along the red line in each
image. ............................................................................................................................................ 58
Figure 4.1 Diagram showing the processes that occur within a thin film on an electrode surface
during electrocatalysis. The symbols are as follows: k is the rate constant for the catalytic
reaction; DH+ is the diffusion coefficient of protons within the film; DH2 is the diffusion
coefficient of hydrogen within the film; De is the diffusion coefficient of electrons within the
film; Co(III) is oxidized form of the catalyst; Co(II) is the reduced form of the catalyst after one
electron transfer. ........................................................................................................................... 66
Figure 4.2 (Left) Representative AFM image of an edge site on a 200 ± 100 nm film. The film
thickness was measured in this region by taking a profile across the blue dashed line and
averaging vertically between the two horizontal white dashed lines. This averaged profile is
shown on the right. ........................................................................................................................ 68

xi
Figure 4.3 Background subtracted linear sweep voltammetry of a series of film thicknesses with
a catalyst density of 2x10⁻⁴ mol catalyst per cm3 of RGO. The supporting electrolyte was a
deaerated ~0.2 M phosphate buffer at pH 2. Scan rate was 10 mV s-1. ........................................ 69
Figure 4.4 Plotted current and TOF versus film thickness from background-subtracted
voltammetry in Figure 4.3. (a) Current at -0.95 V. (b) TOF at -0.95 V. (c) Current at -0.67 V. (d)
TOF at -0.67 V. The data point corresponding to a 600 nm film does not follow a clear trend
with the other data points and should probably be re-measured. .................................................. 70
Figure 4.5 Background subtracted linear sweep voltammetry of a series of film thicknesses with
1.7 ± 0.2 x10⁻¹⁰ mole catalyst in each film. The supporting electrolyte was a deaerated ~0.2 M
phosphate buffer at pH 2. Scan rate was 10 mV s-1. ..................................................................... 71
Figure 4.6 Plotted current (a) and TOF (b) versus film thickness from the background-subtracted
voltammetry in Figure 4.5............................................................................................................. 71
Figure 4.7 Background subtracted linear sweep voltammetry of three catalyst containing films. In
blue is the voltammogram from Figure 4.5 (the 600 ± 300 nm film containing 1.7 ± 0.2 x10⁻¹⁰
mol catalyst). In black and red are voltammograms from similar films but with an additional 600
± 300 nm RGO film cast on top of and below, respectively, the catalyst-containing film.
Supporting electrolyte was a deaerated ~0.2 M phosphate buffer at pH 2. Scan rate was 10 mV s-
1. .................................................................................................................................................... 72
Figure 4.8 Illustration of a current versus thickness trend for an electrocatalytic film that follows
the assumptions in the reports by Savéant and Costentin.222-224 The green circles are the current at
a defined potential from cyclic voltammetry measurements. The dashed lines show the
intersection between the linear portion at the beginning of the curve and the plateau region. The
thickness at this intersection is the optimum film thickness. ........................................................ 74
Figure 4.9 Replotted data from Figure 4.4c with gray dashed lines corresponding to the linear
portion at the lower end of the curve and the plateau current. The intersection of these dashed
lines is at the optimum thickness 𝒅𝒇𝒐𝒑𝒕. ..................................................................................... 75
Figure 4.10 Left, cyclic voltammogram of surface adsorbed 1 on an RGO thin film on a glassy
carbon electrode in deaerated 0.1 M KPF6 and 2 mM trifluoroacetic acid at a scan rate of 50 mV
s-1. Right, FOWA fitting using the data from the voltammogram on the left. The black dotted line
is the data and the red line is the linear fit. The value for Ecat/2 was taken as -0.82 V (the potential
at half the current of the peak current). The slope of the line is 6.6x10⁻⁵ A, which is equal to
𝟐. 𝟐𝟒𝑹𝑻𝑭𝒗𝟏𝟐𝟐𝒌𝑪𝑨𝟎𝟏𝟐. ............................................................................................................. 76
Figure 5.1 Depictions of 24+, 34+, CB[8], and CB[7]. ................................................................... 81
Figure 5.2 Syntheses of 24+ and 34+. Details for these syntheses are described below. ................ 83
Figure 5.3 1H NMR spectra of a) an aqueous D2O solution of 24+ and b) an aqueous D2O solution
of 34+. The peaks are labeled corresponding to the protons in the structures above. .................... 84
xii
Figure 5.4 13CNMR spectra of 24+ (left) and 34+ (right). The peaks are labeled corresponding to
the carbon atoms in the structures above. ..................................................................................... 84
Figure 5.5 Equilibrium geometries modeled for free reduced dimers 24+ and 34+. Note the clear
difference in the number of bond rotations needed to access the π-stacked geometries from these
conformations: 24+ < 34+ ............................................................................................................... 87
Figure 5.6 Equilibrium geometries modeled for free reduced dimers 22+ and 32+. Side view
shows similar spacing of viologen groups, while end and top view illustrate the better π-π
stacking preorganization of 22+. .................................................................................................... 87
Figure 5.7 ITC determination of binding constant between 24+ and CB[8] (left) and 34+ (right).
All solutions for titration were made in phosphate buffer (10 mmol) and degassed in vacuum.
Solutions of 24+ (0.3mM) or 34+ (0.4mM) were titrated into a solution of CB[8] (0.026 mM), and
the resulting exotherm curve was fit to obtain binding constants of 1.2 x 10⁶ M-1 for 24+with
CB[8] and 1.1 x 10⁶ M-1 for 34+ with CB[8], respectively. ........................................................... 88
Figure 5.8 Cyclic voltammetry of viologen/cucurbituril pairs. From top to bottom: MV; 2; 3; MV
+ CB[7]; 2 + CB[7]; 3 + CB[7]; MV + CB[8]; 2 + CB[8]; 3 + CB[8]. Concentrations of MV, 2,
and 3¸were 0.4, 0.2, and 0.2 mM, respectively. Concentrations of CB[7] and CB[8] were
equivalent to the respective viologen in each panel. All voltammetry was performed in dearated
0.075 M phosphate buffer at pH = 7 at a glassy carbon electrode and a scan rate of 0.05 V s-1. . 90
Figure 5.9 Voltammetry of 2 + CB[8] (left) and 3 + CB[8] (right) at various scan rates collected
at 0.25 mM viologen with approximately one equivalent of CB [8]. The electrolyte was
deaerated 0.075 M phosphate buffer (pH 7). A glassy carbon electrode was used as the working
electrode. Pt mesh was used as the counter electrode and a Ag wire coated with AgCl immersed
in a fritted compartment containing saturated KCl was used as the reference electrode. ............ 92
Figure 5.10 1H NMR spectra of a) aqueous D2O solutions of 2 in various oxidation states and in
the presence of cucurbiturils and b) aqueous D2O solutions of 3 in various oxidation states and in
the presence of cucurbiturils. Peaks labeled j, k, and l correspond to cucurbituril protons. ......... 93
Figure 5.11 Color variation in solutions of 2 with and without CB[8] after addition of reducing
equivalents, defined as one reducing equivalent would reduce each viologen unity by 1e-. Top
row: 24+ (left); 2 after reduction with approximately half of the electrons necessary to fully
reduce the solution to 22+ (middle); 2 after the solution has been fully reduced to 22+ (right).
Bottom row: 24+ with CB[8] (left); 2 with CB[8] after reduction with approximately half of the
electrons necessary to fully reduce the solution to 22+ with CB[8] (middle); 2 with CB[8] after
the solution has been fully reduced to 22+/CB[8] (right). The solutions were 0.1 mM 2 in water.
CB[8] was added in approximately 1 equivalent. ......................................................................... 94
Figure 5.12 Absorbance spectra of 2 and 3 with and without cucurbiturils in solution after
reduction to the 2+ or 3+ states. (left) 22+ (black), 22+ in the presence of an equivalent of CB[7]
(blue), 22+ in the presence of an equivalent of CB[8] (green), and 23+ in the presence of an
equivalent of CB[8] (red). (right) 32+ (black), 32+ in the presence of an equivalent of CB[7]
(blue), 32+ in the presence of an equivalent of CB[8] (green), and 33+ in the presence of an
equivalent of CB[8] (red). ............................................................................................................. 95

xiii
Figure 5.13 a) Time-dependent absorbance spectra for 22+ in aqueous solution recorded at 15 s
intervals over 25 min. b) Time-dependent absorbance spectra for 22+ in same solution but with
one equivalent of CB[8]. c) Time-dependence of the absorbance maxima in Figure 5.13a at λ =
536 nm and in Figure 5.13b at λ = 623nm. d) Time-dependent absorbance spectra for 32+ in
aqueous solution. e) Time-dependent absorbance spectra for 32+ in the same solution but with
one equivalent of CB[8]. f) Time-dependence of the absorbance maxima in Figure 5.13d at λ =
534 nm and in Figure 5.13e at λ = 622 nm. .................................................................................. 97
Figure 5.14 a.) Time-dependent absorption spectra for MV•+ in phosphate buffer (pH7) recorded
at 15 s intervals over 25 min. b) Time-dependent absorption spectra for MV•+ in same solution
but with one equivalent of CB[8]. c) Time-dependence of the absorption maxima in Figure 5.14a
at λ = 603 nm and in Figure 5.14b at λ = 538 nm. ........................................................................ 97
Figure 5.15 Proposed elementary chemical and electrochemical steps involved in the reduction
of 2 in the presence of CB[8]. ..................................................................................................... 100
Figure 5.16 a) The relative energies of molecular orbitals from DFT calculations (Spartan
16,B97D, 6-311+G*) showing the 3+ and 2+ states of 2 both without and within CB[8]. b)
Graphical depiction of the LUMO of 2 in the 3+ oxidation state and the sHOMO of 2 in the 2+
oxidation state. c) The spin densities of 2 inside CB[8] in the 3+ and 2+ oxidation states are
shown, with CB[8] omitted for clarity. Side and top views of the 2 are shown, with the blue
regions highlighting the regions where the radical density is highest. ....................................... 101
Figure 5.17 Energy minimized structure (hydrogens not shown) (a) and spin density map (b) of
the 2(MV+) pimer showing the known twisted conformation of the viologen moieties. ........... 102
Figure 5.18 Structures of (left) cyclobis(paraquat-p-phenylene) and (right) cyclobis(paraquat-o-
phenylene). .................................................................................................................................. 104
Figure 6.1 Br 3d XP spectra of films casted from a GO suspension removed from a reaction
mixture with 4-bromoaniline after the listed times. .................................................................... 108
Figure 6.2 Br 3d XP spectra (left) and C 1s XP spectra (right) of films casted on FTO from a
suspension of GO after reaction with 4-bromoaniline. Each film was cycled in a 1 M KCl
solution containing 1 mM HCl between open circuit potential and the potentials listed to the right
in the figure three times. ............................................................................................................. 108
Figure 6.3 Si 2p (left) and C 1s (right) XP spectra of GO films after reaction with TMPS. The top
spectra are from a slurry of GO stirred in a solution of TMPs, and the bottom spectra are from a
thin film of GO immersed in a solution of TMPS. In red are representative C 1s spectra of an
unreacted GO film....................................................................................................................... 109
Figure 6.4 FTIR spectra of GO (black) and GO after reaction with sodium azide (red). The arrow
points to the N-N-N stretching peak. .......................................................................................... 110
Figure 6.5 I 3d (left) and Cu 2p (right) spectra of a GO-N3 film after stirring in a solution of 6-
iodo-1-hexyne with a copper wire wrapped around the stir bar (red) and after stirring in a
solution of 6-iodo-1-hexyne with a normal stir bar. ................................................................... 111

xiv
Figure 6.6 Photograph of the electrochemical cell used for XAS experiments. Front view (left)
and top view (right). Kapton film was glued (using super glue) across the window in the view on
the left. The electrodes were inserted through the holes on the top of the cell in the view on the
right and the solution was purged via an N2 line inserted through the smallest round hole. The
cell is not air-tight, but a blanket of N2 was kept flowing over the top of the solution during
experiments. ................................................................................................................................ 113
Figure 6.7 Overlay of normalized Co K-edge XANES spectra for two different samples at
neutral pH (no added acid). Sample 1 was taken after soaking the electrode in a solution of 1 for
about 4 hours on day 1, and Sample 8 was taking after soaking the electrode for about 2 days on
day 5. The electrolyte was deaerated 0.1 M KPF6. ..................................................................... 113
Figure 6.8 Overlay of Co K-edge XANES spectra with the electrode held at various potentials at
each pH. Each electrode was first held at OCP, then brought to -0.4 V, then -0.8 V, then -0.9 V,
and then it was brought back through the potentials in reverse order, ending at OCP. Hence, OCP
(1st) was the first spectrum and OCP (2nd) the last spectrum taken in each case. (Note that at pH
2, no data was taken at -0.4 V, hence the missing spectra.) The electrolyte was deaerated 0.1 M
KPF6 acidified with sulfuric acid. Each spectrum was taken on the same spot on the same (i.e.
the sample position was not moved between scans). .................................................................. 115
Figure 6.9 Overlays of Co K-edge XANES spectra for individual carbon paper electrodes with
adsorbed 1 at the highest (OCP) and lowest (-0.9 or -0.8 V) potentials over the range of pH
values. The electrolyte was deaerated 0.1 M KPF6 acidified with sulfuric acid. ....................... 116
Figure 6.10 Fitted EXAFS data of a carbon paper electrode with 1 adsorbed, held at -0.8 V vs
Ag|AgCl. The electrolyte was deaerated in 0.1 M KPF6 and acidified to pH 1 with sulfuric acid.
Approximately 20 scans were taken and averaged. .................................................................... 117
Figure 6.11 Photocurrent response of a p-GaP(100) photoelectrode in deaerated 0.1 M
tetrabutylammonium perchlorate in acetonitrile with 10 mM trifluoroacetic acid with various
concentrations of 1. A platinum mesh counter electrode and platinum wire quasi-reference
electrode were used. The scan rate was 50 mV/s and the light intensity was 100 mW/cm2 white
light. ............................................................................................................................................ 119
Figure 6.12 Photocurrent response of a methylated p-GaP(111A) photoelectrode with an RGO
film in deaerated 0.1 M tetrabutylammonium perchlorate in acetonitrile with 10 mM
trifluoroacetic acid with various concentrations of 1. A platinum mesh counter electrode and
platinum wire quasi-reference electrode were used. The scan rate was 50 mV/s and the light
intensity was 100 mW/cm2 white light. The dashed lines are the current in the dark. ............... 120
Figure 6.13 Photocurrent response of a phenylated p-GaP(111A) photoelectrode with an RGO
film before (black) and after (red) soaking in a 5 mM solution of 1 in acetonitrile in a glovebox
for 30 minutes. The supporting electrolyte was 0.1 M KPF6 in water with 10 mM trifluoroacetic
acid. A platinum mesh counter electrode and a Ag|AgCl reference electrode were used. The scan
rate was 50 mV/s and the light intensity was 100 mW/cm2 white light. .................................... 121
Figure 6.14 Photocurrent response of phenylated p-GaP(111A) photoelectrodes with an RGO
film (black and blue) and with an RGO film embedded with 1 (red and pink). The supporting

xv
electrolyte was 0.1 M KPF6 in water with 10 mM trifluoroacetic acid. A platinum mesh counter
electrode and a Ag|AgCl reference electrode were used. The scan rate was 50 mV/s and the light
intensity was 100 mW/cm2 white light. ...................................................................................... 121
Figure 6.15 Possible functionalization of a gallium phosphide surface that can present both a
hydrophobic (left) and hydrophilic (right) surface. .................................................................... 122
Figure 6.16 (left) Electrolysis of a silicon photoanode with (red) and without (black) an RGO
thin film under 0.5 V and 100 mW/cm2 white light. (right) Photocurrent response of the Si/RGO
photoanode after the electrolysis. The electrolyte was 0.5 M K4Fe(CN)6 in 0.2 M phosphate
buffer (pH 7). Platinum mesh was used as the counter electrode and Ag|AgCl was used as the
reference electrode. ..................................................................................................................... 124
Figure 6.17 (a) Photoresponse of a silicon (111) photoanode functionalized with a benzyl alcohol
group with (red) and without (black) an RGO film. (b) Dark current of the same electrodes as in
(a). (c) Electrolysis under illumination at 0.5 V using the same electrodes as in (a) and (b). (d)
Photoresponse of the electrodes after conducting the electrolysis in (c). The electrolyte was 0.5
M K4Fe(CN)6 in 0.2 M phosphate buffer (pH 7) and illumination in all cases was 50 mW/cm2
white light. Platinum mesh was used as the counter electrode and Ag|AgCl was used as the
reference electrode. ..................................................................................................................... 125
Figure 6.18 (a) Photoresponse of a silicon (111) photoanode functionalized with a benzyl alcohol
group with (red) and without (black) an RGO film after drying under vacuum. (b) Photoresponse
of the electrodes after conducting the electrolysis in (c). (c) Electrolysis under illumination and
0.5 V using the same electrodes as in (a) and (b). The electrolyte was 0.5 M K4Fe(CN)6 in 0.2 M
phosphate buffer (pH 7) and illumination in all cases was 50 mW/cm2 white light. Platinum mesh
was used as the counter electrode and Ag|AgCl was used as the reference electrode. ............... 126
Figure 6.19 Si 2p XP spectra of the silicon photoanodes before and after electrolysis under
illumination. (a) Silicon (111) functionalized with a benzyl alcohol group. (b) Silicon (111)
functionalized with a benzyl alcohol group and with an RGO film that had been dried under
vacuum. ....................................................................................................................................... 127
Figure 6.20 Scheme for GO monolayer attachment on silicon oxide surfaces using APTES (left)
and TEOS (right). ....................................................................................................................... 128
Figure 6.21 Atomic force micrographs of self-assembled GO films on silicon wafers. (Top) A
silicon wafer that had been functionalized with APTES and then immersed in a methanolic
suspension of GO at 70 for two hours. (Bottom) Silicon wafers that had been functionalized
with TEOS and then immersed in a methanolic suspension of GO at room temperature for 20
hours, 4 days, and 1 week. .......................................................................................................... 129

xvi
Photoelectrochemical systems are a promising method for the conversion of solar energy
to storable chemical fuels or charge carriers. Limitations on these systems include high
overpotentials for driving redox reactions, which reduce the efficiency of energy conversion, and
difficulties in long-term storage of charge carriers. The work described in this thesis addresses
both issues. First, high overpotentials can be mitigated by the addition of an electrocatalyst.
Heterogeneous molecular electrocatalysis is promising but reports in photoelectrochemical
systems are limited. This thesis describes the use of reduced graphene oxide (RGO) thin films to
immobilize molecular electrocatalysts on electrodes. Second, charge carriers used to store
electrochemical energy are subject to poisoning by oxygen. This thesis presents the use of host-
guest chemistry to stabilize a radical species in the presence of oxygen.
First, a novel method for the fabrication of RGO thin films is demonstrated. This method
is the first report using dissolved outer-sphere reductants to reduce graphene oxide to RGO. As a
result, these RGO films are reduced without heteroatom doping or over-reduction, common
problems with previously reported inner-sphere reductions. Furthermore, this method is
exceedingly gentle and can be performed with a variety of underlying substrates including soft
organic, non-conducting, and chemically sensitive materials.
RGO thin films deposited on electrode surfaces are shown to adsorb the proton reduction
electrocatalyst cobalt(III) bis(dichlorobenzenedithiolate), presumably through π-stacking
interactions. The retention of the electrocatalyst under turnover conditions is poor on smooth films
but excellent on rough films. It is therefore hypothesized that the π-stacking interactions are weak
and may become disrupted during turnover, leading to fast loss of the catalyst from smooth
surfaces. However, on rough RGO films, catalyst intercalation is possible, leading to mechanical
trapping that prevents it from diffusing away during electrocatalysis. This work has implications
for the field of small molecule surface modifications that employ π- π interactions. Specifically,
these interactions may be weak, but intercalation within a graphitic material can lead to enhanced
retention of adsorbed species.
Abstract

xvii
Taking advantage of these findings, I then devised a new approach where catalyst and GO
are co-deposited, and I studied the kinetics of electrocatalytic proton reduction in the resulting
RGO films that are embedded with the electrocatalyst. This is the first time that fundamental
kinetics of an electrocatalytic RGO thin film have been investigated. It is shown that different
processes are limiting depending on the thickness of the film. For films thinner than 200-500 nm,
diffusion processes limit the current, whereas for thicker films, electrical conductivity of the film
likely plays a role. These conclusions are relevant for maximizing current in electrochemical
energy conversion systems, especially since RGO is commonly used as a catalyst support in such
systems.
The second part of this thesis describes interactions of two bis-viologen species with the
cage molecule cucurbit[8]uril (CB[8]). A unique viologen oxidation state is identified in the
presence of CB[8], identifiable by its absorption spectrum. This species possesses extended
stability in the presence of oxygen. Computations suggest that the presence of a buried SOMO is
the origin of this enhanced stability. This work has relevance in energy storage systems such as
redox flow batteries and solar redox batteries, where trace oxygen can poison solutions of reduced
viologens. Extending the stability of viologens by entrapment within cage complexes is a
promising method for improving the shelf-life of these species.

1
1.1 A societal need for clean energy
For the last 1 million years or more, humans and our recent ancestors have been burning
organic materials to produce energy.1 For most of that million years, we have used materials like
wood, peat, and coal, but since the industrial revolution, humanity has become more dependent on
fossil fuels like oil and gas. In every case, however, the burning of organic materials generates
pollutants like ash and gaseous species such as carbon dioxide and NOx. Since the global
population has seen many periods of exponential growth over the last century,2 these emissions
have recently resulted in the onset of an environmental crisis. Today energy usage is at an all-time
high. In 2015, global energy consumption was 575 quadrillion Btu, and the US Energy Information
Administration predicted energy consumption in 2040 to be more than 25% higher, around 739
quadrillion Btu.3 As a result, carbon emissions will increase proportionately. In 2011, the OECD
reported a projected increase in CO2 emissions of 70% by 2050.4 And in turn, as a result of this
increase in greenhouse gas emissions, global temperatures have increased by 1.8⁰F (1⁰C) since
1900 and are expected to rise 2.5⁰F (1.4⁰C) by 2050.5 This warming will likely result in
catastrophic changes to our world and climate, such as sea levels rising as much as 8 feet by 2100
and an increase in severe weather events.5 Furthermore, studies have shown that climate change
disproportionately affects lower-income countries and communities, which also happen to be the
groups of people least responsible for greenhouse gas emissions.6-8 Therefore, it is imperative that
communities that are able to implement change do so whenever possible.
One important direction in which we are moving is the complete switch to renewable and
emission-free energy sources. One of the most extensively discussed and well-known sources of
clean, renewable energy is solar radiation, and for good reason: one hour of irradiance from the
sun delivers more energy than the total energy consumed by humans in one year.9 This suggests
that even with fractionally efficient solar cells covering a fraction of the earth’s surface, we could
potentially power the planet on solar energy alone. In reality, of course, there are other obstacles
Chapter 1. Introduction
2
that limit the feasibility of a totally solar powered society. One major obstacle is the intermittency
and non-uniformity of solar irradiance on the Earth’s surface. For example, the sun does not shine
at night, and in regions with high cloud cover there is much lower solar irradiance than in drier
regions. In order to mitigate this disparity, research has been directed towards methods of
converting solar energy into a form of energy that can be stored for use at times when the sun is
not shining.
A promising method for solar energy storage is the conversion of sunlight to chemical
fuels. The most common non-biological fuel generated by solar energy conversion is hydrogen gas
through the water splitting reaction:
4 H+ + 4 e- → 2 H2
2 H2O → O2 + 4 H+ + 4 e-
______________________________________________
2 H2O → 2 H2 + O2
This is an exceptionally non-polluting reaction as the only reactant is water and the only two
products are hydrogen and oxygen gasses.
The conversion of sunlight to fuel through an electrochemical reaction like the water
splitting reaction can be conducted in a number of ways. The three most common methods are
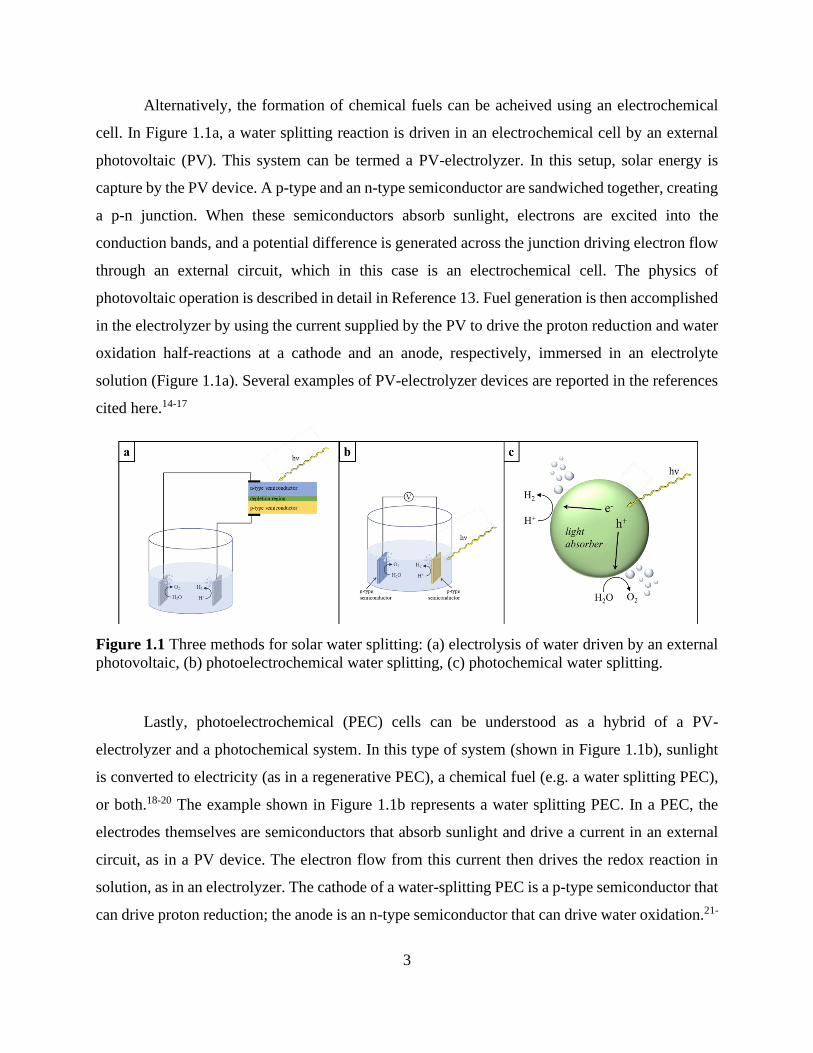
described here. First, sunlight can be converted directly to a chemical fuel through a photochemical
process like photosynthesis. In this process, light absorbers, usually semiconductor nanoparticles10
or, less often, molecular absorbers,11 capture solar energy and drive a chemical transformation.
This process is shown for a nanoparticle light absorber in Figure 1.1c. When the light absorber
absorbs photons of the appropriate energy, it enters an excited state where the excited electron can
be transferred to an electron acceptor in solution (for the water-splitting reaction this is H+ ions).
In the case of the nanoparticle in Figure 1.1c, a positively charged hole (h+) is also formed, which
transfers to an electron donor in solution (in this case H2O). The equivalent of h+ in an excited
molecular light absorber is the newly emptied SOMO that can accept an electron. In this way, a
single light absorber drives both the proton reduction half-reaction (2H+ → H2) and the water
oxidation half-reaction (2H2O → O2). In some cases, a co-catalyst is also added to improve the
kinetics of the reaction. These are often solid state clusters (such as MOx or MSx materials) on the
surface of the light absorbing nanoparticle or solution state coordination complexes.12
3
Alternatively, the formation of chemical fuels can be acheived using an electrochemical
cell. In Figure 1.1a, a water splitting reaction is driven in an electrochemical cell by an external
photovoltaic (PV). This system can be termed a PV-electrolyzer. In this setup, solar energy is
capture by the PV device. A p-type and an n-type semiconductor are sandwiched together, creating
a p-n junction. When these semiconductors absorb sunlight, electrons are excited into the
conduction bands, and a potential difference is generated across the junction driving electron flow
through an external circuit, which in this case is an electrochemical cell. The physics of
photovoltaic operation is described in detail in Reference 13. Fuel generation is then accomplished
in the electrolyzer by using the current supplied by the PV to drive the proton reduction and water
oxidation half-reactions at a cathode and an anode, respectively, immersed in an electrolyte
solution (Figure 1.1a). Several examples of PV-electrolyzer devices are reported in the references
cited here.14-17
Figure 1.1 Three methods for solar water splitting: (a) electrolysis of water driven by an external
photovoltaic, (b) photoelectrochemical water splitting, (c) photochemical water splitting.
Lastly, photoelectrochemical (PEC) cells can be understood as a hybrid of a PV-
electrolyzer and a photochemical system. In this type of system (shown in Figure 1.1b), sunlight
is converted to electricity (as in a regenerative PEC), a chemical fuel (e.g. a water splitting PEC),
or both.18-20 The example shown in Figure 1.1b represents a water splitting PEC. In a PEC, the
electrodes themselves are semiconductors that absorb sunlight and drive a current in an external
circuit, as in a PV device. The electron flow from this current then drives the redox reaction in
solution, as in an electrolyzer. The cathode of a water-splitting PEC is a p-type semiconductor that
can drive proton reduction; the anode is an n-type semiconductor that can drive water oxidation.21-

4
22 The major difference between a PV-electrolyzer and a PEC cell lies in the use of semiconductor
materials both as electrodes and as light absorbers in the case of a PEC, whereas in a PV-
electrolyzer, the light absorbing component is separate from the water splitting component.
Beyond direct water splitting
While the water splitting reaction is a popular source of chemical fuel because of the global
abundance of water and the low environmental impact of burning H2, difficulties arise in the ability
to store H2 long-term and to transport it. H2 is gaseous at ambient conditions so in order to store it
with a high energy density, it must be compressed, which requires an energy input and introduces
safety risks. Because of its low molecular weight, hydrogen molecules easily diffuse through
containment walls leading to significant loss of H2 when stored for long periods of time.
Additionally, H2 is combustible and can form explosive mixtures with O2, which is of particular
risk when dealing with a leaky container of hydrogen.23
Non-gaseous fuels are easier and safer to store. These can include dissolved, liquid, and
solid-state chemical fuels. For example, in redox flow batteries, molecules like organic radical
polymers, vanadium oxide species, and organometallic complexes are used to store
electrochemical energy.24-25 Alternatively, these redox species can be used as mediators in the
water splitting reaction. In other words, the solar conversion methods described above (i.e. PEC,
photochemistry, or PV) drive conversion of a redox species that can be stored as an energy source.
When it is necessary to release the stored energy, these redox mediators can be combined with a
proton reduction catalyst to facilitate spontaneous H2 generation by transfer of electrons from the
redox species to H+ ions. This is most often done using platinum nanoparticles as the catalyst.26-28
An example of this process is shown in Figure 1.2. In Figure 1.2a, species A is
photoelectrochemically converted to A- (here B is a sacrificial reductant necessary to complete the
electron transfer). Solutions of A- can be stored and transported without the safety risks associated
with storing and transporting hydrogen gas; in this way, A- is a more practical energy storage
material. In Figure 1.2b, A- is converted to a combustible fuel (H2) by addition of a proton source
and a proton reduction catalyst. In this scheme, the reduction potential of A- is sufficiently negative
to drive reduction of protons, but the process is kinetically unfavorable unless a proton reduction
catalyst is also present to facilitate the electron transfer. This means A- can be indefinitely stable
in water solutions until platinum nanoparticles are added to the solution, in which case H2 is

5
evolved. A further benefit of a system like this is that the energy conversion and storage aspects
of PEC can be separately optimized.
Figure 1.2 Example scheme of solar energy converted first (a) through the redox reaction A → A-
followed by (b) conversion to H2 by electron transfer through a proton reduction catalyst.
1.2 Photoelectrochemical cells for solar energy conversion.
Photoelectrochemical solar energy conversion has advantages over both photochemical
and PV-electrolysis conversion of solar energy. First, there are two major advantages of a PEC
over photochemical conversion. One of these is the ease of separation of the products. During the
water splitting reaction, gaseous H2 and O2 are evolved simultaneously. In photochemistry these
two species are created essentially at the same reaction site (in Figure 1.1c, both reactions happen
simultaneously at the same nanoparticle); hence a subsequent separation step is required to obtain
pure H2. In a PEC, H2 and O2 are formed at physically separate electrodes. The separate collection
of these two products is achieved readily by use of a membrane separator in the cell. A second
advantage of PEC conversion over photochemical conversion lies in the ease of understanding and
controlling fundamental aspects of the process. Advances in surface analysis methods make it
easier to understand the chemistry of a macroscopic electrode compared to a discrete light-
absorbing particle. Furthermore, traditional electroanalytical techniques allow for an additional
level of characterization of photoelectrode operation.

6
The main advantage of a PEC over a PV-electrolyzer lies in its simpler design. Pristine
semiconductors are expensive materials, as are the high surface area electrodes necessary to
produce H2 efficiently. The cost of the conducting connective elements of a PV-electrolyzer device
is also non-negligble. In a PEC, the semiconductors act simultaneously as the light absorbers and
the electrodes, thereby simplifying the system and eliminating the costs of connective elements
required in a PV-electrolyzer.
Limitations on PEC efficiency
Several limitations on water splitting PEC efficiency for solar energy conversion and
storage currently exist. In the following, the limitations that are addressed by the research in this
thesis are described.
First, large overpotentials can be detrimental in water-splitting electrochemical cell
designs. Overpotential is any energy input beyond the thermodynamic energy of the reaction
needed to drive the reaction. Three types of overpotential can occur in an electrochemical cell.29-
30 The first is activation overpotential, which generally arises from an activation energy barrier for
the reaction. This is due to reaction kinetics and is specific to the electrode material and redox
reaction. For example, proton reduction has an extremely low activation overpotential on platinum
electrodes but a much higher activation overpotential on silver electrodes.31 The second is
concentration overpotential, which arises from slow or limited diffusion of species to and from the
electrode surface. This often observed when bubble formation blocks areas on the electrode
surface, a common problem in the water splitting reaction. Lastly, resistance overpotential occurs
because of cell design. This is common when junctions are formed in a cell, for example across a
membrane separator. Specifically, an electrical resistance within the cell leads to a potential drop
across that area.
This thesis focuses largely on mitigating the activation overpotential of the cathodic side
of the water-splitting reaction. Activation overpotential of a particular reaction can be lessened by
the addition of an electrocatalyst. Homogeneous (or solution phase) electrocatalysts are usually
molecular species, most often coordination complexes.32 Many molecular catalysts mimic proton
reduction and water oxidation catalysts in nature (e.g. hydrogenase).11, 33 Heterogeneous catalysts
can either be the same molecular catalysts immobilized on the electrode surface34-35 or solid state

7
materials, such as metal nanoparticles,36 binary material films like MoSx,37 or metal-organic
frameworks.38
A second limitation of PEC devices is the stability of photoelectrodes in solution and under
bias. Many semiconductor materials that have been investigated for water splitting exhibit low
stability in water and under illumination and bias. For example, n-type silicon, a common
photoanode material, is prone to oxidative attack by the solvent under positive applied bias in
water. Many p-type III-V and II-VI semiconductors (i.e. those comprised of elements from the
third and fifth rows or the second and sixth rows of the periodic table) are also prone to self-
reduction under negative bias. For example, the Ga atoms in GaP can reduce to metallic Ga0
clusters under a mild negative bias, resulting in a disruption of the crystal lattice and allowing for
chemical attack. To prevent oxidative and reductive poisoning of semiconductor photoelectrodes,
research in surface passivation techniques has been pursued. These techniques can be divided into
two categories: chemical passivation and physical passivation (with some systems operating by
both methods). In the former, dangling bonds at the surface are saturated by covalent grafting of a
functional group to the surface. The latter operates by deposition of an organic or inorganic layer
on the semiconductor surface that physically blocks reactive species (like water or O2). Covalent
grafting is surface specific. For example, Grignard type reactions work well on silicon surfaces39
whereas indium phosphide can be passivated by thiol self-assembled monolayers.40 Physical
passivation is generally surface independent and a variety of materials have been investigated for
this purpose, including metal oxides41, organic polymers42, and graphene43.
1.3 Heterogeneous molecular electrocatalysis.
The setup of a water-splitting electrolysis cell is shown in Figure 1.3. The anode and
cathode are immersed in electrolyte solutions and separated by a membrane that allows for ion
diffusion between the two compartments but limits transport of dissolved H2 and O2. The two
gaseous products can then be collected separately as they are evolved into the headspace of their
respective half-cells.
This thesis discusses electrocatalysis in electrochemical and photoelectrochemical cells, in
particular, the use of molecular heterogeneous electrocatalysts. In heterogeneous electrocatalysis,
the catalyst is immobilized on the electrode surface. In contrast, in homogeneous electrocatalysis,
the catalyst is dissolved in the electrolyte solution (the electrolyte reservoir in Figure 1.3).

8
Heterogeneous electrocatalysis has several benefits over its homogeneous counterpart. For one, it
significantly limits the amount of catalyst required. At a given moment in time, only the catalyst
at the electrode surface is active. In other words, only catalyst at the electrode surface can undergo
electron transfer with the electrode and participate in electrocatalysis. This means that catalyst
dissolved in the electrolyte reservoir is largely inactive. Second, heterogeneous catalysis limits
catalyst transport across ion exchange membranes in electrolysis cells, a source of contamination
during long-term electrolysis. And lastly, heterogeneous electrocatalysis allows the scope of usable
catalysts to expand beyond only water-soluble catalysts. This thesis specifically investigates
heterogeneous molecular electrocatalysts. The advantage of molecular electrocatalysts over solid
state electrocatalysts lies in well-defined active sites and a greater degree of tunability of molecular
species.
Figure 1.3 Example setup of a water-splitting electrolysis cell.
While much research has been devoted toward developing new bulk heterogeneous37-38, 44-
45 and homogeneous molecular water splitting electrocatalysts,46-48 heterogenization of molecular
electrocatalysts is less well-developed.47, 49-51 Various strategies for immobilizing electrocatalysts
on electrode surfaces have been explored, and Table 1.1 lists several examples of immobilized
proton reduction electrocatalysts and their kinetic parameters. In this table, TOF and TON are the
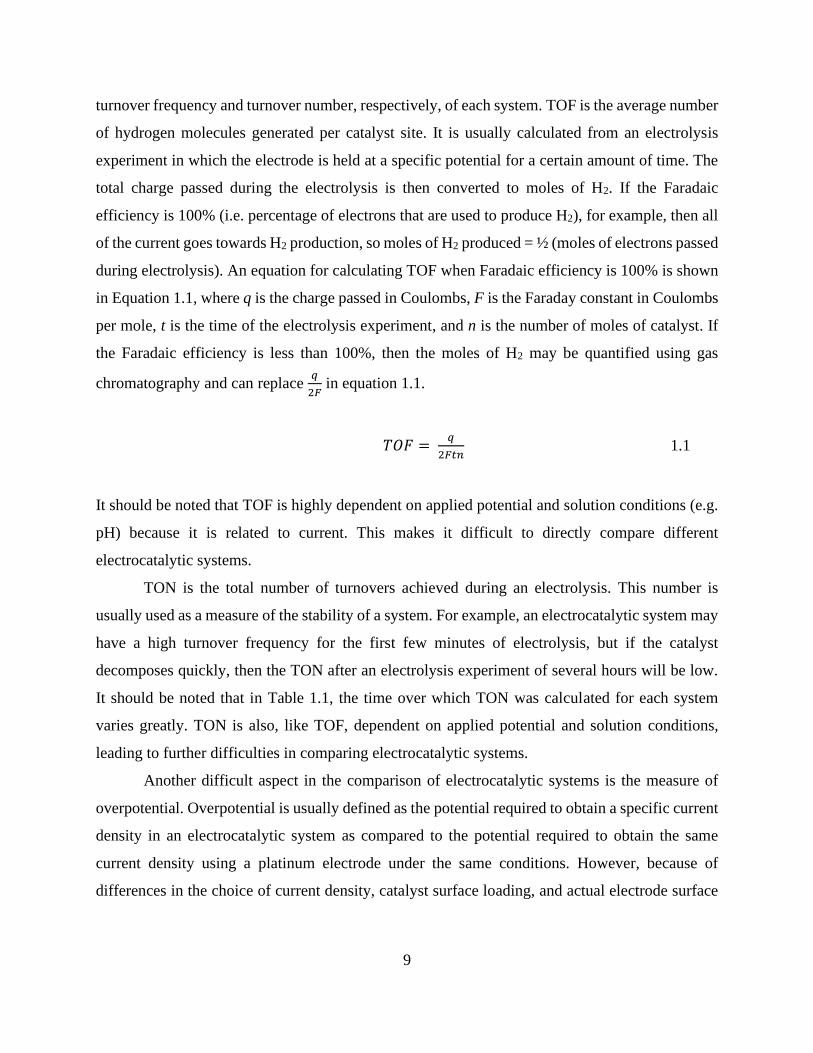
9
turnover frequency and turnover number, respectively, of each system. TOF is the average number
of hydrogen molecules generated per catalyst site. It is usually calculated from an electrolysis
experiment in which the electrode is held at a specific potential for a certain amount of time. The
total charge passed during the electrolysis is then converted to moles of H2. If the Faradaic
efficiency is 100% (i.e. percentage of electrons that are used to produce H2), for example, then all
of the current goes towards H2 production, so moles of H2 produced = ½ (moles of electrons passed
during electrolysis). An equation for calculating TOF when Faradaic efficiency is 100% is shown
in Equation 1.1, where q is the charge passed in Coulombs, F is the Faraday constant in Coulombs
per mole, t is the time of the electrolysis experiment, and n is the number of moles of catalyst. If
the Faradaic efficiency is less than 100%, then the moles of H2 may be quantified using gas
chromatography and can replace 𝑞
2𝐹 in equation 1.1.
𝑇𝑂𝐹 = 𝑞
2𝐹𝑡𝑛 1.1
It should be noted that TOF is highly dependent on applied potential and solution conditions (e.g.
pH) because it is related to current. This makes it difficult to directly compare different
electrocatalytic systems.
TON is the total number of turnovers achieved during an electrolysis. This number is
usually used as a measure of the stability of a system. For example, an electrocatalytic system may
have a high turnover frequency for the first few minutes of electrolysis, but if the catalyst
decomposes quickly, then the TON after an electrolysis experiment of several hours will be low.
It should be noted that in Table 1.1, the time over which TON was calculated for each system
varies greatly. TON is also, like TOF, dependent on applied potential and solution conditions,
leading to further difficulties in comparing electrocatalytic systems.
Another difficult aspect in the comparison of electrocatalytic systems is the measure of
overpotential. Overpotential is usually defined as the potential required to obtain a specific current
density in an electrocatalytic system as compared to the potential required to obtain the same
current density using a platinum electrode under the same conditions. However, because of
differences in the choice of current density, catalyst surface loading, and actual electrode surface

10
area (as opposed to geometric surface area), among other things, overpotential is difficult to
compare among different systems.
In summary, TOF, TON, and overpotential are all parameters that can be used to compare
the efficiency and stability of electocatalytic systems; however, because of differences in how
these parameters are measured, calculated, and reported, it can be difficult to directly compare
systems. Methods for obtaining these parameters should always be clearly reported and taken into
account when comparing systems.
The electrocatalytic systems listed in Table 1.1 are all comprised of molecular
electrocatalysts immobilized on inert electrode surfaces. The strategies for immobilization listed
here can be divided into two subgroups: covalent attachment and noncovalent attachment, i.e.
physical adsorption (termed “physisorption”). The former involves a chemical bond between the
catalyst and the surface, and the latter involves the use of attractive van der Waals forces or
entropic forces between the catalyst and the surface, for example charge-charge attractive forces
or π-stacking interactions.
Covalently grafted catalysts are often more robust than physisorbed systems because of the
strength of a chemical bond compared with a physical interaction. Covalent attachment, however,
is inherently surface-specific. Certain electrode surfaces have received more attention than others
for covalent attachment of molecular species. For example, metal oxides have been studied
extensively for their ability to bind molecules containing phosphonate, carboxylate, and siloxane
moieties.52-53 Silicon can easily be functionalized by Grignard reagents.39 And carbon-based
electrodes can be functionalized with small molecules by targeting the variety of functional groups
inherent to carbon surfaces, e.g. C=C double bonds, carboxylates, and epoxides, among others.54-
55 Some work on covalent attachment to electrode surfaces is discussed in Chapter 6 of this thesis.
Physisorption, on the other hand, utilizes attractive van der Waals forces or entropic forces
to immobilize small molecules on surfaces. These forces are most often charge-charge
interactions56-58 and π- π interactions.54-55 These attachment methods are often less robust
compared to covalent attachment methods, resulting in loss of catalyst from the surface over time.
Physisorption, however, often has the advantage of requiring fewer synthetic steps than covalent
attachment. For example, the physisorbed systems described in Chapters 3 and 4 of this thesis
require no synthesis for the surface attachment.

11
Catalyst Electrodea linkage type
overpotential
(mV)
surface
coverage (mol
cm-2) TOF (s-1) TON (time) pH Reference
Nickel
bis(diphosphine) MWCNT covalent 300 b 1.5x10⁻⁹ 5.6 c 1x10⁵ (10 hr) - 59
Nickel
bis(diphosphine) MWCNT noncovalent ~ 0 2x10⁻⁹ 3.9 d 8.5x10⁴ (6 hr) 0.3 60
Rhodium complex carbon black noncovalent 350 2.6x10⁻⁹ 0.95 e 206 (1.25 hr) 1.9 61
1D Cobalt dithiolene glassy carbon noncovalent ~ 500 5x10⁻⁷ - f 1.3 62
Cobaloxime MWCNT covalent 350 4.5x10⁻⁹ 2.2 g 5.5x10⁴ (7 hr) 4.5 63
Cobaloxime Mesoporous
ITO covalent 300 1.5x10⁻⁷ - - 7 64
Hydrogenase HOPG covalent 800 - - h 1 65
Cobalt clathrochelate glassy carbon covalent 800 - - - 1 66
Cobalt corrole CNT covalent 800 j - 99 k (10 hr) 14 67
W2O2(µ-S)2(S2)
(S4)]2–
glassy carbon noncovalent 227 l - 93 m 0 68
Cobalt bis(dichloro-
benzenedithiolate) HOPG noncovalent 590 2.6x10⁻¹⁰ 320 i 9.1x10⁶ (8hr) 0.3 69
a MWCNT = multi-walled carbon nanotubes; ITO = indium tin oxide; HOPG = highly ordered pyrolytic graphite; CNT = carbon nanotubes. b potential required
to produce 4 mA cm-2. c at -0.5 V. d at -0.3 V. e at 2 mA cm-2. f low stability due to delamination. g at -0.59 V. h very low stability. i averaged over 8 hr electrolysis. j at a current of 12.1 mA μg-1. k no change in current over 10 hrs. l at a current of 10 mA cm-2. m stability tested by cycling, no change after 1000 cycles.
Table 1.1 Reported molecular proton reduction catalysts immobilized on inert electrodes.

12
Catalyst semiconductor linkage type
onset potential
(mV)
surface coverage
(mol cm-2) Stability pH
Illumination
(mW cm-2) Reference
nickel
phosphine Si (111) covalent -60 a 2.5x10⁻¹⁰ - 1 33 d 70
Mo3S4 Si pillars noncovalent 150 b - > 60 min
electrolysis 0 28.3 e 71
Fe2S2(CO)6 InP nanocrystals noncovalent > 250 b - - 7 f 72
Cobaloxime GaP covalent 240 c 11x10-9 > 60 min
electrolysis 7 100 73
1D Cobalt
dithiolene Si noncovalent ~200 5x10⁻⁷ > 20 min
electrolysis 1.3 1 sun 62
a vs NHE. b vs SHE. c vs RHE. d LED white light. e red light, λ > 620 nm. f 395 nm diode (no intensity given).
Table 1.2 Reported molecular proton reduction catalysts immobilized on semiconductor photocathodes under illumination.
13
It is important to note that for both covalent and noncovalent immobilization methods listed
in Table 1.1, carbon materials comprise the majority of electrode surfaces used. This is
representative of literature reports of small molecule immobilization on electrode surfaces,
suggesting that immobilization on carbon materials is more well-understood than immobilization
on any other electrode material.
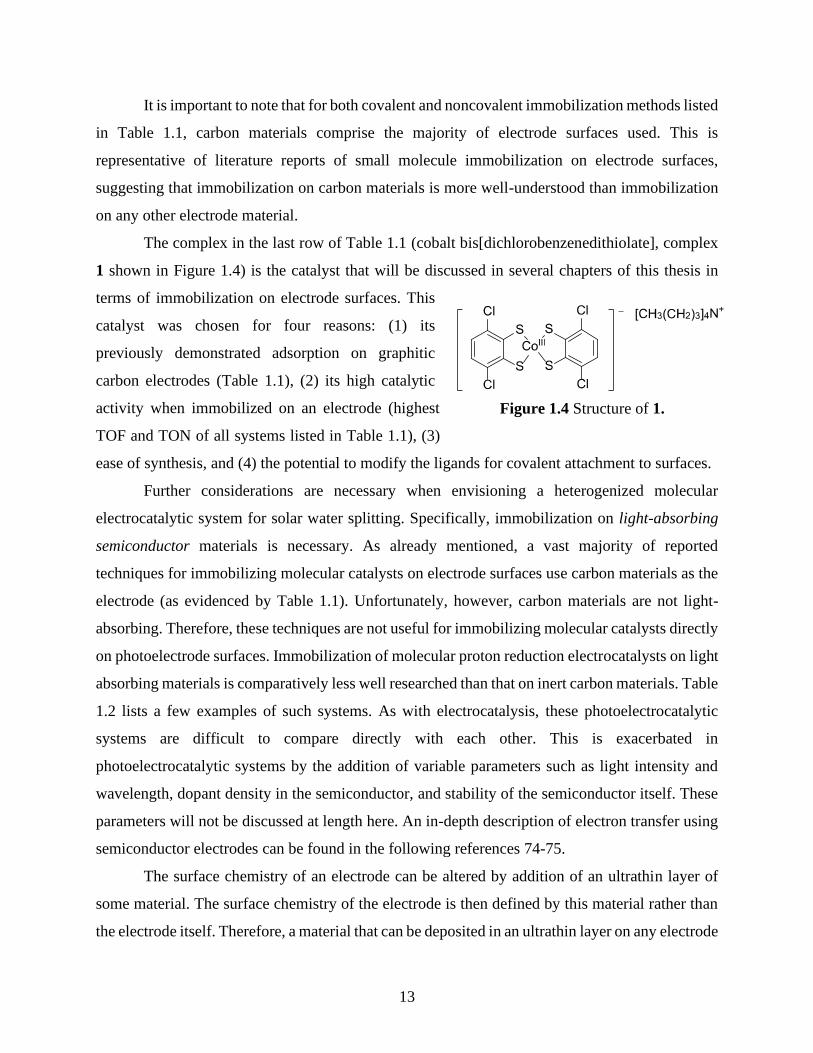
The complex in the last row of Table 1.1 (cobalt bis[dichlorobenzenedithiolate], complex
1 shown in Figure 1.4) is the catalyst that will be discussed in several chapters of this thesis in
terms of immobilization on electrode surfaces. This
catalyst was chosen for four reasons: (1) its
previously demonstrated adsorption on graphitic
carbon electrodes (Table 1.1), (2) its high catalytic
activity when immobilized on an electrode (highest
TOF and TON of all systems listed in Table 1.1), (3)
ease of synthesis, and (4) the potential to modify the ligands for covalent attachment to surfaces.
Further considerations are necessary when envisioning a heterogenized molecular
electrocatalytic system for solar water splitting. Specifically, immobilization on light-absorbing
semiconductor materials is necessary. As already mentioned, a vast majority of reported
techniques for immobilizing molecular catalysts on electrode surfaces use carbon materials as the
electrode (as evidenced by Table 1.1). Unfortunately, however, carbon materials are not light-
absorbing. Therefore, these techniques are not useful for immobilizing molecular catalysts directly
on photoelectrode surfaces. Immobilization of molecular proton reduction electrocatalysts on light
absorbing materials is comparatively less well researched than that on inert carbon materials. Table
1.2 lists a few examples of such systems. As with electrocatalysis, these photoelectrocatalytic
systems are difficult to compare directly with each other. This is exacerbated in
photoelectrocatalytic systems by the addition of variable parameters such as light intensity and
wavelength, dopant density in the semiconductor, and stability of the semiconductor itself. These
parameters will not be discussed at length here. An in-depth description of electron transfer using
semiconductor electrodes can be found in the following references 74-75.
The surface chemistry of an electrode can be altered by addition of an ultrathin layer of
some material. The surface chemistry of the electrode is then defined by this material rather than
the electrode itself. Therefore, a material that can be deposited in an ultrathin layer on any electrode
Figure 1.4 Structure of 1.

14
regardless of the identity of the electrode allows for universal immobilization chemistry on
electrode surfaces. Because there is such a large pool of research that has already been devoted to
immobilization methods on graphitic carbon, thin films of graphitic carbon on photoelectrode
surfaces are highly desirable. The requirements for such a material are threefold: (1) high optical
transparency to allow light absorption by the underlying semiconductor, (2) electrical conductivity
to allow transfer of electrons between the semiconductor and the catalyst at the surface, and (3) a
well-defined and consistent surface chemistry allowing for immobilization of small molecules.
The development of graphene-like films on electrode surfaces for the immobilization of small
molecules is a major focus of this thesis. An additional benefit of graphene modification of
semiconductors surfaces lies in its ability to passivate the surface (i.e. protect against corrosion).43,
76-77
1.4 Reduced graphene oxide.
Graphene is a 2D material (1 atom thick), consisting of an extended aromatic network of
carbon. Because of the aromaticity, it is electronically conductive, and because of its thinness it is
highly optically transparent. Graphene is generally fabricated by CVD methods78 or by exfoliation
from graphite, as in the “scotch tape method”.79 These methods, however, are not amenable to
fabricating large area sheets of graphene. CVD is energy intensive and graphite exfoliation results
in flakes of graphene up to only millimeters in diameter.
Reduced graphene oxide (RGO, sometimes called rGO) is a graphene-like material that
will be discussed in depth here. RGO has three major advantages over pristine graphene: (1) it is
easily and cheaply synthesized from graphite through solution methods; (2) films can be cast from
a solution-processable precursor, allowing for facile, controllable, and low-cost deposition of thin
films; and (3) RGO has a large variety of surface oxygen functional groups, allowing for a range
of methods for grafting small molecules to the surface. The structures of graphene and RGO are
shown in Figure 1.5. Graphene is a single, large-area sheet of aromatic carbon, whereas RGO is
made up of smaller sheets of partially oxidized aromatic carbon.

15
Figure 1.5 Structures of graphene (left) and RGO (right).
RGO is fabricated in four steps. This process is shown in Figure 1.6. The first step consists
of oxidizing graphite flakes using strong oxidants, such as sulfuric acid combined with KMnO4.80
This creates a material known as graphite oxide, which retains the honeycomb molecular structure
of graphite but not the aromaticity. Graphite oxide, therefore, is not electrically conductive.
However, because of the oxygen groups created during the oxidation process, it is a hydrophilic
material and can be exfoliated and suspended in water and some other polar protic solvents. This
exfoliated, oxidized material is termed graphene oxide (GO). Suspensions of GO can be cast as
thin films on a variety of surfaces by methods including dropcasting, spincasting, spray pyrolysis,
Langmuir-Blodgett, and others.81-84 Once these films are cast, they can be reduced to RGO and in
doing so, the aromatic network, and thereby the electrical conductivity, is restored.
RGO is useful for surface modification both through covalent grafting and physisorption.
The former is achievable because of the variety of oxygen functional groups that remain even after
reduction of GO. These groups consist largely of epoxides and hydroxides with smaller amounts
of carbonyls and esters. This variety of functional groups allows for many different routes of
grafting small molecules to RGO materials. For example, there are several reports on grafting to
RGO through amide linkages85-87 and amine attack at epoxide groups.88-90 Additionally, RGO is
useful for physisorption of small molecules because it can participate in π-stacking interactions.
Small molecules containing a π-system that can lay flat on the RGO surface will spontaneously
adsorb to that surface. Some molecular electrocatalysts like porphyrin complexes inherently

16
contain these flat π-systems, and some must be modified with something like a pyrene “foot” that
can dangle off the catalyst and adsorb to the RGO surface.60, 91-92
Figure 1.6 Scheme showing the synthetic steps to obtain RGO from graphite powder. Double
bonds are omitted for the sake of clarity.
Several different oxidation methods have been used to produce GO from graphite powder,
the most common being the named Hummers, Hofmann, and Staudenmaier methods.80, 93-95 Each
of these oxidation methods produce graphene oxide with slightly different chemical and structural
properties. Even more varied, however, are the reduction methods published to date, which in turn
produce chemically, structurally, and electronically varied RGO.96-98 For this reason, it is
extremely important to have well-understood methods for the characterization of RGO. Chapter 2
of this thesis describes a new method for the fabrication of thin films of RGO and the
characterization of that RGO. Here I discuss the methods commonly used to characterize RGO
and other graphitic materials.
X-ray photoelectron spectroscopy (XPS) is an important surface characterization method
used to determine the chemical composition of graphitic materials. The C 1s and the O 1s peaks
can be deconvoluted to give information on the types and relative quantities of different carbon
and oxygen functional groups within the material. Using the O 1s peak to obtain this information,

17
Figure 1.7 Sample set of XP C1s spectra of GO (top), RGO (middle), and graphite (bottom) that
have been fitted with a series of Gaussian-Lorentzian peaks.
however, can be complicated by the presence of water within the material. Since RGO is fabricated
through oxidation of graphite in an aqueous mixture and GO is hydrophilic and often suspended
in water prior to reduction to RGO, residual water trapped in the RGO matrix can make up a large
portion of the O 1s signal. The C 1s signal, however, is less ambiguous. A sample set of XP C1s
spectra are shown in Figure 1.7. These spectra have been fitted with a series of peaks. The peaks
correspond to the functional groups labeled in the figure. As can be seen, graphite is almost entirely
sp2 carbon, as expected, while GO has large quantities of C-O functional groups. RGO contains
an intermediate level of C-O functionalities. The graphitic C=C peak is fitted with an asymmetric
function. The asymmetry of this peak is due low energy π* → π transitions, known as shake-up
satellites, that occur when an electron is ejected and a hole is left behind within the π-system of
the graphitic structure.99-100 Each other type of carbon functionality can be fitted with a symmetric
18
Gaussian-Lorentzian product. Because these functionalities are not part of the π-system their
excitations do not produce shake-up satellites.
Importantly, fitted C1s XP not only give information on the total C-O content of graphitic
materials but also the relative amounts of each type of C-O functionality. For example, from the
data shown in Figure 1.7, it is apparent that the reduction method used here (that is the CoCp2/TFA
solution described in Chapter 2) greatly reduces the amount of C-OH and C-O-C groups while
having limited effect on the O-C=O (carboxylate) groups. Having this kind of information can
help understand the mechanism of GO reduction, allowing for better control of that reduction. It
can also help better understand the wetting of RGO in different solvents, the acidity of RGO, and
the ability of RGO to undergo different types of covalent grafting procedures, among other things.
Raman spectroscopy is another useful tool for probing the structure of graphitic materials.
Dresselhaus et al. give an in-depth description of the origin of Raman bands for single- and multi-
layer graphene and graphite.101-102 The four most distinctive Raman bands produced by graphitic
carbon are termed the D, G, D’, and G’ (also called 2D or D*) bands and show up around 1300,
1580, 1620, and 2600 cm-1, respectively. In Figure 1.8, sample spectra of GO, RGO, and graphite
are shown and the D, G, and G’ peaks are labeled. In this case, the G and D’ peaks overlap forming
a single broad band identified simply as the G peak. The pure G band is so named because it is the
only first-order Raman mode of graphitic carbon. It arises from the E2g stretching of the graphitic
matrix (i.e. sp2 carbon stretches). In graphene and highly ordered graphite, this is by far the most
intense band. The D and D’ bands are considered defect bands. They arise from sp3 carbon
stretching. The D band has sometimes been explained as the symmetric A1g stretching mode, which
becomes Raman-active as the symmetry of the graphitic network is broken.103 The G’ band is an
overtone of the D band (for this reason, some researchers call it the 2D or D* band). It should be
noted that both the D and G’ bands exhibit frequencies that are dependent on the laser excitation
frequency because they arise from a double resonant process. Specifically, resonance selectively
intensifies different modes from a set of modes depending on the wavelength of excitation.104
Because the G peak arises from perfect graphitic carbon and the D peak arises from
defective graphitic carbon, the relative intensities of these two peaks can give information on the
level of defects within the graphitic material. Specifically, the ID/IG ratio is inversely proportional
to crystallite size and can be used to calculate the average crystallite size (that is, the average radius
of defect-free graphitic regions).103, 105 However, this relationship is only valid when the

19
crystallites are > 3 nm. For materials with smaller crystallites, the relationship has a more complex
dependence on crystallite size.106-107 Furthermore, because the G and D’ bands are so close in
frequency, they often overlap (as is the case in Figure 1.8) and present as a single broadened peak,
usually still called the G peak. Therefore, the position and FWHM of this G peak can also give
information on the relative defect density of graphitic materials. For example, the G peak in Figure
1.8 occurs at slightly different wavenumbers in GO (~1606 cm-1) and RGO (1597 cm-1) and with
a slightly narrower FWHM in RGO compared to GO.
Figure 1.8 Sample Raman spectra of GO (top), RGO (middle), and graphite (bottom). The D, G,
and G’ bands are indicated. A 785 nm Raman laser excitation was used to collect these spectra.
Attempts to deconvolute the G, D, and G’ peaks have been presented in the literature.
Deconvolution of the G peak is fairly straightforward as it is comprised mainly of the pure G peak
and the D’ peak. These can be fitted with Lorentzian functions.108 Some reports have also
attempted to deconvolute the D band using a set of Lorentzian functions;106, 108-112 however, the
physical origins of the peaks that comprise the D band are poorly understood, so these fittings vary

20
considerably. Lastly, the G’ band can give information on stacking defects in highly ordered
materials such as few-layer graphene or HOPG (highly ordered pyrolytic graphite). Dresselhaus
et al. have shown fittings of the G’ peak for few-layer graphene and highly ordered graphite.101 In
low order materials like graphite and RGO, the G’ band appears as a broad peak, and in extremely
low order materials, like GO, the G’ band disappears altogether.113-114 The effect of G’ peak
broadening and disappearance can be seen in the spectra in Figure 1.8.
Other commonly used methods to characterize graphitic materials include atomic force
microscopy (AFM) and electrical resistance measurements. The former is an imaging technique
that generally has resolution down to 1 nm, and in some cases atomic resolution115. Single RGO
sheets can be imaged using this technique (Figure 1.9a) or for thicker RGO films, surface
morphology, roughness, and thickness can be obtained (Figure 1.9b). Conductive AFM can be
used to determine the sheet resistance of RGO,116-117 but when this technique is not available, four-
point probe measurements are commonly used to measure sheet resistance.118-121
Figure 1.9 Sample AFM images of (a) individual sheets of GO and (b) a thicker film of RGO on
silicon wafer surfaces.
Many other methods are available for the characterization of RGO materials. These
methods include but are not limited to transmission and scanning transmission electron microscopy
(TEM and STEM),122-126 scanning tunneling microscopy (STM),127-129 infrared absorbance (IR)
spectroscopy,123, 130-132 x-ray diffraction (XRD),121-123, 125-126, 133 thermogravimetric analysis
(TGA),122, 126, 134-135 UV-visible absorbance spectroscopy,122, 124-125, 134 and NMR spectroscopy.120,
126 Because these methods were not used extensively in this thesis, they are not discussed in depth
here; however, examples of their usage for the characterization of RGO and related materials can
be found in the listed references.

21
1.6 Other redox species for electrochemical energy storage
As mentioned previously in Section 1.1, a major hurdle in the implementation of hydrogen
as a fuel is the difficulty of storage and transportation. Gaseous fuels have low energy density
unless compressed, but compression requires an energy cost. Furthermore, H2 leakage from sealed
containers is rapid compared with larger molecules, and hydrogen is explosive when mixed with
oxygen. For these reasons, research into alternative redox species for energy storage is important.
Organic redox species have the benefit of being relatively cheap and non-toxic with a high energy
density compared to metal-based species. In particular, viologens (bipyridine derivatives) have
received significant attention, especially in the redox flow battery community. These compounds
have extremely fast charge transfer rate constants, high reversibility, and long charge-discharge
cycling lifetimes. Furthermore, they are highly water soluble and easy to derivatize. A
disadvantage of viologens is the reactivity of the reduced radical forms with oxygen, which is a
major factor in the shelf-life of these species.
Figure 1.10 Encapsulation of methyl viologen radicals by cucurbit[7]uril (left) and cucurbit[8]uril
(right).
Little research has been published on slowing the kinetics of viologen radical reaction with
O2; however, some reports have manipulated the thermodynamics of viologen radicals. Most of
these involve encapsulation inside cage molecules or structures, i.e. host-guest complexation.
Molecular encapsulation, or host-guest chemistry, occurs when a large molecule (the host
molecule) contains a cavity into which a smaller molecule (the guest molecule) can insert. The
insertion is non-covalent, driven by van der Waals forces or entropy. Viologen molecules have
been studied primarily as guest molecules using cucurbiturils, cyclodextrins, and

22
sulfonatocalixarenes.136-142 For example, Figure 1.10 shows encapsulation of methyl viologen
radicals inside two different cucurbituril cage molecules: cucurbit[7]uril and cucurbit[8]uril (the
numbers 7 and 8 indicate the number of monomers that make up the cucurbituril ring). A single
viologen radical molecule can be encapsulated inside cucurbit[7]uril in water. This encapsulation
destabilizes the radical by preventing it from pairing with other radicals in solution. The
destabilization effect was shown by a negative shift in the reversible electrochemical reduction
potential of methyl viologen.143 On the other hand, encapsulation of two viologen radical
molecules is possible inside the larger cucurbit[8]uril and this leads to stabilization of the radicals
by facilitating pairing.142-143
1.7 Scope of thesis
This thesis can be divided into two separate objectives. The first is the development of
RGO thin films and their use for immobilizing a molecular hydrogen evolution electrocatalyst on
electrodes for heterogeneous electrocatalysis. The second is the investigation of host-guest
complexation between viologen derivatives and cucurbiturils, its effects on viologen reaction with
dissolved oxygen, and its implications for long-term storage of reduced viologen solutions.
Chapter 2 discusses a method for fabricating RGO thin films on a variety of surfaces. This
method is exceedingly gentle and results in highly reduced, smooth RGO films of controllable
thickness. The reduction method is the first published method that uses outer-sphere reductants
(cobaltocene derivatives). The films produced by this method are used to adsorb a molecular,
redox-active dye to electrodes and are shown to facilitate charge transfer to this molecule.
Chapter 3 investigates the immobilization of the molecular proton reduction catalyst 1
(Figure 1.2) to graphitic thin films on electrode surfaces. Data are presented on three types of
graphitic materials: the RGO developed in Chapter 2, commercial single layer graphene, and
multiwalled carbon nanotubes (MWCNT). The data show initial adsorption of the catalyst to all
three graphitic surfaces, but retention of the physisorbed catalyst was low under turnover
conditions except when using an ultra-rough surface. The reason for this was hypothesized to be
catalyst intercalation on rough surfaces.
Chapter 4 presents kinetic considerations of proton reduction in an electrocatalytic thin
film. The film is composed of RGO with 1 embedded among the graphitic layers. The films were
prepared by dropcasting mixtures of GO and 1 followed by electrochemical reduction. By

23
controlling the thickness of the film and the quantity of 1, kinetic limitations were determined from
cyclic voltammetric data.
Chapter 5 describes the interactions of two bis-viologen derivatives with cucurbit[7]uril
(CB[7]) and cucurbit[8]uril (CB[8]) in solution. Both cucurbiturils have high binding constants
with both viologens. However, it is shown that CB[7] thermodynamically destabilizes the
reduction of both viologens, whereas CB[8] stabilizes them. Furthermore, the first 2-electron
reduction of each viologen is split into two 1-electron reductions in the presence of CB[8]. The
singly reduced viologen was isolated and is shown to be a unique mono-radical bis-viologen
species that has not been observed in solution except in the case of the “blue box molecule” (a
cyclic bis-viologen derivative). This mono-radical viologen complexed with CB[8] is shown here
to be significantly stabilized against reaction with dissolved oxygen.
Finally, Chapter 6 discusses preliminary data on five separate fronts and lists future
experiments that should be conducted on these projects. These include (1) three methods for
covalently grafting small molecules to RGO thin films. These methods can be used to graft a
derivative of 1 to electrode surfaces, further improving retention time; (2) in situ XANES data on
1 physisorbed to carbon paper electrodes in neutral and acidic solutions under applied potential;
(3) the use of RGO thin films on gallium phosphide photocathodes to immobilize 1 for
heterogeneous photoelectrocatalytic proton reduction; (4) passivation of silicon photoanodes
against oxidative corrosion using RGO thin films; and (5) the formation of self-assembled
graphene oxide monolayers on silicon oxide surfaces.
24
Adapted from ACS Applied Materials and Interfaces, Vol. 10, “Reduction of Graphene Oxide
Thin Films by Cobaltocene and Decamethylcobaltocene,” MacInnes, M. M.; Hlynchuk, S.;
Acharya, S.; Lehnert, N.; Maldonado, S. 2004-2015, Copyright 2018.
2.1 Introduction
Thin films of reduced graphene oxide (RGO) are attractive for chemically stable and
optically transparent coatings with low electrical resistance.144-146 Preparation of thin films of RGO
typically involves first the chemical oxidation of graphite to form graphene oxide (GO)
suspensions, followed by the casting of GO as a thin film, and finally reductive treatment of the
thin film to form RGO.96-97, 126
To date three main methods for the reduction of GO thin films to RGO have been
investigated.97 Electrochemical reduction of GO thin films or electrodeposition of suspended GO
particles can be used to form RGO films on electrode surfaces.147-153 Applied potentials more
negative than E = -0.6 V vs. the standard hydrogen electrode (SHE) are generally required to obtain
RGO films by this method. The probability that these films incorporate species from the electrolyte
is high.154-155 In addition, this method is limited only to conductive materials that can serve as
electrodes under extreme cathodic potentials. A second method to prepare RGO films is thermal
annealing of cast GO films in either a vacuum, inert atmosphere, or reducing atmosphere.97, 156-163
The extent of reductive conversion depends strongly on the atmosphere, time, and temperature.
Typically, temperatures in excess of 700°C are required, with some researchers recommending
temperatures upwards of 1000°C.157, 162-163 This methodology necessarily eliminates the possibility
of substrates that cannot withstand such temperatures. A third route is the chemical conversion of
GO films to RGO films by reaction with a molecular reductant. A variety of molecular reducing
reagents (Table 2.1), including hydrazine, hydroiodic acid, carbohydrates and metal hydrides, have
been described.96, 120-121, 123-126, 130, 134-135, 157, 164-178 However, these reagents can unintentionally
load the RGO films with heteroatoms (e.g. nitrogen, boron, or iodine)96, 121, 168 generate gaseous
Chapter 2. Reduction of Graphene Oxide Thin Films by Cobaltocene and
Decamethylcobaltocene

25
byproducts (e.g. N2 and H2) which can perturb the film structure, can be destructive/corrosive to
certain substrate materials, and reduce graphene oxide to varying degrees. Other possible methods
of reduction include irradiation179 and plasma treatment180, which each have the potential to
damage the substrate material.
Reduction method Sheet Conductivity (S m-1 x10⁴) Reference
Chemical reductions
Hydrazine monohydrate 0.02 169
Hydrazine monohydrate 1.6 170
Phenylhydrazine 0.47 134
Hydrazine vapor/annealing at 400°C 1.0 157
NaBH4 0.082 120
NaBH4/H2SO4/annealing at 1100°C 2.02 120
LiAlH <0.01 172
HI 2.98 121
HI/AcOH 3.04 126
HI/AcOH vapor 0.785 126
Malonic acid 0.044 125
Lawesson’s Reagent 0.476 173
Lawesson’s Reagent/300°C anneal under H2 3.09 173
NH3BH3 2.03 135
Thiourea dioxide/NaOH/cholate 0.3205 123
Hydroxylamine/NH3 0.1122 174
p-phenylene diamine 1.5 175
Isopropyl alcohol 0.1019 130
Benzyl alcohol 0.46 130
L-ascorbic acid 0.08 124
L-ascorbic acid/NH3 0.77 176
NaHSO3 0.65 177
Na2S2O4/NaOH 0.1377 178
Electrochemical Reductions
Electrochemical (-1.3 V vs SCE) 9.0 152
Electrochemical (-0.9 V vs Ag/AgCl) 0.85 147
Other Methods of Reduction
Methane plasma 15.9 180
Annealing at 1100°C in vacuum 10 157
Annealing at 1000°C under Ar 8.71 162
UV-irradiation under high vacuum 0.000075 179
Table 2.1 Reported methods for the preparation of reduced graphene oxide and the resulting
conductivities

26
Although isolated reports have demonstrated the interaction between graphene oxide and
an electrochemically generated reductant (e.g. methyl viologen radical),181 a simple and
surprisingly unexplored strategy for producing RGO films is the immersion of GO films in a
solution of outer-sphere reductant. Metallocenes are a useful class of outer-sphere reductants.
Although metallocene adsorption on nanostructured graphitic carbons has been pursued
previously,182-184 metallocenes have not yet been explored for the reduction of graphene oxide.
Cobaltocene (CoCp2) is one possible reductant which has a very negative standard potential (E0 =
-0.93 V vs NHE) that ought to facilitate spontaneous injection of e- into GO and has long been
used as a 'clean', one-electron chemical reductant in the synthesis of various inorganic and organic
compounds.185 The permethylated form, decamethylcobaltocene (CoCp*2), is an even stronger
reducing agent (E0 = -1.54 V vs NHE). Both metallocenes have large self-exchange reaction rates
and small reorganization energies for oxidation to the respective metallocenium states,186-187
further underscoring their ability to rapidly transfer electrons without substantial bond
lengthening/shortening or bond breaking/forming.
Cobaltocene is also interesting since it forms adducts with weak acids when dissolved in
aprotic organic solvents. The identity of this adduct is debated, however, and has not received
much attention in recent literature.188-190 Thus, the reaction of GO with cobaltocene both in the
presence and absence of a weak acid like trifluoroacetic acid (pKa = 12.65 in acetonitrile)191
presents a separate test of whether the reducing strength of the reagent and the availability of
protons during reduction imparts a perceptible difference in the resultant RGO films, as suggested
by other groups.96
Accordingly, in this work, we present data describing the separate reactions of cobaltocene
and decamethylcobaltocene with thin GO films, both in the presence and absence of organic acids.
This report is the first study to utilize outer-sphere reductants, affording a simpler route to reduce
graphitic oxides. We present data that show conclusively that these reactions produce high quality
RGO films at room temperature without concomitant mechanical damage to the films or the
underlying substrate. Further, we present data that suggests the resultant electrical and chemical
properties of the films reduced by the different metallocenes are not equivalent, suggesting it may
be possible to produce intentionally RGO films with specific electrical and physicochemical
properties.

27
2.2 Experimental.
Chemicals and Materials. Decamethylcobaltocene (Sigma Aldrich), cobaltocenium
hexafluorophosphate (98%, Sigma Aldrich), trifluoroacetic acid (TFA, 99%, Sigma Aldrich),
methanol (99.9%, Fisher Scientific) hydrogen peroxide (30% in H2O, Sigma Aldrich),
hydrochloric acid (37%, Sigma Aldrich), sulfuric acid (ACS grade, Fisher Scientific Education),
tetrabutylammonium perchlorate (G. Frederick Smith Chemical Company), ferrocene (98%, Acros
Organics), aminotriethyoxysilane (98%, Sigma Aldrich), toluene (anhydrous, 99.8%, Sigma
Aldrich), crystal violet (Sigma Aldrich), hydriodic acid (47-51%, J.T. Baker Chemical Co.),
indium foil (99.99%, Aldrich), and potassium permanganate (98%, Acros) were used as received.
Cobaltocene (Sigma Aldrich) was purified by sublimation at T = 80°C. Acetonitrile (99.9%, Fisher
Scientific) and dichloromethane (99.9%, Fisher Scientific) were distilled and subjected to three
freeze-pump-thaw cycles before glovebox use; otherwise solvents were used as received. Graphite
flakes (-20+84 mesh, Johnson Matthey) was used as the carbon source for graphene oxide
suspensions and for the XPS graphite standard. Water with a resistivity >18.2 MΩ (Nanopure
Barnstead Water Purification) was used throughout.
Polished Si(111) wafers from Wafer Works doped with As (≤0.006 Ω cm-1) were used as
substrates for Raman and XPS measurements. Glass microscope slides from Fischer Scientific
were used as substrates for UV/vis and conductivity measurements. Fluorine-doped tin oxide
(FTO) coated glass from MTI Corporation (2 mm thick, 12-14 Ω sq-1) was used for electrochemical
measurements. Si wafers, glass slides, and FTO substrates were degreased using a sequence of
water, methanol, and acetone, sonicating for ten minutes in each solvent. Glass and FTO were also
etched with oxygen plasma (Plasma Etch, PE-50) for 5 minutes. Glassy carbon substrates were
prepared by first polishing with alumina (1 μm, 0.3 μm, and 0.05 μm alumina suspensions) on felt
and then soaking in isopropanol for 30 minutes. Indium thin film substrates were prepared by
evaporating 600 nm of indium foil onto degreased glass microscope slides.
Preparation of graphene oxide suspensions. A modified Hummers method was used.192 A
4-mL aliquot of water was mixed with 46 mL of concentrated H2SO4 and cooled to T = 0°C in an
acetone bath. After cooling, 1 g of graphite flakes was added and then 3 g KMnO4 was added
slowly over 1 hour. This suspension was stirred slowly for 48 hours at T = 0°C. Following, the
resultant mixture was a dark green, thick slurry. This suspension was then poured into 300 mL of
chilled water and stirred for another 10 minutes. An 8 mL aliquot of 30 % v/v H2O2(aq) was then
28
added to quench the reaction. The suspension was filtered with P5 filter paper from Fisher
Scientific and the collected materials were re-suspended in 1:9 v/v concentrated HCl:H2O. This
suspension was then filtered again and re-suspended a total of three times. The wet filtered product
was then suspended in pristine water and subjected to dialysis (10,000 g mol-1 weight limit) for 2
days. The resultant suspension was then stored in a flask on the benchtop for up to several months.
Preparation of reduced graphene oxide films. A small volume of the graphene oxide
suspension was removed and sonicated for 20 minutes to exfoliate and disperse fully individual
graphene oxide sheets. This volume was then centrifuged at 9000 rpm for 30 minutes. The yellow
supernatant was removed and diluted to approximately 1 mg mL-1. The diluted suspension was
then dropcast onto the substrate of choice and allowed to air dry. To obtain uniform films for
transmittance measurements, GO suspensions were cast on functionalized glass microscope slides.
The glass was first functionalized with aminotriethoxysilane (APTES) by immersion in a 1%
APTES solution in dry toluene for 24 hours followed by thorough rinsing with toluene. The GO
suspension was first diluted with ethanol (3:1 ethanol:water) and was then spin casted on the
functionalized glass surfaces at 300 rpm for 1 minute followed by 3000 rpm for 3 minutes. This
procedure tended to yield films with thicknesses ~ 1 x 10⁻⁸ m. Both drop cast and spin cast GO
films were then reduced by immersion in solutions containing either 15 mM CoCp2 in acetonitrile
or 15 mM CoCp*2 in dichloromethane under a dry N2 atmosphere inside a glove box for 30 min at
room temperature. In some experiments, a molar equivalent (with respect to CoCp2) of TFA was
added to the cobaltocene solution before immersion of the graphene oxide film. Longer times and
higher temperatures did not demonstrate change to any reported observable. Following immersion,
the films were removed from the glovebox and rinsed with solvent. These films were allowed to
air dry under ambient conditions for at least one day before conducting four-point probe
measurements. GO thin films on paper and indium metal substrates were also reduced by
immersion in HI acid to compare with the reduction methods described here. These samples were
immersed in a 50% v/v solution of HI acid, then removed, and finally rinsed thoroughly with water.
Conductivity measurements Two-point probe measurements were performed by painting
two ~1 mm diameter spots of silver print (Sliver Print II from GC Electronics) separated by 2 mm
on the surface of the films deposited on glass slides. Resistance measurements were performed
with a TP4000ZC TekPower multimeter (input impedance = > 40 MΩ). Separate samples for four-
point probe measurements were prepared by sputtering gold contacts onto the surface of the films

29
using a poly(methyl methacrylate) shadow mask with a grid of 500 μm holes spaced by 950 μm.
The sheet resistances were measured using a Keithley 4200 semiconductor parameter analyzer and
an Alessi probe station, with the current sourced through the outer two terminals and the voltage
drop measured across the inner two terminals. Conductivity values were calculated using
thicknesses measured by atomic force microscopy (Figure 2.1). All films for electrical
measurements had thickness ~ 3 x 10⁻⁸ m. For more precise measurements, a four-point probe
apparatus (Miller FPP-5000) was also used to measure the sheet resistances for these thin films.
Figure 2.1 Atomic force microscopy (AFM) images and height profiles of representative GO and
RGO films used for four-point probe resistivity measurements. AFM image of (a) a GO film on
glass, (c) a GO film treated with cobaltocene & TFA on glass, (e) a GO film treated with
decamethylcobaltocene on glass, and (g) a GO film treated with just TFA on glass. Height profiles
along the lines denoted as 1 are shown in (b), (d), (f), and (h), respectively. Scale bars: 2 μm.
X-ray photoelectron spectroscopy. X-ray photoelectron (XP) spectra were acquired with a
PHI 5400 analyzer using an unmonochromated Al Kα (1486.6 eV) source. Spectra were recorded
without charge neutralization at a base pressure of <2.5×10⁻⁹ Torr. A 6 mA emission current and
10 kV anode HT was used. Survey scans were acquired at a pass energy of 117.40 eV. High-
resolution XP spectra were recorded at a pass energy of 23.5 eV. Each collected C1s spectra was
an average of 100 high resolution scans.
0 5 10 15 200
20
40
60
80
Hei
gh
t/n
m
Lateral Distance /mm
0 2 4 6 8 10 12 14
20
30
40
50
60
Lateral Distance /mm
Hei
gh
t/n
m
0 2 4 6 80
10
20
30
40
Lateral Distance /mm
Hei
gh
t/n
m
68 nm
0
20
3040
50
60
10
64 nm
0
20
30
40
50
10
68 nm
0
20
3040
50
60
10
a) b)
c) d)
e) f)
Hei
gh
t/n
m
0 2 4 6 8Lateral Distance /mm
20
30
40
50
60h)78 nm
0
20304050
60
10
g)

30
The C1s spectra were analyzed and fit with the following approach. A C1s spectrum for a
pristine graphite flake (Johnson Matthey) was collected. This spectrum was fit with a total of five
peaks. The lowest binding energy peak was assumed to correspond to the emitted electrons from
carbon atoms involved in the aromatic network of graphite. The peak width and asymmetric tail
of this peak were assessed through least-squares fitting and determined to be an asymmetric
Gaussian-Lorentzian product function described by the text string “A(0.4,0.38,20)GL(80)” (fit in
CasaXPS software) with a peak width of 1.216 eV. The other four peaks at higher binding energies
were assumed to have symmetric shapes (i.e. these emitted electrons came from carbon atoms not
participating in the graphitic electron network) described by a 1:1 convolution of Gaussian and
Lorentzian functions and peak widths of 1.5-1.6 eV. The relative positions of all five peaks were
based on literature assignments for graphitic carbons and oxidized carbon-containing surface
groups193 followed by iterative fits of the spectra for the graphitic flake. The specific peak positions
used here yielded fits for the spectrum of the graphite flake sample with the lowest fitting residuals
and were not allowed to float in the fitting of the data for the thin films. A Shirley background
correction was then used for all collected spectra and the lowest energy peak (the asymmetric peak)
was calibrated to 284.6 eV in each spectrum.
Raman spectroscopy. Unpolarized Raman spectra were obtained using a Renishaw RM
series Raman microscope equipped with a Leica 50x (NA = 0.75) objective, with edge filters for
the 785 nm excitation line, in a backscattering geometry. A 785 nm diode laser was used as the
incident excitation source with a total radiant power of 1.12 mW over a 20 μm2 spot which was
collected for 30 seconds and averaged over 5 scans.
Energy dispersive x-ray spectroscopy. Energy dispersive x-ray spectroscopy (EDS)
mapping was performed at 5 kV with a PentaFET Precision x-act detector in a LEO 1455VP
scanning electron microscope. Films were deposited and treated on clean silicon wafer substrates.
UV-visible absorption spectroscopy. Solution UV-visible absorption experiments were
performed in 1 cm quartz cuvettes using an Analytik Jena Specord S600 spectrophotometer. Solid
state UV-visible absorption experiments were performed with a Varian Carey 5000 UV-vis-NIR
spectrophotometer. Adsorption of crystal violet was performed by immersion of the RGO films on
glass in a 50 mM solution of crystal violet in methanol and then rinsing with neat methanol. Spectra
represent the absorption of light through dye-loaded films relative to the respective RGO films on
glass before adsorption.

31
Electrochemical measurements. Electrochemical measurements were taken using a CH
Instruments 760C potentiostat. A three-electrode cell was used with a supporting electrolyte of
deaerated 0.1 M tetrabutylammonium perchlorate and 4 mM trifluoroacetic acid in acetonitrile. A
platinum mesh was used as the counter electrode and a Ag wire immersed in a AgNO3 solution in
a fritted compartment was used as a quasi-reference electrode. Absolute potentials were
determined by spiking the electrolyte with ferrocene and referencing potentials to the
ferrocene/ferricenium couple. Working electrodes were prepared by casting films on FTO-coated
glass electrodes.
2.3 Results.
Electrical Conductivity of Films. The reaction between metallocenes and graphene oxide
films all uniformly resulted in a perceptible color change in the films, as demonstrated in Figure
2.2a. On glass slides, the GO films generally showed a faint, pale yellow color before reduction.
The films darkened noticeably within the first 30 s of immersion, achieving a grey tint. Treatment
with just cobaltocene produced films with a very slight grey tint, whereas treatments with
cobaltocene & TFA and with decamethylcobaltocene produced films that were significantly
darker. The corresponding transmittance spectra of GO films before and after each treatment are
shown in Figure 2.2b.
Figure 2.2 a) Photograph of (1) a clean glass microscope slide; (2) a GO film deposited on a glass
slide; (3) a GO film on glass treated with cobaltocene; (4) a GO film on glass treated with
cobaltocene & TFA; and (5) a GO film on glass treated with decamethylcobaltocene. b)
Corresponding transmittance spectra of the films 2-5 in (a). Scale bar: 1 cm.
Treatment with cobaltocene alone minimally lowered the overall transmittance of the film from
that of untreated GO. Treatment with cobaltocene & TFA further lowered the transmittance, and
Tra
nsm
itta
nce
(%)
a)
b)
Wavelength /nm
1 2 3 4 5
23
4
5
300 400 500 600 700 800 900
40
60
80
100

32
treatment with decamethylcobaltocene produced the darkest films with the lowest transmittance.
These films were then measured by a two point probe method for determination of approximate
resistance. These values are listed in Table 2.2.
Resistance /Ω Conductivity /S m-1 a
Treatment Two-point probe
measurement Four-point probe
measurement
as-prepared GO 1010-1011 b 10.2 ± 0.4
after reaction with acid ≥1013 b,c --
after reaction with CoCp2 (3 ± 2) x 105 d --
after reaction with CoCp2 + acid (4 ± 2) x 103 d (1.2 ± 0.6) x 104 e
after reaction with CoCp*2
(3 ± 1) x 103 d (1.3 ± 0.3) x 104 e
after reaction with CoCp*2 + acid (1.8 ± 0.8) x 103 d --
a Calculated from sheet resistance using average thicknesses measured by AFM of 31 nm (GO films), 24 nm (films
treated with CoCp2 + acid), and 24 nm (films treated with CoCp*2). b 0.8 mm probe spacing was used for these
measurements. c Films were immersed in 15 mM TFA in acetonitrile in a glovebox for 30 min. d Two point-probe
measurements were performed with N = 20. e Four-point probe measurements were performed with N = 3.
Table 2.2 Resistance and conductivities of GO and RGO films prepared under different conditions,
measured by four-point probe.
Several points were clear from these data. First, in addition to a color change, all putative RGO
films showed a statistically relevant decrease in resistance relative to GO films. Second, the
resistance of the putative RGO films was decreased further when a proton source was used in
conjunction with cobaltocene to perform the reduction by almost a factor of 10-2. Although
addition of a molar equivalent of TFA to cobaltocene in acetonitrile turned the solution from dark
burgundy to dark orange, the absorption spectra indicated that the reaction between cobaltocene
and the acid was not stoichiometric, i.e. a large amount of cobaltocene remained unreacted (Figure
2.3). Control measurements where GO films were reacted with TFA solutions in acetonitrile did
not result in higher conductivities. Rather, exposure to only this TFA solution consistently
increased the measured resistance to a value that exceeded the input impedance of the measuring
apparatus, implying acid alone significantly lowered the film conductivity. Third, the presence of
a proton donor was not required to render even lower resistance, as immersion in solutions with

33
Figure 2.3 (Top) Absorption spectra of cobaltocene in acetonitrile before (black line) and after
(red line) addition of one molar equivalent of trifluoroacetic acid. (Bottom) Absorption spectra of
cobaltocenium in acetonitrile.
just decamethylcobaltocene showed the lowest resistance. Addition of TFA to these solutions did
not produced RGO films with any further decrease in resistance.
Since the reaction of GO films with solutions of either cobaltocene with TFA or just
decamethylcobaltocene yielded comparable resistance values, additional four point probe
resistance measurements were performed with these putative RGO films to obtain more precise
values. Conductivity values were extracted using thicknesses measured by AFM (Figure 2.1).
These data are also reported in Table 2.1.
X-Ray Photoelectron Spectroscopy. Figure 2.4 shows representative C1s X-ray
photoelectron spectra for a GO film, an RGO film prepared with a solution of cobaltocene, an
RGO film prepared with a solution of cobaltocene with TFA, and an RGO film prepared with a
solution of decamethylcobaltocene. A conservative fitting approach was adopted, where each
spectrum was fit as a linear combination of 5 different peaks (vide supra). The assignments for the
five peaks, from lowest to highest binding energy, followed the general conventions historically
employed in the XP analysis of graphitic carbons.193 These five peaks were ascribed to sp2 carbon
200 300 400 500 600 700
0.0
0.4
0.8
1.2
Abso
rban
ce
CoCp2PF6
200 300 400 500 600 700
0.0
0.4
0.8
1.2
Abso
rban
ce
CoCp2
CoCp2 + TFA (1:1)
Wavelength /nm
Wavelength /nm

34
participating in a large aromatic system (i.e. graphitic: 1), sp3 carbon bound only to other carbon
or hydrogen (2), sp3 carbon singly bound to one oxygen (i.e. alcohols and epoxides: 3), sp2 carbon
doubly bound to one oxygen (i.e. quinone, carbonyl: 4), and carbon bound to two oxygens (i.e.
carboxylate, ester: 5), respectively. The peak shapes, full widths at half maximum (fwhm), and
relative spacings used for fitting these peaks were determined from best fits of the C 1s spectrum
of a clean graphite flake sample. The asymmetric tailing for the graphitic peak (arising from
interaction of emitted core electrons with the conduction band)194 for this sample was used for the
peak shape of the first fitted peak.
Figure 2.4 Representative high-resolution C 1s X-ray photoelectron spectra of an as-cast GO film
and after 30 minute immersions in solutions of cobaltocene, cobaltocene & TFA, and
decamethylcobaltocene, respectively. Thin vertical dashed lines are guides for the eye indicating
the binding energies used for the five individual peaks (blue, purple, orange, green, and violet
lines) used to generate the fit (solid red line). The backgrounds used to generate the fits are shown
as thick dashed lines.

35
The results for the fitting analyses of the C 1s XP spectra are contained in Table 2.3. For
GO films, the C1s XP spectrum could be fit with all five peaks, with a sizable contribution from
peak 3. RGO films prepared by reaction with cobaltocene yielded differences in the C1s XP
spectrum. Peak 1 was still the most pronounced peak but the relative contributions from peaks 3
and 4 were strongly attenuated. The relative intensity of peak 5 was nominally unchanged. The
C1s spectrum for RGO films prepared with cobaltocene & TFA was also different from the data
for GO films but in two distinct ways. First, the relative intensity of peak 1 now greatly exceeded
the combined contributions from all other peaks. Second, the relative intensity of peak 2 was
comparable to the relative intensity of peak 3. In contrast, the C1s spectrum for RGO films
prepared with decamethylcobaltocene largely mirrored the spectrum for RGO films prepared with
cobaltocene, with slightly smaller contributions from peaks 3, 4, and 5.
Treatment 1 2 3 4 5
as-prepared GO b 38 ± 7 17 ± 8 31 ± 5 9 ± 3 5 ± 3
after reaction with CoCp2 c 35 ± 8 40 ± 9 15 ± 3 5.1 ± 0.8 5 ± 0.9
after reaction with CoCp2 + acid d 59 ± 6 21 ± 3 10 ± 2 5.1 ± 0.8 5 ± 1
after reaction with CoCp*2
e 33 ± 6 44 ± 9 13 ± 7 5 ± 1 6 ± 2 a Peaks labels: 1- sp3 C; 2- sp2 C; 3- C-O; 4- C=O; and 5- O-C=O. bN =14, cN = 4, dN = 7, eN = 13
Table 2.3 X-ray Photoelectron C 1s Spectra Fitting Results for As-prepared and Reduced
Graphene Oxide Filmsa
Figure 2.5 shows the Co 2p XP spectrum of an RGO film prepared with a solution of
cobaltocene and trifluoroacetic acid and of an RGO film prepared with a solution of
decamethylcobaltocene (red traces). It is apparent that a significant amount of cobalt remains
adsorbed to the film surfaces after reduction. EDS analysis in Figure 2.6 also shows residual cobalt
signal. After the films have been soaked in an acetonitrile solution of trifluoroacetic acid for two
days, however, the cobalt signal is gone (Figure 2.5, red traces). This indicates that the cobalt is
weakly adsorbed and can easily be removed.

36
Figure 2.5 Representative Co 2p XP spectra of RGO films treated with cobaltocene & TFA (top)
and films treated with decamethylcobaltocene (bottom). The black lines correspond to freshly
prepared RGO films and the red lines correspond to the same films after soaking in the respective
solvents for several days. The solvents used for this removal of cobalt species was acidified
acetonitrile in the case of films treated with cobaltocene & TFA and dichloromethane in the case
of films treated with decamethylcobaltocene.
805 800 795 790 785 780 775
No
rmal
ized
Co
un
ts
Binding Energy /eV
CoCp2 + TFA
CoCp 2*
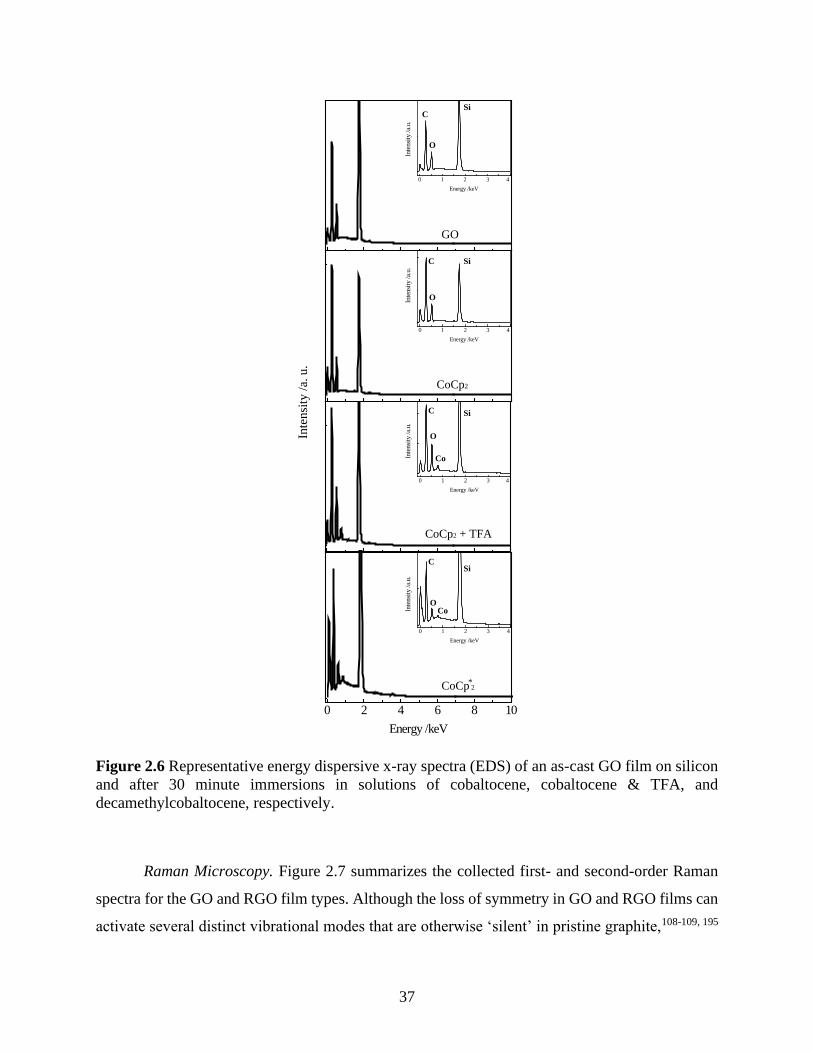
37
Figure 2.6 Representative energy dispersive x-ray spectra (EDS) of an as-cast GO film on silicon
and after 30 minute immersions in solutions of cobaltocene, cobaltocene & TFA, and
decamethylcobaltocene, respectively.
Raman Microscopy. Figure 2.7 summarizes the collected first- and second-order Raman
spectra for the GO and RGO film types. Although the loss of symmetry in GO and RGO films can
activate several distinct vibrational modes that are otherwise ‘silent’ in pristine graphite,108-109, 195
Inte
nsi
ty/a
.u.
0 1 2 3 4
Energy /keV
GO
CoCp2
CoCp2 + TFA
CoCp 2
0 1 2 3 4
Energy /keV
0 2 4 6 8 10
Energy /keV
0 1 2 3 4
Inte
nsi
ty/a
.u.
Energy /keV
C
C
C
C
O
O
O
O
Si
Si
Si
Si
Co
Co
0 1 2 3 4
Energy /keV
Inte
nsi
ty/a
.u.
Inte
nsi
ty/a
.u.
Inte
nsi
ty/a
.u.
*

38
no attempt was made here to fit the as-collected spectra with individual modes/‘interbands’.109
Instead, the primary spectral features are described here and summarized in Table 2.4. Each
spectrum in Figure 2.7 showed a band near 1320 cm-1 (i.e. the D band) and a second less intense
signal near 1610 cm-1 (i.e. the G band). For GO films, the D and G bands were resolvable but
showed substantial overlap. Additionally, no G’ band (appearing near 2600 cm-1 in graphite) was
apparent above the baseline noise. Raman spectra for RGO films prepared with just cobaltocene
showed five principal differences. First, the peak positions of the D and G bands red-shifted
slightly. Second, the fwhm values for both bands decreased. Third, the overlap between these bands
(i.e. the intensity at ~ 1480-1500 cm-1) was less. Fourth, a peak at ~2600 cm-1 (the 2D band)101, 106
was apparent. The RGO film prepared from a solution of cobaltocene and TFA showed these same
changes in the corresponding Raman spectra with some subtle differences. The position of the D
and G bands were more red-shifted, the fwhm values for these bands were smaller with lower
overlap between the bands, but the relative intensity of the G band remained the same. However,
the 2D band at 2600 cm-1 was perceptible over the baseline but with a lower signal to noise ratio.
The RGO film prepared with decamethylcobaltocene showed all of these same trends, except G’
band was clearly visible as well as a secondary peak at 2880 cm-1.
The fifth principal difference in the Raman spectra for the GO and RGO films was the
relative intensities of the G band. For graphitic materials, the ratio of the D and G peak intensities
(i.e. ID and IG, respectively) is proportional to the average crystallite size of a graphitic material,
La, but in a complex manner,106-107
n
G
Da
I
IkL
= 2.1
where k is a proportionality constant that depends on the wavelength of excitation, the extent of
resonance, the instrument response factor, and the scattering properties of the studied material107
and n is the order of the dependence. For graphitic carbons with large (> 3 nm) domain sizes, n is

39
Figure 2.7 Representative Raman spectra of an as-cast GO film and after 30 minute immersions
in solutions of cobaltocene, cobaltocene & TFA, and decamethylcobaltocene, respectively. All
raw spectra were normalized to the intensity of the peak near 1320 cm-1. The intensity of the spectra
between 2200 and 3200 cm-1 has been increased by an order of magnitude to better visualize the
peaks in this region. The scale bar highlights the intensity above the baseline of the overlap region
between the D and G peaks.
Treatment
D band
position
/cm-1
D band
fwhm
/cm-1
G band
position
/cm-1
G band
fwhm
/cm-1
ID/IG ratio
as-prepared GO 1340 ± 20 130 ± 8 1604 ± 3 70 ± 20 1.2 ± 0.2
after reaction with CoCp2 1310 ± 1 99 ± 5 1595 ± 1 71 ± 8 1.78 ± 0.07
after reaction with CoCp2 + acid 1305 ± 1 86 ± 7 1593 ± 1 63 ± 6 2.0 ± 0.2
after reaction with CoCp*2 1306 ± 1 76 ± 4 1592 ± 1 64 ± 3 2.5 ± 0.1
a N = 20 for each measurement; b λlaser = 785 nm
Table 2.4 Raman Spectra for As-prepared and Reduced Graphene Oxide Filmsa,b
-1, and eq 1 is the well-known Tuinstra-König relation.103 However, for graphitic materials with
very small domains where the crystallite size defines the distance between defects, n > 0, and that
for nanocarbons, n ranges from ~0.75-2.106-107 A wide range of crystallite sizes for RGO and GO

40
has been reported, likely largely as a function of the material preparation method.149, 196-197 The
increase in the ID/IG ratio upon treatment with cobaltocenes shown here, which correlates with a
decrease in resistivity, implies that the crystallite sizes of these GO and RGO films are < 3 nm.
Accordingly, the increase in the ID/IG ratio measured in the RGO films after treatment with the
reducing reagents implies a perceptible restoration of the graphitic network in the films.
Unfortunately, the exact quantitation of the Raman spectra for graphitic nanocarbons cannot be
performed without standards with matched scattering properties and without establishing n
beforehand.107 Nevertheless, from the spectra in Figure 2.7, RGO films prepared with
decamethylcobaltocene showed the largest ID/IG value (Table 2.4), implying that films prepared in
this way have larger graphitic domains than films prepared either with just cobaltocene or
cobaltocene & TFA. The proper analysis of Raman spectra from small domain graphitic carbons
is an unsettled topic, including the relevant number of bands.106, 108-109, 195, 198-199 Some authors
prefer to fit the Raman spectra of graphitic carbons with several bands and use the integrated areas
of the D and G peaks for the Tuinstra-König analysis; however, because of the disagreement on
the proper fitting parameters and number of bands, we limit our analyses here to the ratios of the
apparent peak intensities for insight on graphitic character.
Atomic Force Microscopy. Atomic force micrographs were separately collected to
ascertain the respective morphologies of the GO and RGO films. Figure 2.8 presents representative
atomic force microscopy data showing the topography of each film type. The GO films appeared
wrinkled (Figure 2.8a), with an observed root mean square surface roughness of 14 ± 6 nm (N =
7). After immersion in a solution of just cobaltocene (Figure 2.8b), the films looked nominally
unchanged. The roughness for these films was 10 ± 2 nm (N = 7). After immersion in solutions
with equimolar amounts of cobaltocene & TFA (Figure 2.8c), the films appeared rougher, with
more pronounced wrinkling and a root mean square roughness of 19 ± 8 nm (N = 8). Reaction of
GO films with decamethylcobaltocene (Figure 2.8d) imparted to significant morphological
change, but the surface roughness decreased slightly to 8 ± 3 nm (N = 7).
Substrate/Reagent Compatibility. Figures 2.9 and 2.10 show photographs comparing the
results of GO thin film reduction by the most common reductant (HI(aq)) and by cobaltocene &

41
Figure 2.8 Contact mode atomic force micrographs of (a) an as-cast GO film and after 30 minute
immersions in solutions of (b) cobaltocene, (c) cobaltocene & TFA, and (d)
decamethylcobaltocene, respectively. Scale bars: 2 μm.
TFA on two sensitive substrate materials: paper and thin films of indium metal on glass. Figures
2.9a and 2.9c show two GO films on indium metal. Figure 2.9b shows the sample after immersion
in a ~50% HI acid solution for 30 seconds. Under these conditions, the GO and indium metal were
completely removed from the glass. The inset to Figure 2.9b shows the rapid delamination upon
immersion in the HI reductant solution. In Figure 2.9d shows the indium/reduced graphene oxide
film stack after treatment with cobaltocene & TFA. The only noticeable change after this treatment
was the expected darkening of the graphene oxide film. Otherwise, both the graphitic film and the
underlying metal substrate were mechanically unperturbed.
Figures 2.10 and 2.10 show patterned GO films prepared on paper substrates. Figure 2.10b
shows the result after immersion in 50% HI(aq) solution for 30 seconds, where an intense
darkening of both the graphitic film and the paper substrate. The paper was clearly stained by the
formation of I2 following reaction with the paper. In contrast, Figure 2.10d shows the sample in
Figure 2.10c after treatment with cobaltocene & TFA. The only noticeable change after this
treatment is the darkening of the now-reduced graphene oxide film pattern.
60 nm
50
40
30
20
10
0
30
25
20
15
10
5
0
35 nm
0
10
20
30
40
50
55 nm
a) b)
c) d)
0
10
20
30
40
50
55 nm

42
Figure 2.9 a, c) GO films deposited on indium thin films evaporated onto glass. b) The film in (a)
after immersion in 50% HI solution for 30 seconds. d) The film in (c) after treatment with cobaltocene
& TFA. Scale bar: 1 cm.
Figure 2.10 (a) and (c) GO films patterned on paper. (b) The film in (a) after immersion in 50% HI
solution for 30 seconds. (d) The film in (c) after treatment with cobaltocene & TFA. Scale bar: 1 cm
Adsorption on RGO Films as Electrode Coatings. All GO and RGO film types were probed
in terms of their efficacies as thin electrode coatings. These film types were prepared on plain glass
and FTO-coated glass and then exposed to solutions containing crystal violet for 15 min. Crystal
violet is a strongly visible-light-absorbing and redox-active dye. The loading of crystal violet onto
the films was monitored through light absorption. Figure 2.11a illustrates that after immersion for
15 min, the GO films showed an order of magnitude higher absorption than any of the RGO films.
The RGO film prepared with just cobaltocene had an intermediate absorbance while the other RGO
films showed much less light absorbance, implying less extensive dye adsorption. These
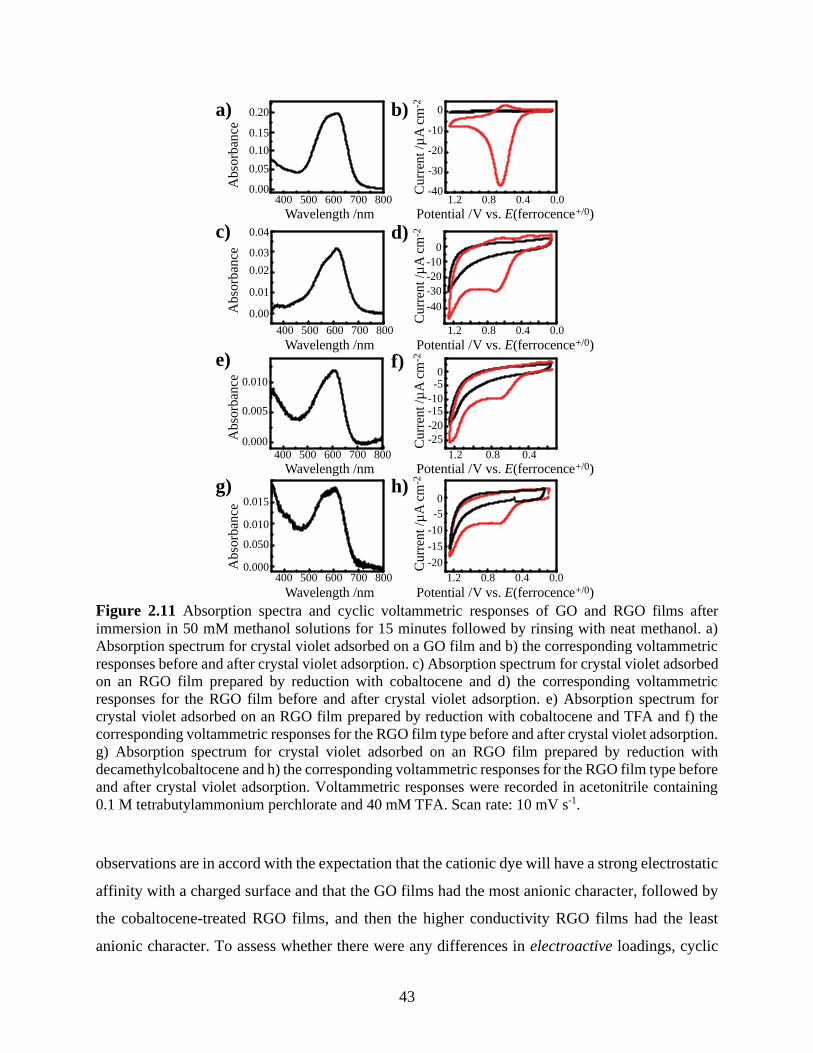
43
Figure 2.11 Absorption spectra and cyclic voltammetric responses of GO and RGO films after
immersion in 50 mM methanol solutions for 15 minutes followed by rinsing with neat methanol. a)
Absorption spectrum for crystal violet adsorbed on a GO film and b) the corresponding voltammetric
responses before and after crystal violet adsorption. c) Absorption spectrum for crystal violet adsorbed
on an RGO film prepared by reduction with cobaltocene and d) the corresponding voltammetric
responses for the RGO film before and after crystal violet adsorption. e) Absorption spectrum for
crystal violet adsorbed on an RGO film prepared by reduction with cobaltocene and TFA and f) the
corresponding voltammetric responses for the RGO film type before and after crystal violet adsorption.
g) Absorption spectrum for crystal violet adsorbed on an RGO film prepared by reduction with
decamethylcobaltocene and h) the corresponding voltammetric responses for the RGO film type before
and after crystal violet adsorption. Voltammetric responses were recorded in acetonitrile containing
0.1 M tetrabutylammonium perchlorate and 40 mM TFA. Scan rate: 10 mV s-1.
observations are in accord with the expectation that the cationic dye will have a strong electrostatic
affinity with a charged surface and that the GO films had the most anionic character, followed by
the cobaltocene-treated RGO films, and then the higher conductivity RGO films had the least
anionic character. To assess whether there were any differences in electroactive loadings, cyclic
Abso
rban
cec) d)
1.2 0.8 0.4 0.0-40
-30
-20
-10
0b)a)
400 500 600 700 800
e) f)
g) h)
Wavelength /nm
Wavelength /nm
Wavelength /nm
Wavelength /nm Potential /V vs. E(ferrocence+/0)
Potential /V vs. E(ferrocence+/0)
Potential /V vs. E(ferrocence+/0)
Potential /V vs. E(ferrocence+/0)
400 500 600 700 800
400 500 600 700 800
400 500 600 700 800
Abso
rban
ceA
bso
rban
ceA
bso
rban
ce
Curr
ent
/µA
cm
-2C
urr
ent
/µA
cm
-2C
urr
ent
/µA
cm
-2C
urr
ent
/µA
cm
-2
1.2 0.8 0.4 0.0
1.2 0.8 0.4
1.2 0.8 0.4 0.0
0.20
0.15
0.10
0.05
0.00
0.04
0.03
0.02
0.01
0.00
0.010
0.005
0.000
0.015
0.010
0.050
0.000
-40
-30
-20
-10
0
-20
-15-10
-50
-25
-20
-15
-10
-5
0

44
voltammograms were recorded with the dye-loaded GO and RGO films, where the potential was
biased sufficiently positive to effect the irreversible 2e- oxidation of crystal violet.200 Integration
of the total charge passed (after correction from the background capacitance) indicated a
comparable loading of crystal violet (10-9 mol cm-2) on the most conductive RGO films, but with
a higher loading on the RGO film prepared with just cobaltocene. The shape of the voltammetry
was comparable among the three RGO film types, consisting of a double-wave oxidation response,
similar to what is seen for solution phase oxidation of crystal violet.200 The voltammetric response
on the GO film showed only a single wave at approximately the same potential as the first wave
in the voltammetry of crystal violet on RGO.
2.4 Discussion
The cumulative data support the following contentions. First, graphene oxide can be
reduced by 1e- outer-sphere reductants. Second, the standard potential of the reductants strongly
influences the extent of reduction. Third, the inclusion of a proton source (acid) in a cobaltocene
solution strongly affects the reduction of graphene oxide and the nature of the resultant film.
Fourth, the differences in the apparent properties of RGO films prepared by
decamethylcobaltocene and by cobaltocene with trifluoroacetic acid do not translate into obvious
differences in their electrical or electrochemical properties. These points are discussed below.
Reduction of Graphene Oxide by Outer-Sphere One-Electron Reductants. The substantial
and rapid darkening of the as-cast films upon immersion in separate solutions of cobaltocene and
decamethylcobaltocene indicate each metallocene readily reacts with graphene oxide. The XP data
in Figure 2.4 separately and clearly show that these reactants lowered the overall oxygen content
by primarily decreasing the number of alcohol/ether and quinone/carbonyl functionalities, as
evidenced by the decrease in peaks 3 and 4, respectively. The Raman data in Figure 2.7 separately
suggest a concomitant increase in the overall conjugation in the films, as denoted by the red-shifts
of the D and G bands, narrowing of these peaks, and emergence of the G’ band. These facts
collectively underscore a restoration of the graphitic sp2 network. The atomic force images
separately indicate that the chemical reduction effected by reaction with either cobaltocene or
decamethylcobaltocene did not substantially alter the physical structure of the graphene oxide
films. The surface roughness of GO films decreases upon treatment with each of these reductants,
possibly due to an increase in aromaticity that facilitates more layer stacking/ordering. Overall,

45
these data are convincing that cobaltocene and decamethylcobaltocene are active for the gentle
reduction of GO to RGO, i.e. conversion does not involve elimination of a significant number of
carbon atoms.
However, the cumulative data also strongly indicate that the RGO films formed through
reaction with these two metallocenes are not equivalent. The lower conductivity of the RGO films
consistently produced with cobaltocene implied that this metallocene was less effective at reducing
graphene oxide. Further analysis of the XP data argues against the difference in conductivity
arising from a lesser ability of cobaltocene to remove oxygen-containing functionalities. Rather,
the relative contributions in the C 1s spectrum from oxygen-containing functionalities in the RGO
films made with cobaltocene and decamethylcobaltocene were comparable (Table 2.3). Instead,
the Raman spectra argue that removal of oxygen-containing functionalities by cobaltocene did not
also restore as much of the conjugated network. That is, reaction with cobaltocene reductively
eliminated the same amount of oxygen-containing functionalities as did reaction with
decamethylcobaltocene without increasing the conductivity as much. The less prominent band at
~2700 cm-1, the greater overlap between the D and G bands, and the larger Raman shifts for these
bands for the RGO films prepared with cobaltocene are all consistent with graphitic domains with
less order and smaller sizes.101, 103, 105-106, 108-110, 113, 195, 199, 201-202 Accordingly, the data strongly
indicate that the less negative standard potential of the cobaltocene/cobaltocenium couple relative
to the decamethylcobaltocene/decamethylcobaltocenium couple significantly lessens its ability to
effect a conversion of graphene oxide back towards graphene.
The data presented here are the first to implicate an explicit dependence of the
physicochemical properties of the resultant RGO films on the reducing power of a chemical
reductant. The data clearly suggest that effective reductants do not just remove oxygen-
functionalities but they also must extend conjugation in the films. The presented work does not
define what precise electrochemical potential is sufficient to do both, but the value appears to be
somewhere between the standard potentials of cobaltocene and decamethylcobaltocene. Given the
ability to tune the reducing power of outer-sphere reductants like metallocenes either through
change in metal center and/or functionalization of the cyclopentadienyl rings,203-205 further
experiments may more precisely identify if a single threshold potential exists.
Reduction of Graphene Oxide by Cobaltocene in the Presence of Acid. The reduction of
GO films with cobaltocene in the presence of acid was also noticeably different. To be clear, there

46
was no evidence of reduction when GO films were exposed to just acid solutions. Rather, the
resistance measurements implied the action of acid in the absence of an electron source was to
lower the film conductivity. In contrast, the conductivity of RGO films reduced with cobaltocene
in the presence of acid was substantially higher. In fact, the conductivity values extracted from
four-point probe measurements showed values that were statistically indistinguishable from those
of RGO films prepared with decamethylcobaltocene. The XP data clearly implicated that the
presence of acid helped further lower the total oxygen-containing functionalities, most specifically
the amount of alcohol groups. In addition, the XP data indicated that treatment of GO films with
cobaltocene and acid also lowered the apparent amount of sp3 carbon (peak 2 in Figure 2.4),
suggesting a possible change in the carbon lattice itself. The atomic force micrographs support this
premise, with the most substantial roughening of the films occurring after reaction with
cobaltocene and acid. The Raman data showed that the spectral features (i.e. peak positions, peak
widths, relative intensities) of the films treated with cobaltocene & acid were different than those
for RGO films prepared with just cobaltocene. The Raman spectra indicated that the graphitic
domain size after treatment with cobaltocene & acid fell in between the values for GO films treated
with just cobaltocene or just decamethylcobaltocene. However, the overall electrical conductivity
of these films was equivalent to that of the films reduced with decamethylcobaltocene. This
observation highlights that the sheet conductivity is likely a function of both the graphitic domain
size and their interconnectivity. In principle, a material with larger graphitic domains that are
electrically isolated from each other (e.g. due to selective functionalization at the periphery of the
domains) could show lower macroscopic conductivity. Accordingly, because of the larger sp2
carbon content and lower oxygen content in the RGO films produced with cobaltocene & TFA as
seen in the XP spectra, we posit that the graphitic domains in these films are less ‘insulated’ by
oxygen functionalities at their boundaries than the graphitic domains in films produced with
decamethylcobaltocene are. This lower degree of electrical isolation may offset a change in the
average graphitic domain size in the RGO films produced with cobaltocene & TFA, thereby giving
these films comparable conductivities to those produced with decamethylcobaltocene. In total, the
data indicated that the presence of acid increased the reducing power of cobaltocene for effecting
a transformation of GO but with a mechanism different than reduction by decamethylcobaltocene.
Control experiments performed in acetonitrile containing trifluoroacetic acid but without
cobaltocene ruled out any specific action of the acid on graphene oxide alone. Rather, the data

47
support the contention that a distinct chemical species is involved in solutions containing acid and
cobaltocene. The oxidative protonation of cobaltocene in the presence of acids is known (eq 2.2),
though the site of protonation (metal center or Cp ligand) is somewhat under debate.188-190
2.2
Recent electron paramagnetic resonance measurements of decamethylcobaltocene in the presence
of triflic acid or lutidinium imply protonation of the Cp ligand,190 suggesting this as the source of
activity as a proton-coupled electron transfer reagent.
The mechanism of reduction of GO by this species is not known and cannot be gleaned
from the presented data. Nevertheless, the presented evidence is clear on several points. Reduction
of GO by this species is more extensive (i.e. substantially lowers oxygen-containing
functionalities) than by either metallocene alone while still selective (i.e. does not increase sp3
character that would lower conductivity). These features are not common to all metal hydrides.
For example, LiAlH4, a strong metal hydride reductant, can reduce GO and almost entirely
eliminate oxygen-containing groups.172 However, the resultant RGO film conductivities are
substantially lower than other RGO film types,172 suggesting that LiAlH4 also compromises some
of the aromatic network through reduction of C=C bonds. In contrast, NaBH4, a milder reductant,
also yields RGO films with much lower conductivities (Table 2.1) but with higher residual oxygen
content172 presumably because it does not reduce GO as extensively. Accordingly, a putative H-
CoCp2+ species in aprotic solvents may be an intermediate hydride reductant. If so, it might prove
useful for selective reductive transformations in organic synthetic chemistry.206 Separate work is
needed to explore this topic.
Substrate Material Tolerance. The data clearly illustrate the issues that arise when
immersion in HI solutions is used to prepare RGO films on sensitive substrates. The corrosion and
staining issues are clear with non-noble metals and porous substrates, respectively. These
complication negate the high conductivities afforded by reaction with HI (Table 2.1).121, 158, 207-208
However, the data presented here demonstrate that metallocene solutions yield comparably
conductive RGO thin films without incurring any mechanical or chemical damage to the
underlying substrate. In this way, such outer-sphere redox reagents are quite mild with respect to
processing considerations while still remaining sufficiently potent reducing reagents.
++ −→+ 22 CoCpHHCoCp

48
RGO Film Coatings. The conductivities of the RGO films prepared by reduction with
decamethylcobaltocene and cobaltocene in acid warrant further mention. As detailed in Table 2.1,
the majority of RGO films produced by wet chemical reductants yield conductivities < 103 S m-1.
The conductivities for the RGO films prepared here are slightly higher and are close to the highest
conductivities reported for RGO prepared by any method (wet chemical, thermal, or
combination).96-97 Chemical reductants that yield more conductive RGO films tend to be species
that can deliver both electrons and protons. In this manner, the activity of acidic cobaltocene
solutions shown here is in line with the potency of other metal hydrides for GO reduction.120, 172
However, decamethylcobaltocene is unique, as it can only deliver electrons. Regarding reductants,
its closest analog is not molecular but rather the approach to electrochemically reduce GO films
cast on metallic electrodes.147-148, 150, 155 The data are also clear that the RGO films exhibit
electrochemical responses for a probe cationic adsorbate that are sensitive to the extent of reduction
in the films. We posit that the ionic character of GO films are not equally diminished upon
reduction by all the investigated reducing solutions. More work is needed to determine whether
the resultant electrical and electrochemical properties are not sensitive to just variations in surface
chemistry/ordering. The use of other outer-sphere reductants and correlating the resultant
properties/behaviors of the RGO films may inform on this topic.
2.5 Conclusions.
This work demonstrates that it is possible to reduce graphene oxide thin films by simple
immersion in non-aqueous solutions containing strongly reducing metallocenes. Cobaltocene and
decamethylcobaltocene are specifically shown to be active in reducing the number of oxygen-
containing functionalities in and affecting the graphitic domain size of graphene oxide. The data
also show that decamethylcobaltocene is more effective at reducing graphene oxide, suggesting a
strong dependence on the standard potential of the reductant. This difference could be offset
somewhat if cobaltocene was used in conjunction with a proton source during the reduction of GO
films. These resultant RGO films show similarly high electrical conductivities, on par with films
prepared by just decamethylcobaltocene. This work motivates further studies on two fronts. From
a practical point of view, the results demonstrate a simple, effective, and very mild means to
prepare highly conductive RGO films on any substrate type (insulator, semiconductor, conductor),
even on substrates that are sensitive to corrosion or impregnation. This work importantly

49
demonstrates reduction of graphene oxide by outer-sphere reductants for the first time, thereby
highlighting a new way to explore and understand the reduction of graphene oxide materials
through the tunability of outer-sphere reductants.

50
3.1 Introduction
In the face of an ever-increasing global energy demand and a looming environmental crisis
due in part to emissions from carbon-based fuels, electrochemical water splitting is a promising
method for generating a clean chemical fuel. In electrochemical water splitting, water is converted
to hydrogen gas (at the cathode) and oxygen gas (at the anode). The hydrogen evolution half-
reaction can be driven at its thermodynamic potential using a platinum electrode, but because of
platinum’s scarcity and costliness, it is preferable to use other, cheaper electrode materials. Most
of these materials, however, require significant overpotentials due to unfavorable reaction kinetics
at the electrode surface. The required overpotential can be lessened by addition of an
electrocatalyst to the system. To this end, a wide range of proton reduction electrocatalysts have
been developed. These include solid state materials, such as metal sulfides or oxides38, and
molecular complexes, like the famous nickel diphosphine catalyst209 among others.32, 210-211 Solid
state catalysts have the benefit of operating heterogeneously, i.e. immobilized on the electrode
surface, whereas molecular catalysts are most often homogeneous, i.e. dissolved in the electrolyte
solution. Heterogeneous catalysis results in far less material waste than homogeneous catalysis.
Molecular catalysts, however, have the advantage of a well-defined and easily tunable active site.
It is therefore advantageous to find ways of heterogenizing molecular electrocatalysts, thereby
combining the benefits of both types of systems.
Molecular catalysts can be immobilized on electrode surfaces in two ways: through
physisorption by utilizing attractive van der Waals forces54, 60, 91, 212-213 or by covalent
attachment.34, 214-216 Physisorption has the benefit of simplicity and ease of execution. One of the
most common van der Waals forces used for physisorption on surfaces is π- π stacking interactions,
which can occur between a molecule containing a π-system that can lie flat on a surface and a
Chapter 3. Physisorption of a Molecular Proton Reduction Electrocatalyst on Thin
Graphitic Films

51
surface that also contains a π-system, e.g. graphitic carbon surfaces. The system discussed in this
chapter utilizes these attractive forces.
Herein we report on the physisorption of the molecular proton reduction electrocatalyst
cobalt (III) bis(dichlorobenzenedithiolate) (1) (Figure 1.2) to graphitic thin films on electrode
surfaces. A set of cobalt bis(benzenedithiolate) proton reduction catalysts has previously been
studied for their physisorption to graphite-based electrodes69, 217 and electrodeposited reduced
graphene oxide (RGO) on FTO electrodes.218 Long-term stability during electrolysis in acidic
conditions was demonstrated on graphite electrodes. Graphite is a low-cost, stable material
commonly used for inert electrodes. However, to implement this system in photoelectrochemical
cells for solar driven water-splitting, transparent graphitic thin films are required. To this end we
report on the adsorption of 1 to three different transparent graphitic thin films: RGO, single layer
graphene, and multiwalled carbon nanotubes (MWCNT). While it has previously been shown that
adsorption to an electrodeposited film of RGO on an FTO surface leads to stable attachment,218
the data presented here suggest that adsorption to dropcast RGO films, graphene, and MWCNT
films is extremely weak and desorption occurs quickly under turnover conditions. Furthermore,
casting a film of a proton-conductive polymer on top of the adsorbed catalyst layer does not
improve retention of the catalyst. The reason for the weak adsorption of catalyst on these surfaces
is hypothesized to be the ultra-low roughness of the surfaces, preventing any intercalation within
the film. To support this hypothesis, voltammetry data are presented, which show that increasing
the roughness of the RGO film does indeed improve catalyst retention.
3.2 Experimental
Materials. Trifluoroacetic acid (TFA, 99%, Sigma Aldrich), hydrogen peroxide (30% in H2O,
Sigma Aldrich), hydrochloric acid (37%, Sigma Aldrich), sulfuric acid (ACS grade, Fisher
Scientific Education), dimethylformamide (99.8%, Sigma Aldrich), multi-walled carbon
nanotubes (>98% carbon basis, O.D. × L 6-13 nm × 2.5-20 μm, Sigma Aldrich), Nafion (5% wt.
in lower aliphatic alcohols and water, Sigma Aldrich), graphite rods (Graphite Machining, Inc. -
Grade NAC-500 purified, <5 ppm ash level), and potassium permanganate (98%, Acros) were
used as received. Cobaltocene (Sigma Aldrich) was purified by sublimation at T = 80°C.
Acetonitrile (99.9%, Fisher Scientific) was distilled and subjected to three freeze-pump-thaw
cycles before glovebox use; otherwise solvents were used as received. Potassium
hexafluorophosphate (95%, TCI) was recrystallized from aqueous 0.1 M KOH before use.

52
Graphite flakes (-20+84 mesh, Johnson Matthey) were used as the carbon source for graphene
oxide suspensions. Single layer graphene on copper (Graphenea) was transferred to the desired
substrate with thermal tape. Water with a resistivity >18.2 MΩ (Nanopure Barnstead Water
Purification) was used throughout.
Polished Si(111) wafers from Wafer Works doped with As (≤0.006 Ω cm-1) were used as
substrates for XPS measurements. Glassy carbon substrates were prepared by first polishing with
alumina (1 μm, 0.3 μm, and 0.05 μm alumina suspensions) on felt and then soaking in isopropanol
or methanol for 5 minutes.
Preparation of graphene oxide suspensions. See Chapter 2.2 Experimental for preparation
of graphene oxide.
Preparation of RGO films. A small volume of the graphene oxide suspension was removed
and sonicated for 20 minutes to exfoliate and disperse fully individual graphene oxide sheets. This
volume was then centrifuged at 9000 rpm for 30 minutes. The brown supernatant was removed
and diluted to approximately 1 mg mL-1. The diluted suspension was then dropcast onto the
substrate of choice and allowed to air dry. These films were then reduced by immersion in solutions
containing 15 mM CoCp2 and15 mM TFA in acetonitrile under a dry N2 atmosphere inside a glove
box for 30 min at room temperature. Following immersion, the films were removed from the
glovebox and rinsed with solvent. These films were allowed to air dry under ambient conditions.
Preparation of MWCNT films. About 1 mg MWCNTs were suspended in about 2 mL DMF
and sonicated for ~15 minutes. The suspension was centrifuged briefly to remove large particles.
The resulting gray colloid was stable for several weeks. This colloid was dropcast on a desired
surface (about 50 μL per cm2 surface area) and allowed to air dry in ambient conditions.
Preparation of freeze-dried RGO (fd-RGO) films. Graphene oxide (GO) suspension (about
0.1 mL of 1 mg/mL suspension cast per 1 cm2 surface area) was dropcast on the desired surface
and allowed to air dry. A similar sized droplet of GO was then cast on top of this film and the
sample was immediately immersed in liquid nitrogen. Note that the underlying GO thin film was
necessary when preparing samples on glassy carbon substrates because the wetting of GO on
glassy carbon was so poor that the frozen GO droplet tended to easily slide off the substrate. If a
thin film of GO was first prepared on the glassy carbon, then the frozen GO droplet adhered to the
surface much more strongly. Immediately after freezing, the sample was then subjected to
lyophilization. Once dried, the film was light brown and had a soft appearance. The GO was
53
reduced to RGO by cobaltocene following the same procedure as described above for smooth RGO
films.
Synthesis of 1. In an inert atmosphere box under N2 pressure (Innovative Technologies), a
solution of 3,6-dichloro-1,2-benzenedithiol (0.5 g, 2.4 mmol) and sodium methoxide (0.128 g, 2.4
mmol) was added dropwise to a suspension of cobalt(II) sulfate heptahydrate (0.320 g, 1.14 mmol)
in 40 mL of dry methanol in a roundbottom flask. The addition caused a color change to deep blue.
The resultant solution was stirred for 2 hours. A solution of tetrabutylammonium bromide (0.407
g, 1.2 mmol) in 6 mL dry methanol was added at this time, and the solution was stirred for an
additional 2 hours. The sealed flask was then removed from the glovebox and the solvent volume
was reduced under vacuum to <10 mL, resulting in a thick, dark blue slurry. This was filtered and
dried. The solid was then recrystallized from dichloromethane/ether to yield 1 as a dark blue
crystalline solid (50% yield). The UV-visible absorption spectrum matched that in the literature.218
Adsorption of 1 to carbon surfaces and Nafion capping layer. To adsorb 1, all films were
immersed in a 5 mM solution of 1 in acetonitrile for at least 30 minutes, then removed and rinsed
gently but thoroughly with acetone. They were then gently dried with a stream of nitrogen.
To form a capping layer of Nafion, about 50 μL of a Nafion solution per cm2 of surface
area was dropcast on top of the carbon thin films. The Nafion capping layer was cast after
adsorbing 1 to the carbon surface.
Preparation of graphite surface for AFM. Graphite rods were polished with coarse
sandpaper to expose a fresh surface, then with fine sandpaper, and finally with alumina polish
(0.05 μm), according to the procedure in Reference 217. The end was then sawed off with a
diamond saw to make a puck that was placed face-up on the AFM stage.
X-ray photoelectron spectroscopy. X-ray photoelectron (XP) spectra were acquired with a
PHI 5400 analyzer using an unmonochromated Al Kα (1486.6 eV) source or a Kratos Axis Ultra
analyzer using a monochromated Al Kα (1486.6 eV) source. Spectra recorded on the PHI
instrument were taken without charge neutralization at a base pressure of <2.5×10⁻⁹ Torr. A 6 mA
emission current and 10 kV anode HT was used. High-resolution XP spectra were recorded at a
pass energy of 23.5 eV. Each C1s spectrum collected is an average of 20 high resolution scans and
each other element spectrum collected is an average of 50 high resolution scans.

54
Spectra recorded on the Kratos instrument were taken with charge neutralization at a base
pressure of <2.5 x 10⁻⁹ Torr. An 8 mA emission current and 14 kV anode HT were used. Each
high-resolution spectrum taken was an average of 10 scans at a pass energy of 20 eV.
All spectra were calibrated to the C1s peak at 284.6 eV.
Electrochemical measurements. Electrochemical measurements were taken using a CH
Instruments 760C potentiostat. A three-electrode cell was used with a supporting electrolyte of
deaerated 0.1 M potassium hexafluorophosphate and various concentrations of trifluoroacetic acid
in water. Platinum mesh was used as the counter electrode and Ag|AgCl (sat’d KCl) (in a
compartment separated by a glass frit) was used as the reference electrode. RGO, MWCNT, and
single layer graphene films were cast or transferred, respectively, on glassy carbon disk electrodes
with a diameter of 3 mm. The fd-RGO films were cast on square plates of glassy carbon which
were then compressed in an o-ring cell for electrochemical analysis. The region of exposed
electrode in this cell was 4.47 mm in diameter.
Atomic force microscopy. AFM was conducted on an Anasys Instruments NanoIR2.
Images were taken with 300 pt resolution in both x and y directions. Images of RGO thin films
and polymer coated films were taken at 1 Hz in contact mode. Images of fd-RGO films were taken
at 0.5 Hz in tapping mode.
Fourier transform infrared spectroscopy. FTIR spectroscopy was performed on a Thermo
Scientific Nicolet iS50 instrument with an ATR diamond crystal attachment. Graphene oxide
suspensions were dropcast on the ATR crystal and allowed to air dry for several minutes before
obtaining a spectrum.
Scanning electron microscopy. SEM images were taken on a Zeiss LEO 1455VP
microscope under 5 kV accelerating voltage and 10 pA beam current.
3.3 Results
Adsorption to surfaces. Figure 3.1 shows the Co 2p XP spectra of the three types of carbon
thin films (excluding freeze-dried (fd)-RGO) after soaking in a 5 mM solution of 1. The strong Co
2p signal indicates adsorption of 1 to all surfaces. It should be noted that the spectrum of RGO/1
was taken on an instrument lacking a monochromator whereas the spectra of graphene/1 and
MWCNT/1 were taken on an instrument with a monochromated x-ray source. This is the reason
for the difference in peak widths and signal-to-noise ratio among the three spectra. There is a

55
distinct shift in the binding energy of the cobalt signal among the three materials. The Co 2p3/2
peaks of graphene/1 and MWCNT/1 occur at a binding energy of approximately 779.4 eV and
780.0 eV, respectively, whereas the same peak occurs at significantly higher energy, 781.8 eV, for
RGO/1. Furthermore, a second peak appears in the RGO/1 spectrum at around 787 eV.
Figure 3.1 Co 2p XP spectra of RGO (blue), MWCNT (red), and graphene (black) after soaking
in a 5 mM solution of 1.
Voltammetry with acid titrations. Figure 3.2 shows the voltammetry of each type of carbon
surface with 1 adsorbed, with and without a Nafion film, and with varied trifluoroacetic acid
concentrations (up to at least 4 mM). Two observations from this voltammetry can be made. The
first is that for RGO/1, graphene/1, and MWCNT/1 by at least 8 mM acid the catalytic peak begins
to disappear and shift to more negative values. This trend is not observed for fd-RGO/1. In this
case, the catalytic peak is stable up to 8 mM acid concentrations. Further experiments with fd-
RGO/1 in 10 mM and 50 mM acid concentrations showed stability over many cycles (Figure 3.3).
Secondly, for each carbon thin film material (RGO, graphene, and MWCNT), the onset of catalytic
current occurs at a more positive potential with a Nafion capping layer than without Nafion. The
dashed gray lines are guides for the eye to show the shift in onset potential between films with
Nafion and films without Nafion. Notably, the current densities at 2 mM acid (before catalysis
starts to drop off) are approximately the same for all materials.

56
Figure 3.2 Cyclic voltammetry of various graphitic thin films after soaking in a 5 mM solution of
1 in acetonitrile for >1 hr with (top) and without (bottom) a Nafion capping layer. Supporting
electrolyte was deaerated 0.1 M KPF6 (black), with 2 mM TFA (red), 4 mM TFA (blue), 6 mM
TFA (green), or 8 mM TFA (orange). The dashed black curves are graphitic surfaces with no 1
adsorbed in 8 mM TFA. The vertical dashed lines are guides for the eye to show shift in onset of
current with a Nafion capping layer. The scan rate was 50 mV/s.
Figure 3.3 Repeated voltammetric cycling of an fd-RGO film that had been soaked in a 5 mM
solution of 1 in acetonitrile for > 1hr. Supporting electrolyte was deaerated 0.1 M KPF6 with 10
mM TFA (left) and 50 mM TFA (right). The scan rate was 50 mV/s.
Atomic Force Microscopy. To help explain the poor retention of 1 on RGO, graphene, and
MWCNT in comparison to strong adsorption on fd-RGO and on graphite electrodes as reported
earlier,217 AFM images of RGO, graphite, and fd-RGO were taken. These images as well as

57
macroscopic photographs are shown in Figure 3.4. The images show no distinct differences in
features between RGO and graphite; however, the calculated roughness of graphite (104 nm) is an
order of magnitude larger than that of RGO (12 nm). The image of fd-RGO suggests a different
morphology than either graphite or RGO. The surface appears to be a network or web of graphitic
carbon. This can be seen more clearly by SEM (Figure 3.5). The roughness of fd-RGO (262 nm)
is even higher than that of graphite.
Figure 3.4 Atomic force micrographs (left) and optical photographs (right) of a dropcasted GO
thin film (top), a polished graphite rod (middle), and a freeze-dried GO film (bottom). The RMS
roughness values calculated for each of these materials are 12 nm for GO, 104 nm for graphite,
and 262 nm for fd-RGO.
Figure 3.5 Scanning electron micrographs of a freeze-dried GO film on a silicon wafer. Cross
section view is on the left. The middle and right images are top down views at different
magnifications.

58
AFM images were also taken of Nafion thin films in the hopes of elucidating why catalytic
current decays so quickly even with a Nafion capping layer. These images can be seen in Figure
3.6. Nafion films on a degreased silicon wafer were smooth with very few features. There are
occasional small circular indents in the film, a few hundreds of nanometers in diameter and less
than 10 nm in depth. These could be attributed to holes in the film from nanoscopic bubbles formed
in the solution as it dried. However, this changed dramatically when Nafion films were cast on
carbon surfaces. On all three surface types, the Nafion film appear to have holes larger than 1 μm
in diameter and over 100 nm deep. These are the most pronounced on MWCNT and the least
pronounced on graphene.
Figure 3.6 AFM images of Nafion thin films cast on a silicon wafer, an RGO film, single layer
graphene, and a MWCNT film. The insets are the height profiles along the red line in each
image.
59
3.4 Discussion
It has previously been demonstrated by our laboratory that the proton reduction catalyst 1
adsorbs to graphite electrodes and remains adsorbed and catalytically active for several hours of
electrolysis in solutions with a pH as low as 0.3.69, 217 The data in this chapter suggest that 1 can
also be adsorbed to a variety of carbon thin films, namely reduced graphene oxide, single-layer
graphene, and multi-walled carbon nanotubes. However, desorption from these surfaces under
turnover conditions in acidic media is rapid. Correlation between surface roughness of these
materials and stability of the catalytic current suggests that intercalation within the graphitic
material plays a crucial role in retaining 1 during turnover.
Adsorption of 1 to carbon surfaces. XPS data in Figure 3.1 demonstrate that adsorption of
1 occurs on all three thin film materials, but the binding energy of the Co 2p orbitals is not identical
for each type of surface. The Co 2p signal of 1 on RGO appears at about 2.4 eV higher in energy
than on graphene and about 1.8 eV higher than on MWCNT. In previously reported systems of
coordination complexes adsorbed to graphene, a shift in binding energy of the metal center has
been observed, but the shifts were to lower binding energy (compared to the free complexes).219-
220 The large oxygen content of RGO compared to graphene and MWCNT may cause the shift to
higher binding energy of the Co center in 1. The large oxygen content of RGO makes it more
electron-withdrawing, effectively raising the binding energy of all orbitals on 1. This hypothesis
should be confirmed with further experiments, however, such as XAS measurements.
Additionally, the second peak at about 787 eV in the Co 2p spectrum of RGO/1 suggests the
presence of two different cobalt environments on RGO. To compare this spectrum with that in the
literature, in reports by Eady et al., the spectrum of 1 on electrodeposited RGO also contains two
cobalt peaks in the 2p region whereas the spectrum of 1 on graphite powder has only a single
peak.217-218 It is unclear at this point what the additional cobalt peak on RGO substrates represents
and additional experiments are required to determine its origin. However, one possible explanation
is that the cobalt center of 1 can coordinate to one of the oxygen groups on RGO. This may also
explain the large shift in binding energy of the main Co 2p peak. Further XPS experiments should
be conducted using RGO at various stages of reduction to determine whether the oxygen functional
groups on RGO influence either of the Co 2p peaks (at 787 eV and at 781.8 eV). These spectra
can also be compared with the spectra of cobalt species in the literature and deconvoluted by fitting

60
with multiple peaks to help determine what types of bonding environments or oxidation states of
cobalt are present. Finally, it should be determined whether the presence of the additional cobalt
environment on RGO influences the electrochemistry and electrocatalysis of 1.
Adherence of adsorbed 1 to surfaces under catalytic turnover. All four carbon thin films
with 1 adsorbed show catalysis in acidic conditions (Figure 3.2). Unfortunately, however, in three
of the cases the catalysis is not long-lived. Upon repeated cycling and addition of acid, the catalytic
peak becomes less prominent and shifts to more negative potentials for RGO/1, graphene/1, and
MWCNT/1. This is indicative of loss of catalyst from the surface. It is apparent from these data,
then, that while 1 readily adsorbs to all of these surfaces initially, it becomes weakly adsorbed on
RGO, graphene, and MWCNT during catalytic turnover or in acidic conditions. In the case of fd-
RGO/1, on the other hand, the catalytic current is stable over the course of the acid titration
experiment. Furthermore, repeated cycling of fd-RGO/1 in 10 mM TFA and 50 mM TFA showed
little change in the shape of the voltammograms, suggesting 1 does not readily desorb from this
surface.
In the previously published graphite system, XPS coupled with sputtering experiments
suggested that 1 was not only physisorbed to the surface of the graphite but also intercalated up to
about 40 nm deep into the material.217 We therefore hypothesize that though initial adsorption of
1 to carbon surfaces occurs because of π- π interactions, these interactions alone are not strong
enough to retain 1 during catalytic turnover. One possible explanation for this is that upon
reduction, 1 becomes more negatively charged and this causes a repulsive force with the surface
that competes with the π- π attractive forces. Another possibility is that a contortion about the Co
center may occur during catalysis and this would cause a weakening of the π- π interactions. This
could be tested using EXAFS experiments. In any case, we hypothesize that intercalation within
the graphite electrode dramatically improves retention of 1 under turnover conditions, and that
intercalation is not possible on smooth RGO, graphene, and MWCNT thin films.
To support this hypothesis, AFM images were taken of a polished graphite rod (prepared
in the same way as Reference 217), an RGO thin film, and a fd-RGO film. Chemically and
structurally, graphite and RGO are nearly identical. Both are made up of overlapping sheets of
partially oxidized aromatic carbon. However, from the AFM images in Figure 3.4, it is apparent
that the microscopic morphologies of the surfaces are very different. The average roughness of the
graphite surface is about an order of magnitude larger than that of RGO and the roughness of fd-

61
RGO is about twice that of graphite. These data support the hypothesis described above because it
suggests that the rougher graphite and fd-RGO surfaces are more porous and likely expose more
edges of the graphitic sheets, allowing access for 1 to diffuse into the material. RGO thin films, on
the other hand, display an extremely smooth surface, suggesting that the majority of the graphitic
sheets lie flat on the surface, limiting the number of exposed edges and access sites for intercalation
of 1. An exception may be the RGO published in Reference 218, on which catalyst adsorption was
stable under turnover conditions in up to 2 mM acid. This is a lower acid concentration than that
used here, but this RGO was also likely rougher than the RGO used here as a result of the
deposition method. The RGO in this thesis was dropcast from a colloidal suspension of GO onto
smooth glassy carbon surfaces, whereas the RGO in Reference 218 was electrodeposited on an
FTO electrode from a slurry of GO. Both the rougher FTO surface and the electrodeposition
method are likely to produce rougher RGO films that are capable of intercalating 1.
This effect can also explain why retention of 1 on graphene and MWCNT was minimal.
Graphene is an atomically smooth surface and has no layers that could allow intercalation.
MWCNT films are rougher than graphene; however, these films do not have the stacked sheets
structure that graphite and RGO have. Instead a MWCNT film is made up of a web of smooth
tubes, which may not facilitate trapping of 1.
Further experiments to confirm the hypothesis that intercalation plays a role in catalyst
retention should be conducted. XPS experiments coupled with ion sputtering can identify whether
1 intercalates within RGO films. These experiments have previously been conducted on graphite
electrodes and have shown that 1 does intercalate several tens of nanometers into the material.217
As an attempt to improve retention of 1 on the smooth carbon films where intercalation
may not be possible, Nafion films were cast onto the surfaces after 1 had been adsorbed. Nafion is
a proton-conducting polymer and should allow protons from the bulk solution access to 1 at the
electrode surface while preventing 1 from diffusing away from the electrode into solution.
Unfortunately, however, the retention of 1 on all carbon surfaces with the addition of Nafion is not
significantly different than without Nafion. In all cases catalytic current begins to drop off around
8 mM acid concentration (Figure 3.2). In the case of graphene/1, however, the Nafion appears to
keep the catalyst on the surface for longer than without Nafion. On a bare graphene/1 surface, the
current in 4 mM acid is only marginally higher than in 2 mM acid, whereas with Nafion, catalytic
current appears to increase with addition of acid until the acid concentration is 8 mM. It is worth

62
noting that when a Nafion film is present on any of the three electrode surface types, the onset of
current occurs at more positive potentials compared to electrodes without Nafion. The reason for
this is still unknown but hypothesized to be due to a different local pH at catalytic sites in a Nafion
matrix because of the acidic nature of Nafion itself. A poly-2-vinylpyridine (an electron
conducting polymer) thin film cast on each of these surfaces demonstrated a similarly poor ability
to prevent 1 from desorbing.
In order to understand the weak retention of 1 with a Nafion capping layer, AFM images
of Nafion films are shown in Figure 3.6. On all three carbon thin films, the Nafion layer contains
large, circular holes, up to 2 μm in diameter and 150 nm deep. Because of the highly symmetric
shape of the holes, they are attributed to air bubble formation in the Nafion solution as it dries into
a film. Because graphitic surfaces are generally more hydrophobic than silicon surfaces that have
been etched with O2 plasma, we predict that the alcohol/water solution of Nafion wets graphitic
materials more poorly and therefore is more likely to trap large air bubbles than when dropcast
onto a plasma-etched silicon surface.
3.5 Conclusions
In this work a molecular proton reduction electrocatalyst (1) was immobilized on graphitic
carbon electrodes through π- π interactions. The graphitic surfaces studied here are reduced
graphene oxide (RGO) thin films, single-layer graphene, and multiwalled carbon nanotube
(MWCNT) thin films. This work complements previous reports on the adsorption of 1 on graphite
rod electrodes and RGO thin films on FTO-coated glass electrodes.69, 217-218 X-ray photoelectron
spectroscopy demonstrates that 1 spontaneously adsorbs to the three types of graphitic surfaces,
but with a difference in binding energy. In particular, two different cobalt binding energies are
observed on RGO, which is consistent with previous reports.218 Further experiments are necessary
to understand this phenomenon. Electrochemical data show fast desorption from the surfaces under
turnover conditions, but retention of the catalyst under turnover is dramatically improved when a
rough RGO film is used (freeze-dried RGO) instead of a smooth dropcasted film. Based on these
data and the previous reports of long-term retention on graphite electrodes, we hypothesize that
intercalation within the graphitic structure plays a crucial role in immobilizing 1 on these carbon
materials.
Physisorption on carbon surfaces is a facile, cost-effective method for immobilizing
molecular catalysts on electrode surfaces. In particular, the catalyst in this report requires no

63
synthetic modifications in order to physisorb through π-stacking on a graphitic surface; and
graphitic thin films, particularly RGO, are easily and cheaply fabricated. This system demonstrates
a cost-effective approach toward heterogenizing molecular electrocatalysts. Future work should
be directed toward fabricating transparent RGO thin films with sufficient roughness to retain
adsorbed 1 during electrolysis. This might be achieved, for example, by dropcasting GO on a pre-
roughened surface or by roughening the GO film after dropcasting (e.g. with a laser-cutter).
Future experiments. First, as mentioned above, the nature of the catalyst adsorbed to each
graphitic surface should be identified. The chemical state of the catalyst can be determined using
x-ray photoelectron and x-ray absorption spectroscopies. One hypothesis described in the previous
section states that 1 may coordinate to oxygen functional groups on partially oxidized graphitic
surfaces (i.e. RGO and polished graphite) in addition to π-stacking with the graphitic network.
This hypothesis can be supported by adsorbing 1 to RGO containing varying quantities of oxygen
functional groups and monitoring the binding energy in XPS and the coordination number and
structure by XANES and EXAFS. Furthermore, it can be shown whether 1 intercalates within
these graphitic materials by using XPS coupled with sputtering experiments.
Next, the stabilities of the systems described in this chapter should be quantified.
Specifically, the rate of desorption of the catalyst from each type of surface should be quantified
in different pH levels. This can be done by performing bulk electrolysis coupled with XPS
measurements. For example, electrodes with adsorbed 1 should be held at a specific potential in a
solution with a defined pH for various lengths of time. XPS before and after the electrolysis
experiment can determine how much catalyst has been lost from the surface. In XP spectra of these
surfaces, the total amount of catalyst cannot be quantified, but by taking the ratio of Co 2p to C 1s
intensity, the relative amount of catalyst can be determined.
64
Paper in preparation.
4.1 Introduction
Previous studies have investigated kinetic parameters of electrocatalytic thin films that
undergo simple outer-sphere, one-electron transfers.221-224 Most of these studies include
electrocatalytic polymers, such as the polyvinylpyridine electrode coatings that incorporate IrCl62-
and RuII(edta) complexes described by Oyama and Anson225 or the poly[Ru(vbpy)3]2+ films
described by Ikeda, et al.226 among others.227-230 These systems undergo one-electron transfers
with metal complexes in solution. Through this work, methods have been developed for
determining rate limiting factors in electrocatalytic thin films, and numerical values for parameters
such as substrate diffusion and electron diffusion within a film were derived.
In addition to these, many reports have described the kinetics of more complex
electrocatalytic reactions. These include the oxidation of formaldehyde at a porphyrin-based
polymer on graphite,231 reduction of CO2 using a surface-bound Re polymer,232 reduction of O2 at
Pt nanoparticles dispersed in a polyaniline film,233 reduction of CO2 using cobalt sites coordinated
in a polymer on graphite electrodes,234-235 and others.236-238 Fewer reports, however, have
investigated the kinetics of electrocatalytic proton reduction in electrocatalytic films.239-242 This
area warrants further study as the proton reduction half reaction is relevant in electrochemical
energy conversion and storage. Understanding electrocatalytic generation of hydrogen in thin films
on electrode surfaces is crucial in developing efficient water splitting systems.
Reduced graphene oxide (RGO) thin films, as described in Chapter 2, are an ideal platform
in which to load electrocatalysts. RGO is made up of small sheets (nanometer to microns in
diameter) of partially oxidized graphene. Because RGO is fabricated from a solution-processable
precursor (graphene oxide), it can be cast as a thin film with controllable thickness. Furthermore,
RGO thin films can easily be loaded with an electrocatalyst by simple adsorption, as shown in
Chapter 4. Reduced Graphene Oxide Thin Films Embedded with a Molecular Catalyst:
Kinetic Considerations

65
Chapter 3. While RGO has been commonly used as a support for electrocatalysts,217-218, 243-246
studies on the fundamental kinetics of electrocatalyst-embedded RGO films are extremely rare.
One relevant example, by Huang and coworkers, determined kinetic parameters through cyclic
voltammetry and electrochemical impedance spectroscopy of a film formed by alternating RGO
sheets and layers of a cobalt porphyrin proton reduction electrocatalyst.247 This study, however,
assumed the electrocatalytic reaction itself was rate-limiting. This chapter takes an alternative
viewpoint: limitations on electrocatalytic current by diffusion and/or electron transport within the
film cannot be ruled out a priori. Because the structure of RGO films is significantly different than
that of polymer or metal oxide films, rates of electron transport and substrate diffusion within the
film are likely also different. It is therefore necessary to identify and understand rate limiting
behaviors in electrocatalytic RGO films.
Herein we report kinetic details of proton reduction by the molecular catalyst 1 (highlighted
in Chapter 3) when embedded within an RGO thin film. Catalyst 1 was chosen because of its high
catalytic activity for proton reduction, and because its ability to π-stack on graphitic surfaces
should decrease the likelihood of diffusing out of the RGO film.69, 217-218, 248 Graphene oxide films
embedded with 1 were dropcasted on glassy carbon electrodes and reduced electrochemically to
RGO. Thickness of the films and catalyst density within the films were controlled by manipulating
the volume and concentration of the GO-catalyst casting solution.
Figure 4.1 describes the processes that occur within these thin films during electrocatalysis.
In these RGO films, cobalt catalyst is distributed throughout the film and is symbolized as Co(III)
in Figure 4.1, as this is the cobalt oxidation state of 1 under ambient conditions. To initiate
catalysis, the cobalt center is reduced by two electrons to Co(I). This form of the catalyst then
converts protons within the film to hydrogen molecules. The rate constant of this reaction (k), the
diffusion of protons into the film from the bulk solution (DH+), and the diffusion of hydrogen
molecules out of the film to the bulk solution (DH2) each may be a kinetic limit on the obtainable
current. Additionally, the movement of electrons, here defined as the diffusion of electrons through
the film (De), may also limit the current.
The intent of the study was to identify operating conditions that maximize the
electrocatalytic current and turnover frequency by identifying which of the processes in Figure 4.1
primarily limit the current. Based on cyclic voltammetry measurements, it was determined that
below a certain thickness, current is primarily limited by slow diffusion of hydrogen out of the

66
film. Above this thickness, the current is limited by a convolution of hydrogen diffusion and
electronic resistivity of the RGO. An optimal film thickness was determined to be between 200
and 500 nm. Future experiments are delineated that will identify the optimal catalyst density.
Figure 4.1 Diagram showing the processes that occur within a thin film on an electrode surface
during electrocatalysis. The symbols are as follows: k is the rate constant for the catalytic reaction;
DH+ is the diffusion coefficient of protons within the film; DH2 is the diffusion coefficient of
hydrogen within the film; De is the diffusion coefficient of electrons within the film; Co(III) is
oxidized form of the catalyst; Co(II) is the reduced form of the catalyst after one electron transfer.
4.2 Experimental
Materials. Sodium phosphate dibasic, phosphoric acid, trifluoroacetic acid (TFA, 99%,
Sigma Aldrich), potassium permanganate (98%, Acros), sulfuric acid (ACS grade, Fisher
Scientific Education), and hydrogen peroxide (30% in H2O, Sigma Aldrich) were used as received.
Potassium hexafluorophosphate (95%, TCI) was recrystallized from aqueous 0.1 M KOH before
use. Graphite flakes (-20+84 mesh, Johnson Matthey) were used as the carbon source for graphene
oxide suspensions. Water with a resistivity >18.2 MΩ (Nanopure Barnstead Water Purification)
was used throughout. Glassy carbon electrodes (3 mm diameter disk electrodes, CH Instruments)
were prepared by polishing with alumina (1 μm, 0.3 μm, and 0.05 μm alumina suspensions) on felt

67
and rinsing with water. Polished Si(111) wafers from Wafer Works doped with As (≤0.006 Ω cm-
1) were used as substrates for AFM imaging.
Preparation of graphene oxide suspensions. See Chapter 2.2 Experimental for details on
preparing graphene oxide.
Synthesis of 1. In an inert atmosphere box under N2 pressure (Innovative Technologies), a
solution of 3,6-dichloro-1,2-benzenedithiol (0.5 g, 2.4 mmol) and sodium methoxide (0.128 g, 2.4
mmol) was added dropwise to a suspension of cobalt(II) sulfate heptahydrate (0.320 g, 1.14 mmol)
in 40 mL of dry methanol in a roundbottom flask. The addition caused a color change to deep blue.
The resultant solution was stirred for 2 hours. A solution of tetrabutylammonium bromide (0.407
g, 1.2 mmol) in 6 mL dry methanol was added at this time, and the solution was stirred for an
additional 2 hours. The sealed flask was then removed from the glovebox and the solvent volume
was reduced under vacuum to <10 mL, resulting in a thick, dark blue slurry. This was filtered and
dried. The solid was then recrystallized from dichloromethane/ether to yield 1 as a dark blue
crystalline solid (50% yield). The UV-visible absorption spectrum matched that in the literature.218
Preparation of RGO and catalyst-embedded RGO thin films. A small volume of the
graphene oxide suspension was removed and sonicated for 20 minutes to exfoliate and disperse
fully individual graphene oxide sheets. This volume was then centrifuged at 9000 rpm for 30
minutes. The brown supernatant was removed. Its concentration was approximately 2 mg mL-1.
This suspension was combined with a defined volume of a solution of 1 in acetonitrile or with the
same volume of clean acetonitrile and then dropcasted on a glassy carbon surface and allowed to
air dry. The thickness of the film was controlled by controlling both the volume and the
concentration of the dropcasted suspension. The films were reduced to RGO electrochemically by
cycling between open circuit potential and -1 V ten times in the same pH 2 electrolyte solution
used for electrochemical measurements.
Electrochemical measurements. Electrochemical measurements were taken using a CH
Instruments 760C potentiostat. A three-electrode cell was used with a graphite rod as the counter
electrode and Ag|AgCl (sat’d KCl) (in a compartment separated by a glass frit) as the reference
electrode. All potentials are referenced to Ag|AgCl (sat’d KCl). For measurements taken in a non-
buffered solution, the electrolyte was deaerated 0.1 M KPF6 with trifluoroacetic acid (pH 2). For
measurements taken in a buffered solution a deaerated pH 2 phosphate buffer of approximately
0.2 M concentration (prepared from sodium phosphate dibasic and phosphoric acid) was used. All

68
voltammetry presented in this chapter was background subtracted by averaging four
voltammograms of RGO films containing no catalyst and subtracting this averaged data from the
voltammetry of the RGO film with catalyst of the same thickness. The data points in the current
and TOF versus thickness plots are averages of four background-subtracted voltammograms.
Atomic Force Microscopy. Film thickness was measured by dropcasting a 3-mm diameter
droplet of the appropriate volume and concentration of graphene oxide on a degreased polished
silicon wafer. After drying, a clean syringe needle was used to gently score the film in several
places to create a step edge. A Veemco Dimension Icon Atomic Force Microscope in contact mode
was used to collect images. A sample image is shown in Figure 4.2. The thickness was estimated
by measuring the height along the dotted blue line and averaging vertically between the two dotted
white lines. At least three regions on between one and three different samples for each film
thickness were measured and averaged. The error bars for these thicknesses are the standard
deviation of these averages.
Optical Profilometry. An Olympus LEXT OLS4100 laser scanning digital microscope was
used to measure the thickness of the thickest film. One region on a single film was measured and
averaged over 50 μm. The error bar for this data point is based on the precision of the instrument
(10 nm) rather than the average of discrete samples (in contrast to the data points based on AFM
measurements).
Figure 4.2 (Left) Representative AFM image of an edge site on a 200 ± 100 nm film. The film
thickness was measured in this region by taking a profile across the blue dashed line and
averaging vertically between the two horizontal white dashed lines. This averaged profile is
shown on the right.

69
4.3 Results
Figure 4.3 Background subtracted linear sweep voltammetry of a series of film thicknesses with
a catalyst density of 2x10⁻⁴ mol catalyst per cm3 of RGO. The supporting electrolyte was a
deaerated ~0.2 M phosphate buffer at pH 2. Scan rate was 10 mV s-1.
Figure 4.3 shows background-subtracted linear sweep voltammograms of a series of
RGO/1 films of various thicknesses in a pH 2 buffer. The volumetric density of 1 within these
films was kept constant (about 2x10⁻⁴ mol catalyst per cm3 of RGO), meaning thicker films contain
more catalyst than thinner films. The voltammogram for each film begins to rise just negative of -
0.6 V. For the thinner films, the current appears to reach a plateau at negative potentials, around -
0.9 V. The thicker films do not reach a plateau within this potential window. At a given potential
within this window, the current for each film increases with increasing film thickness (i.e.
increasing total loading of 1). The current and turnover frequencies from these voltammograms
are plotted versus film thickness in Figure 4.4. Figure 4.4a plots the current at the relatively low
potential of -0.95 V, where current is high. Unfortunately, because of the low quantities of catalyst
within the films, the E1/2 of 1 was not determined. Previous studies on this catalyst in solution248
and adsorbed to graphite electrodes217 report the E1/2 as -0.46 and -0.65 V, respectively, vs
Ag|AgCl at pH 7. The data in Figures 4.4a and 4.4b were taken at -300 mV overpotential with
respect to the E1/2 of the catalyst on a graphite electrode. At this potential, the current continually
rises as thickness increases. If a point at the origin is considered in addition to the data shown (at
0 nm film thickness, the current should be 0 mA) then the current appears to steeply increase at

70
lower film thicknesses and begins to reach a plateau with thicker films. This trend is consistent
with what has been seen in the literature. For example, simulated cyclic voltammograms by C.
Costentin and J.-M. Saveant under conditions where the solvent is the substrate for electrocatalysis
showed plateaued currents as film thickness increased.222 It should be noted that the data point
corresponding to a 600 nm film does not follow a clear trend with the other data points and should
probably be re-measured. In Figure 4.4b, the turnover frequency (TOF) calculated from the
voltammograms at -0.95 V is plotted. TOF values at this potential decrease as film thickness
increases, leveling off around 7 s-1.
Figure 4.4c plots the current at a potential closer to the onset of catalysis, -0.67 V,
approximately 20 mV negative of the reported E1/2 for 1 on graphite electrodes at pH 7. At this
potential current is very low, so the effects of product (H2) buildup within the film should be
minimal. The shape of the current versus thickness curve is similar to that at -0.95 V. Interestingly,
however, the shape of the TOF versus thickness curve (Figure 4.3d) is quite different. TOF
increases with increasing film thickness, reaching a maximum around 200 ± 100 nm and then
decreasing.
To further determine limiting factors on current, a series of films of varied thickness with
a constant amount of catalyst (1.7 ± 0.2 x10⁻¹⁰ moles) were prepared. Figure 4.5 shows a set of
Figure 4.4 Plotted current and TOF versus film thickness from background-subtracted
voltammetry in Figure 4.3. (a) Current at -0.95 V. (b) TOF at -0.95 V. (c) Current at -0.67 V. (d)
TOF at -0.67 V. The data point corresponding to a 600 nm film does not follow a clear trend
with the other data points and should probably be re-measured.

71
Figure 4.5 Background subtracted linear sweep voltammetry of a series of film thicknesses with
1.7 ± 0.2 x10⁻¹⁰ mole catalyst in each film. The supporting electrolyte was a deaerated ~0.2 M
phosphate buffer at pH 2. Scan rate was 10 mV s-1.
Figure 4.6 Plotted current (a) and TOF (b) versus film thickness from the background-subtracted
voltammetry in Figure 4.5.
voltammograms from this series of films. It is obvious that the same trend as Figure 4.3 is not seen
here – the current does not trend upward with film thickness. Figure 4.6 plots the current at -0.95
V versus film thickness and Figure 4.6b plots the TOF at this potential. Current and TOF increase

72
with increasing film thickness up to between 200 and 600 nm where it then begins to drop off.
Interestingly, this is a similar trend that is seen with TOF in Figure 4.4d.
Figure 4.7 shows cyclic voltammograms of two electrodes containing layered films. One
electrode was prepared by dropcasting a 600 ± 300 nm film containing 1.7 ± 0.2 x10⁻¹⁰ moles of
catalyst, and after drying, a second 600 ± 300 nm film with no catalyst was cast on top. The
voltammogram for this electrode is in black. The other electrode was prepared in a reverse order:
a 600 ± 300 nm film with no catalyst was first cast and dried and then a 600 ± 300 nm film
containing 1.7 ± 0.2 x10⁻¹⁰ moles of catalyst was cast on top. The voltammogram for this electrode
is in red. Both voltammograms reach similar currents. In comparison, in blue is the voltammogram
of the 600 ± 300 nm film with 1.7x10⁻¹⁰ moles of catalyst taken from Figure 4.5. This film reaches
a much higher current than either of the layered films.
Figure 4.7 Background subtracted linear sweep voltammetry of three catalyst containing films. In
blue is the voltammogram from Figure 4.5 (the 600 ± 300 nm film containing 1.7 ± 0.2 x10⁻¹⁰ mol
catalyst). In black and red are voltammograms from similar films but with an additional 600 ± 300
nm RGO film cast on top of and below, respectively, the catalyst-containing film. Supporting
electrolyte was a deaerated ~0.2 M phosphate buffer at pH 2. Scan rate was 10 mV s-1.
4.4 Discussion
From the data described above we conclude that electrocatalytic proton reduction in RGO
films embedded with the catalyst 1 is limited by both product buildup within the film (i.e. H2

73
diffusion) and electronic conductivity of the films. For thinner films (below about 500 nm),
hydrogen diffusion out of the film is the limiting factor, and for films thicker than about 500 nm,
current is limited by a convolution of both hydrogen diffusion and electronic conductivity of the
films.
The data in Figures 4.4a and 4.4b demonstrate two things. First, both substrate and
electrons can penetrate the film (i.e. more than just the surface layer of catalyst is active). This is
evidenced by the increase in current with thicker films. Second, film thickness plays a role in
limiting the rate of catalysis. This is apparent because of the plateau that the current reaches with
thicker films and because of the decrease in TOF as film thickness increases. Therefore, current is
likely not limited by the electrocatalytic rate constant and is instead limited by one of three things
related to film thickness: proton diffusion into the film, electronic conductivity of the film, or
hydrogen diffusion out of the film.
C. Costentin and J.-M. Savéant published three papers on the use of cyclic voltammetry to
analyze kinetics of electrocatalytic thin films.222-224 In these reports voltammetry is simulated
under several assumptions. One, the catalytic reaction is an outer-sphere, one-electron transfer
between a catalytic site within the film and a dissolved species than can penetrate the film. Two,
the catalyst is homogeneous throughout the film, meaning every catalyst site operates by the same
mechanism and at the same electrochemical potential and there is a uniform distribution of catalyst
throughout the film. Three, the electrode surface is not active for electrocatalysis in the reported
potential range (in other words, the only redox chemistry that occurs is electrocatalysis at catalytic
sites and self-exchange between adjacent catalyst sites). Four, electron conduction within the film
operates by a hopping mechanism and can therefore be described by Fick’s laws of diffusion. The
authors also assume that only three factors can affect electrocatalytic current: substrate diffusion,
electron diffusion, and reaction rate. In each paper, one of these factors is presumed to be fast,
thereby reducing the number of possible limiting factors. In the following paragraphs I compare
the data in Figure 4.4 to the models in these three papers and show that the predictions from the
models do not match the data.
In each of these reports, current is plotted versus film thickness and the trend in Figure 4.4
can be observed, namely an increase in current with film thickness eventually reaching a plateau.
This trend is shown in Figure 4.8, and the similarity between this figure and Figures 4.4a and c are
apparent. According to these reports, the intersection of the linear portion of the current vs

74
thickness curve with the plateau current is defined as the optimum film thickness, 𝑑𝑓𝑜𝑝𝑡
. In the case
where the catalytic reaction is fast (k is large), 𝑑𝑓𝑜𝑝𝑡
is defined by equations 4.1 and 4.2.224 Equation
4.1 applies when electron diffusion is far smaller than substrate diffusion. Equation 4.2 applies
when substrate diffusion is far smaller than electron diffusion. The parameters in these equations
are as follows: 𝑑𝑓𝑜𝑝𝑡
is the optimum film thickness; De is the diffusion coefficient of electrons in
the film; DS is diffusion coefficient of substrate (H+ ions in this case) within the film; k is the rate
constant for the catalytic reaction; κA is the partition coefficient of H+ ions between solution and
film (unitless); 𝐶𝐴0 is the initial concentration of substrate in the bulk solution. Equation 4.1 also
applies when the solvent is the substrate, i.e. where substrate diffusion within the film is not
limiting.222
𝑑𝑓𝑜𝑝𝑡 = √
𝐷𝑒
𝑘κ𝐴𝐶𝐴0 4.1
𝑑𝑓𝑜𝑝𝑡 = √
𝐷𝑆
𝑘𝐶𝐴0 4.2
Figure 4.8 Illustration of a current versus thickness trend for an electrocatalytic film that follows
the assumptions in the reports by Savéant and Costentin.222-224 The green circles are the current at
a defined potential from cyclic voltammetry measurements. The dashed lines show the intersection
between the linear portion at the beginning of the curve and the plateau region. The thickness at
this intersection is the optimum film thickness.

75
Figure 4.9 Replotted data from Figure 4.4c with gray dashed lines corresponding to the linear
portion at the lower end of the curve and the plateau current. The intersection of these dashed lines
is at the optimum thickness 𝒅𝒇𝒐𝒑𝒕
.
To determine whether the RGO/1 system obeys this model, the value for 𝑑𝑓𝑜𝑝𝑡
was first
determined from the data in Figure 4.4c. These data are replotted in Figure 4.9 with a linear fit for
the data points for the thinnest films. From this figure, it is seen that 𝑑𝑓𝑜𝑝𝑡
is approximately 300
nm. Subsequently, 𝑑𝑓𝑜𝑝𝑡
was calculated using Equations 4.1 and 4.2, with the parameters estimated
in the following manner. DS was approximated based on literature values. The upper limit was set
at 10-6 cm2/s based on a published diffusion coefficient of protons along the surface of a graphene
sheet249 and the lower limit was set at 10-12 cm2/s based on published diffusion coefficients of Li+
ions in graphite.250 κA was estimated by using the reported value of 0.93 for a GO film.251 Assuming
the value of κA for RGO does not differ by more than an order of magnitude, this value is a good
approximation. The value of 𝑘𝐶𝐴0 was calculated using the foot-of-the-wave (FOWA) method from
a cyclic voltammogram of surface-adsorbed 1 on RGO in 2 mM trifluoroacetic acid solution
(Figure 4.10). The value obtained was 1.5x10⁻⁵ cm/s. Lastly, the value of De was calculated from
the conductivity of RGO (reported in Chapter 2 of this thesis as 104 S/m) as follows. Conductivity
is related to mobility of electrons:
𝜎 = 𝑒𝑛𝜇𝑒 4.3
where σ is conductivity; e is the charge of an electron (1.602x10⁻¹⁹ C); n is the density of mobile
electrons, estimated to be 1020 cm-3 based on literature;252 and μe is the mobility of electrons. Using
Equation 4.3 and the values listed for each parameter, the mobility of electrons in these RGO films
is about 6.2 cm2 V-1 s-1. Following this, the diffusion coefficient of electrons can be calculated
using the Einstein Relation:

76
𝐷𝑒 =𝜇𝑒𝑘𝐵𝑇
𝑒 4.4
where kB is the Boltzmann constant; T is temperature; and e and μe are the same as listed as above.
Using Equation 4.4, De is calculated to be 0.16 cm2/s.
Figure 4.10 Left, cyclic voltammogram of surface adsorbed 1 on an RGO thin film on a glassy
carbon electrode in deaerated 0.1 M KPF6 and 2 mM trifluoroacetic acid at a scan rate of 50 mV
s-1. Right, FOWA fitting using the data from the voltammogram on the left. The black dotted line
is the data and the red line is the linear fit. The value for Ecat/2 was taken as -0.82 V (the potential
at half the current of the peak current). The slope of the line is 6.6x10⁻⁵ A, which is equal to
𝟐. 𝟐𝟒 (𝑹𝑻
𝑭𝒗)
𝟏 𝟐⁄
(𝟐𝒌𝑪𝑨𝟎)
𝟏 𝟐⁄.
Finally, 𝑑𝑓𝑜𝑝𝑡
can be calculated using the relationships in Equations 4.1 and 4.2. Using the
former, 𝑑𝑓𝑜𝑝𝑡
is 108 cm, and using the latter, 𝑑𝑓𝑜𝑝𝑡
is between 2.5 μm and 2.5 mm (depending on
the value used for DS). The values for 𝑑𝑓𝑜𝑝𝑡
calculated in both cases are orders of magnitude
different from the real value of 300 nm, demonstrating that these equations are not good models
for the system described here. Most likely, product inhibition is not accounted for in the Costentin
& Savéant model.
In the case where the film conductivity is assumed to be fast, instead of using 𝑑𝑓𝑜𝑝𝑡
, the
peak current, Ip, can be determined from film thickness (within the linear region of the current vs
film thickness plot) based on the parameters described above.223 The relationship is shown in
Equation 4.5.
𝐼𝑝 = 𝐹𝑘𝐶𝑝0κ𝐴𝐶𝐴
0𝑑𝑓 4.5
77
The parameter 𝐶𝑝0 is the concentration of catalyst sites within the film. For films used in
Figure 4.4, that value is 2x10⁻⁴ mol/cm3. Estimated values for the other parameters are listed above
in the description for use of Equations 4.1 and 4.2. Using df = 200 nm as an example, the value of
Ip calculated using Equation 4.5 is 5.3x10⁻⁹ A, far smaller than the approximately 3.8x10⁻⁵ A in
Figure 4.4.
In summary, assuming the values used for DS, De, and κ are good estimates, the data in
Figure 4.4 do not agree with the models in any of these three reports. Therefore, it can be concluded
that the electrocatalytic current in the system described here is not limited purely by substrate
diffusion, catalytic rate, or electron diffusion. One possibility is that a combination of these factors
limits the current. Another possibility is that there is a fourth factor that contributes to limiting
current. This may be by product inhibition because of slow product (H2) diffusion out of the film,
bubble formation, or poisoning of the catalyst with H2 molecules. It may be possible to model
product inhibition by addition of an expression or term in Equations 4.1, 4.2, and 4.5. Further work
on this front should be pursued.
The data shown in Figure 4.6 help to further understand this system. These data were taken
without varying the total amount of catalyst in the films. Because of the initial increase in TOF
with film thickness in Figure 4.6, it is apparent that at least for thinner films, conductivity is not a
limiting factor. Instead, we hypothesize that the increase in current and TOF (with no increase in
the total amount of catalyst present) is due to a decrease in the concentration of catalyst within the
film, which limits overlap of the diffusion radii of the catalyst sites.
For films thicker than about 500 nm, the current and TOF start to decrease with increasing
film thickness. Currently, there is more than one possible explanation for this phenomenon. First,
conductivity of the films may start to play a role in limiting current in films thicker than about 500
nm. Second, the structure or morphology of the film may be different with thicker dropcasted films
compared to thinner ones. For example, thinner films may have a higher relative roughness, allow
for easier penetration of substrate or escape of product. More characterization is necessary to
determine the reason for this decrease in TOF with thicker films, but the data in Figure 4.7 helps
to speak to this point.
In Figure 4.7, each of the three voltammograms are from films of equivalent thicknesses
(600 ± 300 nm) containing equivalent amounts of catalyst (1.7 ± 0.2 x10⁻¹⁰ moles). The black and
red voltammograms are from films that also contain a 600 ± 300 nm RGO film on top of and below

78
the catalyst-containing film, respectively. Because the current in each of these voltammograms is
equivalent and much lower than the blue curve, it suggests that at this film thickness, both
substrate/product diffusion in the film and electron conduction within the film play essentially
equivalent roles in limiting the total current. In other words, with an RGO film on top of the
catalyst-embedded film, diffusion of species to and from the bulk solution is hindered; and with
an RGO film below the catalyst-embedded film, conduction of electrons to catalyst sites within
the film is hindered to an equal extent. Thereby the current from both electrodes in Figure 4.7 is
similarly inhibited.
Future work. First, to definitively confirm that the data presented here do not follow the
models in the reports by Savéant and Costentin, the estimated parameters should be measured. The
value of De for these RGO films can be determined by measuring the mobility with Hall or field-
effect measurements on RGO thin films. Then the real value of DS can be measured by a variety
of methods including electrochemical impedance spectroscopy,250 potential step
chronoamperometry,250 or water permeability measurements.251 De and DS can then be compared
directly to each other. The partition coefficient κ can be measured by determining water uptake in
an RGO film (by mass change). These three parameters should then be used to calculate the value
of 𝑑𝑓𝑜𝑝𝑡
using Equations 4.1 and 4.2 and the value of Ip using Equation 4.5.
Additionally, it should be determined whether morphological changes of the film may
cause variations in limiting current for different film thicknesses. This can be analyzed by using
statistical AFM imaging (i.e. many images over a large area of each film) or with mapping Raman
spectroscopy. The distribution of catalyst within the film can be identified using mapping XPS
with sputtering.
Since the data consistently suggests that a diffusional process controls the current in thinner
films, experiments should be performed to determine whether H+ diffusion or H2 diffusion is the
limiting factor. This can be done in several ways. First, the ability of H2 to slow down the catalytic
reaction should be determined. This can be done by performing electrocatalysis using 1 under an
atmosphere of H2. The obtained currents can be compared to currents under an atmosphere of N2.
If currents under H2 are lower than currents under N2, this is good evidence that buildup of product
within the films can limit the electrocatalytic current. If the reaction is reversible under an
atmosphere of H2, then this is evidence that product buildup specifically limits current by Le
Chatelier’s Principle. Second, H+ diffusion may be limited by counterion (phosphate) diffusion
79
within the RGO films. This can be evaluated by using different buffers with different sized anions.
If buffers with smaller anions produce larger electrocatalytic currents, then this is evidence that H+
diffusion within the film primarily limits the current.
The data in Figures 4.4 and 4.6 suggest that the optimal film thickness is between 200 and
500 nm thick (the thickest film before TOF starts to decrease). Further experiments should keep
film thickness constant within this range and vary the amount of catalyst within the film to find
the optimum catalyst density. Factors affecting current may change depending on catalyst density;
for example, in films with a high catalyst density, self-exchange of protons or electrons may occur,
which may impact catalytic rate or transfer of electrons through the film.
Lastly, to be sure that catalytic rate is a not a limiting factor, kinetic isotope effect (KIE)
experiments can be carried out on surface-adsorbed 1 and embedded 1 to determine whether the
rate limiting step changes when 1 is embedded.
4.5 Conclusions
This chapter describes the kinetic factors that limit catalytic current in RGO thin films
embedded with a molecular proton reduction electrocatalyst. Based on linear sweep voltammetry
data, it was determined that film thickness plays a role in limiting catalytic current. Comparison
of the data obtained here with previously published simulated voltammetry demonstrates that the
electrocatalytic current in this system is not limited by a single process. Instead, multiple processes
can affect the current simultaneously. Specifically, for films thinner than between 200 and 500
nm, current is limited by diffusion of substrate or product into or out of the film, whereas for
thicker films, RGO conductivity also plays a role in limiting catalytic current. For films that are
600 ± 300 nm thick, electrical conductivity of RGO and diffusion of species within the film play
essentially equal roles in limiting the catalytic current. The conclusions drawn from the data in this
chapter apply to the conditions described here, i.e. in deaerated 0.2 M phosphate buffer at pH 2
and at -0.67 V and -0.95 V versus Ag|AgCl. Varying pH, electrolyte identity and concentration,
and applied potential may change the behavior of the electrocatalytic films. This is the first study
on fundamental kinetics of proton reduction electrocatalysis in RGO thin films, and the results
obtained here highlight several further directions that should be pursued. For example, increasing
the porosity of the films to allow faster H+ and H2 diffusion may allow for larger catalytic currents.
Also, the counterion dependence of the current should be investigated, as this can be a critical
factor.

80
Adapted from Journal of Electrochemical Society, Vol. 166, “Discovery of Unusually Stable
Reduced Viologen via Synergistic Folding and Encapsulation,” MacInnes, M. M.; Cousineau, B.
R.; Youngs, S. M.; Sinniah, K.; Reczek, J. J.; and Maldonado, S. H825-H834, Copyright 2019.
5.1 Introduction
Viologens (1,1’-disubstituted-4,4’-bipyridinium ions) are an important class of redox
species. They have received attention for use as electron acceptors in fundamental studies of
chemical and electrochemical charge transfer,253-254 as the charge storage medium in redox flow
batteries,255-260 as the active material in electrochromic devices,261-262 and as the redox-active
component in molecular machines.263-266 Their appeal in these applications derives from their
stability, highly reversible redox character, and relative ease of sythesis.255-262 Viologen dications
reversibly undergo one-electron reductions to form highly stable radical cations.253-254 This
transition is fast because it involves minimal bond length and angle change (i.e. the reorganization
energy is low).254 A second one-electron reduction forms the neutral species, but this transition is
not considered fully reversible in polar and protic solvents because of its low solubility in these
solvents.254
A disadvantage of viologens in energy and electronic applications is the reactivity of the
reduced viologen radicals with O2.253, 267-268 For species like methyl viologen radicals (MV•+), the
rate constant for oxidation by O2 is large (8 x 10⁸ M-1 s-1),269 effectively at the diffusion limit.
Strategies to inhibit parasitic oxidation of reduced viologens by O2 are therefore of significant
importance.
One potential approach to stabilize reduced viologens is by embedding them inside
protective structures.137, 143, 264, 270-277 In this vein, viologens have been inserted in polymers,138, 278-
288 micelles,270-271, 273-275 and macromolecules.137, 140, 289-290 In particular, inclusion complexes
between viologens and cucurbit[n]urils (CB[n]), a class of rigid and water-soluble macrocyclic
Chapter 5. Discovery of an Unusually Stable Reduced Viologen via Synergistic Folding and
Encapsulation

81
host molecules, have been shown to tune the redox potentials of viologens.143, 264, 272, 276, 291-293
However, enhanced stability of the reduced forms in the presence of O2 has yet to be shown.
In this work, we explore the concept that a hierarchical supramolecular assembly can form
structures that inhibit parasitic reaction with O2. Herein, we report the design, assembly, and
electrochemical behaviors of covalently-linked viologen dimers complexed with cucurbit[7]uril
(CB[7]) and cucurbit[8]uril (CB[8]) in aqueous solution. The internal diameters of CB[7] and
CB[8] are 11.33 Å and 12.95 Å, respectively.294 To avoid confusion, in this report the term “dimer”
refers strictly to two viologens covalently bound through a defined linker. Two specific linkers are
explored: an ortho-benzyl group (2) and a propyl group (3) (Figure 5.1). These linkers space two
methyl viologen units by the similar short N-N’ distance of approximately 5 Å but differ in
equilibrium geometry and linker rigidity. The electrochemical and spectroscopic data presented
here indicate that when these viologen dimers are reduced in the presence of cucurbit[8]uril
(CB[8]), a unique and unusually stable monoradical species is formed. We show that specifically
the combination of the structure of the viologen dimer with subsequent encapsulation by CB[8] is
required to form a stabilized, reduced radical. Further, data are presented that distinguish these
stabilized species from viologen “pimers” which have been extensively studied previously.254, 295-
299 This is the first time that a monoradical viologen dimer has been isolated through use of
supramolecular assemblies, and it is the first report of a solubilized viologen radical species that
is significantly stabilized in the presence of oxygen.
Figure 5.1 Depictions of 24+, 34+, CB[8], and CB[7].

82
5.2 Experimental.
Chemicals and materials. Anhydrous dibasic sodium phosphate (Sigma Chemical
Company), monobasic potassium phosphate (99.6%, J.T. Baker, Inc.), sodium dithionite (≥82%,
Sigma Aldrich), cucurbit[7]uril hydrate (CB[7], Sigma Aldrich), cucurbit[8]uril hydrate (Sigma
Aldrich), iodomethane (99%, Sigma Aldrich), 4,4’-bipyridine (98%, Sigma Aldrich), DMF
(≥99.8%, Sigma Aldrich), ,’-dibromo-o-xylene (97%, Sigma Aldrich), and deuterated water
(99.8 atom %, Acros Organics) were used as received. Water with a resistivity >18.2 MΩ
(Nanopure Barnstead Water Purification) was used throughout. Glassy carbon electrodes were
prepared by first polishing with alumina (1 μm, 0.3 μm, and 0.05 μm alumina suspensions) on felt
and then sonicating in methanol for 30 minutes. A carbon cloth electrode was used for bulk
electrolysis and was prepared by thoroughly rinsing with clean water. Platinum mesh was used as
a counter electrode. For bulk electrolysis experiments, the platinum mesh was isolated from the
working electrode by a frit.
Synthesis of N-Methyl-4,4’-bipyridinium iodide. Iodomethane (1.20 mL, 19.2 mmol, 1.0
eq.) was added to 4,4’-bipyridine (2.9994 g, 19.2 mmol, 1.0 eq.) in CH2Cl2 (50 mL). The solution
was stirred at room temperature for 24 hours. A bright yellow solid precipitated out. The solid was
filtered and any residual 4,4’-bipyridine washed away with diethyl ether (3 x 10 ml), yielding N-
Methyl-4,4’-bipyridinium iodide (86.5 %, 4.9497 g). 1H NMR of the solid showed > 99% with no
trace of starting material, and the collected solid was used directly in the synthesis of 2 and 3.
Synthesis of 2. N-Methyl-4,4’-bipyridinium iodide (0.6035 g, 2.0 mmol, 2.2 eq.) was
reacted with ,’-dibromo-o-xylene (0.2432 g, 0.92 mmol, 1.0 eq.) in DMF (30 mL). The solution
was stirred at 60C for 3 days with a rubber septum and vent needle. An orange product
precipitated out. The product was filtered and washed with DMF (2 x 10 mL) to completely remove
any residual N-Methyl-4,4’-bipyridinium iodide, yielding 1 (87.0 %, 0.6893 g). 1H NMR (400
MHz, D2O) 9.194(d, J = 6.8 Hz, 4H), 9.112(d, J = 6.4 Hz, 4H), 8.669(d, J = 6.8 Hz, 4H), 8.598(d,
J = 6.8 Hz, 4H), 7.695(d, J = 9.2 Hz, 2H), 7.423(d, J = 9.2 Hz, 2H), 6.229(s, 4H), 4.554(s, 6H)
ppm; 13C NMR (400 MHz, D2O) 151.066, 149.571, 146.438, 145.901, 131.451, 130.981,
130.837, 127.579, 126.908, 61.362, 48.531 ppm. Analysis by analytical HPLC showed > 99%
purity of 1 in the recovered solid. A schematic depiction of the synthetic protocol and the 1H NMR,
13C NMR spectra are shown in Figures 5.2-5.4 respectively.

83
Synthesis of 3. N-Methyl-4,4’-bipyridinium iodide (0.6163 g, 2.1 mmol, 2.2 eq.) was added
to 1,3-dibromopropane (0.094 mL, 0.93 mol, 1.0 eq.) in DMF (30 mL). The solution was stirred
at 60C for 3 days with a rubber septum and vent needle. A yellow product precipitated out. The
product was filtered and washed with DMF (3 x 10 mL) to completely remove any residual N-
Methyl-4,4’-bipyridinium iodide, yielding 3 (35 %, 0.258 g). 1H NMR (400 MHz, D2O) 9.098(d,
J = 6.8 Hz, 4H), 8.936(d, J = 6.8 Hz, 4H), 8.484(d, J = 6.8 Hz, 4H), 8.408(d, J = 6.8 Hz, 4H),
4.873(t, J = 8.0 Hz, 4H), 4.368(s, 6H), 2.859(m, J = 7.9 Hz, 2H) ppm; 13C NMR (400 MHz, D2O)
150.817, 149.677, 146.409, 145.805, 127.522, 126.841, 58.306, 48.483, 31.905, 30.324 ppm.
Analysis by analytical HPLC showed > 99% purity of 1 in the recovered solid. A schematic
depiction of the synthetic protocol and the 1H NMR, 13C NMR spectra are shown in Figures 5.2-
5.4 respectively.
Figure 5.2 Syntheses of 24+ and 34+. Details for these syntheses are described below.

84
Figure 5.3 1H NMR spectra of a) an aqueous D2O solution of 24+ and b) an aqueous D2O solution
of 34+. The peaks are labeled corresponding to the protons in the structures above.
Figure 5.4 13CNMR spectra of 24+ (left) and 34+ (right). The peaks are labeled corresponding to the
carbon atoms in the structures above.
1 2 3
45
6
7 8
9
10
11 1
23
4
5 6
7
8
9

85
Preparation of viologen-cucurbituril mixtures. All viologen-cucurbituril solutions were
prepared by first dissolving the appropriate amount of viologen in water (or D2O) or buffer
solution. Cucurbituril was then added in excess and the solution was stirred for at least 2 hours.
The undissolved cucurbituril was filtered out using a 0.2 μm nylon syringe filter. Based on NMR
integrations, this resulted in a 1:1 ratio of 24+:CB[8]; a 1:1 ratio of 34+:CB[8]; a 1:3 ratio of
24+:CB[7]; and a 1:3 ratio of 34+:CB[7].
Isothermal titration calorimetry (ITC). ITC data was obtained on a Nano ITC Standard
Volume instrument from TA Instruments. Experiments were performed in 10 mmol sodium
phosphate buffer and all solutions were degassed for 25 min at room temperature prior to running
ITC experiments. The reference cell in the ITC was filled with degassed ultrapure water (18.2 MΩ
cm-1 resistivity). Experiments were run in multiple-injection mode with 20 injections (12 μL each)
with 1000 s injection intervals. The stir rate was 250 rpm. Once the cell had been filled and the
syringe loaded, stirring was turned on and the apparatus was allowed to autoequilibrate. All data
were recorded with the TA Instruments software provided, ITCRun version 2.2.3. The area under
each peak was integrated, and the resulting data were further analyzed using TA NanoAnalyze
version 2.4.1, fitting to a 1:1 binding model of dimer to cucurbituril.
Absorbance Measurements. UV-visible-NIR absorbance spectra were obtained using a
Varian Carey 5000 UV-vis-NIR spectrophotometer. Solutions of 0.25 mM viologen with and
without approximately 1 equivalent of cucurbituril were electrolyzed and immediately syringed
into a 1-cm quartz cuvette sealed with a septum that had been flushed with N2. The supporting
electrolyte was deaerated 0.075 M phosphate buffer (pH ~7) using sodium monohydrogen
phosphate and potassium dihydrogen phosphate. Backgrounds were taken using plain electrolyte
solutions. Absorbance changes upon exposure to O2 was monitored using an Analytik Jena
SPECORD S600 spectrophotometer. Solutions used for these experiments were 30 μM viologen
in 0.075 M phosphate buffer (pH 7). Solutions containing cucurbituril were prepared by dissolving
excess cucurbituril in the buffered viologen solution, stirring for at least two hours and then
filtering through a 0.2 μm nylon syringe filter to remove undissolved cucurbituril. These solutions
were electrolyzed to 100% under a stream of nitrogen and then the electrodes and nitrogen stream
were removed and an immersion probe (Hellma Analytics) was quickly inserted. Spectra were
recorded using the immersion probe while stirring the solution at a constant speed.

86
Electrochemical measurements. Electrochemical measurements were taken using a CH
Instruments 760C potentiostat. A three-electrode cell was used with a supporting electrolyte of
deaerated 0.075 M phosphate buffer (pH ~7) as described above. A platinum mesh was used as
the counter electrode and Ag|AgCl was used as the reference electrode. The working electrode for
cyclic voltammetry experiments was glassy carbon (geometric surface area 0.071 cm2) and for
electrolysis of bulk solutions was a carbon cloth electrode.
1H NMR spectroscopy. Measurements were conducted on a Varian MR 400 instrument at
room temperature and were referenced against the solvent peak. Measurements were performed
on 1 mM viologen solutions in D2O with and without approximately 1 equivalent of cucurbituril.
Sodium dithionite was used to reduce the solutions.
Molecular Orbital Calculations Molecular modeling was carried out using Spartan ’16 for
Macintosh. All structures were constructed in Spartan and equilibrium geometries were calculated
for each redox state independently (4+, no unpaired elections; 3+, one unpaired electron; 2+, two
unpaired electrons) for dimers 2 and 3 and the corresponding complexes of the dimers and CB[8].
All geometry calculations were initiated from a randomized starting point and carried out using
density functional theory in water solvent with a B3LYP functional at the 6-31G* level. The
calculated equilibrium structures were then used in energy calculations to obtain orbital and spin-
state information using density functional theory in water solvent with a B97D functional at the 6-
311+G** level. The B97D functional was used to achieve energy calculations that more
adequately include dispersion stabilization of the delocalized radicals.55
5.3 Results.
Dimer Conformers. Molecular modeling was performed to determine the relevant
conformers of 2 and 3. The results indicated that dimers 24+ and 34+ prefer to adopt extended
conformations in water due to charge-repulsion (Figure 5.5). In contrast, the reduced dimers 22+
and 32+ assemble into folded structures that balance charge-repulsion with π-stacked stabilization
of the radical species (so-called pimers). While 22+ and 32+ adopt conformations with similar
distances between the viologen groups, the equilibrium geometry structure calculated for the rigid
o-xylene-linked 22+ had near-perfect alignment of overlapping viologen surfaces, while propyl-
linked 32+ displayed a significantly skewed relative orientation of the viologen groups (Figure 5.6).

87
Figure 5.5 Equilibrium geometries modeled for free reduced dimers 24+ and 34+. Note the clear
difference in the number of bond rotations needed to access the π-stacked geometries from these
conformations: 24+ < 34+
Figure 5.6 Equilibrium geometries modeled for free reduced dimers 22+ and 32+. Side view shows
similar spacing of viologen groups, while end and top view illustrate the better π-π stacking
preorganization of 22+.
14+
24+
side top
12+
22+
side end top

88
Figure 5.7 ITC determination of binding constant between 24+ and CB[8] (left) and 34+ (right). All
solutions for titration were made in phosphate buffer (10 mmol) and degassed in vacuum. Solutions
of 24+ (0.3mM) or 34+ (0.4mM) were titrated into a solution of CB[8] (0.026 mM), and the resulting
exotherm curve was fit to obtain binding constants of 1.2 x 10⁶ M-1 for 24+with CB[8] and 1.1 x
106 M-1 for 34+ with CB[8], respectively.
Isothermal Calorimetry. ITC measurements (Figure 5.7) were performed on both viologen dimers
in the 4+ oxidation state in the presence of CB[8] in a phosphate buffer. Binding constants between
24+ and CB[8] and between 34+ and CB[8] calculated from this data were 1.18x10⁶ M-1 and
1.11x10⁶ M-1, respectively, indicating a strong affinity of CB[8] for both viologens.
Cyclic Voltammetry. The cyclic voltammograms of 24+, 34+, and MV2+ in the presence and absence
of CB[7] and CB[8] are shown in Figure 5.8. Scanning cathodically from open circuit potential,
MV and compound 2 showed single reversible redox waves in the absence of cucurbituril. The
voltammogram of compound 3 produced a second reversible wave at a lower current density
slightly negative of the main redox wave. The E1/2 values and peak potential separations (ΔEp) of
each of these redox waves are listed in Table 5.1. The wave for MV was consistent with the 1-

89
electron MV2+/1+ transition.253 The E1/2 for the redox wave of 2 and the major wave of 3 were much
more positive than MV with lower current densities and smaller peak separations. The lower
current densities were attributed to smaller diffusion coefficients due to the bulkier nature of the
molecules (5.6 x 10⁻⁶ and 8.6 x 10⁻⁶ cm2 V-1 s-1, for 24+ and MV2+, respectively). The more positive
reduction potentials are consistent with favored pimer formation due to the forced proximity of
two viologen units on each molecule.270, 300-302 Lastly, the small peak separations for compounds
2 and 3 are consistent with 2-electron redox processes, and therefore these waves were ascribed to
the 24+/2+ and the 34+/2+ transitions.30, 303 The second redox wave in the voltammogram of 3 at about
-0.61 V is likely due to effects from a higher degree of freedom for rotation around the propyl
linker as compared to the benzyl linker in 2. In other words, a fraction of 34+ exists in a
conformation that disfavors pimer formation, resulting in a more negative reduction potential.
Addition of CB[7] to 2, 3, and MV lowered the peak currents and shifted the E1/2 values
negative while significantly increasing the peak separations in 2 and 3. The lower peak currents
were because of reduced diffusivity of the viologens when encapsulated in the large CB[7]
scaffold. The negative shift in reduction potentials has previously been ascribed to the inability of
the CB[7] cavity to accommodate two viologen units.272, 276, 291 Complexation with CB[7] therefore
inhibits dimer formation. This is also the reason for the increased ΔEp values. Inhibited pimer
formation suggests that the second reductions of 2 and 3 are more difficult that the first reductions,
i.e. 24+/3+ occurs at a more positive potential than 23+/2+. Because the redox wave still appeared as
a single wave, the separation between E1/2 for 24+/3+ and E1/2 for 23+/2+ was small, less than about
120 mV.303 The same was true for 3 in CB[7]. Furthermore, encapsulation in CB[7] is the reason
for the absence of the secondary redox wave in the voltammogram of 3/CB[7]. The two redox
waves in the voltammogram of 3 were due to the existence of two conformers in solution: one
being the preferred orientation for pimer formation and the other being a non-preferred orientation
for pimer formation. Since pimer formation is precluded in the presence of CB[7], these two
conformations have the same reduction potential and only one redox wave was observed in the
voltammogram of 3/CB[7].
Addition of CB[8] to each of the three compounds shifted the potentials of each redox wave
positive. This positive shift can be ascribed to the facilitation of pimer formation within the CB[8]
cavity.143, 276 Interestingly, the voltammograms of 2/CB[8] and 3/CB[8] no longer showed single

90
Figure 5.8 Cyclic voltammetry of viologen/cucurbituril pairs. From top to bottom: MV; 2; 3; MV
+ CB[7]; 2 + CB[7]; 3 + CB[7]; MV + CB[8]; 2 + CB[8]; 3 + CB[8]. Concentrations of MV, 2,
and 3¸were 0.4, 0.2, and 0.2 mM, respectively. Concentrations of CB[7] and CB[8] were equivalent
to the respective viologen in each panel. All voltammetry was performed in dearated 0.075 M
phosphate buffer at pH = 7 at a glassy carbon electrode and a scan rate of 0.05 V s-1.
reversible redox waves. The voltammogram of 2/CB[8] contained two apparently reversible redox
waves with ΔEp values larger than that of 2 but smaller than that of 2/CB[7]. The current densities
of these waves were much lower than in any of the previous voltammograms. Integration of these
waves showed that the sum of the charge passed during both processes was approximately
equivalent to the charge passed during the single redox process in either 2 or 2/CB[7]. These data

91
then suggest that the two redox waves in 2/CB[8] correspond to the 1-electron 24+/3+ and 23+/2+
transitions. The voltammogram of 3/CB[8] did not have two well-defined reversible waves like
that of 2/CB[8]; however it is apparent that more than one redox process occurred and that these
processes were generally shifted positive of the redox process for 3. Because the redox waves were
not well-defined and reversible they are not listed in Table 5.1. The quasi-reversibility of the waves
in 3/CB[8] can be attributed, as described above, to the higher degrees of rotational freedom
afforded by the propyl linker.
Compound E1/2 a,c
/ V ΔEp
a / V E1/2
b,c / V ΔEp
b / V
MV -0.638 ± 0.002 0.058 ± 0.002 -- --
2 -0.424 ± 0.002 0.036 ± .002 -- --
3 -0.462 ± 0.002 0.032 ± 0.002 -0.61 ± 0.01 0.050 ± 0.010
MV + CB[7] -0.663 ± 0.002 0.065 ± 0.003 -- --
2 + CB[7] -0.540 ± 0.002 0.107 ± 0.002 -- --
3 + CB[7] -0.603 ± 0.003 0.100 ± 0.003 -- --
MV + CB[8] -0.484 ± 0.004 0.061 ± 0.004 -- --
2 + CB[8] -0.192 ± 0.009 0.062 ± 0.009 -0.348 ± 0.006 0.062 ± 0.006
a First most positive redox wave. b Second most positive redox wave. c Midpoint between reduction and oxidation peak potentials
with respect to E(Ag/AgCl) at 0.05V s-1 in a deaerated 0.075 M phosphate buffer (pH 7).
Table 5.1 Voltammetric features for 2, 3, and MV alone and in the presence of cucurbiturils as
shown in Figure 5.1.
Figure 5.9 shows the voltammetric scan rate dependence of 2/CB[8]. At a scan rate of 10
mV/s, the two reversible redox waves described above were distinctly visible. At 100 mV/s, the
first reduction wave was at a slightly lower current compared to the baseline, though the
corresponding oxidation wave was unchanged. At 1 V/s, the first reduction wave was essentially
nonexistent, and the corresponding oxidation wave was still unchanged. These data suggest that a
slow chemical step precedes the reduction of 24+/CB[8] to 23+/CB[8]. At faster scan rates the
chemical step is outpaced and reduction directly to 22+/CB[8] occurs. Compound 3 in CB[8]
demonstrated a similar scan rate dependence (Figure 5.9).

92
Figure 5.9 Voltammetry of 2 + CB[8] (left) and 3 + CB[8] (right) at various scan rates collected
at 0.25 mM viologen with approximately one equivalent of CB [8]. The electrolyte was deaerated
0.075 M phosphate buffer (pH 7). A glassy carbon electrode was used as the working electrode.
Pt mesh was used as the counter electrode and a Ag wire coated with AgCl immersed in a fritted
compartment containing saturated KCl was used as the reference electrode.
NMR spectroscopy. 1H NMR spectra were collected to gain further insight on the
complexation of 2 and 3 with CB[7] and CB[8]. Figure 4 shows the 1H NMR spectra of 2 and 3 in
various oxidation states in the presence and absence of CB[7] and CB[8] in D2O. Upon
complexation by CB[7], all proton signals for 24+ moved to higher chemical shift values (Figure
5.10). The aromatic protons of the viologen units and the bridging methylene peaks were shifted
most extensively whereas the peak corresponding to the methyl protons was affected only
minimally. The presence of CB[8] in solution caused qualitatively similar changes in the 1HNMR
spectrum of 24+. These changes were consistent with the premise that in the 4+ oxidation state, the
viologen rings are spread apart in a “linear” dimer conformation due to charge repulsion and the
benzyl linker of 24+ spends significant time inside of the cucurbituril cavity. Conversely, the
terminal methyl groups on the viologen units are predominantly outside the cavities of the
cucurbiturils since there is no possibility of hydrogen bonding by those hydrogens with the C=O
groups.304 The paramagnetic character of 22+ after reduction convoluted the proton signals of the
viologens in the corresponding 1H NMR spectra, precluding definitive assignment of viologen
orientation upon reduction. However, the significant broadening of the 1H NMR signals from
CB[8] in the presence of reduced dimer was consistent with tight association, and therefore close

93
Figure 5.10 1H NMR spectra of a) aqueous D2O solutions of 2 in various oxidation states and in
the presence of cucurbiturils and b) aqueous D2O solutions of 3 in various oxidation states and in
the presence of cucurbiturils. Peaks labeled j, k, and l correspond to cucurbituril protons.
proximity, of folded 3+ and 2+ paramagnetic radical dimers within CB[8]. The 2+ dimer species
showed a more significant effect on the CB[8] protons, implying an average closer proximity of
radical character to the CB[8] protons. In Figure 4b, the spectra for 34+ with and without either
CB[7] or CB[8] are shown. The changes in the 1H NMR spectral features were generally similar
to those in Figure 4a. The signals for the aromatic peaks of the viologen units and the methylene
peaks of the propyl linker were more strongly affected by the presence of cucurbituril than the
corresponding signatures of the methyl protons. These data suggest that similar to 24+, the viologen
units and propyl linker of 34+ in the oxidation state are primarily inside the cucurbituril cavities
upon complexation.
9 8 7 6 5 4
13+ + CB[8]
12+ + CB[8]
Chemical shift /ppm
14+ + CB[7] 24+ + CB[7]
9 8 7 6 5 4 3
Chemical shift /ppm
22+ + CB[8]
23+ + CB[8]
a) b)
14+
d,e b,cf
g h
a 24+a
b,cd,e f
14+ + CB[8] j l k 24+ + CB[8] j l k

94
Figure 5.11 Color variation in solutions of 2 with and without CB[8] after addition of reducing
equivalents, defined as one reducing equivalent would reduce each viologen unity by 1e-. Top row:
24+ (left); 2 after reduction with approximately half of the electrons necessary to fully reduce the
solution to 22+ (middle); 2 after the solution has been fully reduced to 22+ (right). Bottom row: 24+
with CB[8] (left); 2 with CB[8] after reduction with approximately half of the electrons necessary
to fully reduce the solution to 22+ with CB[8] (middle); 2 with CB[8] after the solution has been
fully reduced to 22+/CB[8] (right). The solutions were 0.1 mM 2 in water. CB[8] was added in
approximately 1 equivalent.
UV-visible-NIR spectroscopy. Figure 5.11 displays photographs of 2 at various stages of
reduction with and without CB[8]. In the top left and bottom left are solutions of 0.1 mM 24+ and
0.1 mM 24+/CB[8]. Both are colorless. The solutions in the top middle and bottom middle photos
were obtained by adding slightly less than half an equivalent of sodium dithionite to the respective
solutions. Based on the voltammetry data described above, this addition reduced half of the top
solution to 22+, whereas all of the solution in the bottom photo was 23+/CB[8]. The color of the
solution in the top middle was pale purple. The color of the solution in the bottom photo was
distinctly blue. The top left and bottom left solutions were obtained by addition of an excess of
dithionite to the respective solutions. Both solutions were the same purple color. The top left
solution was 22+ and the bottom left solution was 22+/CB[8]. The purple color seen in these photos
was attributed to the 22+ oxidation state, and the blue color that was only observed in the presence
of CB[8] was attributed to the 23+ oxidation state. It should be noted that these colors were also
observed during electrochemical reduction of these solutions. When a solution of 24+ was
electrochemically reduced, the color purple was observed to slowly grow in and get steadily darker
until the solution was fully reduced to 22+. In contrast, when a solution of 24+/CB[8] was

95
electrochemically reduced, a blue color was observed, which grew stronger until about half of the
charge needed to fully reduce the solution to 22+/CB[8] had been passed. At this point the color
began to change to purple and by the time the solution had been fully reduced, it was the same
color as a solution of 22+. These same results were observed with 34+ and CB[8].
Figure 5.12 shows the UV-vis-NIR spectra of each set of compounds. The NIR spectral
region was cut off at 1400 nm due to strong absorption by water at longer wavelengths. Both 22+
and 32+ had broad asymmetric absorbances between 500 and 600 nm and a second broad band
around 850 nm, characteristic of viologen pimers in water.296, 302, 305-306 Addition of CB[7] caused
little change to the spectrum of either compound. Addition of CB[8] also produced little change to
the spectra when the viologens were fully reduced to the 2+ states. However, when the viologens
were partially reduced to the 3+ states in CB[8], dramatic changes to the spectra were observed.
In this case, the visible band was shifted from 536 to 623 nm for 2 and from 534 to 622 nm for 3.
The NIR band disappeared completely from the spectrum of 2, and in the spectrum of 3 it shifted
from about 841 nm into the cut-off region, i.e. >1400 nm. These features are characteristic of
viologen dimers in the 3+ oxidation state.298, 301
Figure 5.12 Absorbance spectra of 2 and 3 with and without cucurbiturils in solution after
reduction to the 2+ or 3+ states. (left) 22+ (black), 22+ in the presence of an equivalent of CB[7]
(blue), 22+ in the presence of an equivalent of CB[8] (green), and 23+ in the presence of an
equivalent of CB[8] (red). (right) 32+ (black), 32+ in the presence of an equivalent of CB[7] (blue),
32+ in the presence of an equivalent of CB[8] (green), and 33+ in the presence of an equivalent of
CB[8] (red).

96
Lifetime in air. Figure 5.13 demonstrates the relative rates of decay of the reduced
viologens upon exposure to oxygen with and without CB[8] present. In Figure 5.13a, a 30 μM
solution of 24+ was fully electrolyzed to 22+ under a stream of nitrogen. Upon fully reducing the
solution, the nitrogen stream and electrodes were removed from the cell and immediately the UV-
vis absorbance of the solution was monitored by taking a spectrum every 15 seconds. Figure 5.13b
shows the same experiment done using a 30 μM solution of 24+ in the presence of one equivalent
of CB[8]. In Figure 5.13a, the absorbance at the λmax (536 nm) decayed over time, resulting finally
in a featureless spectrum. In Figure 5.13b, the peak at 536 nm decayed and the peak at 623 nm
grew in with an isosbestic point, until the peak at 623 nm began to decay as well. The final
spectrum in this case was also featureless.
In Figure 5.13c, the black squares indicate the absorbance at 536 nm of the spectrum in
Figure 5.13a, which was assigned to the species 22+, and in red is the absorbance at 623 nm in
Figure 5.13b, which was assigned to the species 23+/CB[8]. The absorbance at 536 nm reached
zero within 90 s, but the absorbance at 623 nm decayed much more slowly, reaching zero after
around 15 minutes. Each of these decay plots in Figure 5.13c were fitted with an exponential decay
function. The time constant for decay of 22+ without CB[8] was 41 ± 2 s, and the half-life was 28
± 1s. The time constant for decay of 23+ in the presence of CB[8] (taking the maximum absorbance
value in the plot in Figure 5.13c as the starting value) was 206 ± 1 s and the half-life was 143 ± 1s.
Figures 5.13d-f demonstrate a similar effect with compound 3. In the absence of CB[8],
the decay time constant was 16 ± 1 s and the half-life was 11 ± 1 s. In the presence of CB[8], the
decay time constant was 126 ± 5 s and the half-life was 87 ± 3 s.
Figures 5.14g-i show the same experiment for MV. In the absence of CB[8], the decay time
constant was 21 ± 1 s and the half-life was 15 ± 1 s. In the presence of CB[8], the decay time
constant was 45 ± 2 s and the half-life was 31 ± 1 s.
R2 values for the exponential decay fits were 0.951 for 22+; 0.999 for 23+/CB[8]; 0.950 for
32+; 0.968 for 33+/CB[8]; 0.942 for MV1+; and 0.953 for MV1+/CB[8].

97
Figure 5.13 a) Time-dependent absorbance spectra for 22+ in aqueous solution recorded at 15 s
intervals over 25 min. b) Time-dependent absorbance spectra for 22+ in same solution but with one
equivalent of CB[8]. c) Time-dependence of the absorbance maxima in Figure 5.13a at λ = 536
nm and in Figure 5.13b at λ = 623nm. d) Time-dependent absorbance spectra for 32+ in aqueous
solution. e) Time-dependent absorbance spectra for 32+ in the same solution but with one
equivalent of CB[8]. f) Time-dependence of the absorbance maxima in Figure 5.13d at λ = 534 nm
and in Figure 5.13e at λ = 622 nm.
Figure 5.14 a.) Time-dependent absorption spectra for MV•+ in phosphate buffer (pH7) recorded
at 15 s intervals over 25 min. b) Time-dependent absorption spectra for MV•+ in same solution but
with one equivalent of CB[8]. c) Time-dependence of the absorption maxima in Figure 5.14a at λ
= 603 nm and in Figure 5.14b at λ = 538 nm.
0 500 1000 1500
0.0
0.1
0.2
0.3MV
MV/CB[8]
Ab
sorb
ance
at
λm
ax
Time /s500 600 700
0.1
0.2
0.3
Ab
sorb
ance
Wavelength /nm
500 600 7000.0
0.2
0.4
Ab
sorb
ance
Wavelength /nm
a b c

98
5.4 Discussion.
The data presented here demonstrate the formation of an unusually stable radical viologen
species through supramolecular complexation in solution that is disctinct from previously explored
viologen radical pimers. This species, a monoradical bis-viologen, has never previously been
observed, but similar species have been observed in the case of the “blue-box molecule”296, 301, 307-
309 (Figure 5.18) and in non-aqueous solvents.298 This is the first time that a simple bis-viologen
monoradical species has been isolated through supramolecular assembly. It is also the first time
that a viologen radical species has been shown to be stabilized toward reaction with dissolved
oxygen. This is further discussed below for the case of compound 2. Compound 3 demonstrated
similar results as compound 2.
Intra- and Intermolecular Factors Necessary to Form Stabilized, Reduced Viologen Dimer.
Singly reduced viologens can form pairs, often called pimers, in solution with strong overlap of
the π orbitals between the two units.296, 298, 302, 310 The formation of these pimers can have large
association constants (~102 M-1)253 since the π-π stacking allows for stabilization of the individual
viologen radicals.299, 311 Studies have shown that this stabilization is mostly attributable to
dispersion and delocalization of the two SOMO orbitals across all surfaces of the stacked viologen
moieties.299, 312-314 Generally, such interactions have been described as pancake bonding.299, 311-314
These delocalized bis-radical species form readily when viologens are reduced in sufficiently high
concentrations305, 315 or when reduced viologen units are in forced close proximity.296 The latter
scenario is clearly evidenced in the voltammetry of free 24+ and 34+ by the notable positive shift of
the voltammetric response for the reduction from the 4+ to 2+ states compared to the reduction of
MV2+ to MV•+. The greater positive shift in redox potential as well as the clearer voltammetry
observed with 2 as compared to 3 suggest that the preorganization of direct π-π overlap observed
in modeling the rigid ortho-benzyl linkage increases the likelihood of stabilized π-π stacking
between radical viologen units of 22+. The equilibrium geometry and flexibility of the propyl linker
provides comparatively less probability that the two reduced viologen units of 32+ are well
positioned for delocalization of the bis-radical. The voltammetry, NMR, and absorbance data for
22+ and 32+ are in line with the previous literature on π-stacked bis-radical pimers.253, 296, 305, 315
In the presence of cucurbituril complexing agents, the reductions of 2 and 3 show evidence
for reduced viologen radicals unlike the previously described π-stacked bis-radical pimers.
Observations in the presence of CB[7] show behavior similar to that in previous reports of viologen

99
complexation with CB[7]; that is, a negative shift in the reduction potential and little change in the
absorbance spectrum.272, 293 This is attributed to the small size of the CB[7] cavity, which is not
able to accommodate two stacked aromatic moieties.272, 291, 293 CB[8], on the other hand, is
uniquely suited to host two reduced, tethered, and stacked viologen units simultaneously because
of its large cavity size. CB[8] thereby promotes the formation of a new type of stabilized radical
pimer. The existence of this new radical pimer is seen in the splitting of the voltammetric wave of
2 in the presence of CB[8] and in the blue color and unique absorbance spectrum of partially
reduced 2 in the presence of CB[8]. This effect is also seen the voltammetry and absorbance
spectrum of 3. In contrast, the inclusion of two reduced MV+ equivalents in CB[8] show no
evidence of a stable 3+ radical pimer or otherwise remarkable properties. Previously reported
reduction of a viologen dimer connected with a longer flexible linker (hexyl) in the presence of
CB[8] also showed no evidence of a stable 3+ radical state.263 Accordingly, the data here are clear
that both dimer pre-organization and complexation within a sufficiently large cavity are necessary
to make the blue viologen dimer in the 3+ oxidation state.
A scheme showing the elementary electrochemical and chemical steps describing the
formation of the monoradical for 2 in the presence of CB[8] is proposed in Figure 5.15.
Presumably, the formation of the corresponding monoradical of 33+ is similar, albeit with
additional competing equilibria for conformations that are not productive towards the 3+ state. In
this figure, vertical transitions denote chemical steps constituting either conformation or
complexation changes while horizontal transitions represent 1e- electrochemical charge transfers.
Based on the collected voltammetry and calculations of conformer stability (Figures 5.5, 5.6, and
5.8), the equilibrium form of 24+ has the viologen units spread far apart, i.e. as a linear conformer
with K2 << 1. This linear conformation of 24+ binds in a 1:1 ratio with CB[8] and the complex has
a disassociation constant K1 = 8.3 x 10⁻⁷ M as measured by ITC (Figure 5.7). The reduction of both
viologen units on unbound 2 are degenerate, i.e. the standard potentials are equivalent and the
reduction processes are independent of each other, as evidenced by the narrow ΔEp in the
voltammetry of 24+ alone.303 Based on the shift of the voltammetric wave of 24+ relative to the
voltammetric wave of MV2+, the value of K3 >> 1, i.e. 22+ changes conformation to stabilize the
viologen units by co-facial pairing. In the presence of CB[8], we infer the paired form of 22+
partitions readily into CB[8] with K4 > K1 since the voltammetric wave at relatively fast scan rates
(> 1 V s-1) for the 4+/2+ condition is shifted towards an even more positive potential (Figure 5.8).

100
Figure 5.15 Proposed elementary chemical and electrochemical steps involved in the reduction of
2 in the presence of CB[8].
Reduction of 24+ in the presence of CB[8] at slower scan rates (< 0.5 Vs-1) allows access to the
significantly stabilized 4+/3+ transition, for which the folded 23+ is likely very tightly associated
with CB[8], combining to a remarkable positive shit in the 1e- reduction wave. The large value of
K4 is also responsible for the scan rate independence of oxidation observed for 22+ in the presence
of CB[8]. The preorganized structure requires no conformational rearrangement to access the
stable 23+ complex, and so sequential 2+/3+ and 3+/4+ oxidation waves are observed at all scan
rates.
Electronic Structure of Reduced, Viologen Monoradical The presented absorbance spectra
clearly indicate that the electronic structure of the 3+ state is very different than that of the bis-
radical form or even of a singly reduced methyl viologen in organic solvents.296, 306 To gain insight
into this empirical observation, molecular orbital calculations were performed on energy
minimized structures of 23+ and 22+ encapsulated in CB[8]. Figure 5.16 shows computations of the
energetics for the 3+ radical form of 2 relative to the 2+ bis-radical. In free solution both species
(3+)(4+)
K1
(2+)
(4+)
(4+) (3 )+
K4
(3+)
(3+)
K3
(4+) (3+)
K5
K2
(2+)
(2+)
1e-
1e-
1e-
1e-
1e-
1e-
1e-

101
yield equilibrium geometries favoring a partially-folded state that balances charge-repulsion with
radical dispersion forces. For 2, this geometry leads to minimal overlap and perturbation of the 23+
singlet highest occupied molecular orbital (sHOMO) and predicts electrochemical near-
degeneracy of the 2nd reduction to the 2+ state (Figure 5.16). In the presence of CB[8], both reduced
species show strong complexation inside the host cavity. The resultant equilibrium geometry of
the dimer is completely folded with a π-π stacking distance < 3.6 Å. In this conformation within
CB[8], the sHOMO of 23+ shows a strong and stabilizing perturbation due to delocalization of the
radical across both viologen moieties, with perfectly symmetric constructive overlap at the π-π
interface (Figure 5.16). This constructive (bonding) symmetry suggests a significant stabilization
of the complex between 23+ and CB[8], with a majority of the 23+ sHOMO orbital density existing
between the aromatic groups, effectively burying the radical between the two viologen units.
Essentially an identical sHOMO orbital was calculated for energy-minimized 33+ in CB[8] (Figure
5.16).
Figure 5.16 a) The relative energies of molecular orbitals from DFT calculations (Spartan
16,B97D, 6-311+G*) showing the 3+ and 2+ states of 2 both without and within CB[8]. b)
Graphical depiction of the LUMO of 2 in the 3+ oxidation state and the sHOMO of 2 in the 2+
oxidation state. c) The spin densities of 2 inside CB[8] in the 3+ and 2+ oxidation states are shown,
with CB[8] omitted for clarity. Side and top views of the 2 are shown, with the blue regions
highlighting the regions where the radical density is highest.
The spin density map of the complex between 23+and CB[8] further supports the point that
the transferrable electron is not readily accessible. The density of unpaired spin is mostly located
on the internal π-surface of the folded dimer (Figure 5.16). Conversely, the sHOMO of the 12+
no CB[8]
-1.0 --
-2.0 --
-3.0 --
-4.0 --
-5.0 --
-6.0 --
-7.0 --
(3+) (2+)
in CB[8]
sHOMO sHOMO-1
HOMO-1
sHOMO-1
HOMO-1
sHOMOsHOMOLUMO
LUMO
LUMO
LUMO
sHOMO
Orb
ital
Ener
gy
/eV
HOMO-2HOMO-2
a) b)
12+ sHOMO
13+ sHOMO
side view
sHOMO orbitals 13+ in CB[8]
in CB[8]
(3+) (2+)
12+
c)
Spin density
1.5 x 10⁻⁴
0.0 x 10⁻⁴
top view

102
dimer in CB[8] has a node running between the two viologen units at the π-π interface (Figure
5.16). This aspect can also be visualized in the corresponding spin density map of the complex
between 22+ bis-radical and CB[8] which shows significant unpaired spin density on both the
internal lower energy singlet HOMO-1 (sHOMO–1) and external (sHOMO) viologen surfaces.
These characteristics are further consistent with the “pancake bonding” concept.316-319 We posit
that the uniform distribution of electron density on both surfaces of the viologens for the sHOMO
orbital of 22+ (and 32+) results in good electronic coupling with oxidants and corresponding fast
electron transfer.
Stability in the Presence of O2 Based on the preceding discussion, we propose that the
resultant stability of 23+ and 33+ complexed with CB[8] in air is largely a consequence of slower
charge-transfer kinetics. The observed stability against oxidation of these species by O2 is in accord
with their proposed electronic structures. Since the CB[8] cavities force the viologen units in close
proximity to form a stable pocket where the radical electron resides between the two aromatic
units, this structure inhibits electronic coupling with external oxidants. In effect, this transferrable
electron becomes significantly less accessible to oxidants like O2 and hence the rate of oxidation
of the viologen dimer back to the 4+ state is slowed. In effect, the viologen rings represent
tunneling barriers that inhibit transfer of that specific electron. For oxidation of the 2+ state, the
viologen rings do not act as tunneling barriers since the electron density is explicitly located on
their exterior as well as interior. As a result, O2 can readily oxidize the 2+ state even when the
dimer resides inside of CB[8]. A further contrast along these lines is clear when considering the
spin density map for the energy-minimized conformation of two MV+ in CB[8]. In this case, the
pimer adopts a twisted conformation (Figure 5.17).
Figure 5.17 Energy minimized structure (hydrogens not shown) (a) and spin density map (b) of
the 2(MV+) pimer showing the known twisted conformation of the viologen moieties.

103
Relation to Other Viologen Materials Although this report is the first explicit use of pre-
organization and complexation principles to stabilize a reduced viologen, there are two examples
that have some parallels. The first area is redox active polymers based on viologen moieties.257-259
In the context of charge-storing catholytes, an organic polymer with pendant side chains consisting
of the ortho-benzyl viologen dimers has been reported.259 Unlike other poly-viologens, this
particular polymer featured a reduced form that was unusually stable in air. The origins of this
stability were not explored since that particular material was not easy to oxidize back
electrochemically and therefore not deemed readily useful for rapid charge/discharge cycling in
redox flow batteries. The oxidation state of this unusually stable viologen was the fully reduced
species, i.e. each viologen dimer in the polymer was a 2+ bis-radical species. Thus, the stabilization
effects were not the same as the stabilization of the 3+ viologen monoradicals described here.
Nevertheless, it is possible that the polymeric structure afforded an environment that forced the
viologen dimers into a stabilized conformation, similar to the synergistic effects between
preorganization and complexation seen here.
Similarly, dually tethered viologen dimers with the proper structure might also enable the
3+ monoradical state. Specifically, cyclophane compounds can have similar structures as 23+
complexed with CB[8], but this is because both ends are linked by phenyl groups rather than
because of complexation. The most famous cyclophane is cyclobis(paraquat-p-phenylene), i.e.
"blue-box" (Figure 5.18), and is widely employed in catenanes and rotaxanes.307, 320-321 The space
between viologen units in para-“blue-box” compounds is large enough to accommodate guest
molecules but conversely precludes the possibility of forming a tight pocket to stabilize the 3+
monoradical. Accordingly, these compounds have never shown a stabilized reduced state. The
ortho form of this cyclophane is less studied. The small space between viologen units precludes
molecular guests and this molecule is exceedingly difficult to synthesize with high yields. Its
synthesis requires inordinately long reaction times because of solubility incompatibilities of the
precursors and low concentrations to prevent polymerization pathways.309, 322 The available data
on the electrochemical properties of this compound are scarce, with only a few reports showing
some optical data upon reduction or photoexcitation.310, 323-325 Still, these scant data are in accord
with the data shown here and suggest the electrochemical properties (and stability in air) of ortho-
“blue-box” could be similar. Experimental verification of this hypothesis would prove insightful.

104
However, the larger take away of this work is that the combination of intramolecular pre-
organization and complexation of much simpler-to-synthesize viologens circumvents the need to
prepare such cyclophanes. More work is needed to determine whether design improvements can
be made to further enhance the stability of reduced viologens.
Figure 5.18 Structures of (left) cyclobis(paraquat-p-phenylene) and (right) cyclobis(paraquat-o-
phenylene).
5.5 Conclusions.
This work demonstrates that it is possible to form a stable, reduced viologen radical in
aqueous solution through a combination of intramolecular and supramolecular assemblies. The
hierarchical reduction of pre-organized viologen moieties and encapsulation of this folded species
inside the cavity of the rigid macrocyclic host CB[8] accesses a conformation that specifically
stabilizes a monoradical, 3+ cation species. This reduced radical possesses a distinct visible light
absorbance profile that is unlike any previously reported viologen pimer. Instead, its optical
properties bear strong resemblance to bis-viologen cyclophanes with ortho-benzyl linkers. Unlike
such cyclophanes which are difficult to synthesize, the compounds shown here can be synthesized in
almost quantitative yields and the supramolecular assemblies form readily in water upon
electrochemical reduction. These encapsulated monoradicals are significantly more stable in the
presence of O2, highlighting a unique reactivity relative to other viologen species. Molecular
modeling analyses suggest the stability of this monoradical species results from the central location
N N
N N
N
N
N
N

105
of the SOMO between the viologen rings. Due to the ease of preparation, these monoradical
compounds are amenable to further spectroscopic studies that detail their electronic structure.
More generally, these results suggest new design motifs for viologens in applications where storing
reduced equivalents of charge such as electrochromic windows, redox flow batteries, and solar
fuel storage systems is critical.
106
6.1 Covalent grafting small molecules to RGO thin films
Molecular catalysts can be immobilized on electrode surfaces through covalent grafting to
the surface.34, 214-216 Covalent grafting is advantageous over physisorption (discussed in Chapter 3)
because it is inherently a more robust attachment method (see Introduction). Graphitic materials
provide convenient surfaces for grafting small molecules as they provide many functional group
handholds. Not only do graphitic carbons contain C=C and C-H functionalities, but native oxides
at defect regions in the form of C-OH, C-O-C, and COOH groups also exist on carbon surfaces.
This allows for a wide variety of grafting reactions on graphitic carbons. Several examples of
covalent attachment of small molecules on graphitic surfaces are given in a review by Campisciano
et al.54
Described here is preliminary work on three methods for grafting small molecules to RGO
thin films. Each of these methods has precedent in the literature, but this is the first time they have
been reported for the particular molecules listed below. Each of these methods can be extended to
grafting a derivative of the catalyst 1 to RGO films on electrode surfaces. As described below,
each grafting method requires the molecule of interest to possess a specific functional group (these
are amine, alkoxysilane, and alkyne). Current work is underway to synthesize derivatives of 1 that
possess one of these functional groups.
Bromoaniline grafting to GO films. The first method of covalent attachment involves amine
attack at epoxide groups on the GO surface. This grafting method has been used extensively in
published reports, mainly for grafting long alkyl chains to GO to alter its surface chemistry or
electronic behavior.55, 88-90 Few reports exist on the grafting of functional molecules, such as
catalysts, to GO surfaces using this method. As a proof-of-concept, in this report 4-bromoaniline
was grafted to GO. This molecule was chosen because it was thought to exhibit similar steric
preferences and electronics as the ligands of 1. The method for grafting via amine functionalities
is extremely simple to carry out; however, it requires the GO to be in suspension during the
Chapter 6. Future Work

107
reaction. Attempts were made on GO and RGO thin films, but none were successful. Likely steric
hindrance becomes a limiting factor for reaction on a film surface.
The reaction was successfully carried out by adding about 50 mg of 4-bromoaniline to
about 5 mL of a suspension of GO in methanol under a nitrogen atmosphere. This mixture was
stirred at about 70 and aliquots were removed after various periods of time, washed with clean
methanol, and cast as films on degreased Si wafers. Analysis by XPS shows that the reaction
reaches approximate completion after only 2 hours (Figure 6.1). Likely the surface coverage can
be improved by increasing the number of epoxide groups on GO, which can be accomplished
through epoxidation reactions.326
Reduction of these bromoaniline-modified GO films to RGO using a solution of
cobaltocene or cobaltocene in the presence of acid327 led to loss of the bromine XPS signal.
Assumedly the reducing power of cobaltocene was strong enough to reduce the C-N bonds of the
grafted molecules. To determine whether reduction of GO to RGO with retention of the
bromoaniline moiety was possible, electrochemical reductions at varied potentials were attempted.
This was carried out by casting films of bromoaniline-modified GO on FTO-coated glass
electrodes, immersing these electrodes in a deaerated 1 M KCl electrolyte containing 1 mM HCl,
and cycling three times between the open circuit potential and a potential more negative of that.
Four different films were produced in this way, cycling to -0.75 V, -0.85 V, -0.95 V, and -1.05 V
(vs. Ag|AgCl), respectively. Figure 6.2 shows the Br 3d and C 1s XP spectra of each film after
voltammetric cycling. The Br 3d signal does not change in intensity at any of the reduction
potentials. However, the C 1s peak shape changes dramatically, becoming narrower and with a
less pronounced shoulder at higher binding energy with more negative reduction potentials during
CV cycling. This data demonstrates that cycling to -1.05 V in a 1 mM HCl solution results in a
reduced material with a C 1s peak that displays graphitic character, while retaining the Br 3d signal.
This grafting method, then, is a viable route for covalently immobilizing a derivative of 1 to RGO
thin films.

108
Figure 6.1 Br 3d XP spectra of films casted from a GO suspension removed from a reaction
mixture with 4-bromoaniline after the listed times.
Figure 6.2 Br 3d XP spectra (left) and C 1s XP spectra (right) of films casted on FTO from a
suspension of GO after reaction with 4-bromoaniline. Each film was cycled in a 1 M KCl solution
containing 1 mM HCl between open circuit potential and the potentials listed to the right in the
figure three times.
Alkoxysilane grafting to GO. The second grafting method investigated in this thesis
involves the reaction of an alkoxysilane with the alcohol groups of GO. It is well known that
alkoxysilanes react with surface alcohol groups. These types of molecules are often used to modify

109
glass and other oxide surfaces.328-330 It has also been shown previously that alkoxysilanes graft
specifically to GO.54 Trimethoxyphenylsilane (TMPS) was chosen as a proof-of-concept because
the phenyl group was thought to closely model the sterics and electronics of the ligands of 1.
Reaction conditions using a slurry of GO and a thin film of GO were both investigated. Figure 6.3
(top left) shows the Si 2p XP spectrum of a sample of GO taken from a slurry stirred with TMPS
in methanol at 70 in a sealed vessel for 20 hours. Figure 6.3 (bottom left) shows the Si 2p
spectrum of a thin film of GO that was immersed in a solution of TMPS at 70 for 20 hours in a
sealed vessel. Both spectra show a distinct Si 2p signal approximately at the binding energy of
SiOx. Reaction on a thin film of GO results in a lower Si 2p peak and a broader C 1s peak. This
suggests the quantity of TMPS is lower under these conditions because the bulky TMPS molecule
likely cannot penetrate within the GO film and therefore only reacts at the exposed surface.
Furthermore, the C 1s signal for the GO that had been mixed as a slurry with TMPS is significantly
narrowed, indicating a reduction in the overall oxide character of the material. On the other hand,
the width of the C 1s signal of the GO thin film that had been immersed in a solution of TMPS is
more similar to that of unreacted GO. (Both C 1s spectra are overlaid with an example C 1s
spectrum of unreacted GO in Figure 6.3 (top and bottom right).)
Figure 6.3 Si 2p (left) and C 1s (right) XP spectra of GO films after reaction with TMPS. The top
spectra are from a slurry of GO stirred in a solution of TMPs, and the bottom spectra are from a
thin film of GO immersed in a solution of TMPS. In red are representative C 1s spectra of an
unreacted GO film.

110
Future research should investigate the ability of the TMPS-modified GO to undergo
reduction to TMPS-modified RGO. Since the linkage requires an oxygen functional group on GO,
it may be labile under reductive conditions; therefore, the reduction potential must be precisely
controlled in order to retain the TMPS linkage but remove any other oxygen functional group on
GO.
Click reaction on GO. The third grafting method involves two sequential steps to modify
GO. The first is attachment of an azide moiety, which was easily accomplished by following a
well-cited procedure using sodium azide in water followed by freeze-drying and washing the
resultant solid with water.331 FTIR spectroscopy was used to analyze the azide content. The spectra
of GO before and after the azidification are shown in Figure 6.4. After reaction there is a distinct
band at about 2121 cm-1, characteristic of the antisymmetric N=N=N stretch. For comparison, the
stretching frequency of pure sodium azide is observed at about 2104 cm-1. XPS survey spectra of
this material revealed a significant sodium signal. This sodium was removed by washing the
material with hydrochloric acid (as described in the Methods section of this chapter). The azide IR
stretch remained after washing with HCl.
Figure 6.4 FTIR spectra of GO (black) and GO after reaction with sodium azide (red). The arrow
points to the N-N-N stretching peak.

111
The second step in this method involves grafting an alkyne-containing molecule via a
copper-catalyzed click reaction. This step was less straightforward. 6-Iodo-1-hexyne was used for
a proof-of-concept, and several attempts using various reaction conditions were made. Every
attempt at using a dissolved copper species as the catalyst (e.g. CuBr, CuSO4) resulted in a copper
deposit on the surface of the film, detectable by XPS and sometimes even by eye. The copper wire
catalyzed click reaction following a modification of the procedure in Reference 332 resulted in the
cleanest and apparently most successful click reaction. Shown in Figure 6.5 are the XP spectra of
the I 3d and Cu 2p regions. After 3 days of reaction there was a small but discernable iodine signal
and a minimal copper signal, showing that the reaction was slow but successful. Future work
should focus on improving the kinetics of this reaction. Addition of an appropriate ligand may
facilitate Cu0 dissolution, or reaction with a slurry of GO-N3 may improve reaction kinetics by
allowing direct contact of the azide with the copper surface.
Figure 6.5 I 3d (left) and Cu 2p (right) spectra of a GO-N3 film after stirring in a solution of 6-
iodo-1-hexyne with a copper wire wrapped around the stir bar (red) and after stirring in a solution
of 6-iodo-1-hexyne with a normal stir bar.
Current and future work. Current efforts are focused on synthesizing a derivative of the
benzenedithiolate ligand of 1 that contains one of the functional groups required to perform the
grafting reactions above, i.e. an amine, an alkyne, or a trimethoxysilane. Future work should focus
on improving the grafting reactions listed above. Specifically, the silane grafting reaction needs to
be optimized to give a high surface coverage without saturating all surface oxide groups (which
would likely influence the conductivity of the RGO). Furthermore, good reduction conditions for
silane-grafted GO need to be identified. Likely electrochemical reduction will be the most effective

112
route as it is the most controlled process. Additionally, the click reaction needs optimization.
Surface coverage is low and reaction kinetics are slow. Kinetics can likely be improved by reaction
in a slurry of GO-N3 or by using an appropriate ligand to solvate Cu0.
Once a modified catalyst is synthesized and the appropriate grafting method optimized, the
catalyst can then be grafted to RGO thin films on electrode surfaces and electrocatalysis can be
compared to electrocatalysis of the physisorbed systems with the expectation that retention of the
catalyst on the surface will be dramatically improved by grafting.
6.2 In situ x-ray absorption measurements on adsorbed cobalt bis(dichlorobenzenedithiolate)
X-ray absorption near edge structure (XANES) and extended x-ray absorption fine
structure (EXAFS) measurements at the cobalt K-edge were conducted of the catalyst 1 adsorbed
to carbon paper electrodes using beamline 11-2 at SSRL at the Stanford Linear Accelerator Center.
Carbon paper electrodes were cut from a larger sheet and immersed in a vial containing a 5 mM
solution of 1 in acetonitrile. These electrodes were soaked for at least 2 hours but up to 2 days
before measurements were conducted. Measurements were performed by immersing the electrode
in a cell containing a 0.1 M KPF6 electrolyte solution with a graphite rod counter electrode and a
Ag|AgCl (saturated KCl) reference electrode. A photograph of the cell is shown in Figure 6.6. A
Kapton film is glued (with super glue) across the window in the center. The carbon paper electrode
is positioned in front of that window. The solvent thickness at that point is 1 mm; however, this
was found to be too thick to achieve a signal, so a stack of small squares of tape (electroplater’s
tape) was placed on the back window of the cell to push the electrode forward against the front
window to reduce the solvent layer in front of it. This method of sandwiching the electrode
between the tape layer and the front window must inhibit diffusion of species in solution to the
electrode surface; however, we deemed this to be insignificant considering the porosity of the
electrode itself.
XANES measurements were taken at four different pH values (acidified with trace metal
grade sulfuric acid): neutral pH (unbuffered, this is around pH 6), pH 3, 2, and 1. At each pH,
measurements were taken at a range of potentials between open circuit potential (usually around
+0.3 V) and -0.9 V, vs Ag|AgCl. Under each set of conditions, three subsequent scans were taken,
normalized, and averaged. One set of EXAFS measurements was also conducted on a sample in a

113
pH 1 solution at -0.8 V every 30 minutes over the course of 10 hours to determine whether
degradation occurs under these conditions.
Figure 6.6 Photograph of the electrochemical cell used for XAS experiments. Front view (left)
and top view (right). Kapton film was glued (using super glue) across the window in the view on
the left. The electrodes were inserted through the holes on the top of the cell in the view on the
right and the solution was purged via an N2 line inserted through the smallest round hole. The cell
is not air-tight, but a blanket of N2 was kept flowing over the top of the solution during
experiments.
Figure 6.7 Overlay of normalized Co K-edge XANES spectra for two different samples at neutral
pH (no added acid). Sample 1 was taken after soaking the electrode in a solution of 1 for about 4
hours on day 1, and Sample 8 was taking after soaking the electrode for about 2 days on day 5.
The electrolyte was deaerated 0.1 M KPF6.

114
After plotting the XANES data it became apparent that some small sample to sample
variations had occurred, as well as variations within a single sample after holding at negative
potentials. For example, Figure 6.7 shows the data for two different samples, both at neutral pH
and at open circuit potential. The spectrum for Sample 1 was taken first, and the spectrum for
Sample 8 was taken about 4 days later. The broader feature at ~7715 eV and the increased
amplitude at 7725 eV are consistent with coordination environment changes, from largely 4-
coordinate initially to more 5-coordinate after 4 days. There are two possible explanations for this
finding. First, since the same solution of 1 was used to soak electrodes during the week at the beam
line, it is possible that the complex underwent a change in solution over time. Some kind of
aggregation or polymerization may have occurred. However, since the color of the solution
appeared to remain unchanged, I believe this to be unlikely. On the other hand, since Sample 1
and Sample 8 were soaked in the solution of 1 for different amounts of time (about 4 hours and
about 2 days, respectively) it is possible that longer soaking times allow for a change to occur on
the surface of the carbon electrode. For example, 1 may coordinate a native oxide species on the
carbon electrode, becoming 5-coordinate. Interestingly, this change in 1 over time, either on the
surface or in solution, does not appear to affect the electrochemistry. Electrochemical
measurements obtained from these carbon electrodes were difficult to interpret due to their high
surface areas and likely large potential gradients across the electrodes. However, in previous
studies on smaller, planar carbon electrodes, no change in electrochemistry related to a variation
in soaking times was observed.
In comparing spectra for one sample at different potentials, it is also apparent that small,
irreversible changes occur when moving to low potentials. Figure 6.8 shows spectra at a series of
potentials at each pH point. These series of data were taken starting at open circuit potential (OCP)
and then moving progressively more negative, then returning to more positive potentials, ending
at OCP again. For example, for the sample at neutral pH, a spectrum was taken at OCP; then the
potential was held at -0.4 V and a spectrum was taken; then it was held at -0.6 V and a spectrum
was taken; then -0.8 V, -0.9 V, back to -0.4 V, and finally OCP again. Each spectrum was an
average of three scans each of which took about 10 minutes to complete, totaling 30 minutes for a
single spectrum. It is apparent from these data that some small changes have occurred at OCP after
ramping to negative potentials. In most cases, upon return to OCP, the structure looks more 5- or

115
6- coordinate than initially (by the less prominent feature at about 7715 eV). This could be
explained by the cobalt complex coordinating at the axial position to an oxide group on the carbon
Figure 6.8 Overlay of Co K-edge XANES spectra with the electrode held at various potentials at
each pH. Each electrode was first held at OCP, then brought to -0.4 V, then -0.8 V, then -0.9 V,
and then it was brought back through the potentials in reverse order, ending at OCP. Hence, OCP
(1st) was the first spectrum and OCP (2nd) the last spectrum taken in each case. (Note that at pH
2, no data was taken at -0.4 V, hence the missing spectra.) The electrolyte was deaerated 0.1 M
KPF6 acidified with sulfuric acid. Each spectrum was taken on the same spot on the same (i.e. the
sample position was not moved between scans).
paper electrode. It is also possible that further intercalation occurs when the electrode is held at
negative potentials and that this intercalation sufficiently alters the structure to produce the spectral
variations observed in Figure 6.8. Further EXAFS measurements and fittings can help determine

116
the precise structure of 1 before and after ramping to negative potentials. However, at this time it
is not clear whether these small changes are purely electrochemical based (i.e. whether ramping to
negative potentials is enough to change the spectrum of 1 irreversibly) or whether it is a
combination of negative potentials and illumination by the x-ray beam that causes irreversible
damage to the sample. If it is the former case, this is of scientific interest and merits further study.
If it is the latter case, experiments may need to be performed on a less intense beamline to limit
beam damage to the sample. Further experiments are needed to determine the exact origin of this
observation.
Figure 6.9 Overlays of Co K-edge XANES spectra for individual carbon paper electrodes with
adsorbed 1 at the highest (OCP) and lowest (-0.9 or -0.8 V) potentials over the range of pH values.
The electrolyte was deaerated 0.1 M KPF6 acidified with sulfuric acid.
In Figure 6.9, the spectra for each pH point at OCP and at the lowest potential are overlaid.
One important takeaway from these results is that the reduction of 1 can be seen at all pH points.
That is, a Co(II) species can be identified even under low pH when catalysis is fast (although
smaller amounts of Co(II) are present in this case). The reduction is very apparent by the shift of
the edge to lower energy in neutral pH, pH 3, and pH 2. In the pH 1 solution, the edge shift is less
dramatic but still occurs to a small extent. This is likely because catalysis in pH 1 solutions is fast,
meaning the reduced cobalt species is transient. Because the XANES measurement is an average
of all cobalt species over the timescale of the scans, the spectrum then shows more oxidized cobalt
character than reduced cobalt character. This implies that electron transfer to the Co(III) catalyst
is the rate-limiting step for proton reduction catalysis under these conditions. Based on this finding,
further XAS experiments are merited. If inconsistencies in the data and data collection can be
limited, we may be able to derive the structure of the reduced Co(II) species at low pH and
determine whether this is a protonated intermediate in the catalytic cycle.

117
Lastly, Figure 6.10 shows a fit of a set of EXAFS data of a carbon electrode with adsorbed
1 in a pH 1 solution held at -0.8 V. This electrode was soaked for about 2 days in the solution of 1
before conducting the EXAFS measurements. The XANES spectra of this electrode, taken before
the EXAFS spectrum, are shown in Figures 6.8 and 6.9 (at pH 1). Approximately 20 scans were
taken and averaged to produce a single spectrum, which was fitted with a shell of four sulfur atoms
at 2.19 Å. This bond distance matches the crystal structure for 1.248 The peak at about 3.8 Å is due
to the near linearity of the Co---C---C interaction (164˚), which gives rise to a multiple-scattering
process. This fit seems to suggest that the cobalt species is the original 4-coordinate square planar
bis(benzenedithiolate) complex or something extremely similar. This electrode was soaked for a
long time and held at a negative potential for a long time, which has been shown by XANES data
to induce a change in the structure. One possible explanation for this phenomenon is that the cobalt
species that initially adsorbs to the carbon electrode is coordinated axially to a native oxide species
on the electrode and that this bond is broken at low potential. In this case, the change that is seen
in the XANES spectra after ramping to negative potentials at low pH could be due in part to a
return to the four-coordinate, Co(III) state. The changes seen at neutral pH, involving a shift in
edge energy in addition to a change in shape, are more consistent with reduction of Co. This, of
course, merits further study. EXAFS spectra at each potential and pH point should be collected
and fitted to obtain structural information.
Figure 6.10 Fitted EXAFS data of a carbon paper electrode with 1 adsorbed, held at -0.8 V vs
Ag|AgCl. The electrolyte was deaerated in 0.1 M KPF6 and acidified to pH 1 with sulfuric acid.
Approximately 20 scans were taken and averaged.

118
Future work. Further XANES and EXAFS data should be collected on this same system,
but the soaking times for each electrode should be kept precisely the same. Additionally, the
solution of 1 used for soaking should be either checked by UV-visible absorption spectroscopy
daily to ensure it is not degrading, or the solution should be remade daily to prevent degradation.
Experiments should be also conducted to determine whether an irreversible electrochemical
change occurs on the adsorbed catalyst when ramping to negative potentials or if the x-ray beam
itself damages the sample at negative potentials. This can be accomplished by (1) taking a spectrum
at OCP, (2) ramping to a negative potential and taking a spectrum, (3) returning to OCP and taking
a spectrum, and then (4) moving to a new spot on the sample and taking a spectrum. If the spectrum
at the new spot is the same as spectrum 3, then the irreversible change is purely electrochemical
in nature. If it is instead the same as spectrum 1, then the change is partially beam-induced.
EXAFS spectra should then be collected at different pH values and different applied
potentials to more precisely determine the structure of the catalyst before and after the irreversible
change occurs. Additionally, XPS experiments may also help understand the changes we see in
the cobalt species. For example, the additional peak at 787 eV seen in the XP spectrum of 1 on
RGO in Chapter 3 (Figure 3.2) may be related to the change in the XANES data after long soaking
times. Specifically, if longer soaking times result in a change in the way 1 binds to the surface, this
may result in two different cobalt XPS binding energies.
6.3 Heterogeneous photoelectrocatalysis using p-GaP photoelectrodes with an electrocatalyst
adsorbed to an RGO thin film
Photoelectrochemical water splitting is a promising clean source of hydrogen gas as the
reaction can be driven partially or entirely by sunlight. The RGO films developed in Chapter 2 and
modified with a proton reduction catalyst in Chapters 3 and 4 can be used on a semiconductor
photoelectrode for photoelectrocatalytic proton reduction. Because RGO films are highly
transparent, they allow an underlying semiconductor to absorb sunlight, and because of their
electronic conductivity and ability to bind a molecular catalyst, they can facilitate electron transfer
from the excited semiconductor electrode to the catalyst. Some preliminary work using p-type
gallium phosphide as an electrode material is presented here.

119
Figure 6.11 Photocurrent response of a p-GaP(100) photoelectrode in deaerated 0.1 M
tetrabutylammonium perchlorate in acetonitrile with 10 mM trifluoroacetic acid with various
concentrations of 1. A platinum mesh counter electrode and platinum wire quasi-reference
electrode were used. The scan rate was 50 mV/s and the light intensity was 100 mW/cm2 white
light.
Initially, the catalyst 1 (discussed in Chapters 3 and 4) was dissolved in electrolyte solution
and bare planar p-GaP(100) wafers were used as electrodes. The electrolyte consisted of 0.1 M
tetrabutylammonium perchlorate (TBAP) in acetonitrile with 10 mM trifluoroacetic acid (TFA).
The photocurrent responses of this system under 100 mW/cm2 white light (halogen lamp) are
shown in Figure 6.11 Upon addition of 0.1 mM 1 to the solution, the onset current shifted positive
by about 400 mV. After raising the concentration of 1 to 0.2 mM, a pre-wave appeared as a
shoulder at about -0.5 V. It is not clear what process caused this wave.
After verifying the ability of p-GaP to facilitate charge transport to 1 under illumination
thereby catalyzing proton reduction, GO films were dropcasted on methylated p-GaP(111A)
electrodes (methylated following the Grignard procedure in Reference 333) and reduced using
cobaltocene (as in Chapter 2). It should be noted that depositing RGO films on bare p-GaP
electrodes caused severe degradation of the GaP surface, resulting in no photocurrent response;
therefore, methylation of the GaP surface was performed to inhibit this degradation. The
methylated GaP electrode modified with an RGO thin film was immersed in the same electrolyte
solution as used in the paragraph above (0.1 M TBAP and 10 mM TFA in acetonitrile). The
photocurrent responses (Figure 6.12 were not as pristine as with a bare GaP surface; however, it
is apparent that current onset occurred at a slightly more positive potential with the addition of 1.
This demonstrates that charge transport from p-GaP to 1 can occur through a thin RGO film.

120
Figure 6.12 Photocurrent response of a methylated p-GaP(111A) photoelectrode with an RGO
film in deaerated 0.1 M tetrabutylammonium perchlorate in acetonitrile with 10 mM trifluoroacetic
acid with various concentrations of 1. A platinum mesh counter electrode and platinum wire quasi-
reference electrode were used. The scan rate was 50 mV/s and the light intensity was 100 mW/cm2
white light. The dashed lines are the current in the dark.
The next experiments attempted physisorption of 1 to RGO surfaces on p-GaP. The
photocurrent response of RGO thin films on methylated p-GaP wafers were first obtained in 0.1
M KPF6 solution with 10 mM TFA in water under 100 mW/cm2. These wafers were then immersed
in a 5 mM solution of 1 in acetonitrile in an inert-atmosphere glovebox for 40 minutes. After
rinsing and drying under a nitrogen stream the photocurrent response was again obtained.
Surprisingly, the onset of current was shifted to more negative potentials than before soaking in
catalyst (Figure 6.13. This suggests that soaking in the catalyst solution somehow degraded the
GaP-RGO interface. Possibly trace oxygen or water in the solution damaged the GaP surface.
In a final experiment, solutions of GO and 1 were mixed before casting (following the
procedure for forming embedded films in Chapter 4). This mixture was dropcasted on phenylated
p-GaP wafers. The GO was reduced to RGO by holding the wafers at -0.4 V vs Ag|AgCl for 300
s in 0.1 M KPF6 with 10 mM TFA in water under 100 mW/cm2 white light. The onset of
photocurrent with these electrodes was not different between electrodes with 1 and electrodes
without 1. As can be seen in Figure 6.14, the variation between two identical electrodes exceeds
the difference between electrodes with 1 and electrodes without 1.
In order to obtain more consistent results, GO films fabricated by spincasting were
developed in the hopes that these would be more uniform and controllable than films fabricated
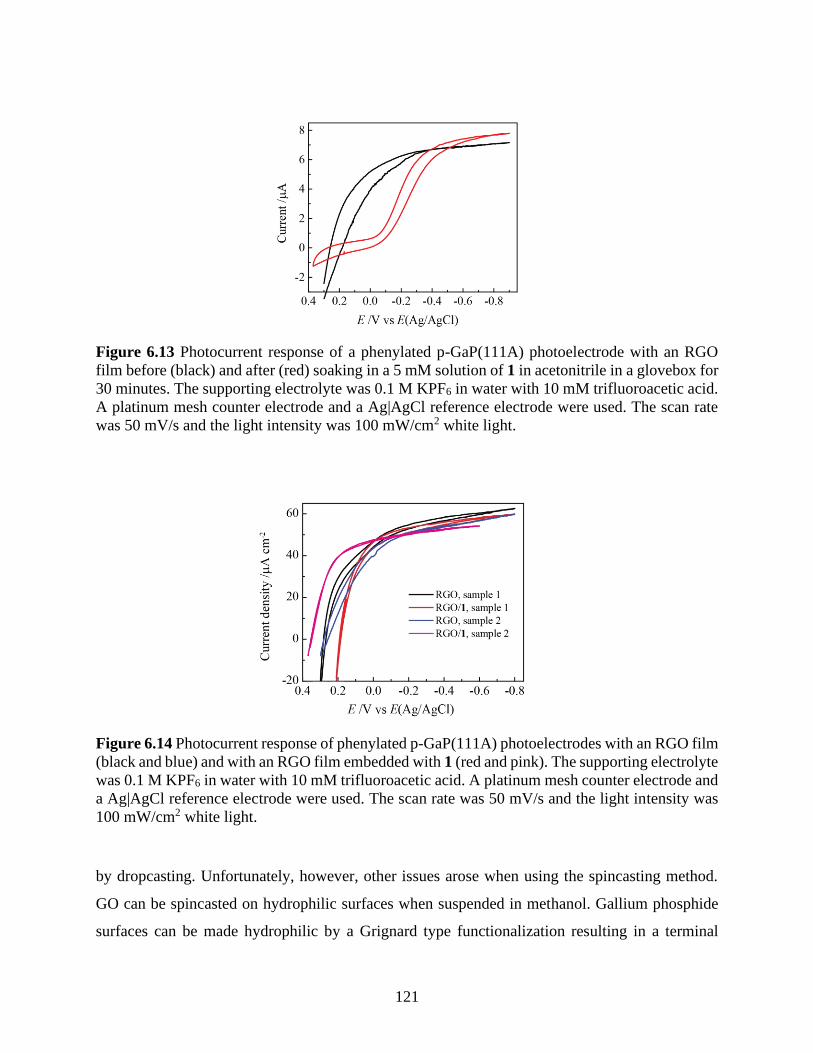
121
Figure 6.13 Photocurrent response of a phenylated p-GaP(111A) photoelectrode with an RGO
film before (black) and after (red) soaking in a 5 mM solution of 1 in acetonitrile in a glovebox for
30 minutes. The supporting electrolyte was 0.1 M KPF6 in water with 10 mM trifluoroacetic acid.
A platinum mesh counter electrode and a Ag|AgCl reference electrode were used. The scan rate
was 50 mV/s and the light intensity was 100 mW/cm2 white light.
Figure 6.14 Photocurrent response of phenylated p-GaP(111A) photoelectrodes with an RGO film
(black and blue) and with an RGO film embedded with 1 (red and pink). The supporting electrolyte
was 0.1 M KPF6 in water with 10 mM trifluoroacetic acid. A platinum mesh counter electrode and
a Ag|AgCl reference electrode were used. The scan rate was 50 mV/s and the light intensity was
100 mW/cm2 white light.
by dropcasting. Unfortunately, however, other issues arose when using the spincasting method.
GO can be spincasted on hydrophilic surfaces when suspended in methanol. Gallium phosphide
surfaces can be made hydrophilic by a Grignard type functionalization resulting in a terminal

122
benzyl alcohol group. However, the hydrophilic surface that was beneficial for spincasting GO
was detrimental after the GO was reduced to RGO. Where GO is hydrophilic, RGO is hydrophobic
and it was seen to delaminate quickly from benzyl alcohol terminated GaP surfaces under
photoelectrochemical experiments in acidic water.
Future work. One option for spincasting adherent RGO films is to functionalize the GaP
surface with a group that can alternate between hydrophobic and hydrophilic character. For
example, the functional group in Figure 6.15 can rotate about the methylene bond to direct either
the vinyl group (which is hydrophobic) or the alcohol group (hydrophilic) upwards. On this type
of surface, when exposed to a protic solvent, like methanol, the surface group should orient with
the alcohol group upward, presenting a hydrophilic surface. When the GO film is reduced to RGO,
the surface bound moiety should rotate so that the vinyl group faces upward, presenting a
hydrophobic surface. Developing a GaP surface functionality with these characteristics is one
option to move forward with this project. Another option is to use a different deposition method
to obtain highly reproducible, uniform thin RGO films. Several methods exist in the literature,
such as Langmuir-Blodgett, spray-casting, and Meyer rod coating.81-82, 334-336 If highly uniform,
reproducible RGO thin films can be formed on p-GaP, then photoelectrochemical measurements
should show better performance with 1-modified RGO films compared to plain RGO films.
Figure 6.15 Possible functionalization of a gallium phosphide surface that can present both a
hydrophobic (left) and hydrophilic (right) surface.
However, even with the poor reproducibility of photoelectrochemical measurements on
RGO-modified GaP photocathodes, it is possible that any potential gain with this system in the
presence of 1 is minimal. Therefore, in addition to the experiments described above, experiments
using other semiconductors such as p-Si should be conducted. Furthermore, wide-bandgap
semiconductors, such as TiO2 or NiO, can be used with an adsorbed sensitizer in addition to 1. The

123
dye crystal violet (λmax ~590 nm) was shown in Chapter 2 to adsorb strongly and remain
electrochemically active on RGO films. Adsorbing both crystal violet and 1 to an RGO film on a
wide-bandgap semiconductor is worth investigating as a sensitized photoelectrocatalytic system.
6.4 Passivation of n-Si photoelectrodes with RGO thin films
Silicon is a common material for both photoanodes and photocathodes in
photoelectrochemical energy conversion. When used as a photocathode, Si is highly stable, but
when used as a photoanode the surface is susceptible to oxidation, especially in aqueous and
oxygenated media.337-338 In order for silicon to be viable as a photoanode material for water
oxidation, the surface must be passivated to prevent silicon oxidation. Chemical passivation
techniques involve saturating “dangling bonds” at the surface, i.e. binding small molecules to
surface defect sites. This lowers the Si surface energy and makes it less likely to react with species
such as O2 or H2O.339-340 Physical passivation involves deposition of an organic or inorganic layer
on the Si surface that acts simply as a physical barrier to reactive species.341 Graphene has been
shown previously to passivate n-Si photoanode surfaces against oxidation in aqueous media.43, 76-
77 The combination of a physical passivation layer on top of a chemically passivated surface should
doubly extend the lifetime of a silicon surface under oxidative conditions, by simultaneously
lowering the energy of the surface atoms and physically blocking reactive species from
approaching the surface. To demonstrate this effect, data are presented in this section detailing the
use of RGO thin films as a physical passivation method on chemically passivated n-Si
photoanodes.
Ultra-thin RGO films were prepared on n-silicon substrates by spincasting a methanolic
suspension of GO, followed by reduction to RGO in a 15 mM CoCp2/TFA solution in the glovebox
(see Chapter 2 for details on the reduction method). Spincasted films were highly uniform when
the silicon surface was hydrophilic. To this end, bare silicon surfaces were either etched with O2-
plasma directly before spincasting or chemically passivated with a benzyl alcohol group through
a Grignard treatment. GO suspensions were spincasted at 500 rpm for 5 seconds, 1500 rpm for 35
seconds, and 2000 rpm for 1 minute. GO was reduced to RGO by immersion in a 15 mM solution
of cobaltocene with trifluoroacetic acid for 30 minutes, following the procedure in Chapter 2.

124
Figure 6.16 (left) Electrolysis of a silicon photoanode with (red) and without (black) an RGO thin
film under 0.5 V and 100 mW/cm2 white light. (right) Photocurrent response of the Si/RGO
photoanode after the electrolysis. The electrolyte was 0.5 M K4Fe(CN)6 in 0.2 M phosphate buffer
(pH 7). Platinum mesh was used as the counter electrode and Ag|AgCl was used as the reference
electrode.
Figure 6.16 (a) shows electrolysis data of a bare n-Si electrode (black) and a bare n-Si
electrode with an RGO film (red). The electrodes were held at 0.5 V (vs Ag|AgCl) under 50
mW/cm2 white light (halogen lamp) in a solution of 0.5 M K4Fe(CN)6 in 0.2 M phosphate buffer
(pH 7). Platinum mesh was used as the counter electrode. Current on both electrodes dropped off
extremely quickly, reaching a plateau within seconds. The initial current and the final plateau
current of Si/RGO were higher than those of bare Si. Cyclic voltammograms of the Si/RGO
electrode after electrolysis are shown in Figure 6.16 (b). Current under illumination was not
different than current in the dark at the electrolysis potential. From this data it can be concluded
that the higher current from Si/RGO compared to bare Si was due to an exceptionally high dark
current. This may be due to the formation of a large defect layer on Si during the RGO deposition
process.
Figure 6.17 shows data corresponding to silicon wafers functionalized with a benzyl
alcohol group (termed Si-BnOH) with and without an RGO film. Passivation with the benzyl
alcohol group helps to protect the silicon surface during RGO deposition. Figure 6.17a shows
cyclic voltammetry of fresh Si-BnOH and Si-BnOH/RGO electrodes in 0.5 M K4Fe(CN)6 in a 0.2
M phosphate buffer (pH 7) under 50 mW/cm2 white light (halogen lamp). Both show the typical
square shape of light-limited current at a semiconductor. The Si-BnOH/RGO electrode
photocurrent plateaued at a lower value than the Si-BnOH electrode and the plateau region was

125
Figure 6.17 (a) Photoresponse of a silicon (111) photoanode functionalized with a benzyl alcohol
group with (red) and without (black) an RGO film. (b) Dark current of the same electrodes as in
(a). (c) Electrolysis under illumination at 0.5 V using the same electrodes as in (a) and (b). (d)
Photoresponse of the electrodes after conducting the electrolysis in (c). The electrolyte was 0.5 M
K4Fe(CN)6 in 0.2 M phosphate buffer (pH 7) and illumination in all cases was 50 mW/cm2 white
light. Platinum mesh was used as the counter electrode and Ag|AgCl was used as the reference
electrode.
less flat. The former can be explained by light absorbance from the RGO thin film (bulk RGO is
black) and a less-than-ideal interface between RGO and Si, which would result in a non-ideal
photocurrent response. This is further supported by the dark current responses shown in Figure
6.17b. From this data the Si-BnOH/RGO electrode showed clear resistor-like behavior, suggesting
that even with the chemical passivation, the Si-RGO interface is somewhat resistive. However, the
electrolysis data (Figure 6.17c) were promising. After holding each electrode at 0.5 V under 50
mW/cm2, current at the Si-BnOH electrode decayed sharply after about 250 s. While the initial
current at the Si-BnOH/RGO electrode was lower than Si-BnOH, it did not sharply decay until
after about 500 s. This points to the ability of RGO to stabilize silicon photoanodes under oxidative
conditions. Figure 6.17d shows voltammograms under illumination after a 30-minute electrolysis
at 0.5 V under illumination. Both voltammograms retained the ideal square shape, but the onset of

126
current and plateau of current occurred at more positive potentials for both electrodes, compared
to the voltammetry before electrolysis, which is indicative of surface degradation.
The final set of data shown here correspond to Si-BnOH and Si-BnOH/RGO electrodes
after having been subjected to drying on a vacuum line (~200 mTorr) for two days as an attempt
to fully dehydrate the RGO film. The ability of an RGO thin film to protect silicon wafers from
oxidation can clearly be seen from this data. The electrolysis data in Figure 6.18c shows that the
current from the Si-BnOH/RGO electrode was steady for longer than 20 minutes. At about 22
minutes, it rapidly droped off. Current from the Si-BnOH electrode, on the other hand, rapidly
droped off in under 5 minutes. Furthermore, the difference in the quality of photocurrent after a
~30 minute electrolysis can be seen in Figure 6.18b. While both curves shifted positive compared
to before electrolysis (Figure 6.18a), the curve for Si-BnOH shifted far more positive than Si-
BnOH/RGO. The electrolysis potential (0.5 V) was still in the plateau current region (i.e.
maximum current) for Si-BnOH/RGO, whereas it was at the base of the wave (minimum current)
for Si-BnOH. Furthermore, Figure 6.19 shows XPS data of these surfaces. The Si oxide peak of
Si-BnOH clearly increased after electrolysis but for Si-BnOH/RGO there was little change.
Figure 6.18 (a) Photoresponse of a silicon (111) photoanode functionalized with a benzyl alcohol
group with (red) and without (black) an RGO film after drying under vacuum. (b) Photoresponse
of the electrodes after conducting the electrolysis in (c). (c) Electrolysis under illumination and 0.5
V using the same electrodes as in (a) and (b). The electrolyte was 0.5 M K4Fe(CN)6 in 0.2 M

127
phosphate buffer (pH 7) and illumination in all cases was 50 mW/cm2 white light. Platinum mesh
was used as the counter electrode and Ag|AgCl was used as the reference electrode.
Figure 6.19 Si 2p XP spectra of the silicon photoanodes before and after electrolysis under
illumination. (a) Silicon (111) functionalized with a benzyl alcohol group. (b) Silicon (111)
functionalized with a benzyl alcohol group and with an RGO film that had been dried under
vacuum.
Future work. Unfortunately, at this point the RGO thin films became irreproducible.
Spincasting resulted in spotty, thick, or nonexistent films. The cause of this was attributed to a
change in the chemical functionalities of GO that had been kept in suspension over time. Further
work is needed to obtain reproducible, uniform thin films of GO again. Once these films can be
obtained, additional experiments showing reproducible passivation of n-Si under oxidative
conditions should be performed. The best results so far were obtained when the Si wafer was first
covalently passivated (with a benzyl alcohol group) and when the RGO film was dried under
vacuum before performing electrochemistry. The effect of the drying procedure should be
investigated, i.e. effects of drying time and of vacuum strength. Separately, effects of film
thickness can be investigated. Additional experiments should be conducted on other unstable
semiconductor photoelectrodes (such as GaP and InGaP).
Furthermore, it is worth investigating whether an RGO film can be casted on a bare
semiconductor surface (i.e. with no initial chemical passivation) without damaging the surface,
and whether this film alone can passivate the surface. This might be achievable, for example, by
using a completely air-free and water-free suspension of GO under an inert atmosphere. Due to
the hydrophilic nature of GO, it will be difficult to obtain a completely water-free suspension,

128
however, with proper use of drying agents and repeated washing with dry solvents, it should be
possible.
6.5 Graphene oxide self-assembled monolayers on silicon oxide surfaces
As discussed in Chapter 3, graphene oxide (GO) can be functionalized with small
molecules in a variety of ways. Using these functionalization methods, a variety of small
molecules, proteins, and nanoparticles have been tethered to GO sheets54, 342-344 but little research
has delved into tethering GO sheets to macroscopic surfaces.345 Tethering GO to surfaces can be
beneficial in several ways, including inhibition of film delamination, allowing for formation of
single-layer GO films, and pattering of single-layer GO films.
Among the many reported GO functionalization methods, alkoxysilane and amino
functionalities bind to GO through the hydroxyl and epoxide groups, respectively. These grafting
methods are discussed further in Chapter 3. It is also known that alkoxysilane groups bind to glass
(silicon oxide) surfaces through terminal hydroxyl groups.330 Using this information, two
molecular tethers were investigated for the binding of GO monolayers to silicon oxide surfaces.
They are (3-aminopropyl)-triethoxysilane (APTES) and tetraethylorthosilicate (TEOS) (Figure
6.19). These species were first bound to silicon wafers containing a native oxide layer by soaking
the slides in a 1% solution of the appropriate silane in toluene for 24 hours. The slides were then
rinsed with clean toluene and acetone, dried, and then immersed in a homogeneous methanolic
suspension of GO. In the case of APTES, the suspension was heated to about 70 for 2 hours,
then cooled, and the slide was rinsed with methanol and then water and dried under a nitrogen
stream. In the case of TEOS, the suspension was left at room temperature for varied amounts of
time.
Figure 6.20 Scheme for GO monolayer attachment on silicon oxide surfaces using APTES (left)
and TEOS (right).

129
AFM images of the modified Si surfaces are shown in Figure 6.20. From these images it
can be seen that in the case of APTES a full coverage or almost full coverage GO film was present.
The film was thin enough that individual overlapping GO sheets could be distinguished, suggesting
it was approximately one sheet thick. However, this should further be confirmed by examining the
step height at an edge of the film. In the case of TEOS, the surface grafting reaction was much
slower. After 20 hours soaking in a GO suspension, single GO sheets could be observed scattered
across the surface. After 4 days in a GO suspension, a higher density of GO sheets could be
observed. And after 1 week in a GO suspension even more sheets were observed. However, at this
point it was apparent that the sheets had begun to aggregate in clumps leaving areas of bare glass
exposed. It was hypothesized that deposition of a GO sheet on a surface leads to aggregation at
that site over time, in the same way that a crystallite nucleates crystal growth in a solution. Reaction
of GO with surface-bound TEOS at room temperature was too slow to out-compete aggregation.
Figure 6.21 Atomic force micrographs of self-assembled GO films on silicon wafers. (Top) A
silicon wafer that had been functionalized with APTES and then immersed in a methanolic
suspension of GO at 70 for two hours. (Bottom) Silicon wafers that had been functionalized with
TEOS and then immersed in a methanolic suspension of GO at room temperature for 20 hours, 4
days, and 1 week.
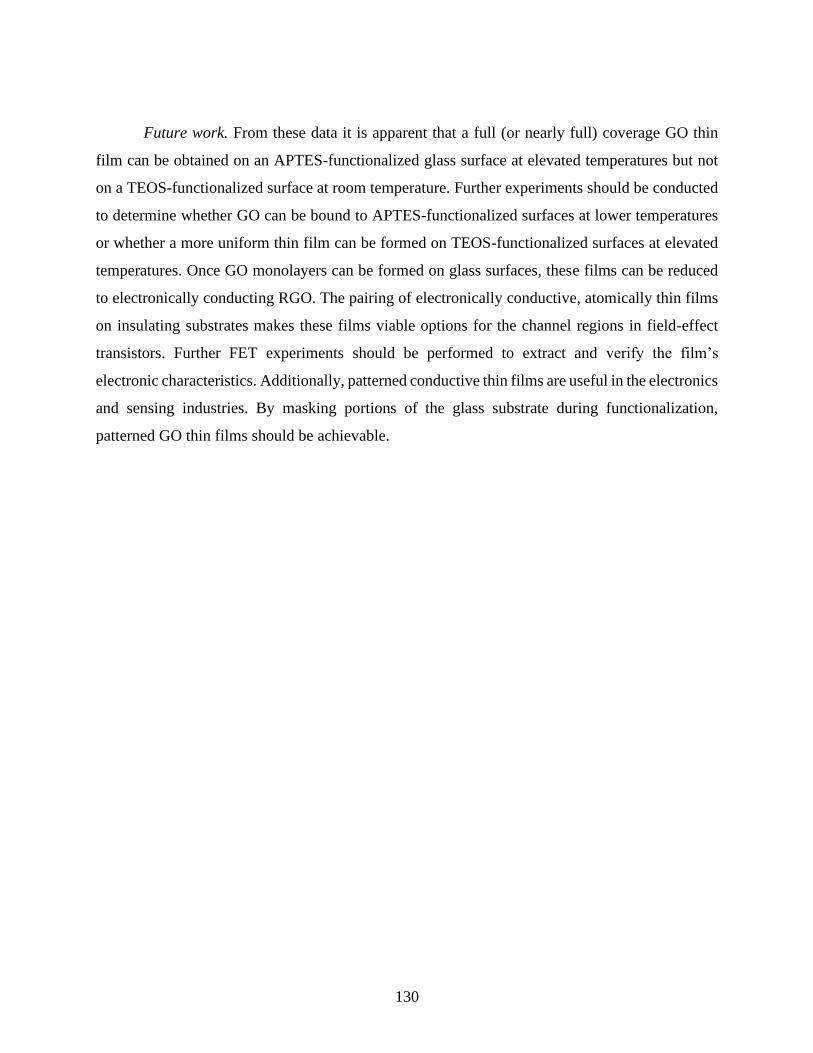
130
Future work. From these data it is apparent that a full (or nearly full) coverage GO thin
film can be obtained on an APTES-functionalized glass surface at elevated temperatures but not
on a TEOS-functionalized surface at room temperature. Further experiments should be conducted
to determine whether GO can be bound to APTES-functionalized surfaces at lower temperatures
or whether a more uniform thin film can be formed on TEOS-functionalized surfaces at elevated
temperatures. Once GO monolayers can be formed on glass surfaces, these films can be reduced
to electronically conducting RGO. The pairing of electronically conductive, atomically thin films
on insulating substrates makes these films viable options for the channel regions in field-effect
transistors. Further FET experiments should be performed to extract and verify the film’s
electronic characteristics. Additionally, patterned conductive thin films are useful in the electronics
and sensing industries. By masking portions of the glass substrate during functionalization,
patterned GO thin films should be achievable.

131
This thesis describes efforts toward improving electrochemical energy conversion systems,
specifically in terms of heterogeneous electrocatalytic solar energy conversion and stabilization of
redox mediators for use as long-term energy storage materials. Photoelectrochemistry is a
promising method for the conversion of solar energy to storable chemical fuels. In
photoelectrochemical cells, sunlight absorbed by semiconductor electrodes immersed in an
electrolyte solution causes electrons to flow between the semiconductors, which drives redox
reactions in the electrolyte solution, thereby generating chemical fuels.
One major obstacle for implementing large scale photoelectrochemical energy conversion
is high activation overpotentials for redox reactions occurring at electrode surfaces. Addition of
an electrocatalyst can help mitigate these high overpotentials. Specifically, heterogeneous
molecular electrocatalysis is a promising platform that has received comparatively little attention
in photoelectrochemical systems. Molecular catalysts are advantageous over solid-state catalysts
because they have well-defined active sites that can be more easily understood and controlled.
Heterogenization of molecular electrocatalysts is desirable because it means less material waste
than homogeneous systems, and it opens the door to catalysts that are insoluble in the electrolyte
medium. Heterogenization of a molecular species can be achieved by physisorption to a surface
using van der Waals forces or by covalent attachment through chemical bonds to the surface.
Physisorption has the benefit of being cheap and facile but often has the disadvantage of low
stability. Covalent attachment is generally more expensive and difficult to achieve but can have
better stability.
Both physisorbed and covalent heterogeneous electrocatalytic systems have received
considerable attention especially using carbon-based electrodes because carbon is amenable to
modification by both methods. Heterogeneous photoelectrocatalytic systems, however, have
received far less attention in part because of the high surface-specificity of surface attachment. The
work in this thesis describes the use of reduced graphene oxide (RGO) thin films on electrode
surfaces to immobilize a molecular electrocatalyst. These films can be used in
Chapter 7. Summary and Conclusions

132
photoelectrocatalytic systems because they are both transparent and conductive, allowing light to
penetrate to the underlying semiconductor and electrons to penetrate to the electrolyte interface.
RGO thin films can be deposited on essentially any electrode surface, thereby allowing previously
studied methods for small molecule immobilization on carbon surfaces to be applied to
semiconductor electrodes in photoelectrochemical cells.
A novel method of fabricating thin RGO films is presented in Chapter 2 of this thesis. This
method is novel in that it uses an outer-sphere chemical reductant to reduce GO films to high
quality RGO films. Because of the gentleness of the method, these RGO films can be casted on a
wide variety of substrates. The reducing solution (cobaltocene and an organic acid) are non-
corrosive to substrates like reactive metals (e.g. indium) and flexible substrates like paper,
demonstrating the applicability of this method to a wide range of substrate materials. This is highly
beneficial for use in photoelectrochemical systems, considering the low stability of many
semiconductor surfaces. Furthermore, these RGO films are shown to adsorb the molecular proton
reduction electrocatalyst cobalt(III) bis(dichlorobenzenedithiolate) (1). The adsorption is assumed
to be due to π-stacking interactions with the aromatic network of RGO; however, some XPS and
XAS data suggest that additional interactions with the surface may occur, such as coordination to
oxide groups. Further characterization using XAS, XANES, and EXAFS is necessary.
Retention of the adsorbed catalyst on these RGO films is shown to be highly dependent on
the surface morphology of the RGO. Under turnover conditions, the catalyst is quickly lost from
smooth RGO films, whereas it is retained for significantly longer times on roughened films. Based
on these results and published reports on graphite electrodes and RGO electrodeposited on FTO-
coated glass electrodes,69, 217-218 it is hypothesized that the catalyst can intercalate within rougher
films, thereby becoming mechanically trapped. These data are relevant for research on adsorption
of small molecules to graphitic surfaces using π-stacking interactions. The work here shows that
while a molecule may readily adsorb to a surface, the interactions holding it on that surface may
not be strong enough to retain it during a chemical transformation, such as catalytic turnover.
However, if intercalation within the graphitic material also occurs, this can help to retain the
molecule for a much longer period of time. This phenomenon can help explain variations and
irreproducibility in reports of molecular adsorption to graphitic surfaces where different deposition
methods and different substrates can produce very different film morphologies. Furthermore, it
points toward potential approaches for improving stability of physisorbed systems that utilize π-

133
stacking interactions. For example, the strength of π-stacking interactions between a molecule and
a surface may be improved by adding more π-systems or larger π-systems to the small molecule.
For instance, the use of pyrene ligands rather than benzene ligands may enhance surface stability
in the case of 1. Another option may be to fabricate reproducibly rough RGO films. If the
roughness (and surface area) of these films can be defined and controlled and if they are thin
enough to allow light transmittance, then they can be useful for studying heterogeneous molecular
electrocatalysis in photoelectrochemical cells.
Besides the use of rough RGO surfaces, another method to improve catalyst retention
developed here is the direct embedding of the electrocatalyst 1 in RGO films by co-deposition.
This is achieved by dropcasting a mixture of a solution of 1 with a suspension of GO followed by
reduction. This thesis further presents work describing kinetic limiting factors on electrocatalytic
proton reduction in these electrocatalytic “mixed” films. By varying the thickness of the films and
the density of catalyst within the films, it is shown that the electrocatalytic current is limited by a
convolution of factors, most likely diffusion of product and substrate within the film as well as
electrical conductivity of the film. For thinner films, the current appears to be limited by diffusion
of either substrate or product (or both), whereas for thicker films, another limiting factor comes
into play, most likely electrical conductivity of the RGO films. This thesis demonstrates the first
work on understanding the kinetics of electrocatalysis in embedded RGO films. To date, literature
has been published on the kinetics of proton reduction in electrocatalytic polymer films239, 241-242
and other reactions in electrocatalytic inorganic films (such as porous metal oxides).232, 236, 346
Given the unique structure of RGO compared to conventional polymers and inorganic films, we
expect the electrical conductivity and diffusion of material into and out of the film to be similarly
unique. Further experiments on this front are described in Chapter 4, which will help to identify
whether product or substrate diffusion is limiting in thinner films and to determine whether
changes in morphology influence the attainable current in thick films versus thin films. For
example, determining catalytic reversibility or whether the catalyst can be poisoned by product
can help determine whether product buildup can affect the system. Statistical imaging of the films
can help demonstrate whether the surface morphology is consistent over a range of thicknesses.
In addition to the experiments on physisorbed 1 on and within RGO thin films on electrode
surfaces, some data on method development for covalent attachment of molecules to RGO films
are also presented. The following three methods for attachment of small molecules on RGO are

134
demonstrated: attachment of amine-containing molecules via RGO epoxide groups; azidification
of RGO followed by a copper-catalyzed click reaction with an alkyne-containing species; and
attachment of an alkoxysilane molecule to RGO alcohol groups. Each of these methods
successfully grafts a small molecule to the surface of graphene oxide thin films. Reaction with
silanes appears to give the highest surface coverage and the click reaction appears to give the
lowest surface coverage. Further experiments to optimize each of these grafting reactions are
detailed in Chapter 6. Ultimately, these reactions will be used to graft a version of 1 to RGO thin
films. Current work is focused on synthesizing derivatives of 1 containing amine, alkyne, and
alkoxysilane functionalities. Once these derivatives are synthesized, RGO films containing the
three types of grafted catalyst will be compared to each other and to the physisorbed systems. This
work will demonstrate differences and similarities in the electrochemistry, catalytic activity, and
stability of different methods of immobilizing 1 on graphitic carbon electrode surfaces.
The ultimate goal of developing these RGO films with immobilized catalyst is to use them
on semiconductor electrodes for photoelectrocatalytic proton reduction. Some preliminary results
are shown in Chapter 6 of this thesis using these RGO films to modify gallium phosphide
photocathodes. Both surface-adsorbed 1 on smooth RGO films and RGO films embedded with 1
were deposited on p-GaP surfaces. The data from these experiments are not wholly conclusive but
suggest that inconsistencies in RGO film deposition lead to large variations in photocurrent and
onset potential. Further experiments are presented that suggest modifications of the GaP surface
that will protect the native surface against chemical attack and allow for spincasting of highly
uniform and reproducible RGO films. Additionally, other types of semiconductors should be tested
with these RGO thin films, for example Si, which has a very large overpotential for proton
reduction.
Chapter 6 also presents some preliminary data that uses RGO thin films to address another
shortcoming in photoelectrochemical energy conversion. Many semiconductor materials exhibit
low stability in water and under illumination and applied potential. Silicon is one such material.
Under illumination and positive bias in water, n-Si rapidly oxidizes to SiOx leading to loss in
photocurrent and photovoltage. In basic conditions (commonly used in water oxidation) corrosion
also occurs because SiOx is soluble in basic media. Methods for protecting semiconductor surfaces
against degradation pathways like this involve chemical passivation by saturating dangling bonds
at the surface, which lowers the energy of the surface, or physical passivation by depositing a layer

135
that can block reactive species from approaching the semiconductor surface. Many of these
methods, however, are highly surface-specific and expensive to implement.
Reported here are data demonstrating the ability of RGO thin films, which are cheap and
not surface-specific, to passivate n-Si surfaces. Silicon (111) surfaces were first chemically
passivated with a benzyl-alcohol group and then RGO thin films were spincasted on top.
Photoelectrochemical and XPS data demonstrate longer-lived photocurrent and less silicon
oxidation in pH 7 electrolyte on electrodes with the RGO film compared to electrodes without the
RGO film, suggesting RGO can act as a barrier for reactive species such as OH- and H2O to
approach the silicon surface. Further experiments should first demonstrate reproducibility of the
data presented here. Then the ability of RGO to passivate other semiconductor surfaces (such as
GaP) and in other conditions (such as acidic or basic media) should be investigated. An important
benefit of using RGO to passivate semiconductor photoelectrodes is that RGO can simultaneously
be used to immobilize electrocatalysts, thereby addressing two problems associated with
photoelectrochemical cells. Future experiments should investigate the ability of RGO thin films to
simultaneously protect photoelectrode surfaces and facilitate heterogeneous electrocatalysis by
immobilizing a catalyst like 1.
Chapter 5 of this thesis addresses a different area in photoelectrochemical energy storage.
While the water-splitting reaction is the most common reaction in fuel-generating
photoelectrochemical cells, hydrogen gas presents many safety concerns when it comes to storage
and transportation because of its gaseous form and reactivity with oxygen. Solid-state, liquid, and
dissolved redox couples do not present these safety concerns and are therefore more desirable than
H2 as fuel sources in this respect. Viologens, for example, are a class of organic molecules that are
redox active and are commonly used in solution state or as polymers in electrochemical energy
storage. One problem that arises when using viologens to store electrochemical energy is their
sensitivity to oxygen. Viologen radicals readily oxidize in trace amounts of oxygen, which limits
their shelf-life.
Chapter 5 addresses this issue by describing the use of cucurbituril cage molecules to trap
and stabilize a unique oxidation state of bis-viologens. Free in solution, these viologens undergo a
2-electron reduction, between the 4+ (stable in air) and the 2+ oxidation states. When encapsulated
within CB[8], an intermediate oxidation state (3+) is accessible. Interestingly, these entrapped 3+
bis-viologens are exceptionally stable in the presence of oxygen. Oxidation of solutions of the

136
encapsulated 3+ viologens exposed to air were about an order of magnitude slower than oxidation
of solutions of the free 2+ viologens exposed to air. Molecular orbital calculations on these species
suggest that the origin of this stability arises from a SOMO orbital that is embedded between the
two aromatic moieties of the folded viologen within the cucurbituril. This phenomenon occurs
because the viologen moieties are forced into a unique conformation by a combination of their
covalent linkage and encapsulation within the cage molecule.
This work demonstrates a method for stabilizing a reduced viologen in the presence of
oxygen by using a combination of synthetic and supramolecular techniques. Understanding the
basis of this stabilization opens the door for development of other stabilized systems. For example,
the viologen moieties can be methylated to provide a larger tunneling barrier around the buried
SOMO electron, potentially slowing reaction with O2 even further. Alternatively, a solid porous
structure, like a MOF, could potentially be designed with cavities that can host bis-viologens in
the same way that CB[8] does in solution. In this way, the viologens will be stabilized both by
forced conformation (as in CB[8]) and by residing inside a solid support into which diffusion of
O2 should be slow. Looking in another direction, solubility of CB[8] in water is quite poor.
Development of an alternative cage molecule that has the same effect on bis-viologens but is also
highly soluble in water would be extremely useful. And lastly, development of a method to
crystallize 3+ bis-viologens entrapped in CB[8] may also be useful, as a way to store the charged
material less densely.
In summary, this thesis presents important progress in two areas related to
photoelectrochemical energy conversion and storage. The first is immobilization of a molecular
electrocatalyst on both electrode and photoelectrode surfaces, which has previously proved
difficult due in part to the surface-specificity of immobilization techniques. In this thesis,
immobilization is achieved by use of transparent and conductive graphitic thin films that allow for
both physisorption and covalent attachment of molecular species. Insights into the role of surface
morphology of these films on the retention of a physisorbed molecular catalyst as well as limiting
kinetic factors for electrocatalysis using these films are described. This work presents a cheap,
facile, and generalizable method for immobilizing molecular electrocatalysts on electrode and
semiconductor surfaces and describes the first efforts in understanding the fundamental kinetics of
an electrocatalytic graphitic film. Second, stabilization of organic radicals for long-term storage of
electrochemical energy is presented. Viologens possess many characteristics beneficial for use as

137
long-term energy storage materials but suffer from fast oxidation in the presence of trace oxygen.
Synergistic effects from covalent linkage and supramolecular assembly are demonstrated in this
thesis to thermodynamically and kinetically stabilize two reduced viologen radicals against
reaction with oxygen. This work presents a facile method that allows for extending the shelf-life
of reduced viologen radicals and points towards methods for improving this shelf-life by further
slowing down the reaction rate with oxygen.

138
1. Berna, F.; Goldberg, P.; Horwitz, L. K.; Brink, J.; Holt, S.; Bamford, M.; Chazan, M.,
Microstratigraphic evidence of in situ fire in the Acheulean strata of Wonderwerk Cave,
Northern Cape province, South Africa. Proceedings of the National Academy of Sciences
2012, 109 (20), E1215-E1220.
2. DeLong, J. P.; Burger, O., Socio-Economic Instability and the Scaling of Energy Use with
Population Size. PLOS ONE 2015, 10 (6), e0130547.
3. Capuano, L., International Energy Outlook 2018. US Energy Information Administration, C.
f. S. a. I. S., Ed. Washington DC, 2018.
4. Marchal, V.; Dellink, R.; Vuuren, D. v.; Clapp, C.; Chateau, J.; Lanzi, E.; Magne, B.; Vliet,
J. v. OECD Environmental Outlook to 2050; OECD: 2011.
5. Wuebbles, D. J.; Fahey, D. W.; Hibbard, K. A.; DeAngelo, B.; Doherty, S.; Hayhoe, K.;
Horton, R.; Kossin, J. P.; Taylor, P. C.; Waple, A. M.; Weaver, C. P. 2017: Executive
summary. In: Climate Science Special Report: Fourth National Climate Assessment, Volume
I; U.S. Global Change Research Program: Washington, DC, USA, 2017.
6. Levy, B. S.; Patz, J. A., Climate Change, Human Rights, and Social Justice. Annals of Global
Health 2015, 81 (3), 310-322.
7. Patz, J. A.; Gibbs, H. K.; Foley, J. A.; Rogers, J. V.; Smith, K. R., Climate Change and Global
Health: Quantifying a Growing Ethical Crisis. EcoHealth 2007, 4 (4), 397-405.
8. Tol, R. S. J., The Economic Impacts of Climate Change. Review of Environmental Economics
and Policy 2018, 12 (1), 4-25.
9. Lewis, N. S.; Nocera, D. G., Powering the planet: Chemical challenges in solar energy
utilization. Proceedings of the National Academy of Sciences 2006, 103 (43), 15729-15735.
10. Ismail, A. A.; Bahnemann, D. W., Photochemical splitting of water for hydrogen production
by photocatalysis: A review. Solar Energy Materials and Solar Cells 2014, 128, 85-101.
11. Andreiadis, E. S.; Chavarot‐Kerlidou, M.; Fontecave, M.; Artero, V., Artificial
Photosynthesis: From Molecular Catalysts for Light‐driven Water Splitting to
Photoelectrochemical Cells. Photochemistry and Photobiology 2011, 87 (5), 946-964.
12. Ran, J.; Zhang, J.; Yu, J.; Jaroniec, M.; Qiao, S. Z., Earth-abundant cocatalysts for
semiconductor-based photocatalytic water splitting. Chemical Society Reviews 2014, 43 (22),
7787-7812.
13. Fonash, S., Solar cell device physics. Elsevier: 2012.
14. Luo, J.; Im, J.-H.; Mayer, M. T.; Schreier, M.; Nazeeruddin, M. K.; Park, N.-G.; Tilley, S. D.;
Fan, H. J.; Grätzel, M., Water photolysis at 12.3% efficiency via perovskite photovoltaics and
Earth-abundant catalysts. Science 2014, 345 (6204), 1593-1596.
15. Gao, Y.; Le Corre, V. M.; Gaïtis, A.; Neophytou, M.; Hamid, M. A.; Takanabe, K.; Beaujuge,
P. M., Homo‐Tandem Polymer Solar Cells with VOC> 1.8 V for Efficient PV‐Driven Water
Splitting. Advanced Materials 2016, 28 (17), 3366-3373.
8. Bibliography

139
16. Li, W.; Jiang, N.; Hu, B.; Liu, X.; Song, F.; Han, G.; Jordan, T. J.; Hanson, T. B.; Liu, T. L.;
Sun, Y., Electrolyzer design for flexible decoupled water splitting and organic upgrading with
electron reservoirs. Chem 2018, 4 (3), 637-649.
17. Jia, J.; Seitz, L. C.; Benck, J. D.; Huo, Y.; Chen, Y.; Ng, J. W. D.; Bilir, T.; Harris, J. S.;
Jaramillo, T. F., Solar water splitting by photovoltaic-electrolysis with a solar-to-hydrogen
efficiency over 30%. Nature communications 2016, 7 (1), 1-6.
18. Sankir, N. D.; Sankir, M., Photoelectrochemical Solar Cells. John Wiley & Sons: 2018.
19. Li, Z.; Luo, W.; Zhang, M.; Feng, J.; Zou, Z., Photoelectrochemical cells for solar hydrogen
production: current state of promising photoelectrodes, methods to improve their properties,
and outlook. Energy & Environmental Science 2013, 6 (2), 347-370.
20. Memming, R., Photoelectrochemical solar energy conversion. In Electrochemistry II,
Springer: 1988; pp 79-112.
21. Tan, M. X.; Laibinis, P. E.; Nguyen, S. T.; Kesselman, J. M.; Stanton, C. E.; Lewis, N. S.,
Principles and applications of semiconductor photoelectrochemistry. Progress in inorganic
chemistry 1994, 21-144.
22. Abe, R., Recent progress on photocatalytic and photoelectrochemical water splitting under
visible light irradiation. Journal of Photochemistry and Photobiology C: Photochemistry
Reviews 2010, 11 (4), 179-209.
23. Dutta, S., A review on production, storage of hydrogen and its utilization as an energy
resource. Journal of Industrial and Engineering Chemistry 2014, 20 (4), 1148-1156.
24. Ye, R.; Henkensmeier, D.; Yoon, S. J.; Huang, Z.; Kim, D. K.; Chang, Z.; Kim, S.; Chen, R.,
Redox Flow Batteries for Energy Storage: A Technology Review. Journal of Electrochemical
Energy Conversion and Storage 2017, 15 (1).
25. Singh, V.; Kim, S.; Kang, J.; Byon, H. R., Aqueous organic redox flow batteries. Nano
Research 2019, 12 (9), 1988-2001.
26. Selzer, Y.; Turyan, I.; Mandler, D., Studying heterogeneous catalysis by the scanning
electrochemical microscope (SECM): The reduction of protons by methyl viologen catalyzed
by a platinum surface. The Journal of Physical Chemistry B 1999, 103 (9), 1509-1517.
27. Tilley, S. D.; Lany, S.; Van de Krol, R., Advances in Photoelectrochemical Water Splitting:
Theory, Experiment and Systems Analysis. Royal Society of Chemistry: 2018.
28. Mills, A.; Douglas, P.; Russell, T., Kinetic study of the reduction of water to hydrogen by
reduced methyl viologen mediated by platinised alumina. Journal of the Chemical Society,
Faraday Transactions 1990, 86 (9), 1417-1423.
29. Agar, J.; Bowden, F. P., The kinetics of electrode reactions. I and II. Proceedings of the Royal
Society of London. Series A. Mathematical and Physical Sciences 1938, 169 (937), 206-234.
30. Bard, A. J.; Faulkner, L. R., Electrochemical Methods: Fundamental and Applications. 2nd
ed.; John Wiley & Sons: Hoboken, NJ, 2001.
31. Conway, B.; Jerkiewicz, G., Relation of energies and coverages of underpotential and
overpotential deposited H at Pt and other metals to the ‘volcano curve’for cathodic H2
evolution kinetics. Electrochimica Acta 2000, 45 (25-26), 4075-4083.
32. McKone, J. R.; Marinescu, S. C.; Brunschwig, B. S.; Winkler, J. R.; Gray, H. B., Earth-
abundant hydrogen evolution electrocatalysts. Chemical Science 2014, 5 (3), 865-878.
33. Tran, P. D.; Artero, V.; Fontecave, M., Water electrolysis and photoelectrolysis on electrodes
engineered using biological and bio-inspired molecular systems. Energy & Environmental
Science 2010, 3 (6), 727-747.
140
34. Bullock, R. M.; Das, A. K.; Appel, A. M., Surface immobilization of molecular
electrocatalysts for energy conversion. Chemistry–A European Journal 2017, 23 (32), 7626-
7641.
35. Tian, H., Molecular Catalyst Immobilized Photocathodes for Water/Proton and Carbon
Dioxide Reduction. ChemSusChem 2015, 8 (22), 3746-3759.
36. Yan, Y.; Xia, B. Y.; Zhao, B.; Wang, X., A review on noble-metal-free bifunctional
heterogeneous catalysts for overall electrochemical water splitting. Journal of Materials
Chemistry A 2016, 4 (45), 17587-17603.
37. Zou, X.; Zhang, Y., Noble metal-free hydrogen evolution catalysts for water splitting.
Chemical Society Reviews 2015, 44 (15), 5148-5180.
38. Zeng, M.; Li, Y., Recent advances in heterogeneous electrocatalysts for the hydrogen
evolution reaction. Journal of Materials Chemistry A 2015, 3 (29), 14942-14962.
39. Bansal, A.; Li, X.; Lauermann, I.; Lewis, N. S.; Yi, S. I.; Weinberg, W. H., Alkylation of Si
Surfaces Using a Two-Step Halogenation/Grignard Route. Journal of the American Chemical
Society 1996, 118 (30), 7225-7226.
40. Schvartzman, M.; Sidorov, V.; Ritter, D.; Paz, Y., Surface passivation of (100) InP by organic
thiols and polyimide as characterized by steady-state photoluminescence. Semiconductor
science and technology 2001, 16 (10), L68.
41. Huang, M. L.; Chang, Y. C.; Chang, C. H.; Lee, Y. J.; Chang, P.; Kwo, J.; Wu, T. B.; Hong,
M., Surface passivation of III-V compound semiconductors using atomic-layer-deposition-
grown Al2O3. Applied Physics Letters 2005, 87 (25), 252104.
42. Yang, G. H.; Zhang, Y.; Kang, E. T.; Neoh, K. G.; Huang, W.; Teng, J. H., Surface Passivation
of (100)-Oriented GaAs via Plasma Deposition of an Ultrathin S-Containing Polymer Film
and Its Effect on Photoluminescence. The Journal of Physical Chemistry B 2003, 107 (33),
8592-8598.
43. Nielander, A. C.; Bierman, M. J.; Petrone, N.; Strandwitz, N. C.; Ardo, S.; Yang, F.; Hone,
J.; Lewis, N. S., Photoelectrochemical Behavior of n-Type Si(111) Electrodes Coated With a
Single Layer of Graphene. Journal of the American Chemical Society 2013, 135 (46), 17246-
17249.
44. Wang, W.; Xu, X.; Zhou, W.; Shao, Z., Recent Progress in Metal-Organic Frameworks for
Applications in Electrocatalytic and Photocatalytic Water Splitting. Advanced Science 2017,
4 (4), 1600371.
45. Hou, Y.; Zhuang, X.; Feng, X., Recent Advances in Earth-Abundant Heterogeneous
Electrocatalysts for Photoelectrochemical Water Splitting. Small Methods 2017, 1 (6),
1700090.
46. Thoi, V. S.; Sun, Y.; Long, J. R.; Chang, C. J., Complexes of earth-abundant metals for
catalytic electrochemical hydrogen generation under aqueous conditions. Chemical Society
Reviews 2013, 42 (6), 2388-2400.
47. Wang, M.; Li, F., Electrochemical Water Oxidation and Reduction Catalyzed by
Organometallic Compounds. In Applied Homogeneous Catalysis with Organometallic
Compounds, 2017; pp 1135-1194.
48. Wang, N.; Zheng, H.; Zhang, W.; Cao, R., Mononuclear first-row transition-metal complexes
as molecular catalysts for water oxidation. Chinese Journal of Catalysis 2018, 39 (2), 228-
244.

141
49. Joya, K. S.; Vallés-Pardo, J. L.; Joya, Y. F.; Eisenmayer, T.; Thomas, B.; Buda, F.; de Groot,
H. J. M., Molecular Catalytic Assemblies for Electrodriven Water Splitting. ChemPlusChem
2013, 78 (1), 35-47.
50. Wang, M.; Han, K.; Zhang, S.; Sun, L., Integration of organometallic complexes with
semiconductors and other nanomaterials for photocatalytic H2 production. Coordination
Chemistry Reviews 2015, 287, 1-14.
51. Coutard, N.; Kaeffer, N.; Artero, V., Molecular engineered nanomaterials for catalytic
hydrogen evolution and oxidation. Chemical Communications 2016, 52 (95), 13728-13748.
52. Materna, K. L.; Crabtree, R. H.; Brudvig, G. W., Anchoring groups for photocatalytic water
oxidation on metal oxide surfaces. Chemical Society Reviews 2017, 46 (20), 6099-6110.
53. Silverman, B. M.; Wieghaus, K. A.; Schwartz, J., Comparative properties of siloxane vs
phosphonate monolayers on a key titanium alloy. Langmuir 2005, 21 (1), 225-228.
54. Campisciano, V.; Gruttadauria, M.; Giacalone, F., Modified Nanocarbons for Catalysis.
ChemCatChem 2019, 11 (1), 90-133.
55. Kuila, T.; Bose, S.; Mishra, A. K.; Khanra, P.; Kim, N. H.; Lee, J. H., Chemical
functionalization of graphene and its applications. Progress in Materials Science 2012, 57
(7), 1061-1105.
56. Toma, F. M.; Sartorel, A.; Iurlo, M.; Carraro, M.; Parisse, P.; Maccato, C.; Rapino, S.;
Gonzalez, B. R.; Amenitsch, H.; Da Ros, T.; Casalis, L.; Goldoni, A.; Marcaccio, M.;
Scorrano, G.; Scoles, G.; Paolucci, F.; Prato, M.; Bonchio, M., Efficient water oxidation at
carbon nanotube–polyoxometalate electrocatalytic interfaces. Nature Chemistry 2010, 2 (10),
826-831.
57. Sandanayaka, A. S. D.; Chitta, R.; Subbaiyan, N. K.; D’Souza, L.; Ito, O.; D’Souza, F.,
Photoinduced Charge Separation in Ion-Paired Porphyrin−Single-Wall Carbon Nanotube
Donor−Acceptor Hybrids. The Journal of Physical Chemistry C 2009, 113 (30), 13425-
13432.
58. Wang, R.-Q.; Suo, L.; Zheng, D.-M.; Du, Y.; Wu, L.-X.; Bi, L.-H., A heterogeneous catalyst
containing tetraruthenium (IV)-substituted silicotungstate: Preparation, characterization and
catalytic performance toward oxidation of n-tetradecane with air. Inorganica Chimica Acta
2016, 443, 218-223.
59. Le Goff, A.; Artero, V.; Jousselme, B.; Tran, P. D.; Guillet, N.; Métayé, R.; Fihri, A.; Palacin,
S.; Fontecave, M., From hydrogenases to noble metal–free catalytic nanomaterials for H2
production and uptake. Science 2009, 326 (5958), 1384-1387.
60. Tran, P. D.; Le Goff, A.; Heidkamp, J.; Jousselme, B.; Guillet, N.; Palacin, S.; Dau, H.;
Fontecave, M.; Artero, V., Noncovalent Modification of Carbon Nanotubes with Pyrene‐
Functionalized Nickel Complexes: Carbon Monoxide Tolerant Catalysts for Hydrogen
Evolution and Uptake. Angewandte Chemie International Edition 2011, 50 (6), 1371-1374.
61. Blakemore, J. D.; Gupta, A.; Warren, J. J.; Brunschwig, B. S.; Gray, H. B., Noncovalent
immobilization of electrocatalysts on carbon electrodes for fuel production. Journal of the
American Chemical Society 2013, 135 (49), 18288-18291.
62. Downes, C. A.; Marinescu, S. C., Efficient electrochemical and photoelectrochemical H2
production from water by a cobalt dithiolene one-dimensional metal–organic surface. Journal
of the American Chemical Society 2015, 137 (43), 13740-13743.
63. Andreiadis, E. S.; Jacques, P.-A.; Tran, P. D.; Leyris, A.; Chavarot-Kerlidou, M.; Jousselme,
B.; Matheron, M.; Pécaut, J.; Palacin, S.; Fontecave, M., Molecular engineering of a cobalt-

142
based electrocatalytic nanomaterial for H 2 evolution under fully aqueous conditions. Nature
chemistry 2013, 5 (1), 48-53.
64. Muresan, N. M.; Willkomm, J.; Mersch, D.; Vaynzof, Y.; Reisner, E., Immobilization of a
molecular cobaloxime catalyst for hydrogen evolution on a mesoporous metal oxide
electrode. Angewandte Chemie International Edition 2012, 51 (51), 12749-12753.
65. Thomas, C. M.; Rüdiger, O.; Liu, T.; Carson, C. E.; Hall, M. B.; Darensbourg, M. Y.,
Synthesis of carboxylic acid-modified [FeFe]-hydrogenase model complexes amenable to
surface immobilization. Organometallics 2007, 26 (16), 3976-3984.
66. Al Cheikh, J.; Villagra, A.; Ranjbari, A.; Pradon, A.; Antuch, M.; Dragoe, D.; Millet, P.;
Assaud, L., Engineering a cobalt clathrochelate/glassy carbon interface for the hydrogen
evolution reaction. Applied Catalysis B: Environmental 2019, 250, 292-300.
67. Li, X.; Lei, H.; Liu, J.; Zhao, X.; Ding, S.; Zhang, Z.; Tao, X.; Zhang, W.; Wang, W.; Zheng,
X., Carbon Nanotubes with Cobalt Corroles for Hydrogen and Oxygen Evolution in pH 0–14
Solutions. Angewandte Chemie International Edition 2018, 57 (46), 15070-15075.
68. McAllister, J.; Bandeira, N. A.; McGlynn, J. C.; Ganin, A. Y.; Song, Y.-F.; Bo, C.; Miras, H.
N., Tuning and mechanistic insights of metal chalcogenide molecular catalysts for the
hydrogen-evolution reaction. Nature communications 2019, 10 (1), 1-10.
69. Eady, S. C.; MacInnes, M. M.; Lehnert, N., Immobilized Cobalt Bis (benzenedithiolate)
Complexes: Exceptionally Active Heterogeneous Electrocatalysts for Dihydrogen Production
from Mildly Acidic Aqueous Solutions. Inorganic chemistry 2017, 56 (19), 11654-11667.
70. Seo, J.; Pekarek, R. T.; Rose, M. J., Photoelectrochemical operation of a surface-bound,
nickel-phosphine H 2 evolution catalyst on p-Si (111): a molecular semiconductor| catalyst
construct. Chemical Communications 2015, 51 (68), 13264-13267.
71. Hou, Y.; Abrams, B. L.; Vesborg, P. C.; Björketun, M. E.; Herbst, K.; Bech, L.; Setti, A. M.;
Damsgaard, C. D.; Pedersen, T.; Hansen, O., Bioinspired molecular co-catalysts bonded to a
silicon photocathode for solar hydrogen evolution. Nature materials 2011, 10 (6), 434-438.
72. Nann, T.; Ibrahim, S. K.; Woi, P. M.; Xu, S.; Ziegler, J.; Pickett, C. J., Water splitting by
visible light: a nanophotocathode for hydrogen production. Angewandte Chemie International
Edition 2010, 49 (9), 1574-1577.
73. Beiler, A. M.; Khusnutdinova, D.; Jacob, S. I.; Moore, G. F., Chemistry at the interface:
polymer-functionalized GaP semiconductors for solar hydrogen production. Industrial &
Engineering Chemistry Research 2016, 55 (18), 5306-5314.
74. Beden, B.; Leger, J., C. Lamy in J. O'M. Bockris, BE Conway and RE White (Eds.), Modern
Aspects of Electrochemistry, Vol. 22. Plenum Press, New York: 1992.
75. Memming, R., Semiconductor electrochemistry. John Wiley & Sons: 2015.
76. Sim, U.; Yang, T.-Y.; Moon, J.; An, J.; Hwang, J.; Seo, J.-H.; Lee, J.; Kim, K. Y.; Lee, J.;
Han, S., N-doped monolayer graphene catalyst on silicon photocathode for hydrogen
production. Energy & Environmental Science 2013, 6 (12), 3658-3664.
77. Chatterjee, S.; Carter, R.; Oakes, L.; Erwin, W. R.; Bardhan, R.; Pint, C. L., Electrochemical
and corrosion stability of nanostructured silicon by graphene coatings: toward high power
porous silicon supercapacitors. The Journal of Physical Chemistry C 2014, 118 (20), 10893-
10902.
78. Tan, R. K. L.; Reeves, S. P.; Hashemi, N.; Thomas, D. G.; Kavak, E.; Montazami, R.;
Hashemi, N. N., Graphene as a flexible electrode: review of fabrication approaches. Journal
of Materials Chemistry A 2017, 5 (34), 17777-17803.

143
79. Choi, W.; Lahiri, I.; Seelaboyina, R.; Kang, Y. S., Synthesis of Graphene and Its Applications:
A Review. Critical Reviews in Solid State and Materials Sciences 2010, 35 (1), 52-71.
80. Poh, H. L.; Šaněk, F.; Ambrosi, A.; Zhao, G.; Sofer, Z.; Pumera, M., Graphenes prepared by
Staudenmaier, Hofmann and Hummers methods with consequent thermal exfoliation exhibit
very different electrochemical properties. Nanoscale 2012, 4 (11), 3515-3522.
81. Cote, L. J.; Kim, F.; Huang, J., Langmuir−Blodgett Assembly of Graphite Oxide Single
Layers. Journal of the American Chemical Society 2009, 131 (3), 1043-1049.
82. Wang, J.; Liang, M.; Fang, Y.; Qiu, T.; Zhang, J.; Zhi, L., Rod-Coating: Towards Large-Area
Fabrication of Uniform Reduced Graphene Oxide Films for Flexible Touch Screens.
Advanced Materials 2012, 24 (21), 2874-2878.
83. Eda, G.; Chhowalla, M., Graphene-based Composite Thin Films for Electronics. Nano Letters
2009, 9 (2), 814-818.
84. Eluyemi, M.; Eleruja, M.; Adedeji, A.; Olofinjana, B.; Fasakin, O.; Akinwunmi, O.; Ilori, O.;
Famojuro, A.; Ayinde, S.; Ajayi, E., Synthesis and characterization of graphene oxide and
reduced graphene oxide thin films deposited by spray pyrolysis method. Graphene 2016, 5
(3), 143-154.
85. Bao, H.; Pan, Y.; Ping, Y.; Sahoo, N. G.; Wu, T.; Li, L.; Li, J.; Gan, L. H., Chitosan‐
functionalized graphene oxide as a nanocarrier for drug and gene delivery. Small 2011, 7 (11),
1569-1578.
86. Niyogi, S.; Bekyarova, E.; Itkis, M. E.; McWilliams, J. L.; Hamon, M. A.; Haddon, R. C.,
Solution properties of graphite and graphene. Journal of the American Chemical Society 2006,
128 (24), 7720-7721.
87. Xu, Y.; Liu, Z.; Zhang, X.; Wang, Y.; Tian, J.; Huang, Y.; Ma, Y.; Zhang, X.; Chen, Y., A
graphene hybrid material covalently functionalized with porphyrin: synthesis and optical
limiting property. Advanced materials 2009, 21 (12), 1275-1279.
88. Jang, J.; Pham, V. H.; Hur, S. H.; Chung, J. S., Dispersibility of reduced alkylamine-
functionalized graphene oxides in organic solvents. Journal of colloid and interface science
2014, 424, 62-66.
89. Ikeda, Y.; Karim, M. R.; Takehira, H.; Matsui, T.; Taniguchi, T.; Koinuma, M.; Matsumoto,
Y.; Hayami, S., Proton conductivity of graphene oxide hybrids with covalently functionalized
alkylamines. Chemistry Letters 2013, 42 (11), 1412-1414.
90. Compton, O. C.; Dikin, D. A.; Putz, K. W.; Brinson, L. C.; Nguyen, S. T., Electrically
conductive “alkylated” graphene paper via chemical reduction of amine‐functionalized
graphene oxide paper. Advanced materials 2010, 22 (8), 892-896.
91. Li, F.; Zhang, B.; Li, X.; Jiang, Y.; Chen, L.; Li, Y.; Sun, L., Highly efficient oxidation of
water by a molecular catalyst immobilized on carbon nanotubes. Angewandte Chemie
International Edition 2011, 50 (51), 12276-12279.
92. Hu, X. M.; Rønne, M. H.; Pedersen, S. U.; Skrydstrup, T.; Daasbjerg, K., Enhanced catalytic
activity of cobalt porphyrin in CO2 electroreduction upon immobilization on carbon
materials. Angewandte Chemie International Edition 2017, 56 (23), 6468-6472.
93. Hummers Jr, W. S.; Offeman, R. E., Preparation of graphitic oxide. Journal of the american
chemical society 1958, 80 (6), 1339-1339.
94. Hofmann, U.; König, E., Untersuchungen über graphitoxyd. Zeitschrift für anorganische und
allgemeine Chemie 1937, 234 (4), 311-336.
95. Staudenmaier, L., Verfahren zur darstellung der graphitsäure. Berichte der deutschen
chemischen Gesellschaft 1898, 31 (2), 1481-1487.

144
96. Chua, C. K.; Pumera, M., Chemical reduction of graphene oxide: a synthetic chemistry
viewpoint. Chem. Soc. Rev. 2014, 43 (1), 291-312.
97. Pei, S.; Cheng, H.-M., The reduction of graphene oxide. Carbon 2012, 50 (9), 3210-3228.
98. Gao, W., The chemistry of graphene oxide. In Graphene oxide, Springer: 2015; pp 61-95.
99. Cheung, T., X‐ray photoemission of polynuclear aromatic carbon. Journal of applied physics
1984, 55 (5), 1388-1393.
100. Leiro, J.; Heinonen, M.; Laiho, T.; Batirev, I., Core-level XPS spectra of fullerene, highly
oriented pyrolitic graphite, and glassy carbon. Journal of Electron Spectroscopy and Related
Phenomena 2003, 128 (2-3), 205-213.
101. Malard, L. M.; Pimenta, M. A.; Dresselhaus, G.; Dresselhaus, M. S., Raman spectroscopy in
graphene. Physics Reports 2009, 473 (5-6), 51-87.
102. Pimenta, M.; Dresselhaus, G.; Dresselhaus, M. S.; Cancado, L.; Jorio, A.; Saito, R., Studying
disorder in graphite-based systems by Raman spectroscopy. Physical chemistry chemical
physics 2007, 9 (11), 1276-1290.
103. Tuinstra, F.; Koenig, J. L., Raman Spectrum of Graphite. J. Chem. Phys. 1970, 53 (3), 1126-
1130.
104. Baranov, A.; Bekhterev, A.; Bobovich, Y. S.; Petrov, V., Interpretation of certain
characteristics in Raman spectra of graphite and glassy carbon. Opt. Spektrosk 1987, 62
(1036), 99.
105. Cançado, L. G.; Takai, K.; Enoki, T.; Endo, M.; Kim, Y. A.; Mizusaki, H.; Jorio, A.; Coelho,
L. N.; Magalhães-Paniago, R.; Pimenta, M. A., General equation for the determination of the
crystallite size La of nanographite by Raman spectroscopy. Appl. Phys. Lett. 2006, 88 (16),
163106.
106. Ferrari, A. C.; Robertson, J., Interpretation of Raman spectra of disordered and amorphous
carbon. Phys. Rev. B 2000, 61 (20), 14095-14107.
107. Lucchese, M. M.; Stavale, F.; Ferreira, E. H. M.; Vilani, C.; Moutinho, M. V. O.; Capaz, R.
B.; Achete, C. A.; Jorio, A., Quantifying ion-induced defects and Raman relaxation length in
graphene. Carbon 2010, 48 (5), 1592-1597.
108. Sadezky, A.; Muckenhuber, H.; Grothe, H.; Niessner, R.; Pöschl, U., Raman
microspectroscopy of soot and related carbonaceous materials: Spectral analysis and
structural information. Carbon 2005, 43 (8), 1731-1742.
109. Claramunt, S.; Varea, A.; López-Díaz, D.; Velázquez, M. M.; Cornet, A.; Cirera, A., The
Importance of Interbands on the Interpretation of the Raman Spectrum of Graphene Oxide. J.
Phys. Chem. C 2015, 119 (18), 10123-10129.
110. Kawashima, Y.; Katagiri, G., Fundamentals, overtones, and combinations in the Raman
spectrum of graphite. Phys. Rev. B 1995, 52 (14), 10053-10059.
111. Tai, F.; Lee, S.-C.; Chen, J.; Wei, C.; Chang, S., Multipeak fitting analysis of Raman spectra
on DLCH film. Journal of Raman Spectroscopy: An International Journal for Original Work
in all Aspects of Raman Spectroscopy, Including Higher Order Processes, and also Brillouin
and Rayleigh Scattering 2009, 40 (8), 1055-1059.
112. Kaniyoor, A.; Ramaprabhu, S., A Raman spectroscopic investigation of graphite oxide
derived graphene. Aip Advances 2012, 2 (3), 032183.
113. Angoni, K., Remarks on the structure of carbon materials on the basis of raman spectra.
Carbon 1993, 31 (4), 537-547.

145
114. Cançado, L.; Reina, A.; Kong, J.; Dresselhaus, M., Geometrical approach for the study of G′
band in the Raman spectrum of monolayer graphene, bilayer graphene, and bulk graphite.
Physical Review B 2008, 77 (24), 245408.
115. Koutsos, V.; Manias, E.; Ten Brinke, G.; Hadziioannou, G., Atomic force microscopy and
real atomic resolution. simple computer simulations. EPL (Europhysics Letters) 1994, 26 (2),
103.
116. Zhang, J.; Shen, G.; Wang, W.; Zhou, X.; Guo, S., Individual nanocomposite sheets of
chemically reduced graphene oxide and poly (N-vinyl pyrrolidone): preparation and humidity
sensing characteristics. Journal of Materials Chemistry 2010, 20 (48), 10824-10828.
117. Shaw, J. E.; Perumal, A.; Bradley, D. D.; Stavrinou, P. N.; Anthopoulos, T. D., Nanoscale
current spreading analysis in solution-processed graphene oxide/silver nanowire transparent
electrodes via conductive atomic force microscopy. Journal of Applied Physics 2016, 119
(19), 195501.
118. Shang, Y.; Zhang, D.; Liu, Y.; Guo, C., Preliminary comparison of different reduction
methods of graphene oxide. Bulletin of Materials Science 2015, 38 (1), 7-12.
119. Eigler, S.; Dotzer, C.; Hirsch, A., Visualization of defect densities in reduced graphene oxide.
Carbon 2012, 50 (10), 3666-3673.
120. Gao, W.; Alemany, L. B.; Ci, L.; Ajayan, P. M., New insights into the structure and reduction
of graphite oxide. Nat. Chem. 2009, 1 (5), 403-8.
121. Pei, S.; Zhao, J.; Du, J.; Ren, W.; Cheng, H.-M., Direct reduction of graphene oxide films into
highly conductive and flexible graphene films by hydrohalic acids. Carbon 2010, 48 (15),
4466-4474.
122. Fan, Z.-J.; Kai, W.; Yan, J.; Wei, T.; Zhi, L.-J.; Feng, J.; Ren, Y.-m.; Song, L.-P.; Wei, F.,
Facile synthesis of graphene nanosheets via Fe reduction of exfoliated graphite oxide. ACS
nano 2011, 5 (1), 191-198.
123. Wang, Y.; Sun, L.; Fugetsu, B., Thiourea Dioxide as a Green Reductant for the Mass
Production of Solution-Based Graphene. B. Chem. Soc. Jpn. 2012, 85 (12), 1339-1344.
124. Zhang, J.; Yang, H.; Shen, G.; Cheng, P.; Zhang, J.; Guo, S., Reduction of graphene oxide via
L-ascorbic acid. Chem. Commun. 2010, 46 (7), 1112-1114.
125. Kumar, A.; Khandelwal, M., A novel synthesis of ultra thin graphene sheets for energy storage
applications using malonic acid as a reducing agent. J. Mater. Chem. A 2014, 2 (47), 20345-
20357.
126. Moon, I. K.; Lee, J.; Ruoff, R. S.; Lee, H., Reduced graphene oxide by chemical
graphitization. Nat. Commun. 2010, 1, 73.
127. Paredes, J.; Villar-Rodil, S.; Solis-Fernandez, P.; Martinez-Alonso, A.; Tascon, J., Atomic
force and scanning tunneling microscopy imaging of graphene nanosheets derived from
graphite oxide. Langmuir 2009, 25 (10), 5957-5968.
128. Doğan, H. Ö.; Ekinci, D.; Demir, Ü., Atomic scale imaging and spectroscopic characterization
of electrochemically reduced graphene oxide. Surface science 2013, 611, 54-59.
129. Rozada, R.; Paredes, J. I.; Villar-Rodil, S.; Martínez-Alonso, A.; Tascón, J. M., Towards full
repair of defects in reduced graphene oxide films by two-step graphitization. Nano Research
2013, 6 (3), 216-233.
130. Dreyer, D. R.; Murali, S.; Zhu, Y.; Ruoff, R. S.; Bielawski, C. W., Reduction of graphite
oxide using alcohols. J. Mater. Chem. 2011, 21 (10), 3443-3447.
131. Viinikanoja, A.; Kauppila, J.; Damlin, P.; Suominen, M.; Kvarnström, C., In situ FTIR and
Raman spectroelectrochemical characterization of graphene oxide upon electrochemical

146
reduction in organic solvents. Physical Chemistry Chemical Physics 2015, 17 (18), 12115-
12123.
132. Bagri, A.; Mattevi, C.; Acik, M.; Chabal, Y. J.; Chhowalla, M.; Shenoy, V. B., Structural
evolution during the reduction of chemically derived graphene oxide. Nature chemistry 2010,
2 (7), 581-587.
133. Storm, M. M.; Johnsen, R. E.; Norby, P., In situ X-ray powder diffraction studies of the
synthesis of graphene oxide and formation of reduced graphene oxide. Journal of Solid State
Chemistry 2016, 240, 49-54.
134. Pham, V. H.; Cuong, T. V.; Nguyen-Phan, T. D.; Pham, H. D.; Kim, E. J.; Hur, S. H.; Shin,
E. W.; Kim, S.; Chung, J. S., One-step synthesis of superior dispersion of chemically
converted graphene in organic solvents. Chem. Commun. 2010, 46 (24), 4375-7.
135. Pham, V. H.; Hur, S. H.; Kim, E. J.; Kim, B. S.; Chung, J. S., Highly efficient reduction of
graphene oxide using ammonia borane. Chem. Commun. 2013, 49 (59), 6665-7.
136. Sliwa, W.; Bachowska, B.; Girek, T., Viologen-based supramolecular structures. Current
Organic Chemistry 2012, 16 (10), 1332-1358.
137. Kaliappan, R.; Ling, Y.; Kaifer, A. E.; Ramamurthy, V., Sulfonatocalix[8]arene as a potential
reaction cavity: photo- and electro-active dicationic guests arrest conformational equilibrium.
Langmuir 2009, 25 (16), 8982-92.
138. Guo, D.-S.; Chen, S.; Qian, H.; Zhang, H.-Q.; Liu, Y., Electrochemical stimulus-responsive
supramolecular polymer based on sulfonatocalixarene and viologen dimers. Chemical
Communications 2010, 46 (15), 2620-2622.
139. Guo, D.-S.; Wang, L.-H.; Liu, Y., Highly effective binding of methyl viologen dication and
its radical cation by p-sulfonatocalix [4, 5] arenes. The Journal of organic chemistry 2007, 72
(20), 7775-7778.
140. Yasuda, A.; Mori, H.; Seto, J., Electrochromic properties of alkylviologen-cyclodextrin
systems. Journal of Applied Electrochemistry 1987, 17 (3), 567-573.
141. Yasuda, A.; Kondo, H.; Itabashi, M.; Seto, J., Structure changes of viologen+ β-cyclodextrin
inclusion complex corresponding to the redox state of viologen. Journal of electroanalytical
chemistry and interfacial electrochemistry 1986, 210 (2), 265-275.
142. Gadde, S.; E Kaifer, A., Cucurbituril complexes of redox active guests. Current Organic
Chemistry 2011, 15 (1), 27-38.
143. Jeon, W. S.; Kim, H.-J.; Lee, C.; Kim, K., Control of the stoichiometry in host–guest
complexation by redox chemistry of guests: Inclusion of methylviologen in cucurbit[8]uril.
Chem. Commun. 2002, (17), 1828-1829.
144. Jariwala, D.; Sangwan, V. K.; Lauhon, L. J.; Marks, T. J.; Hersam, M. C., Carbon
nanomaterials for electronics, optoelectronics, photovoltaics, and sensing. Chem. Soc. Rev.
2013, 42 (7), 2824-2860.
145. El-Kady, M. F.; Shao, Y.; Kaner, R. B., Graphene for batteries, supercapacitors and beyond.
Nat. Rev. Mater. 2016, 1 (7), 1-14.
146. Wang, X.; Shi, G., An introduction to the chemistry of graphene. Phys. Chem. Chem. Phys.
2015, 17 (43), 28484-28504.
147. Zhou, M.; Wang, Y.; Zhai, Y.; Zhai, J.; Ren, W.; Wang, F.; Dong, S., Controlled synthesis of
large-area and patterned electrochemically reduced graphene oxide films. Chem. Eur. J. 2009,
15 (25), 6116-20.

147
148. Kauppila, J.; Kunnas, P.; Damlin, P.; Viinikanoja, A.; Kvarnström, C., Electrochemical
reduction of graphene oxide films in aqueous and organic solutions. Electrochim. Acta 2013,
89, 84-89.
149. Bouša, M.; Frank, O.; Jirka, I.; Kavan, L., In situ Raman spectroelectrochemistry of graphene
oxide. Phys. Status Solidi B 2013, 250 (12), 2662-2667.
150. Viinikanoja, A.; Kauppila, J.; Damlin, P.; Suominen, M.; Kvarnstrom, C., In situ FTIR and
Raman spectroelectrochemical characterization of graphene oxide upon electrochemical
reduction in organic solvents. Phys. Chem. Chem. Phys. 2015, 17 (18), 12115-23.
151. Toh, S. Y.; Loh, K. S.; Kamarudin, S. K.; Daud, W. R. W., Graphene production via
electrochemical reduction of graphene oxide: Synthesis and characterisation. Chem. Eng. J.
2014, 251, 422-434.
152. Guo, H.-L.; Wang, X.-F.; Qian, Q.-Y.; Wang, F.-B.; Xia, X.-H., A green approach to the
synthesis of graphene nanosheets. ACS Nano 2009, 9, 2653-2659.
153. Eady, S. C.; Peczonczyk, S. L.; Maldonado, S.; Lehnert, N., Facile heterogenization of a
cobalt catalyst via graphene adsorption: robust and versatile dihydrogen production systems.
Chem. Commun. 2014, 50 (59), 8065-8.
154. Alcantara, R.; Jimenez-Mateos, J. M.; Lavela, P.; Tirado, J. L., Carbon black: a promising
electrode material for sodium-ion batteries. Electrochem. Commun. 2001, 3, 639-642.
155. Shao, Y.; Wang, J.; Engelhard, M.; Wang, C.; Lin, Y., Facile and controllable electrochemical
reduction of graphene oxide and its applications. J. Mater. Chem. 2010, 20 (4), 743-748.
156. Wang, X.; Zhi, L.; Muellen, K., Transparent, Conductive Graphene Electrodes for Dye-
Sensitized Solar Cells. Nano Lett. 2008, 8 (1), 323-327.
157. Becerril, H. A.; Mao, J.; Liu, Z.; Stoltenberg, R. M.; Bao, Z.; Chen, Y., Evaluation of
Solution-Processed Reduced Graphene Oxide Films as Transparent Conductors. ACS Nano
2008, 2 (3), 463-470.
158. Qin, M.-M.; Ji, W.; Feng, Y.-Y.; Feng, W., Transparent conductive graphene films prepared
by hydroiodic acid and thermal reduction. Chinese Phys. B 2014, 23 (2), 028103.
159. Chen, W.; Yan, L.; Bangal, P. R., Preparation of graphene by the rapid and mild thermal
reduction of graphene oxide induced by microwaves. Carbon 2010, 48 (4), 1146-1152.
160. Acik, M.; Lee, G.; Mattevi, C.; Pirkle, A.; Wallace, R. M.; Chhowalla, M.; Cho, K.; Chabal,
Y., The Role of Oxygen during Thermal Reduction of Graphene Oxide Studied by Infrared
Absorption Spectroscopy. J. Phys. Chem. C 2011, 115 (40), 19761-19781.
161. Larciprete, R.; Fabris, S.; Sun, T.; Lacovig, P.; Baraldi, A.; Lizzit, S., Dual path mechanism
in the thermal reduction of graphene oxide. J. Am. Chem. Soc. 2011, 133 (43), 17315-21.
162. Yang, H.; Cao, Y.; He, J.; Zhang, Y.; Jin, B.; Sun, J.-L.; Wang, Y.; Zhao, Z., Highly
conductive free-standing reduced graphene oxide thin films for fast photoelectric devices.
Carbon 2017, 115, 561-570.
163. Yang, D.; Velamakanni, A.; Bozoklu, G.; Park, S.; Stoller, M.; Piner, R. D.; Stankovich, S.;
Jung, I.; Field, D. A.; Ventrice, C. A.; Ruoff, R. S., Chemical analysis of graphene oxide films
after heat and chemical treatments by X-ray photoelectron and Micro-Raman spectroscopy.
Carbon 2009, 47 (1), 145-152.
164. Nekahi, A.; Marashi, P. H.; Haghshenas, D., Transparent conductive thin film of ultra large
reduced graphene oxide monolayers. Appl. Surf. Sci. 2014, 295, 59-65.
165. Eda, G.; Lin, Y.-Y.; Miller, S.; Chen, C.-W.; Su, W.-F.; Chhowalla, M., Transparent and
conducting electrodes for organic electronics from reduced graphene oxide. Appl. Phys. Lett.
2008, 92 (23), 233305.

148
166. Su, C.-Y.; Xu, Y.; Zhang, W.; Zhao, J.; Tang, X.; Tsai, C.-H.; Li, L.-J., Electrical and
Spectroscopic Characterizations of Ultra-Large Reduced Graphene Oxide Monolayers. Chem.
Mater. 2009, 21 (23), 5674-5680.
167. J. T. Robinson, F. K. P., E. S. Snow, Z. Wei, and P. E. Sheehan, Reduced Graphene Oxide
Molecular Sensors. Nano Lett. 2008, 8 (10), 3137-3140.
168. Shin, H.-J.; Kim, K. K.; Benayad, A.; Yoon, S.-M.; Park, H. K.; Jung, I.-S.; Jin, M. H.; Jeong,
H.-K.; Kim, J. M.; Choi, J.-Y.; Lee, Y. H., Efficient Reduction of Graphite Oxide by Sodium
Borohydride and Its Effect on Electrical Conductance. Adv. Funct. Mater. 2009, 19 (12),
1987-1992.
169. Stankovich, S.; Dikin, D. A.; Piner, R. D.; Kohlhaas, K. A.; Kleinhammes, A.; Jia, Y.; Wu,
Y.; Nguyen, S. T.; Ruoff, R. S., Synthesis of graphene-based nanosheets via chemical
reduction of exfoliated graphite oxide. Carbon 2007, 45 (7), 1558-1565.
170. Park, S.; An, J.; Jung, I.; Piner, R. D.; An, S. J.; Li, X.; Velamakanni, A.; Ruoff, R. S.,
Colloidal suspensions of highly reduced graphene oxide in a wide variety of organic solvents.
Nano Lett. 2009, 9, 1593-1597.
171. Gilje, S.; Han, S.; Wang, M.; Wang, K. L.; Kaner, R. B., A chemical route to graphene for
device applications. Nano Lett. 2007, 7, 3394-3398.
172. Ambrosi, A.; Chua, C. K.; Bonanni, A.; Pumera, M., Lithium Aluminum Hydride as Reducing
Agent for Chemically Reduced Graphene Oxides. Chem. Mater. 2012, 24 (12), 2292-2298.
173. Liu, H.; Zhang, L.; Guo, Y.; Cheng, C.; Yang, L.; Jiang, L.; Yu, G.; Hu, W.; Liu, Y.; Zhu, D.,
Reduction of graphene oxide to highly conductive graphene by Lawesson's reagent and its
electrical applications. J. Mater. Chem. C 2013, 1 (18), 3104.
174. Zhou, X.; Zhang, J.; Wu, H.; Yang, H.; Zhang, J.; Guo, S., Reducing Graphene Oxide via
Hydroxylamine: A Simple and Efficient Route to Graphene. J. Phys. Chem. C 2011, 115 (24),
11957-11961.
175. Chen, Y.; Zhang, X.; Yu, P.; Ma, Y., Stable dispersions of graphene and highly conducting
graphene films: a new approach to creating colloids of graphene monolayers. Chem. Commun.
2009, (30), 4527.
176. Fernandez-Merino, M. J.; Guardia, L.; Paredes, J. I.; Villar-Rodil, S.; Solis-Fernandez, P.;
Martinez-Alonso, A.; Tascon, J. M. D., Vitamin C is an ideal substitute for hydrazine in the
reduction of graphene oxide suspensions. J. Phys. Chem. C 2010, 114, 6426-6432.
177. Chen, W.; Yan, L.; Bangal, P. R., Chemical reduction of graphene oxide to graphene by
sulfur-containing compounds. J. Phys. Chem. C 2010, 114, 19885-19890.
178. Zhou, T.; Chen, F.; Liu, K.; Deng, H.; Zhang, Q.; Feng, J.; Fu, Q., A simple and efficient
method to prepare graphene by reduction of graphite oxide with sodium hydrosulfite.
Nanotechnology 2011, 22 (4), 045704.
179. Tu, Y.; Utsunomiya, T.; Ichii, T.; Sugimura, H., Enhancing the electrical conductivity of
vacuum-ultraviolet-reduced graphene oxide by multilayered stacking. J. Vac. Sci. Technol. B
2017, 35 (3), 03D110.
180. Wang, D.-W.; Wu, K.-H.; Gentle, I. R.; Lu, G. Q., Anodic chlorine/nitrogen co-doping of
reduced graphene oxide films at room temperature. Carbon 2012, 50 (9), 3333-3341.
181. Krishnamurthy, S.; Lightcap, I. V.; Kamat, P. V., Electron transfer between methyl viologen
radicals and graphene oxide: Reduction, electron storage and discharge. J. Photoch. Photobio.
A 2011, 221 (2-3), 214-219.

149
182. Park, S.; Yoon, S. W.; Lee, K.-B.; Kim, D. J.; Jung, Y. H.; Do, Y.; Paik, H.-j.; Choi, I. S.,
Carbon Nanotubes as a Ligand in Cp2ZrCl2-Based Ethylene Polymerization. Macromol.
Rapid Comm. 2006, 27 (1), 47-50.
183. Park, S.; Choi, I. S., Production of Ultrahigh-Molecular-Weight Polyethylene/Pristine
MWCNT Composites by Half-Titanocene Catalysts. Adv. Mater. 2009, 21 (8), 902-905.
184. Choi, B.; Lee, J.; Lee, S.; Ko, J. H.; Lee, K. S.; Oh, J.; Han, J.; Kim, Y. H.; Choi, I. S.; Park,
S., Generation of ultra-high-molecular-weight polyethylene from metallocenes immobilized
onto N-doped graphene nanoplatelets. Macromol. Rapid Commun. 2013, 34 (6), 533-8.
185. Connelly, N. G.; Geiger, W. E., Chemical redox agents for organometallic chemistry. Chem.
Rev. 1996, 96, 877-910.
186. Nielson, R. M.; McManis, G. E.; Golovin, M. N.; Weaver, M. J., Solvent dynamical effects
in electron transfer: comparisons of self-exchange kinetics for cobaltocenium-cobaltocene
and related redox couples with theoretical predictions. J. Phys. Chem. 1988, 92, 3441-3450.
187. Nielson, R. M.; McManis, G. E.; Safford, L. K.; Weaver, M. J., Solvent and electrolyte effects
on the kinetics of ferrocenium-ferrocene self-exchange: a reevaluation. J. Phys. Chem. 1989,
93, 2152-2157.
188. Banthorpe, D. V.; Charlwood, B. V.; Wasserman, A., Radical Anions Formed by Reaction of
Cobaltocene with Protic Acids. J. Chem. Soc., Chem. Commun. 1972, 294-295.
189. Koelle, U.; Infelta, P. P.; Graetzel, M., Kinetics and Mechanism of the Reduction of Protons
to Hydrogen by Cobaltocene. Inorg. Chem. 1988, 27, 879-883.
190. Chalkley, M. J.; Del Castillo, T. J.; Matson, B. D.; Roddy, J. P.; Peters, J. C., Catalytic N2-
to-NH3 Conversion by Fe at Lower Driving Force: A Proposed Role for Metallocene-
Mediated PCET. ACS Cent. Sci. 2017, 3 (3), 217-223.
191. Rountree, E. S.; Dempsey, J. L., Reactivity of Proton Sources with a Nickel Hydride Complex
in Acetonitrile: Implications for the Study of Fuel-Forming Catalysts. Inorg. Chem. 2016, 55
(10), 5079-87.
192. Chen, J.; Zhang, Y.; Zhang, M.; Yao, B.; Li, Y.; Huang, L.; Li, C.; Shi, G., Water-enhanced
oxidation of graphite to graphene oxide with controlled species of oxygenated groups. Chem.
Sci. 2016, 7, 1874-1881.
193. McCreery, R. L., Structural Effects on Electron Transfer Kinetics. In Electroanal. Chem.,
Bard, A. J., Ed. Marcel Dekker, Inc.: New York, NY, 1966; Vol. 17, p 273.
194. Levi, G.; Senneca, O.; Causà, M.; Salatino, P.; Lacovig, P.; Lizzit, S., Probing the chemical
nature of surface oxides during coal char oxidation by high-resolution XPS. Carbon 2015, 90,
181-196.
195. Cuesta, A.; Dhamelincourt, P.; Laureyns, J.; Martinez-Alonso, A.; Tascon, J. M. D., Raman
microprobe studies on carbon materials. Carbon 1994, 32 (8), 1523-1532.
196. Eigler, S.; Hof, F.; Enzelberger-Heim, M.; Grimm, S.; Müller, P.; Hirsch, A., Statistical
Raman Microscopy and Atomic Force Microscopy on Heterogeneous Graphene Obtained
after Reduction of Graphene Oxide. J. Phys. Chem. C 2014, 118 (14), 7698-7704.
197. Gomez-Navarro, C.; Meyer, J. C.; Sundaram, R. S.; Chuvilin, A.; Kurasch, S.; Burghard, M.;
Kern, K.; Kaiser, U., Atomic structure of reduced graphene oxide. Nano Lett. 2010, 10 (4),
1144-8.
198. Díez-Betriu, X.; Álvarez-García, S.; Botas, C.; Álvarez, P.; Sánchez-Marcos, J.; Prieto, C.;
Menéndez, R.; de Andrés, A., Raman spectroscopy for the study of reduction mechanisms
and optimization of conductivity in graphene oxide thin films. J. Mater. Chem. C 2013, 1
(41), 6905.

150
199. Vollebregt, S.; Ishihara, R.; Tichelaar, F. D.; Hou, Y.; Beenakker, C. I. M., Influence of the
growth temperature on the first and second-order Raman band ratios and widths of carbon
nanotubes and fibers. Carbon 2012, 50 (10), 3542-3554.
200. Galus, Z.; Adams, R. N., The Anodic Oxidation of Triphenylmethane Dyes. J. Am. Chem.
Soc. 1964, 86, 1666-1671.
201. Mernagh, T. P.; Cooney, R. P.; Johnson, R. A., Raman Spectra of Graphon Carbon Black.
Carbon 1984, 22 (1), 39-42.
202. Basko, A. C. F. a. D. M., Raman spectroscopy as a versatile tool for studying the properties
of graphene. Nat. Nanotechnol. 2013, 8.
203. Sakai, S.; Takayanagi, H.; Sumimoto, N.; Fukuzawa, S.-i.; Fujinami, T.; Saeki, H.,
Preparation and properties of surface-active organocobalt complexes having long-chain alkyl
groups. Appl. Organomet. Chem. 1990, 4, 35-42.
204. Murr, N. E., Sels de cobalticinium. II*. Proprietes spectroscopiques et polarographiques de
quelques derives du cobalticinium. J. Organomet. Chem. 1976, 112, 189-199.
205. Murr, N. E., Electrochemical reduction of substituted cobaltocinium cations in aqueous
media. Transition Met. Chem. 1981, 6, 321-324.
206. Gaylord, N. G., Reduction with complex metal hydrides. J. Chem. Educ. 1957, 34, 367-374.
207. Cui, P.; Lee, J.; Hwang, E.; Lee, H., One-pot reduction of graphene oxide at subzero
temperatures. Chem. Commun. 2011, 47 (45), 12370-2.
208. Mohan, V. B.; Brown, R.; Jayaraman, K.; Bhattacharyya, D., Characterisation of reduced
graphene oxide: Effects of reduction variables on electrical conductivity. Mater. Sci. Eng. B
2015, 193, 49-60.
209. Wilson, A. D.; Newell, R. H.; McNevin, M. J.; Muckerman, J. T.; Rakowski DuBois, M.;
DuBois, D. L., Hydrogen oxidation and production using nickel-based molecular catalysts
with positioned proton relays. Journal of the American Chemical Society 2006, 128 (1), 358-
366.
210. Das, B.; Thapper, A.; Ott, S.; Colbran, S. B., Structural features of molecular electrocatalysts
in multi-electron redox processes for renewable energy – recent advances. Sustainable Energy
& Fuels 2019, 3 (9), 2159-2175.
211. Matheu, R.; Garrido-Barros, P.; Gil-Sepulcre, M.; Ertem, M. Z.; Sala, X.; Gimbert-Suriñach,
C.; Llobet, A., The development of molecular water oxidation catalysts. Nature Reviews
Chemistry 2019, 3 (5), 331-341.
212. Gentil, S.; Serre, D.; Philouze, C.; Holzinger, M.; Thomas, F.; Le Goff, A., Electrocatalytic
O2 Reduction at a Bio‐inspired Mononuclear Copper Phenolato Complex Immobilized on a
Carbon Nanotube Electrode. Angewandte Chemie International Edition 2016, 55 (7), 2517-
2520.
213. Toma, F. M.; Sartorel, A.; Iurlo, M.; Carraro, M.; Rapino, S.; Hoober-Burkhardt, L.; Da Ros,
T.; Marcaccio, M.; Scorrano, G.; Paolucci, F.; Bonchio, M.; Prato, M., Tailored
Functionalization of Carbon Nanotubes for Electrocatalytic Water Splitting and Sustainable
Energy Applications. ChemSusChem 2011, 4 (10), 1447-1451.
214. Das, A. K.; Engelhard, M. H.; Bullock, R. M.; Roberts, J. A., A hydrogen-evolving Ni (P2N2)
2 electrocatalyst covalently attached to a glassy carbon electrode: preparation,
characterization, and catalysis. Comparisons with the homogeneous analogue. Inorganic
chemistry 2014, 53 (13), 6875-6885.

151
215. Yao, S. A.; Ruther, R. E.; Zhang, L.; Franking, R. A.; Hamers, R. J.; Berry, J. F., Covalent
attachment of catalyst molecules to conductive diamond: CO2 reduction using “smart”
electrodes. Journal of the American Chemical Society 2012, 134 (38), 15632-15635.
216. Kormányos, A.; Hossain, M. S.; Foss, F. W.; Janáky, C.; Rajeshwar, K., Electrocatalytic
behavior of freely-diffusing and immobilized synthetic flavins in aqueous media. Catalysis
Science & Technology 2016, 6 (24), 8441-8448.
217. Eady, S. C.; MacInnes, M. M.; Lehnert, N., A Smorgasbord of Carbon: Electrochemical
Analysis of Cobalt–Bis (benzenedithiolate) Complex Adsorption and Electrocatalytic
Activity on Diverse Graphitic Supports. ACS applied materials & interfaces 2016, 8 (36),
23624-23634.
218. Eady, S. C.; Peczonczyk, S. L.; Maldonado, S.; Lehnert, N., Facile heterogenization of a
cobalt catalyst via graphene adsorption: robust and versatile dihydrogen production systems.
Chemical Communications 2014, 50 (59), 8065-8068.
219. Zhou, X.; Wang, X.; Wang, B.; Chen, Z.; He, C.; Wu, Y., Preparation, characterization and
NH3-sensing properties of reduced graphene oxide/copper phthalocyanine hybrid material.
Sensors and actuators B: chemical 2014, 193, 340-348.
220. Yang, J.; Mu, D.; Gao, Y.; Tan, J.; Lu, A.; Ma, D., Cobalt phthalocyanine-graphene complex
for electro-catalytic oxidation of dopamine. Journal of natural gas chemistry 2012, 21 (3),
265-269.
221. Andrieux, C.; Dumas-Bouchiat, J.; Saveant, J., Catalysis of electrochemical reactions at redox
polymer electrodes: kinetic model for stationary voltammetric techniques. Journal of
Electroanalytical Chemistry and Interfacial Electrochemistry 1982, 131, 1-35.
222. Costentin, C.; Saveant, J.-M., Cyclic voltammetry analysis of electrocatalytic films. The
Journal of Physical Chemistry C 2015, 119 (22), 12174-12182.
223. Costentin, C.; Savéant, J.-M., Cyclic voltammetry of fast conducting electrocatalytic films.
Physical Chemistry Chemical Physics 2015, 17 (29), 19350-19359.
224. Costentin, C.; Savéant, J. M., Cyclic voltammetry of electrocatalytic films: fast catalysis
regimes. ChemElectroChem 2015, 2 (11), 1774-1784.
225. Oyama, N.; Anson, F. C., Catalysis of electrode processes by multiply-charged metal
complexes electrostatically bound to polyelectrolyte coatings on graphite electrodes, and the
use of polymer-coated rotating disk electrodes in diagnosing kinetic and conduction
mechanisms. Analytical Chemistry 1980, 52 (8), 1192-1198.
226. Ikeda, T.; Leidner, C.; Murray, R. W., Kinetics of Outer-Sphere Electron Transfers Between
Metal Complexes in Solutions and Polymeric Films on Modified Electrodes. Journal of the
American Chemical Society 1981, 103 (25), 7422-7425.
227. Ohsaka, T.; Okajima, T.; Oyama, N., Electrode kinetics of metal complexes confined in
electropolymerized poly (N, N-dialkyl substituted aniline) films on graphite surfaces. Journal
of electroanalytical chemistry and interfacial electrochemistry 1986, 215 (1-2), 191-207.
228. Chiba, K.; Ohsaka, T.; Oyama, N., Electrode kinetics of electroactive electropolymerized
polymers deposited on graphite electrode surfaces. Journal of electroanalytical chemistry and
interfacial electrochemistry 1987, 217 (2), 239-251.
229. Kuo, K.-N.; Murray, R. W., Electrocatalysis with ferrocyanide electrostatically trapped in an
alkylaminesiloxane polymer film on a Pt electrode. Journal of Electroanalytical Chemistry
and Interfacial Electrochemistry 1982, 131, 37-59.

152
230. Ikeda, T.; Schmehl, R.; Denisevich, P.; Willman, K.; Murray, R. W., Permeation of
electroactive solutes through ultrathin polymeric films on electrode surfaces. Journal of the
American Chemical Society 1982, 104 (10), 2683-2691.
231. Ciszewski, A.; Milczarek, G., Kinetics of electrocatalytic oxidation of formaldehyde on a
nickel porphyrin-based glassy carbon electrode. Journal of Electroanalytical Chemistry 1999,
469 (1), 18-26.
232. Orchanian, N. M.; Hong, L. E.; Skrainka, J. A.; Esterhuizen, J. A.; Popov, D. A.; Marinescu,
S. C., Surface-Immobilized Conjugated Polymers Incorporating Rhenium Bipyridine Motifs
for Electrocatalytic and Photocatalytic CO2 Reduction. ACS Applied Energy Materials 2018,
2 (1), 110-123.
233. Coutanceau, C.; Croissant, M.; Napporn, T.; Lamy, C., Electrocatalytic reduction of dioxygen
at platinum particles dispersed in a polyaniline film. Electrochimica Acta 2000, 46 (4), 579-
588.
234. Liu, Y.; Leung, K. Y.; Michaud, S. E.; Soucy, T. L.; McCrory, C. C., Controlled Substrate
Transport to Electrocatalyst Active Sites for Enhanced Selectivity in the Carbon Dioxide
Reduction Reaction. Comments on Inorganic Chemistry 2019, 39 (5), 242-269.
235. Liu, Y.; McCrory, C. C., Modulating the mechanism of electrocatalytic CO 2 reduction by
cobalt phthalocyanine through polymer coordination and encapsulation. Nature
communications 2019, 10 (1), 1-10.
236. Kulesza, P. J.; Karnicka, K.; Miecznikowski, K.; Chojak, M.; Kolary, A.; Barczuk, P. J.;
Tsirlina, G.; Czerwinski, W., Network electrocatalytic films of conducting polymer-linked
polyoxometallate-stabilized platinum nanoparticles. Electrochimica acta 2005, 50 (25-26),
5155-5162.
237. Jirkovský, J. S.; Halasa, M.; Schiffrin, D. J., Kinetics of electrocatalytic reduction of oxygen
and hydrogen peroxide on dispersed gold nanoparticles. Physical Chemistry Chemical
Physics 2010, 12 (28), 8042-8053.
238. Chen, X.; Xia, B.; He, P., Dynamics of the electrocatalytic oxidation of cysteine at Nafion
film coated electrodes. Journal of electroanalytical chemistry and interfacial
electrochemistry 1990, 281 (1-2), 185-198.
239. Abe, T.; Toda, G.; Tajiri, A.; Kaneko, M., Electrochemistry of ferric ruthenocyanide
(Ruthenium Purple), and its electrocatalysis for proton reduction. Journal of Electroanalytical
Chemistry 2001, 510 (1-2), 35-42.
240. Abe, T.; Kawai, N.; Tajiri, A.; Kaneko, M., Electrochemistry of ruthenium purple confined
in a polymer matrix: Voltammetry, electrocatalysis for hydrogen evolution, and electron-
transport characteristics. Bulletin of the Chemical Society of Japan 2003, 76 (3), 645-650.
241. Abe, T.; Fujita, T.; Sekimoto, K.; Tajiri, A.; Kaneko, M., Electrochemical hydrogen evolution
by catalyst membrane composed of platinum, alkyl viologen and Nafion: consideration of the
kinetically dominant factor based on understanding of electron-mediating ability of the
viologen molecule. Journal of Molecular Catalysis A: Chemical 2003, 201 (1-2), 55-62.
242. Taguchi, F.; Abe, T.; Kaneko, M., New molecule-based catalyst to produce H2 by metallo-
porphine dispersed into polymer membrane. Journal of Molecular Catalysis A: Chemical
1999, 140 (1), 41-46.
243. Lee, I.; Joo, J. B.; Shokouhimehr, M., Graphene derivatives supported nanocatalysts for
oxygen reduction reaction. Chinese Journal of Catalysis 2015, 36 (11), 1799-1810.

153
244. Videla, A. H. M.; Ban, S.; Specchia, S.; Zhang, L.; Zhang, J., Non-noble Fe–NX
electrocatalysts supported on the reduced graphene oxide for oxygen reduction reaction.
Carbon 2014, 76, 386-400.
245. Lv, J.-J.; Li, S.-S.; Wang, A.-J.; Mei, L.-P.; Chen, J.-R.; Feng, J.-J., Monodisperse Au-Pd
bimetallic alloyed nanoparticles supported on reduced graphene oxide with enhanced
electrocatalytic activity towards oxygen reduction reaction. Electrochimica Acta 2014, 136,
521-528.
246. Xia, B. Y.; Wu, H. B.; Yan, Y.; Wang, H. B.; Wang, X., One‐Pot Synthesis of Platinum
Nanocubes on Reduced Graphene Oxide with Enhanced Electrocatalytic Activity. Small
2014, 10 (12), 2336-2339.
247. Huang, D.; Lu, J.; Li, S.; Luo, Y.; Zhao, C.; Hu, B.; Wang, M.; Shen, Y., Fabrication of cobalt
porphyrin. Electrochemically reduced graphene oxide hybrid Films for electrocatalytic
hydrogen evolution in aqueous solution. Langmuir 2014, 30 (23), 6990-6998.
248. McNamara, W. R.; Han, Z.; Yin, C.-J. M.; Brennessel, W. W.; Holland, P. L.; Eisenberg, R.,
Cobalt-dithiolene complexes for the photocatalytic and electrocatalytic reduction of protons
in aqueous solutions. Proceedings of the National Academy of Sciences 2012, 109 (39),
15594-15599.
249. Achtyl, J. L.; Unocic, R. R.; Xu, L.; Cai, Y.; Raju, M.; Zhang, W.; Sacci, R. L.; Vlassiouk, I.
V.; Fulvio, P. F.; Ganesh, P., Aqueous proton transfer across single-layer graphene. Nature
communications 2015, 6 (1), 1-7.
250. NuLi, Y.; Yang, J.; Jiang, Z., Intercalation of lithium ions into bulk and powder highly
oriented pyrolytic graphite. Journal of Physics and Chemistry of Solids 2006, 67 (4), 882-886.
251. Cho, Y. H.; Kim, H. W.; Lee, H. D.; Shin, J. E.; Yoo, B. M.; Park, H. B., Water and ion
sorption, diffusion, and transport in graphene oxide membranes revisited. Journal of
Membrane Science 2017, 544, 425-435.
252. Wang, Y.; Chen, Y.; Lacey, S. D.; Xu, L.; Xie, H.; Li, T.; Danner, V. A.; Hu, L., Reduced
graphene oxide film with record-high conductivity and mobility. Materials Today 2018, 21
(2), 186-192.
253. Bird, C. L.; Kuhn, A. T., Electrochemistry of the viologens. Chemical Society Reviews 1981,
10 (1), 49-82.
254. Monk, P. M. S., The Viologens: Physicochemical Properties, Synthesis and Applications of
the Salts of 4,4'-Bipyridine. John Wiley & Sons Ltd.: West Sussex, England, 1998.
255. Striepe, L.; Baumgartner, T., Viologens and Their Application as Functional Materials.
Chemistry 2017.
256. Liu, T.; Wei, X.; Nie, Z.; Sprenkle, V.; Wang, W., A Total Organic Aqueous Redox Flow
Battery Employing a Low Cost and Sustainable Methyl Viologen Anolyte and 4-HO-TEMPO
Catholyte. Advanced Energy Materials 2016, 6 (3).
257. Sen, S.; Saraidaridis, J.; Kim, S. Y.; Palmore, G. T., Viologens as charge carriers in a polymer-
based battery anode. ACS Appl Mater Interfaces 2013, 5 (16), 7825-30.
258. Nagarjuna, G.; Hui, J.; Cheng, K. J.; Lichtenstein, T.; Shen, M.; Moore, J. S.; Rodriguez-
Lopez, J., Impact of redox-active polymer molecular weight on the electrochemical properties
and transport across porous separators in nonaqueous solvents. J Am Chem Soc 2014, 136
(46), 16309-16.
259. Burgess, M.; Chénard, E.; Hernández-Burgos, K.; Nagarjuna, G.; Assary, R. S.; Hui, J.;
Moore, J. S.; Rodríguez-López, J., Impact of Backbone Tether Length and Structure on the

154
Electrochemical Performance of Viologen Redox Active Polymers. Chemistry of Materials
2016, 28 (20), 7362-7374.
260. Janoschka, T.; Friebe, C.; Hager, M. D.; Martin, N.; Schubert, U. S., An Approach Toward
Replacing Vanadium: A Single Organic Molecule for the Anode and Cathode of an Aqueous
Redox-Flow Battery. ChemistryOpen 2017, 6 (2), 216-220.
261. Mortimer, R. J., Organic electrochromic materials. Electrochimica Acta 1999, 44 (18), 2971-
2981.
262. Mortimer, R. J., Electrochromic Materials. Annual Review of Materials Research 2011, 41
(1), 241-268.
263. Jeon, W. S.; Ziganshina, A. Y.; Lee, J. W.; Ko, Y. H.; Kang, J. K.; Lee, C.; Kim, K., A [2]
Pseudorotaxane‐Based Molecular Machine: Reversible Formation of a Molecular Loop
Driven by Electrochemical and Photochemical Stimuli. Angewandte Chemie 2003, 115 (34),
4231-4234.
264. Song, Y.; Huang, X.; Hua, H.; Wang, Q., The synthesis of a rigid conjugated viologen and its
cucurbituril pseudorotaxanes. Dyes and Pigments 2017, 137, 229-235.
265. Wessels, H. R.; Slebodnick, C.; Gibson, H. W., Viologen-Based Rotaxanes from Dibenzo-
30-crown-10. Journal of the American Chemical Society 2018, 140 (23), 7358-7370.
266. Zhang, B.; Dong, Y.; Li, J.; Yu, Y.; Li, C.; Cao, L., Pseudo[n,m]rotaxanes of Cucurbit[7/8]uril
and Viologen‐Naphthalene Derivative: A Precise Definition of Rotaxane. Chinese Journal of
Chemistry 2019, 37 (3), 269-275.
267. Thorneley, R. N. F., A convenient electrochemical preparation of reduced methyl viologen
and a kinetic study of the reaction with oxygen using an anaerobic stopped-flow apparatus.
Biochimica et Biophysica Acta 1974, 333, 487-496.
268. Leest, R. E. V. D., The coulometric determination of oxygen with the electolytically generated
viologen radical-cation. Electroanalytical Chemistry and Interfacial Electrochemistry 1973,
43, 251-255.
269. Farrington, J. A.; Ebert, M.; Land, E. J., Bipyridylium quaternary salts and related
compounds. Part 6.—Pulse radiolysis studies of the reaction of paraquat radical analogues
with oxygen. Journal of the Chemical Society, Faraday Transactions 1: Physical Chemistry
in Condensed Phases 1978, 74, 665-675.
270. Hoshino, K.; Sasaki, H.; Suga, K.; Saji, T., Partition parameters for three redox forms of
viologen in a nonionic micellar solution. Bull. Chem. Soc. Jpn. 1987, 60, 1521-1522.
271. Kaifer, A. E.; Bard, A. J., Micellar effects on the reductive electrochemistry of
methylviologen. The Journal of Physical Chemistry 1985, 89 (22), 4876-4880.
272. Kim, H.-J.; Jeon, W. S.; Young, H. K.; Kim, K., Inclusion of methylviologen in
cucurbit[7]uril. PNAS 2002, 99 (8), 5007-5011.
273. Kostela, J.; Elmgren, M.; Hansson, P.; Almgren, M., Electrochemical properties of an
amphiphilic viologen in differently charged micelles. Journal of Electroanalytical Chemistry
2002, 536, 97-107.
274. Lee, C.-W.; M.-K., O.; Jang, J.-M., Reduction potentials of N-hexadecyl-N'-methyl
viologen(2+/+) solubilized in cationic, nonionic, and anionic micelles. Langmuir 1993, 9,
1934-1936.
275. Park, J. W.; Ko, S. H.; Park, J.-Y., Electrochemical studies of viologens in homogeneous
aqueous and sodium dodecyl sulfate micellar solutions. Bull. Korean Chem. Soc. 1992, 13,
259-265.

155
276. Kaifer, A. E.; Li, W.; Yi, S., Cucurbiturils as Versatile Receptors for Redox Active Substrates.
Israel Journal of Chemistry 2011, 51 (5-6), 496-505.
277. Pospisil, L.; Fuoco, R.; Papoff, P., Electrocatalytic reduction of oxygen by cation radicals of
methyl viologen or diquat complexes with macrocyclic crown ethers. J. Electroanal. Chem.
1988, 256, 83-93.
278. Willman, K. W.; Murray, R. W., Viologen homopolymer, polymer mixture and polymer
bilayer films on electrodes: Electropolymerization, electrolysis, spectroelectrochemistry,
trace analysis and photoreduction. Journal of Electroanalytical Chemistry and Interfacial
Electrochemistry 1982, 133 (2), 211-231.
279. Bookbinder, D. C.; Wrighton, M. S., Electrochromic polymers covalently anchored to
electrode surfaces. Optical and electrochemical properties of a viologen‐based polymer.
Journal of the Electrochemical Society 1983, 130 (5), 1080-1087.
280. Liu, X.; Neoh, K. G.; Kang, E. T., Redox-Sensitive Microporous Membranes Prepared from
Poly(vinylidene fluoride) Grafted with Viologen-Containing Polymer Side Chains.
Macromolecules 2003, 36 (22), 8361-8367.
281. Kepley, L. J.; Bard, A. J., Polymer Films on Electrodes XXVII. Electrochemical and
Ellipsometric Measurements of a Viologen‐Siloxane Polymer Film: Deposition, Solvent
Swelling, Oxidation‐State‐Dependent Thickness, and Charge Transport. Journal of The
Electrochemical Society 1995, 142 (12), 4129-4138.
282. Mortimer, R. J.; Dyer, A. L.; Reynolds, J. R., Electrochromic organic and polymeric materials
for display applications. Displays 2006, 27 (1), 2-18.
283. Nakahira, T.; Graetzel, M., Fast electron storage with colloidal semiconductors functionalized
with polymeric viologen. The Journal of Physical Chemistry 1984, 88 (18), 4006-4010.
284. Sato, H.; Tamamura, T., Polymer effect in electrochromic behavior of oligomeric viologens.
Journal of Applied Polymer Science 1979, 24 (10), 2075-2085.
285. Oyama, N.; Ohsaka, T.; Yamamoto, H.; Kaneko, M., Charge-transfer reactions in pendant
viologen polymers coated on graphite electrodes and at electrode/pendant viologen polymer
film interfaces. The Journal of Physical Chemistry 1986, 90 (16), 3850-3856.
286. Dalton, E.; Murray, R. W., Viologen (2+/1+) and viologen (1+/0) electron-self-exchange
reactions in a redox polymer. The Journal of Physical Chemistry 1991, 95 (16), 6383-6389.
287. Simon, M. S.; Moore, P. T., Novel polyviologens: Photochromic redox polymers with film‐
forming properties. Journal of Polymer Science: Polymer Chemistry Edition 1975, 13 (1), 1-
16.
288. Factor, A.; Heinsohn, G., Polyviologens–a novel class of cationic polyelectrolyte redox
polymers. Journal of Polymer Science Part B: Polymer Letters 1971, 9 (4), 289-295.
289. Tomokazu, M.; Tetsuya, K.; Uichi, A.; Tetsuo, O., INCLUSION, SOLUBILIZATION, AND
STABILIZATION OF TWO-ELECTRON REDUCED SPECIES OF METHYL
VIOLOGEN BY CYCLODEXTRINS. Chemistry Letters 1985, 14 (12), 1825-1828.
290. Annibaldi, V.; Breslin, C. B., Electrochemistry of viologens at polypyrrole doped with
sulfonated β–cyclodextrin. Journal of Electroanalytical Chemistry 2019, 832, 399-407.
291. Ong, W.; Gómez-Kaifer, M.; Kaifer, A. E., Cucurbit[7]uril: A Very Effective Host for
Viologens and Their Cation Radicals. Organic Letters 2002, 4 (10), 1791-1794.
292. Sun, S.; Zhang, R.; Andersson, S.; Pan, J.; Zou, D.; Åkermark, B.; Sun, L., Host−Guest
Chemistry and Light Driven Molecular Lock of Ru(bpy)3−Viologen with Cucurbit[7−8]urils.
The Journal of Physical Chemistry B 2007, 111 (47), 13357-13363.

156
293. Buck, A. T.; Paletta, J. T.; Khindurangala, S. A.; Beck, C. L.; Winter, A. H., A noncovalently
reversible paramagnetic switch in water. Journal of the American Chemical Society 2013, 135
(29), 10594-10597.
294. El-Barghouthi, M. I.; Assaf, K. I.; Rawashdeh, A. M. M., Molecular dynamics of methyl
viologen-cucurbit[n]uril complexes in aqueous solution. J. Chem. Theory Comput. 2010, 6,
984-992.
295. Blandamer, M. J.; Brivati, J. A.; Fox, M. F.; Symons, M. C. R.; Verman, G. S. P., Water-
induced dimerization of various dye and related paramagnetic ions studied by optical and
electron spin resonance spectroscopy. Trans. Faraday Soc. 1967, 63, 1850-1857.
296. Neta, P.; Richoux, M.-C.; Harriman, A., Intramolecular association of covalently linked
viologen radicals. Journal of the Chemical Society, Faraday Transactions 2: Molecular and
Chemical Physics 1985, 81 (9), 1427-1443.
297. Lü, J.-M.; Rosokha, S. V.; Kochi, J. K., Stable (long-bonded) dimers via the quantitative self-
association of different cationic, anionic, and uncharged π-radicals: Structures, energetics, and
optical transitions. Journal of the American Chemical Society 2003, 125 (40), 12161-12171.
298. Deronzier, A.; Galland, B.; Vieira, M., Electrochemical behavior of some paraquat dimer
molecules a potential direct bielectronic mediating system. Nouv. J. Chim. 1982, 6, 97-100.
299. Geraskina, M. R.; Dutton, A. S.; Juetten, M. J.; Wood, S. A.; Winter, A. H., The Viologen
Cation Radical Pimer: A Case of Dispersion‐Driven Bonding. Angewandte Chemie 2017, 129
(32), 9563-9567.
300. Neta, P.; Richoux, M.-C.; Harriman, A., Intramolecular Association of Covalently Linked
Viologen Radicals. J. Chem. Soc., Faraday Trans. 2 1985, 81, 1427-1443.
301. Enea, O.; Crouigneau, P.; Moser, J.; Graetzel, M.; Huenig, S. On the pimerization of bridged
viologen radicals photoproduced at the surface of illuminated titanium(IV) oxide sols, p. 267-
71-267-71. (accessed 1991).
302. Masaoki, F.; Shun-ichi, N., Photoreduction of Bisviologen Compounds, Viologen–(CH2)n–
Viologen, by 2-Propanol. Bulletin of the Chemical Society of Japan 1982, 55 (2), 513-516.
303. Richardson, D. E.; Taube, H., Determination of E20-E10 in multistep charge transfer by
stationary-electrode pulse and cyclic voltammetry: application to binuclear ruthenium
ammines. Inorganic Chemistry 1981, 20 (4), 1278-1285.
304. Peerannawar, S. R.; Gobre, V. V.; Gejji, S. P., Binding of viologen derivatives to cucurbit [8]
uril. Computational and Theoretical Chemistry 2012, 983, 16-24.
305. Mizuguchi, J.; Karfunkel, H., Semi-Empirical Calculations on the Optical Absorption of
Methylviologen and p-Cyanophenylviologen in Different Oxidation States. Berichte der
Bunsengesellschaft für physikalische Chemie 1993, 97 (11), 1466-1472.
306. Lee, C.; Lee, Y. M.; Moon, M. S.; Park, S. H.; Park, J. W.; Kim, K. G.; Jeon, S.-J., UV-vis-
NIR and Raman spectroelectrochemical studies on viologen cation radicals: evidence for the
presence of various types of aggregate species. Journal of Electroanalytical Chemistry 1996,
416 (1), 139-144.
307. Odell, B.; Reddington, M. V.; Slawin, A. M. Z.; Spencer, N.; Stoddart, J. F.; Williams, D. J.,
Cyclobis(paraquat-p-phenylene). A Tetracationic Multipurpose Receptor. Angewandte
Chemie International Edition in English 1988, 27 (11), 1547-1550.
308. Rauwolf, C.; Straßner, T., Modeling of Selforganizing Systems. Molecular modeling annual
1997, 3 (1), 1-16.
309. Geuder, W.; Hünig, S.; Suchy, A., Single and double bridged viologenes and intramolecular
pimerization of their cation radicals. Tetrahedron 1986, 42 (6), 1665-1677.

157
310. Enea, O.; Crouigneau, P.; Moser, J.; Grätzel, M.; Huenig, S., On the pimerization of bridged
viologen radicals photoproduced at the surface of illuminated titanium (IV) oxide sols. New
journal of chemistry 1991, 15 (ARTICLE), 267-71.
311. Zhang, D. W.; Tian, J.; Chen, L.; Zhang, L.; Li, Z. T., Dimerization of Conjugated Radical
Cations: An Emerging Non‐Covalent Interaction for Self‐Assembly. Chemistry–An Asian
Journal 2015, 10 (1), 56-68.
312. Huang, J.; Kertesz, M., Intermolecular covalent π− π bonding interaction indicated by bond
distances, energy bands, and magnetism in biphenalenyl biradicaloid molecular crystal.
Journal of the American Chemical Society 2007, 129 (6), 1634-1643.
313. Goto, K.; Kubo, T.; Yamamoto, K.; Nakasuji, K.; Sato, K.; Shiomi, D.; Takui, T.; Kubota,
M.; Kobayashi, T.; Yakusi, K., A stable neutral hydrocarbon radical: Synthesis, crystal
structure, and physical properties of 2, 5, 8-tri-tert-butyl-phenalenyl. Journal of the American
Chemical Society 1999, 121 (7), 1619-1620.
314. Fukui, K.; Sato, K.; Shiomi, D.; Takui, T.; Itoh, K.; Gotoh, K.; Kubo, T.; Yamamoto, K.;
Nakasuji, K.; Naito, A., Electronic structure of a stable phenalenyl radical in crystalline state
as studied by SQUID measurements, cw-ESR, and 13C CP/MAS NMR spectroscopy.
Synthetic metals 1999, 103 (1-3), 2257-2258.
315. Kosower, E. M.; Cotter, J. L., Stable Free Radicals. II. The Reduction of 1-Methyl-4-
cyanopyridinium Ion to Methylviologen Cation Radical. Journal of the American Chemical
Society 1964, 86 (24), 5524-5527.
316. Zafra, J. L.; Qiu, L.; Yanai, N.; Mori, T.; Nakano, M.; Alvarez, M. P.; Navarrete, J. T. L.;
Gómez-García, C. J.; Kertesz, M.; Takimiya, K.; Casado, J., Reversible Dimerization and
Polymerization of a Janus Diradical To Produce Labile C−C Bonds and Large Chromic
Effects. Angewandte Chemie International Edition 2016, 55 (47), 14563-14568.
317. Preuss, K. E., Pancake bonds: π-Stacked dimers of organic and light-atom radicals.
Polyhedron 2014, 79, 1-15.
318. Miller, L. L.; Mann, K. R., π-Dimers and π-Stacks in Solution and in Conducting Polymers.
Accounts of Chemical Research 1996, 29 (9), 417-423.
319. Kertesz, M., Pancake Bonding: An Unusual Pi-Stacking Interaction. Chemistry – A European
Journal 2019, 25 (2), 400-416.
320. Trabolsi, A.; Khashab, N.; Fahrenbach, A. C.; Friedman, D. C.; Colvin, M. T.; Cotí, K. K.;
Benítez, D.; Tkatchouk, E.; Olsen, J.-C.; Belowich, M. E., Radically enhanced molecular
recognition. Nature chemistry 2010, 2 (1), 42.
321. Collier, C. P.; Mattersteig, G.; Wong, E. W.; Luo, Y.; Beverly, K.; Sampaio, J.; Raymo, F.
M.; Stoddart, J. F.; Heath, J. R., A [2] catenane-based solid state electronically reconfigurable
switch. Science 2000, 289 (5482), 1172-1175.
322. Geuder, W.; Hünig, S.; Suchy, A., Phane mit zwei 4,4′‐Bipyridiniumeinheiten — eine neue
Verbindungsklasse. Angewandte Chemie 1983, 95 (6), 501-502.
323. Moser, J.; Graetzel, M., Light-induced electron transfer in colloidal semiconductor
dispersions: single vs. dielectronic reduction of acceptors by conduction-band electrons.
Journal of the American Chemical Society 1983, 105 (22), 6547-6555.
324. Sun, X.; Yang, Y.-K., Photochromism of double-bridged viologens in a polar polymer matrix.
Journal of the Chemical Society, Perkin Transactions 2 1996, (2), 225-228.
325. Yang, Y.-K.; Sun, X., PHOTOREDUCTION OF DOUBLE-BRIDGED VIOLOGEN
POLYMER MATRIX FILM. Journal of Photopolymer Science and Technology 1994, 7 (1),
193-198.

158
326. Katsuki, T.; Sharpless, K. B., The first practical method for asymmetric epoxidation. Journal
of the American Chemical Society 1980, 102 (18), 5974-5976.
327. MacInnes, M. M.; Hlynchuk, S.; Acharya, S.; Lehnert, N.; Maldonado, S., Reduction of
Graphene Oxide Thin Films by Cobaltocene and Decamethylcobaltocene. ACS applied
materials & interfaces 2017, 10 (2), 2004-2015.
328. Rozlosnik, N.; Gerstenberg, M. C.; Larsen, N. B., Effect of Solvents and Concentration on
the Formation of a Self-Assembled Monolayer of Octadecylsiloxane on Silicon (001).
Langmuir 2003, 19 (4), 1182-1188.
329. Wang, Y.; Lieberman, M., Growth of Ultrasmooth Octadecyltrichlorosilane Self-Assembled
Monolayers on SiO2. Langmuir 2003, 19 (4), 1159-1167.
330. Ulman, A., Formation and structure of self-assembled monolayers. Chemical reviews 1996,
96 (4), 1533-1554.
331. Eigler, S.; Hu, Y.; Ishii, Y.; Hirsch, A., Controlled functionalization of graphene oxide with
sodium azide. Nanoscale 2013, 5 (24), 12136-12139.
332. Bell, C. A.; Jia, Z.; Perrier, S.; Monteiro, M. J., Modulating catalytic activity of polymer‐
based cuAAC “click” reactions. Journal of Polymer Science Part A: Polymer Chemistry 2011,
49 (21), 4539-4548.
333. Mukherjee, J.; Peczonczyk, S.; Maldonado, S., Wet chemical functionalization of III− V
semiconductor surfaces: Alkylation of gallium phosphide using a grignard reaction sequence.
Langmuir 2010, 26 (13), 10890-10896.
334. Cote, L. J.; Kim, J.; Zhang, Z.; Sun, C.; Huang, J., Tunable assembly of graphene oxide
surfactant sheets: wrinkles, overlaps and impacts on thin film properties. Soft Matter 2010, 6
(24), 6096-6101.
335. Taylor, A. P.; Velásquez-García, L. F., Electrospray-printed nanostructured graphene oxide
gas sensors. Nanotechnology 2015, 26 (50), 505301.
336. Shao, J.-J.; Lv, W.; Yang, Q.-H., Self-Assembly of Graphene Oxide at Interfaces. Advanced
Materials 2014, 26 (32), 5586-5612.
337. Gerischer, H., Photodecomposition of semiconductors thermodynamics, kinetics and
application to solar cells. Faraday Discussions of the Chemical Society 1980, 70, 137-151.
338. Sun, K.; Shen, S.; Liang, Y.; Burrows, P. E.; Mao, S. S.; Wang, D., Enabling silicon for solar-
fuel production. Chemical reviews 2014, 114 (17), 8662-8719.
339. DeBenedetti, W. J. I.; Chabal, Y. J., Functionalization of oxide-free silicon surfaces. Journal
of Vacuum Science & Technology A 2013, 31 (5), 050826.
340. Thissen, P.; Seitz, O.; Chabal, Y. J., Wet chemical surface functionalization of oxide-free
silicon. Progress in surface science 2012, 87 (9-12), 272-290.
341. Liu, R.; Zheng, Z.; Spurgeon, J.; Yang, X., Enhanced photoelectrochemical water-splitting
performance of semiconductors by surface passivation layers. Energy & Environmental
Science 2014, 7 (8), 2504-2517.
342. Wang, Y.; Li, Z.; Wang, J.; Li, J.; Lin, Y., Graphene and graphene oxide: biofunctionalization
and applications in biotechnology. Trends in biotechnology 2011, 29 (5), 205-212.
343. Iqbal, M.; Li, C.; Jiang, B.; Hossain, M. S. A.; Islam, M. T.; Henzie, J.; Yamauchi, Y.,
Tethering mesoporous Pd nanoparticles to reduced graphene oxide sheets forms highly
efficient electrooxidation catalysts. Journal of Materials Chemistry A 2017, 5 (40), 21249-
21256.

159
344. Hu, S. H.; Chen, Y. W.; Hung, W. T.; Chen, I. W.; Chen, S. Y., Quantum‐dot‐tagged reduced
graphene oxide nanocomposites for bright fluorescence bioimaging and photothermal therapy
monitored in situ. Advanced materials 2012, 24 (13), 1748-1754.
345. Xu, Y.-y.; Niu, X.-y.; Dong, Y.-l.; Zhang, H.-g.; Li, X.; Chen, H.-l.; Chen, X.-g., Preparation
and characterization of open-tubular capillary column modified with graphene oxide
nanosheets for the separation of small organic molecules. Journal of Chromatography A 2013,
1284, 180-187.
346. Kulesza, P. J.; Grzybowska, B.; Malik, M. A.; Galkowski, M. T., Tungsten oxides as active
supports for highly dispersed platinum microcenters: electrocatalytic reactivity toward
reduction of hydrogen peroxide and oxygen. Journal of The Electrochemical Society 1997,
144 (6), 1911.