Functional Carbon Materials for Electrochemical Energy Storage
140
UNIVERSITY OF CALIFORNIA Los Angeles Functional Carbon Materials for Electrochemical Energy Storage A dissertation submitted in partial satisfaction of the requirements for the degree Doctor of Philosophy in Chemical Engineering By Huihui Zhou 2015
-
Upload
khangminh22 -
Category
Documents
-
view
2 -
download
0
Transcript of Functional Carbon Materials for Electrochemical Energy Storage
UNIVERSITY OF CALIFORNIA
Los Angeles
Functional Carbon Materials for Electrochemical
Energy Storage
A dissertation submitted in partial satisfaction of the
requirements for the degree Doctor of Philosophy
in Chemical Engineering
By
Huihui Zhou
2015

© Copyright by
Huihui Zhou
2015

ii
ABSTRACT OF DISSERTATION
Functional Carbon Materials for Electrochemical Energy Storage
By
Huihui Zhou
Doctor of Philosophy in Chemical Engineerging
University of California, Los Angeles, 2015
Professor Yunfeng Lu, Chair
The ability to harvest and convert solar energy has been associated with the evolution
of human civilization. The increasing consumption of fossil fuels since the industrial
revolution, however, has brought to concerns in ecological deterioration and depletion of the
fossil fuels. Facing these challenges, humankind is forced to seek for clean, sustainable and
renewable energy resources, such as biofuels, hydraulic power, wind power, geothermal
energy and other kinds of alternative energies. However, most alternative energy sources,
generally in the form of electrical energy, could not be made available on a continuous basis.
It is, therefore, essential to store such energy into chemical energy, which are portable and
various applications. In this context, electrochemical energy-storage devices hold great
promises towards this goal.
The most common electrochemical energy-storage devices are electrochemical
capacitors (ECs, also called supercapacitors) and batteries. In comparison to batteries, ECs
posses high power density, high efficiency, long cycling life and low cost. ECs commonly
utilize carbon as both (symmetric) or one of the electrodes (asymmetric), of which their
performance is generally limited by the capacitance of the carbon electrodes. Therefore,

iii
developing better carbon materials with high energy density has been emerging as one the
most essential challenges in the field.
The primary objective of this dissertation is to design and synthesize functional
carbon materials with high energy density at both aqueous and organic electrolyte systems.
The energy density (E) of ECs are governed by E = CV2/2, where C is the total capacitance
and V is the voltage of the devices. Carbon electrodes with high capacitance and high
working voltage should lead to high energy density. In the first part of this thesis, a new class
of nanoporous carbons were synthesized for symmetric supercapacitors using aqueous
Li2SO4 as the electrolyte. A unique precursor was adopted to create uniformly distributed
nanopores with large surface area, leading to high-performance electrodes with high
capacitance, excellent rate performance and stable cycling, even under a high working
voltage of 1.6V. The second part of this dissertation work further improved the capacitance
of the carbon electrodes by fluorine doping. This doping process enhances the affinity of the
carbon surface with organic electrolytes, leading to further improved capacitance and energy
density. In the third part, carbon materials were synthesized with high surface area,
capacitance and working voltage of 4V in organic electrolyte, leading to the construction of
prototyped devices with energy density comparable to those of the current lead-acid batteries.
Besides the abovementioned research, hierarchical graphitic carbons were also explored for
lithium ion batteries and supercapacitors. Overall, through rational design of carbons with
optimized pore configuration and surface chemistry, carbon electrodes with improved energy
density and rate performance were improved significantly.
Collectively, this thesis work systematically unveils simple yet effective strategies to
achieve high performance carbon-based supercapacitors with high power density and high
energy density, including the following aspects:

iv
1) Constructed electrodes with high capacitance through building favorable ion/electron
transportation pathways, tuning pore structure and pore size.
2) Improved the capacitance through enhancing the affinity between the carbon
electrodes and electrolytes by doping the carbons with heteroatoms.
3) Explored and understand the roles of heteroatom doping in the capacitive behavior by
both experimental measurement and computational modeling.
4) Improved energy density of carbon electrodes by enlarging their working voltage in
aqueous and organic electrolyte.
5) Scalable and effective production of hierarchically porous graphite particles through
aerosol process for use as the anode materials of lithium ion batteries.
These strategies can be extended as a general design platform for other high-performance
energy storage materials such as fuel cells and lithium-ion batteries.

v
The dissertation of Huihui Zhou is approved.
SENKAN, SELIM M
DUAN, XIANGFENG
LU, YUNFENG Committee Chair
University of California, Los Angeles
2015

vi
TABLE OF CONTENTS
LIST OF FIGURES .............................................................................................................. viii
ACKNOWLEDGEMENTS ................................................................................................ xiv
VITA .................................................................................................................................. xvii
Chapter1. Introduction ........................................................................................................ 1
1.1. Background ............................................................................................................... 1
1.2. Energy Storage Technologies ................................................................................... 2
1.3. Electrochemical Energy Storage ............................................................................... 5
1.3.1 Batteries .......................................................................................................... 9
1.3.2 Electrical Double-Layer Capacitors (EDLC) ................................................ 13
1.4. Development of Carbon Materials for Energy Storage………..................................18
1.4.1 Carbon Materials for Lithium-Ion Batteries.................................................... 18
1.4.2 Carbon Materials for Supercapacitors............................................................ 20
1.5. Design Criteria of Carbon for Electrochemical Energy Storage……………………25
1.6. Thesis Objective and Research Scope........................................................................26
1.7. References ................................................................................................................ 27
Chapter 2. Superior Carbon Materials for High-Voltage Supercapacitors in Aqueous
Electrolyte…………………………………………………………………………………...36
2.1 Introduction………………………………………………………………………...36
2.2 Results and Discussion…………………………………………………………..... 37
2.3 Conclusion………………………………………………………………………….48
2.4 Experimental Section……………………………………………………………....49
References……………………………………………………………………………….51

vii
Chapter 3. Fluorine-rich Nanoporous Carbon with Enhanced Surface Affinity in
Organic Electrolyte for High-performance Supercapacitors.………………...………….55
3.1 Introduction………………………………………………………………...………55
3.2 Results and Discussion……………………………………………………………..56
3.3 Conclusion………………………………………………………………………….67
3.4 Experimental Section………………………………………………………………67
3.5 Supporting Information…………………………………………………………….70
References……………………………………………………………………………….75
Chapter 4. Fluorinated Nanoporous carbon for High Voltage Supercapacitors………79
4.1 Introduction……………………………………………………………………...…79
4.2 Results and Discussion…………………………………………………………..…82
4.3 Conclusion………………………………………………………………………….92
4.4 Experimental Section………………………………………………………………92
References………………………………………………………………………………95
Chapter 5. Facial Aerosol-assisted Synthesis of Hierarchical Porous Carbon for Lithium
Ion Battery………………………………………………………………………………..101
5.1 Introduction………………………………….…………………………….…...…101
5.2 Results and Discussion………………………………………………………..…..103
5.3 Conclusion……………………………………………………………………...…113
5.4 Experimental Section………………………………………………..……………113
References…………………………………………………………………………...…115
Chapter 6. Conclusion……………………………………………………………...…….120

viii
LIST OF FIGURES
Figure 1.1 (A), the forecasting fossil fuel consumption in the next 20 years based on the
statistical result in past 50 years, unit for y-axis is billion toe. (B) renewable electricity
generation from 2000-2040, unit of y-axis is billion kilowatthours. ……………………..….1
Table 1.1: Energy Storage plants: Capital Cost Data……………………………………….4
Figure 1.2 Plot of hydrogen storage materials as a function of observed temperature release
or sorption. Dashed lines denotes DOE 2017 and Ultimate targets……………………….…5
Table 1.2: Storage plants: performance and characteristics…………………………………6
Figure 1.3, Specific power against specific energy, also called a ragone plot, for various
electrical energy storage devices...............................................................…………………...7
Table 1.3 Comparison of some important characteristics of state of the art of electrochemical
capacitors and lithium-ion batteries. * Time for discharge and charge of the useable total
energy stored in the devices. ** Power capability of the battery for short duration partial
dischargeat 90% efficiency…………………………………………………………………..8
Figure 1.4 A Common Cell structure and components which usually consist of anode,
cathode, electrolyte and a separator, which are electrically connected in an appropriate
series or parallel arrangement to provide the required operating voltage and current
levels…………………………………………………………………………………………10
Figure 1.5 Schematic open-circuit energy diagram of an aqueous electrolyte………...……12
Figure 1.6 Models of the electrical double layer at a positively charged surface: (a) the
Helmholtz model, (b) the Gouy–Chapman model, and (c) the Stern model…………………15
Figure 1.7, (A) Plot of specific capacitance normalized by BET SSA for the carbons varying
with average pore sizes. (B) to (D) drawings of the behavior of solvated ions residing in pores
with distance between adjacent pore walls (B) greater than 2nm, (C) between 1 and 2 nm, and

ix
(D) less than 1nm. (E) schematic diagrams (top view) of a negatively charged mesopore with
solvated cations……………………………………………………………………………...16
Table 1.4 Summary of the performance characteristics of commercialized
supercapacitors ……………………………………………………………………………...18
Figure 1.8, Scheme of chemical route to the synthesis of chemically derived graphene……22
Figure 1.9, SWNT forest grown with water-assisted CVD. (A) Picture of a 2.5-mm-tall
SWNT forest on a 7-mm by 7-mm silicon wafer. A matchstick on the left and ruler with
millimeter markings on the right is for size reference. (B) Scanning electron microscopy
(SEM) image of the same SWNT forest. Scale bar, 1 mm. (C) SEM image of the SWNT
forest ledge. Scale bar, 1 mm. (D) Low-resolution TEM image of the nanotubes. Scale bar,
100 nm. (E) High-resolution TEM image of the SWNTs. Scale bar, 5 nm…………………23
Figure 2.1. (A) Schematic illustration of the synthesis procedure of oxygen-enriched
nanoporous carbon. TEM images of (B) NC and (C) ANC-2. Insets are the corresponding
HRTEM images………………………………………………………………………………39
Figure 2.2 (A) XRD patterns of NC, ANC-1 and ANC-2. (B) Raman images of NC and
ANC-2 respectively…………………………………………………………………………..40
Figure 2.3, XPS C1s spectra of (A) NC, (B) ANC-1 and (C) ANC-2, respectively. XPS O1s
spectra of (D) NC, (E) ANC-1 and (F) ANC-2……………………………………….……...41
Table 2.1 Composition and pore properties of F-rich nanoporous carbons…………………42
Figure 2.4. Under working voltage of 1V, cyclic voltammograms of (A) ANC and (B) ANC-
2 at various scan rates. Galvanostatic charge/discharge curves of (C) NC and (D) ANC-2 at
different current densities. ………………………………………………………………….43
Figure 2.5. Under high working voltage of 1.6V, cyclic voltammograms of (A) ANC-1 and
(B) ANC-2 at various scan rates. Galvanostatic charge/discharge curves of (C) ANC-1 and
(D) ANC-2 at different current densities……………………………………………………45

x
Figure 2.6 Relationships of the specific capacitance and current densities of different carbons
under different working voltages of (A) 1V and (B) 1.6V. (C) Nyquist plots of different
carbon-based electrodes; inset shows the plots in high frequency region. (D) Long-term
cycling performance of symmetric supercapacitors based on ANC-2 at 1.6V………………46
Figure 2.7 Ragone plots comparing the energy density and power density of the
supercapacitor based on ANC-2 in this work and representative literature reports: (■)
Polymer derived carbon, (●) Activated graphene, (▲) 3D hexaporous carbon, (▼) Nitrogen
enriched carbon, (☆) this work tested under 1V, and (★) this work tested under 1.6V……47
Figure 3.1. (A) Schematic illustration of the synthesis procedure of fluorine-rich nanoporous
carbon. (B) Nitrogen sorption isotherms and (C) pore size distribution of NC and FNCs.
TEM images of (D) NC and (E) FNC-4. Insets are the corresponding HRTEM images..….57
Figure 3.2. (A) XPS wide scan spectra of NC, FNC-1, FNC-2, FNC3, and FNC-4. (B) F1s
XPS spectrum of FNC-4. C1s XPS spectra of (C) NC and (D) FNC-4. O1s XPS spectra of (E)
NC and (F) FNC-4…………………………………………………………………………...59
Table 3.1 Composition and pore properties of F-rich nanoporous carbons…………………61
Figure 3.3. (A) Cyclic voltammogram and (B) galvanostatic charge/discharge curves of
FNC-4 at various scan rates and current densities. (C) Relationship of the specific
capacitance and current densities of different FNCs. (D) Nyquist plots of different FNC-
based electrodes; inset shows the plots in high frequency region. (E) Long-term cycling
performance of symmetric supercapacitors based on FNCs. (F) Ragone plots comparing the
energy density and power density of the supercapacitor based on FNC-4 in this work and
representative literature reports………………………………………………………..…….62
Figure 3.4. The simulated electrostatic potential surface for (A) pristine graphene and (B)
fluorine doped graphene. The inset is electrostatic potential scale bar; the most negative value

xi
is red while the most positive value is blue. Optimized configuration of TEA+ adsorbed on (C)
pristine graphene and (D) fluorine doped graphene………………………………………...65
Figure S3.1. TEM images of (A) FNC-1, (B) FNC-2, (C) FNC-3. Insets are the HRTEM
images of the corresponding samples……………………………………………………….70
Figure S3.2. (A) XRD patterns and (B) Raman spectra of NC and FNC-4…………………71
Figure S3.3. F1s XPS peaks of (A) FNC-1, (B) FNC-2, and (C) FNC-3, respectively. C1s
XPS peaks of (D) FNC-1, (E) FNC-2, (F) FNC-3, respectively. O1s XPS peaks of (G) FNC-1,
(H) FNC-2, (I) FNC-3, respectively…………………………………………………………71
Figure S3.4. CVs of (A) FNC-1, (B) FNC-2, (C) FNC-3 at different scanning rates ranging
from 5 to 100 mV s-1
…………………………………………………………………………72
Figure S3.5. Galvanostatic charge/discharge curves of (A) FNC-1, (B) FNC-2, (C) FNC-3 at
different current rates ranging from 0.5 to 10 A g-1
………………………………………….72
Figure S3.6. Capacitance of FNCs and corresponding activated samples without HF wash
measured at different current densities. The dashed columns numbered 1 to 4 represents
FNC-1 to FNC-4, while the blank columns are corresponding counterparts without
fluorination………………………………………………………………………………..….72
Figure S3.7. Contact angle of TEABF4 on (A) NC and (B) FNC-4…………………………73
Table S3.1 Brief summary of current fluorinated carbon on their synthesis method,
fluorination content and structure configuration……………………………………………..74
Table S 3.2. Summary of current fluorinated carbon properties for supercapacitors………..75
Figure 4.1 TEM images of (A) NC and (B) FNC. Insets are the corresponding HRTEM
images………………………………………………………………………………………..82
Figure 4.2 (A) Nitrogen sorption isotherms and (B) pore size distribution of NC and FNC..83
Figure 4.3 XRD images of NC and FNC…………………………………………………....84
Figure 4.4 XPS C1s of (A) NC and (B) FNC……………………………………………….85

xii
Figure 4.5 (A) Cyclic voltammogram of FNC at different working voltage windows under
scanning rate of 50 mV/s, (B) Cyclic voltammogram of FNC at various scan rates under the
working voltage window of 4V. ……………………………………………………………..86
Figure 4.6 (A) Cyclic voltammogram of FNC under scanning rate of 50 mV/s at different
working voltage of 2.7V, 3V, 3.3V, 3.7V and 4V. (B) Cyclic voltammogram of FNC under
scanning rate of 50 mV/s at different working voltage window of 4.2V and 4.4V……….…87
Figure 4.7 (A) galvanostatic charge/discharge curves of FNC at various current densities, (B)
IR drop of FNC under the current density of 10 A g-1. (C) Relationship of the specific
capacitance and current densities of FNC, (D) Nyquist plots of NC and FCN electrodes; inset
shows the plots in high frequency region……………………………………………………89
Figure 4.8 Ragone plots comparing the energy density and power density of the
supercapacitor based on FNC in this work and representative literature reports……………91
Scheme 5.1, (A) DPSD-nickel composite particles after aerosol process, (B) hierarchical
porous carbon after template removal, (C) the aerosol process used to synthesize the carbon
particles……………………………………………………………………………………..103
Figure 5.1 (A) SEM image of the obtained aerosol-assisted hierarchical porous carbon. (B)
and (C) are the TEM images of the aerosol-assisted hierarchical porous carbon. (D) the
graphitic lattice under TEM view of the products. ………………………………………...105
Figure 5.2, (A) X-ray diffraction pattern of the aerosol-assisted hierarchical graphitic carbon.
(B) the isothermal nitrogen-sorption isotherms and inset is pore-size distributions of the
aerosol-assisted hierarchical graphitic carbon.…………………………………….………106
Figure 5.3 (A) The cyclic voltammetry test of AHGC carbon, (B) the 1st, 2
nd and 3
rd
galvanostatic charging and discharging profile, (C) rate performance of commercial graphite
325 and AHGC, (D) cycling performance of AHGC after rate performance test………….109

xiii
Figure 5.4 (A) Impedance spectra of AHGC and commercial graphite 325 electrode, (B)
After rate test, the cycling performance of the commercial graphite 325 and AHGC at a
charging/discharging rate of 10C…………………………………………………………..111

xiv
ACKNOWLEDGEMENT
I still clearly recall that time when I was a junior student at Sichuan University, my
class adviser encouraged me to participate in an information session called “Cross-
disciplinary Scholars in Science and Technology (CSST) Program”. Before that moment, the
biggest dream I could imagine is to pass the postgraduate entrance exams of Chinese
Academy of Sciences in Beijing, go back to somewhere near my hometown, and flee from
the frigid and humid weather in Sichuan forever.
That must be a watershed of my life. I decided to have a try to step further, even
further than the “biggest dream” I had before, to apply for the research program hold by
University of California in Los Angeles. That sudden decision stirred up my passion so
deeply that I quickly wrapped up my bag, went to a computer and finished the online-
application by that day. I think I was lucky, especially considering my zero preparation in
applying for graduate school abroad, a professor in UCLA unexpectedly offered me an olive
branch to volunteer in his lab for a whole summer. Moreover, this professor finally turned out
to be my Ph. D supervisor, thesis advisor, guider and philosophier in the past four years.
Thank you, dear Dr. Lu, you really lighted my life and opened an unanticipated window that I
therefore saw a brand new world.
And this world in not only new, but full of fun! The four years in Dr. Lu’s lab was the
most rewarding time in my life. I could not say enough to thank Dr. Lu, who has just been a
great mentor in every meaning of the word. In lab, he set me on the right track and let go,
giving timely guidance while granting me full freedom to explore new frontiers. In life, he is
a kind and generous man, with a truly free and fun-loving spirit. I still remember the Brand
Lu’s Thanksgiving Parties hosted in his family every year, the yummy turkeys with glutinous
rice, the home-made lobster plate, the countless drinking time in faculty center, and all those
interesting stories he shared with us. I couldn’t count how many good advices he has given

xv
me on my professional as well as personal growth, even if sometimes the guidance sounds
like very strict. While, this rigorous and logical thinking training was approved to be the most
valuable treasure that I couldn’t estimate how much I benefited and will continue to benefit
from them.
I would also to give my gratitude to my doctoral committee members, Professor
Jane.P.Chang, Professor Selim Senkan and Professor Xiangfeng Duan for their support of my
doctoral candidacy. Their insightful questions and discussions along the way have helped me
a lot over the years. I am also thankful to Dr. Dunn’s student Yongjia Li, Zhaoyang Lin and
Chain Lee who have been helping me a lot with material characterization.
Thanks all the previous and current group members in UCLA. I feel so lucky to be
surrounded by such smart and diligent colleagues like you. Especially, thank Dr. Zheng Chen,
Dr.Xiaolei Wang, Dr. Juanjuan Du, Dr.Yang Liu, Dr. Jie Li, Dr. Zhe Weng, Dr. Haobin Wu
Dr Jing Liu for your kind help and advice. Thanks to Zaiyuan Le, Fang Liu, Duo Xu, Di Wu,
Gurong Shen, Li Shen, Audi Furr, Fei Sun, Xu Wu, Xiaoyan Liu for your daily help and
discussions. Also thanks to the visiting professors Fang He, Jian Zhu and Zhengying Wu,
who gave me valuable advice in career consulting.
I would like to say special thanks to my dear friends. Wenke, the girl always standing
by my side, we have known each other since we were 13 years old! This impregnable
friendship has lasted for another 13 years already and will be forever! Ying and Beijia, you
two are my best friends in UCLA. I just can’t tell how many times you two raised me up and
helped me with your full-hearted love and trust. Thanks to my close sisters, Lisa Yuxi Wang,
Julie Jue Liao, Eve Yuanxiu Luo, Anna Juan Wu, Wanru Liu, Fangting Xia, Dan Duan, and
et al, your Christ-like love, help and support made my life fulfilled with happiness and joy.
Especially thanks to Hang Yu, you gave me full support and encouragement during the past

xvi
days in graduate school. Good time, hard time, but never bad time. I wish you all the best in
the future.
Finally, I thank my parents, especially my mother, who has always supported my
choices and decisions, and offered me unconditional love and hope. You teach me to be an
honest and righteous person, to be always optimistic and friendly to life. I wish you two will
be the happiest and most blessed parents in the world, since as your daughter, I am already
the most happiest and blessed girl.

xvii
VITA
2007-2011 B. S., Biomedical Engineering
Sichuan University
Chengdu, P. R. China
2011-2015 Teaching Assistant, Research Assistant
Department of Chemical and Biomolecular Engineering
University of California, Los Angeles, USA

1
Chapter 1: Introduction
1.1 Background
In the beginning God created the heavens and the earth, God said, “Let there be light”,
and there was light.[1] Solar energy then transfers into various energy types such as chemical
energy, electrical energy, geothermal energy and so on. Energy drives the evolution of nature
and human beings since the beginning of creation. However, modern civilization along with
industrial revolution rapidly accelerates the consumption of non-renewable fossil fuel energy
and lead to serious greenhouse gas emission and environmental pollution, as shown in Figure
1.1 A.[2] Facing these challenges, humankind is forced to move towards sustainable and
renewable resources.[3]
Figure 1.1 (A), the forecasting fossil fuel consumption in the next 20 years based on the statistical
result in past 50 years, unit for y-axis is billion toe. [2] (B) renewable electricity generation from
2000-2040, unit of y-axis is billion kilowatthours. [4]
In terms of alternative energy, there emerge lots of options in the recent years, such as
biofuel, hydraulic power, wind power, geothermal energy and so on.[5] Geothermal energy
comes from the heat of the earth, which is clean and “free”. However, it is not practical to set
up a geothermal power station anywhere, and the potential danger of running out of steam
cannot be ignored.[6] Wind and hydraulic power play a critically important role in world
2
commercial energy use. As expected in Annual Energy Outlook 2015 published by U.S.
Energy information administration, wind energy will account for the largest absolute increase
in renewable generation and for 40.0% of the growth in renewable generation from 2013 to
2038, displacing hydropower and becoming the largest source of renewable generation by
2040.[4] (see Figure 1.1 B) Nevertheless, the construction of dams and wind farms are
extremely expensive and the locations with special geological conditions are required.
Biomass and biofuel is a potential way to produce high-quality energy (e.g. alcohol, biodiesel)
from renewable sources, such as crops, plants and other organic compounds.[7] However, the
biomass processing is expensive and inefficient. It requires large land and lots labors to grow
and burn the biomass. Moreover, due to the low conversion efficiency, the biofuel usually
needs to be mixed with other gasoline to power the machines properly, which not only does it
take a lot more fuel to do the same job as using conventional fuels, but it also creates
environmental problems of its own.[8]
Despite all the energy resources mentioned above, the variability of these sources has
led to concerns regarding the reliability of an energy supply network. Because the sun does
not shine during the night and wind does not blow at any given location, there has been an
increased call for the deployment of energy storage as an essential component of future
energy systems. However, this often-characterized “need” for energy storage to enable
renewable integration is actually a complicated question not only consisting technical
breakthrough, industrial chain revolution, but also economic and political adjustment. The
amount of storage or any other “enabling” technology used will depend on the costs and
benefits of each technology relative to the other available options.
1.2 Energy Storage Techniques
Energy storage is accomplished by deices or physical media that store energy to
perform useful processes at a later time. It is aimed to convert energy from forms that are

3
difficult to store to more conveniently or economically storable forms.[9] Diverse
technologies have been developed such as electrical energy storage devices (including
capacitors, lead-acid batteries, lithium batteries, et al), mechanical energy storage devices
(flywheel, compressed-air, et al), chemical storage devices (hydrogen, methane, biofuel, et al)
and so on. [10]
Mechanical energy storage devices have a great potential in commercialization as
they are large scale and durable. Compressed air energy storage (CAES) store energy in the
form of a compressed air in underground caverns, and the energy is later supplied to
electrical networks through a conversion process. The airis compressed into an underground
reservoir, which facilitates the storage of energy in a “pressure gradient”, the energy is
discharged through a combustion process to operate an expansion turbine which spins and
electrical generator. CAES systems have round trip efficiency (RTE) of ~85%, and an
expected life time of 20-40 years, making it a suitable option for large-scale storage
applications. Similarly, the RTE and lifetime for other mechanical energy storage devices
like flywheel energy storage and gravitational potential energy storage are also very high,
namely 75%, 40-60 years and 95%, 15 years.[10] However, as shown in Table 1.1, the
mechanical energy storage technologies usually have large physical dimensions, long
construction time (8-12 years), high investment cost (1000-2000 $/kW), which is expensive
and time consuming. [11]

4
Table 1.1: Energy Storage plants: Capital Cost Data [11]
Chemical energy storage technologies such as hydrogen storage are increasing studied
as a promising replacement energy storage form due to its high energy density. At
143.0MJ/kg, hydrogen storage has the highest energy density of common fuels by weight
(three times larger than gasoline). Unfortunately, at 0.0108 MJ/L, gaseous hydrogen also has
the lowest energy density by volume (over 3000 times smaller than gasoline) and it can
explode violently when brought into contact with air. There is limited space to store fuel on a
vehicle and the fuel tank must be reinforced enough to prevent explosion during a crash.
Therefore, a compact, safe, reliable, inexpensive and energy efficient method of storing
hydrogen is needed if a hydrogen energy-driven vehicle is to become commonly used.[12]
Methods of hydrogen storage span many approaches, including high pressures, cryogenics,
and chemical compounds that reversibly release hydrogen upon heating. High pressure gas
and cryogenic liquid is a possible option, however, they have technical and practical
challenges, especially when considering emerging commercial markets. When considering

5
the hydrogen storage materials, as shown in Figure 1.2, the suitable materials with a
reasonable release/sorption temperature and observed hydrogen capacity is quite limited. [13]
Figure 1.2 Plot of hydrogen storage materials as a function of observed temperature release or
sorption. Dashed lines denotes DOE 2017 and Ultimate targets.[13]
1.3 Electrochemical Energy Storage
As compared in Table 1.1 and Table 1.2, a desired energy storage system should
have high energy density, high conversion efficiency, facial and fast construction, and low
cost as much as possible. Based on these criteria, electrochemical energy storage (EES) is an
established, valuable approach for improving the reliability and overall use of the entire
power system (generation, transmission, and distribution). EES usually contains of batteries
and electrochemical capacitors (EC), which are highly portable and environmental friendly,
enabling their broad use in portable electronics, electric vehicles, and other applications.

6
Table 1.2: Storage plants: performance and characteristics.[11]
Footnotes: (1) Conversion efficiency: for energy storage technology only, and is not to be used if the
storage device uses anything other than electricity as input; (2) Delivery efficiency: from primary fuel
through base load power generator and energy storage technology, including any supplemental fuel
used in the storage facility; (3) Effective efficiency: useful for comparing all types of storage plants,
represents the ability of the storage plant to efficiently store electrical energy

7
Figure 1.3, Specific power against specific energy, also called a ragone plot, for various electrical
energy storage devices. If a supercapacitor is used in an electric vehicle, the specific power shows
how fast one can go, and the specific energy shows how far one can go on a single charge. Times
shown are the time constants of the devices, obtained by dividing the energy density by the power.
[14]
Performance requirements of EES for stationary use is a combined consideration of
energy density and power density, as shown in the typical Ragone plot in Figure 1.3.[14]
Energy density represents the total amount of energy that could be stored in the material per
mass/volume, while power density displays how fast you can charge/discharge your device.
Batteries, which operate based on redox reactions between their cathodes and anodes, offer
high energy density but low power density. Capacitors, on the other hand, which are operated
based on charge accumulation on parallel electrodes separated by dielectrics, usually offer
much higher power density but much lower energy density. In the aspect of lifetime,
capacitors exhibit dramatically longer lifetimes (e.g., >1,000,000 cycles) than batteries (e.g.,
1000 cycles). Electrochemical capacitors, also called supercapacitors, exhibit storage
performance intermediate that of capacitors and batteries. They are generally operated based

8
on electrical double layer capacitance or pseudocapacitance, and are referred to electrical
double-layer capacitor (EDLC) and pseudocapacitor, respectively. As shown in Table 1.3,
Supercapacitors can deliver at least 1,000 times more energy than dielectric capacitors and 10
times more power than batteries. In addition, they often exhibit long cycling lives of over
500,000 cycles.[15] Such superior performance is essential for various applications where
fast charging, high power and long cycling life are required. Typical applications include
energy recovery, energy harvesting from intermittent power sources, back-up power supply,
heavy-duty loading and uninterruptible power supplies.
Table 1.3 Comparison of some important characteristics of state of the art of electrochemical
capacitors and lithium-ion batteries. * Time for discharge and charge of the useable total energy
stored in the devices. ** Power capability of the battery for short duration partial dischargeat 90%
efficiency.[15]
Cost is probably the most important and fundamental issue of EES for a broad market
penetration. Capital cost and life-cycle cost are the typical concerned important factors. As

9
shown in Table 1.1, the capital cost is typically expressed in terms of the unit cost of power
($/kW) for power applications (e.g., frequency regulation) or the unit cost of energy capacity
($/kWh) for energy applications (e.g. load leveling). Compared with other currently
established energy storage devices, electrochemical storage system shows a lowest capital
price of only 320-460 $/kW, whereas the cost for compressed air, pumped hydro energy
storage, flywheel energy storage and superconducting magnetic storage is 400-550 $/kW,
1200-1700 $/kW, 750 $/kW and 720$/kW, respectively.
Considering the aforementioned technical and economic factors, it is more clear and
rational to offer a guide in the R&D of electrochemical storage devices. As the detailed
requirements for different electrochemical devices also distinguish a lot with each other, we
will discuss the main-stream electrochemical storage systems as follows.
1.3.1 Batteries
A battery is one or more electrically connected electrochemical cells having
terminals/contacts to supply electrical energy. A secondary battery is a cell or group of cells
for the generation of electrical energy in which the cell, after being discharged, may be
restored to its original charged condition by an electric current flowing in the direction
opposite to the flow of current when the cell was discharged. Other terms for this type of
battery are rechargeable battery or accumulator. As secondary batteries are usually assembled
in the discharged state, they have to be charged first before they can undergo discharge in a
secondary process.[16]
10
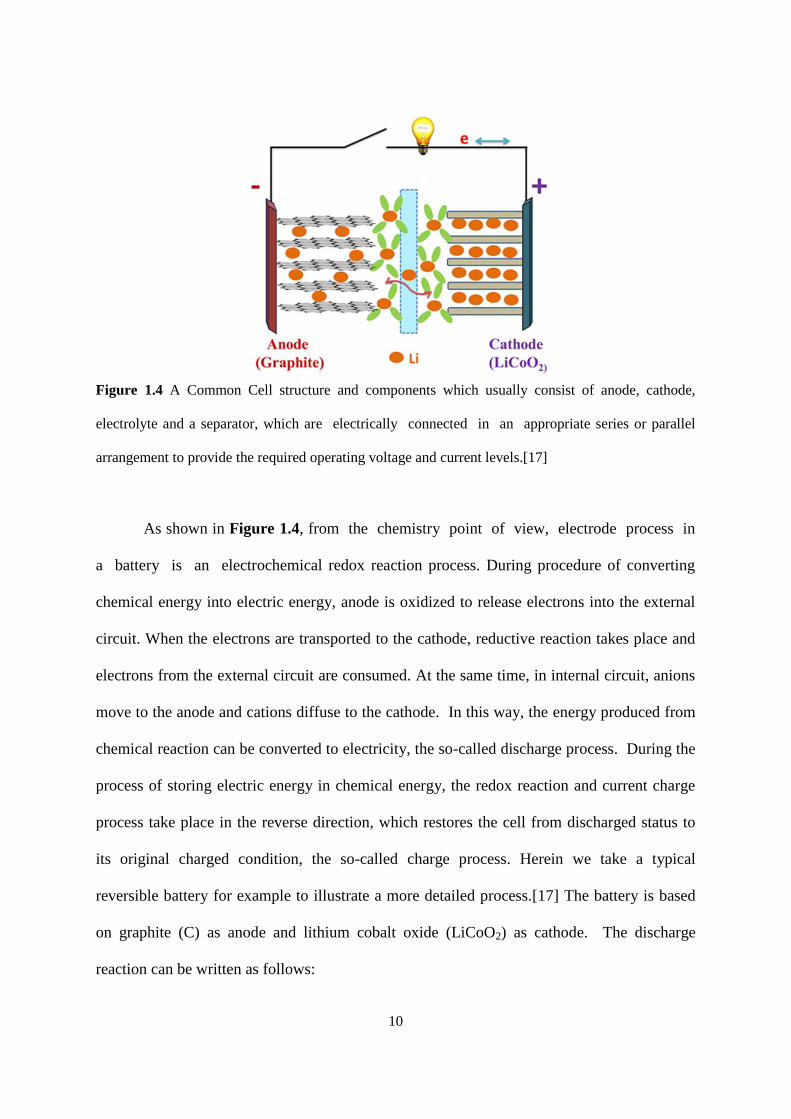
Figure 1.4 A Common Cell structure and components which usually consist of anode, cathode,
electrolyte and a separator, which are electrically connected in an appropriate series or parallel
arrangement to provide the required operating voltage and current levels.[17]
As shown in Figure 1.4, from the chemistry point of view, electrode process in
a battery is an electrochemical redox reaction process. During procedure of converting
chemical energy into electric energy, anode is oxidized to release electrons into the external
circuit. When the electrons are transported to the cathode, reductive reaction takes place and
electrons from the external circuit are consumed. At the same time, in internal circuit, anions
move to the anode and cations diffuse to the cathode. In this way, the energy produced from
chemical reaction can be converted to electricity, the so-called discharge process. During the
process of storing electric energy in chemical energy, the redox reaction and current charge
process take place in the reverse direction, which restores the cell from discharged status to
its original charged condition, the so-called charge process. Herein we take a typical
reversible battery for example to illustrate a more detailed process.[17] The battery is based
on graphite (C) as anode and lithium cobalt oxide (LiCoO2) as cathode. The discharge
reaction can be written as follows:

11
Negative electrode: anodic reaction (oxidation, generation of electrons)
LixC6xLi+ + C + e
-
Positive electrode: cathodic reaction (reduction, gain of electrons)
Li1-xCoO2 + xLi+ + xe
- LiCoO2
The overall reaction of discharge process can be expressed as
LixC6 + Li1-xCoO2 C + LiCoO2
During the course of charge, the cell is connected to direct current power source and
the current and ions flow is opposite to direction of the discharge process, as well as the
electrochemical reactions. Keeping in mind that the anode is the electrode where oxidation
occurs and cathode is the one where reduction takes place, the positive electrode
becomes anode and the negative is cathode. Similarly, the charge reaction can be written as
follows:
Negative electrode: cathodic reaction (reduction, gain of electrons):
xLi+ + C + e
- LixC6
Positive electrode: anodic reaction (oxidation, generation of electrons):
LiCoO2 Li1-xCoO2 + xLi+ + xe
-
The overall reaction of discharge process can be expressed as:
C + LiCoO2 LixC6 + Li1-xCoO2
The storage electricity or capacity of a cell is determined by the amount of active
materials in the electrode. It is expressed as the total quantity of electricity produced in the
electrochemical reaction and is defined in terms of coulombs or ampere-hours. The
theoretical capacity of a battery, based only on the active materials participating in the
electrochemical reaction, is calculated from the equivalent weight of the reactants, where one
gram-equivalent weight is the atomic or molecular weight of the active material in
grams divided by the number of electrons involved in the reaction. Similarly, the

12
specific capacity based on volume can be calculated using the appropriate data for ampere-
hours per cubic centimeter. The specific energy (E) of a cell can be calculated by taking
both the voltage and the quantity of electricity into consideration, using the following
equation (1.1):
E (Wh/g) = U (V) × C (Ah) (1.1)
Where, the cell voltage is determined by the difference of potentials between
the two half-cells in the battery. If the discharge current density is expressed as I,
then the specific power (P) of the battery can be evaluated by equation (1.2):
P (W/g) = U (V) × I (A/g) (1.2)
Figure 1.5 Schematic open-circuit energy diagram of an aqueous electrolyte.[18]
Rechargeable batteries can be divided into different categories according to their
electrode materials, and mainly include lead-acid, nickel-cadmium, nickel-metal hydride and
lithium-ion batteries. Currently, lithium-ion batteries are the most widely used rechargeable
batteries due to their high energy density, high cell voltage, low self-discharge, long cycling
life and absence of memory effect. Typically, a lithium battery mainly contains four parts,
namely cathode materials, anode materials, electrolyte and separator. Figure 1.5 shows the
schematic of the relative electron energies in the electrodes and the electrolyte of a

13
thermodynamically stable battery cell in electrolyte.[18] The anode is reductant, the cathode
is oxidant, and the energy separation Eg of the lowest unopccupied molecular orbital (LUMO)
and the highest occupied molecular orbital (HOMO) of the electrolyte is the “window” of the
electrolyte. The electrochemical potentials of cathode and anode are μA and μB respectively.
Thermodynamically, μA should below LUMO and μB should above HOMO, otherwise, the
electrolyte will be either reduced or oxidized and form a passivating solid/electrolyte-
interface (SEI) layer at the electrode/electrolyte boundary. Therefore, once the window of
electrolyte is fixed, it is necessary to select and design electrodes of high capacity that have
their μA and μB matched to the LUMO and HOMO of the electrolyte.
Based on the design criteria, to date, numerous kinds of materials have been
developed towards the application of cathode and anode for lithium ion batteries. Among
them, carbon-based materials have attracted more and more attention due to their super
conductivity, cheap price, good intercalation/de-intercalation reversibility and excellent
electrochemical stability, leading carbon to a promising candidate both for lithium anode
materials and also super conductive agents for cathode materials. Especially for anode
materials, graphite takes over 85% of the whole anode materials market in 2014 in China.[19]
Due to the huge marketing potential, various types of carbons have been designed and studied,
such as graphite, hard carbon, CNT, graphene, et al.
1.3.2 Electrochemical Double Layer Capacitor (EDLC)
When an electrode (electronic conductor) comes into contact with an electrolyte
(ionic conductor), it shows some potential and attracts ions with the opposite sign, forming an
“electrical double-layer” at the electrode/electrolyte interface, as shown in Figure 1.6.[20][21]
From Figure 1.6 (A) to (C), the model to explain EDL evolves from the Helmholtz Model to
Couy-Chapman Model, and finally to Stern Model. As shown in Figure 1.6 (C), there are
two regions called compact layer and diffuse layer. In the compact layer, ions (very often

14
hydrated) are strongly adsorbed by the electrode. In addition, the compact layer consists of
specifically adsorbed ions (in most cases they are anions irrespective of the charge nature of
the electrode) and non-specifically adsorbed counterions. The inner Helmholtz plane (IHP)
and outer Helmholtz plane (OHP) are used to distinguish the two types of adsorbed ions. The
capacitance in the EDL (Cdl) is the sum of capacitances from two regions, the Stern type of
compact double layer capacitance (CH) and the diffusion region capacitance (Cdiff). Thus, Cdl
can be expressed by the following equation (1.3):
The capacitance is dependent on the specific surface area of the electrode, the type of
electrolyte and the effective thickness of the double layer (the Debye length), according to the
formula of a parallel-plate capacitor (1.4):
C=εrε0A/d (1.4)
Where C is the capacitance of the EDLC, εr is the electrolyte dielectric constant, ε0 is the
dielectric constant of the vacuum, d is the effective thickness of the double layer which is
also approximated as the Debye length, and A is the electrode surface area. Based on this
model, for a long time, it was believed that the micropores (typical pore size smaller than
2nm) have no contribution to the SC of electrode due to their inaccessibility to electrolyte.
However, as shown in Figure 1.7 (A) to (D), reports of Simon and Gogotsi showed an
anomalous capacitance increase in carbon electrodes with pore size less than 1nm, in which
the solved electrolyte ions will experience a desolvation process and fit into the
mirocropores.[22] Based on this abnormal

15
Figure 1.6 Models of the electrical double layer at a positively charged surface: (a) the Helmholtz
model, (b) the Gouy–Chapman model, and (c) the Stern model, showing the inner Helmholtz plane
(IHP) and outer Helmholtz plane (OHP). The IHP refers to the distance of closest approach of
specifically adsorbed ions (generally anions) and OHP refers to that of the non-specifically adsorbed
ions. The OHP is also the plane where the diffuse layer begins.dis the double layer distance described
by the Helmholtz model. Ψ0 and Ψ are the potentials at the electrode surface and the
electrode/electrolyte interface, respectively.[20][21]
phenomenon, Huang et al proposed a heuristic approach to illustrate the capacitance storage
more precisely by considering different pore curvatures.[23] As shown in Figure 1.7 (E), for
the mesoporous materials, it is generally assumed that the mesopores are cylindrical and
solvated counterions enter pores and approach the pore walls to form EDLC, the double
cylinder capacitance is given in Equation (1.5):
in which L is the pore length and b and a are the radii of the outer and inner cylinders,
respectively.

16
Figure 1.7, (A) Plot of specific capacitance normalized by BET SSA for the carbons varying with
average pore sizes. (B) to (D) drawings of the behavior of solvated ions residing in pores with
distance between adjacent pore walls (B) greater than 2nm, (C) between 1 and 2 nm, and (D) less than
1nm. (E) schematic diagrams (top view) of a negatively charged mesopore with solvated cations
approaching the pore wall to form an electric double-cylinder capacitor (EDCC) with radii b and a for
the outer and inner cylinders, respectively, separated by a distance d, and (F) a negatively charged
micropore of radius b with solvated cations of radius a0 lining up to form an electric wire-in-cylinder
capacitor (EWCC). [23]
For micropores, however, the small pores do not allow the formation of a double
cylinder. Asuuming cylindrical micropores, solvated (desolvated) counterions enter the pores
and line up to form electric wire-in-cylinder capaciators (EWCC). Although the molecular
geometries of the counterions might be anisotropic, the pore walls experience the average
effect owing to the translation or room temperature rotation of the counterions along or with
respect to the pore axes, leading to an inner cylinder. Conversely, the counterions experience
the average effect if the micropore shape is slightly distorted from a cylinder, leading to an
outer cylinder, as shown in Figure 1.7 (F). In a way, EWCCs can also be viewed as EDCCs,
but the key quantity for EWCCs is no longer d, but rather the radius of the inner cylinder a0,

17
which is the effective size of the counterions (that is, the extent of electron density around the
ions). By using a0, Equation (1.5) then becomes Equation (1.6):
Equation (1.5) and (1.6) are used to fit the available experimental data for
supercapacitors of nanoporous carbon materials with diverse pore sizes and electrolytes.
Energy and power densities are two crucial parameters for evaluating the
elctrochemical performance of supercapacitors. The maximum energy (E in Wh kg-1
) and
power densities (P in W kg-1
) of a supercapacitor can be obtained using the equations (1.5)
(1.6), respecitively.
E=CV2/2 (1.5)
P=V2/4R (1.6)
Since the first discovery of the carbon-based electrochemical capacitor by Becker in
1957, numerous kinds of supercapacitor have been developed and commercialized as shown
in Table 4.[25] Among the multitudinous choices, carbon-based material is attracting more
and more interest due to their high electrical conductivity, low cost, versatile forms, broad
chemical stability in different electrolytes (from strongly acidic to basic), and highly
durability in a wide range of temperatures. Consequently, diverse forms of carbon have been
synthesized and developed towards the application in supercapacitors, such as carbon
nanotube (CNT), graphene, template microporous carbon, activated carbon, carbon
nanocages, carbon onions, carbon fibers, heteroatom-doped carbons and so on.[26][27]
Table 1.4 Summary of the performance characteristics of commercialized supercapacitors [25]
a Energy density at 400 Wkg-1
constant power,Vrated−1/2Vrated

18
b Power based on P= 9/16×(1−EF)×V2/R, EF= efficiency of discharge.
c Except where noted, all the devices use acetonitrile as the electrolyte.
d All device except those with footnote d are packaged in metal containers, these devices are in laminated
pouches.
1.4 Development of Carbon Materials for Energy Storage
Carbon, as one of the most abundant elements on the Earth, has been a source of
energy which is closely associated with the development of human history. The technologies
that move forward our modern society such as automobiles, airplanes, lasers and portable
electronics et al, rely on the carbon-based materials which could supply energy continuously.
Thereafter, carbons have been studied in a wide range of fields. For example, fullerene-
containing P-type semiconducting polymers are one of the key foundations in rapidly
advancing organic photovoltaics.[28][29] CNT and graphenes are emerging as next
generation of typically transparent electronically conductive films for solar cells.[30][31]
Other carbon-based materials such as active carbons and porous carbons also show great
promise in the applications such as batteries, supercapacitors, and fuel cells.[32][33][34][35]
1.4.1 Carbon Materials for Lithium-Ion Batteries
Device V rated C (F) R (mOhm) RC(s) Wkg-1 (a)
Wkg-1 (b) (95% ) Wkg-1 match. imped Wgt.(kg) Vol.lit
Maxwell (c) 2.7 2855 0.375 1.08 4.2 994 8836 0.55 0.414
Maxwell 2.7 605 0.9 0.55 2.35 1139 9597 0.2 0.211
ApowerCap (d) 2.7 55 4 0.22 5.5 5695 50625 0.009 -
ApowerCap (d) 2.7 450 1.4 0.58 5.89 2569 24595 0.057 0.045
Ness 2.7 1800 0.55 1 3.6 975 8674 0.38 0.277
Ness 2.7 3640 0.3 1.1 4.2 928 8010 0.65 0.514
Ness (cyl.) 2.7 3160 0.4 1.26 4.4 982 8728 0.522 0.38
Carbon Tech 2.85 1600 1 1.6 5.8 1026 91-6 0.223 0.151
Non-acetonirile Asahi
Glass(propylene carbonate)2.7 1375 2.5 3.4 4.9 390 3471 0.21 0.245
Panasonic (propylene carbonate) 2.5 1200 1 1.2 2.3 514 4596 0.34 0.48
EPCOS 2.7 3400 0.45 1.5 4.3 760 6750 0.6 0.47
LS Cable 2.8 3200 0.25 0.8 3.7 1400 12400 0.63 0.572
BatScap 2.7 2680 0.2 0.54 4.2 2050 18225 0.5 0.151
Power Sys. (activated carbon,
propylene carbonate) (d)2.7 1350 1.5 2 4.9 650 5785 0.21 0.15
Power Sys. (graphitic carbon,
propylene caronate) (d)3.3 1800 3 5.4 8 486 4320 0.21 0.15
Fuji Heavy Industry-hybrid
(AC/Graphitic carbon) (d)3.8 1800 1.5 2.6 9.2 1025 10375 0.232 0.143
JSR Micro (AC/graphitic carbon)
(d)3.8 1000 4 4 11.2 900 7987 0.113 0.073

19
Since the elements of electrochemical intercalation into carbons and graphites was
established by Besenhard[36] and used in a rechargeable cell by Basu[37], and later
combined with the cathode materials developed by Goodenough et al[38], for the first time,
the energy storage capability of a rechargeable system approached that of the primary battery
system.[39] Carbon, thereafter, becomes the preferred anode materials for LIB due to its
relatively high capacity, good cyclability and low redox potential versus lithium metal.
Intercalation/deintercalation of Li+ in and out of the carbon upon charge/discharge forms the
basis of carbon as the anode of the battery. To date, graphite is the most commonly used form
of carbon towards the application of LIB anode materials. Thermodynamically, the
equilibrium saturation concentration of graphite is LiC6, corresponding to a theoretical
capacity of 372 mAh g-1
.[40] Assuming the cathode capacity to be 140-200 mAh g-1
, the total
cell capacity is saturated when the anode capacity reaches 1000-1200 mAh g-1
, and such
value can be a target capacity for the anodes from a practical point of view. Therefore, more
and more types of carbon have been developed towards a higher capacitance and better
stability.
Lithium-Ion Batteries with Graphite Electrodes Graphite has been long attractive as
LIB anode materials because of its high in-plane electron conductivity owing to the π-bond
and weak interaction with Li ions, giving rise to high Li ion storage capacity and fast Li ion
diffusion. There are also other models to explain the energy storage mechanism, like storage
in cavities or nanopores, or the house-of-cards model, et al.[41][42][43] However, the
intercalation capacity of Li ions is still limited at 372 mAh g-1
, leading to great efforts to
increase this capacity by adjusting carbon structures, expanding lattice spaces, making
hierarchical pores and developing more functional surface areas.[41][44][45]
Lithium-Ion Batteries with Carbon Nanotube Electrodes Since the discovery of
carbon nanotube[46][47], this material draws much attention due to its novel properties of

20
high electrical conductivity (105 Sm
-1 to 10
6 Sm
-1), high tensile strength up to 60GPa, high
charge transport capability, relatively high specific surface area and high electrolyte
accessibility.[40][48][49][50] For anode material, it is usually assumed that Li+ can be stored
in the central core, the interlayer space for multi-wall CNT (MWCNT), or the empty space
between the nanotubes when assembled into bundles. Reversible Li+ intercalation capacities
of as high as 400 mAh g-1
for MWCNTs and 520 mAh g-1
for single-wall carbon nanotube
(SWCNT) have been reported.[51][52] However, the improved capacitance of CNT is still
quite limited compared with traditional graphite. Consequently, much effort has been
dedicated to design and modify the chemical or physical properties of CNT, like introducing
sidewall defects, chemical etching, ball-milling, changing CNT diameters, varying CNT
lengths and so on.[52] Although the varieties introduced to CNT could usually lead to a
higher capacitance, more serious side reaction and unwanted solid-electrolyte interface (SEI)
formation till limits the practical application of CNT. To overcome this natural shortcoming,
fabricating composite materials of CNT with other materials shows as a promising resolution,
but how to combine hybrid materials together to obtain safe, stable, and high-capacity
electrodes has always been the radical problem that many researchers are trying to solve.
1.4.2 Carbon Materials for Supercapacitors
Supercapacitors are electrochemical energy storage devices that combine the high
energy-storage capability of conventional batteries with the high power-delivery capability of
conventional capacitors. Supercapacitors have been utilized in a wide range of applications,
such as power assists for hybrid electric vehicles, peak power during acceleration and hill-
climbing, and catapults for airplane.[53] To date, for supercapacitors, there are mainly three
types of electrode materials which consist of carbons[54], transition metal oxides,[55] and
electro-active polymers.[56] The latter two cases rely on the redox reaction and are usually
called “pesudocapacitors”, whereas the carbon-based capacitors are based on electro-double

21
layer capacitance. Generally, pseudo-capacitors has a higher capacitance than EDLC, for
example, V2O5 has a high theoretical capacity as high as 590 mAh g-1
,[57] and recent work
shows that the capacity of composite V2O5 /CNT thin film could reach as high as 680 mAh g-
1.[58] Other candidates like Nb2O5, MnO2, polypyrrole, polyaniline et al, also show good
performance both in aqueous and organic electrolyte system.[40] However, the pseudo-
capacitance rising from chemical reaction always suffers from capacitance decay, poor
conductivity and structure instability. Therefore, carbon materials, with super conductivity,
thermal stability in large temperature ranges, chemical stability in acid/basic electrolytes,
excellent rate and cycling performance, holds great promise in this field. Diverse kinds of
carbon materials have been developed and the exploration is still going on. Up to now, the
most widely studied carbon forms include graphene, CNT, active carbons, template porous
carbons, biomass-derived carbons, carbon onions, graphene ribbons, heteroatom-doped
carbons and so on.
Supercapacitors with Graphene Electrodes Since the mechanism of EDLC rely on the
electrolyte ion accumulation on material surface, a high accessible surface area and facilitated
pore penetrability is desired. From this point of view, graphene has the natural two
dimensional structures (see Figure 1.8),[59] large surface area (theoretical surface area of
2630 m2 g
-1), high theoretical gravimetric capacitance of about 550 F g
-1, superior
conductivity, and well exposed surface to electrolyte, which makes it to become quite popular
in the field of supercapacitors. However, due to the strong π-π interaction between graphene
sheets, the graphene flakes tend to restack to form graphite-like powders or films, which can
severely decrease the accessible surface area and reduce the ion diffusion rate, resulting in
unsatisfactory gravimetric capacitances (typically <180 F g-1
in organic electrolytes) and
relatively low charge/discharge rates.[60][61] Recent report on holey graphene gels showed a
breakthrough towards this long-held problem, in which the free-standing frameworks

22
structure was maintained and kept moist by electrolyte. The capacitance of this kind of
structure in aqueous system reaches 310 F g-1
and 298 F g-1
in organic system, which is by far
the highest capacitance obtained of EDLC in organic system.
Figure 1.8, Scheme of chemical route to the synthesis of chemically derived graphene [59]
Supercapacitors with Carbon Nanotube Electrodes Owning to their high electrical
conductivity, high charge transport capability, high mesoporosity, and high electrolyte
accessibility, CNTs are attractive electrode materials for developing high-performance
supercapacitors.[62][63] Since the surface area of most CNT (both MWCNT and SWCNT) is
not high, and EDLC relies on the accessible surface area that could store the electrolyte ions,
researchers have developed CNTs with different diameters, lengths, synthesis routes, and also
with various chemical modifications and functional groups.[64][65] It is reported that the
CNT electrodes after ammonia plasma treatment could reach a capacitance to 207.3 F g-1
from 38.7 F g-1
of the pristine ones.[64]

23
Figure 1.9, SWNT forest grown with water-assisted CVD. (A) Picture of a 2.5-mm-tall SWNT forest
on a 7-mm by 7-mm silicon wafer. A matchstick on the left and ruler with millimeter markings on the
right is for size reference. (B) Scanning electron microscopy (SEM) image of the same SWNT forest.
Scale bar, 1 mm. (C) SEM image of the SWNT forest ledge. Scale bar, 1 mm. (D)Low-resolution
TEM image of the nanotubes. Scale bar, 100 nm. (E) High-resolution TEM image of the SWNTs.
Scale bar, 5 nm. [66]
Recent work also demonstrated the advantageous performance of Vertically-aligned
CNT (VACNT) compared with their randomly entangled counterparts. The unique structure
of VACNT is as shown in Figure 1.8.[66] It is assumed that the VACNT not only provide a
more electrolyte-accessible surface, but also improve the charge storage/delivery properties
as each of the constituent aligned tubes can be connected directly onto a common electrode to
allow them to effectively participate. Moreover, the top end-caps of VACNT can be properly
opened under appropriate conditions (e.g., by plasma etching). The end-cap-opening then
allows the electrolyte access to the inner cavity of the VACNTs, resulting in an enhanced
overall surface area (both internal and external walls of tubes) for charge storage on
VACNTs.[40] Recent research has demonstrated the superior performance of VACNT, in

24
which a high capacitance of 365 F g-1
was obtained in 1M H2SO4 via a template-assisted
CVD method. [67]
Supercapacitors with High-surface-area Activated Carbon Electrodes Different from
the well-ordered graphitic carbon mentioned above, the structure of activated carbon (AC) is
usually less ordered due to their poor-crystallized carbonaceous precursors (e.g. biomass,
polymers et al) and hash synthesis routes by physical/chemical activation. Physical activation
refers to the treatment of carbon precursor at elevated temperatures (up to 1200 ℃) in the
presence of an oxidizing gas, such as steam, air and CO2. Chemical activation is usually
carried out at relatively low temperatures (from 400 ℃to 900 ℃) with an activating agent
like potassium hydroxide, sodium hydroxide and zinc chloride. Although the activation
process lead to corrosion to carbon structure, the internal compact carbon matrix will be
opened up and the surface area will increase dramatically. Therefore, the overall capacitance
of activated carbon is usually comparable or even better compared with those of graphene
and CNTs. Diverse forms of activated carbons have been developed by researchers, such as
biomass-derived carbons, carbide-derived carbons (CDC), heteroatom-doped carbons,
templated carbons and so on. The capacitive behavior was also studied both in aqueous (acid
and basic) and organic system. It is reported that a 3D interconnected microporous carbon
network synthesized by a single step pyrolysis of poly(acrylamide-co-acrylicacid) potassium
salt ([CHCO2RCH]m[CHCONH2]n) where R=K or H, has a high capacitance of 254 F g-1
in
1M H2O4 and 138 F g-1
in 1M LiPF6 in EC-DMC.[68] Reports on heteroatom-doped carbon
also show great potential in the functionalization and modification of carbon materials for
supercapacitors. Nitrogen, sulfur, phosphate, boron and their functional groups are
successively introduced to the carbon surface, leading to a series of changes of carbon
properties, such as enhanced conductivity, improved electrochemical stability, better
wettability with electrolyte, extra pesudocapacitance and so on.[69]

25
1.5 Design Criteria of Carbon for Electrochemical Energy
Storage
In summary, no matter for batteries or supercapacitors, to realize high energy density
and power density, sufficient number of ions and electrons need to be effectively stored and
rapidly shuttled between cathode and anode. To obtain long cycling life, the electrodes and
device structure must keep stable during charge/discharge cycling. These principles imply
that high-performance electrodes and devices should meet the following criteria:
1) Effective electrochemical-active interface between electrode and electrolyte.
2) Efficient ion-electron transportation pathway.
3) Mechanically robust and chemically stable electrode architecture.
To achieve the criteria mentioned above, the design of high-performance carbons is
supposed to follow these directions:
1) Well-defined carbon structure and pore configuration.
To achieve a high energy density, LIB requires the carbon to efficiently intercalate
Li+ and EDLC requests the carbon surface to accumulate as much electrolyte ions as possible,
thus a large surface area and approachable surface/bulk interiors is desired when designing
and synthesizing carbons. From another aspect, to obtain a high power density, the carbons
are demanded to transport ions (both Li+ and other electrolyte ions used in EDLC) and
electrons efficiently. Therefore, a good conductive framework including interconnected pores
and appropriate pore size are desired.
2) Electrochemically active and stable interface chemistry.
All the chemical reactions take place at the interface, and electrochemical reaction is
not excluded. Hence, foremost, the carbons should be well approached and infiltrative by
electrolyte. The hydrophobic/hydrophilic properties are influenced by the carbon materials
26
nature, carbon surface functionalities, and carbon surface charge properties. Moreover,
during the electrochemical charging/discharging process, carbon should be
chemically/mechanically stable in electrolyte in the given electronic conditions. The carbon
with less/no side reactions, tolerant voltage/current ranges, and robust frameworks are desired
to achieve this goal.
1.6 Thesis Objective and Research Scope
The objective of my dissertation is to address the limitation of current carbon
materials for energy storage (especially for EDLC) by rational structure design according to
the above principles and criteria. The ultimate goal of this research is to develop high energy,
high power, low cost and long life electrochemical devices for various applications, including
portable electronics, EVs and grid-scale energy storage. To achieve this goal, my research
strategy is to fundamentally understand the operational mechanism of carbon as energy
storage materials and address its limitations by creating a new family of high-performance
carbon structures with desired properties. Generally, my dissertation is dedicated to the
following aspects:
1) Fundamentally understand and explore the mechanism/behavior of materials under
electrochemical energy storage process.
2) Fundamentally and technically find the bottlenecks of current carbon materials for
energy storage.
3) Design and implement of novel synthetic method to obtain new class of carbon
materials aiming at its current limitations.
4) Fabrication and integration of carbon materials into electrochemical devices and
examine their performance to further guide the materials design.

27
Reference
[1] Bible Gateway passage: Genesis 1 - New King James Version, Bible Gateway. (n.d.).
https://www.biblegateway.com/passage/?search=Genesis+1&version=NKJV (accessed May
14, 2015).
[2] BP Energy Outlook 2035, (n.d.).
[3] Fossil fuel, Wikipedia, the Free Encyclopedia. (2015).
http://en.wikipedia.org/w/index.php?title=Fossil_fuel&oldid=662139122 (accessed May 14,
2015).
[4] Annual Energy Outlook 2015 with projections to 2040, (n.d.).
[5] Alternative energy, Wikipedia, the Free Encyclopedia. (2015).
http://en.wikipedia.org/w/index.php?title=Alternative_energy&oldid=661616541 (accessed
May 14, 2015).
[6] Disadvantages Of Geothermal Energy, Conserve-Energy-Future. (n.d.).
http://www.conserve-energy-future.com/Disadvantages_GeothermalEnergy.php (accessed
May 14, 2015).
[7] N. Sriram, M. Shahidehpour, Renewable biomass energy, in: IEEE Power
Engineering Society General Meeting, 2005, 2005: pp. 612–617 Vol. 1.
doi:10.1109/PES.2005.1489459.
[8] Advantages and Disadvantages Of Biomass Energy, Conserve-Energy-Future. (n.d.).
http://www.conserve-energy-future.com/Advantages_Disadvantages_BiomassEnergy.php
(accessed May 14, 2015).

28
[9] Energy storage, Wikipedia, the Free Encyclopedia. (2015).
http://en.wikipedia.org/w/index.php?title=Energy_storage&oldid=658821780 (accessed May
18, 2015).
[10] D.O. Akinyele, R.K. Rayudu, Review of energy storage technologies for sustainable
power networks, Sustainable Energy Technologies and Assessments. 8 (2014) 74–91.
doi:10.1016/j.seta.2014.07.004.
[11] P. Vadasz, Compressed air energy storage, Energy Storage Systems. I (n.d.).
[12] S. McWhorter, K. O’Malley, J. Adams, G. Ordaz, K. Randolph, N.T. Stetson,
Moderate Temperature Dense Phase Hydrogen Storage Materials within the US Department
of Energy (DOE) H2 Storage Program: Trends toward Future Development, Crystals. 2
(2012) 413–445. doi:10.3390/cryst2020413.
[13] D.J. Durbin, C. Malardier-Jugroot, Review of hydrogen storage techniques
for on board vehicle applications, International Journal of Hydrogen Energy. 38 (2013)
14595–14617. doi:10.1016/j.ijhydene.2013.07.058.
[14] P. Simon, Y. Gogotsi, Materials for electrochemical capacitors, Nat Mater. 7 (2008)
845–854. doi:10.1038/nmat2297.
[15] John R. Miller, Andrew F. Burke, Electrochemical Capacitors: Challenges and
Opportunities for Real-World Applications, The Electrochemical Society Interface. 17 (2008)
53.
[16] Rechargeable battery, Wikipedia, the Free Encyclopedia. (2015).
http://en.wikipedia.org/w/index.php?title=Rechargeable_battery&oldid=661271384
(accessed May 19, 2015).

29
[17] S. Goriparti, E. Miele, F. De Angelis, E. Di Fabrizio, R. Proietti Zaccaria, C. Capiglia,
Review on recent progress of nanostructured anode materials for Li-ion batteries, Journal of
Power Sources. 257 (2014) 421–443. doi:10.1016/j.jpowsour.2013.11.103.
[18] J.B. Goodenough, Y. Kim, Challenges for Rechargeable Li Batteries, Chem. Mater.
22 (2010) 587–603. doi:10.1021/cm901452z.
[19] Chinese Industry Insight, 2012-2016 Report of Market Situation and Investment Risk
Evaluation of Lithium Anode Materials in China, (2012).
[20] F. Béguin, V. Presser, A. Balducci, E. Frackowiak, Supercapacitors: Carbons and
Electrolytes for Advanced Supercapacitors (Adv. Mater. 14/2014), Adv. Mater. 26 (2014)
2283–2283. doi:10.1002/adma.201470093.
[21] M. Ue, Double-Layer Capacitors, in: H. Ohno (Ed.), Electrochemical Aspects of Ionic
Liquids, John Wiley & Sons, Inc., 2011: pp. 243–269.
http://onlinelibrary.wiley.com/doi/10.1002/9781118003350.ch17/summary (accessed May 20,
2015).
[22] J. Chmiola, G. Yushin, Y. Gogotsi, C. Portet, P. Simon, P.L. Taberna, Anomalous
Increase in Carbon Capacitance at Pore Sizes Less Than 1 Nanometer, Science. 313 (2006)
1760–1763. doi:10.1126/science.1132195.
[23] J. Huang, B.G. Sumpter, V. Meunier, A Universal Model for Nanoporous Carbon
Supercapacitors Applicable to Diverse Pore Regimes, Carbon Materials, and Electrolytes,
Chem. Eur. J. 14 (2008) 6614–6626. doi:10.1002/chem.200800639.
[24] R. Kötz, M. Carlen, Principles and applications of electrochemical capacitors,
Electrochimica Acta. 45 (2000) 2483–2498. doi:10.1016/S0013-4686(00)00354-6.

30
[25] A. Burke, M. Miller, The power capability of ultracapacitors and lithium batteries for
electric and hybrid vehicle applications, Journal of Power Sources. 196 (2011) 514–522.
doi:10.1016/j.jpowsour.2010.06.092.
[26] L.L. Zhang, X.S. Zhao, Carbon-based materials as supercapacitor electrodes, Chem.
Soc. Rev. 38 (2009) 2520–2531. doi:10.1039/B813846J.
[27] E. Frackowiak, Carbon materials for supercapacitor application, Phys. Chem. Chem.
Phys. 9 (2007) 1774–1785. doi:10.1039/B618139M.
[28] B.C. Thompson, J.M.J. Fréchet, Polymer–Fullerene Composite Solar Cells,
Angewandte Chemie International Edition. 47 (2008) 58–77. doi:10.1002/anie.200702506.
[29] S.H. Park, A. Roy, S. Beaupré, S. Cho, N. Coates, J.S. Moon, et al., Bulk
heterojunction solar cells with internal quantum efficiency approaching 100%, Nat Photon. 3
(2009) 297–302. doi:10.1038/nphoton.2009.69.
[30] D.S. Hecht, L. Hu, G. Irvin, Emerging Transparent Electrodes Based on Thin Films of
Carbon Nanotubes, Graphene, and Metallic Nanostructures, Adv. Mater. 23 (2011) 1482–
1513. doi:10.1002/adma.201003188.
[31] Y.-K. Kim, D.-H. Min, Durable Large-Area Thin Films of Graphene/Carbon
Nanotube Double Layers as a Transparent Electrode, Langmuir. 25 (2009) 11302–11306.
doi:10.1021/la9029744.
[32] Y. Sun, Q. Wu, G. Shi, Graphene based new energy materials, Energy Environ. Sci. 4
(2011) 1113–1132. doi:10.1039/C0EE00683A.
[33] L.L. Zhang, R. Zhou, X.S. Zhao, Graphene-based materials as supercapacitor
electrodes, J. Mater. Chem. 20 (2010) 5983–5992. doi:10.1039/C000417K.
31
[34] B.J. Landi, M.J. Ganter, C.D. Cress, R.A. DiLeo, R.P. Raffaelle, Carbon nanotubes
for lithium ion batteries, Energy Environ. Sci. 2 (2009) 638–654. doi:10.1039/B904116H.
[35] S. Giddey, S.P.S. Badwal, A. Kulkarni, C. Munnings, A comprehensive review of
direct carbon fuel cell technology, Progress in Energy and Combustion Science. 38 (2012)
360–399. doi:10.1016/j.pecs.2012.01.003.
[36] J.O. Besenhard, H.P. Fritz, Cathodic reduction of graphite in organic solutions of
alkali and NR4+ salts, Journal of Electroanalytical Chemistry and Interfacial
Electrochemistry. 53 (1974) 329–333. doi:10.1016/S0022-0728(74)80146-4.
[37] S. Basu, Ambient temperature rechargeable battery, US4423125 A, 1983.
http://www.google.com/patents/US4423125 (accessed May 26, 2015).
[38] K. Mizushima, P.C. Jones, P.J. Wiseman, J.B. Goodenough, LixCoO2 (0<x<-1): A
new cathode material for batteries of high energy density, Materials Research Bulletin. 15
(1980) 783–789. doi:10.1016/0025-5408(80)90012-4.
[39] R.J. Brodd, K.R. Bullock, R.A. Leising, R.L. Middaugh, J.R. Miller, E. Takeuchi,
Batteries, 1977 to 2002, J. Electrochem. Soc. 151 (2004) K1–K11. doi:10.1149/1.1641042.
[40] L. Dai, D.W. Chang, J.-B. Baek, W. Lu, Carbon Nanomaterials for Advanced Energy
Conversion and Storage, Small. 8 (2012) 1130–1166. doi:10.1002/smll.201101594.
[41] T. Zheng, J.N. Reimers, J.R. Dahn, Effect of turbostratic disorder in graphitic carbon
hosts on the intercalation of lithium, Phys. Rev. B. 51 (1995) 734–741.
doi:10.1103/PhysRevB.51.734.

32
[42] T. Zheng, Y. Liu, E.W. Fuller, S. Tseng, U. von Sacken, J.R. Dahn, Lithium Insertion
in High Capacity Carbonaceous Materials, J. Electrochem. Soc. 142 (1995) 2581–2590.
doi:10.1149/1.2050057.
[43] J.R. Dahn, T. Zheng, Y. Liu, J.S. Xue, Mechanisms for Lithium Insertion in
Carbonaceous Materials, Science. 270 (1995) 590–593. doi:10.1126/science.270.5236.590.
[44] K. Sato, M. Noguchi, A. Demachi, N. Oki, M. Endo, A Mechanism of Lithium
Storage in Disordered Carbons, Science. 264 (1994) 556–558.
doi:10.1126/science.264.5158.556.
[45] K. Fukuda, K. Kikuya, K. Isono, M. Yoshio, Foliated natural graphite as the anode
material for rechargeable lithium-ion cells, Journal of Power Sources. 69 (1997) 165–168.
doi:10.1016/S0378-7753(97)02568-8.
[46] S. Iijima, T. Ichihashi, Single-shell carbon nanotubes of 1-nm diameter, Nature. 363
(1993) 603–605. doi:10.1038/363603a0.
[47] S. Iijima, Helical microtubules of graphitic carbon, Nature. 354 (1991) 56–58.
doi:10.1038/354056a0.
[48] M.-F. Yu, O. Lourie, M.J. Dyer, K. Moloni, T.F. Kelly, R.S. Ruoff, Strength and
Breaking Mechanism of Multiwalled Carbon Nanotubes Under Tensile Load, Science. 287
(2000) 637–640. doi:10.1126/science.287.5453.637.
[49] Y. Ando, X. Zhao, H. Shimoyama, G. Sakai, K. Kaneto, Physical properties of
multiwalled carbon nanotubes, International Journal of Inorganic Materials. 1 (1999) 77–82.
doi:10.1016/S1463-0176(99)00012-5.

33
[50] A. Thess, R. Lee, P. Nikolaev, H. Dai, P. Petit, J. Robert, et al., Crystalline Ropes of
Metallic Carbon Nanotubes, Science. 273 (1996) 483–487.
doi:10.1126/science.273.5274.483.
[51] B.J. Landi, M.J. Ganter, C.M. Schauerman, C.D. Cress, R.P. Raffaelle, Lithium Ion
Capacity of Single Wall Carbon Nanotube Paper Electrodes, J. Phys. Chem. C. 112 (2008)
7509–7515. doi:10.1021/jp710921k.
[52] Y. Wu, J. Wang, K. Jiang, S. Fan, Applications of carbon nanotubes in high
performance lithium ion batteries, Front. Phys. 9 (2013) 351–369. doi:10.1007/s11467-013-
0308-x.
[53] M. Ehsani, Y. Gao, A. Emadi, Modern Electric, Hybrid Electric, and Fuel Cell
Vehicles: Fundamentals, Theory, and Design, Second Edition, CRC Press, 2009.
[54] A. Ghosh, Y.H. Lee, Carbon-Based Electrochemical Capacitors, ChemSusChem. 5
(2012) 480–499. doi:10.1002/cssc.201100645.
[55] J.P. Zheng, P.J. Cygan, T.R. Jow, Hydrous Ruthenium Oxide as an Electrode Material
for Electrochemical Capacitors, J. Electrochem. Soc. 142 (1995) 2699–2703.
doi:10.1149/1.2050077.
[56] A. Rudge, J. Davey, I. Raistrick, S. Gottesfeld, J.P. Ferraris, Conducting polymers as
active materials in electrochemical capacitors, Journal of Power Sources. 47 (1994) 89–107.
doi:10.1016/0378-7753(94)80053-7.
[57] D.B. Le, S. Passerini, J. Guo, J. Ressler, B.B. Owens, W.H. Smyrl, High Surface Area
V 2 O 5 Aerogel Intercalation Electrodes, J. Electrochem. Soc. 143 (1996) 2099–2104.
doi:10.1149/1.1836965.

34
[58] I.-H. Kim, J.-H. Kim, B.-W. Cho, Y.-H. Lee, K.-B. Kim, Synthesis and
Electrochemical Characterization of Vanadium Oxide on Carbon Nanotube Film Substrate
for Pseudocapacitor Applications, J. Electrochem. Soc. 153 (2006) A989–A996.
doi:10.1149/1.2188307.
[59] L.L. Zhang, Z. Lei, J. Zhang, X. Tian, X.S. Zhao, Supercapacitors: Electrode
Materials Aspects, in: Encyclopedia of Inorganic Chemistry, John Wiley & Sons, Ltd, 2006.
http://onlinelibrary.wiley.com/doi/10.1002/0470862106.ia816/abstract (accessed November
20, 2015).
[60] Y. Zhu, S. Murali, W. Cai, X. Li, J.W. Suk, J.R. Potts, et al., Graphene and Graphene
Oxide: Synthesis, Properties, and Applications, Adv. Mater. 22 (2010) 3906–3924.
doi:10.1002/adma.201001068.
[61] C. Liu, Z. Yu, D. Neff, A. Zhamu, B.Z. Jang, Graphene-Based Supercapacitor with an
Ultrahigh Energy Density, Nano Lett. 10 (2010) 4863–4868. doi:10.1021/nl102661q.
[62] W. Lu, L. Qu, K. Henry, L. Dai, High performance electrochemical capacitors from
aligned carbon nanotube electrodes and ionic liquid electrolytes, Journal of Power Sources.
189 (2009) 1270–1277. doi:10.1016/j.jpowsour.2009.01.009.
[63] R.H. Baughman, A.A. Zakhidov, W.A. de Heer, Carbon Nanotubes--the Route
Toward Applications, Science. 297 (2002) 787–792. doi:10.1126/science.1060928.
[64] B.-J. Yoon, S.-H. Jeong, K.-H. Lee, H. Seok Kim, C. Gyung Park, J. Hun Han,
Electrical properties of electrical double layer capacitors with integrated carbon nanotube
electrodes, Chemical Physics Letters. 388 (2004) 170–174. doi:10.1016/j.cplett.2004.02.071.

35
[65] E. Frackowiak, F. Béguin, Carbon materials for the electrochemical storage of energy
in capacitors, Carbon. 39 (2001) 937–950. doi:10.1016/S0008-6223(00)00183-4.
[66] K. Hata, D.N. Futaba, K. Mizuno, T. Namai, M. Yumura, S. Iijima, Water-Assisted
Highly Efficient Synthesis of Impurity-Free Single-Walled Carbon Nanotubes, Science. 306
(2004) 1362–1364. doi:10.1126/science.1104962.
[67] Q.-L. Chen, K.-H. Xue, W. Shen, F.-F. Tao, S.-Y. Yin, W. Xu, Fabrication and
electrochemical properties of carbon nanotube array electrode for supercapacitors,
Electrochimica Acta. 49 (2004) 4157–4161. doi:10.1016/j.electacta.2004.04.010.
[68] D. Puthusseri, V. Aravindan, S. Madhavi, S. Ogale, 3D micro-porous conducting
carbon beehive by single step polymer carbonization for high performance supercapacitors:
the magic of in situ porogen formation, Energy Environ. Sci. 7 (2014) 728–735.
doi:10.1039/C3EE42551G.
[69] J.P. Paraknowitsch, A. Thomas, Doping carbons beyond nitrogen: an overview of
advanced heteroatom doped carbons with boron, sulphur and phosphorus for energy
applications, Energy Environ. Sci. 6 (2013) 2839–2855. doi:10.1039/C3EE41444B.
36
Chapter 2: High-voltage Symmetric Carbon
Supercapacitors in Aqueous Electrolyte
2.1 Introduction
Supercapacitors, served as intermediates between conventional dielectric capacitors
and batteries, offer a promising alternative approach to meet the increasing demands of
energy storage systems such as portable electronic devices and automotive vehicles.[1][2][3]
Among the various materials adopted in supercapacitor, carbon shows a particularly
promising prospect due to its low cost, high conductivity, robust mechanical behavior, and
excellent stability in different temperatures and electrolytes. Carbon based supercapacitors
have demonstrated higher power density and super long cycling life (over 10, 000 W kg-1
for
over 10, 000 cycles) than most batteries (below 1000 W kg-1
under 1000 cycles).[4]
However, their lower energy density (5 W h kg-1
for commercial supercapacitors) remains far
not satisfied than Lithium-ion batteries (70-100 W h kg-1
).[5] Therefore, intensive efforts
have been dedicated to increase the energy density of carbon based supercapacitors without
sacrificing its high power density and stable long cycling life.[6][7][8]
According to the formula estimating the energy density of supercapacitor (E=CsV2/2),
it is apparent that two directions can be considered to enhance the energy density, namely
increasing the specific capacitance (Cs) and enlarging the cell working voltage (V). Due to
the square term of V, it is more efficient to extend working voltage to achieve a higher
energy density. Consequently, extensive research aims at enlarging the operating voltage of
sueprcapacitors.[9][10][11][12] Basically, V is limited by the matching between
electrochemical potentials of electrodes and the stable voltage window of electrolytes.[13]
From this point of view, the organic electrolytes usually yield a wider operating potential

37
window (2.5V-2.7V) than aqueous electrolyte (less than 1.0V).[9] However, nonaqueous
electrolytes generally give rise to a series of shortcomings, such as low conductivity,
environmental unfriendliness, unsatisfied security issue, high cost in materials and production,
and complicated manufacturing condition like moisture isolated building atmosphere.[9][10]
Accordingly, from the practically industrial vison, aqueous electrolyte system is assumed to
be more acceptable and applicable.
Currently used aqueous electrolytes mainly include acid (H2SO4, H3PO4, et al), basic
(KOH, NaOH, et al) and neutral solutions (Li2SO4, Na2SO4, et al). According to the Nernst
equation, the thermodynamic limits for di-oxygen and di-hydrogen evolution at the positive
and negative electrodes are pH dependent and given simplified by the equations Eox=1.23-
0.059pH and Ered=-0.059 pH vs SHE, respectively.[14] In other words, either over-low or
over-high pH values will lead to a more narrow working voltage window, which explains
why the working voltages of acid and basic electrolyte are usually less than 1V.[15][16] By
contrast, recent reports find that salt aqueous electrolyte exhibits excellent stability under
high galvanostatic charging/discharging voltage up to 1.6V-1.9V, which demonstrate the
potential of carbon materials for developing a high-voltage, long-cyclability system with
neutral aqueous electrolyte. Thereafter, different kinds of carbon have been studied towards
the application in high-voltage symmetric capacitors, such as commercial activated carbon
and carbon nanotube (CNT).[10][11][17] Whereas, the capacitance of neither commercial
activated carbon nor CNT is not satisfied due to their low surface, ununiformed pore size
distribution and non-stable carbon structures. Therefore, how to develop a carbon with well-
defined structure, controllable pore structure, remains a challenging issue.
2.2 Results and Discussion
Here, we develop a new class of nanoporous carbons towards the application of high-
voltage symmetric supercapacitors used in aqueous Li2SO4 electrolyte. As shown in Figure

38
2.1 A, a unique precursor called diphenylsilanediol (DPSD) was adopted to prepare the
porous carbon. One DPSD molecule consists of two benzene rings and two hydroxyl groups,
centered with a silicon atom. After polymerization with assistance of HCl and carbonization
under high temperature, DPSD will polymerize into a consistent interlinked benzene rings
with embedded ultrafine silica nanoparticles, leading to a high char yielding and robust
carbon framework. Due to the atomically integrated organic and inorganic components
distributed in the carbon-silica matrix, uniformly sized nanopores can be generated after
removing the silica moiety by hydrofluoric acid (HF). Finally, the as-prepared nanoporous
carbon (devoted as NC) were activated by potassium hydroxide (KOH) and followed by
HNO3 washing, with a synchronous introduction of oxygen-enriched functionalities onto
carbon surface. The porosity and oxygen content of the resulting oxygen-enriched
nanoporous carbon (ANC) are controlled by the mass of KOH to NC during activation (see
details in the experimental section). ANC prepared with different KOH/carbon ratios (1:1 and
3:1) are denoted as ANC-1 and ANC-2, respectively. The obtained ANC effectively increases
the capacitance of the nanoporous carbon and shows a stable electrochemical performance in
aqueous Li2SO4 electrolyte up to 1.6V.

39
The nitrogen-sorption isotherms and pore size distributions of NC and ANC are
illustrated in Figure 2.1 B and C. Before activation, the Brunauer-Emmett-Teller (BET)
surface area of NC is only 440 m2 g
-1 and the pore size is less than 1nm. During reaction with
KOH, it is suggested that the activation of carbon with KOH proceeds as 6KOH+C--->2K +
3H2 + 2K2CO3,
Figure 2.1. (A) Schematic illustration of the synthesis procedure of oxygen-enriched nanoporous
carbon. TEM images of (B) NC and (C) ANC-2. Insets are the corresponding HRTEM images.
followed by decomposition of K2CO3 and/or reaction of K/K2CO3/CO2 with carbon.[18] The
process will generate nanoscale pores in the product carbon. As shown in Figure 2.1B, the

40
surface areas of ANC-1 and ANC-2 are enlarged to 1076 m2 g
-1 and 2634 m
2 g
-1, respectively,
and the pore size distributions of ANC-1 and ANC-2 are also extended to around 2 to 3nm.
The inner structures of NC and ANC are further revealed by transmission electron
microscope (TEM) images, as shown in Figure 2. 1 D and E. In Figure 2. 1 D, the NC
shows an amorphous and compact network of tiny pores less than 1nm with low visibility
(see the inset High-resolution TEM images, (HRTEM)). By contrast, for product ANC-2, the
worm-like carbon framework is apparently loosened and opened up. The pore size is enlarged
to around 2.5nm, as shown in Figure 2. 1E and its inset.
Figure 2. 2 (A) XRD patterns of NC, ANC-1 and ANC-2. (B) Raman images of NC and ANC-2
respectively.
Figure 2. 2 A shows the powder X-ray diffraction (XRD) images of the as-obtained
carbon samples. For product NC, two slight peaks positioned near 2ϴ values of 26.3o and
44.1o refer to the (002) and (100) plane of graphite, reflecting an incomplete and weak
graphitization in the amorphous carbon.[19] Considering the high content of sp2 carbon in
DPSD polymer, it is suspected that the weak graphitization in NC comes from the long-range
orderly benzene rings rising from the DPSD-derived carbon. After activation, compared with

41
NC, the (002) peak of ANC-2 has a markedly reduced intensity and is dramatically
broadened. A large increase in the low-angle scatter from ANC-2 is also noted, which is
consistent with the presence of a high density of pores. All of these results are consistent with
the observations from HR-TEM, which indicate that the higher porosity induced by chemical
activation interrupted the originally weak graphitization but contribute to a more loose and
open amorphous carbon structure.
Figure 2. 3, XPS C1s spectra of (A) NC, (B) ANC-1 and (C) ANC-2, respectively. XPS O1s spectra
of (D) NC, (E) ANC-1 and (F) ANC-2.
The surface chemistry of the samples before and after the activation is characterized
using X-ray photoelectron spectroscopy (XPS), as shown in Figure 2. 3. The carbon peak of
the non-activated NC (Figure 2. 3A) is deconvolved into 4 constituents located at 284.6,
286.2, 287.9, and 289.0 eV, which are assigned to carbon sp2/sp3, C-O, C=O, and -COO-
bonds, respectively. The atom percent of carbon bonding state is listed in Table 1, which
shows that the C-C occupies a high content of the total material. In contrast to the control,

42
C1s spectra of the ANC-1 and ANC-2 (Figure 2. 3B and Figure 2. 3C) can be deconvolved
into the same peaks; however the percent of C-C bonds decreases to 71.6% and 65.5%
respectively. The decrease in the carbon content illustrates that the activation process
corrodes the carbon and introduces oxygen-containing groups instead. Similarly, the O1s
spectrum of the NC sample in Figure 2. 3E is deconvolved into two constituent peaks
located at 531.0 and 532.4 eV eV, which are assigned to the carbonyl/carboxyl groups and
hydroxyl groups, respectively.[22][23]
In line with the carbon bonding state distribution
mentioned above, the oxygen bonding shows a similar tendency. For ANC-1 and ANC-2
shown in Figure 2. 3F and Figure 2. 3G, the proportion of C-OH peak gradually decrease
whereas the content of C=O peak increase instead, indicating that the activation process will
lead to a higher degree of oxidation and more carbon oxygen double bonds are formed. As
shown in Table 1, for NC before activation, the oxygen atom displayed by hydroxyl groups
takes account for 86.1%. By comparison, the C=O bonding percent increase from 3.2% to
30.7% and 34.4% for ANC-1 and ANC-2.
Table 2.1 Composition and pore properties of F-rich nanoporous carbons.
Sample MC:KOH
w:w
SBET
m2
g-1
at.% of carbon bonding state at.% of oxygen
bonding state
C-C C-O C=O O-C=O C=O OH ads
NC 0 440 77.9 15.1 7.0 3.2 86.1 10.7
ANC-1 1 1076 71.6 18.4 5.0 4.9 30.7 47.7 21.6
ANC-2 3 2634 65.5 18.9 5.5 10.1 34.4 42.1 23.5

43
Figure 2. 4. Under working voltage of 1V, cyclic voltammograms of (A) ANC and (B) ANC-2 at
various scan rates. Galvanostatic charge/discharge curves of (C) NC and (D) ANC-2 at different
current densities.
The electrochemical performance of the ANCs was evaluated in Li2SO4 electrolyte at
both regular voltage and high-voltage window (see the SI for experimental details). Cyclic
voltammetry (CV) and galvanostatic charge/discharge (GCD) curves were used to
characterize the capacitive properties of our carbon materials. Figure 2. 4A shows that the
non-activated sample NC exhibits a distorted and narrow shape at various scan rates ranging
from 5 to 200 mV s-1
at the working voltage window to 1V, which corresponds to a low
capacitance due to its low surface area (440 m2 g
-1) and very small pore size (less than 1nm).
To the contrary, the CV curves of activated sample ANC-2 is distinctly expanded and

44
enlarged under the same testing conditions, as shown in Figure 2. 4B. ANC-2 presents a
typical capacitive behavior with a rectangular-like shape of the voltammetry characteristics,
suggesting an improved capacitance and better ion transportation capability. The GCD test
also shows a clear difference of the charge/discharge behavior for the carbon before and after
activation (Figure 2. 4C and 4D), which is consistent with the CV curves. ANC-2 in Figure
2. 4D exhibits inclining straight lines at different current densities while the curves for NC
(see Figure 2. 4C) is asymmetric and bent. Both the results of CV and GCD analysis reveal
nearly ideal double layer capacitive behavior and excellent rate capability of the ANCs.
Based on the GCD analysis, the specific capacitances of ANCs at different current densities
are summarized and compared in Figure 2. 6A. There is a strong correlation between the
degree of activation and the specific capacitance of the ANCs; namely, ANCs prepared with
higher degree of activation deliver higher electrochemical capacitance. In particular, ANC-1
and NC only show specific capacitances of 53, and 181 F g-1
at a current density of 0.5 A g-1
,
respectively. In contrast, ANC-2 delivers a highest specific capacitance of 241 F g-1
at a
current density of 0.5 A g-1
, and retains a high value of 147 F g-1
when the current density
even increases to 80 A g-1
. Note that for most currently studied oxygen-doped carbons, the
current densities applied during test are usually quite narrowed and limited due to the severe
self-discharge causing by the surface functionalities, which limits the power density of
carbon materials. Here in our work, ANC-2 could remain 61% of the maximum capacitance
even under a quite high current density of 80 A g-1
, which is comparable to the best results
reported until now.
Besides the regular working voltage window of 1V, capacitive performance of ANC-
1 and ANC-2 were also evaluated under high voltage of 1.6V in Li2SO4 electrolyte assessed
with the best-practice symmetric two electrode system. As illustrated in Figure 2. 5A and 5B,
both ANC-1 and ANC-2 show a near-rectangular shape in CV test, which represent favorable
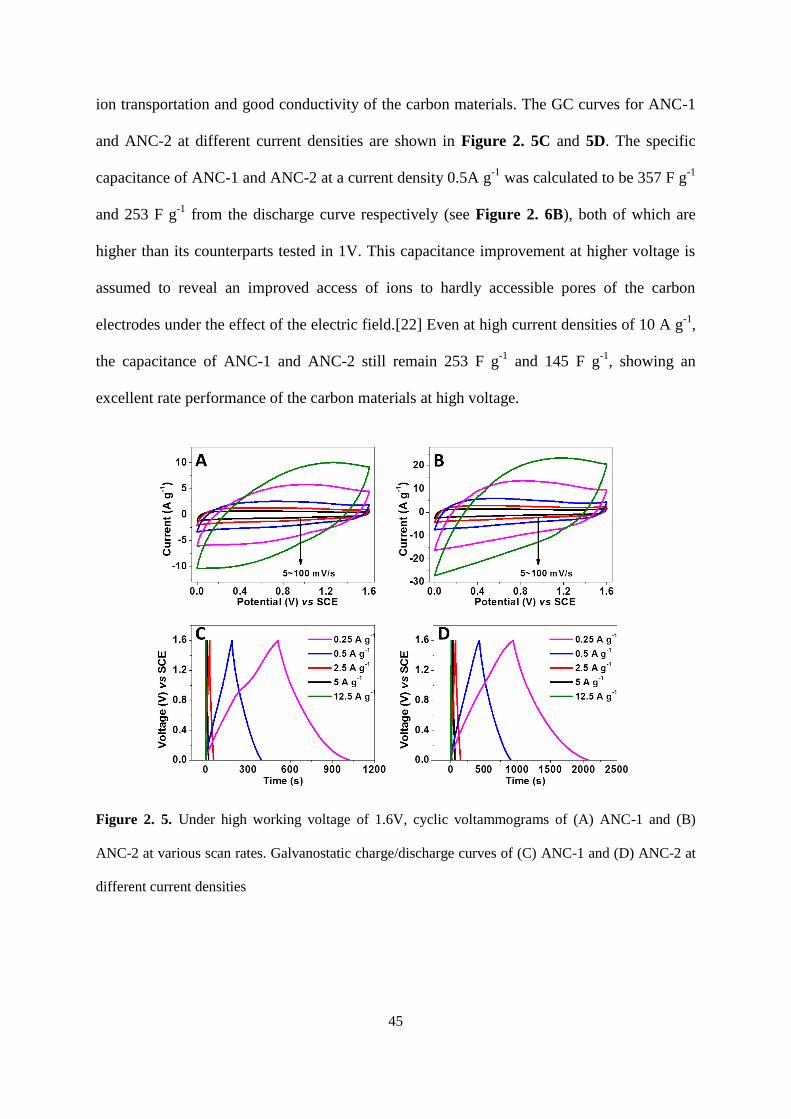
45
ion transportation and good conductivity of the carbon materials. The GC curves for ANC-1
and ANC-2 at different current densities are shown in Figure 2. 5C and 5D. The specific
capacitance of ANC-1 and ANC-2 at a current density 0.5A g-1
was calculated to be 357 F g-1
and 253 F g-1
from the discharge curve respectively (see Figure 2. 6B), both of which are
higher than its counterparts tested in 1V. This capacitance improvement at higher voltage is
assumed to reveal an improved access of ions to hardly accessible pores of the carbon
electrodes under the effect of the electric field.[22] Even at high current densities of 10 A g-1
,
the capacitance of ANC-1 and ANC-2 still remain 253 F g-1
and 145 F g-1
, showing an
excellent rate performance of the carbon materials at high voltage.
Figure 2. 5. Under high working voltage of 1.6V, cyclic voltammograms of (A) ANC-1 and (B)
ANC-2 at various scan rates. Galvanostatic charge/discharge curves of (C) ANC-1 and (D) ANC-2 at
different current densities

46
Figure 2. 6 Relationships of the specific capacitance and current densities of different carbons under
different working voltages of (A) 1V and (B) 1.6V. (C) Nyquist plots of different carbon-based
electrodes; inset shows the plots in high frequency region. (D) Long-term cycling performance of
symmetric supercapacitors based on ANC-2 at 1.6V.
To further study the facilitated ion-transport kinetics of the carbons, electrochemical
impedance spectroscopy (EIS) was tested. The Nyquist plots were obtained in the frequency
range 10MHz to 10 kHz with a two electrode test system, as shown in Figure 2. 6C. The
vertical nature of the Nyquist plosts clearly indicates the capacitive behavior of the carbon
materials. The Nyquist plot expanded in the high frequency region is given in the inset. The
x-intercept of the Nyquist plot in Figure 2. 6C gives the Ohmic resistance of the circuit
which is a combination of the resistance of the electrolyte, internal resistance of the active
materials and the substrate, and the contact resistance at the active material-current collector

47
interface. The intercept values of NC, ANC-1 and ANC-2 are close to zero, illustrating a
superior conductivity of the devices we set up. The small semicircles in the high frequency
region are due to the electrical double layer formation at the electrode electrolyte interface.
The equivalent series resistance is the sum of the Ohmic resistance and the charge transfer
resistance, which is observed to be 15 Ω, 2.6 Ω, and 1.73 Ω for NC, ANC-1 and ANC-2
respectively. Since the Ohmic resistance of these three carbon materials is near zero and
almost can be negligible, the decrease of charge transfer resistance is thought to attribute to
the better wettability induced by the oxygen-functional groups from activation process.
Figure 2. 7 Ragone plots comparing the energy density and power density of the supercapacitor based
on ANC-2 in this work and representative literature reports: (■) Polymer derived carbon, (●)
Activated graphene, (▲) 3D hexaporous carbon, (▼) Nitrogen enriched carbon, (☆) this work tested
under 1V, and (★) this work tested under 1.6V.
Additionally, symmetric supercapacitors based on ANCs demonstrate excellent
stability for long-term operation. As shown in Figure 2. 6D, at a large working voltage
window of 1.6 V, only minor capacitance decay is observed after GCD measurement at a
high current density of 5 A g-1
for 10000 cycles. In virtue of the high specific capacitance,

48
excellent rate capability and large operation voltage window, the symmetric supercapacitor
assembled based on the representative sample, namely ANC-2, shows high energy and power
density. As shown in the Ragone plots (Figure 2. 7), when the working voltage is 1V, the
ANC-2 supercapacitor delivers a moderate gravimetric energy density of 9.31 Wh kg-1
at a
power output of 127.3 W kg-1
, and the energy density could remain up to 61% (5.64 Wh kg-1
)
when the power density increases to 40090 W kg-1
. Moreover, when the working voltage is
up to 1.6V, the energy density is boosted to almost double than before. The energy density of
ANC-2 reaches as high as 31.7 Wh kg-1
at a power of 100 W kg-1
, and it still remains 12.9
Wh kg-1
at a high power density of 10108 W kg-1
. The electrochemical performance of the
ANC-2 supercapacitor is much better to the reports of carbon-based materials due to its
enlarged working voltage, such as polymer derived carbon, activated graphene, 3D
hexaporous carbon, and nitrogen enriched carbon.
2.3 Conclusion
In summary, we have developed a novel and facile approach to synthesize oxygen-enriched
nanoporous carbons with tunable porosity and oxygen content. The key synthesis procedure
involves a precursor with unique structure to maintain its uniformly-distributed pores and
subsequent KOH activation. The KOH activation process effectively enlarges the pore size,
increases the surface area, and facilitates the oxygen doping in the nanoporous carbons, all of
which significantly improve the electrochemical capacitive performance of activated
nanoporous carbons. The optimized ANC-2 nanoporous carbon manifests a high specific
capacitance of up to 241 F g-1
in a symmetric cell with excellent retention at high rates and
upon prolonged cycling. In particular, this kind of nanoporous carbon also shows high
capacitance, excellent rate performance as well as stable cycling under a high voltage of 1.6V
in Li2SO4 electrolyte. The enlarged working voltage window significantly boosted the energy

49
density. The symmetric cell exhibits a high energy density of 31.7 Wh kg-1
at a power density
of 100 W kg-1
, and retains a high value of 12.9 Wh kg-1
at an ultrahigh power output of 10108
W kg-1
, which outperforms most of the representative carbon-based supercapacitors. The
present study demonstrates a simple and effective strategy to increase the double layer
capacitance in carbon-based materials, and provides some important insights regarding the
high voltage carbon electrodes in supercapacitors. The as-developed nanoporous carbon
would also find its applications in many other fields, such as fuel cells and lithium-ion
batteries.
2.4 Experimental Section
Synthesis of nanoporous carbon (NC): Diphenylsilanediol (3g) was dissolved in 20 ml of
anhydrous ethanol. Concentrated hydrochloride acid (0.7 ml) was drop wise added in the
solution in 5 min. The solution was continuously stirred and heated at 200 °C until the
solvent evaporated thoroughly and turned into a transparent and viscous oily liquid. The oily
liquid was cooled down under room temperature and then carbonized at 900 °C for 3 h in
nitrogen gas with a heating rate of 3 °C min-1
. The as-obtained product was successively
washed with 5 % hydrofluoric acid and distilled water until the solution is neutral. The
nanoporous carbon was finally treated at 900 °C under the atmosphere of nitrogen to be
purified.
Synthesis of Oxygen-enriched nanoporous carbon (ANC): The NC was mixed with potassium
hydroxide under different mass ratios of 1:1 (ANC-1) and 3:1 (ANC-2), respectively. The
samples were then heated to 800 °C for 1 h in nitrogen gas with a heating rate of 5 °C min-1
.
The activated samples were washed with a 10 % nitric acid for 5 times. Then the samples
were washed with distilled water and dried at 110°C under vacuum.

50
Characterizations: Nitrogen-sorption isotherms were measured at 77 K with a Micromeritics
ASAP 2020 analyzer (Micromeritics Instrument Corporation, Norcross, GA). Specific
surface areas (SSA) were calculated by the Brunauer-Emmett-Teller (BET) method and the
pore size distribution was determined from the adsorption branch of the isotherm based on
the Barrett-Joyner-Halenda (BJH) method. TEM analysis was conducted on a FEI Tecnai™
transmission electron microscope (200kV). Powder X-ray diffraction was operated on the
Rigaku MiniFlex II (Rigaku, Japan) using Cu Kα radiation (λ=0.15406 nm). XPS was
conducted with a PHI 3057 spectrometer using Mg Kα X-rays source at 1253.6 eV. Raman
spectra were obtained using a Renishaw 1000, with a 50 objective lens at an excitation
wavelength of 514 nm.
Electrode Fabrication and Electrochemical Measurements: A two-electrode cell
configuration was used to measure the electrochemical performance of the ANCs. Briefly,
10 % of polytetrafluoroethylene (PTFE; 5 wt% dispersion in water), 10 % of carbon black
and 80 % of the electrochemical active material was dispersed in ethanol. The slurry was
mixed into a paste using a mortar and pestle, rolled into electrode sheets with size of 0.5 cm *
0.5 cm (size variation < 5 %). A pair of electrodes typically had a weight of 6 mg (mass
variation < 5 %) after drying overnight at 110 °C under vacuum. The two identical electrodes
were coated onto nickel-foam substrates and pressed at a pressure of 2MPa for 5 minutes.
The electrochemical impedance measurements were carried out on a Solartron 1860/1287
Electrochemical Interface (Solartron Analytical, Oak Ridge, TN). The EIS tests were
operated in the frequency range of 10 mHz to 100 kHz with 10 mV AC amplitude. The cyclic
voltammetry test and galvanostatic charge and discharge test were conducted using EC-LAB
on a Bio Logic VMP-3 (Bio Logic Science Instruments, Claix, France). Symmetric cells were
charged and discharged between 1V to 0 V for the normal voltage range, and 1.6V to 0V for

51
the high voltage range. The specific gravimetric capacitance of the supercapacitor cell was
calculated according to the following Equation (2.1):
Ccell = IΔt/mΔV (2.1)
where I (A), Δt (s), ΔV (V), and m (g) are the discharge current, discharge time, potential
window during the discharge process, and the mass of a single electrode, respectively. The
specific capacitance of the single electrode was calculated by the following equation of Cs =
2 Ccell. The energy density and power density were calculated using the formula in Equation
(2.2) and Equation (2.3):
Es = CsVmax/8×3.6 (2.2)
Ps = Es/t (2.3)
where Es is the specific energy density, Vmax is the maximum voltage window, Ps is the
power density and t is the discharge time.
Reference
[1] L.L. Zhang, X.S. Zhao, Carbon-based materials as supercapacitor electrodes, Chem. Soc.
Rev. 38 (2009) 2520–2531. doi:10.1039/B813846J.
[2] Y. Zhai, Y. Dou, D. Zhao, P.F. Fulvio, R.T. Mayes, S. Dai, Carbon Materials for
Chemical Capacitive Energy Storage, Adv. Mater. 23 (2011) 4828–4850.
doi:10.1002/adma.201100984.
[3] E. Frackowiak, Carbon materials for supercapacitor application, Phys. Chem. Chem.
Phys. 9 (2007) 1774–1785. doi:10.1039/B618139M.
[4] Daniel A. Scherson, Attila Palencsár, Batteries and Electrochemical Capacitors, The
Electrochemical Society Interface. 15 (2006) 17–22.

52
[5] John R. Miller, Andrew F. Burke, Electrochemical Capacitors: Challenges and
Opportunities for Real-World Applications, The Electrochemical Society Interface. 17 (2008)
53–57.
[6] Y. Xu, Z. Lin, X. Zhong, X. Huang, N.O. Weiss, Y. Huang, et al., Holey graphene
frameworks for highly efficient capacitive energy storage, Nat Commun. 5 (2014).
doi:10.1038/ncomms5554.
[7] Z. Lei, Z. Liu, H. Wang, X. Sun, L. Lu, X.S. Zhao, A high-energy-density supercapacitor
with graphene–CMK-5 as the electrode and ionic liquid as the electrolyte, J. Mater. Chem. A.
1 (2013) 2313–2321. doi:10.1039/C2TA01040B.
[8] H. Yang, S. Kannappan, A.S. Pandian, J.-H. Jang, Y.S. Lee, W. Lu, Achieving Both High
Power and Energy Density in Electrochemical Supercapacitors with Nanoporous Graphene
Materials, arXiv:1311.1413 [cond-Mat]. (2013). http://arxiv.org/abs/1311.1413 (accessed
May 28, 2015).
[9] Q. Gao, L. Demarconnay, E. Raymundo-Piñero, F. Béguin, Exploring the large voltage
range of carbon/carbon supercapacitors in aqueous lithium sulfate electrolyte, Energy
Environ. Sci. 5 (2012) 9611–9617. doi:10.1039/C2EE22284A.
[10] T.-H. Wu, C.-T. Hsu, C.-C. Hu, L.J. Hardwick, Important parameters affecting the
cell voltage of aqueous electrical double-layer capacitors, Journal of Power Sources. 242
(2013) 289–298. doi:10.1016/j.jpowsour.2013.05.080.
[11] Y.-K. Hsu, Y.-C. Chen, Y.-G. Lin, L.-C. Chen, K.-H. Chen, High-cell-voltage
supercapacitor of carbon nanotube/carbon cloth operating in neutral aqueous solution, J.
Mater. Chem. 22 (2012) 3383–3387. doi:10.1039/C1JM14716A.
[12] V. Khomenko, E. Raymundo-Piñero, E. Frackowiak, F. Béguin, High-voltage
asymmetric supercapacitors operating in aqueous electrolyte, Appl. Phys. A. 82 (2005) 567–
573. doi:10.1007/s00339-005-3397-8.

53
[13] J.B. Goodenough, Y. Kim, Challenges for Rechargeable Li Batteries, Chem. Mater.
22 (2010) 587–603. doi:10.1021/cm901452z.
[14] Q. Abbas, P. Ratajczak, P. Babuchowska, A.L. Comte, D. Bélanger, T. Brousse, et al.,
Strategies to Improve the Performance of Carbon/Carbon Capacitors in Salt Aqueous
Electrolytes, J. Electrochem. Soc. 162 (2015) A5148–A5157. doi:10.1149/2.0241505jes.
[15] A. Ghosh, Y.H. Lee, Carbon-Based Electrochemical Capacitors, ChemSusChem. 5
(2012) 480–499. doi:10.1002/cssc.201100645.
[16] Z. Chen, D. Weng, H. Sohn, M. Cai, Y. Lu, High-performance aqueous
supercapacitors based on hierarchically porous graphitized carbon, RSC Adv. 2 (2012) 1755–
1758. doi:10.1039/C2RA00887D.
[17] P. Ratajczak, K. Jurewicz, F. Béguin, Factors contributing to ageing of high voltage
carbon/carbon supercapacitors in salt aqueous electrolyte, J Appl Electrochem. 44 (2013)
475–480. doi:10.1007/s10800-013-0644-0.
[18] M.A. Lillo-Ródenas, J. Juan-Juan, D. Cazorla-Amorós, A. Linares-Solano, About
reactions occurring during chemical activation with hydroxides, Carbon. 42 (2004) 1371–
1375. doi:10.1016/j.carbon.2004.01.008.
[19] Z.Q. Li, C.J. Lu, Z.P. Xia, Y. Zhou, Z. Luo, X-ray diffraction patterns of graphite and
turbostratic carbon, Carbon. 45 (2007) 1686–1695. doi:10.1016/j.carbon.2007.03.038.
[20] N.G. Sahoo, H.K.F. Cheng, L. Li, S.H. Chan, Z. Judeh, J. Zhao, V4-22-Specific
Functionalization of Carbon Nanotubes for Advanced Polymer Nanocomposites, Adv. Funct.
Mater. 19 (2009) 3962–3971. doi:10.1002/adfm.200901486.
[21] H. Ago, T. Kugler, F. Cacialli, W.R. Salaneck, M.S.P. Shaffer, A.H. Windle, et al.,
V4-23-Work Functions and Surface Functional Groups of Multiwall Carbon Nanotubes, J.
Phys. Chem. B. 103 (1999) 8116–8121. doi:10.1021/jp991659y.

54
[22] P. Ratajczak, K. Jurewicz, F. Béguin, Factors contributing to ageing of high voltage
carbon/carbon supercapacitors in salt aqueous electrolyte, J Appl Electrochem. 44 (2013)
475–480. doi:10.1007/s10800-013-0644-0.

55
Chapter 3: Fluorine-rich Nanoporous Carbon with
Enhanced Surface Affinity in Organic Electrolyte
for High-Performance Supercapacitors
3.1 Introduction
Supercapacitors are desirable energy-storage devices due to their high power density
and long cycling life, yet their low energy density still limit their broad applications.[1][2][3]
Supercapacitors commonly utilize carbon as both (symmetric supercapacitors) or one of the
electrodes (asymmetric supercapacitors), of which the device capacitances are generally
limited by the capacitance of the carbon electrodes. Developing better carbon materials with
higher capacitance and working voltage has been emerging as one the most essential
challenges in the field.[3]
Generally, carbon electrodes store electrochemical energy in the form of electrical
double layer capacitance, which requires high surface area[4]
and highly effective electron-
conducting pathways.[5]
Towards this goal, a large variety of carbons have been studied, such
as biomass-derived carbons,[6]
polymer-templated carbons,[7]
carbide-derived microporous
carbons,[8]
and carbon onions.[9]
While most of the research has been focused on engineering
the pore structure, recent studies have shown that doping the carbons with heteroatoms could
improve the capacitance, possibly owning to the improved charge mobility and wettability
with electrolytes.[10][11]
Such doping processes are generally achieved by reacting carbons
with heteroatom-containing agents or by carbonizing heteroatom-containing precursors.[10]
Nitrogen is by far the most intensely studied n-type dopant, which is generally doped into
carbons by treating the carbons with ammonia gas or urea, or by carbonizing nitrogen-
containing precursors such as melamine, poly(acrylonitrile), poly(vinylpyridine), and

56
quinolone-polymerized pitch.[5][12]
Doping with other heteroatoms such as boron,
phosphorous and sulfur, was also explored, which was realized by carbonizing boron-
containing precursors,[13]
by carbonizing sulfurated polymers,[14]
or by activating carbon
precursors using phosphoric acid, respectively.[15]
However, despite of the improved
capacitance, most dopant moieties (e.g., quinoid, quinhydrone, phenolic, carbonxyl, carbonyl
and lactone) are electrochemically unstable, often resulting in increased leakage current and
poor cycling performance.[16][17]
Fluorine (F), the element with the highest electronegativity, is capable of forming the
fluorine-carbon bond with high polarity and stability.[18][19]
F-doped carbons have enabled
widespread applications such as semiconductor-based devices, primary lithium-ion batteries,
and supercapacitors.[20][21][22]
Most of the existing F-doped carbons are prepared using
gaseous phase or plasma dissociation of F-containing agents (e.g., F2, XeF2, CF4 et. al.),
which are hazardous and expensive.[23][24][25][26]
Especially for supercapacitors, both gaseous
and isoionic fluorine could corrode the pristine carbon and lead to an unexpected structural
distortion, resulting in decrease of surface area and drop in capacitance.[27][28]
Therefore, it
remains a critical challenge to achieve F-doping carbons with high F content, intact carbon
structure and superior electrochemical performance using a facile synthesis approach.
3.2 Results and Discussion
In this work, we report a simple method to synthesize F-rich nanoporous carbons for high-
performance supercapacitors. As shown in Figure 3. 1A, a diphenylsilanediol (DPSD)-
derived polymer is chosen as a unique carbon precursor that atomically integrates both the
organic and inorganic components. Carbonization process leads to the formation of
carbon/silica nanocomposites embedding ultrafine silica moieties. Subsequent removal of the
silica moieties by hydrofluoric acid (HF) etching creates nanoporous carbons with uniform

57
pore structure. Finally, the as-prepared nanoporous carbon (denoted as NC) is activated using
KOH, and followed by a simple F doping approach via washing with a mixture of HF and
nitric acid. The porosity and F content of resulting F-rich nanoporous carbons (denoted as
FNCs) are controlled by the mass ratios of KOH to NC used during the activation (see
experimental details in the Supporting Information (SI)). F-rich nanoporous carbons prepared
with different KOH/carbon ratios (1:1, 3:1, 6:1 and 9:1) are denoted as FNC-1, FNC-2, FNC-
3, and FNC-4, respectively. The F doping effectively increases the stability and capacitance
of the nanoporous carbons, offering a new class of electrode materials for high-performance
supercapacitors.

58
Figure 3. 1. (A) Schematic illustration of the synthesis procedure of fluorine-rich nanoporous carbon.
(B) Nitrogen sorption isotherms and (C) pore size distribution of NC and FNCs. TEM images of (D)
NC and (E) FNC-4. Insets are the corresponding HRTEM images.
Figure 3. 1B and C show the nitrogen-sorption isotherms and pore size distributions
of the nanoporous carbons before and after the activation and F doping. Before the activation,
the NC exhibits a microporous structure (pore size around 1nm) with a moderate Brunauer-
Emmett-Teller (BET) surface area of ~ 455 m2 g
-1. After the activation and doping process,
the pore size and surface area of FNCs are substantially increased with increasing mass ratios
of KOH to carbon. For example, FNC-4 prepared with a high KOH/carbon ratio (9:1)
exhibits an exceptionally high BET surface area of 3231 m2 g
-1. Meanwhile abundant
mesopores with size centered at around 3.4 nm are also generated.
The pore structure of the NC and FNCs is also investigated by transmission electron
microscopy (TEM). The pristine NC exhibits a less porous texture (Figure 3. 1D), which is
consistent with the results of nitrogen-sorption analysis. The insufficient porosity and small
pore size make the inner region of the NC hardly accessible to electrolyte, which is
unfavorable for electrical double layer charge storage. On the other hand, higher porosity and
larger pores can be easily observed in FNCs with increasing KOH/carbon ratio during the
activation (Figure 3. S1, see the SI, and Figure 3. 1E). Specifically, in line with the previous
discussion, the high resolution (HR) TEM image (inset of Figure 3. 1E) reveals that the
pores in FNC-4 are enlarged to around 3 nm with high uniformity and well interconnected,
offering a highly porous and open framework. NC and FNCs all exhibit an amorphous feature
with low graphitic degree as confirmed by both the powder X-ray diffraction (XRD) patterns
and Raman spectra (Figure 3. S2, see the SI).

59
Figure 3. 2. (A) XPS wide scan spectra of NC, FNC-1, FNC-2, FNC3, and FNC-4. (B) F1s XPS
spectrum of FNC-4. C1s XPS spectra of (C) NC and (D) FNC-4. O1s XPS spectra of (E) NC and (F)
FNC-4.
The surface chemistry of the samples before and after the activation and F doping is
characterized using x-ray photoelectron spectroscopy (XPS), as shown in Figure 3. 2. The
wide scan spectrum shown in Figure 3. 2A illustrates sharp C1s and O1s peaks in NC. After
activation and F doping, the C1s and O1s peaks are weakened, whereas distinct F1s and F
KLL peaks are observed. No other elemental peaks can be observed in the FNCs, indicating

60
the absence of impurities in the samples. The F1s spectrum of FNC-4 (Figure 3. 2 B) is
further deconvolved into four peaks located at 687.7, 688.6, 689.6 and 690.9 eV, which are
assigned to covalent CFx, covalent CFx with charge effect (CE), perfluorinated CF bonding,
and perfluorinated CF bonding with CE, respectively.[29][30]
The covalent bonding state and
high content of F reveal stable and efficient F doping on the carbon surface, which is further
confirmed by the C1s and O1s spectra as shown in Figure 3. 2C to F. The carbon peak of the
non-activated NC (Figure 3. 2C) is deconvolved into 5 constituents located at 284.6, 286.2,
287.9, and 289.0 eV, which are assigned to carbon sp2/sp3, C-O, C=O, and -COO- bonds,
respectively.[31][32]
In contrast to the control, C1s spectra of the FNC-4 (Figure 3. 2D) are
deconvolved into additional peaks, including CFx (x = 1, 2), CFx (x = 2, 3), CF3, and CF3 with
CE that are located at 288.8, 290.6, 292.0, and 294.0 eV, respectively.[29]
Similarly, the O1s
spectrum of the NC sample in Figure 3. 2E is deconvolved into two constituent peaks
located at 531.0 and 532.4 eV, which are assigned to the carbonyl/carboxyl groups and
hydroxyl groups, respectively.[31][32]
An extra peak at 535.2 eV appears in the deconvolved
O1s spectrum of FNC-4 as shown in Figure 3. 2F, which is contributed to oxygen bonded to
perfluorinated (CFxO).[29][30]
FNC-1 to FNC-3 also exhibit similar XPS spectra with F-
containing species as shown in Figure 3. S3 (see SI).
Table 1 summarizes the information of the porous structure and chemical
composition of FNCs obtained from nitrogen-sorption and XPS analysis, respectively. It is
obvious that the degree of activation (i.e., the KOH/carbon ratio) primarily plays dual roles to
the FNCs. First, a higher degree of activation results in larger pores and higher surface area,
as discussed earlier. Second, the F content in the FNCs also strongly depends on the degree
of activation. Specifically, from FNC-1 to FNC-4, the F content increases remarkably from
7.8 to 17.5 atom-%, accompanied by the reduction of carbon content. This phenomenon
suggests that KOH activation plays a critical role in the subsequent F doping. Note that most

61
of reported F doping methods rely on the gaseous phase reactions between F and carbon at
high temperature, which is highly toxic, operationally inconvenient and casing unwanted
changes of carbon texture.[18][19]
In a sharp contrary, the F doping in this work is achieved
under ambient conditions without altering the carbon structure, which easily introduces a
rather high and controllable F content on the carbon surface. Comparison of the synthesis
methods and carbon structure between our work and previous studies is summarized in Table
S1 (see the SI), which highlighted the advantages of our F doping method.
Table 1 Composition and pore properties of F-rich nanoporous carbons.
Sample MC:KOH
w:w
SBET
m2
g-1
PMD[a]
nm
C
at.%
O
at.%
F
at.%
FNC-1 1:1 1400 < 2 84.7 7.5 7.8
FNC-2 3:1 2526 < 2 84.3 7.6 8.1
FNC-3 6:1 3035 2.66 78.1 9.0 12.9
FNC-4 9:1 3231 3.04 73.8 8.7 17.5
[a] (Peak maximum diameter)
A possible mechanism for such KOH-activation-assisted F doping method is
proposed here. During the KOH activation, carbon reacts with metal alkalis and generates
abundant defects, edge carbon atoms and dangling bonds. When the mixture of reaction
products (including carbon, K, K2CO3, K2O, KOH) is washed with hydrofluoric acid, the
potassium compounds are removed and the fresh unsaturated carbon surface is exposed.[33]
To reduce surface energy, the carbon dangling bonds tend to be terminated by forming
covalent bond with foreign groups. In general cases, the dangling bonds are either stabilized
by H or by oxygen compounds, such as phenolic, carbonxyl, carbonyl and so on.[34]
However
in this work, fluorine possesses stronger electronegativity than oxygen, and thus has the

62
priority to bond with the carbon. Consequently, with increasing activation intensity, higher
fluorine content is obtained as a result of more unsaturated carbon bonds generated during
activation.
Figure 3. 3. (A) Cyclic voltammogram and (B) galvanostatic charge/discharge curves of FNC-4 at
various scan rates and current densities. (C) Relationship of the specific capacitance and current
densities of different FNCs. (D) Nyquist plots of different FNC-based electrodes; inset shows the
plots in high frequency region. (E) Long-term cycling performance of symmetric supercapacitors
based on FNCs. (F) Ragone plots comparing the energy density and power density of the
supercapacitor based on FNC-4 in this work and representative literature reports: (■) active carbon,[36]
(●) graphic carbon sphere,[37]
(▲) sandwich-type carbon nanosheet,[38]
(▼) 3D microporous carbon,[39]
(♦) interconnected carbon sheet,[40]
and (★) FNC-4 in this work.
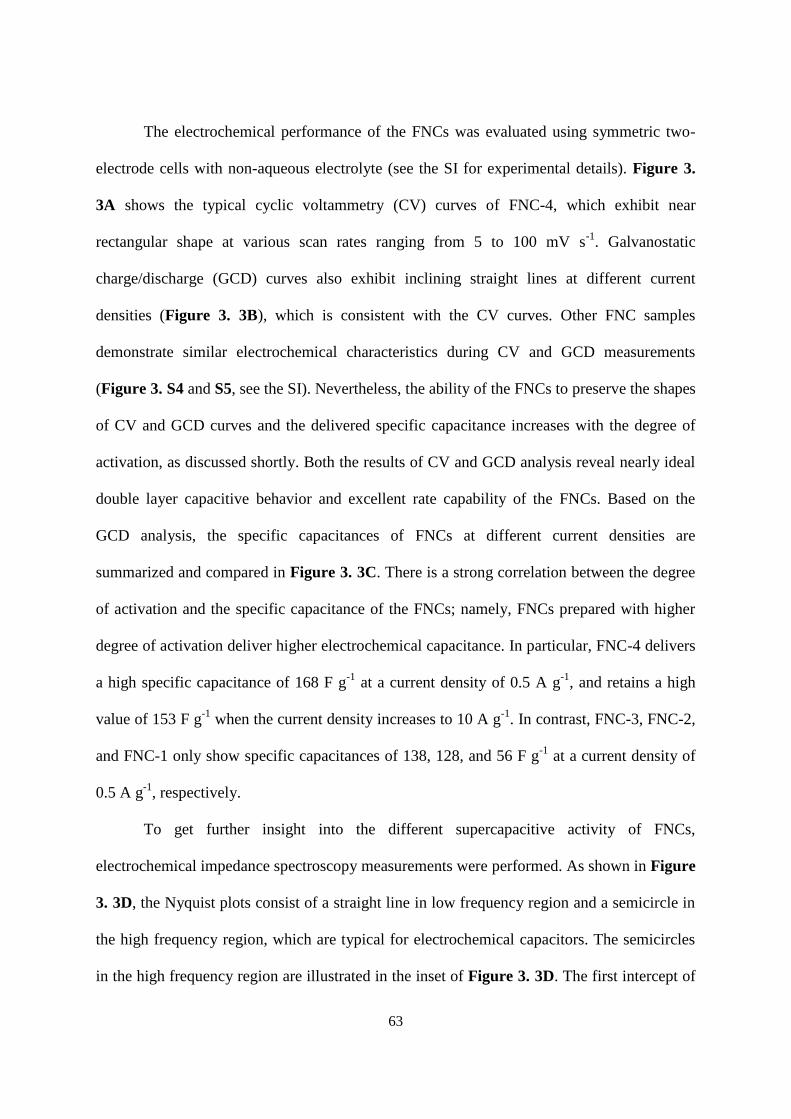
63
The electrochemical performance of the FNCs was evaluated using symmetric two-
electrode cells with non-aqueous electrolyte (see the SI for experimental details). Figure 3.
3A shows the typical cyclic voltammetry (CV) curves of FNC-4, which exhibit near
rectangular shape at various scan rates ranging from 5 to 100 mV s-1
. Galvanostatic
charge/discharge (GCD) curves also exhibit inclining straight lines at different current
densities (Figure 3. 3B), which is consistent with the CV curves. Other FNC samples
demonstrate similar electrochemical characteristics during CV and GCD measurements
(Figure 3. S4 and S5, see the SI). Nevertheless, the ability of the FNCs to preserve the shapes
of CV and GCD curves and the delivered specific capacitance increases with the degree of
activation, as discussed shortly. Both the results of CV and GCD analysis reveal nearly ideal
double layer capacitive behavior and excellent rate capability of the FNCs. Based on the
GCD analysis, the specific capacitances of FNCs at different current densities are
summarized and compared in Figure 3. 3C. There is a strong correlation between the degree
of activation and the specific capacitance of the FNCs; namely, FNCs prepared with higher
degree of activation deliver higher electrochemical capacitance. In particular, FNC-4 delivers
a high specific capacitance of 168 F g-1
at a current density of 0.5 A g-1
, and retains a high
value of 153 F g-1
when the current density increases to 10 A g-1
. In contrast, FNC-3, FNC-2,
and FNC-1 only show specific capacitances of 138, 128, and 56 F g-1
at a current density of
0.5 A g-1
, respectively.
To get further insight into the different supercapacitive activity of FNCs,
electrochemical impedance spectroscopy measurements were performed. As shown in Figure
3. 3D, the Nyquist plots consist of a straight line in low frequency region and a semicircle in
the high frequency region, which are typical for electrochemical capacitors. The semicircles
in the high frequency region are illustrated in the inset of Figure 3. 3D. The first intercept of

64
the plots with x-axis reflects the Ohmic resistance of the cells,[35]
whereas the diameter of the
semicircle corresponds to the charge transfer resistance. It is found that FNCs with more
intense activation exhibit smaller Ohmic resistance and charge transfer resistance, which
might be due to the improved wettability of electrolyte on carbon surface as discussed shortly.
Meanwhile, the slope of the straight lines in low frequency regions increases along with the
activation intensity, indicating promoted ion/electron transportation.
Additionally, symmetric supercapacitors based on FNCs demonstrate excellent
stability for long-term operation. As shown in Figure 3. 3E, with a large voltage window of
2.7 V, only minor capacitance decay is observed after GCD measurement at a high current
density of 5 A g-1
for 10000 cycles. Particularly, FNC-4 exhibits the highest capacitance
retention of about 92% after 10000 cycles. In virtue of the high specific capacitance,
excellent rate capability and large operation voltage window, the symmetric supercapacitor
assembled based on the representative sample, namely FNC-4, shows high energy and power
density. As shown in the Ragone plots (Figure 3. 3F), the FNC-4 supercapacitor delivers a
high gravimetric energy density of 42.2 Wh kg-1
at a power output of 134.9 W kg-1
, and the
energy density could remain up to 91.8% (38.7 Wh kg-1
) when the power density increases to
6750 W kg-1
. Even at a very high power density of 40500 W kg-1
, the energy density of the
supercapacitor is still preserved at 26.5 Wh kg-1
. The electrochemical performance of the
FNC-4 supercapacitor is superior to that of previous reported F-doped carbon (Table S2, see
the SI), and also among the best reports of carbon-based materials, such as activated
carbon,[36]
hierarchical graphic carbon spheres,[37]
interconnected carbon nanosheets,[38]
3D
micro-porous carbon from polymer carbonization,[39]
and sandwich-type microporous carbon
nanosheets.[40]
Particularly, the FNC-4 supercapacitor shows excellent energy density
retention at ultra-high power output over 10000 W kg-1
and obviously outperforms

65
conventional carbon-based supercapacitors, manifesting its promising high-power
applications.
Figure 3. 4. The simulated electrostatic potential surface for (A) pristine graphene and (B) fluorine
doped graphene. The inset is electrostatic potential scale bar; the most negative value is red while the
most positive value is blue. Optimized configuration of TEA+ adsorbed on (C) pristine graphene and
(D) fluorine doped graphene.
The improved electrochemical capacitive properties of FNCs could be attributed to a
synergistic effect of both the pore configuration and carbon surface chemistry. Specifically, a
higher surface area could provide more electrolyte accumulation and lead to a higher
capacitance. Meanwhile, a suitable pore size would effectively facilitate the electrolyte
infusion and ion transport without sacrificing the surface area and the robustness of the
porous structure. In particular, the pore size of FNC-4 is marginally larger than twice
diameter of the solvated ions, which is proved to be an optimized size distribution to form
double layer capacitor.[41]
However, high surface area alone does not necessarily result in

66
high specific capacitance.[42][43][44][45]
Incomplete utilization of carbon surface to form
electrical double layer in electrolyte due to limited accessibility might be the major reason
accounted for the non-linear relationship between surface area and specific capacitance.[46]
In
this work, we found that F doping is another critical factor that contributes to the high
capacitance of FNCs. Figure 3. S6 (see the SI) compares the capacitances of NCs with and
without F doping. All of the FNCs exhibit higher specific capacitances at various current
densities compared with their F-free counterparts with the same porous structure. The
beneficial effect of F doping is especially significant in FNC-1 with low surface area, which
shows capacitance as high as eight times that of F-free counterpart.
To better understand the role of carbon surface chemistry in the capacitive
performance, theoretical models of pure carbon surface (CS) and F-containing carbon surface
(FCS) with one typical F-containing group were developed to study the interactions between
F-doped carbon and electrolyte ions. Figure 3. 4A and B shows the simulated electrostatic
potential surface for CS and FCS models, respectively. After introducing a F atom into the
carbon cluster, the surrounding area becomes more electro-negative, which would alter the
interaction with ions in the electrolyte. The most stable geometric configuration between a
single tetraethylammonium ion (TEA+) and the CS/FCS models is simulated and illustrated
in Figure 3. 4C and D, respectively. The calculated adsorption energy changes from -48.97
kJ mol-1
for CS model to -67.52 kJ mol-1
for FCS model, indicating a stronger affinity
between the electrolyte ions and the F-containing surface. Meanwhile the dipole moment of
reduces from 4.30 Å in CS model to 3.60 Å in FCS model, which suggests a stronger polarity.
Such enhanced interactions between electrolyte ions and F-rich carbon surface might help to
build up the electric double layer on the electrode surface. Meanwhile, it is found that F
doping also improves the wettability of electrolyte on carbon surface as verified by contact
angle measurement in Figure 3. S7 (see the SI). The contact angle between electrolyte and

67
electrode decreases from 88.9o for NC to 55.1
o for FNC-4, which indicates that F-doping
improves the affinity of electrolyte to carbon surface, facilitating transport of electrolyte
within the porous frameworks.
3.3 Conclusion
In summary, we have developed a novel and facile approach to synthesize fluorine-
rich nanoporous carbons with tunable porosity and F content. The key synthesis procedure
involves KOH activation and subsequent hydrofluoric acid washing of a polymer-derived
nanoporous carbon. The KOH activation process effectively enlarges the pore size, increases
the surface area, and facilitates the F doping in the nanoporous carbons, all of which
significantly improve the electrochemical capacitive performance of the F-rich nanoporous
carbons. In particular, with the assistance of both experimental and computational methods,
we successfully demonstrate that the F-rich carbon surface with higher polarity provides
stronger affinity and wettability for the organic electrolyte, which is accounted for the
enhanced electrochemical performance. The optimized F-rich nanoporous carbon manifests a
very high specific capacitance of up to 168 F g-1
in a symmetric cell with excellent retention
at high rates and upon prolonged cycling. The present study demonstrates a simple and
effective strategy to increase the double layer capacitance in carbon-based materials, and
provides some important insights regarding the origin of enhanced performance in
heteroatom-rich carbons. The as-developed F-rich nanoporous carbon would also find its
applications in many other fields, such as fuel cells and lithium-ion batteries.
3.4 Experimental Section
Synthesis of nanoporous carbon (NC): Diphenylsilanediol (3g) was dissolved in 20 ml of
anhydrous ethanol. Concentrated hydrochloride acid (0.7 ml) was drop wise added in the

68
solution in 5 min. The solution was continuously stirred and heated at 200 °C until the
solvent evaporated thoroughly and turned into a transparent and viscous oily liquid. The oily
liquid was cooled down under room temperature and then carbonized at 900 °C for 3 h in
nitrogen gas with a heating rate of 3 °C min-1. The as-obtained product was successively
washed with 5 % hydrofluoric acid and distilled water until the solution is neutral. The
nanoporous carbon was finally dried at 110 °C under vacuum.
Synthesis of fluorine-rich nanoporous carbon (FNC): The NC was mixed with potassium
hydroxide under different mass ratios of 1:1 (FNC-1), 3:1 (FNC-2), 6:1 (FNC-3) and
9:1(FNC-4), respectively. The samples were then heated to 800 °C for 1 h in nitrogen gas
with a heating rate of 5 °C min-1. The activated samples were washed with a mixing solution
of 20 % hydrofluoric acid and 10 % nitric acid for 5 times. Then the samples were washed
with distilled water and dried at 110°C under vacuum.
Characterizations: Nitrogen-sorption isotherms were measured at 77 K with a Micromeritics
ASAP 2020 analyzer (Micromeritics Instrument Corporation, Norcross, GA). Specific
surface areas (SSA) were calculated by the Brunauer-Emmett-Teller (BET) method and the
pore size distribution was determined from the adsorption branch of the isotherm based on
the Barrett-Joyner-Halenda (BJH) method. TEM analysis was conducted on a FEI Tecnai™
transmission electron microscope (200kV). Powder X-ray diffraction was operated on the
Rigaku MiniFlex II (Rigaku, Japan) using Cu Kα radiation (λ=0.15406 nm). XPS was
conducted with a PHI 3057 spectrometer using Mg Kα X-rays source at 1253.6 eV. Raman
spectra were obtained using a Renishaw 1000, with a 50 objective lens at an excitation
wavelength of 514 nm.
Electrode Fabrication and Electrochemical Measurements: A two-electrode cell
configuration was used to measure the electrochemical performance of the FNCs. Briefly, 10 %
of polytetrafluoroethylene (PTFE; 5 wt% dispersion in water), 10 % of carbon black and 80 %

69
of the electrochemical active material was dispersed in ethanol. The slurry was mixed into a
paste using a mortar and pestle, rolled into electrode sheets with size of 0.5 cm * 0.5 cm (size
variation < 5 %). A pair of electrodes typically had a weight of 3 mg (mass variation < 5 %)
after drying overnight at 110 °C under vacuum. The two identical electrodes were assembled
into a symmetric cell, which consisted of two current collectors, two electrodes, and an ion-
porous separator (glass fiber, GF/C from Whatman). Conductive carbon coated aluminum
foils were used as current collectors. The electrolyte was 1 M of
tetraethylammoniumtetrafluoroborate (TEA BF4, Sigma Aldrich) in polypropylene carbonate
(PC). The assembly of the test cell was done in a glove box filled with Ar. The
electrochemical impedance measurements were carried out on a Solartron 1860/1287
Electrochemical Interface (Solartron Analytical, Oak Ridge, TN). The EIS tests were
operated in the frequency range of 10 mHz to 100 kHz with 10 mV AC amplitude. The cyclic
voltammetry test was conducted using EC-LAB on a Bio Logic VMP-3 (Bio Logic Science
Instruments, Claix, France). Galvanostatic charge and discharge test was carried out by
LAND CT2000 (Wuhan Jinnuo Electronics, Ltd., Wuhan, China). Symmetric cells were
charged and discharged between 2.7 and 0 V. The specific gravimetric capacitance of the
supercapacitor cell was calculated according to the following Equation (3.1):
Ccell = IΔt/mΔV (3.1)
where I (A), Δt (s), ΔV (V), and m (g) are the discharge current, discharge time, potential
window during the discharge process, and the mass of a single electrode, respectively. The
specific capacitance of the single electrode was calculated by the following equation of Cs =
2 Ccell. The energy density and power density were calculated using the formula in Equation
(2.2) and Equation (2.3):
Es = CsVmax2/8×3.6 (3.2)
Ps = Es/t (3.3)

70
where Es is the specific energy density, Vmax is the maximum voltage window, Ps is the
power density and t is the discharge time.
Method of Computational Modeling: The fluorine-containing carbon surface (FCS) model
was constructed based on a previous work established by Wu et al.[38] Pure carbon surface
(CS) model was derived based on C42H16 clusters adopted from investigation of both
lithium adsorption and ORR on doped graphene.[39] Density functional theory (DFT) at the
B3LYP/6-31G* level was employed for geometry optimization and vibrational frequency
analysis, which ensured no imaginary frequencies.[40] The combination of function and basis
sets were proved to be reliable and computationally expedient. All the calculations were
carried out on Gaussian 09 suite package.[41]
3.5 Supporting Information
Figure S 3.1. TEM images of (A) FNC-1, (B) FNC-2, (C) FNC-3. Insets are the HRTEM images of
the corresponding samples.

71
Figure S 3.2. (A) XRD patterns and (B) Raman spectra of NC and FNC-4.
Figure S 3.3. F1s XPS peaks of (A) FNC-1, (B) FNC-2, and (C) FNC-3, respectively. C1s XPS peaks
of (D) FNC-1, (E) FNC-2, (F) FNC-3, respectively. O1s XPS peaks of (G) FNC-1, (H) FNC-2, (I)
FNC-3, respectively.
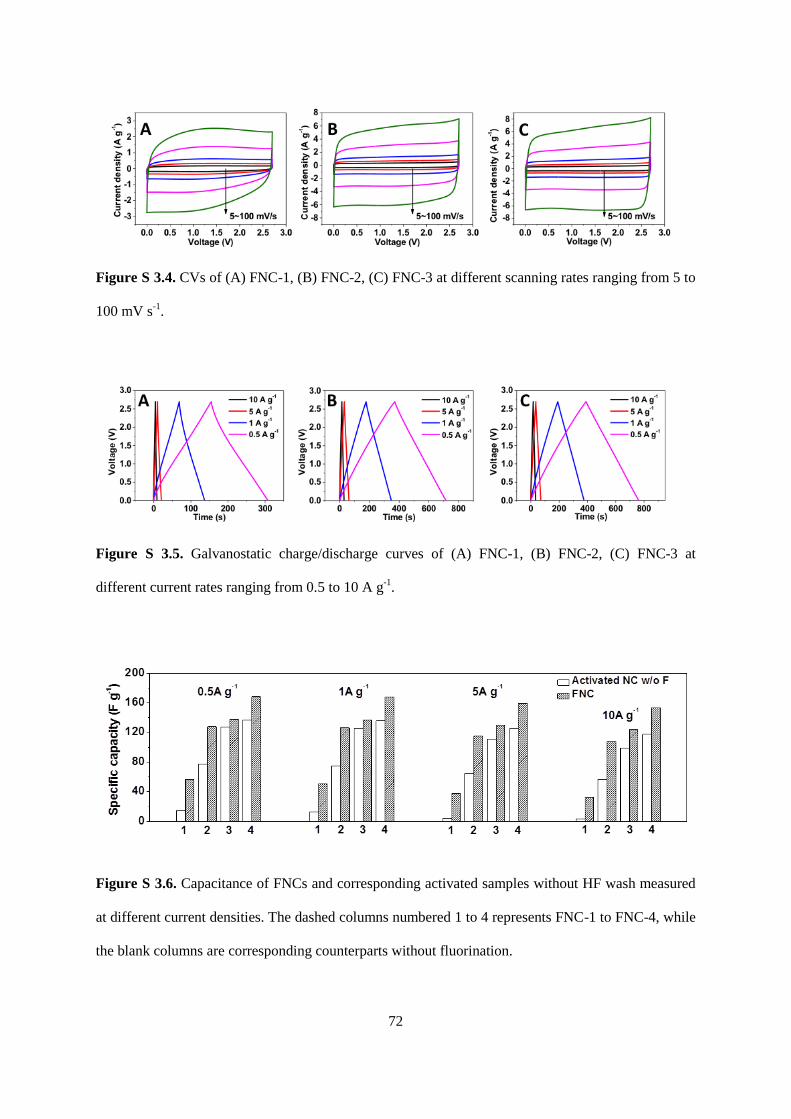
72
Figure S 3.4. CVs of (A) FNC-1, (B) FNC-2, (C) FNC-3 at different scanning rates ranging from 5 to
100 mV s-1
.
Figure S 3.5. Galvanostatic charge/discharge curves of (A) FNC-1, (B) FNC-2, (C) FNC-3 at
different current rates ranging from 0.5 to 10 A g-1
.
Figure S 3.6. Capacitance of FNCs and corresponding activated samples without HF wash measured
at different current densities. The dashed columns numbered 1 to 4 represents FNC-1 to FNC-4, while
the blank columns are corresponding counterparts without fluorination.

73
Figure S 3.7. Contact angle of TEABF4 on (A) NC and (B) FNC-4.
A B

74
Table S 3.1 Brief summary of current fluorinated carbon on their synthesis method, fluorination content and structure configuration.
F-carbon Fluorination agent
Synthesis
Temperature
(oC)
Maximum F-
doped content
[atom%]
SSArc [a]
(m2/g)
SSAfc [b]
(m2/g)
SSAV [c]
(%)
Fluorinated carbon
fibers[1]
F2 gas 380~480 45 N/A N/A N/A
Fluorinated
mesoporous
carbon[2]
5 vol % diluted
fluorine gas (F2/He) RT~250 44 437 332 -24
Fluorinated single
wall carbon
nanotube[3]
9 vol % diluted
fluorine gas (F2/He) 150~600 50 N/A N/A N/A
Fluorinated active
carbon[4]
Mixture gas F2/O2
(7:3) RT 7.51 1924 1556 -19
Fluorinated
graphene[5]
XeF2 gas 30 25 N/A N/A N/A
Fluorinated
graphite[6]
Gaseous mixture of
HF, F2, and IF5
100~600 49 N/A N/A N/A
Fluorinated multi
wall carbon
nanotube[7]
CF4 plasma N/A 66 N/A N/A N/A
Fluorinated
diamond-like
carbons[8]
CF4 plasma-assisted
CVD N/A 60 N/A N/A N/A
Fluorinated
naoporous carbon in
this work
HF solution (5
wt% ) RT 17.5 3320 3231 -2.7
[a] (Specific surface area of raw carbon) [b] (Specific surface area of fluorinated carbon) [c] (Specific surface area variation before and after fluorination)

75
Table S 3.2. Summary of current fluorinated carbon properties for supercapacitors.
F-carbon Fluorination
agent
Synthesis
Tem (oC)
F-doped
content
(atom%)
SSArc [a]
(m2/g)
SSAfc [b]
(m2/g)
APSrc [c]
(nm)
APSfc [d]
(nm)
SCrc [e]
(F/g)
SCfc [f]
(F/g)
SSAV [g]
(%)
PSV [h]
(%)
SCV [i]
(%)
F-carbon
energy density
(Wh/kg)
Fluorinated
SWCNT[9]
F2 gas
(0.2bar) 200 N/A 133 134 0.12 0.11
72.5
(KOH)
63
(KOH) 0.8 -11.7 -15.1 1.77
Fluorinated
commercial
active carbon
MSP20[10]
1M HF
solution RT 0.7 2379 2312 0.6 0.6
18.4 F/cm3
(TEATBF4)
19.8 F/cm3
(TEABF4) -2.8 0 7.5 8.4 Wh/L
Fluorinated
Phenol-based
MSP-20
active
carbon[4]
F2:O2 gas
(3:7) RT 4.17 1924 1894 0.6 0.75
325
(H2SO4)
371
(H2SO4) -1.6 25.0 14.1 12.9
F2:O2 gas
(5:5) RT 4.23 1924 1876 0.6 0.75
325
(H2SO4)
397
(H2SO4) -2.5 25.0 22.2 13.8
F2:O2 gas
(7:3) RT 7.51 1924 1556 0.6 0.78
325
(H2SO4)
269
(H2SO4) -19.1 30.0 -17.2 9.3
Fluorinated
phenol-based
active
carbon[11]
F2:N2 gas
(1:9) RT 0.04 1875 2036
0.6-
2.0
0.6-
2.0
375
(H2SO4)
422
(H2SO4) 8.6 - 12.5 14.7
F2:N2 gas
(2:8) RT 0.77 1875 2338
0.6-
2.0
0.6-
2.0
375
(H2SO4)
491
(H2SO4) 24.7 - 30.9 17.0
F2:N2 gas
(3:7) RT 1.13 1875 2286
0.6-
2.0
0.6-
2.0
375
(H2SO4)
255
(H2SO4) 21.9 - -32.0 8.9
Fluorinated
activated
carbon
nanofibers[12]
1M KOH
activation RT 7.0 777 590 0.6 1.2
106
(H2SO4)
117
(H2SO4) -24.1 100 10.4 4.1
4M KOH
activation RT 12.4 1694 1102 0.6 1.2
181
(H2SO4)
221
(H2SO4) -34.9 100 22.1 7.7
6M KOH
activation RT 21.7 2369 1209 1.2 1.5
199
(H2SO4)
230
(H2SO4) -95.9 25 15.6 8.0
Fluorinated
carbon cloth
ACC507[13]
Reflux with
pitch
fluoride
100 0.20 1291 1256 N/A N/A N/A N/A 2.8 N/A N/A 3.9
Fluorinated
DPSD-
derived
carbon in
this work
FNC-1 RT 7.8 1432 1400 0.94 0.96 12
63
(TEABF4) -2.2 2.1 425 15.9
FNC-4 RT 17.5 3320 3231 3.29 3.04 137 168
(TEABF4) -2.7 7.6 22.6 42.5
[a] (Specific surface area of raw carbon) [b] (Specific surface area of fluorinated carbon) [c] (Average pore size of raw carbon) [d] (Average pore size of fluorinated carbon) [e] (Specific capacitance of raw carbon) [f]
(Specific capacitance of fluorinated carbon) [g] (Specific surface area variation before and after fluorination) [h] (Average pore size variation before and after fluorination) [i] (Specific capacitance variation before and
after fluorination)

76
Reference
[1] P. Simon, Y. Gogotsi, Nat Mater 2008, 7, 845.
[2] G. Wang, L. Zhang, J. Zhang, Chem. Soc. Rev. 2012, 41, 797.
[3] Y. Zhai, Y. Dou, D. Zhao, P. F. Fulvio, R. T. Mayes, S. Dai, Adv. Mater. 2011, 23, 4828.
[4] A. Ghosh, Y. H. Lee, ChemSusChem 2012, 5, 480.
[5] J. Yan, Q. Wang, T. Wei, Z. Fan, Adv. Energy Mater. 2014, 4, 1300816.
[6] L. Wei, M. Sevilla, A. B. Fuertes, R. Mokaya, G. Yushin, Adv. Energy Mater. 2011, 1, 356.
[7] M. Hamedi, E. Karabulut, A. Marais, A. Herland, G. Nyström, L. Wågberg, Angew. Chem.
Int. Ed. 2013, 52, 12038.
[8] J. Chmiola, G. Yushin, Y. Gogotsi, C. Portet, P. Simon, P. L. Taberna, Science 2006, 313,
1760.
[9] D. Pech, M. Brunet, H. Durou, P. Huang, V. Mochalin, Y. Gogotsi, P.-L. Taberna, P.
Simon, Nat Nano 2010, 5, 651.
[10] J. P. Paraknowitsch, A. Thomas, Energy Environ. Sci. 2013, 6, 2839.
[11] V. V. Strelko, V. S. Kuts, P. A. Thrower, Carbon 2000, 38, 1499.
[12] H. Wang, T. Maiyalagan, X. Wang, ACS Catal. 2012, 2, 781.
[13] D.-W. Wang, F. Li, Z.-G. Chen, G. Q. Lu, H.-M. Cheng, Chem. Mater. 2008, 20, 7195.
[14] G. Hasegawa, M. Aoki, K. Kanamori, K. Nakanishi, T. Hanada, K. Tadanaga, J. Mater.
Chem. 2011, 21, 2060.
[15] D. Hulicova-Jurcakova, A. M. Puziy, O. I. Poddubnaya, F. Suárez-García, J. M. D. Tascón,
G. Q. Lu, J. Am. Chem. Soc. 2009, 131, 5026.
[16] C.-T. Hsieh, H. Teng, Carbon 2002, 40, 667.
[17] D. Qu, Journal of Power Sources 2002, 109, 403.
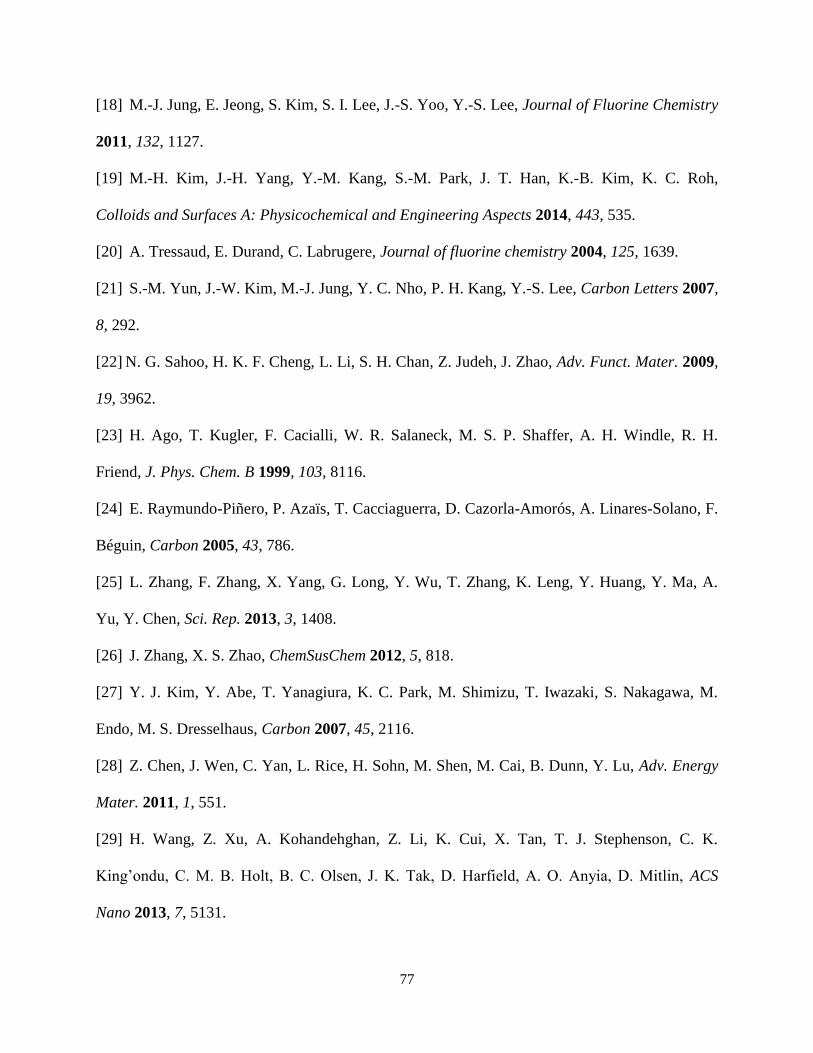
77
[18] M.-J. Jung, E. Jeong, S. Kim, S. I. Lee, J.-S. Yoo, Y.-S. Lee, Journal of Fluorine Chemistry
2011, 132, 1127.
[19] M.-H. Kim, J.-H. Yang, Y.-M. Kang, S.-M. Park, J. T. Han, K.-B. Kim, K. C. Roh,
Colloids and Surfaces A: Physicochemical and Engineering Aspects 2014, 443, 535.
[20] A. Tressaud, E. Durand, C. Labrugere, Journal of fluorine chemistry 2004, 125, 1639.
[21] S.-M. Yun, J.-W. Kim, M.-J. Jung, Y. C. Nho, P. H. Kang, Y.-S. Lee, Carbon Letters 2007,
8, 292.
[22] N. G. Sahoo, H. K. F. Cheng, L. Li, S. H. Chan, Z. Judeh, J. Zhao, Adv. Funct. Mater. 2009,
19, 3962.
[23] H. Ago, T. Kugler, F. Cacialli, W. R. Salaneck, M. S. P. Shaffer, A. H. Windle, R. H.
Friend, J. Phys. Chem. B 1999, 103, 8116.
[24] E. Raymundo-Piñero, P. Azaïs, T. Cacciaguerra, D. Cazorla-Amorós, A. Linares-Solano, F.
Béguin, Carbon 2005, 43, 786.
[25] L. Zhang, F. Zhang, X. Yang, G. Long, Y. Wu, T. Zhang, K. Leng, Y. Huang, Y. Ma, A.
Yu, Y. Chen, Sci. Rep. 2013, 3, 1408.
[26] J. Zhang, X. S. Zhao, ChemSusChem 2012, 5, 818.
[27] Y. J. Kim, Y. Abe, T. Yanagiura, K. C. Park, M. Shimizu, T. Iwazaki, S. Nakagawa, M.
Endo, M. S. Dresselhaus, Carbon 2007, 45, 2116.
[28] Z. Chen, J. Wen, C. Yan, L. Rice, H. Sohn, M. Shen, M. Cai, B. Dunn, Y. Lu, Adv. Energy
Mater. 2011, 1, 551.
[29] H. Wang, Z. Xu, A. Kohandehghan, Z. Li, K. Cui, X. Tan, T. J. Stephenson, C. K.
King’ondu, C. M. B. Holt, B. C. Olsen, J. K. Tak, D. Harfield, A. O. Anyia, D. Mitlin, ACS
Nano 2013, 7, 5131.
78
[30] D. Puthusseri, V. Aravindan, S. Madhavi, S. Ogale, Energy Environ. Sci. 2014, 7, 728.
[31] G.-P. Hao, A.-H. Lu, W. Dong, Z.-Y. Jin, X.-Q. Zhang, J.-T. Zhang, W.-C. Li, Adv. Energy
Mater. 2013, 3, 1421.
[32] J. Huang, B. G. Sumpter, V. Meunier, Angew. Chem. Int. Ed 2008, 47, 520.
[33] O. Barbieri, M. Hahn, A. Herzog, R. Kötz, Carbon 2005, 43, 1303.
[34] H. Shi, Electrochimica Acta 1996, 41, 1633.
[35] J. Gamby, P. L. Taberna, P. Simon, J. F. Fauvarque, M. Chesneau, Journal of Power
Sources 2001, 101, 109.
[36] D. Qu, H. Shi, Journal of Power Sources 1998, 74, 99.
[37] B. Fang, Y.-Z. Wei, K. Suzuki, M. Kumagai, Electrochimica Acta 2005, 50, 3616.
[38] M. Wu, C. Cao, J. Z. Jiang, Nanotechnology 2010, 21, 505202.
[39] X. Kong, Q. Chen, Phys. Chem. Chem. Phys. 2013, 15, 12982.
[40] Y. Zheng, Y. Jiao, L. Ge, M. Jaroniec, S. Z. Qiao, Angew. Chem. Int. Ed. 2013, 52, 3110.
[41] Frisch, M. J. et al.; Gaussian; Gaussian, Inc.: Wallingford CT, 2009.
Supporting Information Reference
[1] R. Yazami, A. Hamwi, K. Guérin, Y. Ozawa, M. Dubois, J. Giraudet, F. Masin,
Electrochemistry Communications 2007, 9, 1850.
[2] Z. Li, G. D. Del Cul, W. Yan, C. Liang, S. Dai, J. Am. Chem. Soc. 2004, 126, 12782.
[3] E. T. Mickelson, C. B. Huffman, A. G. Rinzler, R. E. Smalley, R. H. Hauge, J. L.
Margrave, Chemical Physics Letters 1998, 296, 188.
[4] M.-J. Jung, E. Jeong, J. W. Lim, S. I. Lee, Y.-S. Lee, Colloids and Surfaces A:
Physicochemical and Engineering Aspects 2011, 389, 274.
[5] J. T. Robinson, J. S. Burgess, C. E. Junkermeier, S. C. Badescu, T. L. Reinecke, F. K.

79
Perkins, M. K. Zalalutdniov, J. W. Baldwin, J. C. Culbertson, P. E. Sheehan, E. S. Snow, Nano
Lett. 2010, 10, 3001.
[6] K. Guérin, J. P. Pinheiro, M. Dubois, Z. Fawal, F. Masin, R. Yazami, A. Hamwi, Chem.
Mater. 2004, 16, 1786.
[7] A. Felten, C. Bittencourt, J. J. Pireaux, G. V. Lier, J. C. Charlier, Journal of Applied
Physics 2005, 98, 074308.
[8] R. S. Butter, D. R. Waterman, A. H. Lettington, R. T. Ramos, E. J. Fordham, Thin Solid
Films 1997, 311, 107.
[9] J. Y. Lee, K. H. An, J. K. Heo, Y. H. Lee, J. Phys. Chem. B 2003, 107, 8812.
[10] M.-H. Kim, J.-H. Yang, Y.-M. Kang, S.-M. Park, J. T. Han, K.-B. Kim, K. C. Roh,
Colloids and Surfaces A: Physicochemical and Engineering Aspects 2014, 443, 535.
[11] M.-J. Jung, E. Jeong, S. Kim, S. I. Lee, J.-S. Yoo, Y.-S. Lee, Journal of Fluorine
Chemistry 2011, 132, 1127.
[12] E. Jeong, M.-J. Jung, Y.-S. Lee, Journal of Fluorine Chemistry 2013, 150, 98.
[13] Y. Geng, Y. Song, M. Zhong, J. Shi, Q. Guo, L. Liu, Materials Letters 2010, 64, 2673.

80
Chapter 4: Fluorinated Nanoporous Carbon for
High Voltage Supercapacitors
4.1 Introduction
The increasing consumption of non-renewable fossil fuels and subsequent climate change
pose the challenge for human society to develop clean and sustainable energy resources.[1][2][3]
Supercapacitors, usually considered to bridge the advantages of traditional dielectric capacitor
and batteries, have attracted more and more attention because of their high power density, stable
and long cycling life (>10,000 cycles), no memory effect, low cost, as well as simple charging
circuit installation.[4][5] However, the energy density of commercial supercapacitors ranges
from 5 to 10 Wh kg-1
, which is too low compared with other electrochemical energy storage
systems such as 25-35 Wh kg-1
of lead-acid, 40-100 Wh kg-1
of Ni metal hydride, and 120-170
Wh kg-1
of lithium-ion-batteries.[6] Therefore, a supercapacitor that is capable of delivering high
energy density is attracting more and more attention in energy technology.
Depending on the charge storage mechanism as well as the active materials used, two
main types of supercapacitors can be distinguished. Electric double layer capacitor (EDLC), the
most common devices at present, uses carbon-based active materials with high surface area. The
second group of supercapacitors, known as pseudo-capacitors or redox supercapacitors, uses fast
and reversible surface or near-surface reactions for charge storage. Since supercapacitors
commonly utilize carbon as both (symmetric supercapacitors) or one of the electrodes
(asymmetric supercapacitors), of which the device capacitances are generally limited by the
capacitance of the carbon electrodes, developing better carbon materials with prompted energy
density has been emerging as one the most essential challenges in the field.[7][8]

81
Energy density is dependent on both the capacitance of electrode materials as well as its
working voltage, in which the cell voltage plays a more crucial role since it increases two orders
of magnitude than capacitance. Hence, enlarging the cell working voltage becomes a more
important issue to be addressed.[9][10] Basically for carbon-based EDLCs, the thermodynamic
stability requires locating the differential electrode electrochemical potentials within the LUMO
and HOMO window of the electrolyte.[1] Exceeding the safe voltage window will lead to severe
consequences. First, operation at high voltage approaching the upper limit of the voltage window
of the electrolyte produces a large amount of Joule heat in the supercapacitor cell with large
internal resistance and results in the decomposition of the electrolyte gradually. Second, the
presence of impurities, such as metal and oxygen on the carbon surface, accelerates the
decomposition of the electrolyte at high voltage. As a result, the operation voltage of the carbon-
based sueprcapacitor cell in practical use is often between 2.5-3V, quite lower than the voltage
window of electrolyte with a theoretical value of over 4V. Consequently, how to fully utilize the
full range of voltage window of the electrolyte and therefore increase the energy density of the
supercapacitors remains an unsolved problem in the energy storage field.
Up to now, there have been only a few reports on the development of carbon materials
towards the high-voltage application in supercapacitors. Ali et al extracted the full potential of
single-walled carbon nanotubes (SWCNT) as durable sueprcapacitor electrodes operable at 4V,
in which shows that the highly conductive SWCNT with high purity (>99.98%) would perform
as a promising candidate in the high-voltage application.[11] Cui et al reported the fabrication of
one-dimensional highly electroconductive mesoporous graphene nanofibers (GNFs) by a
chemical vapor deposition method using MgCO3·3H2O fibers as the template, and was used for
a 4V supercapacitor.[12] However, all the reported carbons for high voltage supercapacitors are

82
purely graphitic structure, which mostly rely on the metal-catalysis method through CVD
deposition. Specifically customized equipment is required to ensure the high purity of carbon
nanotube/fibers, making the synthesis method complicated and expensive. Activated carbon,
which is cheap and easy handling, has been widely used as electrode materials for EDLCs. The
specific application for high voltage supercapacitors, however, is really rare since the oxygen-
rich functional groups on activated carbon surface are assumed to decompose at high voltage and
cause a series of problems like increasing resistance, sever self-discharging and poor cycling
performance.[5] Consequently, it is of considerable importance to develop a facial kind of
activated carbon for high voltage supercapacitors and diminish the adverse impact from surface
oxygen-related functional groups.[13]
Fluorine (F), the element with the highest electronegativity, is capable of forming the
fluorine-carbon bond with high polarity and stability.[14][15] F-doped carbons have enabled
widespread applications such as semiconductor-based devices, primary lithium-ion batteries, and
supercapacitors.[16][17][18] Most of the existing F-doped carbons are prepared using gaseous
phase or plasma dissociation of F-containing agents (e.g., F2, XeF2, CF4 et. al.), which are
extremely hazardous and expensive.[19][20][21][22]
Especially for supercapacitors, both
gaseous and isoionic fluorine could corrode the pristine carbon and lead to an unexpected
structural distortion, resulting in decrease of surface area and drop in capacitance.[23][24]
Therefore, it remains a critical challenge to achieve F-doping carbons with high F content, intact
carbon structure and superior electrochemical performance using a facile synthesis approach.
Here, we develop a new kind of fluorinated nanoporous carbon (FNC) which can be
operated under 4V for supercapcitors. This carbon possesses a high surface area up to 3474 m2 g
-
1, and high capacity up to 141 F g
-1 in TEA BF4 electrolyte in propylene carbonate (PC) . After

83
enlarging the working voltage to 4V, the power density of this FNC supercapacitor is increased
to 78.3 Wh/kg, even comparable to the energy density of nickel-hydrogen battery (75 Wh/kg).
The improved supercapacitive performance is speculated to arise from the much stronger
fluorine-carbon bond at high voltage and better wettability of FNC surface with electrolyte.
4.2 Results and Discussion
Figure 4. 1 TEM images of (A) NC and (B) FNC. Insets are the corresponding HRTEM images.
The synthesis method is similar with that discussed in Chapter 3. Briefly,
diphenylsilanediol (DPSD) and resorcinol were used as the starting precursors. The two
precursors were polymerized into silane oil under the catalysis of hydrochloric acid. After
carbonization at high temperature, carbon matrix with embedded ultrafine silica nanoparticles is
obtained due to the atomically integrated organic and inorganic components in the polymer
precursor. Instead of only using DPSD as precursors as discussed in Chapter 3, we also
introduced resorcinol to polymerize with DPSD in this work, and the silica moiety will be more
concentrated in the carbon-surrounded framework. Such hybrid material can ensure the
generation of uniformly distributed and sized nanopores throughout the entire carbon material

84
after removing the silica moiety by hydrofluoric acid (HF) etching. Finally, the as-prepared
nanoporous carbon (denoted as NC) is activated using KOH, and followed by a simple F doping
approach via washing with a mixture of HF and nitric acid. The resulting F-rich nanoporous
carbons (denoted as FNCs) is doped by fluorine from a simple solution based washing, which
effectively increases the stability and capacitance of the nanoporous carbons, offering a new
class of electrode materials for high-voltage supercapacitors.
Figure 4. 2 (A) Nitrogen sorption isotherms and (B) pore size distribution of NC and FNC.
Figure 4. 1 (A) shows the transmission electron microscope (TEM) of the NC. It can be
seen that the NC derived directly from carbonized DPSD/resorcinol composite is dense and
compact with an average pore size below 1nm. The insufficient porosity and small pore size
make the inner region of the NC hardly accessible to electrolyte, which is unfavorable for
electrical double layer charge storage. After activation, as shown in Figure 4. 1 (B), the structure
is significantly loosen and opened up. This pore-enlarging effect is better revealed by the high-
resolution TEM (HRTEM) in the insets of Figure 4. 1 (A) and (B). After KOH activation, the
average pore size of carbon significantly enlarges to over 3nm.

85
Figure 4. 3 XRD images of NC and FNC
The pore structures of NC and FNC are also illustrated by nitrogen-sorption isotherms
and the pore size distributions of the nanoporous carbons before and after the activation and F
doping are shown in Figure 4. 2 (A) and (B). Before the activation, the NC exhibits a
microporous structure (pore size less than 1 nm) with a moderate Brunauer-Emmett-Teller (BET)
surface area of ~ 474 m2 g
-1. After the activation and doping process, the surface area of FNC
could be substantially increased to an exceptionally high value of 3474 m2 g
-1, which is around
seven times that of the NC. Meanwhile abundant mesopores with size centered at around 3nm
are generated. Generally, chemical activation like KOH treatment will lead to a diverse pore size
distribution of carbon structure. However in this work, the pore size distribution of FNC is
uniformly distributed around 3nm to 4nm, which is supposed to come from the uniform
nanopores originated from removing the silicon-atom in the carbon-silica composite.

86
Figure 4. 3 shows the powder X-ray diffraction (XRD) pattern of the carbons before and
after activation. In the spectrum of NC, flat peaks located near 2ϴ values of 21.9°and 43.9°
reflect an amorphos structure of the carbon. Comparing the spectrum of NC to that of FNC
reveals that the intensity of (002) and (100) peaks reduces after activation while its full width
half maximum broadens significantly. A large increase in the low-angle scattering after
activation is also noted, which is regarded as the presence of a high density of pores.[25]
Figure 4. 4 XPS C1s of (A) NC and (B) FNC
The surface chemistry of the samples before and after the activation and F doping is
characterized using X-ray photoelectron spectroscopy (XPS), as shown in Figure 4. 4. The
carbon peak of the non-activated NC (Figure 4. 4A) is deconvolved into four constituents
located at 284.6, 286.2, 287.9, and 289.0 eV, which are assigned to carbon sp2/sp3, C-O, C=O,
and -COO- bonds, respectively.[28][29] In contrast to the control, C1s spectra of the FNC
(Figure 4. 4B) are deconvolved into additional peaks, including CFx (x = 1, 2), CFx (x = 2, 3) that
are located at 288.8 and 290.6eV, respectively.[26] A possible mechanism for such KOH-

87
activation-assisted F doping method has been proposed in Chapter 3. Briefly, during the KOH
activation, carbon reacts with metal alkalis and generates abundant defects, edge carbon atoms
and dangling bonds. When the mixture of reaction products (including carbon, K, K2CO3, K2O,
KOH) is washed with hydrofluoric acid, the potassium compounds are removed and the fresh
unsaturated carbon surface is exposed.[30] To reduce surface energy, the carbon dangling bonds
tend to be terminated by forming covalent bond with foreign groups. In general cases, the
dangling bonds are either stabilized by H or by oxygen compounds, such as phenolic, carbonxyl,
carbonyl and so on.[31] However in this work, fluorine possesses stronger electronegativity than
oxygen, and thus has the priority to bond with the carbon. Consequently, with increasing
activation intensity, higher fluorine content is obtained as a result of more unsaturated carbon
bonds generated during activation.
Figure 4. 5 (A) Cyclic voltammogram of FNC at different working voltage windows under scanning rate
of 50 mV/s, (B) Cyclic voltammogram of FNC at various scan rates under the working voltage window of
4V.
The electrochemical performance of the FNC was evaluated using symmetric two-
electrode cells with non-aqueous electrolyte. Figure 4. 5 (A) shows the typical cyclic
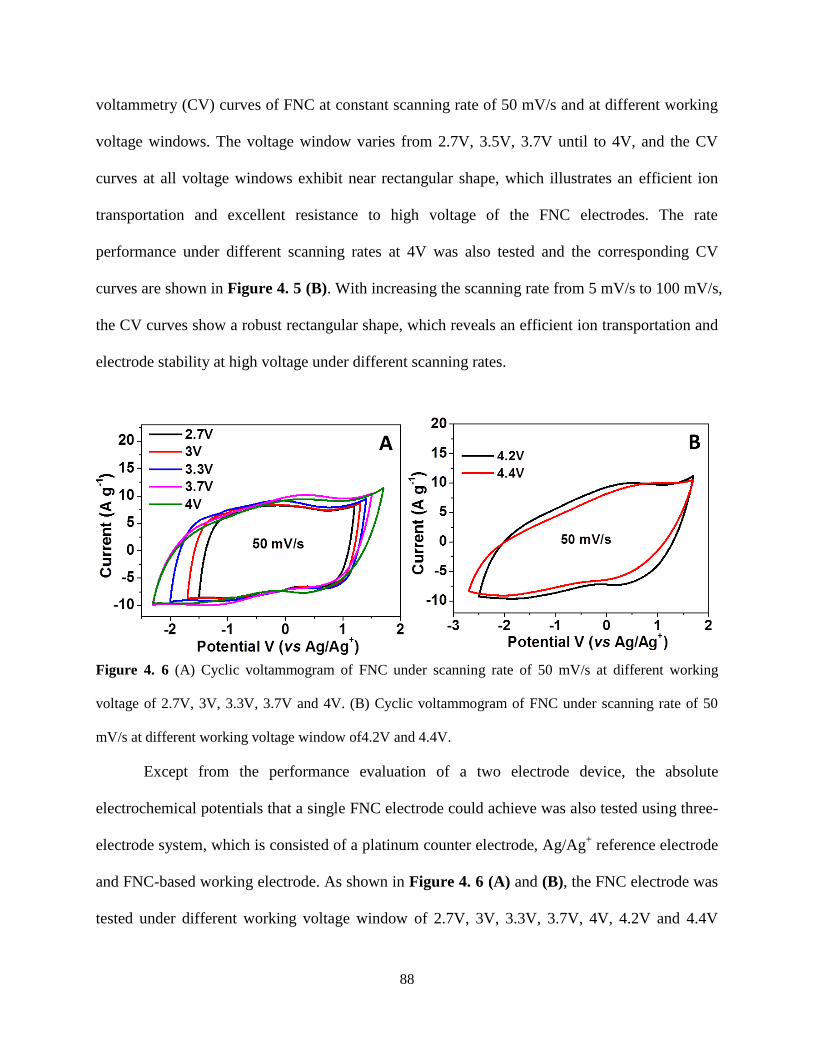
88
voltammetry (CV) curves of FNC at constant scanning rate of 50 mV/s and at different working
voltage windows. The voltage window varies from 2.7V, 3.5V, 3.7V until to 4V, and the CV
curves at all voltage windows exhibit near rectangular shape, which illustrates an efficient ion
transportation and excellent resistance to high voltage of the FNC electrodes. The rate
performance under different scanning rates at 4V was also tested and the corresponding CV
curves are shown in Figure 4. 5 (B). With increasing the scanning rate from 5 mV/s to 100 mV/s,
the CV curves show a robust rectangular shape, which reveals an efficient ion transportation and
electrode stability at high voltage under different scanning rates.
Figure 4. 6 (A) Cyclic voltammogram of FNC under scanning rate of 50 mV/s at different working
voltage of 2.7V, 3V, 3.3V, 3.7V and 4V. (B) Cyclic voltammogram of FNC under scanning rate of 50
mV/s at different working voltage window of4.2V and 4.4V.
Except from the performance evaluation of a two electrode device, the absolute
electrochemical potentials that a single FNC electrode could achieve was also tested using three-
electrode system, which is consisted of a platinum counter electrode, Ag/Ag+ reference electrode
and FNC-based working electrode. As shown in Figure 4. 6 (A) and (B), the FNC electrode was
tested under different working voltage window of 2.7V, 3V, 3.3V, 3.7V, 4V, 4.2V and 4.4V

89
respectively. The detailed voltage range for each test is -1.5 to 1.2V, -1.7 to 1.3V, -2 to 1.3V, -
2.3 to 1.4V and -2.3 to 1.7V respectively. Compared with the initially operation voltage of 2.7V
(-1.5V to 1.2V), the FNC-electrode reaches an extended working window of 4V (-2.3 to 1.7V)
finally. Specifically, this improvement is seen more clearly in the negative scanning region (1.2
V difference from -1.5 to -2.7V). In comparison, the positive scanning region only improved by
0.5V from 1.2V to 1.7V. The near-rectangular shapes of the CV curves at different voltage
windows indicate a well-conserved electrode structure and stable electrochemical properties of
fluorine doped nanocarbons. Additionally, if we extend the voltage to an even higher point of
4.2V and 4.4V (see Figure 4. 6 (B)), the CV curves begin to become distorted and polarized,
which illustrates that the stable testing voltage region may be controlled under 4V and a higher
applied voltage will lead the structure change of the electrode materials.
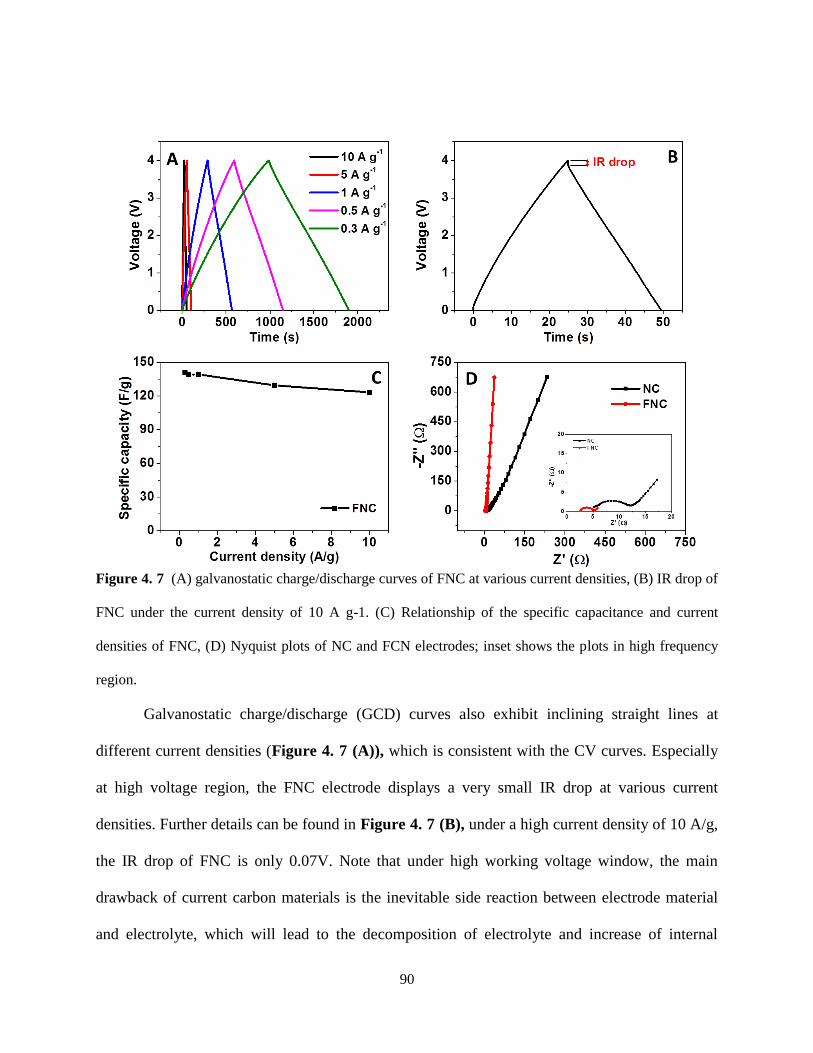
90
Figure 4. 7 (A) galvanostatic charge/discharge curves of FNC at various current densities, (B) IR drop of
FNC under the current density of 10 A g-1. (C) Relationship of the specific capacitance and current
densities of FNC, (D) Nyquist plots of NC and FCN electrodes; inset shows the plots in high frequency
region.
Galvanostatic charge/discharge (GCD) curves also exhibit inclining straight lines at
different current densities (Figure 4. 7 (A)), which is consistent with the CV curves. Especially
at high voltage region, the FNC electrode displays a very small IR drop at various current
densities. Further details can be found in Figure 4. 7 (B), under a high current density of 10 A/g,
the IR drop of FNC is only 0.07V. Note that under high working voltage window, the main
drawback of current carbon materials is the inevitable side reaction between electrode material
and electrolyte, which will lead to the decomposition of electrolyte and increase of internal

91
resistance. Here, the IR drop of FNC electrode at 4V is hardly detected, reflecting the stable
electrochemical performance at high voltage. Based on the GCD analysis, the specific
capacitances of FNCs at different current densities are summarized and compared in Figure 4. 7
(C). In particular, FNC-4 delivers a high specific capacitance of 141 F g-1
at a current density of
0.3 A g-1
, and retains a high value of 123 F g-1
when the current density increases to 10 A g-1
.
To get further insight into the different supercapacitive activity of FNCs, electrochemical
impedance spectroscopy measurements were performed. As shown in Figure 4. 7 (D), the
Nyquist plots consist of a straight line in low frequency region and a semicircle in the high
frequency region, which are typical for electrochemical capacitors. The semicircles in the high
frequency region are illustrated in the inset of Figure 4. 7D. The first intercept of the plots with
x-axis reflects the Ohmic resistance of the cells,[32] whereas the diameter of the semicircle
corresponds to the charge transfer resistance. Compared with NC, it is found that FNC exhibits
smaller Ohmic resistance and charge transfer resistance, which might be due to improved
wettability of electrolyte on carbon surface. Meanwhile, the slope of the straight lines in low
frequency regions of FNC is also sharper than NC, indicating promoted ion/electron
transportation.

92
Figure 4. 8 Ragone plots comparing the energy density and power density of the supercapacitor
based on FNC in this work and representative literature reports: (■) active carbon,[31] (●) graphic
carbon sphere,[5] (▲) sandwich-type carbon nanosheet,[32] (▼) 3D microporous carbon,[33] (♦)
interconnected carbon sheet,[34] (○) DPSD-derived nanoporous carbon in Chapter 3, and (★) FNC
in this work.
In virtue of the high specific capacitance, excellent rate capability and large operation
voltage window, the symmetric supercapacitor assembled based on the representative sample,
namely FNC, shows high energy and power density. As shown in the Ragone plots (Figure 4. 8),
the FNC supercapacitor delivers a high gravimetric energy density of 78.3 Wh kg-1
at a power
output of 307.6 W kg-1
, and the energy density could remain up to 88.1% (69 Wh kg-1
) when the
power density increases to 10041 W kg-1
. Even at a very high power density of 40090 W kg-1
,
the energy density of the supercapacitor is still preserved at 47 Wh kg-1
, almost twice of the
number than the current state of arts, such as activated carbon,[33] hierarchical graphic carbon

93
spheres,[34] interconnected carbon nanosheets,[35] 3D micro-porous carbon from polymer
carbonization,[36] and sandwich-type microporous carbon nanosheets.[37] Particularly, the FNC
supercapacitor shows unparalleled energy density retention at ultra high power output over
10000 W kg-1
and obviously outperforms conventional carbon-based supercapacitors,
manifesting its promising high-power applications.
4.3 Conclusion
In summary, we have developed a novel and facile approach to synthesize fluorine-rich
nanoporous carbons with tunable porosity and F content. The key synthesis procedure involves
KOH activation and subsequent hydrofluoric acid washing of a polymer-derived nanoporous
carbon. The KOH activation process effectively enlarges the pore size, increases the surface area,
and facilitates the F doping in the nanoporous carbons, all of which significantly improve the
electrochemical capacitive performance of the F-rich nanoporous carbons. In particular, this kind
of optimized F-doped carbon shows excellent electrochemical performance even at high voltage
up to 4V. The symmetric cell exhibits a high energy density of 78.3 Wh kg-1
at a power density
of 307.6 W kg-1
, and retains a high value of 47 Wh kg-1
at an ultrahigh power output of 40090 W
kg-1
, which outperforms all of the representative carbon-based supercapacitors. The high
working voltage and high capacitance is speculated to arise from the much stronger fluorine-
carbon bond at high voltage and better wettability of FNC surface with electrolyte. Collectively,
the present study demonstrates a simple and effective strategy to increase the working voltage
and capacitance in carbon-based materials, which would find its broad applications in many
fields such as fuel cells and lithium-ion batteries.
4.4 Experimental S ection

94
Synthesis of nanoporous carbon (NC): Diphenylsilanediol (2.16g) and resorcinol (1.1g) were
dissolved in 20 ml of anhydrous ethanol. Concentrated hydrochloride acid (0.7 ml) was drop
wise added in the solution in 5 min. The solution was continuously stirred and heated at 200 °C
until the solvent evaporated thoroughly and turned into a transparent and viscous oily liquid. The
oily liquid was cooled down under room temperature and then carbonized at 900 °C for 3 h in
nitrogen gas with a heating rate of 3 °C min-1. The as-obtained product was successively washed
with 5 % hydrofluoric acid and distilled water until the solution is neutral. The nanoporous
carbon was finally dried at 110 °C under vacuum.
Synthesis of fluorine-rich nanoporous carbon (FNC): The NC was mixed with potassium
hydroxide under mass ratios of 9:1 (FNC). The samples were then heated to 800 °C for 1 h in
nitrogen gas with a heating rate of 5 °C min-1. The activated samples were washed with a mixing
solution of 20 % hydrofluoric acid and 10 % nitric acid for 5 times. Then the samples were
washed with distilled water and dried at 110°C under vacuum.
Characterizations: Nitrogen-sorption isotherms were measured at 77 K with a Micromeritics
ASAP 2020 analyzer (Micromeritics Instrument Corporation, Norcross, GA). Specific surface
areas (SSA) were calculated by the Brunauer-Emmett-Teller (BET) method and the pore size
distribution was determined from the adsorption branch of the isotherm based on the Barrett-
Joyner-Halenda (BJH) method. TEM analysis was conducted on a FEI Tecnai™ transmission
electron microscope (200kV). Powder X-ray diffraction was operated on the Rigaku MiniFlex II
(Rigaku, Japan) using Cu Kα radiation (λ=0.15406 nm). XPS was conducted with a PHI 3057
spectrometer using Mg Kα X-rays source at 1253.6 eV. Raman spectra were obtained using a
Renishaw 1000, with a 50 objective lens at an excitation wavelength of 514 nm.

95
Electrode Fabrication and Electrochemical Measurements: A two-electrode cell configuration
was used to measure the electrochemical performance of the FNCs. Briefly, 10 % of
polytetrafluoroethylene (PTFE; 5 wt% dispersion in water), 10 % of carbon black and 80 % of
the electrochemical active material was dispersed in ethanol. The slurry was mixed into a paste
using a mortar and pestle, rolled into electrode sheets with size of 0.5 cm * 0.5 cm (size variation
< 5 %). A pair of electrodes typically had a weight of 3 mg (mass variation < 5 %) after drying
overnight at 110 °C under vacuum. The two identical electrodes were assembled into a
symmetric cell, which consisted of two current collectors, two electrodes, and an ion-porous
separator (glass fiber, GF/C from Whatman). Conductive carbon coated aluminum foils were
used as current collectors. The electrolyte was 1 M of tetraethylammoniumtetrafluoroborate
(TEA BF4, Sigma Aldrich) in polypropylene carbonate (PC). The assembly of the test cell was
done in a glove box filled with Ar. The electrochemical impedance measurements were carried
out on a Solartron 1860/1287 Electrochemical Interface (Solartron Analytical, Oak Ridge, TN).
The EIS tests were operated in the frequency range of 10 mHz to 100 kHz with 10 mV AC
amplitude. The cyclic voltammetry test was conducted using EC-LAB on a Bio Logic VMP-3
(Bio Logic Science Instruments, Claix, France). Galvanostatic charge and discharge test was
carried out by LAND CT2000 (Wuhan Jinnuo Electronics, Ltd., Wuhan, China). Symmetric cells
were charged and discharged between 4 and 0 V. The specific gravimetric capacitance of the
supercapacitor cell was calculated according to the following Equation (4.1):
Ccell = IΔt/mΔV (4.1)
where I (A), Δt (s), ΔV (V), and m (g) are the discharge current, discharge time, potential
window during the discharge process, and the mass of a single electrode, respectively. The
specific capacitance of the single electrode was calculated by the following equation of Cs = 2

96
Ccell. The energy density and power density were calculated using the formula in Equation (4.2)
and Equation (4.3):
Es = CsVmax2/8×3.6 (4.2)
Ps = Es/t (4.3)
where Es is the specific energy density, Vmax is the maximum voltage window, Ps is the power
density and t is the discharge time.
Reference
[1] P. Simon, Y. Gogotsi, Materials for electrochemical capacitors, Nat Mater. 7 (2008) 845–854.
doi:10.1038/nmat2297.
[2] N.-S. Choi, Z. Chen, S.A. Freunberger, X. Ji, Y.-K. Sun, K. Amine, et al., Challenges Facing
Lithium Batteries and Electrical Double-Layer Capacitors, Angew. Chem. Int. Ed. 51 (2012)
9994–10024. doi:10.1002/anie.201201429.
[3] H. Chen, T.N. Cong, W. Yang, C. Tan, Y. Li, Y. Ding, Progress in electrical energy storage
system: A critical review, Progress in Natural Science. 19 (2009) 291–312.
doi:10.1016/j.pnsc.2008.07.014.
[4] Y. Zhai, Y. Dou, D. Zhao, P.F. Fulvio, R.T. Mayes, S. Dai, Carbon Materials for Chemical
Capacitive Energy Storage, Adv. Mater. 23 (2011) 4828–4850. doi:10.1002/adma.201100984.
[5] J. Yan, Q. Wang, T. Wei, Z. Fan, Recent Advances in Design and Fabrication of
Electrochemical Supercapacitors with High Energy Densities, Adv. Energy Mater. 4 (2014) n/a–
n/a. doi:10.1002/aenm.201300816.
[6] C. Liu, Z. Yu, D. Neff, A. Zhamu, B.Z. Jang, Graphene-Based Supercapacitor with an
Ultrahigh Energy Density, Nano Lett. 10 (2010) 4863–4868. doi:10.1021/nl102661q.

97
[7] A.G. Pandolfo, A.F. Hollenkamp, Carbon properties and their role in supercapacitors,
Journal of Power Sources. 157 (2006) 11–27. doi:10.1016/j.jpowsour.2006.02.065.
[8] H. Jiang, P.S. Lee, C. Li, 3D carbon based nanostructures for advanced supercapacitors,
Energy Environ. Sci. 6 (2012) 41–53. doi:10.1039/C2EE23284G.
[9] F. Béguin, V. Presser, A. Balducci, E. Frackowiak, Carbons and Electrolytes for Advanced
Supercapacitors, Adv. Mater. 26 (2014) 2219–2251. doi:10.1002/adma.201304137.
[10] L. Dai, D.W. Chang, J.-B. Baek, W. Lu, Carbon Nanomaterials for Advanced Energy
Conversion and Storage, Small. 8 (2012) 1130–1166. doi:10.1002/smll.201101594.
[11] A. Izadi-Najafabadi, S. Yasuda, K. Kobashi, T. Yamada, D.N. Futaba, H. Hatori, et al.,
Extracting the Full Potential of Single-Walled Carbon Nanotubes as Durable Supercapacitor
Electrodes Operable at 4 V with High Power and Energy Density, Adv. Mater. 22 (2010) E235–
E241. doi:10.1002/adma.200904349.
[12] C. Cui, W. Qian, Y. Yu, C. Kong, B. Yu, L. Xiang, et al., Highly Electroconductive
Mesoporous Graphene Nanofibers and Their Capacitance Performance at 4 V, J. Am. Chem. Soc.
136 (2014) 2256–2259. doi:10.1021/ja412219r.
[13] T.-H. Wu, C.-T. Hsu, C.-C. Hu, L.J. Hardwick, Important parameters affecting the cell
voltage of aqueous electrical double-layer capacitors, Journal of Power Sources. 242 (2013) 289–
298. doi:10.1016/j.jpowsour.2013.05.080.
[14] M.-J. Jung, E. Jeong, S. Kim, S.I. Lee, J.-S. Yoo, Y.-S. Lee, V4-18-Fluorination effect of
activated carbon electrodes on the electrochemical performance of electric double layer
capacitors, Journal of Fluorine Chemistry. 132 (2011) 1127–1133.
doi:10.1016/j.jfluchem.2011.06.046.

98
[15] M.-H. Kim, J.-H. Yang, Y.-M. Kang, S.-M. Park, J.T. Han, K.-B. Kim, et al., V4-19-
Fluorinated activated carbon with superb kinetics for the supercapacitor application in
nonaqueous electrolyte, Colloids and Surfaces A: Physicochemical and Engineering Aspects.
443 (2014) 535–539. doi:10.1016/j.colsurfa.2013.12.020.
[16] H. Chang, J. Cheng, X. Liu, J. Gao, M. Li, J. Li, et al., Facile Synthesis of Wide-Bandgap
Fluorinated Graphene Semiconductors, Chem. Eur. J. 17 (2011) 8896–8903.
doi:10.1002/chem.201100699.
[17] R. Yazami, A. Hamwi, K. Guérin, Y. Ozawa, M. Dubois, J. Giraudet, et al., Fluorinated
carbon nanofibres for high energy and high power densities primary lithium batteries,
Electrochemistry Communications. 9 (2007) 1850–1855. doi:10.1016/j.elecom.2007.04.013.
[18] M.-H. Kim, J.-H. Yang, Y.-M. Kang, S.-M. Park, J.T. Han, K.-B. Kim, et al., Fluorinated
activated carbon with superb kinetics for the supercapacitor application in nonaqueous
electrolyte, Colloids and Surfaces A: Physicochemical and Engineering Aspects. 443 (2014)
535–539. doi:10.1016/j.colsurfa.2013.12.020.
[19] H. Touhara, F. Okino, Property control of carbon materials by fluorination, Carbon. 38
(2000) 241–267. doi:10.1016/S0008-6223(99)00140-2.
[20] Y.-S. Lee, Syntheses and properties of fluorinated carbon materials, Journal of Fluorine
Chemistry. 128 (2007) 392–403. doi:10.1016/j.jfluchem.2006.11.014.
[21] E.T. Mickelson, C.B. Huffman, A.G. Rinzler, R.E. Smalley, R.H. Hauge, J.L. Margrave,
Fluorination of single-wall carbon nanotubes, Chemical Physics Letters. 296 (1998) 188–194.
doi:10.1016/S0009-2614(98)01026-4.

99
[22] K. Guérin, J.P. Pinheiro, M. Dubois, Z. Fawal, F. Masin, R. Yazami, et al., Synthesis and
Characterization of Highly Fluorinated Graphite Containing sp2 and sp3 Carbon, Chem. Mater.
16 (2004) 1786–1792. doi:10.1021/cm034974c.
[23] M.-J. Jung, E. Jeong, J.W. Lim, S.I. Lee, Y.-S. Lee, Physico-chemical surface
modification of activated carbon by oxyfluorination and its electrochemical characterization,
Colloids and Surfaces A: Physicochemical and Engineering Aspects. 389 (2011) 274–280.
doi:10.1016/j.colsurfa.2011.08.013.
[24] M.-J. Jung, E. Jeong, S. Kim, S.I. Lee, J.-S. Yoo, Y.-S. Lee, Fluorination effect of
activated carbon electrodes on the electrochemical performance of electric double layer
capacitors, Journal of Fluorine Chemistry. 132 (2011) 1127–1133.
doi:10.1016/j.jfluchem.2011.06.046.
[25] Y. Zhu, S. Murali, M.D. Stoller, K.J. Ganesh, W. Cai, P.J. Ferreira, et al., Carbon-Based
Supercapacitors Produced by Activation of Graphene, Science. 332 (2011) 1537–1541.
doi:10.1126/science.1200770.
[26] N.G. Sahoo, H.K.F. Cheng, L. Li, S.H. Chan, Z. Judeh, J. Zhao, V4-22-Specific
Functionalization of Carbon Nanotubes for Advanced Polymer Nanocomposites, Adv. Funct.
Mater. 19 (2009) 3962–3971. doi:10.1002/adfm.200901486.
[27] H. Ago, T. Kugler, F. Cacialli, W.R. Salaneck, M.S.P. Shaffer, A.H. Windle, et al., V4-
23-Work Functions and Surface Functional Groups of Multiwall Carbon Nanotubes, J. Phys.
Chem. B. 103 (1999) 8116–8121. doi:10.1021/jp991659y.
[28] A. Tressaud, E. Durand, C. Labrugere, V4-20-Surface modification of several carbon-
based materials: comparison between CF4 rf plasma and direct F2-gas fluorination routes,

100
Journal of Fluorine Chemistry. 125 (2004) 1639–1648.
http://cat.inist.fr/?aModele=afficheN&cpsidt=16343490 (accessed April 28, 2015).
[29] E. Raymundo-Piñero, P. Azaïs, T. Cacciaguerra, D. Cazorla-Amorós, A. Linares-Solano,
F. Béguin, V4-24-KOH and NaOH activation mechanisms of multiwalled carbon nanotubes with
different structural organisation, Carbon. 43 (2005) 786–795. doi:10.1016/j.carbon.2004.11.005.
[30] L. Zhang, F. Zhang, X. Yang, G. Long, Y. Wu, T. Zhang, et al., V4-25-Porous 3D
graphene-based bulk materials with exceptional high surface area and excellent conductivity for
supercapacitors, Sci. Rep. 3 (2013). doi:10.1038/srep01408.
[31] J. Zhang, X.S. Zhao, V4-32-On the Configuration of Supercapacitors for Maximizing
Electrochemical Performance, ChemSusChem. 5 (2012) 818–841. doi:10.1002/cssc.201100571.
[32] Y.J. Kim, Y. Abe, T. Yanagiura, K.C. Park, M. Shimizu, T. Iwazaki, et al., V4-33-Easy
preparation of nitrogen-enriched carbon materials from peptides of silk fibroins and their use to
produce a high volumetric energy density in supercapacitors, Carbon. 45 (2007) 2116–2125.
doi:10.1016/j.carbon.2007.05.026.
[33] Z. Chen, J. Wen, C. Yan, L. Rice, H. Sohn, M. Shen, et al., V4-34-High-Performance
Supercapacitors Based on Hierarchically Porous Graphite Particles, Adv. Energy Mater. 1 (2011)
551–556. doi:10.1002/aenm.201100114.
[34] H. Wang, Z. Xu, A. Kohandehghan, Z. Li, K. Cui, X. Tan, et al., V4-35-Interconnected
Carbon Nanosheets Derived from Hemp for Ultrafast Supercapacitors with High Energy, ACS
Nano. 7 (2013) 5131–5141. doi:10.1021/nn400731g.
[35] D. Puthusseri, V. Aravindan, S. Madhavi, S. Ogale, V4-36-3D micro-porous conducting
carbon beehive by single step polymer carbonization for high performance supercapacitors: the

101
magic of in situ porogen formation, Energy Environ. Sci. 7 (2014) 728–735.
doi:10.1039/C3EE42551G.
[36] G.-P. Hao, A.-H. Lu, W. Dong, Z.-Y. Jin, X.-Q. Zhang, J.-T. Zhang, et al., V4-37-
Sandwich-Type Microporous Carbon Nanosheets for Enhanced Supercapacitor Performance,
Adv. Energy Mater. 3 (2013) 1421–1427. doi:10.1002/aenm.201300383.
102
Chapter 5: Facial Aerosol-assisted Synthesis of
Hierarchical Porous Carbon for Li-Ion Battery
5.1 Introduction
Modern civilization has become dependent on fossil fuels of finite supply and uneven
global distribution, which leads to severe problematic consequences like vulnerability of nation
states to fossil-fuel imports, exceeding CO2 emissions and environmental pollutions such as
global warming. Clear and distributed energy supply is significantly required to secure a
sustainable and environmental friendly energy resource. Among the multi-optional alternative
choices, lithium ion batteries (LIB) have been extensively used in portable electronic devices due
to their high energy density and long cycle life.[1][2][3] The ever-increasing and urgent demand
for the widespread application in electric or hybrid electric vehicles has largely promoted the
global research interests to develop LIBs with high reversible capacity, excellent rate capability
and cycling stability.[4]
Graphite, the most commonly used commercial anode material, outperforms than many
other anode alternatives (Si, Sn, P, et al) due to its excellent features such as flat and low
working potential vs. lithium, low cost and good cycling life.[5] However, graphite allows the
intercalation of only one Li-ion with six carbon atoms, with a resulting stoichiometry of LiC6 and
thus an equivalent reversible capacity of only 372 mA h g-1
.[6] Additionally, the diffusion rate of
lithium ion into graphite is between 10-9
and 10-7
cm2 s
-1, which results in batteries in low power
density limited rate capability.[7][8] Therefore, there is an urgency to develop a kind of carbon
materials that could allow efficient lithium ion mobility and improved capacity.

103
Many carbonaceous anode materials with various microstructures have been investigated
consequently, such as carbon nanotubes,[9] nanofibers,[10] nanobeads,[11] hollow
nanospheres,[12] graphene, porous carbon,[13] and their hybrids.[14][15][16]. Chen et al
develops a kind of two-dimensional (2D) porous graphitic carbon nanosheets as a high-rate
anode material for lithium storage. The reversible capacity of up to 722 mA h/g at current
density of 100 mA/g after 100 cycles was achieved.[5] Sun et al obtained the 1D nanocarbons by
surfactant–template assembly for use of lithium anode, and the carbon nanofibers demonstrated
good rate performance (reversible capacity of 160 mA h/g at current density of 1500 mA/g,
which is much higher than the commercial artificial graphite. Among these materials,
nanostructured porous carbon attracts much more attention in providing high lithiation capability
and excellent cycling stability because the porous nanostructure can not only shorten the
transport length for Li+ ions but also offer large electrode/electrolyte interface for the charge-
transfer reaction. Generally, template-assisted methods involving hard and soft templates could
be the most frequently used technique to prepare porous carbons, which is either based on
coating carbon precursor onto existed solid template structures or decomposing soft template
agent during the carbonization process. [17] This strategy allows for fine control of hollow cores
by selection of different template sizes. However, the conductivity of porous carbon may be
infected compared with the solid carbon structure, since the hollow pore space is insulated and
therefore increase the internal resistance. Furthermore, it is very difficult to control the diameter
of hollow pores below 100 nm, a size that is critical to the nanoscale effects. This is due to the
preferential aggregation of small template particles, which leads to ill-defined hollow structures.
Consequently, a nanoporous structure with high conductivity and well-controlled pore size

104
distribution is emerging as a big challenge in the field of carbon materials as anodes for lithium
ion batteries.
5.2 Results and Discussion
Scheme 5.1, (A) DPSD-nickel composite particles after aerosol process, (B) hierarchical porous carbon
after template removal, (C) the aerosol process used to synthesize the carbon particles.
Here, we report the design and fabrication of high-performance anode material for
lithium ion batteries based on hierarchically porous graphite particles. As illustrated in Scheme 1
(A) and (B), our carbon electrodes are constructed from such particles containing hierarchical
porous structure including micro-, meso and macropores. In comparison to the graphite with low
capacitance, and activated carbon with low conductivity and poor rate performance, this unique

105
structure provides the critical features required for high-performance carbon anode electrodes: i)
the multi-scale pores provide the electrode with high surface areas and active sites to facilitate
the interaction between electrolyte ions and carbon surface, ii) uniform particle size distribution
and hierarchically interconnected micropores, mesopores and macropors facilitate ion transport,
which ensure high rate capability; iii) graphitic carbon structure catalyzed by nickel could
provide excellent electronic conductivity towards for high rate capability.
The synthesis of such particles is based on a simple aerosol process. First,
diphenylsilanediol was chosen as the starting precursor for polymerization under the catalyst of
hydrochloric acid. The polymerized silane oil was then dispersed in an approximate amount of
anhydrous ethanol. Nickel nitrate was dissolved and dispersed in deionized water. After mixing
the DPSD-containing ethanol solution and aqueous nickel nitrate solution, a homogeneous
emulsion solution was prepared for the further use. The aerosol processing was as reported
before,[18] as shown in Scheme 1, the mixing solution underwent an atomization process using
nitrogen as the carrier gas to form continuously generated aerosol droplets, which were passed
through a heating zone and converted into nanocomposite particles. Subsequent carbonization in
the presence of the nickel moieties converted the polymerized DPSD into graphitized carbon.
Further removal of the templates as well as the silica in DPSD resulted in graphitized, porous
carbon particles with high surface area and hierarchical pores. It is important to point out that
such a continuous synthesis approach can be scaled up.
Figure 5. 1 shows the representative scanning electron microscope (SEM) and
transmission electron microscope (TEM) images of the aerosol-carbon particles. It is shown in
Figure 5. 1 (A) that most of the carbons are sphere-like particles with a size ranging from 300nm
to 1um, which are much smaller than that of the activated carbon normally used in commercial

106
devices (5-20 um). The generally uniform particle size distribution is attributed to the facile
fabrication process of aerosol, in which the atomizer produces meso-sized droplets automatically.
Figure 5. 1 (A) SEM image of the obtained aerosol-assisted hierarchical porous carbon. (B) and (C) are
the TEM images of the aerosol-assisted hierarchical porous carbon. (D) the graphitic lattice under TEM
view of the products.
The in-depth structure information is further revealed by TEM images as shown in
Figure 5. 1 (B). It is observed that the carbon particles are intrinsically hollow and the thickness
of carbon shell is only 5 to 10nm. Furthermore, except from the macro-sized hollow space inside
the carbon particles, there are also abundant ring-like mesopores embedded on the carbon wall,

107
which can be seen from Figure 5. 1 (C). The size of the mesopores ranges from 3 to 10 nm,
providing effective surface area to interact with electrolyte and improve the ion transportation
efficiently. Figure 5. 1 (D) shows that the high-resolution image of the outer edge of the ring-
like mesopores. A graphitic structure with lattice distance around 3.1 Å can be observed,
indicating the mesopores are originated from the nickel clusters and the graphitic ring-like outer
edge is due to the nickel catalyzed graphitization. There are about ten graphitized layers in the
graphitic zone, and the rest of the carbon shells are still composed of amorphous carbon, as
shown in Figure 5. 1 (D). The micropores in the amorphous carbon region have an average size
below 1nm and it mainly comes from the removal of silica atoms from DPSD. The micropores
provide a high surface area and active sites for the lithium ion storage. This unique hierarchical
porous structure consisting of macropores, mesopores as well as micropores establish an inter-
connected and consistent carbon network, which is beneficial for electrolyte penetration and ion
transportation. Moreover, the rich pores also perform as a lithium ion reservoir and improve the
capacitance accordingly.

108
Figure 5. 2, (A) X-ray diffraction pattern of the aerosol-assisted hierarchical graphitic carbon. (B) the
isothermal nitrogen-sorption isotherms and inset is pore-size distributions of the aerosol-assisted
hierarchical graphitic carbon.
The phase structure of the as-prepared aerosol-assisted hierarchical graphitic carbons
(AHGC) was detected by the wide-angle X-ray diffraction test, and it is shown in Figure 5. 2
(A). The diffraction of the AHGC exhibits a strong peak located at 2ϴ=26.32o and 44.36
o, which
is associated with the graphite (002) and (100) plane. Pore structure of the AHGC was
investigated using nitrogen-sorption experiments. Figure 5. 2 (B) and its inset show the
nitrogen-sorption isotherms and pore-size distributions of the particles, which clearly suggest the
coexistence of the micropors and mesorpores. The nitrogen adsorption-desorption isotherms of
the AHGC are typical of type IV according to the International Union of Pure and Applied
Chemistry nomenclature, and they exhibit a prominent hysteresis loop at a relative pressure in
the range of 0.45~0.97. A sharp increase of nitrogen uptake above 0.97 and a slow increase of
nitrogen uptake below 0.45 can also be observed, indicating that the AHGC should also have
macropores and micropores as well in their pore structure. On the basis of the above results, it
can be concluded that pore structure of AHGC is hierarchical because of the simultaneous
presence of macropores, mesopores, and micropores, which can be further verified by the pore
size distribution plot of inset Figure 5. in Figure 5. 2 (B). From the pore size distribution, the
pore size was estimated to be concentrated distributed below 1nm and 4.01nm, and the AHGC
show a BET specific surface area of 736 m2/g and a pore volume of 0.32 cm
3/g. The pore size
below 1nm is speculated to come from the removed atomic silica from polymerized DPSD. It is
specifically noticed that the pore size distribution in the mesopore region is quite concentrated at
around 4.01nm, indicating that the nickel-based catalyst is embedded uniformly among the

109
carbon matrix. Since it remains a long-existed challenge to prevent the aggregation and over-
growth of nickel clusters in traditional synthesis of nickel-catalyzed graphitic carbon. Here in our
approach, the aerosol process ensures a short standing time of reaction due to the gas flow
passing by tube furnace consistently and rapidly. The high temperature at 900oC immediately
evaporates the precursor solution and pre-carbonized the nickel-DPSD composites, leaving no
time for further aggregation of nickel clusters. In line with the SEM and TEM images, it is
revealed that after the metal-catalyst-assisted pyrolysis and carbonization, highly porous
graphitic carbon was synthesized. The pores in the AHGC were probably induced by the
catalyzed effect and the elimination of the Ni-based nanoparticles from the carbon. The co-
existed micropores are originated from the removal of silica in the polymerized DPSD clusters.

110
The lithium-ion insertion/extraction reactions of the AHGC electrode were first
investigated by cyclic voltammetry (CV) tests. Figure 5. (3) shows representative CV curves of
the AHGC electrode conducted over voltages between 0.01V and 3V at a scanning rate of 5
mV/s. In the first scanning cycle, we can clearly see one obvious cathodic current peaks located
at around 0.375V, although it disappeared during the second cycle. This result may be attributed
to some irreversible reactions associated with the decomposition of electrolyte, the formation of
a SEI film, and/or loss of some irreversible lithium storage sites during the initial cathodic
scan.[19][20][21][22][23][24] In addition, it should be noted that after the initial scanning cycle ,
the CV profiles of the following cycles are almost overlapped, which indicates that the structural
integrity of the AHGC electrode is well preserved during subsequent charge-discharge cycles.
Moreover, the typical CV characteristics of AHGC are completely different from those of

111
reduction/oxidation reactions of NiO/Ni(OH)2, further indicating that the nickel related metal
oxides have been completely removed from the AHGC.
Figure 5.3 (A) The cyclic voltammetry test of AHGC carbon, (B) the 1st, 2
nd and 3
rd galvanostatic
charging and discharging profile, (C) rate performance of commercial graphite 325 and AHGC, (D)
cycling performance of AHGC after rate performance test.
Figure 5. 3 (B) depicts the galvanostatic charge-discharge profiles of the AHGC
electrode at 85 mA/g within a cutoff voltage window of 0.01 to 3V versus Li+/Li. As can be seen,
the charge and discharge curves exhibit a common shape that is similar to other carbonaceous
nanostructures. In the initial discharge curves, the voltage drops fast, with one plateau appearing
at around 0.9V and most of the discharge capacity decreasing between 0.01V to 0.9V. As for the
112
charge curves, it behaves nearly steep lines at the applied voltage window. In addition, it is worth
noted that the first discharge process disappeared after the first cycle, which may be due to the
irreversible insertion of lithium into the deep-seated superfine micropores.[25][26][27][28]
Figure 5. 3 (D) shows the rate performance of the AHGC electrode at different current
rates (from 0.5C to 10 C, 1C=372 mA/g). At a charge-discharge rate of 1C, a reversible capacity
of over 1376 mA h/g was obtained, indicating a high reversible capacity of the AHGC electrodes.
When the current rate is increased to high rates of 3C, the electrode still can deliver 997 mAh/g,
which is larger than the theoretical capacity of a commercial graphite anode (~372 mAh/g).[29]
Even at ultrahigh current rates of 5C and 10C, large reversible capacities of 732 and 599 mAh/g
are still obtained, respectively. Remarkably, when the current rate was restored to 0.5 C after 50
cycles at different rates, a reversible capacity was still retained at 1539mAh/g after 50 cycles.
These results suggest that the AHGC possess an easy charge-transport process and that the
structure of the AHGC remains extraordinarily stable even under high rate cycling.
To understand the reasons for the excellent rate performance of the AGHC electrode
material, EIS measurements were performed, and the results are displayed in Figure 5. 4 (A). As
can be seen, the impedance spectra obtained of AGHC electrode and commercial graphite
electrode are composed of a depressed semicircle arc in the high-to-medium frequency region
and a linear tail in the low-frequency region. The semicircle at high frequency is an indication of
SEI resistance (RSEI) and contact resistance (Rf), the semicircle across the medium-frequency
region represents the charge-transfer impedance (Rct) between the electrode and the electrolyte,
and the linear tail is the Warburg impedance (Zw) associated with the diffusion of lithium ions in
the carbon electrodes (Re). [14][31][32] According to Figure 5. 4 (A), we find that the diameters
of the semicircles at both the high and medium frequencies of AHGC-based electrode are larger

113
than that of commercial graphite electrode. This result implies that the aerosol-assisted
hierarchical graphitic carbon possesses a high electronic conductivity and a low contact and
charge-transfer resistances, which are very beneficial for the fast insertion/extraction of lithium
ions and thus results in a remarkable improvement of the rate performance of the AHGC
electrode.[14][32][30][31]
Figure 5. 4 (A) Impedance spectra of AHGC and commercial graphite 325 electrode, (B) After rate test,
the cycling performance of the commercial graphite 325 and AHGC at a charging/discharging rate of 10C.
A comparison of commercial graphite 325 with our AHGC electrodes demonstrates a
much larger reversible capacity and superior cycling performance after rate test at high charge-
discharge rate of 10C (Figure 5. 4 (B)).[23][20][33][14][34][27][28][26][12][35][36][5] The
outstanding electrochemical performance of the AHGC material is due to its well graphitized and
hierarchical porous structure as well as the large specific surface area and the porous structures.
First, the integrative feature and porous nature of carbon can ensure a large contact area between
the electrode and electrolyte, which is very beneficial for the access of liquid electrolyte into the
interior of the lithium ions into the deep locations of the stacked graphene layers. Furthermore,
the micropores derived from DPSD matrix are also very favorable for the adsorption of lithium
ions storage. Second, the well-graphitized micrometer-sized carbon can form a continuous

114
conductive network, which gives rise to the very high electronic conductivity of the overall
electrode and is thus very beneficial for improving the rate performance of the electrode. Third,
the carbon with outstanding mechanical flexibility and stability can accommodates the volume
changes upon lithium insertion and thus can preserve the structural integrity of the whole
electrode. Finally, the abundant macropores and mesopores can alleviate the local volume
expansions of the nanosheet electrode during the charge-discharge processes, which can endow
the electrode with structural integrity and stability and thus lead to superior lithium storage
capacity and cycling stability at high rates. [28]
5.3 Conclusion
In this chapter, we developed a simple process to produce the hierarchical porous
graphitic carbon through a facial aerosol-assisted method. The porous carbon shows an ultra-
high and stable lithium ion capacitance up to 1539 mA h/g at 1C and still remains 599 mA h/g
even under the charging/discharging rate of 10C. The superior electrochemical performance is
speculated to arise from the hierarchical porous and high conductive graphitic structure, which
will lead the carbon to perform as a promising candidate in many other fields, such as
supercapacitors and fuel cells.
5.4 Experimental Section
Material Synthesis Diphenylsilanediol (3g) was dissolved in 20 ml of anhydrous ethanol.
Concentrated hydrochloride acid (0.7 ml) was drop wise added in the solution in 5 min. The
solution was continuously stirred and refluxed at 100 °C for 2 hours. 2.3g nickel nitrate was
dissolved in water first, and then mix with the DPSD-containing ethanol to form a stable
emulsion dispersion. The final solution was sent through an atomizer using nitrogen as a carrier
gas. The automizer dispersed the solution into aerosol droplets, which was then passed through a

115
ceramic tube that was heated to 900oC. The particles were then collected on a membrane filter in
apress, and subsequent carbonizationto 900oC of the composite nanoparticles under nitrogen
atmosphere resulted in the formation of nickel/DPSD-derived carbon composite. 1M HF solution
and 1M HNO3 were used in sequence to remove the nickel and silica to produce the porous
carbon particles with hierarchically porous graphite carbon.
Material Chracterization Nitrogen-sorption isotherms were measured at 77 K with a
Micromeritics ASAP 2020 analyzer (Micromeritics Instrument Corporation, Norcross, GA).
Specific surface areas (SSA) were calculated by the Brunauer-Emmett-Teller (BET) method and
the pore size distribution was determined from the adsorption branch of the isotherm based on
the Barrett-Joyner-Halenda (BJH) method. TEM analysis was conducted on a FEI Tecnai™
transmission electron microscope (200kV). Powder X-ray diffraction was operated on the Rigaku
MiniFlex II (Rigaku, Japan) using Cu Kα radiation (λ=0.15406 nm).
Electrochemical measurement. A coin-type test cell (CR2032) was utilized to evaluate
the electrochemical performance of the aerosol-assisted hierarchical porous carbon electrode.
The working electrode was produced by coating the mixture of hierarchical porous carbon (80
wt%), carbonaceous additive (acetylene black, 10 wt%), and poly(vinylidene difluoride) (PVDF,
10 wt%) binder on copper foil, which was first dried in a vacuum furnace at 80oC for 4h and
then at 120 oC for 12h. The lithium metal was used as counter electrode, and the separator was
Whatman® glass microfiber filters, Grade GF/C. The electrolyte used in this work is a 1M LiPF6
solution in a mixture (1:1:1, in vol%) of dimethyl carbonate (DMC), ethylene carbonate (EC),
and ethylmethyl carbonate (EMC). The cells were assembled in an argon-filled glovebox in
which both the moisture and oxygen contents were controlled to be less than 0.1ppm. The
electrochemical impedance measurements were carried out on a Solartron 1860/1287

116
Electrochemical Interface (Solartron Analytical, Oak Ridge, TN). The EIS tests were operated in
the frequency range of 10 mHz to 100 kHz with 10 mV AC amplitude. The cyclic voltammetry
test was conducted using EC-LAB on a Bio Logic VMP-3 (Bio Logic Science Instruments, Claix,
France). Galvanostatic charge and discharge test was carried out by LAND CT2000 (Wuhan
Jinnuo Electronics, Ltd., Wuhan, China).
Reference
[1] J.B. Goodenough, K.-S. Park, The Li-Ion Rechargeable Battery: A Perspective, J. Am. Chem.
Soc. 135 (2013) 1167–1176. doi:10.1021/ja3091438.
[2] P. Roy, S.K. Srivastava, Nanostructured anode materials for lithium ion batteries, J. Mater.
Chem. A. 3 (2015) 2454–2484. doi:10.1039/C4TA04980B.
[3] S. Goriparti, E. Miele, F. De Angelis, E. Di Fabrizio, R. Proietti Zaccaria, C. Capiglia,
Review on recent progress of nanostructured anode materials for Li-ion batteries, Journal of
Power Sources. 257 (2014) 421–443. doi:10.1016/j.jpowsour.2013.11.103.
[4] N. Nitta, G. Yushin, High-Capacity Anode Materials for Lithium-Ion Batteries: Choice of
Elements and Structures for Active Particles, Part. Part. Syst. Charact. 31 (2014) 317–336.
doi:10.1002/ppsc.201300231.
[5] L. Chen, Z. Wang, C. He, N. Zhao, C. Shi, E. Liu, et al., Porous Graphitic Carbon
Nanosheets as a High-Rate Anode Material for Lithium-Ion Batteries, ACS Appl. Mater.
Interfaces. 5 (2013) 9537–9545. doi:10.1021/am402368p.
[6] E. Peled, C. Menachem, D. Bar‐Tow, A. Melman, Improved Graphite Anode for Lithium‐
Ion Batteries Chemically Bonded Solid Electrolyte Interface and Nanochannel Formation, J.
Electrochem. Soc. 143 (1996) L4–L7. doi:10.1149/1.1836372.

117
[7] K. Persson, V.A. Sethuraman, L.J. Hardwick, Y. Hinuma, Y.S. Meng, A. van der Ven, et al.,
Lithium Diffusion in Graphitic Carbon, J. Phys. Chem. Lett. 1 (2010) 1176–1180.
doi:10.1021/jz100188d.
[8] N.A. Kaskhedikar, J. Maier, Lithium Storage in Carbon Nanostructures, Adv. Mater. 21
(2009) 2664–2680. doi:10.1002/adma.200901079.
[9] X.X. Wang, J.N. Wang, H. Chang, Y.F. Zhang, Preparation of Short Carbon Nanotubes and
Application as an Electrode Material in Li-Ion Batteries, Adv. Funct. Mater. 17 (2007) 3613–
3618. doi:10.1002/adfm.200700319.
[10] Q. Sun, X.-Q. Zhang, F. Han, W.-C. Li, A.-H. Lu, Controlled hydrothermal synthesis of
1D nanocarbons by surfactant-templated assembly for use as anodes for rechargeable lithium-ion
batteries, J. Mater. Chem. 22 (2012) 17049–17054. doi:10.1039/C2JM33030J.
[11] J.-C. Chang, Y.-F. Tzeng, J.-M. Chen, H.-T. Chiu, C.-Y. Lee, Carbon nanobeads as an
anode material on high rate capability lithium ion batteries, Electrochimica Acta. 54 (2009)
7066–7070. doi:10.1016/j.electacta.2009.07.020.
[12] S. Yang, X. Feng, L. Zhi, Q. Cao, J. Maier, K. Müllen, Nanographene-Constructed
Hollow Carbon Spheres and Their Favorable Electroactivity with Respect to Lithium Storage,
Adv. Mater. 22 (2010) 838–842. doi:10.1002/adma.200902795.
[13] W.-Q. Tian, X.-Y. Wu, K.-X. Wang, Y.-M. Jiang, J.-F. Wang, J.-S. Chen, Hierarchical
porous carbon spheres as an anode material for lithium ion batteries, RSC Adv. 3 (2013) 10823–
10827. doi:10.1039/C3RA40667A.
[14] S. Chen, W. Yeoh, Q. Liu, G. Wang, Chemical-free synthesis of graphene–carbon
nanotube hybrid materials for reversible lithium storage in lithium-ion batteries, Carbon. 50
(2012) 4557–4565. doi:10.1016/j.carbon.2012.05.040.

118
[15] C. de las Casas, W. Li, A review of application of carbon nanotubes for lithium ion
battery anode material, Journal of Power Sources. 208 (2012) 74–85.
doi:10.1016/j.jpowsour.2012.02.013.
[16] Y. Liu, Y.M. Wang, B.I. Yakobson, B.C. Wood, Assessing Carbon-Based Anodes for
Lithium-Ion Batteries: A Universal Description of Charge-Transfer Binding, Phys. Rev. Lett.
113 (2014) 028304. doi:10.1103/PhysRevLett.113.028304.
[17] B. Sakintuna, Y. Yürüm, Templated Porous Carbons: A Review Article, Ind. Eng. Chem.
Res. 44 (2005) 2893–2902. doi:10.1021/ie049080w.
[18] Z. Chen, J. Wen, C. Yan, L. Rice, H. Sohn, M. Shen, et al., High-Performance
Supercapacitors Based on Hierarchically Porous Graphite Particles, Advanced Energy Materials.
1 (2011) 551–556. doi:10.1002/aenm.201100114.
[19] H. Kim, Z. Wen, K. Yu, O. Mao, J. Chen, Straightforward fabrication of a highly
branched graphene nanosheet array for a Li-ion battery anode, J. Mater. Chem. 22 (2012) 15514–
15518. doi:10.1039/C2JM33150K.
[20] X.-C. Chen, W. Wei, W. Lv, F.-Y. Su, Y.-B. He, B. Li, et al., A graphene-based
nanostructure with expanded ion transport channels for high rate Li-ion batteries, Chem.
Commun. 48 (2012) 5904–5906. doi:10.1039/C2CC32276E.
[21] F. Liu, S. Song, D. Xue, H. Zhang, Folded Structured Graphene Paper for High
Performance Electrode Materials, Adv. Mater. 24 (2012) 1089–1094.
doi:10.1002/adma.201104691.
[22] G. Wang, X. Shen, J. Yao, J. Park, Graphene nanosheets for enhanced lithium storage in
lithium ion batteries, Carbon. 47 (2009) 2049–2053. doi:10.1016/j.carbon.2009.03.053.

119
[23] E. Yoo, J. Kim, E. Hosono, H. Zhou, T. Kudo, I. Honma, Large Reversible Li Storage of
Graphene Nanosheet Families for Use in Rechargeable Lithium Ion Batteries, Nano Lett. 8 (2008)
2277–2282. doi:10.1021/nl800957b.
[24] Q. Sun, X.-Q. Zhang, F. Han, W.-C. Li, A.-H. Lu, Controlled hydrothermal synthesis of
1D nanocarbons by surfactant-templated assembly for use as anodes for rechargeable lithium-ion
batteries, J. Mater. Chem. 22 (2012) 17049–17054. doi:10.1039/C2JM33030J.
[25] S. Yang, X. Feng, L. Zhi, Q. Cao, J. Maier, K. Müllen, Nanographene-Constructed
Hollow Carbon Spheres and Their Favorable Electroactivity with Respect to Lithium Storage,
Adv. Mater. 22 (2010) 838–842. doi:10.1002/adma.200902795.
[26] G. Li, L. Xu, Q. Hao, M. Wang, Y. Qian, Synthesis, characterization and application of
carbon nanocages as anode materials for high-performance lithium-ion batteries, RSC Adv. 2
(2011) 284–291. doi:10.1039/C1RA00631B.
[27] J. Yang, X. Zhou, J. Li, Y. Zou, J. Tang, Study of nano-porous hard carbons as anode
materials for lithium ion batteries, Materials Chemistry and Physics. 135 (2012) 445–450.
doi:10.1016/j.matchemphys.2012.05.006.
[28] F.-D. Han, Y.-J. Bai, R. Liu, B. Yao, Y.-X. Qi, N. Lun, et al., Template-Free Synthesis of
Interconnected Hollow Carbon Nanospheres for High-Performance Anode Material in Lithium-
Ion Batteries, Adv. Energy Mater. 1 (2011) 798–801. doi:10.1002/aenm.201100340.
[29] M. Yoshio, H. Wang, K. Fukuda, T. Umeno, T. Abe, Z. Ogumi, Improvement of natural
graphite as a lithium-ion battery anode material, from raw flake to carbon-coated sphere, J.
Mater. Chem. 14 (2004) 1754–1758. doi:10.1039/B316702J.

120
[30] Y. Fang, Y. Lv, R. Che, H. Wu, X. Zhang, D. Gu, et al., Two-Dimensional Mesoporous
Carbon Nanosheets and Their Derived Graphene Nanosheets: Synthesis and Efficient Lithium
Ion Storage, J. Am. Chem. Soc. 135 (2013) 1524–1530. doi:10.1021/ja310849c.
[31] S. Yin, Y. Zhang, J. Kong, C. Zou, C.M. Li, X. Lu, et al., Assembly of Graphene Sheets
into Hierarchical Structures for High-Performance Energy Storage, ACS Nano. 5 (2011) 3831–
3838. doi:10.1021/nn2001728.
[32] C. He, S. Wu, N. Zhao, C. Shi, E. Liu, J. Li, Carbon-Encapsulated Fe3O4 Nanoparticles
as a High-Rate Lithium Ion Battery Anode Material, ACS Nano. 7 (2013) 4459–4469.
doi:10.1021/nn401059h.
[33] D. Wan, C. Yang, T. Lin, Y. Tang, M. Zhou, Y. Zhong, et al., Low-Temperature
Aluminum Reduction of Graphene Oxide, Electrical Properties, Surface Wettability, and Energy
Storage Applications, ACS Nano. 6 (2012) 9068–9078. doi:10.1021/nn303228r.
[34] J. Yang, X. Zhou, Y. Zou, J. Tang, A hierarchical porous carbon material for high power,
lithium ion batteries, Electrochimica Acta. 56 (2011) 8576–8581.
doi:10.1016/j.electacta.2011.07.047.
[35] Z.-J. Fan, J. Yan, T. Wei, G.-Q. Ning, L.-J. Zhi, J.-C. Liu, et al., Nanographene-
Constructed Carbon Nanofibers Grown on Graphene Sheets by Chemical Vapor Deposition:
High-Performance Anode Materials for Lithium Ion Batteries, ACS Nano. 5 (2011) 2787–2794.
doi:10.1021/nn200195k.
[36] B. Guo, X. Wang, P.F. Fulvio, M. Chi, S.M. Mahurin, X.-G. Sun, et al., Soft-Templated
Mesoporous Carbon-Carbon Nanotube Composites for High Performance Lithium-ion Batteries,
Adv. Mater. 23 (2011) 4661–4666. doi:10.1002/adma.201102032.
121
Chapter 6: Conclusion
Energy storage performance of current carbon-based electrochemical double layer
capacitors and lithium ion batteries are constrained by poor carbon properties. The work in this
dissertation is to address the limitation of current carbon materials with low energy density by
rational structure designs according to well-recognized principles and criteria. The overall
research strategy is to design and synthesis functional carbon materials with high energy density
at both aqueous and organic electrolyte systems. From the definition of energy density
(E=CV2/2), the design methodology is to have carbon electrodes with high capacitance and high
working voltage.
Different types of carbon architectures were investigated and compared with
conventional structures to demonstrate such design concepts. In the first part of this thesis, a
new class of nanoporous carbon was represented towards the application of symmetric
supercapacitors in aqueous Li2SO4 electrolyte. A unique precursor was adopted to ensure the
generation of uniformly distributed nanopores and large surface area. Specifically, this kind of
carbon also showed outperformed high capacitance, excellent rate performance and stable
cycling even under a high working voltage of 1.6V. The second part of work further improved
the carbon electrode capacitance by enhancing the carbon surface affinity in organic electrolyte
through a simple fluorine doping. Higher capacitance and enlarged energy density was obtained
consequently. In the third part of the thesis, an optimized carbon framework was created with an
impressive large surface area, high capacitance and high working voltage of 4V in organic
electrolyte, showing outstanding energy density which is comparable to current commercial lead-
acid battery. Other parts of work also explore the fabrication of hierarchical graphitic carbon
used for lithium ion batteries and supercapacitors. In a word, by a rational design of carbon

122
materials through optimized pore configuration and more comparable surface chemistry, the
carbon electrode energy density in different parts of this thesis were improved incrementally.
Collectively, this thesis systematically unveils simple and effective strategies to achieve
high performance carbon-based supercapacitors with high power density and high energy density.
The contributions of this thesis are dedicated to the following aspects:
1) High electrode capacitance and favorable ion/electron transportation pathway by well-
designed carbon framework with uniform pore size distribution, interconnected pore
configuration and high surface area.
2) High electrode capacitance and fully utilization of surface area through enhanced affinity
between carbon and electrolyte by doping heteroatoms.
3) Fundamentally explore and understand the roles of heteroatom doping chemistry in the
influence of carbon capacitor behavior by both experimental measurement and
computational modeling.
4) Extensively improve the energy density of carbon electrode by enlarging the working
voltage of capacitors both in aqueous and organic electrolyte.
5) Scalable and effective production of hierarchically porous graphite particles through
aerosol process to act as better anode materials for lithium ion batteries.
The strategies above can be extended as a general design platform for many other high
performance energy storage materials towards broad applications, such as supercapacitors, fuel
cells, lithium-ion batteries and so on.