Hydrogen storage by carbon materials synthesized from oil seeds and fibrous plant materials
12
International Journal of Hydrogen Energy 32 (2007) 4238 – 4249 www.elsevier.com/locate/ijhydene Hydrogen storage by carbon materials synthesized from oil seeds and fibrous plant materials Maheshwar Sharon a , ∗ , T. Soga b , Rakesh Afre b , D. Sathiyamoorthy c , K. Dasgupta c , Sunil Bhardwaj a , Madhuri Sharon d , Sandesh Jaybhaye a a Nanotechnology Research Center, Birla College, Kalyan 421304, India b Graduate School of Engineering, Nagoya Institute of Technology, Nagoya, Japan c Powder Metallurgy Division, BARC, Trombay 400 085, India d Monad Nanotech Pvt. Ltd., A702 Bhawani Tower, Powai, Mumbai 400 076, India Received 30 January 2007; received in revised form 28 May 2007; accepted 28 May 2007 Available online 11 September 2007 Abstract Carbon materials of various morphologies have been synthesized by pyrolysis of various oil-seeds and plant’s fibrous materials. These materials are characterized by SEM and Raman. Surface areas of these materials are determined by methylene blue method. These carbon porous materials are used for hydrogen storage. Carbon fibers with channel type structure are obtained from baggas and coconut fibers. It is reported that amongst the different plant based precursors studied, carbon from soyabean (1.09 wt%) and baggas (2.05 wt%) gave the better capacity to store hydrogen at 11 kg/m 2 pressure of hydrogen at room temperature. Efforts are made to correlate the hydrogen adsorption capacity with intensities and peak positions of G- and D-band obtained with carbon materials synthesized from plant based precursors. It is suggested that carbon materials whose G-band is around 1575 cm −1 and the intensity of D-band is less compared to G-band, may be useful material for hydrogen adsorption study. 2007 International Association for Hydrogen Energy. Published by Elsevier Ltd. All rights reserved. Keywords: Porous carbon; Oil seed; Hydrogen adsorption; Carbon from plant’s fiber; Carbon from oil seeds 1. Introduction Hydrogen storage on carbon materials has recently been at- tracting attention because of the importance of hydrogen as an ideal substitute for fossil fuels. Iijima’s discovery of carbon nanotubes (CNTs) in 1991 sparked intense research activity due to their unusual mechanical and electronic properties [1]. The pioneer work by Dillon et al. [2] on the possibility of 5–10 wt% storage in single-walled carbon nanotubes (SWNTs) aroused interest to research into hydrogen adsorption by CNT [3]. Liu et al. [4] measured the H 2 storage capacity of MWCNTs syn- thesized by hydrogen arc-discharge method, with a relatively large sample quantity (about 500 mg) at ambient temperature under a modestly high pressure (about 10 MPa). They found that ball milling of MWCNTs improves the H 2 adsorption ∗ Corresponding author. Tel.: +91 251 2230054; fax: +91 251 2231029. E-mail address: [email protected] (M. Sharon). 0360-3199/$ - see front matter 2007 International Association for Hydrogen Energy. Published by Elsevier Ltd. All rights reserved. doi:10.1016/j.ijhydene.2007.05.038 capacity. The enhancement of hydrogen adsorption might result from the increase of defects and surface area of the multi-wall carbon nanotubes (MWNTs) caused by ball milling. SWCNTs treated with aqueous solution of HCl and heat- treated under vacuum condition is reported to adsorb H 2 up to 4.2wt%. Activated carbons have shown high hydrogen ad- sorption capabilities [5,6]. Hydrogen adsorption by commercial activated carbon has been studied at 77–298 K and pressures up to 9 MPa. The amount of gas that can be stored depends on the adsorbent characteristics and the operational conditions [7]. The exact mechanism and the factors responsible to help the hydrogen adsorption process are still not very well estab- lished. However, it has been proposed that hydrogen can be adsorbed by CNTs in two ways, physisorption and chemisorp- tion. Physisorption of hydrogen occurs in CNTs by trapping hydrogen molecules inside the cylindrical structure of the nan- otube or by trapping hydrogen in the interstitial sites between nanotubes.
Transcript of Hydrogen storage by carbon materials synthesized from oil seeds and fibrous plant materials

International Journal of Hydrogen Energy 32 (2007) 4238–4249www.elsevier.com/locate/ijhydene
Hydrogen storage by carbon materials synthesized from oil seedsand fibrous plant materials
Maheshwar Sharona,∗, T. Sogab, Rakesh Afreb, D. Sathiyamoorthyc, K. Dasguptac,Sunil Bhardwaja, Madhuri Sharond, Sandesh Jaybhayea
aNanotechnology Research Center, Birla College, Kalyan 421304, IndiabGraduate School of Engineering, Nagoya Institute of Technology, Nagoya, Japan
cPowder Metallurgy Division, BARC, Trombay 400 085, IndiadMonad Nanotech Pvt. Ltd., A702 Bhawani Tower, Powai, Mumbai 400 076, India
Received 30 January 2007; received in revised form 28 May 2007; accepted 28 May 2007Available online 11 September 2007
Abstract
Carbon materials of various morphologies have been synthesized by pyrolysis of various oil-seeds and plant’s fibrous materials. Thesematerials are characterized by SEM and Raman. Surface areas of these materials are determined by methylene blue method. These carbonporous materials are used for hydrogen storage. Carbon fibers with channel type structure are obtained from baggas and coconut fibers. It isreported that amongst the different plant based precursors studied, carbon from soyabean (1.09 wt%) and baggas (2.05 wt%) gave the bettercapacity to store hydrogen at 11 kg/m2 pressure of hydrogen at room temperature. Efforts are made to correlate the hydrogen adsorptioncapacity with intensities and peak positions of G- and D-band obtained with carbon materials synthesized from plant based precursors. It issuggested that carbon materials whose G-band is around 1575 cm−1 and the intensity of D-band is less compared to G-band, may be usefulmaterial for hydrogen adsorption study.� 2007 International Association for Hydrogen Energy. Published by Elsevier Ltd. All rights reserved.
Keywords: Porous carbon; Oil seed; Hydrogen adsorption; Carbon from plant’s fiber; Carbon from oil seeds
1. Introduction
Hydrogen storage on carbon materials has recently been at-tracting attention because of the importance of hydrogen as anideal substitute for fossil fuels. Iijima’s discovery of carbonnanotubes (CNTs) in 1991 sparked intense research activity dueto their unusual mechanical and electronic properties [1]. Thepioneer work by Dillon et al. [2] on the possibility of 5–10 wt%storage in single-walled carbon nanotubes (SWNTs) arousedinterest to research into hydrogen adsorption by CNT [3]. Liuet al. [4] measured the H2 storage capacity of MWCNTs syn-thesized by hydrogen arc-discharge method, with a relativelylarge sample quantity (about 500 mg) at ambient temperatureunder a modestly high pressure (about 10 MPa). They foundthat ball milling of MWCNTs improves the H2 adsorption
∗ Corresponding author. Tel.: +91 251 2230054; fax: +91 251 2231029.E-mail address: [email protected] (M. Sharon).
0360-3199/$ - see front matter � 2007 International Association for Hydrogen Energy. Published by Elsevier Ltd. All rights reserved.doi:10.1016/j.ijhydene.2007.05.038
capacity. The enhancement of hydrogen adsorption might resultfrom the increase of defects and surface area of the multi-wallcarbon nanotubes (MWNTs) caused by ball milling.
SWCNTs treated with aqueous solution of HCl and heat-treated under vacuum condition is reported to adsorb H2 upto 4.2 wt%. Activated carbons have shown high hydrogen ad-sorption capabilities [5,6]. Hydrogen adsorption by commercialactivated carbon has been studied at 77–298 K and pressures upto 9 MPa. The amount of gas that can be stored depends on theadsorbent characteristics and the operational conditions [7].
The exact mechanism and the factors responsible to helpthe hydrogen adsorption process are still not very well estab-lished. However, it has been proposed that hydrogen can beadsorbed by CNTs in two ways, physisorption and chemisorp-tion. Physisorption of hydrogen occurs in CNTs by trappinghydrogen molecules inside the cylindrical structure of the nan-otube or by trapping hydrogen in the interstitial sites betweennanotubes.

M. Sharon et al. / International Journal of Hydrogen Energy 32 (2007) 4238–4249 4239
Table 1Details of conditions under which pyrolysis of various plant-based fibers were used to get carbon nanomaterials and values of their density and yields are alsogiven.
Name of the precursors Pyrolysis conditions Density carbon (g/cc)
Pyrolysis temp. (◦C) Yield (%) Time (h) Gas
Baggas (Sacharum officinarum) 850 28.0 3 Nitrogen 0.23Corn 850 27.58 3 Nitrogen 0.36Rice straw 850 31.17 3 H2/N2 0.28Jute straw (Corchorus capsularis) 850 20.76 3 Nitrogen 0.22Coconut fiber 850 23.87 3 Nitrogen 0.32Bamboo 850 25.22 4 Nitrogen 0.46
Table 2Details of conditions under which pyrolysis of various plant-based seeds were used to get carbon nanomaterials (Density of carbon nanomaterials and theiryields are also given.)
Name of the substance Pyrolysis conditions Density (g/cc)
Temp. (◦C) Yield (%) Time (h) Gas
Soyabean (Glysin maze) 850 20.4 4 Hydrogen 0.664Til (Sessamum indicum) 850 14.3 3 Hydrogen 0.777Sunflower (Helianthus annus) 850 17.9 3 Hydrogen 0.716Castor (Ricinus communis) 850 11.8 4 Hydrogen 0.94Kardi (Carthamus tinctorius) 850 11.6 3 Hydrogen 0.714Ambadi (Crotalaria juncea) 850 30.0 3 Nitrogen 0.619Rye (Drassica rapa) 850 30.3 4 Nitrogen 0.759Anacardium (Semecarpus anacardium) 850 31.9 4 Nitrogen 0.690Bitter almond (Prunus amygdalus) 850 20.3 4 Hydrogen 0.729Ritha seed (Soapnut, Sapindus) 850 26.0 3 Nitrogen 0.61Supari seed (Areca catechu) 850 18.8 3 Nitrogen 0.63Khajur seed (Datepalm) 850 19.8 3 Nitrogen 0.71Neem seed (Azadirachta Indica au Jus) 850 20.0 3 Hydrogen 0.56
During chemisorption the hydrogen is exothermically ad-sorb to the top sites of carbon atoms on the tube wall, formingan arch-type geometry, essentially hydrogen atoms bonded toevery carbon atom on the outside of the tube wall [8]. Thisenhances sp3-like hybridizations in the tube and expands thenanotube diameter. It is expected that larger the tube diame-ters more is the hydrogen storage capacity. Excessive hydro-gen storage results in large repulsive energies and eventuallybreakdown the tube wall. Lee et al. [9] concluded that theserepulsive energies determine the maximum storage capacity ofhydrogen inside nanotubes and the stability of the tubes.
Chen et al. [10] has reported H2 uptake of 20 and 14 wt%with Li doped and K-doped MWNTs in milligram quantities,respectively, under ambient pressure. The K-doped MWNTsthough can adsorb H2 at room temperature, but they are chem-ically unstable, whereas the Li-doped MWNTs are chemicallystable, but require elevated temperatures (473–673 K) for max-imum adsorption and desorption of H2. Hydrogen adsorption inCNTs has been obtained at temperatures below 100 K and peak-ing at temperatures between 150 and 200 K. On the other hand,at room temperature hydrogen adsorption can be increased byincreasing the storage pressure. Thus the efficient hydrogenstorage in CNTs requires a specific tube size [11], pressure,and temperature. Perhaps due to these specific properties of
carbon materials, it has been difficult to reproduce variousclaims made by various scientists.
According to Chahine and Benard [12] hydrogen adsorptionof 6.5 wt% is required for an electric vehicle powered by a hy-drogen fuel to achieve a range of 500 km. Thus for making hy-drogen storage an economically viable sources of energy, thehost (e.g., carbon material) should be able to adsorb 6.5 wt%.To achieve this target, there is a need to select the carbon ma-terials with right type of diameter, surface area and presenceof specific combination of sp3 and sp2 carbon into the carbonmaterials [11]. The process of synthesis of the carbon nanoma-terials should also be economically viable.
Most of the carbon nanomaterials have been synthesizedfrom precursors based on the fossil fuels like petroleum prod-ucts, acetylene, etc. These precursors are destined to get de-pleted one day. Moreover, the cost of these raw materials isexpected to keep on increasing day by day. It is therefore nec-essary that we look for precursors which are plant based andthat too of such type which do not need much of special carefor the cultivation. If we succeed in this search, there wouldnever be any fear of them getting depleted.
Sharon et al. [13–15] have been trying to synthesize vari-ous carbon materials from precursors derived from plant ma-terials (e.g., camphor, turpentine oil, etc.). As an extension of

4240 M. Sharon et al. / International Journal of Hydrogen Energy 32 (2007) 4238–4249
this work, it was thought to use various types of oil seeds (e.g.,soyabeans, mustered, etc.), and plant based fibers (like sugarcane baggas, coconut fibers, etc.) to synthesize carbon mate-rials and study their capability to store hydrogen. Since thesematerials are solid, pyrolysis could be done without the use ofany catalyst. If we succeed in this exploration, then productionof carbon fibers could be easy and economical.
Keeping these ideas in mind selection of plant fibers (Table 1)and various oil seeds (Table 2) were made. These materialswere pyrolysed under nitrogen/hydrogen atmosphere at suitabletemperature. Products obtained were analyzed by SEM, Ramanand their hydrogen storage studies were made. This paper givesan account of our efforts made in this direction.
2. Experimental results and discussions
2.1. Synthesis of carbon nanomaterials from plant based oilseeds and fibers
Seeds or fibers were pyrolysed at suitable temperatures inatmosphere free from oxygen. Details of the conditions aregiven in Tables 1 and 2. The apparatus for pyrolysis is describedelsewhere [16]. A quartz boat kept in a furnace was loadedwith oil’s seed or fibers of known weight (Fig. 1). Nitrogen gaswas flushed into the horizontal quartz tube containing quartzboat to remove air. Then hydrogen or nitrogen gas (as per theset conditions given in Tables 1 and 2) was allowed to flowwith a flow rate of 6 ml/min. Furnace was then switched on toattain the set temperature of 850 ◦C. When desired temperaturesreached, furnace was left on for a set time and then switchedoff. After cooling the furnace, carbon materials were taken outand powdered. These materials were then weighed and yieldof carbon nanomaterials was calculated. It was observed thatyield was in the range of 20–30% (Tables 1 and 2). Densityof carbon materials was also calculated and found to be inthe range of 0.5–0.9 g/cm3 for carbon obtained from oil seedsand 0.2–0.5 g/cm3 for carbon obtained from fibers suggestingcarbon materials obtained from fibrous precursors were lighter.These materials were characterized for their morphology andstructure.
2.2. SEM micrographs of carbon materials
SEM micrographs for carbon materials obtained from variousoil seeds and fibrous plant precursors were taken (Figs. 2–4). All
Fig. 1. A self-explanatory schematic diagram of pyrolysing unit used forpreparationof carbon materials from plant based precursors.
of them are of size measuring to several micrometers. Detailsof the morphologies of carbon materials obtained from theseprecursors are summarized in Tables 3 and 4.
2.3. Raman spectra of carbon materials
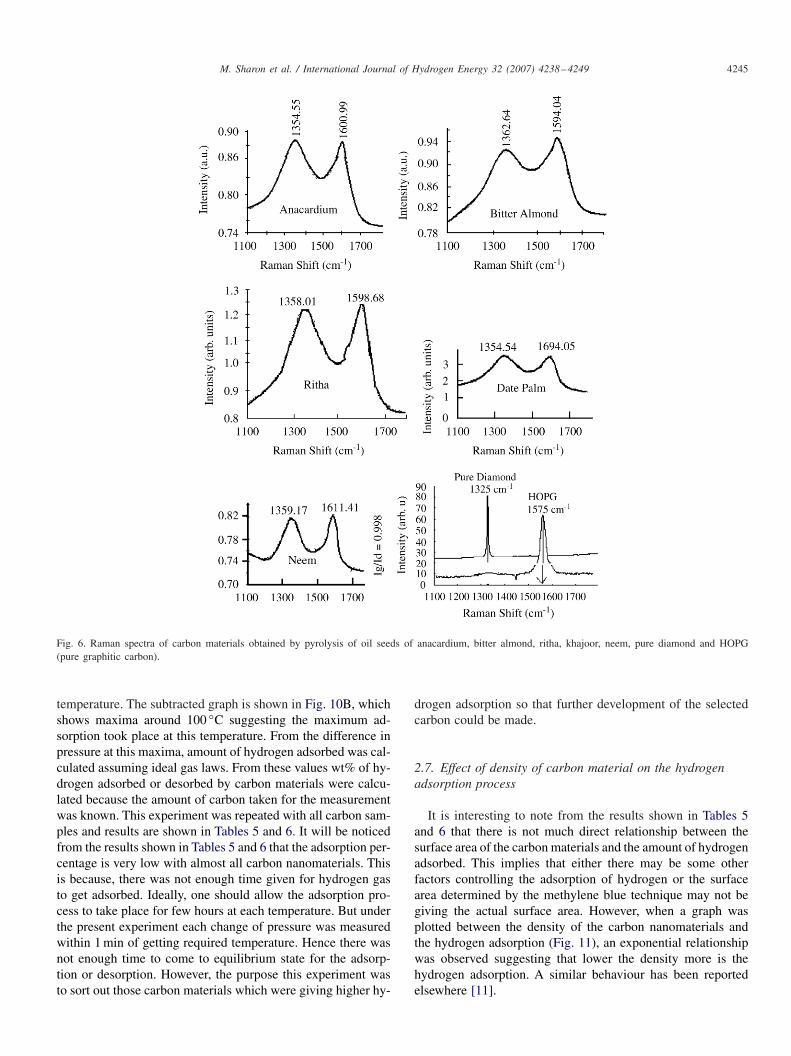
Raman spectra of carbon materials synthesized from variousoil seeds and fibers are shown in Figs. 5–7. The spectrum revealsthat all of them possess D-band in the range of 1351–1360 cm−1
with the exception of carbon materials obtained from ambadiwhich shows D-band at 1380 cm−1. Similarly G-band for thesematerials falls in the range of 1581–1604 cm−1. Carbon mate-rials obtained from anacardium, bitter almond and neem showsG-band at wave number greater than 1600 cm−1, while all oth-ers show at lower wave number. On comparison with Ramanspectra of pure diamond and HOPG, Raman spectra of fi-brous precursors (Table 1) show very small shift in the Ramanspectra. Moreover, the intensities of G-band and D-band arehigher for carbon materials prepared from riha, date palm andambadi.
2.4. Surface area measurement
Surface area of carbon materials was determined by methy-lene blue method [10]. For this purpose, standard solution ofmethylene blue was made in concentration range 10−1 M to10−6 M. All solutions were made in distilled water. Methy-lene blue spectrum was obtained with spectrophotometer(Systronic, India) to find out its � max which was found tobe 670 nm.
At this wavelength, optical density (OD) was determined foreach of the standard solution. A standard calibration graph ofOD versus concentration of methylene blue (in terms of ppm)was plotted (graph not shown here). In a separate experiment,in a flask containing 10 cc of 0.1 M methylene blue solution,15 mg of carbon material was added and left for over night atroom temperature for attaining the equilibrium. The bottle wasclosed to avoid any evaporation of liquid. After 24 h OD of thesupernant liquid was measured. With the help of standard cal-ibration graph, the corresponding value of total concentrationof methylene blue left in the solution was found out. The dif-ference of concentration of methylene blue was taken as thequantity of methylene blue adsorbed by 15 mg of carbon mate-rial. From these results, surface area of carbon material (CNM)was calculated as
S = Ng × A × N × 10−20
M, (1)
where S is the specific surface area (m2/g) of carbon material,Ng is the number of molecules of methylene blue adsorbed byCNM, A is the surface area of one molecule of methylene blue(197.2 A2), N is Avogadro number (6.02 × 10⁻²³ mol−1) andM is the molecular weight of methylene blue (373.9 g).
Surface areas of each of the carbon materials were calculatedand values are given in Tables 5 and 6.

M. Sharon et al. / International Journal of Hydrogen Energy 32 (2007) 4238–4249 4241
Fig. 2. SEM micrographs of carbon obtained from oil seeds of kardi, caster, ambadi, riha, superi, soyabean, till and bitter almonds.
Amongst the carbon materials obtained from oil seeds, sur-face area of carbon materials obtained from kardi and casterwere the highest in the range of 64–67 m2/g and lowest were forcarbon obtained from rye, sunflower and neem seeds. Amongstthe carbon materials obtained from fibrous precursors, carbonof baggas gave the highest surface area 187.66 m2/g. More-over, this surface area is highest amongst all precursors tried inthis experiment.
2.5. Relationship between density and surface area of thecarbon materials
It is reported that a good absorber for good hydrogen ab-sorption should possess large surface area and low density sothat low weight materials could give good high hydrogen ad-sorption [11]. In order to find out the relationship between thesurface area and density of carbon nanomaterials, two graphs

4242 M. Sharon et al. / International Journal of Hydrogen Energy 32 (2007) 4238–4249
Fig. 3. SEM micrographs of carbon obtained from oil seed of date palm, anacardium, neem, rye and sunflower.
were plotted one for carbon materials obtained from fibrousprecursors and other for carbon obtained from oil seeds (Fig. 8).It is interesting to observe that as the density decreased for car-bon materials the surface area increased. The results of carbonmaterials obtained from oil seeds showed very large scatteringcompared to those obtained with fibrous precursors. Moreover,densities of fibers were much smaller to those obtained fromoil seeds and conversely was true for the surface area (Tables 5and 6), which suggests that hydrogen adsorption with carbonmaterials from fibrous may give better hydrogen adsorption.
2.6. Hydrogen adsorption studies
Hydrogen adsorption by carbon materials was studied using aunit described in Fig. 9. This unit is safe to work with hydrogenpressure up to 15 kg/m2 and has a total empty space of 40 cc.Hydrogen storage by each of carbon material was studied byapplying hydrogen pressure of 11 kg/m2.
This unit was evacuated at 0.2 mm pressure and left for 24 hto examine any leakages at low pressure. After confirming
the absence of any leakage, hydrogen gas was filled into theassembly (G) at a pressure of 11 kg/m2 and left for 24 h. Itwas observed that there was no leakage in the unit either underthe vacuum condition or under positive pressure of 11 kg/m2
in 24 h.After ascertaining no leakage, following procedures were
adopted to measure the adsorption of hydrogen gas by carbonnanomaterials.
This unit was filled with hydrogen gas at a pressure of11 kg/m2 through the inlet valve (E). The heater (B) wasswitched on and temperature of sample holder (H) was mea-sured with thermocouple (F).
With the help of a PID controller temperature of sampleholder was increased slowly and corresponding change in pres-sure of hydrogen was measured. A graph was plotted betweenthe change of pressure and temperature of sample holder. Graphof a typical run is shown in Fig. 10A-X. This graph was usedas a reference graph to show the variation of pressure due tochange of temperature. After performing this experiment, hy-drogen gas was removed from the unit and carbon material

M. Sharon et al. / International Journal of Hydrogen Energy 32 (2007) 4238–4249 4243
Fig. 4. SEM micrographs of carbon materials produced from pyrolysis of corn, rice straw, jute straw, coconut fiber, bamboo fiber and baggas fiber.
Table 3Morphology of carbon materials synthesized from various oil seeds as seen from SEM micrographs (Figs. 2 and 3)
Carbon materials from precursors Nature of carbon particle
Kardi Each particle made of stacks of platelets of approximate 400 �mCaster Rectangular shape, 100 �m × 60 �m containing pores of ∼5 �m sizeAmbadi Like damaged brick width 100 �m and diagonal length 325 �m with no poresRitha Appears like stack of cotton’s wigs, pores on broaden side size ∼6.8 �mSupari seed Looks like spongy sea rock of craters sizes 20–50 �m with pores size ∼5 �mSoyabean seed Upper surface like dry dates, contains some pores of size ∼1.5 �mTill Like broken stone pieces with some pores of size around 20 �mBitter almonds Looks like sea rock with many craters of sizes 10–30 �mDate palm Shape same as bitter almonds crater size 5–10 �mAnacardium Stacks of 1 �m tapes length 200 �m with empty space and holes ∼0.5 �mNeem Like a rock of various pores of size ranging 1–10 �mRye Like a child shoe filled with rectangular granules of 1–5 �m sizeSunflower Like human head’s bone with pores of size 20 �m
(5 g) was loaded to the sample holder (H). The unit (G) wasevacuated and heated to about 300 ◦C under the vacuum andleft under vacuum for 24 h. This was done to remove any ad-
sorbed gasses by the carbon material. Next day the unit wascooled down to room temperature and unit (G) was filled withhydrogen at pressure of 11 kg/m2. The sample holder (H) was

4244 M. Sharon et al. / International Journal of Hydrogen Energy 32 (2007) 4238–4249
Table 4Morphology of carbon materials synthesized from various fiberous plant as seen from SEM micrographs (Fig. 4)
Carbon from fiberous precursors Shape of carbon as seen from SEM
Corn Sea rock with many craters ∼40.80 �mRice straw A bundle of hollow cylindrical channels of diam. ∼20 �mJute straw Open channels ∼10 �m with cotton like fibers spread over surfaceCoconut fiber Stacks of rectangular hollow channels of 5–8 �m sizeBamboo fiber Stack of hollow channels filled with boats like structure ∼20 × 20 �mBaggas fiber Stacks of rectangular hollow channels ∼10.15 �m and length ∼150 �m
Fig. 5. Raman spectra of carbon materials obtained by pyrolysis of oil seeds of soyabean, till, sunflower, caster, kardi and ambadi.
then heated gradually by the PID controller and correspond-ing change in the pressure of hydrogen was measured. A graphwas plotted between the hydrogen pressure and the tempera-ture (Fig. 10A-Y). This graph showed the variation of pressuredue to adsorption of hydrogen at different temperature as welldue to expansion of gas with change of temperature of thesample holder. In both experiments, once the unit G was filledwith 11 kg/m2 of hydrogen gas, both valves E and D were kept
closed and the change in pressure was measured by meter C.If there was only adsorption the pressure recorded should belower than the pressure recorded for the corresponding tem-perature when there was no carbon sample in the unit. There-fore the subtraction of graph X from graph Y would show theamount of hydrogen adsorbed/desorbed. If this value is posi-tive information about absorption is obtained, and if negativeit would indicate desorption of hydrogen at the corresponding
M. Sharon et al. / International Journal of Hydrogen Energy 32 (2007) 4238–4249 4245
Fig. 6. Raman spectra of carbon materials obtained by pyrolysis of oil seeds of anacardium, bitter almond, ritha, khajoor, neem, pure diamond and HOPG(pure graphitic carbon).
temperature. The subtracted graph is shown in Fig. 10B, whichshows maxima around 100 ◦C suggesting the maximum ad-sorption took place at this temperature. From the difference inpressure at this maxima, amount of hydrogen adsorbed was cal-culated assuming ideal gas laws. From these values wt% of hy-drogen adsorbed or desorbed by carbon materials were calcu-lated because the amount of carbon taken for the measurementwas known. This experiment was repeated with all carbon sam-ples and results are shown in Tables 5 and 6. It will be noticedfrom the results shown in Tables 5 and 6 that the adsorption per-centage is very low with almost all carbon nanomaterials. Thisis because, there was not enough time given for hydrogen gasto get adsorbed. Ideally, one should allow the adsorption pro-cess to take place for few hours at each temperature. But underthe present experiment each change of pressure was measuredwithin 1 min of getting required temperature. Hence there wasnot enough time to come to equilibrium state for the adsorp-tion or desorption. However, the purpose this experiment wasto sort out those carbon materials which were giving higher hy-
drogen adsorption so that further development of the selectedcarbon could be made.
2.7. Effect of density of carbon material on the hydrogenadsorption process
It is interesting to note from the results shown in Tables 5and 6 that there is not much direct relationship between thesurface area of the carbon materials and the amount of hydrogenadsorbed. This implies that either there may be some otherfactors controlling the adsorption of hydrogen or the surfacearea determined by the methylene blue technique may not begiving the actual surface area. However, when a graph wasplotted between the density of the carbon nanomaterials andthe hydrogen adsorption (Fig. 11), an exponential relationshipwas observed suggesting that lower the density more is thehydrogen adsorption. A similar behaviour has been reportedelsewhere [11].

4246 M. Sharon et al. / International Journal of Hydrogen Energy 32 (2007) 4238–4249
Fig. 7. Raman spectra of carbon materials obtained by pyrolysis of fibers of baggas, corn, rice straw, jute straw, coconut fiber and bamboo fiber.
Table 5Carbon materials produced from pyrolysis of various oil seeds, their surfacearea and hydrogen adsorption capacity at 11 kg/m2
Precursor (seeds) Surface area (m2/g) H2 adsorption (wt%)
Kardi 67.70 0.19Castor 64.85 0.09Ambadi 49.17 0.19Ritha seed 49.17 0.23Supari seed 49.88 0.07Soyabean 41.33 0.91Til 42.05 0.07Bitter almond 29.93 0.15Date palm 29.22 0.09Anacardium 15.68 0.14Neem seed 14.25 0.08Rye 13.54 0.17Sunflower 12.83 0.12
Table 6Carbon materials produced from pyrolysis of various fibers, surface area andhydrogen adsorption capacity measured within 1 min at 11 kg/m2
Precursor (fiber) Surface area (m2/g) H2 adsorption (wt%)
Corn 61.29 0.08Rice straw 140.15 0.06Jute straw 100.96 0.14Coconut fiber 55.59 0.17Bamboo 12.83 0.18Baggas 187.66 0.66
2.8. Influence of D- and G-band on the hydrogen adsorptionprocess
The examination of Raman spectra of all carbon materialssuggests that all these carbon materials show a shift in G-bandand D-band (Figs. 5–7) towards higher wave number as

M. Sharon et al. / International Journal of Hydrogen Energy 32 (2007) 4238–4249 4247
Fig. 8. Plots of surface area of carbon materials obtained from the pyrolysis of fibers and seeds versus their corresponding densities.
Fig. 9. A schematic diagram of apparatus used for studying hydrogen ad-sorption: (A) PID controller; (B) power supply; (C) pressure gauge; (D) H2gas outlet; (E) H2 inlet; (F) thermocouple to measure sample temperature;(G) stainless steel chamber; (H) sample holder; (I) sealed sample heater andact like a stand of the unit.
compared to that obtained with pure diamond (1325 cm−1)
or pure graphite (1575 cm−1). Therefore a graph was plottedbetween the amount of hydrogen adsorbed (with those carbonmaterials showing absorption greater than 0.1 wt%) versus thedifference between the peaks of G-band obtained with carbonmaterial and the G-band obtained with pure graphite (i.e.,1575 cm−1). This graph (Fig. 12) shows that carbon materialwhose G-band is nearer to 1575 cm−1 shows better hydrogenadsorption suggesting that for getting better hydrogen adsorp-tion, it is necessary that carbon materials should possess moreof graphitic nature than the diamond type structure.In otherwords, carbon materials should contain more of sp2 type carbonthan sp3 type carbon to promote the hydrogen adsorption [9].
In order to examine the effect of intensities of G-band andD-band on the hydrogen adsorption property of the carbonmaterial, a graph was plotted between the ratio of intensitiesof G-band and D-band versus amount of hydrogen adsorp-tion obtained with those carbon nanomaterials showing absorp-tion greater than 0.1 wt% (Fig. 13). This graph also reveal thatcarbon material possessing lesser intense D-band gives bet-ter hydrogen adsorption. This means that carbon materials
possessing more of sp2 carbon and less of sp3 carbon should bebetter carbon materials for hydrogen adsorption. In addition tothis property, Raman spectra of carbon obtained from soyabeanshows a lower intensity of D-band as compared to G-band(Fig. 5) as well as peak shift of G-band is also less. These prop-erties of carbon material may be responsible to give the highesthydrogen adsorption amongst the materials studied here.
2.9. Hydrogen adsorption measurements after the equilibriumachieved
From previous discussion and results shown in Tables 5 and6 it appears that amongst the various oil seeds and the fibrousprecursors, carbon materials obtained from soybeans (giving H2adsorption 0.91%) and baggas (H2 adsorption 0.66 wt%), seemsto be promising materials for exploring further for studyinghydrogen adsorption. Therefore, these two precursors were usedfor further investigation. In the previous experiment, since allprecursors were pyrolysed at 850 ◦C, it was necessary to studythe effect of temperature as well as the gas on the productionof carbon fiber and their consequence on the hydrogen storagebehaviour. It was also decided to study the effect of chemicalactivation of carbon fibers (with 1 M HCl and 3 M KOH) onthe adsorption of hydrogen.
Therefore, in the new set of experiments, carbon materialswere obtained by the pyrolysis under conditions as specified inTable 7. After these carbon materials were produced, chemicalactivation were done by soaking them in acid and KOH asdescribed in Table 7 for 1 h and then washed several times withwater and finally with acetone. These carbon materials weredried at 100 ◦C and used for hydrogen adsorption studies.
For hydrogen storage, same unit as shown in Fig. 9 wasused. After confirming that there was no leakage in the unit(as discussed earlier), known weight of carbon fiber (5 g) waskept in the unit (G). This was then kept under vacuum for 24 hand next day hydrogen gas was introduced into the chambersat 11 kg/m2. The unit was left to equilibrate for 6 h at roomtemperature. Decrease in pressure was measured after 6 h fromwhich amount of hydrogen adsorbed was calculated. The resultsof hydrogen adsorption are given in Table 7. Between the carbonmaterials obtained from soyabeans and baggas, carbon obtained

4248 M. Sharon et al. / International Journal of Hydrogen Energy 32 (2007) 4238–4249
Fig. 10. (A) Graph showing the change in pressure with temperature: (X) with no carbon sample in the unit and (Y) with the carbon sample (5 g) in the unit.(B) Showing the difference of graph X and graph Y versus the temperature. The positive difference shows the adsorption of hydrogen and negative differenceshows the desorption of hydrogen by carbon.
Fig. 11. A relationship between the hydrogen adsorbed and the density of the carbon fibers obtained from various precursors used in this experiment (Tables 1–5).
Fig. 12. A graph showing the effect of shift in G-band in comparison to peak position obtained with pure graphite on the hydrogen adsorption property ofcarbon material.
from baggas pyrolysed at 700 ◦C under hydrogen atmosphereand post-chemical treatment with 3 M KOH seems to give thebest hydrogen adsorption of 2.67 wt%.
Efforts are now being made to activate the carbon nanoma-terial of baggas by suitable metals to increase its hydrogen ad-sorption properties further.

M. Sharon et al. / International Journal of Hydrogen Energy 32 (2007) 4238–4249 4249
Fig. 13. A graph showing the effect of G-band intensity on the hydrogen adsorption by the carbon material.
Table 7Carbon materials prepared under different conditions and their capacity to adsorb hydrogen gas
Precursor Temperature (◦C) Treatment Gas H2 adsorption at 11 kg/m2 (wt%)
Baggas 600 1 M HCl Ar 1.4Baggas 700 3 M KOH H2 2.67Baggas 800 None N2 2.02Soyabeans 600 3 M KOH N2 1.90Soyabeans 700 None Ar 2.00Soyabeans 800 1 M HCl H2 1.59
3. Conclusion
Amongst the various carbon materials obtained from differ-ent types of precursors, carbon materials with lower densityand larger surface area are obtained from fibrous precursors(Tables 5 and 6). Amongst these fibrous materials carbon fibersobtained from baggas consists of agglomerated tubular fibersforming channel type structure (Fig. 4). Carbon soot of baggashas given hydrogen adsorption of 2.67 wt% at 11 kg/m2 of hy-drogen pressure. Porous carbon obtained from soyabeans hasalso given hydrogen adsorption capacity of 2.0 wt%. These twomaterials are being further studied to improve their hydrogenadsorption property.
Acknowledgements
We are extremely thankful to Board of Nuclear ResearchSociety (BRNS), India to provide a grant to carry out this work.
References
[1] Iijima S. Helical microtubules of graphite. Nature 1991;354:56–58.[2] Dillon AC, Jones KM, Bekkedahl TA, Kiang CH, Bethune DS, Heben
MJ. Storage of hydrogen in single-walled carbon nanotubes. Nature1977;386:377–9.
[3] Huang WZ, Zhang XB, Tu JP, Kong FZ, Ma JX, Liu F. et al. Theeffect of pretreatments on hydrogen adsorption of multi-walled carbonnanotubes. Mater Chem Phys 2003;78(1):144–8.
[4] Liu F, Zhang X, Cheng J, Tu J, Kong F, Huang W. et al. Preparation ofshort carbon nanotubes by mechanical ball milling and their hydrogenadsorption behavior. Carbon 2003;41(13):2527–32.
[5] Takagi H, Hatori H, Yamada Y. Hydrogen adsorption/desorption propertyof activated carbon loaded with platinum. Chem Lett 2004;33(9):1220–1.
[6] Texier-Mandoki N, Dentzer J, Piquero T, Saadallah S, David P,Vix-Guterl C. Hydrogen storage in activated carbon materials: role ofthe nanoporous texture. Carbon 2004;42(12–13):2744–7.
[7] Buczek B, Czepirski L. Storage of hydrogen in commercial activatedcarbon. Inz Chem Procesowa 2003;24(3):545–50.
[8] Volpe M, Cleri F. Chemisorption of atomic hydrogen in graphite andcarbon nanotubes. Surf Sci 2003;544(1):24–34.
[9] Lee SM, Lee YH. Hydrogen storage in single-walled carbon nanotubes.Appl Phys Lett 2000;76(20):2877–9.
[10] Chen P, Xu W, Liu J. et al. High H2 uptake by alkali-doped carbonnanotubes under ambient pressure and moderate temperatures. Science1999;285:91–93.
[11] Hou P-X, Xu S-T, Ying Z, Yang Q-H, Liu C, Cheng H-M. Hydrogenadsorption/desorption behavior of multi-walled carbon nanotubes withdifferent diameters. Carbon 2003;41(13):2471–6.
[12] Chahine R, Benard P. Performance study of hydrogen adsorption storagesystems. Hydrogen Energy Prog 1998;12:979.
[13] Sharon M, Kingsuk M, Kiyoshi Y, Sumio I, Yoshinori A, Zhao Z. Spongycarbon nanobeads—a new material. Carbon 1998;36(4–5):507.
[14] Sharon M. Carbon Nanomaterials. In: Nalwa HS, editor. Encyclopedia ofNanoscience and Nanotechnology, vol. 1, American Scientific Publisher;2005. p. 517.
[15] Sharon M, Debabrata P, Yoshinori A, Xinluo Z. Electrical and opticalproperties of semiconducting camphoric carbon films. Current Appl Phys2002;2:445.
[16] Kumar M, Kichambre PD, Sharon M, Ando Y, Zhao X. Synthesis ofconducting fibers, nanotubes, and thin films of carbon from commercialkerosene. Mater Res Bull 1999;34:791–801.


![High capacity Li[Ni0.8Co0.1Mn0.1]O2 synthesized by sol–gel and co-precipitation methods as cathode materials for lithium-ion batteries](https://static.fdokumen.com/doc/165x107/6336e10720d9c9602f0b0e64/high-capacity-lini08co01mn01o2-synthesized-by-solgel-and-co-precipitation.jpg)