Analytical expressions for predicting capture efficiency of bimodal fibrous filters
11
Analytical expressions for predicting capture efficiency of bimodal fibrous filters S. Fotovati a , H. Vahedi Tafreshi a, , A. Ashari a , S.A. Hosseini a , B. Pourdeyhimi b a Mechanical Engineering Department, Virginia Commonwealth University, Richmond, VA 23284-3015, United States b Nonwovens Cooperative Research Center, The Nonwovens Institute, NC State University, Raleigh, NC 27695-8301, United States article info Article history: Received 27 April 2009 Received in revised form 1 December 2009 Accepted 2 January 2010 Keywords: Bimodal filter media Aerosol filtration Slip flow Interception modeling CFD simulation abstract In this work, a series of numerical simulations are formulated for studying the performance (collection efficiency and pressure drop) of filter media with bimodal diameter distributions. While there are numerous analytical expressions available for predicting performance of filters made up of fibers with a unimodal fiber diameter distribution, there are practically no simple relations for bimodal filters. In this paper, we report on the influence of the fiber diameter dissimilarity and the number (mass) fraction of each component on the performance of a bimodal filter. Our simulation results are utilized to establish a unimodal equivalent diameter for the bimodal media, thereby taking advantage of the existing expressions of unimodal filters for capture efficiency prediction. Our results indicate that the cube root relation of Tafreshi, Rahman, Jaganathan, Wang, and Pourdeyhimi (2009) offers the closest predictions for the range of particle diameters, coarse fiber number (mass) fractions, fiber diameter ratios, and solid volume fractions (SVF) considered in this work. Our study revealed that the figure of merit (FOM) of bimodal filters increases with increasing fiber diameter ratios for Brownian particles (d p o100 nm), and decreases when challenged with larger particles. It has also been shown that when increasing the ratio of coarse fibers to fine fibers, FOM increases for Brownian particles, and decreases for larger particles. & 2010 Elsevier Ltd. All rights reserved. 1. Introduction Aerosol collection efficiency of fibrous media has been studied for many years, and there are many analytical, numerical, and/or empirical correlations available for conveniently calculating the performance of a filter. In almost all of these studies, however, a fibrous medium is assumed to be made up of fibers with a unimodal fiber diameter distribution (referred to hereafter as unimodal media). Many fibrous filters, however, consist of blends of coarse and fine fibers (referred to hereafter as bimodal media). In these filters, fine fibers contribute to the high filtration efficiency while coarse fibers provide mechanical rigidity. Bimodal media are typically comprised of coarse fibers with a diameter of about 3 mm and fine fibers with a diameter of the order of 0.3 mm (e.g., glass fiber filters). Such fine fibers at normal temperatures and pressures allow the so-called ‘‘slip flow’’ to occur at the fiber surface. The slip effect is known for reducing the resistance of a fiber against an air stream, and can desirably reduce the filter’s pressure drop. Despite their importance, bimodal (or multimodal) media have not been adequately studied in the literature, and unlike the case of unimodal media, there are no simple expressions/correlations that can be used to predict their collection Contents lists available at ScienceDirect journal homepage: www.elsevier.com/locate/jaerosci Journal of Aerosol Science ARTICLE IN PRESS 0021-8502/$ - see front matter & 2010 Elsevier Ltd. All rights reserved. doi:10.1016/j.jaerosci.2010.01.002 Corresponding author. Tel.: + 1 804 828 9936; fax: + 1 804 827 7030. E-mail address: [email protected] (H. Vahedi Tafreshi). Journal of Aerosol Science 41 (2010) 295–305
-
Upload
danimubarak -
Category
Documents
-
view
0 -
download
0
Transcript of Analytical expressions for predicting capture efficiency of bimodal fibrous filters
ARTICLE IN PRESS
Contents lists available at ScienceDirect
Journal of Aerosol Science
Journal of Aerosol Science 41 (2010) 295–305
0021-85
doi:10.1
� Cor
E-m
journal homepage: www.elsevier.com/locate/jaerosci
Analytical expressions for predicting capture efficiency of bimodalfibrous filters
S. Fotovati a, H. Vahedi Tafreshi a,�, A. Ashari a, S.A. Hosseini a, B. Pourdeyhimi b
a Mechanical Engineering Department, Virginia Commonwealth University, Richmond, VA 23284-3015, United Statesb Nonwovens Cooperative Research Center, The Nonwovens Institute, NC State University, Raleigh, NC 27695-8301, United States
a r t i c l e i n f o
Article history:
Received 27 April 2009
Received in revised form
1 December 2009
Accepted 2 January 2010
Keywords:
Bimodal filter media
Aerosol filtration
Slip flow
Interception modeling
CFD simulation
02/$ - see front matter & 2010 Elsevier Ltd. A
016/j.jaerosci.2010.01.002
responding author. Tel.: +1 804 828 9936; fax
ail address: [email protected] (H. Vahedi Taf
a b s t r a c t
In this work, a series of numerical simulations are formulated for studying the
performance (collection efficiency and pressure drop) of filter media with bimodal
diameter distributions. While there are numerous analytical expressions available for
predicting performance of filters made up of fibers with a unimodal fiber diameter
distribution, there are practically no simple relations for bimodal filters. In this paper,
we report on the influence of the fiber diameter dissimilarity and the number (mass)
fraction of each component on the performance of a bimodal filter. Our simulation
results are utilized to establish a unimodal equivalent diameter for the bimodal media,
thereby taking advantage of the existing expressions of unimodal filters for capture
efficiency prediction. Our results indicate that the cube root relation of Tafreshi,
Rahman, Jaganathan, Wang, and Pourdeyhimi (2009) offers the closest predictions for
the range of particle diameters, coarse fiber number (mass) fractions, fiber diameter
ratios, and solid volume fractions (SVF) considered in this work. Our study revealed that
the figure of merit (FOM) of bimodal filters increases with increasing fiber diameter
ratios for Brownian particles (dpo100 nm), and decreases when challenged with larger
particles. It has also been shown that when increasing the ratio of coarse fibers to fine
fibers, FOM increases for Brownian particles, and decreases for larger particles.
& 2010 Elsevier Ltd. All rights reserved.
1. Introduction
Aerosol collection efficiency of fibrous media has been studied for many years, and there are many analytical,numerical, and/or empirical correlations available for conveniently calculating the performance of a filter. In almost all ofthese studies, however, a fibrous medium is assumed to be made up of fibers with a unimodal fiber diameter distribution(referred to hereafter as unimodal media). Many fibrous filters, however, consist of blends of coarse and fine fibers(referred to hereafter as bimodal media). In these filters, fine fibers contribute to the high filtration efficiency while coarsefibers provide mechanical rigidity. Bimodal media are typically comprised of coarse fibers with a diameter of about 3mmand fine fibers with a diameter of the order of 0.3mm (e.g., glass fiber filters). Such fine fibers at normal temperatures andpressures allow the so-called ‘‘slip flow’’ to occur at the fiber surface. The slip effect is known for reducing the resistance ofa fiber against an air stream, and can desirably reduce the filter’s pressure drop.
Despite their importance, bimodal (or multimodal) media have not been adequately studied in the literature, and unlikethe case of unimodal media, there are no simple expressions/correlations that can be used to predict their collection
ll rights reserved.
: +1 804 827 7030.
reshi).

ARTICLE IN PRESS
S. Fotovati et al. / Journal of Aerosol Science 41 (2010) 295–305296
efficiencies. This is partly because there are too many independent, but coupled, variables that need to be included indeveloping an equation for such predictions. Note here that bimodal filters are those made up of blends (intimately mixed)of fibers with different diameters, and should not be confused with composite unimodal media (laminates of unimodallayers with different fiber diameters) which are much easier to analyze.
There are only a few studies dedicated to the development of predictive models for bimodal fibrous material. Almost allof these models deal only with permeability (inversely proportional to pressure drop) prediction (Brown & Thorpe, 2001;Clague & Phillips, 1997; Jaganathan, Tafreshi, & Pourdeyhimi, 2008; Lundstrom & Gebart, 1995; Mattern & Deen, 2008;Papathanasiou, 2001; Tafreshi et al., 2009). In this work, for the first time, bimodal filters will be considered for defining aunimodal equivalent diameter in such a way that it can be used with the existing unimodal expressions for collectionefficiency prediction.
In the next section, we present a review of the existing permeability-based models for obtaining an equivalent diameterfor bimodal media. In Section 3, our fluid flow and aerosol filtration formulations are described in detail and comparedwith existing models in the literature. Results and discussion are presented in Section 4, and are followed by the conclusionin Section 5.
2. Unimodal equivalent diameter for bimodal media
There are various expressions that have been developed for predicting pressure drop of unimodal filter media over thepast decades (e.g., Drummond & Tahir, 1984; Jackson & James, 1986; Tahir and Tafreshi, 2009). In almost all these models,pressure drop across unimodal media is presented as a function of fiber diameter df and solid volume fraction (SVF) a of themedia
Dp
t¼ f ðaÞ4mU
d2f
ð1Þ
where m and U are the fluid viscosity and flow face velocity, respectively, and t is the filter thickness. Here we use anexpression for f(a) proposed by Brown (1993) as
f ðaÞ ¼4að1þ1:996Knf Þ
�0:5 lna�0:75þa�a2=4þ1:996Knf ð�0:5 lna�0:25þa2=4Þð2Þ
In the above equation Knf=2l/df is the fiber Knudsen number, where l is the molecular mean free path of air (about64 nm in normal temperatures and pressures).
For the case of very small particles, capture is mainly due to the Brownian diffusion. Brownian diffusion takes place as aresult of a non-uniform pressure field around a very small particle (smaller than about 100 nm), which causes the particleto exhibit erratic random displacements with time even in quiescent air. The existence of the above non-uniform pressurefield is due to the comparatively infrequent number of collisions between the gas molecules and a very small particle, asthe particle is often smaller than the gas molecular mean free path. Single fiber capture efficiency due to Browniandiffusion is given by (Brown, 1993) as
ED ¼ 2:27Ku�1=3Pe�2=3ð1þ0:62Knf Pe1=3Ku�1=3Þ ð3Þ
where Ku is the Kuwabara factor Ku=�(lna/2)�0.75+a�0.25a2 and Pe is the Peclet number Pe=Udf/D. Here D=sCCT/(3pmdP) is the diffusivity, and s=1.38�10�23(m2 kg s�2 K�1) is the Boltzmann constant. T and m are the air temperatureand viscosity, respectively, and dP is the particle diameter.
For larger particles, where the size and mass of the particles are not negligible, filtration is due to interception andinertial impaction. Large particles, however, do not exhibit Brownian diffusion. Collection efficiency due to interception isgiven as (Pich, 1966)
ER ¼ð1þRÞ�1
�ð1þRÞþ2ð1þ1:996Knf Þð1þRÞ lnð1þRÞ
2ð�0:75�0:5 lnaÞþ1:996Knf ð�0:5�lnaÞð4Þ
where R=dp/df and the equation is valid for Ro0.4. In this paper, we also use the expression proposed by Liu and Rubow(1990)
ER ¼ 0:61�aKu
� �R2
1þR1þ
1:996Knf
R
� �ð5Þ
Collection efficiency due to inertial impaction is given as (Stechkina, Kirsch, & Fuchs, 1969)
EI ¼ðStkÞJ
ð2KuÞ2ð6Þ
where Stk¼ ðrPd2PCCV=18mdf Þ is the Stokes number and J=(29.6�28a0.62)R2
�27.5R2.8.

ARTICLE IN PRESS
S. Fotovati et al. / Journal of Aerosol Science 41 (2010) 295–305 297
The total single fiber efficiency can be approximated (as the three mechanisms are not entirely independent of oneanother) as
E¼ 1�ð1�EDÞð1�ERÞð1�EIÞ ð7Þ
Particle penetration through a fibrous filter with a thickness of t can be obtained by (Brown, 1993)
P¼ exp�4aEt
pdf ð1�aÞ
� �ð8Þ
As mentioned earlier, there are very few studies dedicated to bimodal fibrous media, and all of them are focused onpressure drop predictions. To our knowledge, there is no study in which collection efficiency of a bimodal filter has beenmodeled for the purpose of developing a predictive correlation. In a recent study, we calculated the pressure drop of aseries of bimodal fibrous media, and evaluated eight different methods of defining an equivalent diameter for bimodalmedia (Tafreshi et al., 2009). It was shown that the area-weighted average diameter of Brown and Thorpe, (2001), Eq. (9);volume-weighted resistivity model of Clague and Phillips (1997), Eq. (10); and the cube root relation of Tafreshi et al. (2009),Eq. (11), offer the best predictions over the entire range of mass (number) fractions, 0rncr1, with fiber diameter ratios of1rRcf=dc/dfr5, and SVFs of 5%rar15%
dð2Þeq ¼ 2ncr2
c þnf r2f
ncrcþnf rfð9Þ
dvwreq ¼ 2
ffiffiffiffiffiffiffiffiffiffiffiffiffiffiffiffiffiffiffiffiffiffiffincr2
f þnf r2c
qð10Þ
dcreq ¼ 2
ffiffiffiffiffiffiffiffiffiffiffiffiffiffiffiffiffiffiffiffiffiffiffincr3
c þnf r3f
3
qð11Þ
Here nc, nf, rc, and rf are the number fraction and radius of coarse and fine fibers, respectively. In this paper, we considerthese established equivalent diameter definitions, and evaluate their suitability for predicting the particle captureefficiency using Eqs. (3)–(8).
Lastly, it is worth mentioning that a filter’s pressure drop often increases as a result of an increase in its collectionefficiency. This makes it difficult to judge whether or not the filter has been designed properly. To circumvent this problem,figure of merit (FOM), also referred to as quality factor, has been defined and is widely used in the literature
FOM¼�lnðPÞ
Dpð12Þ
We will use Figure of Merit in the discussions presented in Section 4.
3. Governing equations and numerical solution
In this section we present the governing equations for simulating air and particle flow in a 2-D model of aerosol fibrousfilters. The air flow through the microstructure of a filter is believed to be governed by the Stokes equation, where thepressure drop is caused solely by viscous forces. Conservation of mass and momentum are given as
@u
@xþ@v
@y¼ 0 ð13Þ
and
@p
@x¼ m @2u
@x2þ@2u
@y2
!ð14:1Þ
@p
@y¼ m @2v
@x2þ@2v
@y2
!ð14:2Þ
For the case of small particles, we considered a convective–diffusive equation for the concentration of the particlesbased on the Eulerian approach (Friedlander, 2000)
u@n
@xþv
@n
@y¼D
@2n
@x2þ@2n
@y2
!ð15Þ
where n is the nanoparticle concentration. Eqs. (13), (14.1), and (14.2) are numerically solved in a series of bimodal 2-Dgeometries using the computational fluid dynamics (CFD) code from Fluent Inc (Fluent 6.3). We used the SIMPLE algorithmfor pressure–velocity coupling along with a second order upwind scheme for the momentum equation discretization. Ourcriterion for convergence was at least four orders of magnitude reduction in the residuals for the continuity andmomentum equations in the x and y directions. More importantly, we monitored the pressure drop across the media

ARTICLE IN PRESS
S. Fotovati et al. / Journal of Aerosol Science 41 (2010) 295–305298
during the iterations, in order to ensure that no significant changes occur in the flow field calculation upon performingfurther iterations when a simulation is considered converged.
To define Eq. (15) for the Fluent’s solver, we developed a special user-defined function (UDF) that was simultaneouslyexecuted during the computations.
For larger particles (dPZ100 nm), we used a Lagrangian modeling approach where each individual particle istracked throughout the solution domain. In the Lagrangian method, the force balance on a given particle is integrated toobtain the particle position in time. The dominant force acting on a particle is the air drag force. For Rep=rVdp/mo1(Li & Ahmadi, 1992)
dvip
dt¼
18md2
prpCcðvi�vip Þ ð16Þ
where vi and vip are the respective field and particle velocity in the x or y direction.Note that interception and inertial impaction play negligible roles in capturing very small particles. On the other hand,
for particles larger than 500 nm at normal temperatures and pressures, Brownian diffusion is practically non-existent andthe collection efficiency is due solely to interception and inertial impaction. In this work, we consider Brownian diffusionfor particles up to 500 nm in diameter.
When using a unit cell, one needs to use periodic boundary conditions in order for the unit cell to be representative ofthe whole domain. An alternative approach is to replicate the cells to obtain the required filter thickness (see Fig. 1). Thisallows for considering a uniform flow at the inlet. The size of the unit cells depends on the SVF and diameter of the fibers.
Here, we used a square unit cell with a dimension of h¼ 0:5a�0:5ffiffiffiffiffiffiffiffiffiffiffiffiffiffiffiffiffiffiffiffiffiffiffiffiffiffiffiffiffiffiffiffiffiffiffiffiffiffiffiffipðncd2
c þð1�ncÞd2f Þ
q. The number of unit cells is not as
important, since the results are presented per unit thickness of the filter. Note that one of the unit cells is divided into twoparts and has been added to the left and right sides of the whole geometry.
The SVF of the filters was kept at 10% (a reasonable average SVF for filter media), while the fiber diameters, andtherefore the cell sizes were varied. Note also that the equivalent diameters that we work with here (Eqs. (9)–(11)) are notvery sensitive to the choice of SVF in the range 5–15% (Jaganathan et al., 2008; Tafreshi et al., 2009). Here, the coarse fibernumber fraction, nc, can only be 0, 0.25, 0.50, 0.75, and 1, which corresponds to the 0:4, 1:3, 2:2, 3:1, 4:0 fraction in thework of Brown and Thorpe (2001), where the first and last digits represent the number of coarse and fine fibers,respectively. We studied filters with fiber diameter ratios (Rcf) of 1, 2, 3, 5, and 7. The case of nc=0.50 represents three
nc = 0.75
Symmetry boundary
unith cell
Vel
ociy
inle
t
LL
Clolumns R StaggeredC Rows
Pres
sure
out
let
Fig. 1. (a) Square unit cell with one fine and three coarse fibers (nc=0.75); (b) simulation domain and boundary conditions; (c) three possible fiber
arrangements of columns, rows and staggered configurations for the case of for the case of nc=0.5.

ARTICLE IN PRESS
S. Fotovati et al. / Journal of Aerosol Science 41 (2010) 295–305 299
distinctive fiber arrangements depending on whether different fibers are placed in columns, rows, or staggered fashion (seeFig. 1c). Here, we only consider the staggered configuration.
Boundary conditions are shown in Fig. 1b. Uniform velocity and concentration profiles are assumed for the incoming airborneparticles at the inlet. It is assumed here that particles that come in contact with the fibers will be captured and vanished from thesolution domain. Note that the inlet and outlet boundaries are placed far up and downstream, so that a uniform flow can beassumed to prevail at the inlet and outlet (Maze, Tafreshi, Wang, & Pourdeyhimi, 2007; Wang, Tafreshi, Maze, & Pourdeyhimi,2006). We used an upstream distance of L=5dc and L=10dc for our small particle (Eulerian) and large particle (Lagrangian) flowsimulations, respectively, to improve the calculation’s accuracy. For the case of small particles (Eq. (15)), we assumed n=0 at thefiber surface and ð@n=@xÞ ¼ 0 at the outlet (no change in the particle concentration flux at the outlet). The upper and lowerboundaries are symmetry boundary condition, meaning that gradient of any flow property (velocity, particle concentration y) iszero at these boundaries. For the Lagrangian particle tracking, symmetry boundary conditions act like a perfectly reflecting wall,i.e., particles colliding with the symmetry boundaries will be reflected without any loss of momentum.
Standard discrete phase model (DPM) in the Fluent code treats the particles as point masses, and therefore cannot calculateparticle deposition due to interception. In this work, we developed a UDF that modifies Fluent’s standard DPM to include theparticle deposition via interception. This has been done by continuously monitoring the distance between the particles’ centersand fibers’ surface during the trajectory tracking. If the particle’s center of mass reaches a distance of dp/2 away from a fiber, it willbe counted as deposited. Fig. 2a shows the particle concentration contour plot throughout the domain for a typical bimodalmedium considered in this work. Here red to blue represent normalized nanoparticle concentration from 1 to zero. Note that thenanoparticle concentration close to the fibers is almost zero indicating the particle deposition. Fig. 2b depicts the trajectory ofparticles’ centers of mass for 2mm particles in the same solution domain. For the sake of clarity, only a few particle trajectories areshown. Particles’ center of mass trajectories in the first unit cell are shown in Fig. 2c with a higher magnification. Interception ofthe particle trajectories by the fibers is evident. Note that particles do not interact with each other. Therefore, one can (and must)release a large number of particles to correctly predict the particle capture via interception and impaction.
For the dimensions considered in this paper, considerable slip velocity occurs at the fiber surface, as expected for flowswith non-zero Knudsen numbers. To add this feature to the Fluent code, we developed another UDF that enables Fluent toaccept slip velocity at the fiber surface (see Hosseini & Tafreshi, 2010 for more details).
Our filter geometries were meshed with triangular cells in the filter zone and quadrilateral cells in the fluid entry andexit zones. Depending on the fiber diameter ratio, Rcf, 50,000–400,000 cells were used in the simulations presented in thispaper. Larger numbers of cells are considered in simulations with greater dissimilar fiber diameters. To ensure that thesimulation results are mesh-independent, one of our filter geometries was arbitrarily chosen and the effect of mesh densityon its pressure drop and collection efficiency was calculated for different number of mesh points around the perimeter ofthe finer fiber. As it was shown in our previous work (Jaganathan et al., 2008), increasing the number of mesh pointsaround the perimeter of the fine fibers beyond 40 does not influence the pressure drop. We therefore used 40 mesh pointsaround the fine fibers in our simulations, and adjusted the mesh in the rest of the domain accordingly.
Fig. 2. (a) Contour plot of particle concentration (dp=10 nm) obtained via Eulerian method; (b) a few representative trajectories for 2mm particles
introduced at the inlet; (c) particle trajectories in the first unit cell. Terminated trajectories belong to particles intercepted by the fibers. The filter is made
up of fibers of 1 and 3mm diameter with an SVF of 10%.

ARTICLE IN PRESS
-1.8E+03
LnP
/t (1
/m)
-2.2E+03 Simulation for dP = 1 µmdf = 3µm
0
Particle number density at inlet, NP/h, (m-1)
-1.6E+03
-2.0E+03
1E+07 2E+07 3E+07
Fig. 3. Effect of inlet particle number density (mesh density) on particle penetration calculated via Lagrangian Method.
Current Simulation
80
60
Eff
icie
ncy
40
20
0
101 102 103
100
dP (nm)
ED, Brown [1993]
ER+I, Liu & Rubow [1990]
ER+I, Pich [1966]
df = 3µm
Fig. 4. A comparison between the efficiency of a unimodal medium having a fiber diameter of 3mm with those of analytical expressions in a particle
range of 10odpo2000 nm.
S. Fotovati et al. / Journal of Aerosol Science 41 (2010) 295–305300
Fig. 3 shows the influence of a number of particles introduced at the inlet on the medium’s collection efficiency usingthe Lagrangian method (Eq. (16)). The horizontal axis here is the number of particles per unit of length at the inlet, Np/h. Itcan be seen that particle collection efficiency (due to interception and inertial impaction) is independent of the numberdensity of the particles at the inlet beyond a value of about 2�107. It is worth mentioning that we also obtained similarresults when injecting particles next to the symmetry boundaries to calculate the critical y-distance (the maximumdistance above the fiber axis of symmetry at the inlet where a particle can be intercepted) and used it to calculate thepercentage of intercepted fibers as suggested by Wang and Pui (2009) (see also Lastow & Podgorski, 1998).
Fig. 4 shows a comparison between the results of Fluent+UDFs and those obtained from the traditional analytical expressions(Eqs. (1)–(8)). These results are obtained for a unimodal filter medium with an SVF of 10% and a fiber diameter of 3mm. Note thatour large-particle collection efficiency calculations are in relatively good agreement with Eq. (5) but somewhat differ from theefficiency calculated using Eq. (4). We therefore used Eq. (5) in this study. Also note that since molecular thermal effects have notbeen defined for our simulations, no thermal rebound (if any) or any effect of that nature should be expected from the simulations(thermal rebound has been widely discussed in the literature, see for instance Japuntich, Franklin, Pui, Kuehn, & Kim, 2007).

ARTICLE IN PRESS
Vol-wt Res.
Area-wt Ave.
Δp/t
(Pa/
mm
)
00
nC
0.25 0.5 0.75 1
0nC
0.25 0.5 0.75 1
0nC
0.25 0.5 0.75 1
5E+06
4E+06
3E+06
2E+06
1E+06
Δp/t
(Pa/
mm
)
5E+06
4E+06
3E+06
2E+06
1E+06
Δp/t
(Pa/
mm
)
5E+06
4E+06
3E+06
2E+06
1E+06
Rcf = 7
Rcf = 3
Rcf = 2
Simulation
Cube Root
Vol-wt Res.
Area-wt Ave.
Simulation
Cube Root
Vol-wt Res.
Area-wt Ave.
Simulation
Cube Root
Fig. 5. Pressure drop per unit thickness of different bimodal media with different fiber diameter ratios and coarse fiber number (mass) fractions. Here
SVF=10% and df=1mm. Comparison is made between the results of area-weighted average diameter, volume-weighted resistivity model, and the cube root
relation.
S. Fotovati et al. / Journal of Aerosol Science 41 (2010) 295–305 301
ARTICLE IN PRESS
-2.0E+04
0.0E+00
Simulation, Rcf = 3
-4.0E+04Volume-wt Resistivity
Volume-wt Resistivity
Simulation Rcf = 5
Simulation Rcf = 7
Area-wt Ave.
Cube Root
Area-wt Ave.
Cube Root
20-8.0E+04
-6.0E+04
dP (nm)40 60 80 100
20dP (nm)
40 60 80 100
Ln
(P)/
t (1/
m)
0.0E+00
-1.5E+05
-1.0E+05
-5.0E+04
Ln
(P)/
t (1/
m)
nC = 0.75
Area-wt Ave.
Cube Root
Volume-wt Resistivity
Simulation, Rcf = 3
Volume-wt Resistivity
Volume-wt Resistivity
Simulation Rcf = 5
Simulation Rcf = 7
Area-wt Ave.
Cube Root
Area-wt Ave.
Cube Root
nC = 0.75
Area-wt Ave.
Cube Root
Volume-wt Resistivity
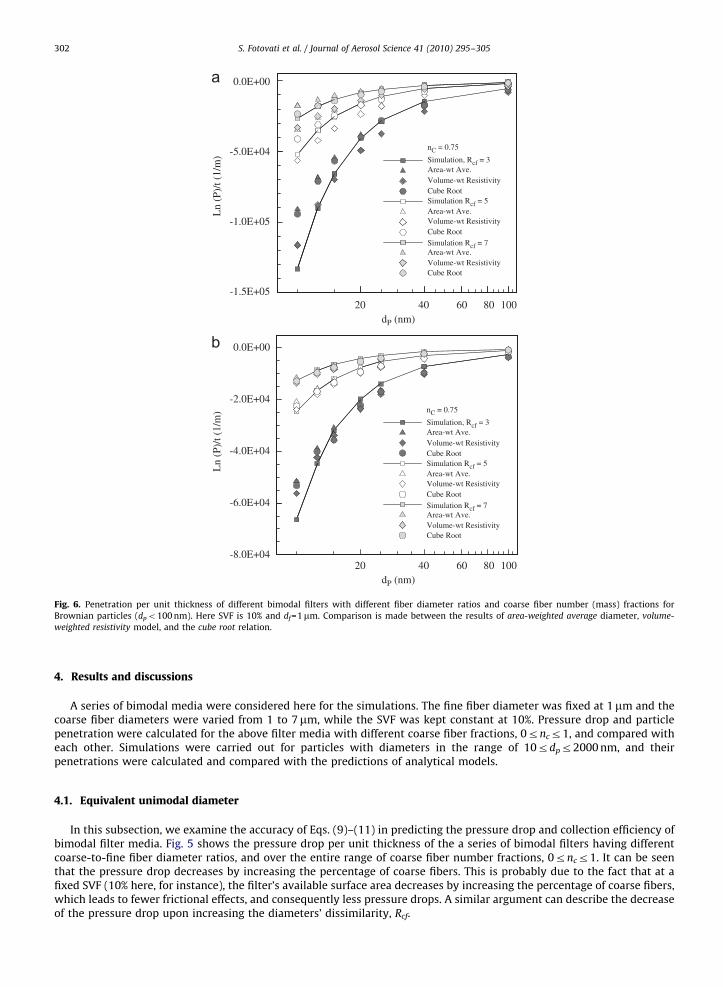
Fig. 6. Penetration per unit thickness of different bimodal filters with different fiber diameter ratios and coarse fiber number (mass) fractions for
Brownian particles (dpo100 nm). Here SVF is 10% and df=1mm. Comparison is made between the results of area-weighted average diameter, volume-
weighted resistivity model, and the cube root relation.
S. Fotovati et al. / Journal of Aerosol Science 41 (2010) 295–305302
4. Results and discussions
A series of bimodal media were considered here for the simulations. The fine fiber diameter was fixed at 1mm and thecoarse fiber diameters were varied from 1 to 7mm, while the SVF was kept constant at 10%. Pressure drop and particlepenetration were calculated for the above filter media with different coarse fiber fractions, 0rncr1, and compared witheach other. Simulations were carried out for particles with diameters in the range of 10rdpr2000 nm, and theirpenetrations were calculated and compared with the predictions of analytical models.
4.1. Equivalent unimodal diameter
In this subsection, we examine the accuracy of Eqs. (9)–(11) in predicting the pressure drop and collection efficiency ofbimodal filter media. Fig. 5 shows the pressure drop per unit thickness of the a series of bimodal filters having differentcoarse-to-fine fiber diameter ratios, and over the entire range of coarse fiber number fractions, 0rncr1. It can be seenthat the pressure drop decreases by increasing the percentage of coarse fibers. This is probably due to the fact that at afixed SVF (10% here, for instance), the filter’s available surface area decreases by increasing the percentage of coarse fibers,which leads to fewer frictional effects, and consequently less pressure drops. A similar argument can describe the decreaseof the pressure drop upon increasing the diameters’ dissimilarity, Rcf.

ARTICLE IN PRESS
-4.0E+04
-2.0E+04
-0.0E+00
-6.0E+04
-8.0E+04
101 102 103
Ln
(P)/
t) (
1/m
1
dP (nm)
Simulation, Rcf = 3
Volume-wt Resistivity
Volume-wt Resistivity
Simulation Rcf = 5
Simulation Rcf = 7
Area-wt Ave.
Cube Root
Area-wt Ave.
Cube Root
nC = 0.5
Area-wt Ave.
Cube Root
Volume-wt Resistivity
Fig. 7. Penetration per unit thickness of different bimodal filters with different fiber diameter ratios and a coarse fiber number (mass) fractions of nc=0.5.
Here SVF is 10% and df=1mm. Comparison is made between the results of area-weighted average diameter, volume-weighted resistivity model, and the cube
root relation.
Table 1Sum of the squares of differences between Ln(P)/t obtained from numerical simulation and different equivalent diameter definitions.
Rcf Cube root average diameter Area weighted average diameter Volume weighted resistivity average diameter
3 68.40�107 76.90�107 87.30�107
5 3.10�107 3.50�107 12.50�107
7 0.94�107 1.33�107 5.63�107
S. Fotovati et al. / Journal of Aerosol Science 41 (2010) 295–305 303
Predictions of unimodal equivalent area-weighted average diameter, volume-weighted resistivity model, and thecube root formula, when used for pressure drop calculation (Eqs. (1) and (2)), are also shown in Fig. 5 for comparison.It can be seen that all the three models can closely predict the results of the bimodal numerical simulations asexpected.
To investigate the accuracy of these models in predicting particle collection efficiency of a filter medium, we computedthe filters’ particle penetration per unit thickness, and plotted the results in Figs. 6 and 7 for different diameterdissimilarities, Rcf. In Fig. 6, we present the penetration of small particles in bimodal filter media, using the above-mentioned unimodal equivalent diameter models (Eqs. (9)–(11)). Each diameter model is used in conjunction with Eqs.(3)–(8), and compared with the results of our numerical simulations. The cases of nc=0.25 and 0.75 are shown here, whilethe case of nc=0.5 is combined with the results shown in Fig. 7. It again can be seen that the area-weighted average
diameter, volume-weighted resistivity model, and the cube root formula all provide closely matching predictions. Note inFig. 6 that penetration increases as the fiber diameter ratio increases. This is because the dominant collection mechanismfor Brownian particles (case of Fig. 6) is diffusion, and the collection efficiency for such particles is directly proportional tothe fibers’ surface area, which decreases with increasing Rcf.
In Fig. 7, we present particle penetration per unit thickness of the media for the entire range of particles considered inthis study, 10odpo2000 nm. Without limiting the generality of the conclusions, here we continue our discussion, usingnc=0.5 for the sake of simplicity of presentation. It can be seen that the area-weighted average diameter and the cube root
formulas provide relatively good matching predictions, although the cube root formula seems to have slightly betterpredictions when the entire range of particles is considered.
To make this comparison more quantitative, we calculated the sum of the squares of the difference between Ln(P)/tobtained from our bimodal CFD simulations, and those of the proposed equivalent diameter definitions for different Rcf
values (see Table 1). It can be seen that the cube root average diameter has minimum error at each Rcf when compared withthe results obtained from the two other average diameters definitions.
In Fig. 7, also note that particle penetration for the whole range of relevant particles, 10odpo2000 nm, increases byincreasing the fiber diameter ratio.

ARTICLE IN PRESS
0.08Cube Root, Rcf = 3
Cube Root, Rcf = 5
Cube Root, Rcf = 7
0.06
FOM
0.04
00.02
0
0.08
0.06
FOM
0.04
0.02
0
101 102 103
Cube Root, nC = 0.25CubeRoot, nC = 0.5
Cube Root, nC = 0.75
dP (nm)
101 102 103
dP (nm)
Rcf = 5
nC = 0.5
Fig. 8. Figure of merit of different bimodal filters with different Rcf and nc. The results shown here are obtained using the analytical expressions with an
equivalent diameter calculated using the cube root formula.
S. Fotovati et al. / Journal of Aerosol Science 41 (2010) 295–305304
The simulations presented here have no limitations with regard to the fiber or particle size. However, it should be notedthat the conclusions drawn here are only valid for the range of parameters considered in the simulations. For instance, theequivalent diameters discussed here may not necessarily be accurate in predicting performance of filters made up of fiberswith very dissimilar diameters. Also, it should be noted that our conclusions are based on the assumption that the fibersare clean. Obviously, deposition of particles on the fibers, especially on the fine fibers, can drastically change the media’smicrostructure, and renders the definition of an equivalent diameter ineffective.
4.2. Figure of merit
In this section, we study the influence of nc and Rcf on the figure of merit (Eq. (12)) of bimodal filters. As wasdemonstrated in previous sections the cube root formula seems to be a suitable model to define an equivalent unimodaldiameter for estimating the pressure drop and particle collection efficiency of most bimodal filters. We therefore used thisformula, together with the analytical unimodal expressions presented earlier (Eqs. (1)–(8)), to study the FOM of bimodalfilter media. Fig. 8 shows the FOM of different bimodal filters having different fiber diameter ratios and coarse fibernumber fractions, but a constant SVF of 10%. It can be seen that FOM of bimodal filters increases with increasing Rcf when

ARTICLE IN PRESS
S. Fotovati et al. / Journal of Aerosol Science 41 (2010) 295–305 305
challenged with Brownian particles dpo100 nm. An opposite trend, however, can be observed when the filter is challengedwith larger particles. Comparing the results shown in Fig. 8, it can also been seen that FOM increases with increasing nc forBrownian particles (dpo100 nm) and decreases for larger particles.
5. Conclusions
While there are numerous analytical expressions available for predicting the performance of unimodal filter media,there are practically no simple relationships for bimodal filters. In this paper, we examined three different criteria fordefining an equivalent unimodal diameter to be used in the existing expressions for predicting the collection efficiency andpressure drop of bimodal filters. Among the definitions tested, the cube root relation seems to better predict theperformance (pressure drop and collection efficiency) of bimodal filters with fiber diameter ratios of 1rRcfr7, and coarsefiber fractions of 0onco1, when challenged with particles in the range 10–2000 nm. The SVF of the filter media simulatedin this work was kept at 10% (a typical value for most air filters).
Simulating series of bimodal media with different properties, we showed that increasing the ratio of fiber diameters, Rcf,or number (mass) fraction of coarse fibers, nc, in filters with constant SVF, leads to smaller pressure drops and greaterparticle penetrations. Our results revealed that FOM of bimodal filters increases with increasing Rcf when challenged withBrownian particles, and decreases for larger aerosol particles. It has also been shown that FOM increases with increasing nc
for Brownian particles (dpo100 nm), and decreases for larger particles.
Acknowledgments
The current work is supported by the Nonwovens Cooperative Research Center (NCRC). Their support is gratefullyacknowledged. AA and SAH acknowledge Ahlstrom Nonwovens LLC and VCU School of Engineering for financial support,respectively.
References
Brown, R. C. (1993). Air filtration. Pergamon Press.Brown, R. C., & Thorpe, A. (2001). Glass-fiber filters with bimodal fiber size distributions. Power Technology, 118, 3.Clague, S. D., & Phillips, R. J. (1997). A numerical calculation of the hydraulic permeability of tree dimensional disordered fibrous media. Physics of Fluids,
9(6), 1562.Drummond, J. E., & Tahir, M. I. (1984). Laminar viscous flow through regular arrays of parallel solid cylinders. International Journal of Multiphase Flow, 10,
515.Friedlander, S. K. (2000). Smoke, dust, and haze: Fundamentals of aerosol dynamics (2nd edition). Oxford University Press.Hosseini, S.A. and Tafreshi, H.V. (2010). Modeling permeability of porous media made of nanofibers with different three-dimensional fiber orientations
Chemical engineering Science in press, doi:10.1016/j.ces.2009.12.002.Jackson, W. G., & James, F. D. (1986). The permeability of fibrous porous media. The Canadian Journal of Chemical Engineering, 64, 364.Jaganathan, S., Tafreshi, H. V., & Pourdeyhimi, B. (2008). On the pressure drop prediction of filter media with bimodal fiber diameter. Powder Technology,
181, 89.Japuntich, D. A., Franklin, L. M., Pui, D. Y., Kuehn, T. H., & Kim, S. C. (2007). A comparison of two nano-sized particle air filtration tests in the diameter range
of 10–400 nanometers. Journal of Nanoparticle Research, 9, 93–107.Lastow, O., & Podgorski, A. (1998). Single-Fiber Collection Efficiency. In K. R. Spurny (Ed.), Advances in Aerosol Filtration. Lewis Publisher, CRC Press LLC:
Lewis Publisher, CRC Press LLC, 1998.Li, A., & Ahmadi, G. (1992). Dispersion and deposition of spherical-particles from point sources in a turbulent chemical flow. Aerosol Science and
Technology, 16(4), 209.Liu, B.Y.H., Rubow, K.L. (1990). Efficiency, pressure drop and figure of merit of high efficiency fibrous and membrane filter media, Fifth world filtration
conference, Nice, France.Lundstrom, S. T., & Gebart, G. B. (1995). Effect of perturbation of fiber architecture on permeability inside fiber tows. Journal of Composite Materials, 29,
424.Mattern, J. K., & Deen, M. W. (2008). Mixing rules for estimating the hydraulic permeability of fiber mixtures. AIChE Journal, 54, 32.Maze, B., Tafreshi, H. V., Wang, Q., & Pourdeyhimi, B. (2007). Unsteady-state simulation of nanoparticle aerosol filtration via nanofiber electrospun filters
at reduced pressures. Journal of Aerosol Science, 38, 550.Papathanasiou, T. D. (2001). The hydraulic permeability of periodic arrays of cylinders of varying size. Journal of Porous Media, 4(4), 323.Pich, J. (1966). In aerosol science. New York: Academic Press C.N. Davis (Ed.).Stechkina, I. B., Kirsch, A. A., & Fuchs, N. A. (1969). Studies on fibrous aerosol filters—IV. Calculus of aerosol deposition in model filters in the region of
maximum penetration. Annals of Occupational Hygiene, 12, 1–8.Tafreshi, H. V., Rahman, M. S.A., Jaganathan, S., Wang, Q., & Pourdeyhimi, B. (2009). Analytical expressions for predicting permeability of bimodal fibrous
porous media. Chemical Engineering Science, 64, 1154.Tahir, M. A., & Tafreshi, H. V. (2009). Influence of fiber orientation on the transverse permeability of fibrous media. Physics of Fluids, 21, 083604.Wang, Q., Maze, B., Tafreshi, H. V., & Pourdeyhimi, B. (2006). A case study of simulating submicron aerosol filtration via spun-bonded filter media.
Chemical Engineering Science, 61, 4871.Wang, J., & Pui, D. Y.H. (2009). Filtration of aerosol particles by elliptical fibers: a numerical study. Journal of Nanoparticle Research, 11(1), 185.