
Cross-validation of bimodal health-related stress assessment
15
1 23 Personal and Ubiquitous Computing ISSN 1617-4909 Volume 17 Number 2 Pers Ubiquit Comput (2013) 17:215-227 DOI 10.1007/s00779-011-0468-z Cross-validation of bimodal health-related stress assessment Egon L. van den Broek, Frans van der Sluis & Ton Dijkstra
Transcript of Cross-validation of bimodal health-related stress assessment
1 23
Personal and Ubiquitous Computing ISSN 1617-4909Volume 17Number 2 Pers Ubiquit Comput (2013) 17:215-227DOI 10.1007/s00779-011-0468-z
Cross-validation of bimodal health-relatedstress assessment
Egon L. van den Broek, Frans van derSluis & Ton Dijkstra

1 23
Your article is published under the Creative
Commons Attribution license which allows
users to read, copy, distribute and make
derivative works, as long as the author of
the original work is cited. You may self-
archive this article on your own website, an
institutional repository or funder’s repository
and make it publicly available immediately.
ORIGINAL ARTICLE
Cross-validation of bimodal health-related stress assessment
Egon L. van den Broek • Frans van der Sluis •
Ton Dijkstra
Received: 22 January 2011 / Accepted: 20 June 2011 / Published online: 4 October 2011
� The Author(s) 2011. This article is published with open access at Springerlink.com
Abstract This study explores the feasibility of objective
and ubiquitous stress assessment. 25 post-traumatic stress
disorder patients participated in a controlled storytelling
(ST) study and an ecologically valid reliving (RL) study.
The two studies were meant to represent an early and a late
therapy session, and each consisted of a ‘‘happy’’ and a
‘‘stress triggering’’ part. Two instruments were chosen to
assess the stress level of the patients at various point in
time during therapy: (i) speech, used as an objective and
ubiquitous stress indicator and (ii) the subjective unit of
distress (SUD), a clinically validated Likert scale. In total,
13 statistical parameters were derived from each of five
speech features: amplitude, zero-crossings, power, high-
frequency power, and pitch. To model the emotional state
of the patients, 28 parameters were selected from this set
by means of a linear regression model and, subsequently,
compressed into 11 principal components. The SUD and
speech model were cross-validated, using 3 machine
learning algorithms. Between 90% (2 SUD levels) and 39%
(10 SUD levels) correct classification was achieved. The
two sessions could be discriminated in 89% (for ST) and
77% (for RL) of the cases. This report fills a gap between
laboratory and clinical studies, and its results emphasize
the usefulness of Computer Aided Diagnostics (CAD) for
mental health care.
Keywords Post-traumatic stress disorder (PTSD) �Stress � Speech � Computer aided diagnostics (CAD) �Machine learning � Validity
1 Introduction
In our modern society, many people experience stress,
sometimes for just a brief moment, at other times for pro-
longed periods. Stress can be defined as a feeling of pressure
or tension, caused by influences from the outside world
[15, Chapter 6]. It can be accompanied by positive or nega-
tive feelings. It affects our physical state, for instance, by
increasing our heart rate and blood pressure, and by freeing
stress hormones such as (nor)adrenaline or (nor)epinephrine
[27], which stimulate autonomic nerve action. Stress may
become harmful if it occurs for too long or too frequently, or
if it occurs during a traumatic experience. It may, for
instance, result in depression or post-traumatic stress disor-
der (PTSD) [2]. To make things even worse, such stress-
related disorders stigmatize the people suffering from them,
which in itself is an additional stressor [42, 43].
Depression cannot always be related to a specific cause,
though several contributing factors have been identified
(e.g., genetic vulnerability and unavoidability of stress) [2,
25, 35]. More specifically, certain stressful life events (e.g.,
E. L. van den Broek (&) � F. van der Sluis
Human Media Interaction (HMI), Faculty of Electrical
Engineering, Mathematics, and Computer Science,
University of Twente, P.O. Box 217, 7500 AE Enschede,
The Netherlands
e-mail: [email protected]
E. L. van den Broek � F. van der Sluis
Karakter U.C., Radboud University Medical Center Nijmegen,
P.O. Box 9101, 6500 HB Nijmegen, The Netherland
T. Dijkstra
Donders Institute for Brain, Cognition and Behaviour,
Radboud University Nijmegen (RU), P.O. Box 9104,
6500 HE Nijmegen, The Netherlands
T. Dijkstra
Centre for Language Studies, Faculty of Arts,
Radboud University Nijmegen (RU), P.O. Box 9104,
6500 HE Nijmegen, The Netherlands
123
Pers Ubiquit Comput (2013) 17:215–227
DOI 10.1007/s00779-011-0468-z
job loss and widowhood) can lead to a state of depression.
Furthermore, chronic role-related stress is significantly
associated with chronically depressed mood [25]. Note that
the experience of stress is associated with the onset of
depression and not necessarily with the symptoms of
depression [25].
Traumas can originate from a range of situations, either
short or long lasting, such as warfare, natural disaster, and
interpersonal violence (e.g., sexual, physical, and emo-
tional abuse), intimate partner violence, or collective vio-
lence (e.g., experiencing a bank robbery). In such cases, a
PTSD may arise, which can be characterized by a series of
symptoms and causes (see [2, 44]).
Due to large inter-individual variability and a broad
variety of symptoms, the diagnosis of PTSD is hard to
make [2]. At the same time, it is clear that an efficient
treatment of PTSD requires an objective and early diag-
nosis of the patient’s problems and their therapeutic pro-
gress. Assessing the emotional distress of a patient is,
therefore, of the utmost importance. Therapists have
developed a range of questionnaires and diagnostic mea-
surement tools for this purpose (e.g., [36, 44]). Regrettably,
these may be experienced as a burden by patients, because
it demands their time and willingness to complete them.
Par excellence, this makes it a case in which ubiquitous
technology can contribute.
Given these considerations, it is abundantly clear why
both researchers and clinicians have searched for a long
time for more objective, ubiquitous ways to measure stress-
like phenomena in (patient) populations [3, 30, 35],
involving, for instance, the use of virtual reality technology
and biofeedback [37]. In parallel, ubiquitous computing
has gradually emerged as an increasingly important para-
digm over the last two decades. An excellent state-of-the-
art overview on ubiquitous computing is provided by [28].
In addition to the notion of computing itself, intelligence
and emotion quickly became important terms in ubiquitous
computing. However, as shown repeatedly over 15 years,
modeling these are still a bridge too far for current state-of-
the-art science and technology (cf. [38]). Even last year, it
was remarked that ‘‘pervasive healthcare research in the
field of stress prevention is still at an exploratory stage’’
[3, p. 70]. Despite such skepticism, the ability to reliably
and unobtrusively recognize stress in people might make a
more realistic (and consequently better) starting point than
either affective computing or modeling general (human)
intelligence.
In this article, we present research on the development
of a voice-based ubiquitous stress indicator. Such an
indicator is envisioned as part of ubiquitous technology
[28, 53] and emotion-aware consumer products [39, 52]. It
can be used as a decision support system in everyday life
(e.g., at work [3, 36]) and in mental health care settings.
The research rationale employed throughout this article is
presented next, in Sect. 2, followed by the research meth-
ods in Sect. 3. Section 4 introduces the subjective unit of
distress (SUD) and Sect. 5 describes relevant speech signal
features and their parameters. Section 6 discusses the chain
of speech signal preprocessing and Sect. 7 the classification
techniques employed in this study. The results of both
studies are presented in Sect. 8 and then discussed in Sect.
9. The article ends with a general conclusion in Sect. 10.
2 Research rationale: on the validity of stress
assessment
In the pursuit of triggering emotions and stress in a more or
less controlled manner, a range of methods have been
applied, involving, for example, images [51], sounds (e.g.,
music [23, 54]), (fragments of) movies [52, 53], virtual
reality [8], and real-world experiences [21, 23]. However,
how do we know what methods actually triggered partici-
pants’ true emotions? This is a typical concern of validity,
which is a crucial issue for emotion recognition and stress
assessment. Within the context of the current research,
validity can be best guaranteed through three approaches:
content, criteria-related, and ecological validation. We will
discuss each of these in relation to stress assessment.
Content validity refers to (i) the agreement of experts in
the domain of interest; (ii) the degree to which a measure
or its features (and its parameters) represent a construct;
(iii) the degree to which a set of features (or their param-
eters) of a given set of signals adequately represents all
facets of the domain.
Criteria-related validity is concerned with the quality of
the relation between the preferred and the measurement.
Emotions are preferably measured at the moment they
occur (e.g., online via speech); however, measurements
before (predictive) or after (postdictive) the actual event
are sometimes more feasible (e.g., off-line using the SUD).
The quality of these actual measurements is referred to as
predictive or postdictive validity. Another form of criteria-
related validity is concurrent validity. This is a metric for
the reliability of measurements applied in relation to the
preferred standard. For instance, the more stress levels can
be discriminated, the higher the concurrent validity is.
Ecological validity refers to the effect of the context on
measurements. We identify two issues here: (i) natural
stressors are sparse, which makes it hard to obtain such
data in a limited time frame; and (ii) stressors are easily
contaminated by contextual factors, which makes it of
vital importance to use a context similar to the intended
application for initial learning. Although understand-
able from a measurement-feasibility perspective, emotion
measurements are often done in controlled laboratory settings.
216 Pers Ubiquit Comput (2013) 17:215–227
123

This makes results poorly generalizable to real-world
applications.
These three levels of validity formed the foundation for
the research at hand. In all aspects of the design, the
implementation, and the execution of the research, content,
criteria-related, and ecological validity were taken into
account. As such, we aimed at ensuring the successful
development of the back-end of the envisioned application:
Computer aided diagnostics (CAD) for PTSD patients.
3 Methods
3.1 Patients
Recent surveys [7, 50] report that in daily life more than
twice as many women suffer from PTSD than men. This
fact provided us with a number of reasons to select solely
female patients: (i) the envisioned computer aided diag-
nostics (CAD) for PTSD patients is most relevant for
women; (ii) with more female patients available, they were
easier to include in the research; and (iii) including only a
limited number of male patients would result in a heavily
skewed distribution of gender, possibly turning this into a
source of noise instead of an additional informative factor.
In total, 25 female Dutch PTSD patients (mean age: 36;
SD: 11.32) participated of their own free will.
All patients suffered from panic attacks, agoraphobia,
and panic disorder with agoraphobia [2, 44]; see also Sect.
1. Before the start of the studies, all patients signed an
informed consent form and all were informed of the tasks
they could expect. The data from one patient with problems
in both studies were omitted from further analysis. Hence,
the data of 24 patients were used for further analysis.
3.2 Design and procedure
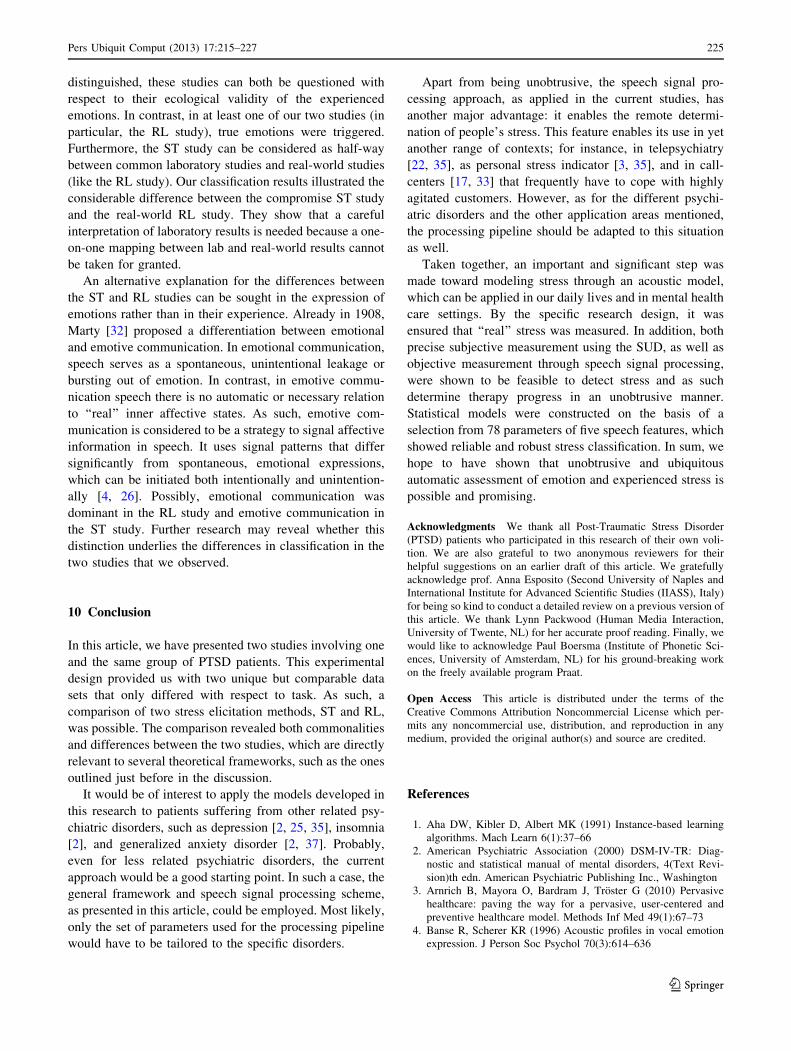
All participants took part in two studies: a storytelling (ST)
study and a reliving (RL) study; see Fig. 1. Possible factors
of influence (e.g., location, apparatus, therapist, and
experiment leader) were kept constant. Both studies were
designed to develop a voice-based model for experienced
stress; each therefore consisted of a stress-provoking ses-
sion and a happy session (see also Fig. 1).
Both studies were conducted in a clinic room setup to
facilitate therapy sessions. As such, the patients were
familiar with and comfortable in this setting. Moreover, the
location was free from any distractions and the room was
shielded from external sources of noise. All in all, the
context used was the same as that of the intended appli-
cation, which is known to be of vital importance.
The studies started with a practice session, during which
the participants learned to speak continuously for long
periods of time. Additionally, the practice session offered
them the opportunity of becoming more comfortable with
the research setting. Next, the test session started. Two
baseline blocks (see Fig. 1) preceded and ended both the
ST and the RL study. The baselines consisted of reading a
neutral story. The order of both studies and their conditions
were counterbalanced across participants.
In the ST study, the participants read aloud both a stress-
provoking and a positive story. This procedure allows
considerable methodological control over the invoked
stress, in the sense that every patient reads exactly the same
stories. The fictive stories were constructed in such a way
that they would induce certain relevant emotional associ-
ations. The complexity and syntactic structure of the two
stories were controlled to exclude the effects of con-
founding factors.
In the RL study, the participants re-experienced their
last panic attack and their last joyful occasion. Because the
RL sessions were expected to have a high impact on the
patient’s emotional state, a therapist was present for each
patient and during all sessions. The two RL sessions could
act like two phases of a therapy session: the start or the end
of it. For RL, a panic attack approximate the trauma in its
full strength, as with the intake of a patient. The condition
of telling about the last experienced happy event resembles
that of a patient who is relaxed or (at least) in a ‘‘normal’’
emotional condition. This should be almost the emotional
state at the end of therapy sessions, when the PTSD has
diminished.
4 The subjective unit of distress (SUD)
To evaluate the quality of our speech analysis, we had to
compare it to an independent measure of distress. We
compared the results of our speech analysis to those
obtained by means of a standard questionnaire for SUD
measurement. The SUD was introduced by Wolpe [57] in
1958 and has repeatedly proven itself since as a reliable
measure of a person’s experienced stress.
Fig. 1 Overview of the design of the research and the investigated
relations (dotted lines). The two studies, storytelling (ST) and reliving
(RL), are indicated. Each consisted of a happy and a stress-inducing
session. Baseline measurements were collected before and after the
two studies
Pers Ubiquit Comput (2013) 17:215–227 217
123

The SUD is measured by a Likert scale [30] that reg-
isters the degree of distress a person experiences at a par-
ticular moment in time. In our case, we used a linear scale
with a range between 0 and 10 on which the experienced
degree of distress was indicated by a dot or cross. The
participants in our study were asked to fill in the SUD test
once every minute; consequently, it became routine during
the experimental sessions.
5 Speech signal features
Voice-based stress assessment has the advantage that it can
be conducted unobtrusively at most times in our daily lives
and, in mental health care settings, therapy communication
is often recorded anyway. Speech was recorded using a
personal computer, an amplifier, and a microphone. The
sample rate of the recordings was 44.1 kHz, mono channel,
with a resolution of 16 bits. All recordings were divided in
samples of approximately one minute of speech. Because
the therapy sessions were held under controlled conditions
in a room shielded from noise (as is more generally the
case), high-quality speech signals were collected.
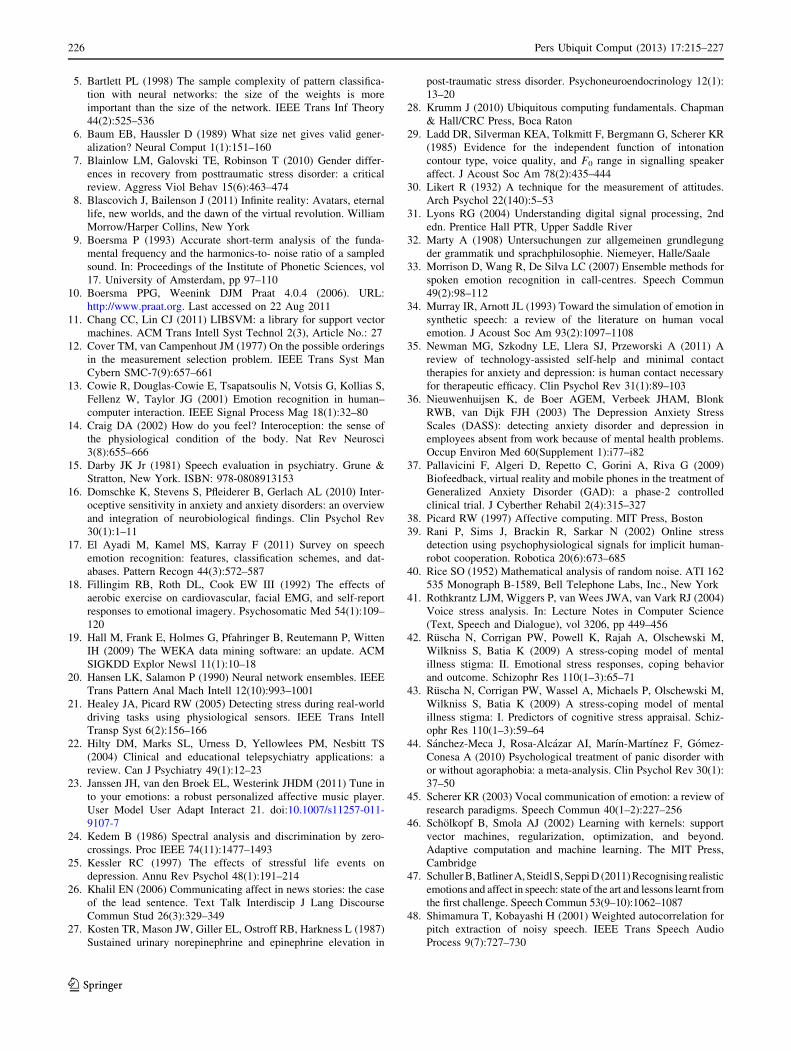
Various speech features have been shown to be sensitive
to experienced emotions and stress; see, for example
[13, 17, 34, 45, 55]. In our own research, we measured five
important characteristics of speech: (i) the power (or
intensity or energy) of the speech signal [13, 34]; (ii) its
fundamental frequency (F0) or pitch [13, 29, 34, 45, 55];
(iii) the zero-crossings rate [24, 41]; (iv) its wave amplitude
[34, 45]; and (v) the high-frequency power [4, 13, 34, 41].
Various speech features have been shown to be sensitive
to experienced stress; for a recent survey see [17]. The first
two extracted features were amplitude and power. The term
power is often used interchangeably with energy and
intensity. For a domain [0,T], the power of the speech
signal is defined as follows (see [31]):
20 log10
1
P0
ffiffiffiffiffiffiffiffiffiffiffiffiffiffiffiffiffiffiffiffiffiffiffiffi
1
T
Z
T
0
x2ðtÞ dt
v
u
u
u
t ; ð1Þ
where the amplitude or sound pressure of the signal is
denoted in Pa (Pascal) as x(t) (see also Fig. 2a) and the
auditory threshold P0 is 2 � 10�5 Pa [10].
The power of the speech signal is also described as the
Sound Pressure Level (SPL), calculated by the root mean
square of the sound pressure, relative to the auditory
threshold P0 (i.e., in decibel (dB) (SPL)). Its discrete
equivalent is defined as follows:
20 log10
1
P0
ffiffiffiffiffiffiffiffiffiffiffiffiffiffiffiffiffiffiffiffiffiffiffi
1
N
X
N�1
n¼0
x2ðnÞ
v
u
u
t ; ð2Þ
where N is the number of samples of the (sampled)
amplitude of the signal is denoted as x(n) in Pa (Pascal)
[10]. See Fig. 2b for an example of signal power.
As a third feature, we computed the zero-crossings rate
of the speech signal. For space reasons, we refrain from
defining the continuous model of the zero-crossings rate
(cf. [40]). Zero-crossings can be conveniently defined in a
discrete manner, through the following:
1
N
X
N�1
n¼1
I xðnÞxðn� 1Þ\0f g; ð3Þ
where N is the number of samples of the signal amplitude x.
The I af g serves as a logical function [24]. An example of
this feature is shown in Fig. 2c. Note that both power and
zero-crossings are defined through the signal’s amplitude x.
The fourth derived feature was the high-frequency power
[4]: the power for the domain [1000, 22000], denoted in Hz
(see also Fig. 2d). First, the signal was transformed to the
frequency domain via a Fourier transform X(f), defined as [31]:
Xðf Þ ¼Z
1
�1
xðtÞe�j2pft dt: ð4Þ
Subsequently, the power for the domain [F1, F2] was
defined as:
20 log10
ffiffiffiffiffiffiffiffiffiffiffiffiffiffiffiffiffiffiffiffiffiffiffiffiffiffiffiffiffiffiffiffiffiffiffiffiffiffiffiffiffi
1
F2 � F1
Z
F2
F1
jXðf Þj2 dt
v
u
u
u
t : ð5Þ
To implement high-frequency power extraction, the
discrete Fourier transform [31] was used:
XðmÞ ¼ 1
N
X
N�1
n¼0
xðnÞe�j2pnm=N ; ð6Þ
where m relates to frequency by f(m) = m fs/N. Here, fs is
the sample frequency and N is the number of bins. The
number of bins typically amounts to the next power of 2 for
the number of samples being analyzed; for instance, 2,048
for a window of 40 ms sampled at 44.1 kHz. The power
for the domain [M1, M2], where f(M1) = 1,000 Hz and
f(M2) = fs/2 (i.e., the Nyquist frequency), is defined by the
following:
20 log10
1
P0
ffiffiffiffiffiffiffiffiffiffiffiffiffiffiffiffiffiffiffiffiffiffiffiffiffiffiffiffiffiffiffiffiffiffiffiffiffiffiffiffiffiffiffiffi
1
M2 �M1
X
M2
m¼M1
jXðmÞj2v
u
u
t : ð7Þ
The fundamental frequency (F0 or perceived pitch)
was extracted using an autocorrelation function. The
autocorrelation of a signal is the cross-correlation of the
signal with itself. The cross-correlation denotes the similarity
of two signals, as a function of a time lag between them. In its
218 Pers Ubiquit Comput (2013) 17:215–227
123
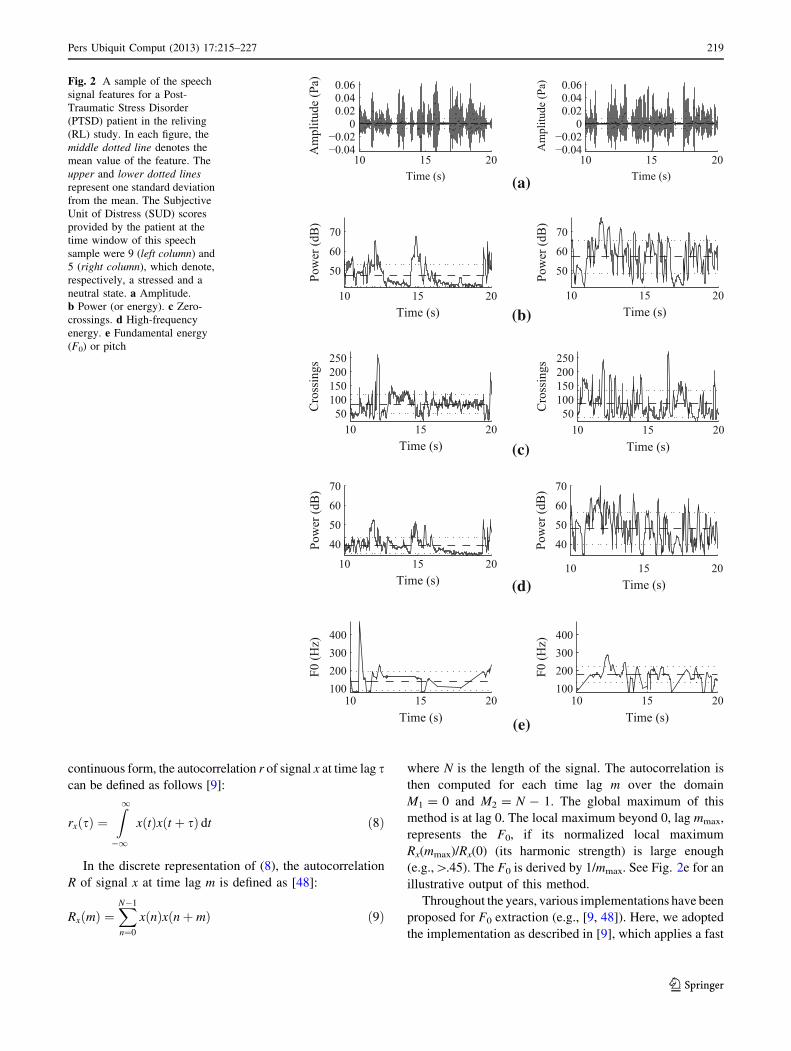
continuous form, the autocorrelation r of signal x at time lag scan be defined as follows [9]:
rxðsÞ ¼Z
1
�1
xðtÞxðt þ sÞ dt ð8Þ
In the discrete representation of (8), the autocorrelation
R of signal x at time lag m is defined as [48]:
RxðmÞ ¼X
N�1
n¼0
xðnÞxðnþ mÞ ð9Þ
where N is the length of the signal. The autocorrelation is
then computed for each time lag m over the domain
M1 = 0 and M2 = N - 1. The global maximum of this
method is at lag 0. The local maximum beyond 0, lag mmax,
represents the F0, if its normalized local maximum
Rx(mmax)/Rx(0) (its harmonic strength) is large enough
(e.g.,[.45). The F0 is derived by 1/mmax. See Fig. 2e for an
illustrative output of this method.
Throughout the years, various implementations have been
proposed for F0 extraction (e.g., [9, 48]). Here, we adopted
the implementation as described in [9], which applies a fast
(a)
(b)
(c)
(d)
(e)
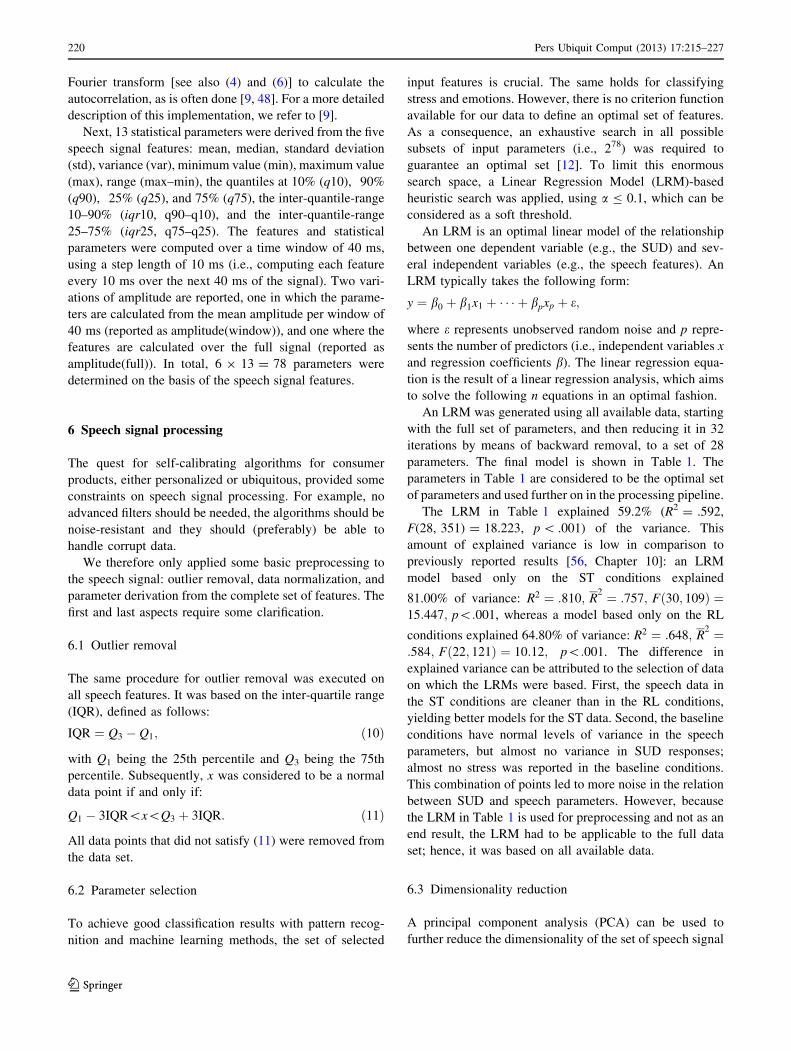
Fig. 2 A sample of the speech
signal features for a Post-
Traumatic Stress Disorder
(PTSD) patient in the reliving
(RL) study. In each figure, the
middle dotted line denotes the
mean value of the feature. The
upper and lower dotted linesrepresent one standard deviation
from the mean. The Subjective
Unit of Distress (SUD) scores
provided by the patient at the
time window of this speech
sample were 9 (left column) and
5 (right column), which denote,
respectively, a stressed and a
neutral state. a Amplitude.
b Power (or energy). c Zero-
crossings. d High-frequency
energy. e Fundamental energy
(F0) or pitch
Pers Ubiquit Comput (2013) 17:215–227 219
123
Fourier transform [see also (4) and (6)] to calculate the
autocorrelation, as is often done [9, 48]. For a more detailed
description of this implementation, we refer to [9].
Next, 13 statistical parameters were derived from the five
speech signal features: mean, median, standard deviation
(std), variance (var), minimum value (min), maximum value
(max), range (max–min), the quantiles at 10% (q10), 90%
(q90), 25% (q25), and 75% (q75), the inter-quantile-range
10–90% (iqr10, q90–q10), and the inter-quantile-range
25–75% (iqr25, q75–q25). The features and statistical
parameters were computed over a time window of 40 ms,
using a step length of 10 ms (i.e., computing each feature
every 10 ms over the next 40 ms of the signal). Two vari-
ations of amplitude are reported, one in which the parame-
ters are calculated from the mean amplitude per window of
40 ms (reported as amplitude(window)), and one where the
features are calculated over the full signal (reported as
amplitude(full)). In total, 6 9 13 = 78 parameters were
determined on the basis of the speech signal features.
6 Speech signal processing
The quest for self-calibrating algorithms for consumer
products, either personalized or ubiquitous, provided some
constraints on speech signal processing. For example, no
advanced filters should be needed, the algorithms should be
noise-resistant and they should (preferably) be able to
handle corrupt data.
We therefore only applied some basic preprocessing to
the speech signal: outlier removal, data normalization, and
parameter derivation from the complete set of features. The
first and last aspects require some clarification.
6.1 Outlier removal
The same procedure for outlier removal was executed on
all speech features. It was based on the inter-quartile range
(IQR), defined as follows:
IQR ¼ Q3 � Q1; ð10Þ
with Q1 being the 25th percentile and Q3 being the 75th
percentile. Subsequently, x was considered to be a normal
data point if and only if:
Q1 � 3IQR\x\Q3 þ 3IQR: ð11Þ
All data points that did not satisfy (11) were removed from
the data set.
6.2 Parameter selection
To achieve good classification results with pattern recog-
nition and machine learning methods, the set of selected
input features is crucial. The same holds for classifying
stress and emotions. However, there is no criterion function
available for our data to define an optimal set of features.
As a consequence, an exhaustive search in all possible
subsets of input parameters (i.e., 278) was required to
guarantee an optimal set [12]. To limit this enormous
search space, a Linear Regression Model (LRM)-based
heuristic search was applied, using a B 0.1, which can be
considered as a soft threshold.
An LRM is an optimal linear model of the relationship
between one dependent variable (e.g., the SUD) and sev-
eral independent variables (e.g., the speech features). An
LRM typically takes the following form:
y ¼ b0 þ b1x1 þ � � � þ bpxp þ e;
where e represents unobserved random noise and p repre-
sents the number of predictors (i.e., independent variables x
and regression coefficients b). The linear regression equa-
tion is the result of a linear regression analysis, which aims
to solve the following n equations in an optimal fashion.
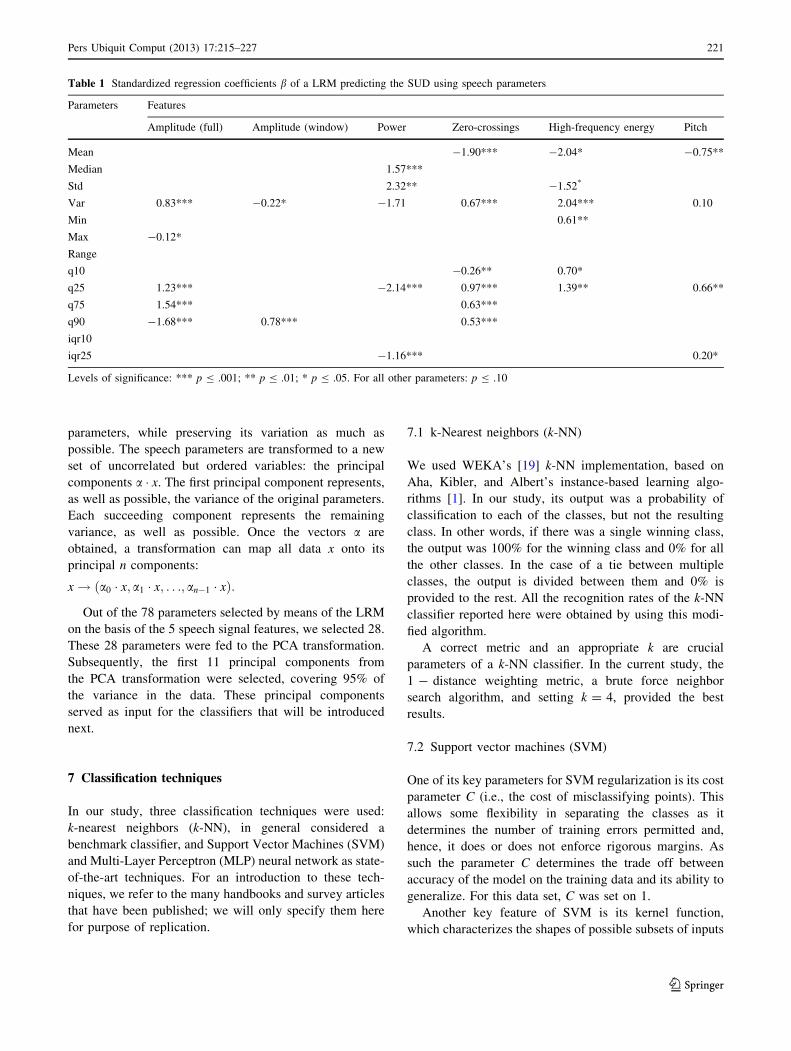
An LRM was generated using all available data, starting
with the full set of parameters, and then reducing it in 32
iterations by means of backward removal, to a set of 28
parameters. The final model is shown in Table 1. The
parameters in Table 1 are considered to be the optimal set
of parameters and used further on in the processing pipeline.
The LRM in Table 1 explained 59.2% (R2 = .592,
F(28, 351) = 18.223, p \ .001) of the variance. This
amount of explained variance is low in comparison to
previously reported results [56, Chapter 10]: an LRM
model based only on the ST conditions explained
81.00% of variance: R2 ¼ :810; R2 ¼ :757; Fð30; 109Þ ¼
15:447; p\:001, whereas a model based only on the RL
conditions explained 64.80% of variance: R2 ¼ :648; R2 ¼
:584; Fð22; 121Þ ¼ 10:12; p\:001. The difference in
explained variance can be attributed to the selection of data
on which the LRMs were based. First, the speech data in
the ST conditions are cleaner than in the RL conditions,
yielding better models for the ST data. Second, the baseline
conditions have normal levels of variance in the speech
parameters, but almost no variance in SUD responses;
almost no stress was reported in the baseline conditions.
This combination of points led to more noise in the relation
between SUD and speech parameters. However, because
the LRM in Table 1 is used for preprocessing and not as an
end result, the LRM had to be applicable to the full data
set; hence, it was based on all available data.
6.3 Dimensionality reduction
A principal component analysis (PCA) can be used to
further reduce the dimensionality of the set of speech signal
220 Pers Ubiquit Comput (2013) 17:215–227
123
parameters, while preserving its variation as much as
possible. The speech parameters are transformed to a new
set of uncorrelated but ordered variables: the principal
components a � x. The first principal component represents,
as well as possible, the variance of the original parameters.
Each succeeding component represents the remaining
variance, as well as possible. Once the vectors a are
obtained, a transformation can map all data x onto its
principal n components:
x! a0 � x; a1 � x; . . .; an�1 � xð Þ:
Out of the 78 parameters selected by means of the LRM
on the basis of the 5 speech signal features, we selected 28.
These 28 parameters were fed to the PCA transformation.
Subsequently, the first 11 principal components from
the PCA transformation were selected, covering 95% of
the variance in the data. These principal components
served as input for the classifiers that will be introduced
next.
7 Classification techniques
In our study, three classification techniques were used:
k-nearest neighbors (k-NN), in general considered a
benchmark classifier, and Support Vector Machines (SVM)
and Multi-Layer Perceptron (MLP) neural network as state-
of-the-art techniques. For an introduction to these tech-
niques, we refer to the many handbooks and survey articles
that have been published; we will only specify them here
for purpose of replication.
7.1 k-Nearest neighbors (k-NN)
We used WEKA’s [19] k-NN implementation, based on
Aha, Kibler, and Albert’s instance-based learning algo-
rithms [1]. In our study, its output was a probability of
classification to each of the classes, but not the resulting
class. In other words, if there was a single winning class,
the output was 100% for the winning class and 0% for all
the other classes. In the case of a tie between multiple
classes, the output is divided between them and 0% is
provided to the rest. All the recognition rates of the k-NN
classifier reported here were obtained by using this modi-
fied algorithm.
A correct metric and an appropriate k are crucial
parameters of a k-NN classifier. In the current study, the
1 - distance weighting metric, a brute force neighbor
search algorithm, and setting k = 4, provided the best
results.
7.2 Support vector machines (SVM)
One of its key parameters for SVM regularization is its cost
parameter C (i.e., the cost of misclassifying points). This
allows some flexibility in separating the classes as it
determines the number of training errors permitted and,
hence, it does or does not enforce rigorous margins. As
such the parameter C determines the trade off between
accuracy of the model on the training data and its ability to
generalize. For this data set, C was set on 1.
Another key feature of SVM is its kernel function,
which characterizes the shapes of possible subsets of inputs
Table 1 Standardized regression coefficients b of a LRM predicting the SUD using speech parameters
Parameters Features
Amplitude (full) Amplitude (window) Power Zero-crossings High-frequency energy Pitch
Mean -1.90*** -2.04* -0.75**
Median 1.57***
Std 2.32** -1.52*
Var 0.83*** -0.22* -1.71 0.67*** 2.04*** 0.10
Min 0.61**
Max -0.12*
Range
q10 -0.26** 0.70*
q25 1.23*** -2.14*** 0.97*** 1.39** 0.66**
q75 1.54*** 0.63***
q90 -1.68*** 0.78*** 0.53***
iqr10
iqr25 -1.16*** 0.20*
Levels of significance: *** p B .001; ** p B .01; * p B .05. For all other parameters: p B .10
Pers Ubiquit Comput (2013) 17:215–227 221
123
classified into one category [46]. Being SVM’s similarity
measure, the kernel function is the most important part of
an SVM. We applied a radial basis function kernel, defined
as follows:
kGðxi; xlÞ ¼ exp �cjxi � xlj2
� �
;
where xi is a feature vector that has to be classified, xl is a
feature vector assigned to a class (i.e., the training sample),
and c is set to 1/28, with 28 being the number of input
parameters [46]. Note that the radial basis function is a
variant of the Gaussian kernel function.
For the SVM, the LibSVM implementation [11] was
used, using the cost parameter C and the kernel described
here. For all other settings, the defaults of LibSVM were
used [11].
7.3 Multi-Layer Perceptron (MLP) neural network
We computed WEKA’s [19] MLP trained by a back-
propagation algorithm. It used gradient descent with
moment and adaptive training parameters.
Experiments using various network topologies sup-
ported the claim from [5, 6, 20] that bigger MLP do not
always over-fit the data. In our case, an MLP with 3
layers with 7 nodes in the hidden layer was shown to
have optimal topology. This topology was trained with
500 cycles. For all other settings, the defaults of WEKA
were used [19].
8 Results
Using the three classifiers introduced in the previous sec-
tion, we conducted two series of analyses:
1. Cross-validation of the (precision of the) SUD with the
parameters of the speech signal features that are
classified by the k-NN, SVM, and MLP. On the one
hand, this verifies the validity of the SUD; on the other
hand, this determines the performance of the three
classifiers in objective stress detection.
2. Classification of the happiness and fear conditions of
both studies. This enables the inspection of the
feasibility of CAD for PTSD. Additionally, analyses
across both studies and of the baselines were con-
ducted to inspect the effects of experimental design.
The input for the classifiers were the principal components
described in the previous section. All classifiers were tested
using tenfold cross-validation, and their average perfor-
mance is reported in Table 2.
8.1 Cross-validation
The SUD scale consisted of 11 bins (from 0 to 10).
However, SUD score 10 was not used by any of the
patients and, hence, could not be classified. So, for the
classification 10 bins (i.e., SUD levels 0 to 9) were used.
All three classifiers were successfully employed.
Assuming the SUD provides a valid comparison for the
speech parameters, we classified the SUD scores over both
studies, including both conditions and their baselines. All
classifiers had to be capable of detecting stress from speech,
in particular when classification was simplified to the binary
comparison of low versus high stress. The correct classifi-
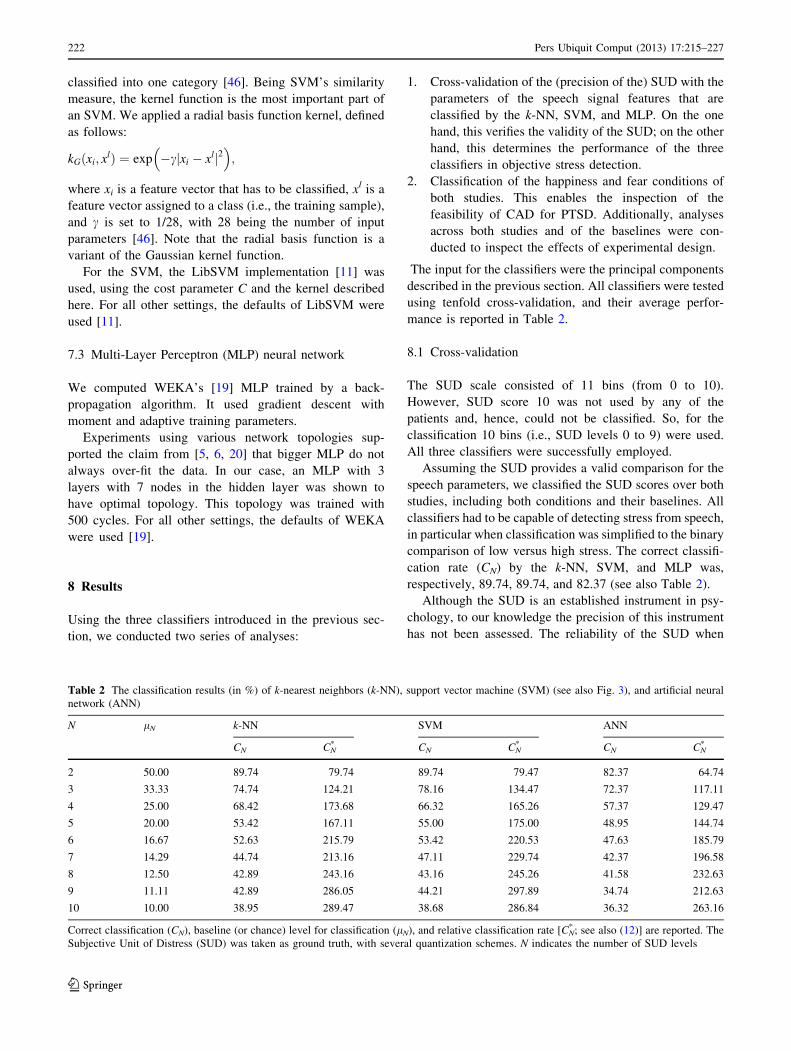
cation rate (CN) by the k-NN, SVM, and MLP was,
respectively, 89.74, 89.74, and 82.37 (see also Table 2).
Although the SUD is an established instrument in psy-
chology, to our knowledge the precision of this instrument
has not been assessed. The reliability of the SUD when
Table 2 The classification results (in %) of k-nearest neighbors (k-NN), support vector machine (SVM) (see also Fig. 3), and artificial neural
network (ANN)
N lN k-NN SVM ANN
CN CN* CN CN
* CN CN*
2 50.00 89.74 79.74 89.74 79.47 82.37 64.74
3 33.33 74.74 124.21 78.16 134.47 72.37 117.11
4 25.00 68.42 173.68 66.32 165.26 57.37 129.47
5 20.00 53.42 167.11 55.00 175.00 48.95 144.74
6 16.67 52.63 215.79 53.42 220.53 47.63 185.79
7 14.29 44.74 213.16 47.11 229.74 42.37 196.58
8 12.50 42.89 243.16 43.16 245.26 41.58 232.63
9 11.11 42.89 286.05 44.21 297.89 34.74 212.63
10 10.00 38.95 289.47 38.68 286.84 36.32 263.16
Correct classification (CN), baseline (or chance) level for classification (lN), and relative classification rate [CN* ; see also (12)] are reported. The
Subjective Unit of Distress (SUD) was taken as ground truth, with several quantization schemes. N indicates the number of SUD levels
222 Pers Ubiquit Comput (2013) 17:215–227
123
aiming at a high precision of reporting, such as for a scale
of 0–10, could be doubted if people’s interoception is
unreliable [14]. While this point is under debate [14],
patients with anxiety disorders have recently been shown to
be (over)sensitive to interoception [16].
In the current research, we not only used the SUD as a
ground truth, but also quantized the scale into all possible
numbers of levels, ranging from 10 to 2. This quantization
is performed by discretizing the SUD responses into
N steps, with a step size of r/N, where r is the range of the
SUD values (i.e., 9). This quantization allows us to verify
the reliability of the SUD in relation to the obtained speech
parameters.
To provide a fair presentation of the classification
results, we do not only provide the correct classification
rate (CN), but also the relative classification rate (CN* ) for
each of the N bins. The relative classification rate expresses
the improvement of the classification compared to baseline
(or chance) level. It is defined as:
C�N ¼CN � lN
lN
� 100; ð12Þ
with lN being the baseline (or chance) level for N classes.
This relative classification rate is also known as a range
correction and used more often in health and emotion
research [18].
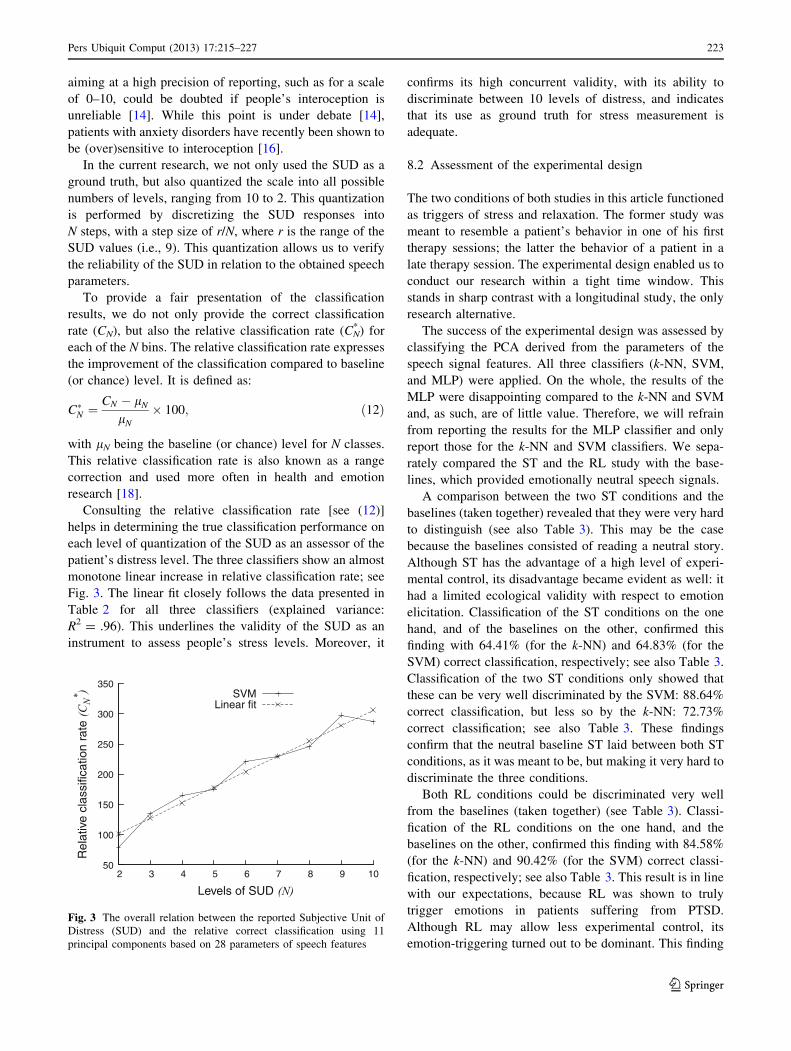
Consulting the relative classification rate [see (12)]
helps in determining the true classification performance on
each level of quantization of the SUD as an assessor of the
patient’s distress level. The three classifiers show an almost
monotone linear increase in relative classification rate; see
Fig. 3. The linear fit closely follows the data presented in
Table 2 for all three classifiers (explained variance:
R2 = .96). This underlines the validity of the SUD as an
instrument to assess people’s stress levels. Moreover, it
confirms its high concurrent validity, with its ability to
discriminate between 10 levels of distress, and indicates
that its use as ground truth for stress measurement is
adequate.
8.2 Assessment of the experimental design
The two conditions of both studies in this article functioned
as triggers of stress and relaxation. The former study was
meant to resemble a patient’s behavior in one of his first
therapy sessions; the latter the behavior of a patient in a
late therapy session. The experimental design enabled us to
conduct our research within a tight time window. This
stands in sharp contrast with a longitudinal study, the only
research alternative.
The success of the experimental design was assessed by
classifying the PCA derived from the parameters of the
speech signal features. All three classifiers (k-NN, SVM,
and MLP) were applied. On the whole, the results of the
MLP were disappointing compared to the k-NN and SVM
and, as such, are of little value. Therefore, we will refrain
from reporting the results for the MLP classifier and only
report those for the k-NN and SVM classifiers. We sepa-
rately compared the ST and the RL study with the base-
lines, which provided emotionally neutral speech signals.
A comparison between the two ST conditions and the
baselines (taken together) revealed that they were very hard
to distinguish (see also Table 3). This may be the case
because the baselines consisted of reading a neutral story.
Although ST has the advantage of a high level of experi-
mental control, its disadvantage became evident as well: it
had a limited ecological validity with respect to emotion
elicitation. Classification of the ST conditions on the one
hand, and of the baselines on the other, confirmed this
finding with 64.41% (for the k-NN) and 64.83% (for the
SVM) correct classification, respectively; see also Table 3.
Classification of the two ST conditions only showed that
these can be very well discriminated by the SVM: 88.64%
correct classification, but less so by the k-NN: 72.73%
correct classification; see also Table 3. These findings
confirm that the neutral baseline ST laid between both ST
conditions, as it was meant to be, but making it very hard to
discriminate the three conditions.
Both RL conditions could be discriminated very well
from the baselines (taken together) (see Table 3). Classi-
fication of the RL conditions on the one hand, and the
baselines on the other, confirmed this finding with 84.58%
(for the k-NN) and 90.42% (for the SVM) correct classi-
fication, respectively; see also Table 3. This result is in line
with our expectations, because RL was shown to truly
trigger emotions in patients suffering from PTSD.
Although RL may allow less experimental control, its
emotion-triggering turned out to be dominant. This finding
50
100
150
200
250
300
350
2 3 4 5 6 7 8 9 10
Rel
ativ
e cl
assi
ficat
ion
rate
Levels of SUD
SVMLinear fit
Fig. 3 The overall relation between the reported Subjective Unit of
Distress (SUD) and the relative correct classification using 11
principal components based on 28 parameters of speech features
Pers Ubiquit Comput (2013) 17:215–227 223
123
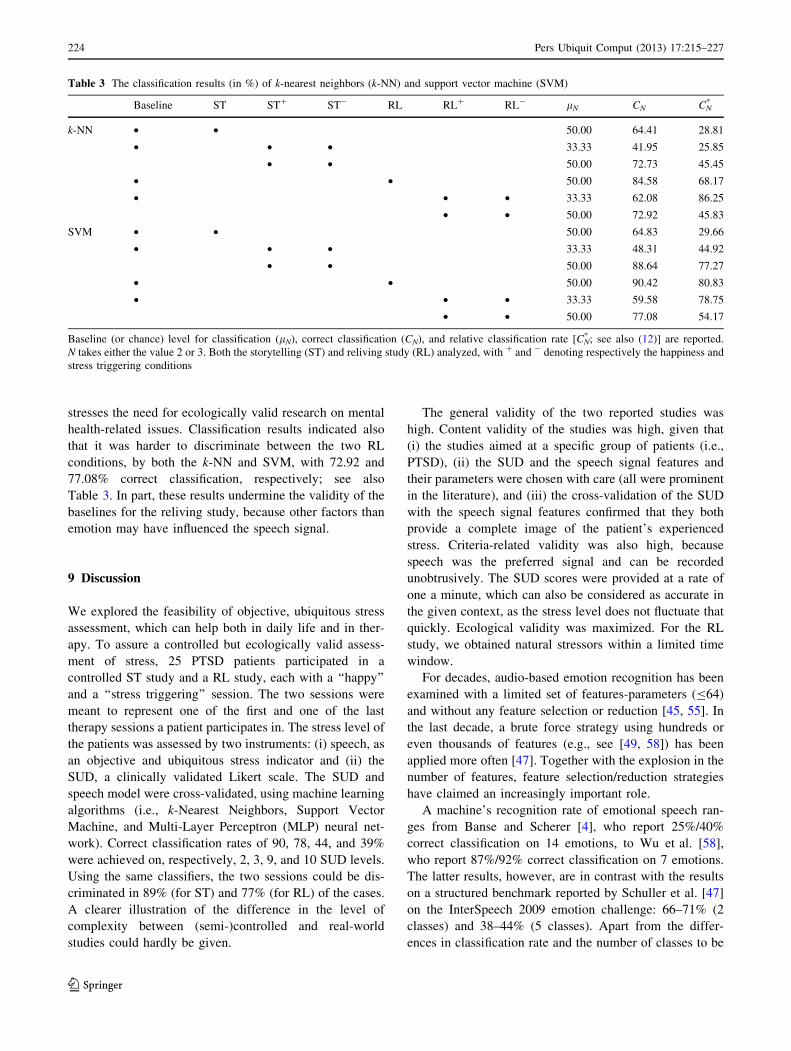
stresses the need for ecologically valid research on mental
health-related issues. Classification results indicated also
that it was harder to discriminate between the two RL
conditions, by both the k-NN and SVM, with 72.92 and
77.08% correct classification, respectively; see also
Table 3. In part, these results undermine the validity of the
baselines for the reliving study, because other factors than
emotion may have influenced the speech signal.
9 Discussion
We explored the feasibility of objective, ubiquitous stress
assessment, which can help both in daily life and in ther-
apy. To assure a controlled but ecologically valid assess-
ment of stress, 25 PTSD patients participated in a
controlled ST study and a RL study, each with a ‘‘happy’’
and a ‘‘stress triggering’’ session. The two sessions were
meant to represent one of the first and one of the last
therapy sessions a patient participates in. The stress level of
the patients was assessed by two instruments: (i) speech, as
an objective and ubiquitous stress indicator and (ii) the
SUD, a clinically validated Likert scale. The SUD and
speech model were cross-validated, using machine learning
algorithms (i.e., k-Nearest Neighbors, Support Vector
Machine, and Multi-Layer Perceptron (MLP) neural net-
work). Correct classification rates of 90, 78, 44, and 39%
were achieved on, respectively, 2, 3, 9, and 10 SUD levels.
Using the same classifiers, the two sessions could be dis-
criminated in 89% (for ST) and 77% (for RL) of the cases.
A clearer illustration of the difference in the level of
complexity between (semi-)controlled and real-world
studies could hardly be given.
The general validity of the two reported studies was
high. Content validity of the studies was high, given that
(i) the studies aimed at a specific group of patients (i.e.,
PTSD), (ii) the SUD and the speech signal features and
their parameters were chosen with care (all were prominent
in the literature), and (iii) the cross-validation of the SUD
with the speech signal features confirmed that they both
provide a complete image of the patient’s experienced
stress. Criteria-related validity was also high, because
speech was the preferred signal and can be recorded
unobtrusively. The SUD scores were provided at a rate of
one a minute, which can also be considered as accurate in
the given context, as the stress level does not fluctuate that
quickly. Ecological validity was maximized. For the RL
study, we obtained natural stressors within a limited time
window.
For decades, audio-based emotion recognition has been
examined with a limited set of features-parameters (B64)
and without any feature selection or reduction [45, 55]. In
the last decade, a brute force strategy using hundreds or
even thousands of features (e.g., see [49, 58]) has been
applied more often [47]. Together with the explosion in the
number of features, feature selection/reduction strategies
have claimed an increasingly important role.
A machine’s recognition rate of emotional speech ran-
ges from Banse and Scherer [4], who report 25%/40%
correct classification on 14 emotions, to Wu et al. [58],
who report 87%/92% correct classification on 7 emotions.
The latter results, however, are in contrast with the results
on a structured benchmark reported by Schuller et al. [47]
on the InterSpeech 2009 emotion challenge: 66–71% (2
classes) and 38–44% (5 classes). Apart from the differ-
ences in classification rate and the number of classes to be
Table 3 The classification results (in %) of k-nearest neighbors (k-NN) and support vector machine (SVM)
Baseline ST ST? ST- RL RL? RL- lN CN CN*
k-NN • • 50.00 64.41 28.81
• • • 33.33 41.95 25.85
• • 50.00 72.73 45.45
• • 50.00 84.58 68.17
• • • 33.33 62.08 86.25
• • 50.00 72.92 45.83
SVM • • 50.00 64.83 29.66
• • • 33.33 48.31 44.92
• • 50.00 88.64 77.27
• • 50.00 90.42 80.83
• • • 33.33 59.58 78.75
• • 50.00 77.08 54.17
Baseline (or chance) level for classification (lN), correct classification (CN), and relative classification rate [CN* ; see also (12)] are reported.
N takes either the value 2 or 3. Both the storytelling (ST) and reliving study (RL) analyzed, with ? and - denoting respectively the happiness and
stress triggering conditions
224 Pers Ubiquit Comput (2013) 17:215–227
123
distinguished, these studies can both be questioned with
respect to their ecological validity of the experienced
emotions. In contrast, in at least one of our two studies (in
particular, the RL study), true emotions were triggered.
Furthermore, the ST study can be considered as half-way
between common laboratory studies and real-world studies
(like the RL study). Our classification results illustrated the
considerable difference between the compromise ST study
and the real-world RL study. They show that a careful
interpretation of laboratory results is needed because a one-
on-one mapping between lab and real-world results cannot
be taken for granted.
An alternative explanation for the differences between
the ST and RL studies can be sought in the expression of
emotions rather than in their experience. Already in 1908,
Marty [32] proposed a differentiation between emotional
and emotive communication. In emotional communication,
speech serves as a spontaneous, unintentional leakage or
bursting out of emotion. In contrast, in emotive commu-
nication speech there is no automatic or necessary relation
to ‘‘real’’ inner affective states. As such, emotive com-
munication is considered to be a strategy to signal affective
information in speech. It uses signal patterns that differ
significantly from spontaneous, emotional expressions,
which can be initiated both intentionally and unintention-
ally [4, 26]. Possibly, emotional communication was
dominant in the RL study and emotive communication in
the ST study. Further research may reveal whether this
distinction underlies the differences in classification in the
two studies that we observed.
10 Conclusion
In this article, we have presented two studies involving one
and the same group of PTSD patients. This experimental
design provided us with two unique but comparable data
sets that only differed with respect to task. As such, a
comparison of two stress elicitation methods, ST and RL,
was possible. The comparison revealed both commonalities
and differences between the two studies, which are directly
relevant to several theoretical frameworks, such as the ones
outlined just before in the discussion.
It would be of interest to apply the models developed in
this research to patients suffering from other related psy-
chiatric disorders, such as depression [2, 25, 35], insomnia
[2], and generalized anxiety disorder [2, 37]. Probably,
even for less related psychiatric disorders, the current
approach would be a good starting point. In such a case, the
general framework and speech signal processing scheme,
as presented in this article, could be employed. Most likely,
only the set of parameters used for the processing pipeline
would have to be tailored to the specific disorders.
Apart from being unobtrusive, the speech signal pro-
cessing approach, as applied in the current studies, has
another major advantage: it enables the remote determi-
nation of people’s stress. This feature enables its use in yet
another range of contexts; for instance, in telepsychiatry
[22, 35], as personal stress indicator [3, 35], and in call-
centers [17, 33] that frequently have to cope with highly
agitated customers. However, as for the different psychi-
atric disorders and the other application areas mentioned,
the processing pipeline should be adapted to this situation
as well.
Taken together, an important and significant step was
made toward modeling stress through an acoustic model,
which can be applied in our daily lives and in mental health
care settings. By the specific research design, it was
ensured that ‘‘real’’ stress was measured. In addition, both
precise subjective measurement using the SUD, as well as
objective measurement through speech signal processing,
were shown to be feasible to detect stress and as such
determine therapy progress in an unobtrusive manner.
Statistical models were constructed on the basis of a
selection from 78 parameters of five speech features, which
showed reliable and robust stress classification. In sum, we
hope to have shown that unobtrusive and ubiquitous
automatic assessment of emotion and experienced stress is
possible and promising.
Acknowledgments We thank all Post-Traumatic Stress Disorder
(PTSD) patients who participated in this research of their own voli-
tion. We are also grateful to two anonymous reviewers for their
helpful suggestions on an earlier draft of this article. We gratefully
acknowledge prof. Anna Esposito (Second University of Naples and
International Institute for Advanced Scientific Studies (IIASS), Italy)
for being so kind to conduct a detailed review on a previous version of
this article. We thank Lynn Packwood (Human Media Interaction,
University of Twente, NL) for her accurate proof reading. Finally, we
would like to acknowledge Paul Boersma (Institute of Phonetic Sci-
ences, University of Amsterdam, NL) for his ground-breaking work
on the freely available program Praat.
Open Access This article is distributed under the terms of the
Creative Commons Attribution Noncommercial License which per-
mits any noncommercial use, distribution, and reproduction in any
medium, provided the original author(s) and source are credited.
References
1. Aha DW, Kibler D, Albert MK (1991) Instance-based learning
algorithms. Mach Learn 6(1):37–66
2. American Psychiatric Association (2000) DSM-IV-TR: Diag-
nostic and statistical manual of mental disorders, 4(Text Revi-
sion)th edn. American Psychiatric Publishing Inc., Washington
3. Arnrich B, Mayora O, Bardram J, Troster G (2010) Pervasive
healthcare: paving the way for a pervasive, user-centered and
preventive healthcare model. Methods Inf Med 49(1):67–73
4. Banse R, Scherer KR (1996) Acoustic profiles in vocal emotion
expression. J Person Soc Psychol 70(3):614–636
Pers Ubiquit Comput (2013) 17:215–227 225
123
5. Bartlett PL (1998) The sample complexity of pattern classifica-
tion with neural networks: the size of the weights is more
important than the size of the network. IEEE Trans Inf Theory
44(2):525–536
6. Baum EB, Haussler D (1989) What size net gives valid gener-
alization? Neural Comput 1(1):151–160
7. Blainlow LM, Galovski TE, Robinson T (2010) Gender differ-
ences in recovery from posttraumatic stress disorder: a critical
review. Aggress Viol Behav 15(6):463–474
8. Blascovich J, Bailenson J (2011) Infinite reality: Avatars, eternal
life, new worlds, and the dawn of the virtual revolution. William
Morrow/Harper Collins, New York
9. Boersma P (1993) Accurate short-term analysis of the funda-
mental frequency and the harmonics-to- noise ratio of a sampled
sound. In: Proceedings of the Institute of Phonetic Sciences, vol
17. University of Amsterdam, pp 97–110
10. Boersma PPG, Weenink DJM Praat 4.0.4 (2006). URL:
http://www.praat.org. Last accessed on 22 Aug 2011
11. Chang CC, Lin CJ (2011) LIBSVM: a library for support vector
machines. ACM Trans Intell Syst Technol 2(3), Article No.: 27
12. Cover TM, van Campenhout JM (1977) On the possible orderings
in the measurement selection problem. IEEE Trans Syst Man
Cybern SMC-7(9):657–661
13. Cowie R, Douglas-Cowie E, Tsapatsoulis N, Votsis G, Kollias S,
Fellenz W, Taylor JG (2001) Emotion recognition in human–
computer interaction. IEEE Signal Process Mag 18(1):32–80
14. Craig DA (2002) How do you feel? Interoception: the sense of
the physiological condition of the body. Nat Rev Neurosci
3(8):655–666
15. Darby JK Jr (1981) Speech evaluation in psychiatry. Grune &
Stratton, New York. ISBN: 978-0808913153
16. Domschke K, Stevens S, Pfleiderer B, Gerlach AL (2010) Inter-
oceptive sensitivity in anxiety and anxiety disorders: an overview
and integration of neurobiological findings. Clin Psychol Rev
30(1):1–11
17. El Ayadi M, Kamel MS, Karray F (2011) Survey on speech
emotion recognition: features, classification schemes, and dat-
abases. Pattern Recogn 44(3):572–587
18. Fillingim RB, Roth DL, Cook EW III (1992) The effects of
aerobic exercise on cardiovascular, facial EMG, and self-report
responses to emotional imagery. Psychosomatic Med 54(1):109–
120
19. Hall M, Frank E, Holmes G, Pfahringer B, Reutemann P, Witten
IH (2009) The WEKA data mining software: an update. ACM
SIGKDD Explor Newsl 11(1):10–18
20. Hansen LK, Salamon P (1990) Neural network ensembles. IEEE
Trans Pattern Anal Mach Intell 12(10):993–1001
21. Healey JA, Picard RW (2005) Detecting stress during real-world
driving tasks using physiological sensors. IEEE Trans Intell
Transp Syst 6(2):156–166
22. Hilty DM, Marks SL, Urness D, Yellowlees PM, Nesbitt TS
(2004) Clinical and educational telepsychiatry applications: a
review. Can J Psychiatry 49(1):12–23
23. Janssen JH, van den Broek EL, Westerink JHDM (2011) Tune in
to your emotions: a robust personalized affective music player.
User Model User Adapt Interact 21. doi:10.1007/s11257-011-
9107-7
24. Kedem B (1986) Spectral analysis and discrimination by zero-
crossings. Proc IEEE 74(11):1477–1493
25. Kessler RC (1997) The effects of stressful life events on
depression. Annu Rev Psychol 48(1):191–214
26. Khalil EN (2006) Communicating affect in news stories: the case
of the lead sentence. Text Talk Interdiscip J Lang Discourse
Commun Stud 26(3):329–349
27. Kosten TR, Mason JW, Giller EL, Ostroff RB, Harkness L (1987)
Sustained urinary norepinephrine and epinephrine elevation in
post-traumatic stress disorder. Psychoneuroendocrinology 12(1):
13–20
28. Krumm J (2010) Ubiquitous computing fundamentals. Chapman
& Hall/CRC Press, Boca Raton
29. Ladd DR, Silverman KEA, Tolkmitt F, Bergmann G, Scherer KR
(1985) Evidence for the independent function of intonation
contour type, voice quality, and F0 range in signalling speaker
affect. J Acoust Soc Am 78(2):435–444
30. Likert R (1932) A technique for the measurement of attitudes.
Arch Psychol 22(140):5–53
31. Lyons RG (2004) Understanding digital signal processing, 2nd
edn. Prentice Hall PTR, Upper Saddle River
32. Marty A (1908) Untersuchungen zur allgemeinen grundlegung
der grammatik und sprachphilosophie. Niemeyer, Halle/Saale
33. Morrison D, Wang R, De Silva LC (2007) Ensemble methods for
spoken emotion recognition in call-centres. Speech Commun
49(2):98–112
34. Murray IR, Arnott JL (1993) Toward the simulation of emotion in
synthetic speech: a review of the literature on human vocal
emotion. J Acoust Soc Am 93(2):1097–1108
35. Newman MG, Szkodny LE, Llera SJ, Przeworski A (2011) A
review of technology-assisted self-help and minimal contact
therapies for anxiety and depression: is human contact necessary
for therapeutic efficacy. Clin Psychol Rev 31(1):89–103
36. Nieuwenhuijsen K, de Boer AGEM, Verbeek JHAM, Blonk
RWB, van Dijk FJH (2003) The Depression Anxiety Stress
Scales (DASS): detecting anxiety disorder and depression in
employees absent from work because of mental health problems.
Occup Environ Med 60(Supplement 1):i77–i82
37. Pallavicini F, Algeri D, Repetto C, Gorini A, Riva G (2009)
Biofeedback, virtual reality and mobile phones in the treatment of
Generalized Anxiety Disorder (GAD): a phase-2 controlled
clinical trial. J Cyberther Rehabil 2(4):315–327
38. Picard RW (1997) Affective computing. MIT Press, Boston
39. Rani P, Sims J, Brackin R, Sarkar N (2002) Online stress
detection using psychophysiological signals for implicit human-
robot cooperation. Robotica 20(6):673–685
40. Rice SO (1952) Mathematical analysis of random noise. ATI 162
535 Monograph B-1589, Bell Telephone Labs, Inc., New York
41. Rothkrantz LJM, Wiggers P, van Wees JWA, van Vark RJ (2004)
Voice stress analysis. In: Lecture Notes in Computer Science
(Text, Speech and Dialogue), vol 3206, pp 449–456
42. Ruscha N, Corrigan PW, Powell K, Rajah A, Olschewski M,
Wilkniss S, Batia K (2009) A stress-coping model of mental
illness stigma: II. Emotional stress responses, coping behavior
and outcome. Schizophr Res 110(1–3):65–71
43. Ruscha N, Corrigan PW, Wassel A, Michaels P, Olschewski M,
Wilkniss S, Batia K (2009) A stress-coping model of mental
illness stigma: I. Predictors of cognitive stress appraisal. Schiz-
ophr Res 110(1–3):59–64
44. Sanchez-Meca J, Rosa-Alcazar AI, Marın-Martınez F, Gomez-
Conesa A (2010) Psychological treatment of panic disorder with
or without agoraphobia: a meta-analysis. Clin Psychol Rev 30(1):
37–50
45. Scherer KR (2003) Vocal communication of emotion: a review of
research paradigms. Speech Commun 40(1–2):227–256
46. Scholkopf B, Smola AJ (2002) Learning with kernels: support
vector machines, regularization, optimization, and beyond.
Adaptive computation and machine learning. The MIT Press,
Cambridge
47. Schuller B, Batliner A, Steidl S, Seppi D (2011) Recognising realistic
emotions and affect in speech: state of the art and lessons learnt from
the first challenge. Speech Commun 53(9–10):1062–1087
48. Shimamura T, Kobayashi H (2001) Weighted autocorrelation for
pitch extraction of noisy speech. IEEE Trans Speech Audio
Process 9(7):727–730
226 Pers Ubiquit Comput (2013) 17:215–227
123

49. Tawari A, Trivedi MM (2010) Speech emotion analysis:
exploring the role of context. IEEE Trans Multimed 12(6):
502–509
50. Tolin DF, Foa EB (2006) Sex differences in trauma and post-
traumatic stress disorder: a quantitative review of 25 years of
research. Psychol Bull 132(6):959–992
51. van den Broek EL (2011) Ubiquitous emotion-aware computing.
Pers Ubiquitous Comput 15. doi:10.1007/s00779-011-0479-9
52. van den Broek EL, Westerink JHDM (2009) Considerations for
emotion-aware consumer products. Appl Ergonomics 40(6):
1055–1064
53. van den Broek EL, Schut MH, Westerink JHDM, Tuinenbreijer K
(2009) Unobtrusive Sensing of Emotions (USE). J Ambient Intell
Smart Environ 1(3):287–299
54. van der Zwaag MD, Westerink JHDM, van den Broek EL (2011)
Emotional and psychophysiological responses to tempo, mode,
and percussiveness. Musicae Scientiae 15(2):250–269
55. Ververidis D, Kotropoulos C (2006) Emotional speech recogni-
tion: resources, features, and methods. Speech Commun 48(9):
1162–1181
56. Westerink JHDM, Krans M, Ouwerkerk M (2011) Sensing
emotions: the impact of context on experience measurements,
Philips Research Book Series, vol 12. Springer, Dordrecht
57. Wolpe J (1958) Psychotherapy by reciprocal inhibition. Stanford
University Press, Stanford
58. Wu S, Falk TH, Chan WY (2011) Automatic speech emotion
recognition using modulation spectral features. Speech Commun
53(5):768–785
Pers Ubiquit Comput (2013) 17:215–227 227
123