Seeking the Self in Pigment and Pixels: Postmodernism, Art ...
Bimodal spatial distribution of macular pigment: evidence of a gender relationship
18
Bimodal spatial distribution of macular pigment: evidence of a gender relationship François C. Delori Schepens Eye Research Institute, 20 Staniford Street, Boston, Massachusetts 02114, and Harvard Medical School, Gordon Hall, 25 Shattuck Street, Boston, Massachusetts 02115 Douglas G. Goger Schepens Eye Research Institute, 20 Staniford Street, Boston, Massachusetts 02114 Claudia Keilhauer University Eye Hospital Würzburg, 11 Josef-Schneider Strasse, Würzburg, Germany Paola Salvetti Schepens Eye Research Institute, 20 Staniford Street, Boston, Massachusetts 02114, and Harvard Medical School, Gordon Hall, 25 Shattuck Street, Boston, Massachusetts 02115 Giovanni Staurenghi Department of Ophthalmology, University of Milan, 11 via Muratori, Milan, 20135 Italy Received June 10, 2005; accepted August 4, 2005 The spatial distribution of the optical density of the human macular pigment measured by two-wavelength autofluorescence imaging exhibits in over half of the subjects an annulus of higher density superimposed on a central exponential-like distribution. This annulus is located at about 0.7° from the fovea. Women have broader distributions than men, and they are more likely to exhibit this bimodal distribution. Maxwell’s spot reported by subjects matches the measured distribution of their pigment. Evidence that the shape of the foveal depression may be gender related leads us to hypothesize that differences in macular pigment distribution are related to anatomical differences in the shape of the foveal depression. © 2006 Optical Society of America OCIS codes: 330.4300, 170.6280. 1. INTRODUCTION Macular pigment (MP) is an accumulation of lutein and zeaxanthin in the cone axons and in the inner-plexiform layer of the retina. 1,2 There is growing evidence that MP, a blue light absorber and an antioxidant, may protect the photoreceptors and the retinal pigment epithelium (RPE) from oxidative damage by short-wavelength radiation. 3–7 Risk for advanced age-related macular degeneration (AMD) was lower in individuals with higher dietary and/or plasma levels of total carotenoids 8,9 or with higher lutein and/or zeaxanthin. 10,11 Since MP can be increased by supplementation, 12,13 the possibility exists that supplementation may reduce risk of retinal degeneration in individuals with low MP and/or stabilize progression in AMD patients. Several methods have been used to mea- sure the MP optical density D MP and its spatial distri- bution in the fovea. These techniques are based on flicker photometry, 14–16 motion photometry, 17 fundus reflectometry, 18–21 resonant Raman dosimetry, 22,23 and two-wavelength 2- autofluorescence (AF) fluorometry 24,25 or imaging. 26,27 The AF method 24 for measurement of the optical den- sity of macular pigment D MP utilizes the AF of lipofuscin in the RPE of the retina. This AF is emitted in the 520– 800 nm spectral range and can be excited in vivo between 400 and 570 nm. 28 In the fovea, the excitation light is par- tially absorbed by the MP for excitation wavelengths lower than 550 nm, but the MP is transparent for most of the emitted AF 550 nm. Since the spatial distribu- tion of the RPE fluorescence is not uniform, 29 two excita- tion wavelengths that are differentially absorbed by the MP are needed to accomplish the measurement. The de- tection of the AF outside the MP absorption range 550 nm allows for a single-pass measurement of D MP . As with most methods, with the exception of Raman spectroscopy, 23 D MP is estimated from a density difference between foveal and perifoveal sites, thereby eliminating the influence of absorption in the ocular media. Scanning laser AF imaging at 488 nm excitation allows visualization and classification of the MP distribution, 30 but accurate quantification is not possible with a one- wavelength 1- method. Using AF imaging, we demonstrated 31,32 that in some subjects the distribution of the MP exhibited a bimodal pattern consisting of a cen- Delori et al. Vol. 23, No. 3/March 2006/J. Opt. Soc. Am. A 521 1084-7529/06/030521-18/$15.00 © 2006 Optical Society of America
-
Upload
independent -
Category
Documents
-
view
0 -
download
0
Transcript of Bimodal spatial distribution of macular pigment: evidence of a gender relationship

1MzlapfR(albsiAsbprtfl
Delori et al. Vol. 23, No. 3 /March 2006/J. Opt. Soc. Am. A 521
Bimodal spatial distribution of macular pigment:evidence of a gender relationship
François C. Delori
Schepens Eye Research Institute, 20 Staniford Street, Boston, Massachusetts 02114, and Harvard Medical School,Gordon Hall, 25 Shattuck Street, Boston, Massachusetts 02115
Douglas G. Goger
Schepens Eye Research Institute, 20 Staniford Street, Boston, Massachusetts 02114
Claudia Keilhauer
University Eye Hospital Würzburg, 11 Josef-Schneider Strasse, Würzburg, Germany
Paola Salvetti
Schepens Eye Research Institute, 20 Staniford Street, Boston, Massachusetts 02114, and Harvard Medical School,Gordon Hall, 25 Shattuck Street, Boston, Massachusetts 02115
Giovanni Staurenghi
Department of Ophthalmology, University of Milan, 11 via Muratori, Milan, 20135 Italy
Received June 10, 2005; accepted August 4, 2005
The spatial distribution of the optical density of the human macular pigment measured by two-wavelengthautofluorescence imaging exhibits in over half of the subjects an annulus of higher density superimposed on acentral exponential-like distribution. This annulus is located at about 0.7° from the fovea. Women havebroader distributions than men, and they are more likely to exhibit this bimodal distribution. Maxwell’s spotreported by subjects matches the measured distribution of their pigment. Evidence that the shape of the fovealdepression may be gender related leads us to hypothesize that differences in macular pigment distribution arerelated to anatomical differences in the shape of the foveal depression. © 2006 Optical Society of America
OCIS codes: 330.4300, 170.6280.
si84tltttMt�Asbt
vbwdo
. INTRODUCTIONacular pigment (MP) is an accumulation of lutein and
eaxanthin in the cone axons and in the inner-plexiformayer of the retina.1,2 There is growing evidence that MP,blue light absorber and an antioxidant, may protect the
hotoreceptors and the retinal pigment epithelium (RPE)rom oxidative damage by short-wavelength radiation.3–7
isk for advanced age-related macular degenerationAMD) was lower in individuals with higher dietarynd/or plasma levels of total carotenoids8,9 or with higherutein and/or zeaxanthin.10,11 Since MP can be increasedy supplementation,12,13 the possibility exists thatupplementation may reduce risk of retinal degenerationn individuals with low MP and/or stabilize progression inMD patients. Several methods have been used to mea-ure the MP optical density �DMP� and its spatial distri-ution in the fovea. These techniques are based on flickerhotometry,14–16 motion photometry,17 funduseflectometry,18–21 resonant Raman dosimetry,22,23 andwo-wavelength �2-�� autofluorescence (AF)uorometry24,25 or imaging.26,27
The AF method24 for measurement of the optical den-
1084-7529/06/030521-18/$15.00 © 2
ity of macular pigment �DMP� utilizes the AF of lipofuscinn the RPE of the retina. This AF is emitted in the 520–00 nm spectral range and can be excited in vivo between00 and 570 nm.28 In the fovea, the excitation light is par-ially absorbed by the MP for excitation wavelengthsower than 550 nm, but the MP is transparent for most ofhe emitted AF ���550 nm�. Since the spatial distribu-ion of the RPE fluorescence is not uniform,29 two excita-ion wavelengths that are differentially absorbed by theP are needed to accomplish the measurement. The de-
ection of the AF outside the MP absorption range ��550 nm� allows for a single-pass measurement of DMP.s with most methods, with the exception of Ramanpectroscopy,23 DMP is estimated from a density differenceetween foveal and perifoveal sites, thereby eliminatinghe influence of absorption in the ocular media.
Scanning laser AF imaging at 488 nm excitation allowsisualization and classification of the MP distribution,30
ut accurate quantification is not possible with a one-avelength �1-�� method. Using AF imaging, weemonstrated31,32 that in some subjects the distributionf the MP exhibited a bimodal pattern consisting of a cen-
006 Optical Society of America

tcwtt
2ATa4ts(
ypataTh(wy
m�wTds
Ifo7
BAficmc�d
tw2wtStt�nssnt
u0vfia0tltdtfiac
Ff�4inilcitttass4Fs
522 J. Opt. Soc. Am. A/Vol. 23, No. 3 /March 2006 Delori et al.
ral peak of highest density surrounded by a ring of in-reased density on the slopes of the profile. In this study,e used nonconfocal AF imaging at several wavelengths
o characterize the principal parameters of the DMP dis-ribution with particular emphasis on the ring pattern.
. METHODS. Subjectshe study population consisted of 41 subjects between 20nd 70 years of age (20 women and 21 men; mean age9±15 years) with normal retinal status and with refrac-ive error between and including −6 and +3 diopters. Fourubjects were pseudophakic, having an intraocular lensIOL) implant [women/men �W/M�=3/1, ages 61–67
ig. 1. (a), (b) AF images of the macula of a 50 year old womanor (a) �=545 nm and (b) �=470 nm, and a common barrier filter�590 nm�. Absorption by the MP is clearly demonstrated in the70 nm image (high MP absorption) compared with the 545 nmmage (very low absorption). The broader dark area in the 545m image represents the area of increased melanin pigmentation
n the RPE and of decreased lipofuscin fluorescence. (c) Relativeog-ratio map obtained from the aligned images. The dots on aircle at 4° radius are the end points of the 48 meridians radiat-ng from the center of the fovea. (d) Density profile DMP��� alonghe line ab seen in (c). The MP density is the difference betweenhe profile and the reference (see the text). The arrows indicatehe half-widths HW�7/8� and HW�3/8�, where the density is 7/8nd 3/8 of the peak density, respectively. The positions and den-ities of secondary maxima (solid circle), minima (open circle), orhoulders (cross) are calculated by differential analysis along all8 meridians, yielding the coded maps of their positions shown inig. 2 [Fig. 2(g) is for the same subject]. A slope less than thathown by line S is considered a shoulder.
ears]. Retinal status was established with color fundushotographs and/or during dilated fundus examination byn ophthalmologist (P.S.). One eye of each subject wasested. All subjects were Caucasians of European descentnd had best-corrected visual acuity of 0.63 or better.wenty-three subjects �W/M=13/10� had dark (brown orazel) iris color, and 18 subjects �W/M=7/11� had light
blue, gray, green) irides. Seven subjects �W/M=4/3�ere current smokers or had stopped in the last threeears (all but one had smoked less than 190 pack-years).
Women and men showed no significant differences inean age �t=0.21,p=0.8� or in mean degree of ametropia
t=0.6,p=0.6�. Degree of ametropia increased slightlyith age in women �p=0.01� but not in men �p=0.9�.here was a tendency for a higher prevalence of light iri-es among the younger subjects than among the olderubjects ��2=3.1,p=0.08�.
The tenets of the Declaration of Helsinki were followed,nstitutional Review Board approval was granted, and in-ormed consent was obtained for all subjects.33 The pupilf the test eye was dilated with 1% Tropicamide to at leastmm in diameter.
. Autofluorescence ImagingF and reflectance images were acquired with a modified
undus camera (TRC-FE, Topcon Corp., Tokyo, Japan) us-ng a 15° diameter field of view and coupled to a CCDamera.25 The CCD (MicroMax, RS, Princeton Instru-ents, Trenton, New Jersey) was scientific grade and
ooled �−17 °C�, and its image array had 384255 pixels and 12 bits of gray level. Pixel size was 0.05
egree/pixel (14.4 �m/pixel at the retina).The optical density of the MP �DMP� was measured with
he two-wavelength �2-�� method,24 using excitationavelengths �=470 and �=545 nm (FWHMs of 29 and6 nm, respectively). An IR blocking filter ���600 nm�as also located between the light sources and the exci-
ation filters. A common barrier filter was used (OG590,chott). Leakages of the 470 and 545 nm filter combina-ions [integrated over the spectral range of the barrier fil-er (590–900 nm)] were measured to be, respectively, 1105 and 7�105 times less than the reflected light sig-
al. Using actual AF and reflectance levels (in 11 studyubjects), we estimated that such a leak signal repre-ented 0.4% ±0.2% and 0.2% ±0.1% of the foveal AF sig-al for the 470 and 545 nm filter combinations, respec-ively. This would have no significant effect on DMP.
Alignment and focusing of the fundus were performednder 545 nm illumination (retinal irradiance of.2 mW/cm2 for 30–90 s) by using an external fixation de-ice to direct the subject’s fovea near the center of theeld of the camera. One to three 545 nm reflectance im-ges were first recorded (retinal radiant exposure of.5 mJ/cm2 for each image, 3 ms duration). We estimatedhat photoreceptor bleaching after these exposures was ateast 96% for cones and 79% for rods.34–36 AF images werehen obtained with �=545 nm and �=470 nm (retinal ra-iant exposure of 3.0 mJ/cm2 for each image, 3 ms dura-ion), and these exposures were repeated if the subject’sxation was poor. All measurements were repeated aftershort break and repositioning and realignment of the
amera.

omlrm
a=5wp
CAaAarmcwa
aaateo
wtma4scb=ne
F51cvw(satse
Delori et al. Vol. 23, No. 3 /March 2006/J. Opt. Soc. Am. A 523
The retinal safety standard37 applied to the worst casef a 470 nm exposure at the retina indicated that theaximum permissible number of images was 95, much
arger than the 10–20 images used in our protocol. Theetina could safely be exposed to the focusing light forore than 8 h.In 21 subjects (W/M=9/12, mean age 53±14 years), we
lso recorded an AF image using �=510 nm �FWHM21 nm�, allowing for the computation of DMP using the10–545 nm wavelength pair. These DMP distributionsere compared with those obtained with the 470–545 nmair.
. Image AnalysisF images (Fig. 1) were analyzed with the IGOR imagenalysis software (WaveMetrics, Lake Oswego, Oregon).fter the CCD dark level was subtracted, the images wereligned, using translations, by matching the position ofetinal vessels in the superimposed images and by mini-izing, in the difference image, misalignment artifacts
aused by details in the AF distribution. Both imagesere smoothed by using a Gaussian filter with full widtht half-height (FWHM) of 7 pixels or 0.35°. A log-ratio im-
ig. 2. MP distributions in 12 subjects displayed in three age g5–70 years. Men are in the first and second columns, women in° visual angle. All distributions are shown with the nasal side oorrected to allow visualization of details in the high-density (darkertical density profiles through the fovea center (displayed at thith spacing of 0.25 D.U. The coded map of the positions of the m
crosses) on each meridian is shown in the upper right side in eachown are the equidensity contour lines at 3/8 of peak density (ound age of the subject (e.g., M34), the index �Nr� characterizingributions �0�Nr�48�, and the pattern of Maxwell’s spot reportpokes; R, ring with no central spot; Rc, ring with central spot; anach figure of this paper.
ge [Fig. 1(c)] was calculated as log�F545/F470�, where F470nd F545 are gray-level distributions in the aligned AF im-ges for �=470 and 545 nm, respectively. The position ofhe center of the fovea was defined as the location of low-st AF in the 470 nm excitation image. The optical densityf the MP at 460 nm is calculated by using24
DMP =1
K470 − K545�log
F545
FR,545− log
F470
FR,470� , �1�
here DMP is the density difference between any point inhe field and the reference location, FR,545 and FR,470 areeasured at the perifoveal reference location, and K470
nd K545 are the known extinction coefficients of MP at70 and 545 nm (normalized to K460=1). We used the MPpectrum derived by Bone et al.38 that yielded a scalingonstant �K470−K545�−1 of 1.19 after averaging over theandwidths of the interference filters �K470=0.857, K5450.016�. This scaling constant was 2.55 for the 510–545m combination �K510=0.408�. To determine the refer-nce, we fitted a plane through the 48 evenly spaced
top row, 20–40 years; middle row, 40–55 years; and bottom row,ird and fourth columns. Tick marks along the axes are spaced atleft. The “gray-scale” map of the MP densities has been gamma-ea at the fovea (same correction for all maps); the horizontal andom and the left side of each panel) are scaled to the tick marksa (black solid circles), minima (gray solid circles), and shouldersel (displaced by 2° temporally and 2° superiorly, for clarity). Alsod at 7/8 of peak density (inner). Each panel includes the genderminence of the ring pattern observed on the slopes of some dis-the subject (Subsection 3.F): D, diffuse spot; Ds, dark spot withesting was not performed. The same information will be given in
roups:the thn theest) are bottaxim
h panter) an
the proed byd “-”, t

p1
t7wttttaohsdpcrmd
mpcImfdpuop
invmwt
DVT4tosintaan
EIATsUvofTb=
FAm(gVcocmtaguttwjltwcpt
3Mvtbllrt
Fl(anfIT(
524 J. Opt. Soc. Am. A/Vol. 23, No. 3 /March 2006 Delori et al.
oints of the log-ratio image (at 4° from the fovea [Figs.(c) and 1(d)]) and substituted the fitted values in Eq. (1).Density profiles were derived along 24 lines through
he center of the fovea positioned at angular intervals of.5° [Figs. 1(c) and 1(d)]. The density at the peak, DMP�0�,as obtained from the average of the peak densities on
he 24 scans (although the scan rotated around a point,he maxima were spread over a small area). The analysishen proceeded for each of 48 radial meridians (lines fromhe center of the fovea to the periphery). The half-widtht 3/8 of peak density, HW�3/8�, characterizes the widthf the profile. We did not use the traditional half-width atalf the peak because secondary maxima on the profilelope [Fig. 1(d), right slope] occurred in a few subjects at aensity lower than the half-level. The half-width at 7/8 ofeak density, HW�7/8�, characterizes the width of theentral peak of the profile; if the profile along a meridianeached the 7/8 level at a higher eccentricity than theean minimum eccentricity for that subject, then this
ata point was not included.To characterize the position of the ring pattern on eacheridian, we used differential analysis of the smoothed
rofile between 0.25° and HW�3/8� to determine the ec-entricities and DMP’s of secondary maxima and minima.f a maximum–minimum pair was not identified along aeridian profile, then an additional analysis was per-
ormed to ascertain whether the profile exhibited a shoul-er (plateau, inflection); these occur when the slope of therofile was between 0 (plateau) and 0.2DMP�0� densitynit/deg. This information is presented as coded overlaysf the density maps [Fig. 1(d)]. All eccentricities were ex-ressed in degree of visual angle.Means for the above-defined parameters for all merid-
ans �n=48� were calculated for each test. If HW�7/8� wasot available for more than 24 meridians, then its meanalues were not included. Results of the test and retesteasurements were averaged (except in four subjects,here no retest was available) and yielded information on
he reproducibility.
ig. 3. Index Nr that characterizes the prominence of the annu-us pattern plotted versus age (left) for women (circles) and menbow ties). The vertical lines are the differences between the testnd retest determinations (shaded symbols are for those whereo retest was available). Symbols with a horizontal white bar areor pseudophakic subjects. The vertical bars (right) represent theQR with the median (dark lines) for women (W) and men (M).he index Nr was significantly higher in women than in men
Mann–Whitney, Z=3.8, p=0.0001).
. Visualization of the Macular Pigment Distribution byiewing Maxwell’s Spotwenty-seven study subjects (mean age4±16 years, W/M=14/13) were also asked to describeheir Maxwell’s spot (an entoptic phenomenon that allowsne to visualize the distribution of his/her MP).39,40 Theubjects observed a fine grain diffuse screen back-lluminated over a 25° visual field with blue light (460m, FWHM �20 nm, 2.7 c/m2); they were asked to selecthe most appropriate description for what they observedmong the following options: nothing, a diffuse dark spot,diffuse dark spot with spokes (or star), a dark ring witho central spot, and a dark ring with a dark central spot.
. Scanning Laser Ophthalmoscope AutofluorescencemagesF images of special cases were included in this study.he images are from subjects at the Eye Hospital, Univer-ity of Würzburg, Germany (C.K.) and at the Eye Clinic,niversity of Brescia, Italy (G.S.) and were part of a pre-ious study using AF imaging with the scanning laserphthalmoscope (SLO).31 Informed consent was obtainedor protocols approved by these respective institutions.he AF images were acquired with SLOs (HRA, Heidel-erg Engineering, Heidelberg, Germany) using �488 nm and a 30° field.
. Statistical Analysesll results are given as mean±standard deviation or asedian [with the corresponding interquartile range
IQR)]. Stepwise multiple regression was used to investi-ate the influence of several factors on a parameter (Stat-iew, SAS Institute, Cary, North Carolina). The factorsonsidered were the continuous variables age and degreef ametropia, the dichotomous variables gender and irisolor, and the three possible interactions with age. Toinimize type II errors, the model accepted only factors
hat had F ratios 5 (F ratios to reject: 4.96). Smokingnd phakic status were not included in the multiple re-ressions because of their small numbers: Instead wesed t tests to compare parameters in seven smokers withhose of seven age- and gender-matched nonsmokers ando compare parameters in the four pseudophakic subjectsith those of eight age- and gender-matched phakic sub-
ects (two for each pseudophakic subject). Statistical out-iers were defined as those data that were outside the in-erval �10th percentile−IQR, 90th percentile+IQR�,here IQR is the range between the 25th and 75th per-
entiles. For variables varying with age, we applied thisrocedure to the residuals of linear fit with age throughhe data.
. RESULTSP spatial distributions measured by 2-� AF imaging
aried from a single central peak that decreased mono-onically with increasing eccentricity to a bimodal distri-ution with a central peak surrounded by a ring (annu-us) of high density (Fig. 2). When observed, the ring wasocated at an eccentricity between 0.6° and 1.2°, and theing’s maximum was often only moderately higher thanhe density on the inner edge of the ring [panels (b), (h)].

Ioope[[podtrtp
lttm
AOompmr
T0=sw(
i=(m=aawaId
fs
BMsHaptteh1o
cswsoieas1dcchi
CTacoysoeaen=ct
P
MMMHHH
easurem
Delori et al. Vol. 23, No. 3 /March 2006/J. Opt. Soc. Am. A 525
ntermediate distributions included an annulus coveringnly part of the circumference of the distribution [(d),(l)]r shoulders (inflections, plateaus) on the slopes of therofiles [(e),(j)]. The density of the ring is sometimes un-ven and may appear as discrete dots located on a circle(c)]. The pattern is often fragmented at old age(k),(l),(m)]. One subject [(k)] showed a pronounced ringattern that was interrupted inferiorly; this is the resultf a focus of RPE atrophy (with very low AF) that was notetectable in the color photograph (visual acuity 1.00). Inhree subjects [such as (d)], the central peak could not beeadily differentiated from the surrounding annulus andhe mean HW�7/8� was derived only if differentiation wasossible for more than 50% of the circumference.We will use the terminology “ring” to refer to the annu-
ar pattern. For clarity we will define “peak” density ashe optical density of the MP at the center of the distribu-ion, whereas we will use “maximum” to designate theaximum on the edge of the profile (ring pattern).
. Prominence of Ring Patternur image analysis detected, on each of the 48 meridiansf the MP distribution (Fig. 1), either a maximum–inimum pair, a shoulder, or nothing. To characterize the
rominence of the ring pattern, we used the number ofaxima–minima and the number of shoulders for all me-
idians to define an index Nr:
Nr = �Count of maximum–minimum pairs� + �1/2�
��Count of shoulders�. �2�
he index Nr varied among different individuals betweenand 48 (Fig. 3) and had a median value of 21 �IQR
23�. The median reproducibility of Nr, defined as the ab-olute difference in Nr between test and retest �n=37�,as 5.0 (range 0.5–21.5) and was not affected by age
Spearman �=−0.2,p=0.3).The ring pattern was more pronounced in women than
n men (Fig. 3): The median Nr values were 30 �IQR17� and 11 �IQR=16� for women and men, respectively
Mann–Whitney, Z=3.8, p=0.0001). The number ofaximum–minimum pairs was higher in women �Z3.9, p0.0001�, but the number of shoulders exhibitedtendency to be higher in men �Z=1.5, p=0.13�; this is
lso apparent in the distributions in Fig. 2. The index Nras not affected by age ��=0.11, p=0.5�, degree ofmetropia ��=0.04, p=0.8�, or iris color �Z=0.5, p=0.6�.n age- and gender-matched comparisons, we could notetect an effect of smoking status �Z=0.4,p=0.6�, but the
Table 1. Macular Pigment Optica
arameter Unit
P density at peak, DMP�0° � D.U.P density at 1.5° eccentricity, DMP�1.5° � D.U.P density averaged in 1° diameter circle D.U.alf-width at 7/8 of DMP�0� , HW�7/8� degalf-width at 1/2 of DMP�0� degalf-width at 3/8 of DMP�0� , HW�3/8� deg
an=41 subjects, except for HW�7/8�, where n=38.bMedian value, for 37 subjects, of the absolute difference of the test and retest m
our subjects with IOL’s had lower Nr values than phakicubjects, as is apparent in Fig. 3 �Z=2.0,p=0.04�.
. Elliptical Distribution of Peak Densityacular pigment density distribution is not circularly
ymmetric; mean half-widths at 3/8 of peak density,W�3/8�, were 1.59° ±0.36°, 1.52° ±0.40°, 1.39° ±0.33°,nd 1.26° ±0.30° for the nasal, temporal, inferior, and su-erior meridian, respectively. All differences betweenhese four meridians were statistically significant (paired,�3.6, p0.001), except for the nasal–temporal differ-nce �t=1.7, p=0.07�. The distribution extended moreorizontally than vertically with an ellipticity of.17±0.09 (range 0.96–1.42, p0.0001), and more inferi-rly than superiorly (by about 11%, p=0.0008).
Although statistically significant, the deviations fromircular symmetry were small compared with the inter-ubject variability: The intersubject variance in HW�3/8�as 4.7 times larger than the intrasubject variance �p0.0001�. Because of this and because parameters mea-
ured on different meridians correlated highly with eachther, we chose to average parameters over all 48 merid-ans for each subject and to calculate a mean profile forach subject from the average of the 48 profiles. Meansnd ranges of the various parameters that we have cho-en to characterize the MP distribution are given in Table, together with median values of the test–retest repro-ucibility. For comparison with other studies, we have in-luded in Table 1 the mean DMP averaged over a 1° circleentered on the fovea, and the mean half-width at half-eight. MP density profiles averaged over the 48 merid-
ans (Fig. 4, thick curves) were calculated for all subjects.
. Densities and Distribution Widthhe shape of the MP density distribution changed withge and gender (Fig. 5). The density at the peak, DMP�0�,orrelated negatively with age �r=−0.4,p=0.02�, a resultf the marked decrease with age for subjects older than 60ears �r=−0.5,p=0.04�. Stepwise multiple regression forubjects less than 60 years of age showed no dependencen age or any other factors. However, the densities at anccentricity ��� greater than 1° tended to increase withge, but this was significant only in women; the strongestffect was at ��1.5° [Fig. 5(a)], where DMP�1.5� was sig-ificantly higher in women than in men �t=2.9,p0.007�. Stepwise multiple regression showed a signifi-ant interaction between gender and age (p=0.003; seehe caption to Fig. 5).
sities and Critical Eccentricities
±S.D.a and (Range) Test–Retestb Median and (Range)
1±0.07 (0.16–0.43) 6.4% (0%–34%)0±0.04 (0.04–0.21) 9.8% (0%–59%)5±0.07 (0.11–0.40) 6.4% (0%–36%)5±0.07 (0.13–0.43) 11.6% �n=34� (1%–54%)6±0.32 (0.59–2.05) 3.1% (0%–25%)1±0.32 (0.85–2.26) 2.9% (0%–23%)
ents expressed as a percentage of their mean.
l Den
Mean
0.30.10.20.21.11.4

c�nt�
Hagenp
af
taDnbw
DIpw=0=0=dscddoctaf
fssctwpTss
EWT2p4m(8ttatsw
w=ermf=
F(tpG�t(thpfiicnisaFlb0
526 J. Opt. Soc. Am. A/Vol. 23, No. 3 /March 2006 Delori et al.
The half-width at 3/8 of peak density, HW�3/8�, in-reased significantly with age in both women and menp=0.01�, but this increase was significantly more pro-ounced in women �p0.0001� [Fig. 5(b)]. The width ofhe central peak, HW�7/8�, increased slightly with agep=0.008� but was not significantly affected by gender.
We found no association between DMP�0�, DMP�1.5�,W�3/8�, and HW�7/8� with iris color or degree ofmetropia. Furthermore, in age- and gender-matchedroups (Subsection 2.E), we found no significant differ-nces for these four parameters between smokers andonsmokers (all t0.7, p�0.4) and betweenseudophakic and phakic subjects (all t1.3, p�0.2).Thus the distribution of MP broadens with age, more so
t the base of the profile than at its peak, and these ef-ects are more pronounced in women. One might expect
ig. 4. Mean DMP profiles obtained with the 470–545 nm pairthick curves) as a function of eccentricity for six subjects ob-ained by averaging the profiles measured on 48 meridians. Therofiles were displaced by 0.15 D.U. for clarity (DMP is zero at 4°).ender and age are given for each subject, as well as the index
Nr� and the Maxwell spot type seen by each subject (see the cap-ion to Fig. 2). DMP profiles obtained with the 510–545 nm pairdotted curves) have similar shape but exhibit higher densitieshan those for the 470–545 nm wavelength pair (subject W67 ex-ibited the largest difference among the study subjects). The ringattern is similar for both combinations. The three sets of pro-les at the bottom were obtained with various degrees of bleach-
ng of the photoreceptors. The arrow in each case indicates in-reased level of bleaching. For subject M60, four sets of 470–545m exposures—each pair yielding a single profile—were obtained
n sequence (after focusing and one monochromatic image). Forubject W29, the two profiles are from our regular protocol andfter 5 min bleaching at 545 nm followed by our regular protocol.or subject M62, three profiles were acquired after focusing fol-
owed by 5 min of dark adaptation (the last profile in this set isetween the first two). The changes of peak densities were 0.06,.00, and 0.05 D.U., respectively.
hat the increases in profile widths, which were measuredt 3/8 of DMP�0�, might be related to decreases inMP�0�’s; this is not the case, since HW�3/8� was not sig-ificantly correlated with DMP�0� �r=−0.2,p=0.5�. Theroadening of the distribution with age, particularly inomen, is illustrated by the normalized profiles in Fig. 6.
. Effect of Excitation Wavelength „�… and Bleachingn 21 subjects (ages 24–69 years), we found that the MProfiles obtained with our standard �=470 to 545 nm pairere significantly lower than those obtained with the �510 to 545 nm pair (Fig. 4): The mean DMP�0�’s were.29±0.07 and 0.35±0.08 D.U., respectively (paired, t10, p0.0001). The mean density difference was.058±0.026 D.U.: It increased slightly with age �p0.02�, was lower in women �p=0.04�, and displayed noependence on degree of ametropia or iris color. Thehapes of the distribution obtained with the two filterombinations were quite similar (Fig. 4): No significantifferences were found either in the width HW�3/8� of theistributions (paired, t=1.1, p=0.3) or in the prominencef the ring pattern as characterized by the index Nr (Wil-oxon signed rank test, Z=0.5, p=0.6). The choice of exci-ation pair affected the entire profile, albeit more stronglyt the center; this is likely the result of stray light (SL)rom lens fluorescence (Subsection 4.I).
Incomplete bleaching of photoreceptors could also af-ect the MP density profile, and we tested this in threeubjects by measuring the DMP profile during differenttates of light adaptation (Fig. 4, bottom). Small, but notonsistent, changes were observed during light adapta-ion. The peak densities decreased by less than 0.06 D.U.ith bleaching, but this change is opposite to what is ex-ected from bleaching of cones and rods (Subsection 4.J).hus the shape of the profile and its ring pattern did noteem to be strongly affected by residual photoreceptor ab-orption.
. Positions of the Ring Pattern: Effect of Distributionidth
o characterize the ring pattern, we considered only the5 subjects who had eight or more maximum–minimumairs on their MP distribution (W/M=19/6, mean age8±16 years). The ring pattern was maximal and mini-al at mean eccentricities of 0.73° and 0.48°, respectively
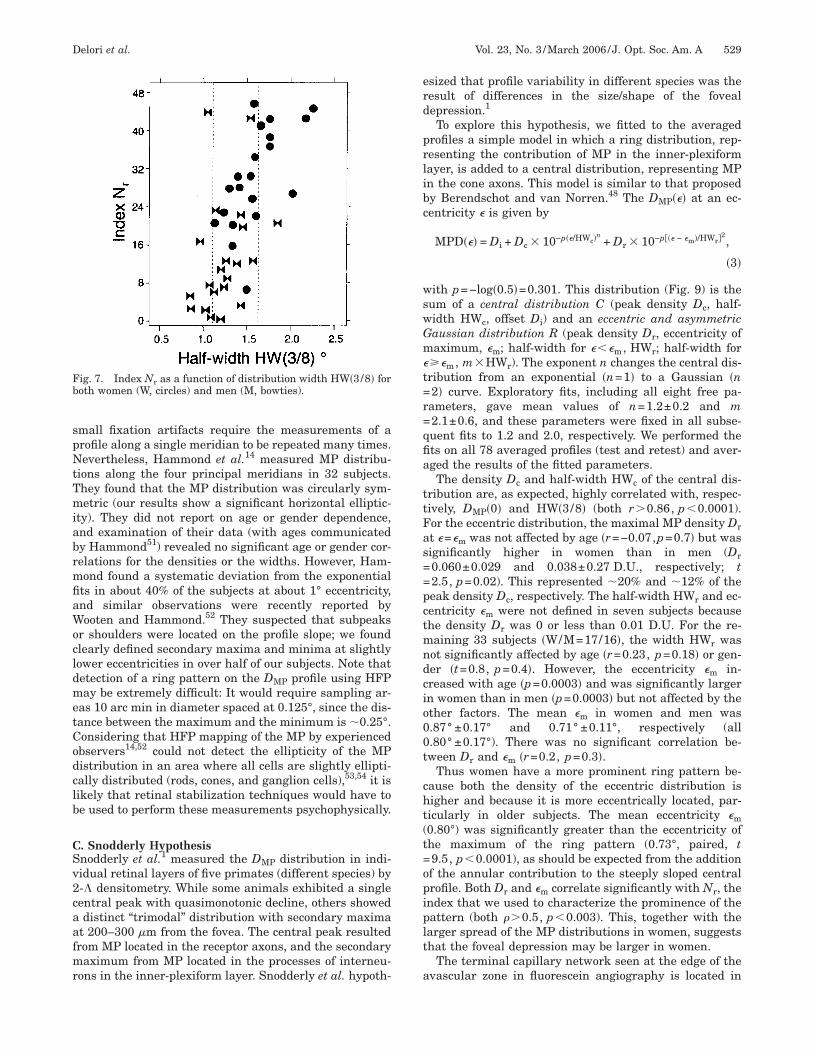
Table 2). The DMP’s at the maximum and minimum were1% and 75% of the peak density, respectively. The eccen-ricity at which the ring maximum occurred showed posi-ive correlations with both the half-width HW�3/8� andge (Table 2), but the effect of gender could not be ascer-ained because of its uneven gender distribution in thisubgroup. A more comprehensive analysis of this issueill be presented in the discussion (Subsection 4.C).The index Nr increases significantly with the half-
idth HW�3/8� (Fig. 7, n=41, Spearman �= +0.55, p0.0005). Since HW�3/8� is also related to gender, wevaluated whether the gender effect existed for a narrowange of widths (with good overlap between the widths foren and women): Women had higher Nr than men, even
or equal distribution widths (Mann–Whitney, Z=2.88, p0.004).

FTrmaabds==rpr
o3wm=dtdwsotp
4MbhamssetmsattDlf
ATd
Flbbsowaa(wmao�+H=
FacM
Delori et al. Vol. 23, No. 3 /March 2006/J. Opt. Soc. Am. A 527
. Visualization of Maxwell’s Spothe type of Maxwell’s “spot” observed by 27 subjects cor-esponded well with the pattern exhibited in their DMPaps. Table 3 gives the median index Nr measured by im-
ging for each of four types. Choosing the report of a rings end point (with or without central spot, given in theottom two rows in Table 3), we found that the median in-ex Nr for those who reported a ring was 39 �IRQ=17�,ignificantly larger than the median index of 14 �IRQ17� for those who did not (Mann–Whitney, Z=3.2, p0.001). Women and men were equally likely to observe aing ��2=1.2, p=0.3�. Since it is possible that subjects re-orting “spokes” may actually see different fragments of aing pattern, we repeated the analysis by using deviation
ig. 5. (a) Optical density DMP�0� at the peak (closed symbols,eft scale) and density DMP�1.5° � at 1.5° eccentricity (open sym-ols) as a function of age for both women (W, circles) and men (M,owties). Symbols with a horizontal bar are for the pseudophakicubjects. The DMP�1.5° � plot was displaced downward to avoidverlap (right scale). Regression lines are for simple regressionith age [split in two parts for DMP�0�]. (b) Half-widths HW�3/8�,t which the density is 3/8 of the peak density (soled symbols),nd HW�7/8�, at which the density is 7/8 of the peak densityopen symbols), as a function of age. Same symbols apply foromen and men as those in (a). Stepwise multiple regressionodels are used (factors were age, degree of ametropia, gender,
nd iris color). The dichotomous variable [Fe] is 1 or 0 for womenr men, respectively. DMP�1.5° ��in D.U.�=0.084+0.0007�FE��Age�; adjusted r2=0.18, p=0.003. Half-width HW�3/8�=0.940.0064�Age�+0.0070�FE��Age�; adjusted r2=0.52, p0.0001.alf-width HW�7/8�=0.16+0.0017�Age�; adjusted r2=0.17, p0.008 (n=39, two outliers indicated by an arrow).
f a diffuse spot as end point (bottom three rows of Table). In that case, the mean Nr was 30 �IRQ=21� for thoseho reported a deviation, significantly larger than theedian Nr of 13 �IRQ=17� for those who did not �Z3.0, p=0.003�, and women were more likely to observeeviation of a diffuse spot ��2=6.3, p=0.01�. Thus the pat-ern type of Maxwell’s spot did not exhibit the strong gen-er relationship seen with Nr, although the type of Max-ell’s spot corresponded well with index Nr. For the two
ubgroups that reported either a “dark spot with spokes”r “a ring without central spot,” we could not detect anyrends in the comparison of the DMP maps with the re-orted Maxwell spot type.
. DISCUSSIONacular pigment density �DMP� distributions measured
y the 2-� AF method were slightly elliptic with a meanalf-width of 1.2°. Peak densities �DMP� did not vary withge for subjects less than 60 years of age but decreasedarkedly in older subjects, probably as a result of exces-
ive SL. The distribution of MP broadened with age, moreo at the base of the profile than at its peak, and theseffects were more pronounced in women. Women, morehan men, also exhibited a ring pattern with minimal andaximal densities at eccentricities of �0.7° and �0.5°, re-
pectively. Shoulders or plateaus at the same locationsre also detected. This ring pattern was also observed en-optically by subjects who exhibited such a pattern inheir DMP distribution. The relationships between the
MP distribution and gender has not been reported in theiterature: However, previous studies,41,42 but not all,21,43
ound that women had lower DMP than men.
. Other Imaging Modalitieshe ring pattern is also observed with other imaging mo-alities. Using AF images (excitation wavelength �
ig. 6. Average normalized profiles for women and men in threege groups (as shown). The increase in relative densities for ec-entricities larger than 1° causes a widening of the profile. TheP mean densities at the peak, D �0�, are given at the top.
MP
=(s8modtrrwondemir
dbfstflepttpds0�flcdtt
ssimi
ltipo
bpmayfb
s[coaoplrcsw
BTwieawylscpo
flcr
P
PHEEDDM
528 J. Opt. Soc. Am. A/Vol. 23, No. 3 /March 2006 Delori et al.
488 nm) recorded with a scanning laser ophthalmoscopeSLO),31 we demonstrated the existence of a ring patternimilar in size to those observed in this study [Figs. 8(a),(c), and 8(e)]. However, examination of AF images byasked observers revealed no gender dependence on its
ccurrence. Whether differences in age/sex distribution,iet, differences between 1- and 2-� methods (see Subsec-ion 4.E), or image quality can explain this discrepancyemains to be fully clarified. The pattern may be lesseadily detectable in SLO images than in images recordedith our nonconfocal camera [Figs. 8(a) and 8(b)] becausef the longer � used in the SLO (488 nm instead of 470m, less MP absorption) and because the SLO has a lowerynamic range (8 instead of 12 bits per pixel in our cam-ra). Other studies27,30,44 using SLO devices have notentioned its presence in 488 nm AF images, although
mages presented by Trieschmann et al.30 may reveal aing, or at least a shoulder, at the fovea.
Monochromatic reflectance images recorded with fun-us cameras45 do not readily reveal a ring pattern, likelyecause of the nonlinear characteristics of film and inter-erence by the foveal reflex. However, reexamination ofuch 30 year old images revealed a weak ring pattern inhree of 20 subjects [one is illustrated in Fig. 8(d)]. 2-� re-ectometry measurement of the MP distribution by Chent al.20 demonstrated Gaussian-like distributions in aopulation of Taiwanese subjects �W/M=21/33�. The dis-ribution width increased with age, as was observed inhis study, but the uneven gender distribution of theopulation did not allow for an evaluation of a genderependence.46 Secondary maxima and shoulders were ob-erved near the base of the profile (at 2°–4° as opposed to.7° in this study). In a small group of normal subjectsW/M=5/6�, Elsner et al.19 demonstrated, by SLO 2-� re-ectometry, alterations in the MP distribution that in-luded the absence of the central peak and a ringlike MPistribution. Women were more likely to exhibit this al-eration than men ��2=5.2,p=0.03�. A similar distribu-ion was demonstrated ex vivo using Raman imaging.47
Finally, Berendschot and van Norren48 recently demon-trated “ring” patterns on MP distributions in normalubjects using both 2-� reflectometry and 2-� AF SLOmaging (Table 4). The mean eccentricity of the pattern
aximum was �0.7°, similar to the �0.8° that we foundn this study (Table 2). However, they found no gender re-
Table 2. Characteris
arameter Unit Mean±S.D
eak/density DMP�0� D.U. 0.29±0.07alf-width HW�3/8� deg 1.54±0.33ccentricity of ring� max. deg 0.73±0.13ccentricity of ring� min. deg 0.48±0.09
MP at maximum/DMP�0� — 0.81±0.14
MP at minimum/DMP�0� — 0.75±0.13ax./min. ratioe — 1.09±0.09
an=25 subjects who exhibited more than eight maximum–minimum pairs on thebMedian value, for 24 subjects, of the absolute difference of the test and retest mcSignificant positive correlation with age �p0.04�.dSignificant positive correlation with HW�3/8� �p0.02�.eRatio of MP density at the ring maximum to that at its minimum.
ationship with profile width and prominence of the pat-ern. The detection of the same pattern by both AF imag-ng and reflectometry minimizes the possibility that theattern is an artifact caused by spurious effects in the eyer in the imaging system.
The two above mentioned studies19,48 using an SLOoth reported an MP distribution in which the centraleak had lower density than the density of the ring maxi-um. In our study, only one subject (out of 41) exhibited
n averaged profile where this was the case (by 8%, 67ear old woman, Fig. 4). Whether these differences resultrom instrumental differences or other factors must stille clarified.The ring pattern observed in AF images can also be
een occasionally on fluorescein angiograms of patientsFigs. 8(e) and 8(f)]. The fluorescence of fluorescein in thehoriocapillaries plays the same role as the fluorescencef RPE lipofuscin. Since the fluorescence of fluorescein isbout ten times more intense than that of lipofuscin, thisbservation helps rule out the possibility that the ringattern in AF images is caused by spurious reflection ofens fluorescence or by a minor fluorophore located ante-ior to the MP. Indeed, if such a spurious (additive) effectaused the pattern in AF images, it would be negligiblymall in the much brighter angiogram and the patternould not be seen.
. Entoptic Effect and Psychophysicshe significant agreement between the pattern of Max-ell’s spot reported by our subjects and the pattern exhib-
ted in their MP density maps also lends support to thexistence of a bimodal distribution of the MP. Fifty yearsgo, Miles40 performed a comprehensive study of Max-ell’s spot in which young male subjects (n=20, 20–32ears) were asked to draw the perceived pattern whenooking at a uniform blue–red screen. Some, but not all,ubjects reported a darker ring (outside radius 1.2°) con-entric to the central peak, and some subjects also re-orted a “shell-burst” appearance of the pattern as wasbserved by some subjects in our study (spokes).
Measurements of the MP profiles by heterochromaticicker photometry (HFP Table 4) are difficult and time-onsuming because each point must be evaluated sepa-ately against a reference location. Eye movements and
f the Ring Pattern
Range Test–Retestb Median and (Range)
0.15–0.420.96–2.260.56–1.06 4.0% (0%–17%)0.34–0.67 5.7% (1%–22%)0.46–1.08 3.6% (0%–17%)0.43–0.94 2.5% (0%–25%)1.02–1.36 1.0% (0%–11%)
ution.
ents expressed as a percentage of their mean.
tics o
.a
c
c,d
c,d
d
c,d
ir distrib
easurem
spNtTmiabrmfiaWocldmetCodclb
CSv2caafmr
erd
prlibc
wswGm�t=r=qfia
ttFas==pctmndcio00t
cht(t=opiplt
a
Fb
Delori et al. Vol. 23, No. 3 /March 2006/J. Opt. Soc. Am. A 529
mall fixation artifacts require the measurements of arofile along a single meridian to be repeated many times.evertheless, Hammond et al.14 measured MP distribu-
ions along the four principal meridians in 32 subjects.hey found that the MP distribution was circularly sym-etric (our results show a significant horizontal elliptic-
ty). They did not report on age or gender dependence,nd examination of their data (with ages communicatedy Hammond51) revealed no significant age or gender cor-elations for the densities or the widths. However, Ham-ond found a systematic deviation from the exponential
ts in about 40% of the subjects at about 1° eccentricity,nd similar observations were recently reported byooten and Hammond.52 They suspected that subpeaks
r shoulders were located on the profile slope; we foundlearly defined secondary maxima and minima at slightlyower eccentricities in over half of our subjects. Note thatetection of a ring pattern on the DMP profile using HFPay be extremely difficult: It would require sampling ar-
as 10 arc min in diameter spaced at 0.125°, since the dis-ance between the maximum and the minimum is �0.25°.onsidering that HFP mapping of the MP by experiencedbservers14,52 could not detect the ellipticity of the MPistribution in an area where all cells are slightly ellipti-ally distributed (rods, cones, and ganglion cells),53,54 it isikely that retinal stabilization techniques would have toe used to perform these measurements psychophysically.
. Snodderly Hypothesisnodderly et al.1 measured the DMP distribution in indi-idual retinal layers of five primates (different species) by-� densitometry. While some animals exhibited a singleentral peak with quasimonotonic decline, others showeddistinct “trimodal” distribution with secondary maxima
t 200–300 �m from the fovea. The central peak resultedrom MP located in the receptor axons, and the secondaryaximum from MP located in the processes of interneu-
ons in the inner-plexiform layer. Snodderly et al. hypoth-
ig. 7. Index Nr as a function of distribution width HW�3/8� foroth women (W, circles) and men (M, bowties).
sized that profile variability in different species was theesult of differences in the size/shape of the fovealepression.1
To explore this hypothesis, we fitted to the averagedrofiles a simple model in which a ring distribution, rep-esenting the contribution of MP in the inner-plexiformayer, is added to a central distribution, representing MPn the cone axons. This model is similar to that proposedy Berendschot and van Norren.48 The DMP��� at an ec-entricity � is given by
MPD��� = Di + Dc � 10−p��/HWc�n+ Dr � 10−p��� − �m�/HWr�2
,
�3�
ith p=−log�0.5�=0.301. This distribution (Fig. 9) is theum of a central distribution C (peak density Dc, half-idth HWc, offset Di) and an eccentric and asymmetricaussian distribution R (peak density Dr, eccentricity ofaximum, �m; half-width for ��m, HWr; half-width for
�m, m�HWr). The exponent n changes the central dis-ribution from an exponential �n=1� to a Gaussian �n2� curve. Exploratory fits, including all eight free pa-ameters, gave mean values of n=1.2±0.2 and m2.1±0.6, and these parameters were fixed in all subse-uent fits to 1.2 and 2.0, respectively. We performed thets on all 78 averaged profiles (test and retest) and aver-ged the results of the fitted parameters.The density Dc and half-width HWc of the central dis-
ribution are, as expected, highly correlated with, respec-ively, DMP�0� and HW�3/8� (both r�0.86, p0.0001).or the eccentric distribution, the maximal MP density Drt �=�m was not affected by age �r=−0.07,p=0.7� but wasignificantly higher in women than in men (Dr0.060±0.029 and 0.038±0.27 D.U., respectively; t2.5, p=0.02). This represented �20% and �12% of theeak density Dc, respectively. The half-width HWr and ec-entricity �m were not defined in seven subjects becausehe density Dr was 0 or less than 0.01 D.U. For the re-aining 33 subjects �W/M=17/16�, the width HWr was
ot significantly affected by age �r=0.23, p=0.18� or gen-er �t=0.8, p=0.4�. However, the eccentricity �m in-reased with age �p=0.0003� and was significantly largern women than in men �p=0.0003� but not affected by thether factors. The mean �m in women and men was.87° ±0.17° and 0.71° ±0.11°, respectively (all.80° ±0.17°). There was no significant correlation be-ween Dr and �m �r=0.2, p=0.3�.
Thus women have a more prominent ring pattern be-ause both the density of the eccentric distribution isigher and because it is more eccentrically located, par-icularly in older subjects. The mean eccentricity �m0.80°) was significantly greater than the eccentricity ofhe maximum of the ring pattern (0.73°, paired, t9.5, p0.0001), as should be expected from the additionf the annular contribution to the steeply sloped centralrofile. Both Dr and �m correlate significantly with Nr, thendex that we used to characterize the prominence of theattern (both ��0.5, p0.003). This, together with thearger spread of the MP distributions in women, suggestshat the foveal depression may be larger in women.
The terminal capillary network seen at the edge of thevascular zone in fluorescein angiography is located in

ttaneaatfitafWepp
DImetawethatgdtwlt
bi(itftfaw=b
fst
wsttwstmwddntprtlwp
EPWtst=fiRfTwooca
cc1em�Tg
tGciTa
T
DDDD
530 J. Opt. Soc. Am. A/Vol. 23, No. 3 /March 2006 Delori et al.
he inner nuclear layers of the retina55 slightly less eccen-ric than the edge of the inner-plexiform layer. Mean di-meters of the avascular zone measured in angiograms inormal subjects are 500–750 �m,56–59 and these diam-ters were found to increase with age in some,56,58 but notll,57 studies. Gender differences were not analyzed inny of these studies. These diameters are slightly largerhan the diameter of 465±100 �m found above by modeltting (�m, using 290 �m/deg for conversion for an emme-ropic eye). It may be that the avascular zone diametersre overestimated, since a lack of excellent image qualityor the angiogram inevitably yields larger diameters.60
hile our data are far from proving Snodderly’s hypoth-sis, they are consistent with the concept that the ringattern is a consequence of MP accumulation in the inner-lexiform layer.
. Extent and Shape of the Foveas the shape/size of the fovea different in women anden? Several independent studies using optical coher-
nce tomography (OCT) have shown that the thickness ofhe normal retina, averaged in a 1 mm diameter centralrea, was significantly smaller in women than in men,hereas no significant differences were found for periph-ral locations.61–64 This can be interpreted as indicating ahinner fovea in women, although it is difficult to conceiveow this could be the case since only cone photoreceptorsre present. Since the measurement area covered �1/2 ofhe foveal depression (diameter 2.1–2.3 mm),54,65 we sug-est that these findings may be explained by a more openepression in women than in men (assuming that the cen-ral thickness is the same): Indeed, the average thicknessould be smaller if the depression were more open and
arger. Further OCT studies may clarify our interpreta-ion.
The shape of the foveal depression can also be assessedy measuring the size of the foveal reflex in reflectancemages. Indeed, this reflex is the image of the light sourcein the plane of the subject’s pupil) formed by the concavenner limiting membrane (ILM) surface; its size is propor-ional to the radius of curvature of the concave mirrorormed by the ILM surface. Gorrand and Delori66 usedhis principle to measure the radius of curvature of theovea and reported a smaller radius of curvature at oldge but no gender effect. However, when the same dataere reanalyzed accounting for ages�50 years �W/M7/5�, we found a tendency for the radius of curvatures toe larger in women than in men �t=2.3, p=0.05�.To confirm this finding, we measured the size of the
oveal reflex on the 545 nm reflectance images of 20 studyubjects with age�50 years (Fig. 10). This reflex, which ishe image of the ring illumination of our fundus camera,
Table 3. Visualiza
ype of Maxwell’s Spot All Subjectsa
ark diffuse spot (D) 14ark spot with spokes/star (Ds) 4ark ring with no central dark spot (R) 3ark ring with central dark spot (Rc) 6
aNumber of subjects who reported a particular type of Maxwell’s spot.
as often elliptic in shape �H/V�1.09� and was not mea-urable in two women (not visible in one and multifocal inhe other). For the remaining 18 subjects �W/M=8/10�,he mean radius of the reflex was significantly larger inomen than in men (0.27° ±0.07° and 0.16° ±0.04°, re-
pectively; t=4.1, p=0.0008). The radius of curvature ofhe concave ILM surface is thus larger in women than inen (1185 and 744 �m, respectively), which is consistentith a flatter foveal floor and/or broader fovealepression.67 Whether this difference results from genderifferences in development or other biological factors isot known. It is interesting to note that women are threeimes more likely than men to develop a macular hole, aathologic condition in which the central neurosensoryetina is pulled away from the RPE.68,69 Vitreomacularraction has been implicated in the pathogenesis of macu-ar holes, and differences in the anatomy of the fovea inomen and men may contribute to the difference inrevalence.
. Distribution of the Autofluorescence from the Retinaligment Epitheliume analyzed our data to consider whether the ring pat-
ern is related to variation in the AF from the RPE. Ashown by Eq. (1), the 2-� method uses the differences ofhe logarithms of AF distributions obtained with �545 nm (profiles G in Fig. 11) and with �=470 nm (pro-les B). The former is the distribution of the AF from thePE, modulated somewhat by RPE melanin, but not af-
ected by MP since its absorption is negligible at 545 nm.he mean central value G�0° � was −0.11±0.05 D.U.,hich indicates that the AF at the fovea is 79.0% ±0.1%f that at 4°, similar to the 77% value found in our previ-us study of the AF distribution.29 G�0� showed no signifi-ant dependence age, gender, iris color, and degree ofmetropia.The distribution of the G profiles ��=545 nm� in the
entral 3° diameter was quite variable: We observed bothentral minima [Fig. 11(b)] and localized maxima [Fig.1(a)]. To characterize this variation, we used the differ-nce �G=G�0° �−G�1.0° �, which is negative for a centralinimum and positive for a maximum. The mean value ofG was −0.011±0.03 D.U. (range −0.07 to +0.05 D.U.).he difference �G did not show any dependence on age,ender, iris color, and degree of ametropia.
How is the distribution of DMP and the ring pattern de-ectable on some B profiles (Fig. 11) modified after the−B subtraction? Answering this question is essentially
omparing our 2-� AF method with the 1-� methods usedn some studies to estimate the MP distribution.30,31,44
he 1-� method uses one AF image (e.g., �=488 nm) andssumes that the distribution of the AF from the RPE is
f Maxwell’s Spot
Median Index Nr and (IQR) Womena Mena
13 (17) 4 1022 (19) 4 039 (12) 2 136 (20) 4 2
tion o

ut-0(cn(twm�ddn
Zdrd
FBIlcMsRtmalmitttswltttfpmeoep
GALbStsmftsatb5gaabfvt1gn
Fe=m(wst(ociaga
Delori et al. Vol. 23, No. 3 /March 2006/J. Opt. Soc. Am. A 531
niform (or that G=0). The main difference between thewo methods is the overestimation of the DMP’s by the 1� method; mean peak DMP was 0.41±0.09 and.31±0.07 D.U. for the 1-� and 2-� methods, respectivelymean error of 37% with range 4%–81%). To evaluatehanges in the shape of the distribution, we compared theormalized distributions obtained with each approachDMP and B� profiles in Fig. 11). As expected, we foundhat the ring was less prominent for the 1-� approachhen �G was small or negative [Figs. 11(b)–11(d)] andore prominent when �G was positive [Fig. 11(a)]. SinceG was not affected by gender, we did not expect the gen-er relation of the index Nr to change drastically: The in-ex (recalculated for the single blue images) was also sig-ificantly higher in women than in men (Mann–Whitney,
ig. 8. Fundus images of the ring pattern obtained with differ-nt image modalities. All SLO images were obtained with �488 nm [(a), (c), (e), and (f)]. The gamma of all images wasodified to reveal the details in the darkest part of the image.
a), (b) AF images of the left eye of a 29 year old woman obtainedith (a) an SLO and (b) the nonconfocal camera used in this
tudy. The pattern is more distinct on the camera image than onhe SLO image. (c) AF image of the right eye of a 70 year old manwith IOL implant) obtained with an SLO. (d) Reflectance imagebtained with 470 nm monochromatic photography (Carl Zeissamera) of the right eye of a 25 year old woman; the ring patterns seen as well as the smaller specular reflex (small circular im-ge at 9 o’clock). (e) AF image and (f) sodium fluorescein angio-ram of the left eye of a 75 year old female patient obtained withn SLO.
=3.3, p=0.0009). We conclude that accounting for theistribution of the AF from the RPE provides more accu-ate estimates of the DMP distribution but does not intro-uce any significant gender-related changes.
. Tissue Properties That Could Explain or Modify theimodal Distributionn the next subsections, we will investigate possible vio-ations of the main assumptions24 of the AF method to as-ertain to what degree they would affect the measuredP density �DMP� distributions. The first assumption
tates that the excitation spectrum of the lipofuscin in thePE must be similar at the fovea and at the perifovea; al-
hough the amount of lipofuscin may vary, its compositionust be the same to ensure that the excitation spectra at
ll sites are proportional with each other. Since the smallocalized maximum at the fovea in some AF distributions
ay represent a different fluorophore, we will attempt todentify its nature (Subsection 4.G). The second assump-ion states that all the light that is sampled by the detec-or (camera) must have been attenuated by MP absorp-ion (Beer’s law). This implies that there are no sources oftray AF or reflections originating anterior to the MP. Weill investigate whether reflection of AF from the crystal-
ine lens by the ILM could affect the DMP profile (Subsec-ion 4.H) and to what extent the stray AF associated withhe lens affects the shape of the MP distribution (Subsec-ion 4.I). Finally, no other pigments should introduce dif-erential spectral absorption between the fovea and theerifovea. Since the photoreceptor pigments and RPEelanin are distributed symmetrically, albeit with some
llipticity, around the fovea, we will examine their impactn the MP distribution (Subsection 4.J). Spectral absorb-rs distributed uniformly anterior (crystalline lens) orosterior to the MP do not affect the 2-� method.
. Spectral Properties of Retinal Pigment Epitheliumutofluorescenceipofuscin is composed of several fluorophores that haveeen observed in the RPE cells of aging donor eyes.70,71
ince little is known about changes in lipofuscin composi-ion at different retinal locations, we are not able topeculate on what role such changes would have on oureasurement. However, our observation of a localized
oveal maximum (�G�0, Subsection 4.E) in the distribu-ion of the AF from the RPE must be scrutinized. Ithould be noted that our technique, and that of Spaide,72
re the only AF imaging modalities that provide a view ofhe foveal AF distribution unobstructed by MP absorptionecause ��540 nm are used (SLO devices use 488 and14 nm). The areas of higher AF are often composed ofroups of small fluorescent lobules (less than 0.5° in di-meter), sometimes with an attenuated center [Figs. 1(a)nd 12]. They are located throughout the posterior pole,ut a dark background facilitates their detection in theoveal and perifoveal areas. The averaged profiles in pre-ious figures gave the somewhat misleading impressionhat these highlights are centered only on the fovea (Fig.2). The high variability of lipofuscin content in adjacentroups of RPE cells was also demonstrated ex vivo in do-or eyes by using fluorescence microscopy.73

gvhwiRcltwtn(cs
HLStatmTrpeir�nfatprAtil
ttl
IDlpls(sttpaostcwNagpbts
s
wuTA
F
RHWHKCD
W
B
T
fl
532 J. Opt. Soc. Am. A/Vol. 23, No. 3 /March 2006 Delori et al.
The individual vertical profiles of Fig. 12 show thatood symmetric DMP profiles are obtained despite a largeariation in the AF of the G profiles. We believe that theseighlights are local variations in lipofuscin concentrationithin the RPE cells, perhaps modulated by local changes
n RPE melanin. We cannot exclude that these representPE cells with different lipofuscin composition; if the ex-itation spectrum of these cells were to be shifted towardonger wavelengths, one would expect a local decrease ofhe DMP.24 The opposite would occur if the shift were to-ard shorter wavelengths. We found no consistent pat-
ern in the position of areas of high or low AF in the 545m image and localized variations of the DMP distribution
Fig. 12). We will use MP maps obtained with an SLO inonjunction with spectral measurements bypectrofluorometry74 to elucidate these issues.
. Lens Autofluorescence Reflected by the Internalimiting Membraneimilar to the foveal reflex in reflectance images (Subsec-ion 4.D), lens AF reflected by the ILM could also be im-ged in our camera as a circular pattern and this reflec-ion would cause the DMP profile to exhibit a spuriousinimum at about the same position as that of the reflex.his could affect subjects of all ages because the age-elated decrease of the ILM reflectance66 would be com-ensated by the increase in lens AF with age.75,76 How-ver, the minimum that we observed on the DMP profiless located at �0.5° from the fovea (Table 2), whereas theeflex occurs at the significantly smaller eccentricity of0.2° (paired, t=7.4, p0.0001) and several subjects didot exhibit the ring pattern despite the observation of aoveal reflex. The fundus photograph shown in Fig. 8(d)lso illustrates the relative size of the ring pattern andhe foveal reflex. In one subject, with a very prominentattern [Fig. 2(h)], we masked half of the illuminationing in the camera but observed a full ring in the 470 nmF image (data not shown). Furthermore, the ring pat-
ern was observed in pseudophakic subjects by using SLOmaging [Fig. 8(c)] and with our camera [Fig. 2(l)]. Theower index N found in those subjects may result from
Table 4. Macular Pig
irst Author n (Age Range) Methods,a Reference
obson44 18 (—) MMP, 7°ammond14 32 (21–63) HFP, 6°ooten52 5 (22–38) HFP, 4°ammond49 217 (16–92) HFP, 4°ilbride18 7 (22–39) REI, 4°hen20 54 (22–83) REI, 12°elori24 134 (20–70) AFS, 7°
RES, 7°ustemeyer27 109 (16–76) AFI, 5°
REI, 5°erendschot48,50 53 (19–75) AFI, 8°
REI, 8°his study 39 (24–69) AFI, 4°
AFI, 4°
aMMP, minimum motion photometry; HFP, heterochromatic flicker photometry; Auorometry. All methods involve the use of two or more wavelengths.
r
he decrease in stray light (SL). Thus lens AF reflected byhe ILM is not the origin of the ring pattern and is notikely to play an important role.
. Stray LightMP’s obtained in this study are within—although at the
ow end—of the range of DMP’s measured with psycho-hysical methods and physical techniques (Table 4). Aarge difference exists between DMP’s obtained in thistudy and those in our previous study using fluorometrythe latter incorporated a correction for SL).74 SL in ourystem is responsible for the larger DMP’s obtained withhe 470–545 nm combinations compared with those withhe 510–545 nm combinations (Subsection 3.D, Fig. 4). Inrevious reports,25,32 we corrected for SL, but subsequentnalyses proved that our approach had not beenptimal.77 No correction for SL was used in this study, re-ulting in lower DMP’s here than in those reports. We es-ablished that the SL affecting our measurements de-reased with increasing excitation wavelength ��� andas significantly smaller in the four subjects with IOLs.77
ontryptophan AF of the crystalline lens increases withge and decreases with increasing �,75,76,78 which sug-ests that lens AF scattered in the optical system is therincipal source of SL in our camera. Since lens AF maye gender dependent,76,79,80 it is important to estimatehe magnitude of the SL and analyze its impact on thehape of the MP distribution.
If DMP,i is the density in absence of SL, then the mea-ured density DMP,m is given by
DMP,m = DMP,i −1
K470�log
+ �470 � 10K470DMP,i
1 + �470
− log + �545
1 + �545� , �4�
here ��=S� /FR,�, with S� being the uniformly distrib-ted SL and FR,� the AF at the reference location at �.he factor =F545/FR,545 is the relative distribution of theF from the RPE at 545 nm (F and F are the AF at
Studies Comparison
DMP (460 nm) DMP in 1° or 2° Diameter Field FWHM
.43±0.16 — 3.0° ±1.0°
.58±0.26 0.35±0.24 �1° � 2.1° ±0.8°
.77±0.16 — 1.4° ±0.3°— 0.22±0.11 �1° � —
.33±0.07 — 2.5° ±0.4°
.23±0.06 — 3.8° ±1.0°— 0.42±0.15 �2° � —
0.23±0.07 �2° �— 0.21±0.07 �2° � —
0.16±0.06 �2° �— 0.32±0.10 �1° � 2.7° ±0.2°— 0.32±0.11 �1° � —
.30±0.06 0.25±0.07 �1° � 2.3° ±0.7°0.22±0.06 �2° �
maging; REI, reflectance imaging; RES, reflectance spectrometry; AFS, fluorescence
ment
Peak
000
00
0
FI, AF i
545 R,545

atGbctgtt
hntwlsFDvvb(0
�cd0�ti�wtptepsw
DtttactsSoocis
F�soreRfwtEwf
FswmTm
Delori et al. Vol. 23, No. 3 /March 2006/J. Opt. Soc. Am. A 533
ny point in the field and at the reference location, respec-ively). The quantity G (Subsection 4.E) is related to by= �K470−K545�−1log� �. The second term in the square
rackets is always small compared with the first one. Theenter of the DMP distribution will be more affected by SLhan its edge, because DMP,i is higher and because isenerally lower at the fovea29: The consequence is a flat-ening of the peak of the profile and a possible exaggera-ion of the ring pattern in the MP profiles.
We estimated the amount of SL for the 21 subjects thatad DMP profiles with both the 470–545 nm and 510–545m combinations (Subsection 3.D, Fig. 4), assuming thathe differences in DMP were due solely to SL associatedith the lens. From measured excitation spectra of the
ens AF, we used that S510/S470�0.53,78 and from mea-ured excitation spectra of fundus AF we estimated thatR,510/FR,470�1.31.28,74 The factors S470/FR,470 andMP,i�0� were then obtained by iterative computation in-olving two Eqs. (4) for �=510 and 470 nm. Using indi-idual measurements of F545/FR,545 and of DMP,m�0� foroth combinations, we found that S470/FR,470=0.16±0.09range 0.01–0.32) and DMP,i�0�=0.40±0.09 D.U. (range.24–0.53 D.U.). The ratio S /F increased with
ig. 9. Curve fits �F� of the sum of a central �C� and an eccentricR� distribution [see Eq. (3)] to the averaged profile (solidquares) for three subjects (gender/age indicated). The MP mapsf subjects M34 and F67 (IOL) are also seen in Figs. 2(a) and 2(l),espectively. The data on the right of each panel are the results ofach fit (see the text): MP densities are measured at 460 nm, andMSE is the root mean square error of the fit. The fits had six
ree parameters and 40 data points (every 0.1°). Constraintsere as follows; all parameters, except Di, positive; eccentric dis-
ribution at �=0 less than �peak density� /100; and Di−0.2. Thexcell solver (Microsoft) was used to minimize the errors, whichere weighted by 1 for ��2°, by 0.75 for 2° ��3°, and by 0.5
or ��3°.
470 R,470
Age�3 �p0.0001�, but no significant effect of gender, irisolor, and degree of ametropia was detected. The pre-icted density DMP,i�0� was 0.40±0.09 D.U. (range 0.24–.53 D.U.) compared with a measured DMP,m�0� of0.29 D.U. (Subsection 3.D). Two other effects involving
he choice of the reference eccentricity and the effect ofmage smoothing also contributed to a reduction of0.05 D.U. of our DMP’s.81 Accounting for all effects, weould expect the peak DMP to increase from �0.29 D.U.
o �0.45 D.U., which is about what we found for a 2° sam-ling field (Table 4). We conclude that to fully account forhe low densities found in this study, other factors (differ-nt populations, possible overestimation of the SL in ourrevious study) may be involved. However, we found noignificant differences in the amount of SL betweenomen and men in our population.Does SL substantially affect the shape of the measured
MP distributions? To answer this question, we correctedhe 470 and 545 nm images for SL by using the above es-imates of S470/FR,470 and recalculated the DMP distribu-ion and the index Nr by image analysis �n=21�. We found
modest decrease in ring prominence for the SL-orrected distributions, but only for subjects with Nr inhe mid and low range [with a substantial number ofhoulders and shallow maxima; Fig. 11(c), curves S and�]. For subjects with a pronounced ring pattern, we sawnly small changes [Fig. 11(b)] because our index detectsnly the presence of a maximum but is not sensitive tohanges of its prominence. For Nr24 �n=12�, the meanncrease in Nr caused by SL was 2.5±2.5 (range −1 to +7),ignificantly different from 0 (one-sample sign test, p
ig. 10. Radius of the foveal reflex as a function of age mea-ured in 545 nm reflectance images (solid circles representomen, and bowties represent men). The insets are 545-nmonochromatic images for the two extremes indicated by arrows.he foveal reflex in women was significantly larger than that inen.

=t=
onapdtp
JEPttst
wcrtKos
=
tdhmtdstlw−fwMrtec
Ksrcrta−bDt
ak
F(i�Mapwsnb edges
534 J. Opt. Soc. Am. A/Vol. 23, No. 3 /March 2006 Delori et al.
0.006). No significant change in Nr was found when Nr24 �n=9�. Overall, SL correction did not affect the rela-
ionship between Nr and gender (Mann–Whitney, Z3.1, p=0.001).We conclude that although SL has an important effect
n the MP densities, it only slightly increases the promi-ence of the ring pattern as characterized by our index Nrnd does not substantially alter the differences in the ringattern between women and men. The above analysis alsoemonstrated a weakness in our index Nr in its inabilityo differentiate changes for ring patterns that are veryronounced.
. Other Absorbers: Photopigment and Retinal Pigmentpithelium Melaninhysical methods using the 2-� approach are insensitiveo other sources of absorption if they are spectrally neu-ral or if they are evenly distributed over the entire mea-urement field (lens absorption). If this is not the case,hen we can predict the effect of such absorbers by
DMP,m = DMP,i + DOP� KOP,470 − KOP,545
KMP,470 − KMP,545� , �5�
here DMP,m and DMP,i are the measured and ideal opti-al density differences between a point in the field and theeference location, DOP is the optical density difference ofhe other pigment at a reference wavelength �p, and470,OP and K545,OP, are the extinction coefficients of thether pigment at 470 and 545 nm (normalized at �p), re-pectively.
For cone photopigment, extinction coefficients KOP,4700.31 and K =1.00 �� =545 nm� give �0.82 for the
ig. 11. DMP averaged profiles (thick curves) for four subjects. Th1): log�F� /FR,�� / �K470−K545� for the excitations �=545 nm (G, gren upper left panel). The G and B profiles are the log distribution=545 nm �G� is generally lower in the center than at the edge oP absorption. �G is the difference G�0° �−G�1° �, used to charac
nd (b) had the extreme values for �G (0.047 and −0.074, respeceak DMP�0� to allow comparison of shapes with DMP; it represenith �=470 nm (assuming that G=0). The ring pattern of the D
ome [(b)–(d)] but not all distributions. The profiles S in (b) andormalized to the peak DMP�0�. These S� profiles illustrate thatecause it attenuates the peak of the distribution more than the
OP,545 p
erm in square brackets, assuming that L /M=2.82,83 Theensity difference DOP for dark adapted cones can be asigh as +0.7 D.U. at �p=545 nm.84 Unbleached cone pig-ent has the potential to cause a ring pattern but only if
he photopigment distribution is narrower than the MPistribution; this does not appear to be the case in mea-urements reported by Elsner et al.19 Furthermore, we es-imated that, in our protocol, cones were bleached to ateast 95% (Subsection 2.B) before the first 545 nm imageas acquired. The error in peak DMP would then be0.03 D.U. at 460 nm, too small to have a significant ef-
ect on the MP distribution. In the experiment in whiche recorded four successive MP maps (Fig. 4, subject60), we saw no evidence of incomplete bleaching but
ather an opposite change. DMP decreased, suggesting ei-her bleaching of the MP, although no evidence of such anffect was found in a previous study,85 or other opticalhanges yet to be fully explained.
For rhodopsin, extinction coefficients KOP,470=0.78 andOP,545=0.51 ��p=500 nm� give +0.33 for the term in
quare brackets in Eq. (5). The density for dark adaptedods at �p=500 nm can be as high as 0.06 D.U. at 4° ec-entricity (therefore DOP=−0.06 D.U., since there are noods in the fovea). Our bleaching conditions were suchhat rods were bleached to at least 75% (Subsection 2.B),nd the error in peak DMP would then be less than0.01 D.U. at 460 nm. Thus the bleaching conditions ofoth cones and rods give rise to underestimations of theMP but should not substantially affect the DMP distribu-
ion.The density of RPE melanin is maximal in the fovea
nd decreases gradually in the perifoveal area.86 Little isnown about the detailed spatial distribution of RPE
curves below the zero lines in each panel are the two terms of Eq.d �=470 nm (B, blue). DMP is the difference G−B (vertical arrowfor the 2-� method (AF increases, less negative). Thus the AF atistribution, and this effect is enhanced at �=470 nm because ofcentral changes of the G distribution: Subjects data shown in (a). Profile B� is identical to B, but inverted and normalized to the
P distribution that would be obtained by using the 1-� methodfile appears to be more prominent than that of the B� profile forSL-corrected profiles, and profile S� is the same as S but again
uses only small increases in the prominence of the ring pattern[(c)].
e twoen) anof AFf the dterizetively)ts the MMP pro(c) areSL ca

mmttcwars=eiDscatwsakva
5Tltwtvwwsawmdh
btsamrtpvtbebh
csrpft
F=pj[iss+br(css�dwptD(dimiAF.
Delori et al. Vol. 23, No. 3 /March 2006/J. Opt. Soc. Am. A 535
elanin and its variability among individuals. Further-ore, RPE melanin and lipofuscin are not uniformly dis-
ributed in the RPE cell; melanin has a higher concentra-ion on the apical side, and lipofuscin has a higheroncentration on the basal side.87 In a previous study,24
e estimated the amount of the apical RPE melanin thatttenuates the excitation of lipofuscin; we found, using aeference at 7° temporal to the fovea, that the optical den-ity at the fovea averaged DOP=0.15 D.U. (at �p500 nm). Using KOP,470=1.23 and KOP,545=0.74 for thextinction coefficients of melanin,88 we find that the termn the square brackets in Eq. (5) is +0.58 and that the
MP is overestimated by 0.08 D.U. (somewhat smaller,ince our reference is only at 4°). This is not an insignifi-ant error in DMP. However, since the density of melaninnd the MP are additive, it is not possible that a ring pat-ern would be created by RPE melanin whatever theidth of its distribution may be. Whether the changes ob-
erved at the fovea in 545 nm AF images (�G0, Figs. 11nd 12) are related only to the melanin distribution is notnown. IR fluorescence imaging in the macula may pro-ide a means to visualize the RPE melanin distribution89
nd help to clarify this issue.
. CONCLUSIONShe spatial distribution of the optical density of the macu-
ar pigment (MP) is more complex than previouslyhought. In over 50% of the subjects, a bimodal patternas observed, consisting of a central exponentiallike dis-
ribution surrounded by a ring of higher density. Indi-idual MP density distributions measured by the two-avelength autofluorescence method also correspondedith the pattern of Maxwell’s spot reported by the same
ubjects. The distribution of the MP broadened with age,nd this effect was more pronounced in women. Womenere also more likely to exhibit the ring pattern thanen. The central distribution decreased to half the peak
ensity at a mean eccentricity of 1.2°; the ring, if present,ad maximal density at a mean eccentricity of 0.7.Evidence that the shape of the foveal depression may
e different in women and men leads us to propose thathere may be gender-related differences in the shape andize of the foveal depression. Observation by Snodderly etl.1 of monomodal and bimodal distributions of the MP inonkeys led him to hypothesize that this variability was
elated to variations of the size of the fovea and that con-ributions of MP in the cone axons and in the inner-lexiform layer of the retina could combine to produceariations in the overall MP distribution. Our modeling ofhe different MP contributions suggested that the contri-ution from the inner-plexiform layer is higher and moreccentrically located in women than in men. Verificationy high-resolution OCT may allow further testing of thisypothesis.We analyzed the impact of several spurious effects that
ould have affected MP distribution measurement. Whiletray fluorescent light from the crystalline lens causes aeduction in MP densities and some exaggeration of therominence of the ring pattern, it cannot by itself accountor the bimodal distribution. Fluorescent light reflected byhe inner limiting membrane of the retina and un-
ig. 12. AF images obtained with the excitation wavelength �545 nm in three subjects illustrating extreme cases of the AFrofile in the fovea (field: 8° �8° centered on the fovea). (a) Sub-ect with strongest local foveal maximum in the averaged profiles�G=0.047, same subject as that in Fig. 11(a)] and a bright focusn the fovea, which was not observed in any other subjects; (b)ubject with second strongest foveal maximum ��G=0.044�; (c)ubject with second most pronounced foveal minimum [�G=0.072, same subject as that in Fig. 2(h)]. Circular lobules andright foci are seen throughout the images. The curves on theight are vertical profiles through the fovea: DMP distributionthick curves, right) and AF profiles for �=545 nm (G, solidurves) and �=470 nm (B, interrupted curves). We used theame format as that in Fig. 11. The profiles were obtained on un-moothed images with a scan width of 5 pixels. The DMP profilesG−B� are very symmetric around the center of the distributionespite strong asymmetries and variability of the G profile; itas, in some instance, affected by local changes in the 545 nmrofile. However, no consistent pattern emerged from comparinghese profiles: A central ringlike pattern seen at the center of the
MP profile in (a) may have corresponded to the area of high AFtwo arrows), but a similar pattern in (c) corresponded with aark area (two arrows). The high-AF areas in (c) (contrasted byts dark center) are located at higher eccentricities than the ring
aximum. No large asymmetry was detected on the DMP profilen (b), despite the marked asymmetric position of an area of high

bptcmsifsbcwFlrstpd
tlRw
AWfRnvHE
eMp
R
1
1
1
1
1
1
1
1
1
1
2
2
2
2
2
2
536 J. Opt. Soc. Am. A/Vol. 23, No. 3 /March 2006 Delori et al.
leached rod photopigment are not likely to play an im-ortant role. Cone photopigment could be responsible forhe ring pattern, but our bleaching conditions were suffi-ient to eliminate this possibility. RPE melanin canodify the measured distribution but cannot be respon-
ible for the bimodal distribution. Substantial differencesn the composition of lipofuscin in the fovea could inter-ere with the methods assumptions, and we have foundome indications that it may affect the profile. This wille further investigated by spectrofluorometry and confo-al imaging, where the interactions from stray lightould not limit our ability to perform a detailed analysis.inally, none of these spurious effects (except the one re-
ated to the limiting membrane) was found to have genderelationships in our study population. It should betressed that other imaging modalities also demonstratehe bimodal distribution of the MP (fluorescein angiogra-hy, confocal scanning laser reflectance imaging), but aetailed comparison of MP distributions is warranted.Thus, while the source of variation in MP density dis-
ributions is not clear, the effect itself is reliable and un-ikely to be secondary to other effects such as lens andPE changes. This leaves changes in foveal structureith gender as the most likely causative mechanism.
CKNOWLEDGMENTSe thank Tos Berendschot and Dirk van Norren for many
ruitful discussions and for their patience. Additionally,ussell Woods, Steve Burns, and Kathy Dorey providedumerous insights for different parts of the study. This in-estigation was supported by National Institutes ofealth grant EY08511 and by the Massachusetts Lionsye Research Fund (François Delori and Douglas Goger).Address correspondence to François C. Delori, Schep-
ns Eye Research Institute, 20 Staniford Street, Boston,assachusetts. 02114; e-mail, [email protected];
hone, 617-912-2502.
EFERENCES AND NOTES1. D. M. Snodderly, J. D. Auran, and F. C. Delori, “The
macular pigment. II. Spatial distribution in primateretinas,” Invest. Ophthalmol. Visual Sci. 25, 674–684(1984).
2. G. J. Handelman, E. A. Dratz, C. C. Reay, and F. J. G. M.van Kuijk, “Carotenoids in the human macula and wholeretina,” Invest. Ophthalmol. Visual Sci. 29, 850–855 (1988).
3. D. M. Snodderly, “Evidence for protection against age-related macular degeneration by carotenoids andantioxident vitamins,” Am. J. Clin. Nutr. 62, 1448S–1461S(1995).
4. S. Beatty, M. Boulton, D. Henson, H. H. Koh, and I. J.Murray, “Macular pigment and age related maculardegeneration,” Br. J. Ophthamol. 83, 867–877 (1999).
5. J. T. Landrum and R. A. Bone, “Lutein, zeaxanthin, and themacular pigment,” Arch. Biochem. Biophys. 385, 28–40(2001).
6. L. R. Thomson, Y. Toyoda, A. Langner, F. C. Delori, K. M.Garnett, N. Craft, C. R. Nichols, K. M. Cheng, and C. K.Dorey, “Elevated retinal zeaxanthin and prevention oflight-induced photoreceptor cell death in quail,” Invest.Ophthalmol. Visual Sci. 43, 3538–3549 (2002).
7. L. R. Thomson, Y. Toyoda, F. C. Delori, K. M. Garnett, Z. Y.Wong, C. R. Nichols, K. M. Cheng, N. E. Craft, and C. K.Dorey, “Long term dietary supplementation with
zeaxanthin reduces photoreceptor death in light-damagedJapanese quail,” Exp. Eye Res. 75, 529–542 (2002).
8. H. Leibowitz, D. E. Krueger, L. R. Maunder, R. C. Milton,M. M. Kini, H. A. Kahn, R. J. Nickerson, J. Pool, T. Colton,J. P. Ganley, J. I. Loewenstein, and T. R. Dawber, “TheFramingham eye study monograph. An ophthalmologicaland epidemiological study of cataract, glaucoma, diabeticretinopathy, macular degeneration, and visual acuity in ageneral population of 2631 adults, 1973–1975,” Surv.Ophthalmol. 24, 335–610 (1980).
9. J. M. Seddon, U. A. Ajani, R. D. Sperduto, R. Hiller, N.Blair, T. C. Burton, M. D. Farber, E. S. Gragoudas, J.Haller, D. T. Miller, L. A. Yannuzzi, and W. Willett,“Dietary carotenoids, vitamins A, C, and E and advancedage-related macular degeneration,” J. Am. Med. Assoc. 272,1413–1420 (1994).
0. J. M. Seddon and C. H. Hennekens, “Vitamins, minerals,and macular degeneration,” Arch. Ophthalmol. (Chicago)112, 176–179 (1994).
1. C. R. Gale, N. F. Hall, D. I. Phillips, and C. N. Martyn,“Lutein and zeaxanthin status and risk of age-relatedmacular degeneration,” Invest. Ophthalmol. Visual Sci. 44,2461–2465 (2003).
2. B. R. Hammond, Jr., E. J. Johnson, R. M. Russell, N. I.Krinsky, K. J. Yeum, R. B. Edwards, and D. M. Snodderly,“Dietary modification of human macular pigment density,”Invest. Ophthalmol. Visual Sci. 38, 1795–1801 (1997).
3. J. T. Landrum, R. A. Bone, H. Joa, M. D. Kilburn, L. L.Moore, and K. E. Sprague, “One year study of the macularpigment: the effect of 140 days of a lutein supplement,”Exp. Eye Res. 65, 57–62 (1997).
4. B. R. Hammond, Jr., B. R. Wooten, and D. M. Snodderly,“Individual variations in the spatial profile of humanmacular pigment,” J. Opt. Soc. Am. A 14, 1187–1196 (1997).
5. B. R. Wooten, B. R. Hammond, Jr., R. I. Land, and D. M.Snodderly, “A practical method for measuring macularpigment optical density,” Invest. Ophthalmol. Visual Sci.40, 2481–2489 (1999).
6. D. M. Snodderly, J. A. Mares, B. R. Wooten, L. Oxton, M.Gruber, and T. Ficek, “Macular pigment measurement byheterochromatic flicker photometry in older subjects: thecarotenoids and age-related eye disease study,” Invest.Ophthalmol. Visual Sci. 45, 531–538 (2004).
7. J. D. Moreland, “Macular pigment assessment by motionphotometry,” Arch. Biochem. Biophys. 430, 143–148 (2004).
8. P. E. Kilbride, K. R. Alexander, M. Fishman, and G. A.Fishman, “Human macular pigment assessed by imagingfundus reflectometry,” Vision Res. 29, 663–674 (1989).
9. A. E. Elsner, S. A. Burns, E. Beausencourt, and J. J.Weiter, “Foveal cone photopigment distribution: smallalterations associated with macular pigment distribution,”Invest. Ophthalmol. Visual Sci. 39, 2394–2404 (1998).
0. S. F. Chen, Y. Chang, and J. C. Wu, “The spatialdistribution of macular pigment in humans,” Curr. EyeRes. 23, 422–434 (2001).
1. T. T. Berendschot, J. J. Willemse-Assink, M. Bastiaanse, P.T. De Jong, and D. van Norren, “Macular pigment andmelanin in age-related maculopathy in a generalpopulation,” Invest. Ophthalmol. Visual Sci. 43, 1928–1932(2002).
2. W. Gellermann, I. V. Ermakov, M. R. Ermakova, R. W.McClane, D. Y. Zhao, and P. S. Bernstein, “In vivo resonantRaman measurement of macular carotenoid pigments inthe young and the aging human retina,” J. Opt. Soc. Am. A19, 1172–1186 (2002).
3. W. Gellermann and P. S. Bernstein, “Noninvasive detectionof macular pigments in the human eye,” J. Biomed. Opt. 9,75–85 (2004).
4. F. C. Delori, D. G. Goger, B. R. Hammond, D. M. Snodderly,and S. A. Burns, “Macular pigment density measured byautofluorescence spectrometry: comparison withreflectometry and heterochromatic flicker photometry,” J.Opt. Soc. Am. A 18, 1212–1230 (2001).
5. F. C. Delori, “Autofluorescence method to measure macularpigment optical densities fluorometry and autofluorescenceimaging,” Arch. Biochem. Biophys. 430, 156–162 (2004).

2
2
2
2
3
3
3
3
3
3
3
3
3
3
4
4
4
4
4
4
4
4
4
4
5
5
5
5
5
5
5
5
5
5
6
6
6
6
6
Delori et al. Vol. 23, No. 3 /March 2006/J. Opt. Soc. Am. A 537
6. H. Wustemeyer, C. Jahn, A. Nestler, T. Barth, and S. Wolf,“A new instrument for the quantification of macularpigment density: first results in patients with AMD andhealthy subjects,” Graefe’s Arch. Clin. Exp. Ophthalmol.240, 666–671 (2002).
7. H. Wustemeyer, A. Moessner, C. Jahn, and S. Wolf,“Macular pigment density in healthy subjects quantifiedwith a modified confocal scanning laser ophthalmoscope,”Graefe’s Arch. Clin. Exp. Ophthalmol. 241, 647–651 (2003).
8. F. C. Delori, C. K. Dorey, G. Staurenghi, O. Arend, D. G.Goger, and J. J. Weiter, “In vivo fluorescence of the ocularfundus exhibits retinal pigment epithelium lipofuscincharacteristics,” Invest. Ophthalmol. Visual Sci. 36,718–729 (1995).
9. F. C. Delori, D. G. Goger, and C. K. Dorey, “Age-relatedaccumulation and spatial distribution of lipofuscin in RPEof normal subjects,” Invest. Ophthalmol. Visual Sci. 42,1855–1866 (2001).
0. M. Trieschmann, G. Spital, A. Lommatzsch, E. Van Kuijk,F. Fitzke, A. C. Bird, and D. Pauleikhoff, “Macularpigment: quantitative analysis on autofluorescenceimages,” Graefe’s Arch. Clin. Exp. Ophthalmol. 241,1006–1012 (2003).
1. G. Staurenghi, C. Keilhauer, F. Viola, P. Salvetti, D. Goger,and F. Delori, “Variability in macular pigment distributionevaluated by autofluorescence imaging,” Invest.Ophthalmol. Visual Sci. 44, 5118 (2003).
2. F. Delori, D. Goger, P. Salvetti, C. Keilhauer, and G.Staurenghi, “Spatial distribution of macular pigment innormal subjects,” Invest. Ophthalmol. Visual Sci. 45, 1288(2004).
3. Most older subjects in this study were recruited from theHarvard Cooperative Program on Aging (Roslindale,Mass.), an organization devoted to good health throughresearch and education.
4. W. A. Rushton and G. H. Henri, “Bleaching andregeneration of cone pigments in man,” Vision Res. 8,617–631 (1968).
5. W. H. A. Rushton, “Visual pigments in man,” in Handbookof Sensory Physiology, H. J. A. Dartnall, ed. (Springer-Verlag, 1972), pp. 364–394.
6. A. T. Liem, J. E. E. Keunen, D. van Norren, and J. van derKraats, “Rod densitometry in the aging human eye,”Invest. Ophthalmol. Visual Sci. 32, 31–37 (1991).
7. ANSI, American National Standard for Safe Use of Lasers(ANSI 136.1), ANSI 136.1-2000 (The Laser Institute ofAmerica, 2000).
8. R. A. Bone, J. T. Landrum, and A. Cains, “Optical densityspectra of the macular pigment in vivo and in vitro,” VisionRes. 32, 105–110 (1992).
9. J. C. Maxwell, “On the unequal sensibility of the foramencentrale to light of different colours,” Rep. Brit. Assoc. 2, 12(1856).
0. W. R. Miles, “Comparison of functional and structural areasin human fovea. I. Method of entopic plotting,” J.Neurophysiol. 17, 22–38 (1954).
1. B. R. Hammond, J. Curran-Celentano, S. Judd, K. Fuld, N.I. Krinsky, B. R. Wooten, and D. M. Snodderly, “Sexdifferences in macular pigment optical density: relation toplasma carotenoid concentrations and dietary patterns,”Vision Res. 36, 2001–2012 (1996).
2. W. M. Broekmans, T. T. Berendschot, I. A. Klopping-Ketelaars, A. J. de Vries, R. A. Goldbohm, L. B. Tijburg, A.F. Kardinaal, and G. van Poppel, “Macular pigment densityin relation to serum and adipose tissue concentrations oflutein and serum concentrations of zeaxanthin,” Am. J.Clin. Nutr. 76, 595–603 (2002).
3. T. A. Ciulla, J. Curran-Celantano, D. A. Cooper, B. R.Hammond, Jr., R. P. Danis, L. M. Pratt, K. A. Riccardi, andT. G. Filloon, “Macular pigment optical density in amidwestern sample,” Ophthalmology 108, 730–737 (2001).
4. A. G. Robson, J. D. Moreland, D. Pauleikhoff, T. Morrissey,G. E. Holder, F. W. Fitzke, A. C. Bird, and F. J. van Kuijk,“Macular pigment density and distribution: comparison offundus autofluorescence with minimum motionphotometry,” Vision Res. 43, 1765–1775 (2003).
5. F. C. Delori, E. S. Gragoudas, R. Francisco, and R. C.Pruett, “Monochromatic ophthalmoscopy and fundusphotography: the normal fundus,” Arch. Ophthalmol.(Chicago) 95, 861–868 (1977).
6. Y. Chang, Institute of Biomedical Engineering, NationalYang-Ming University, 155 Section 2 Li-Long Street, Shih-Pi, Taipei, Taiwan 11221 (personal communication, 2002).
7. W. Gellermann, I. V. Ermakov, and R. W. McClane, “Ramanimaging of human macular pigments,” Opt. Lett. 27,833–835 (2002).
8. T. Berendschot and D. van Norren, “Macular pigmentshows ring like structures,” Invest. Ophthalmol. Visual Sci.46, 1774 (2006).
9. B. R. Hammond and M. Caruso-Avery, “Macular pigmentoptical density in a Southwestern sample,” Invest.Ophthalmol. Visual Sci. 41, 1492–1497 (2000).
0. T. T. Berendschot and D. van Norren, “On the agedependency of the macular pigment optical density,” Exp.Eye Res. 81, 602–609 (2005).
1. B. R. Hammond, Jr., Department of Psychology, Universityof Georgia, Franklin College of Arts and Sciences, Athens,Georgia 30677 (personal communication, 2002).
2. B. R. Wooten and B. R. Hammond, Jr., “Spectralabsorbance and spatial distribution of macular pigmentusing heterochromatic flicker photometry,” Optom. VisionSci. 82, 378–386 (2005).
3. C. A. Curcio, K. R. Sloan, R. E. Kalina, and A. E.Hendrickson, “Human photoreceptor topography,” J. Comp.Neurol. 292, 497–523 (1990).
4. C. A. Curcio and K. A. Allen, “Topography of ganglion cellsin human retina,” J. Comp. Neurol. 300, 5–25 (1990).
5. D. M. Snodderly, R. S. Weinhaus, and J. C. Choi, “Neural-vascular relationships in central retina of macaquemonkeys (Macaca fascicularis),” J. Neurosci. 12, 1169–1193(1992).
6. L. Laatikainen and J. Larinkari, “Capillary-free area of thefovea with advancing age,” Invest. Ophthalmol. Visual Sci.16, 1154–1157 (1977).
7. G. H. Bresnick, R. Condit, S. Syrjala, M. Palta, A. Groo,and K. Korth, “Abnormalities of the foveal avascular zonein diabetic retinopathy,” Arch. Ophthalmol. (Chicago) 102,1286–1293 (1984).
8. L. Wu, Z. Huang, D. Wu, and E. Chan, “Characteristics ofthe capillary-free zone in the normal macula,” Jpn. J.Ophthalmol. 29, 406–411 (1985).
9. O. Arend, S. Wolfe, F. Jung, B. Bertram, and H. Postgens,“Retinal microcirculation in patients with diabetesmellitus: dynamic and morphological analysis of perifovealcapillary network,” Br. J. Ophthamol. 75, 514–518(1991).
0. R. S. Weinhaus, J. M. Burke, F. C. Delori, and D. M.Snodderly, “Comparison of fluorescein angiography withmicrovascular anatomy of macaque retinas,” Exp. Eye Res.61, 1–16 (1995).
1. M. R. Hee, C. A. Puliafito, J. S. Duker, E. Reichel, J. G.Coker, J. R. Wilkins, J. S. Schuman, E. A. Swanson, and J.G. Fujimoto, “Topography of diabetic macular edema withoptical coherence tomography,” Ophthalmology 105,360–370 (1998).
2. V. Guedes, J. S. Schuman, E. Hertzmark, G. Wollstein, A.Correnti, R. Mancini, D. Lederer, S. Voskanian, L.Velazquez, H. M. Pakter, T. Pedut-Kloizman, J. G.Fujimoto, and C. Mattox, “Optical coherence tomographymeasurement of macular and nerve fiber layer thickness innormal and glaucomatous human eyes,” Ophthalmology110, 177–189 (2003).
3. P. Massin, A. Erginay, B. Haouchine, A. B. Mehidi, M.Paques, and A. Gaudric, “Retinal thickness in healthy anddiabetic subjects measured using optical coherencetomography mapping software,” Eur. J. Ophthalmol. 12,102–108 (2002).
4. S. Fraser-Bell, R. Varma, J. Lipyanik, V. M. Patella, D.Budenz, L. Cantor, D. Greenfield, J. Savell, J. Schuman,and M. Ying-Lai, “Age, gender, ethnicity and refractiveerror related differences in normal macular thickness and

6
6
6
6
6
7
7
7
7
7
7
7
7
7
7
8
8
8
8
8
8
8
8
8
8
538 J. Opt. Soc. Am. A/Vol. 23, No. 3 /March 2006 Delori et al.
volume as measured by STRATUS OCT,” Invest.Ophthalmol. Visual Sci. 46, 1542 (2005).
5. D. Koozekanani, C. Roberts, S. E. Katz, and E. E.Herderick, “Intersession repeatability of macular thicknessmeasurements with the Humphrey 2000 OCT,” Invest.Ophthalmol. Visual Sci. 41, 1486–1491 (2000).
6. J. M. Gorrand and F. C. Delori, “Reflectance and curvatureof the inner limiting membrane at the foveola,” J. Opt. Soc.Am. A 16, 1229–1237 (1999).
7. From the dimensions of the reflex, we calculated, usingequations in the study of Gorrand and Delori,66 that theradius of curvature of the concave ILM reflector was 1180and 744 �m for women and men, respectively. The methoddoes not sample the entire foveal depression but considersonly an eccentric annulus from where incident rays can bereflected through the detection pupil.66 We calculated thatthe center of that annulus is at 0.27° and 0.16° from thefovea in women and men, respectively, and that the anglebetween the ILM and the RPE surface is 3.7° and 3.6°,respectively.
8. M. la Cour and J. Friis, “Macular holes: classification,epidemiology, natural history and treatment,” ActaOphthalmol. Scand. 80, 579–587 (2002).
9. W. E. Smiddy and H. W. Flynn, Jr., “Pathogenesis ofmacular holes and therapeutic implications,” Am. J.Ophthalmol. 137, 525–537 (2004).
0. G. E. Eldred and M. L. Katz, “Fluorophores of the humanretinal pigment epithelium: separation and spectralcharacterization,” Exp. Eye Res. 47, 71–86 (1988).
1. J. R. Sparrow, N. Fishkin, J. Zhou, B. Cai, Y. P. Jang, S.Krane, Y. Itagaki, and K. Nakanishi, “A2E, a byproduct ofthe visual cycle,” Vision Res. 43, 2983–2990 (2003).
2. R. F. Spaide, “Fundus autofluorescence and age-relatedmacular degeneration,” Ophthalmology 110, 392–399(2003).
3. C. K. Dorey, G. Staurenghi, and F. C. Delori, “Lipofuscin inaged and AMD eyes,” in Retinal Degeneration, J. G.Holyfield, R. E. Anderson, and M. M. LaVail, eds. (Plenum,1993), pp. 3–14.
4. F. C. Delori, “Spectrophotometer for noninvasivemeasurement of intrinsic fluorescence and reflectanceof the ocular fundus,” Appl. Opt. 33, 7439–7452(1994).
5. S. Siik, P. J. Airaksinen, A. Tuulonen, H. I. Alanko, and H.Nieminen, “Lens autofluorescence in healthy individuals,”Acta Ophthalmol. 69, 187–192 (1991).
6. B. Bordat, A. Laudeho, I. R. Guirguis, and C. Arnaud,“Study of the crystalline lens by fluorophotometry in 60control subjects and 56 diabetics,” J. Fr. Ophtalmol 15,113–118 (1992) (in French).
7. In previous reports,25,32 we used the signal at a fixedlocation outside the illuminated area to estimate SL[squares in Fig. 1(a)]. We found that this signal increasedsignificantly with age for both �’s �p0.0001� but that itwas also affected by the choroidal pigmentation (asestimated by iris color). Measurements showed that therewas a gradient away from the image edge caused by the redAF diffusing in the choroid. We also found that the signalwas smaller in the four study pseudophakic subjectscompared with the age- and gender-matched phakicsubjects (for �=470 nm, t=2.8, p=0.02).
8. Crystalline lens AF was measured in three study subjects(ages 37, 46, and 57 years) by focusing the samplingvolume within the lens. Excitation, normalized at 470 nm,were 0.91±0.01, 1.00±0.00, 0.53±0.02, and 0.24±0.02 at�=430, 470, 510, and 550 nm, respectively. Emissionspectra were maximal at 520±5 nm for �=470 nm; at 600nm, the fluorescence was 37% ±2% of the maximumfluorescence. Fluorescence intensity increased with age ofthe three subjects. Excitation and emission spectra for onesubject can be found in Fig. 8 of Ref. 74.
9. J. M. Benitez del Castillo, T. del Rio, and J. Garcia-Sanchez, “Effects of estrogen use on lens transmittance inpostmenopausal women,” Ophthalmology 104, 970–973(1997).
0. J. Sandby-Moller, E. Thieden, P. Alshede Philipsen, G.Schmidt, and H. C. Wulf, “Ocular lens blueautofluorescence cannot be used as a measure of individualcumulative UVR exposure,” Photodermatol. Photoimmunol.Photomed. 20, 41–46 (2004).
1. Since DMP still decreased at 4° in some subjects (Figs. 1, 2,and 4), we are underestimating DMP’s compared withstudies that used a reference at 7°. By exponentialextrapolation of the profiles, we estimated that the DMP’swith a reference at 4° would be 0.02±0.03 D.U. (range 0.0to −0.16 D.U.) less than those with the reference at 7°.Furthermore, our peak DMP’s were decreased by thesmoothing that we used in our image analysis; reanalysisof our profiles using no smoothing caused the peakdensities to increase by 0.03±0.02 D.U. (range 0.01–0.05D.U.).
2. A. Stockman and L. T. Sharpe, “The spectral sensitivities ofthe middle- and long-wavelength-sensitive cones derivedfrom measurements in observers of known genotype,”Vision Res. 40, 1711–1737 (2000).
3. S. A. Burns and A. E. Elsner, “Color matching at highilluminances: photopigment optical density and pupilentry,” J. Opt. Soc. Am. A 10, 221–230 (1993).
4. P. M. Prieto, J. S. McLellan, and S. A. Burns, “Investigatingthe light absorption in a single pass through thephotoreceptor layer by means of the lipofuscinfluorescence,” Vision Res. 45, 1957–1965 (2005).
5. A. J. Wenzel, K. Fuld, and J. M. Stringham, “Lightexposure and macular pigment optical density,” Invest.Ophthalmol. Visual Sci. 44, 306–309 (2003).
6. J. J. Weiter, F. C. Delori, G. Wing, and K. A. Fitch, “Retinalpigment epithelial lipofuscin and melanin and choroidalmelanin in human eyes,” Invest. Ophthalmol. Visual Sci.27, 145–152 (1986).
7. L. Feeney-Burns, E. R. Berman, and H. Rothman,“Lipofuscin of human retinal pigment epithelium,” Am. J.Ophthalmol. 90, 783–791 (1980).
8. V.-P. Gabel, R. Birngruber, and F. Hillenkamp, “Visible andnear infrared light absorption in pigment epithelium andchoroid,” in XXIII Concilium Ophthalmol Kyoto, K.Shimuzu and J. A. Oosterhuis, eds. (Excerpta Medica,Amsterdam, 1979), pp. 658–662.
9. C. N. Keilhauer, J. Fischer, J. Mlynski, A. Stangl, and F. C.Delori, “Confocal infrared autofluorescence imaging innormal subjects and AMD patients,” Invest. Ophthalmol.Visual Sci. 46, 1394 (2005).