
Materials for Advanced Power Engineering 2006 - OSTI.GOV
618
Energietechnik Energy Technology J. Lecomte-Beckers, M. Carton, F. Schubert and P.J. Ennis (Editors) Materials for Advanced Power Engineering 2006 Proceedings Part III
-
Upload
khangminh22 -
Category
Documents
-
view
0 -
download
0
Transcript of Materials for Advanced Power Engineering 2006 - OSTI.GOV
EnergietechnikEnergy Technology
J. Lecomte-Beckers, M. Carton,F. Schubert and P. J. Ennis (Editors)
Materials forAdvanced Power Engineering 2006
Proceedings Part III

Schriften des Forschungszentrums JülichReihe Energietechnik / Energy Technology Band/Volume 53, Part III

Forschungszentrum Jülich GmbHInstitut für Energieforschung
Jacqueline Lecomte-Beckers, Marc Carton,Florian Schubert and Philip J. Ennis (Editors)
Materials for Advanced PowerEngineering 2006
Proceedings of the 8th Liege ConferencePart III
Universite de LiegeEuropean CommissionCOSTEuropean Science Foundation
Schriften des Forschungszentrums JülichReihe Energietechnik / Energy Technology Band/Volume 53, Part III
ISSN 1433-5522 ISBN 3-89336-436-6

Bibliographic information published by Die Deutsche Bibliothek.Die Deutsche Bibliothek lists this publication in the DeutscheNationalbibliografie; detailed bibliographic data are available in theInternet at <http://dnb.ddb.de>.
Publisher Forschungszentrum Jülich GmbHand Distributor: Zentralbibliothek, Verlag
D-52425 JülichTelefon (02461) 61-5368 • Telefax (02461) 61-6103e-mail: [email protected]: http://www.fz-juelich.de/zb
Cover Design: Grafische Medien, Forschungszentrum Jülich GmbH
Printer: Grafische Medien, Forschungszentrum Jülich GmbH
Copyright: Forschungszentrum Jülich 2006
Schriften des Forschungszentrums JülichReihe Energietechnik / Energy Technology Band / Volume 53, Part III
ISSN 1433-5522ISBN 3-89336-436-6
Neither this book nor any part may be reproduced or transmitted in any form or by any means,electronic or mechanical, including photocopying, microfilming, and recording, or by anyinformation storage and retrieval system, without permission in writing from the publisher.
111
FOREWORD
The European Co-operation in the field of Scientific and Technical Research (COST) is awell-established organisation for the co-ordination of national research and developmentprogrammes on the European level. The series of Li ege conferences began in 1978 withthe aim of disseminating the results of the COST Action 50 in which materials for gasturbines were investigated. Since then, a Liege Conference has been held every four yearsand the results of COST Actions 501 and 522, which were concerned with materials forpower generation plant, reported. At this, the Eighth Li ege Conference, the materialsresearch and development work being carried out in the current COST Actions 536 `AlloyDevelopment for Critical Components of Environmentally Friendly Steam Power Plant'with the acronym ACCEPT and 538 'High Temperature Plant Lifetime Extension' will bereported.
Reliable energy supply at reasonable cost is one of the most important factors in thedevelopment and maintenance of the modern industrial society, but there are increasingconcerns about the environmental impact of energy production as well as about the need toconserve valuable energy resources for future generations. New and emerging energytechnologies are of great interest, but fossil fuels will continue to make a considerablecontribution to energy requirements into the foreseeable future. The emphasis in this fieldis therefore on the most efficient use of fossil fuels, which can be achieved by increasingthe thermal efficiency of the energy conversion process. For steam power plant and gasturbines, this means raising the temperature and pressure of the process. This in turnrequires the application of improved materials that are able to withstand the increasinglyarduous service conditions.
In the COST Actions, the materials research and development activities that are necessaryfor the critical components of advanced, highly efficient power generation plant have beenbased on the principle of work-sharing, bringing together materials scientists andengineers, plant designers, alloy producers, component manufacturers, plant constructorsand plant operators. This constellation of expertise reflects the need to match materialsproperties to component behaviour.
In order to put the European efforts into a world-wide scenario, there are in this conferencea number of invited papers that will discuss the energy perspectives and the developmentof power plant materials in the USA, Japan, India and China.
The Conference Proceedings are organised as follows:
Part I: INAUGURAL SESSIONInvited papers
EUROPEAN ENERGY MATERIALS RESEARCHInvited papers
ENERGY PERSPECTIVESInvited papers
iv
ADVANCED GAS TURBINE MATERIALSInvited papersContributed papers
Mechanical propertiesMicrostructure
Part II: ADVANCED GAS TURBINE MATERIALSContributed papers
ModellingJoining technologyOxidation and hot corrosionCoating technologyIntermetallics and ceramics
ADVANCED STEAM TURBINE MATERIALSInvited papersContributed papers
Mechanical properties
Part III: ADVANCED STEAM TURBINE MATERIALSContributed papers
MicrostructureModelling and alloy designWelding technologySteam oxidation and coatingsAustenitic and nickel-base alloys
ADDENDUM
The Technical and Editorial Board members would like to express their gratitude to all themembers of the COST 536 and COST 538 Management Committees, for their supervisionand support of the considerable research and development efforts, both in their owncountries and across national borders. Those who were involved in the reviewing of thesubmitted papers are also sincerely thanked for their important contribution to theproduction of the Proceedings.

Research Centre Jülich - 50 Years of Innovation
Addressing society's challenges, questions and expectations and delivering solutions with the
aid of excellent, strategically positioned research: this is the mission that Research Centre
Jülich has been involved in ever since its foundation 50 years ago. Over the course of the
years, it has undergone a huge transition, moving from research focused on the peaceful uses
of nuclear energy to a research enterprise Tun on a multi-programmatic and interdisciplinary
basis with an internationally unrivalled profile.
The key to this profile is the dose linking of Jülich's traditional core competence, physics, to
the other sciences. The basic insights gained in physics contribute decisively to a better
understanding of the complex systems in energy, chemistry, biology, medicine and the
geosciences, while the questions encountered in these fields extend the approaches adopted in
physics. A further core competence that has evolved in Jülich with a remarkable momentum
over the last few years is scientific computing. The operation of medium and large-scale
equipment and a well-developed scientific and technical infrastructure round off the profile.
This leads to the co-operation between and mutual enrichment of the different areas of
expertise in Jülich, which remains internationally unparalleled in both nature and intensity.
The positive effect of this cross-linking is further enhanced through strategic alliances with
other centres in the Helmholtz Association, as well as with universities, industrial companies
and research institutions worldwide.
The Research Centre Jülich will use this profile as a focal point for its research over the next
two decades, making thus significant future contributions to the following four grand
challenges: responsible management of the environment's natural resources, sustainable and
comprehensive energy supply, securing food for and the health of a growing world
population, and the provision and solutions-orientated linking of large quantities of
information.

1 91
1 107
- vii -
TABLE OF CONTENTS
Part I
Foreword iiiTable of Contents vii
INAUGURAL SESSION
ENGINEERING SUSTAINABILITY 5Wall G
THE EU RESEARCH STRATEGY TOWARDS ZERO EMISSION FOSSIL 25FUEL POWER PLANTSDechamps P
EUROPEAN ENERGY MATERIALS RESEARCH
MATERIALS DEVELOPMENT FOR BOILERS AND STEAM TURBINES 141OPERATING AT 700 °CBlum R, Vanstone R W
THE EUROPEAN WAY TO 700°C COAL FIRED POWER PLANT 1 61Tschaffon H
MATERIALS ASPECTS OF SOLID OXIDE FUEL CELLS 169Steinbrech R, Menzler N H, Batfalsky P, Blum L
MATERIALS FOR EXTREME ENVIRONMENTS IN FUSION 181APPLICATIONSBolt H, Maier H
DEVELOPMENT AND CURRENT STATUS OF ECCC CREEP PROPERTYDATA SHEETSHoldsworth S R
(see also Part 111 1722, Addendum)
ENERGY PERSPECTIVES
EVALUATION OF THE MATERIALS TECHNOLOGY REQUIRED FOR A760°C POWER STEAM BOILERShingledecker J P, Wright 1 G
CURRENT AND 2050 ENERGY PERSPECTIVES IN INDIA: OPPORTUNITIES 1 121FOR MATERIALS SCIENTISTS AND TECHNOLOGISTSBaldev Rat, B S Rao Kota
viii
MATERIALS CHALLENGES IN CO2 CAPTURE AND STORAGE 1 143Mathieu P
THE HYDROGEN ECONOMY 1 161Birnbaum U, Hake J-F, Linssen J, Walbeck M
ADVANCED POWER PLANT DEVELOPMENTS AND MATERIAL 1 175EXPERIENCES IN JAPANMasuyama F
DEVELOPMENT OF HIGH TEMPERATURE MATERIALS FOR ENERGY 1 189MARKET IN CHINAHu Z Q, Guo J T
ADVANCED GAS TURBINE MATERIALS
Invited papers
DEGRADATION IN SINGLE CRYSTAL NICKEL-BASE SUPERALLOYS – A 1 205REVIEWNazmy M, Epishin A, Link T, Staubli M
RECENT ADVANCES IN NDT TECHNIQUES FOR GAS TURBINE 1 217COATINGSOsgerby S, Rinaldi C, De Maria L
GAS TURBINE ISSUES IN ADVANCED GASIFICATION SYSTEMS 1 233Wenglarz R, Oakey J
MATERIALS PROBLEMS AND SOLUTIONS IN BIOMASS FIRED PLANTS 1 245Larsen 0 H, Montgomery M
RE-QUALIFICATION OF BOILER DRUMS IN THERMAL POWER PLANT 1 261Brziak P, BernasovskST P
(see also Part HI 1696, Addendum)
Contributed papers: Mechanical properties
DEVELOPMENT OF NI-BASED SINGLE CRYSTAL SUPERALLOYS FOR 1 273POWER-GENERATION GAS TURBINE BLADESHashizume R, Yoshinari A, Kiyono T, Murata Y, Morinaga M
A 5TH GENERATION NI-BASE SINGLE CRYSTAL SUPERALLOY WITH 1 287SUPERIOR ELEVATED TEMPERATURE PROPERTIESSato A, Yeh A C, Kobayashi T, Yokokawa T, Harada H, Murakumo T, Zhang J
ix
EFFECT OF PLASTIC ANISOTROPY ON CREEP STRENGTH OF SINGLE 1 299CRYSTAL NI-BASED SUPERALLOYSKoyabu H, Tsuno N, Kakehi K
DEVELOPMENT OF CO-FREE NI-BASE SINGLE CRYSTAL SUPERALLOY 1 309Yokokawa T, Kobayashi T, Suzuki T, Koizumi Y, Harada H
THE EFFECT OF HIGH TEMPERATURE CREEP DAMAGE ON LOW
1 317CYCLE FATIGUE IN CMSX-4Epishin A, Link T, Bruckner U, Klingelhöffer H, Portella P
THE LONG-TERM CREEP PROPERTY OF NICKEL-BASE SINGLE- 1 327CRYSTAL SUPERALLOYSKoizumi Y, Harada H, Yokokawa T, Kobayashi T
INFLUENCE OF SOLIDIFICATION CONDITIONS ON HOMOGENISATION 1 335HEAT TREATMENT AND MECHANICAL PROPERTIES IN SINGLECRYSTAL NICKEL-BASE SUPERALLOYSLamm M, Volek A, Luesebrink 0, Singer R F
PREDICTION OF THERMAL MECHANICAL FATIGUE PROPERTIES OF 1 347NI-BASE SINGLE CRYSTAL SUPERALLOYSOhata H, Yokokawa T, Kobayashi T, Ro Y, Harada H
DEVELOPMENT OF A HIGH STRENGTH NI-BASED SUPERALLOY FOR 1 355CONVENTIONAL CASTINGTamaki H, Yoshinari A, Doi H
HIGH TEMPERATURE PROPERTIES OF SELECTED NI-BASE
1 365SUPERALLOYSHakl J, Vlasäk T
HOT ISOSTATIC PRESSING PROCESS TO REJUVENATE SERVICED CAST 1 377NICKEL-BASE SUPERALLOY IN738 TURBINE BLADESWangyao P, Zrnik J, Polsilapa S, Nisaratanaporn E, Homkrajai W
DEVELOPMENT OF NEW SUPERALLOYS FOR TURBINE DISK
1385APPLICATIONSGu Y, Cui C, Ping D, Harada H, Sato A, Fujioka J
INFLUENCE OF CARBIDES AND OXIDATION ON THERMAL FATIGUE 1 393BEHAVIORS OF TWO NICKEL-BASE SUPERALLOYSLi Y L, Yuan C, Guo J T, Hou J S
LOW CYCLE FATIGUE BEHAVIOR OF WROUGHT NICKEL BASED 1 403SUPERALLOY GH413Guo X G, Guo J T, Yuan C, Yang H C
EFFECT OF CARBIDES ON THERMAL FATIGUE PROPERTY OF K465 1 413CAST SUPERALLOYGuan H R, Yang J X, Zheng Q, Wang Y L, Sun X F, Hu Z Q
ENVIRONMENTAL EFFECT ON HIGH TEMPERATURE FATIGUE
1 423BEHAVIOUR OF A NICKEL BASE SUPERALLOY FOR TURBINE DISCSMarchionni M, Onofrio G, Osinkolu G A
INFLUENCE OF SOLUTION HEAT TREATMENT CONDITIONS ON
1 435GAMMA PRIME CHARACTERISTICS IN A HOT CORROSION RESISTANTSUPERALLOYHou J S, Guo J T, Zhou L Z, Li J Z, Qin X Z, Li Y L, Ye H Q
Contributed papers: Microstructure
MORPHOLOGICAL EVOLUTION OF GAMMA PRIME AND M23C6 CARBIDE 1 447IN A CAST NI-BASE SUPERALLOY IN THE DIFFERENT TREATMENTCONDITIONSQin X Z, Guo J T, Yuan C, Hou J S, Ye Q H
DISLOCATION SUBSTRUCTURE IN y-CHANNEL OF SINGLE CRYSTAL
1 455NICKEL-BASED SUPERALLOY, CMSX-4, CREPT AT 1273 K, 160 MPAKondo Y, Miura N, Matsuo T
DISLOCATION SUBSTRUCTURE AT ye INTERFACE OF SINGLE
1 465CRYSTAL NICKEL-BASED SUPERALLOY CMSX-4 CREPT AT 1273 K, 250MPAMiura N, Tanaka F, Kurita K, Kondo Y, Matsuo T
MODELLING OF RAFTING AND ITS INFLUENCE IN NI-BASE
1 475SUPERALLOYSFedelich B, Künecke G, Epishin A
TEM MICROSTRUCTURAL ANALYSIS OF CREEP DEFORMED CM186LC 1 485SINGLE CRYSTAL NI-BASE SUPERALLOYDubiel B, Blackler M, Barnard P M, Czyrska-Filemonowicz A
ATOM PROBE MICROANALYSIS OF FIFTH-GENERATION NI-BASE 1 495SINGLE-CRYSTAL SUPERALLOYSKitashima T, Ping D H, Harada H, Kobayashi T
MICROSTRUCTURAL STABILITY OF CMSX-4 AND CMSX-10 UNDER 1 507HIGH TEMPERATURE CREEP CONDITIONSEpishin A, Link T, Bruckner U
X-RAY TOMOGRAPHY FOR POROSITY ANALYSIS IN SINGLE-CRYSTAL 1 521NI-BASE SUPERALLOYSLink T, Zabler S, Haibel A, Epishin A
xi
DEFORMATION BEHAVIOR AND MICROSTRUCTURE EVOLUTION 1 533DURING HOT WORKING PROCESS OF NICKEL-BASE ALLOY GH742Zhang B, Zhao G, Xu G, Feng D
ORIENTATION DEPENDENCE OF SECONDARY REACTION ZONES IN 1 541SURFACE MODIFIED NI-BASED SINGLE CRYSTAL SUPERALLOYSMurakami H, Sakai T, Shibata M, Yamaguchi A, Kuroda S
STUDY ON THE INVESTMENT CASTING PROCESS OF K418 SUPERALLOY 1 549TURBINELi J, Zhao M, Shao C, Kong S, Wu J, Li W
STUDY ON CASTING PROCESS OF K4537 SUPERALLOY GAS TURBINE 1555Shao C, Li J, Zhao M, Li W, Wu J, Kong S
DIFFUSION COEFFICIENT OF REFRACTORY ELEMENTS IN MULTI- 1 561COMPONENT NI-ALLOYMurata Y, Hattori M, Efendi, Goto N, Koyama T, Morinaga M
MICROSTRUCTURAL DEGRADATION OF HAYNES 230 COMBUSTOR 1 571HARDWAREMarchant G, McColvin G, Strang A
SHOT PEENING INDUCED RECRYSTALLIZATION IN A DIRECTIONALLY 1 583SOLIDIFIED NI-BASE SUPERALLOYZhang J, Wang L, Xie G, Sun C, Lou L H
AUTHOR INDEX 1
KEYWORD INDEX VII

xii
Part II
ADVANCED GAS TURBINE MATERIALS
Contributed papers: Modelling
MICRO-MECHANICAL MODELLING OF THE SINGLE CRYSTAL NICKEL- 11 595BASE SUPERALLOY CMSX-4Tinga T, Geers M G D, Brekelmans W A M
MODELLING THE CONSTANT AND VARIABLE LOADING /
II 607TEMPERATURE CREEP BEHAVIOUR OF UDIMET 720LIMaldini M, Lupine V
A GENERAL APPROACH TO MICROSTRUCTURAL MODELLING OF II 619CREEPPein C, Kozeschnik E
Contributed papers: joinini' technology
THE CREEP RUPTURE BEHAVIOUR OF A NICKEL-BASE SINGLE- 11 627CRYSTAL SUPERALLOY AFTER TLP BONDINGLiu J D, Jin T, Zhao N R, Wang Z H, Sun X F, Guan H R, Hu Z Q
NANOINDENTATION AND ORIENTATION MEASUREMENTS IN SINGLE 11 633CRYSTALLINE BRAZING JOINTS OF NICKEL — BASE SUPERALLOYSDinkel M, Pyczak F, Göken M, Heinz P, Volek A, Singer R F, Ott M, Affeldt E,Vossberg A
Contributed papers: Oxidation and hot corrosion
LONG-TIME HIGH-TEMPERATURE OXIDATION OF MA 6000 AND PM 11 6453030 ODS SUPERALLOYSMaresca P, Pratesi F, Terzigli V, Innocenti M, Giorni E
OXIDATION RESISTANCE OF SILICON-CONTAINING 5TH GENERATION 11 655NICKEL-BASE SINGLE CRYSTAL SUPERALLOYSSato A, Harada H, Ang J, Yutaka K, Toshiharu K, Kawagishi K, Imai H
ESTIMATION OF THE RISK OF HOT CORROSION IN GAS TURBINES BY 11 665THERMODYNAMIC MODELLINGMüller M
Contributed papers: Coating technology
MICROSTRUCTURAL INVESTIGATIONS AND MODELLING OF
II 675INTERDIFFUSION BETWEEN MCRALY COATING AND IN738SUPERALLOYDahl K V, Hald J
DEVELOPMENT OF EQ COATINGS FOR A NEW TBC COATING SYSTEM 11 691IN NI-BASE SUPERALLOYSKawagishi K, Sato A, Matsumoto K, Ang J, Harada H
COATINGS BY LASER CLADDING AGAINST LIQUID DROPLET EROSION II 699Giannozzi M, Giorni E, Giovannetti 1, Pratesi F, Zonfrillo G
A NEW DEVICE FOR TESTING COATINGS UNDER THERMAL SHOCK II 707Zonfrillo G, Giannozzi M, Pratesi F, Giorni E
CHARACTERIZATION OF THERMAL BARRIER COATINGS BY MEANS 11 717OF FURNACE CYCLE TESTINGCappuccini F, Zonfrillo G, Pratesi F, Giannozzi
ACOUSTIC EMISSION ANALYSIS USED AS MONITORING TOOL FOR II 727BURNER RIG TESTS OF THERMAL BARRIER COATINGSMack D E, Casu A, Traeger F, Vaßen R, Stöver D
PRACTICAL APPLICATIONS OF TEMPERATURE ESTIMATION MODELS II 737BASED ON SUPERALLOY BASE METAL AND MCRALY COATINGMICROSTRUCTURE EVOLUTION IN SERVICE GAS TURBINECOMPONENTSHussain K, Daleo J A
NUMERICAL SIMULATION OF TBC DELAMINATION UNDER THERMAL II 747CYCLIC LOADINGBialas M, Bednarz P, Herzog R
OXIDATION AND HOT CORROSION BEHAVIOUR OF ALUMINIZED 11 757PT-IR COATINGS ON NI-BASED SUPERALLOYS TMS-82+Yamaguchi A, Wu Y N, Suzuki A, Murakami H, Kuroda S, Imai H
Contributed papers: Intermetallics and ceramics
CREEP BEHAVIOR OF ORTHORHOMBIC TI 2ALNB-BASED ALLOYS 11 767Hagiwara M, Emura S, Mao Y
COMPARISON OF THE ISOTHERMAL FATIGUE BEHAVIOUR OF
11 773TIMETAL 6242 AND y-TIAL ALLOYS AT 700°CCempura G, Penkalla H J, Schubert F, Czyrska-Filemonowicz A
xiv
TIAL OXIDATION PROTECTION IMPROVEMENTS USING THE HALOGEN II 783EFFECTMasset P, Zschau H-E, Schütze M
THERMAL EXPOSURE EFFECTS ON THE MECHANICAL PROPERTIES OF 11 793TIAL INTERMETALLICHoldway P, Lucas K, Wisbey A
DIRECTIONALLY SOLIDIFIED MULTIPHASE NI3AL-BASED
11 803INTERMETALLICS FOR HIGH TEMPERATURE APPLICATIONSLapin J, Pelachovä T, MareM( J
SUPERPLASTIC DEFORMATION AND MECHANISM OF EXTRUDED
11 819EUTECTIC NIAL/CR(MO) ALLOY DOPED WITH DYGuo J T, Du X, Li G
FEM STUDY OF A CMC SHROUD 11 829Del Pugliaa P, Lanese N, Zonfrilloa G
ADVANCED STEAM TURBINE MATERIALS
Invited papers
THE EUROPEAN EFFORT IN DEVELOPMENT OF NEW HIGH
II 843TEMPERATURE ROTOR MATERIALS — COST 536Kern T -U, Staubli M, Mayer K H, Donth B, Zeiler G, DiGianfrancesco A
THE EUROPEAN EFFORTS IN DEVELOPMENT OF NEW HIGH
11 855TEMPERATURE CASING MATERIALS — COST 536Staubli M, Hanus R, Weber T, Mayer K H, Kern T-U
WELDABILITY AND PROPERTIES OF NEW CREEP RESISTANT II 871MATERIALS FOR USE IN ULTRA SUPERCRITICAL COAL FIRED POWERPLANTSBaun E, Cerjak H, Caminada S, Jochum C, Mayr P, Pasternak J
US PROGRAM ON MATERIALS TECHNOLOGY FOR
II 893ULTRASUPERCRITICAL STEAM-COAL FIRED POWER PLANTSViswanathan R, Henry J F, Tanzosh J, Stanko G, Shingledecker J P, Vitalis B
METALLOGRAPHY AND ALLOY DESIGN IN THE COST 536 ACTION II 917Hald J
MATERIALS DEVELOPMENT FOR ADVANCED STEAM BOILERS II 931Heimrich A, Chen Q, Stamatelopoulos G, Scarlin B
xv
COATINGS FOR PROTECTION OF HIGH TEMPERATURE NEW
II 949GENERATION STEAM PLANT COMPONENTS: A REVIEWAguero A
METALLURGY FOR LONG-TERM STABILIZATION OF FERRITIC STEELS 11 965FOR THICK SECTION BOILER COMPONENTS IN USC POWER PLANT AT650°CAbe F
Contributed papers: Mechanical properties
CONTRIBUTION TO THE INVESTIGATION OF ADVANCED LOW-ALLOY 11 985P23 STEEL CREEP BEHAVIOURHakl J, Vlasäk T, Brziak P, Zifcak P
EFFECT OF TEMPERING TIMES ON CREEP STRENGTH IN
II 997ASME GR 23 (2 25CR-1 6W STEEL)Komai N, Imazato T
CREEP OF 0.5CrMoV STEEL AT VERY LOW STRAIN RATES II 1011Kloc L, Sklenica V
IMPROVEMENT IN CREEP STRENGTH OF HEAT RESISTANT FERRITIC 11 1019STEEL STRENGTHENED BY INTERMETALLIC COMPOUNDToda Y, Kushima H, Kimura K, Abe F
SUPERIOR LONG-TERM CREEP BEHAVIOUR AND MICROSTRUCTURAL 11 1031EVOLUTION OF 9%CR-STEELS WITH BORONKager F, Böck N, Spiradek-Hahn K, Höfinger S, Brabetz M, Zeiler G
ALLOY DESIGN AND CREEP STRENGTH OF ADVANCED 9%CR USC
II 1041BOILER STEELS CONTAINING HIGH BORONSemba H, Abe F
IMPROVEMENT OF CREEP STRENGTH OF 650 °C 11 1053FERRITIC/MARTENSITIC SUPER HEAT RESISTANT 11-12 % CR STEELSMayer K-H, Berger C, Scholz A, Wang Y
STATUS OF DEVELOPMENT OF THE VM12 STEEL FOR TUBULARAPPLICATIONS IN ADVANCED POWER PLANTSGabrel J, Bendick W, Vandenberghe B, Lefebvre B
MICROSTRUCTURAL DEVELOPMENT OF VM12 STEEL CAUSED BYCREEP DEFORMATION AT 625°CZielinska-Lipiec A, Bendick W, Cempura G, Vandenberghe B, Ennis P J,Czyrska-Filemonowicz A
REGENERATIVE HEAT TREATMENT OF L21HMF CAST STEEL AFTERLONG TERM OPERATIONGolanski G, Kupczyk J, Stachura S, Gajda B
II 1065
II 1077
II 1087
xvi
II 1095LONG TERM CREEP STRENGTH DEGRADATION IN T122/P122 STEELSFOR USC POWER PLANTSIgarashi M, Yoshizawa M, lseda A, Matsuo H, Kan T
DEGRADATION BEHAVIOUR AND LONG-TERM CREEP STRENGTH OF12CR FERRITIC CREEP RESISTANT STEELSKimura K, Sawada K, Kushima H, Toda Y
CREEP CURVE ANALYSIS USING THE MODIFIED SZ METHODYin Y F, Faulkner R G
EFFECT OF NON STEADY LOADING ON CREEP BEHAVIOUR OFADVANCED 9-12 % FOSSIL POWER PLANT STEELSSklenicka V, Kucharova K, Svoboda M, Kloc L, Kudrman J
CREEP AND CREEP FATIGUE PROPERTIES OF TURBINE STEELS FORAPPLICATION TEMPERATURES UP TO 625 °CBerger C, Schwienheer M, Scholz A
11 1105
II 1117
II 1127
II 1137
LOW CYCLE FATIGUE BEHAVIOUR OF SANDWICH STRUCTURES OF P92 11 1147AND NICROFER 6025 HTEl-Magd E, Stuhrmann J, Gebhard J
CAUSES OF CREEP FRACTURE MECHANISM CHANGE IN
II 11579CR-1 8W-0 5Mo-VNb STEELLee J S, Arnaki H G, Maruyama K, Muraki T, Asahi H
AUTHOR INDEX 1
KEYWORD INDEX VII

xvii
Part III
ADVANCED STEAM TURBINE MATERIALS
Contributed papers: Microstructure
MICROSTRUCTURAL CHARACTERIZATION OF MODERN BORON 111 1171CONTAINING 9-11 % CR STEELS DEVELOPED IN THE FRAMEWORK OFTHE COST PROGRAMKauffmann F, Mayer K H, Straub S, Zies G, Scheu C, Willer D, Ruoff Maile K
QUANTITATIVE MICROSTRUCTURAL ANALYSIS ON THE STABILITY OF III 1181MX AND M2X IN 9-12 % CR STEELS BY AFM, SEM, TEMSeibert T, Durst K, Chilukuru H, Göken M
SIMULATION OF THE PRECIPITATION KINETICS DURING HEATTREATMENT AND SERVICE OF CREEP RESISTANT MARTENSITIC9-12% CR STEELHolzer I, Rajek J, Kozeschnik E, Cerjak H
MICROSTRUCTURAL ANALYSIS ON A CREEP RESISTANTMARTENSITIC 9-12% CR STEELS USING THE EBSD METHODSonderegger B, Mitsche S, Cerjak H
DISLOCATION MOBILITY IN 9% CHROMIUM STEELS EXPOSED TOCREEPBöck N
EFTEM INVESTIGATIONS ON PRECIPITATES IN A CREEP RESISTANT9-12% CR STEELSonderegger B, Kothleitner G, Rechberger W, Cerjak
III 1199
III 1207
111 1217
PRECIPITATION BEHAVIOR OF Z PHASE AFTER LONG-TERM CREEP IN III 1227HIGH CHROMIUM FERRITIC HEAT RESISTANT STEELSSawada K, Kushima H, Kimura K
ON THE ROLES OF M2X AND Z-PHASE IN TEMPERED MARTENSITIC9-12% CR-STEELSChilukuru H, Durst K, Göken M, Blum W
ELECTRON DIFFRACTION STUDIES ON (Nb,V)CrN PARTICLES IN12CrMoVNbN STEELSVodarek V, Danielsen H, Grumsen F, Hald J, Strang A
III 1241
111 1251
xviii
AN EFTEM STUDY OF Z-PHASE NUCLEATION IN MARTENSITIC
III 1267CHROMIUM STEELSGolpayegani A, Andren H 0
Z-PHASE IN 9-12%CR STEELS - OBSERVATIONS AND THERMODYNAMIC 111 1275MODELLINGDanielsen H K, Hald J
MICROSTRUCTURE AND STEAM OXIDATION RESISTANCE OF LAVES 111 1285PHASE FORMING 12%CR STEELS AT 600-650°CPirön Abellän J, Ennis P J, Singheiser L, Quadakkers W J
Contributed papers: Modelling
CDM MODELLING OF POWER PLANT FERRITIC STEELS 111 1299Yin Y F, Faulkner R G
AN EFFECTIVE PARAMETRIC STRAIN MODEL FOR CREEP III 1309Holmström S, Auerkari P, Holdsworth S
ADVANCED ALLOY DESIGN TOOLS APPLIED TO THE DEVELOPMENT 111 1319OF VANADIUM NITRIDE STRENGTHENED HIGH-TEMPERATURESTEELSGaude-Fugarolas D, Yardley V, Lardon J-M, Montagnon J, De Carlan Y
Contributed papers: Weldin,g technolo,gy
APPLICATION OF BAINITIC CREEP RESISTING STEELS FOR III 1331SUPERCRITICAL PARAMETERS AND PROPERTIES OF WELDED JOINTSBrözda J, Zeman M, Pasternak J
INVESTIGATIONS ON OPTIMISATION OF WELD CREEP PERFORMANCE 111 1341IN MARTENSITIC STEELSBauer M, Klenk A, Maile K, Roos E, Jochum C
STRUCTURAL STABILITY AND PROPERTIES OF WELD JOINTS OF NEWCREEP-RESISTANT STEEL GRADES WITH 9 OR 12% CR CONTENTSAPPLIED IN OPERATION OF POWER GENERATIONS SECTOR OVER30000 hMoskal G, Hernas A, Pasternak J
WELDABILITY AND HIGH TEMPERATURE BEHAVIOR OF12% CR-STEEL FOR TUBES AND PIPES IN POWER PLANTSWITH STEAM TEMPERATURES UP TO 650 °CVekeman J, Dhooge A, Huysmans S, Vandenberghe B, Jochum C
111 1357
111 1369
EXPECTED CREEP LIFE OF WELDED 9-12% CR STEELS III 1381Auerkari P, Holmström S, Salonen J
xix
STUDY OF THE SIMULATED HAZ OF A BORON ALLOYED CREEPRESISTANT 9% CHROMIUM STEELMayr P, Cerjak H
MICROSTRUCTURAL STUDIES OF SIMILAR AND DISSIMILAR WELDSOF P91Jandova D, Kasl J, Folkova E, Kanta V
PHYSICAL SIMULATION AND NUMERICAL MODELLING OFX10CRMOVNB 9 10 (P91) STEEL REPAIR WELDINGLomozik M, Tasak E
III 1393
111 1401
111 1417
DISSIMILAR WELDED JOINTS WITHOUT A BUFFER AREAS OF STEEL III 1427TYPE 9CR WITH 1CRMOV TO BE USED FOR STEAM BOILER PIPELINESTasak E, Hernas A, Pasternak J, Fudali S
CREEP PROPERTIES OF HETEROGENEOUS P91/P23 WELDS AT550 AND 600 °CKubori Z, Vodärek V, Tou govä D
STRUCTURAL STABILITY OF HETEROGENEOUS WELD JOINT OF6CRMOV 8-3-2 AND X12CRMOV 10-1 STEELS WITH INCREASEDNITROGEN CONTENTForet R, Zlämal B, Sopodek J, Bufgfk J
111 1437
111 1449
Contributed napers: Oxidation and umtangs
OXIDATION OF CANDIDATE CHROMIUM STEELS IN STEAMENVIRONMENTCizner J, Hakl J
111 1461
OXIDE SCALE GROWTH AND SPALLATION IN STEAM ENVIRONMENTS III 1469– AN ASSESSMENT OF DIFFERENT MODELLING APPROACHESFry A T, Osgerby S
THE INFLUENCE OF OXIDATION ON LONG TERM CREEP RUPTURESTRENGTH DATAAllen D J, Harvey B
NEW EXPERIENCE IN THE FIELD OF APPLICATION OF CORROSIONRESISTANCE PROTECTION IN FLUE GAS DESULPHURISATION PLANTABSORBERSHernas A, Imosa M, Pasternak J, Fudali S
CORROSION AND OXIDATION EXPERIENCES IN AVEDØRE IIMULTIFUEL BOILERMontgomery M, Jensen S A, Biede 0, Larsen 0 H, Andersson A
III 1479
111 1491
111 1503
xx
111 1513HEAT EXCHANGER CORROSION IN BIOMASS AND COAL CO-FIREDPOWER PLANTSSimms N J, Kilgallon P J, Oakey J E
HOT CORROSION MONITORING OF ALLOY 617 IN MOLTENCHLORIDES USING ELECROCHEMICAL TECHNIQUESFeez, F J, Hierro M P, Nieto J
METAL WASTAGE IN LOW ALLOY STEELS UNDER ALTERNATINGATMOSPHERES AT ELEVATED TEMPERATUREOsgerby S, Gohil D D
DEVELOPMENT OF ALUMINIDE DIFFUSION COATINGS FOR HEATEXCHANGER MATERIALS AND THEIR CREEP-CORROSIONRESISTANCE IN SIMULATED COAL FIRING ENVIRONMENTRohr V, Weber T, Schütze M, Ennis P J, Quadakkers W J
111 1523
111 1533
III 1543
DEVELOPMENT AND VALIDATION OF ADVANCED OXIDATION 111 1553PROTECTIVE COATINGS FOR SUPER CRITICAL STEAM POWER PLANTHenderson M B, Scheefer M, Aguero A, Allcock B, Norton B, Tsipas D N,Durham R
IMPROVEMENT OF OXIDATION RESISTANCE OF TUBES BY PULSED
111 1571SILICONISINGMaile K, Berreth K, Lyutovich A
INFLUENCE OF SURFACE TREATMENT ON THE OXIDATION KINETICS III 1581OF ADVANCED STEELS IN FLOWING STEAM AT 650 °CKnoedler R, Straub S
LONG TERM STEAM OXIDATION RESISTANCE OF SHOT-BLASTED
III 1589STAINLESS STEEL TUBINGMinami Y, Fukui T
Contributed papers: Austenitics and Ni-base alloys
QUALIFICATION OF NI-BASED MATERIAL FOR TUBES AND PIPING OF III 1597700°C POWER PLANTKlenk A, Maile K, Theofel H, Heimrich A, Husemann R U, Lüdenbach G
AN INVESTIGATION ON STRUCTURE STABILITY AND ITSIMPROVEMENT ON A NEW DEVELOPMENTAL NI-CR-CO-MO-NB-TI-ALSUPERALLOY FOR USC POWER PLANT APPLICATION ATTEMPERATURE ABOVE 750°CXie X, Zhao G, Dong J, Smith G D, Baker B A, Patel S J
CHEMISTRY MODIFICATIONS OF INCONEL 706 FOR IMPROVEDMICROSTRUCTURAL STABILITYDel Genovese D, Mukherji D, Rösler J, Kindratschuk V, Wabderka N, Banhart J
111 1609
111 1619
xxi
CRACK GROWTH BEHAVIOUR OF WASPALOY AT 700°C IN DIFFERENT III 1629ATMOSPHERESPenkalla H J, Schubert F, Singheiser L
ASSESSMENT OF THE INFLUENCE OF LASER-DRILLED HOLES ON THE III 1639DAMAGE BEHAVIOUR OF ALLOY 617Mülders B, Wessel E, Schubert F
DEFORMATION BEHAVIOUR OF ALLOY INCONEL 617 TUBES IN THETEMPERATURE RANGE 600°C TO 850°CMakhele-Lekala L, Ennis P J, Schubert F
FIELD TESTING OF TP 347H FG AT ULTRA SUPERCRITICAL STEAMCONDITIONSHansson A N, Montgomery M
AN IMPROVED METHOD TO CALCULATE THE CREEP-FATIGUEENDURANCE OF TYPE 316H STAINLESS STEELSpindler M
WEB-ENABLED DATABASES OF JRC PETTEN-EFFECTIVE TOOLS FOREUROPEAN KNOWLEDGE MANAGEMENTOver H H, Dietz W
ADDENDUMThese papers arrived too Tate for reviewing and are reproduced as received
III 1651
III 1663
III 1673
III 1683
ADVANCED COATINGS FOR GAS TURBINES III 1696Nicholls J R, Bordenet B
APS-TBC FOR GAS TURBINES: FAILURE MODES, DAMAGE EVOLUTION III 1722AND LIFE-TIME ASSESSMENTHerzog R, Bednarz P, Trunova 0, Steinbrech R W, Wessel E, Quadakkers W J,Schubert F, Singheiser L
AUTHOR INDEX 1
KEYWORD INDEX VII


Part III
Advanced Steam Turbine Materials
Contributed Papers
M icrostructure

MICROSTRUCTURAL CHARACTERIZATION OF MODERN BORONCONTAINING 9-11 % CR STEELS DEVELOPED IN THE
FRAMEWORK OF THE COST PROGRAM
F. Kauffmann', K. H. Mayer, S. Straub 3 , G. Zies', C. Scheul'4,D. Willer i , H. Ruoff and K. Mailei
1 Materialprüfungsanstalt, University of Stuttgart, Stuttgart, GermanyEmail: [email protected]
2 Schwarzenbruck, Germany3 ALSTOM Power Generation AG, Mannheim, Germany
4 now at: Institute for Physical Metallurgy & Materials Testing, University of Leoben,Leoben, Austria
Abstract
New ferritic-martensitic 9-12 wt.% Cr steels for the usage in steam power plants are currently underdevelopment with the aim to further enhance the creep properties and thermal resistance of these materials.Those improved materials would allow higher steam inlet temperatures and pressures in the power plants.Thereby the thermal efficiency could be increased and the CO 2 emission decreased. One important method toimprove the creep properties is to control and optimize the microstructural features of the materials. In thepresent work, a combination of various microscopy techniques, ranging from optical microscopy to transmissionelectron microscopy, is used to investigate the microstructural features relevant for the creep-resistance. Theseinclude the quantitative measurement of the subgrain-size, the number of free dislocations, the chemicalcomposition and the crystallographic structure of the precipitates, as well as their density and size distribution.Small precipitations with a high precipitation density and especially a high thermal stability are of great benefitto improve the creep strength. The results of these investigations an new boron containing 9-11 % Cr steelsinvestigated within the COST program are presented.
Keywords: creep resistance, precipitation analysis, Z-phase, TEM
Introduction
During the last decades new ferritic-martensitic 9-12 wt. % Cr steels for modern steam powerplants were developed with the aim to raine the steam inlet temperature from 540 - 550 °C upto temperatures of 600 - 650 °C [1]. This increased inlet temperature would lead to asignificantly improved rate of efficiency and reduced CO 2 emission. The traditionally usedX20(2)CrMoV-12-1 has been improved with the development of 9-12 % CrMo(W)VNbNsteels yielding a significantly enhanced creep resistance. This improvement has its origin in athermally stabilised M23C6, vanadium and niobium carbonitrides and the precipitation of theLaves phase. These steels are already applied in nearly 30 power stations, operating atmaximum steam inlet temperatures of 610 °C. Typical examples for these steels are theX10CrMoVNbN-9-1 (P91), X12CrMoVNbN-10-1 and X12CrMoWVNbN-10-1-1 (E911) [1].
For a further stabilization of the M23C6 precipitates 30 to 100 ppm boron has been added tothe 9 wt.% Cr steels. The nitrogen content has to be reduced in these cases to avoid theformation of primary boron nitride an the expense of vanadium carbonitrides. These boronsteels are suited for applications up to 625 °C [1]. Alloys representing this seconddevelopment step are XI OCrWMoVNbNB-9-2 (P92) and X14CrMoVNbB-9-1 (FB2). Recentresearch results suggest that the creep properties can be further improved by increasing theboron content and adjusting the nitrogen content accordingly. This should lead to an increasedamount of fine vanadium carbonitrides and prevent the formation of boron nitride at the sametime [2, 3].
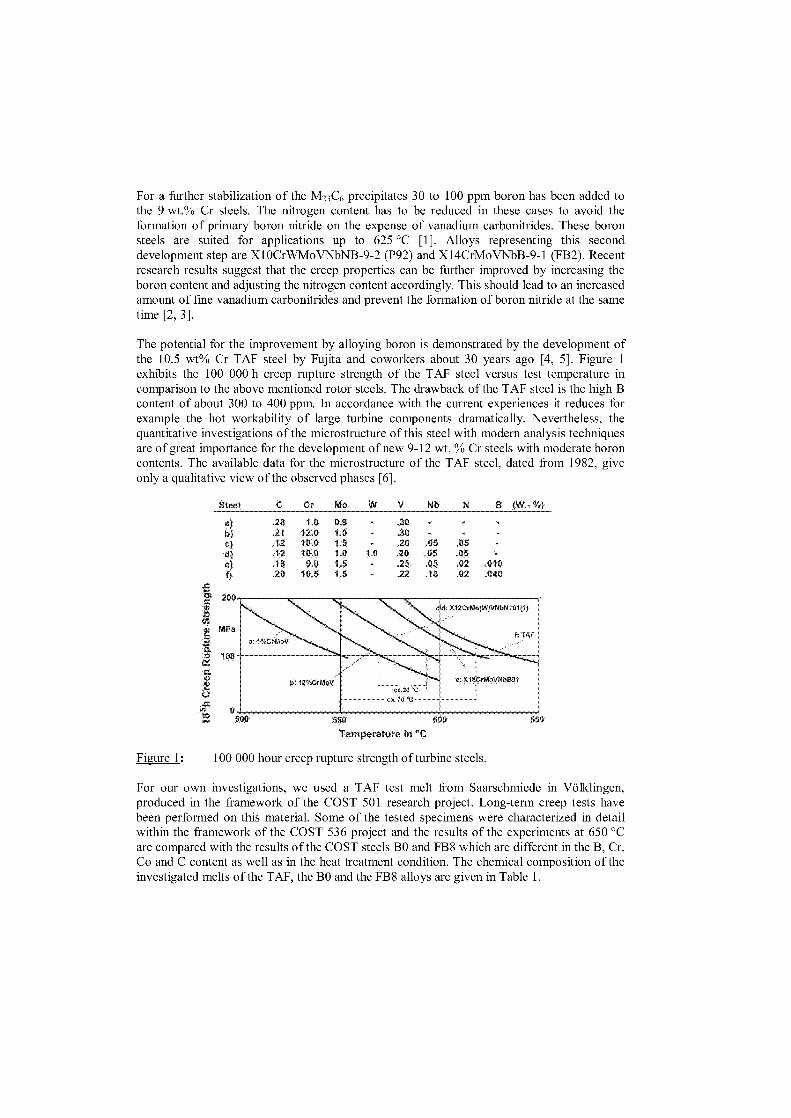
The potential for the improvement by alloying boron is demonstrated by the development ofthe 10.5 wt% Cr TAF steel by Fujita and coworkers about 30 years ago [4, 5]. Figure 1exhibits the 100 000 h creep rupture strength of the TAF steel versus test temperature incomparison to the above mentioned rotor steels. The drawback of the TAF steel is the high Bcontent of about 300 to 400 ppm. In accordance with the current experiences it reduces forexample the hot workability of large turbine components dramatically. Nevertheless, thequantitative investigations of the microstructure of this steel with modern analysis techniquesare of great importance for the development of new 9-12 wt. % Cr steels with moderate boroncontents. The available data for the microstructure of the TAF steel, dated from 1982, giveonly a qualitative view of the observed phases [6].
Steel V Nb B (W.•
a) .28 1.0 0.9 .30b) .21 12.0 1.0 .30c) .12 10.0 1.5 20 .05 .05d) .12 10.0 1.0 1.0 .20 .05 .05 -e) .18 9.0 1.5 .25 .05 .02 .010
0 .20 10.5 1.5 .22 .15 .02
teure 1: 100 000 hour creep rupture strength of turbine steels.
For our own investigations, we used a TAF test melt from Saarschmiede in Völldingen,produced in the framework of the COST 501 research project. Long-term creep tests havebeen performed an this material. Some of the tested specimens were characterized in detailwithin the framework of the COST 536 project and the results of the experiments at 650 °Care compared with the results of the COST steels BO and FB8 which are different in the B, Cr,Co and C content as well as in the heat treatment condition. The chemical composition of theinvestigated melts of the TAF, the BO and the FB8 alloys are given in Table 1.
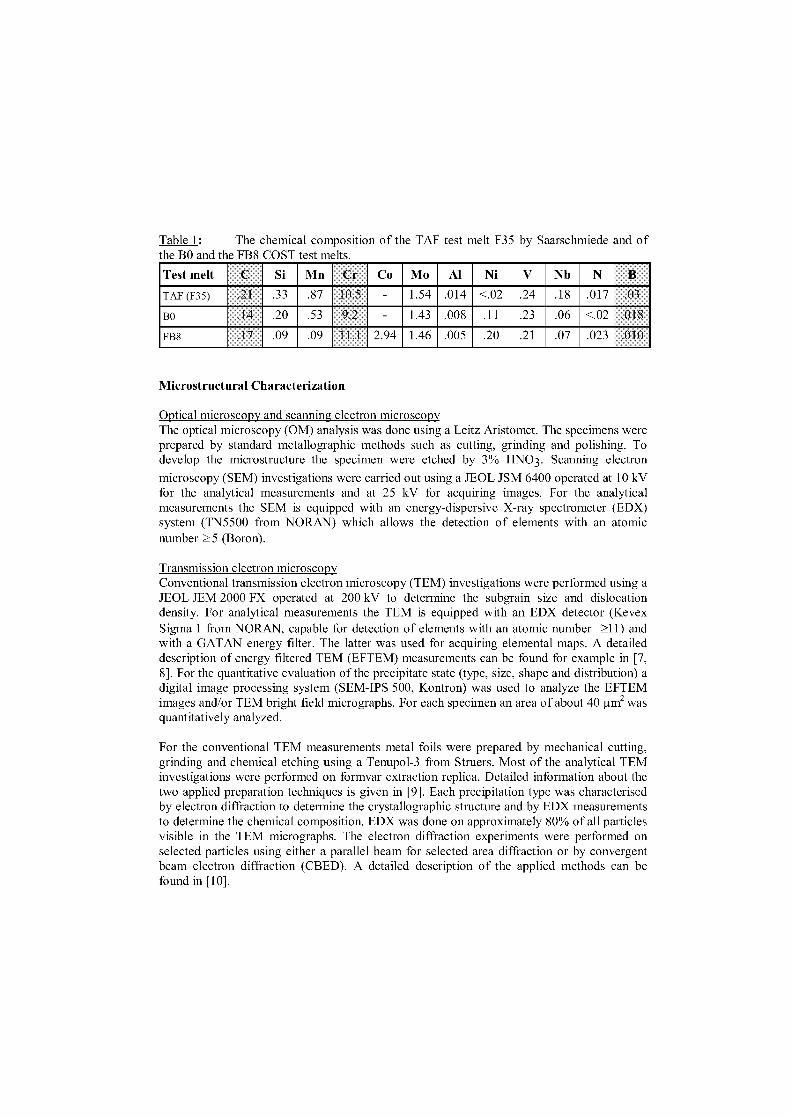
Table 1: The chemical composition of the TAF test melt F35 by Saarschmiede and ofthe BO and the FB8 COST test melts.
Test melt C Si Mn Cr Co Mo Al Ni V Nb N
TAF (F35) .21 .33 .87 10.5 - 1.54 .014 <.02 .24 .18 .017 .03
BO .14 .20 .53 9.2 - 1.43 .008 .11 .23 .06 <.02 .018
FB8 .17 .09 .09 11.1 2.94 1.46 .005 .20 .21 .07 .023 .010
Microstructural Characterization
Optical microscopy and scanning electron microscopyThe optical microscopy (OM) analysis was done using a Leitz Aristomet. The specimens wereprepared by standard metallographic methods such as cutting, grinding and polishing. Todevelop the microstructure the specimen were etched by 3% HNO3. Scanning electron
microscopy (SEM) investigations were carried out using a JEOL JSM 6400 operated at 10 kVfor the analytical measurements and at 25 kV for acquiring images. For the analyticalmeasurements the SEM is equipped with an energy-dispersive X-ray spectrometer (EDX)system (TN5500 from NORAN) which allows the detection of elements with an atomicnumber 5 (Boron).
Transmission electron microscopyConventional transmission electron microscopy (TEM) investigations were performed using aJEOL JEM 2000 FX operated at 200 kV to determine the subgrain size and dislocationdensity. For analytical measurements the TEM is equipped with an EDX detector (KevexSigma 1 from NORAN, capable for detection of elements with an atomic number �11) andwith a GATAN energy filter. The latter was used for acquiring elemental maps. A detaileddescription of energy filtered TEM (EFTEM) measurements can be found for example in [7,8]. For the quantitative evaluation of the precipitate state (type, size, shape and distribution) adigital image processing system (SEM-IPS 500, Kontron) was used to analyze the EFTEMimages and/or TEM bright field micrographs. For each specimen an area of about 40 gm 2 wasquantitatively analyzed.
For the conventional TEM measurements metal foils were prepared by mechanical cutting,grinding and chemical etching using a Tenupol-3 from Struers. Most of the analytical TEMinvestigations were performed on formvar extraction replica. Detailed information about thetwo applied preparation techniques is given in [9]. Each precipitation type was characterisedby electron diffraction to determine the crystallographic structure and by EDX measurementsto determine the chemical composition. EDX was done on approximately 80% of all particlesvisible in the TEM micrographs. The electron diffraction experiments were performed onselected particles using either a parallel beam for selected area diffraction or by convergentbeam electron diffraction (CBED). A detailed description of the applied methods can befound in [10].
r Mn Ca Ni Harrt TrontrnnntA TAF 21 33 S7 /0 5 1.56 - 24 18 017 0.30 014 181150`C,011 .s211 700.0 070M%
u 1.. 10 9.Z 150 • .11 .27.04:5 0;.: 018.008 4h1090'C'011.4h 730 . 0 08 iMP4q F13 g oe 99 111 14F.. 2 94 20 21.070 MV. .010 005 4h1/00"Ce1+10h576 . C.1011120°C 718MPa
Test material
For the microstructural investigations material in the initial state and creep-ruptured samplestested at 650 °C were used. The creep test of the TAF steel has been performed at 650 °C witha load of 100 MPa which lead to failure alter 26 931 hours. The BO material has been tested at650 °C for 18 788 h with a load of 80 MPa, the FB8 steel has been tested at 650 °C for19436 h with a load of 70 MPa. The chemical composition of the test melts, the heattreatment data and the 0.2 limit at RT alter heat treatment of the samples TAF, BO and FB8are presented along with the creep data for these two alloys in Figure 2. The heat treatment ofthe TAF steel is typical for bars which are used for the manufacturing of blades and bolts.The heat treatment of the Steels BO and FB8 represents the heat treatment procedure of largeforgings.
taire 650°C300
200
rn(7, 100
80
60
teure 2:
40
30100 1 000 10 000 100 000
Tim hCreep resistance of the TAF, the BO and the FB8 steels tested at 650 °C.
As no initial material was available for the microstructural characterization of the TAFspecimen, the original heat treatment has been applied again to one specimen head of theSample. The hardness values obtained alter heat treatment are in accordance with the tensilestrength during the initial tests, which suggests that the initial state was successfullyreproduced.
Results
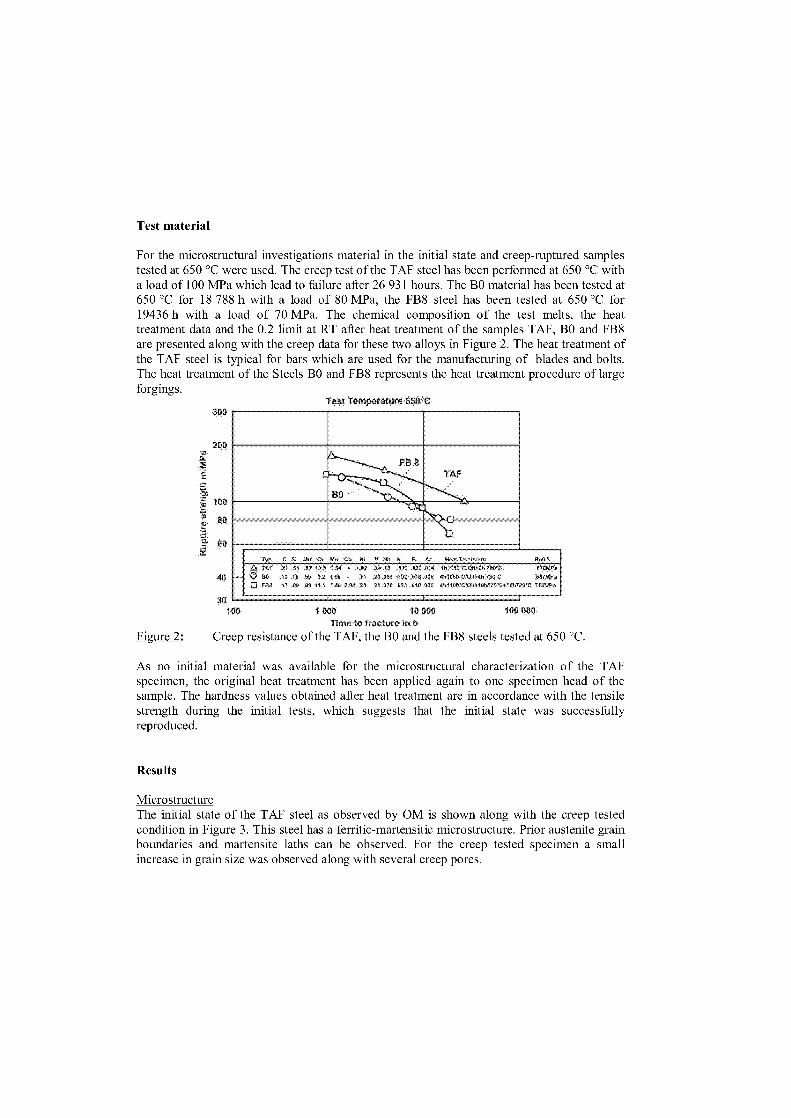
MicrostructureThe initial state of the TAF steel as observed by OM is shown along with the creep testedcondition in Figure 3. This steel has a ferritic-martensitic microstructure. Prior austenite grainboundaries and martensite laths can be observed. For the creep tested specimen a smallincrease in grain size was observed along with several creep pores.
Nzr,r-7J
figure UM Images of the 1A1, inatenal in the initial state and alter creep.
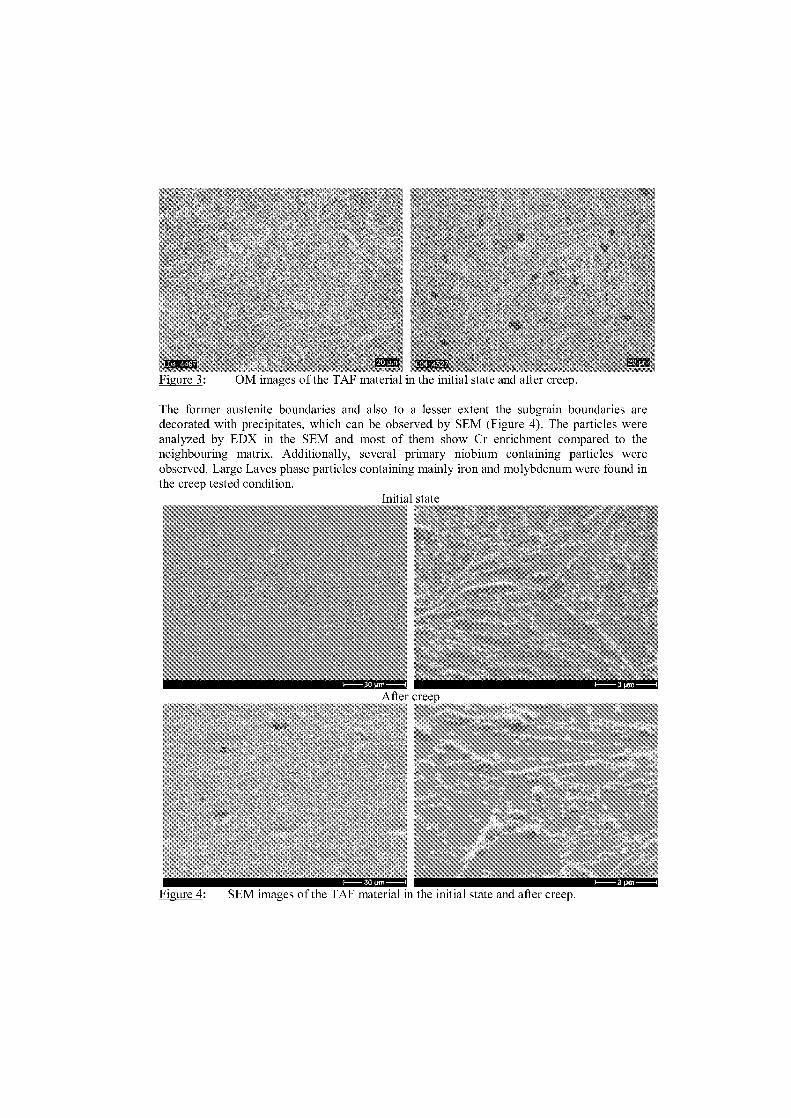
The former austenite boundaries and also to a lesser extent the subgrain boundaries aredecorated with precipitates, which can be observed by SEM (Figure 4). The particles wereanalyzed by EDX in the SEM and most of them show Cr enrichment compared to theneighbouring matrix. Additionally, several primary niobium containing particles wereobserved. Large Laves phase particles containing mainly iron and molybdenum were found inthe creep tested condition.
Initial state
—4
gm
Figure 4: SEM images of the TAF material in the initial state and alter creep.
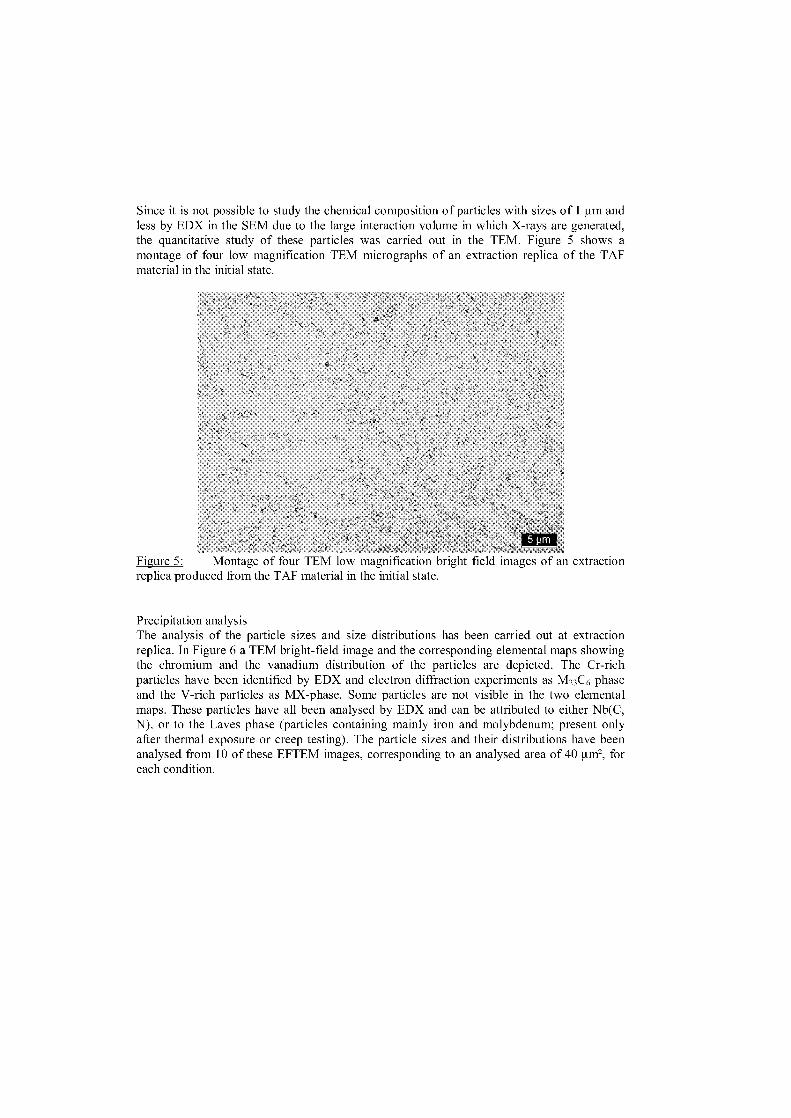
Since it is not possible to study the chemical composition of particles with sizes of 1 p.m andless by EDX in the SEM due to the large interaction volume in which X-rays are generated,the quantitative study of these particles was carried out in the TEM. Figure 5 shows amontage of four low magnification TEM micrographs of an extraction replica of the TAFmaterial in the initial state.
Figure 5: Montage of four TEM low magnification bright field images of an extractionreplica produced from the TAF material in the initial state.
Precipitation analysisThe analysis of the particle sizes and size distributions has been carried out at extractionreplica. In Figure 6 a TEM bright-field image and the corresponding elemental maps showingthe chromium and the vanadium distribution of the particles are depicted. The Cr-richparticles have been identified by EDX and electron diffraction experiments as M23C6 phaseand the V-rich particles as MX-phase. Some particles are not visible in the two elementalmaps. These particles have all been analysed by EDX and can be attributed to either Nb(C,N), or to the Laves phase (particles containing mainly fron and molybdenum; present onlyafter thermal exposure or creep testing). The particle sizes and their distributions have beenanalysed from 10 of these EFTEM images, corresponding to an analysed area of 401.1m 2, foreach condition.
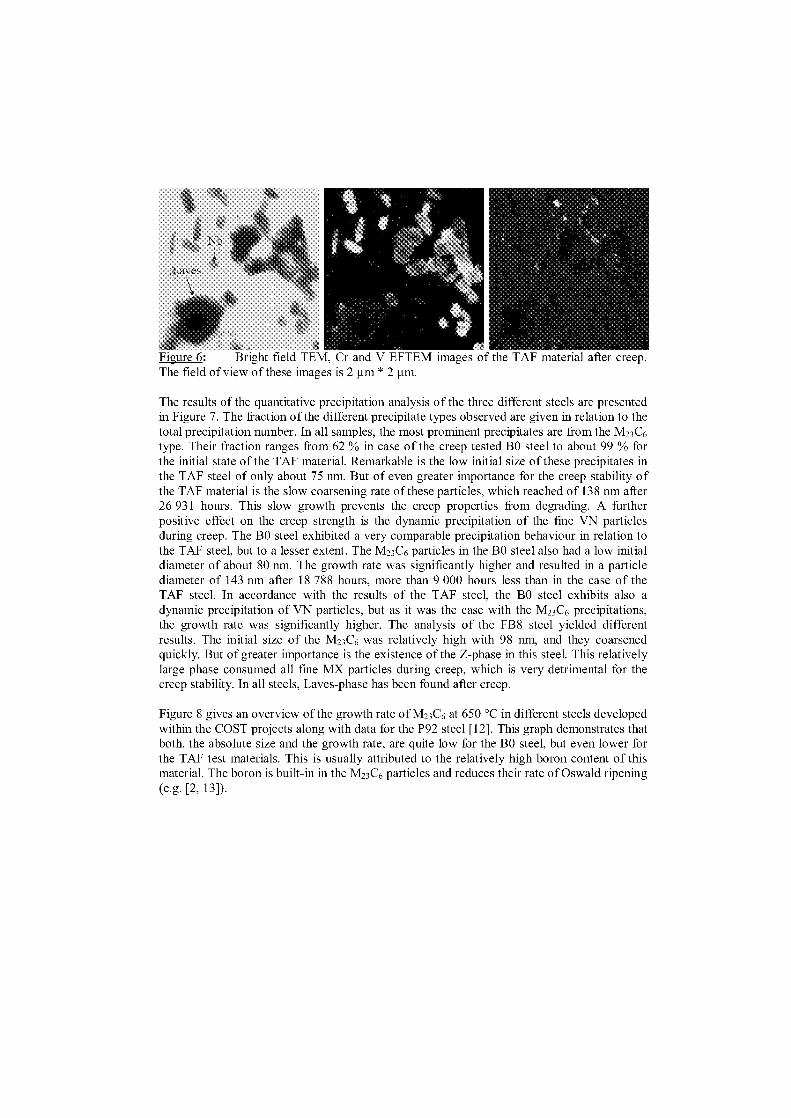
jgure 6: Bright field TEM, Cr and V EFTEM Images of the TAF material after creep.The field of view of these images is 2 pin * 2 pm.
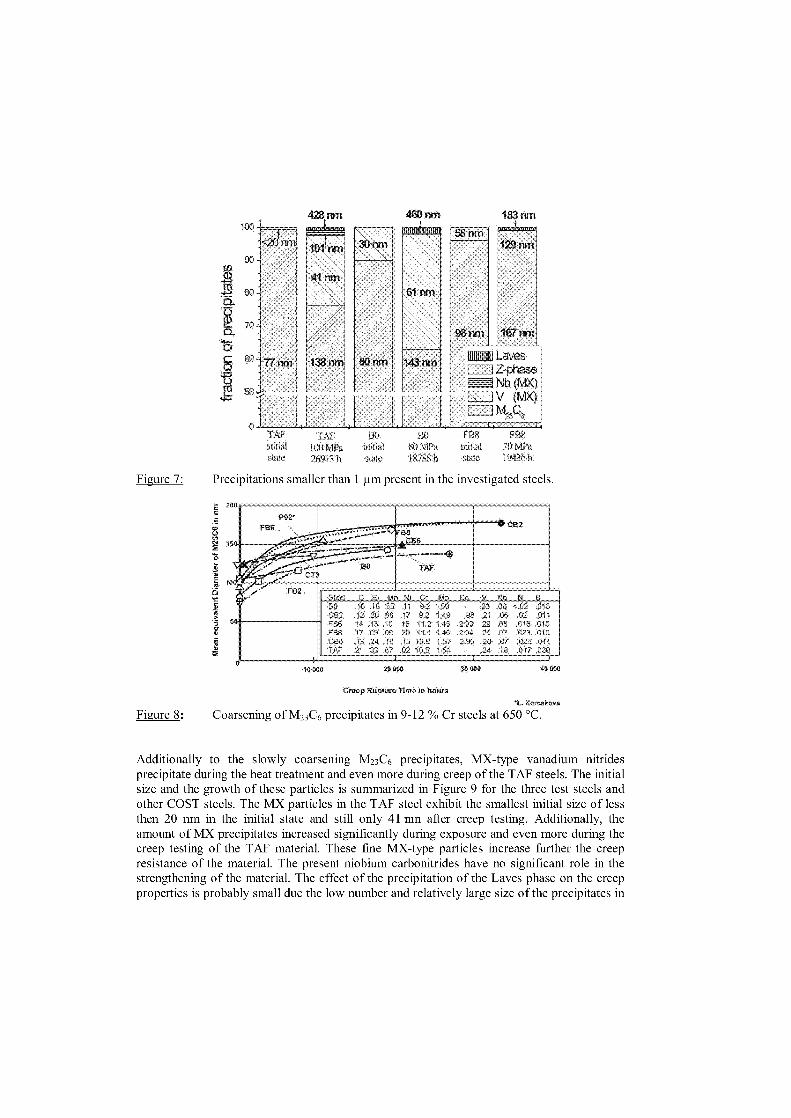
The results of the quantitative precipitation analysis of the three different steels are presentedin Figure 7. The fraction of the different precipitate typen observed are given in relation to thetotal precipitation number. In all Samples, the most prominent precipitates are from the M23C6type. Their fraction ranges from 62 % in case of the creep tested BO steel to about 99 % forthe initial state of the TAF material. Remarkable is the low initial size of these precipitates inthe TAF steel of only about 75 nm. But of even greater importance for the creep stability ofthe TAF material is the slow coarsening rate of these particles, which reached of 138 nm alter26 931 hours. This slow growth prevents the creep properties from degrading. A furtherpositive effect an the creep strength is the dynamic precipitation of the fine VN particlesduring creep. The BO steel exhibited a very comparable precipitation behaviour in relation tothe TAF steel, but to a lesser extent. The M23C6 particles in the BO steel also had a low initialdiameter of about 80 nm. The growth rate was significantly higher and resulted in a particlediameter of 143 nm after 18 788 hours, more than 9 000 hours less than in the case of theTAF steel. In accordance with the results of the TAF steel, the BO steel exhibits also adynamic precipitation of VN particles, but as it was the case with the M23C6 precipitations,the growth rate was significantly higher. The analysis of the FB8 steel yielded differentresults. The initial size of the M23C6 was relatively high with 98 nm, and they coarsenedquickly. But of greater importance is the existence of the Z-phase in this steel. This relativelylarge phase consumed all fine MX particles during creep, which is very detrimental for thecreep stability. In all steels, Laves-phase has been found after creep.
Figure 8 gives an overview of the growth rate of M23C6 at 650 °C in different steels developedwithin the COST projects along with data for the P92 steel [12]. This graph demonstrates thatboth, the absolute size and the growth rate, are quite low for the BO steel, but even lower forthe TAF test materials. This is usually attributed to the relatively high boron content of thismaterial. The boron is built-in in the M23C6 particles and reduces their rate of Oswald ripening(e.g. [2, 13]).
TAFinitial
FI38ini0a1
130TAF100 Nfl'a26913 0
80 NIPa18788 h
428 run
matrtnim 5s3 nin
lb
41 nm6 nm
98 rrn
77 rm 138 nm 143 nm111111111111
167 nm
La es
NbV i rvi>,;)" .
1713Nll'a
; 4436
90
Figure 7: Precipitations smaller than 1 present in the investigated steels.
ro Mn V Nb N R BO 10 .18 .55 11 9.2 1.50 .23 06 <.02 .018C92 .12 .20 88 .17 9.2 !!!!! 2 .0f, 02 .011, B6 .14 .13 .10 15 11.2 1.45 3 .013<08 .17 09 09 20 11.1 1.49 2 ;• 023 010C96 .13 .24 .19 .15 10.9 1.57 2.90 .20 .07 .020 .011TAF 21 33 97 .02 10.5 1 54 - 24 19 017 030
0 i0i2 20 000 30 ma 40 000
'creep Rupture Time in hoursKercakeva
Figure 8:
Coarsening of M23C6 precipitates in 9-12 % Cr steels at 650 °C.
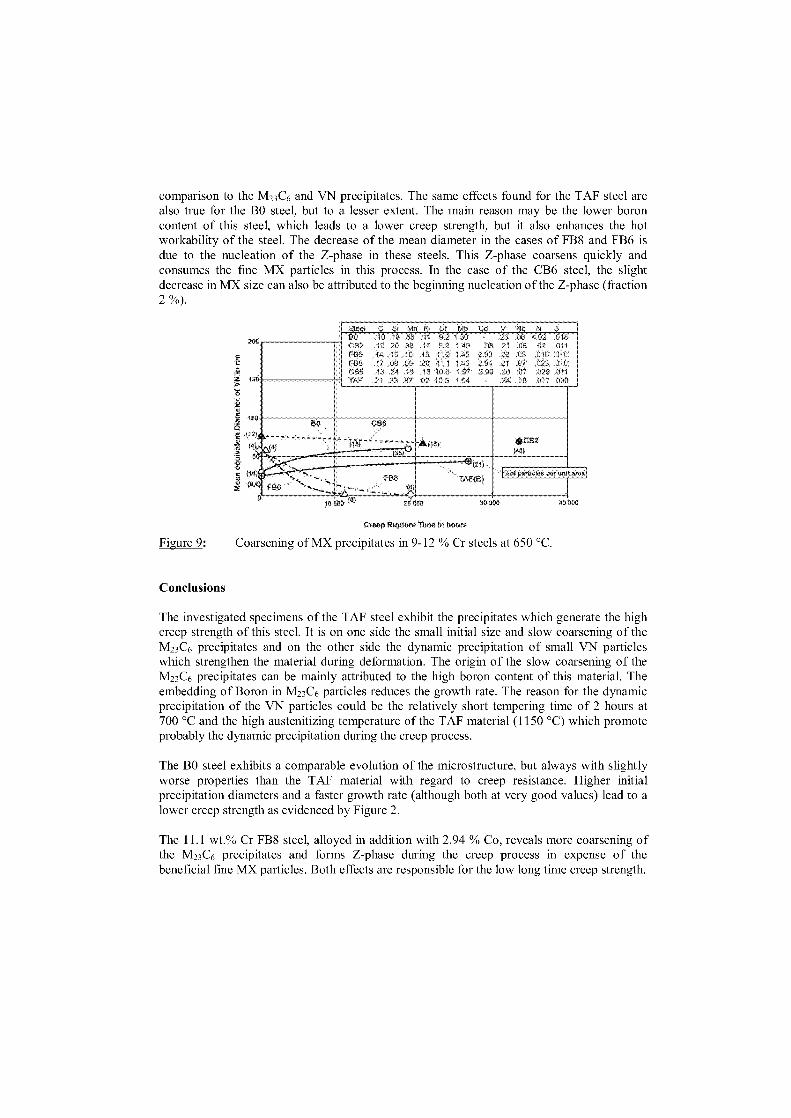
Additionally to the slowly coarsening M23C6 precipitates, MX-type vanadium nitridesprecipitate during the heat treatment and even more during creep of the TAF steels. The initialsize and the growth of these particles is summarized in Figure 9 for the three test steels andother COST steels. The MX particles in the TAF steel exhibit the smallest initial size of lessthen 20 nm in the initial state and still only 41 nm alter creep testing. Additionally, theamount of MX precipitates increased significantly during exposure and even more during thecreep testing of the TAF material. These fine MX-type particles increase further the creepresistance of the material. The present niobium carbonitrides have no significant role in thestrengthening of the material. The effect of the precipitation of the Laves phase an the creepproperties is probably Small due the low number and relatively large size of the precipitates in
02
Stee( C S1 Mn Ni Cr Mo Cö Nb N BBO 10 18 55 11 9 2 1 50 .06CB212 .2 .88 17 9.2 1 49 95 .21 OSFB6 14 13 10 15 11 2 145 2.93 22 08FB8 17 09 09 20 111 1 46 2.94 21 07
13 24 ' .57 2.90 .20 Atü 0'11.54 - 24 h3(
200
( )
TAF(8)
comparison to the M23C6 and VN precipitates. The same effects found for the TAF steel arealso true for the BO steel, but to a lesser extent. The main reason may be the lower boroncontent of this steel, which leads to a lower creep strength, but it also enhances the hotworkability of the steel. The decrease of the mean diameter in the cases of FB8 and FB6 isdue to the nucleation of the Z-phase in these steels. This Z-phase coarsens quickly andconsumes the fine MX particles in this process. In the case of the CB6 steel, the slightdecrease in MX size can also be attributed to the beginning nucleation of the Z-phase (fraction2 %).
Creep Rupiu , ree in hours
teure 9:
Coarsening of MX precipitates in 9-12 % Cr steels at 650 °C.
Conclusions
The investigated specimens of the TAF steel exhibit the precipitates which generate the highcreep strength of this steel. It is on one side the small initial size and slow coarsening of theM23C6 precipitates and on the other side the dynamic precipitation of small VN particleswhich strengthen the material during deformation. The origin of the slow coarsening of theM23C6 precipitates can be mainly attributed to the high boron content of this material. Theembedding of Boron in M23C6 particles reduces the growth rate. The reason for the dynamicprecipitation of the VN particles could be the relatively short tempering time of 2 hours at700 °C and the high austenitizing temperature of the TAF material (1150 °C) which promoteprobably the dynamic precipitation during the creep process.
The BO steel exhibits a comparable evolution of the microstructure, but always with slightlyworse properties than the TAF material with regard to creep resistance. Higher initialprecipitation diameters and a faster growth rate (although both at very good values) lead to alower creep strength as evidenced by Figure 2.
The 11.1 wt.% Cr FB8 steel, alloyed in addition with 2.94 % Co, reveals more coarsening ofthe M23C6 precipitates and forms Z-phase during the creep process in expense of thebeneficial fine MX particles. Both effects are responsible for the low Jong time creep strength.
AcknowledgementThe authors wish to thank their partners of the COST projects for the creep test specimens andDr. Wang from the University of Darmstadt for the additional heat treatment for reproducingthe initial state of the TAF material. Thanks are also extended to the German COST partnersand to the German Government for the financial support of the investigations.
Literature
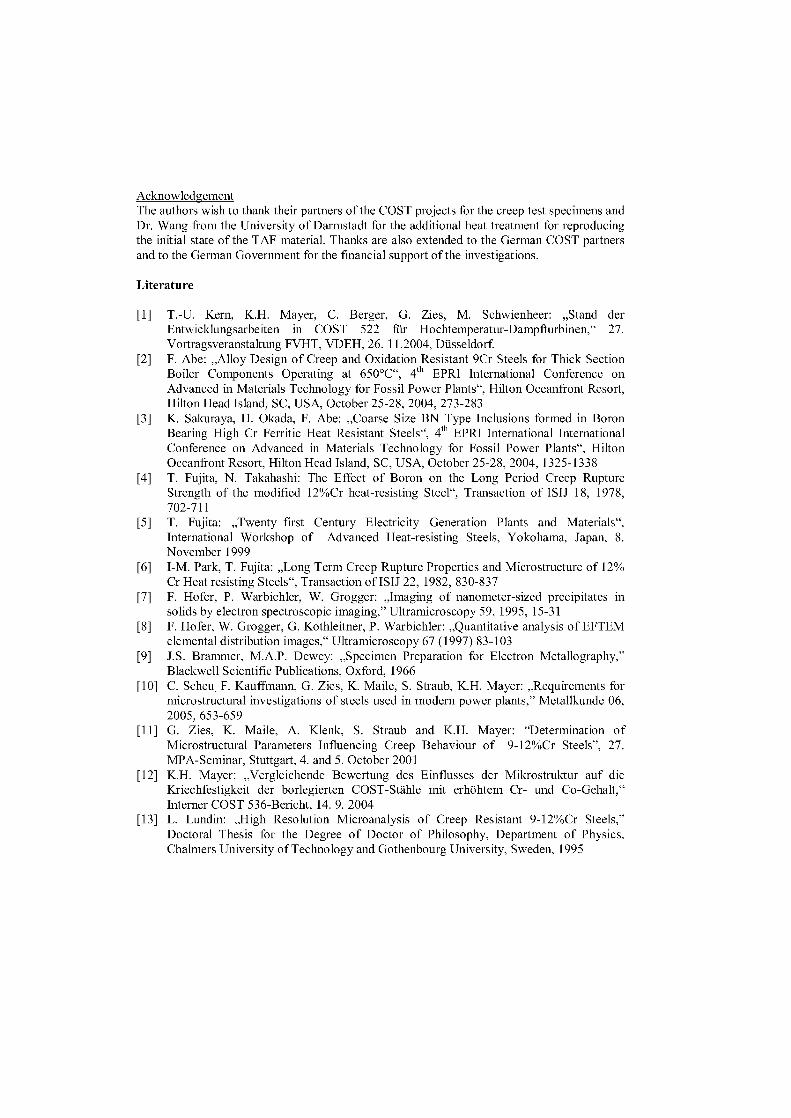
[1] T.-U. Kern, K.H. Mayer, C. Berger, G. Zies, M. Schwienheer: „Stand derEntwicklungsarbeiten in COST 522 für Hochtemperatur-Dampfturbinen," 27.Vortragsveranstaltung FVHT, VDEH, 26. 11.2004, Düsseldorf.
[2] F. Abe: „Alloy Design of Creep and Oxidation Resistant 9Cr Steels for Thick SectionBoiler Components Operating at 650°C", 4th EPRI International Conference onAdvanced in Materials Technology for Fossil Power Plants", Hilton Oceanfront Resort,Hilton Head Island, SC, USA, October 25-28, 2004, 273-283
[3] K. Sakuraya, H. Okada, F. Abe: „Coarse Size BN Type Inclusions formed in BoronBearing High Cr Ferritic Heat Resistant Steels", 4th EPRI International InternationalConference on Advanced in Materials Technology for Fossil Power Plants", HiltonOceanfront Resort, Hilton Head Island, SC, USA, October 25-28, 2004, 1325-1338
[4] T. Fujita, N. Takahashi: The Effect of Boron on the Long Period Creep RuptureStrength of the modified 12%Cr heat-resisting Steel", Transaction of ISIJ 18, 1978,702-711
[5] T. Fujita: „Twenty–first Century Electricity Generation Plants and Materials",International Workshop of Advanced Heat-resisting Steels, Yokohama, Japan, 8.November 1999
[6] I-M. Park, T. Fujita: „Long Term Creep Rupture Properties and Microstructure of 12%Cr Heat resisting Steels", Transaction of ISIJ 22, 1982, 830-837
[7] F. Hofer, P. Warbichler, W. Grogger: „Imaging of nanometer-sized precipitates insolids by electron spectroscopic imaging," Ultramicroscopy 59, 1995, 15-31
[8] F. Hofer, W. Grogger, G. Kothleitner, P. Warbichler: „Quantitative analysis of EFTEMelemental distribution images," Ultramicroscopy 67 (1997) 83-103
[9] J.S. Brammer, M.A.P. Dewey: „Specimen Preparation for Electron Metallography,"Blackwell Scientific Publications, Oxford, 1966
[10] C. Scheu, F. Kauffmann, G. Zies, K. Maile, S. Straub, K.H. Mayer: „Requirements formicrostructural investigations of steels used in modern power plants," Metallkunde 06,2005, 653-659
[11] G. Zies, K. Maile, A. Klenk, S. Straub and K.H. Mayer: "Determination ofMicrostructural Parameters Influencing Creep Behaviour of 9-12%Cr Steels", 27.MPA-Seminar, Stuttgart, 4. and 5. October 2001
[12] K.H. Mayer: „Vergleichende Bewertung des Einflusses der Mikrostruktur auf dieKriechfestigkeit der borlegierten COST-Stähle mit erhöhtem Cr- und Co-Gehalt,"Interner COST 536-Bericht, 14. 9. 2004
[13] L. Lundin: „High Resolution Microanalysis of Creep Resistant 9-12%Cr Steels,"Doctoral Thesis for the Degree of Doctor of Philosophy, Department of Physics,Chalmers University of Technology and Gothenbourg University, Sweden, 1995
QUANTITATIVE MICROSTRUCTURAL ANALYSIS ON THE STABILITY OF MXAND M2X IN 9-12% Cr STEELS BY AFM, SEM AND TEM
T. Seibert*, K. Durst, H. Chilukuru, M. Göken
* Framatome ANP GmbH, Freyeslebenstr. 1, 91058 Erlangen, GermanyUniversity Erlangen-Nürnberg, General Material Properties, Martensstr. 5, 91058 Erlangen,
Germanydurst(d,ww.uni-erlangen.de
Abstract
The evaluation of mean diameter and volume fraction of individual phases with the analysis of carbon extraction
replica has been studied on 9-12% Cr steels. Moreover, the thermal stability of MX and M2X phase to coarsen-
ing has been studied in annealing experiments. Extraction replicas were analyzed by SEM and TEM. In order to
compare information obtained from different high resolution microscopic techniques, atomic force microscopy
(AFM), scanning electron microcopy (SEM) and transmission electron microscopy (TEM) were used to analyze
the same area on a TEM thin foil, as prepared by jet polishing. It turned out that the particle size distribution
from all techniques is relatively similar. Furthermore it is found, that in an extraction replica, the information
depth is approximately given by the mean diameter of the individual phase. By considering the mean diameter of
the individual phase, its volume fraction can thus be quantified within certain limits. In the annealing experi-
ments at 700°C it is found, that M 2X is found at subgrain boundaries and coarsens quite rapidly. While Z-phase
nucleation is detected it does not occur in expense of carbonitrides.
1 Introduction
9-12% Cr-steels play an important role in Gas and Steam Power Plants and have been focusof several research programs [3]. Two important aspects of the material behaviour are thehigh temperature stability and the resistance to creep deformation. The materials have a goodcreep resistance mainly due to the tempered martensite structure and precipitation hardening.As the creep and deformation behavior are directly correlated with the evolution of the micro-structure the characterization of the precipitate and dislocation structure is of great importancefor understanding and improving the creep resistance of these materials. The present paperfocuses on the quantification of the particle size distribution of individual phases and theirlong term stability. Within the frame of a research program both ageing experiments and mi-crostructural analyses were performed on the model alloys 1A and 5E. The microstructurewas analyzed with Transmission Electron Microscopy (TEM) using extraction replica andthin foil as well as Atomic Force Microscopy (AFM) and Scanning Electron Microscopy(SEM). Aim of these investigations was to gain more information about the extraction replicaprocess and the determination of the volume fraction of precipitates from replicas. The nu-cleation of Z-phase and the subsequent loss in precipitation hardening in grain interior is con-sidered to be one of the main reasons for the degradation in creep resistance in 9-12% Crsteels [2,6,7]. Therefore, the stability of alloys containing MX and M 2X phase was studied inan annealing experiment at 700°C.
1
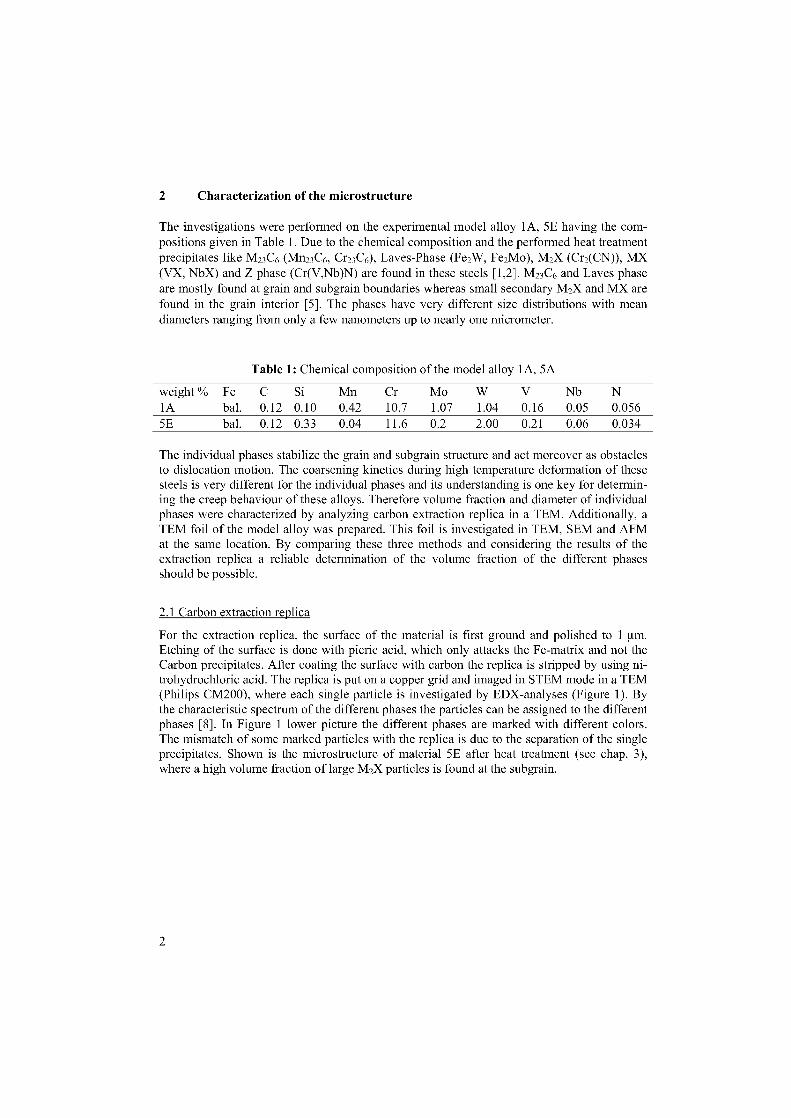
2 Characterization of the microstructure
The investigations were performed on the experimental model alloy 1A, 5E having the com-positions given in Table 1. Due to the chemical composition and the performed heat treatmentprecipitates like M23C6 (Mn23 C6, Cr23C6), Laves-Phase (Fe2W, Fe2Mo), M2X (Cr2(CN)), MX(VX, NbX) and Z phase (Cr(V,Nb)N) are found in these steels [1,2]. M23C6 and Laves phaseare mostly found at grain and subgrain boundaries whereas Small secondary M 2X and MX arefound in the grain interior [5]. The phases have very different size distributions with meandiameters ranging from only a few nanometers up to nearly one micrometer.
Table 1: Chemical composition of the model alloy 1A, 5A
weight % Fe C Si Mn Cr Mo W V Nb N lA bal. 0.12 0.10 0.42 10.7 1.07 1.04 0.16 0.05 0.056 5E bal. 0.12 0.33 0.04 11.6 0.2 2.00 0.21 0.06 0.034
The individual phases stabilize the grain and subgrain structure and act moreover as obstaclesto dislocation motion. The coarsening kinetics during high temperature deformation of thesesteels is very different for the individual phases and its understanding is one key for determin-ing the creep behaviour of these alloys. Therefore volume fraction and diameter of individualphases were characterized by analyzing carbon extraction replica in a TEM. Additionally, aTEM foil of the model alloy was prepared. This foil is investigated in TEM, SEM and AFMat the same location. By comparing these three methods and considering the results of theextraction replica a reliable determination of the volume fraction of the different phasesshould be possible.
2.1 Carbon extraction replica
For the extraction replica, the surface of the material is first ground and polished to 1 um.Etching of the surface is done with picric acid, which only attacks the Fe-matrix and not theCarbon precipitates. After coating the surface with carbon the replica is stripped by using ni-trohydrochloric acid. The replica is put on a copper grid and imaged in STEM mode in a TEM(Philips CM200), where each single particle is investigated by EDX-analyses (Figure 1). Bythe characteristic spectrum of the different phases the particles can be assigned to the differentphases [8]. In Figure 1 lower picture the different phases are marked with different colors.The mismatch of some marked particles with the replica is due to the Separation of the singleprecipitates. Shown is the microstructure of material 5E after heat treatment (see chap. 3),where a high volume fraction of large M2X particles is found at the subgrain.
2
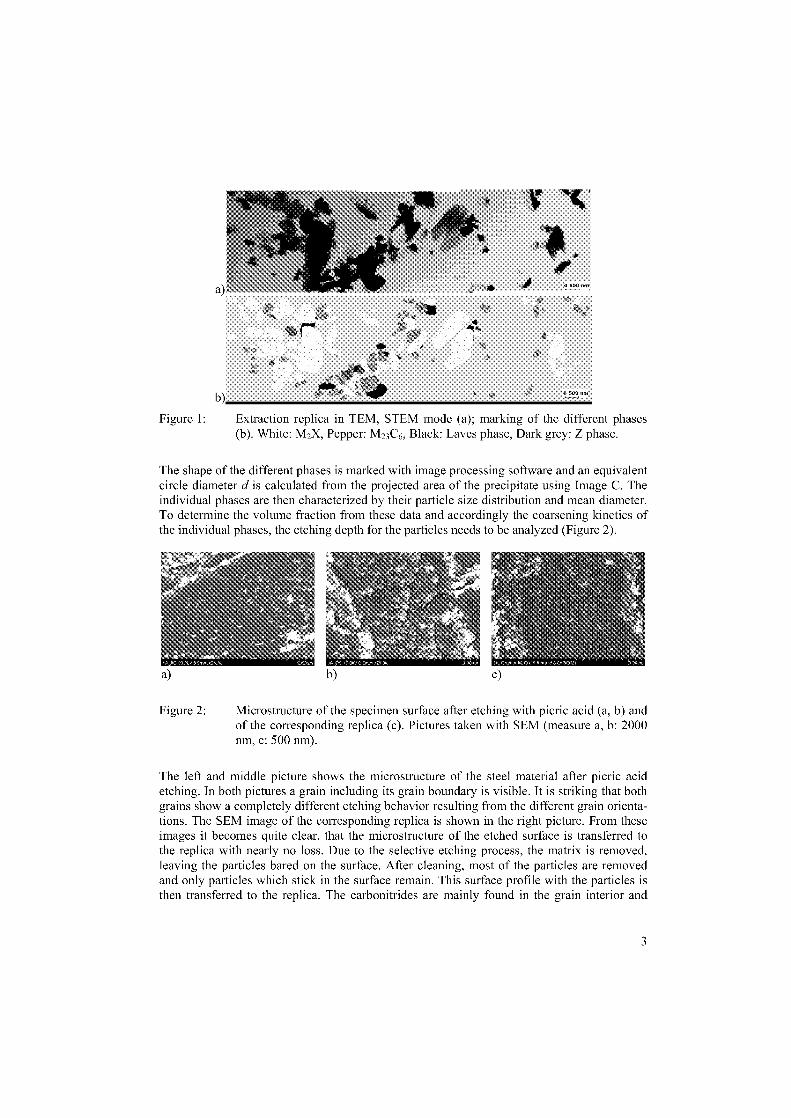
b)0 599 nm
Figure 1: Extraction replica in TEM, STEM mode (a); marking of the different phases(b). White: M2X, Pepper: M23C6, Black: Laves phase, Dark grey: Z phase.
The shape of the different phases is marked with image processing software and an equivalentcircle diameter d is calculated from the projected area of the precipitate using Image C. Theindividual phases are then characterized by their particle size distribution and mean diameter.To determine the volume fraction from these data and accordingly the coarsening kinetics ofthe individual phases, the etching depth for the particles needs to be analyzed (Figure 2).
Figure 2: Microstructure of the specimen surface after etching with picric acid (a, b) andof the corresponding replica (c). Pictures taken with SEM (measure a, b: 2000nm, c: 500 nm).
The left and middle picture Shows the microstructure of the steel material after picric acidetching. In both pictures a grain including its grain boundary is visible. It is striking that bothgrains show a completely different etching behavior resulting from the different grain orienta-tions. The SEM image of the corresponding replica is shown in the right picture. From theseimages it becomes quite clear, that the microstructure of the etched surface is transferred tothe replica with nearly no loss. Due to the selective etching process, the matrix is removed,leaving the particles bared an the surface. After cleaning, most of the particles are removedand only particles which stick in the surface remain. This surface profile with the particles isthen transferred to the replica. The carbonitrides are mainly found in the grain interior and
3
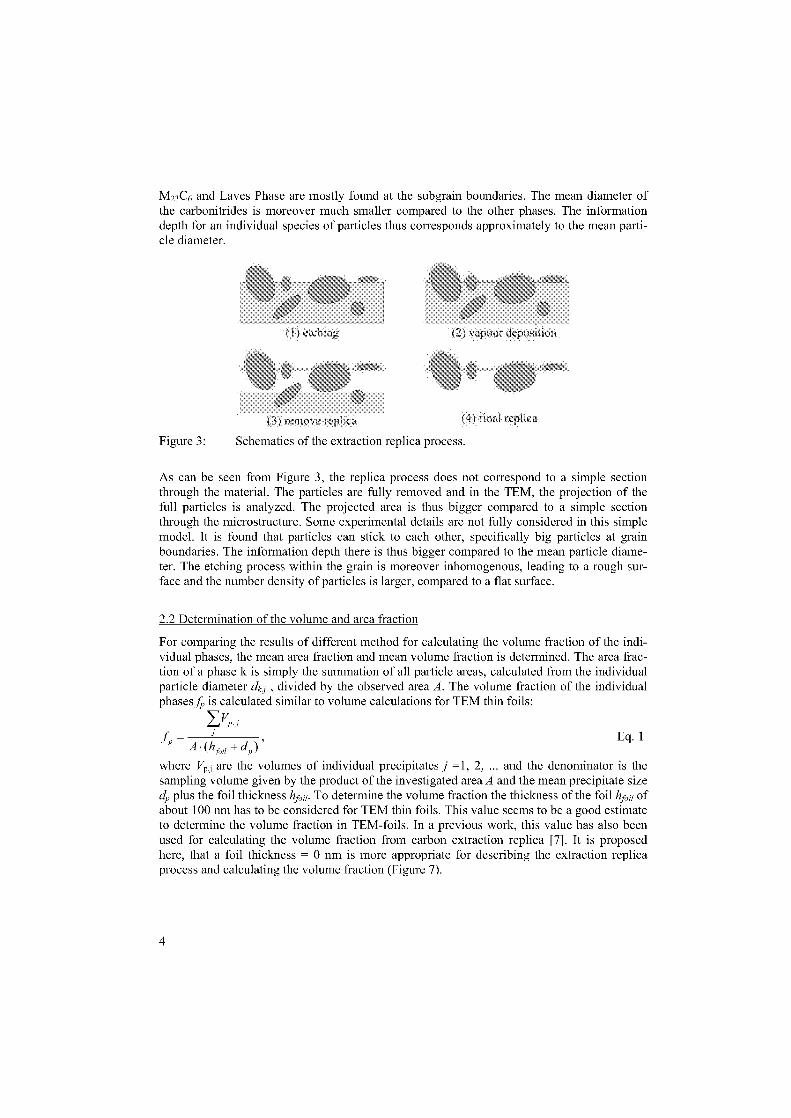
M23C6 and Laves Phase are mostly found at the subgrain boundaries. The mean diameter ofthe carbonitrides is moreover much smaller compared to the other phases. The informationdepth for an individual species of particles thus corresponds approximately to the mean parti-cle diameter.
final replica
Figure 3: Schematics of the extraction replica process.
As can be seen from Figure 3, the replica process does not correspond to a simple sectionthrough the material. The particles are fully removed and in the TEM, the projection of thefull particles is analyzed. The projected area is thus bigger compared to a simple sectionthrough the microstructure. Some experimental details are not fully considered in this simplemodel. It is found that particles can stick to each other, specifically big particles at grainboundaries. The information depth there is thus bigger compared to the mean particle diame-ter. The etching process within the grain is moreover inhomogenous, leading to a rough sur-face and the number density of particles is larger, compared to a flat surface.
2.2 Determination of the volume and area fraction
For comparing the results of different method for calculating the volume fraction of the indi-vidual phases, the mean area fraction and mean volume fraction is determined. The area frac-tion of a phase k is simply the summation of all particle areas, calculated from the individualparticle diameter dkj , divided by the observed area A. The volume fraction of the individualphases fp is calculated similar to volume calculations for TEM thin foils:
p,,
fp – A • (h fr,„ + c 1 p)' Eq. 1
where V, are the volumes of individual precipitates j =1, 2, ... and the denominator is thesampling volume given by the product of the investigated area A and the mean precipitate sized1, plus the foil thickness hjoil . To determine the volume fraction the thickness of the foil hm/ ofabout 100 nm has to be considered for TEM thin foils. This value seems to be a good estimateto determine the volume fraction in TEM-foils. In a previous work, this value has also beenused for calculating the volume fraction from carbon extraction replica [7]. It is proposedhere, that a foil thickness 0 nm is more appropriate for describing the extraction replicaprocess and calculating the volume fraction (Figure 7).
4
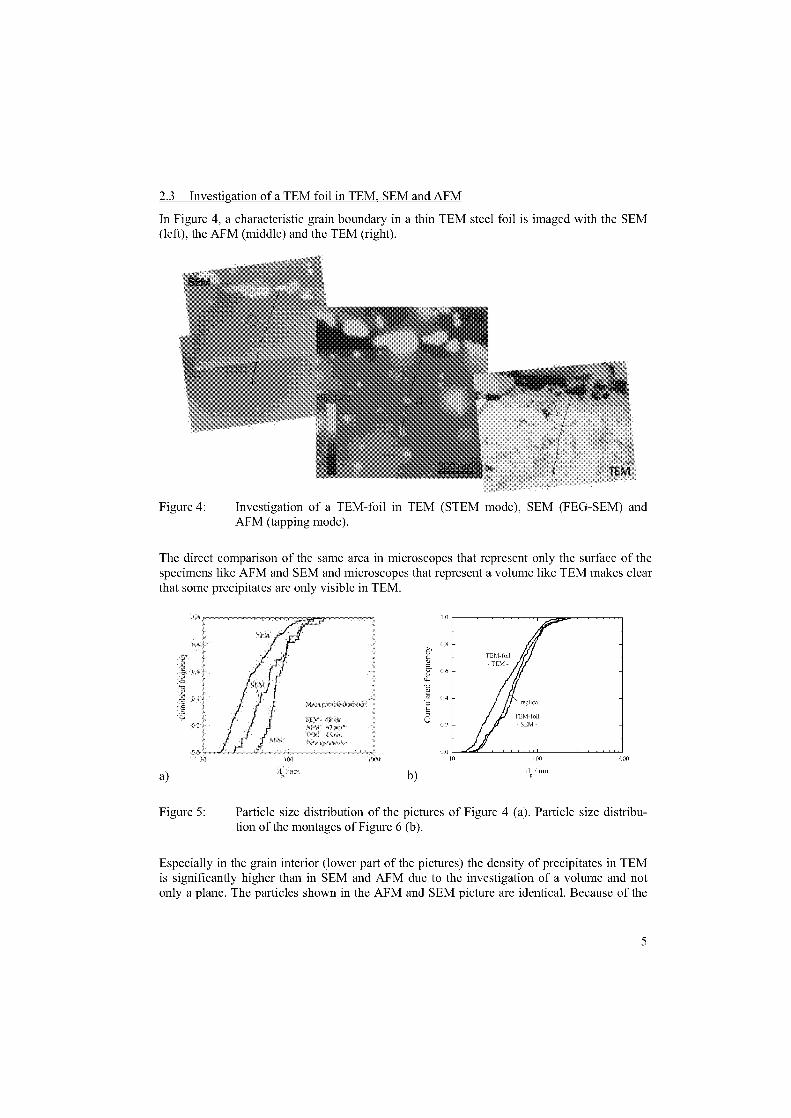
2.3 Investigation of a TEM foil in TEM, SEM and AFM
In Figure 4, a characteristic grain boundary in a thin TEM steel foil is imaged with the SEM(left), the AFM (middle) and the TEM (right).
Figure 4: Investigation of a TEM-foil in TEM (STEM mode), SEM (FEG-SEM) andAFM (tapping mode).
The direct comparison of the same area in microscopes that represent only the surface of thespecimens like AFM and SEM and microscopes that represent a volume like TEM makes clearthat some precipitates are only visible in TEM.
a) b)
Figure 5: Particle size distribution of the pictures of Figure 4 (a). Particle size distribu-tion of the montages of Figure 6 (b).
Especially in the grain interior (lower part of the pictures) the density of precipitates in TEMis significantly higher than in SEM and AFM due to the investigation of a volume and notonly a plane. The particles shown in the AFM and SEM picture are identical. Because of the
5
a)
c)
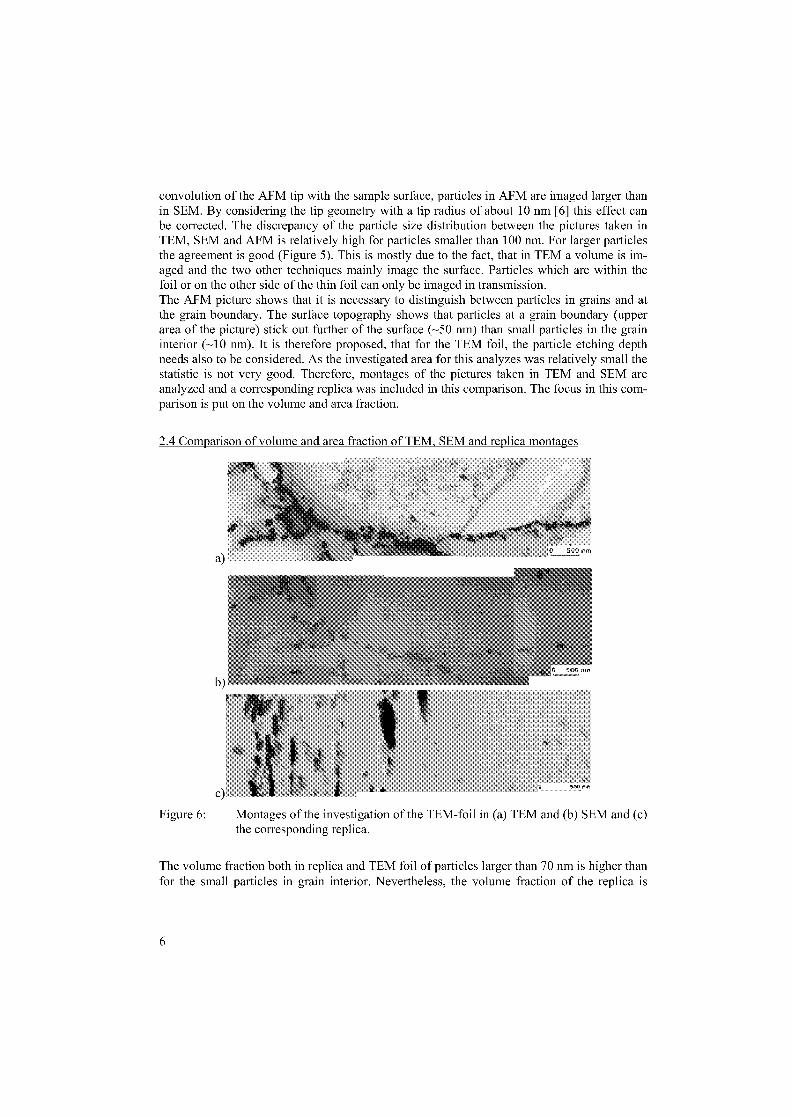
Figure 6: Montages of the investigation of the TEM-foil in (a) TEM and (b) SEM and (c)the corresponding replica.
benm
convolution of the AFM tip with the Sample surface, particles in AFM are imaged larger thanin SEM. By considering the tip geometry with a tip radius of about 10 nm [6] this effect canbe corrected. The discrepancy of the particle size distribution between the pictures taken inTEM, SEM and AFM is relatively high for particles smaller than 100 nm. For larger particlesthe agreement is good (Figure 5). This is mostly due to the fact, that in TEM a volume is im-aged and the two other techniques mainly image the surface. Particles which are within thefoil or on the other side of the thin foil can only be imaged in transmission.The AFM picture shows that it is necessary to distinguish between particles in grains and atthe grain boundary. The surface topography shows that particles at a grain boundary (upperarea of the picture) stick out further of the surface (-50 nm) than small particles in the graininterior (-10 nm). It is therefore proposed, that for the TEM foil, the particle etching depthneeds also to be considered. As the investigated area for this analyzes was relatively small thestatistic is not very good. Therefore, montages of the pictures taken in TEM and SEM areanalyzed and a corresponding replica was included in this comparison. The focus in this com-parison is put on the volume and area fraction.
2.4 Comparison of volume and area fraction of TEM, SEM and replica montages
The volume fraction both in replica and TEM foil of particles larger than 70 nm is higher thanfor the small particles in grain interior. Nevertheless, the volume fraction of the replica is
6
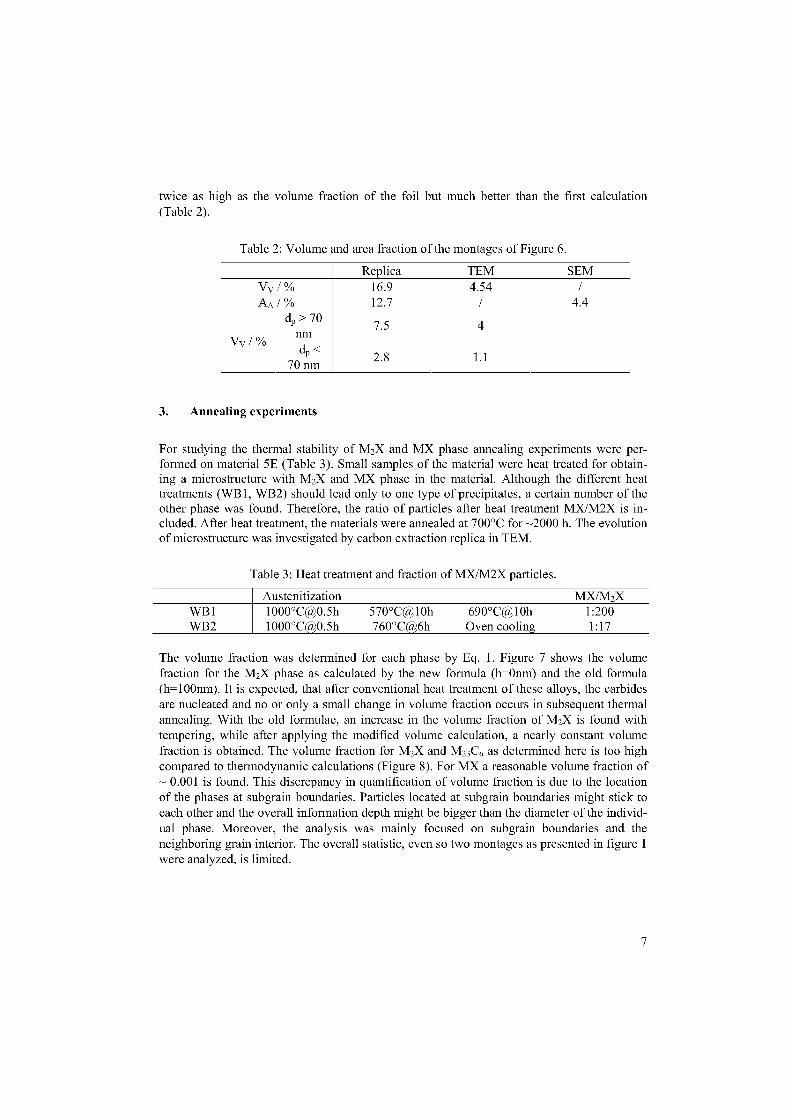
twice as high as the volume fraction of the foil but much better than the first calculation(Table 2).
Table 2: Volume and area fraction of the montages of Figure 6.
Replica TEM SEMVv/ %
AA C/0
dp > 70nm
Vv / %dp <
70 nm
16.912.7
7.5
2.8
4.54/
4
1.1
/
4.4
3. Annealing experiments
For studying the thermal stability of M2X and MX phase annealing experiments were per-formed on material 5E (Table 3). Small Samples of the material were heat treated for obtain-ing a microstructure with M2X and MX phase in the material. Although the different heattreatments (WB1, WB2) should lead only to one type of precipitates, a certain number of theother phase was found. Therefore, the ratio of particles after heat treatment MX/M2X is in-cluded. After heat treatment, the materials were annealed at 700°C for 2000 h. The evolutionof microstructure was investigated by carbon extraction replica in TEM.
Table 3: Heat treatment and fraction of MX/M2X particles.
Austenitization MX/M2XWB 1WB2
1000°[email protected]°[email protected]
570°C@10h760°C@6h
690°C@10hOven cooling
1:2001:17
The volume fraction was determined for each phase by Eq. 1. Figure 7 Shows the volumefraction for the M2X phase as calculated by the new formula (h=Onm) and the old formula(h=100nm). It is expected, that after conventional heat treatment of these alloys, the carbidesare nucleated and no or only a small change in volume fraction occurs in subsequent thermalannealing. With the old formulae, an increase in the volume fraction of M2X is found withtempering, while after applying the modified volume calculation, a nearly constant volumefraction is obtained. The volume fraction for M2X and M23C6 as determined here is too highcompared to thermodynamic calculations (Figure 8). For MX a reasonable volume fraction of– 0.001 is found. This discrepancy in quantification of volume fraction is due to the locationof the phases at subgrain boundaries. Particles located at subgrain boundaries might stick toeach other and the overall information depth might be bigger than the diameter of the individ-ual phase. Moreover, the analysis was mainly focused on subgrain boundaries and theneighboring grain interior. The overall statistic, even so two montages as presented in figure 1were analyzed, is limited.
7
102
to'
to'
104
h
IU io'h
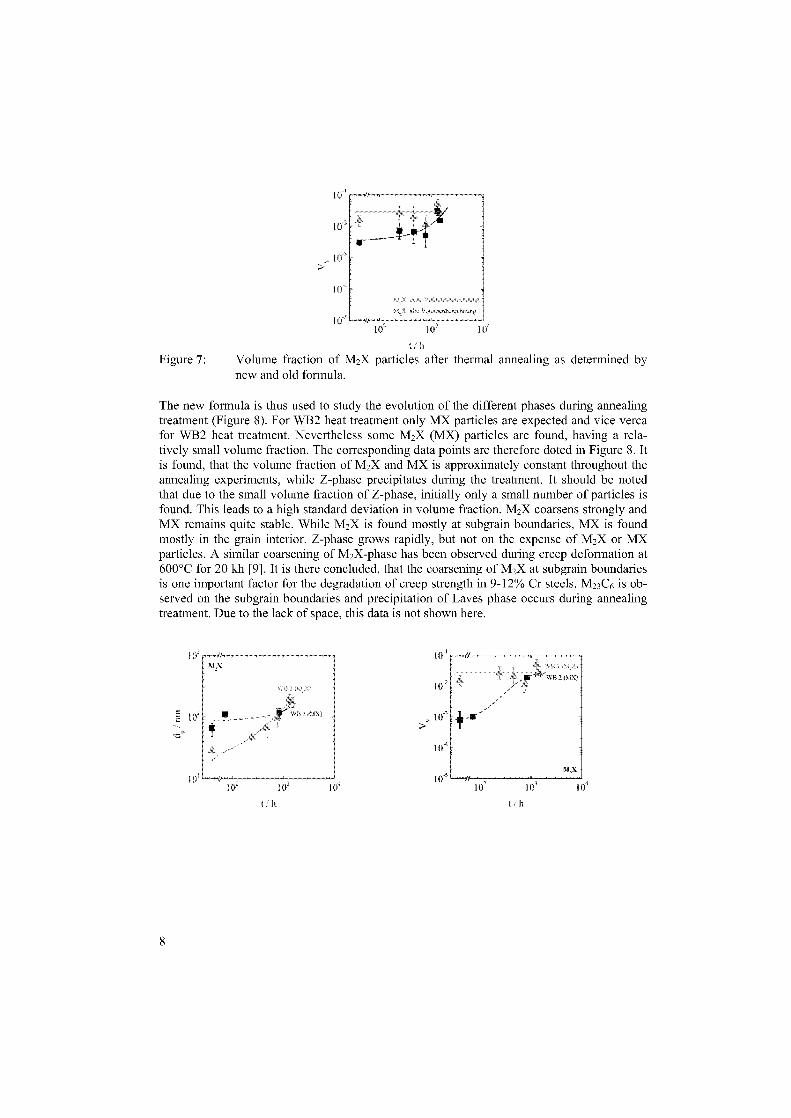
Figure 7: Volume fraction of M 2X particles after thermal annealing as determined bynew and old formula.
The new formula is thus used to study the evolution of the different phases during annealingtreatment (Figure 8). For WB2 heat treatment only MX particles are expected and vice vercafor WB2 heat treatment. Nevertheless some M2X (MX) particles are found, having a rela-tively small volume fraction. The corresponding data points are therefore doted in Figure 8. Itis found, that the volume fraction of M 2X and MX is approximately constant throughout theannealing experiments, while Z-phase precipitates during the treatment. It should be notedthat due to the small volume fraction of Z-phase, initially only a small number of particles isfound. This leads to a high standard deviation in volume fraction. M2X coarsens strongly andMX remains quite stable. While M 2X is found mostly at subgrain boundaries, MX is foundmostly in the grain interior. Z-phase grows rapidly, but not on the expense of M2X or MXparticles. A similar coarsening of M 2X-phase has been observed during creep deformation at600°C for 20 kh [9]. It is there concluded, that the coarsening of M2X at subgrain boundariesis one important factor for the degradation of creep strength in 9-12% Cr steels. M23C6 is ob-served on the subgrain boundaries and precipitation of Laves phase occurs during annealingtreatment. Due to the lack of space, this data is not shown here.
8
0 Rcaan
102103 to'
16'
l6'
10'
t / h h
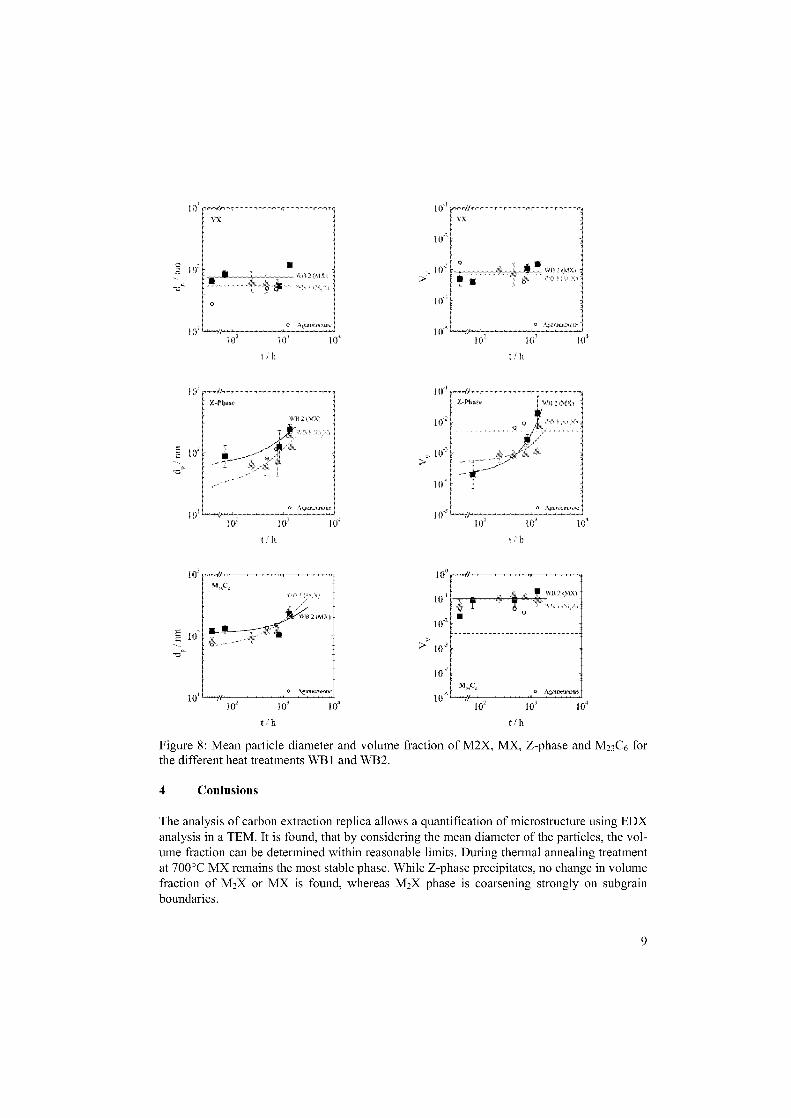
Figure 8: Mean particle diameter and volume fraction of M2X, MX, Z-phase and M23C6 forthe different heat treatments WB 1 and WB2.
4 Conlusions
The analysis of carbon extraction replica allows a quantification of microstructure using EDXanalysis in a TEM. It is found, that by considering the mean diameter of the particles, the vol-ume fraction can be determined within reasonable limits. During thermal annealing treatmentat 700°C MX remains the most stable phase. While Z-phase precipitates, no change in volumefraction of M2X or MX is found, whereas M2X phase is coarsening strongly an subgrainboundaries.
9
5 Literature
[1] J.D. Robson, H.K.D.H. Bhadeshia: Modelling precipitation sequences in power plantsteels Part 2 - Application of kinetic theory, Mater. Sci. Technol. 13 (1997) 640.
[2] A. Strang, V. Vodarek: Z phase formation in martensitic 12CrMoVNb steel, Mater. Sci.Technol. 12 (1996) 552.
[3] V. Knezevic, G. Sauthoff, J. Vilk, G. Inden, A. Schneider, R. Agamennone, W. Blum,Y. Wang, A. Scholz, C. Berger, J. Ehlers, L. Singheiser, Martensitic/ferritic super heatrestistant 650°C steels – Design and testing of model alloys, ISIJ International 42,2002,pp. 1505-1514.
[4] P. Polcik, S. Straub, W. Blum, in: The 4th European Conference on Advanced Materialsand Processes, Associatione Italiana di Metallurgia, Mailand, 1995, pp. 313-318.
[5] D. Henes, H. Möhlig, S. Straub, J. Granacher, W. Blum, C. Berger, in: H. Mughrabi, G.Gottstein, H. Mecking, H. Riedel, J. Tobolski (Eds.), Microstructure and MechanicalProperties of Metallic High-Temperature Materials, Wiley-VCH, Weinheim, 1999, pp.179-191.
[6] H. Danielsen and J. Hald. Z-Phase in 9-12%Cr Steels. Technical Report M4313, Värme-forsk Service AB, 10153 Stockholm, February 2004.
[7] R. Agamennone 1 , W. Blum, C. Gupta, J. K. Chakravartty: Evolution of microstructureand deformation resistance in creep of tempered martensitic 9-12%Cr-2%W-5%Costeels, submitted to Acta. Mat., 2006
[8] K. Durst , M. Göken: Quantitative Microstructural Characterisation by Atomic ForceMicroscopy and Electron Microscopy - A Comparative Study on the Superalloy Waspa-loy, Prakt. Metallogr., 38 (2001), 197-215
[9] G. Götz, W. Blum, Influence of thermal history on precipitation of hardening phases intempered martensite steel of type X12CrMoWVNbN10-1-1, Mater. Sci. Eng. A 348/1-2,pp. 201-207,2003.
[10] K. Sawada, H. Kushima, and K. Kimura. Precipitation behavior of Z phase during agingand creep in 9-12 %Cr ferritic heat resistant steels. In International workshop on Per-formance and requirements of structural materials for modern high efficient powerplants, pages 96-104, Darmstadt, September 6-9 2005.
[11] H. Chilukuru, K. Durst, M. Göken, W. Blum: On the Roles of M 2X and Z-Phase inTempered Martensitic 9-12% Cr-Steels, Liege conference 2006.
10
SIMULATION OF THE PRECIPITATION KINETICS DURING HEATTREATMENT AND SERVICE OF CREEP RESISTANT
MARTENSITIC 9-12% CR STEEL
I. Holzer, J. Rajek', E. Kozeschnik 1 '2 , H. Cerjak'
'Institute for Materials Science, Welding and Forming, Graz University of Technology,Kopernikusgasse 24, A-8010 Graz, Austria.Ph. 43-316-873-7181 Fax 43-316-873-7187
2 Materials Center Leoben Forschungsgesellschaft mbH, Franz-Josef Straße 13, A-8700Leoben, Austria. Ph. 43-3842-459221 Fax 43-3842-459225
Abstract
Based on the software package MatCalc, the evolution of precipitates during the complete thermal history of theCOST 522 steel CB8 is simulated, including cooling after cast solidification, heat treatment and service. Atdefinite points, the results of the calculation are compared with experimental results. The comparison Showsgood agreement. Thus, these results illustrate the potential of implementing advanced simulation techniques intothe process of alloy development and prediction of the service behaviour of this type of steels.
Keywords: Microstructure evolution, heat treatment, precipitation kinetics, simulation.
Introduction
In the past years, a lot of effort was made to enhance the efficiency of fossil fired powerplants with the goal of decreasing the CO 2 exhaust due to environmental protection. One ofthe most promising ways to reach this goal is to further improve the material properties of thenewly developed 9-12%Cr steels. Thus, the steam parameters, namely pressure undtemperature, can be increased. However, long-term application of these materials at highertemperature and pressure is extremely challenging in terms of the stability of the highlyoptimized microstructure, which provides the superior creep resistance of these materials.
A major ingredient for a stable tempered martensite microstructure is strengthening with ahigh number of finely dispersed precipitates. The physical mechanism behind this strategy is,that precipitates, which are located on the grain- and subgrain boundaries and dislocations,work as obstacles for the movement of boundaries and dislocations and, thus, effectively pinand stabilize the microstructure. In all the efforts to improve the properties of 9-12% Cr-steels,a stable microstructure with minimized precipitate coarsening, minimal grain and subgraingrowth and dislocation recovery is aspired.
By application of numerical simulation software, it became possible to predict some aspectsof the evolution of the microstructure on the researcher's desktop. This provides thepossibility to study variations of the chemical composition and/or the heat treatmentconditions on the computer and allows drawing conclusions on the changes in mechanicalproperties of the investigated material. Subsequently, the evolution of precipitates in a typicalmodern heat resistant complex 9-12% Cr steel is simulated through the entire heat treatment,starting from casting until the end of the design lifetime at more than 10 5 h. To carry out thenumerical simulations, the software MatCalc [1], which is developed at the Institute for
100
1
10000
100000
1000 -900
800- 700- 600
500-400400 j
10
Materials Science, Welding and Forming (IWS) of the Graz University of Technology, isutilised. For details on the model and its implementation in the software, the reader is referredto refl. [2-4].
Numerical Simulation
Material
The steel CB8 is a test-melt designed during the COST 522 project on the development of 9-12% Cr steels for application in 650°C USC steam power plants. The chemical compositionof CB8 steel is summarized in table 1.
Table 1: Composition of CB8 utilised in the kinetic simulations.
wt% Al C Co Cr Mn Mo N Nb Ni Si VCB8 0.028 0.17 2.92 10.72 0.20 1.40 0.0319 0.06 0.16 0.27 0.21
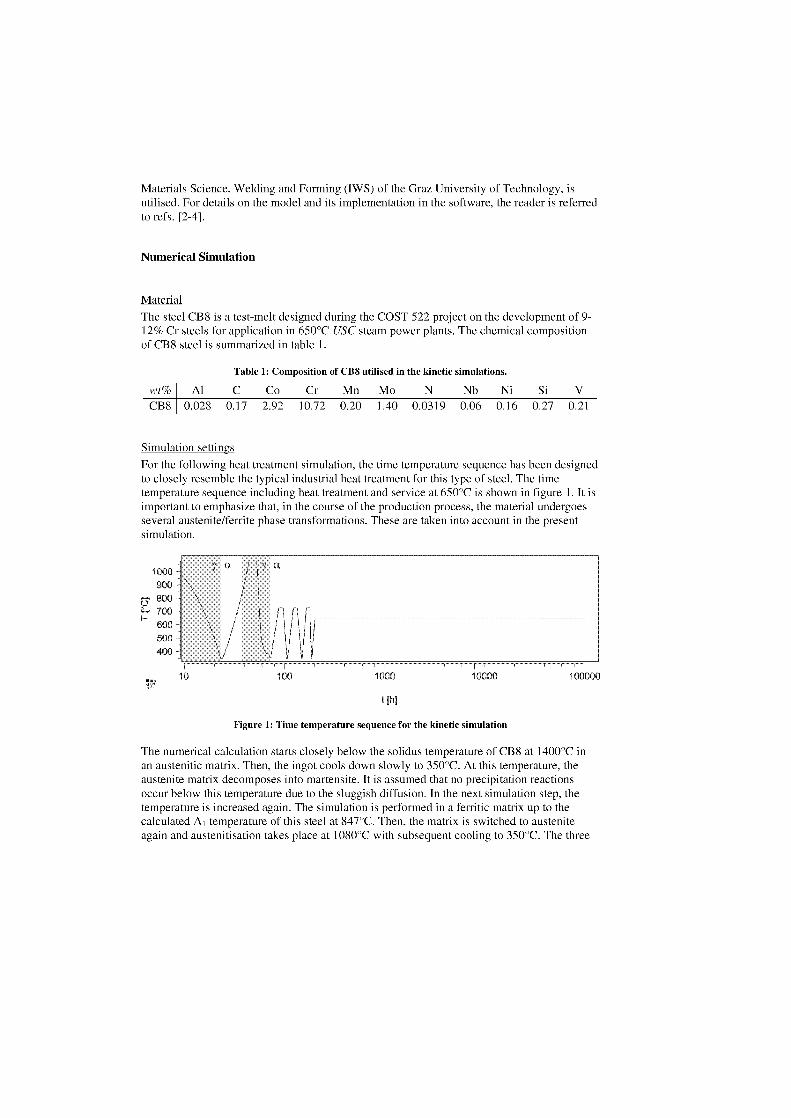
Simulation settings
For the following heat treatment simulation, the time temperature sequence has been designedto closely resemble the typical industrial heat treatment for this type of steel. The timetemperature sequence including heat treatment and service at 650°C is shown in figure 1. lt isimportant to emphasize that, in the course of the production process, the material undergoesseveral austenite/ferrite phase transformations. These are taken into account in the presentsimulation.
t [h]
Figure 1: Time temperature sequence for the kinetic simulation
The numerical calculation starts closely below the solidus temperature of CB8 at 1400°C inan austenitic matrix. Then, the ingot cools down slowly to 350°C. At this temperature, theaustenite matrix decomposes into martensite. It is assumed that no precipitation reactionsoccur below this temperature due to the sluggish diffusion. In the next simulation step, thetemperature is increased again. The simulation is performed in a ferritic matrix up to thecalculated A l temperature of this steel at 847°C. Then, the matrix is switched to austeniteagain and austenitisation takes place at 1080°C with subsequent cooling to 350°C. The three
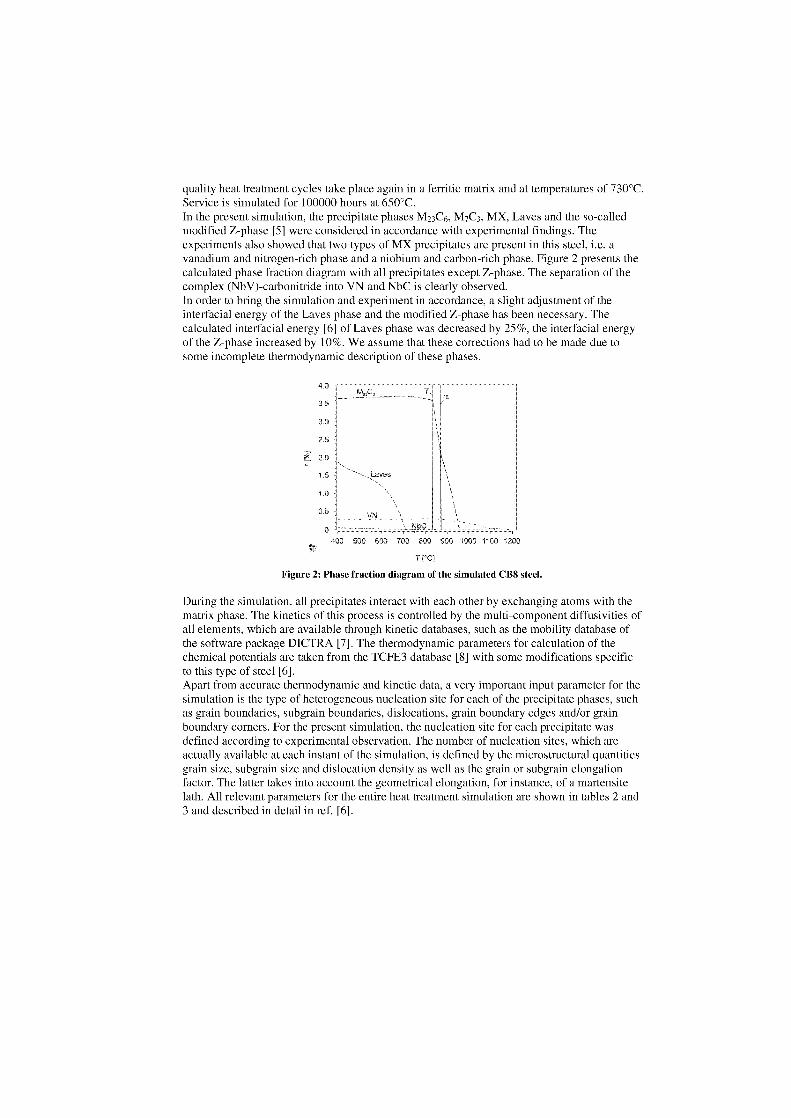
quality heat treatment cycles take place again in a ferritic matrix and at temperatures of 730°C.Service is simulated for 100000 hours at 650°C.In the present simulation, the precipitate phases 1\42 3C6, M7C3 , MX, Laves and the so-calledmodified Z-phase [5] were considered in accordance with experimental findings. Theexperiments also showed that two types of MX precipitates are present in this steel, i.e. avanadium and nitrogen-rich phase and a niobium and carbon-rich phase. Figure 2 presents thecalculated phase fraction diagram with all precipitates except Z-phase. The Separation of thecomplex (NbV)-carbonitride into VN and NbC is clearly observed.In order to bring the simulation and experiment in accordance, a slight adjustment of theinterfacial energy of the Laves phase and the modified Z-phase has been necessary. Thecalculated interfacial energy [6] of Laves phase was decreased by 25%, the interfacial energyof the Z-phase increased by 10%. We assume that these corrections had to be made due tosome incomplete thermodynamic description of these phases.
400 600 600 700 800 900 1000 1100 1200
T re.1
Figure 2: Phase fraction diagram of the simulated CB8 steel.
During the simulation, all precipitates interact with each other by exchanging atoms with thematrix phase. The kinetics of this process is controlled by the multi-component diffusivities ofall elements, which are available through kinetic databases, such as the mobility database ofthe software package DICTRA [7]. The thermodynamic parameters for calculation of thechemical potentials are taken from the TCFE3 database [8] with some modifications specificto this type of steel [6].Apart from accurate thermodynamic and kinetic data, a very important input parameter for thesimulation is the type of heterogeneous nucleation site for each of the precipitate phases, suchas grain boundaries, subgrain boundaries, dislocations, grain boundary edges and/or grainboundary corners. For the present simulation, the nucleation site for each precipitate wasdefined according to experimental observation. The number of nucleation sites, which areactually available at each instant of the simulation, is defined by the microstructural quantitiesgrain size, subgrain size and dislocation density as well as the grain or subgrain elongationfactor. The latter takes into account the geometrical elongation, for instance, of a martensitelath. All relevant parameters for the entire heat treatment simulation are shown in tables 2 and3 and described in detail in ref. [6].
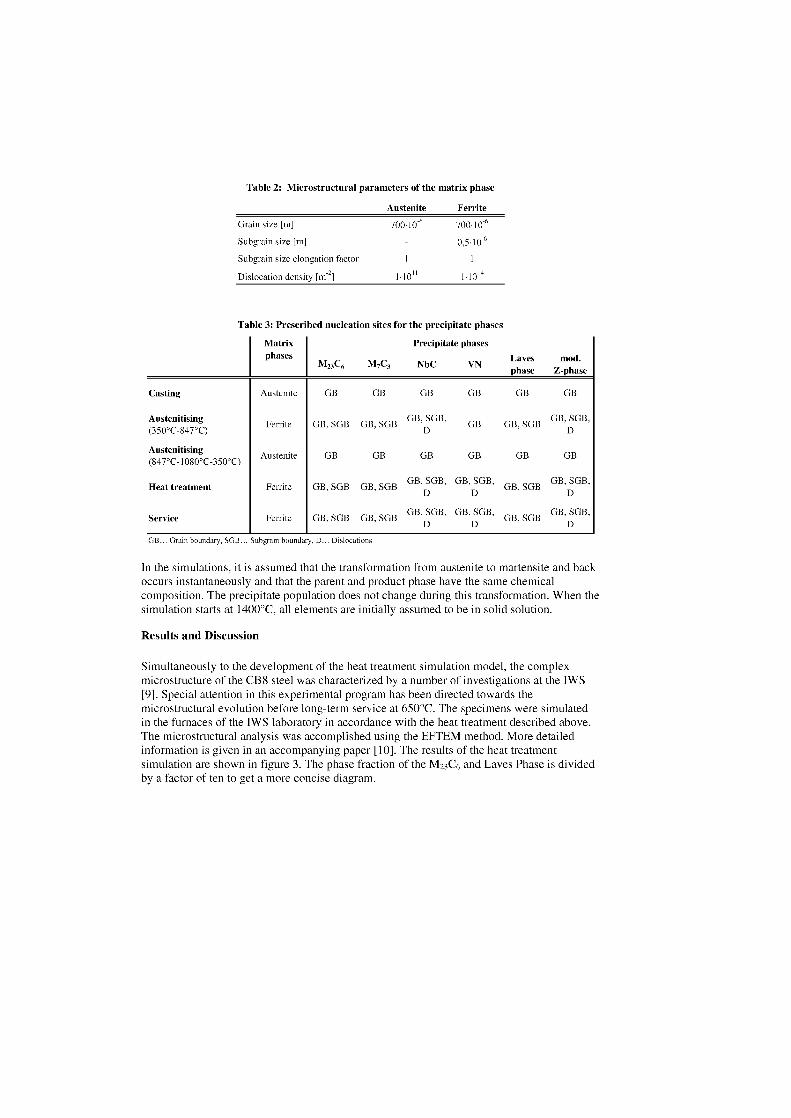
Table 2: Microstructural parameters of the matrix phase
Austenite Ferrite
Grain size [m]
700 . 10 -6 70010-6
Subgrain size [m]
0 ,5.10-6
Subgrain size elongation factor
Dislocation density [m-2]
11014
Table 3: Prescribed nucleation sites for the precipitate phases
Matrixphases
M7C3
Precipitate phases
NbC VNLavesphase
mod.Z-phase
Casting Austenite GB GB GB GB GB GB
AustenitisingFerrite GB, SGB GB, SGB
GB'
SGBGB GB, SGB
GB, SGB,(350°C-847°C)
AustenitisingAustenite GB GB GB GB GB GB
(847°C-I080°C-350°C)
Heat treatment Ferrite GB, SGB GB, SGBGB, SGB, GB, SGB,
GB, SGBGB, SGB,
Service Ferrite GB, SGB GB, SGBGB, SGB, GB, SGB,
GB, SGBGB, SGB,
GB... Grain boundary, SGB... Subgrain boundary, D... Dislocations
In the simulations, it is assumed that the transformation from austenite to martensite and backoccurs instantaneously and that the parent and product phase have the same chemicalcomposition. The precipitate population does not change during this transformation. When thesimulation starts at 1400°C, all elements are initially assumed to be in solid solution.
Results and Discussion
Simultaneously to the development of the heat treatment simulation model, the complexmicrostructure of the CB8 steel was characterized by a number of investigations at the 1WS[9]. Special attention in this experimental program has been directed towards themicrostructural evolution before long-term service at 650°C. The specimens were simulatedin the furnaces of the IWS laboratory in accordance with the heat treatment described above.The microstructural analysis was accomplished using the EFTEM method. More detailedinformation is given in an accompanying paper [10]. The results of the heat treatmentsimulation are shown in figure 3. The phase fraction of the M23C6 and Laves Phase is dividedby a factor of ten to get a more concise diagram.
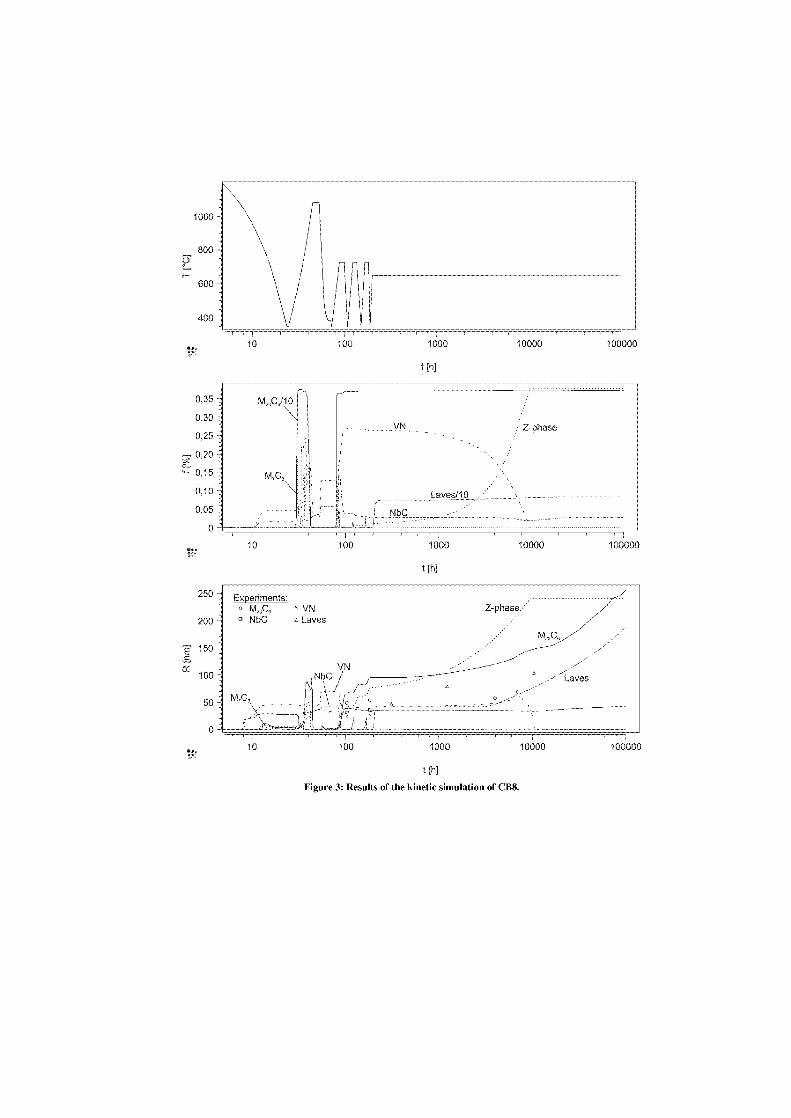
250 -
200 7
Experiments: VN
NbC Laves
150 -c
100 -
50 -
0 -
1000
800 -
600 -
400\
iln
'11
10
100
1000
10000
100000
t [h]
10
100
1000
10000
100000
t [h]
Figure 3: Results of the kinetic simulation of CB8.
Casting
During cooling from 1400°C, the first NbC and VN nucleate at approximately 1050°C. Ataround 830°C, M23C6 and M7C3 also nucleate as well as Laves phase at around 680°C. Thecasting simulation ends after 23,3h. At this point small amounts of NbC, VN, M23C6, M7C3and Laves phase are present.
Austenitising
Before beginning the austenitising simulation, the matrix is switched from austenite to ferriteand kept unaltered during reheating from 350°C to the calculated A 1 temperature at 874°C.Up to about 500°C, diffusion processes are too slow to cause major changes in the precipitatemicrostructure. The phase fractions and radii of the present precipitate phases remain almostconstant. Above this temperature, the amount of M23C6 and NbC as well as the amount of VN,M7C3 and Laves phase rise sharply. The latter precipitate phases dissolve again already attemperatures around 700°C. At 874°C, the matrix phase is switched back to austenite.With increasing temperature the M23C6 start to grow until they dissolve again after exceedingtheir solubility temperature. After a short intermediate increase of the phase fractions of NbCand VN, the amount of these phases decreases until the equilibrium phase fraction ataustenitising temperature is reached. During the subsequent cooling, additional VN nucleateas well as M23C6 and N 7C3 carbides. After the austenitising process, a mean radius of NbC of31.5 nm was measured. The simulation delivers a calculated radius of 41.9 nm. Thisaccordance is considered as good. No experimental information on the other phases wasavailable in this state.
Quality heat treatment
Similar to reheating during the austenitisation, the phase fractions of M23C6, M7C3, NbC, VNand Laves phase are increasing during heating to annealing temperature. Again, the latter aredissolving at temperatures around 700°C. Nucleation, growth and subsequent dissolution ofLaves phase is observed in all three annealing cycles. The high number of newly precipitatedVN causes a sharp increase of the VN phase fraction and a decrease of the mean radius. Fromthis point on, the phase fractions of VN as well as the phase fractions of NbC and M23C6remain dose to their equilibrium value. The measured precipitate radius of NbC, VN, M23C6and Laves-phase is indicated by open symbols in figure 3. The experimental data were takenfrom references [10] and [11]. In contrast to the good agreement of NbC, VN and Laves-phase, the mean radius of M23C6 Shows some deviation. Nonetheless, agreement of simulationresults and experimental data is considered as good, since only the interfacial energy of theLaves-phase and Z-phase have been modified.During the three annealing cycles, coarsening of the M23C6 precipitates is observed.Interestingly, occurrence of the modified Z-phase is visible already during the first annealingcycle. However, the phase fraction and number density is very low (4.002%, 6,4.1016m-3)and the mean radius is still small Experimental characterisation of precipitates inthis stage is rather difficult, particularly because Z-phase and VN precipitates can hardly bedistinguished by composition differences. Therefore, no experimental points for Z-phase areavailable for the heat treatment period.
Service
In addition to the previously discussed heat treatment, a service period at 650°C was carriedout for 100.000h. Coarsening of all precipitate phases is clearly observed, with NbC and VNhaving significantly slower kinetics. The phase fraction of Z-phase is increasing constantly,

while, simultaneously, the VN phase dissolves. According to our simulations, atapproximately 10500h, the VN have disappeared completely and the Z-phase has reached itsmaximum phase fraction. The same phenomenon has been observed experimentally in theinvestigated specimens, where, after 16000h, no more VN were observed. In the samespecimen, modified Z-phase was detected [9].
Summary and Outlook
The possibility to simulate precipitation kinetics during the whole production and service ofmaterials used in power plant applications is of particular importance, especially for thedevelopment of modern 9-12% Cr steels with advanced creep strength at enhanced servicetemperature and pressure. On basis of the newly developed multi-component multi-phaseprecipitation kinetics model, which is implemented into the software MatCalc, simulations arecarried out for the COST steel CB8.The results of the simulation Show good agreement with new experimental data characterisingthe precipitate microstructure in the production stages, i.e. casting, austenitization and heattreatment.Despite the complexity of the alloy composition and the time temperature-sequence whichwas simulated, only slight changes of some input quantities have been necessary to obtainreasonable agreement with experiments. lt is hoped that improved thermodynamic databasesfor kinetic simulation make these adjustments unnecessary in the future.
Acknowledgement
This work was part of the Austrian research cooperation "ARGE ACCEPT – COST 536" andwas supported by the Austrian Research Promotion Agency Ltd. (FFG) which is gratefullyacknowledged. Financial support by the Austrian Kplus program within the strategic projectsSP11 and SP16 of the Materials Center Leoben is gratefully acknowledged.
References
1 E. Kozeschnik and B. Buchmayr, Mathematical Modelling of Weld Phenomena 5(London, Institute of Materials, Book, 734, 2001), 349-361.
2 J. Svoboda, F. D. Fischer, P. Fratzl, and E. Kozeschnik, Modelling of kinetics in multi-component multi-phase systems with spherical precipitates I. – Theory, Mater. Sci. Eng. A,Vol 385 (No. 1-2), 2004, p 166-174.
3 E. Kozeschnik, J. Svoboda, P. Fratzl, and F. D. Fischer, Modelling of kinetics in multi-component multi-phase systems with spherical precipitates II. – Numerical solution andapplication, Mater. Sci. Eng. A, Vol 385 (No. 1-2), 2004, p 157-165.
4 E. Kozeschnik, J. Svoboda, and F. D. Fischer, Modified evolution equations for theprecipitation kinetics of complex phases in multi-component systems, CALPHAD, Vol 28(No. 4), 2005, p 379-382.
5 V. Vodarek, A. Strang, "Z Phase Characteristics in Martensitic 12CrMoVNb Steels", Proc.Materials for advanced power engineering, Liege (2002), 1223-1231.
6 J. Rajek, PhD thesis, Computer simulation of precipitation kinetics in solid metals andapplication to the complex power plant steel CB8, Graz University of Technology, 2005.

7 J.O. Andersson, L. Höglund, B. Jönsson, and J. Agren, Computer simulations ofmulticomponent diffusional transformations in steel, in: Fundamentals and Applicationsof Ternaly Diffusion, G.R. Purdy (ed.), Pergamon Press, New York, NY, 1990, p 153-163.
8 TCFE3 thermodynamic database, Thermo-Calc Software AB, Stockholm, Sweden, 1992-2004.
9 B. Sonderegger, PhD thesis, Characterisation of the substructure of modern power plantmaterials using the EBSD method, Graz University of Technology, 2005 (in German).
10 B. Sonderegger, S. Mitsche, H. Cerjak, Microstructural analysis on a creep resistantmartensitic 9-12% Cr steel using the EBSD method, at this conference.
11 G. Dimmler, PhD thesis, Quantification of creep resistance and creep fracture strength of9-12%Cr steel on microstructural basis, Graz University of Technology, 2003 (inGerman).
MICROSTRUCTURAL ANALYSIS ON A CREEP RESISTANTMARTENSIC 9-12% CR STEEL USING THE EBSD METHOD
B. Sonderegger l '2 , S. Mitsche3 , H. Cerjakl
1: Institute for Materials Science, Welding and Forming, Graz University of Technology,Kopernikusgasse 24, 8010 Graz, Austria
2: Materials Center Leoben, Franz Josef Straße 13, 8700 Leoben, Austria3: Research Institute for Electron Microscopy, Graz University of Technology, Steyrergasse
17, 8010 Graz, Austria
Abstract
9-12% chromium steels are well established materials for high temperature components in ultra efficient powerplants. One important impact factor for the creep resistance are the parameters of martensite laths and subgrains,namely lath width, subgrain size, interfacial energies and the interfacial mobility. In this work, the morphologyand crystallography of the martensitic creep resistant 9-12% Cr steel CB8 was examined by EBSD (ElectronBackScatter Diffraction). This technique, applied for the first time for these types of steels, makes it possible toanalyse the size of the microstructural elements, as well as the misorientations on internal interfaces as functionof ageing and creep deformation. This information can then be further used for simulations of the microstructuralevolution in the course of heat treatment, thermal ageing and creep loading.
Keywords: Martensite, EBSD, 9-12% Cr steel
Introduction
In high temperature components of caloric power plants, high creep resistance isindispensable for the application of the material. One of the main reasons for the creepprocess is the dislocation movement, which is most effectively depressed by precipitates andinternal matrix interfaces. In order to keep the high creep resistance, it is of particular interest,how far these structures coarsen during tempering and creep loading.
Because of the low mobility of martensite lath boundaries (amongst other parameters), ferritic- martensitic steels are ideal for the application as creep resistant material. Also contributingto the hindering of dislocation movements are subgrain boundaries, which are low angleboundaries located in the martensite laths. These boundaries are expected to have a highermobility, which is leading to a higher coarsening rate.
While the misorientation of martensite laths and the lath width have been examined bytransmission electron microscopy [1, 2], EBSD is a rarely used method on this topic [3]. Thereason is the lateral resolution of the technique (roughly 0,2 - 0,5pm) — many martensite lathsare about the same size. As a consequence it is not sure if a sufficiently high number of lathscan be resolved in order to detect coarsening effects.
In the following, misorientations of martensite laths are studied by using the EBSD methodon the example of an advanced creep resistant 9-12% Cr steel. Not only the "as received"condition is considered, also several samples after tempering and creep loading weremeasured to examine the evolution of the boundary properties.
Experimental
Material
The investigated material is an advanced creep resistant martensitic 9-12% Cr cast steel, thechemical composition is given in Table 1.
Table 1: Chemical composition of the steel testmelt. Element concentrations are given in wt%
Fe C Cr Mo V Nb N B Co SiBal 0.17 10.86 1.42 0.21 0.061 0.024 0.01 2.94 0.22
The steel was cast, austenitized (8h, 1100°C) and heat treated (730°C for 10h, 12h and 14h,consecutively). After the full heat treatment, samples were thermally aged or exposed to acreep load at 650°C for times up to 16.000h. Table 2 summarises the sample codes usedsubsequently:
Table 2: lnvestigated Samples
Sample name Additional treatment
t2000 Tempered, 650°C, 2000ht4000 Tempered, 650°C, 4031 ht7000 Tempered, 650°C, 7063ht16000 Tempered, 650°C, 16000hc2000 Creep loaded, 650°C, 1 1 OMPa, 2000hc4000 Creep loaded, 650°C, 1 OOMPa, 4031hc7000 Creep loaded, 650°C, 1 OOMPa, 7063h
c16000 Creep loaded, 650°C, 80MPa, 16000h
Measurements
All EBSD analysis were performed at the Austrian Centre for Electron Microscopy andNanoanalysis (FELMI) at TU Graz, the sample preparation was partially carried out atFELMI, partially at the Institute for Materials Science, Welding and Forming (IWS).In order to obtain EBSD-measurements with high quality a routine of the specimenspreparation was applied, which was introduced by Katrakova and Mücklich [4]. The sampleswere embedded cylindrically with the Technovit 4071 encapsulant (dimensions: diameter 2.5cm, height 1 cm). After the surface grinding and the fine grinding till to a granulation of 4400the sample surface was polished in three steps with a diamond paste of 6 prn, 1 pm and 0.25pm granulation a few minutes each. The final step was a surface polishing with an alkalinecolloidal silica solution (0.04 pm granulation) for 2h. The surface of the encapsulant wascovered with a conductive silver layer and the sample itself was conducted with a carbon stripto avoid charging during the long analysis time.All measurements were performed an a Zeiss DSM 982 Gemini equipped with an EBSD-system from EDAX-TSL. The microscope was operated with an accelerating voltage of E 0 =20 keV and a specimen current of Iss = 2.8 nA. Three micrographs with a stepsize of 0.05,0.25 or l pm respectively were produced of each sample. These used step sizes permits a
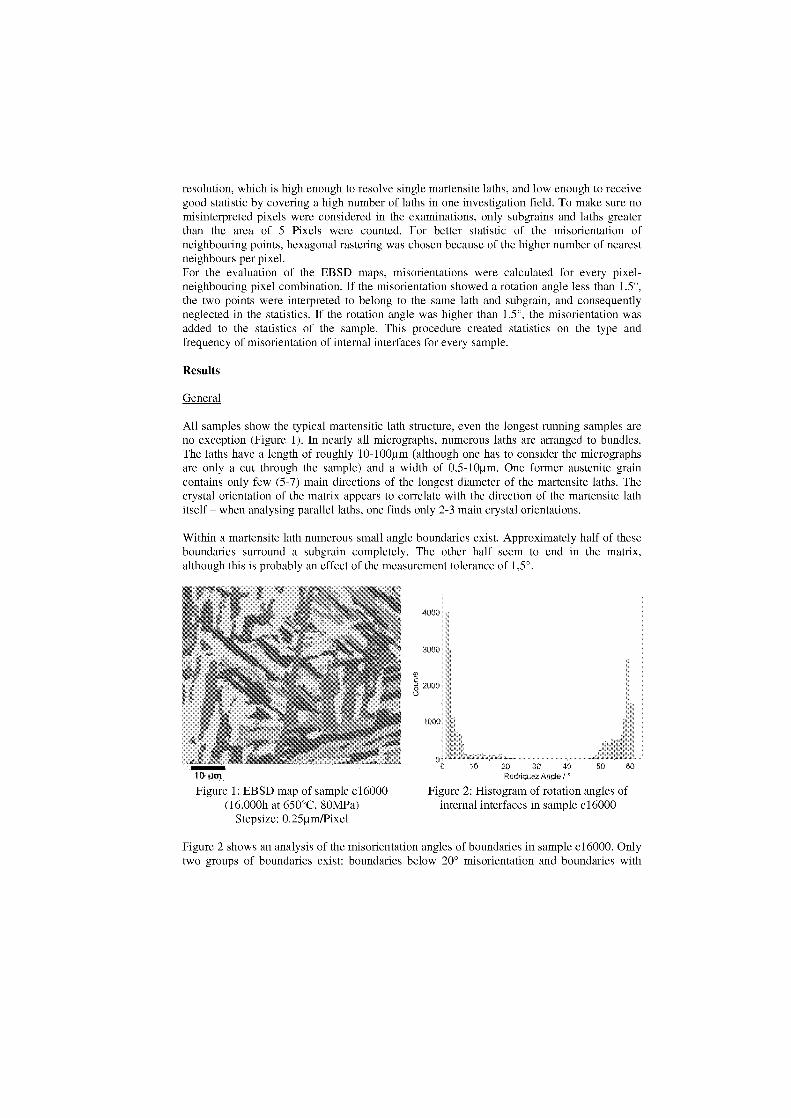
resolution, which is high enough to resolve single martensite laths, and low enough to receivegood statistic by covering a high number of laths in one investigation field. To make sure nomisinterpreted pixels were considered in the examinations, only subgrains and laths greaterthan the area of 5 Pixels were counted. For better statistic of the misorientation ofneighbouring points, hexagonal rastering was chosen because of the higher number of nearestneighbours per pixel.For the evaluation of the EBSD maps, misorientations were calculated for every pixel-neighbouring pixel combination. If the misorientation showed a rotation angle less than 1.5°,the two points were interpreted to belong to the same lath and subgrain, and consequentlyneglected in the statistics. If the rotation angle was higher than 1.5°, the misorientation wasadded to the statistics of the sample. This procedure created statistics an the type andfrequency of misorientation of internal interfaces for every sample.
Results
General
All samples show the typical martensitic lath structure, even the longest running samples areno exception (Figure 1). In nearly all micrographs, numerous laths are arranged to bundles.The laths have a length of roughly 10-100tim (although one has to consider the micrographsare only a cut through the sample) and a width of 0,5-10ttm. One former austenite graincontains only few (5-7) main directions of the longest diameter of the martensite laths. Thecrystal orientation of the matrix appears to correlate with the direction of the martensite lathitself – when analysing parallel laths, one finds only 2-3 main crystal orientations.
Within a martensite lath numerous Small angle boundaries exist. Approximately half of theseboundaries surround a subgrain completely. The other half seem to end in the matrix,although this is probably an effect of the measurement tolerante of 1,5°.
g 20000
10 20 30 40htnerieuez Angle
Figure 2: Histogram of rotation angles ofinternal interfaces in sample c16000
10 lant
Figure 1: EBSD map of sample c16000(16.000h at 650°C, 80MPa)
Stepsize: 0.25ttm/Pixel
Figure 2 Shows an analysis of the misorientation angles of boundaries in sample c16000. Onlytwo groups of boundaries exist: boundaries below 20° misorientation and boundaries with
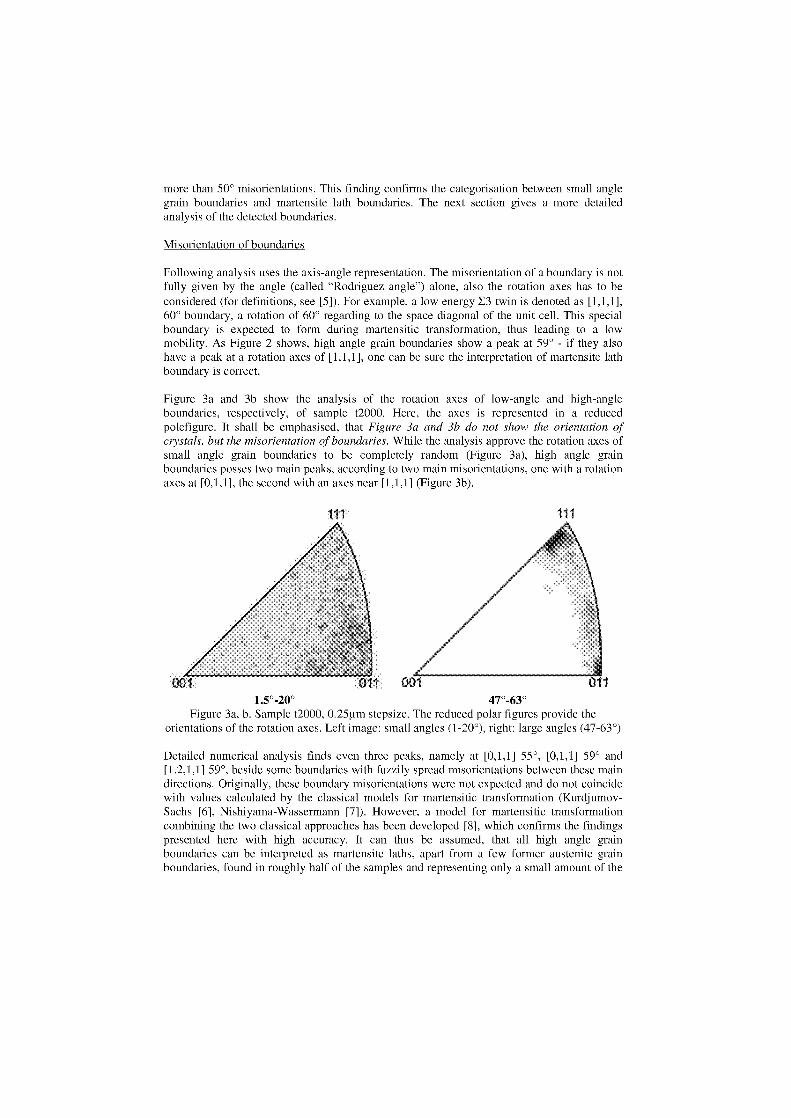
more than 50° misorientations. This finding confirms the categorisation between small anglegrain boundaries and martensite lath boundaries. The next section gives a more detailedanalysis of the detected boundaries.
Misorientation of boundaries
Following analysis uses the axis-angle representation. The misorientation of a boundary is notfully given by the angle (called "Rodriguez angle") alone, also the rotation axes has to beconsidered (for definitions, see [5]). For example, a low energy E3 twin is denoted as [1,1,1],60° boundary, a rotation of 60° regarding to the space diagonal of the unit cell. This specialboundary is expected to form during martensitic transformation, thus leading to a lowmobility. As Figure 2 shows, high angle grain boundaries show a peak at 59° - if they alsohave a peak at a rotation axes of [1,1,1], one can be sure the Interpretation of martensite lathboundary is correct.
Figure 3a and 3b show the analysis of the rotation axes of low-angle and high-angleboundaries, respectively, of sample t2000. Here, the axes is represented in a reducedpolefigure. lt shall be emphasised, that Figure 3a and 3b do not show the orientation ofcrystals, but the misorientation of boundaries. While the analysis approve the rotation axes ofsmall angle grain boundaries to be completely random (Figure 3a), high angle grainboundaries posses two main peaks, according to two main misorientations, one with a rotationaxes at [0,1,1], the second with an axes near [1,1,1] (Figure 3b).
1.50 -20° 47°-63°Figure 3a, b. Sample t2000, 0.25gm stepsize. The reduced polar figures provide the
orientations of the rotation axes. Left image: small angles (1-20°), right: large angles (47-63°)
Detailed numerical analysis finds even three peaks, namely at [0,1,1] 55°, [0,1,1] 59° and[1.2,1,1] 59°, beside some boundaries with fuzzily spread misorientations between these maindirections. Originally, these boundary misorientations were not expected and do not coincidewith values calculated by the classical modeln for martensitic transformation (Kurdjumov-Sachs [6], Nishiyama-Wassermann [7]). However, a model for martensitic transformationcombining the two classical approaches has been developed [8], which confirms the findingspresented here with high accuracy. lt can thus be assumed, that all high angle grainboundaries can be interpreted as martensite laths, apart from a few former austenite grainboundaries, found in roughly half of the samples and representing only a small amount of the
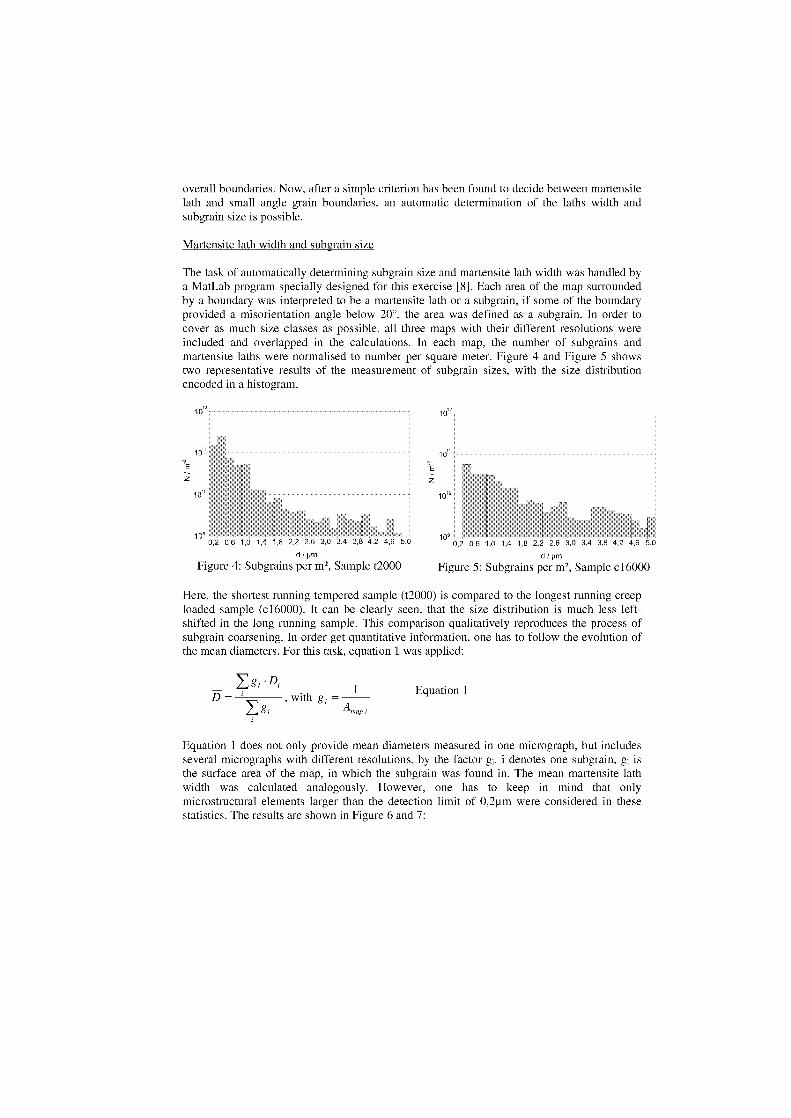
overall boundaries. Now, after a simple criterion has been found to decide between martensitelath and Small angle grain boundaries, an automatic determination of the laths width andsubgrain size is possible.
Martensite lath width and subgrain size
The task of automatically determining subgrain size and martensite lath width was handled bya MatLab program specially designed for this exercise [8]. Each area of the map surroundedby a boundary was interpreted to be a martensite lath or a subgrain, if some of the boundaryprovided a misorientation angle below 20°, the area was defined as a subgrain. In order tocover as much size classes as possible, all three maps with their different resolutions wereincluded and overlapped in the calculations. In each map, the number of subgrains andmartensite laths were normalised to number per square meter. Figure 4 and Figure 5 Showstwo representative results of the measurement of subgrain sizes, with the size distributionencoded in a histogram.
i o"
Ez z
0,2 0,6 1,0 1,4 1,8 2,2 2,b ,u 3,4 3,8 4,2 4,6 5,0
d / pm
Figure Subgrains per m2, Sample t2000
0,2 0,6 1,0 1,4 1,8 2,2 2,6 3,0 3,4 3,6 4,2 4,6 5,0
d / pm
Figure 5: Subgrains per m 2, Sample c16000
Here, the shortest running tempered sample (t2000) is compared to the longest running creeploaded sample (c16000). lt can be clearly seen, that the size distribution is much less left-shifted in the Jong running sample. This comparison qualitatively reproduces the process ofsubgrain coarsening. In order get quantitative information, one has to follow the evolution ofthe mean diameters. For this task, equation 1 was applied:
Eg , • D,1
D= , with g , - Eg
Equation 1
Equation 1 does not only provide mean diameters measured in one micrograph, but includesseveral micrographs with different resolutions, by the factor g i . i denotes one subgrain, g i isthe surface area of the map, in which the subgrain was found in. The mean martensite lathwidth was calculated analogously. However, one has to keep in mind that onlymicrostructural elements larger than the detection limit of 0,2ttm were considered in thesestatistics. The results are shown in Figure 6 and 7:
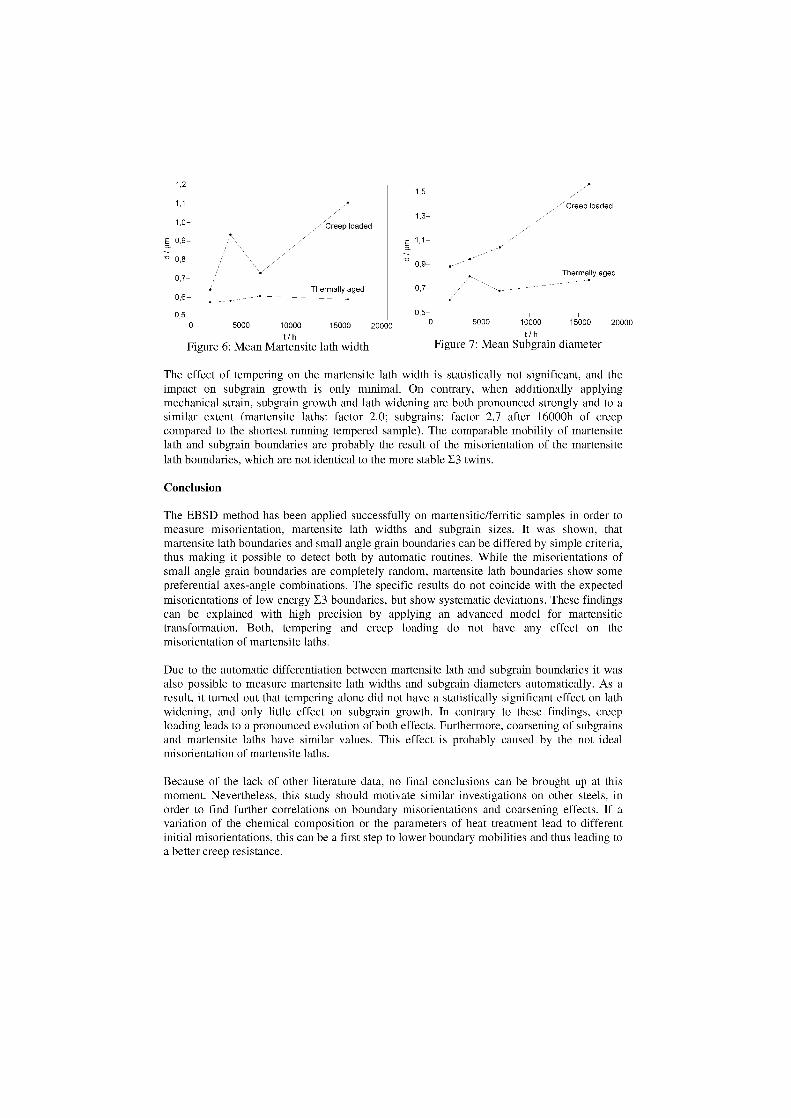
0,7-
1,2-
1,1
1,0-
E 0,9-
' 0,8
0,7-
./Creep loaded
Thermally aged0,6-
-- Creep loaded
Thermally aged
0,50 5000 10000 15000 20000
t/hFigure 6: Mean Martensite lath width
0,5-0 5000 10000 15000 20000
t/hFigure 7: Mean Subgrain diameter
The effect of tempering on the martensite lath width is statistically not significant, and theimpact on subgrain growth is only minimal. On contrary, when additionally applyingmechanical strain, subgrain growth and lath widening are both pronounced strongly and to asimilar extent (martensite laths: factor 2.0; subgrains: factor 2.7 after 16000h of creepcompared to the shortest running tempered Sample). The comparable mobility of martensitelath and subgrain boundaries are probably the result of the misorientation of the martensitelath boundaries, which are not identical to the more stable E3 twins.
Conclusion
The EBSD method has been applied successfully on martensitic/ferritic samples in order tomeasure misorientation, martensite lath widths and subgrain sizes. lt was shown, thatmartensite lath boundaries and small angle grain boundaries can be differed by simple criteria,thus making it possible to detect both by automatic routines. While the misorientations ofsmall angle grain boundaries are completely random, martensite lath boundaries show somepreferential axes-angle combinations. The specific results do not coincide with the expectedmisorientations of low energy E3 boundaries, but show systematic deviations. These findingscan be explained with high precision by applying an advanced model for martensitictransformation. Both, tempering and creep loading do not have any effect on themisorientation of martensite laths.
Due to the automatic differentiation between martensite lath and subgrain boundaries it wasalso possible to measure martensite lath widths and subgrain diameters automatically. As aresult, it turned out that tempering alone did not have a statistically significant effect on lathwidening, and only little effect on subgrain growth. In contrary to these findings, creeploading leads to a pronounced evolution of both effects. Furthermore, coarsening of subgrainsand martensite laths have similar values. This effect is probably caused by the not idealmisorientation of martensite laths.
Because of the lack of other literature data, no final conclusions can be brought up at thismoment. Nevertheless, this study should motivate similar investigations on other steels, inorder to find further correlations on boundary misorientations and coarsening effects. If aVariation of the chemical composition or the parameters of heat treatment lead to differentinitial misorientations, this can be a first step to lower boundary mobilities and thus leading toa better creep resistance.
Acknowledgment
This work was supported by the Austrian Federal Ministry of Transport, Innovation andTechnology, the Province of Styria and the Austrian Research Promotion Agency (FFG),which are gratefully acknowledged.
References
[1] A. Dronhofer, J. Pesicka, A. Dlohy, G. Eggeler: On the nature of internal interfaces intempered martensite ferritic steels, Z. Metallk., 94 (5) (2003), pp. 511 - 520
[2] P . Hofer: Mikrostrukturelle Analyse als Basis für die Entwicklung neuer Kraftwerks-werkstoffe am Beispiel von G-X12 CrMoWVNbN 10-1-1, PhD thesis, GrazUniversity of Technology, 1999
[3] S. Morito et al.: The morphology and crystallography of lath martensite in Fe-C alloys,Acta Materialia 51 (2003), pp. 1789 - 1799
[4] D. Katrakova, F. Mücklich: Specimen preparation for electron backscatter diffractionPart 1: Metals, Praktische Metallographie 38 (2001) 10, pp. 547 - 565
[5] U.F. Kocks, C.N. Tome, H.R. Wenk: Texture and Anisotropy, Cambridge UniversityPress 1998
[6] G. V. Kurdjumov, G. Sachs: Über den Mechanismus der Stahlhärtung, Z. Phys. 64(1930), pp. 325 - 343
[7] Z. Nishiyama: X-Ray investigations of the mechanism of the transformation fromface- centered cubic lattice to body- centered cubic, Sc. Rep. Tohoku Imp. Univ. 23(1934), pp. 637 - 664
[8] B. Sonderegger: Charakterisierung der Substruktur in modernen Kraftwerkswerk-stoffen mittels der EBSD Methode, PhD thesis, Graz University of Technology, 2005

DISLOCATION MOBILITY IN 9% CHROMIUM STEELSEXPOSED TO CREEP
N. BöckARC Seibersdorf research GmbH, A-2444-Seibersdorf, Austria
nikolaus.boeckgarcs ac at
Abstract
The macroscopic creep deformation of 9% Cr-steels at their usual application temperature and load is primarilycaused by the motions of dislocations. These motions occur primarily due to dislocation climbing. The numericalsimulation of dislocation motion and its dependence on local microstructure is a promising approach forpredicting the creep behaviour. The simulation offers the possibility to avoid long term creep tests. Further itallows a more rigorous approach for alloy development. There exist several estimations of the mobility ofdislocations during climbing. These estimations include on the one hand material parameters like the diffusioncoefficient but on the other hand they include rather intuitive parameters like averaged distances betweendislocations. The notation "estimation" is used, because in most cases they are based on the description of singledislocations in homogeneous stress fields and are used for complex dislocation arrangements in arbitrary stressfields. Since the results of these estimations are not very satisfactory, if the microscopic inhomogeneousstructure of the 9% chromium steels is considered, there is a more physical based approach applied in thefollowing. For some test arrangements of dislocations, the stress field due to the dislocations are calculated byuse of the finite element method and Green's functions. Further the vacancy flow will be calculated. Based onthe results of these calculations dislocation velocities are calculated. The results of these calculations arecompared with the mentioned estimations. These simulations provide a first step for large scale simulation ofrealistic dislocation assembles.
Keywords: 9-12% Cr steels, dislocation dynamics, simulation, constitutive model
1. Introduction
A crucial point during development of heat resistant 9-12% Cr steels is the evaluation of thecreep behaviour of the examined alloys. In Operation the steels are exposed to loads which actwell beyond 105 hours. It is common to perform creep tests over a loading time of 10 5 hours,[1], which is not conservative since it is known that relevant micromechanical processes, forexample dissolution of precipitates, occur alter 3.104 and even more hours, [2]. To avoidunsuccessful development cycles, including such time consuming and expensive long termtests, it seems promising to enhance the use of simulation techniques.
The prediction of the creep behaviour of 9-12% Cr steels by means of simulation techniquescan roughly be divided in two important tasks. One task is the prediction of the long termstability of precipitates which have major influence on the creep resistance of the steels. Theother task is the prediction of the creep strains based on the information about themicrostructure. Today in the field of the first task the major effort is made, since somecommercial software packages exist, which allow the calculation of phase equilibria andphase transformations with satisfactory accuracy, based on proper thermodynamicformulations.
In the field of the second task there is a lack of such accurate prediction tools. There exist anumber of macroscopic constitutive models, for example the well known Dorn relation, whichare useable for description of the creep strain evolution. Since these macroscopic evolutionlaws of creep strains are mostly based on empirical parameters and numerical fitting
parameters, they are rather useful to describe the creep behaviour after the parameters havebeen evaluated in long term creep tests, than to predict the long term creep behaviour [3].Another shortcoming of this dass of empirical macroscopic laws is that they use averagedmicrostructural variables, like dislocation densities, which do not allow taking into accountthe microscopic very inhomogeneous development of dislocation interaction and patterning.These local interactions of dislocations with precipitates and the evolution of subgrains needspecial attention, since they mainly influences the overall creep behaviour.
During the last decade there was much work done in the field of so called dislocationdynamics simulation [4], [5]. The dislocation dynamics approach is a continuum mechanicalapproach. The displacements, stresses, and strains caused by the dislocations are calculated bymeans of linear elastic constitutive relations and Green's functions. The forces acting on thedislocations are described as so called material forces (Peach-Koehler forces, Fpk). Materialforces are not forces in Newton's sense, but forces which relate the motion of material defectsto the change of total energy of a considered body (like 7-integral in linear fracturemechanics), [6], [7]. This approach leads to a description which relates the degrees of freedomof the considered system to the degrees of freedom of dislocation segments. This descriptionreduces the amount of necessary degrees of freedom of the microscopic model, since it is notnecessary to evaluate the dislocation (strain, stress) field in every material point, which istheoretically necessary in a continuum mechanical description in strong form. The descriptionof the dislocations via degrees of freedom of dislocation segments which are related to thePeach-Koehler forces, allows the application of the finite element method. The displacementsof a dislocation segment are defined at discrete nodes and the displacement field between thenodes via interpolation functions. The overall solution of the problem can be calculated inweak form.
The pure mechanical part of the dislocation dynamics approach is well developed.Nevertheless there are still some remaining questions especially the efficient handling ofinteraction with boundary surfaces and the consideration of anisotropic elasticity [4].
In the field of constitutive modelling further improvement is necessary for the description oflocal interactions of dislocations, since near the core of a dislocation the linear elasticdescription is not longer valid. For constitutive modelling of dislocation glide it is common touse a so called drag coefficient, B, which describes the material dependent resistance againstdislocation motion, Fpk=B .v (v is the velocity vector related to a dislocation segment). Thereare several values of this drag coefficient published in literature, e.g. [5], but not for the steelswhich are considered within this paper and the considered temperature range.
In the temperature range from 600°C to 650°C the dislocation motion comprises glide andclimb (i.e. dislocation creep). The portion of glide motion and climb motion on the wholedislocation motion is not well known. It is often mentioned in literature that duringdislocation creep, the resistance against glide is rather low compared to the resistance againstclimb, see for example [8]. But this obviously depends on the considered material, mechanicalload range and temperature. Therefore this assumption cannot be ad hoc stated for the heatresistant 9-12% Cr steels.
To apply the dislocation dynamics method to the simulation of the creep behaviour of 9-12%Cr steels it is necessary to get quantitative values for the constitutive relations. The

quantitative calculation of drag forces against glide needs molecular dynamics simulation.The climb velocities can be calculated by means of continuum thermodynamical diffusionsimulation, since it is related to vacancy diffusion.
For simulation of the vacancy diffusion some further investigations concerning theavailability and mobility of vacancies in real microstructures are necessary. In the followingsome models are discussed which quantifies the influence of vacancy diffusion on dislocationmotion. The results of the performed simulations are discussed with respect to their usabilityin dislocation dynamics simulation. Further they are compared with analytical estimations ofclimb velocities which are published in literature [9], [10].
2. Peach-Koehler force and driving force for diffusion
In this section the influence of the Peach-Koehler force on vacancy diffusion and somelimitations of statistical thermodynamics and continuum thermodynamics are shortlydiscussed.
If two load cases are considered, and in both cases the material dependent resistance againstdislocation motion is the same, that load case that causes the higher driving force fordislocation motion (i.e. Peach-Koehler force), will cause a higher dislocation velocity. Fromthis simple Statement it follows, that, if climb motion is considered, the vacancy flow mustincrease, if the Peach-Koehler force increases. Therefore the Peach-Koehler force can berelated to the driving force of diffusion.
As mentioned above the Peach-Koehler force can be associated to the change of energy (inthis case strain energy) with respect to the motion of the dislocation, Fpk—dE/dx. A climbmotion of a dislocation caused by Fpk in a finite medium will lead to a reduction of freeenergy in the considered body, and this reduction of free energy will act as a driving force fordiffusion.
In the following gradients of free energy are defined and related to the motion of singlevacancies. If a crystal is in thermodynamic equilibrium at finite temperatures it contains anequilibrium concentration of vacancies. The number of vacancies can be calculated by meansof statistical thermodynamics. It is obvious that the number of atoms in the considered systemmust be large enough that the statistical approach makes sense and that inside of this systemthe vacancies can not be assigned to an exact position. In a continuum thermodynamicapproach the amount of vacancies is described by means of concentrations and also not byposition vectors of single vacancies. Using this continuum approach the flow has to beintegrated over position and time to get the information which averaged time passed until avacancy meets the dislocation.
In the real physical process a single vacancy is moving through the lattice, which cannot bemodelled directly neither by the statistical thermodynamics approach nor by the continuumthermodynamics approach. Nevertheless, having these limitations in mind, in the followingthe statistical thermodynamics approach is used for calculation of equilibrium concentration,and the continuum thermodynamics approach is used for calculation of the vacancy flowcaused by the Peach-Koehler force.
If only the area near the dislocation is considered, where only a limited number of atoms aresituated, both approaches reach their limitations. They are useable, but should not be over-interpreted in the core region of the dislocation. In the next section it is estimated how manyreal (single) vacancies exist around the dislocation core.
In the models used within this paper it is estimated that the continuum elastic description ofthe material is useable outside a certain distance from dislocation core. This distance isestimated to be five Burgers vectors. This definition is also used for the continuum diffusionsimulation. The diffusion flux at the boundary of this adjusted dislocation core is calculatedand related to the dislocation climb motion.
The stress field and Peach-Koehler force of an arbitrary formed dislocation is usuallycalculated by means of Green's functions [4], [9], or Fourier series [13].
3. Quantitative estimations
In the following quantitative estimations will be performed which nerve as a basis for propermodel assumptions in large scale simulations. The usability of the results will be discussed inthe last section. The main goal is, to make an estimation, how the availability and mobility ofvacancies influences the climb motion of dislocations in the considered temperature and stressrange, and which major effects have to be taken into account in large scale simulations.
There are several sources and sinks of the vacancies which are produced or annihilated duringthe climb process. The mentioned availability of the vacancies includes theirproduction/annihilation rate and their transport rate. Further it includes the available vacancieswhich already exist within the matrix material or can be assembled in the matrix material.They first question which arises, is whether there is a sufficient number of vacancies withinthe matrix to allow dislocation climb. With a vacancy formation enthalpy of 41-1 ,f =1.4 eV (for
Fe, [12]) the equilibrium vacancy concentration at T=600°C is:
= K, exp(-411,f / k B T) = 2.5e – 8 (K, includes the entropy of formation term which is
almost constant, [12], here the value K, =3, is used for the first estimation, [13]; kB is theBoltzmann constant and T is the temperature).
The following discussion is related to the edge component of a dislocation (i.e. the parts of thedislocation which are able to climb). To clarify the problem the mechanical description isbased on a plain strain formulation. An edge dislocation causes a hydrostatic stress whichinfluences the equilibrium vacancy concentration, see for example [9]. To estimate theavailable vacancies in equilibrium the vacancy concentration around a dislocation isintegrated over a cylindrical domain, including the influence of the hydrostatic stress, figure1. The dislocation lies on the cylinder axis and the inner boundary is a cylinder with a radiusof approximately five Burgers vectors (R=1.25e-9 m). The length of the cylinder is 1.25e-7 m.As discussed above the statistical approach requires a sufficiently large domain, neverthelessthis integration is applied to give an estimation. Figure 1 Shows the number of vacancies as afunction of the outer boundary radius. The number of vacancies which occurs if an additionalhydrostatic stress of =100 MPa is applied (at 600°C) is also shown.
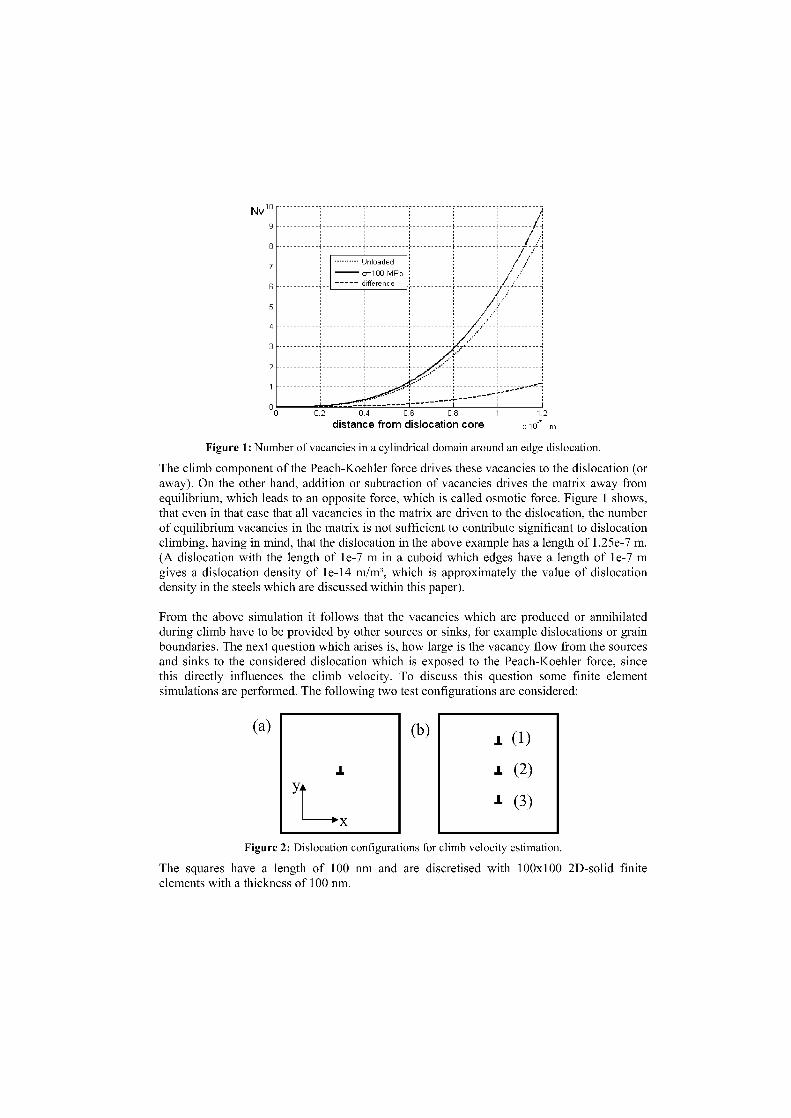
NVi°
9
8
7
6
5
4
3
2
Unloadedo=100 NIPadifference
-- --------- 4 -------- -----
0 2 0.4 0.6 0.8distance from dislocation core
1 1.2x10 7 m
(a) (b) (1)
J. 1 (2)
1 (3)► X
Figure 1: Number of vacancies in a cylindrical domain around an edge dislocation.
The climb component of the Peach-Koehler force drives these vacancies to the dislocation (oraway). On the other hand, addition or subtraction of vacancies drives the matrix away fromequilibrium, which leads to an opposite force, which is called osmotic force. Figure 1 shows,that even in that case that all vacancies in the matrix are driven to the dislocation, the numberof equilibrium vacancies in the matrix is not sufficient to contribute significant to dislocationclimbing, having in mind, that the dislocation in the above example has a length of 1.25e-7 m.(A dislocation with the length of 1 e-7 m in a cuboid which edges have a length of 1 e-7 mgives a dislocation density of 1e-14 m/m 3, which is approximately the value of dislocationdensity in the steels which are discussed within this paper).
From the above Simulation it follows that the vacancies which are produced or annihilatedduring climb have to be provided by other sources or sinks, for example dislocations or grainboundaries. The next question which arises is, how large is the vacancy flow from the sourcesand sinks to the considered dislocation which is exposed to the Peach-Koehler force, sincethis directly influences the climb velocity. To discuss this question some finite elementsimulations are performed. The following two test configurations are considered:
Figure 2: Dislocation configurations for climb velocity estimation.
The squares have a length of 100 nm and are discretised with 100x100 2D-solid finiteelements with a thickness of 100 nm.
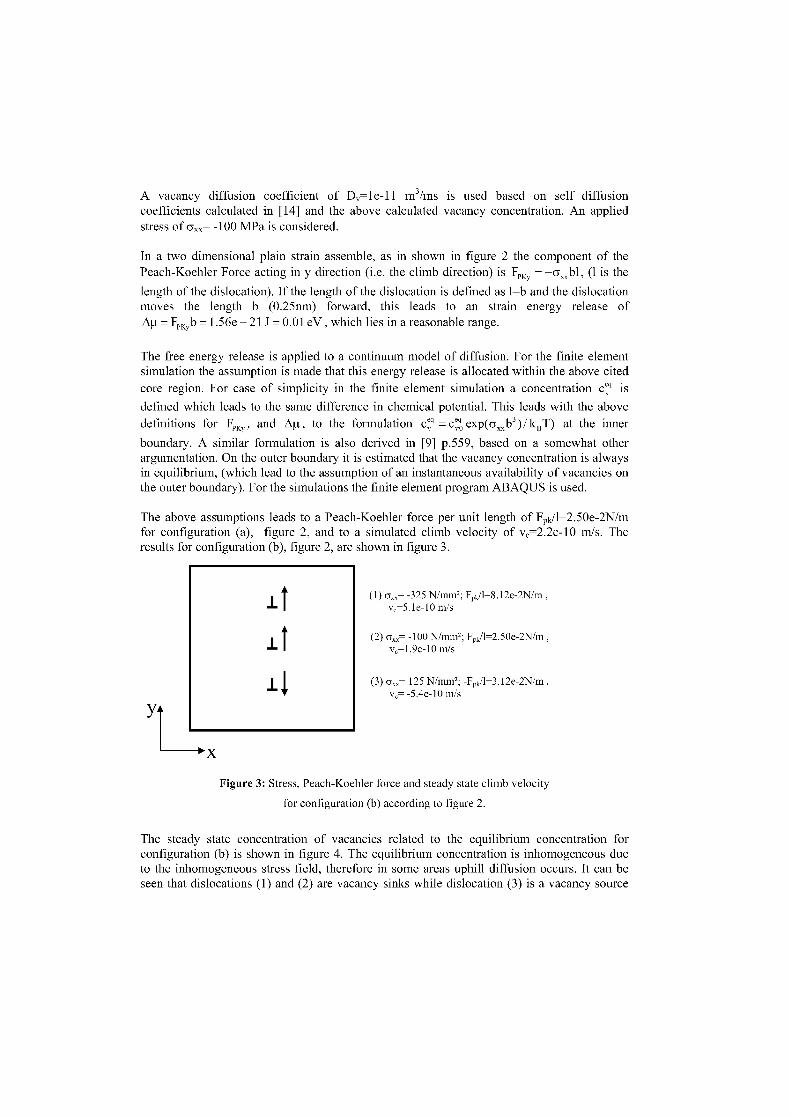
A vacancy diffusion coefficient of D v=le-11 m3/ms is used based on seif diffusioncoefficients calculated in [14] and the above calculated vacancy concentration. An appliedstress of axx= -100 MPa is considered.
In a two dimensional plain strain assemble, as in shown in figure 2 the component of thePeach-Koehler Force acting in y direction (i.e. the climb direction) is F PKY = –G„„bl, (1 is the
length of the dislocation). If the length of the dislocation is defined as 1=1) and the dislocationmoves the length b (0.25nm) forward, this leads to an strain energy release of
= FpKyb =1.56e – 21 J = 0.01 eV , which lies in a reasonable range.
The free energy release is applied to a continuum model of diffusion. For the finite elementsimulation the assumption is made that this energy release is allocated within the above cited
core region. For case of simplicity in the finite element simulation a concentration is
defined which leads to the same difference in chemical potential. This leads with the abovedefinitions for FpKy , and Ala , to the formulation = c ö exp(a „„b 3 )/ kJ) at the inner
boundary. A similar formulation is also derived in [9] p.559, based on a somewhat otherargumentation. On the outer boundary it is estimated that the vacancy concentration is alwaysin equilibrium, (which lead to the assumption of an instantaneous availability of vacancies onthe outer boundary). For the simulations the finite element program ABAQUS is used.
The above assumptions leads to a Peach-Koehler force per unit length of F„k/1=2.50e-2N/mfor configuration (a), figure 2, and to a simulated climb velocity of v c=2.2e-10 m/s. Theresults for configuration (b), figure 2, are shown in figure 3.
ltt
(1) crxx= -325 N/mm2 ; Fpk/1=8.12e-2N/mvc=5.1e-10 m/s
(2) Gxx= -100 N/mm2; Fpk/1=2.50e-2N/mvc=1.9e-10 m/s
Yi
(3) Gxx= 125 N/mm2 ; -Fpk/1=3.12e-2N/mv0 -5.4e-10 m/s
•X
Figure 3: Stress, Peach-Koehler force and steady state climb velocity
for configuration (b) according to figure 2.
The steady state concentration of vacancies related to the equilibrium concentration forconfiguration (b) is shown in figure 4. The equilibrium concentration is inhomogeneous dueto the inhomogeneous stress field, therefore in some areas uphill diffusion occurs. It can beseen that dislocations (1) and (2) are vacancy links while dislocation (3) is a vacancy source
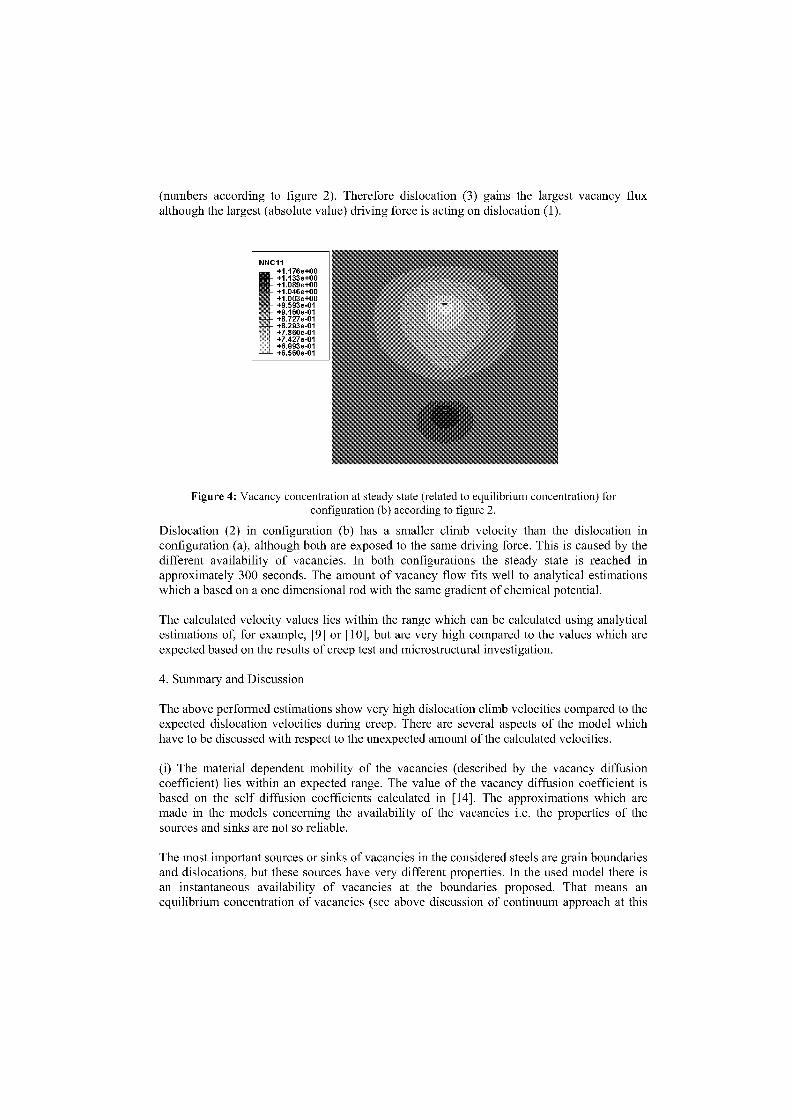
(numbers according to figure 2). Therefore dislocation (3) gains the largest vacancy fluxalthough the largest (absolute value) driving force is acting on dislocation (1).
NNC11- +1.176e+00
+1.133e+00+1.089e+00+1.046e+00
- +1.0030+00+9.593e-01+9.160e-01+8.727e-01+8.293e-01+7.860e-01+7.427e-01+6.993e-01+6.560e-01
Figure 4: Vacancy concentration at steady state (related to equilibrium concentration) forconfiguration (b) according to figure 2.
Dislocation (2) in configuration (b) has a smaller climb velocity than the dislocation inconfiguration (a), although both are exposed to the same driving force. This is caused by thedifferent availability of vacancies. In both configurations the steady state is reached inapproximately 300 seconds. The amount of vacancy flow fits well to analytical estimationswhich a based on a one dimensional rod with the same gradient of chemical potential.
The calculated velocity values lies within the range which can be calculated using analyticalestimations of, for example, [9] or [10], but are very high compared to the values which areexpected based on the results of creep test and microstructural investigation.
4. Summary and Discussion
The above performed estimations show very high dislocation climb velocities compared to theexpected dislocation velocities during creep. There are several aspects of the model whichhave to be discussed with respect to the unexpected amount of the calculated velocities.
(i) The material dependent mobility of the vacancies (described by the vacancy diffusioncoefficient) lies within an expected range. The value of the vacancy diffusion coefficient isbased on the self diffusion coefficients calculated in [14]. The approximations which aremade in the models concerning the availability of the vacancies i.e. the properties of thesources and sinks are not so reliable.
The most important sources or sinks of vacancies in the considered steels are grain boundariesand dislocations, but there sources have very different properties. In the used model there isan instantaneous availability of vacancies at the boundaries proposed. That means anequilibrium concentration of vacancies (see above discussion of continuum approach at this

length scale). This high availability seems to be realistic at large angle grain boundaries (inthe considered steels these are former austenite grain boundaries or boundaries between lathpackages (not between the laths themselves), and some of the boundaries between the matrixand M23C6 precipitates). At small angle grain boundaries (boundaries between the martensitelaths for example) there is a larger resistance against the integration or rejection of vacancies,also at boundaries with coherent or semicoherent precipitates like MX, or M23C6 in earlystages of precipitation.
Even more obvious is this difference of the source properties of dislocations. If a dislocationis exposed to a load which causes the production of vacancies it is a very effective source ofvacancies for another dislocation which needs vacancies for its movement. If the dislocationhas a stable position or even needs vacancies for its motion it will not be very useable sourceof vacancies. The usability of dislocations as source or sink of vacancies can be related to thePeach-Koehler force acting on them (the part of the Peach-Koehler force which causes climb)and is therefore taken into account in the above model.
For the grain boundaries an equivalent quantitative calculation is not so obvious, but it seemsclear that it has also to be related to the driving force for grain growth. Even in the simpleestimation which is performed above it can be seen, that the different availability of vacanciescauses different velocities for the single dislocation in configuration (a) and dislocation (2) inconfiguration (b), which are both exposed to the same driving force.
(ii) There are several other important driving forces for vacancy diffusion which can be actingagainst the Peach-Koehler force driven diffusion.
Since the vacancies themselves causes positive residual stresses they will diffuse due to astress fields. Therefore the local stress fields caused for example by inclusions, stabledislocation arrangements (for example subgrain boundaries) or simple the differentorientation of neighbouring (anisotropic) grains can reduce the vacancy flow to a dislocationwhich is exposed to a Peach-Koehler force.
In addition grain growth and dissolution or precipitation, which occur during creep exposure,cause substitutional diffusion, which is based on vacancy diffusion. Therefore the drivingforces for these processes can also be competing with the Peach-Koehler force.
(iii) The Peach-Koehler forces acting on the dislocations depend on the stress state, which ison a microscopic scale very inhomogeneous. The loading stress itself is inhomogeneous dueto stress concentrations caused by precipitates and due to the anisotropic material behaviourof the grains. In addition the self stress of the considered dislocation and the stresses causedby other dislocations have to be taken into account. Further there are many sources of residualstresses as for example the misfit strains caused by precipitates. If the microstructure is asinhomogeneous as in the considered 9%Cr steels, the forces acting on the dislocations vary atshort distances. The formation of stable dislocation arrangements, for example subgrainboundaries, also influences the Peach-Koehler on a dislocation inside such a stablearrangement, but these effects (influence of other dislocations) are considered within thedislocation dynamics simulation (as it is shown in the above calculation of the Peach-Koehlerforces in arrangement (b)).
Hence, to make a useable dislocation dynamics simulation including dislocation climb, thedifferent driving forces acting on the vacancies, the different locations and "quality" ofsources and sinks and the local stress fields which influences the Peach-Koehler forces haveto be taken into account. The use of averaged parameters will not allow to build models whichdescribe the local physical behaviour because the microstructure is locally to inhomogeneous.Such averaged parameters always have empirical or even only numerical character.
5. Summary and conclusion
The dislocation dynamics simulation seems to be very useful tool for prediction of dislocationarrangements and creep strain evolution (despite of the fact that there are some aspects asshort range interactions between dislocations, or useable methods of calculating Green'sfunctions in finite anisotropic areas etc., which need further improvements). The use ofaveraged microstructural parameters in connection with empirical evolution laws does notoffer the possibility of further improvement based on thermodynamical relations.
The performed simulations provide some basic estimations for the coupling of dislocationdynamics simulation with continuum simulation of diffusion. The proper calculation ofvacancy diffusion is a basis for a usable description of dislocation motion due to climb. Dueto the local very inhomogeneous microstructure the estimation of averaged dislocationvelocities will not allow to gain further knowledge about the quantitative influences ofmicrostructure on the motion of the dislocations. But this knowledge is necessary foroptimising the microstructure with respect to creep resistance. Therefore based on thepresented simulation models further improvements, related to the above discussed aspects,will be implemented to get useable models for dislocation dynamics simulation.
Thanks go to my colleagues at Competence Centre of Micro and Nanocharacterisation atARC Seibersdorf research Gmbh for helpful discussions and providing of the test results oflong term creep tests, including microstructural characterisation. Financial support wasprovided by the Austrian Research Promotion Agency Ltd. (FFG) under ACCEPT - COST536, Proj. No. 808.789, and ARC Seibersdorf research Gmbh. This support is gratefullyacknowledged.
[1] K. H. Mayer, R. Blum, P. Hillenbrand, T.-U. Kern, M. Staubli. Development Steps of newsteels for advanced steam power plants. Materials for advanced power engineering 2002:Proceedings of the 7 ffi Liege Conference, Part III, 2002, 1385-1396.
[2] F. Kager, K. Spiradek-Hahn, N. Böck, S. Höfinger, M. Brabetz, G. Zeiler. Superior long-term creep behaviour and microstructural evolution of 9%Cr-steels with boron. Materials foradvanced power engineering 2006: Proceedings of the 8ffi Liege Conference, (thereproceedings), 2006.
[3] N. Böck, F. Kager. Finite element simulation of the creep behaviour of 9% chromiumsteels based on micromechanical considerations. Creep Deformation and Fracture, Design,and Life Extension. Edited by R.S. Mishra, J.C. Earthman, S.V. Raj, and R. Viswanathan.Materials Science & Technology Conference , Pittsburgh 2005, p 149-158.
[4] N. M: Ghoniem, E. P. Busso, N. Kioussis. Multiscale modelling of nanomechanics andmicromechanics: an overview. Philosophical Magazine, 2003, Vol. 83, Nos. 31-34, 3475-3528.
[5] H. M. Zhbib, M. Hiratani, M. Shehadeh. Multiscale discrete dislocation plasticity.Continuum scale Simulation of engineering materials. Edited by Dierk Raabe et al. Wiley2004.
[6] R. Phillips. Crystal, defects and microstructures, modelling across scales. Cambridgeuniversity press. 2002.
[7] J. D. Eshelby. The elastic energy momentum tensor. Journal of elasticity, Vol. 5, Nos. 3-4,November 1975.
[8] R. Bürgel. Handbuch Hochtemperaturwerkstofftechnik. Vieweg 2001.
[9] J. P. Hirth, J. Lothe. Theory of dislocations. Krieger Publishing Company, 1992.
[10] N. M. Ghoniem, J. R. Matthews, R. J. Amodeo. A dislocation model for creep inengineering materials. Res Mechanica 29 (1990) 197-219.
[11] T. Mura. Micromechanics of defects in solids. Kluwer academic publishers. 1998.
[12] M. E. Glicksman. Diffusion in solids, Field theory, solid-state principles, andapplications. Wiley. 2002.
[13] D. A.. Porter, K. E. Easterling. Phase transformations in Metals and Alloys.Chapman&Hall. 1996.
[14] H. Cerjak, P. Hofer, B. Schaffernak. The influence of microstructural aspects an theservice behaviour of advanced power plant steels. ISIJ international. Vol. 39 (1999), No. 9,pp874-888.

EFTEM INVESTIGATIONS ON PRECIPITATES IN A CREEPRESISTANT 9-12% CR STEEL
B. Sondereggen, G. Kothleitner2, W. Rechberger2, H. Cerjakl
1: Institute for Materials Science, Welding and Forming, Graz University of Technology,Kopernikusg. 24, A- 8010 Graz, Austria
2: Research Institute for Electron Microscopy and Fine Structure Research, Graz Universityof Technology, Steyrerg. 17, A-8010 Graz, Austria
Abstract
9-12% chromium steels are well established materials for high temperature components in ultra efficient powerplants. One important parameter for the creep resistance of these steels is the formation and interaction ofdifferent precipitate populations like NbC, VN, M23C6, Laves phase and modified Z-phase. Energy filtered TEM(EFTEM) studies were carried out on samples of the European COST steel CB8. Enhanced analysis methodswere applied to determine the size, volume fraction and number frequency of precipitates with arbitrary sizedistribution in samples of varying thickness. The results show growth, coarsening and dissolution of precipitatesduring in-service exposure. The dissolution of VN precipitates at long running times was identified as the mostlikely reason for the drop of creep resistance of the steel CB8. Furthermore, the drop in the number density ofVN precipitates corresponds with the first appearance of the V- and N- containing modified Z-phase Cr(V,Nb)N.
Keywords: EFTEM, precipitates, size distribution, creep resistant steel, mod. Z-phase
Introduction
Creep resistant 9-12% Cr steels are used for high temperature components in fossil powerplants. Amongst other parameters like oxidation resistance, ductility etc., high temperaturecreep resistance is one of the key factors for the reliability and long life of these components.State-of-the-art steels withstand temperatures of 600-620°C at mechanical stresses of lOOMPafor over 10 years (10 5h). However, further increase of the Operation temperature allowsconstructing more efficient power plants with less emission of CO 2. The EuropeanCooperation in the field of Scientific and Technical Research (COST) is aiming at this goal inAction 536 [1].The creep resistance is mainly influenced by the presence and the stability of different kindsof precipitates at service conditions. According to the backstress concept [2], a high numberof Small precipitates are the best precondition for improved creep properties. Mostimportantly, this high number density must not decrease distinctively during service. Effectslike coarsening and dissolution of precipitates accelerate the number density decrease, andthus the drop of creep resistance.In the European COST program 522 (the predecessor of 536), several types of Boron alloyedtest melts have been developed [3]. One of the most promising candidates for creepresistance, the test melt CB8, was chosen for long-term creep tests. lt turned out that CB8shows a drop in creep resistance at times greater than 10 4h, although the initial microstructureshows all properties needed for a good performance. Therefore, extensive studies of themicrostructure were carried out to help understanding this effect.Due to the different sizes of precipitates, several experimental techniques have to be used tofully quantify precipitate parameters. Techniques commonly used are SEM phase contrastimaging [4], TEM/EFTEM [5, 6] and atom probe [7]. This paper focuses on EFTEM
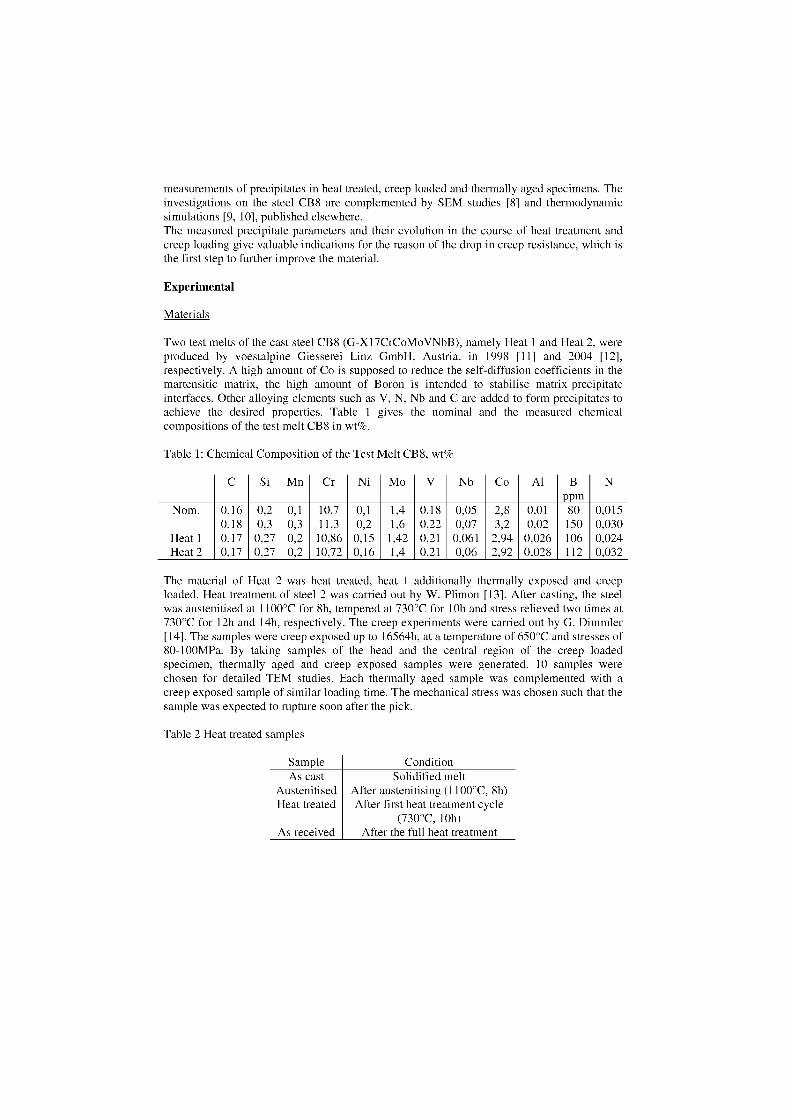
measurements of precipitates in heat treated, creep loaded and thermally aged specimens. Theinvestigations an the steel CB8 are complemented by SEM studies [8] and thermodynamicsimulations [9, 10], published elsewhere.The measured precipitate parameters and their evolution in the course of heat treatment andcreep loading give valuable indications for the reason of the drop in creep resistance, which isthe first step to further improve the material.
Experimental
Materials
Two test melts of the cast steel CB8 (G-X17CrCoMoVNbB), namely Heat 1 and Heat 2, wereproduced by voestalpine Giesserei Linz GmbH, Austria, in 1998 [11] and 2004 [12],respectively. A high amount of Co is supposed to reduce the self-diffusion coefficients in themartensitic matrix, the high amount of Boron is intended to stabilise matrix-precipitateinterfaces. Other alloying elements such as V, N, Nb and C are added to form precipitates toachieve the desired properties. Table 1 gives the nominal and the measured chemicalcompositions of the test melt CB8 in wt%.
Table 1: Chemical Composition of the Test Melt CB8, wt%
C Si Mn Cr Ni Mo V Nb Co Al Bppm
N
Nom. 0,16 0,2 0,1 10,7 0,1 1,4 0,18 0,05 2,8 0,01 80 0,0150,18 0,3 0,3 11,3 0,2 1,6 0,22 0,07 3,2 0,02 150 0,030
Heat 1 0,17 0,27 0,2 10,86 0,15 1,42 0,21 0,061 2,94 0,026 106 0,024Heat 2 0,17 0,27 0,2 10,72 0,16 1,4 0,21 0,06 2,92 0,028 112 0,032
The material of Heat 2 was heat treated, heat 1 additionally thermally exposed and creeploaded. Heat treatment of steel 2 was carried out by W. Plimon [13]. After casting, the steelwas austenitised at 1100°C for 8h, tempered at 730°C for 10h and stress relieved two times at730°C for 12h and 14h, respectively. The creep experiments were carried out by G. Dimmler[14]. The samples were creep exposed up to 16564h, at a temperature of 650°C and Stresses of80-100MPa. By taking samples of the head and the central region of the creep loadedspecimen, thermally aged and creep exposed samples were generated. 10 samples werechosen for detailed TEM studies. Each thermally aged sample was complemented with acreep exposed sample of similar loading time. The mechanical stress was chosen such that thesample was expected to rupture soon after the pick.
Table 2 Heat treated samples
SampleAs cast
AustenitisedHeat treated
As received
Condi tion Solidified melt
After austenitising (1100°C, 8h)After first heat treatment cycle
(730°C, 10h)After the full heat treatment
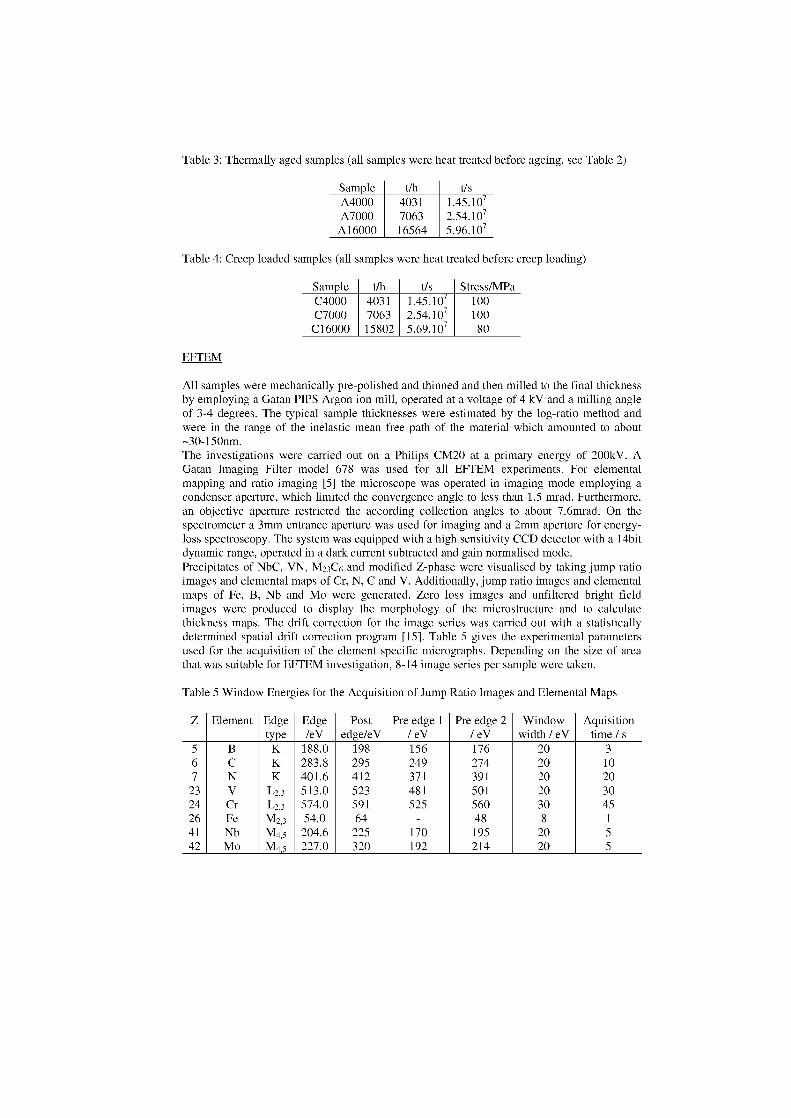
Table 3: Thermally aged samples (all samples were heat treated before ageing, see Table 2)
Sample t/h
tisA4000
4031
1.45.10'A7000
7063
2.54.107A16000
16564
5.96.107
Table 4: Creep loaded samples (all samples were heat treated before creep loading)
Sample t/h t/s Stress/MPaC4000 4031 1.45.10' 100C7000 7063 2.54.107 100
C16000 15802 5.69.107 80
EFTEM
All samples were mechanically pre-polished and thinned and then milled to the final thicknessby employing a Gatan PIPS Argon ion mill, operated at a voltage of 4 kV and a milling angleof 3-4 degrees. The typical sample thicknesses were estimated by the log-ratio method andwere in the range of the inelastic mean free path of the material which amounted to about-30-150nm.The investigations were carried out on a Philips CM20 at a primary energy of 200kV. AGatan Imaging Filter model 678 was used for all EFTEM experiments. For elementalmapping and ratio imaging [5] the microscope was operated in imaging mode employing acondenser aperture, which limited the convergence angle to less than 1.5 mrad. Furthermore,an objective aperture restricted the according collection angles to about 7.6mrad. On thespectrometer a 3mm entrance aperture was used for imaging and a 2mm aperture for energy-loss spectroscopy. The system was equipped with a high sensitivity CCD detector with a l4bitdynamic range, operated in a dark current subtracted and gain normalised mode.Precipitates of NbC, VN, M23C6 and modified Z-phase were visualised by taking jump ratioimages and elemental maps of Cr, N, C and V. Additionally, jump ratio images and elementalmaps of Fe, B, Nb and Mo were generated. Zero loss images and unfiltered bright fieldimages were produced to display the morphology of the microstructure and to calculatethickness maps. The drift correction for the image series was carried out with a statisticallydetermined spatial drift correction program [15]. Table 5 gives the experimental parametersused for the acquisition of the element specific micrographs. Depending on the size of areathat was suitable for EFTEM investigation, 8-14 image series per sample were taken.
Table 5 Window Energies for the Acquisition of Jump Ratio Images and Elemental Maps
Z Element Edgetype
Edge/eV
Postedge/eV
Pre edge 1/ eV
Pre edge 2/ eV
Windowwidth / eV
Aquisitiontime / s
5 B K 188.0 198 156 176 20 36 C K 283.8 295 249 274 20 107 N K 401.6 412 371 391 20 20
23 V L2,3 513.0 523 481 501 20 3024 Cr L2,3 574.0 591 525 560 30 4526 Fe M2,3 54.0 64 - 48 8 141 Nb M4,5 204.6 225 170 195 20 542 Mo M4,5 227.0 320 192 214 20 5
Evaluation of precipitate parameters
The precipitates found in the elemental maps and jump ratio images were analysed withGatan's Digital Micrograph software package. In this software, mean equivalent circlediameters of the precipitates projections, its XY-positions and shape parameters can becalculated. Together with the normalised thickness maps, these datasets were used todetermine volume fraction, number of precipitates per volume, mean and median diameterand size distributions of the second phases.
These analyses were carried out using mathematical routines programmed in the commercialsoftware MatLab. As a basis for the calculation, the stereologic evaluation equations ofUnderwood [16], Hättestrand and Andren [17] were applied in a slightly modified manner:These authors derived mean correction factors from mean diameters and mean samplethicknesses, and applied these factors to all precipitates. This approach works perfectly wellfor a population of precipitates with constant size in a sample of constant thickness. In thiswork, the sequence of evaluation was reversed: First, correction factors for each particle werecalculated by using the diameter of the particle and the sample thickness at the position of theparticle. Afterwards, a statistical analysis for calculating the parameters of the precipitatepopulations was performed. Using individual correction factors for every single particleinstead, enables the evaluation of parameters for precipitate populations with different sizedistributions in a sample of varying thickness. The following equations were used:
2d
VsGnpm
= =As„,„p„ 2d,v,i+3t,
Equation 1
where fv is the total phase fraction. fv is calculated with the parameters Vv (absolute volume(sample volume)of the phase in the examined sample volume), Vsampie (sam volume), Asample (sample area),
Ai (measured area of precipitate i), (measured equivalent circle diameter of precipitate i)and t, (foil thickness at the position of precipitate i).
1 1Nv — L
As„,„,e ti+ diEquation 2
where Nv is the number of precipitates per unit volume. The real diameter d, is calculated withequation 3:
72 (i 2 4d .t Equation 3
Huge particles are more likely to intersect a sample, when having the same number density assmall particles. This can be considered by the factor wi, which gives the probability of aspherical precipitate having its centre located inside the sample volume, when intersecting thesample:
w, —di Equation 4
d, is the real diameter of the precipitate calculated by equation 3. By using this probabilitywi, one finds for the mean precipitate diameter J:

Equation 5
t i + di
When calculating size distributions, the probability factor given in equation 4 is used for eachprecipitate.
Results and Discussion
Qualitative Description of Precipitate Evolution:
The as cast condition of the steel showed no statistically spread precipitates in the matrix.Some string-shaped precipitates located an former austenite grain boundaries were identifiedas Mo-rich M3B 2 phases by Selected Area Diffraction (SAED) [12].
The first precipitates in the matrix appear after austenitising and were determined to be NbCparticles. These bulky precipitates showed a low number density (10 18 m-3 ) and a size ofroughly 70nm. Both parameters stay practically constant during the rest of the heat treatment,thermal ageing and creep loading.
The most noticeable change in microstructure happens after the first heat treatment cycle.High numbers of Cr-rich M23C6 (confirmed by SAED) and VN (confirmed by ELNES)precipitates form at subgrain boundaries and martensite lath boundaries [12, 18]. Thoughstatistical deviation blur the results, both precipitate phases appear to have already reachedmost of their equilibrium phase at this point of time.
During tempering and creep loading, M23C6 and VN precipitates stay the most common types.Mo-rich Laves phase forms after 50h of tempering at 650°C and was examined by SEM [8].As shown in the next section, M23C6 precipitates coarsen, while VN particles keep their initialsize for at least 7000h.
A very Small number of precipitates containing Cr and V were detected only in the thermallyaged sample A16000 and the creep sample C16000, both with the longest running times ofroughly 16000h. According to literature, this phase was also found in similar steels after longcreep and ageing times and is assumed to be modified Z-phase Cr(V,Nb)N by a number ofauthors due to its chemistry [17, 19-21], and approved to be so by measurements of thecrystallography with CBED of TEM Samples (Papst-Letofsky et al [23]) and SAED ofextraction replicas (Vodarek and Strang [24]). Figure 1 shows a micrograph of sampleA16000 with M23C6 and VN precipitates, as well as a precipitate of the Cr- and V-rich phase.
Simultaneously with the first appearance of the modified Z-phase, the number density of VNprecipitates decreases consistently. This coincidence, which lowers the overall numberfrequency of precipitates, was also found in similar 9-12% Cr steels [25]. At the same time,the creep resistance of the steel CB8 drops drastically. The obvious correlation in time ofthese three incidences strongly suggests the modified Z-phase as one of the reason for thedeterioration of the materials properties.
As the number density of the modified Z-phase was to low for accurate statistical evaluations,a detailed quantitative study of the most common precipitates, namely M23C6 and VN, wascarried out in order to further clarify the precipitate evolution.
- rvizeCe
Fe A/121 jr
Figure 1: Cr-carbides, VN and Cr- and V-rich phase (presumably mod. Z-phase) found in thermally aged sample A16000
Quantitative Evaluation of Precipitate Parameters:
To obtain statistics for the precipitate populations of M23C6 and VN, Cr jump ratio images andV elemental maps were used. The numbers of Laves phase, NbC and mod. Z-phase were toolow for a proper statistic. The number of M23C6 detected per sample was between 49 and 154,the number of VN between 18 and 101, respectively.
Figure 2a and 2b show the size distribution of M23C6 and VN precipitates in heat treated andthermally aged samples, calculated with equations 3 and 4, from their first appearance insample "heat treated" up to sample A16000. Nearly all distributions are left shifted with onesingle peak. Analysing the M23C6 particles, one clearly recognises the shift of the peakposition from 60nm in the sample "heat treated" to 120nm after 16000h of tempering. Incontrary to this behaviour, VN precipitates only seem to grow until 4000h of tempering. Afterthis sample condition no clear tendency is obvious. For further analysis it is inevitable todetermine mean diameters, the volume fraction and, most important, the number density inthe course of the experiments.
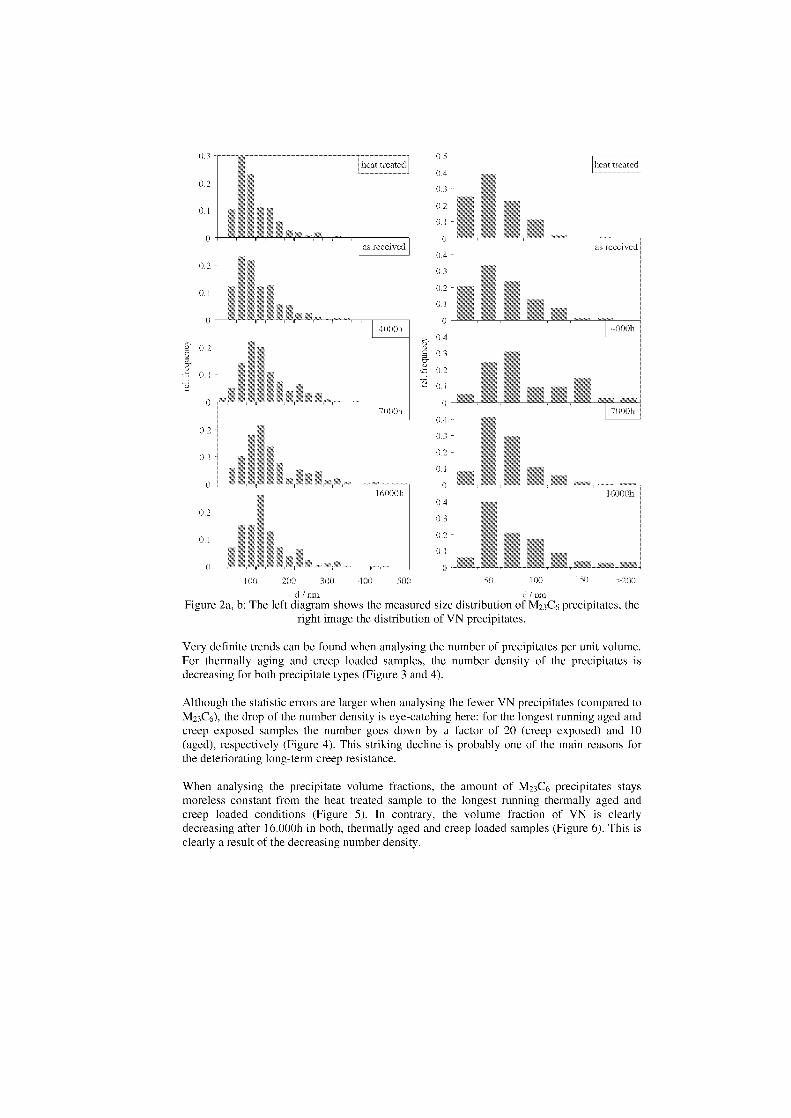
0.5
0.4 hegt treated
02
0.1
as received '1
0 .4 -
03
0 .2 -
04000h
•„,„, 0.4 -2 0.3
0.1
, 7000h
0.4-
0.30.3 -
0 .2 -
0.1
016000h
0.4
0.3
0 .2 -
0.1
0.2-,
0.1
160(106
0.2
0.1
0 0 -
1 11) 2( _ 300 400 50C 50 100 150 >2) 1
d / nen d / nmFigure 2a, b: The left diagram shows the measured size distribution of M23C6 precipitates, the
right image the distribution of VN precipitates.
Very definite trends can be found when analysing the number of precipitates per unit volume.For thermally aging and creep loaded samples, the number density of the precipitates isdecreasing for both precipitate types (Figure 3 and 4).
Although the statistic errors are larger when analysing the fewer VN precipitates (compared toM23C6), the drop of the number density is eye-catching here: for the longest running aged andcreep exposed samples the number goes down by a factor of 20 (creep exposed) and 10(aged), respectively (Figure 4). This striking decline is probably one of the main reasons forthe deteriorating long-term creep resistance.
When analysing the precipitate volume fractions, the amount of 1\423C6 precipitates staysmoreless constant from the heat treated sample to the longest running thermally aged andcreep loaded conditions (Figure 5). In contrary, the volume fraction of VN is clearlydecreasing after 16.000h in both, thermally aged and creep loaded samples (Figure 6). This isclearly a result of the decreasing number density.
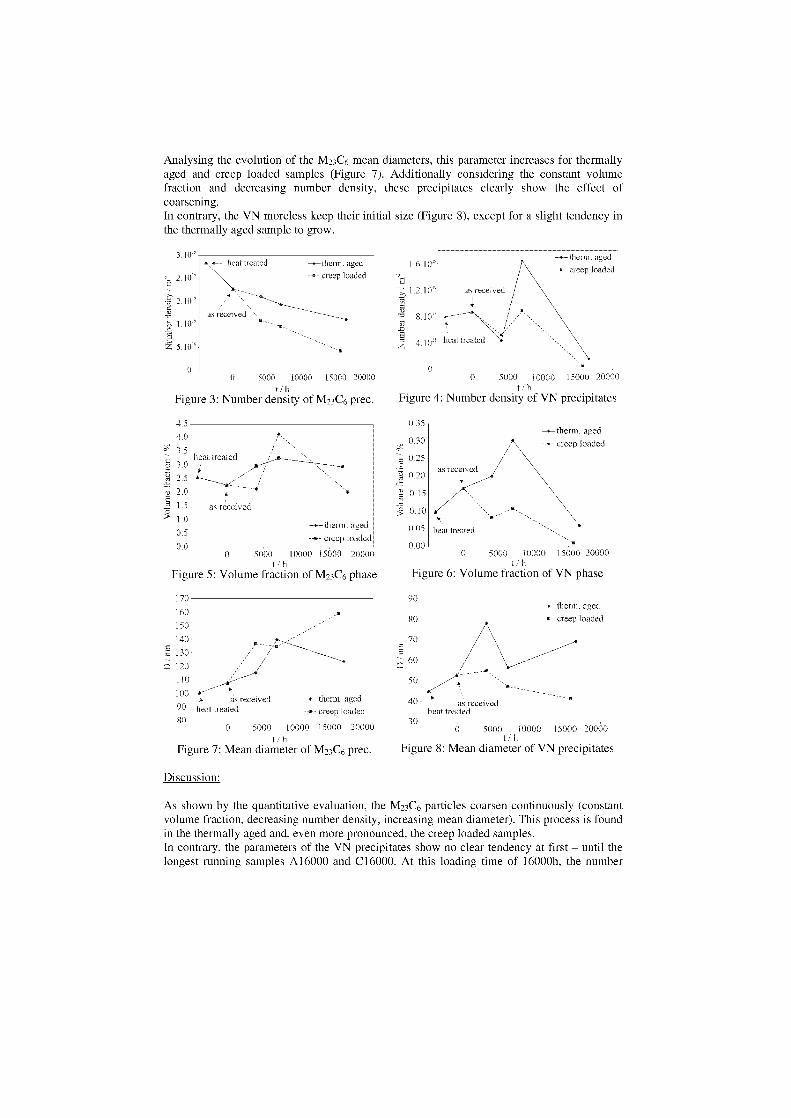
—.—thenn. agedcreep loaded2 10
heat treated3.10'
agedcreep loaded
1- 1'-
- asteceivedheal Ircated
Analysing the evolution of the M23C6 mean diameters, this parameter increases for thermallyaged and creep loaded samples (Figure 7). Additionally considering the constant volumefraction and decreasing number density, these precipitates clearly show the effect ofcoarsening.In contrary, the VN moreless keep their initial size (Figure 8), except for a slight tendency inthe thermally aged sample to grow.
00 5000 10000 15000 20000
t/ hFigure Number density of VN precipitates
0 5000 10000 15000 20000t h
Figure 3: Number density of M23C6 prec.
:-.0 5000 10000 15600 20000 0 5000 10000 15000 20000
t / h t / h
Figure 5: Volume fraction of M23C6 phase Figure 6: Volume fraction of VN phase
170 90160 801501401 701301 --- 602 120 j 50
100 as received —+—therm. aged 4090 heat treated - - creep loaded80 300 5000 10000 15000 20060
t / hFigure 7: Mean diameter of M23C6 prec.
Discussion:
As shown by the quantitative evaluation, the M23C6 particles coarsen continuously (constantvolume fraction, decreasing number density, increasing mean diameter). This process is foundin the thermally aged and, even more pronounced, the creep loaded samples.In contrary, the parameters of the VN precipitates show no clear tendency at first — until thelongest running samples A16000 and C16000. At this loading time of 16000h, the number
4.5-1.03.53,0
'rd' 2.5d 2.0
7,1-§ 1.51.00.50.0
0.350.30
0252, 0.20,
0.150.100.050.00
6 5000 10000 15000 20000t
Figure 8: Mean diameter of VN precipitates
frequency drops dramatically. At the same moment, the V- and N- containing mod. Z-phaseappears for the first time, consuming the nitrogen formerly bound in VN precipitates. Theprecipitates of this phase were found to have greater diameters than VN (by a factor of 2), andtherefore producing a much lower number frequency, when consuming the same amount ofNitrogen. Conspicuously, the creep properties deteriorate at the same moment.
This behaviour is also found in similar steels [25]. The mod. Z-phase is known to coarsen fast[26], and thus further degrading the creep properties. Numerical thermodynamic studies basedon new databases [26, 27] show that this phase in fact is an equilibrium phase, and displacingVN in the long run. First kinetic simulations, carried out on the software MatCalc, alsoapprove this behaviour [27]. The slow coarsening of M23C6 precipitates additionallycontributes to the overall decrease of the precipitates number density.
Conclusion
The formation and interaction of precipitates in the course of heat treatment, thermally ageingand creep loading were measured successfully by TEM/EFTEM for the COST steel CB8. Theprecipitate types VN and M23C6 were studied in detail by evaluating the evolution of their size(distribution), volume fraction and number density. As most remarkable effect, the decrease inthe number density of VN by a factor of 10-20 in the longest running Samples was identified.This corresponded to the first appearance of V- and N- containing mod. Z-phase Cr(V,Nb)N.The formation of mod. Z-phase is found as the most likely reason for the drop of the VNnumber density, and therefore the drop of long-term creep resistance of the steel CB8.
For Future developments, the emphasis must be laid on suppressing the formation of mod. Z-phase as long as possible. For this goal it is inevitable to associate the microstructuralinvestigations with thermodynamic kinetic simulations of the precipitate evolution, in order tofind improved chemical compositions of 9-12% Cr steels.
Acknowledgements
The authors want to thank the Austrian Federal Ministry of Transport, Innovation andTechnology, the Province of Styria and the Austrian Research Promotion Agency (FFG) fortheir financial Support.
References
[1] COST - European Cooperation in the field of Scientific and Technical Research, Action536: Alloy development for Critical Components of Environmental friendly PowerplanT (ACCEPT); htip://costcordi s.luis rohe non del in 1 cfm ? an ti on=5 3 6
[2] B. Reppich: Ein auf Mikromechanismen abgestütztes Modell der Hochtemperatur-festigkeit und Lebensdauer für teilchengehärtete Legierungen, Zeitschrift fürMetallkunde, 73 (11), 1982, pp. 697-805
[3] B. Schaffernak: Charakterisierung von 9-12% Cr Stählen Mittels ThermodynamischerModellrechnungen, PhD thesis, Graz University of Technology, 2000
[4] L. Korcakova, J. Hald, M. A. J. Somers: Quantification of Laves phase particle size in9CrW steels, Materials Characterisation, 47, 2001, pp. 111-117.
[5] F. Hofer, P. Warbichler: Improved imaging of secondary phases in solids by energy-filtering TEM, Ultramicroscopy, 63 (1), 1996, pp. 21-25.
[6] M. Hättestrand, H.-O. Andren: Influence of strain on precipitation reactions duringcreep of an advanced 9% chromium steel, Acta Mater., 49, 2001, pp. 2123-2128.
[7] A. Gustafson, M. Hättestrand: Coarsening of precipitates in an advanced creep resistant9% chromium steel-quantitative microscopy and simulations, Materials Science andTechnology, 333 (1-2), 2002, pp. 279-286.
[8] G. Dimmler, P. Weinert, E. Kozeschnik, H. Cerjak: Quantification of the Laves phase inadvanced 9-12% Cr steels using a standard SEM, Materials Characterisation, 51, 2003,pp. 341-352.
[9] J. Rajek, E. Kozeschnik, H. Cerjak: Simulation of precipitation in a complex 9-12% Crsteel for modern steam power plants, Proc. Mat. Sci. Tech. 2003, USA 2003
[10] J. Rajek, E. Kozeschnik and H. Cerjak: Computer simulation of precipitation in acomplex 9-12% Cr-steel during fabrication heat treatment, Proc. "EPRI 4th Int. Conf.Adv. in Mat. Tech. for Fossil Power Plants", Hilton Head Island, USA, 2004
[11] R. Hanus: COST Report VOEST Alpine Gießerei Linz GmbH, COST 522, 2000[12] B. Sonderegger: Charakterisierung der Substruktur in modernen Kraftwerkswerkstoffen
mittels der EBSD Methode, PhD thesis, Graz University of Technology, 2005[13] S. W. Plimon: Simulation einer großtechnischen Wärmebehandlung und begleitende
mikrostrukturelle Untersuchung an einem modernen 9-12% Cr Stahl, Diploma thesis,Graz University of Technology, 2004
[14] G. Dimmler: Quantifizierung der Kriech- und Zeitstandfestigkeit von 9-12% Cr Stählenauf Mikrostruktureller Basis, Ph.D. thesis, Graz University of Technology, 2003
[15] B. Schaffer, W. Grogger, G. Kothleitner: Automated spatial drift correction for EFTEMimage series, Ultramiscroscopy 101, 2004, pp. 123-128
[16] E. E. Underwood: Quantitative Stereology, London, 1970, pp.174[17] M. Hättestrand, H.-O. Andren: Evaluation of particle size distribution in a 9% Cr steel
using energy filtered transmission electron microscopy, Micron, 32 , 2001, pp. 789-797[18] F. Hofer, P. Warbichler, A. Scott, R. Brydson, I. Galesic, B. Kolbesen, J. Microscopy,
204 (2), 2001, pp.166.[19] K. Kimura, K. Suzuki, Y. Toda, H. Kushima, F. Abe: Precipitation of Z-phase and
degradation behaviour of mod. 9Cr-lMo steel, Proc. Materials for advanced powerengineering, Liege, 2002, pp. 1171-1180.
[20] A. Strang, V. Vodarek: Microstructural stability of high chromium ferritic power plantsteels, Proc. Microstructural development and Stability in high Chromium ferritic powerplant steels, Cambridge, 1995, pp. 31-51.
[21] J. Bursik, N. Merk: Quantitative microstructural assessment of P91 ferritic steel afterlong term creep at high temperature, Proc. Mechanical Behaviour of Materials at HighTemperature, Sesimbra, 1995, pp. 1-12.
[22] P. Hofer: Mikrostrukturelle Analyse als Basis für die Entwicklung neuer Kraftwerks-werkstoffe am Beispiel von G-X12CrMoWVNbN 10-1-1", PhD thesis, Graz Universityof Technology, 1999.
[23] 1. Papst, P. Warbichler, F. Hofer, B. Schaffernak, E. Letofsky: Identifizierung dermodifizierten Z-Phase mittels konvergenter Elektronenbeugung, MetallographietagungDortmund, Germany, 6.-10. September 1999
[24] V. Vodarek, A. Strang: Z Phase characteristics in martensitic 12CrMoVNb steels,Materials for advanced power engineering, Liege, 2002, pp. 1223-1231.
[25] K. H. Mayer: Vergleichende Bewertung des Einflusses der Mikrostruktur auf dieKriechfestigkeit der borlegierten COST-Stähle mit erhöhtem Cr- und Co-Gehalt,Internal COST Report, 14.9.2004
[26] H. Danielsen, J. Hald: Z-phase in 9-12% Cr steels", ISSN 0282-3772, VärmeforskService AB, Stockholm, 2004
[27] J. Rajek: Computer simulation of precipitation kinetics in solid metals and application tothe complex power plant steel CB8, PhD thesis, Graz University of Technology, 2005
PRECIPITATION BEHAVIOR OF Z PHASE AFTER LONG - TERMCREEP IN HIGH CHROMIUM FERRITIC HEAT RESISTANT STEELS
K. Sawada, H. Kushima and K. Kimura
Materials Reliability Center, National Institute for Materials Science,
1-2-1, Sengen, Tsukuba, 305-0047, Japan
Abstract
The precipitation behavior of the Z phase was investigated after long-term creep exposure in ASME-T91, T92,
T122 without S-ferrite, and T122 with ö-ferrite through elemental mapping using EF-TEM. The Z phase was
identified by comparing the Cr map with the V map. Most of the Z phase was observed around prior austenite
grain boundaries and/or packet boundaries in all of the steels examined. In T122 with 8-ferrite, the Z phase also
precipitates around the S-ferrite. In particular, the number of MX carbonitrides was very small in T122 with a
large amount of the Z phase. The main metallic composition of the Z phase in T91 was the same as that in T92.
In T122, the Z phase contained a lower Nb content. The main metallic composition of the Z phase around the
S-ferrite was the same as that in the other areas. There was no large difference in the size distribution of the Z
phase among the steels. The mean diameter of the Z phases for T122 with S-ferrite was relatively large in spite of
a shorter creep exposure in contrast with T91 and T92. The number density of the Z phases increased with
increasing creep exposure time except in the case of T91. The order of the number density was T122 with
S-ferrite, T91, T122 without S-ferrite, and T92. In crept samples, the amount of Z phase in the gauge portion was
higher than that in the grip portion, meaning that stress and/or strain promotes the formation of a Z phase during
creep exposure.
Keywords: Z phase, long-term creep, precipitation site, stress and/or strain effect
1. Introduction
Steam power plants need high chromium ferritic steel with higher creep strength to improvethermal efficiency. In order to improve the creep resistance of high chromium ferritic steels,we need to retard microstructural changes, such as the recovery of martensitic lath structuresand the coarsening of precipitates. In particular, creep strength at long terms abruptlydecreases due to microstructural degradation. New phases such as Laves and Z phase appearafter long-term creep exposure. [1-4] In 9-12% Cr ferritic steels, the Z phase precipitates aftercreep exposure for about 10,000 h at 650°C. lt is assumed that the formation of the Z phasecauses an abrupt decrease in the creep strength since Z phase formation consumes MXcarbonitrides, which are important strengtheners. [5,6] Suzuki et al. reported that the Z phaseis formed around prior austenite grain boundaries, and that Nb-rich MX disappears afterlong-term creep exposure in Mod.9Cr-lMo steel. [7] Thus, we need to know the precipitationbehavior of the Z phase to improve creep strength at the long term.
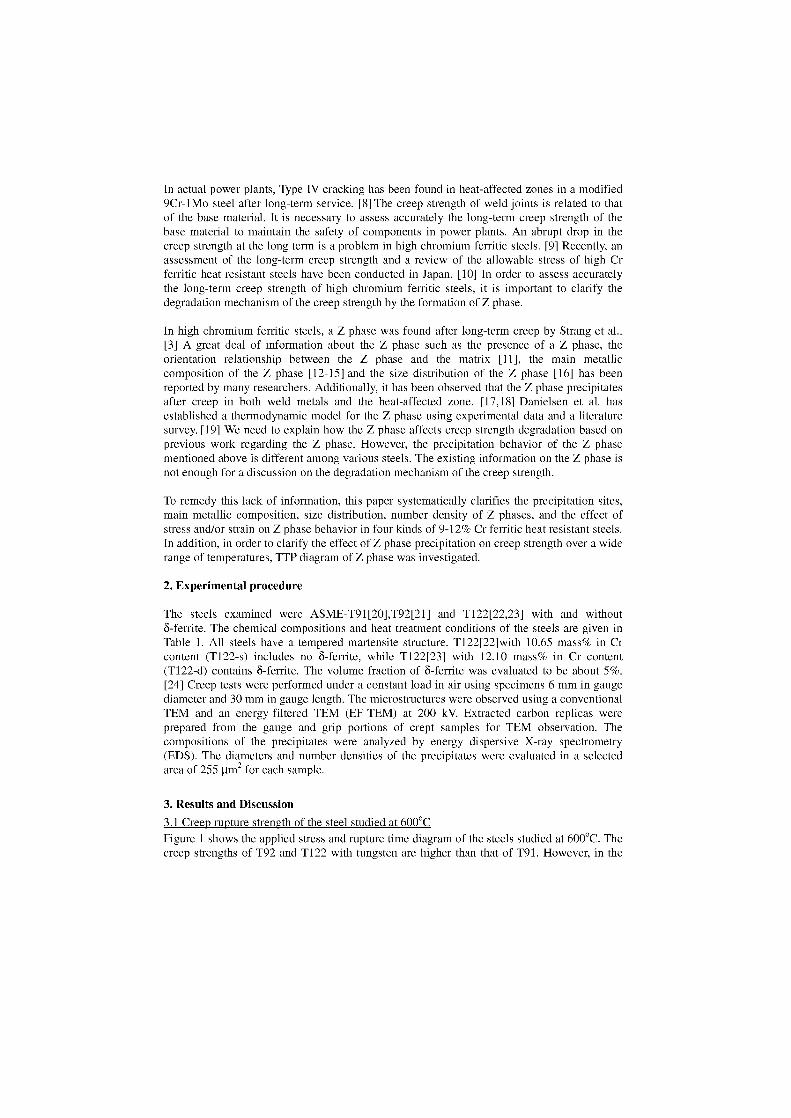
In actual power plants, Type IV cracking has been found in heat-affected zones in a modified9Cr-lMo steel after long-term service. [8] The creep strength of weld joints is related to thatof the base material. It is necessary to assess accurately the long-term creep strength of thebase material to maintain the safety of components in power plants. An abrupt drop in thecreep strength at the long term is a problem in high chromium ferritic steels. [9] Recently, anassessment of the long-term creep strength and a review of the allowable stress of high Crferritic heat resistant steels have been conducted in Japan. [10] In order to assess accuratelythe long-term creep strength of high chromium ferritic steels, it is important to clarify thedegradation mechanism of the creep strength by the formation of Z phase.
In high chromium ferritic steels, a Z phase was found after long-term creep by Strang et al..[3] A great deal of information about the Z phase such as the presence of a Z phase, theorientation relationship between the Z phase and the matrix [11], the main metalliccomposition of the Z phase [12-15] and the size distribution of the Z phase [16] has beenreported by many researchers. Additionally, it has been observed that the Z phase precipitatesafter creep in both weld metals and the heat-affected zone. [17,18] Danielsen et al. hasestablished a thermodynamic model for the Z phase using experimental data and a literaturesurvey. [19] We need to explain how the Z phase affects creep strength degradation based onprevious work regarding the Z phase. However, the precipitation behavior of the Z phasementioned above is different among various steels. The existing information on the Z phase isnot enough for a discussion on the degradation mechanism of the creep strength.
To remedy this lack of information, this paper systematically clarifies the precipitation sites,main metallic composition, size distribution, number density of Z phases, and the effect ofstress and/or strain on Z phase behavior in four kinds of 9-12% Cr ferritic heat resistant steels.In addition, in order to clarify the effect of Z phase precipitation on creep strength over a widerange of temperatures, TTP diagram of Z phase was investigated.
2. Experimental procedure
The steels examined were ASME-T91[20],T92[21] and T122[22,23] with and without8-ferrite. The chemical compositions and heat treatment conditions of the steels are given inTable 1. All steels have a tempered martensite structure. T122[22]with 10.65 mass% in Crcontent (T122-s) includes no 8-ferrite, while T122[23] with 12.10 mass% in Cr content(T122-d) contains 8-ferrite. The volume fraction of 8-ferrite was evaluated to be about 5%.[24] Creep tests were performed under a constant load in air using specimens 6 mm in gaugediameter and 30 mm in gauge length. The microstructures were observed using a conventionalTEM and an energy-filtered TEM (EF-TEM) at 200 kV. Extracted carbon replicas wereprepared from the gauge and grip portions of crept samples for TEM observation. Thecompositions of the precipitates were analyzed by energy dispersive X-ray spectrometry(EDS). The diameters and number densities of the precipitates were evaluated in a selectedarea of 255 gm 2 for each sample.
3. Results and Discussion
3.1 Creep rupture strength of the steel studied at 600°C Figure 1 shows the applied stress and rupture time diagram of the steels studied at 600°C. Thecreep strengths of T92 and T122 with tungsten are higher than that of T91. However, in the
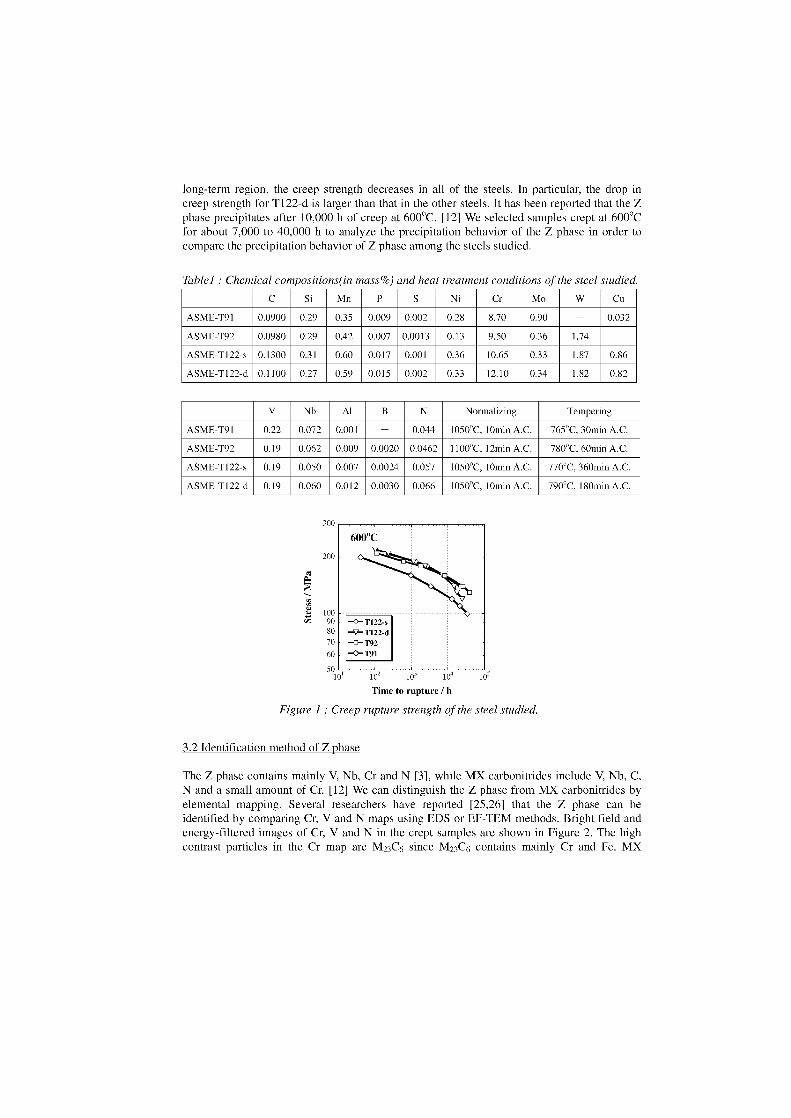
300
200
long-term region, the creep strength decreases in all of the steels. In particular, the drop increep strength for T122-d is larger than that in the other steels. lt has been reported that the Zphase precipitates after 10,000 h of creep at 600°C. [12] We selected samples crept at 600°Cfor about 7,000 to 40,000 h to analyze the precipitation behavior of the Z phase in order tocompare the precipitation behavior of Z phase among the steels studied.
Tablel : Chemical compositions(in mass%) and heat treatment conchtions of the steel studied.
C Si Mn P S Ni Cr Mo W Cu
A SME-T91 0.0900 0.29 0.35 0.009 0.002 0.28 8.70 0.90 - 0.032
ASME-T92 0.0980 0.29 0.42 0.007 0.0013 0.13 9.50 0.36 1.74 -
ASME-T122-s 0.1300 0.31 0.60 0.017 0.001 0.36 10.65 0.33 1.87 0.86
ASME-T122-d 0.1100 0.27 0.59 0.015 0.002 0.33 12.10 0.34 1.82 0.82
V Nb Al B N Normalizing Tempering
ASME-T91 0.22 0.072 0.001 - 0.044 1050°C, 10min A.C. 765°C, 30min A.C.
A SME-T92 0.19 0.062 0.009 0.0020 0.0462 1100°C, 12min A.C. 780°C, 60min A.C.
ASME-T122-s 0.19 0.050 0.007 0.0024 0.057 1050°C, 10min A.C. 770°C, 360min A.C.
ASME-T122-d 0.19 0.060 0.012 0.0030 0.066 1050°C, 10min A.C. 790°C, 180min A.C.
Figure I : Creep rupture strength of the steel studied.
3.2 Identification method of Z phase
The Z phase contains mainly V, Nb, Cr and N [3], while MX carbonitrides include V, Nb, C,N and a small amount of Cr. [12] We can distinguish the Z phase from MX carbonitrides byelemental mapping. Several researchers have reported [25,26] that the Z phase can beidentified by comparing Cr, V and N maps using EDS or EF-TEM methods. Bright field andenergy-filtered images of Cr, V and N in the crept samples are shown in Figure 2. The highcontrast particles in the Cr map are M23C6 since M23C6 contains mainly Cr and Fe. MX
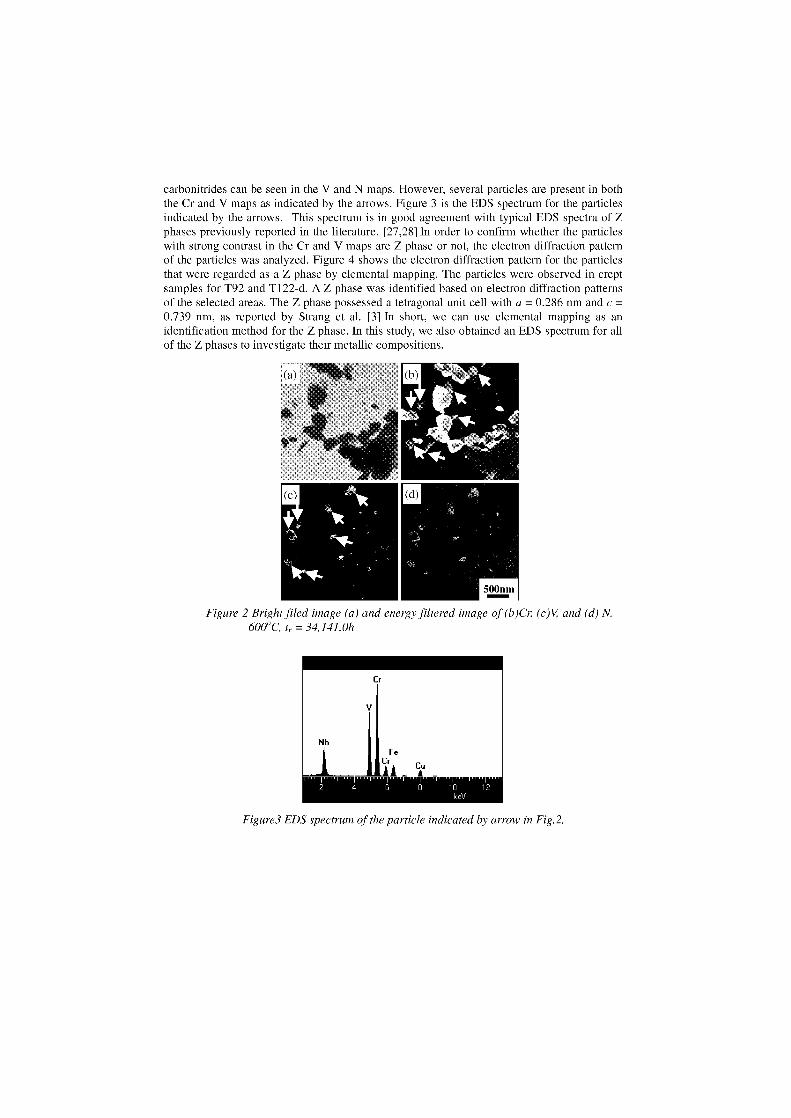
carbonitrides can be seen in the V and N maps. However, several particles are present in boththe Cr and V maps as indicated by the arrows. Figure 3 is the EDS spectrum for the particlesindicated by the arrows. This spectrum is in good agreement with typical EDS spectra of Zphases previously reported in the literature. [27,28] In order to confirm whether the particleswith strong contrast in the Cr and V maps are Z phase or not, the electron diffraction patternof the particles was analyzed. Figure 4 shows the electron diffraction pattern for the particlesthat were regarded as a Z phase by elemental mapping. The particles were observed in creptsamples for T92 and T122-d. A Z phase was identified based an electron diffraction patternsof the selected areas. The Z phase possessed a tetragonal unit cell with a = 0.286 nm and c =0.739 nm, as reported by Strang et al. [3] In short, we can use elemental mapping as anidentification method for the Z phase. In this study, we also obtained an EDS spectrum for allof the Z phases to investigate their metallic compositions.
Figure 2 Bright filed image (a) and energy filtered image of (b)Cr, (c)v, and (d) N.600°C, tr = 34,141.0h
Figure3 EDS spectrum of the particle indicated by arrow in Fig.2.
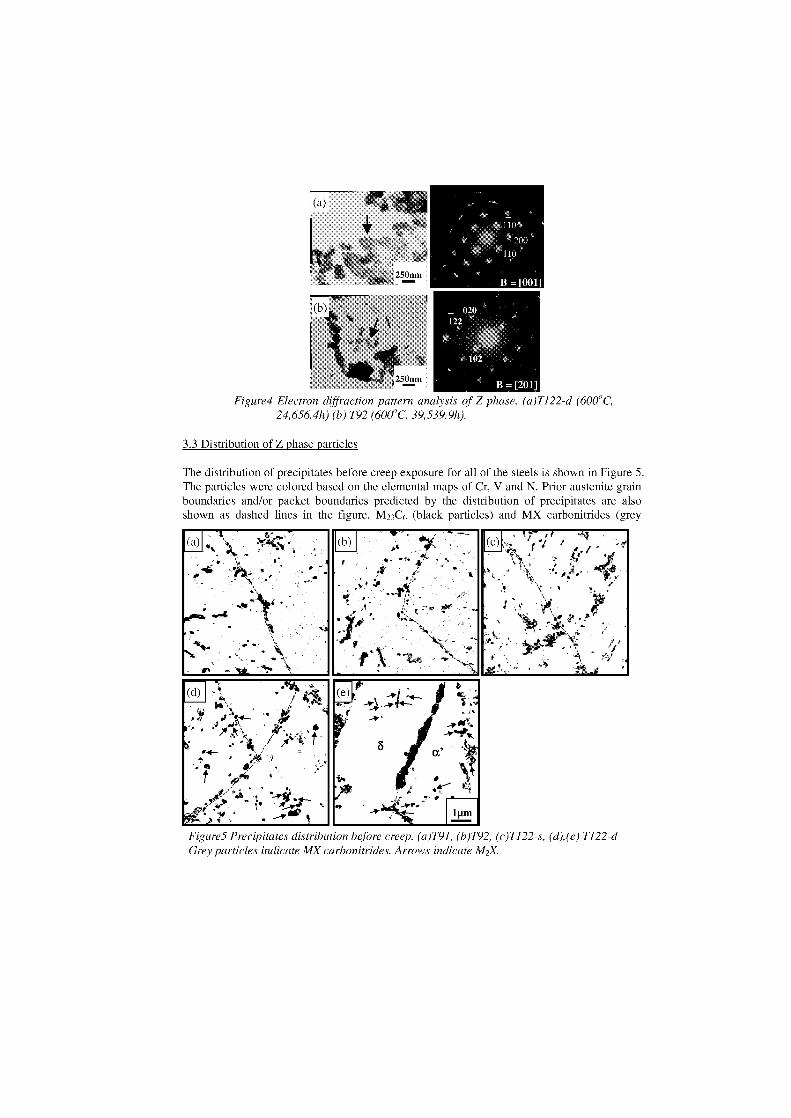
250nm
Figure4 Electron ,'ffraction pattern analysis of Z phase. (a)T122-d (600°C,24,656.4h) (b)T92 (600°C, 39,539.9h).
3.3 Distribution of Z1-ncles
The distribution of precipitates before creep exposure for all of the steels is shown in Figure 5.The particles were colored based an the elemental maps of Cr, V and N. Prior austenite grainboundaries and/or packet boundaries predicted by the distribution of precipitates are alsoshown as dashed lines in the figure. M23C6 (black particles) and MX carbonitrides (grey
(a) 1 *
.
... —.
•
.•
(b),
-.
.
. -
.
lc)
,..,„ ,-,„..-k •
.
, ev.- illt v
.,
,,,,,,,,, , ,,
,e, ,
x. .
_
,
(d) 1
_,.,.
w.lt
,-
.,
-4-
• •
'4..
- .•i** .
.`
•
*. ...,_
.--e, die
ii....".
'
(e) --ele:.:2/___-,;\ -4,-
.-e-
• „ • ...ero '
-eile.
_
.
t
Figure5 Precipitates distribution before creep. (a)T91, (b)T92, (c)T122-s, (d),(e) T122-dGrey particles indicate MX carbonitrides. Arrows indicate M2X.
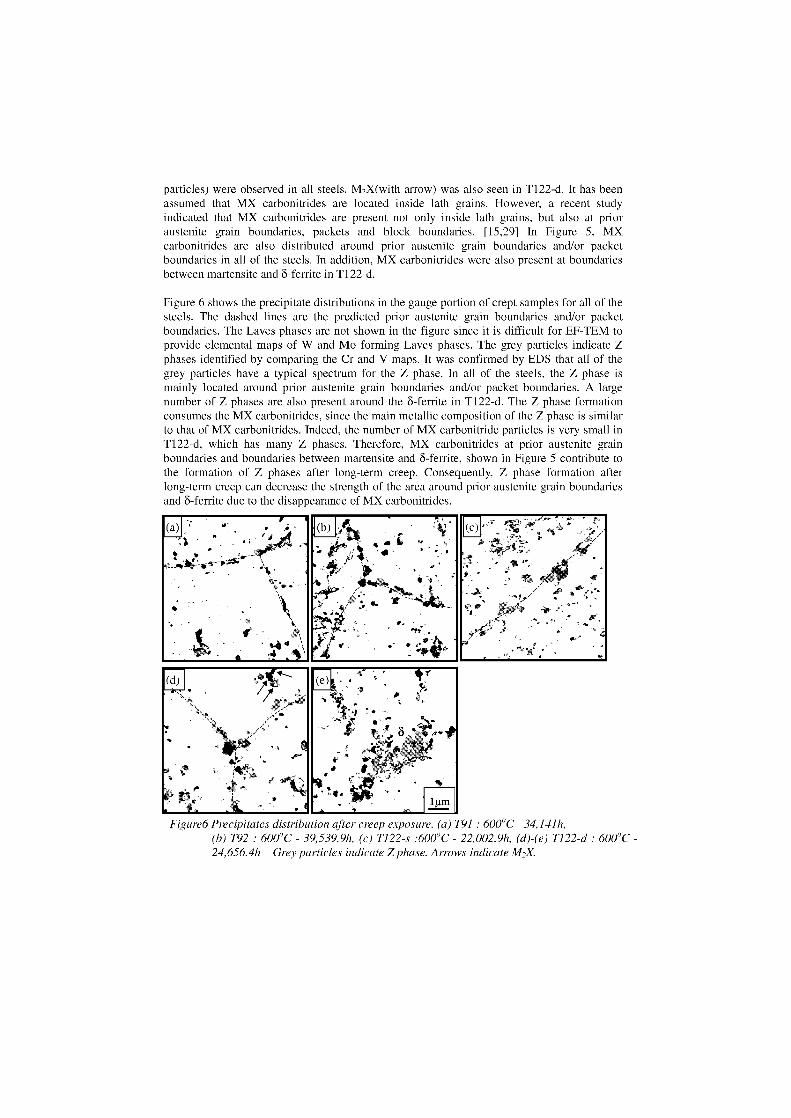
particles) were observed in all steels. M 2X(with arrow) was also seen in T122-d. It has beenassumed that MX carbonitrides are located inside lath grains. However, a recent studyindicated that MX carbonitrides are present not only inside lath grains, but also at prioraustenite grain boundaries, packets and block boundaries. [15,29] In Figure 5, MXcarbonitrides are also distributed around prior austenite grain boundaries and/or packetboundaries in all of the steels. In addition, MX carbonitrides were also present at boundariesbetween martensite and 8-ferrite in T122-d.
Figure 6 shown the precipitate distributions in the gauge portion of crept samples for all of thesteels. The dashed lines are the predicted prior austenite grain boundaries and/or packetboundaries. The Laves phases are not shown in the figure since it is difficult for EF-TEM toprovide elemental maps of W and Mo forming Laves phases. The grey particles indicate Zphases identified by comparing the Cr and V maps. It was confirmed by EDS that all of thegrey particles have a typical spectrum for the Z phase. In all of the steels, the Z phase ismainly located around prior austenite grain boundaries and/or packet boundaries. A largenumber of Z phases are also present around the 8-ferrite in T122-d. The Z phase formationconsumes the MX carbonitrides, since the main metallic composition of the Z phase is similarto that of MX carbonitrides. Indeed, the number of MX carbonitride particles is very small inT122-d, which has many Z phases. Therefore, MX carbonitrides at prior austenite grainboundaries and boundaries between martensite and 8-ferrite, shown in Figure 5 contribute tothe formation of Z phases after long-term creep. Consequently, Z phase formation afterlong-term creep can decrease the strength of the area around prior austenite grain boundariesand 8-ferrite due to the disappearance of MX carbonitrides.
(a)r
•; '
,. .\I.
'
, 4 4 \:4 . Ih '
(b)
+,.,
-
q• a. • •
.
.
.- • e.
(c) "'''
.,
. . —
.r.
1 . . •
t * =Ire-4 - -•4142-1i4r- - i*-2'.
. . .
■
d
(d)
• e
•
0
4•
Il•.
'
,,-
.....x.
•. .
e fi■
,,,,
.
# 4fi,1
Figure6 Precipitates distribution after creep exposure. (a) T91 : 600°C - 34,141h,(b) T92 : 600°C - 39,539.9h, (c) T122-s :600°C - 22,002.9h, (d)-(e) T122-d : 600°C -24,656.4h Grey particles indicate Z phase. Arrows indicate M2X.
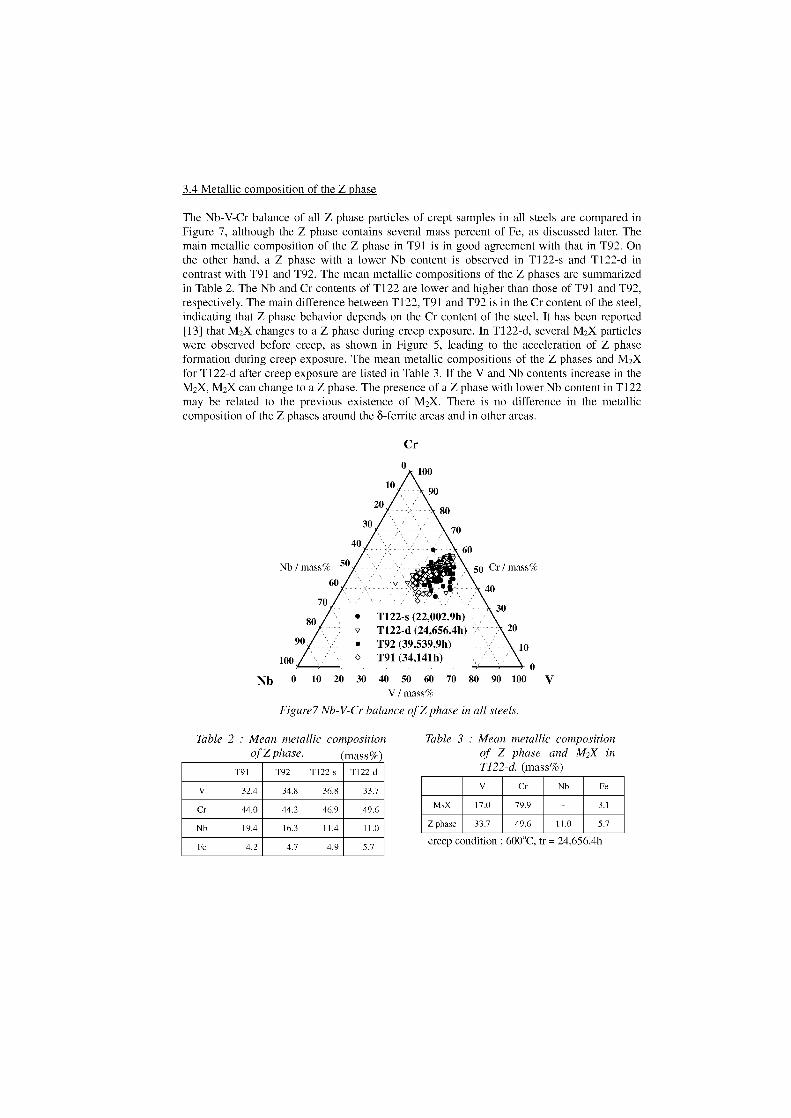
• T122-s (22,002.9h)80o T122-d (24,656.4h)
90 ■ T92 (39,539.9h)100 • T91 (34,141h)
3.4 Metallic composition of the Z phase
The Nb-V-Cr balance of all Z phase particles of crept samples in all steels are compared inFigure 7, although the Z phase contains several mass percent of Fe, as discussed later. Themain metallic composition of the Z phase in T91 is in good agreement with that in T92. Onthe other hand, a Z phase with a lower Nb content is observed in T122-s and T122-d incontrast with T91 and T92. The mean metallic compositions of the Z phases are summarizedin Table 2. The Nb and Cr contents of T122 are lower and higher than those of T91 and T92,respectively. The main difference between T122, T91 and T92 is in the Cr content of the steel,indicating that Z phase behavior depends an the Cr content of the steel. lt has been reported[13] that M2X changes to a Z phase during creep exposure. ln T122-d, several M 2X particleswere observed before creep, as shown in Figure 5, leading to the acceleration of Z phaseformation during creep exposure. The mean metallic compositions of the Z phases and M2Xfor T122-d after creep exposure are listed in Table 3. lf the V and Nb contents increase in theM2X, M2X can change to a Z phase. The presence of a Z phase with lower Nb content in T122may be related to the previous existence of M2X. There is no difference in the metalliccomposition of the Z phases around the 8-ferrite areas and in other areas.
Cr
Nb 0 10 20 30 40 50 60 70 80 90 100 VV / mass%
Figure7 Nb-V-Cr balance of Z phase in all steels.
Table 2 : Mean metallic compositionof Z phase. (mass%)
T91 T92 T 1 22-s T 1 22-d
V 32.4 34.8 36.8 33.7
Cr 44.0 44.2 46.9 49.6
Nb 19.4 16.3 11.4 11.0
Fe 4.2 4.7 4.9 5.7
Table 3 : Mean metallic compositionof Z phase and M2X inT122-d. (mass%)
V Cr Nb Fe
M,X 17.0 79.9 3.1
Z phase 33.7 49.6 11.0 5.7
creep condition : 600°C, tr = 24,656.4h
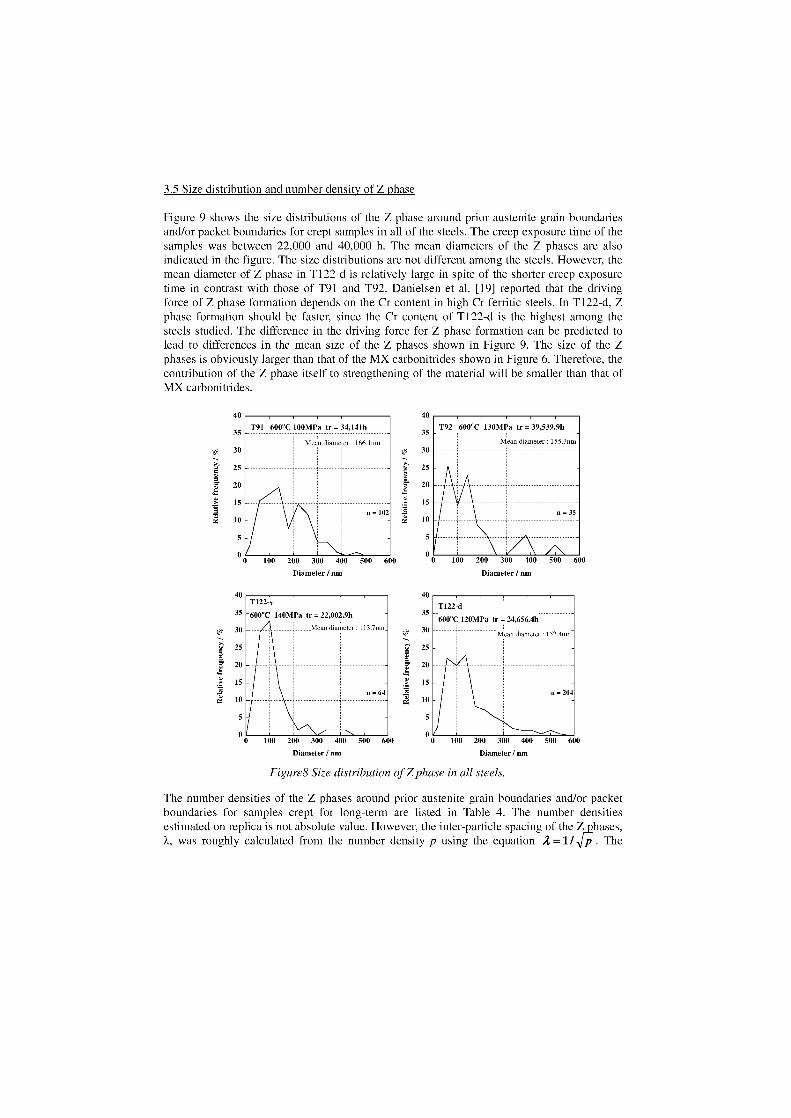
35
30
g▪ 25
20
15
10
40
T122-d35
600°C 120MPa tr = 24,656.4h• 30 Mem diameter I 52 4nnl
• 25
20
15
10n = 204
5
0 0
100 200 300 400 500 600
3.5 Size distribution and number density of Z phase
Figure 9 shows the size distributions of the Z phase around prior austenite grain boundariesand/or packet boundaries for crept samples in all of the steels. The creep exposure time of thesamples was between 22,000 and 40,000 h. The mean diameters of the Z phases are alsoindicated in the figure. The size distributions are not different among the steels. However, themean diameter of Z phase in T122-d is relatively large in spite of the shorter creep exposuretime in contrast with those of T91 and T92. Danielsen et al. [19] reported that the drivingforce of Z phase formation depends on the Cr content in high Cr ferritic steels. In T122-d, Zphase formation should be faster, since the Cr content of Ti 22-d is the highest among thesteels studied. The differente in the driving force for Z phase formation can be predicted tolead to differences in the mean size of the Z phases shown in Figure 9. The size of the Zphases is obviously larger than that of the MX carbonitrides shown in Figure 6. Therefore, thecontribution of the Z phase itself to strengthening of the material will be smaller than that ofMX carbonitrides.
40 40
T92 600°C 130MPa tr = 39,539.9h35
Mean diameter : 155.3nm30
25
20
e.".re
15n = 35
7'4 10
5
/N100 200 300 400 500 600
Diameter / nm
Diameter / nm
0 0
Figure8 Size distribution of Z phase in all steels.
The number densities of the Z phases around prior austenite grain boundaries and/or packetboundaries for samples crept for long-term are listed in Table 4. The number densitiesestimated on replica is not absolute value. However, the inter-particle spacing of the Z hases,X, was roughly calculated from the number density p using the equation A =11 p . The
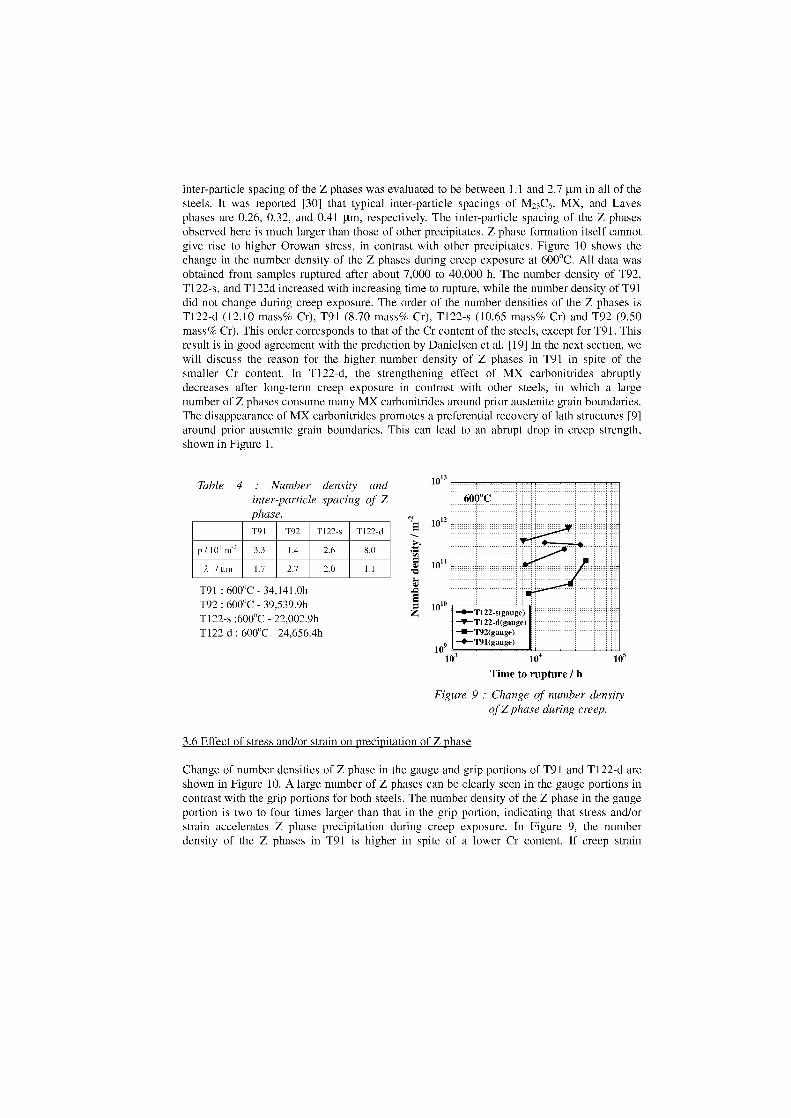
Table 4 : Number density andinter-particle spacing of Zphase.T91 T92 T122-s T122-d
p / 10 11 m-2 3.3 1.4 2.6 8.0
2.. him 1.7 2.7 2.0 1.1
T91 : 600°C - 34 141.0h -1=
T92 : 600°C - 39 539.9h 5
T122-s :600°C - 22,002.9hT122-d : 600°C - 24,656.4h
104
Time to rupture / h
109
110 los
inter-particle spacing of the Z phases was evaluated to be between 1.1 and 2.7 tm in all of thesteels. lt was reported [30] that typical inter-particle spacings of M23C6, MX, and Lavesphases are 0.26, 0.32, and 0.41 gm, respectively. The inter-particle spacing of the Z phasesobserved here is much larger than those of other precipitates. Z phase formation itself cannotgive rise to higher Orowan stress, in contrast with other precipitates. Figure 10 shows thechange in the number density of the Z phases during creep exposure at 600°C. All data wasobtained from Samples ruptured after about 7,000 to 40,000 h. The number density of T92,T122-s, and T1 22d increased with increasing time to rupture, while the number density of T91did not change during creep exposure. The order of the number densities of the Z phases isT122-d (12.10 mass% Cr), T91 (8.70 mass% Cr), T122-s (10.65 mass% Cr) and T92 (9.50mass% Cr). This order corresponds to that of the Cr content of the steels, except for T91. Thisresult is in good agreement with the prediction by Danielsen et al. [19] In the next section, wewill discuss the reason for the higher number density of Z phases in T91 in spite of thesmaller Cr content. In T122-d, the strengthening effect of MX carbonitrides abruptlydecreases after long-term creep exposure in contrast with other steels, in which a largenumber of Z phases consume many MX carbonitrides around prior austenite grain boundaries.The disappearance of MX carbonitrides promotes a preferential recovery of lath structures [9]around prior austenite grain boundaries. This can lead to an abrupt drop in creep strength,shown in Figure 1.
Figure 9 : Change of number densityof Z phase during creep.
3.6 Effect of stress and/or strain an precipitation of Z phase
Change of number densities of Z phase in the gauge and grip portions of T91 and T122-d areshown in Figure 10. A large number of Z phases can be clearly seen in the gauge portions incontrast with the grip portions for both steels. The number density of the Z phase in the gaugeportion is two to four times larger than that in the grip portion, indicating that stress and/orstrain accelerates Z phase precipitation during creep exposure. In Figure 9, the numberdensity of the Z phases in T91 is higher in spite of a lower Cr content. If creep strain
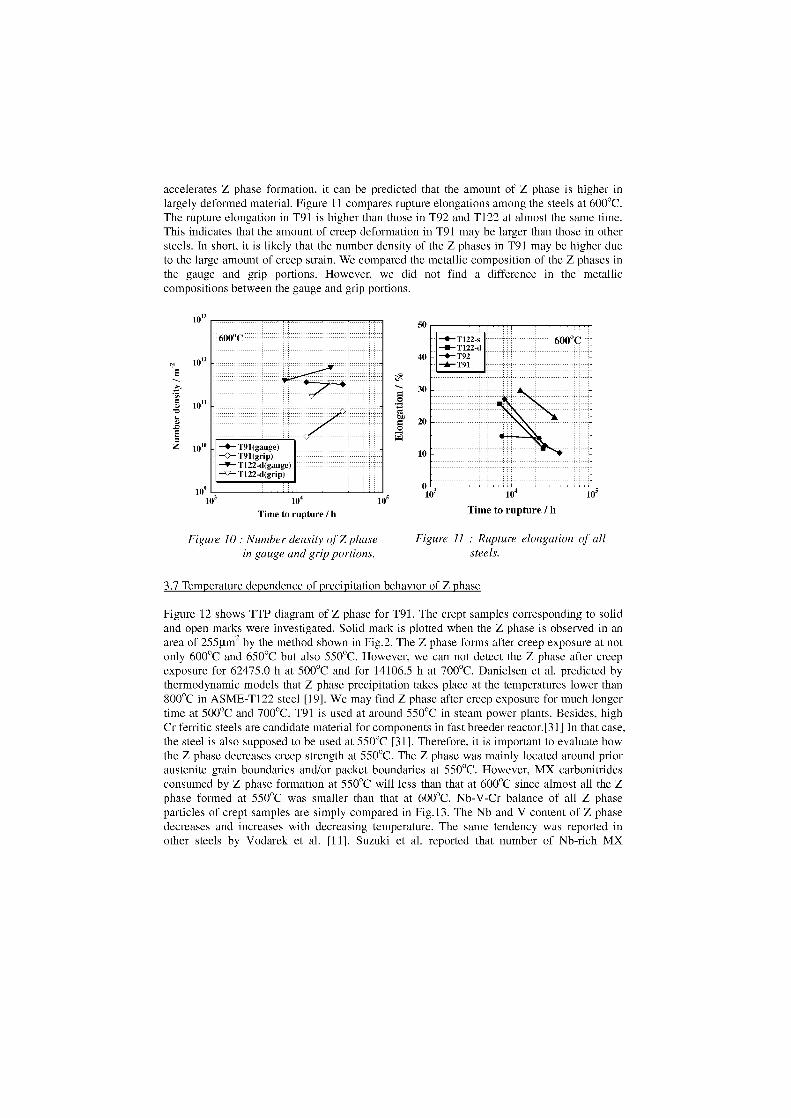
600°C
T91(gauge) T91(grip)
T122-d(gauge) T122-d(grip)
1o510 104
los
Time to rupture / h
:35
z
1013
1012
1011
1010
109
accelerates Z phase formation, it can be predicted that the amount of Z phase is higher inlargely deformed material. Figure 11 compares rupture elongations among the steels at 600°C.The rupture elongation in T91 is higher than those in T92 and T122 at almost the same time.This indicates that the amount of creep deformation in T91 may be larger than those in othersteels. In short, it is likely that the number density of the Z phases in T91 may be higher dueto the large amount of creep strain. We compared the metallic composition of the Z phases inthe gauge and grip portions. However, we did not find a difference in the metalliccompositions between the gauge and grip portions.
Figure 10 : Number density of Z phase Figure 11 : Rupture elongation of all
in gauge and grip portions. steels.
3.7 Temperature dependence of precipitation behavior of Z phase
Figure 12 shows TTP diagram of Z phase for T91. The crept samples corresponding to solidand open marks were investigated. Solid mark is plotted when the Z phase is observed in anarea of 255gm2 by the method shown in Fig.2. The Z phase forms after creep exposure at notonly 600°C and 650°C but also 550°C. However, we can not detect the Z phase after creepexposure for 62475.0 h at 500°C and for 14106.5 h at 700°C. Danielsen et al. predicted bythermodynamic modeln that Z phase precipitation takes place at the temperatures lower than800°C in ASME-T122 steel [19]. We may find Z phase after creep exposure for much longertime at 500°C and 700°C. T91 is used at around 550°C in steam power plants. Besides, highCr ferritic steels are candidate material for components in fast breeder reactor.[31] In that case,the steel is also supposed to be used at 550°C [31]. Therefore, it is important to evaluate howthe Z phase decreases creep strength at 550°C. The Z phase was mainly located around prioraustenite grain boundaries and/or packet boundaries at 550°C. However, MX carbonitridesconsumed by Z phase formation at 550°C will less than that at 600°C since almost all the Zphase formed at 550°C was smaller than that at 600°C. Nb-V-Cr balance of all Z phaseparticles of crept samples are simply compared in Fig.13. The Nb and V content of Z phasedecreases and increases with decreasing temperature. The same tendency was reported inother steels by Vodarek et al. [11]. Suzuki et al. reported that number of Nb-rich MX
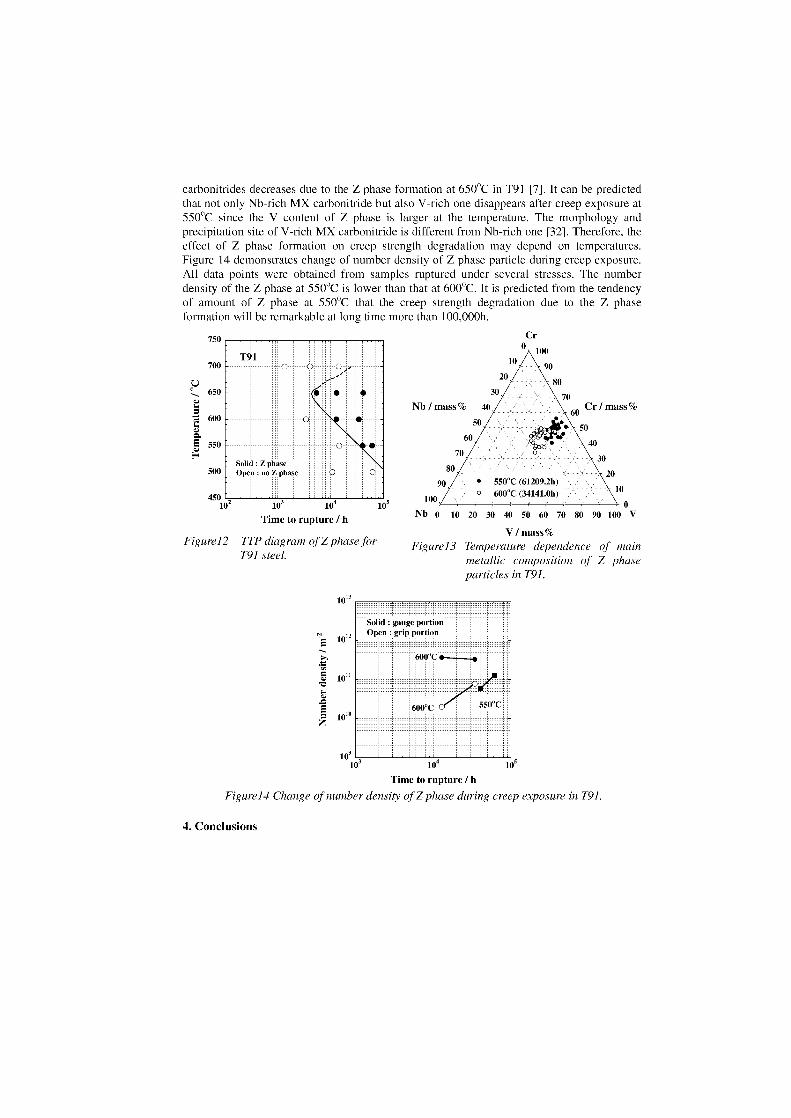
Cr
1090
20• 80
3070
Cr / mass(o60
\3080 20
90 • 550°C (61209.2h0 600°C (34141.0h) `111
0Nb 0 10 20 30 40 50 60 70 80 90 100 V
Am°
100105
450102
750
700
650
re 600
550
Solid : Z OaseOpen : no Z phase500
Solid : _nu te porlionOpen : grip porlion
MV('
carbonitrides decreases due to the Z phase formation at 650°C in T91 [7]. lt can be predictedthat not only Nb-rich MX carbonitride but also V-rich one disappears after creep exposure at550°C since the V content of Z phase is larger at the temperature. The morphology andprecipitation site of V-rich MX carbonitride is different from Nb-rich one [32]. Therefore, theeffect of Z phase formation on creep strength degradation may depend on temperatures.Figure 14 demonstrates change of number density of Z phase particle during creep exposure.All data points were obtained from samples ruptured under several stressec. The numberdensity of the Z phase at 550°C is lower than that at 600°C. lt is predicted from the tendencyof amount of Z phase at 550°C that the creep strength degradation due to the Z phaseformation will be remarkable at long time more than 100,000h.
Figurel 2 TTP diagram of Z phase forT91 steel.
Nb / mass% 4050 / 50
60 / \4070
V / mass%Figurel3 Temperature dependence of main
metallic composition of Z phaseparticles in T91.
1013
1012
" ä> 1011
0.›
101°
1091o3 104 105
Time to rupture / hFigurel 4 Change of number density of Z phase during creep exposure in T91.
4. Conclusions
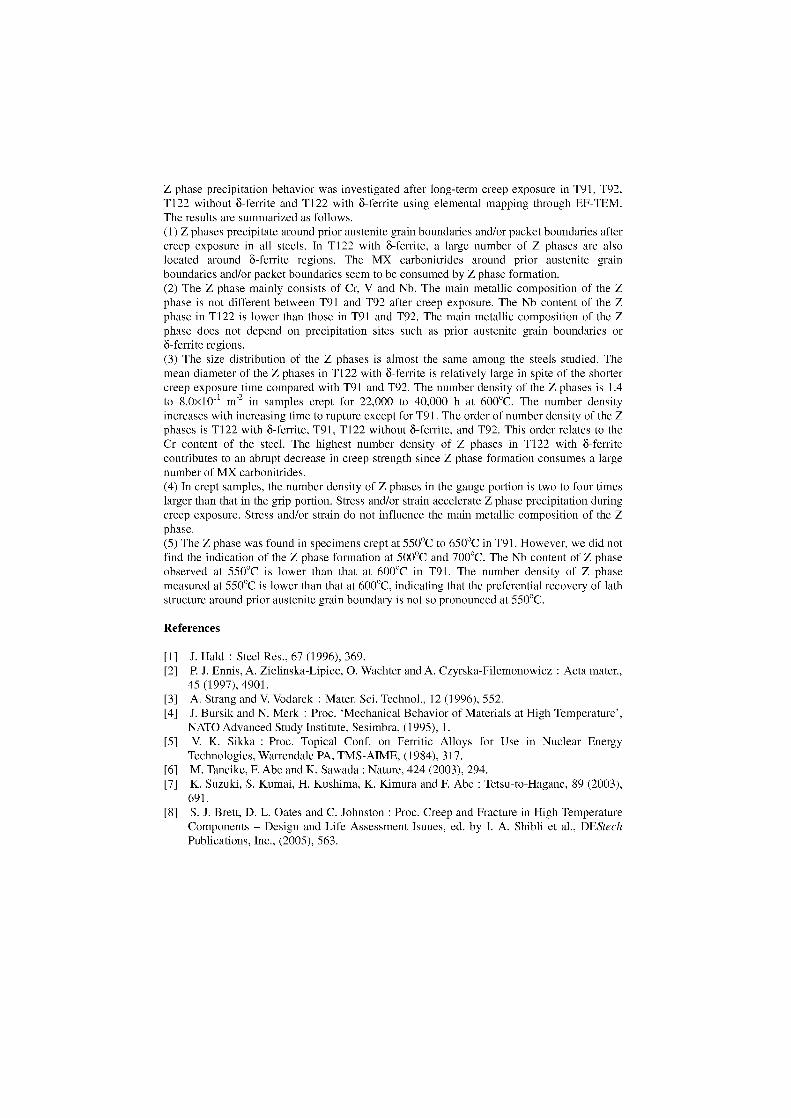
Z phase precipitation behavior was investigated after long-term creep exposure in T91, T92,T122 without 8-ferrite and T122 with 8-ferrite using elemental mapping through EF-TEM.The results are summarized as follows.(1) Z phases precipitate around prior austenite grain boundaries and/or packet boundaries aftercreep exposure in all steels. In T122 with 8-ferrite, a large number of Z phases are alsolocated around 8-ferrite regions. The MX carbonitrides around prior austenite grainboundaries and/or packet boundaries seem to be consumed by Z phase formation.(2) The Z phase mainly consists of Cr, V and Nb. The main metallic composition of the Zphase is not different between T91 and T92 after creep exposure. The Nb content of the Zphase in T122 is lower than those in T91 and T92. The main metallic composition of the Zphase does not depend on precipitation sites such as prior austenite grain boundaries or8-ferrite regions.(3) The size distribution of the Z phases is almost the same among the steels studied. Themean diameter of the Z phases in T122 with 8-ferrite is relatively large in spite of the shortercreep exposure time compared with T91 and T92. The number density of the Z phases is 1.4to 8.0x10 11 m-2 in samples crept for 22,000 to 40,000 h at 600°C. The number densityincreases with increasing time to rupture except for T91. The order of number density of the Zphases is T122 with 8-ferrite, T91, T122 without 8-ferrite, and T92. This order relates to theCr content of the steel. The highest number density of Z phases in T122 with 8-ferritecontributes to an abrupt decrease in creep strength since Z phase formation consumes a largenumber of MX carbonitrides.(4) In crept samples, the number density of Z phases in the gauge portion is two to four timeslarger than that in the grip portion. Stress and/or strain accelerate Z phase precipitation duringcreep exposure. Stress and/or strain do not influence the main metallic composition of the Zphase.(5) The Z phase was found in specimens crept at 550°C to 650°C in T91. However, we did notfind the indication of the Z phase formation at 500°C and 700°C. The Nb content of Z phaseobserved at 550°C is lower than that at 600°C in T91. The number density of Z phasemeasured at 550°C is lower than that at 600°C, indicating that the preferential recovery of lathstructure around prior austenite grain boundary is not so pronounced at 550°C.
References
[1] Hald : Steel Res., 67 (1996), 369.[2] P. J. Ennis, A. Zielinska-Lipiec, 0. Wachter and A. Czyrska-Filemonowicz : Acta mater.,
45 (1997), 4901.[3] A. Strang and V. Vodarek : Mater. Sci. Technol., 12 (1996), 552.[4] J. Bursik and N. Merk : Proc. `Mechanical Behavior of Materials at High Temperature',
NATO Advanced Study Institute, Sesimbra, (1995), 1.[5] V. K. Sikka : Proc. Topical Conf. on Ferritic Alloys for Use in Nuclear Energy
Technologies, Warrendale PA, TMS-AIME, (1984), 317.[6] M. Taneike, F. Abe and K. Sawada : Nature, 424 (2003), 294.[7] K. Suzuki, S. Kumai, H. Kushima, K. Kimura and F. Abe : Tetsu-to-Hagane, 89 (2003),
691[8] S. J. Brett, D. L. Oates and C. Johnston : Proc. Creep and Fracture in High Temperature
Components — Design and Life Assessment Isuues, ed. by I. A. Shibli et al., DEStechPublications, Inc., (2005), 563.
[9] H. Kushima, K. Kimura and F. Abe : Tetsu-to-Hagane, 85 (1999), 841.[10] K. Kimura : Proc. Creep and Fracture in High Temperature Components – Design and
Life Assessment Issues, ed. by I. A. Shibli et al., DEStech Publications, Inc., (2005),1009.
[11] V. Vodarek and A. Strang : 7th Liege Conf. on 'Materials for Advanced PowerEngineering, ed. by J. Lecomte-Beckers et al., Forshungs-zentrum, Jülich GmbH, Jülich,(2002), 11.1223.
[12] K. Suzuki, S. Kumai, H. Kushima, K. Kimura and F. Abe : Tetsu-to-Hagane, 86 (2000),550.
[13] R. Ishii, Y. Tsuda, M. Yamada and K. Kimura : Tetsu-to-Hagane, 88 (2002), 36.[14] M. Svoboda, J. Bursik, 1. Podstranska, A. Kroupa, V. Sklenicka and K. H. Mayer : 7th
Liege Conf. on 'Materials for Advanced Power Engineering, ed. by J. Lecomte-Beckerset al., Forshungs-zentrum, Jülich GmbH, Jülich, (2002), 111.1521.
[15] K. Sawada, M. Taneike, K. Kimura and F. Abe : 1S1J Int., 44 (2004), 1243.[16] H. Cerjak, E. Letofsky, R. Hanus, H. Heuser and C. Jochum : Proc. 5th International
Charles Parsons Turbine Conference, ed. by A. Strang et al., 10M Communications Ltd,(2000), 386.
[17] H. Heuser and C. Jochum : Proc. 3rd Conference on Advances in Material Technologyfor Fossil Power Plants, ed. by R. Viswanathan et al., The Institute of Materials, (2001),249.
[18] M. E. Abd El-Azim, A. M. Nasreldin, G Zies and A. Klenk : Mater. Sci. Tecnol., 21(2005), 779.
[19] H. Danielsen and J. Hald : Proc. 4th International Conference on Advances in MaterialsTechnology for Fossil Power Plants, ed. by R. Viswanathan et al., ASM International,(2004), 999.
[20] NR1M Creep Data Sheet, No.43, National Research Institute for Metals, Tsukuba, Japan,1996.
[21] NIMS Creep Data Sheet, No.48, National Institute for Materials Science, Tsukuba, Japan,2002.
[22] NIMS Creep Data Sheet, No.51, National Institute for Materials Science, Tsukuba, Japan,2006.
[23] NIMS Creep Data Sheet, No.52, National Institute for Materials Science, Tsukuba, Japan,2006.
[24] M. Yoshino, Y. Mishima, K. Sawada, Y. Toda, H. Kushima and K. Kimura : CAMP-ISIJ,18 (2005), 1623.
[25] M. lgarashi, H. Semba, H. Okada, H. Okubo, S. Muneki, K. Yamada and F. Abe : Proc.9th Ultra-Steel Workshop, National Institute for Materials Science, (2005), 96.
[26] M. Hättestrand and H. 0. Andren : Micron, 32 (2001), 789.[27] G. Götz and W. Blum : Mater. Sci. Eng. A348 (2003), 201.[28] 1. Letofsky-Papst, P. Warbichler, F. Hofer, E. Letofsky and H. Cerjak : Z. Metallkd., 95
(2004), 18.[29] K. Sawada, K. Kubo, T. Hara and F. Abe : 7th Liege Conf. on 'Materials for Advanced
Power Engineering, ed. by J. Lecomte-Beckers et al., Forshungs-zentrum, Jülich GmbH,Jülich, (2002), 11.1181.
[30] K. Maruyama, K. Sawada and J. Koike : 1S1J Int., 41 (2001), 641.[31] T. Onizawa, T. Wakai, M. Ando and K. Aoto: Proc. Creep and Fracture in High
Temperature Components – Design and Life Assessment Issues, ed. by I.A. Shibli et al.,

DEStech Publications, inc., (2005), p.l 30[32] K. Suzuki, S. Kumai, Y. Toda, H. Kushima and K. Kimura: ISIJ Int. Vol. 43 (2003), p.
1089
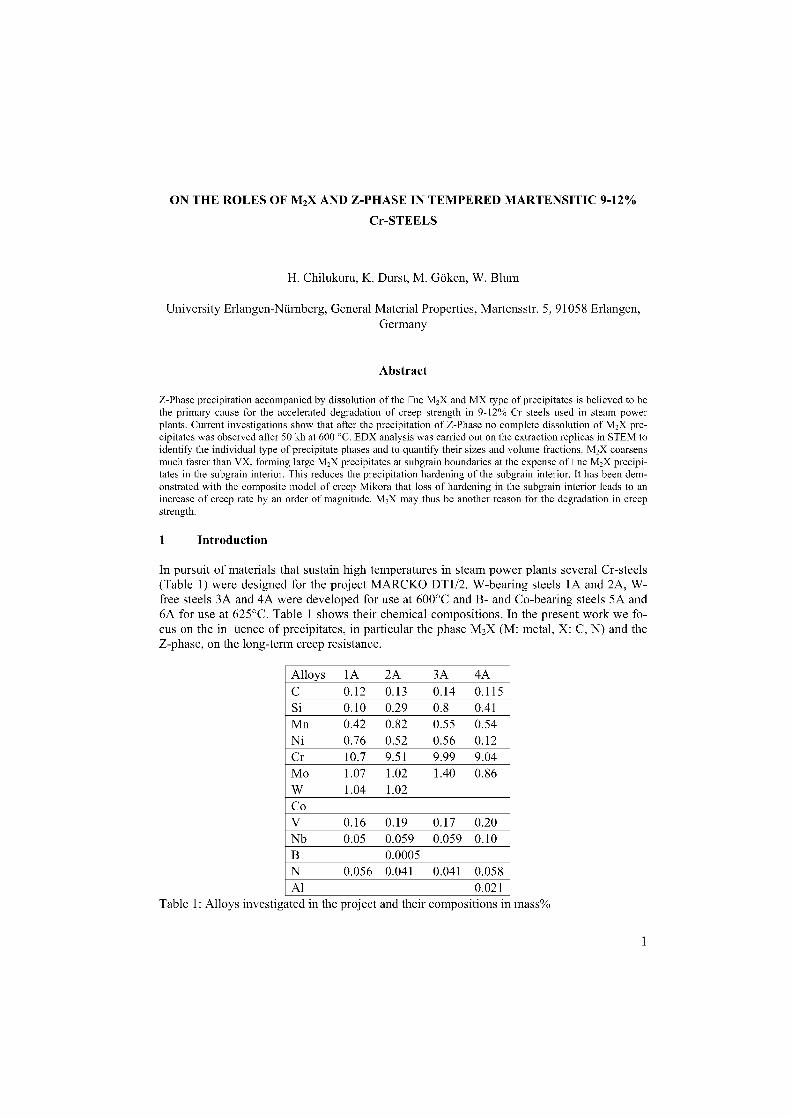
ON THE ROLES OF M2X AND Z-PHASE IN TEMPERED MARTENSITIC 9-12%Cr-STEELS
H. Chilukuru, K. Durst, M. Göken, W. Blum
University Erlangen-Nürnberg, General Material Properties, Martensstr. 5, 91058 Erlangen,Germany
Abstract
Z-Phase precipitation accompanied by dissolution of the Pne M 2X and MX type of precipitates is believed to bethe primary cause for the accelerated degradation of creep strength in 9-12% Cr steels used in steam powerplants. Current investigations show that after the precipitation of Z-Phase no complete dissolution of M 2X pre-cipitates was observed after 50 kh at 600 °C. EDX analysis was carried out on the extraction replicas in STEM toidentify the individual type of precipitate phases and to quantify their sizes and volume fractions. M2X coarsensmuch faster than VX, forming large M2X precipitates at subgrain boundaries at the expense of Me M2X precipi-tates in the subgrain interior. This reduces the precipitation hardening of the subgrain interior. It has been dem-onstrated with the composite model of creep Mikora that loss of hardening in the subgrain interior leads to anincrease of creep rate by an order of magnitude. M 2X may thus be another reason for the degradation in creepstrength.
1 Introduction
In pursuit of materials that sustain high temperatures in steam power plants several Cr-steels(Table 1) were designed for the project MARCKO DT1/2. W-bearing steels lA and 2A, W-free steels 3A and 4A were developed for use at 600°C and B- and Co-bearing steels 5A and6A for use at 625°C. Table 1 Shows their chemical compositions. In the present work we fo-cus on the in quence of precipitates, in particular the phase M 2X (M: metal, X: C, N) and theZ-phase, on the long-term creep resistance.
Alloys 1A 2A 3A 4A
C 0.12 0.13 0.14 0.115Si 0.10 0.29 0.8 0.41Mn 0.42 0.82 0.55 0.54Ni 0.76 0.52 0.56 0.12Cr 10.7 9.51 9.99 9.04Mo 1.07 1.02 1.40 0.86W 1.04 1.02CoV 0.16 0.19 0.17 0.20Nb 0.05 0.059 0.059 0.10B 0.0005N 0.056 0.041 0.041 0.058Al 0.021
Table 1: Alloys investigated in the project and their compositions in mass%
1
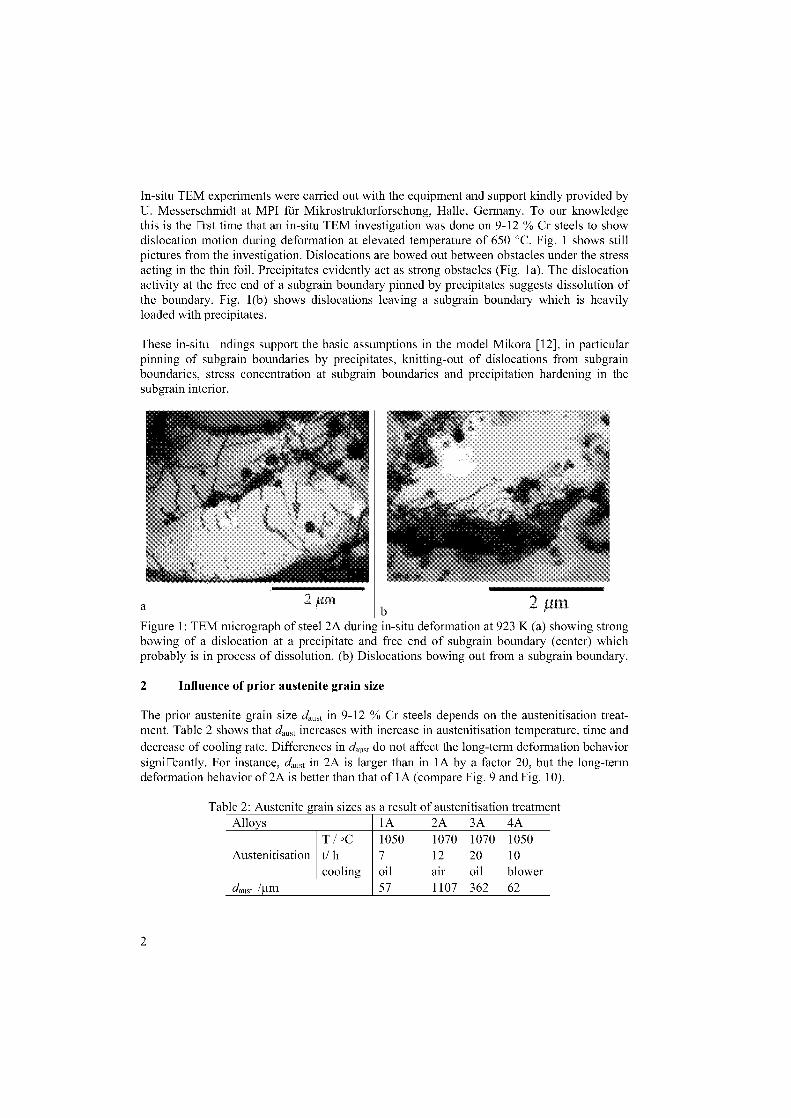
In-situ TEM experiments were carried out with the equipment and support kindly provided byU. Messerschmidt at MPI für Mikrostrukturforschung, Halle, Germany. To our knowledgethis is the rist time that an in-situ TEM investigation was done on 9-12 % Cr steels to Showdislocation motion during deformation at elevated temperature of 650 °C. Fig. 1 shows stillpictures from the investigation. Dislocations are bowed out between obstacles under the stressacting in the thin foil. Precipitates evidently act as strong obstacles (Fig. la). The dislocationactivity at the free end of a subgrain boundary pinned by precipitates suggests dissolution ofthe boundary. Fig. 1(b) shows dislocations leaving a subgrain boundary which is heavilyloaded with precipitates.
These in-situ Endings support the basic assumptions in the model Mikora [12], in particularpinning of subgrain boundaries by precipitates, knitting-out of dislocations from subgrainboundaries, stress concentration at subgrain boundaries and precipitation hardening in thesubgrain interior.
2 pba– 1
Figure 1: TEM micrograph of steel 2A during in-situ deformation at 923 K (a) showing strongbowing of a dislocation at a precipitate and free end of subgrain boundary (center) whichprobably is in process of dissolution. (b) Dislocations bowing out from a subgrain boundary.
2 Influence of prior austenite grain size
The prior austenite grain size daust in 9-12 % Cr steels depends on the austenitisation treat-ment. Table 2 shows that daust increases with increase in austenitisation temperature, time and
decrease of cooling rate. Differences in daust do not affect the long-term deformation behaviorsigni Rantly. For instance, daust in 2A is larger than in 1A by a factor 20, but the long-termdeformation behavior of 2A is better than that of 1A (compare Fig. 9 and Fig. 10).
Table 2: Austenite grain sizes as a result of austenitisation treatmentAlloys lA 2A 3A 4A
AustenitisationT / oC 1050 1070 1070 1050t/ h 7 12 20 10cooling oil air oil blower
daust /JIM 57 1107 362 62
2
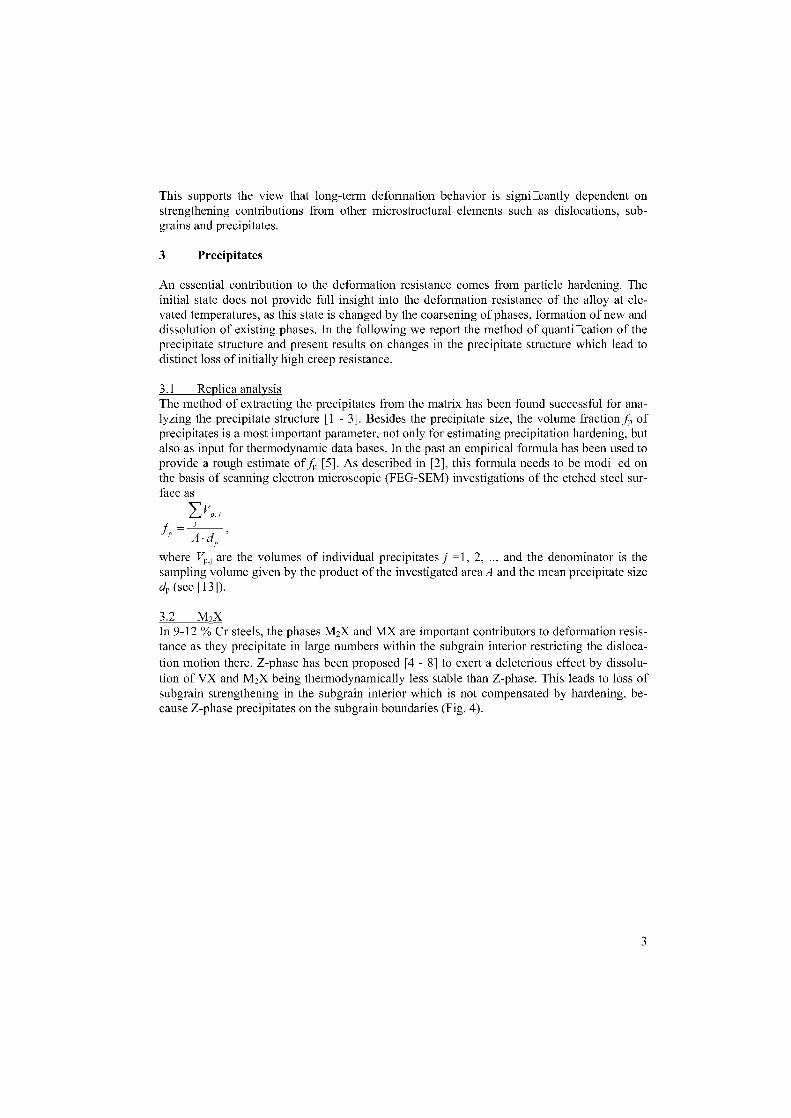
This Supports the view that long-term de formation behavior is signiDeantly dependent onstrengthening contributions from other microstructural elements such as dislocations, sub-grains and precipitates.
3 Precipitates
An essential contribution to the deformation resistance comes from particle hardening. Theinitial state does not provide full insight into the deformation resistance of the alloy at ele-vated temperatures, as this state is changed by the coarsening of phases, formation of new anddissolution of existing phases. In the following we report the method of quanti Ration of theprecipitate structure and present results on changes in the precipitate structure which lead todistinct loss of initially high creep resistance.
3.1 Replica analysisThe method of extracting the precipitates from the matrix has been found successful for ana-lyzing the precipitate structure [1 - 3]. Besides the precipitate size, the volume fraction fp ofprecipitates is a most important parameter, not only for estimating precipitation hardening, butalso as input for thermodynamic data bases. In the past an empirical formula has been used toprovide a rough estimate of fp [5]. As described in [2], this formula needs to be modi Fied onthe basis of scanning electron microscopic (FEG-SEM) investigations of the etched steel sur-face as
Ev,,,
f- Ad
where Vp, are the volumes of individual precipitates j =1, 2, ... and the denominator is thesampling volume given by the product of the investigated area A and the mean precipitate sizedp (see [13]).
3.2 M,XIn 9-12 % Cr steels, the phases M 2X and MX are important contributors to deformation resis-tance as they precipitate in large numbers within the subgrain interior restricting the disloca-tion motion there. Z-phase has been proposed [4 - 8] to exert a deleterious effect by dissolu-tion of VX and M 2X being thermodynamically less stable than Z-phase. This leads to loss ofsubgrain strengthening in the subgrain interior which is not compensated by hardening, be-cause Z-phase precipitates on the subgrain boundaries (Fig. 4).
3
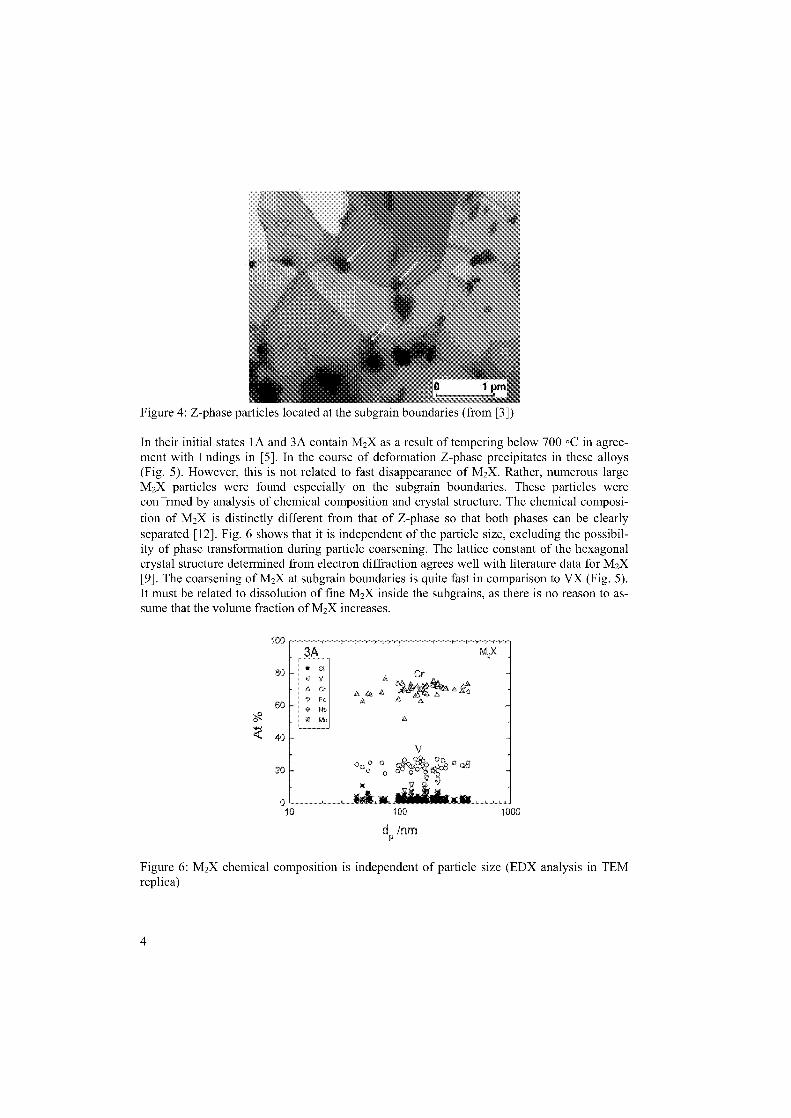
Figure 4: Z-phase particles located at the subgrain boundaries (from [3])
In their initial states 1A and 3A contain M2X as a result of tempering below 700 .0 in agree-ment with Endings in [5]. In the course of deformation Z-phase precipitates in these alloys(Fig. 5). However, this is not related to fast disappearance of M2X. Rather, numerous largeM2X particles were found especially an the subgrain boundaries. These particles wereconrimed by analysis of chemical composition and crystal structure. The chemical composi-tion of M2X is distinctly different from that of Z-phase so that both phases can be clearlyseparated [12]. Fig. 6 Shows that it is independent of the particle size, excluding the possibil-ity of phase transformation during particle coarsening. The lattice constant of the hexagonalcrystal structure determined from electron diffraction agrees well with literature data for M2X[9]. The coarsening of M 2X at subgrain boundaries is quite fast in comparison to VX (Fig. 5).It must be related to dissolution of fine M 2X inside the subgrains, as there is no reason to as-sume that the volume fraction of M 2X increases.
100
80
60
40
20
0
d inm
Figure 6: M2X chemical composition is independent of particle size (EDX analysis in TEMreplica)
4
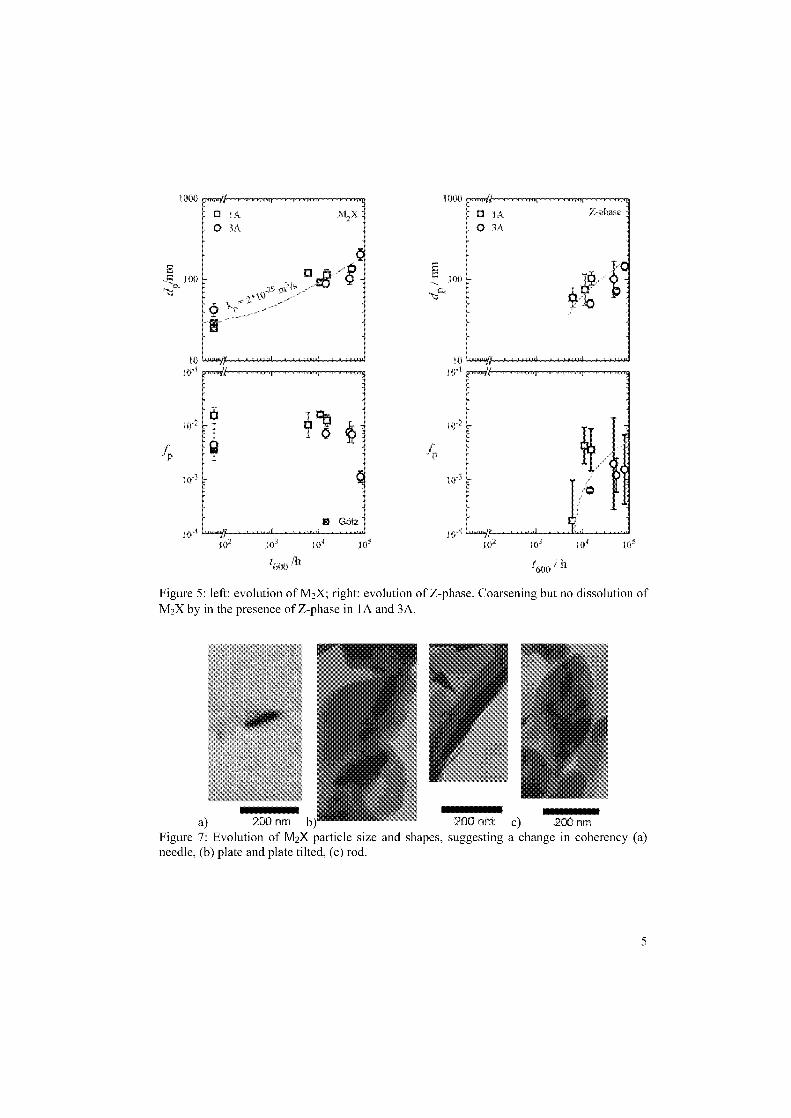
o'
O'
60()
Figure 5: left: evolution of M 2X; right: evolution of Z-phase. Coarsening but no dissolution ofM2X by in the presence of Z-phase in lA and 3A.
IIIIIIIIIIIIIIIIIIIIIIIIIIIIIIIIIIIIIIIIIIII IIIIIIII■11
a) _30 nm b) 200 nm c) 200 nmFigure 7: Evolution of M 2X particle size and shapes, suggesting a change in coherency (a)needle, (b) plate and plate tilted, (c) rod.
5
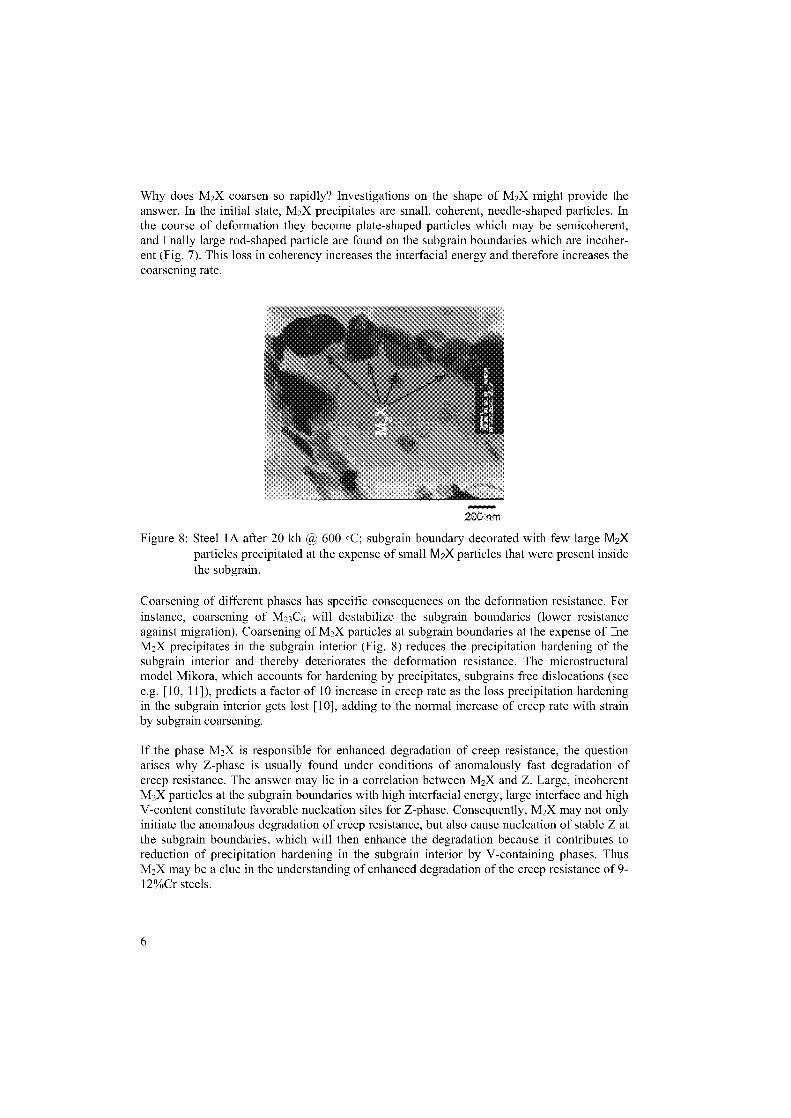
Why does M2X coarsen so rapidly? Investigations on the shape of M 2X might provide theanswer. In the initial state, M2X precipitates are small, coherent, needle-shaped particles. Inthe course of deformation they become plate-shaped particles which may be semicoherent,and Enally large rod-shaped particle are found on the subgrain boundaries which are incoher-ent (Fig. 7). This loss in coherency increases the interfacial energy and therefore increases thecoarsening rate.
Figure 8: Steel 1A after 20 kh @ 600 .C; subgrain boundary decorated with few large M2Xparticles precipitated at the expense of small M 2X particles that were present insidethe subgrain.
Coarsening of different phases has specific consequences on the deformation resistance. Forinstance, coarsening of M23C6 will destabilize the subgrain boundaries (lower resistanceagainst migration). Coarsening of M2X particles at subgrain boundaries at the expense of EheM2X precipitates in the subgrain interior (Fig. 8) reduces the precipitation hardening of thesubgrain interior and thereby deteriorates the deformation resistance. The microstructuralmodel Mikora, which accounts for hardening by precipitates, subgrains free dislocations (seee.g. [10, 11]), predicts a factor of 10 increase in creep rate as the loss precipitation hardeningin the subgrain interior gets lost [10], adding to the normal increase of creep rate with strainby subgrain coarsening.
If the phase M 2X is responsible for enhanced degradation of creep resistance, the questionarises why Z-phase is usually found under conditions of anomalously fast degradation ofcreep resistance. The answer may lie in a correlation between M 2X and Z. Large, incoherentM2X particles at the subgrain boundaries with high interfacial energy, large interface and highV-content constitute favorable nucleation sites for Z-phase. Consequently, M2X may not onlyinitiate the anomalous degradation of creep resistance, but also cause nucleation of stable Z atthe subgrain boundaries, which will then enhance the degradation because it contributes toreduction of precipitation hardening in the subgrain interior by V-containing phases. ThusM2X may be a clue in the understanding of enhanced degradation of the creep resistance of 9-12%Cr steels.
6
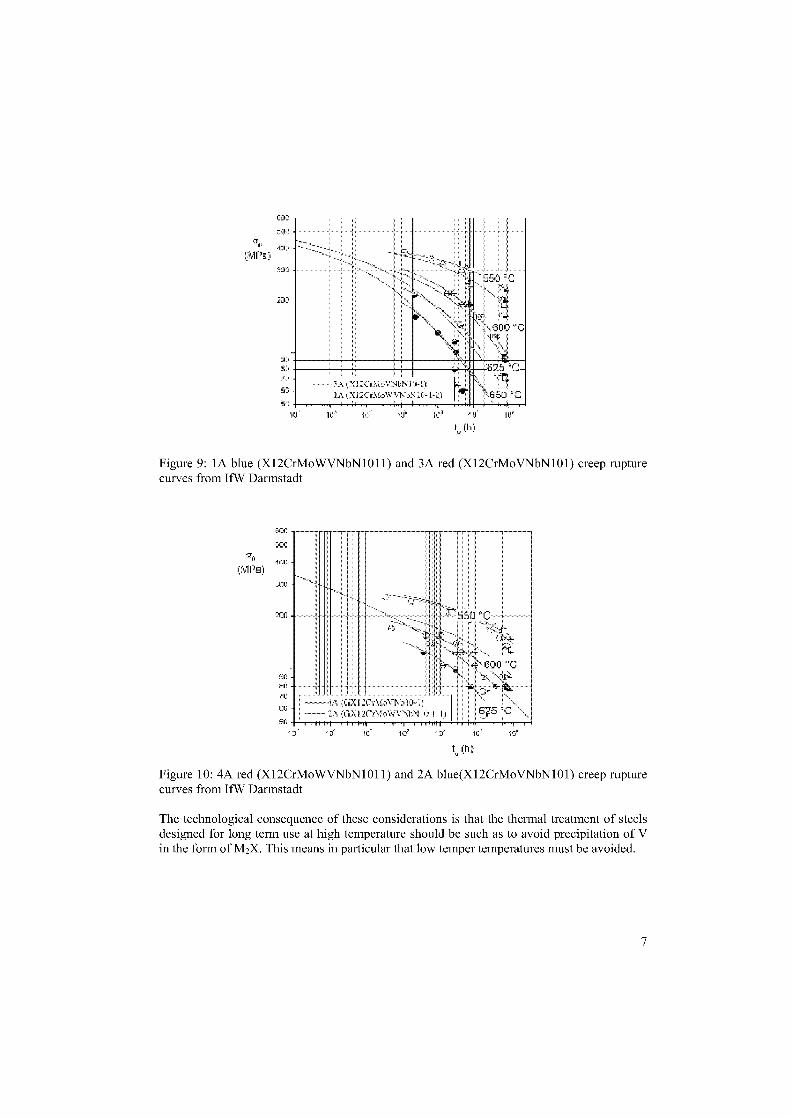
Figure 9: lA blue (X12CrMoWVNbN1011) and 3A red (X12CrMoVNbN101) creep rupturecurves from IfW Darmstadt
Figure 10: 4A red (X12CrMoWVNbN1011) and 2A blue(X12CrMoVNbN101) creep rupturecurves from IfW Darmstadt
The technological consequence of these considerations is that the thermal treatment of steelsdesigned for Jong term use at high temperature should be such as to avoid precipitation of Vin the form of M 2X. This means in particular that low temper temperatures must be avoided.
7
6 Microstructural interpretation of the creep rupture behavior
This section provides the microstructural interpretation for the experimental creep rupturecurves from IfW Darmstadt displayed in Figs. 9 and 10. The W-based steels 1A, 2A and W-free 3A, 4A are designed for operation at 600°C. The forged steels 1A and 3A show betterinitial creep resistance due to their small initial subgrain size wo and numerous Ehe M 2X par-ticles in comparison to larger wo and MX particles in the cast steels 2A and 4A. As evidentfrom the creep rupture curves, the deterioration of creep resistance with increasing rupturetime is faster in 1A and 3A in comparison to 2A. This is primarily due to the relatively rapidcoarsening of M2X (section 4.2). According to the Ostwald ripening law, the coarsening ofprecipitates occurs at a certain constant rate of increase of precipitate volume with time. Thiscoarsening becomes relevant only at a time where the increase of volume is signiRant rela-tive to the initial volume of the precipitates. This time decreases when the initial size of pre-cipitates dp,0 is small and the coarsening rate is high. Smaller 4 0 and higher coarsening rateof M2X in comparison to MX explain why the creep resistance of 1A and 3A degrades fasterthan that of 2A and 4A. Consistent with the thermal activation of coarsening the degradationby coarsening of M2X sets in at lower times for higher temperature. This explains why thepoint of intersection of the curves for lA (with M2X) and 2A (with MX) shifts to smallertimes with increasing temperature.The initial subgrain sizes in 1A and 3A are similar, giving no reason for a difference in creeprupture behavior. Yet the creep rupture strength of the W free 3A is better than that of Wbased 1A. Laves phase in the W-bearing steels is expected to stabilize the subgrain bounda-ries and increase the creep life of 1A. Obviously, this effect is not dominant here, but ismasked by other changes in the microstructure probably related to carbonitride precipitates.In the case of the cast steels the expectation of a positive effect of W is ful However, theW-free steel 4A Shows abnormal fracture behavior with low fracture strain. For instance, theinvestigated 4A-specimen crept at 90 MPa at 600 o C has only 4.0 % fracture strain whereas a3A-specimen crept at 125 MPa at 600 o C has 17.5 % fracture strain. This embrittlement mayhave to do with grain boundaries, for instance in relation with localized strain at grainboundaries, which may be due to locally coarsened microstructure, or to impurity segregationat the boundaries. However, there are no data to clarify this issue.
7 Summary
Precipitation hardening is essential for creep resistance of tempered martensite Cr steels tosuppress dislocation glide and coarsening of the subgrain structure. If the steels are heattreated to be hardened by M2X, they show relatively high initial creep resistance at tempera-tures around 873 K due to File M2X in the subgrain interior, but relatively low Jong-termcreep resistance as M2X coarsens rapidly at subgrain boundaries and dissolves in the subgraininterior.
8 Acknowledgments
Financial support of the DFG in the DT1/2 project is gratefully acknowledged. We thankProf. Messerschmidt and his coworkers, MPI, Halle, Germany, for performing the in-situTEM deformation experiments at high temperature.
8
9 References
[1] G. Götz, Y. Qin, and W. Blum. Investigation of precipitation in Gast martensitic an-nealed steel X12 CrMoVWNbN 1011 by semiautomatic EDX analysis in the scanningtransmission electron microscope. In R. Viswanathan, W.T. Bakker, and J. D. Parker,editors, Advances in materials technology for fossil power plants, Proc. of the 3rd Con-ference held at University of Wales Swansea, 5th April 6th April 2001, pages 155-163,London, 2001. The Institute of Materials.
[2] T. Seibert, K. Durst, H. Chilukuru, W. Blum, and M. Göken. Quantitative Gefügeanaly-se von 912%Cr Stählen mittels AFM, REM und TEM. in M. Göken, editor, 37. Prakti-schen Metallographie Sonderbände, Fortschritte in der Metallographie, page 73, Erlan-gen, Sept. 2005. DGM.
[3] R. Agamennone, W. Blum, C. Gupta, and Chakravartty. Evolution of microstructure anddeformation resistance in creep of tempered martensitic 9-12%Cr2W5%Co steels. ActaMater., to be published.
[4] K. Kimura, K. Suzuki, H. Kushima, and F. Abe:Precipitation of Z-phase and its effecton creep strength of Mod.9CrlMo steel. In R. Gladir§ A. Jakobov'na Z. Kuborl Pur-mensk'y M. Filip, V. Foldyna and J. Sobotka, editors, Proceedings of the 10th joint In-ternational Conference on Creep & Fracture of Engineering Materials and Structures,Creep Resistant Metallic Materials, 811 April 2001, pages 186– 195, Prag, Czech Re-public, 2001. VitkoviceResearch and Development and TERIS 2002.
[5] G. Götz and W. Blum. InPuence of thermal history on precipitation of hardening phasesin tempered martensite steel of type X12CrMoWVNbN1011. Mater. Sci. Eng. A,348/12:201-207, 2003.
[6] H. Danielsen and J. Hald. Z-Phase in 9-12%Cr Steels. Technical Report M4313, Värme-forsk Service AB, 10153 Stockholm, February 2004.
[7] J. Hald. Long-term Stability of 912% Cr Steels Current Understanding and Future Per-spectives. In Werkstoffe und Qualitätssicherung 2004, Dortmund, March 2004. VGB.
[8] L Letofsky, Papst, P. Warbichler, F. Hofer, E. Letofsky, and H. Cerjak. On the occur-rence of Z-phase in a creep tested 10% Cr steel. Z. Metallkd., 95(1):18, 2004.
[9] L. Lundin, S. Fällman, and H.O. Andr'en. Microstructure and mechanical properties of a10% chromium steel with improved creep resistance at 600 .C. Mat. Sci. Tech.,13(3):232-242, 1997.
[10] X. H. Zeng and W. Blum. Modelling the InPuence of Microstructure on Creep Strengthof GX12CrMoWVNbN 1011. In 29th MPA Seminar, Safety and Reliability in EnergyTechnology, Oct 2003, Stuttgart, 2003.
[11] D. Henes, H. Möhlig, S. Straub, J. Granacher, W. Blum, and C. Berger. MicrostructureBased Modelling of the Long Term Monotonic and Cyclic Creep of the MartensiticSteel X 20(22) CrMoV 12 1. In H. Mughrabi, G. Gottstein, H. Mecking, H. Riedel, andJ. Tobolski, editors, Microstructure and Mechanical Properties of Metallic HighTem-perature Materials, pages 179-191, Weinheim, 1999. Wi1eyVCH.
[12] K. Sawada, H. Kushima, and K. Kimura. Precipitation behavior of Z phase during agingand creep in 9-12 %Cr ferritic heat resistant steels. In International workshop on Per-formance and requirements of structural materials for modern high efficient powerplants, pages 96-104, Darmstadt, September 6-9 2005.
[13] T. Seibert, K. Durst, H. Chilukuru, M. Göken: Quantative microstructural analysis onthe stability of MX and M2X in 9-12% Cr steels by AFM, SEM, TEM submitted toLiege 2006
9

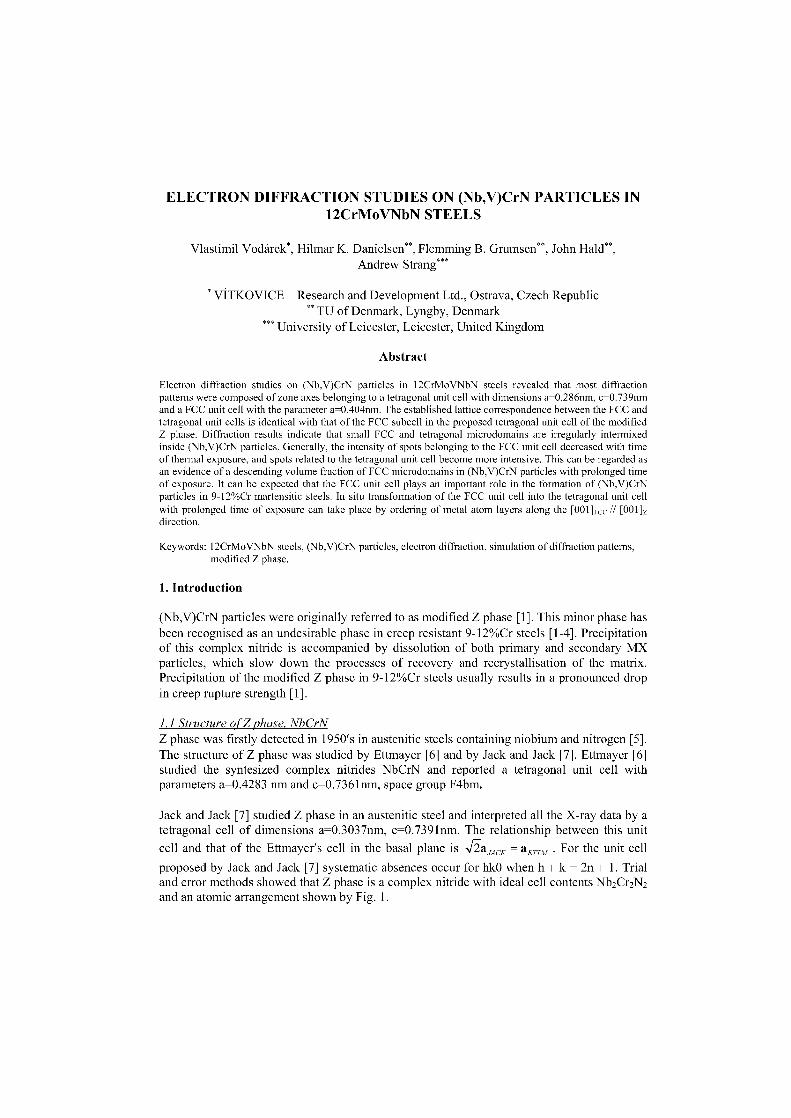
ELECTRON DIFFRACTION STUDIES ON (Nb,V)CrN PARTICLES IN12CrMoVNbN STEELS
Vlastimil Vodärek * , Hilmar K. Danielsen** , Flemming B. Grumsen ** , John Halde,Andrew Strang***
* ViTKOVICE — Research and Development Ltd., Ostrava, Czech Republic** TU of Denmark, Lyng,by Denmark
*** University of Leicester, Leicester, United Kingdom
Abstract
Electron diffraction studies an (Nb,V)CrN particles in 12CrMoVNbN steels revealed that most diffractionpattems were composed of zone axes belonging to a tetragonal unit cell with dimensions a=0.286nm, c=0.739nmand a FCC unit cell with the parameter a=0.404nm. The established lattice correspondence between the FCC andtetragonal unit cells is identical with that of the FCC subcell in the proposed tetragonal unit cell of the modifiedZ phase. Diffraction results indicate that small FCC and tetragonal microdomains are irregularly intermixedinside (Nb,V)CrN particles. Generally, the intensity of spots belonging to the FCC unit cell decreased with timeof thermal exposure, and spots related to the tetragonal unit cell become more intensive. This can be regarded asan evidence of a descending volume fraction of FCC microdomains in (Nb,V)CrN particles with prolonged timeof exposure. It can be expected that the FCC unit cell plays an important role in the formation of (Nb,V)CrNparticles in 9-12%Cr martensitic steels. In situ transformation of the FCC unit cell into the tetragonal unit cellwith prolonged time of exposure can take place by ordering of metal atom layers along the [001] Fcc /1 [0011zdirection.
Keywords: 12CrMoVNbN steels, (Nb,V)CrN particles, electron diffraction, simulation of diffraction pattems,modified Z phase.
1. Introduction
(Nb,V)CrN particles were originally referred to as modified Z phase [1]. This minor phase hasbeen recognised as an undesirable phase in creep resistant 9-12%Cr steels [1-4]. Precipitationof this complex nitride is accompanied by dissolution of both primary and secondary MXparticles, which slow down the processes of recovery and recrystallisation of the matrix.Precipitation of the modified Z phase in 9-12%Cr steels usually results in a pronounced dropin creep rupture strength [1].
1.1 Structure of Z phase, NbCrNZ phase was firstly detected in 1950's in austenitic steels containing niobium and nitrogen [5].The structure of Z phase was studied by Ettmayer [6] and by Jack and Jack [7]. Ettmayer [6]studied the syntesized complex nitrides NbCrN and reported a tetragonal unit cell withparameters a=0.4283 nm and c=0.7361nm, space group F4bm.
Jack and Jack [7] studied Z phase in an austenitic steel and interpreted all the X-ray data by atetragonal cell of dimensions a=0.3037nm, c=0.7391nm. The relationship between this unit
cell and that of the Ettmayer's cell in the basal plane is Via„,„ = amm . For the unit cell
proposed by Jack and Jack [7] systematic absences occur for hk0 when h + k = 2n + 1. Trialand error methods showed that Z phase is a complex nitride with ideal cell contents Nb2Cr2N2and an atomic arrangement shown by Fig. 1.
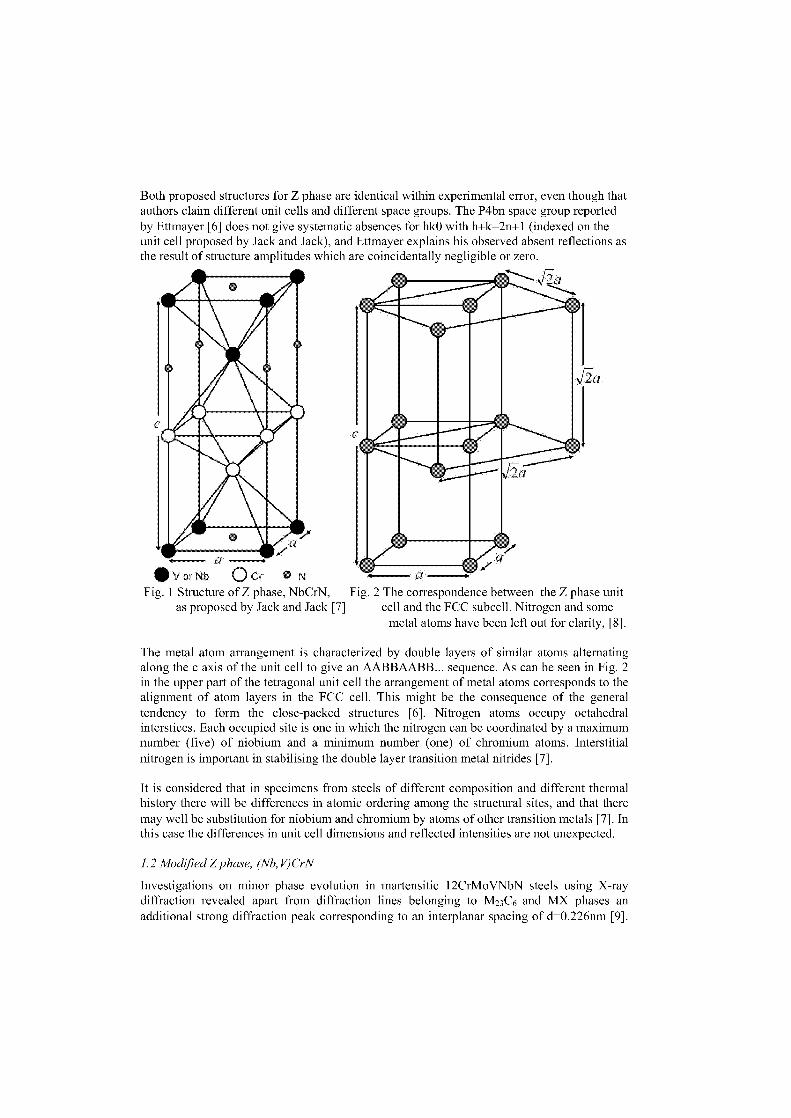
Both proposed structures for Z phase are identical within experimental error, even though thatauthors claim different unit cells and different space groups. The P4bn space group reportedby Ettmayer [6] does not give systematic absences for hk0 with h+k=2n+1 (indexed on theunit cell proposed by Jack and Jack), and Ettmayer explains his observed absent reflections asthe result of structure amplitudes which are coincidentally negligible or zero.
2a
Vor tob 0 Cr 0 N a
Fig. 1 Structure of Z phase, NbCrN, Fig. 2 The correspondence between the Z phase unitas proposed by Jack and Jack [7] cell and the FCC subcell. Nitrogen and some
metal atoms have been left out for clarity, [8].
The metal atom arrangement is characterized by double layers of similar atoms alternatingalong the c axis of the unit cell to give an AABBAABB... sequence. As can be seen in Fig. 2in the upper part of the tetragonal unit cell the arrangement of metal atoms corresponds to thealignment of atom layers in the FCC cell. This might be the consequence of the generaltendency to form the close-packed structures [6]. Nitrogen atoms occupy octahedralinterstices. Each occupied site is one in which the nitrogen can be coordinated by a maximumnumber (five) of niobium and a minimum number (one) of chromium atoms. Interstitialnitrogen is important in stabilising the double layer transition metal nitrides [7].
It is considered that in specimens from steels of different composition and different thermalhistory there will be differences in atomic ordering among the structural sites, and that theremay well be substitution for niobium and chromium by atoms of other transition metals [7]. Inthis case the differences in unit cell dimensions and reflected intensities are not unexpected.
1.2 Modified Z phase, (Nb, V)CrN
Investigations on minor phase evolution in martensitic 12CrMoVNbN steels using X-raydiffraction revealed apart from diffraction lines belonging to M23C6 and MX phases anadditional strong diffraction peak corresponding to an interplanar spacing of d=0.226nm [9].
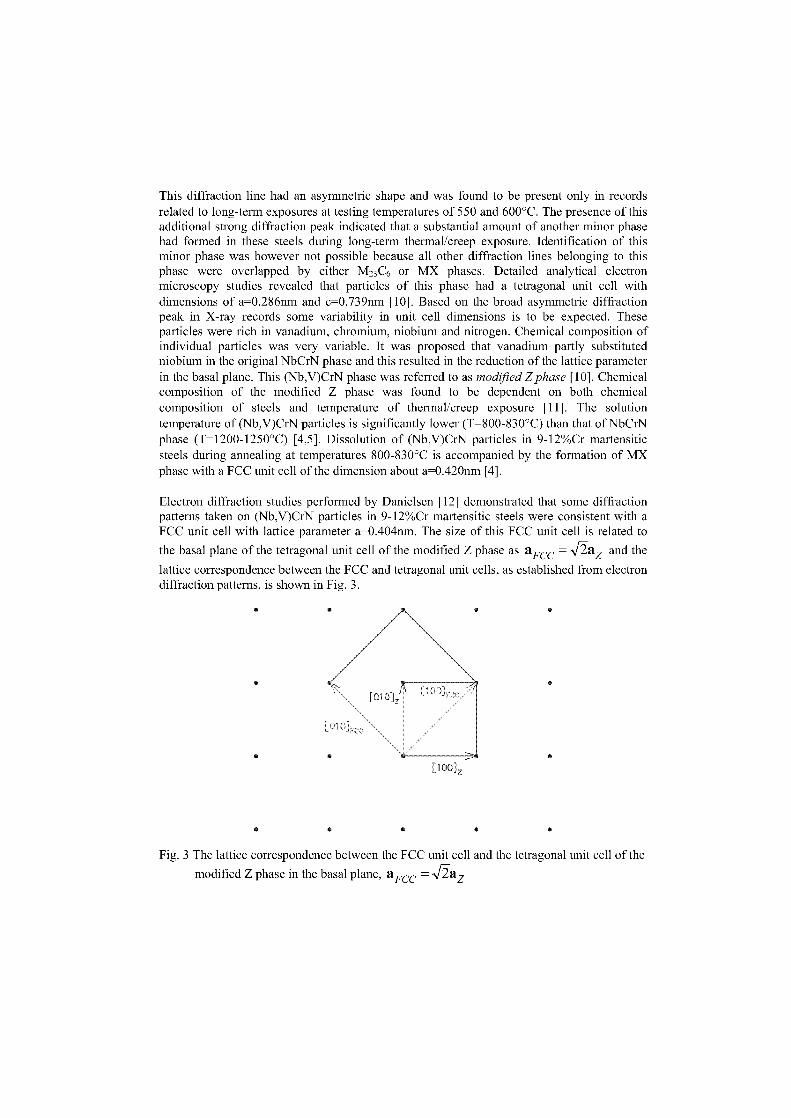
This diffraction line had an asymmetric shape and was found to be present only in recordsrelated to long-term exposures at testing temperatures of 550 and 600°C. The presence of thisadditional strong diffraction peak indicated that a substantial amount of another minor phasehad formed in these steels during long-term thermal/creep exposure. Identification of thisminor phase was however not possible because all other diffraction lines belonging to thisphase were overlapped by either M23C6 or MX phases. Detailed analytical electronmicroscopy studies revealed that particles of this phase had a tetragonal unit cell withdimensions of a=0.286nm and c=0.739nm [10]. Based on the broad asymmetric diffractionpeak in X-ray records some variability in unit cell dimensions is to be expected. Theseparticles were rich in vanadium, chromium, niobium and nitrogen. Chemical composition ofindividual particles was very variable. It was proposed that vanadium partly substitutedniobium in the original NbCrN phase and this resulted in the reduction of the lattice parameterin the basal plane. This (Nb,V)CrN phase was referred to as modified Z phase [10]. Chemicalcomposition of the modified Z phase was found to be dependent on both chemicalcomposition of steels and temperature of thermal/creep exposure [11]. The solutiontemperature of (Nb,V)CrN particles is significantly lower (T=800-830°C) than that of NbCrNphase (T=1200-1250°C) [4,5]. Dissolution of (Nb,V)CrN particles in 9-12%Cr martensiticsteels during annealing at temperatures 800-830°C is accompanied by the formation of MXphase with a FCC unit cell of the dimension about a=0.420nm [4].
Electron diffraction studies performed by Danielsen [12] demonstrated that some diffractionpatterns taken on (Nb,V)CrN particles in 9-12%Cr martensitic steels were consistent with aFCC unit cell with lattice parameter a=0.404nm. The size of this FCC unit cell is related to
the basal plane of the tetragonal unit cell of the modified Z phase as a = and theFCC Zlattice correspondence between the FCC and tetragonal unit cells, as established from electrondiffraction patterns, is shown in Fig. 3.
[100],
Fig. 3 The lattice correspondence between the FCC unit cell and the tetragonal unit cell of the
modified Z phase in the basal plane, aFcc, = -jaz
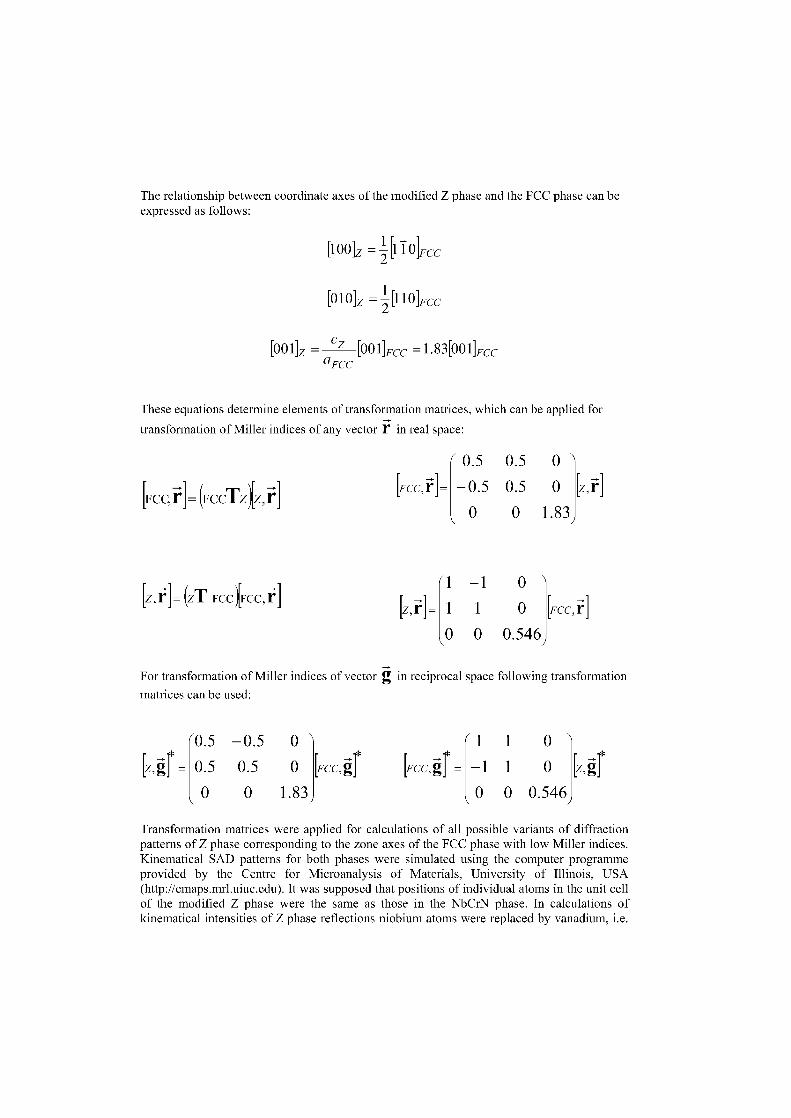
The relationship between coordinate axes of the modified Z phase and the FCC phase can beexpressed as follows:
ook = 2
I Okrc
[010]z[110]FCC
[001]2 = CZ [001]FCC =1.83[001]FCCaFCC
These equations determine elements of transformation matrices, which can be applied fortransformation of Miller indices of any vector r in real space:
[F CC, = C JAZ, i] [FCC,i]=
0.5
— 0.5
0
0.5
0.5
0
0
0
1.83[Z r]
[Z (ZT FCC )[FCC ,1 —1 0
[z,i]= 1 1 0 [FCC,
0 0 0.546,
For transformation of Miller indices of vector g in reciprocal space following transformationmatrices can be used:
(0.5 —0.5 0 1 1 0
[z , er = 0.5
0
0.5
0
0
1.83
[FCC, er [FCC,gr =0
10
00.546,
[z ,
Transformation matrices were applied for calculations of all possible variants of diffractionpatterns of Z phase corresponding to the zone axes of the FCC phase with low Miller indices.Kinematical SAD patterns for both phases were simulated using the computer programmeprovided by the Centre for Microanalysis of Materials, University of Illinois, USA(http://emaps.mrl.uiuc.edu). It was supposed that positions of individual atoms in the unit cellof the modified Z phase were the same as those in the NbCrN phase. In calculations ofkinematical intensities of Z phase reflections niobium atoms were replaced by vanadium, i.e.
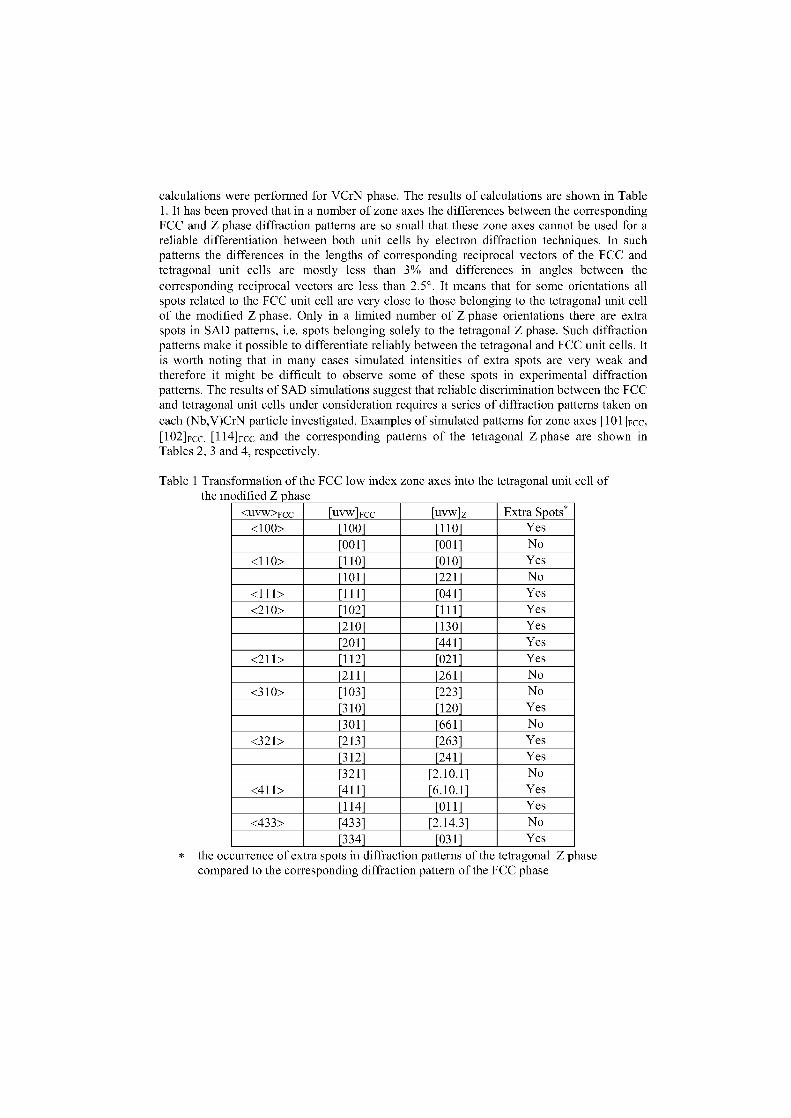
calculations were performed for VCrN phase. The results of calculations are shown in Table1. It has been proved that in a number of zone axes the differences between the correspondingFCC and Z phase diffraction patterns are so Small that these zone axes cannot be used for areliable differentiation between both unit cells by electron diffraction techniques. In suchpatterns the differences in the lengths of corresponding reciprocal vectors of the FCC andtetragonal unit cells are mostly less than 3% and differences in angles between thecorresponding reciprocal vectors are less than 2.5°. It means that for some orientations allspots related to the FCC unit cell are very dose to those belonging to the tetragonal unit cellof the modified Z phase. Only in a limited number of Z phase orientations there are extraspots in SAD patterns, i.e. spots belonging solely to the tetragonal Z phase. Such diffractionpatterns make it possible to differentiate reliably between the tetragonal and FCC unit cells. Itis worth noting that in many cases simulated intensities of extra spots are very weak andtherefore it might be difficult to observe some of these spots in experimental diffractionpatterns. The results of SAD simulations suggest that reliable discrimination between the FCCand tetragonal unit cells under consideration requires a series of diffraction patterns taken aneach (Nb,V)CrN particle investigated. Examples of simulated patterns for zone axes [101]Fcc,[102] FCC, [114] FCC and the corresponding patterns of the tetragonal Z phase are shown inTables 2, 3 and 4, respectively.
Table 1 Transformation of the FCC low index zone axes into the tetragonal unit cell ofthe modified Z phase
<UVW>FCC [UVW]FCC [uvw]z Extra Spots*Yes<100> [100] [110]
[001] [001] No
<110> [110] [010] Yes
[101] [221] No
<111> [111] [041] Yes
<210> [102] [111] Yes
[210] [130] Yes
[201] [441] Yes
<211> [112] [021] Yes
[211] [261] No
<310> [103] [223] No
[310] [120] Yes
[301] [661] No
<321> [213] [263] Yes
[312] [241] Yes
[321] [2.10.1] No
<411> [411] [6.10.1] Yes
[114] [011] Yes
<433> [433] [2.14.3] No
[334] [031] Yes
* the occurrence of extra spots in diffraction patterns of the tetragonal Z phasecompared to the corresponding diffraction pattern of the FCC phase
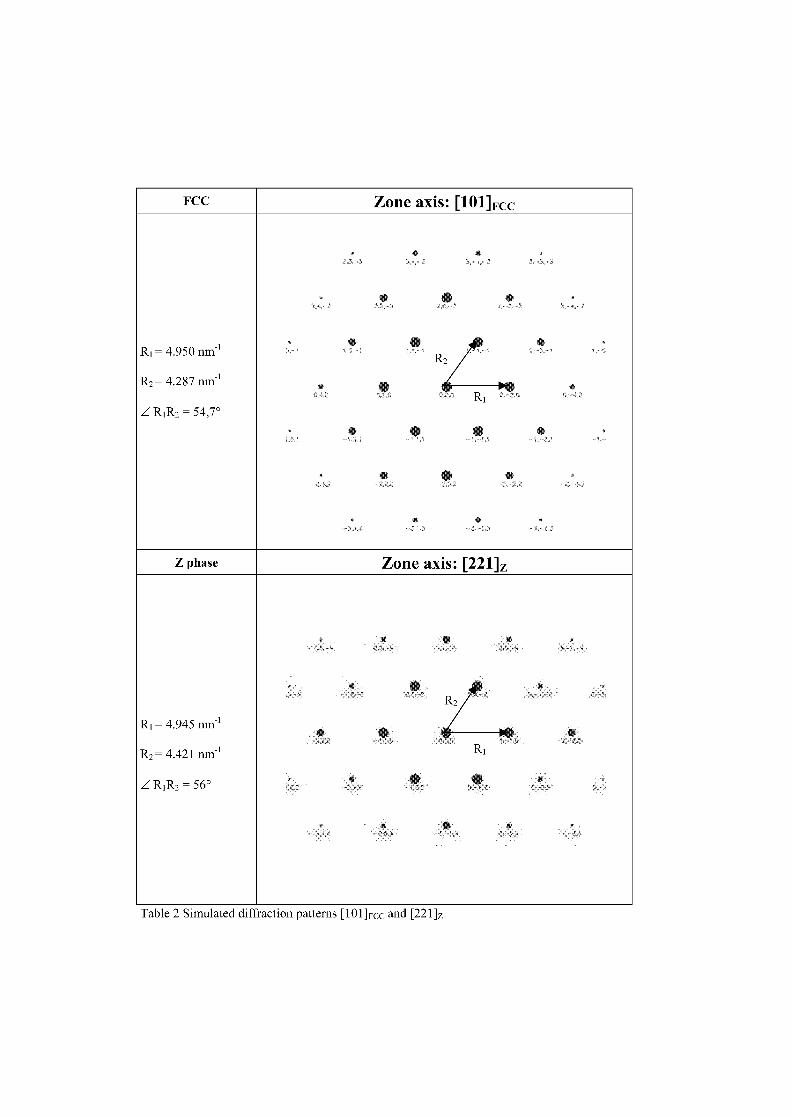
Zone axis: [101]FccFCC
R1 = 4.950 nm-1
R2 = 4.287 nm-1
R I R2 = 54,7°
Zone axis: [221]zZ phase
R 1 =4.945 nm-1
R2 = 4.421 nm-1
R1 R2 = 56°
Table 2 Simulated diffraction patterns [101] FCC and [221]z
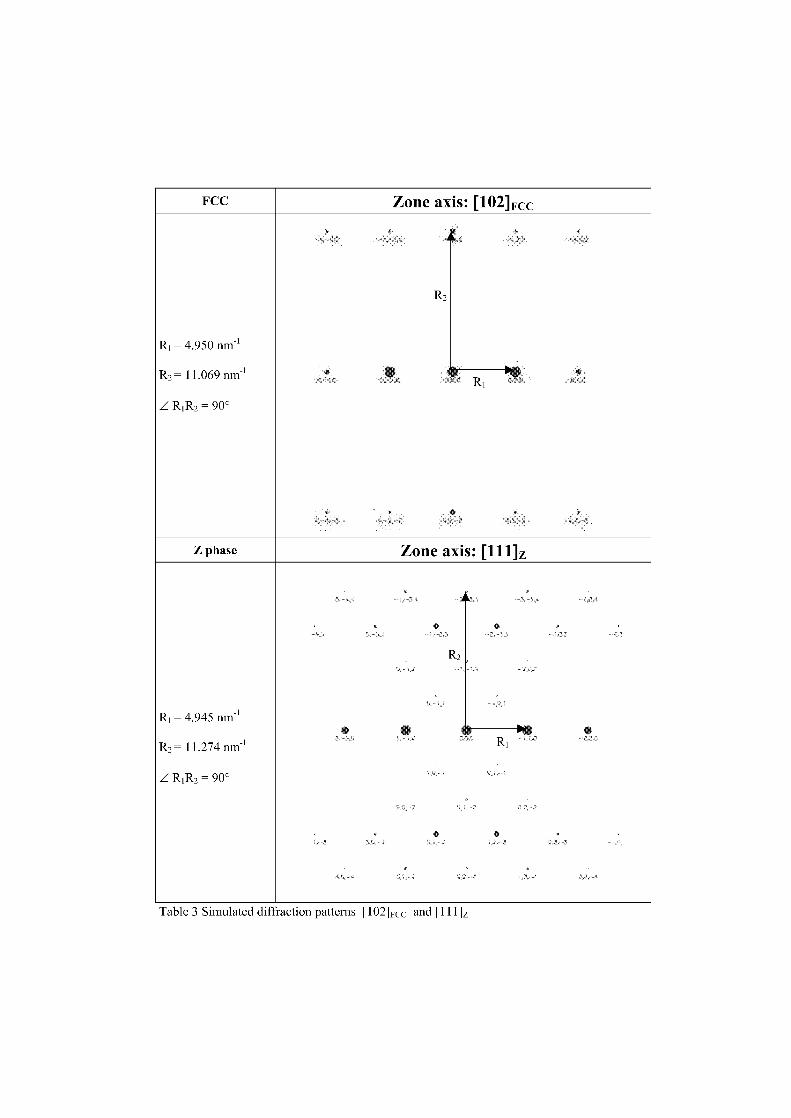
Zone axis: [111]zZ phase
Zone axis: [102]FccFCC
R i = 4.950 nm-1
R2 = 11.069 nm-1
RiR2 = 90°
R 1 = 4.945 nm-1
R2 = 11.274 nm-1
R1 R2 = 90°
Table 3 Simulated diffraction pattems [102] FCC and [111]z
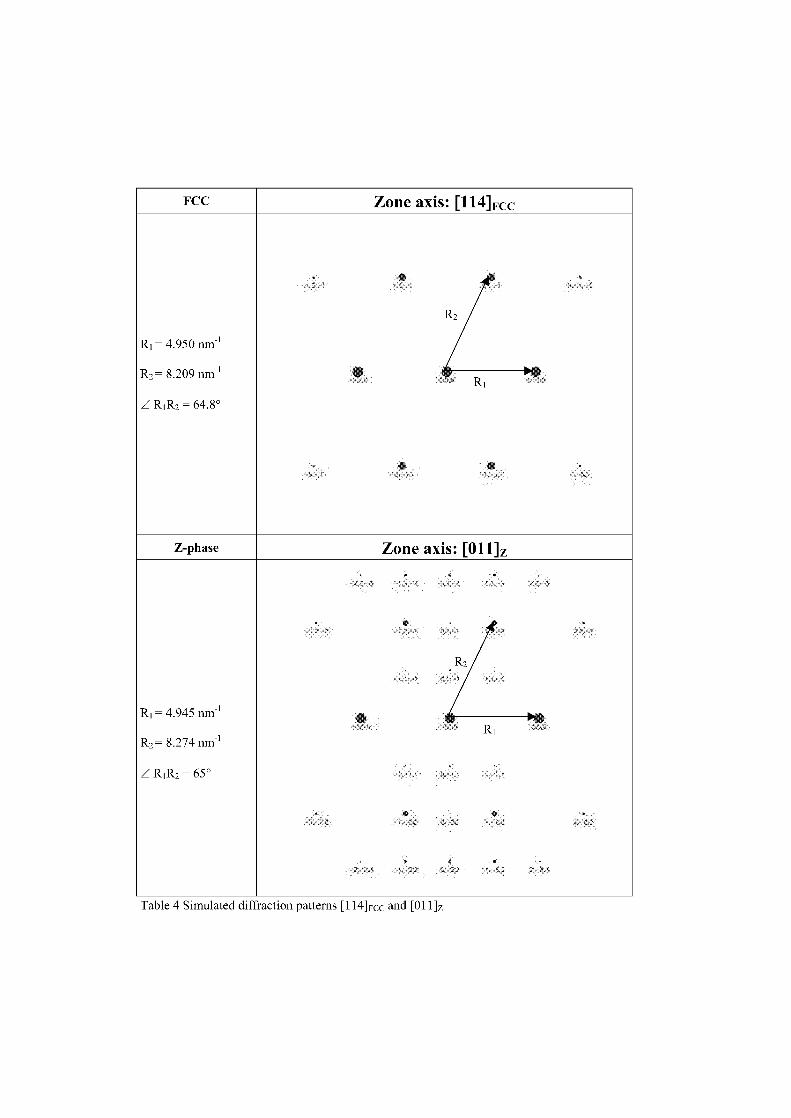
FCC Zone axis: [114]Fcc
R1 = 4.950 nm-1
R2 = 8.209 nm-1
Z R I R2 = 64.8°
R2
R1
Z-phase Zone axis: [011]Z
R i = 4.945 nm-1
R2 = 8.274 nm-1
Z Ri R2 = 65°
R2
R1
Table 4 Simulated diffraction patterns [114] FCC and [011]z
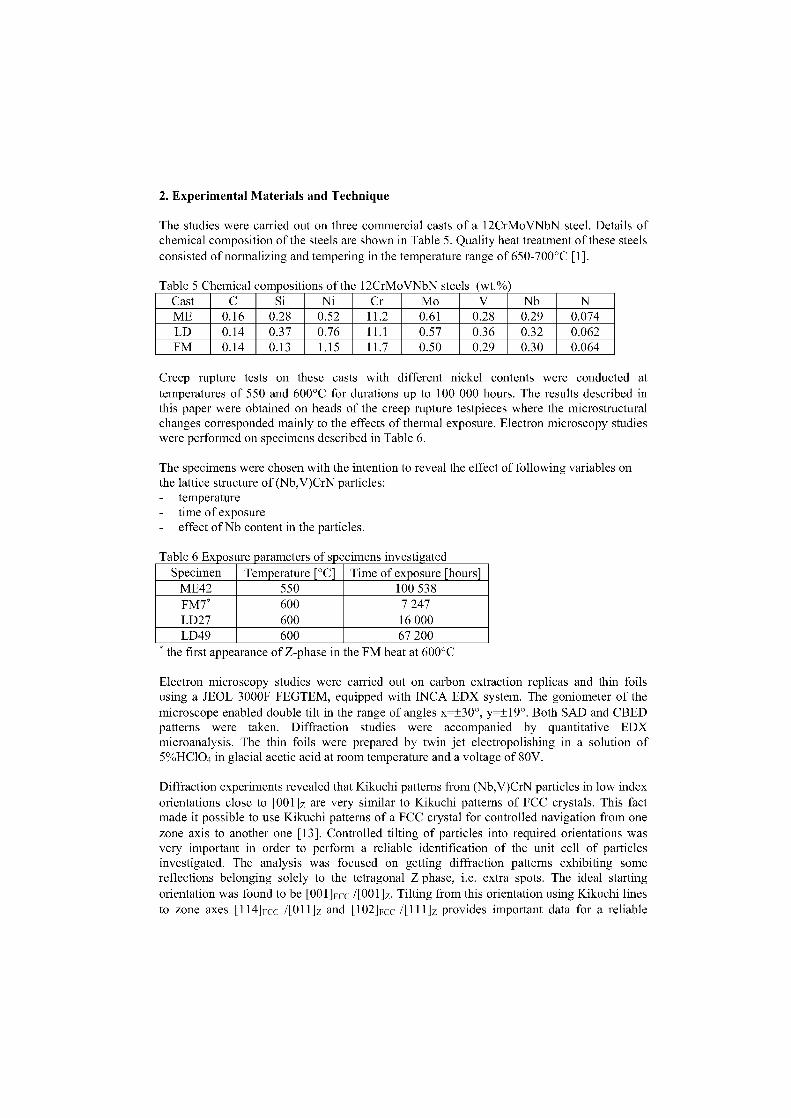
2. Experimental Materials and Technique
The studies were carried out on three commercial casts of a 12CrMoVNbN steel. Details ofchemical composition of the steels are shown in Table 5. Quality heat treatment of these steelsconsisted of normalizing and tempering in the temperature range of 650-700°C [1].
Table 5 Chemical com ositions of the 12CrMoVNbN steels (wt.%Cast C Si Ni Cr Mo V Nb NME 0.16 0.28 0.52 11.2 0.61 0.28 0.29 0.074LD 0.14 0.37 0.76 11.1 0.57 0.36 0.32 0.062FM 0.14 0.13 1.15 11.7 0.50 0.29 0.30 0.064
Creep rupture tests on these casts with different nickel contents were conducted attemperatures of 550 and 600°C for durations up to 100 000 hours. The results described inthis paper were obtained on heads of the creep rupture testpieces where the microstructuralchanges corresponded mainly to the effects of thermal exposure. Electron microscopy studieswere performed on specimens described in Table 6.
The specimens were chosen with the intention to reveal the effect of following variables onthe lattice structure of (Nb,V)CrN particles:- temperature- time of exposure- effect of Nb content in the particles.
Table 6 Ex osure oarameters of specimens investigatedSpecimen Temperature [°C] Time of exposure [hours]
ME42 550 100 538FM7 * 600 7 247LD27 600 16 000LD49 600 67 200
* the first appearance of Z-phase in the FM heat at 600°C
Electron microscopy studies were carried out on carbon extraction replicas and thin foilsusing a JEOL 3000F FEGTEM, equipped with INCA EDX system. The goniometer of themicroscope enabled double tilt in the range of angles x=±30°, y=±19°. Both SAD and CBEDpatterns were taken. Diffraction studies were accompanied by quantitative EDXmicroanalysis. The thin foils were prepared by twin jet electropolishing in a solution of5%HC1O4 in glacial acetic acid at room temperature and a voltage of 80V.
Diffraction experiments revealed that Kikuchi patterns from (Nb,V)CrN particles in low indexorientations dose to [001]z are very similar to Kikuchi patterns of FCC crystals. This factmade it possible to use Kikuchi patterns of a FCC crystal for controlled navigation from onezone axis to another one [13]. Controlled tilting of particles into required orientations wasvery important in order to perform a reliable identification of the unit cell of particlesinvestigated. The analysis was focused on getting diffraction patterns exhibiting somereflections belonging solely to the tetragonal Z phase, i.e. extra Spots. The ideal startingorientation was found to be [001] Fcc /[001]z. Tilting from this orientation using Kikuchi linesto zone axes [114]Fcc /[011]z and [102]Fcc /[111]z provides important data for a reliable
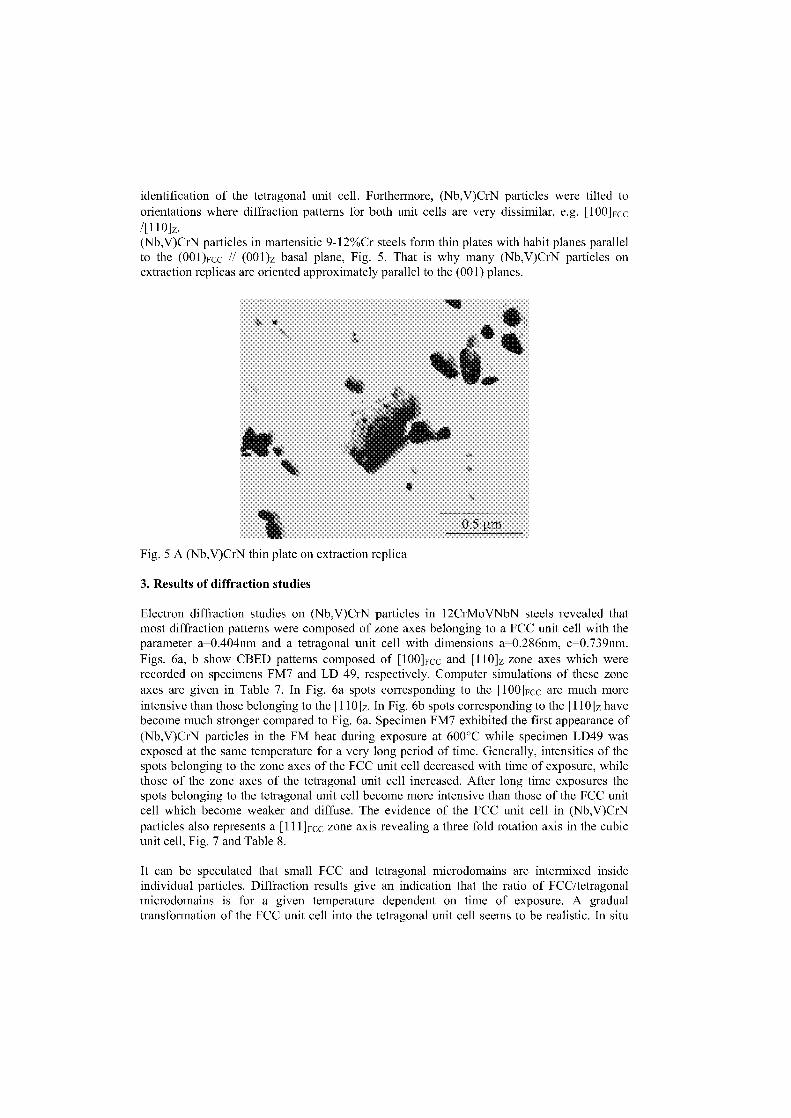
identification of the tetragonal unit cell. Furthermore, (Nb,V)CrN particles were tilted toorientations where diffraction patterns for both unit cells are very dissimilar, e.g. [100]Fcc/1101z.(Nb,V)CrN particles in martensitic 9-12%Cr steels form thin plates with habit planes parallelto the (001)Fcc // (001)z basal plane, Fig. 5. That is why many (Nb,V)CrN particles onextraction replicas are oriented approximately parallel to the (001) planes.
0.5 [Im
Fig. 5 A (Nb,V)CrN thin plate on extraction replica
3. Results of diffraction studies
Electron diffraction studies on (Nb,V)CrN particles in 12CrMoVNbN steels revealed thatmost diffraction patterns were composed of zone axes belonging to a FCC unit cell with theparameter a=0.404nm and a tetragonal unit cell with dimensions a=0.286nm, c=0.739nm.Figs. 6a, b Show CBED patterns composed of [100] FCC and [110]z zone axes which wererecorded on specimens FM7 and LD 49, respectively. Computer simulations of these zoneaxes are given in Table 7. In Fig. 6a spots corresponding to the [100] Fcc are much moreintensive than those belonging to the [110]z. In Fig. 6b spots corresponding to the [110]z havebecome much stronger compared to Fig. 6a. Specimen FM7 exhibited the first appearance of(Nb,V)CrN particles in the FM heat during exposure at 600°C while specimen LD49 wasexposed at the same temperature for a very long period of time. Generally, intensities of thespots belonging to the zone axes of the FCC unit cell decreased with time of exposure, whilethose of the zone axes of the tetragonal unit cell increased. After long time exposures thespots belonging to the tetragonal unit cell become more intensive than those of the FCC unitcell which become weaker and diffuse. The evidence of the FCC unit cell in (Nb,V)CrNparticles also represents a [111] Fcc zone axis revealing a three fold rotation axis in the cubicunit cell, Fig. 7 and Table 8.
It can be speculated that Small FCC and tetragonal microdomains are intermixed insideindividual particles. Diffraction results give an indication that the ratio of FCC/tetragonalmicrodomains is for a given temperature dependent on time of exposure. A gradualtransformation of the FCC unit cell into the tetragonal unit cell seems to be realistic. In situ
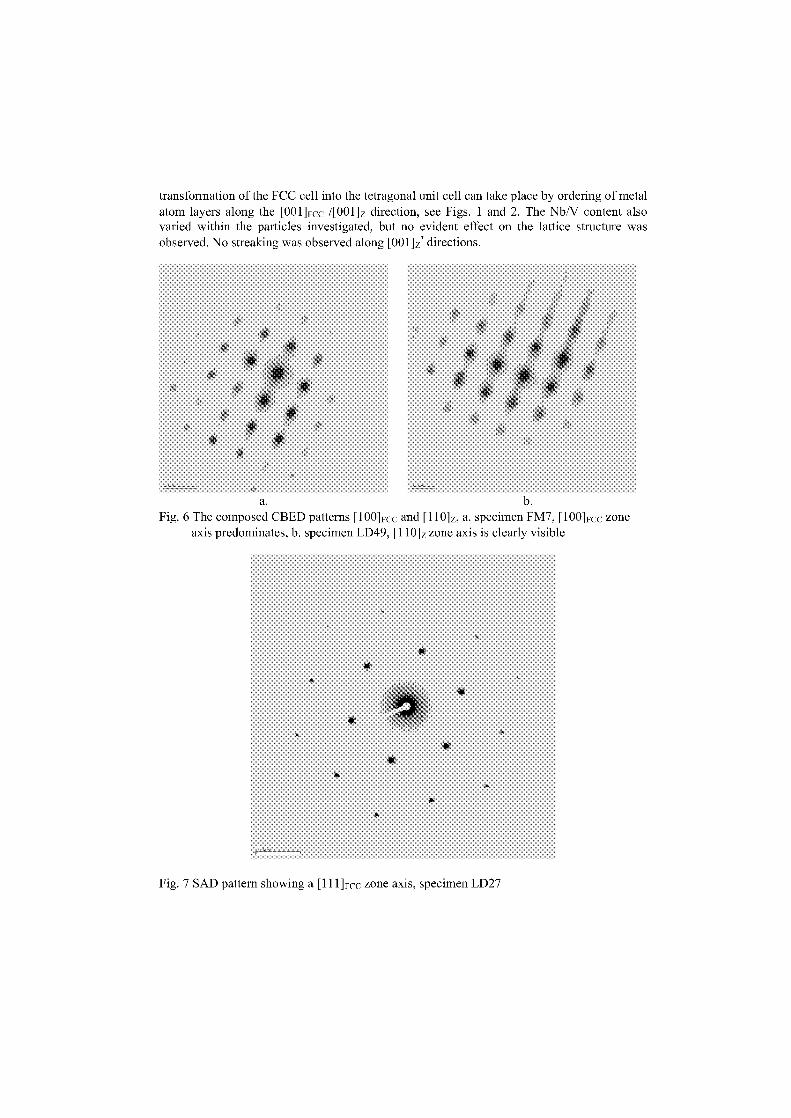
transformation of the FCC cell into the tetragonal unit cell can take place by ordering of metalatom layers along the [001] Fcc /[001]z direction, see Figs. 1 and 2. The Nb/V content alsovaried within the particles investigated, but no evident effect an the lattice structure wasobserved. No streaking was observed along [001]z * directions.
a. b.Fig. 6 The composed CBED patterns [100] Fcc and [110]z, a. specimen FM7, [100] Fcc zone
axis predominates, b. specimen LD49, [110]z zone axis is clearly visible
Fig. 7 SAD pattern showing a [111] Fcc zone axis, specimen LD27
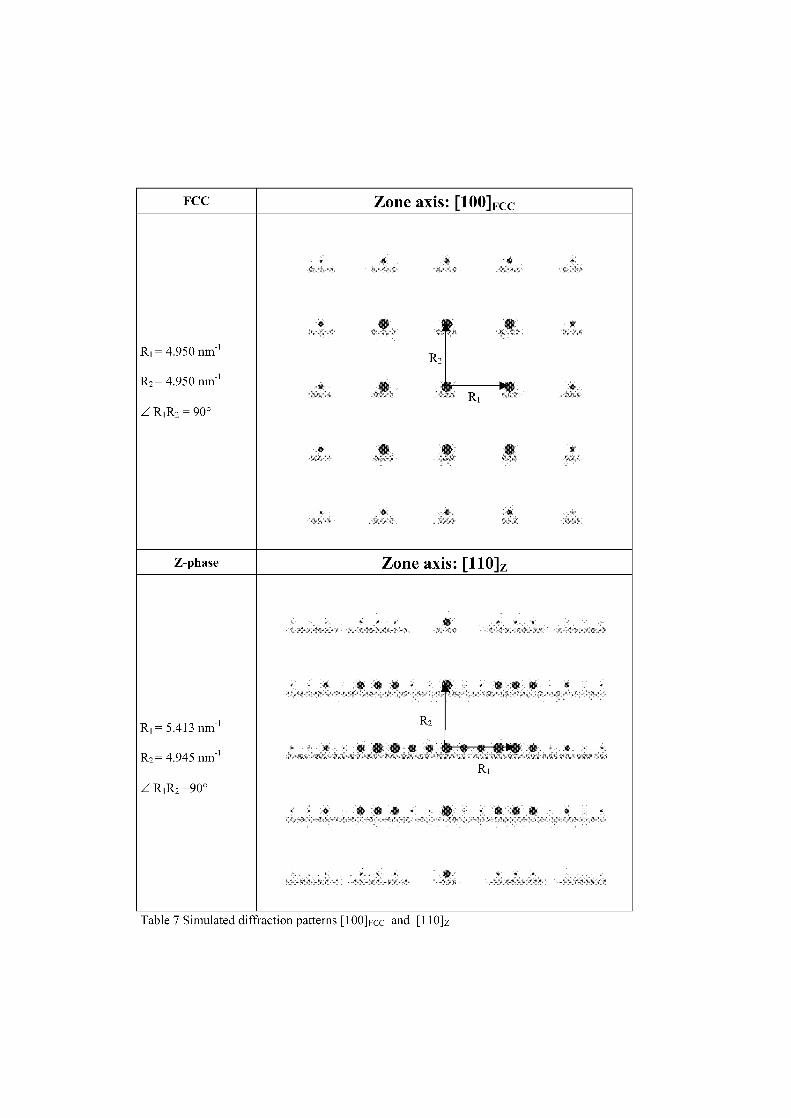
Zone axis: [110]zZ-phase
• • • •
Zone axis: [100]FccFCC
R1 = 4.950 nm-1
R2 = 4.950 nm-1
R I R2 = 90°
R1 = 5.413 nm'
R2 = 4.945 nm-1
Ri R2 =90°
Table 7 Simulated diffraction pattems [100]FCC and [110]z
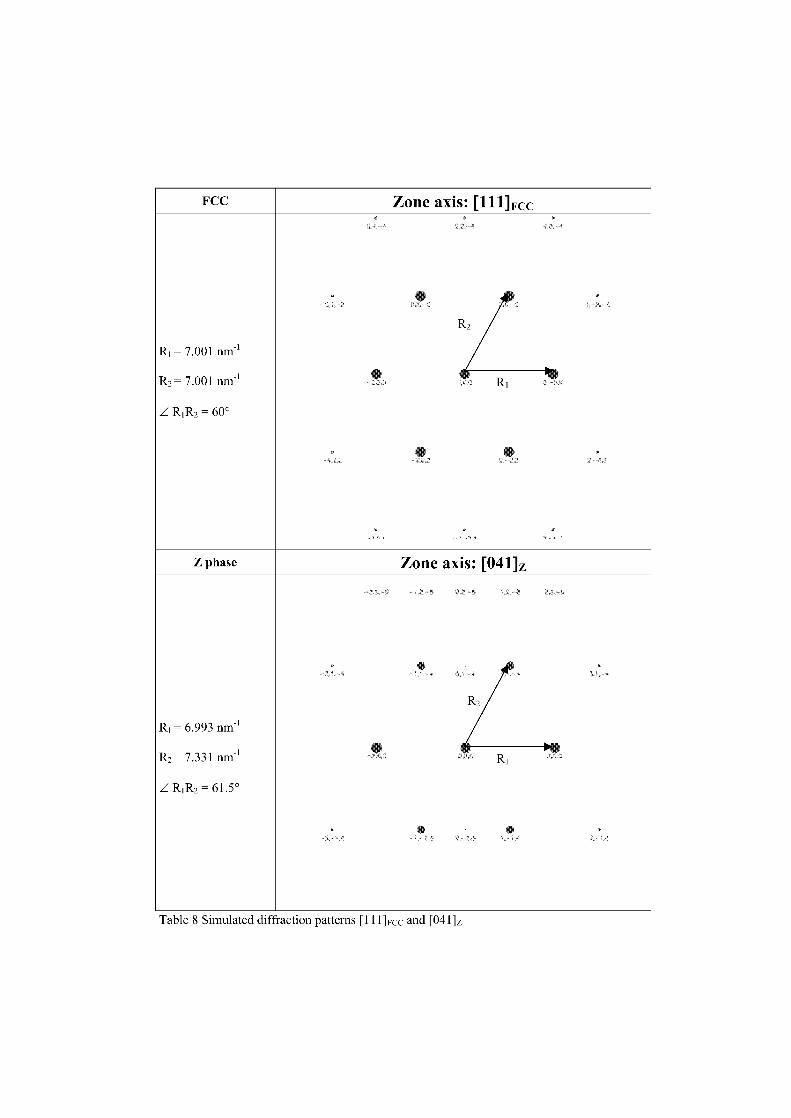
Zone axis: [111]FccFCC
R 1 = 7.001 nm1
R2 = 7.001 nm-1
RiR2 = 60°
Zone axis: [041]zZ phase
R1 = 6.993 nm-1
R2 = 7.331 nm-1
R I R2 = 61.5°
0
0
Table 8 Simulated diffraction pattems [1111 Fcc and [041]z
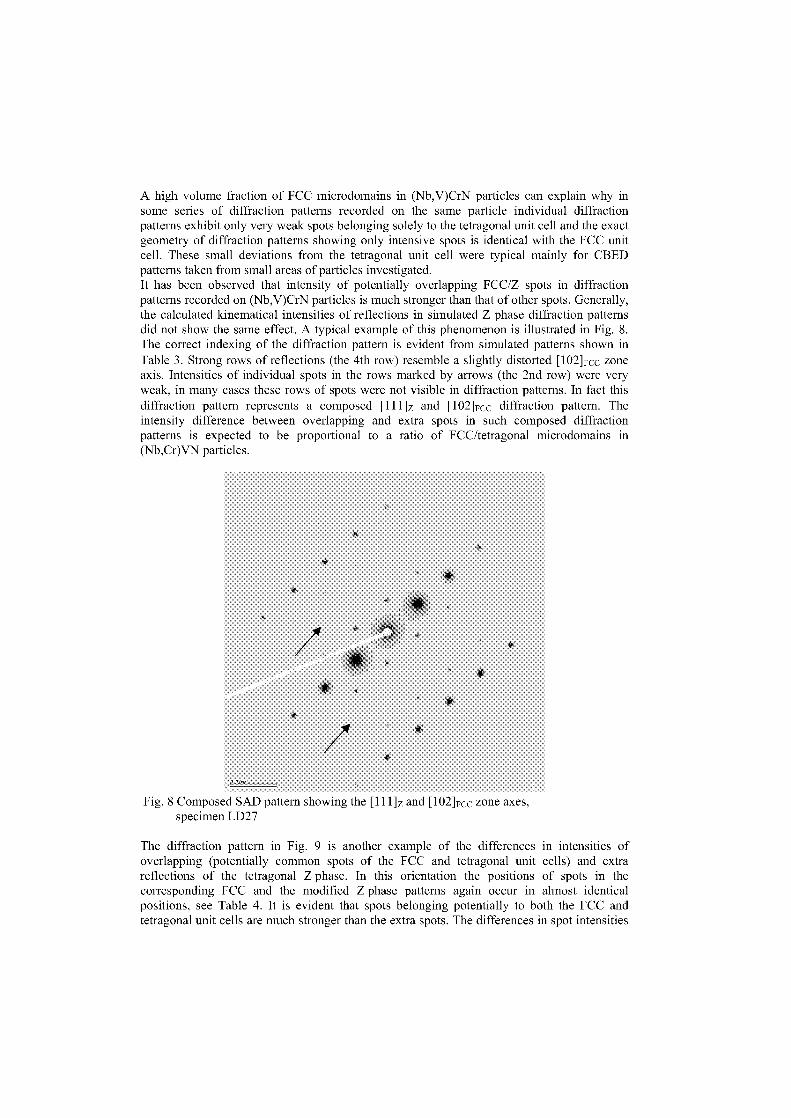
A high volume fraction of FCC microdomains in (Nb,V)CrN particles can explain why insome series of diffraction patterns recorded on the same particle individual diffractionpatterns exhibit only very weak spots belonging solely to the tetragonal unit cell and the exactgeometry of diffraction patterns showing only intensive spots is identical with the FCC unitcell. These small deviations from the tetragonal unit cell were typical mainly for CBEDpatterns taken from small areas of particles investigated.It has been observed that intensity of potentially overlapping FCC/Z spots in diffractionpatterns recorded on (Nb,V)CrN particles is much stronger than that of other spots. Generally,the calculated kinematical intensities of reflections in simulated Z phase diffraction patternsdid not Show the same effect. A typical example of this phenomenon is illustrated in Fig. 8.The correct indexing of the diffraction pattern is evident from simulated patterns shown inTable 3. Strong rows of reflections (the 4th row) resemble a slightly distorted [102] Fcc zoneaxis. Intensities of individual spots in the rows marked by arrows (the 2nd row) were veryweak, in many cases these rows of spots were not visible in diffraction patterns. In fact thisdiffraction pattern represents a composed [111]z and [102] Fcc diffraction pattern. Theintensity difference between overlapping and extra spots in such composed diffractionpatterns is expected to be proportional to a ratio of FCC/tetragonal microdomains in(Nb,Cr)VN particles.
Fig. 8 Composed SAD pattern showing the [111]z and [102] Fcc zone axes,specimen LD27
The diffraction pattern in Fig. 9 is another example of the differences in intensities ofoverlapping (potentially common spots of the FCC and tetragonal unit cells) and extrareflections of the tetragonal Z phase. In this orientation the positions of spots in thecorresponding FCC and the modified Z phase patterns again occur in almost identicalpositions, see Table 4. It is evident that spots belonging potentially to both the FCC andtetragonal unit cells are much stronger than the extra spots. The differences in spot intensities
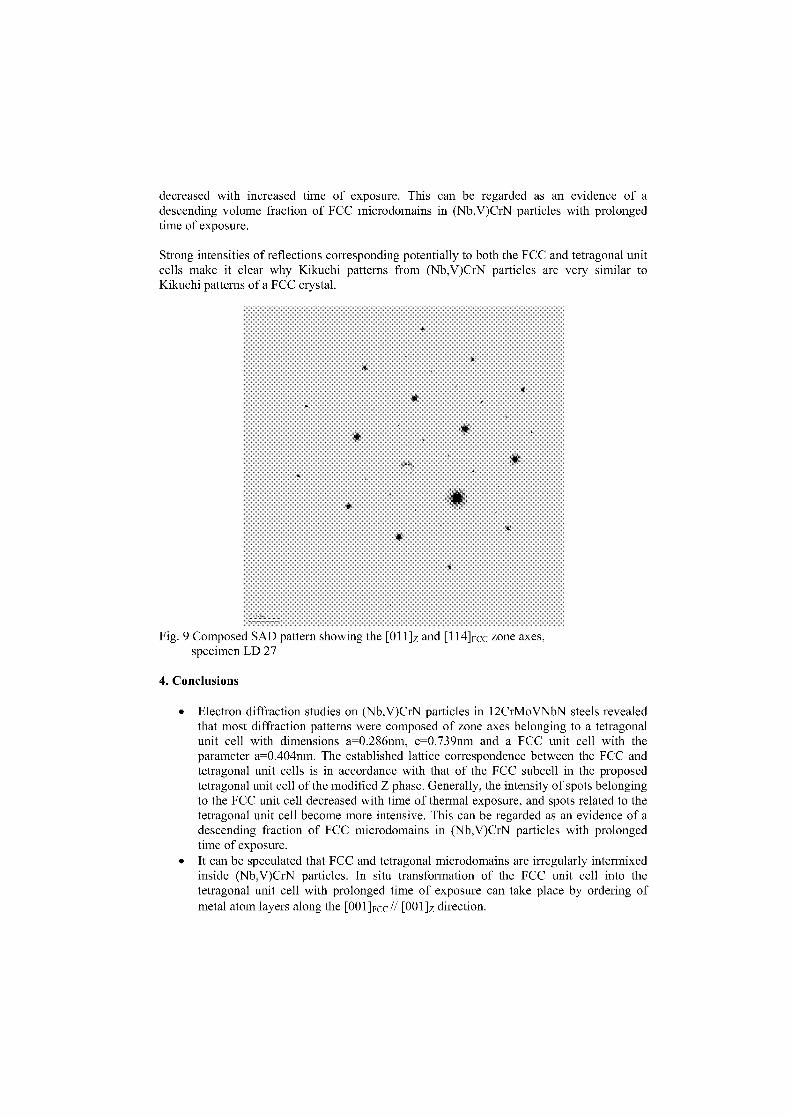
decreased with increased time of exposure. This can be regarded as an evidence of adescending volume fraction of FCC microdomains in (Nb,V)CrN particles with prolongedtime of exposure.
Strong intensities of reflections corresponding potentially to both the FCC and tetragonal unitcells make it clear why Kikuchi patterns from (Nb,V)CrN particles are very similar toKikuchi patterns of a FCC crystal.
Fig. 9 Composed SAD pattern showing the [011]z and [114] Fcc zone axes,specimen LD 27
4. Conclusions
• Electron diffraction studier an (Nb,V)CrN particles in 12CrMoVNbN steels revealedthat most diffraction patterns were composed of zone axes belonging to a tetragonalunit cell with dimensions a=0.286nm, c=0.739nm and a FCC unit cell with theparameter a=0.404nm. The established lattice correspondence between the FCC andtetragonal unit cells is in accordance with that of the FCC subcell in the proposedtetragonal unit cell of the modified Z phase. Generally, the intensity of spots belongingto the FCC unit cell decreased with time of thermal exposure, and spots related to thetetragonal unit cell become more intensive. This can be regarded as an evidence of adescending fraction of FCC microdomains in (Nb,V)CrN particles with prolongedtime of exposure.
• It can be speculated that FCC and tetragonal microdomains are irregularly intermixedinside (Nb,V)CrN particles. In situ transformation of the FCC unit cell into thetetragonal unit cell with prolonged time of exposure can take place by ordering ofmetal atom layers along the [001] Fcc // [001]z direction.
• Based on the diffraction results it can be expected that the FCC unit cell, whose latticecorrespondence with the tetragonal unit cell is identical to that of the FCC subcell inthe tetragonal unit cell of the modified Z phase, plays an important role in theformation of (Nb,V)CrN particles in 9-12%Cr martensitic steels. The tetragonal unitcell predominates in diffraction patterns only after long-term exposure.
References[1] Strang, A., Vodarek,V, The effect of microstructural stability on the creep properties of
high temperature martensitic 12Cr steels, Proc. of the 7th Int. conf. on creep andfracture of engineering materials and structures, Irvine 1997, 415.
[2] Letofsky, E., Cerjak, H., Papst, L., Warbichler, P., The use of light and electronmicroscopy investigations to characterise the creep behaviour of welded joints inmodern power station materials, Proc. of the 3rd EPRI conference on advances inmaterials technology for fossil power plants, R. Viswanathan et al. Eds., IOM Swansea,2000, 133.
[3] Svoboda, M., Burgik, J., Podstränskä, Kroupa, A., Skleni&a, V., Mayer, K.H., Hightemperature creep behaviour and microsrtructural changes of TAF 650 steel, Proc. ofMaterials for advanced power engineering, J. Lecomte-Beckers, et al. Eds.,Forschungszentrum Jülich, Liege 2002, 111/1521.
[4] Danielsen, H.K., Hald, J., Energy Materials, 1, 2006, in press.[5] Hughes, H., J. Iron Steel Institute, 205, 1967, 775.[6] Ettmayer, P., Monatshefte für Chemie, 102, 1971, 858.[7] Jack, D.H., Jack, K.H., J.Iron Steel Institute, 1972, 209, 790.[8] Danielsen, H.K., Hald, J., Grumsen, F.B., Somers, M.A.J., On the crystal structure of Z-
phase, Cr(V,Nb)N, submitted to Metallurgical and Materials Transactions.[9] Chickwanda, H.: Microstructural stability of 12CrMoVNb power plant steels, PhD
Thesis, Imperial College, London 1994.[10] Strang, A., Vodärek, V., Mater. Sci. and Technology, 12, 1996, 552.[11] Vodärek, V., Strang, A.: Z phase characteristics in martensitic 12CrMoVNb steels,
Proc. of Materials for advanced power engineering, J. Lecomte-Beckers, et al. Eds.,Forschungszentrum Jülich, Liege 2002, 11/1223.
[12] Danielsen, H., Report of the STSM, TU of Denmark, 2004.[13] Loretto, M., Electron Beam Analysis of Materials, Chapman and Hall, New York, 1984
AcknowledgementsThe Management Committee of the COST 536 programme is kindly acknowledged forfunding of the STSM missions to Ostrava and Risoe.The authors wish to acknowledge the financial support from MSMT of the Czech Republic(contract no. OC 099-COST 536), Elsam A/S and the Danish Research Agency (grant no. 26-03-0275). The work by H. K. Danielsen was carried out under the IMPRESS researchconsortium.
AN EFTEM STUDY ON Z-PHASE NUCLEATION IN MARTENSITICCHROMIUM STEELS
Ardeshir Golpayegani and Hans-Olof Andren
Microscopy and MicroanalysisDepartment of Applied Physics
Chalmers University of TechnologySE-412 96 Gothenburg, Sweden
ggolpa(d,fi.chalmers.se
Abstract
9-12% Cr martensitic steels that are used in crucial parts of steam power plants have been found liable to theprecipitation of Z-phase after long time at service temperature. This complex nitride consumes vanadium nitridesand leaves the matrix with a relatively big vanadium poor region causing the creep strength of material to falldrastically after several thousand hours. it is of great importance to monitor the initial stages of precipitation ofthis phase to understand the factors promoting it and to get ideas about ways to suppress or eliminate it. In thiswork, Z-phase has been characterized using energy-filtered TEM. lt has been found that VN provides the mostsuitable nucleation site for Z-phase since its lattice has the minimum misfit for starting the nucleation and it alsoprovides vanadium for the growth. it has also been observed that the presence of niobium carbide close to thenucleation site is crucial for the nucleation and growth of this phase.
Keywords: 9-12% chromium steel, Z-phase, creep strength, Energy-filtered TEM
Introduction
The microstructure of the 9-12%Cr steel used in boilers and turbines of steam power plantsgenerally consists of tempered martensite formed during a final normalizing and temperingheat treatment. A fine distribution and high thermal stability of carbides and nitrides providesthe high creep strength in these materials and it has been shown that changing the type anddistribution of the precipitates can double the creep strength of these steels [1]. It has beenfound that the precipitation of Z-phase, the complex nitride Cr(V,Nb)N, happens during creep[2] and it has now been realized that it may have the most detrimental effect an the creepstrength. One example of this is steel TAF650 which showed a large creep instability afterseveral thousand hours (see figure 1)[3].
Figure 1. Creep rupture strength of steel TAF 650 [3]
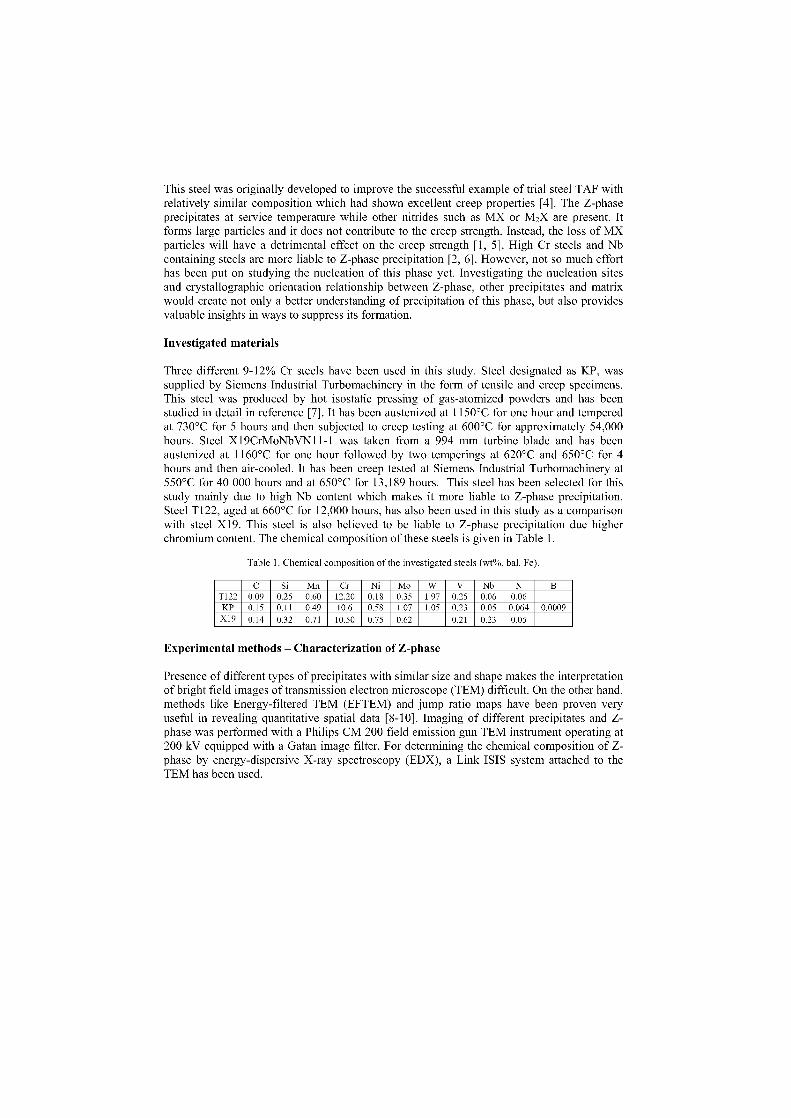
This steel was originally developed to improve the successful example of trial steel TAF withrelatively similar composition which had shown excellent creep properties [4]. The Z-phaseprecipitates at service temperature while other nitrides such as MX or M 2X are present. Itforms large particles and it does not contribute to the creep strength. Instead, the loss of MXparticles will have a detrimental effect an the creep strength [1, 5]. High Cr steels and Nbcontaining steels are more liable to Z-phase precipitation [2, 6]. However, not so much efforthas been put an studying the nucleation of this phase yet. Investigating the nucleation sitesand crystallographic orientation relationship between Z-phase, other precipitates and matrixwould create not only a better understanding of precipitation of this phase, but also providesvaluable insights in ways to suppress its formation.
Investigated materials
Three different 9-12% Cr steels have been used in this study. Steel designated as KP, wassupplied by Siemens Industrial Turbomachinery in the form of tensile and creep specimens.This steel was produced by hot isostatic pressing of gas-atomized powders and has beenstudied in detail in reference [7]. It has been austenized at 1150°C for one hour and temperedat 730°C for 5 hours and then subjected to creep testing at 600°C for approximately 54,000hours. Steel X 19CrMoNbVN11-1 was taken from a 994 mm turbine blade and has beenaustenized at 1160°C for one hour followed by two temperings at 620°C and 650°C for 4hours and then air-cooled. It has been creep tested at Siemens Industrial Turbomachinery at550°C for 40 000 hours and at 650°C for 13,189 hours. This steel has been selected for thisstudy mainly due to high Nb content which makes it more liable to Z-phase precipitation.Steel T122, aged at 660°C for 12,000 hours, has also been used in this study as a comparisonwith steel X19. This steel is also believed to be liable to Z-phase precipitation due higherchromium content. The chemical composition of these steels is given in Table 1.
Table 1. Chemical composition of the investigated steels (wt%, bal. Fe).
C Si Mn Cr Ni Mo W V Nb N BT122 0.09 0.25 0.60 12.20 0.18 0.35 1.97 0.25 0.06 0.06KP 0.15 0.11 0.49 10.6 0.58 1.07 1.05 0.23 0.05 0.064 0.0009X19 0.14 0.32 0.71 10.50 0.75 0.62 0.21 0.23 0.05
Experimental methods - Characterization of Z-phase
Presence of different typen of precipitates with similar size and shape makes the interpretationof bright field images of transmission electron microscope (TEM) difficult. On the other hand,methods like Energy-filtered TEM (EFTEM) and jump ratio maps have been proven veryuseful in revealing quantitative spatial data [8-10]. Imaging of different precipitates and Z-phase was performed with a Philips CM 200 field emission gun TEM instrument operating at200 kV equipped with a Gatan image filter. For determining the chemical composition of Z-phase by energy-dispersive X-ray spectroscopy (EDX), a Link ISIS system attached to theTEM has been used.
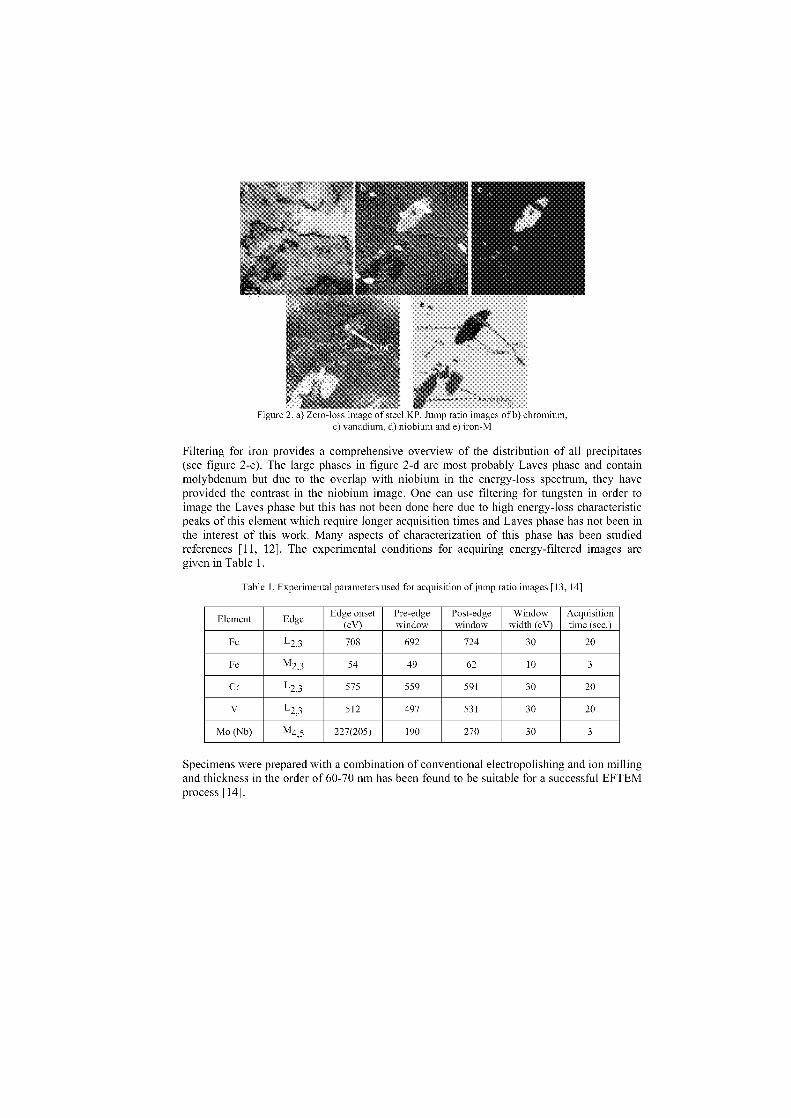
F gure 2. a) Lero-loss imuage ot steel KP. Jump ratio Images ot b) chromium,c) vanadium, d) niobium and e) iron-M
Filtering for fron provides a comprehensive overview of the distribution of all precipitates(see figure 2-e). The large phases in figure 2-d are most probably Laves phase and containmolybdenum but due to the overlap with niobium in the energy-loss spectrum, they haveprovided the contrast in the niobium image. One can use filtering for tungsten in order toimage the Laves phase but this has not been done here due to high energy-loss characteristicpeaks of this element which require longer acquisition times and Laves phase has not been inthe interest of this work. Many aspects of characterization of this phase has been studiedreferences [11, 12]. The experimental conditions for acquiring energy-filtered images aregiven in Table 1.
Table 1. Experimental parameters used for acquisition of jump ratio Images [13, 14]
Element Edge Edge onset(eV)
Pre-edgewindow
Post-edgewindow
Windowwidth (eV)
Acquisitiontime (sec.)
Fe Lz3 708 692 724 30 20
Fe M23 54 49 62 10 3
Cr 575 559 591 30 20
V 512 497 531 30 20
Mo (Nb) M4,5 227(205) 190 270 30 3
Specimens were prepared with a combination of conventional electropolishing and ion millingand thickness in the order of 60-70 nm has been found to be suitable for a successful EFTEMprocess [14].
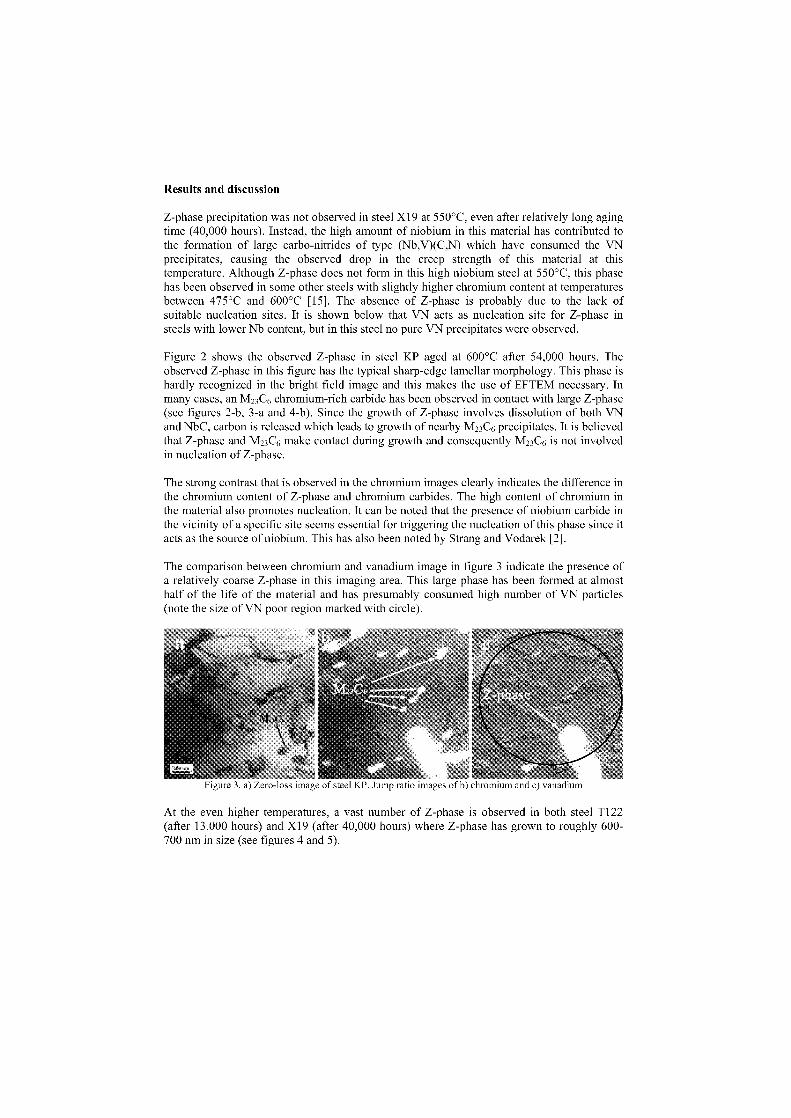
Results and discussion
Z-phase precipitation was not observed in steel X19 at 550°C, even after relatively long agingtime (40,000 hours). Instead, the high amount of niobium in this material has contributed tothe formation of large carbo-nitrides of type (Nb,V)(C,N) which have consumed the VNprecipitates, causing the observed drop in the creep strength of this material at thistemperature. Although Z-phase does not form in this high niobium steel at 550°C, this phasehas been observed in some other steels with slightly higher chromium content at temperaturesbetween 475°C and 600°C [15]. The absence of Z-phase is probably due to the lack ofsuitable nucleation sites. It is shown below that VN acts as nucleation site for Z-phase insteels with lower Nb content, but in this steel no pure VN precipitates were observed.
Figure 2 shows the observed Z-phase in steel KP aged at 600°C after 54,000 hours. Theobserved Z-phase in this figure has the typical sharp-edge lamellar morphology. This phase ishardly recognized in the bright field image and this makes the use of EFTEM necessary. Inmany cases, an Mz3C6 chromium-rich carbide has been observed in contact with large Z-phase(see figures 2-b, 3-a and 4-b). Since the growth of Z-phase involves dissolution of both VNand NbC, carbon is released which leads to growth of nearby M23C6 precipitates. It is believedthat Z-phase and M23C6 make contact during growth and consequently M23C6 is not involvedin nucleation of Z-phase.
The strong contrast that is observed in the chromium images clearly indicates the difference inthe chromium content of Z-phase and chromium carbides. The high content of chromium inthe material also promotes nucleation. It can be noted that the presence of niobium carbide inthe vicinity of a specific site seems essential for triggering the nucleation of this phase since itacts as the source of niobium. This has also been noted by Strang and Vodarek [2].
The comparison between chromium and vanadium image in figure 3 indicate the presence ofa relatively coarse Z-phase in this imaging area. This large phase has been formed at almosthalf of the life of the material and has presumably consumed high number of VN particles(note the size of VN poor region marked with circle).
F gut. 3. a) Lero-loss of steel KP. Jump ratio tittages ot b) chromium and c) vanadium
At the even higher temperatures, a vast number of Z-phase is observed in both steel T122(after 13,000 hours) and X19 (after 40,000 hours) where Z-phase has grown to roughly 600-700 nm in size (see figures 4 and 5).
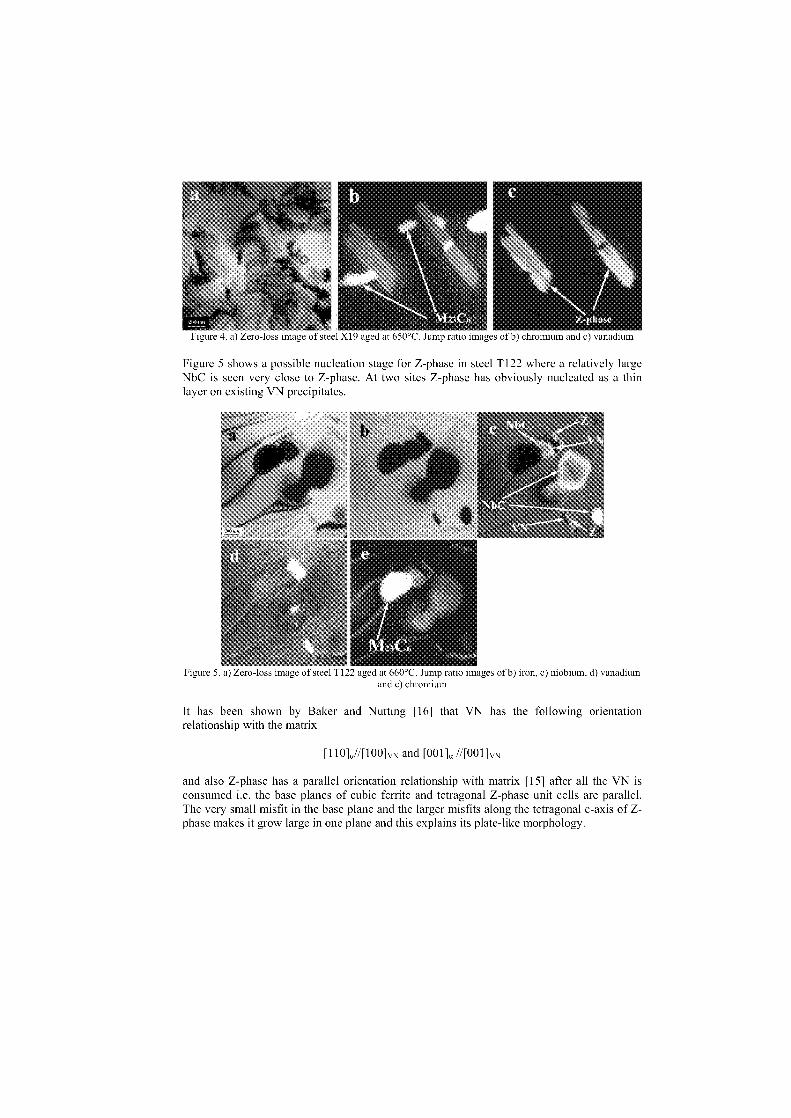
Figure 4. Lero-loss image ot steel X19 aged at 650°C. Jump ratio Images ofb) chromium and c) vanadium
Figure 5 shows a possible nucleation stage for Z-phase in steel T122 where a relatively largeNbC is seen very dose to Z-phase. At two sites Z-phase has obviously nucleated as a thinlayer an existing VN precipitates.
Figure 5. a) Lero-loss ag, ot steel 1122 aged at 660°C. Jump ratio Images ofb) fron, c) n ob um, d) vanadiumand e) chromium
It has been shown by Baker and Nutting [16] that VN has the following orientationrelationship with the matrix
HOW/100] and [001]„ //[001]vN
and also Z-phase has a parallel orientation relationship with matrix [15] alter all the VN isconsumed i.e. the base planes of cubic ferrite and tetragonal Z-phase unit cells are parallel.The very small misfit in the base plane and the larger misfits along the tetragonal c-axis of Z-phase makes it grow large in one plane and this explains its plate-like morphology.
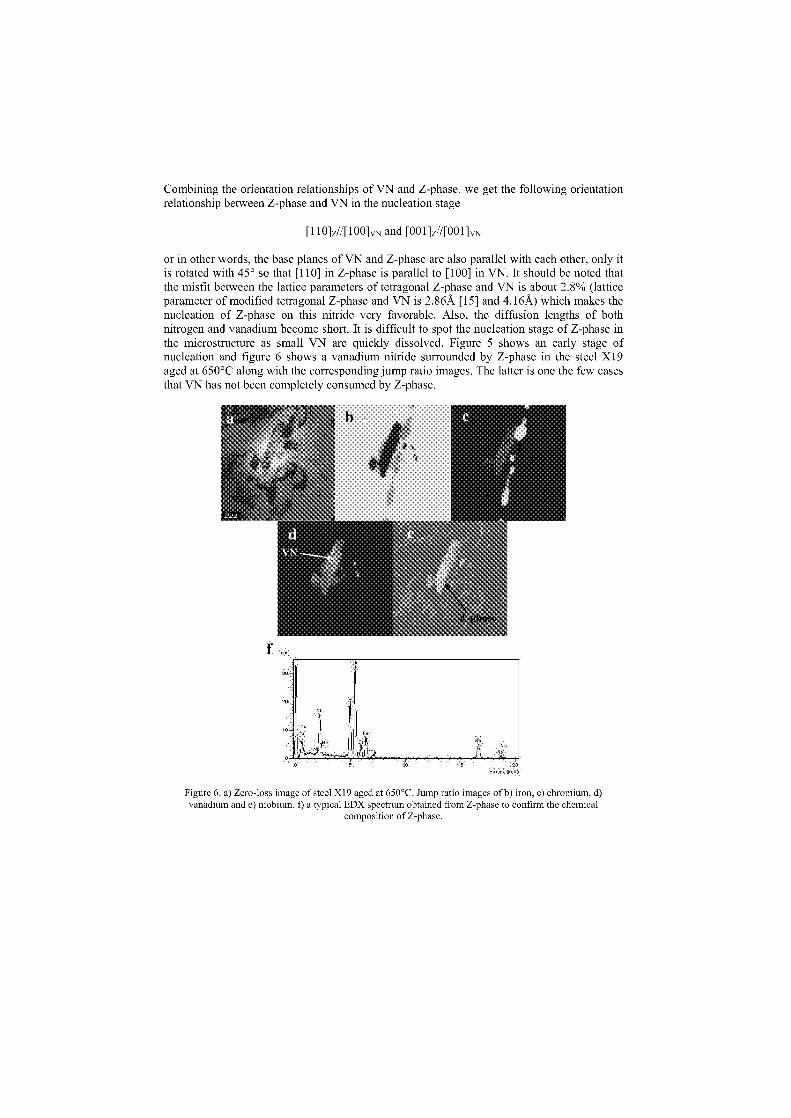
Combining the orientation relationships of VN and Z-phase, we get the following orientationrelationship between Z-phase and VN in the nucleation stage
[110]z//[100]vN and [001]z//[001]vN
or in other words, the base planes of VN and Z-phase are also parallel with each other, only itis rotated with 45° so that [110] in Z-phase is parallel to [100] in VN. It should be noted thatthe misfit between the lattice parameters of tetragonal Z-phase and VN is about 2.8% (latticeparameter of modified tetragonal Z-phase and VN is 2.86Ä [15] and 4.16Ä) which makes thenucleation of Z-phase an this nitride very favorable. Also, the diffusion lengths of bothnitrogen and vanadium become short. It is difficult to spot the nucleation stage of Z-phase inthe microstructure as small VN are quickly dissolved. Figure 5 shows an early stage ofnucleation and figure 6 shows a vanadium nitride surrounded by Z-phase in the steel X19aged at 650°C along with the corresponding jump ratio images. The latter is one the few casesthat VN has not been completely consumed by Z-phase.
Figure 6. a) Zero-loss image of steel X19 aged at 650°C. Jump ratio images of b) iron, c) chromium, d)vanadium and e) niobium. a typical EDX spectrurn obtained from Z-phase to confirm the chemical
composition of Z-phase.

Conclusion
1. VN precipitates in the vicinity of NbC precipitates act as nucleation sites for Z-phasein modified 9-12% chromium steels due to a small misfit in the (100) planes of VNand Z-phase.
2. The small misfit between ferrite and tetragonal Z-phase in the (100) plane results in aplate-like morphology of Z-phase.
3. The growth of Z-phase leads to large VN-free areas in the microstructure and causesthe decrease in the creep strength while M23C6 carbides grow due to the release ofcarbon from dissolution of NbC carbides.
4. In the steel with high niobium content, no Z-phase precipitation was observed at550°C. Instead, coarse (Nb,V)(C,N) grow at the expense of VN causing the observeddrop in the creep strength.
Acknowledgements
Hilmar Danielsen and John Hald of Technical University of Denmark are thanked for fruitfulcollaboration. Lennart Johansson of Siemens Industrial Turbomachinery is thanked forproviding the X19 material. The authors would also like to thank the KME Consortium aswell as Swedish Foundation for Strategic Research (SSF) and the Research Foundation ofVGB in Germany for financial support of this project.
References
1. J. Hald and S. Straub. Microstructural stability of 9-12% CrMo(W)VNbN-steels. inMaterials for advanced power engineering. 1998. Liege: Forschungszentrum JülichGmbH, 1998.
2. A. Strang and V. Vodarek, Z phase formation in martensitic 12CrMoVNb steel.Materials science and technology, 1996. 12: p. 552-556.
3. T. Uehara, T. Ohno, R. Watanabe and T. Fujita, Development of high strength 12 °A
Cr ferritic heat-resistant steel. in Materials engineering in turbines and compressors.1995. Newcastle upon Tyne: The Institute of Materials, London, 1995.
4. T. Fujita and N. Takahashi, The effect of boron an the long period creep rupturestrength of the moded 12%Cr heat-resisting steel. Transaction of ISIJ, 1978. 18: p.702-711.
5. H. Danielsen and J. Hald, Z-phase in 9-12% Cr Steels. 2004, Värmeforsk Service AB:Stockholm, Sweden.
6. J. Hald. Long-term stability of 9-12%Cr steels - Current understanding and futureperspectives. in VGB W6Q. 2004. Dortmund.
7. L. Lundin, M. Hättestrand, and H.-O. Andren. Redistribution of elements duringageing and creep testing of 9-12% chromium steels. in Parsons 2000 Advancedmaterials for 21st centtuy turbines and power plants. 2000. Cambridge: The Instituteof Materials, London, 2000.
8. P. Hofer, H. Cerjak, B. Schaffernak and P. Warbichler, Quantification of precipitatesin advanced creep resistant 9-12% Cr steels. Steel Research, 1998. 69(8): p. 343-348.
9. F. Hofer, P. Warbichler, and W. Grogger, Imaging of nanometer-sized precipitates insolids by electron spectroscopic imaging. Ultramicroscopy, 1995. 59: p. 15-31.
10. P. Warbichler, F. Hofer, P. Hofer and E. Letofsky, On the application of energy-filtering TEM in materials science: HL Precipitates in steel. Micron, 1998. 29(1): p.63-72.
11. L. Korcakova, J. Hald, and M.A.J. Somers, Quantification of Laves phase particle sizein 9CrW steel. Materials Characterisation, 2001. 47: p. 111-117.
12. G. Dimmler, P. Weinhert, E. Kozeschnik and H. Cerjak, Quantification of the Lavesphase in advanced 9-12% Cr steels using a standard SEM. Materials Characterization,2003. 51(5): p. 341-352.
13. I. Letofsky-Papst, P. Warbichler, F. Hofer, E. Letofsky and H. Cerjak, On theoccurrence of Z-phase in a creep-tested 10% Cr steel. Zeitschrift fur Metallkunde,2004. 95(1): p. 18-21.
14. M. Hättestrand and H.-O. Andren, Evaluation of particle size distributions ofprecipitates in a 9% Cr-steel using energy filtered transmission electron microscopy.Micron, 2001. 32: p. 789-797.
15. V. Vodarek and A. Strang, Z phase precipitation in martensitic 12CrMoVNb steels.Journal de Physique IV (Proceedings) International Conference an MartensiticTransformations, 10-14 June 2002, 2003. 112(pt.1): p. 445-8.
16. R.G. Baker and J. Nutting. The tempering of a Cr-Mo-V-W steel and a Mo-V steel. inPrecipitation Processes in Steels. 1958. Sheffield, UK: The Iron and Steel Institute,London, 1959.
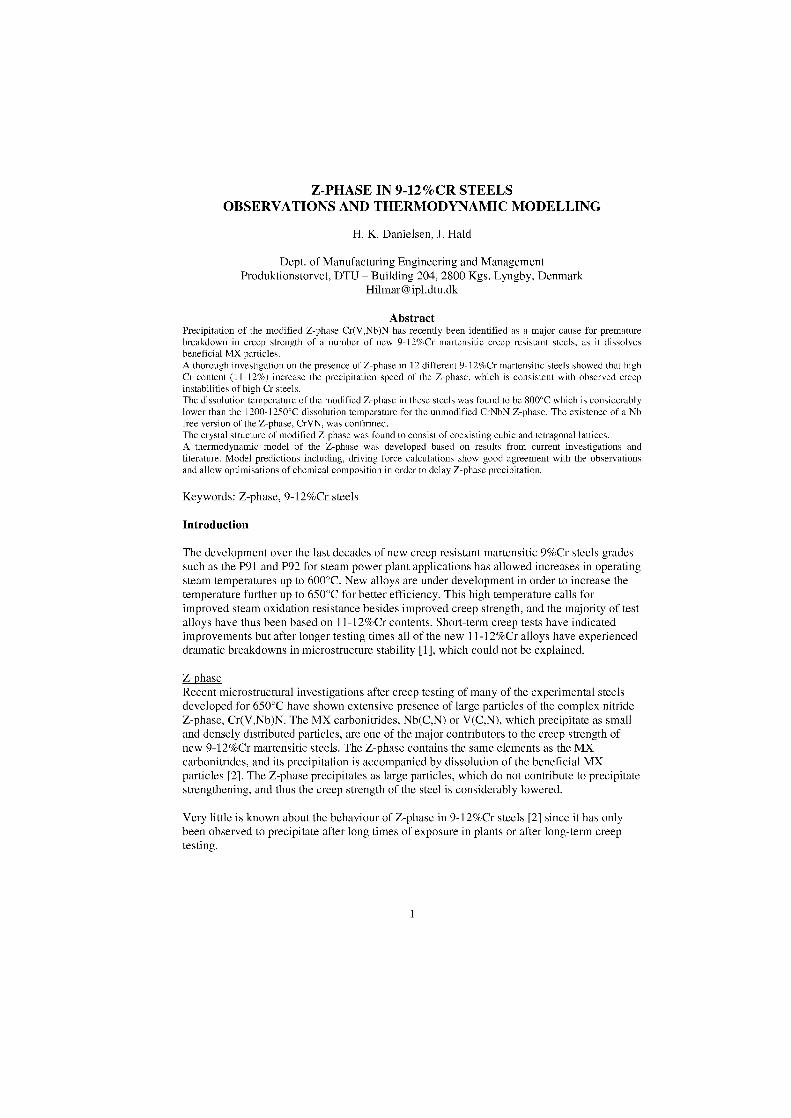
Z-PHASE IN 9-12%CR STEELSOBSERVATIONS AND THERMODYNAMIC MODELLING
H. K. Danielsen, J. Hald
Dept. of Manufacturing Engineering and ManagementProduktionstorvet, DTU — Building 204, 2800 Kgs. Lyngby, Denmark
AbstractPrecipitation of the modified Z-phase Cr(V,Nb)N has recently been identified as a major cause for prematurebreakdown in creep strength of a number of new 9-12%Cr martensitic creep resistant steels, as it dissolvesbeneficial MX particles.A thorough investigation on the presence of Z-phase in 12 different 9-12%Cr martensitic steels showed that highCr content (11-12%) increase the precipitation Speed of the Z-phase, which is consistent with observed creepinstabilities of high Cr steels.The dissolution temperature of the modified Z-phase in these steels was found to be 800°C which is considerablylower than the 1200-1250°C dissolution temperature for the unmodified CrNbN Z-phase. The existente of a Nbfree version of the Z-phase, CrVN, was confirmed.The crystal structure of modified Z-phase was found to consist of coexisting cubic and tetragonal lattices.A thermodynamic model of the Z-phase was developed based on results from current investigations andliterature. Model predictions including, driving force calculations Show good agreement with the observationsand allow optimisations of chemical composition in order to delay Z-phase precipitation.
Keywords: Z-phase, 9-12%Cr steels
Introduction
The development over the last decades of new creep resistant martensitic 9%Cr steels gradessuch as the P91 and P92 for steam power plant applications has allowed increases in operatingsteam temperatures up to 600°C. New alloys are under development in order to increase thetemperature further up to 650°C for better efficiency. This high temperature calls forimproved steam oxidation resistance besides improved creep strength, and the majority of testalloys have thus been based on 11-12%Cr contents. Short-term creep tests have indicatedimprovements but after longer testing times all of the new 11-12%Cr alloys have experienceddramatic breakdowns in microstructure stability [1], which could not be explained.
Z-phaseRecent microstructural investigations after creep testing of many of the experimental steelsdeveloped for 650°C have shown extensive presence of large particles of the complex nitrideZ-phase, Cr(V,Nb)N. The MX carbonitrides, Nb(C,N) or V(C,N), which precipitate as smalland densely distributed particles, are one of the major contributors to the creep strength ofnew 9-12%Cr martensitic steels. The Z-phase contains the same elements as the MXcarbonitrides, and its precipitation is accompanied by dissolution of the beneficial MXparticles [2]. The Z-phase precipitates as large particles, which do not contribute to precipitatestrengthening, and thus the creep strength of the steel is considerably lowered.
Very little is known about the behaviour of Z-phase in 9-12%Cr steels [2] since it has onlybeen observed to precipitate after long times of exposure in plants or after long-term creeptesting.
1
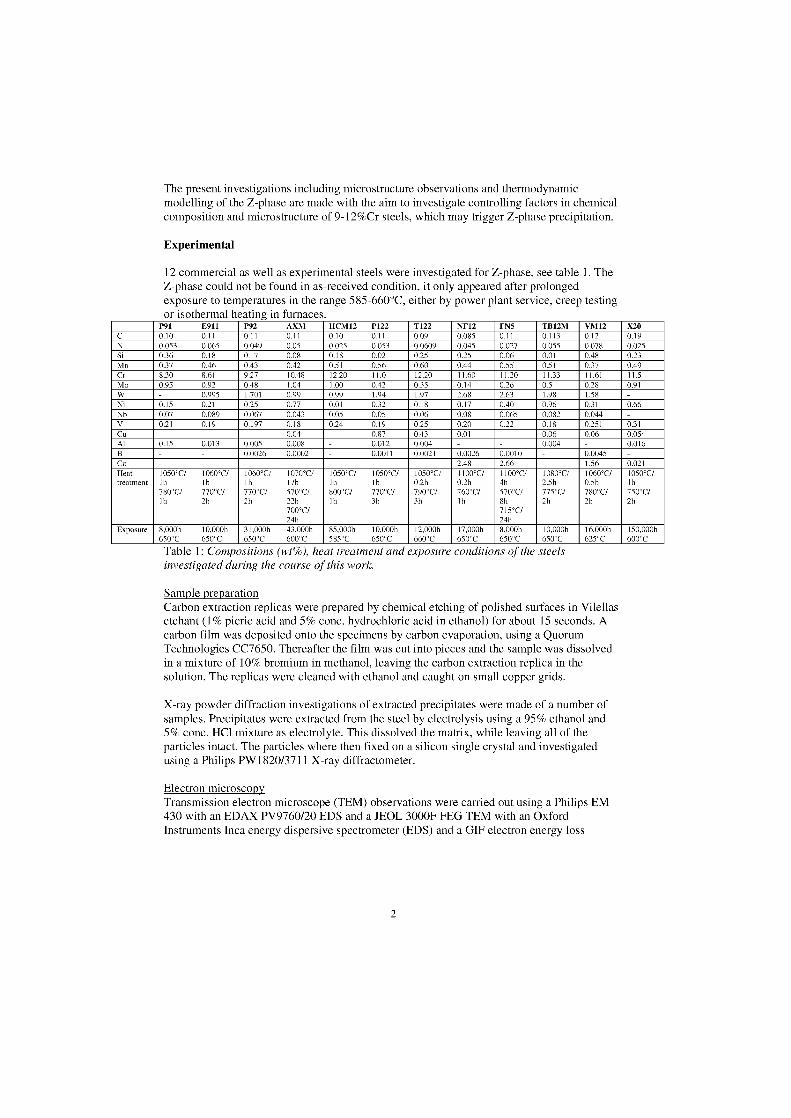
The present investigations including microstructure observations and thermodynamicmodelling of the Z-phase are made with the aim to investigate controlling factors in chemicalcomposition and microstructure of 9-12%Cr steels, which may trigger Z-phase precipitation.
Experimental
12 commercial as well as experimental steels were investigated for Z-phase, see table 1. TheZ-phase could not be found in as-received condition, it only appeared after prolongedexposure to temperatures in the range 585-660°C, either by power plant service, creep testingor isothermal heating in furnaces.
P91 E911 P92 AXM HCM12 P122 T122 NF12 FN5 TB12M VM12 X20C 0.10 0.11 0.11 0.11 0.10 0.11 0.09 0.085 0.11 0.113 0.12 0.19N 0.053 0.065 0.049 0.05 0.025 0.053 0.0609 0.045 0.027 0.055 0.078 0.025Si 0.36 0.18 0.17 0.08 0.18 0.02 0.25 0.25 0.06 0.01 0.48 0.23Mn 0.37 0.46 0.43 0.42 0.51 0.56 0.60 0.44 0.55 0.51 0.37 0.49Cr 8.30 8.61 9.27 10.48 12.20 11.0 12.20 11.60 11.20 11.33 11.61 11.5Mo 0.95 0.92 0.48 1.04 1.00 0.42 0.35 0.14 0.26 0.5 0.28 0.91W 0.995 1.701 0.99 0.99 1.94 1.97 2.68 2.63 1.98 1.58 -Ni 0.15 0.21 0.25 0.77 0.01 0.32 0.18 0.17 0.40 0.96 0.31 0.66Nb 0.07 0.089 0.067 0.043 0.05 0.05 0.06 0.08 0.065 0.082 0.044 -V 0.21 0.19 0.197 0.18 0.24 0.19 0.25 0.20 0.22 0.18 0.251 0.31Cu 0.04 0.87 0.43 0.01 0.06 0.06 0.054Al 0.15 0.013 0.005 0.008 0.012 0.004 0.004 0.016B 0.0026 0.0002 - 0.0011 0.0021 0.0026 0.0010 - 0.0045 -Co 2.48 2.66 1.56 0.021Heat 1050°C/ 1060°C/ 1060°C/ 1070°C/ 1050°C/ 1050°C/ 1050°C/ 1100°C/ 1100°C/ 1080°C/ 1060°C/ 1050°C/treatment lh lh lh 17h 1h lh 0.2h 0.2h 4h 2.5h 0.5h 1h
780°C/ 770°C/ 770°C/ 570°C/ 800°C/ 770°C/ 790°C/ 760°C/ 570°C/ 775°C/ 780°C/ 750°C/lh 2h 2h 22h lh 3h 3h lh 8h 2h 2h 2h
700°C/ 715°C/24h 24h
Exposure 8,000h 10,000h 31,000h 43,000h 85,000h 10,000h 12,000h 17,000h 8,000h 10,000h 16,000h 150,000h650°C 650°C 650°C 600°C 585°C 650°C 660°C 650°C 650°C 650°C 625°C 600°C
Table 1: Compositions (wt%), heat treatment and exposure conditions of the steelsinvestigated during the course of this work.
Sample preparation Carbon extraction replicas were prepared by chemical etching of polished surfaces in Vilellasetchant (1% picric acid and 5% conc. hydrochloric acid in ethanol) for about 15 seconds. Acarbon film was deposited onto the specimens by carbon evaporation, using a QuorumTechnologies CC7650. Thereafter the film was cut into pieces and the Sample was dissolvedin a mixture of 10% bromium in methanol, leaving the carbon extraction replica in thesolution. The replicas were cleaned with ethanol and caught on small copper grids.
X-ray powder diffraction investigations of extracted precipitates were made of a number ofsamples. Precipitates were extracted from the steel by electrolysis using a 95% ethanol and5% conc. HCl mixture as electrolyte. This dissolved the matrix, while leaving all of theparticles intact. The particles where then fixed on a silicon single crystal and investigatedusing a Philips PW 1820/3711 X-ray diffractometer.
Electron microscopyTransmission electron microscope (TEM) observations were carried out using a Philips EM430 with an EDAX PV9760/20 EDS and a JEOL 3000F FEG TEM with an OxfordInstruments Inca energy dispersive spectrometer (EDS) and a GIF electron energy loss
2
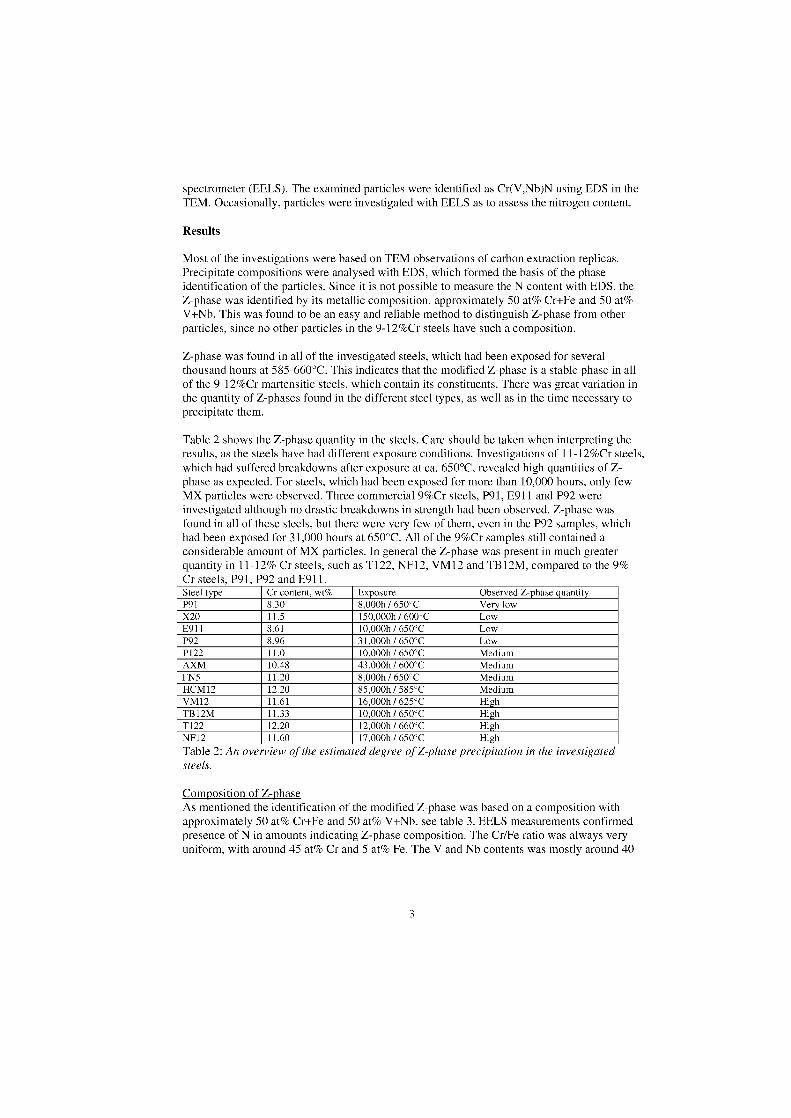
spectrometer (EELS). The examined particles were identified as Cr(V,Nb)N using EDS in theTEM. Occasionally, particles were investigated with EELS as to assess the nitrogen content.
Results
Most of the investigations were based on TEM observations of carbon extraction replicas.Precipitate compositions were analysed with EDS, which formed the basis of the phaseidentification of the particles. Since it is not possible to measure the N content with EDS, theZ-phase was identified by its metallic composition, approximately 50 at% Cr+Fe and 50 at%V+Nb. This was found to be an easy and reliable method to distinguish Z-phase from otherparticles, since no other particles in the 9-12%Cr steels have such a composition.
Z-phase was found in all of the investigated steels, which had been exposed for severalthousand hours at 585-660°C. This indicates that the modified Z-phase is a stable phase in allof the 9-12%Cr martensitic steels, which contain its constituents. There was great variation inthe quantity of Z-phases found in the different steel types, as well as in the time necessary toprecipitate them.
Table 2 shows the Z-phase quantity in the steels. Care should be taken when interpreting theresults, as the steels have had different exposure conditions. investigations of 11-12%Cr steels,which had suffered breakdowns after exposure at ca. 650°C, revealed high quantities of Z-phase as expected. For steels, which had been exposed for more than 10,000 hours, only fewMX particles were observed. Three commercial 9%Cr steels, P91, E911 and P92 wereinvestigated although no drastic breakdowns in strength had been observed. Z-phase wasfound in all of these steels, but there were very few of them, even in the P92 samples, whichhad been exposed for 31,000 hours at 650°C. All of the 9%Cr samples still contained aconsiderable amount of MX particles. In general the Z-phase was present in much greaterquantity in 11-12% Cr steels, such as T122, NF12, VM12 and TB12M, compared to the 9%Cr steels, P91, P92 and E911.Steel type Cr content, wt% Exposure Observed Z-phase quantityP91 8.30 8,000h / 650°C Very lowX20 11.5 150,000h / 600°C LowE911 8.61 10,000h / 650°C LowP92 8.96 31,000h / 650°C LowP122 11.0 10,000h / 650°C MediumAXM 10.48 43,000h / 600°C MediumFN5 11.20 8,000h / 650°C MediumHCM12 12.20 85,000h / 585°C MediumVM12 11.61 16,000h / 625°C HighTB12M 11.33 10,000h / 650°C HighT122 12.20 12,000h / 660°C HighNF12 11.60 17,000h / 650°C HighTable 2: An overview of the estimated degree of Z-phase precipitation in the investigatedsteels.
Composition of Z-phaseAs mentioned the identification of the modified Z-phase was based on a composition withapproximately 50 at% Cr+Fe and 50 at% V+Nb, see table 3. EELS measurements confirmedpresence of N in amounts indicating Z-phase composition. The Cr/Fe ratio was always veryuniform, with around 45 at% Cr and 5 at% Fe. The V and Nb contents was mostly around 40
3
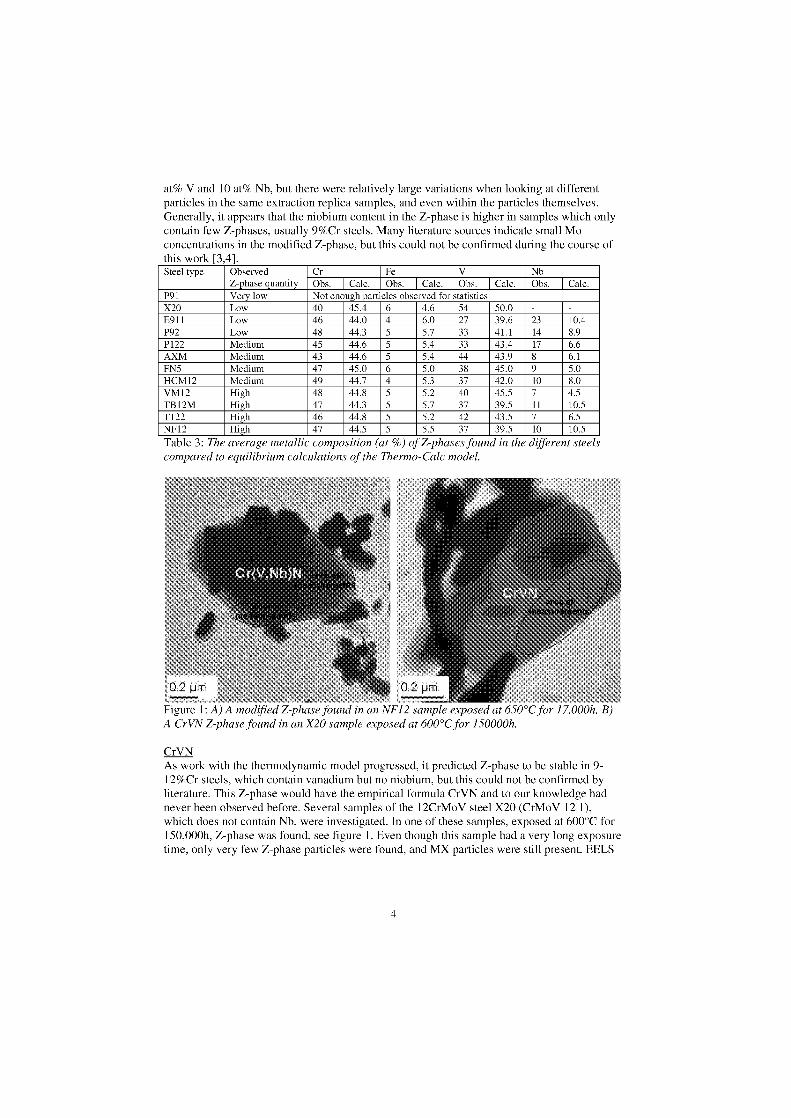
at% V and 10 at% Nb, but there were relatively large variations when looking at differentparticles in the same extraction replica samples, and even within the particles themselves.Generally, it appears that the niobium content in the Z-phase is higher in samples which onlycontain few Z-phases, usually 9%Cr steels. Many literature sources indicate small Moconcentrations in the modified Z-phase, but this could not be confirmed during the course ofthis work [3,4].Steel type Ohserved
Z-phase quantityCr Fe V NbObs. Calc. Obs. Calc. Obs. Calc. Obs. Calc.
P91 Very low Not enough particles observed for statisticsX20 Low 40 45.4 6 4.6 54 50.0 - -E911 Low 46 44.0 4 6.0 27 39.6 23 10.4P92 Low 48 44.3 5 5.7 33 41.1 14 8.9P122 Medium 45 44.6 5 5.4 33 43.4 17 6.6AXM Medium 43 44.6 5 5.4 44 43.9 8 6.1FN5 Medium 47 45.0 6 5.0 38 45.0 9 5.0HCM12 Medium 49 44.7 4 5.3 37 42.0 10 8.0VM12 High 48 44.8 5 5.2 40 45.5 7 4.5TB12M High 47 44.3 5 5.7 37 39.5 11 10.5T122 High 46 44.8 5 5.2 42 43.5 7 6.5NF12 High 47 44.5 5 5.5 37 39.5 10 10.5
Table 3: The average metallic composition (at %) of Z-phases found in the different steelsco; :,ared to equilibrium calculations of the Thermo-Calc model.
02 pT 0.2 [I
Figure 1: A) A moi fiedl '1F12 exposed at 650 uCjor 17,000h. 13)A CrVN Z-phase found in 1X20 sag nle josed at 600°C for 150000h.
CrVN As work with the thermodynamic model progressed, it predicted Z-phase to be stable in 9-12%Cr steels, which contain vanadium but no niobium, but this could not be confirmed byliterature. This Z-phase would have the empirical formula CrVN and to our knowledge hadnever been observed before. Several samples of the 12CrMoV steel X20 (CrMoV 12 1),which does not contain Nb, were investigated. In one of these samples, exposed at 600°C for150,000h, Z-phase was found, see figure 1. Even though this sample had a very long exposuretime, only very few Z-phase particles were found, and MX particles were still present. EELS
4
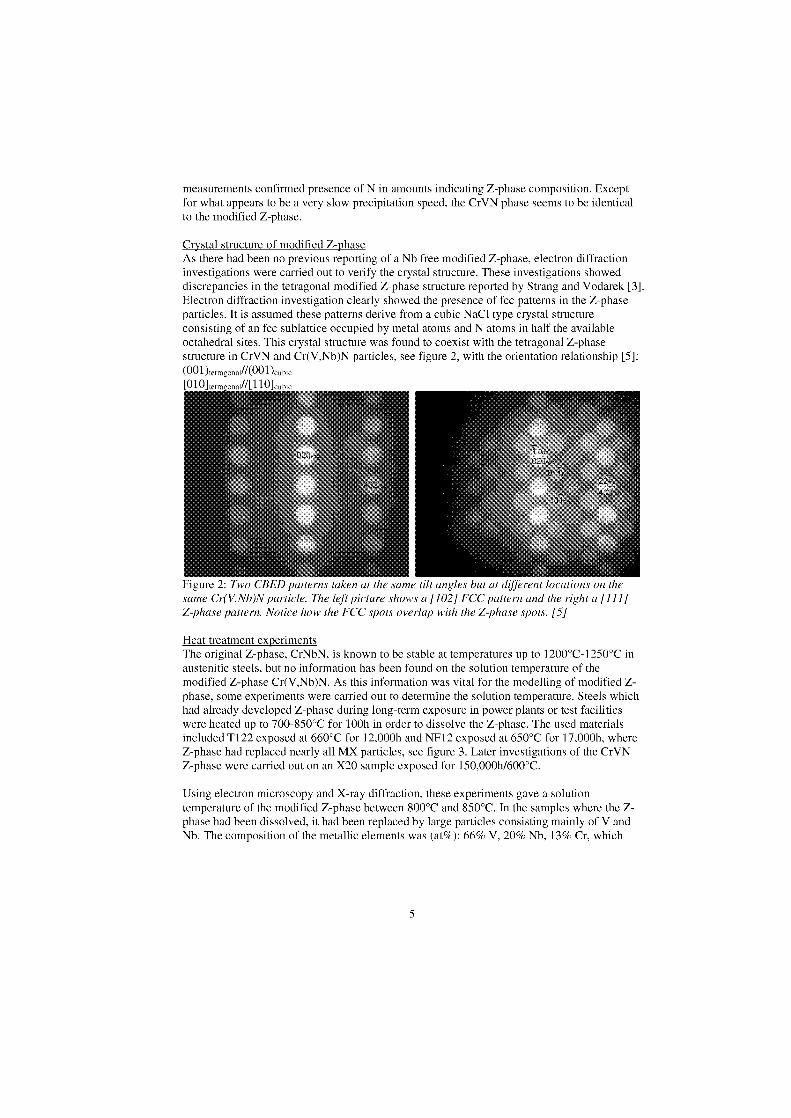
a [111]Figure 2: Two CBED patterns taken at the same tilt angles but atsame Cr(V,Nb)N partiele. The left pieture shows a [102] FCC pattern a . e rigZ-phase pattern. Notice how the FCC spots overlap with the Z-phase spots. [5]
measurements confirmed presence of N in amounts indicating Z-phase composition. Exceptfor what appears to be a very slow precipitation Speed, the CrVN phase seems to be identicalto the modified Z-phase.
Crystal structure of modified Z-phaseAs there had been no previous reporting of a Nb free modified Z-phase, electron diffractioninvestigations were carried out to verify the crystal structure. These investigations showeddiscrepancies in the tetragonal modified Z-phase structure reported by Strang and Vodarek [3].Electron diffraction investigation clearly showed the presence of fcc patterns in the Z-phaseparticles. It is assumed these patterns derive from a cubic NaC1 type crystal structureconsisting of an fcc sublattice occupied by metal atoms and N atoms in half the availableoctahedral sites. This crystal structure was found to coexist with the tetragonal Z-phasestructure in CrVN and Cr(V,Nb)N particles, see figure 2, with the orientation relationship [5]:(001 ),tetragonal//(0011,cubic[010],„--1/[1101,...k,
Heat treatment experimentsThe original Z-phase, CrNbN, is known to be stable at temperatures up to 1200°C-1250°C inaustenitic steels, but no information has been found on the solution temperature of themodified Z-phase Cr(V,Nb)N. As this information was vital for the modelling of modified Z-phase, some experiments were carried out to determine the solution temperature. Steels whichhad already developed Z-phase during long-term exposure in power plants or test facilitieswere heated up to 700-850°C for 100h in order to dissolve the Z-phase. The used materialsincluded T122 exposed at 660°C for 12,000h and NF12 exposed at 650°C for 17,000h, whereZ-phase had replaced nearly all MX particles, see figure 3. Later investigations of the CrVNZ-phase were carried out on an X20 sample exposed for 150,000h/600°C.
Using electron microscopy and X-ray diffraction, these experiments gave a solutiontemperature of the modified Z-phase between 800°C and 850°C. In the samples where the Z-phase had been dissolved, it had been replaced by large particles consisting mainly of V andNb. The composition of the metallic elements was (at%): 66% V, 20% Nb, 13% Cr, which
5
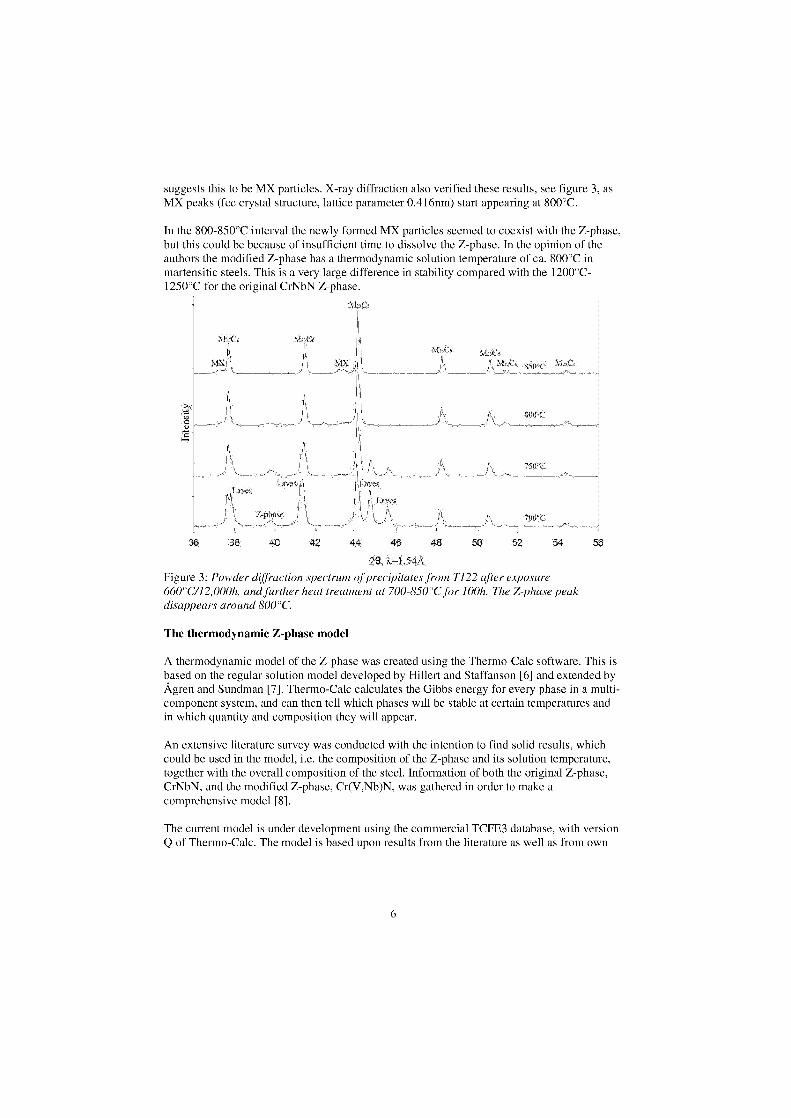
suggests this to be MX particles. X-ray diffraction also verified these results, see figure 3, asMX peaks (fcc crystal structure, lattice parameter 0.416nm) Start appearing at 800°C.
In the 800-850°C interval the newly formed MX particles seemed to coexist with the Z-phase,but this could be because of insufficient time to dissolve the Z-phase. In the opinion of theauthors the modified Z-phase has a thermodynamic solution temperature of ca. 800°C inmartensitic steels. This is a very large difference in stability compared with the 1200°C-1250°C for the original CrNbN Z-phase.
20, i,.=1.54AFigure 3: Powder diffraction spectrum of precipitates from T122 alter exposure660°C/12,000h, and further heat treatment at 700-850°C for 100h. The Z-phase peakdisappears around 800°C.
The thermodynamic Z-phase model
A thermodynamic model of the Z-phase was created using the Thermo-Calc software. This isbased an the regular solution model developed by Hillert and Staffanson [6] and extended byAgren and Sundman [7]. Thermo-Calc calculates the Gibbs energy for every phase in a multi-component system, and can then tell which phases will be stable at certain temperatures andin which quantity and composition they will appear.
An extensive literature survey was conducted with the intention to find solid results, whichcould be used in the model, i.e. the composition of the Z-phase and its solution temperature,together with the overall composition of the steel. Information of both the original Z-phase,CrNbN, and the modified Z-phase, Cr(V,Nb)N, was gathered in order to make acomprehensive model [8].
The current model is under development using the commercial TCFE3 database, with versionQ of Thermo-Calc. The model is based upon results from the literature as well as from own
6
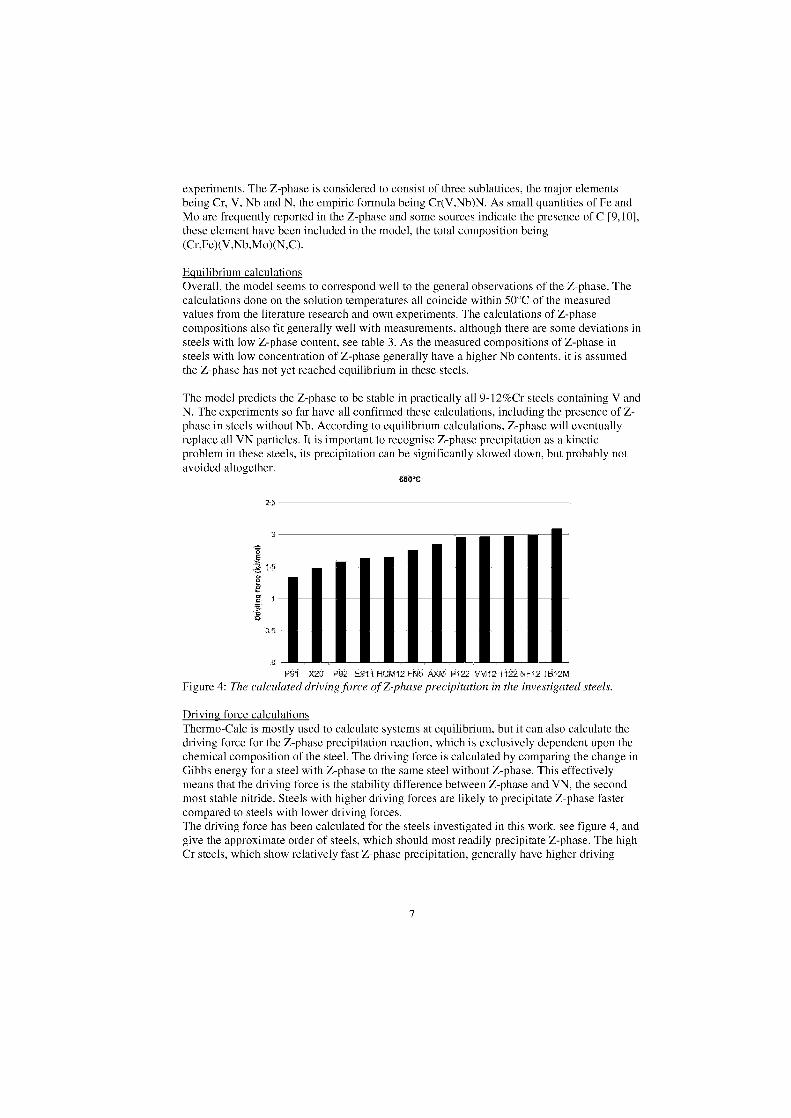
experiments. The Z-phase is considered to consist of three sublattices, the major elementsbeing Cr, V, Nb and N, the empiric formula being Cr(V,Nb)N. As small quantities of Fe andMo are frequently reported in the Z-phase and some sources indicate the presence of C [9,10],these element have been included in the model, the total composition being(Cr,Fe)(V,Nb,Mo)(N,C).
Equilibrium calculations Overall, the model seems to correspond well to the general observations of the Z-phase. Thecalculations done an the solution temperatures all coincide within 50°C of the measuredvalues from the literature research and own experiments. The calculations of Z-phasecompositions also fit generally well with measurements, although there are some deviations insteels with low Z-phase content, see table 3. As the measured compositions of Z-phase insteels with low concentration of Z-phase generally have a higher Nb contents, it is assumedthe Z-phase has not yet reached equilibrium in these steels.
The model predicts the Z-phase to be stable in practically all 9-12%Cr steels containing V andN. The experiments so far have all confirmed these calculations, including the presence of Z-phase in steels without Nb. According to equilibrium calculations, Z-phase will eventuallyreplace all VN particles. It is important to recognise Z-phase precipitation as a kineticproblem in these steels, its precipitation can be significantly slowed down, but probably notavoided altogether.
650'C
P91 X20 P92 E9111-ICM12 FN5 AXIVI P122 VM12 T122 NF '2'3"21,,
Figure 4: The calculated driving force of Z-phase precipitation in the investigated steels.
Driving force calculations Thermo-Calc is mostly used to calculate systems at equilibrium, but it can also calculate thedriving force for the Z-phase precipitation reaction, which is exclusively dependent upon thechemical composition of the steel. The driving force is calculated by comparing the change inGibbs energy for a steel with Z-phase to the same steel without Z-phase. This effectivelymeans that the driving force is the stability difference between Z-phase and VN, the secondmost stable nitride. Steels with higher driving forces are likely to precipitate Z-phase fastercompared to steels with lower driving forces.The driving force has been calculated for the steels investigated in this work, see figure 4, andgive the approximate order of steels, which should most readily precipitate Z-phase. The highCr steels, which Show relatively fast Z-phase precipitation, generally have higher driving
7
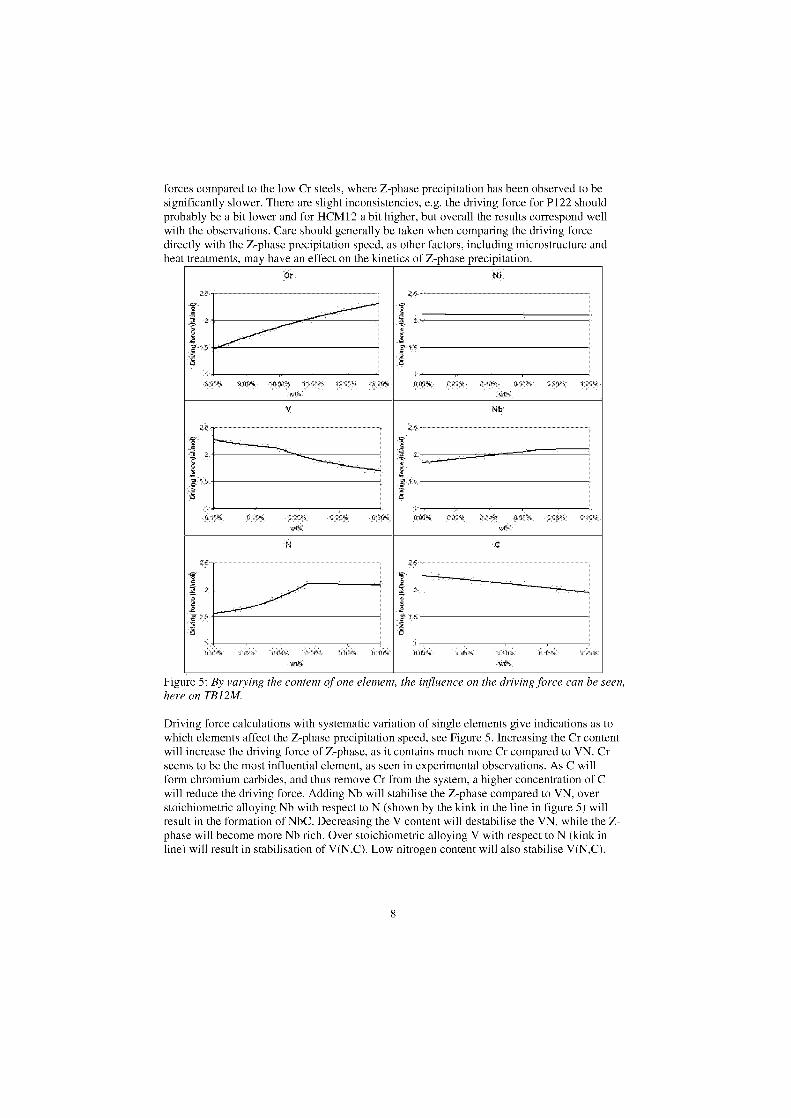
dr
forces compared to the low Cr steels, where Z-phase precipitation has been observed to besignificantly slower. There are slight inconsistencies, e.g. the driving force for P122 shouldprobably be a bit lower and for HCM12 a bit higher, but overall the results correspond wellwith the observations. Care should generally be taken when comparing the driving forcedirectly with the Z-phase precipitation speed, as other factors, including microstructure andheat treatments, may have an effect on the kinetics of Z-phase precipitation.
Figure 5: By varying the content of one element, the influence on the driving force can be seen,here on TB12M.
Driving force calculations with systematic variation of single elements give indications as towhich elements affect the Z-phase precipitation speed, see Figure 5. lncreasing the Cr contentwill increase the driving force of Z-phase, as it contains much more Cr compared to VN. Crseems to be the most influential element, as seen in experimental observations. As C willform chromium carbides, and thus remove Cr from the system, a higher concentration of Cwill reduce the driving force. Adding Nb will stabilise the Z-phase compared to VN, overstoichiometric alloying Nb with respect to N (shown by the kink in the line in figure 5) willresult in the formation of NbC. Decreasing the V content will destabilise the VN, while the Z-phase will become more Nb rich. Over stoichiometric alloying V with respect to N (kink inline) will result in stabilisation of V(N,C). Low nitrogen content will also stabilise V(N,C),
8

over stoichiometric alloying N with respect to Nb+V (kink in line) will lead to the formationof chromium nitrides (M 2X). Strang and Vodarek [11] have suggested that Ni should have anaccelerating effect on the precipitation of Z-phase, but the model does not show anyindications of this.
Summary
A thorough investigation into the presence of modified Z-phase, Cr(V,Nb)N, in creepresistant martensitic 9-12%Cr steels has been carried out, and a thermodynamic model of theZ-phase has been created using the Thermo-Calc software. The model predicts the Z-phasebeing stable in all of the 9-12%Cr martensitic steels, provided they contain its constituents.This is verified by experimental investigations, as twelve different commercial andexperimental steels with varying composition have been investigated, and modified Z-phasehas been found in all of these steel types in varying quantities.
The chromium content in 9-12%Cr martensitic steels has a strong influence on theprecipitation of modified Z-phase. The higher chromium (11-12%) steels have a much higherrate of Z-phase precipitation compared to steels with around 9% Cr. The high Cr steels haveall shown a premature breakdown in creep strength in the same time-temperature range as theZ-phase precipitation, whereas the low Cr steels have demonstrated good Jong-term creepstability up to more than 50,000 hours at 650°C [1]. This clearly demonstrates that acceleratedZ-phase precipitation has a crucial influence on the premature breakdown in creep strengthobserved in the high Cr steels.
Since Z-phase was found in all of the investigated steels, the presence of Z-phase in itselfdoes not have a direct influence on the creep strength. Z-phase precipitation is accompaniedby dissolution of the beneficial MX particles, and has to precipitate in large enough quantitiesto dissolve an appreciable amount of MX particles in order to affect the creep strength. In thehigh Cr steels the MX dissolution was all but complete after –10,000h at 650C°, this can bemeasured using both X-ray diffraction, see figure 3, and TEM microscopy.
The presence of niobium also appears to accelerate Z-phase precipitation. In the 12CrMoVsteel X20 with high Cr but no Nb, Z-phase was found after exposure for 150,000h at 600°C.Even after such extended time, there were only very few Z-phase particles present. Theempirical chemical composition of these Z-phases was CrVN, and is not known to beobserved before.
The crystal structure of modified Z-phase was investigated, and was found to consist ofcoexisting tetragonal/cubic crystal structures [5].
The solution temperature of the modified Z-phases Cr(V,Nb)N and CrVN has beendetermined to be dose to 800°C in 11-12%Cr martensitic steels, which is much lower than the1200-1250°C solution temperature for CrNbN. Above the solution temperature the modifiedZ-phase is replaced by MX particles.
Driving force calculations of the Z-phase generally show the steels with higher Cr contents tohave higher driving force compared to the steels with low Cr content, which also correspondwell with experimental observations. Driving force calculations show the major elements of
9
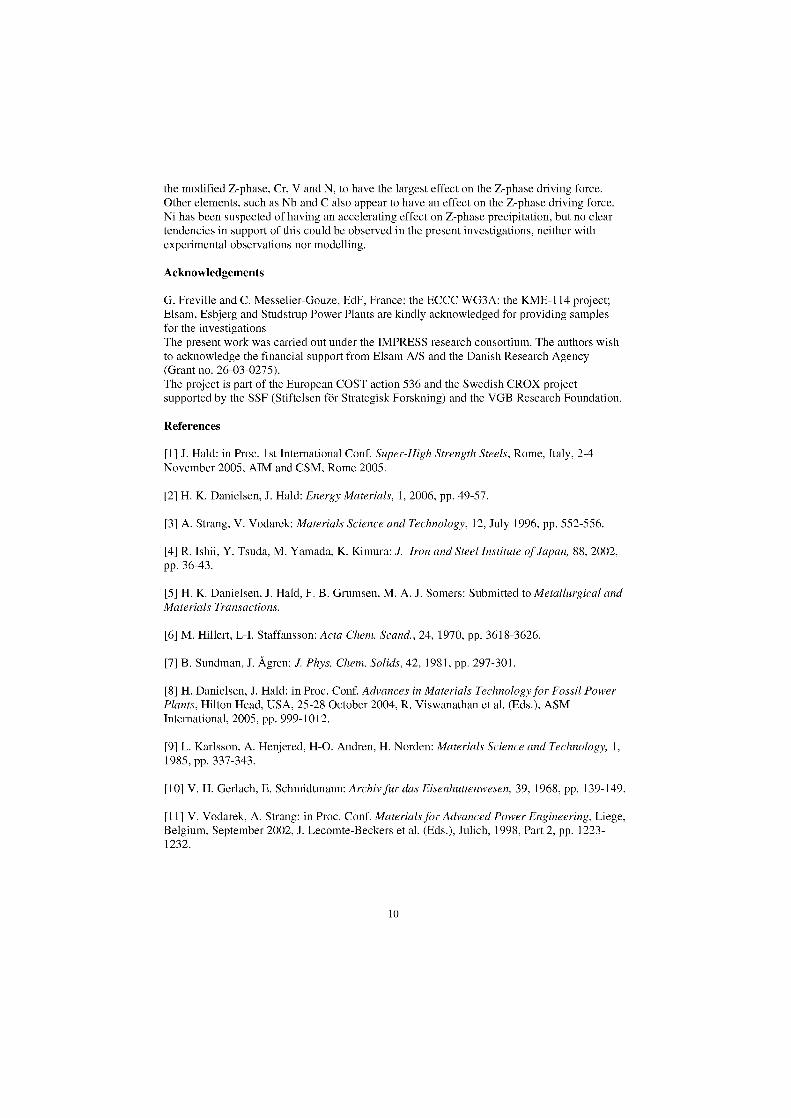
the modified Z-phase, Cr, V and N, to have the largest effect on the Z-phase driving force.Other elements, such as Nb and C also appear to have an effect on the Z-phase driving force.Ni has been suspected of having an accelerating effect on Z-phase precipitation, but no cleartendencies in support of this could be observed in the present investigations, neither withexperimental observations nor modelling.
Acknowledgements
G. Freville and C. Messelier-Gouze, EdF, France; the ECCC WG3A; the KME-114 project;Elsam, Esbjerg and Studstrup Power Plants are kindly acknowledged for providing samplesfor the investigationsThe present work was carried out under the IMPRESS research consortium. The authors wishto acknowledge the financial support from Elsam A/S and the Danish Research Agency(Grant no. 26-03-0275).The project is part of the European COST action 536 and the Swedish CROX projectsupported by the SSF (Stiftelsen för Strategisk Forskning) and the VGB Research Foundation.
References
[1] J. Hald: in Proc. Ist International Conf. Super-High Strength Steels, Rome, Italy, 2-4November 2005, AIM and CSM, Rome 2005.
[2] H. K. Danielsen, J. Hald: Energy Materials, 1, 2006, pp. 49-57.
[3] A. Strang, V. Vodarek: Materials Science and Technology, 12, July 1996, pp. 552-556.
[4] R. Ishii, Y. Tsuda, M. Yamada, K. Kimura: J. Iron and Steel Institute of Japan, 88, 2002,pp. 36-43.
[5] H. K. Danielsen, J. Hald, F. B. Grumsen, M. A. J. Somers: Submitted to Metallurgical andMaterials Transactions.
[6] M. Hillert, L-1. Staffansson: Acta Chem. Scand., 24, 1970, pp. 3618-3626.
[7] B. Sundman, J. Ägren: J. Phys. Chem. Solids, 42, 1981, pp. 297-301.
[8] H. Danielsen, J. Hald: in Proc. Conf. Advances in Materials Technology for Fossil PowerPlants, Hilton Head, USA, 25-28 October 2004, R. Viswanathan et al. (Eds.), ASMInternational, 2005, pp. 999-1012.
[9] L. Karlsson, A. Henjered, H-0. Andren, H. Norden: Materials Science and Technology, 1,1985, pp. 337-343.
[10] V. H. Gerlach, E. Schmidtmann: Archiv fur das Eisenhuttenwesen, 39, 1968, pp. 139-149.
[11] V. Vodarek, A. Strang: in Proc. Conf. Materials for Advanced Power Engineering, Liege,Belgium, September 2002, J. Lecomte-Beckers et al. (Eds.), Julich, 1998, Part 2, pp. 1223-1232.
10
MICROSTRUCTURE AND STEAM OXIDATION RESISTANCE OFLAVES PHASE FORMING 12%CR STEELS AT 600-650°C
J Pirön Abellän, P J Ennis, L Singheiser, W J QuadakkersForschungszentrum Jülich, Institute for Materials and Processes in Energy Systems
D-52425 Jülich Germany
Abstract
Tempered martensitic/ferritic 12%Cr steels can be considered as candidate materials for Ultra Super Critical (USC)Power Plants from the point of view of long-term oxidation resistance. However, microstructure degradation of thehigh Cr-steels leads to poorer creep strengths compared with 9%Cr steels. The effect of elements, such as Co, Cu,Mn and Si on the alloy microstructure and oxidation resistance at 600 and 650°C have been investigated on various12%Cr model alloys, containing high W additions that correspond with the assumption that the contribution of theLaves phase to the creep strength is higher than that of the MX particles. During long-term exposure it has been alsoobserved the beneficial effect of combined additions of Co/Cu on the oxidation resistance allowing the formation ofprotective Cr-rich oxide scales at exposure temperatures of 600 to 650°C.
Keywords: 12%Cr steels, steam oxidation, Laves phases, MX precipitates, SNMS.
Introduction
In recent years the demand for steam power plants with increased efficiencies has led to thedevelopment of materials capable of operating at steam temperatures and pressures significantlyhigher than those employed in current power plants [1]. The use of low-Cr steels, such as21/4 %Cr-1% Mo steels is limited to boiler service at temperatures around 550 °C both ongrounds of insufficient creep strength and the relatively high oxidation rates in steam at highertemperatures around 600 °C [2]. Martensitic steels containing around 9% Cr are capable of useup to 600 °C at the stress levels of interest [3]. The commercial 9% Cr grades P91, P92 and E911possess high creep strengths; unfortunately, these steels exhibit poor oxidation resistance in highwater vapour containing atmospheres at 600-650 °C [4] and are therefore unsuitable for thin-walled components, such as boiler tubes. The oxidation resistance of the steels may be improvedby increasing the chromium content, frequently up to levels of around 12% Cr. This, however,results in a decrease in creep strength at higher Cr concentrations [5], possibly due to theformation of Z-phase [6] and the fact that during austenitising the material may not be fullyaustenitic with the result that after quenching the steel is ferritic/martensitic rather than fullymartensitic. To overcome the latter problem, the steels are frequently alloyed with substantialamounts of Co [7]. Recently, a number of developments have aimed at the partial replacement ofCo by Cu additions, mainly to reduce the alloy cost.
The new steel compositions mostly contain minor amounts of Si and Mn because these elementsare used to reduce the oxygen and sulphur content during alloy manufacturing. From bothelements, it is also known that they affect the oxidation behaviour [8]. Additionally, Mn canpartly replace the austenite stabilizing effect of the costly alloying element Co.
The aim of the present paper is the investigation of the microstructural features and the steamoxidation resistance of a number of recently developed Laves phase strengthened 12%Cr steels.The as-received microstructures of the materials were studied to determine the possibleformation of the deleterious 8-phase [9], which is reported to adversely affect the steeltoughness. The oxidation mechanisms were evaluated by detailed oxide scale characterization
1
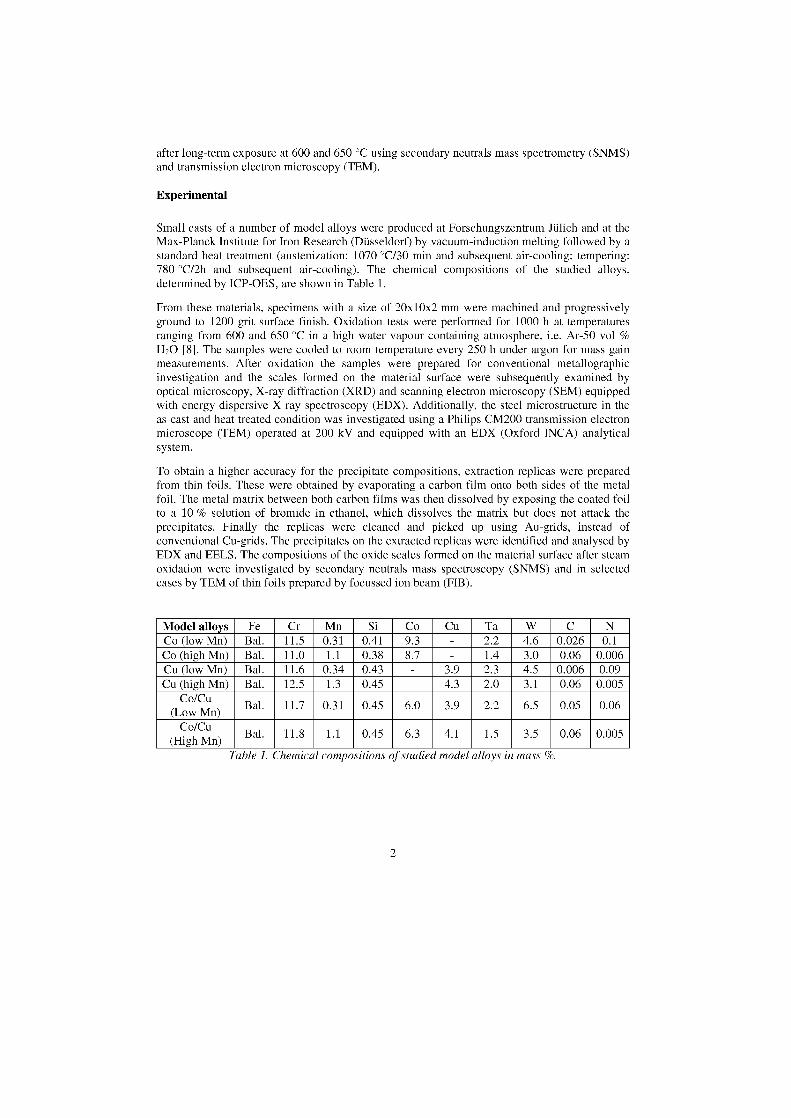
after long-term exposure at 600 and 650 °C using secondary neutrals mass spectrometry (SNMS)and transmission electron microscopy (TEM).
Experimental
Small casts of a number of model alloys were produced at Forschungszentrum Jülich and at theMax-Planck Institute for hon Research (Düsseldorf) by vacuum-induction melting followed by astandard heat treatment (austenization: 1070 °C/30 min and subsequent air-cooling; tempering:780 °C/2h and subsequent air-cooling). The chemical compositions of the studied alloys,determined by ICP-OES, are shown in Table 1.
From these materials, specimens with a size of 20x10x2 mm were machined and progressivelyground to 1200 grit surface finish. Oxidation tests were performed for 1000 h at temperaturesranging from 600 and 650 °C in a high water vapour containing atmosphere, i.e. Ar-50 vol %WO [8]. The samples were cooled to room temperature every 250 h under argon for mass gainmeasurements. After oxidation the samples were prepared for conventional metallographicinvestigation and the scales formed on the material surface were subsequently examined byoptical microscopy, X-ray diffraction (XRD) and scanning electron microscopy (SEM) equippedwith energy dispersive X-ray spectroscopy (EDX). Additionally, the steel microstructure in theas-cast and heat treated condition was investigated using a Philips CM200 transmission electronmicroscope (TEM) operated at 200 kV and equipped with an EDX (Oxford INCA) analyticalsystem.
To obtain a higher accuracy for the precipitate compositions, extraction replicas were preparedfrom thin foils. These were obtained by evaporating a carbon film onto both sides of the metalfoil. The metal matrix between both carbon films was then dissolved by exposing the coated foilto a 10 % solution of bromide in ethanol, which dissolves the matrix but does not attack theprecipitates. Finally the replicas were cleaned and picked up using Au-grids, instead ofconventional Cu-grids. The precipitates on the extracted replicas were identified and analysed byEDX and EELS. The compositions of the oxide scales formed on the material surface after steamoxidation were investigated by secondary neutrals mass spectroscopy (SNMS) and in selectedcases by TEM of thin foils prepared by focussed ion beam (FIB).
Model alloys Fe Cr Mn Si Co Cu Ta W C NCo (low Mn) Bal. 11.5 0.31 0.41 9.3 2.2 4.6 0.026 0.1Co (high Mn) Bal. 11.0 1.1 0.38 8.7 - 1.4 3.0 0.06 0.006Cu (low Mn) Bal. 11.6 0.34 0.43 - 3.9 2.3 4.5 0.006 0.09Cu (high Mn) Bal. 12.5 1.3 0.45 4.3 2.0 3.1 0.06 0.005
Co/Cu(Low Mn)
Bal. 11.7 0.31 0.45 6.0 3.9 2.2 6.5 0.05 0.06
Co/Cu(High Mn)
Bal. 11.8 1.1 0.45 6.3 4.1 1.5 3.5 0.06 0.005
Table I. Chemical compositions of studied model alloys in mass %.
2
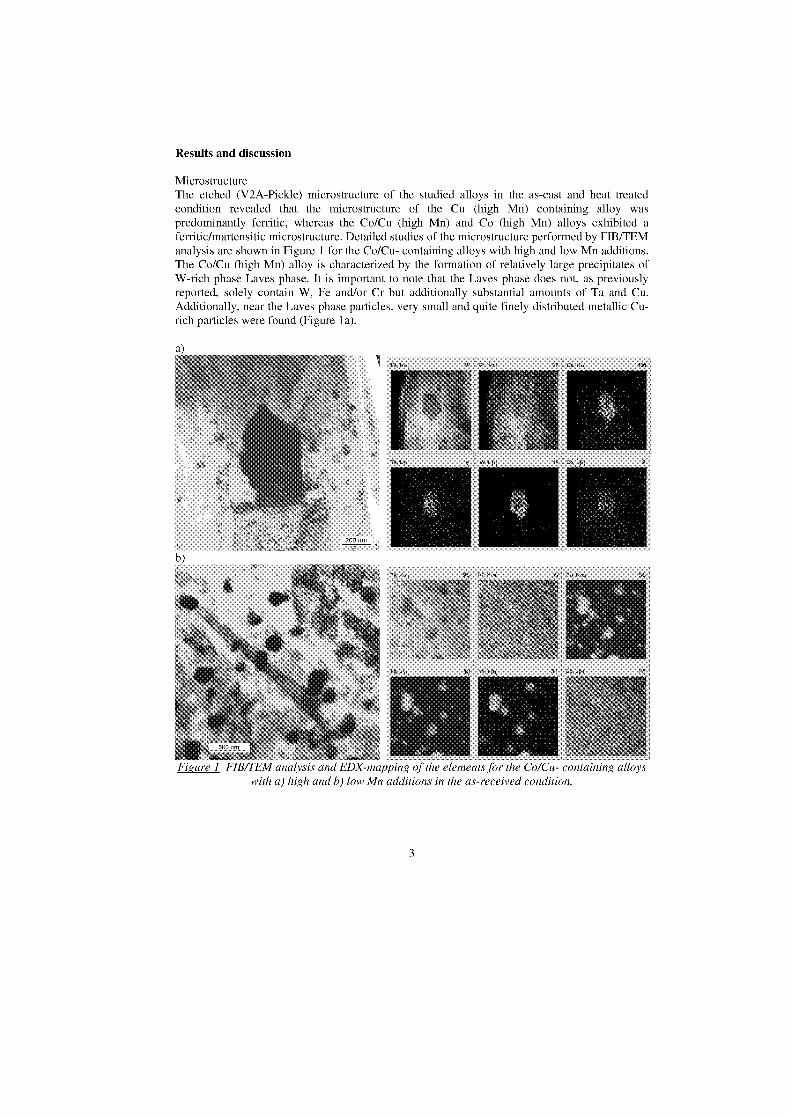
Results and discussion
MicrostructureThe etched (V2A-Pickle) microstructure of the studied alloys in the as-cast and he gt treatedcondition revealed that the microstructure of the Cu (high Mn) containing alloy waspredominantly ferritic, whereas the Co/Cu (high Mn) and Co (high Mn) alloys exhibited aferritic/martensitic microstructure. Detailed studies of the microstructure performed by FIB/TEManalysis are shown in Figure 1 for the Co/Cu- containing alloys with high and low Mn additions.The Co/Cu (high Mn) alloy is characterized by the formation of relatively large precipitates ofW-rich phase Laves phase. lt is important to note that the Laves phase does not, as previouslyreported, solely contain W, Fe and/or Cr but additionally substantial amounts of Ta and Cu.Additionally, near the Laves phase particles, very small and quite finely distributed metallic Cu-rich particles were found (Figure la).
•e 1 1,1B/1 EM anairs • 1 / of the elements for the Co/Cu- containing alloyswith a) high c 7 b) lo Mn additions in the as-received condition.
3
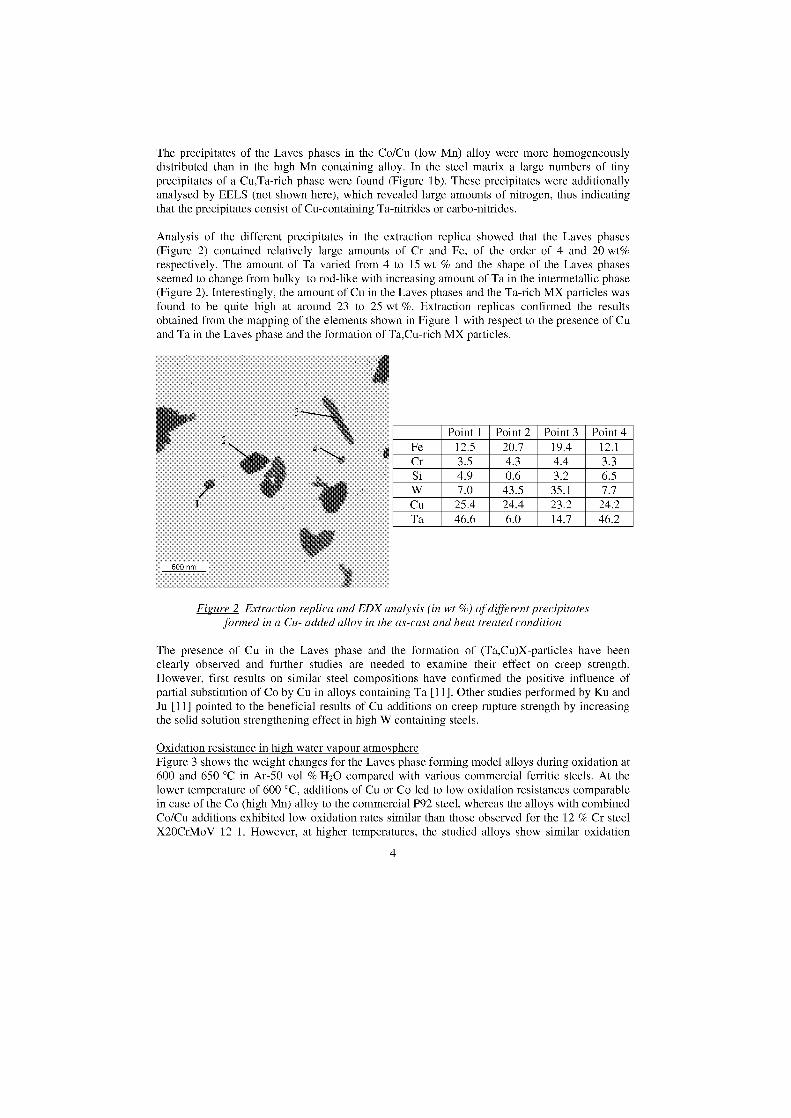
The precipitates of the Laves phases in the Co/Cu (low Mn) alloy were more homogeneouslydistributed than in the high Mn containing alloy. In the steel matrix a large numbers of tinyprecipitates of a Cu,Ta-rich phase were found (Figure 1b). These precipitates were additionallyanalysed by EELS (not shown here), which revealed large amounts of nitrogen, thus indicatingthat the precipitates consist of Cu-containing Ta-nitrides or carbo-nitrides.
Analysis of the different precipitates in the extraction replica showed that the Laves phases(Figure 2) contained relatively large amounts of Cr and Fe, of the order of 4 and 20 wt%respectively. The amount of Ta varied from 4 to 15 wt % and the shape of the Laves phasesseemed to change from bulky to rod-like with increasing amount of Ta in the intermetallic phase(Figure 2). Interestingly, the amount of Cu in the Laves phases and the Ta-rich MX particles wasfound to be quite high at around 23 to 25 wt %. Extraction replicas confirmed the resultsobtained from the mapping of the elements shown in Figure 1 with respect to the presence of Cuand Ta in the Laves phase and the formation of Ta,Cu-rich MX particles.
500 nm
Point 1 Point 2 Point 3 Point 4Fe 12.5 20.7 19.4 12.1Cr 3.5 4.3 4.4 3.3Si 4.9 0.6 3.2 6.5
7.0 43.5 35.1 7.7Cu 25.4 24.4 23.2 24.2Ta 46.6 6.0 14.7 46.2
Figure 2 Euraction replica and EDX analysis (in wt %) of different precipitatesformed in a Cu- added alloy in the as-cast and heat treated condition
The presence of Cu in the Laves phase and the formation of (Ta,Cu)X-particles have beenclearly observed and further studies are needed to examine their effect on creep strength.However, first results on similar steel compositions have confirmed the positive influence ofpartial substitution of Co by Cu in alloys containing Ta [11]. Other studies performed by Ku andJu [11] pointed to the beneficial results of Cu additions on creep rupture strength by increasingthe solid solution strengthening effect in high W containing steels.
Oxidation resistance in hi h water va our atmos ihereFigure 3 shown the weight changes for the Laves phase forming model alloys during oxidation at600 and 650 °C in Ar-50 vol % H20 compared with various commercial ferritic steels. At thelower temperature of 600 °C, additions of Cu or Co led to low oxidation resistances comparablein case of the Co (high Mn) alloy to the commercial P92 steel, whereas the alloys with combinedCo/Cu additions exhibited low oxidation raten similar than those observed for the 12 % Cr steelX20CrMoV 12 1. However, at higher temperatures, the studied alloys show similar oxidation
4
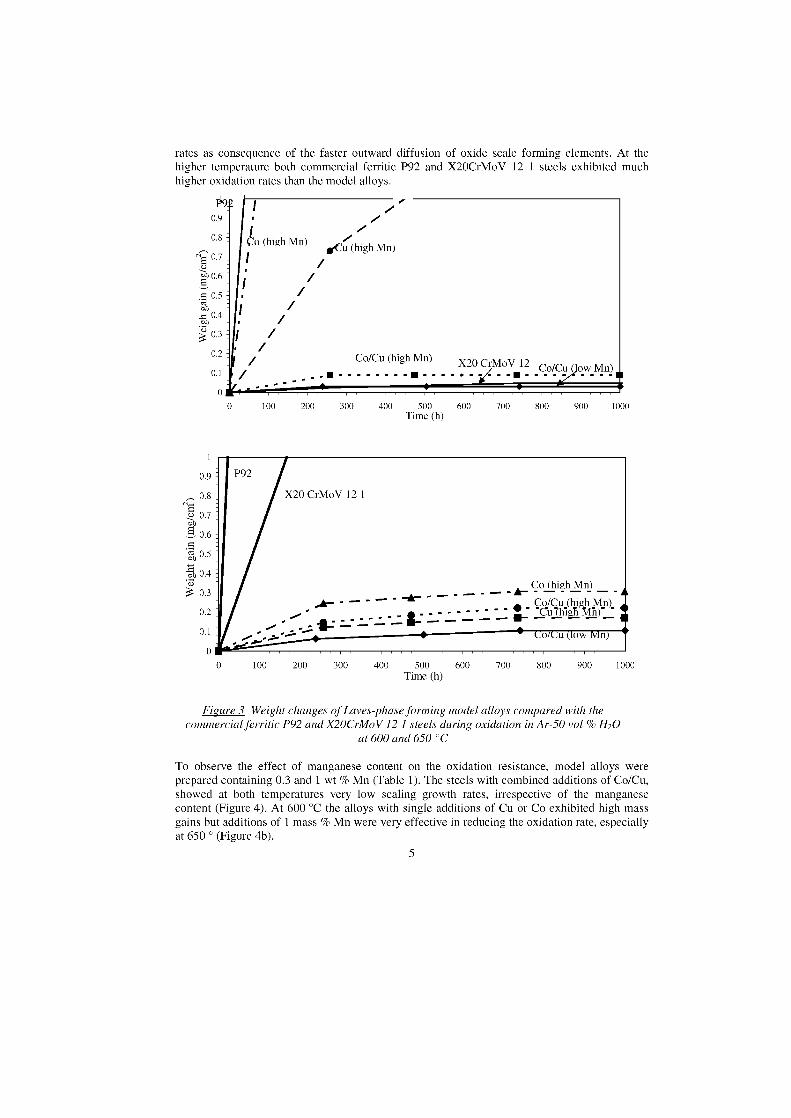
Co/Cu (high Mn) X20 CrMoV 12• j17
• Co/Cu ow Mn)
X20 CrMoV 12 1
.. AMnA.... - ..... , - _ . Co (high ) _
.......... Co/Cu (hie Mn)
---• . .. :... . : . ir - -cu Th-wri mr-)- *B– a---
' - ..-- • Co/Cu (1ow Mn) •
rates as consequence of the faster outward diffusion of oxide scale forming elements. At thehigher temperature both commercial ferritic P92 and X20CrMoV 12 1 steels exhibited muchhigher oxidation rates than the model alloys.
0.9
0.8 o (high Mn) .Cu ((high Mn)rg 0.7 I
'7;1 0.65
0.5ar) I_= 0.4cu
0.3
0.2
//
0.1
00 100 200 300 400 500 600 700 800 900 1000
Time (h)
0.9
0.8
'S 0.7an5 0.6
a 0.5
e 0.4173
0.3
0.2
0.1
0
&ure 3 Weight changes of Laves-phase forming model alloys compared with thecommercial ferritic P92 and X20CrMoV 12 1 steels during oxidation in Ar-50 vol % 1120
at 600 and 650 °C
To observe the effect of manganese content an the oxidation resistance, model alloys wereprepared containing 0.3 and 1 wt % Mn (Table 1). The steels with combined additions of Co/Cu,showed at both temperatures very low scaling growth rates, irrespective of the manganesecontent (Figure 4). At 600 °C the alloys with single additions of Cu or Co exhibited high massgains but additions of 1 mass % Mn were very effective in reducing the oxidation rate, especiallyat 650 ° (Figure 4b).
5
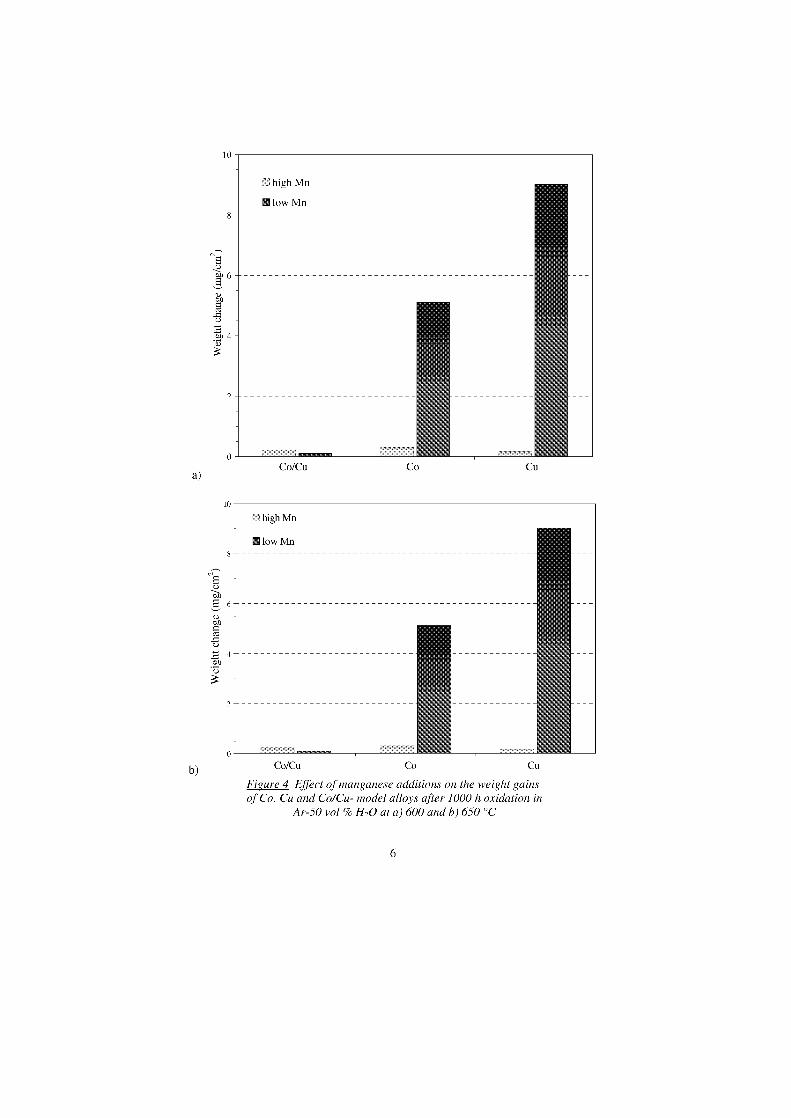
2 high Mn
low Mn
Cu
10
a)
10
0
b) Co/Cu
Co Cu
Figure 4 Effect of manganese additions an the weight gainsof Co, Cu and Co/Cu- model alloys after 1000 h oxidation in
Ar-50 vol % H2 0 at a) 600 and b) 650 °C
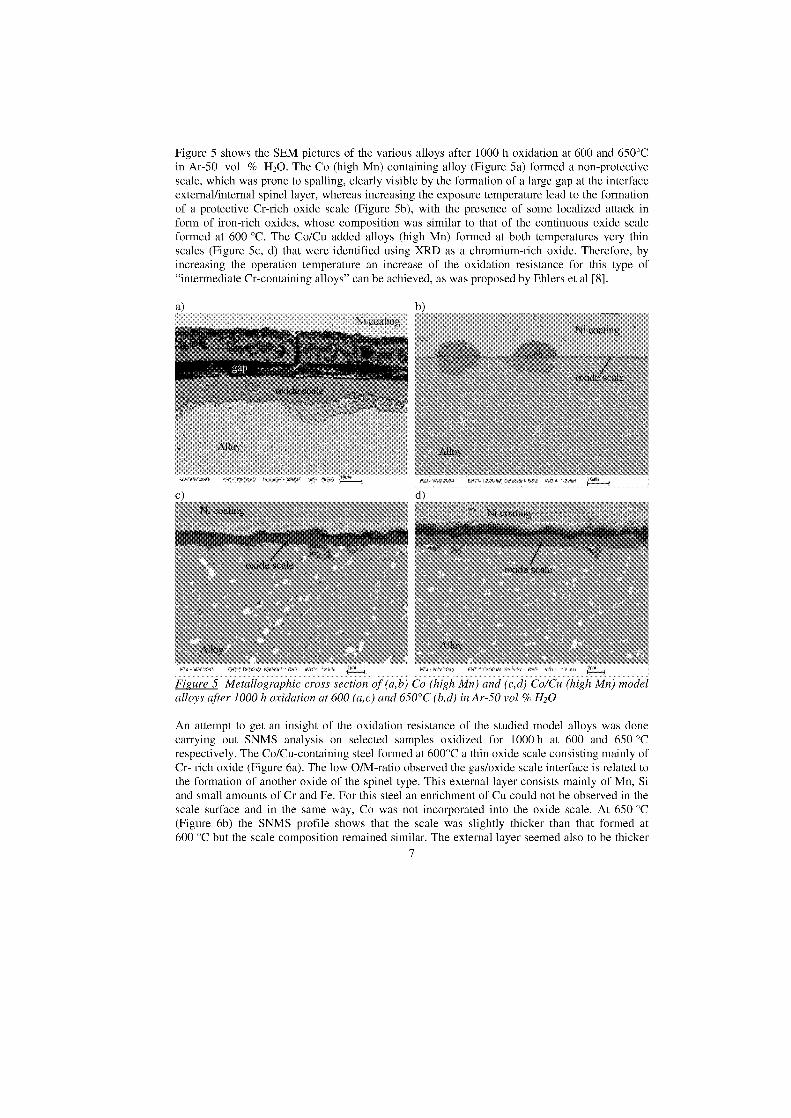
Figure 5 shows the SEM pictures of the various alloys after 1000 h oxidation at 600 and 650°Cin Ar-50 vol % 1120. The Co (high Mn) containing alloy (Figure 5a) formed a non-protectivescale, which was prone to spalling, clearly visible by the formation of a large gap at the interfaceexternal/internal spinel layer, whereas increasing the exposure temperature lead to the formationof a protective Cr-rich oxide scale (Figure 5b), with the presence of some localized attack inform of iron-rich oxides, whose composition was similar to that of the continuous oxide scaleformed at 600 °C. The Co/Cu added alloys (high Mn) formed at both temperatures very thinscales (Figure 5c, d) that were identified using XRD as a chromium-rich oxide. Therefore, byincreasing the Operation temperature an increase of the oxidation resistance for this type of"intermediate Cr-containing alloys" can be achieved, as was proposed by Ehlers et al [8].
a)
b)
Figure 5 Metallographic cross section of (a,b) Co (high Mn) and (c,d) Co/Cu (high Mn)) modelalloys after 1000 h oxidation at 600 (a,c) and 650°C (b,d) in Ar-50 vol % [-120
An attempt to get an insight of the oxidation resistance of the studied model alloys was donecarrying out SNMS analysis an selected samples oxidized for 1000 h at 600 and 650 °Crespectively. The Co/Cu-containing steel formed at 600°C a thin oxide scale consisting mainly ofCr- rich oxide (Figure 6a). The low 0/M-ratio observed the gas/oxide scale interface is related tothe formation of another oxide of the spinel type. This external layer consists mainly of Mn, Siand small amounts of Cr and Fe. For this steel an enrichment of Cu could not be observed in thescale surface and in the same way, Co was not incorporated into the oxide scale. At 650 °C(Figure 6b) the SNMS profile shows that the scale was slightly thicker than that formed at600 °C but the scale composition remained similar. The external layer seemed also to be thicker
7
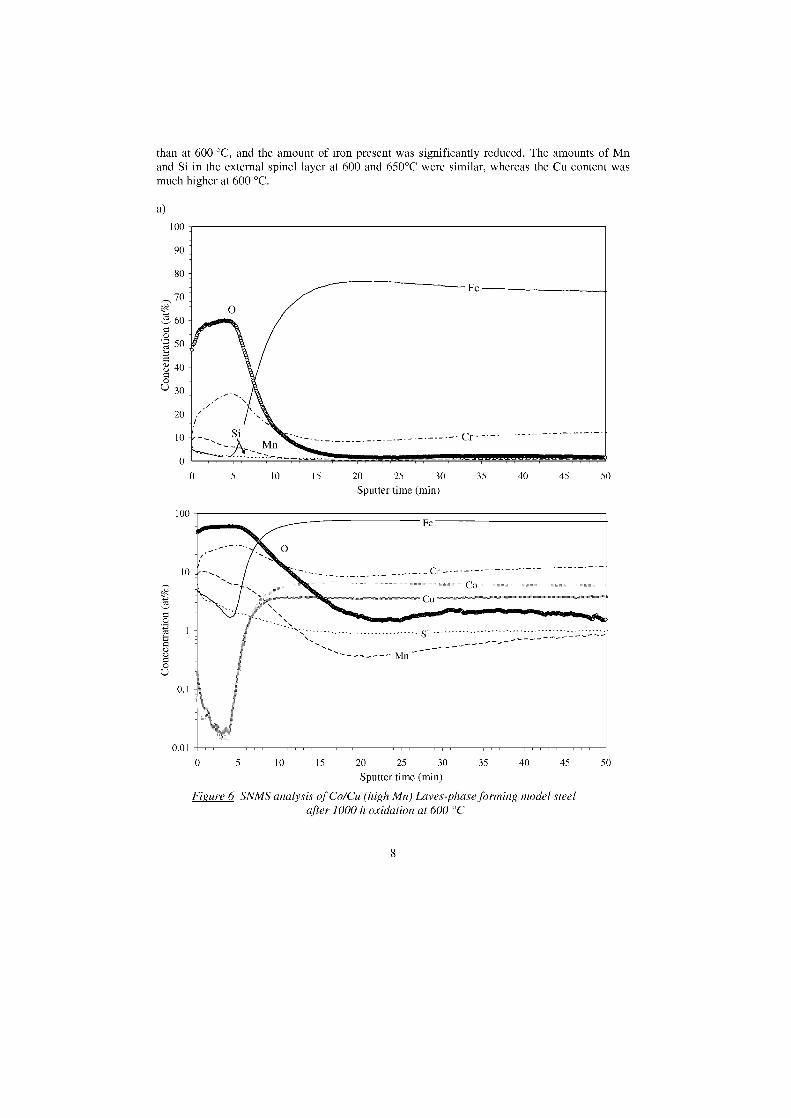
70
600• 50
8 4000U30
20
1 0
0
35 40 5045
Si '''''''''''''' '''' '' '''' ''' '' '''''' ' •:•• ''
'' Mn
5 10 15 20 25 30Sputter time (min)
FiRure 6 SNMS analysis of Co/Cu (high Mn) Laves-phase forming model steelafter 1000 h oxidation at 600 °C
50
than at 600 °C, and the amount of iron present was significantly reduced. The amounts of Mnand Si in the external spinel layer at 600 and 650°C were similar, whereas the Cu content wasmuch higher at 600 °C.
a)
100
90
80
8
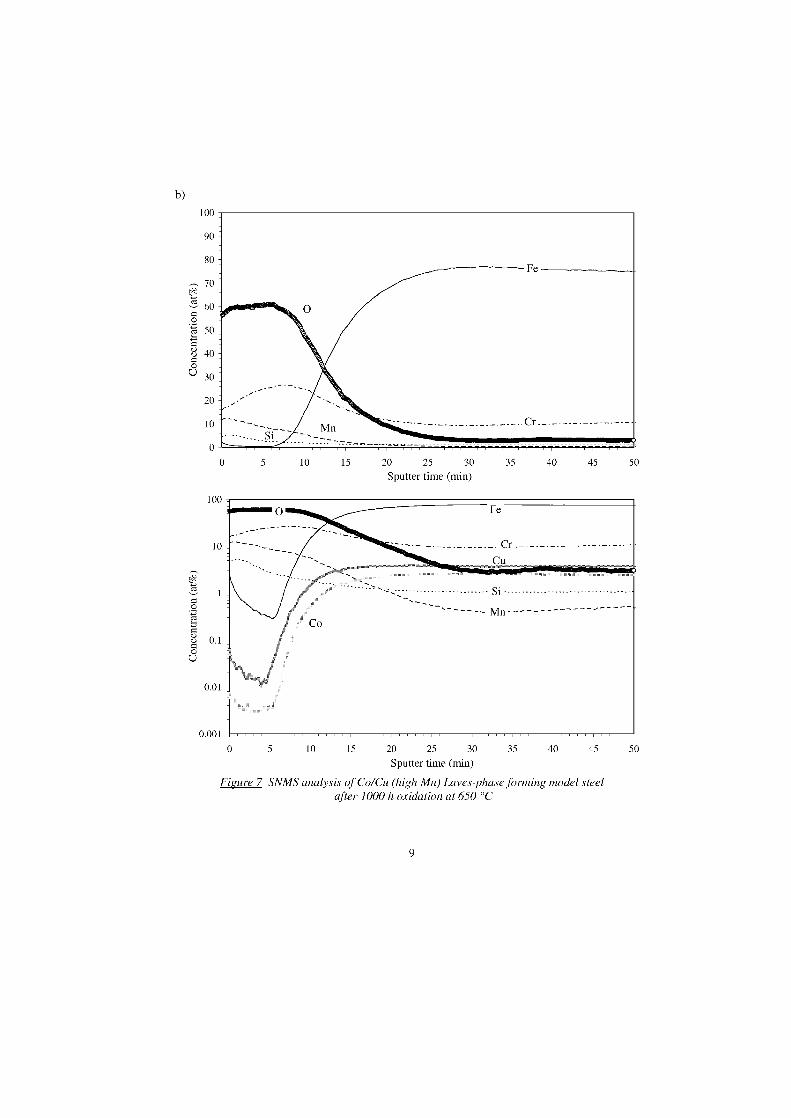
35 504540
100
0.1
0.01
b)
100
90
80
70
600e 50
Q 400
3
20
10
0.001 0 5 10 15 20 25 30 35 40 45 50
Sputter time (min)
Figure 7 SNMS analysis of Co/Cu (high Mn) Laves-phase forming model steelafter 1000 h oxidation at 650 °C
9
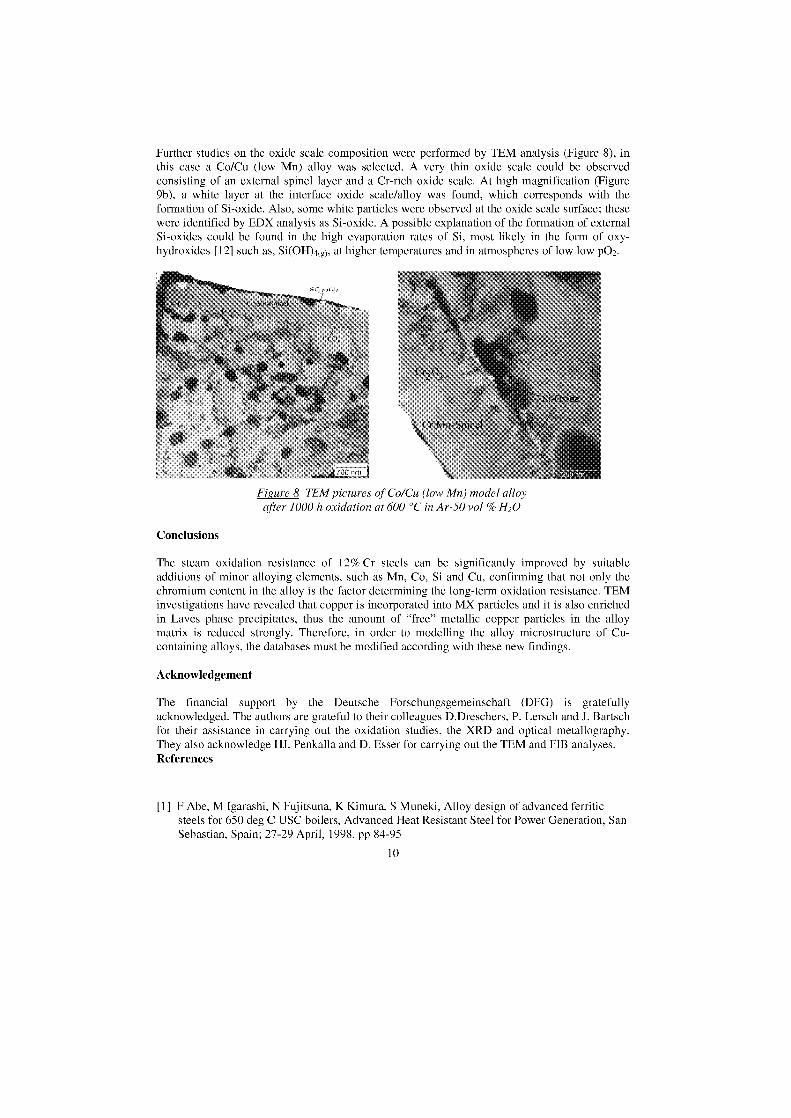
Further studies an the oxide scale composition were performed by TEM analysis (Figure 8), inthis case a Co/Cu (low Mn) alloy was selected. A very thin oxide scale could be observedconsisting of an external spinel layer and a Cr-rich oxide scale. At high magnification (Figure9b), a white layer at the interface oxide scale/alloy was found, which corresponds with theformation of Si-oxide. Also, some white particles were observed at the oxide scale surface; thesewere identified by EDX analysis as Si-oxide. A possible explanation of the formation of externalSi-oxides could be found in the high evaporation rates of Si, most likely in the form of oxy-hydroxides [12] such as, Si(OH) 4(2) , at higher temperatures and in atmospheres of low low p02.
FiRure 8 TEM pietures of Co/Cu (low Mn) mo, alloyafter 1000 h at 600 °C in Ar-50 vol H20
Conclusions
The steam oxidation resistance of 12% Cr steels can be significantly improved by suitableadditions of minor alloying elements, such as Mn, Co, Si and Cu, confirming that not only thechromium content in the alloy is the factor determining the Jong-term oxidation resistance. TEMinvestigations have revealed that copper is incorporated into MX particles and it is also enrichedin Laves phase precipitates, thus the amount of "free" metallic copper particles in the alloymatrix is reduced strongly. Therefore, in order to modelling the alloy microstructure of Cu-containing alloys, the databases must be modified according with these new findings.
Acknowledgement
The financial support by the Deutsche Forschungsgemeinschaft (DFG) is gratefullyacknowledged. The authors are grateful to their colleagues D.Dreschers, P. Lersch and J. Bartschfor their assistance in carrying out the oxidation studies, the XRD and optical metallography.They also acknowledge HJ. Penkalla and D. Esser for carrying out the TEM and F1B analyses.References
[1] F Abe, M Igarashi, N Fujitsuna, K Kimura, S Muneki, Alloy design of advanced ferriticsteels for 650 deg C USC boilers, Advanced Heat Resistant Steel for Power Generation, SanSebastian, Spain; 27-29 April, 1998, pp 84-95
10
[2] 1 G Wright and B A Pint, NACE Corrosion 2002, Paper 02-377, Denver, CO, March 2002
[3] P J Ennis, A Zielinska-Lipiec, 0 Wachter 0, A Czyrska-Filemonowicz, Acta Materialia,Volume 45,Number 12, December 1997, pp 4901-4907
[4] P J Ennis, W J Quadakkers, 9-12% chromium steels: application limits and potential forfurther development, PARSONS 2000: Fifth International Charles Parsons TurbineConference; Cambridge; UK; 3-7 July, 2000, pp 265-275
[5] V SkleniCla, K Kuchafoyä, M Svoboda, L Kloc, J BurSk, A Kroupa, MaterialsCharacterization 51 (2003), pp 35-48.
[6] H Danielsen and J Hald, Z-phase in 9-12%Cr steels, Fourth International Conference onAdvances in Materials Technology for Fossil Power Plants, Hilton Head Island, SouthCarolina, 25-28 October, 2004
[7] B Jiang, K Xu, X Qi and W Zhou, Effects of cobalt content on martensitic transformationand shape memory effect in Fe-Mn-Si-Cr-Ni alloys, J. Phys. IV France, 112 (2003), p 393
[8] J Ehlers, W J Quadakkers, Report Forschungszentrum Jülich, Jülich, FRG, Jül-3883, ISSN0944-2952, June 2001
[9] V Knezevic, G Sauthoff, J Vilk, G Inden, A Schneider, R Agamennone, W Blum, Y Wang,A Scholz, C Berger, J Ehlers, L Singheiser, ISIJ International, Vol 42 (2002), No. 12, pp1505-1514
[10] V Knezevic, G Sauthoff, Improvement of creep strength of heat-resistant martensitic -ferritic 12% Cr steels, Fourth International Conference on Advances in MaterialsTechnology for Fossil Power Plants, Hilton Head Island, South Carolina, 25-28 October,2004, pp 1256
[11] B S Ku, J Yu, Scripta Materialia, 45, 2001, pp 205-211
[12] N Jacobson, D. Myersb, E. Opila, E. Copland, Interactions of water vapor with oxides atelevated temperatures, Journal of Physics and Chemistry of Solids 66 (2005), pp 471-478
11


Part III
Advanced Steam Turbine Materials
Contributed Papers
Modelling and Alloy Design

CDM MODELLING OF POWER PLANT FERRITIC STEELS
You Fa Yin and Roy G FaulknerInstitute of Polymer Technology and Materials Engineering, Loughborough University,
Loughborough, Leicestershire LE11 3TU, UKy.yin(iidboro.ac.uk; r.g.faulkneni4lboro.ac.uk
Abstract
A new continuum creep damage mechanics (CDM) modelling based on Monte Carlo simulations of precipitationkinetics has been developed to predict the creep behaviour of power plant steels. The Output of themicrostructural evolution simulation, including inter-particle spacing (owing to particle coarsening) anddepletion of solution hardening atoms from matrix (due to the formation of laves phase), is fed to a CDMmodelling program to calculate creep curves and creep rupture strength. The combined modelling technique hasbeen validated by applying it to a 9wt.% Cr ferritic steel, P92, and using the microstructural data published in theliterature and creep data supplied by our collaborators. Reasonably good agreement with experimentalobservations has been found. The approach has also been used to study the effects of different creep damagemechanisms on the creep behaviour. The new approach shows promise to provide a useful tool for both newalloy development and component life prediction.
Keywords: CDM modelling; Creep damage; Microstructural evolution; Ferritic steels
1. Introduction
Prediction of long term creep behaviour of power plant steels from short term experimentalobservations or from using models has been of great interest to both academics and engineersfor many years [1, 2]. Recently, Dyson reviewed the application of CDM in materialsmodelling and component creep life prediction and showed that this method provides aunifying framework for some of the other methods [3]. Different creep damage mechanismscan be integrated into the model, provided that the damage mechanism is understood and theevolution of the particular damage with time is known. Therefore, models of different creepdamage mechanisms have to be used. For example, Wagner's model has to be used to derivethe evolution of the damage due to particle coarsening. Limitations of such an approach arethat the model is only applicable to intra-granular spherical particles. We have recentlydeveloped a technique to simulate the microstructural evolution of power plant steels usingMonte Carlo simulations [4, 5]. This technique is different from many previous approaches tothis problem [6-8] and can give important information about particle coarsening and solutedepletion from the matrix. Therefore, the combination of this approach with Dyson's CDMmodelling would eliminate some limitations of Dyson's approach. Here we report the resultsof our CDM modelling using this combined approach.
2. Simulation of precipitation kinetics
The Monte Carlo based precipitation kinetics simulation technique employed in this study hasbeen reported elsewhere [4, 5]. However, a summary of the technique is provided below.
The simulation is carried out in a representative bulk of the material which includes bothmatrix and grain boundaries. Segregations to grain boundaries is then calculated according tothe model developed by Faulkner et. al. [9] to give the solute concentration in grainboundaries. The pre-service heat treatment and service (or test) durations at different
1
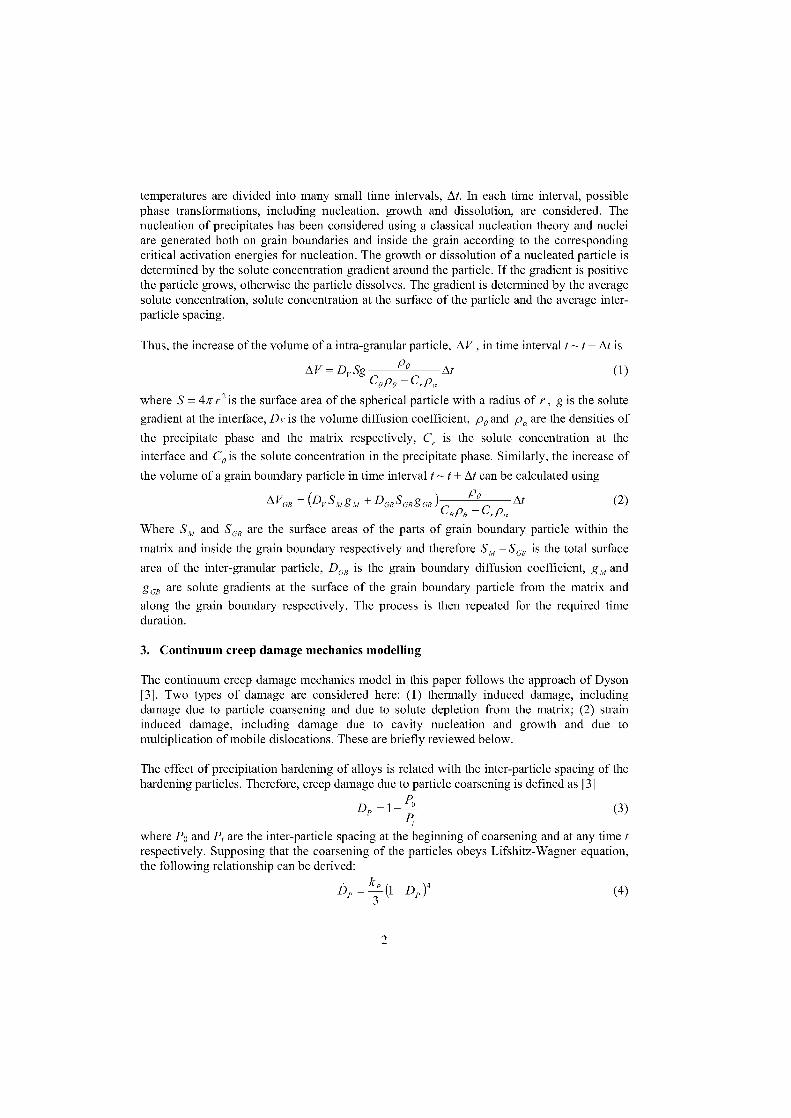
temperatures are divided into many small time intervals, At. In each time interval, possiblephase transformations, including nucleation, growth and dissolution, are considered. Thenucleation of precipitates has been considered using a classical nucleation theory and nucleiare generated both an grain boundaries and inside the grain according to the correspondingcritical activation energies for nucleation. The growth or dissolution of a nucleated particle isdetermined by the solute concentration gradient around the particle. If the gradient is positivethe particle grows, otherwise the particle dissolves. The gradient is determined by the averagesolute concentration, solute concentration at the surface of the particle and the average inter-particle spacing.
Thus, the increase of the volume of a intra-granular particle, A V , in time interval t t+ At is
PoAV = Dv Sg At (1)C8 p, –C,p,
where S = 471- r 2 is the surface area of the spherical particle with a radius of r , g is the solute
gradient at the interface, Dv is the volume diffusion coefficient, p, and p, are the densities of
the precipitate phase and the matrix respectively, C, is the solute concentration at the
interface and C8 is the solute concentration in the precipitate phase. Similarly, the increase of
the volume of a grain boundary particle in time interval t t + At can be calculated using
PO VG, =(Dv S m g + DGBSGBgGB) At–Crpa
Where S M and SG, are the surface areas of the parts of grain boundary particle within the
matrix and inside the grain boundary respectively and therefore SM +SGB is the total surface
area of the inter-granular particle, DGB is the grain boundary diffusion coefficient, g and
gcB are solute gradients at the surface of the grain boundary particle from the matrix and
along the grain boundary respectively. The process is then repeated for the required timeduration.
3. Continuum creep damage mechanics modelling
The continuum creep damage mechanics model in this paper follows the approach of Dyson[3]. Two typen of damage are considered here: (1) thermally induced damage, includingdamage due to particle coarsening and due to solute depletion from the matrix; (2) straininduced damage, including damage due to cavity nucleation and growth and due tomultiplication of mobile dislocations. These are briefly reviewed below.
The effect of precipitation hardening of alloys is related with the inter-particle spacing of thehardening particles. Therefore, creep damage due to particle coarsening is defined as [3]
D, =1– (3)
where Po and P, are the inter-particle spacing at the beginning of coarsening and at any time trespectively. Supposing that the coarsening of the particles obeys Lifshitz-Wagner equation,the following relationship can be derived:
= - Dp)4P 3 (4)
2
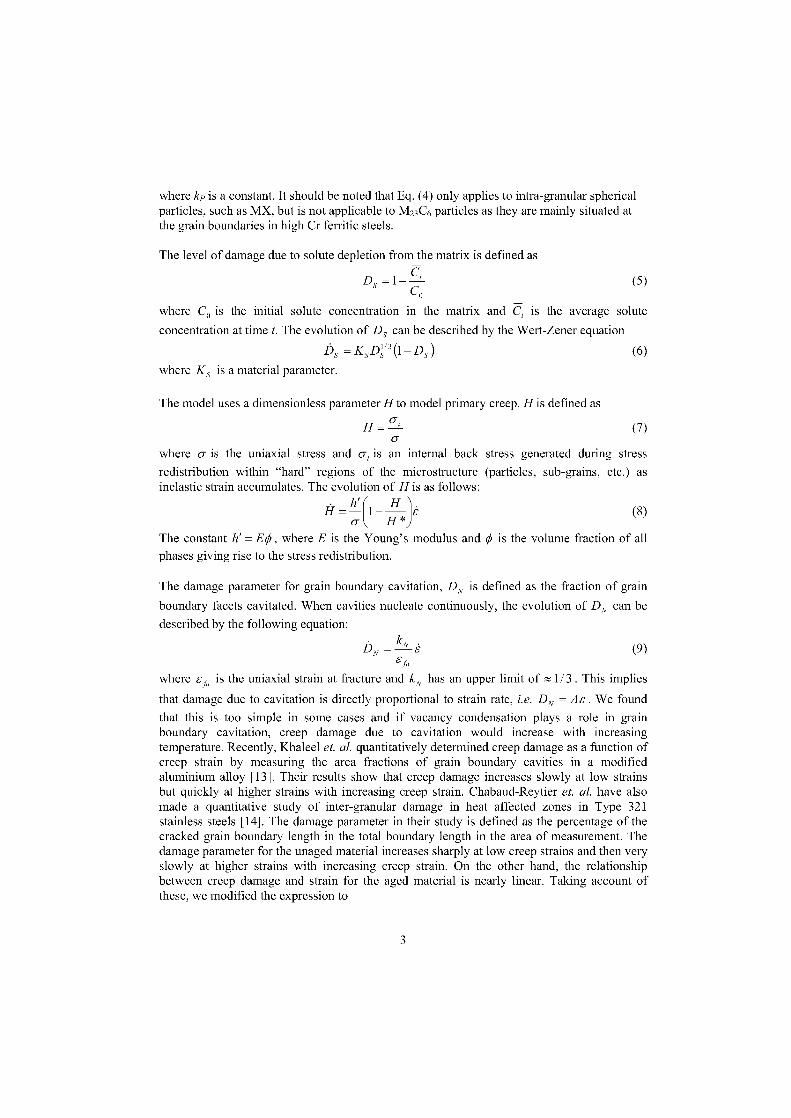
where kP is a constant. It should be noted that Eq. (4) only applies to intra-granular sphericalparticles, such as MX, but is not applicable to M23C6 particles as they are mainly situated atthe grain boundaries in high Cr ferritic steels.
The level of damage due to solute depletion from the matrix is defined as
D, = 1 – C (5)Co
where C, is the initial solute concentration in the matrix and C, is the average solute
concentration at time t. The evolution of D, can be described by the Wert-Zener equation
bs = Ks Ds1/3 (1–D,) (6)
where K, is a material parameter.
The model uses a dimensionless parameter H to model primary creep. His defined as
H =a,(7)o-
where u is the uniaxial stress and o-, is an internal back stress generated during stress
redistribution within "hard" regions of the microstructure (particles, sub-grains, etc.) asinelastic strain accumulates. The evolution of His as follows:
1 =:1h' 7
1 (8)o- H*,The constant h' = EO, where E is the Young's modulus and O is the volume fraction of all
phases giving rise to the stress redistribution.
The damage parameter for grain boundary cavitation, D, is defined as the fraction of grain
boundary facets cavitated. When cavities nucleate continuously, the evolution of DN can be
described by the following equation:
DN = (9)Ei«
where ef„ is the uniaxial strain at fracture and kN has an upper limit of 1/3 . This implies
that damage due to cavitation is directly proportional to strain rate, i.e. DN = As We found
that this is too simple in some cases and if vacancy condensation plays a role in grainboundary cavitation, creep damage due to cavitation would increase with increasingtemperature. Recently, Khaleel et. al. quantitatively determined creep damage as a function ofcreep strain by measuring the area fractions of grain boundary cavities in a modifiedaluminium alloy [13]. Their results show that creep damage increases slowly at low strainsbut quickly at higher strains with increasing creep strain. Chabaud-Reytier et. al. have alsomade a quantitative study of inter-granular damage in heat affected zones in Type 321stainless steels [14]. The damage parameter in their study is defined as the percentage of thecracked grain boundary length in the total boundary length in the area of measurement. Thedamage parameter for the unaged material increases sharply at low creep strains and then veryslowly at higher strains with increasing creep strain. On the other hand, the relationshipbetween creep damage and strain for the aged material is nearly linear. Taking account ofthese, we modified the expression to
3
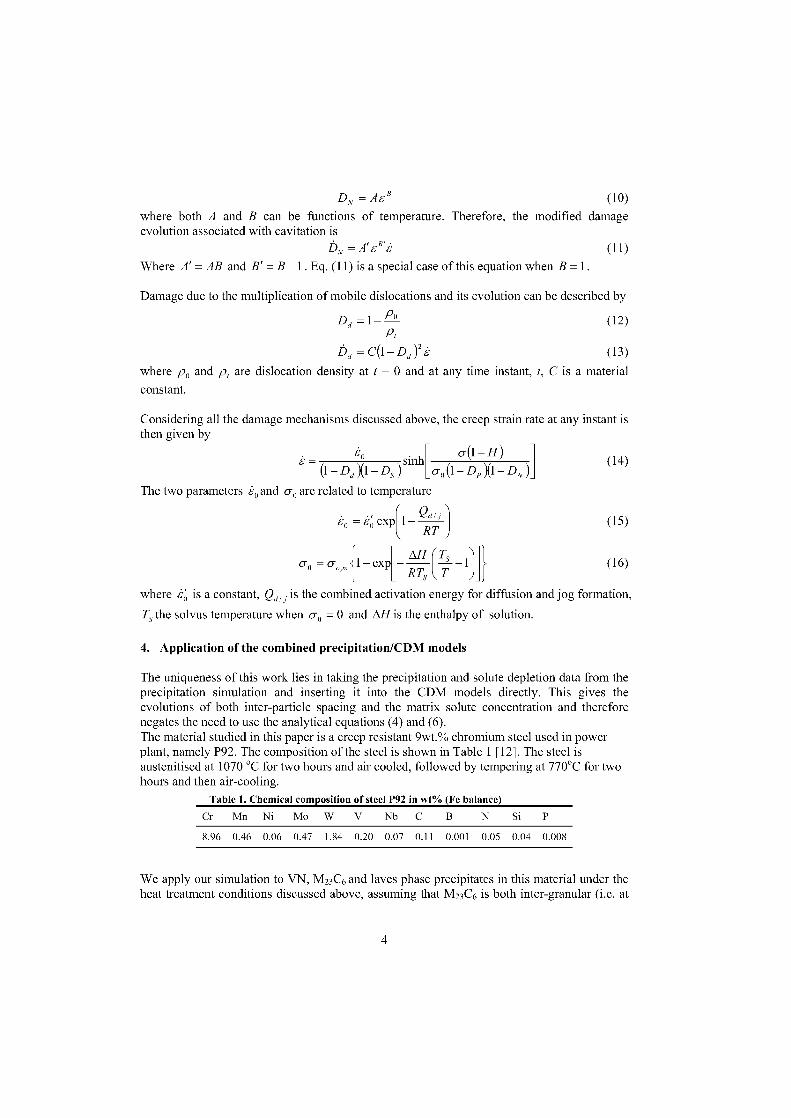
D, = AE R (10)
where both A and B can be functions of temperature. Therefore, the modified damageevolution associated with cavitation is
DN = A' E R E (11)
Where A' = AB and B' = B –1 . Eq. (11) is a special case of this equation when B = 1.
Damage due to the multiplication of mobile dislocations and its evolution can be described by
D = 1– f=' ' (12)Pt
Dd = C(1 – Dd (13)
where p0 and p, are dislocation density at t = 0 and at any time instant, t, C is a material
constant.
Considering all the damage mechanisms discussed above, the creep strain rate at any instant isthen given by
Z• –4 o-(1 H )
(14),1 – Dd X1–Ds
,)sinh
o-, (1– D,X1–D,)
The two parameters 4 and uo are related to temperature
4 = e p Qd11 (15)
RT
ao = – expAH ( Ts
1 (16)RT
where so is a constant, Qdi j is the combined activation energy for diffusion and jog formation,
T the solvus temperature when a 0 = 0 and AH is the enthalpy of solution.
4. Application of the combined precipitation/CDM models
The uniqueness of this work lies in taking the precipitation and solute depletion data from theprecipitation simulation and inserting it into the CDM models directly. This gives theevolutions of both inter-particle spacing and the matrix solute concentration and thereforenegates the need to use the analytical equations (4) and (6).The material studied in this paper is a creep resistant 9wt.% chromium steel used in powerplant, namely P92. The composition of the steel is shown in Table 1 [12]. The steel isaustenitised at 1070 °C for two hours and air cooled, followed by tempering at 770°C for twohours and then air-cooling.
Table 1. Chemical composition of steel P92 in wt% (Fe balance)
Cr Mn Ni Mo W V Nb C B N Si P
8.96 0.46 0.06 0.47 1.84 0.20 0.07 0.11 0.001 0.05 0.04 0.008
We apply our simulation to VN, M23C6 and laves phase precipitates in this material under theheat treatment conditions discussed above, assuming that M23C6 is both inter-granular (i.e. at
4
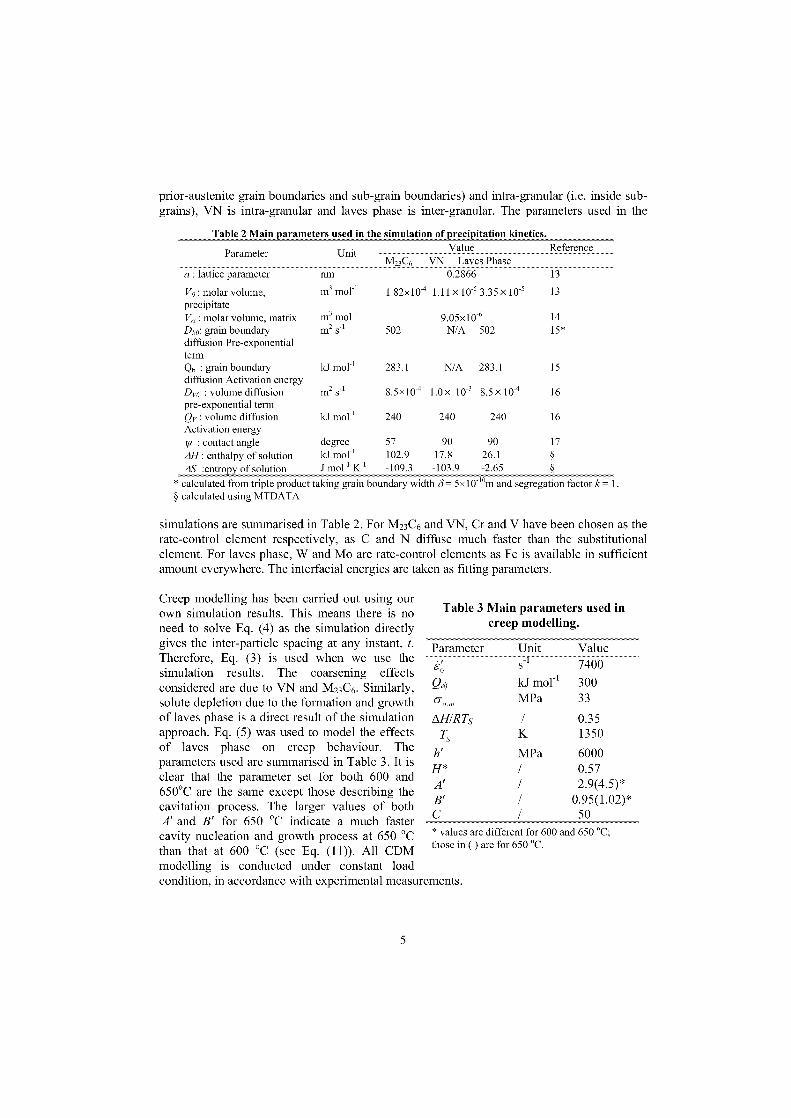
prior-austenite grain boundaries and sub-grain boundaries) and intra-granular (i.e. inside sub-grains), VN is intra-granular and laves phase is inter-granular. The parameters used in the
Table 2 Main • arameters used in the simulation of • reci itation kinetics.ValueParameter Unit Reference
M•:C„ VN I.aves Phase0.2866 13
1.82x10⁻⁴ 1.11x 10⁻⁵ 3.35 x 10⁻⁵ 13
9.05x10⁻⁶ 14502 N/A 502 15*
283.1 N/A 283.1 15
8.5x10⁻⁴ 1.0 x 10⁻³ 8.5 x 10⁻⁴ 16
240 240 240 16
57 90 90 17102.9 17.8 26.1 §-109.3 -103.9 -2.65 §
a : lattice parameter
Vo: molar volume, 111 molprecipitateV„, : molar volume, matrix m3mori
grain boundary m2 s-1
diffusion Pre-exponentialtermQh : grain boundary kJ mor idiffusion Activation energyDvo : volume diffusion m2 s-1
pre-exponential termQv: volume diffusion kJ mo1-1Activation energytif : contact angle degreeAH : enthalpy of solution kJ mor iAS :entro of solution J mor i K-1
* calculated f om triple product taking grain boundary width 8= 5x10⁻¹⁰m and Segregation facto k = 1.§ calculated using MTDATA
simulations are summarised in Table 2. For M23C6 and VN, Cr and V have been chosen as therate-control element respectively, as C and N diffuse much faster than the substitutionalelement. For laves phase, W and Mo are rate-control elements as Fe is available in sufficientamount everywhere. The interfacial energies are taken as fitting parameters.
Creep modelling has been carried out using ourown simulation results. This means there is noneed to solve Eq. (4) as the simulation directlygives the inter-particle spacing at any instant, t.Therefore, Eq. (3) is used when we use thesimulation results. The coarsening effectsconsidered are due to VN and M23C6. Similarly,solute depletion due to the formation and growthof laves phase is a direct result of the simulationapproach. Eq. (5) was used to model the effectsof laves phase an creep behaviour. Theparameters used are summarised in Table 3. It isclear that the parameter set for both 600 and650°C are the same except those describing thecavitation process. The larger values of bothA' and B' for 650 °C indicate a much faster
Table 3 Main parameters used increep modelling.
Parameter
Unit
Value
so
s t
7400
Qdj kJ mo1-1 300
0 0, MPa
33
AH/RTs l 0.35
Ts K 1350
h' MPa 6000H* 0.57A' 2.9(4.5)*B' 0.95(1.02)*C / 50
cavity nucleation and growth process at 650 °C * values are different for 600 and 650 °C;
than that at 600 °C (see Eq. (11)). All CDM those in ( )are for 650 °C.
modelling is conducted under constant loadcondition, in accordance with experimental measurements.
5
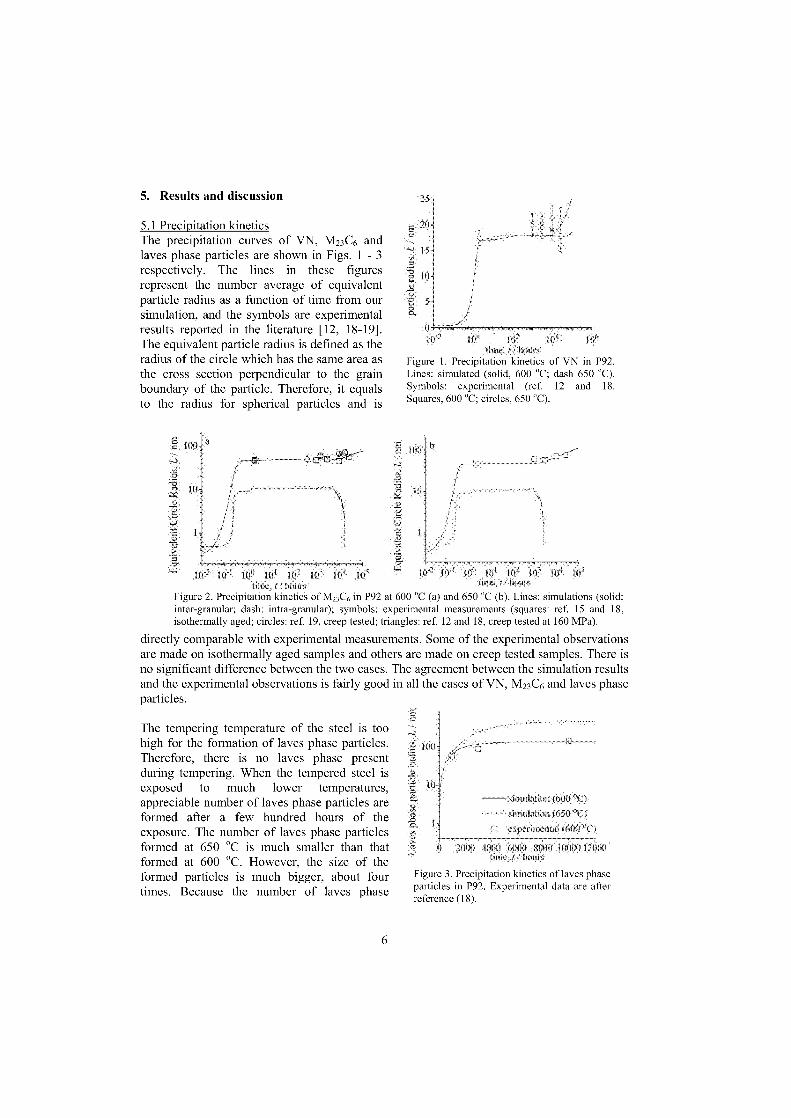
inni) I (if X g) 1201)0
Figure 3. Precipitation kinetics of laves phaseparticles in P92. Experimental data are afterreference (18).
5. Results and discussion
5.1 Precipitation kinetics The precipitation curves of VN, M23C6 andlaves phase particles are shown in Figs. 1 - 3respectively. The lines in these figuresrepresent the number average of equivalentparticle radius as a function of time from oursimulation, and the symbols are experimentalresults reported in the literature [12, 18-19].The equivalent particle radius is defined as theradius of the circle which has the same area asthe cross section perpendicular to the grainboundary of the particle. Therefore, it equalsto the radius for spherical particles and is
r ' r hoursFigure 1. Precipitation kinetics of VN in P92.Lines: simulated (solid, 600 °C; dash 650 °C).Symbols: experimental (ref. 12 and 18.Squares, 600 °C; circles, 650 °C).
10' e 1D 1 10: Ir` ■tr' l0 1 Io•1.,lu
time. hours s.Figure 2. Precipitation kinetics of M23C6 in P92 at 600 °C (a) and 650 °C (b). Lines: simulations (solid:inter-granular; dash: intra-granular); symbols: experimental measurements (squares: ref. 15 and 18,isothermally aged; circles: ref. 19, creep tested; triangles: ref. 12 and 18, creep tested at 160 MPa).
directly comparable with experimental measurements. Some of the experimental observationsare made on isothermally aged samples and others are made on creep tested samples. There isno significant difference between the two cases. The agreement between the simulation resultsand the experimental observations is fairly good in all the cases of VN, M23C6 and laves phaseparticles.
The tempering temperature of the steel is toohigh for the formation of laves phase particles.Therefore, there is no laves phase presentduring tempering. When the tempered steel isexposed to much lower temperatures,appreciable number of laves phase particles areformed after a few hundred hours of theexposure. The number of laves phase particlesformed at 650 is much smaller than thatformed at 600 °C. However, the size of theformed particles is much bigger, about fourtimes. Because the number of laves phase
6
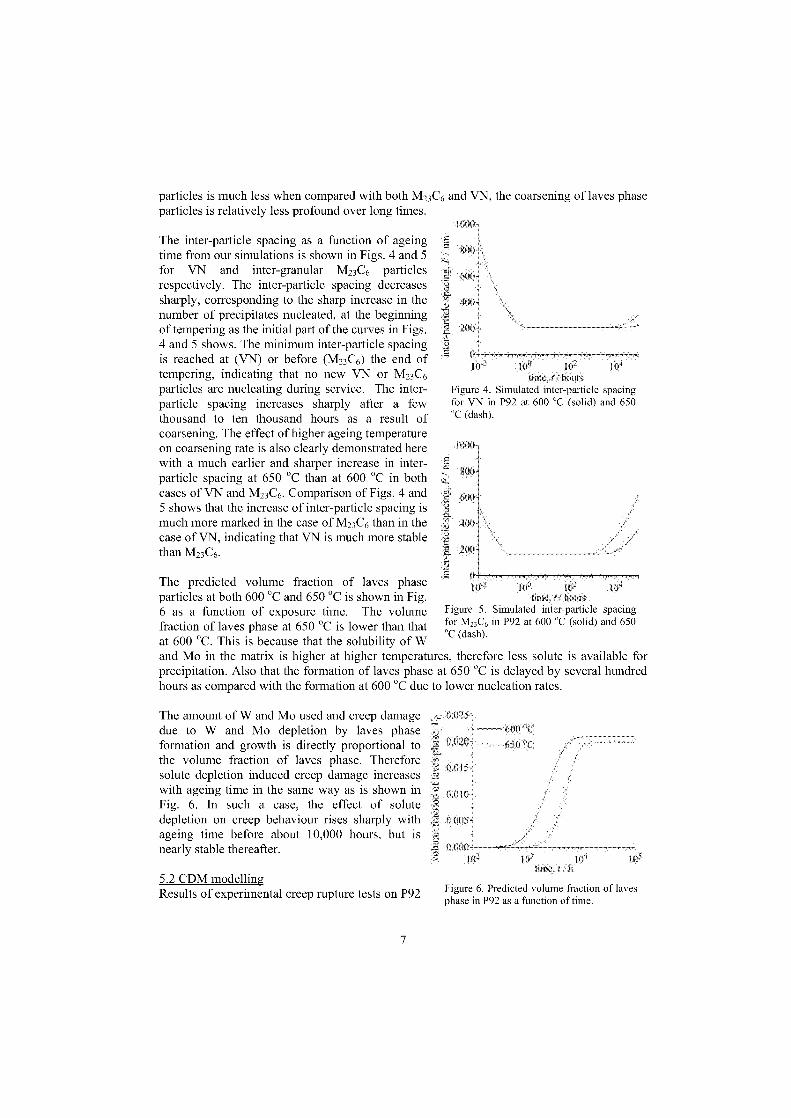
i10'2
lim.:. 1 hoursFigure 4. Simulated inter-particle spacingfor VN in P92 at 600 °C (solid) and 650
(dash).
particles is much less when compared with both M23C6 and VN, the coarsening of laves phaseparticles is relatively less profound over long times.
The inter-particle spacing as a function of ageingtime from our simulations is shown in Figs. 4 and 5for VN and inter-granular M23C6 particlesrespectively. The inter-particle spacing decreasessharply, corresponding to the sharp increase in thenumber of precipitates nucleated, at the beginningof tempering as the initial part of the curves in Figs.4 and 5 shows. The minimum inter-particle spacingis reached at (VN) or before (M23C6) the end oftempering, indicating that no new VN or M23C6particles are nucleating during service. The inter-particle spacing increases sharply after a fewthousand to ten thousand hours as a result ofcoarsening. The effect of higher ageing temperatureon coarsening rate is also clearly demonstrated herewith a much earlier and sharper increase in inter-particle spacing at 650 than at 600 °C in bothcases of VN and M23C6. Comparison of Figs. 4 and5 shows that the increase of inter-particle spacing ismuch more marked in the case of M23C6 than in thecase of VN, indicating that VN is much more stablethan M23C6.
The predicted volume fraction of laves phaseparticles at both 600 °C and 650 °C is shown in Fig.6 as a function of exposure time. The volume Figure 5. Simulated inter-particle spacing
°Cfraction of laves phase at 650 is lower than that for M23C6 in P92 at 600 (solid) and 650
at 600 °C. This is because that the solubility of W "C (dash).
and Mo in the matrix is higher at higher temperatures, therefore less solute is available forprecipitation. Also that the formation of laves phase at 650 is delayed by several hundredhours as compared with the formation at 600 °C due to lower nucleation raten.
The amount of W and Mo used and creep damagedue to W and Mo depletion by laves phaseformation and growth is directly proportional tothe volume fraction of laves phase. Thereforesolute depletion induced creep damage increaseswith ageing time in the same way as is shown inFig. 6. In such a case, the effect of solutedepletion on creep behaviour rises sharply withageing time before about 10,000 hours, but isnearly stable thereafter.
5.2 CDM modellingResults of experimental creep rupture tests on P92 Figure 6. Predicted volume fraction of laves
phase in P92 as a function of time.
7
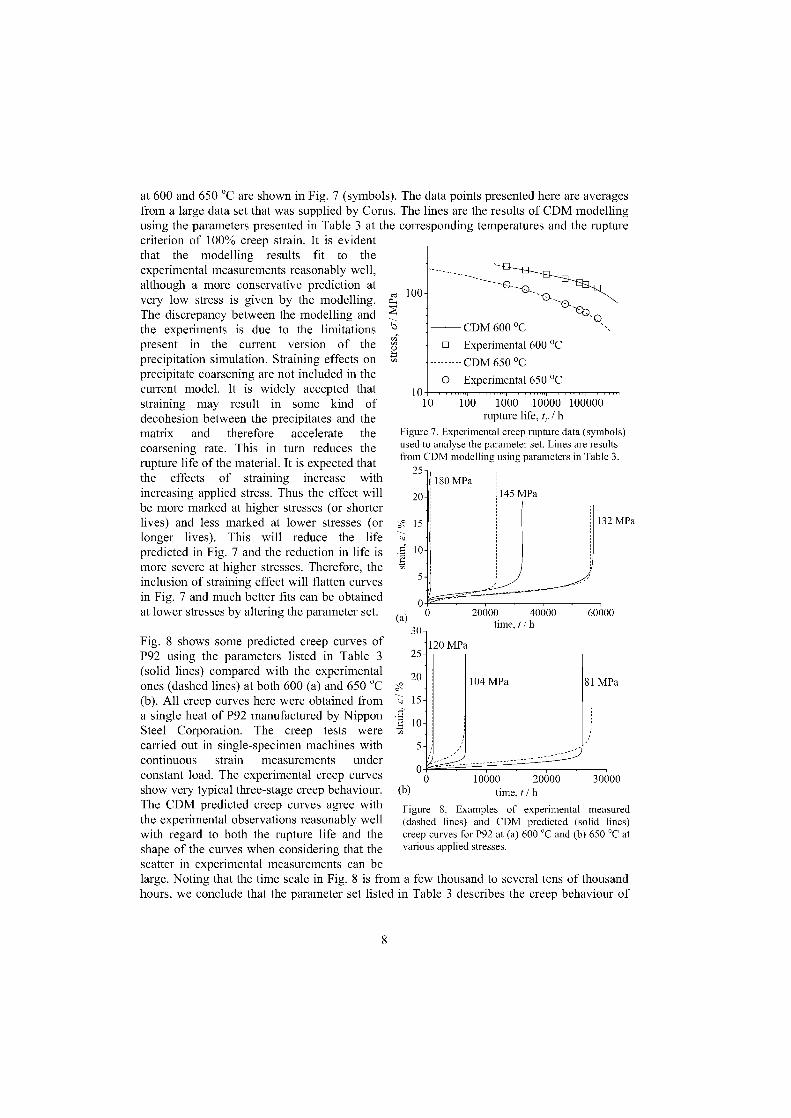
at 600 and 650 are shown in Fig. 7 (symbols). The data points presented here are averagesfrom a large data set that was supplied by Corus. The lines are the results of CDM modellingusing the parameters presented in Table 3 at the corresponding temperatures and the rupturecriterion of 100% creep strain. It is evidentthat the modelling results fit to theexperimental measurements reasonably well,although a more conservative prediction at
-very low stress is given by the modelling. c
d 100
The discrepancy between the modelling andthe experiments is due to the limitationspresent in the current version of the qprecipitation Simulation. Straining effects anprecipitate coarsening are not included in thecurrent model. It is widely accepted that 10straining may result in some kind ofdecohesion between the precipitates and thematrix and therefore accelerate the Figure 7. Experimental creep rupture data (symbols)
coarsening rate. This in turn reduces the used to analyse the parameter set. Lines are resultsCDM modelling using parameters in Table 3.
rupture life of the material. It is expected that from
25-the effects of straining increase with 180 MPaincreasing applied stress. Thus the effect will 20- 145 MPabe more marked at higher stresses (or shorterlives) and less marked at lower stresses (or 15-longer lives). This will reduce the lifepredicted in Fig. 7 and the reduction in life is .5 10-
more severe at higher stresses. Therefore, theinclusion of straining effect will flatten curves 5
in Fig. 7 and much better fits can be obtainedat lower stresses by altering the parameter set.
0
CDM 600 °C
Experimental 600 °C
CDM 650 °C
Experimental 650 °C
10 100 1000 10000 100000rupture life, / h
132 MPa
60000
30-Fig. 8 Shows some predicted creep curves ofP92 using the parameters listed in Table 3 25-
(solid lines) compared with the experimental 20-ones (dashed lines) at both 600 (a) and 650 °C(b). All creep curves here were obtained from 'Z) 15-a single heat of P92 manufactured by Nippon
-g 10-Steel Corporation. The creep tests werecarried out in single-specimen machines with 5 -continuou s strain measurements underconstant load. The experimental creep curves 0
show very typical three-stage creep behaviour. (b)
104 MPa
---- -------
10000 20000time, t / h
30000
The CDM predicted creep curves agree with Figure 8. Examples of experimental measuredthe experimental observations reasonably well (dashed lines) and CDM predicted (solid lines)with regard to both the rupture life and the creep curves for P92 at (a) 600 °C and (b) 650 °C at
shape of the curves when considering that the various applied stresses.
scatter in experimental measurements can belarge. Noting that the time scale in Fig. 8 is from a few thousand to several tens of thousandhours, we conclude that the parameter set listed in Table 3 describes the creep behaviour of
8
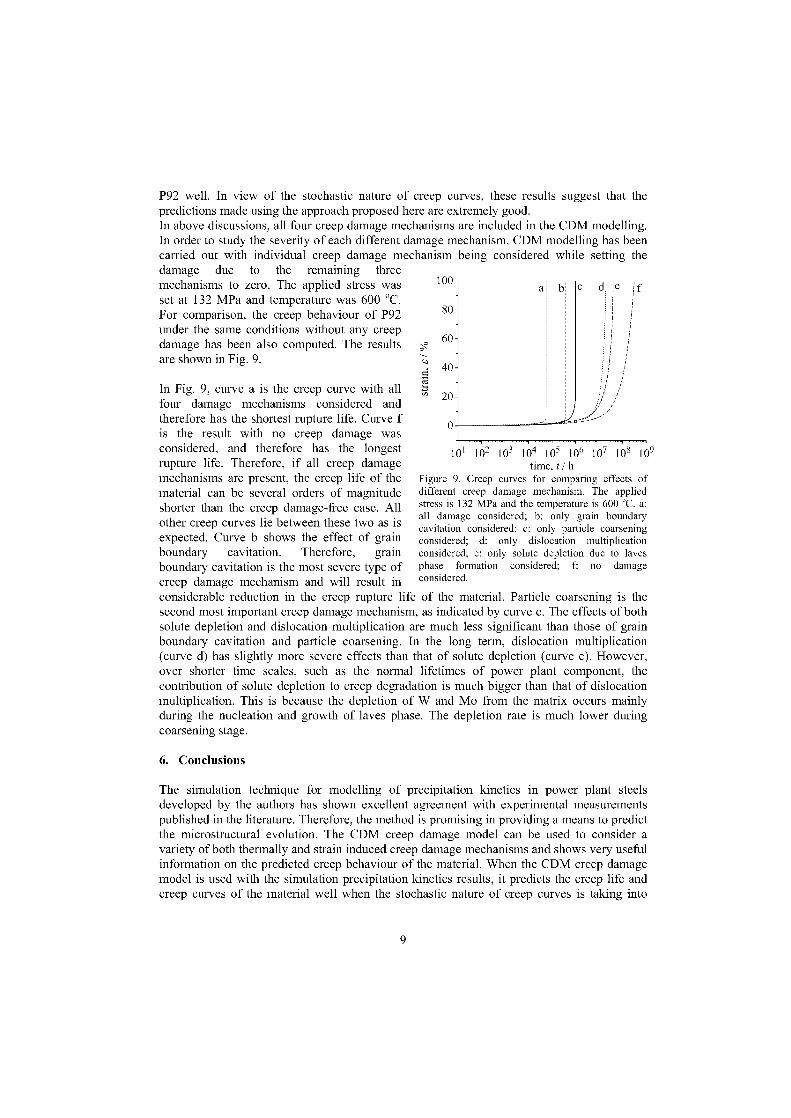
100-a b c
80-
60-
40-
20-
0
101 102 10 3 104 105 106 107 108 109time, t / h
Figure 9. Creep curves for comparing effects ofdifferent creep damage mechanism. The appliedstress is 132 MPa and the temperature is 600 °C. a:all damage considered; b: only grain boundarycavitation considered; c: only particle coarseningconsidered; d: only dislocation multiplicationconsidered; e: only solute depletion due to lavesphase formation considered; f: no damageconsidered.
P92 well. In view of the stochastic nature of creep curves, these results suggest that thepredictions made using the approach proposed here are extremely good.In above discussions, all four creep damage mechanisms are included in the CDM modelling.In order to study the severity of each different damage mechanism, CDM modelling has beencarried out with individual creep damage mechanism being considered while setting thedamage due to the remaining threemechanisms to zero. The applied stress wasset at 132 MPa and temperature was 600 °C.For comparison, the creep behaviour of P92under the same conditions without any creepdamage has been also computed. The resultsare shown in Fig. 9.
In Fig. 9, curve a is the creep curve with allfour damage mechanisms considered andtherefore has the shortest rupture life. Curve fis the result with no creep damage wasconsidered, and therefore has the longestrupture life. Therefore, if all creep damagemechanisms are present, the creep life of thematerial can be several orders of magnitudeshorter than the creep damage-free case. Allother creep curves lie between these two as isexpected. Curve b shows the effect of grainboundary cavitation. Therefore, grainboundary cavitation is the most severe type ofcreep damage mechanism and will result inconsiderable reduction in the creep rupture life of the material. Particle coarsening is thesecond most important creep damage mechanism, as indicated by curve c. The effects of bothsolute depletion and dislocation multiplication are much less significant than those of grainboundary cavitation and particle coarsening. In the Jong term, dislocation multiplication(curve d) has slightly more severe effects than that of solute depletion (curve e). However,over shorter time scales, such as the normal lifetimes of power plant component, thecontribution of solute depletion to creep degradation is much bigger than that of dislocationmultiplication. This is because the depletion of W and Mo from the matrix occurs mainlyduring the nucleation and growth of laves phase. The depletion rate is much lower duringcoarsening stage.
6. Conclusions
The simulation technique for modelling of precipitation kinetics in power plant steelsdeveloped by the authors has shown excellent agreement with experimental measurementspublished in the literature. Therefore, the method is promising in providing a means to predictthe microstructural evolution. The CDM creep damage model can be used to consider avariety of both thermally and strain induced creep damage mechanisms and shows very usefulinformation an the predicted creep behaviour of the material. When the CDM creep damagemodel is used with the simulation precipitation kinetics results, it predicts the creep life andcreep curves of the material well when the stochastic nature of creep curves is taking into
9
consideration. This kind of approach can also be used to provide useful information for alloydesigners on the effects on creep of using different compositions.Acknowledgements
We would like to thank the Engineering and Physical Science Research Council (EPSRC) forfunding the project (grant number GRN 13074, GRS 77523) and Powergen and Innogy, UKfor co-funding. The authors also acknowledge the financial support from The Department ofTrade and Industry (DTI) of UK (Grant 409). We are also grateful to Mr Philip Clarke ofCorus for supplying the experimental data of creep rupture life of P92 (Figure 7) and Mr PhilEnnis of Institute for Materials and Processes in Energy Systems, Jülich, Germany for supplyingthe experimental data of the creep curves (Figure 8).
References
1. B. J. Cane, and P. F. Aplin, Journal of Strain Analysis for Engineering Design, 1994,29(3), 225-232.
2. R. W. Evans, Proceedings of the Royal Society of London Series A- MathematicalPhysical and Engineering Sciences, 2000, 456(1996), 835-868.
3. B. Dyson, Journal of Pressure Kessel Technology, 2000, 122(3), 281-296.4. Y. F. Yin and R. G. Faulkner, Materials Science and Technology, 2003, 19, 91-98.5. Y. F. Yin and R. G. Faulkner, Power Technology, J. Lecomte-Beckers et. al. (eds.), 2002,
19(II), 1247-1256.6. J. D. Robson, H. K. D. H. Bhadeshia, Materials Science and Technology, 1997, 13(8),
631-639.7. Y. F. Yin and R. G. Faulkner, Materials Science and Engineering A, 2003, 344, 92-102.8. G. Ghosh, and G. B. Olson, Metallurgical and Materials Transactions A, 2001, 32(3),
455-467.9. R. G. Faulkner, International Materials Reviews, 1996, 41(5), 198-208.10. M. A. Khaleel, H. M. Zbibb, and E. A. Nyberg, International Journal of Plasticity, 2001,
17, 277-296.11. M. Chabaud-Reytier, L. Allais, D. Poquillon, C. Cäes-Hogrel, M. Mottot, and A. Pineau,
Materials at High Temperatures, 2001, 18(2), 71-80.12. A. Gustafson, and M. Hättestrand, Materials Science and Engineering A, 2002, 333(1-2),
279.13. W. B. Pearson, A handbook of Lattice Spacings and structures of metals and alloys,
Pergamon Press, London 1958.14. E. A. Brandes and G. B. Brook, Smithells Metals Reference Book, Butterworth-
Heinemann, Oxford, 1992.15. Zs. Tökei, K. Hennesen, H. Viefhaus and H. J. Grabke, Materials Science and Technology,
2000, 16, 1129-1138.16. T. Gladman, in Microstructural Stability of Creep Resistant Alloys for High Temperature
Plant Applications (ed. Strang, A. et al.), IOM, 1998, 49.17. R. A. Carolan, and R. G. Faulkner, Acta Metall. 1988, 36(2), 257.18. M. Hattestrand, and H. 0. Andren, ACTA MATERIALIA, 2001, 49 (12), 2123-2128.19. P. J. Ennis et al., 'Quantitative Comparison of the Microstructures of High Chromium
Steels for Advanced Power Stations', Microstructural Stability of Creep Resistant Alloysfor High Temperature Plant Applications, Strang, A. et al.(eds.), IOM, 1998, 135-143.
10
AN EFFECTIVE PARAMETRIC STRAIN MODEL FOR CREEP
Stefan Holmström(1) , Pertti Auerkari (1) , Stuart Holdsworth (2)
1) VTT Technical Research Centre of FinlandP.O.Box 1000
FI-02044 VTT, [email protected]
2) EMPA, Materials Science & TechnologyÜberlandstrasse 129
CH-8600 Dübendorf, Switzerland
Abstract
Within the European Creep Collaborative Committee (ECCC), the effectiveness of numerous creep strain modelshas been reviewed, ranging from simple-phenomenological to complex-constitutive models fitted to large sets ofuniaxial creep data. In this paper, a parametric model called MHG (Manson-Haferd-Grounes) is considered andcompared in terms of performance with other models, when applied to two steels, 10CrMo9-10 (P22) andXIOCrMoVNb9-1 (P91). The MHG model has the ability to describe the deformation characteristics in primary,secondary and tertiary creep. The model performed better than many more complex models and the fittingeffectiveness was very good for both steels. The recommended procedure to apply the MHG model requires pre-assessment in the form of investigating the general quality of the creep curves. In case of multi-heat data, heat-specific fitting to the raw data should be performed with intermediate evaluation of the fitting efficiency. In thecase of inhomogeneous creep data, a balanced intermediate data set can be constructed by extracting stress-temperature-time values for selected strains using heat-specific MHG equations. This intermediate data is then re-fitted to produce the final master equation. For well-behaving single heat data this iteration step is not needed. Inits simplest form the MHG model can per form well with only four fitting constants in the master curve (MHG-4).More complex MHG models with more fitting constants can naturally provide even better fits but with potentialdisadvantages in model robustness and extrapolation. A low number of required fitting constants for the MHG-4implies robustness of the master curves, which also showed good applicability for the whole strain range ofuniaxial creep tests, including time to rupture.
Keywords: creep, strain, model, ferritic steel
Introduction
Creep strain is typically addressed in materials standards only to fixed limits such as rupture or1% strain. However, analysis of component behaviour beyond simple design code treatmentwill require more detailed strain descriptions for transferring the uniaxial creep properties tomulti-axial behavior. For this purpose, the uniaxial creep curves need to be evaluated for creepstrain modeling. Such modeling is also of interest for extrapolation from shorter term test datato longer term component lifetimes, both for design and later life assessment purposes.
To predict the time to a given creep strain, or stress to reach a given creep strain at somecombination of time and temperature, several approaches have been used for selecting the creepmodels and fitting the available creep test data [1-6].
One of the more simple approaches is to apply time-temperature parameters (TTP), widely usedfor predicting the time to creep rupture, extended to describe the time to given creep strain. This
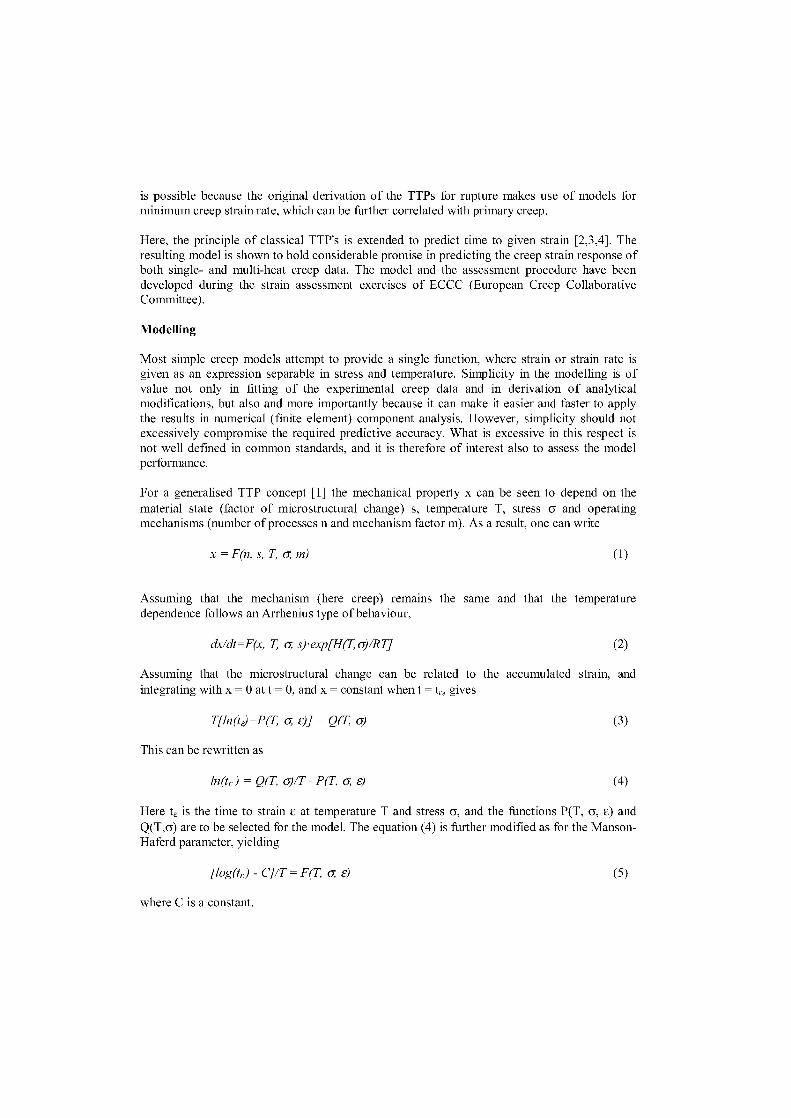
is possible because the original derivation of the TTPs for rupture makes use of models forminimum creep strain rate, which can be further correlated with primary creep.
Here, the principle of classical TTP's is extended to predict time to given strain [2,3,4]. Theresulting model is shown to hold considerable promise in predicting the creep strain response ofboth single- and multi-heat creep data. The model and the assessment procedure have beendeveloped during the strain assessment exercises of ECCC (European Creep CollaborativeCommittee).
Modelling
Most simple creep models attempt to provide a single function, where strain or strain rate isgiven as an expression reparable in stress and temperature. Simplicity in the modelling is ofvalue not only in fitting of the experimental creep data and in derivation of analyticalmodifications, but also and more importantly because it can make it easier and faster to applythe results in numerical (finite element) component analysis. However, simplicity should notexcessively compromise the required predictive accuracy. What is excessive in this respect isnot well defined in common standards, and it is therefore of interest also to assess the modelperformance.
For a generalised TTP concept [1] the mechanical property x can be seen to depend an thematerial state (factor of microstructural change) s, temperature T, stress a and operatingmechanisms (number of processes n and mechanism factor m). As a result, one can write
x = F(n, s, T, m) (1)
Assuming that the mechanism (here creep) remains the same and that the temperaturedependence follows an Arrhenius type of behaviour,
dx/dt=F(x, T, 6 s)•exp[H(T,a)/RT] (2)
Assuming that the microstructural change can be related to the accumulated strain, andintegrating with x 0 at t 0, and x = constant when t = gives
Tfin(td+P(T, 6 )] = Q(T, a)
(3)
This can be rewritten as
ln(tE ) = Q(T, ("VT - P(T, c e)
(4)
Here 4 is the time to strain e at temperature T and stress a, and the functions P(T, E) andQ(T,a) are to be selected for the model. The equation (4) is further modified as for the Manson-Haferd parameter, yielding
flog(t,) - CJ/T = F(T, 6 e)
(5)
where C is a constant.
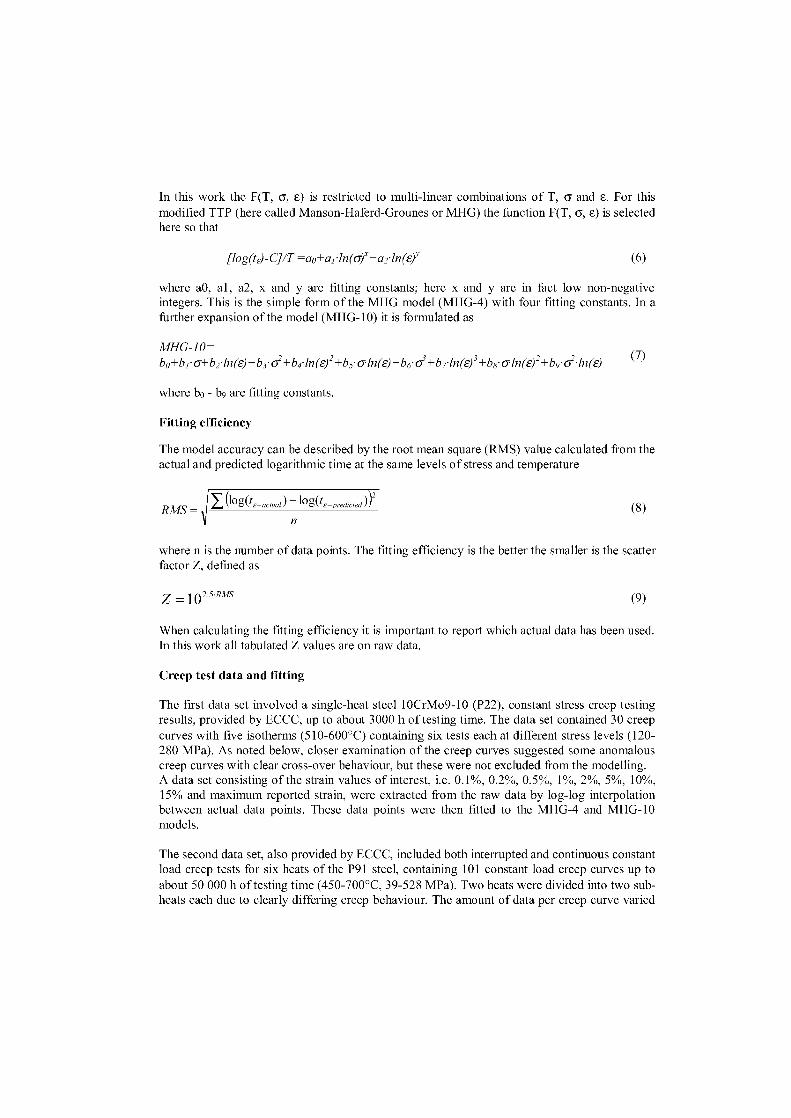
In this work the F(T, a, e) is restricted to multi-linear combinations of T, c and e. For thismodified TTP (here called Manson-Haferd-Grounes or MHG) the function F(T, e) is selectedhere so that
Ilog(td-CPT =a0 + arin(o) +a2 •1n(e)Y (6)
where a0, al, a2, x and y are fitting constants; here x and y are in fact low non-negativeintegers. This is the simple form of the MHG model (MHG-4) with four fitting constants. In afurther expansion of the model (MHG-10) it is formulated as
MHG-10=bo+bi.o-±b21n(e)+193.0-2+14.1n(e)2+65.o-ln(e)+196.o3+67.1n(e)3+14.o-ln(e)2+b9.ci21n(e)
where bo - b9 are fitting constants.
Fitting efficiency
The model accuracy can be described by the root mean square (RMS) value calculated from theactual and predicted logarithmic time at the same levels of stress and temperature
(7)
RMS –(log(tE_,,f„,) – log(t, , 1pre.ic ,)2
(8) n
where n is the number of data points. The fitting efficiency is the better the smaller is the scatterfactor Z, defined as
z 102.5.RMS(9)
When calculating the fitting efficiency it is important to report which actual data has been used.In this work all tabulated Z values are an raw data.
Creep test data and fitting
The first data set involved a single-heat steel 10CrMo9-10 (P22), constant stress creep testingresults, provided by ECCC, up to about 3000 h of testing time. The data set contained 30 creepcurves with five isotherms (510-600°C) containing six tests each at different stress levels (120-280 MPa). As noted below, closer examination of the creep curves suggested some anomalouscreep curves with clear Cross-over behaviour, but these were not excluded from the modelling.A data set consisting of the strain values of interest, i.e. 0.1%, 0.2%, 0.5%, 1%, 2%, 5%, 10%,15% and maximum reported strain, were extracted from the raw data by log-log interpolationbetween actual data points. These data points were then fitted to the MHG-4 and MHG-10modeln.
The second data set, also provided by ECCC, included both interrupted and continuous constantload creep tests for six heats of the P91 steel, containing 101 constant load creep curves up toabout 50 000 h of testing time (450-700°C, 39-528 MPa). Two heats were divided into two sub-heats each due to clearly differing creep behaviour. The amount of data per creep curve varied
widely between heats, suggesting that some balancing is required to avoid bias in the fitting dueto differences in the number of data points in each represented creep curve. First the data fromeach data heat batch with no data reduction were fitted to MHG-4 model. This resulted in poorfitting, with Z > 10 largely due to one heat with inconsistencies such as strain jumps andquestionable initial strain values. For all data excluding this heat, the combined Z = 4.18 usingindividual models for each sub-heat, and this Z-value was considered as a reference target for acombined master curve. To produce a balanced master curve for the whole data set, the initialmodels for each sub-heat were utilised for producing a new more balanced synthetic data set ofcreep curves at temperatures and stressec representative of sub-heat data, each curve consistingof the strain values of interest, i.e. 0.1%, 0.2%, 0.5%, 1%, 2%, 5%, 10%, 15%, however limitedto the maximum strain in the original data. The resulting synthetic creep curve data set was thenrefitted to the MHG model to provide the final master curve surface.
The data were fitted to the model of Eqs. (6) and (7) using iteratively usual standard fittingroutines of program Tablecurve 3D (Systat Software Inc.), supported by purpose-built functionsin Origin (OriginLab Corp.).
The fitting results were compared with parallel results obtained from the same data Sets usingother models tested within ECCC [1, 6].
Fitting results
The fitting constants for the MHG-4 model an the single heat P22 data are shown in Table 1,and the fitting results in Fig. 1 and 2. An intercomparison of the MHG model performance withother models, as tested in the ECCC excercise, is shown in Table 2.
Table 1. Fitting constants for MGH-4 of Eq. (6) /P22 data (x = y = 2)
Constant ao a1 az
Value -33.2 -0.95 -0.2 55.62
-2 4 5
ä data logt-MHG4— tp=ta.Z— tp=ta/Z— — tp=2.ta— — tp&h.ta tp=ta—Linear fit to MHG-4
•■•.111. ,1e1L.,iteeer,,, ‚et.
err'
•bee.,« e%.11444e."..4e4( sfss.s „eseeire,ssmee
e eeeee,NeeNot kl,b1
-55
-60
Q0
- 65
C.7
-70 2
- 75
Fig. 1. Single heat fit for P22 to all data from 0.2% strain to rupture (MHG-4 model)
Fig. 2. Fitted MHG-4 master curve surface for P22 steel (single heat data)
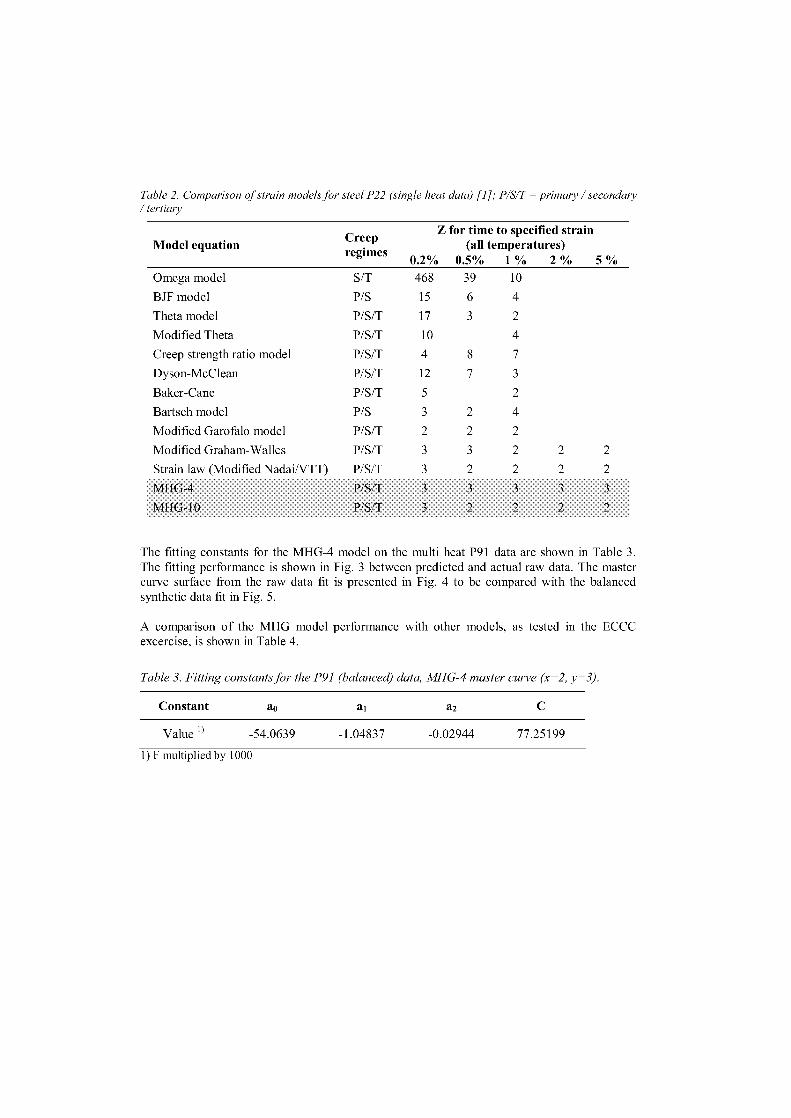
Table 2. Comparison of strain models for steel P22 (single heat data) [l] ; P/S/T = primary / secondan;/ tertiary
Model equationCreepregimes
Z for time to specified strain(all temperatures)
0.2% 0.5% 1 % 2 % 5 %Omega model S/T 468 39 10
BJF model P/S 15 6 4
Theta model P/S/T 17 3 2
Modified Theta P/S/T 10 4
Creep strength ratio model P/S/T 4 8 7
Dyson-McClean P/S/T 12 7 3
Baker-Cane P/S/T 5 2
Bartsch model P/S 3 2 4
Modified Garofalo model P/S/T 2 2 2
Modified Graham-Walles P/S/T 3 3 2 2 2
Strain law (Modified Nadai/VTT) P/S/T 3 2 2 2 2
MHG-4 P/S/T 3 3 3 3 3
MHG-10 P/S/T 3 2 2 2 2
The fitting constants for the MHG-4 model an the multi heat P91 data are shown in Table 3.The fitting performance is shown in Fig. 3 between predicted and actual raw data. The mastercurve surface from the raw data fit is presented in Fig. 4 to be compared with the balancedsynthetic data fit in Fig. 5.
A comparison of the MHG model performance with other models, as tested in the ECCCexcercise, is shown in Table 4.
Table 3. Fitting constants for the P91 (balanced) data, MHG-4 master curve (x=2, y=3).
Constant ao ai a2
Va1ue I)
-54.0639 -1.04837 -0.02944 77.25199
1) F multiplied by 1000
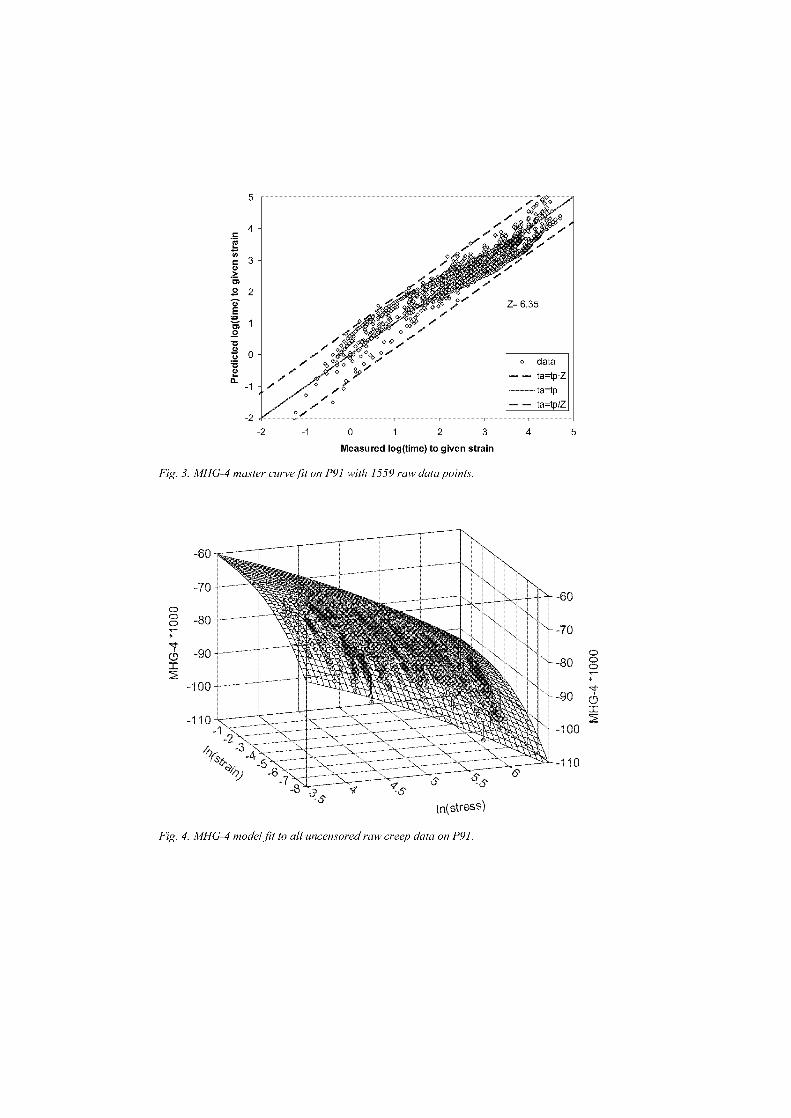
-2 54-1
Measured log(time) to given strain
Fig. 3. MHG-4 master curve fit on P91 with 1559 raw data points.
-60
-70
-80 0
-90 1-2
-100
-110
Fig. 4. MHG-4 model fit to all uncensored raw creep data on P91.
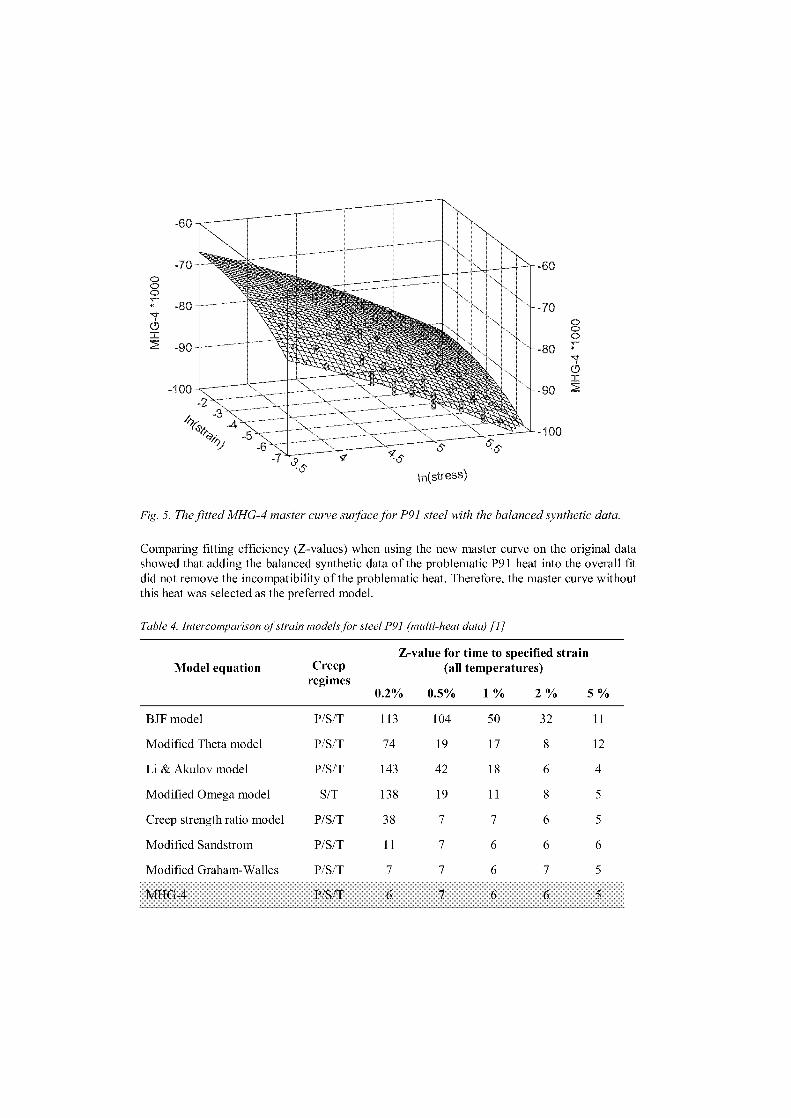
, ,.,.......„....st..........e....e.e....... -,
..„, ..,. .,.. ...,. . ..,.. ....,..,27"2:2:1;
,»..,,x,..14,......eee...,.... . .
-60
-70
-80
-90
-100
Fig. 5. The fitted MHG-4 master curve surface for P91 steel with the balanced synthetic data.
Comparing fitting efficiency (Z-values) when using the new master curve an the original datashowed that adding the balanced synthetic data of the problematic P91 heat into the overall fitdid not remove the incompatibility of the problematic heat. Therefore, the master curve withoutthis heat was selected as the preferred model.
Table 4. Intercomparison of strain models for steel P91 (multi -heat data) [1]
Model equation Creepregimes
Z-value for time to specified strain(all temperatures)
0.2% 0.5% 1% 2% 5%
BJF model P/S/T 113 104 50 32 11
Modified Theta model P/S/T 74 19 17 8 12
Li & Akulov model P/S/T 143 42 18 6 4
Modified Omega model S/T 138 19 11 8 5
Creep strength ratio model P/S/T 38 7 7 6 5
Modified Sandstrom P/S/T 11 7 6 6 6
Modified Graham-Walles P/S/T 7 7 6 7 5
MHG-4 P/S/T 6 7 6 6 5
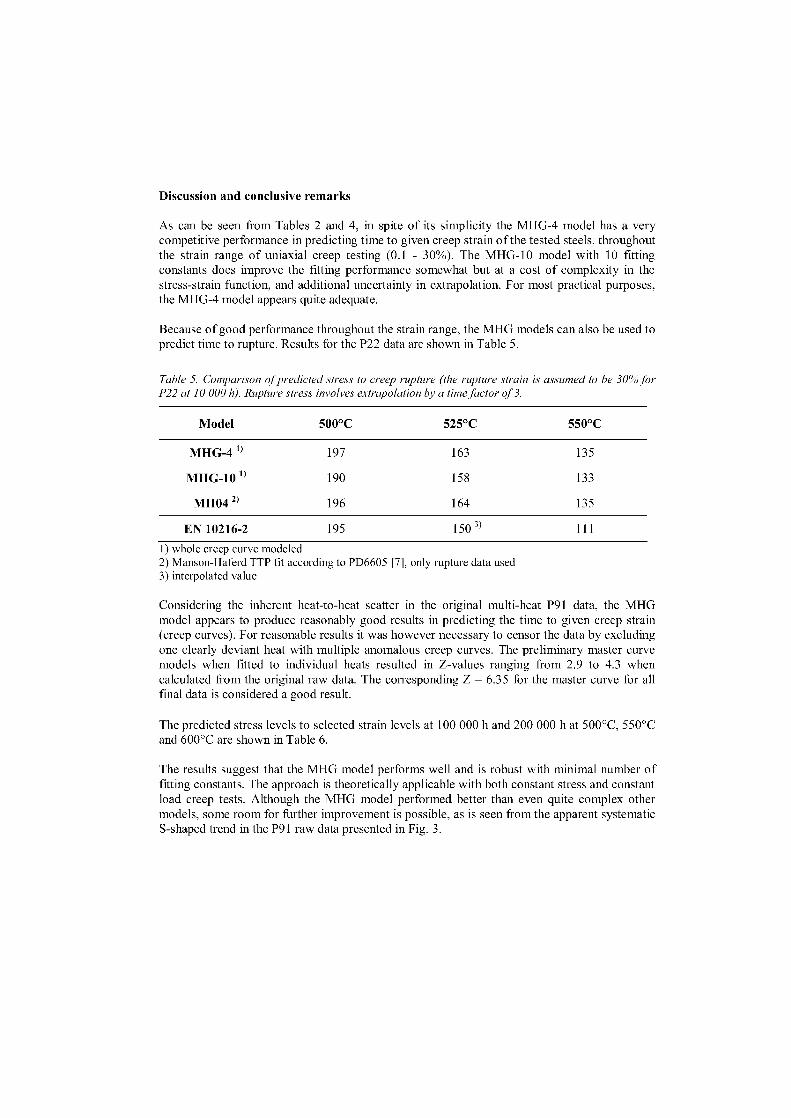
Discussion and conclusive remarks
As can be seen from Tables 2 and 4, in spite of its simplicity the MHG-4 model has a verycompetitive performance in predicting time to given creep strain of the tested steels. throughoutthe strain range of uniaxial creep testing (0.1 - 30%). The MHG-10 model with 10 fittingconstants does improve the fitting performance somewhat but at a cost of complexity in thestress-strain function, and additional uncertainty in extrapolation. For most practical purposes,the MHG-4 model appears quite adequate.
Because of good performance throughout the strain range, the MHG models can also be used topredict time to rupture. Results for the P22 data are shown in Table 5.
Table 5. Comparison of predicted stress to creep rupture (the rupture strain is assumed to be 30% forP22 at 10 000 h). Rupture stress involves extrapolation by a time factor of 3.
Model 500°C 525°C 550°C
MHG-4 1) 197 163 135
MHG-10 1) 190 158 133
MH04 2) 196 164 135
EN 10216-2 195 150 3) 111
1) whole creep curve modeled2) Manson-Haferd TTP fit according to PD6605 [7], only rupture data used3) interpolated value
Considering the inherent heat-to-heat scatter in the original multi-heat P91 data, the MHGmodel appears to produce reasonably good results in predicting the time to given creep strain(creep curves). For reasonable results it was however necessary to censor the data by excludingone clearly deviant heat with multiple anomalous creep curves. The preliminary master curvemodels when fitted to individual heats resulted in Z-values ranging from 2.9 to 4.3 whencalculated from the original raw data. The corresponding Z = 6.35 for the master curve for allfinal data is considered a good result.
The predicted stress levels to selected strain levels at 100 000 h and 200 000 h at 500°C, 550°Cand 600°C are shown in Table 6.
The results suggest that the MHG model performs well and is robust with minimal number offitting constants. The approach is theoretically applicable with both constant stress and constantload creep tests. Although the MHG model performed better than even quite complex othermodels, some room for further improvement is possible, as is seen from the apparent systematicS-shaped trend in the P91 raw data presented in Fig. 3.
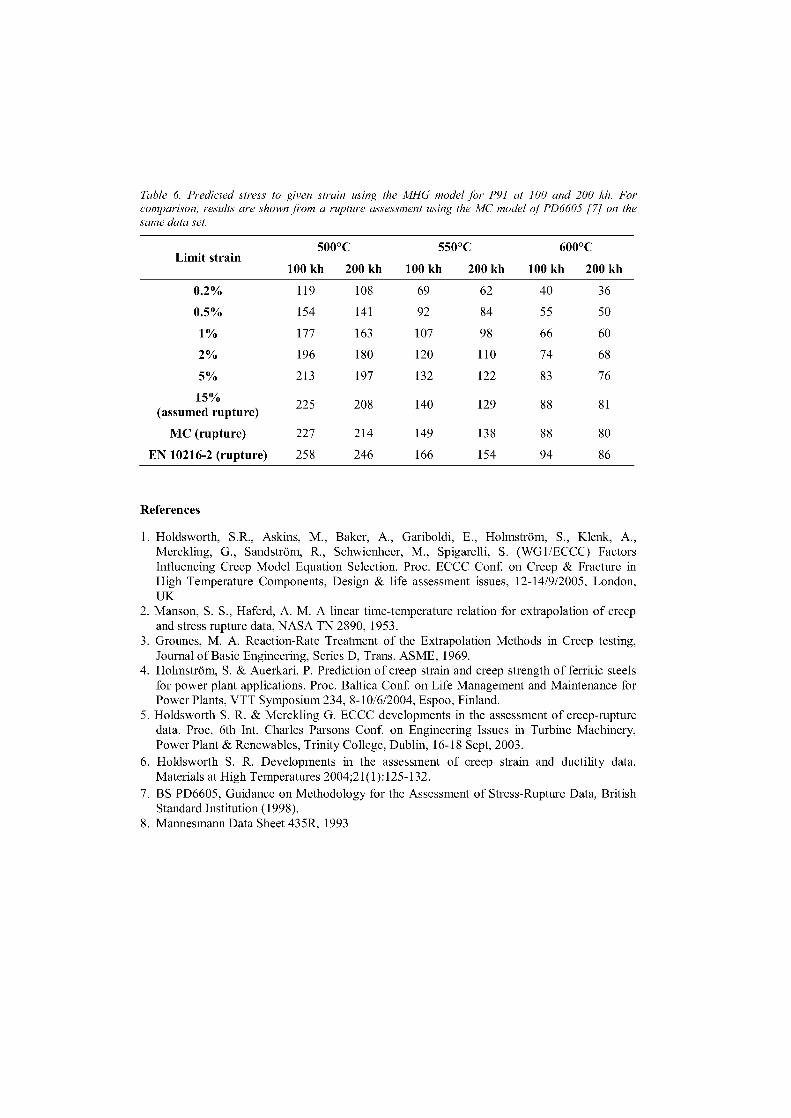
Table 6. Predicted stress to given strain using the MHG model for P91 at 100 and 200 kh. Forcomparison, results are shown from a rupture assessment using the MC model of PD6605 [7] on thesame data set.
Limit strain500°C
100 kh 200 kh
550°C
100 kh 200 kh
600°C
100 kh 200 kh
0.2% 119 108 69 62 40 36
0.5% 154 141 92 84 55 50
1% 177 163 107 98 66 60
2% 196 180 120 110 74 68
5% 213 197 132 122 83 76
15%(assumed rupture)
225 208 140 129 88 81
MC (rupture) 227 214 149 138 88 80
EN 10216-2 (rupture) 258 246 166 154 94 86
References
1. Holdsworth, S.R., Askins, M., Baker, A., Gariboldi, E., Holmström, S., Klenk, A.,Merckling, G., Sandström, R., Schwienheer, M., Spigarelli, S. (WG1/ECCC) FactorsInfluencing Creep Model Equation Selection. Proc. ECCC Conf. on Creep & Fracture inHigh Temperature Components, Design & life assessment issues, 12-14/9/2005, London,UK
2. Manson, S. S., Haferd, A. M. A linear time-temperature relation for extrapolation of creepand stress rupture data, NASA TN 2890, 1953.
3. Grounes, M. A. Reaction-Rate Treatment of the Extrapolation Methods in Creep testing,Journal of Basic Engineering, Series D, Trans. ASME, 1969.
4. Holmström, S. & Auerkari, P. Prediction of creep strain and creep strength of ferritic steelsfor power plant applications. Proc. Baltica Conf. on Life Management and Maintenance forPower Plants, VTT Symposium 234, 8-10/6/2004, Espoo, Finland.
5. Holdsworth S. R. & Merckling G. ECCC developments in the assessment of creep-rupturedata. Proc. 6th Int. Charles Parsons Conf. on Engineering Issues in Turbine Machinery,Power Plant & Renewables, Trinity College, Dublin, 16-18 Sept, 2003.
6. Holdsworth S. R. Developments in the assessment of creep strain and ductility data.Materials at High Temperatures 2004;21(1):125-132.
7. BS PD6605, Guidance on Methodology for the Assessment of Stress-Rupture Data, BritishStandard Institution (1998).
8. Mannesmann Data Sheet 435R, 1993
ADVANCED ALLOY DESIGN TOOLS APPLIEDTO THE DEVELOPMENT OF VANADIUM
NITRIDE STRENGTHENEDHIGH-TEMPERATURE STEELS
D. Gaude-Fugarolas l * V. Yardley" J-1\1. Lardon2J. Montagnon2Y. De Carlanl
1.- CEA SaclaySRMA/LA21\1 bät 453
91191 Gif Sur Yvette CEDEX (France)2.- Aubert et Duval
Parc Technologique La Pardieu 6 r Condorcet63063 Clermont Ferrand CEDEX 1 (France)3.- Now at Tohoku University (Japan)
AbstractThe modern power generation industry is constantly seeking to attain higher efficiency levels to
obtain betten environmental and economic performance. In order to achieve these goals, materialsare needed with sufficiently high creep resistance to withstand operation under more demandingconditions, particularly higher service temperatures. A new generation of Fe8-12Cr ferrito-martensiticsteels have the potential to become optimal candidates for various critical applications in the thermaland nuclear power generation and petrochemical industries.
One effective method of enhancing the creep resistance of an alloy is by producing a fine pre-cipitate distribution that minimises deformation at service temperatures. MX precipitates such asVN are especially suitable for this task, due to their morphology, homogeneous distribution and slowcoarsening (especially in comparison with 1\1 23 C6-type carbides). Moreover, VN is stable to highertemperatures than 1\1 23 Co, allowing an increase in the working temperature of the alloy.
An alloy with a high nitrogen content is not devoid of potential problems, and therefore carefuldesign of the alloy composition and heat treatments are needed. The occurrence of porosity relatedto high nitrogen content has been noted. The maximum nitrogen content (both in absolute termsand relative to other elements, e.g. V/N, V/C) needs to be optimised in order to obtain the bestpossible mechanical performance whilst minimising the risk of porosity after casting.
In the work described here, thermodynamic software packages based an the CALPHAD method,together with advanced statistical analysis using neural networks, were used to suggest optimumcompositions, microstructures and heat treatments to obtain improved creep properties in a new setof alloys for the nuclear power industry. The computational work was complemented by the use ofexperimental castings and characterisation of a selection of alloys of various compositions and witha wide range of nitrogen contents. This also enabled the development of a criterion to predict the
*Corr. Author: dgaudeOcantab.net Tel: +33 (0)1 69 08 22 69 Fax: +33 (0) 169 08 71 30
formation of nitrogen-induced porosity during casting; this should be useful both to research and tothe steel-making industry.
Keywords: Cr-Steel; Creep; VN Precipitation; Porosity; Neural Networks
Introduction
In order to satisfy more demanding efficiency requirements and to achieve better environmental andeconomic performance, the modern power generation industry requires a continuous process of improve-ment. New materials able to outperform present ones in safety, mechanical properties and service tem-perature are a continuous need in this process. In the past, the process of designing a new material wasmostly heuristic, requiring repeated experimental trial and error, but the accuracy of current scientificknowledge in thermodynamics and transformation kinetics enables us to design successful new allesusing minimal empirical feedback. The design process is, however, still somewhat iterative, each stageleading to a more refined definition of the final alloy. The differente from the traditional approach is thatmost of the process is performed theoretically or computationally, involving the production of only a fewessential trial Gasts to verify the suitability of the product material.
Design methodology and discussion
To illustrate the potential of modern materials design methods, a new family of alloys for the nuclearpower industry has been developed. Ferritic-martensitic steels are known to perform well as low-activationmaterials, duc to their low swelling under radiation and long service life at high temperatures [1]. AnFe8-12Cr ferritico-martensitic alloy was selected as the basis for this new type of alloy, duc to its goodbalance between mechanical properties and oxidation resistance [1, 2, 3]. A neural-network model basedon a largo database of creep properties of alloys used in high-temperature applications was then used tonarrow the range of suitable compositions. An alloy containing carbon, chromium, tungsten, vanadiumand nitrogen was chosen.
Creep damage involves several competing mechanisms, but under typical power plant conditions,the main mechanism consists of the easy glide of dislocations along slip planes, and the subsequent,thermally activated dislocation climb into a different slip plane when dislocations encounter an obstacle(for instance, an incoherent precipitate). Providing a fine distribution of precipitates that remain stableat service temperature is therefore a suitable strategy to improve the creep behaviour of an alloy [4].
The composition selected provides the possibility of reinforcing the microstructure with a nanometricdistribution of MX-precipitates. VN precipitates, for instance, are stable at higher temperatures thanother MX precipitates or M 23 C6 carbides, and are less prone to coarsening than M23 C6 [2, 5]. Calcula-tions of the stability of phases were performed using thermodynamic models based on the CALPHADmethod [6, 7]. When dealing with high nitrogen contents, there is a risk of developing a small amountof porosity in the material. Sometimes this kind of problem is not obvious at the first stages of theprocess of alloy design, but it clearly needs to be taken into account nonetheless. Obviously, there is ademand to find suitable criteria that could be applied in research and industrial environments to predictthe occurrence of such porosity. One such criterion for the occurrence of porosity in high-nitrogen alloysis presented in this work.
The optimal heat treatment to obtain the desired distribution of precipitates in a suitable microstruc-ture was determined using a thermodynamic and kinetic model based on the CALPHAD method and the
2
Onsager extremum principle [8, 9, 10]. The alloy designed in this way was cast at the Aubert et Duvalsteelworks and its properties are being characterised at CEA Saclay.
General composition
Many alloys for high temperature applications, especially in the power generation industry, are basedon the Fe8-12Cr system. This family of alloys presents a good compromise between mechanical properties(especially creep resistance) and oxidation resistance [1, 2, 3]. The optimal structures for high temperaturenuclear applications are the Body-centred cubic ferritic or martensitic phases, usually as a matrix with acomplex arrangement of reinforcing precipitates. Austenitic alloys lack the capability of ferritic alloys ofwithstanding the radiation damage, especially swelling [1, 2, 3].
A balance between ferrite-stabilising (or n-gen) elements and austenite-stabilising (or -y-gen) elementsnccds to be achieved in the alloy composition to avoid the formation of ö-fcrrite at the austcnitisationtemperature. This phase would produce brittleness in the final component, and unless the structure couldbe fully transformed into austenite, the subsequent transformation to martensite on quenching would beincomplete [3, 11].
Some alloying elements, such as Mo, Ni, Nb, Si, Mn, Co and B. which are commonly used to improvethe properties of steels for the conventional power generation industry and other high-temperature appli-cations, need to be reduced or even excluded entirely from alloys intended for use in the nuclear industrybecause of their behaviour under neutron irradiation. They are commonly substituted by \V, V and Tain alloys intended for operation under radiation [1, 2, 3].
Starting from the general criteria found in the literature, a first set of composition was defined,and dien a thermodynamic calculation software package was used to select the ones that would fitto the microstructure requirements imposed. The thermodynamic software packages MTDATA andThermocalc were used to perform this type of calculation on the thermodynamic stability of the phasesof interest [3, 11]. A general 'urige of possible compositions including the elements Fe, Cr. W. V. N, andC but with limited contcnts of Ni, Si. Mn and B was therefore selected following the above criteria.
At the same time, and in order to analyse the effect of small variations of each element on the creepresistance of the alloy (and the respective interactions), an advanced statistical method was used. aBayesian-based neural network [12. 13]. Cole et al. had trained a neural network describing the creepproperties of a wide range of steels [14]. This model is publicly available at the Materials AlgorithmsProject website [15]. Using this tool, the effect of variations in composition on the creep rupture strengthafter 100,000 hours was analysed and a well-defined composition was defined that would potentiallymaximise creep resistance.
In all figures showing the predictions obtained with the neural network model (Figures 1 to 6), thepredictions for each set of conditions are plotted in solid lines and surrounded by dashed lines representingthe errorbar or confidence estimate of the prediction [12. 13].
According to the predictions using the neural network trained by Cole et al. [14], for some elementsthere was an optimal composition range (represented by a maximum in the predicted creep rupturestrength at 10.000 hours). This was the case for Cr and W. elements for which the optimal contents werearound 9.5 wt.% (Figure 1) and 2 wt.% (Figure 3) respectively. In the rase of chromium, this value liesin the lower end of the range of compositions traditionally used for high-temperature applications, andtherefore it will be necessary to pay special attention to aspeets such as the corrosion resistance of thealloy. Tungsten is usually added to produce solid solution strengthening of the matrix, but it is also astrong a-gen element.
Carbon has a strong solid solution strengthening effect, and according to the neural network predic-tions (Figure 2), the creep rupture strength of the alloy increases monotonically with its carbon content.
3
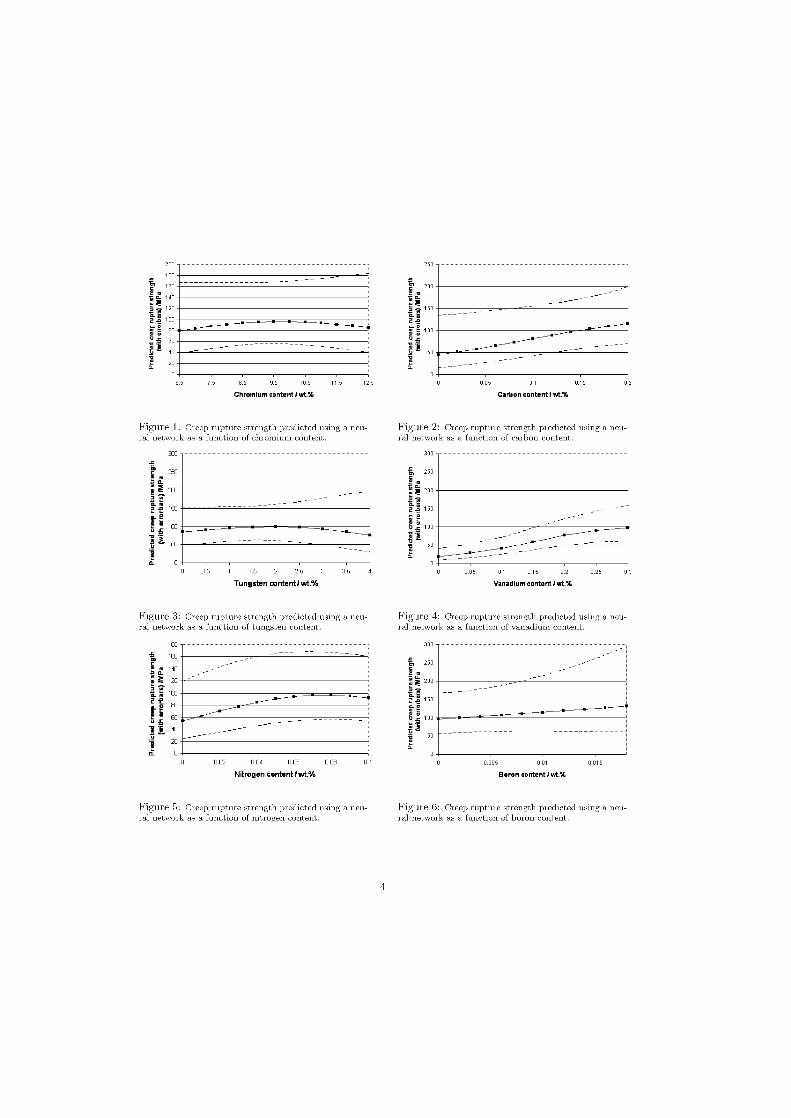
250200
180
▪ 160
140
11. 120
ä 100
200
e
100
50
'M 20
7.5 8.5 9.5 10.5 11.5 12.5 0.05 0.1 0.15
Chromium content t wt.% Carbon content 1 wt.%
Figure 1: Creep rupture strength predicted using a neu-ral network as a function of chromium content.
300
250
05 1 15 2 2'5 3 3!5 4
Figure 2: Creep rupture strength predicted using a neu-ral network as a function of carbon content.
300
250
200
150
11 100
.°1 I50
0.05 0.1 0.15 0.2 0.25
e100
200
Ja 150
O
Tungsten content! wt.% Vanadium content l aht.%
Figure 3: Creep rupture strength predicted using a neu- Figure 4: Creep rupture strength predicted using a neu-ral network as a function of tungsten content. ral network as a function of vanadium content
160
160
140
a 120
100
s-2 -2 80
• 60
E 40
4‘.2 20
n_ 0
0.02 0.04 0.06 0 005 0.01 0.015
Nitrogen content UM.% Boron oontent, wt.%
`Z: NI 200
.:ä2 15
300
250
Figure 5: Creep rupture strength predicted using a neu-ral network as a function of nitrogen content.
Figure 6: Creep rupture strength predicted using a neu-ral network as a function of boron content.
4
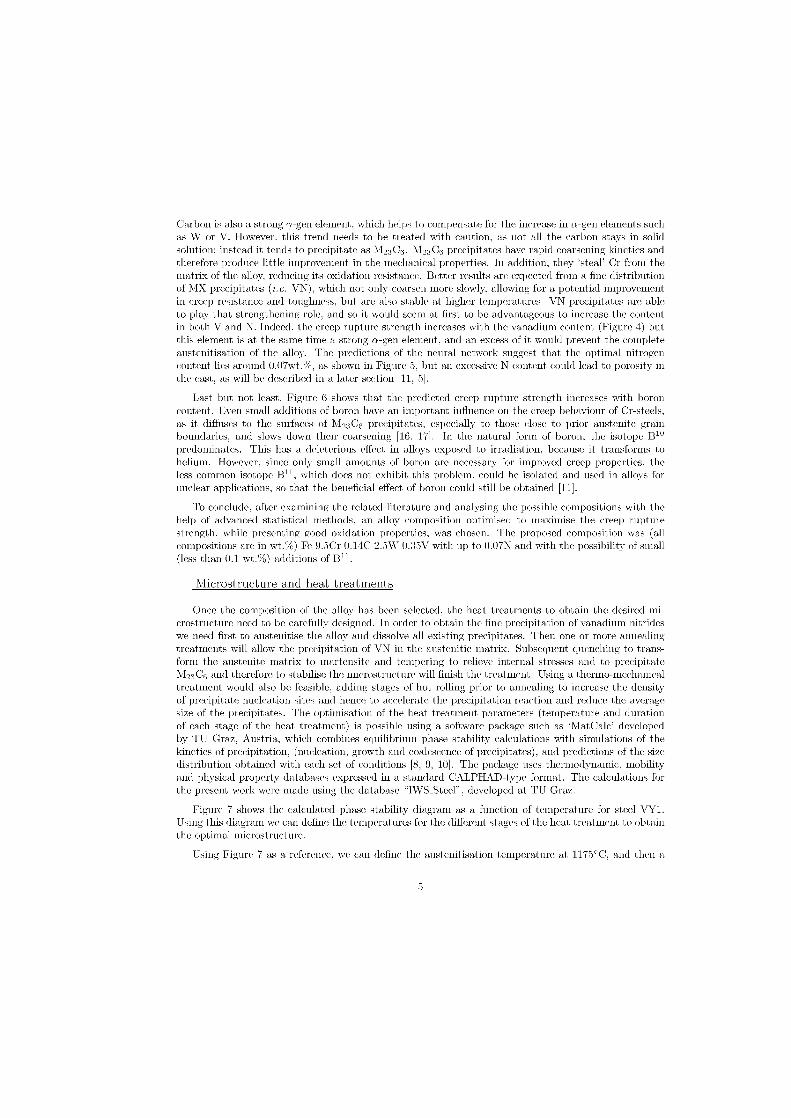
Carbon is also a strong iy-gen element, which helps to compensate for the increase in a-gen elements suchas W or V. However, this trend needs to be treated with caution, as not all the carbon stays in solidsolution: instead it tends to precipitate as M23C6. 1\123 C6 precipitates have rapid coarsening kinetics andtherefore produce little improvement in the mechanical properties. In addition, they 'steel' Cr from thematrix of the alloy, reducing its oxidation resistance. Better results are expected from a fine distributionof MX precipitates (i.e. VN), which not only coarsen more slowly, allowing for a potential improvementin creep resistance and toughness, but are also stable at higher temperatures. VN precipitates are ableto plag that strengthening role, and so it would seem at first to be advantageous to increase the contentin both V and N. Indeed, the creep rupture strength increases with the vanadium content (Figure 4) butthis element is at the same time a strong a-gen element, and an excess of it would prevent the completeaustenitisation of the alloy. The predictions of the neural network suggest that the optimal nitrogencontent lies around 0.07wt.%, as shown in Figure 5, but an excessive N content could lead to porosity inthe cast, as will be described in a later section [11, 5].
Last but not least. Figure 6 shows that the predicted creep rupture strength increases with boroncontent. Even small additions of boron have an important influence an the creep behaviour of Cr-steels,as it diffuses to the surfaces of 1\1 23 C6 precipitates, especially to those dose to prior austenite grainboundaries, and slows down their coarsening [16, 17]. In the natural form of boron, the isotope Bl°predominates. This has a deleterious effect in alloys exposed to irradiation, because it transforms tohelium. However, since only small amounts of boron are necessary for improved creep properties, theless common isotope B rr , which does not exhibit this problem, could be isolated and used in alloys fornuclear applications, so that the beneficial effect of boron could still be obtained
To conclude, after examining the related literature and analysing the possible compositions with thehelp of advanced statistical methods, an alloy composition optimised to maximise the creep rupturestrength, while presenting good oxidation properties, was chosen. The proposed composition was (allcompositions are in wt.%) Fe 9.5Cr 0.14C 2.5W 0.35V with up to 0.07N and with the possibility of small(less than 0.1 wt.%) additions of Bi'.
Microstructure and heat treatments
Once the composition of the alloy has been selected, the heat treatments to obtain the desired mi-crostructure need to be carefully designed. In order to obtain the fine precipitation of vanadium nitrideswe need first to austenitise the alloy and dissolve all existing precipitates. Then one or more annealingtreatments will allow the precipitation of VN in the austenitic matrix. Subsequent quenching to trans-form the austenite matrix to martensite and tempering to relieve internal stresses and to precipitate1\1 23 C6 and therefore to stabilise the microstructure will finish the treatment. Using a thermo-mechanicaltreatment would also be feasible, adding stages of hot rolling prior to annealing to increase the densityof precipitate nucleation sites and hence to accelerate the precipitation reaction and reduce the averagesize of the precipitates. The optimisation of the heat treatment parameters (temperature and durationof each stage of the heat treatment) is possible using a software package such as 'MatCale1 developedby TU Graz, Austria, which combines equilibrium phase stability calculations with simulations of thekinetics of precipitation, (nucleation, growth and coalescence of precipitates), and predictions of the sizedistribution obtained with each set of conditions [8, 9. 10]. The package uses thermodynamic, mobilityand physical property databases expressed in a standard CALPHAD-type format. The calculations forthe present work were made using the database "IWS_Steel" , developed at TU Graz.
Figure 7 shows the calculated phase stability diagram as a function of temperature for steel VY1.Using this diagram we can dehne the temperatures for the different stages of the heat treatment to obtainthe optimal microstructure.
Using Figure 7 as a reference,we, can define the austenitisation temperature at 1175°C. and then a
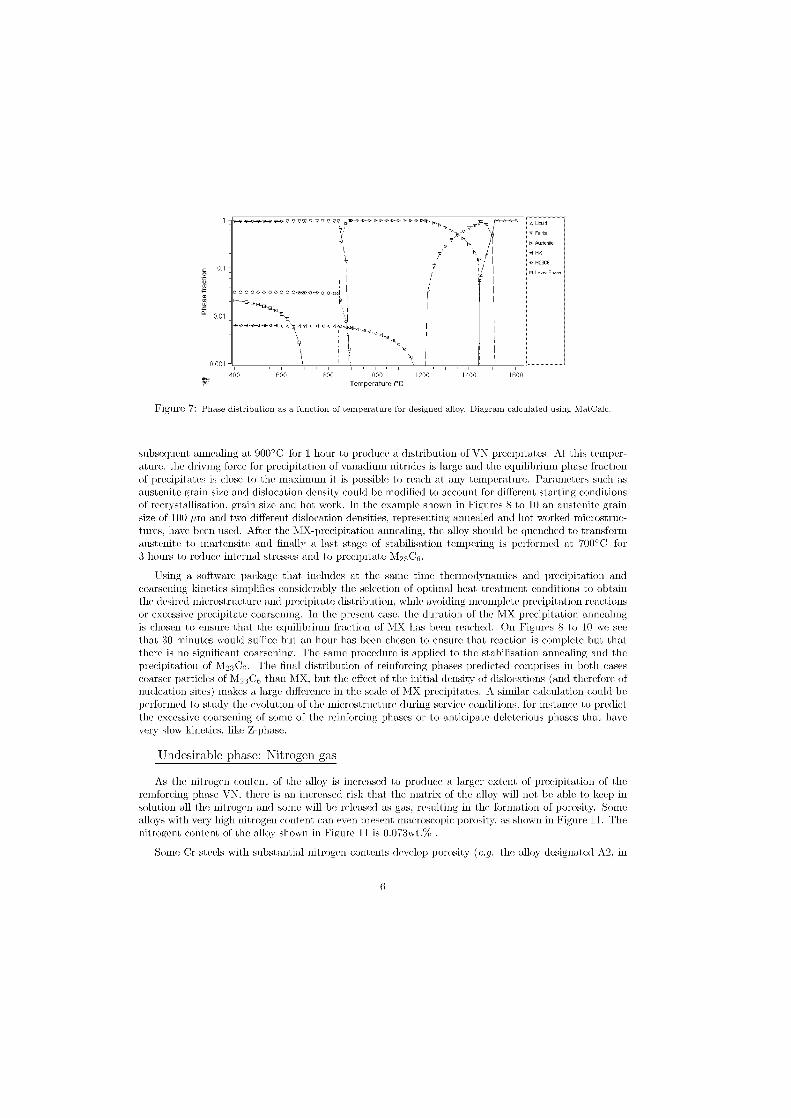
a--a e-v-v-we.,,,-,,43-9-V-V-, ',V i„,...da-radrId Ld at e,Pda- LP LIP Lala
'IIWI 7'
7
/
0,e-0- 00-0 0 -3,3- -.3 ...D, o - o e -3- ej 1
p1
nef -9, -,1-e- n711 ,,,„ ,,,Paidhaledaaaa-ead-a-e i
' 1 i'''''''Pa.,,,
iie,"9 1
400 600 800 1000 1200 1400Temperature rc
ehe a LiquidFerrite
eh PusieniteLIXM23C6
E Laves Phase
6 00
Figure 7: Phase distribution as a function of temperature for designed alloy. Diagram calculated using MatCalc.
subsequent annealing at 900°C for 1 hour to produce a distribution of VN precipitates. At this temper-ature, the driving forte for precipitation of vanadium nitrides is large and the equilibrium phase fractionof precipitates is dose to the maximum it is possible to reach at any temperature. Parameters such asaustenite grain size and dislocation density could be modified to account for different starting conditionsof recrystallisation, grain size and hot work. In the example shown in Figures 8 to 10 an austenite grainsize of 100 pm and two different dislocation densities, representing annealed and hot worked microstruc-tures, have been used. After the MX-precipitation annealing, the alloy should be quenched to transformaustenite to martensite and finally a last stage of stabilisation tempering is performed at 700°C for3 hours to reduce internal stresses and to precipitate M23C6•
Using a software package that includes at the same time thermodynamics and precipitation andcoarsening kinetics simplifies considerably the selection of optimal heat treatment conditions to obtainthe desired microstructure and precipitate distribution, while avoiding incomplete precipitation reactionsor excessive precipitate coarsening. In the present Gase, the duration of the MX precipitation annealingis (losen to ensure that the equilibrium fraction of MX has been reached. On Figures 8 to 10 we seethat 30 minutes would suffice but an hour has been chosen to ensure that reaction is complete but thatthere is no significant coarsening. The same procedure is applicd to the stabilisation annealing and theprecipitation of M23C6. The final distribution of reinforcing phases predicted comprises in both Gasescoarser particles of M23C6 than MX, but the effect of the initial density of dislocations (and therefore ofnucication sites) makes a large differente in the scale of MX precipitates. A similar calculation could beperformed to study the evolution of the microstructure during service conditions, for instance to predictthe excessive coarsening of some of the reinforcing phases or to anticipate deleterious phases that havevery slow kinetics, like Z-phase.
Undesirable phase: Nitrogen gas
As the nitrogen content of the alloy is increased to produce a 'arger extent of precipitation of thereinforcing phase VN, there is an increased risk that the matrix of the alloy will not be able to keep insolutioni all the nitrogen and some will be, released as gas, resulting in the formation of porosity. Somealloys with very high nitrogen content can even present macroscopic porosity, as shown in Figure 11. Thenitrogent content of the alloy shown in Figure 11 is 0.073wt.% .
Sonne Cr-steels with substantial nitrogen contents develop porosity (e.g. the alloy designated A2, in
6
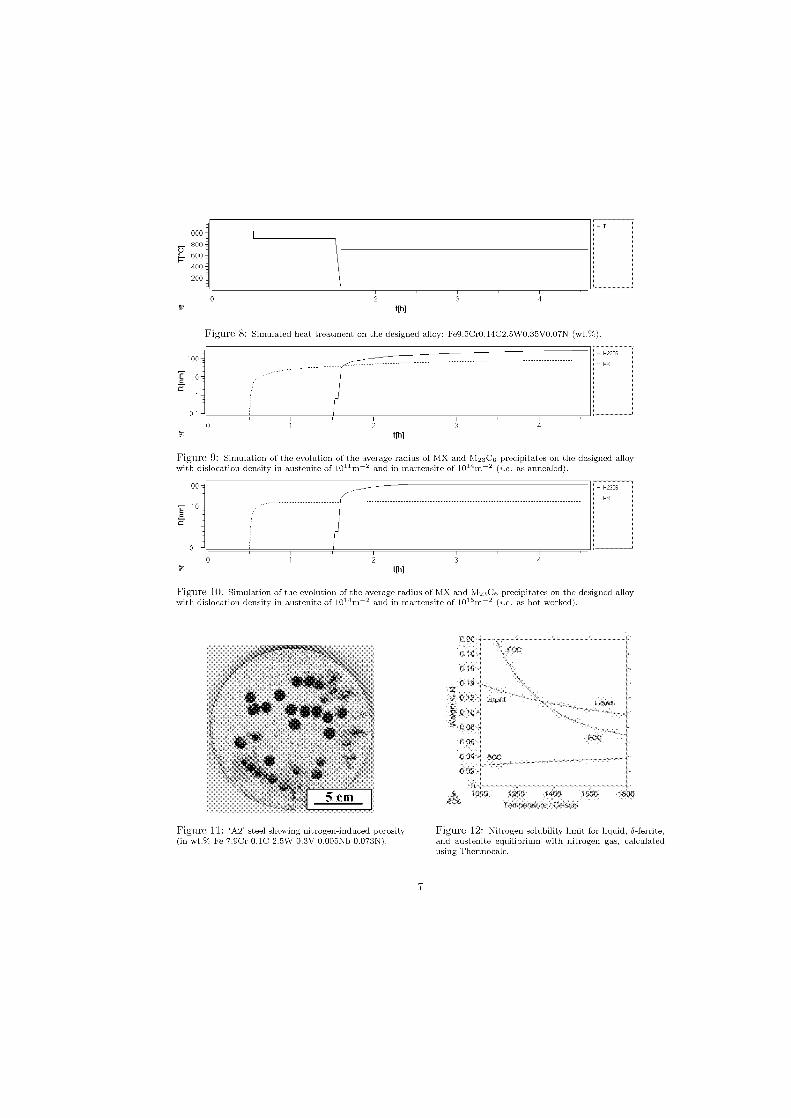
400-
200-
3t[h]
Figure 8: Simulated heat treatment on the designed alloy: Fe9.5Cr0.14C2.5W0.35V0.07N (wt.%).
323C6
0 1
t[h]
Figure 9: Simulation of the evolution of the average radius of MX and I\1 23 C 6 precipitates on the designed alloywith dislocation density in austenite of 10 11 m- 2 and in martensite of 10 14m- 2 (i.e. as annealed).
0 1t[h]
Figure 10: Simulation of the evolution of the average radius of MX and M23C6 precipitates on the designed alloywith dislocation density in austenite of 10 14 m-2 and in martensite of 10 15 m-2 (i.e. as hot worked).
100-
10 -
A
0 1-
Figure 11: `A2' steel showing nitrogen-induced porosity(in wt.% Fe 7.9Cr 0.1C 2.5W 0.3V 0.005Nb 0.073N).
Figur' 12: Nitrogen solubility limit for liquid, 6-ferrite,and austenite equilibrium with nitrogen gas, calculatedusing Thermocalc.
7
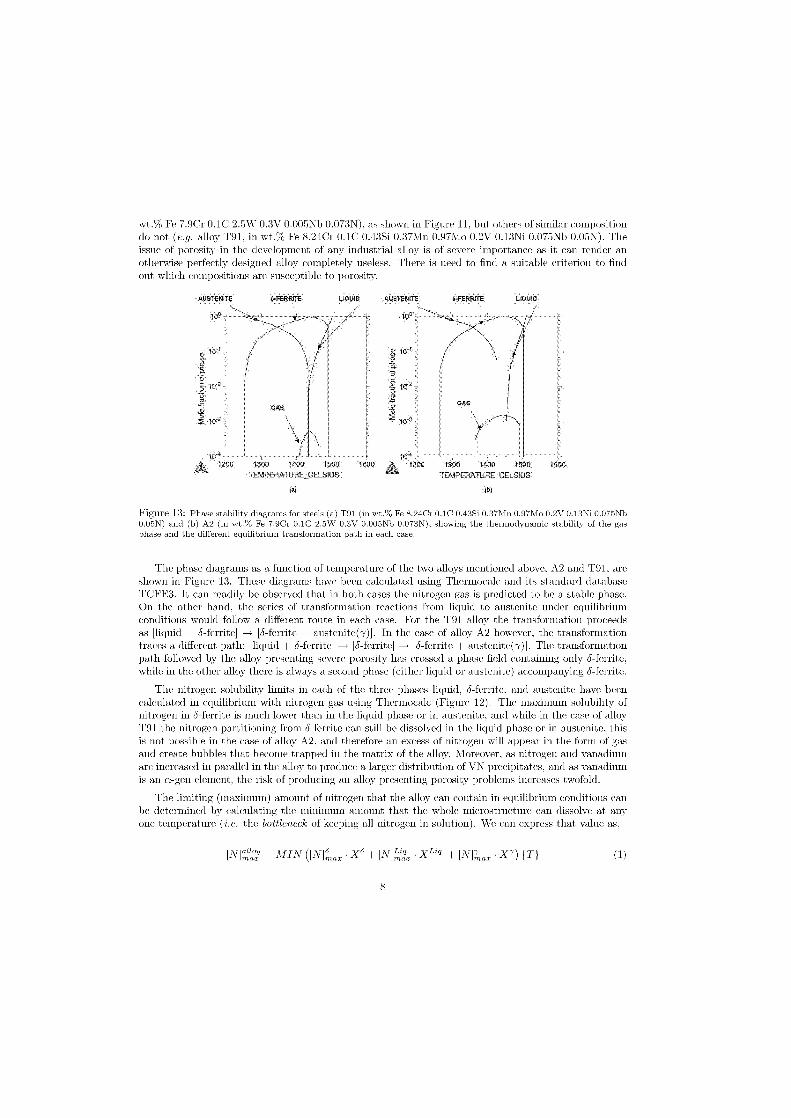
LIQUID LIQUID
wt.% Fe 7.9Cr 0.1C 2.5W 0.3V 0.005Nb 0.073N), as shown in Figure 11, but others of similar composition(10 not (e.g. alloy T91, in wt.% Fe 8.24Cr 0.1C 0.43Si 0.37Mn 0.97Mo 0.2V 0.13Ni 0.075Nb 0.05N). Theissuc of porosity in the development of any industrial alloy is of severe importance as it can render anotherwise perfectly designed alloy complete useless. There is need to find a suitable criterion to findout which compositions are susceptible to porosity.
(.1
Figure 13: Phase stability diagrams for steels (a) T91 (in wt.% Fe 8.24Cr 0.1C 0.43Si 0.37Mn 0.97Mo 0.2V 0.13Ni 0.075Nb0.05N) and (b) A2 (in wt.% Fe 7.9Cr 0.1C 2.5W 0.3V 0.005Nb 0.073N), showing the thermodynamic stability of the gasphase and the different equilibrium transformation path in each Gase.
The phase diagrams as a function of temperature of the two alloys mentioned above. A2 and T91, areshown in Figure 13. These diagrams have been calculated using Therrnocalc and its standard databaseTCFE3. It can readily be observed that in both Gases the nitrogen gas is predicted to be a stable phase.On the other hand, the series of transformation reactions from liquid to austenite under equilibriumconditions would follow a different route in each Gase. For the T91 alloy the transformation proceedsas [liquid + 5-ferrite] [5-ferrite + austenite(y)1. In the Gase of alloy A2 however, the transformationtraees a different path: [liquid + 5-ferrite] [5-ferrite] [4-ferrite + austenite(7)[. The transformationpath followed by the alloy presenting severe porosity has crossed a phase field containing only 4-ferrite,while in the other alloy there is always a second phase (either liquid or austenite) accompanying 5-ferrite.
The nitrogen solubility limits in each of the three phases liquid. 5-ferrite, and austenite have beencalculated in equilibrium with nitrogen gas using Thermocalc (Figure 12). The maximum solubility ofnitrogen in 4-ferrite is rauch lower than in the liquid phase or in austenite, and while in the case of alloyT91 the nitrogen partitioning from 4-ferrite can still be dissolved in the liquid phase or in austenite, thisis not possible in the case, of alloy A2, and therefore an excess of nitrogen will appear in the form of gasand create bubbles that become trapped in the matrix of the alloy. Moreover, as nitrogen and vanadiumare increased in parallel in the alloy to produce a larger distribution of VN precipitates, and as vanadiumis an u-gen element, the risk of producing an alloy presenting porosity problems increases twofold.
The limiting (maximum) amount of nitrogen that the alloy can contain in equilibrium conditions canbe determined by calculating the minimum amount that the whole microstructure can dissolve at anyone temperature (i.e. the bottleneek of keeping all nitrogen in solution). We can express that value as,
[N[,27 = MIN GIV1„„„ + [1\712; • X L' q. +[Nn,„ ITI (1)
8
where X' is the fraction of each phase (S-ferrite, liquid and austenite) and [N[ the maximumsolubility of nitrogen in the alloy or in phase as a function of temperature T.
Nevertheless, the process of forming a gas bubble in the alloy is not immediate, and the effect ofkinetics needs to be taken into account. The formation of gas porosity is not unlike other phenomenagoverned by nucleation and growth [18]. In this case, nitrogen and vacancies need to coalesce in sufficientquantity to nucleate a "bubble-nuclens", with the creation of new gas/matrix interfaces, and subsequentlythis nucleus needs to be able to grow above a certain critical size, becoming energetically stable insteadof redissolving again in the matrix. The differente with the classical nucleation and growth scenario,however, is that in this case there is a term related to the pressure of the gas in the bubble that willcontribute to its overall energy. Consequently, and with respect to the criterion described by Equation 1,there will be a region where the nitrogen gas will remain dissolved in the matrix in metastable conditions.For instance, it would be feasible to keep in solution an amount of nitrogen larger than the minimum of[1\r]„,„ but lower than most of the curve as long as it was only for a short time. Likewise, it could bepossible to keep in solution for a long time an amount of nitrogen that was only marginally higher thatthat described by Equation 1.
All parameters in Equation 1 can be calculated using a CALPHAD-based thermodynamic softwarepackage. From this expression it is clear that an alloy which presents a 6-ferrite single-phase region willnot tolerate nitrogen content rauch higher than 300ppm (Figure 12) without producing a porous cast.Alloys that (10 not form (5-ferrite or in which this phase is part of a dual microstructure with either liquidor austenite at all temperatures will be more tolerant to largo nitrogen contents.
Conclusions
The work presented here is a case study on how the current accuracy of thermodynamic and kineticcalculations allow new alloys to be designed to respond to demanding operating conditions, while avoidingmost of the experimental trial and error needed in the past. Software tools based on the CALPHADmethod and various kinetic models are available, allowing the prediction not only of the feasibility of atarget microstructure but also of its evolution during various heat treatments.
In the present study a new reduced activation ferritic/martensitic alloy has been designed that shouldbe able to sustain service temperatures of 650°C. This alloy has been cast and treated and is beingcharacterised microstructurally and in terms of mechanical properties.
Acknowledgements:
The authors are grateful to Ms. A. Petit and Mr. F. Vivier for their collaboration in the developmentof this work and to Prof. H. K. D. H. Bhadeshia and Dr. E. Kozeschnik for their invaluable advice on theuse of the various methods employed in the present work.
References
[1] J. L. S&an, J-C. Brachet. and A. Alamo. Fast reactor cores, ferritic-martensitic steels for. InEnciclopedia of Materials: Science and Technology, pages 2863 2866. Elsevier Science Ltd., 2001.
[2] H. K. D. H. Bhadeshia. Design of heat resistant alloys for the energy industries. In 5th, InternationalCharles Parsons Turbine Conference, pages 3 39, 2000.
9
[3]Y. De Carlan, M. Murugananth, T. Sourmail, and H. K. D. H. Bhadeshia. Design of new Fe-9CrWVreduced-activation martensitic steels for creep properties at 650°C. Journal of Nuclear Materials,329-333:238-242. 2004.
[4] R. W. Hertzberg. Deformation and ,fracture mechanics of engineering materials. John Wiley Bons,inc., New York, 1996.
[5]V. A. Yardley and Y. de Carlan. Design criteria for high-temperature steels strengthened withvanadium nitride. Journal of Phase Equilibria and Diffusion. 27, 2006.
[6] D. A. Porter and K. E. Easterling. Phase transformations in metals and alloys. Chapman kLondon, 1981.
[7] N. Saunders and A. P. Miodownik. CALPHAD, calculation of phase diagrams, a comprehemsivemüde. Pergamon Press, Oxford, 1998.
[8] J. Svoboda, F. D. Fischer, P. Fratzl. and E. Kozeschnik. Modelling of kinetics in multi-componentmulti-phase systems with spherical precipitates I: Theory. Materials Science and Engineering A,A385:166 174, 2004.
[9] E. Kozeschnik, J. Svoboda, P. Fratzl. and F. D. Fischer. Modelling of kinetics in multi-componentmulti-phase systems with spherical precipitates II: Numerical solution and application. MaterialsScience and Engineering A. A385:157-165, 2004.
[10]E. Kozeschnik, J. Svoboda, and F. D. Fischer. Modified evolution equations for the precipitationkinetics of complex phases in multi-cmponent systems. Computer Coupling of Phase Diagrams andTherrnochemistry, 28:379 382, 2004.
[11]V. A. Yardley and Y. De Carlan. Progress in fabrication of experimental 9cr steel compositions opti-mised for creep resistance, thermodynamic and statistical analysis and proposed solutions. Technicalreport. CEA (France), 2005.
[12]D. J. C. MacKay. Bayesian non-linear modelling with neural networks. In H. Cerjak, editor, Math-ematical modelling of well phenomena 3, pages 359-389. The Institute of Materials. London. 1997.
[13]D. J. C. MacKay. Probable networks and plausible predictions - a review of practical Bayesianmethods for supervised neural networks. In http://wol.ra.phy.cam.ac.uk/mackay/.
[14]D. Cole, C. Martin-Moran, A. G. Sheard, H. K. D. H. Bhadeshia. and D. J. C. MacKay. Modellingcreep rupture strength of ferritic steel welds. Science and Technology of Welding and Joining, 5:8189, 2000.
[15]Materials Science and Metallurgy Department - University of Cambridge and Na-tional Physical Laboratory. Materials Algorithms Project. University of Cambridge,http: //www.rnsrn.carn.ac.uk/rnap/nraprnain.htrnl. 1995.
[16]T. F. Kelly, D. J. Larson, M. K. and J. E. Flinn. Three dimensional atom probe investigationof vanadium nitride precipitates and the role of oxygen and boron in rapidly solidified 316 stainlesssteel. Materials Science and Engineering A. A270:19 26, 1999.
[17]F. Abe, T. Horiuchi, M. Taneike, and K. Sawada. Stabilisation of martensitic microstructure in ad-vanced 9Cr steel during creep at high temperature. Materials Science and Engineering A. A378:299–303, 2004.
[18]J. W. Christian. Theory of transformations in metals and alloys, Part I. Pergamon Press, Oxford,1975.
10

Part III
Advanced Steam Turbine Materials
Contributed Papers
Welding Technology

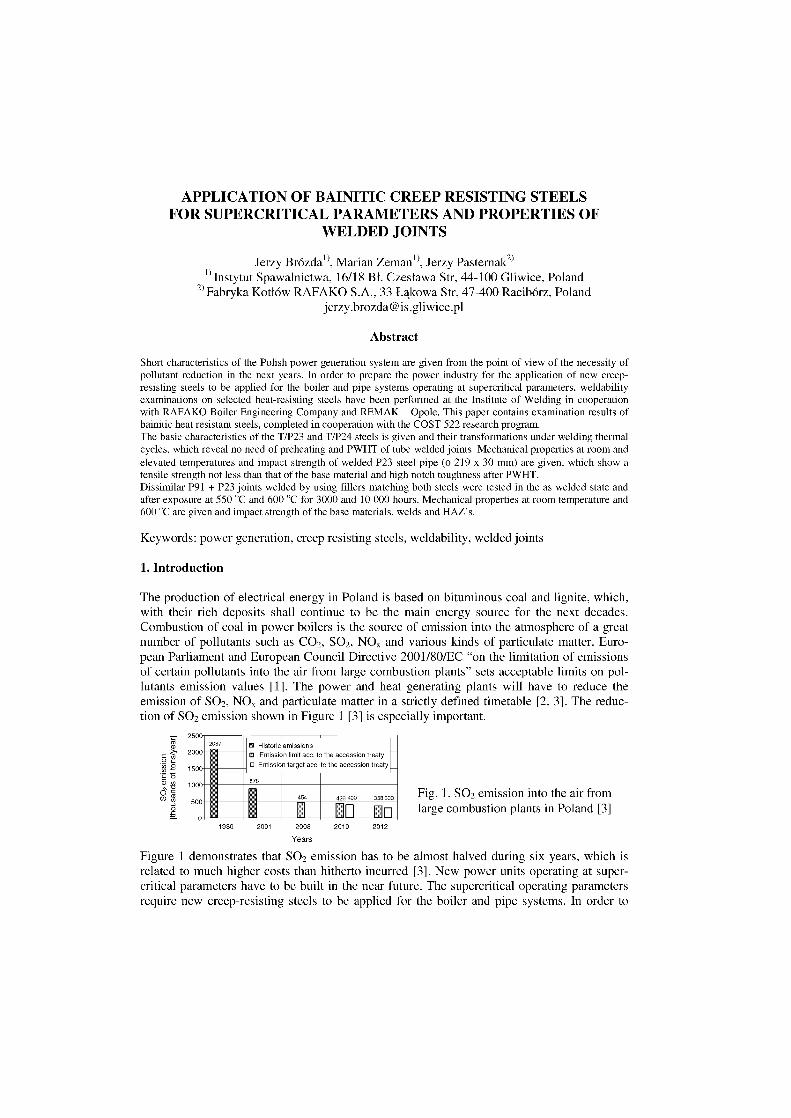
250
O
0 .N 2
g5, 5000
2087 E Historic emissionso Emission limit acc. to the accession treatyq Emission target acc. to the accession treaty
878
454 426 400 358 300
rin EnFig. 1. SO2 emission into the air fromlarge combustion plants in Poland [3]
200
150
100
APPLICATION OF BAINITIC CREEP RESISTING STEELSFOR SUPERCRITICAL PARAMETERS AND PROPERTIES OF
WELDED JOINTS
Jerzy Brözda l) , Marian Zeman i), Jerzy Pasternak2)1) Instytut Spawalnictwa, 16/18 Bl. Czeslawa Str, 44-100 Gliwice, Poland
2) Fabryka Kotlöw RAFAKO S.A., 33 Lqkowa Str, 47-400 Racibdrz, [email protected]
Abstract
Short characteristics of the Polish power generation system are given from the point of view of the necessity ofpollutant reduction in the next years. In order to prepare the power industry for the application of new creep-resisting steels to be applied for the boiler and pipe systems operating at supercritical parameters, weldabilityexaminations on selected heat-resisting steels have been performed at the Institute of Welding in cooperationwith RAFAKO Boiler Engineering Company and REM AK – Opole. This paper contains examination results ofbainitic heat resistant steels, completed in cooperation with the COST 522 research program.The basic characteristics of the T/P23 and T/P24 steels is given and their transformations under welding thermalcycles, which reveal no need of preheating and PWHT of tube welded joints. Mechanical properties at room andelevated temperatures and impact strength of welded P23 steel pipe (0 219 x 30 mm) are given, which show atensile strength not less than that of the base material and high notch toughness after PWHT.Dissimilar P91 + P23 joints welded by using fillers matching both steels were tested in the as welded state andafter exposure at 550 °C and 600 °C for 3000 and 10 000 hours. Mechanical properties at room temperature and600 °C are given and impact strength of the base materials, welds and HAZ's.
Keywords: power generation, creep resisting steels, weldability, welded joints
1. Introduction
The production of electrical energy in Poland is based on bituminous coal and lignite, which,with their rich deposits shall continue to be the main energy source for the next decades.Combustion of coal in power boilers is the source of emission into the atmosphere of a greatnumber of pollutants such as CO 2 , SO2 , NOx and various kinds of particulate matter. Euro-pean Parliament and European Council Directive 2001/80/EC "on the limitation of emissionsof certain pollutants into the air from large combustion plants" sets acceptable limits on pol-lutants emission values [1]. The power and heat generating plants will have to reduce theemission of SO2 , NOx and particulate matter in a strictly defined timetable [2, 3]. The reduc-tion of SO 2 emission shown in Figure 1 [3] is especially important.
1980 2001
2008
2010 2012
Years
Figure 1 demonstrates that SO2 emission has to be almost halved during six years, which isrelated to much higher costs than hitherto incurred [3]. New power units operating at super-critical parameters have to be built in the near future. The supercritical operating parametersrequire new creep-resisting steels to be applied for the boiler and pipe systems. In order to
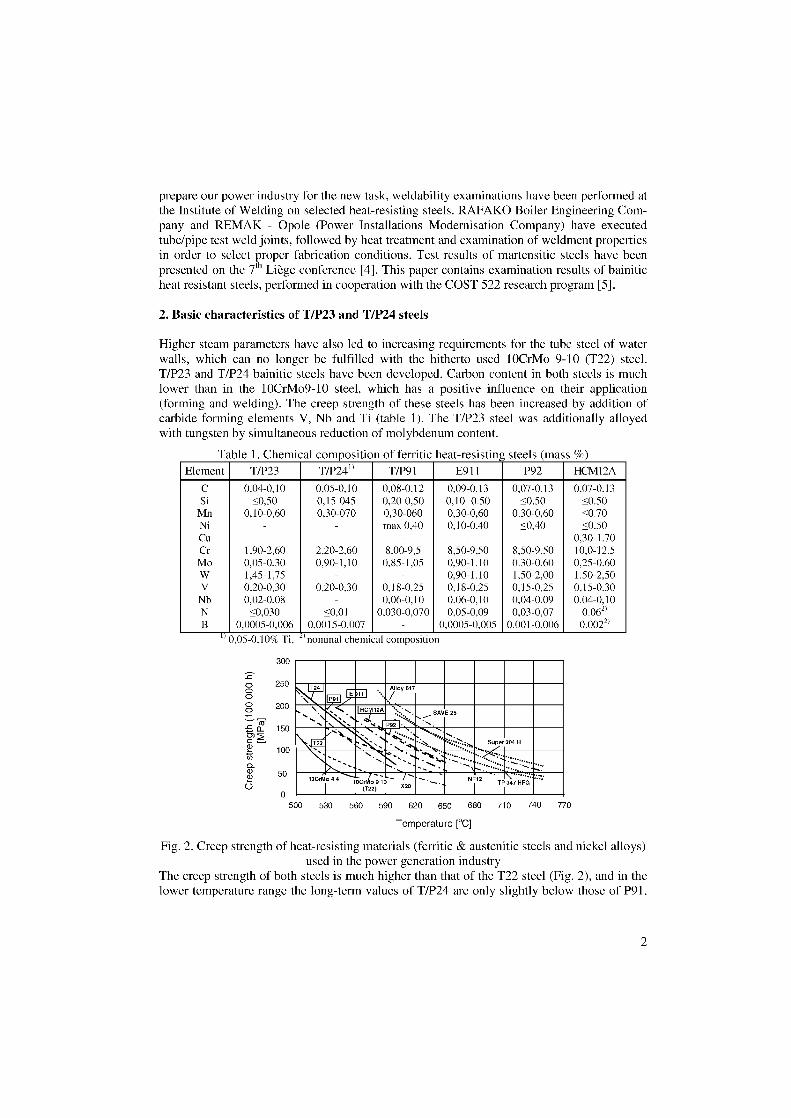
Alloy 617i T24bb, IMI AMI ,innomminrizornannMIIIIMBIEBEIN
304 H
'' ':::-...2::..,»13CrMo 44 oCr o 9 10 NF12 T 347 HFG
(T22) X20
300
250OO200
ZZ. —crso_ 150r 2
2 100
50
0
prepare our power industry for the new task, weldability examinations have been performed atthe Institute of Welding on selected heat-resisting steels. RAFAKO Boiler Engineering Com-pany and REMAK - Opole (Power Installations Modernisation Company) have executedtube/pipe test weld joints, followed by heat treatment and examination of weldment propertiesin order to select proper fabrication conditions. Test results of martensitic steels have beenpresented on the 7 th Liege conference [4]. This paper contains examination results of bainiticheat resistant steels, performed in cooperation with the COST 522 research program [5].
2. Basic characteristics of T/P23 and T/P24 steels
Higher steam parameters have also led to increasing requirements for the tube steel of waterwalls, which can no longer be fulfilled with the hitherto used 10CrMo 9-10 (T22) steel.T/P23 and T/P24 bainitic steels have been developed. Carbon content in both steels is muchlower than in the 10CrMo9-10 steel, which has a positive influence on their application(forming and welding). The creep strength of these steels has been increased by addition ofcarbide forming elements V, Nb and Ti (table 1). The T/P23 steel was additionally alloyedwith tungsten by simultaneous reduction of molybdenum content.
Table 1. Chemical composition of ferritic heat-resisting steels (mass %)Element T/P23 T/P24 I ) T/P91 E911 P92 HCM I 2A
CSi
0,04-0,10<0,50
0,05-0,100,15-045
0,08-0,120,20-0,50
0,09-0.130,10- 0.50
0,07-0.13<0.50
0,07-0.13<0.50
Mn 0,10-0,60 0,30-070 0,30-060 0,30-0,60 0.30-0,60 <0.70Ni max 0,40 0,10-0,40 <0,40 <0.50Cu 0,30-1.70Cr 1,90-2,60 2,20-2,60 8,00-9,5 8,50-9,50 8,50-9.50 10,0-12.5Mo 0,05-0,30 0,90-1,10 0,85-1,05 0,90-1.10 0.30-0,60 0,25-0.60W 1,45-1,75 0,90-1.10 1,50-2,00 1.50-2,50V 0,20-0,30 0,20-0,30 0,18-0,25 0,18-0,25 0,15-0,25 0,15-0.30Nb 0,02-0,08 0,06-0,10 0.06-0,10 0,04-0,09 0.04-0,10N <0,030 <0,01 0,030-0,070 0,05-0,09 0,03-0,07 0.0621B 0,0005-0,006 0,0015-0,007 0,0005-0,005 0.001-0,006 0.0022)
11 0,05-0,10% Ti, 2) nominal chemical composition
500 530 560 590 620 650 680 710
740 770
Temperature [°C]
Fig. 2. Creep strength of heat-resisting materials (ferritic & austenitic steels and nickel alloys)used in the power generation industry
The creep strength of both steels is much higher than that of the T22 steel (Fig. 2), and in thelower temperature range the long-term values of T/P24 are only slightly below those of P91.
2
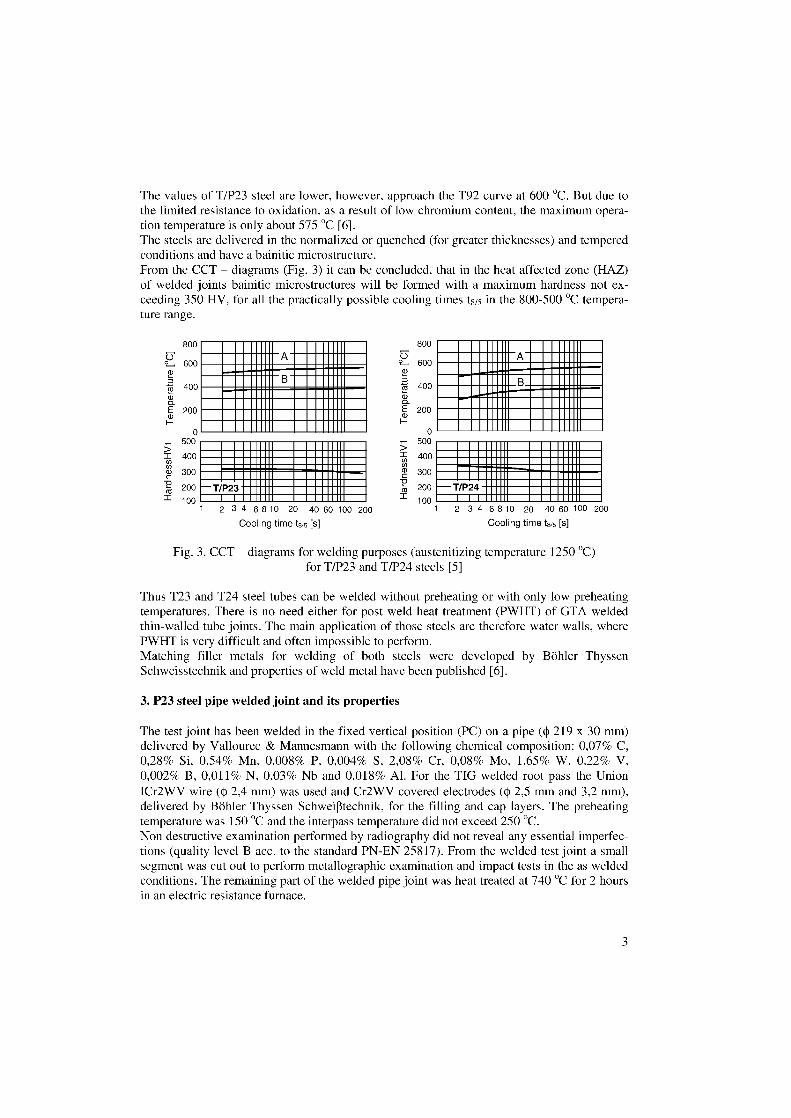
500
400
300
200
100
500
400
300
200
100
∎•■■11111∎M■■IIIII∎
■M■■IIIII■M■■IMsun■mmazuIIIII∎M■■11111∎∎m■■uni∎m■■inii∎
T/P24
The values of T/P23 steel are lower, however, approach the T92 curve at 600 °C. But due tothe limited resistance to oxidation, as a result of low chromium content, the maximum Opera-tion temperature is only about 575 °C [6].The steels are delivered in the normalized or quenched (for greater thicknesses) and temperedconditions and have a bainitic microstructure.From the CCT – diagrams (Fig. 3) it can be concluded, that in the heat affected zone (HAZ)of welded joints bainitic microstructures will be formed with a maximum hardness not ex-ceeding 350 HV, for all the practically possible cooling times t815 in the 800-500 °C tempera-ture range.
800 800
600
3400
7z
600
400
A
Bif51) EL 2001) E- 200
H0 0
MM■■11111∎M■■IIIII∎■MMMUIII■MMBNIIII■
=.=mere...■■••••3111■
■11111∎∎■■11111∎2 3 4 6 8 10 20 40 60 100 200
Cooling time t815 Es]
2 3 4 6 8 0 20 40 60 00 200
Cooling time t815 Es]
Fig. 3. CCT – diagrams for welding purposes (austenitizing temperature 1250 °C)for T/P23 and T/P24 steels [5]
Thus T23 and T24 steel tubes can be welded without preheating or with only low preheatingtemperatures. There is no need either for post weld heat treatment (PWHT) of GTA weldedthin-walled tube joints. The main application of those steels are therefore water walls, wherePWHT is very difficult and often impossible to perform.Matching filler metals for welding of both steels were developed by Böhler ThyssenSchweisstechnik and properties of weld metal have been published [6].
3. P23 steel pipe welded joint and its properties
The test joint has been welded in the fixed vertical position (PC) an a pipe (f1) 219 x 30 mm)delivered by Vallourec & Mannesmann with the following chemical composition: 0,07% C,0,28% Si, 0,54% Mn, 0,008% P, 0,004% S, 2,08% Cr, 0,08% Mo, 1,65% W, 0,22% V,0,002% B, 0,011% N, 0,03% Nb and 0,018% Al. For the TIG welded root pass the UnionICr2WV wire (12,4 mm) was used and Cr2WV covered electrodes (f1) 2,5 mm and 3,2 mm),delivered by Böhler Thyssen Schweißtechnik, for the filling and cap layers. The preheatingtemperature was 150 °C and the interpass temperature did not exceed 250 °C.Non destructive examination performed by radiography did not reveal any essential imperfec-tions (quality level B acc. to the standard PN-EN 25817). From the welded test joint a smallsegment was cut out to perform metallographic examination and impact tests in the as weldedconditions. The remaining part of the welded pipe joint was heat treated at 740 °C for 2 hoursin an electric resistance furnace.
3
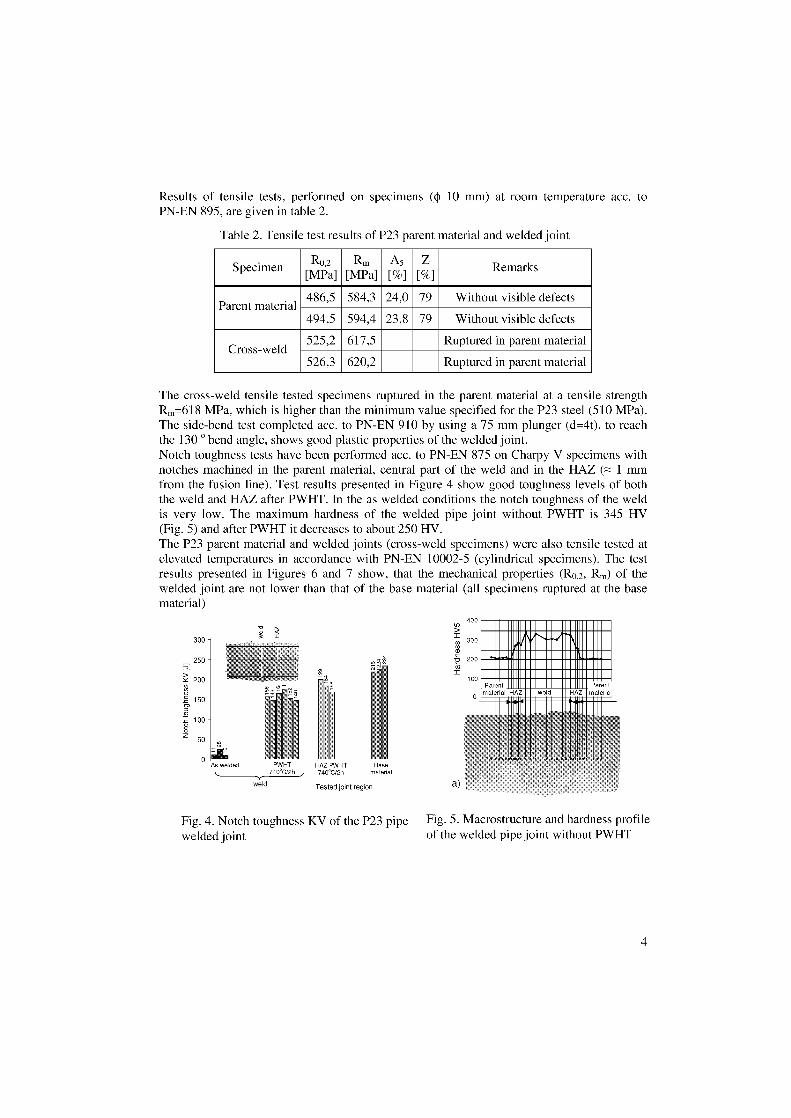
Results of tensile tests, performed on specimens (fli 10 mm) at room temperature acc. toPN-EN 895, are given in table 2.
Table 2. Tensile test results of P23 parent material and welded joint
SpecimenRo 2
[MPa]Rn,
[MPa]A5[%]
Z[o] Remarks
Parent material486,5 584,3 24,0 79 Without visible defects
494,5 594,4 23,8 79 Without visible defects
Cross-weld525,2 617,5 Ruptured in parent material
526,3 620,2 Ruptured in parent material
The cross-weld tensile tested specimens ruptured in the parent material at a tensile strengthR„=618 MPa, which is higher than the minimum value specified for the P23 steel (510 MPa).The side-bend test completed acc. to PN-EN 910 by using a 75 mm plunger (d=40, to reachthe 130 ° bend angle, shows good plastic properties of the welded joint.Notch toughness tests have been performed acc. to PN-EN 875 on Charpy V specimens withnotches machined in the parent material, central part of the weld and in the HAZ 1 mmfrom the fusion line). Test results presented in Figure 4 show good toughness levels of boththe weld and HAZ after PWHT. In the as welded conditions the notch toughness of the weldis very low. The maximum hardness of the welded pipe joint without PWHT is 345 HV(Fig. 5) and after PWHT it decreases to about 250 HV.The P23 parent material and welded joints (cross-weld specimens) were also tensile tested atelevated temperatures in accordance with PN-EN 10002-5 (cylindrical specimens). The testresults presented in Figures 6 and 7 show, that the mechanical properties (R 0,2 , Rm) of thewelded joint are not lower than that of the base material (all specimens ruptured at the basematerial)
400■111111111111■11111111111111■
300 - 30 ■111111111KOKMM011111111■iiiIIMI111011111B
250 20 MIMIK■111111111111■11111111111■11■
200 100Pa en II Parent
material HAZ material
E 150 «um onun..■....• ms.
100-
50 -
0 .. . ....As welded PWHT HAZ PWHT Base
740 C/2h material
weld Tested joint region a)
Fig. 4. Notch toughness KV of the P23 pipe 5. Macrostructure and hardness profile
welded joint of the welded pipe joint without PWHT
4
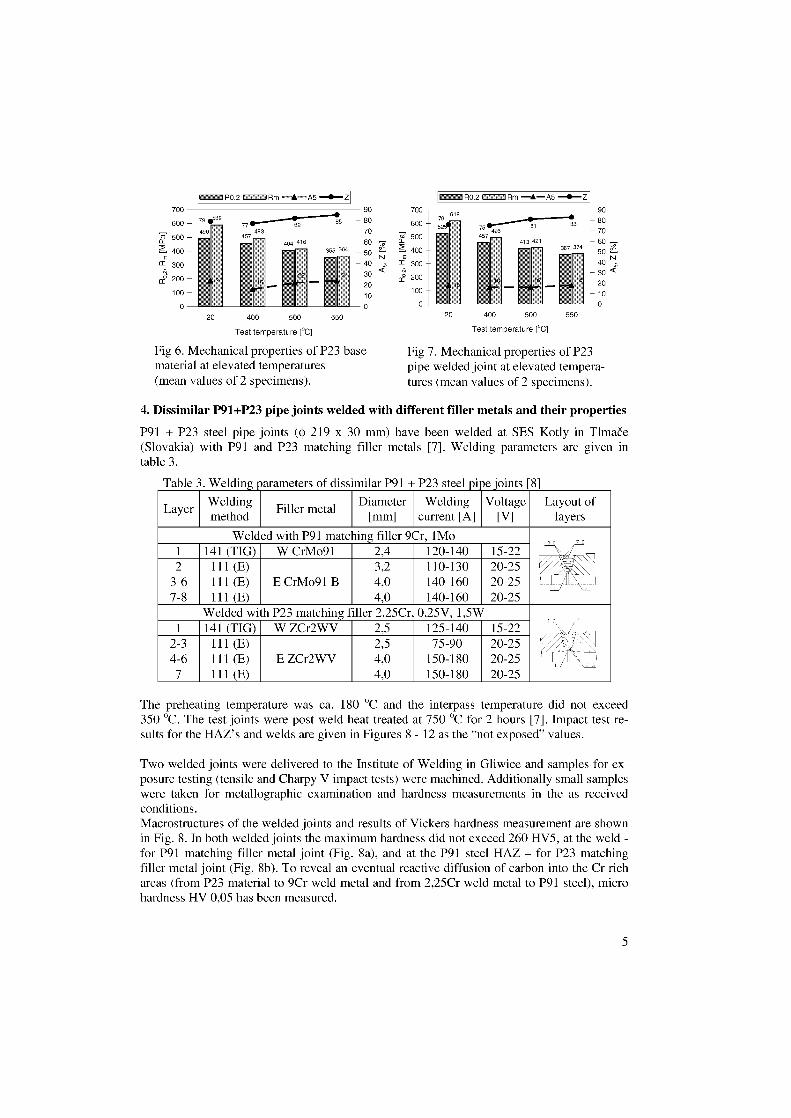
R0,2
o71 500 —_
2 400 E
eC 300 -
2 200
100 —
700
600 —
0
90
— 80
— 70
— 60
— 5040 N
— 30
— 20
— 10
0
Fig 7. Mechanical properties of P23pipe welded joint at elevated tempera-tures (mean values of 2 specimens).
1=1R0,2 r iRm —11—Z
700 90
6 — " 058900 77 gZ 85 — 80
490 493 — 70500 457
404 416 — 60400 355 364 — 50
EII 300 -
N— 40
<i>c° 200 —
100 —
0
20 400 500 550
Test temperature [°C]
Fig 6. Mechanical properties of P23 basematerial at elevated temperatures(mean values of 2 specimens).
— 30
— 20
— 10
0
4. Dissimilar P91+P23 pipe joints welded with different filier metals and their properties
P91 + P23 steel pipe joints (11) 219 x 30 mm) have been welded at SES Kotly in Tlmae(Slovakia) with P91 and P23 matching filler metals [7]. Welding parameters are given intable 3.
Table 3. Welding parameters of dissimilar P91 + P23 steel pipe joints [8]
LayerWeldingmethod
Filier metalDiameter
[mm]Welding
current [A]Voltage
[V]Layout of
layers
Welded with P91 matching filler 9Cr, 1Mo 7 2
1 141 (TIG) W CrMo91 2,4 120-140 15-222 111 (E) 3,2 110-130 20-25
3-6 111 (E) E CrMo91 B 4,0 140-160 20-25 _i*,, _
7-8 111 (E) 4,0 140-160 20-25Welded with P23 matching filler 2,25Cr 0,25V, 1,5W
1 141 (TIG) W ZCr2WV 2,5 125-140 15-222-3 111 (E) 2,5 75-90 20-254-6 111 (E) E ZCr2WV 4,0 150-180 20-25
7 111 (E) 4,0 150-180 20-25
The preheating temperature was ca. 180 °C and the interpass temperature did not exceed350 °C. The test joints were post weld heat treated at 750 °C for 2 hours [7]. Impact test re-sults for the HAZ's and welds are given in Figures 8 - 12 as the "not exposed" values.
Two welded joints were delivered to the Institute of Welding in Gliwice and samples for ex-posure testing (tensile and Charpy V impact tests) were machined. Additionally small sampleswere taken for metallographic examination and hardness measurements in the as receivedconditions.Macrostructures of the welded joints and results of Vickers hardness measurement are shownin Fig. 8. In both welded joints the maximum hardness did not exceed 260 HV5, at the weld -for P91 matching filler metal joint (Fig. 8a), and at the P91 steel HAZ - for P23 matchingfiller metal joint (Fig. 8b). To reveal an eventual reactive diffusion of carbon into the Cr richareas (from P23 material to 9Cr weld metal and from 2,25Cr weld metal to P91 steel), microhardness HV 0,05 has been measured.
5
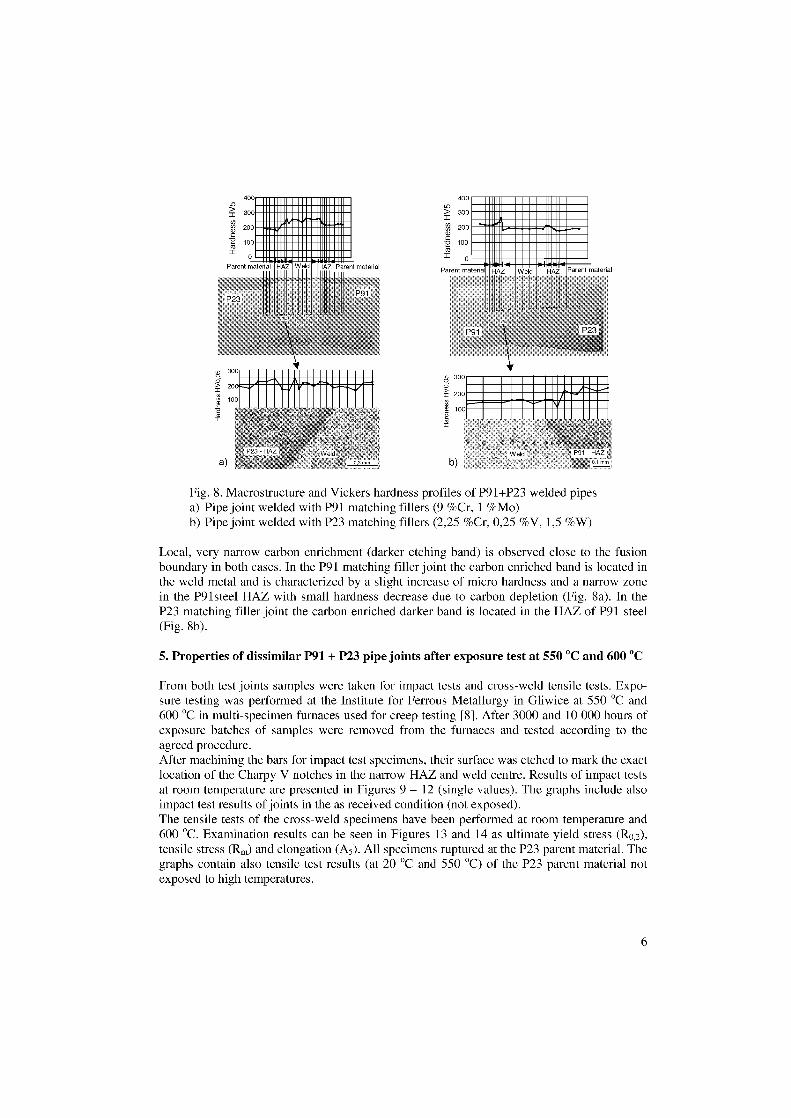
00
rIZE■111111/M•eva:4111/1»iiiMUMM
2 300 2 300
g 200
100
a) b)
400
300
2 0c
100
400111111111111111111111111 •11111113 IIII1MZ1n111111111ZIIImilalli Num Immo11111111/111/!!!!111111111111!51111111111^ •"^hia1111111111111111111
300
200211111113 IIII1MZ!!!!!111111111amallb:Zili
IIII1MZ
IIII11M1Z1111111311E1111111E111E11111E111
100Z11111113 IIII11M1
0 111111111 11111MMmon lopro«.
Parent material HAZ Wald HAZ Parent material Parent male al u WPI P r nt material
F
Fig. 8. Macrostructure and Vickers hardness profiles of P91+P23 welded pipesa) Pipe joint welded with P91 matching fillers (9 %Cr, 1 %Mo)b) Pipe joint welded with P23 matching fillers (2,25 %Cr, 0,25 %V, 1,5 %W)
Local, very narrow carbon enrichment (darker etching band) is observed dose to the fusionboundary in both cases. In the P91 matching filler joint the carbon enriched band is located inthe weld metal and is characterized by a slight increase of micro hardness and a narrow zonein the P9lsteel HAZ with Small hardness decrease due to carbon depletion (Fig. 8a). In theP23 matching filler joint the carbon enriched darker band is located in the HAZ of P91 steel(Fig. 8b).
5. Properties of dissimilar P91 + P23 pipe joints after exposure test at 550 °C and 600 °C
From both test joints samples were taken for impact tests and cross-weld tensile tests. Expo-sure testing was performed at the Institute for Ferrous Metallurgy in Gliwice at 550 °C and600 °C in multi-specimen furnaces used for creep testing [8]. After 3000 and 10 000 hours ofexposure batches of samples were removed from the furnaces and tested according to theagreed procedure.After machining the Bars for impact test specimens, their surface was etched to mark the exactlocation of the Charpy V notches in the narrow HAZ and weld centre. Results of impact testsat room temperature are presented in Figures 9 — 12 (single values). The graphs include alsoimpact test results of joints in the as received condition (not exposed).The tensile tests of the cross-weld specimens have been performed at room temperature and600 °C. Examination results can be seen in Figures 13 and 14 as ultimate yield stress (R0,2),tensile stress (R.) and elongation (A5 ). All specimens ruptured at the P23 parent material. Thegraphs contain also tensile test results (at 20 °C and 550 °C) of the P23 parent material notexposed to high temperatures.
6
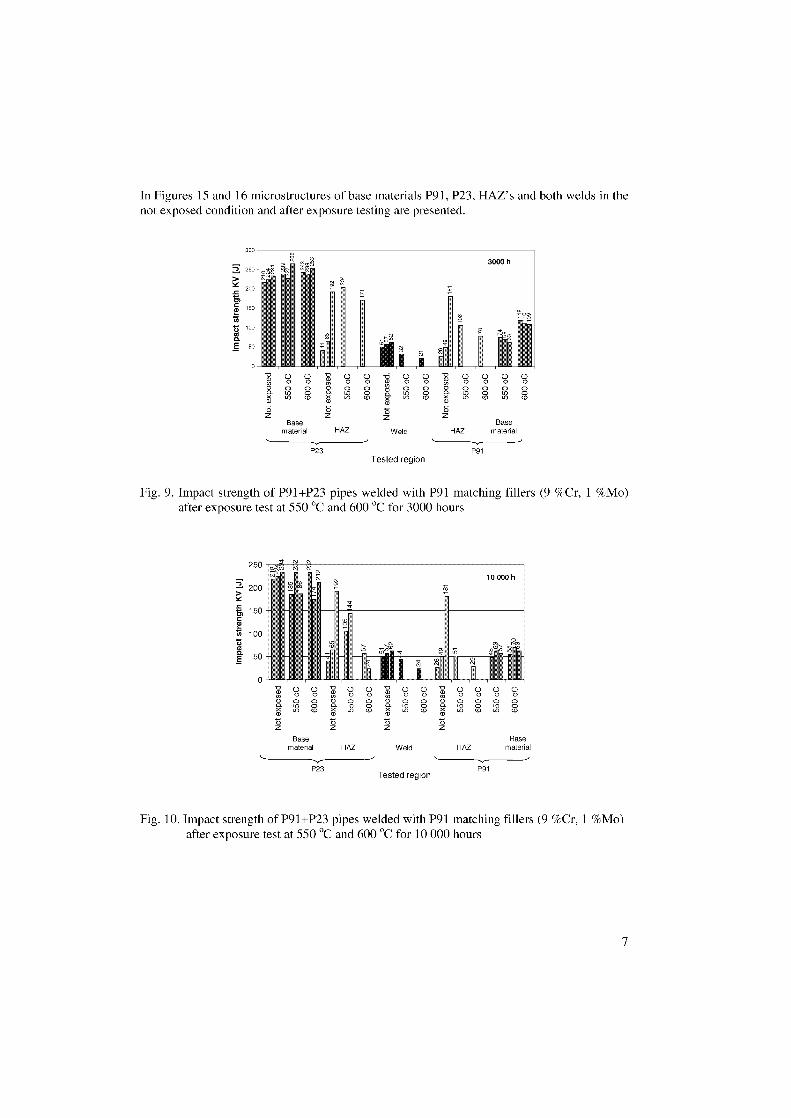
In Figures 15 and 16 microstructures of Base materials P91, P23, HAZ's and both welds in thenot exposed condition and after exposure testing are presented.
300
3000 h250 comA
>200
rn150
r, 100
E 50 -
72 0 0 -0 0 0O
o o 2 o oO a g c, a
-ß 0N oo a
0o‘o
-o 0 0 0 02o 0 0 0 0O 0 0 a
2SO 0 ..-• SOSO COSO 0CO k5 SO
0)SOx 0CO 0- SO 0 SO 0k5a> SO 10 SO CO
Ö öZ
Basez
aseöZ
öz
Basematerial HAZ Weld HAZ material
'.----..,..----'P23 P91
Tested region
Fig. 9. Impact strength of P91+P23 pipes welded with P91 matching fillers (9 %Cr, 1 %Mo)after exposure test at 550 °C and 600 °C for 3000 hours
00‘2,5' 0
000
720
0o0
0o0
a303
0o0
0o0
a303
0o0
0o0
V0o0
00O 1.1)
iii Lnöz
010 0-
öz
0“)
0(0 9-a3öz
SOSO 0(0öz
SON 0(0 SOSO 0(0
Base Basematerial HAZ Weld HAZ material
,--____,_____-, -----..„-----,P23
Tested region
Fig. 10. Impact strength of P91+P23 pipes welded with P91 matching fillers (9 %Cr, 1 %Mo)after exposure test at 550 °C and 600 °C for 10 000 hours
7
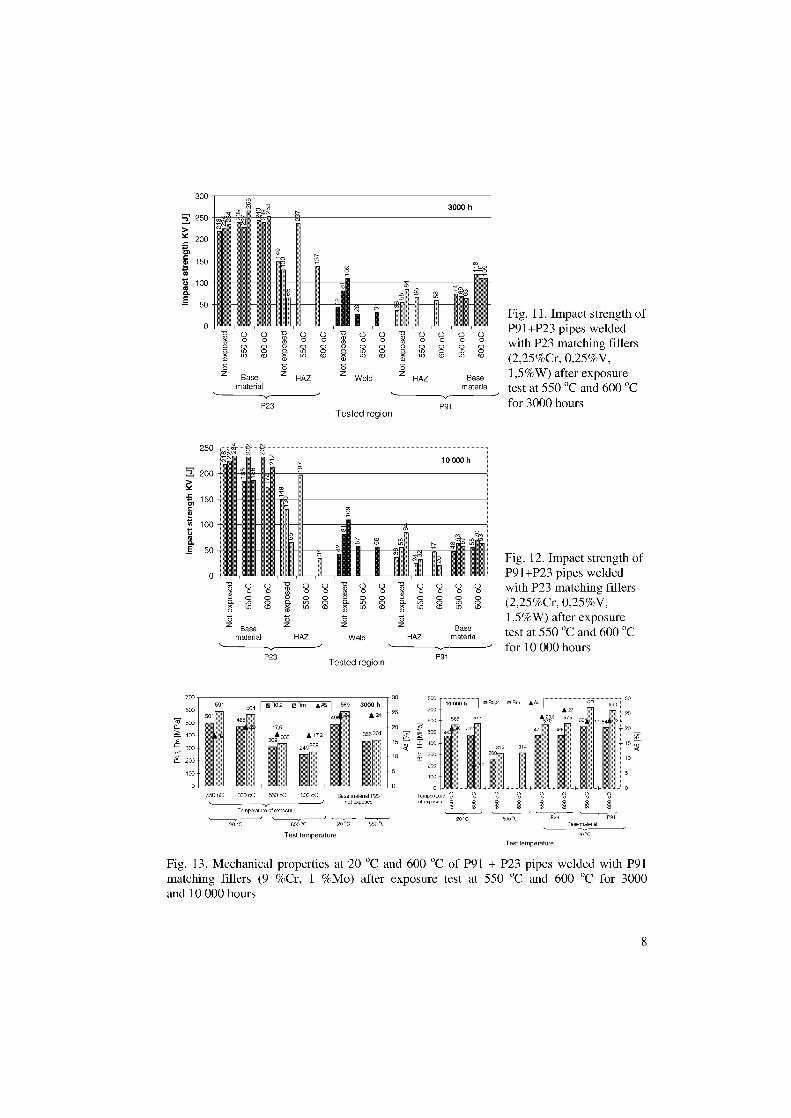
0 0o o 000
0 can'0
0z
0 00 00 0 Pt
0z
00
HAZWeld
-0, 0 0 -otl" 0 0o 0 0 o0
Base z HAZmaterial
0 0 00 0 0cs)
Basematerial
20 °C
56 0902 Erm AAS
P23 P91Tested region
Fig. 11. Impact strength ofP91+P23 pipes weldedwith P23 matching fillers(2,25%Cr, 0,25%V,1,5%W) after exposuretest at 550 °C and 600 °Cfor 3000 hours
Fig. 12. Impact strength ofo 13 P91+P23 pipes welded
C..) C..)0 0 3 oc, oc, ,,, (.) (.) 3 ö(.) (.) (.)
0 0 0 with P23 matching fillers2.2 . 2. 2 8 i S° S° , ° g„ . ,
0 00 0 0- 0 0 .0 . (O (2,25%Cr, 0,25%V,. . . . . . .
t t t t 1,5%W) after exposurez Base z z z Base test at 550 °C and 600 °Cmaterial HAZ Weld HAZ materia
"---,------ for 10 000 hoursP23
Tested regioin
250
2 200
2
15 150c
TA 10000o.E 50
P91
700 591
600507,7 500
400
300
d 200
100
0
30589 3000 h
£ 24 –254
17,5 – 20'55364
309 .17,2
– 15249269
– 10
–5
H- 0
550 oC 600 oC 550 oC 600 oC Base material P23not expose
Temperature of exposure-
20 °C 600 °C 20 °C 550 °C
Test temperature
Fig. 13. Mechanical properties at 20 °C and 600 °C of P91 + P23 pipes welded with P91matching fillers (9 %Cr, 1 %Mo) after exposure test at 550 °C and 600 °C for 3000and 10 000 hours
8
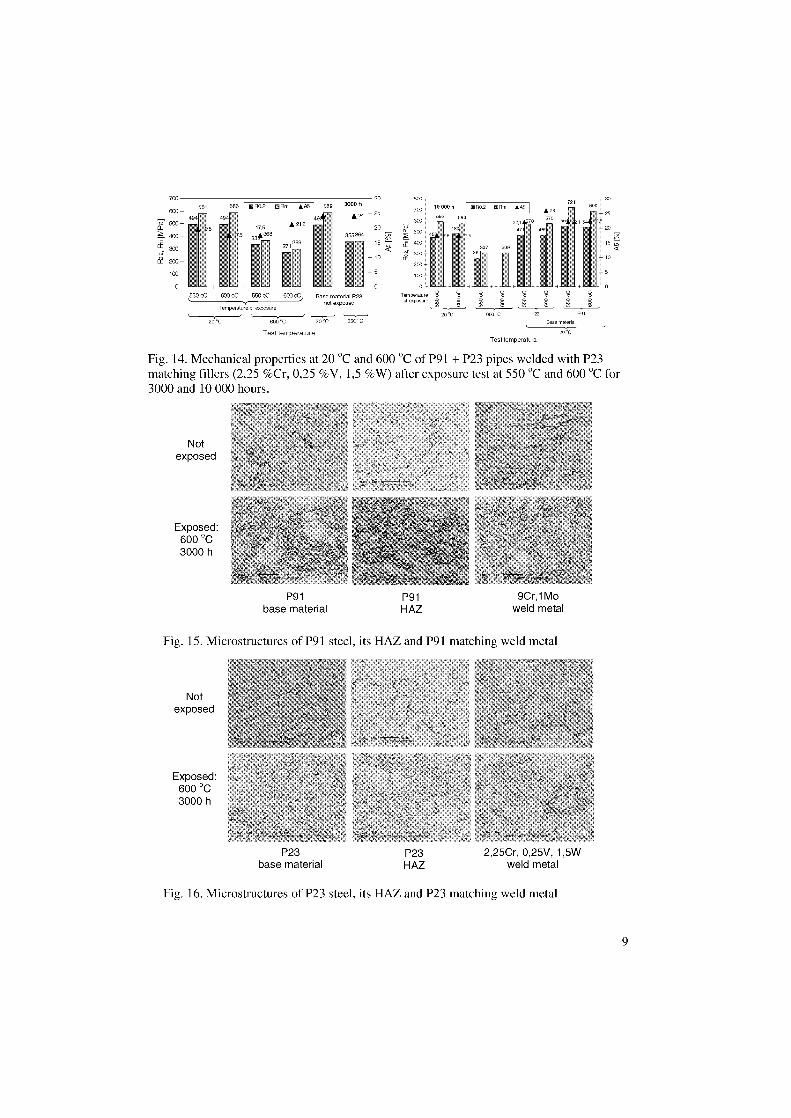
700
600
30 800
700—25
10 000 h Ä PS
30721 r
- 25591 586 R0,2 Rr5 £A5 589 3000 h 510,2 112 Pro ♦45
49421,2
175
mt22 1/1P.soo
o_
49, 49, 600— 20
593 T s l 1 51k-20
400
cE 300
33* 368 355 364600
— 15 40007 309
15
/55— 10 102200 200
100 —5 100
550 eC 600 oC 550 9C 600 0 Base material P23 Temperaturof exposurenot exposed 8 8' 8 H
NTemperature of exposure
P23 P9120 °C 600 °C 20 °C
550 °C Base material
Test temperature 20
Test temperature
Fig. 14. Mechanical properties at 20 °C and 600 °C of P91 + P23 pipes welded with P23matching fillers (2,25 %Cr, 0,25 %V, 1,5 %W) after exposure test at 550 °C and 600 °C for3000 and 10 000 hours.
Notexposed
Exposed:600 °C3000 h
P91 P91 9Cr,1Mo
base material
HAZ weld metal
Fig. 15. Microstructures of P91 steel, its HAZ and P91 matching weld metal
Notexposed
Exposed:600 °C3000 h
P23 P23 2,25Cr, 0,25V, 1,5W
base material HAZ weld metal
Fig. 16. Microstructures of P23 steel, its HAZ and P23 matching weld metal
9
5. Discussion of results
Hardness not exceeding 350 HV in the HAZ of T23 and T24 steel tube joints as well as hightoughness of the GTA weld metal in the as welded conditions [6], are a good basis for theapplication of those steels for water walls in supercritical boilers, without the need of PWHT.Pipes with greater wall thicknesses in P23 and P24 steels require PWHT to get the requiredimpact strength of the HAZ and weld metal. Mechanical properties at room and elevated tem-peratures of the P23 pipe welded joint are not lower than that of the base material.For welding dissimilar P91 + P23 pipe joints the P23 steel matching filler is a better choice,because its weld metal has a higher toughness than the P91 matching weld metal. The tensilestrength of welded joints is not lower than that of the P23 steel.The high Charpy V notch toughness of the P23 steel does not change much after exposure at550 °C and 600 °C for 3000 h and 10 000 h (Fig. 9-12). The influence of the ageing tempera-ture and time on the toughness of P91 steel is also not too big. After 10 000 h of exposure at550 °C and 600 °C the impact strength of the P23 steel matching weld shows still a value of56 J (Fig. 12). The scatter of the HAZ's test results is more evident than of the base materialand weld. It is caused by difficulties in the exact location of the Charpy V notch in the narrowHAZ region. The lowest toughness values are observed in the HAZ of P91 steel.The cross-weld specimens tensile tested at room temperature Show no significant differencesin the proof stress R0 ,2 and tensile strength Rff, after exposure at 550 °C and 600 °C for bothageing times (Fig. 13, 14). Tensile tests performed at 600 °C revealed some lower mechanicalproperties of both welded joints after 3000 h exposure at 600 °C. No differences are seen after10 000 h exposure. All specimens ruptured in the P23 base material.
References
[1] Directive 2001 /80/EC of the European Parliament and of the Council of 23 October 2001.htt :1/euro cur-tex/ ri/en/o7dat/2001/1 309/1 30920011127(.1100010021 df
[2] Najgebauer E, Patrycy A.: Commitment of the Polish power industry to the EC(in Polish). w.geoland.plidodaikiienergia xxxvienerg belcliatml
[3] Preliminary evaluation of the realizability of the 2001/80/EC Directive accession treaty bylarge combustion plants in Poland (in Polish)hup://www.geoland.plidodatkiienergia mvienergoprojckt.luml
[4] Brözda J., Zeman M., Pasternak J.: The first supercritical power unit in Poland.Weldability evaluation of new martensitic chromium steels with tungsten additions andproperties of welded joints. Proceedings of the 7 ffi Liege Conference. European Commis-sion, University de Liege, Vol. 21. p. 1711-1720 (Part III).
[5] Brözda J.: Weldability characteristics and welding technology guidelines of the advancedheat resisting steels. COST 522 Final Report. Gliwice, 07. 2003.
[6] Bendick W., Fuchs R., Hahn B., Heuser H., Vaillant J., Weber J.: Application capabilityand welding of modern heat-resistant steels (T/P91, T/P23, T/P24) for the maintenanceand refurbishment of power Station components. Paper presented on a seminar atRAFAKO (Poland), 2003.
[7] Pecha J., Kaszäsovä E., Boboni M.: Welding test welds of P23 steel and P23 + P91 steel.COST 522 Progress Report No 2, SES Kotly s.r.o. Tlma&, Slovakia, 02. 2002.
[8] Brözda J., Maciosowski A.: Weldability characteristics and welding technology guidelinesof the advanced heat resisting steels. COST 522 Progress Report No 5. Gliwice,05. 2003.
10
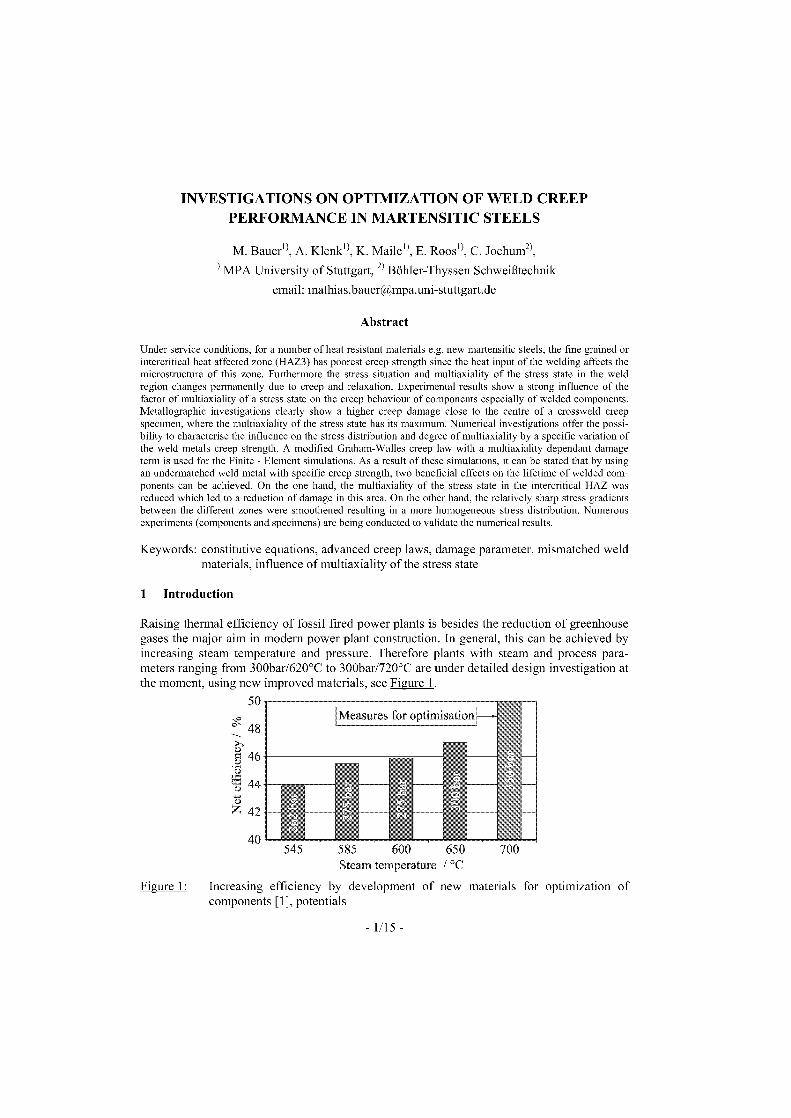
Measures for optimisation
INVESTIGATIONS ON OPTIMIZATION OF WELD CREEPPERFORMANCE IN MARTENSITIC STEELS
M. Bauern, A. Klenk i), K. E. Roosn, C. Jochum2),
1) MPA University of Stuttgart, 2) Böhler-Thyssen Schweißtechnik
email: mathias .bauer@mpa. uni-stuttgart. de
Abstract
Under service conditions, for a number of heat resistant materials e.g. new martensitic steels, the fine grained orintercritical heat affected zone (HAZ3) has poorest creep strength since the heat input of the welding affects themicrostructure of this zone. Furthermore the stress situation and multiaxiality of the stress state in the weldregion changes permanently due to creep and relaxation. Experimental results show a strong influence of thefactor of multiaxiality of a stress state on the creep behaviour of components especially of welded components.Metallographic investigations clearly show a higher creep damage dose to the centre of a crossweld creepspecimen, where the multiaxiality of the stress state has its maximum. Numerical investigations offer the possi-bility to characterise the influence on the stress distribution and degree of multiaxiality by a specific variation ofthe weld metals creep strength. A modified Graham-Walles creep law with a multiaxiality dependant damageterm is used for the Finite - Element simulations. As a result of these simulations, it can be stated that by usingan undermatched weld metal with specific creep strength, two beneficial effects on the lifetime of welded com-ponents can be achieved. On the one hand, the multiaxiality of the stress state in the intercritical HAZ wasreduced which led to a reduction of damage in this area. On the other hand, the relatively sharp stress gradientsbetween the different zones were smoothened resulting in a more homogeneous stress distribution. Numerousexperiments (components and specimens) are being conducted to validate the numerical results.
Keywords: constitutive equations, advanced creep laws, damage parameter, mismatched weldmaterials, influence of multiaxiality of the stress state
1 Introduction
Raising thermal efficiency of fossil fired power plants is besides the reduction of greenhousegases the major aim in modern power plant construction. In general, this can be achieved byincreasing steam temperature and pressure. Therefore plants with steam and process para-meters ranging from 300bar/620°C to 300bar/720°C are under detailed design investigation atthe moment, using new improved materials, see Figure 1.
50
48
46
44
Z 42
40545 585 600 650 700
Steam temperature / °C
Figure 1: Increasing efficiency by development of new materials for optimization ofcomponents [1], potentials
- 1/15 -
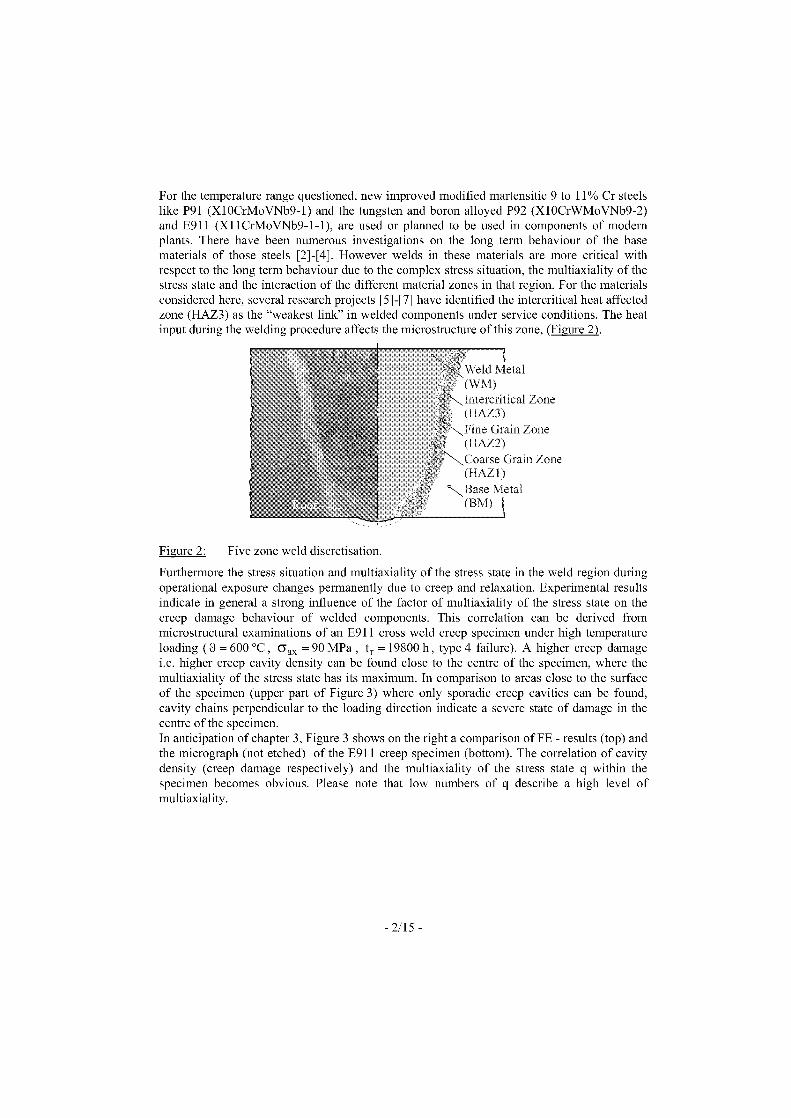
For the temperature range questioned, new improved modified martensitic 9 to 11% Cr steelslike P91 (X10CrMoVNb9-1) and the tungsten and boron alloyed P92 (X10CrWMoVNb9-2)and E911 (X11CrMoVNb9-1-1), are used or planned to be used in components of modernplants. There have been numerous investigations on the long term behaviour of the basematerials of those steels [2]-[4]. However welds in these materials are more critical withrespect to the long term behaviour due to the complex stress situation, the multiaxiality of thestress state and the interaction of the different material zones in that region. For the materialsconsidered here, several research projects [5]-[7] have identified the intercritical heat affectedzone (HAZ3) as the "weakest link" in welded components under service conditions. The heatinput during the welding procedure affects the microstructure of this zone, (Figure 2).
Weld MetalW M)
N Intercritical Zone(HAZ3)
NFine Grain Zone(HAZ2)
N,Coarse Grain Zone(HAZ I)
NBase Metal(BM)
Figure 2: Five zone weld discretisation.
Furthermore the stress situation and multiaxiality of the stress state in the weld region duringoperational exposure changes permanently due to creep and relaxation. Experimental resultsindicate in general a strong influence of the factor of multiaxiality of the stress state on thecreep damage behaviour of welded components. This correlation can be derived frommicrostructural examinations of an E911 cross weld creep specimen under high temperatureloading ( 3 = 600 °C, 6ax = 90 MPa , tr =19800 h, type 4 failure). A higher creep damagei.e. higher creep cavity density can be found dose to the centre of the specimen, where themultiaxiality of the stress state has its maximum. In comparison to areas dose to the surfaceof the specimen (upper part of Figure 3) where only sporadic creep cavities can be found,cavity chains perpendicular to the loading direction indicate a severe state of damage in thecentre of the specimen.In anticipation of chapter 3, Figure 3 shows on the right a comparison of FE - results (top) andthe micrograph (not etched) of the E911 creep specimen (bottom). The correlation of cavitydensity (creep damage respectively) and the multiaxiality of the stress state q within thespecimen becomes obvious. Please note that low numbers of q describe a high level ofmultiaxiality.
- 2/15 -
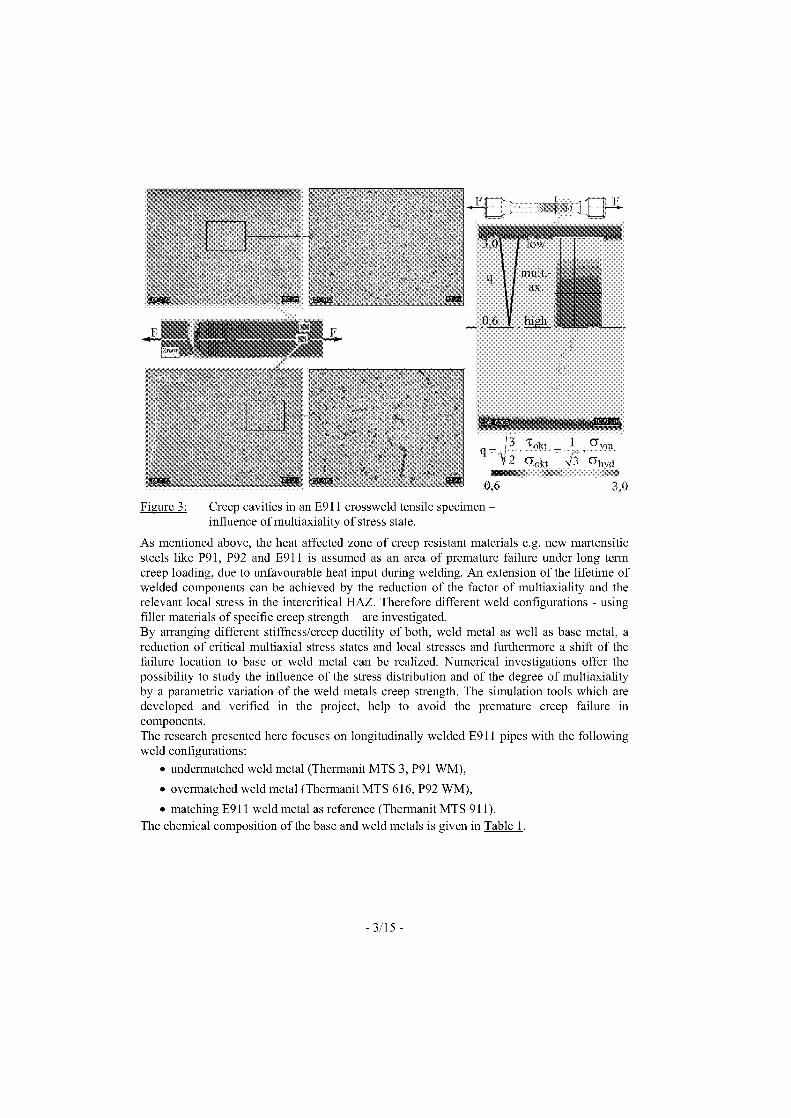
Figure 3: Creep cavities in an E911 crossweld tensile specimen –influence of multiaxiality of stress state.
As mentioned above, the heat affected zone of creep resistant materials e.g. new martensiticsteels like P91, P92 and E911 is assumed as an area of premature failure under long termcreep loading, due to unfavourable heat input during welding. An extension of the lifetime ofwelded components can be achieved by the reduction of the factor of multiaxiality and therelevant local stress in the intercritical HAZ. Therefore different weld configurations - usingfiller materials of specific creep strength – are investigated.By arranging different stiffness/creep ductility of both, weld metal as wen as base metal, areduction of critical multiaxial stress states and local stressec and furthermore a shift of thefailure location to base or weld metal can be realized. Numerical investigations offer thepossibility to study the influence of the stress distribution and of the degree of multiaxialityby a parametric variation of the weld metals creep strength. The simulation tools which aredeveloped and verified in the project, help to avoid the premature creep failure incomponents.The research presented here focuses an longitudinally welded E911 pipes with the followingweld configurations:
• undermatched weld metal (Thermanit MTS 3, P91 WM),
• overmatched weld metal (Thermanit MTS 616, P92 WM),
• matching E911 weld metal as reference (Thermanit MTS 911).
The chemical composition of the base and weld metals is given in Table 1.
- 3/15 -
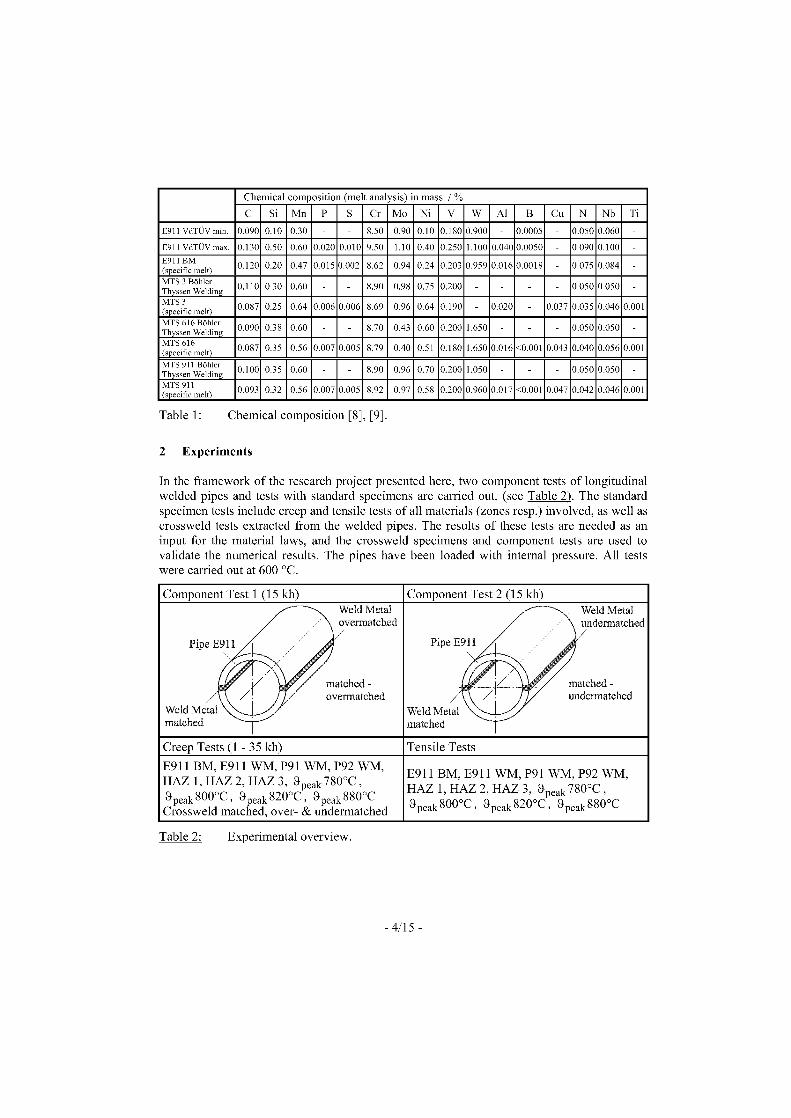
Chemical composition (me t analysis) in mass / %C Si Mn P S Cr Mo Ni V W Al B Cu N Nb Ti
E911 VdTÜV min. 0.090 0.10 0.30 8.50 0.90 0.10 0.180 0.900 0.0005 0.050 0.060 -
E911 VdTÜV max. 0.130 0.50 0.60 0.020 0.010 9.50 1.10 0.40 0.250 1.100 0.040 0.0050 0.090 0.100 -
E911 BM(specific melt) 0.120 0.20 0.47 0.015 0.002 8.62 0.94 0.24 0.203 0.959 0.016 0.0018 0.075 0.084 -
MTS 3 BöhlerThyssen Welding 0.110 0.30 0.60 - - 8.90 0.98 0.75 0.200 - - - - 0.050 0.050 -
MTS 3(specific melt) 0.087 0.25 0.64 0.006 0.006 8.69 0.96 0.64 0.190 0.020 0.037 0.035 0.046 0.001
MTS 616 BöhlerThyssen Welding 0.090 0.38 0.60 8.70 0.43 0.60 0.200 1.650 0.050 0.050 -
MTS 616(specific melt) 0.087 0.35 0.56 0.007 0.005 8.79 0.40 0.51 0.180 1.650 0.016 <0.001 0.043 0.040 0.056 0.001
MTS 911 BöhlerThyssen Welding 0.100 0.35 0.60 - - 8.90 0.96 0.70 0.200 1.050 - - - 0.050 0.050 -
MTS 911(specific melt) 0.093 0.32 0.56 0.007 0.005 8.92 0.97 0.58 0.200 0.960 0.017 <0.001 0.047 0.042 0.046 0.001
Table 1: Chemical composition [8], [9].
2 Experiments
In the framework of the research project presented here, two component tests of longitudinalwelded pipes and tests with standard specimens are carried out, (see Table 2). The standardspecimen tests include creep and tensile tests of all materials (zones resp.) involved, as well ascrossweld tests extracted from the welded pipes. The results of these tests are needed as aninput for the material laws, and the crossweld specimens and component tests are used tovalidate the numerical results. The pipes have been loaded with internal pressure. All testswere carried out at 600 °C.
Component Test 1 (15 kh) Component Test 2 (15 kh)Weld Metal \ Weld Metalovcrmatched \ undermatched
Pipe E911 Pipe E911
7matched -i/ / overmatched
matched - undermatched
Weld Metal Weld Metalmatched matched
Creep Tests (1 - 35 kh) Tensile Tests
E911 BM, E911 WM, P91 WM, P92 WM,HAZ 1, HAZ 2, HAZ 3, -9' peak 780 °C ,a peak 800°C , apeak 820°C , ä peak 880°CCrossweld matched, over- & undermatched
E911 BM, E911 WM, P91 WM, P92 WM,HAZ 1, HAZ 2, HAZ 3, 3 peak 780°C ,8 eai 800°C , 8, peak 820°C , -9 peak 880°C
P (
Table 2: Experimental overview.
- 4/15 -
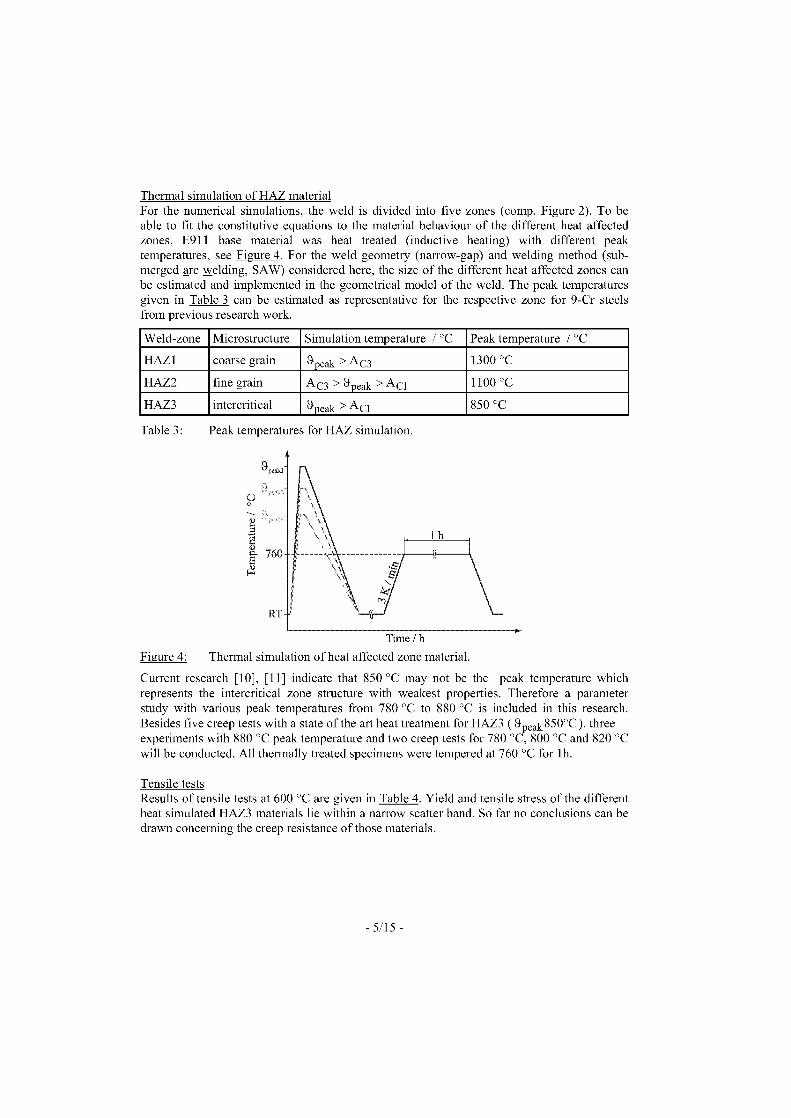
Thermal simulation of HAZ materialFor the numerical simulations, the weld is divided into five zones (comp. Figure 2). To beable to fit the constitutive equations to the material behaviour of the different heat affectedzones, E911 base material was heat treated (inductive heating) with different peaktemperatures, see Figure 4. For the weld geometry (narrow-gap) and welding method (sub-merged arc welding, SAW) considered here, the size of the different heat affected zones canbe estimated and implemented in the geometrical model of the weld. The peak temperaturesgiven in Table 3 can be estimated as representative for the respective zone for 9-Cr steelsfrom previous research work.
Weld-zone Microstructure Simulation temperature / °C Peak temperature / °C
HAZ 1 coarse grain apeak > AC3 1300 °C
HAZ2 fine grain AC3 > apeak > AC1 1100 °C
HAZ3 intercritical apeak > AC1 850 °C
Table 3: Peak temperatures for HAZ simulation.
g 760
E2
RT
Time / h
Figure 4: Thermal simulation of heat affected zone material.
Current research [10], [11] indicate that 850 °C may not be the peak temperature whichrepresents the intercritical zone structure with weakest properties. Therefore a parameterstudy with various peak temperatures from 780 °C to 880 °C is included in this research.
(peakBesides five creep tests with a state of the art heat treatment for HAZ3 850°C ), threeexperiments with 880 °C peak temperature and two creep tests for 780 °C, 800 °C and 820 °Cwill be conducted. All thermally treated specimens were tempered at 760 °C for lh.
Tensile testsResults of tensile tests at 600 °C are given in Table 4. Yield and tensile stress of the differentheat simulated HAZ3 materials lie within a narrow scatter band. So far no conclusions can bedrawn concerning the creep resistance of those materials.
- 5/15 -
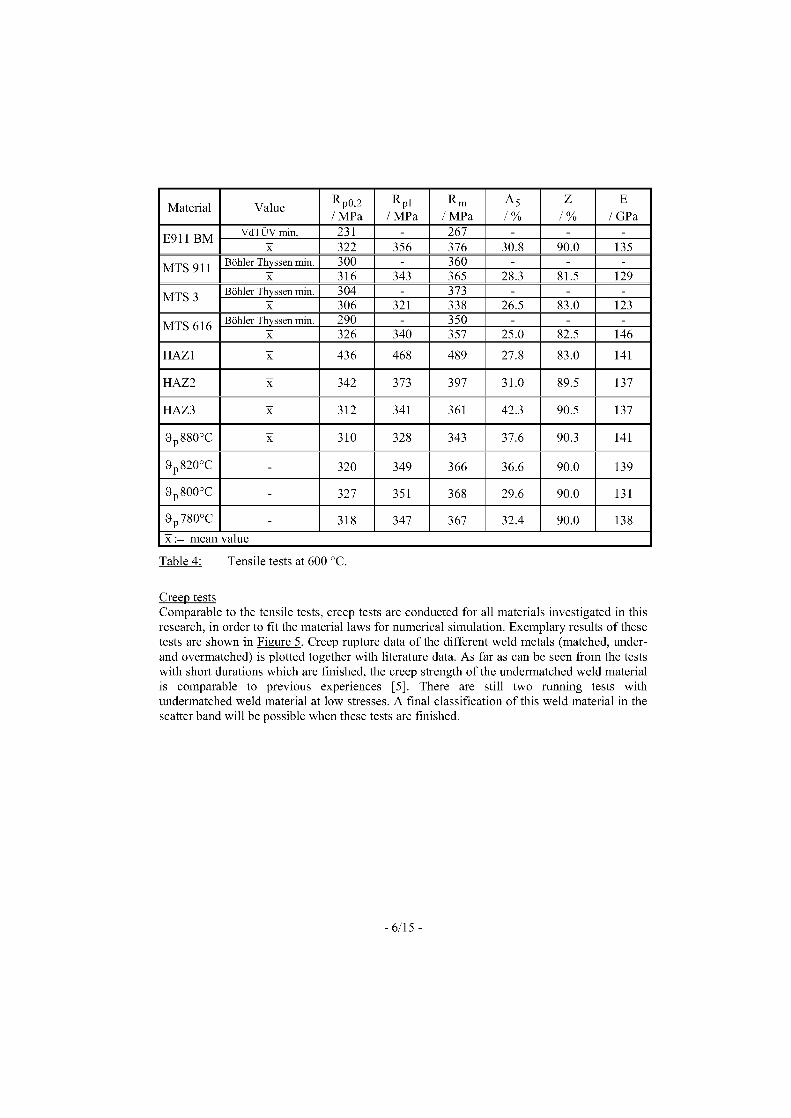
Material ValueR p0,2
/ MPa
R p1
/ MPa
Rm
/ MPa
A5
/ %
Z
/%
E
/GPa
E911 BMVdTÜV min. 231 267 - - -
x 322 356 376 30.8 90.0 135
MTS 911 Böhler Thyssen min. 300 - 360I
Y( 316 343 365 28.3 81.5 129
MTS 3Böhler Thyssen min. 304 - 373I
Y( 306 321 338 26.5 83.0 123
MTS 616 Böhler Thyssen min. 290 - 350I
Y( 326 340 357 25.0 82.5 146
HAZ1 I Y( 436 468 489 27.8 83.0 141
HAZ2 I Y( 342 373 397 31.0 89.5 137
HAZ3 I Y( 312 341 361 42.3 90.5 137
9, 880°CP I Y( 310 328 343 37.6 90.3 141
9, 820°CP - 320 349 366 36.6 90.0 139
9, 800°CP - 327 351 368 29.6 90.0 131
-9 780°C - 318 347 367 32.4 90.0 138
x := mean value
Table 4: Tensile tests at 600 °C.
Creep tests Comparable to the tensile tests, creep tests are conducted for all materials investigated in thisresearch, in order to fit the material laws for numerical simulation. Exemplary results of thesetests are shown in Figure 5. Creep rupture data of the different weld metals (matched, under-and overmatched) is plotted together with literature data. As far as can be seen from the testswith short durations which are finished, the creep strength of the undermatched weld materialis comparable to previous experiences [5]. There are still two running tests withundermatched weld material at low stressec. A final classification of this weld material in thescatter band will be possible when these tests are finished.
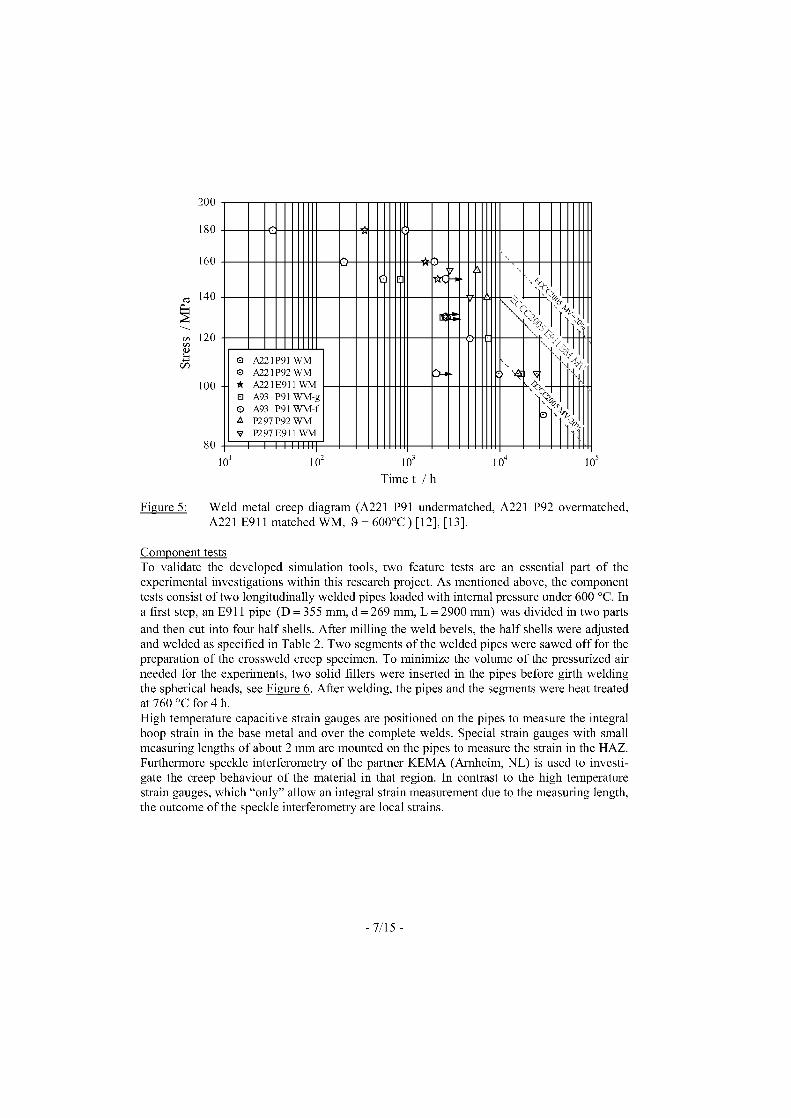
200
180
160
100
80
C t c
0 0
..s
-
1,
0 A221P91 WM0 A221P92 WM
- * A221E911 WMD A93 P91 WM-g0 A93 P91 WM-fA P297 P92 WMv P297 E911 WM
1 1 1 1 1 11111
3 \1 ''0
1 1 1—
10`
102
103
lo'
io5
Time t / h
Figure 5: Weld metal creep diagram (A221 P91 undermatched, A221 P92 overmatched,A221 E911 matched WM, 3 = 600°C) [12], [13].
Component testsTo validate the developed Simulation tools, two feature tests are an essential part of theexperimental investigations within this research project. As mentioned above, the componenttests consist of two longitudinally welded pipes loaded with internal pressure under 600 °C. Ina first step, an E911 pipe (D = 355 mm, d = 269 mm, L = 2900 mm) was divided in two parts
and then cut into four half shells. After milling the weld bevels, the half shells were adjustedand welded as specified in Table 2. Two segments of the welded pipes were sawed off for thepreparation of the crossweld creep specimen. To minimize the volume of the pressurized airneeded for the experiments, two solid fillers were inserted in the pipes before girth weldingthe spherical heads, see Figure 6. After welding, the pipes and the segments were heat treatedat 760 °C for 4 h.High temperature capacitive strain gauges are positioned on the pipes to measure the integralhoop strain in the bare metal and over the complete welds. Special strain gauges with smallmeasuring lengths of about 2 mm are mounted on the pipes to measure the strain in the HAZ.Furthermore speckle interferometry of the partner KEMA (Arnheim, NL) is used to investi-gate the creep behaviour of the material in that region. In contrast to the high temperaturestrain gauges, which "only" allow an integral strain measurement due to the measuring length,the outcome of the speckle interferometry are local strains.
- 7/15 -
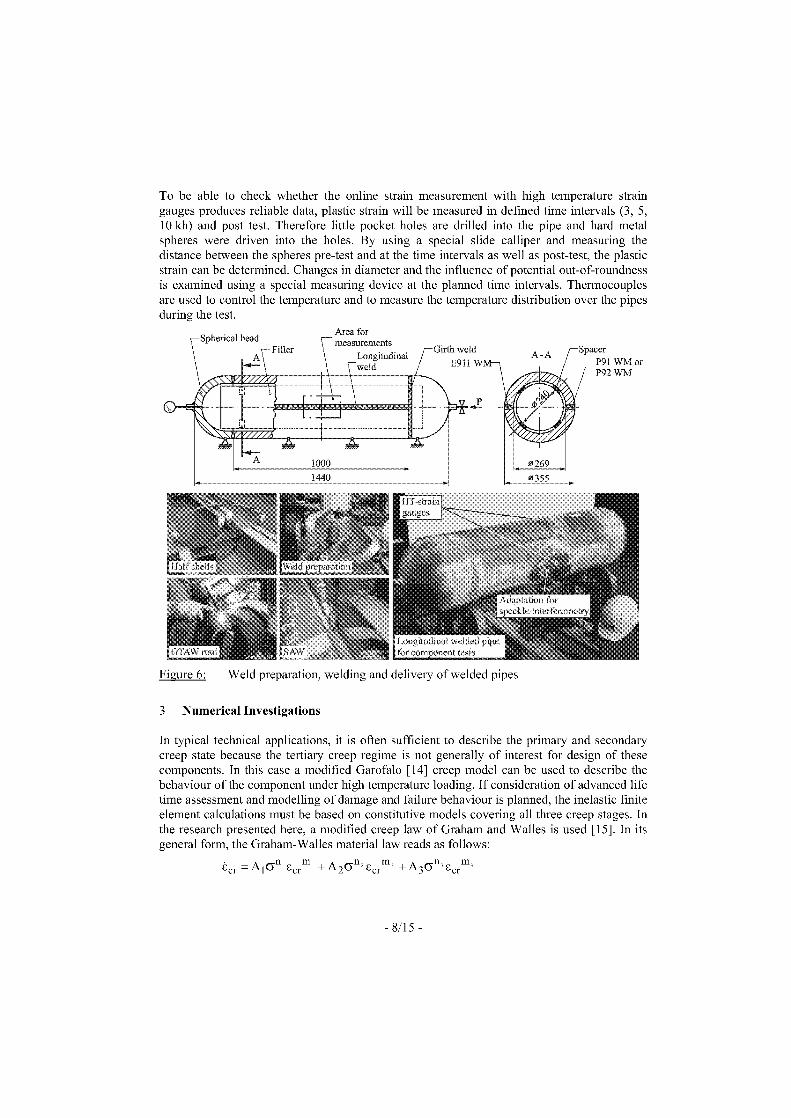
Area formeasurements
Longitudinalweld
To be able to check whether the online strain measurement with high temperature straingauges produces reliable data, plastic strain will be measured in defined time intervals (3, 5,10 kh) and post test. Therefore little pocket holes are drilled into the pipe and hard metalspheres were driven into the holes. By using a special slide calliper and measuring thedistance between the spheres pre-test and at the time intervals as well as post-test, the plasticstrain can be determined. Changes in diameter and the influence of potential out-of-roundnessis examined using a special measuring device at the planned time intervals. Thermocouplesare used to control the temperature and to measure the temperature distribution over the pipesduring the test.
Figure 6: Weld preparation, welding and delivery of welded pipes
3 Numerical Investigations
In typical technical applications, it is often sufficient to describe the primary and secondarycreep state because the tertiary creep regime is not generally of interest for design of thesecomponents. In this case a modified Garofalo [14] creep model can be used to describe thebehaviour of the component under high temperature loading. If consideration of advanced lifetime assessment and modelling of damage and failure behaviour is planned, the inelastic finiteelement calculations must be based an constitutive models covering all three creep stages. Inthe research presented here, a modified creep law of Graham and Walles is used [15]. In itsgeneral form, the Graham-Walles material law reads as follows:
cr A 1 6n ' + A2 (511 ' E cr in2 + A3 (5113 Ecrill'
- 8/15 -
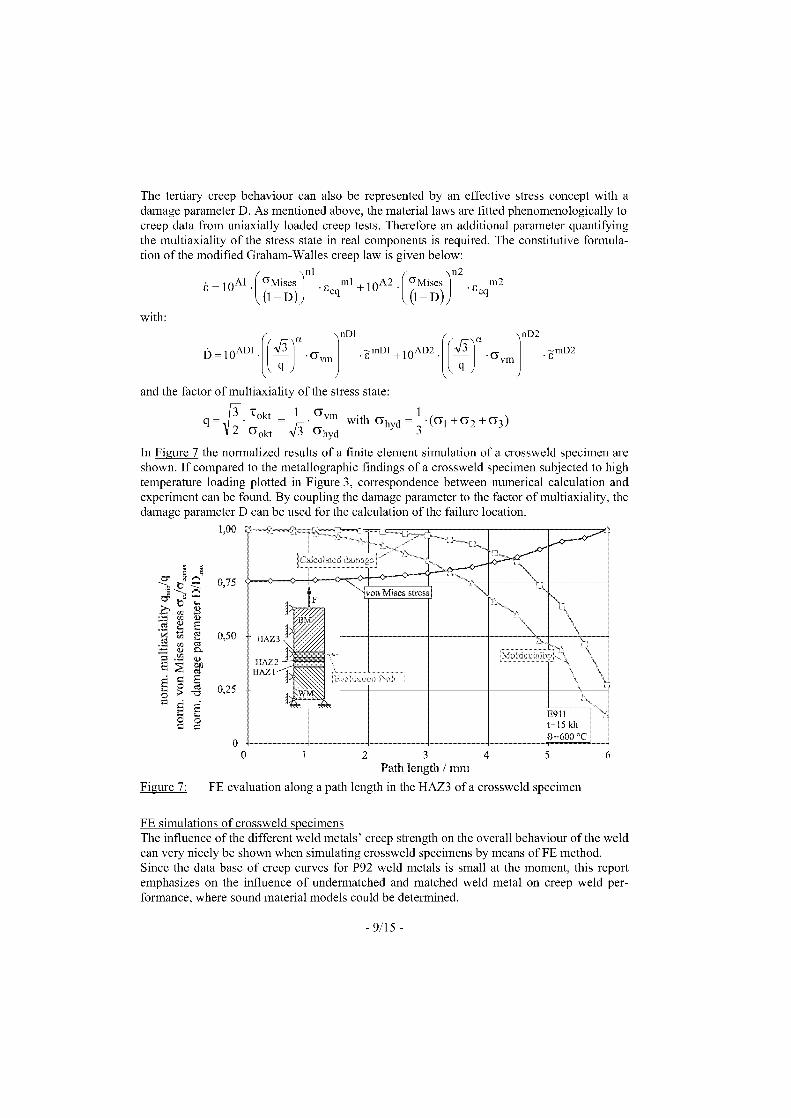
The tertiary creep behaviour can also be represented by an effective stress concept with adamage parameter D. As mentioned above, the material laws are fitted phenomenologically tocreep data from uniaxially loaded creep tests. Therefore an additional parameter quantifyingthe multiaxiality of the stress state in real components is required. The constitutive formula-tion of the modified Graham-Walles creep law is given below:
•oAt aMises • E ml + 10A2 G Mises n2 • E m2
n1 7
(1 — D) )eq — D) )eq
with:nD1
nD2
b=i0ANGvm
q
mD1 AD2E +10 [7, vrn
—mD2• E
and the factor of multiaxiality of the stress state:
3 1okt _ 1 \In with crhyd = — • (CY1 +6 2 +63)1
2 Gokt V Ghyd 3
In Figure 7 the normalized results of a finite element Simulation of a crossweld specimen areshown. If compared to the metallographic findings of a crossweld specimen subjected to hightemperature loading plotted in Figure 3, correspondence between numerical calculation andexperiment can be found. By coupling the damage parameter to the factor of multiaxiality, thedamage parameter D can be used for the calculation of the failure location.
2 3 4
5
6Path length / mm
Figure 7: FE evaluation along a path length in the HAZ3 of a crossweld specimen
FE simulations of crossweld specimens The influence of the different weld metals' creep strength on the overall behaviour of the weldcan very nicely be shown when simulating crossweld specimens by means of FE method.Since the data bare of creep curves for P92 weld metals is small at the moment, this reportemphasizes on the influence of undermatched and matched weld metal on creep weld Per-formance, where sound material models could be determined.
q =
- 9/15 -
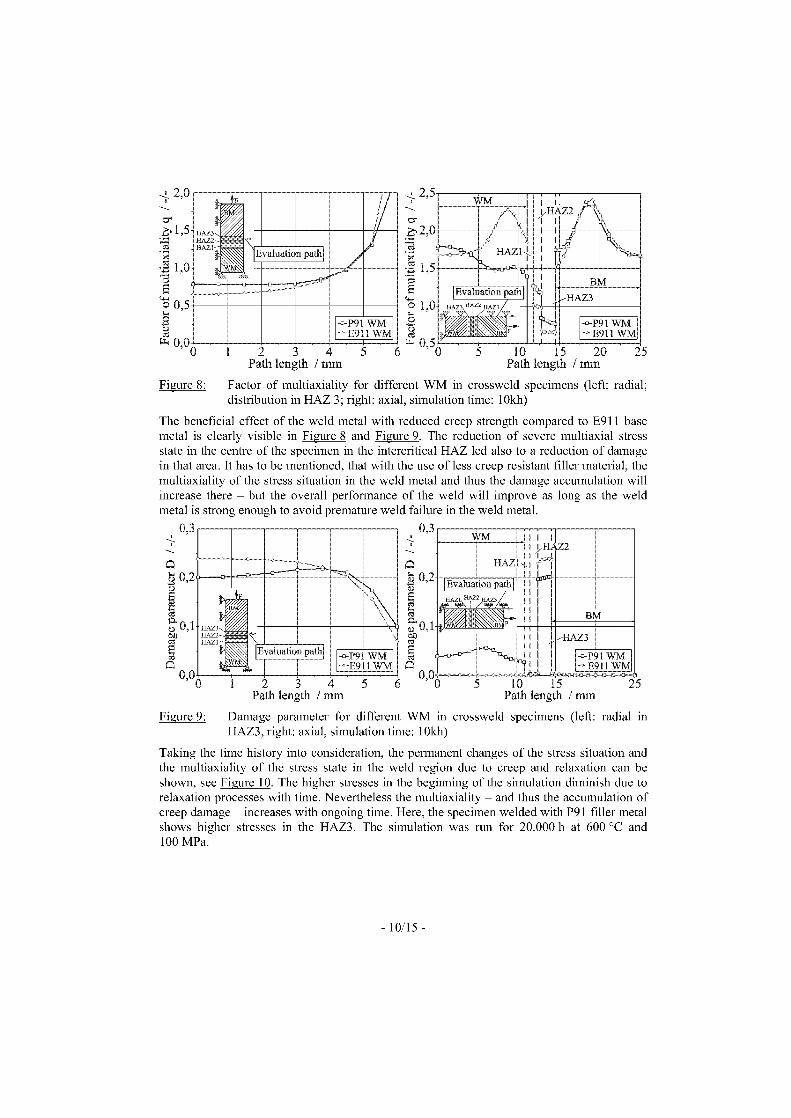
2,0
Figure 8: Factor of multiaxiality for different WM in crossweld specimens (left: radial;distribution in HAZ 3; right: axial, simulation time: 10kh)
The beneficial effect of the weld metal with reduced creep strength compared to E911 basemetal is clearly visible in Figure 8 and Figure 9. The reduction of severe multiaxial stressstate in the centre of the specimen in the intercritical HAZ led also to a reduction of damagein that area. It has to be mentioned, that with the use of less creep resistant filier material, themultiaxiality of the stress situation in the weld metal and thus the damage accumulation willincrease there – but the overall performance of the weld will improve as long as the weldmetal is strong enough to avoid premature weld failure in the weld metal.
Figure 9: Damage parameter for different WM in crossweld specimens (left: radial inHAZ3, right: axial, simulation time: l0kh)
Taking the time history into consideration, the permanent changes of the stress situation andthe multiaxiality of the stress state in the weld region due to creep and relaxation can beshown, see Figure 10. The higher stresses in the beginning of the simulation diminish due torelaxation processes with time. Nevertheless the multiaxiality – and thus the accumulation ofcreep damage – increases with ongoing time. Here, the specimen welded with P91 filier metalShows higher stresses in the HAZ3. The simulation was run for 20.000 h at 600 °C and100 MPa.
- 10/15 -
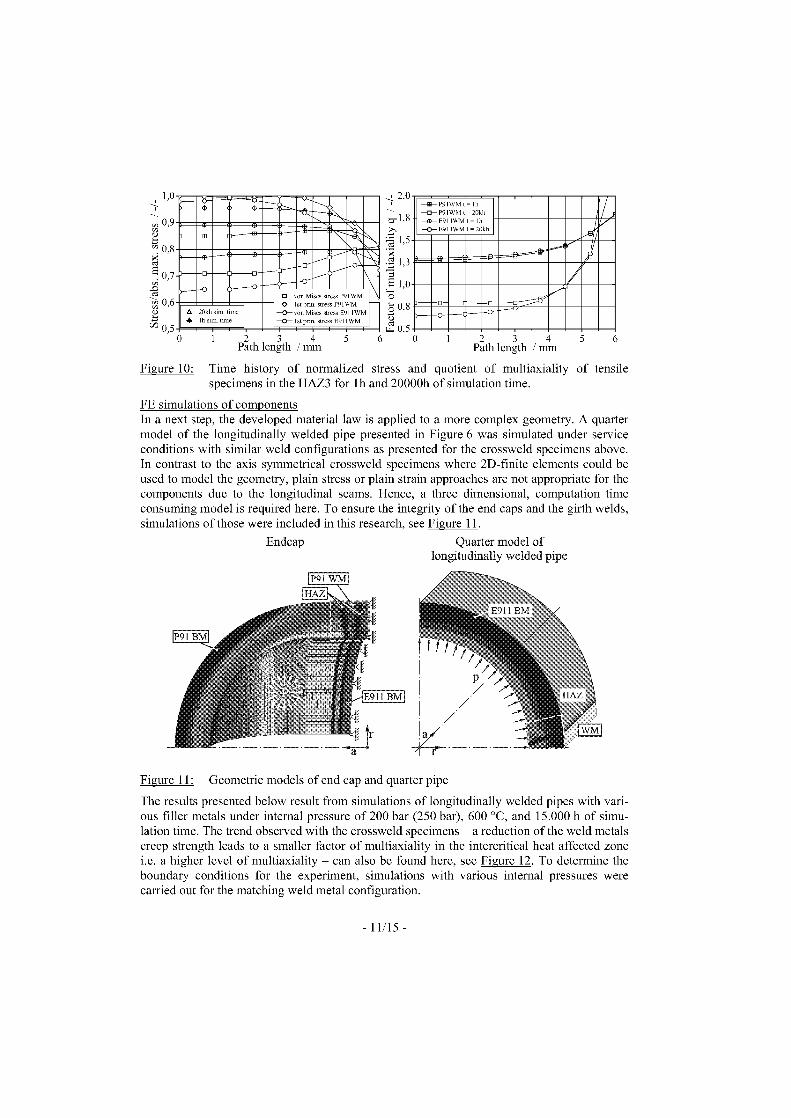
2,0
0,50
5, 0,8
0,50
...--Numwmal,MaInntam.- mam
*KZWminigiaremiM_Reininiimapire
P man-,,,-. M • t,cq stress P91 WM
A 20kh sim tune-- Ist pm . stress P9I WM—0— . M ,cq stress E9I I WM♦ Ih surr tune —0— Ist prIn. stress E911 WM
1 2 3 4 5 6
Path length / nun
—0——ED——0—
.—811—P9IWM
P9 I
E9 I
.
E9I1WM
WM 1=
I WM
.t= Ih
20kht = I ht = 20kh
.
Eirr
, /,i
d.____—
)---0---0---°
2 3 4 5
6Path length / mm
1,0
0,9
0,8
5 0,7
0,6
Figure 10: Time history of normalized stress and quotient of multiaxiality of tensilespecimens in the HAZ3 for lh and 20000h of simulation time.
FE simulations of components In a next step, the developed material law is applied to a more complex geometry. A quartermodel of the longitudinally welded pipe presented in Figure 6 was simulated under serviceconditions with similar weld configurations as presented for the crossweld specimens above.In contrast to the axis symmetrical crossweld specimens where 2D-finite elements could beused to model the geometry, plain stress or plain strain approaches are not appropriate for thecomponents due to the longitudinal seams. Hence, a three dimensional, computation timeconsuming model is required here. To ensure the integrity of the end caps and the girth welds,simulations of those were included in this research, see Figure 11.
Endcap Quarter model oflongitudinally welded pipe
Figure 11: Geometric modeln of end cap and quarter pipe
The results presented below result from simulations of longitudinally welded pipes with vari-ous filier metals under internal pressure of 200 bar (250 bar), 600 °C, and 15.000 h of simu-lation time. The trend observed with the crossweld specimens – a reduction of the weld metalscreep strength leads to a smaller factor of multiaxiality in the intercritical heat affected zonei.e. a higher level of multiaxiality – can also be found here, see Figure 12. To determine theboundary conditions for the experiment, simulations with various internal pressures werecarried out for the matching weld metal configuration.
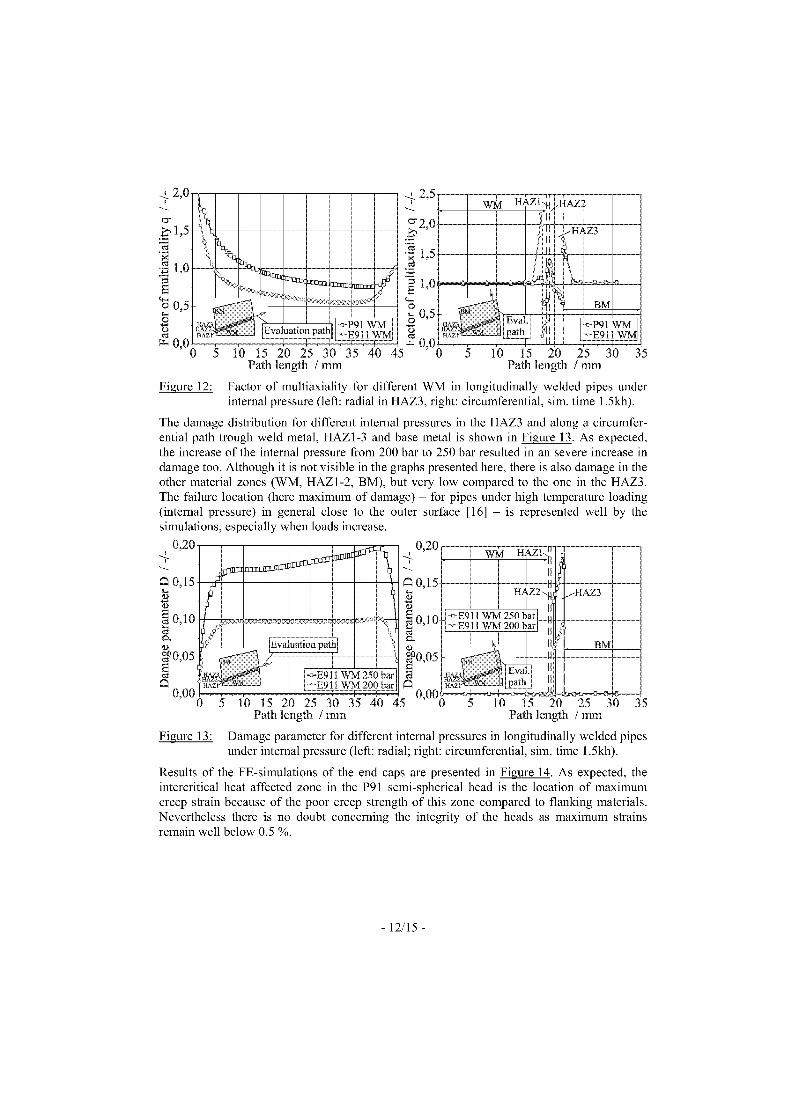
2,0
e 1,5
1,0
0 0,500
Lz-i 0'000 5 10 15 20 25 30 35 40
Path length / mm
2,5
cr 2 0'
-7,• 1,5
1,0
sc.) 0,5
ceuLT0- 0'00 0
WM HAZ 1
/ 0
Figure 12: Factor of multiaxiality for different WM in longitudinally welded pipes underinternal pressure (left: radial in HAZ3, right: circumferential, sim. time 1.51(h).
The damage distribution for different internal pressures in the HAZ3 and along a circumfer-ential path trough weld metal, HAZ1-3 and base metal is shown in Figure 13. As expected,the increase of the internal pressure from 200 bar to 250 bar resulted in an severe increase indamage too. Although it is not visible in the graphs presented here, there is also damage in theother material zones (WM, HAZ1-2, BM), but very low compared to the one in the HAZ3.The failure location (here maximum of damage) – for pipes under high temperature loading(internal pressure) in general dose to the outer surface [16] – is represented well by thesimulat'ons, especially when loads increase.
0,20 0,20
Ca 0,15
P0,10
L,
go 0,05 e• 0,05--,-E911 WM 250 bar e
0 00 ♦2r
,—E911 WM 200 bar
1 0,000 5 10 15 20 25 30 35 40 45 0
Path length / mm
Figure 13: Damage parameter for different internal pressures in longitudinally welded pipesunder internal pressure (left: radial; right: circumferential, sim. time 1.5kh).
Results of the FE-simulations of the end caps are presented in Figure 14. As expected, theintercritical heat affected zone in the P91 semi-spherical head is the location of maximumcreep strain because of the poor creep strength of this zone compared to flanking materials.Nevertheless there is no doubt concerning the integrity of the heads as maximum strainsremain well below 0.5 %.
11:111•1111--E911 WM 250 bar
HAZ2 HÄZ3 •s
B 111-,-E911 WM 200 bar
HAZHAZ2
' 1
10 15 20 25 30 35Path length / mm
- 12/15 -
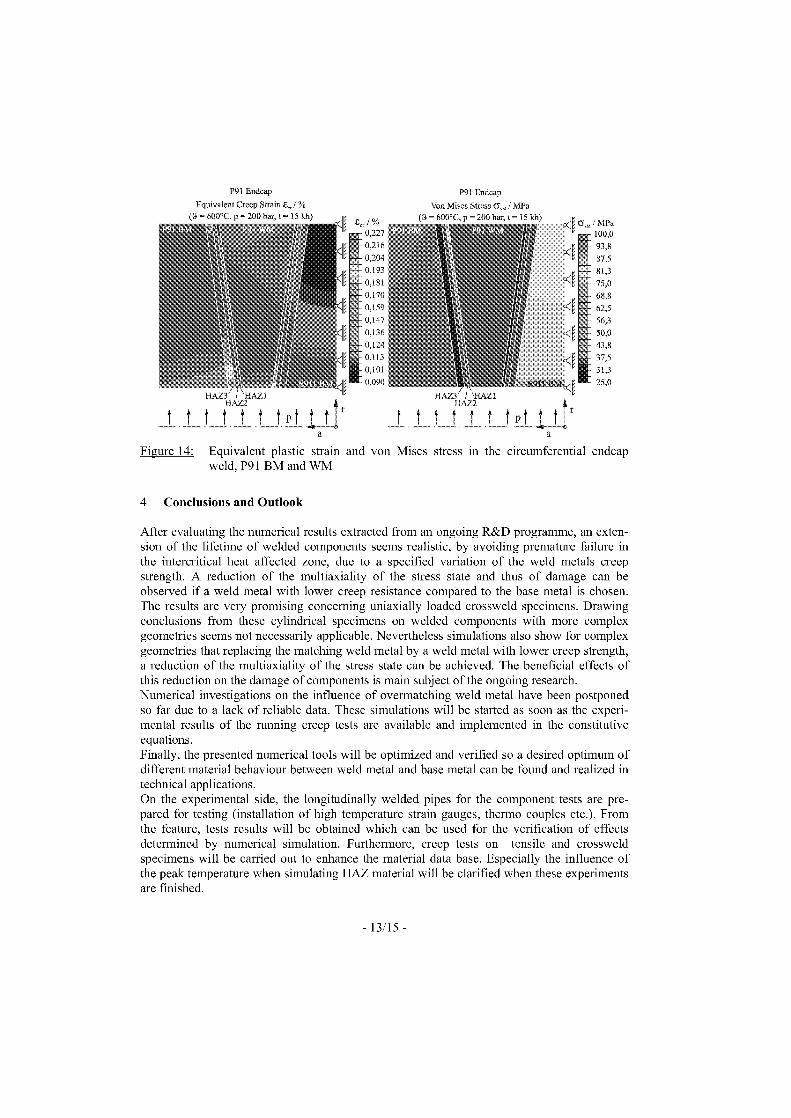
0,2270,2160,2040,1930,1810,1700,1590,1470,1360,1240,1130,1010,090
P91 Endcap
Equivalent Creep Strain 0,, / %= 600°C. n = 200 bar, t = 15 kh)
11AL.1 `HAZ1HAZ2ttfttttptft
a
P91 Endcap
Von Mises Stress CT,„ / MPa(a = 600°C. p = 200 bar, t = 15 kh)
Figure 14: Equivalent plastic strain and von Mises stress in the circumferential endcapweld, P91 BM and WM
4 Conclusions and Outlook
After evaluating the numerical results extracted from an ongoing R&D programme, an exten-sion of the lifetime of welded components seems realistic, by avoiding premature failure inthe intercritical heat affected zone, due to a specified variation of the weld metals creepstrength. A reduction of the multiaxiality of the stress state and thus of damage can beobserved if a weld metal with lower creep resistance compared to the base metal is chosen.The results are very promising concerning uniaxially loaded crossweld specimens. Drawingconclusions from these cylindrical specimens on welded components with more complexgeometries seems not necessarily applicable. Nevertheless simulations also show for complexgeometries that replacing the matching weld metal by a weld metal with lower creep strength,a reduction of the multiaxiality of the stress state can be achieved. The beneficial effects ofthis reduction on the damage of components is main subject of the ongoing research.Numerical investigations on the influence of overmatching weld metal have been postponedso far due to a lack of reliable data. These simulations will be started as soon as the experi-mental results of the running creep tests are available and implemented in the constitutiveequations.Finally, the presented numerical tools will be optimized and verified so a desired optimum ofdifferent material behaviour between weld metal and base metal can be found and realized intechnical applications.On the experimental side, the longitudinally welded pipes for the component tests are pre-pared for testing (installation of high temperature strain gauges, thermo couples etc.). Fromthe feature, tests results will be obtained which can be used for the verification of effectsdetermined by numerical simulation. Furthermore, creep tests on tensile and crossweldspecimens will be carried out to enhance the material data base. Especially the influence ofthe peak temperature when simulating HAZ material will be clarified when these experimentsare finished.
- 13/15 -
5 Acknowledgement
Main parts of the investigations presented in this paper are supported by the Research Asso-ciation of the Iron and Steel Manufacturing Industry (AVIF) in Germany under contract no.A221 -MISMATCH. The support is highly acknowledged. Furthermore the investigations aresupported by the COST group — mainly in the framework of COST 536 and by the membersof the Work Group W1 of the German Creep Group. These contributions are appreciated.
6 References
[1] Tschaffon, H.:COMTES700 — an the way to 700°C Power Plant.Int. Workshop: Performance and Requirements of Structural Materials for ModernHigh Efficient Power Plants, Sept. 2005, Darmstadt, Germany
[2] Hahn, B., V. Baumhoff and M. Zschau:Use of Xl0CrMoVNb9-1 Steel in Power Plant Retrofitting Applications - Experienceand Application PotentialAdvanced Heat Resistant Steel for Power Generation. Eds. R. Viswanathan and J.Nutting. Conference Proceedings. 27-29 April. 1998. San Sebastian. Spain
Bendick, W., K. Haarmann and M. Zschau:E911 Ein neuer Werkstoff für Dampfleitungen im KraftwerksbauVGB Kraftwerkstechnik 5/2000
Hald, J.:Long-term Stability of 9- to 12% Cr Steels — Current Understanding and FuturePerspectivesVGB PowerTech 12/2004
Maile, K. et al.:Zeitstandverhalten von P91-Schweißverbindungen.19. Vortragsveranstaltung AGW/AGHT, Düsseldorf, 1996, Germany
Husemann, R. U. et. al.:Langzeiteigenschaften von Schweißverbindungen moderner Stähle für Dampferzeuger23. Vortragsveranstaltung AGW/AGHT, Düsseldorf, 2000, Germany
Maile, K. et. al.:Behaviour of similar welds in T24 Tubes and E911 pipes3rd HIDA and Integrity Conference, Integrity of High Temperature Repair Welds,Oeiras-Lisabon, Portugal, 16-18 September, 2002, pp. 69/80
TÜV Rheinland/Berlin Brandenburg:VdTÜV-Werkstoffblatt 522/2 and 522/3
Böhler Thyssen Welding:SchweißzusätzeBöhler Tyssen Schweisstechnik, 2002, Hamm, Germany
- 14/15 -
[10] Ennis, P. J.:The mechanical properties and microstructures of 9% chromium Steel P92 weldments.OMMI (Vol. 1, Issue2), 2002
[11] Schubert, J., A. Klenk and K. Maile:Determination of weld strength factors for the creep rupture strength of welded joints.European Creep Collaborative Committee (ECCC) Conference: Creep and fracture inHigh Temperature Components — Design and Life Assessment Issues, 2005,London, UK
[12] Heuser, H., et. al.:Ermittlung der Langzeiteigenschaften artgleicher Schweißgüter neuer warmfesterStähleForschungsbericht P 297, 2000, Düsseldorf, Germany
[13] Theofel, H., K. Maile and E. Roos:Untersuchung einer artgleichen Schweißverbindung für 9%Cr 1 %Mo-Stähle unterbesonderer Berücksichtigung des LangzeitkriechverhaltensAbschlussbericht AiF-Nr. 9300, 1997, Stuttgart, Germany
[14] Granacher, J. and A. Pfenning:Kriechgleichungen II — rechnergestützte Beschreibung des Kriechverhaltensausgewählter hochwarmfester Legierungen.FVV Forschungsvorhaben Nr. 432, 1991
[15] Graham, A. and K. F. A. Walles:Relationships between Long- and Short-Time Creep and Tensile Properties of aCommercial AlloyJournal of The Iron and Steel Institute, Vol. 179, pp. 104-121, 1955
[16] Rauch, M. et. al.:Numerical Calculation and Experimental Validation of Damage Development in9 Cr Steels30. MPA-Seminar: Safety and Reliability in Energy Technology, Vol. 2, 2004,Stuttgart, Germany

STRUCTURAL STABILITY AND PROPERTIES OF WELD JOINTS OFNEW CREEP-RESISTANT STEEL GRADES WITH 9 OR 12% CR
CONTENTS APPLIED IN OPERATION OF POWER GENERATIONSSECTOR OVER 30 000H
Grzegorz Moskal l , Adam Hernas 1 , Jerzy Pasternak2 ,1 The Silesian University of Technology, 8 Krashiskiego Str, 40-019 Katowice, Poland2 Boiler Engineering Factory RAFAKO S.A., 33 Lgkowa Str, 47-400, Racibdrz, Poland
Abstract
Continuously developing power generation sector, including boilers with supercritical parameters, requires theapplications of new creep-resistant steel grades for pressure components in construction of boilers, turbo-generators and steam piping. This paper presents RAFAKO S.A. experience within the field of research andimplementation of a new group of creep-resistant steel grades with tungsten and cobalt contents for applicationson elements of steam superheaters boilers with supercritical parameters – including the selection of filier metal,welding procedures and selected results of mechanical properties carried out during implementation of thewelding process.The article presents the results of examinations of steam superheater coils, with 38 mm diameter and wallthickness 4,4 or 6,3 mm, made of martensitic, creep-resistant steel grades containing 9% and 12% Cr with theaddition of Mo, V and additional tungsten contents, after more than 20 and 30 thousand hours of Operation inactual operational conditions.In order to compare the required parameters of examined steel grades after extended operation period, theresearch was focused on structure degradation processes, which are mainly manifested in the form of:disintegration of martensitic areas, release of M23C6 type carbides, release of Laves phase, steel recrystallizationand recovery processes. The scope of examinations included microstructure examinations (LM, SEM, TEM) andassessment of mechanical properties at ambient temperature and at 600°C. Such examination program enabledfor the assessment of steel structure stability during Operation. lt was clearly shown that 20 thousand hours ofoperation have little impact on changes occurring in microstructure and other properties of the examined steelgrades.The examinations were performed by RAFAKO within the framework of European COST 522 and COST 536programs.
Keywords: power generation, mechanical properties of weld joints, creep-resistance, 9-12%Crsteel, structural stability,
Introduction
The average efficiency of local utilities amounted to c.a. 33% while the efficiency values ofnew power-generating units in Europe approached the range of 42-46%. In line with thedecision to build a 440MW power-generating unit in Pfttndw Power Plant, the main guidelinesof country' s energy policy stipulate construction of another 440MW power-generating unit inLagisza Power Plant and a 840MW power-generating unit in Belchat6w Power Plant, bothoperating with supercritical parameters of the medium, i.e. steam temperature reaching580°C-620°C, steam pressure amounting to 26-30 MPa and design unit efficiency of 43-46 %.These newly designed boilers shall also meet very stringent requirements concerningavailability and environment protection resulting from the provisions of European Directiveno. 80/2001/EU [1-3].Such boiler design parameters require application of new generation martensitic steel gradeswith 9-12% Cr contents and tungsten addition in manufacturing of outlet superheater
elements. This clear tendency to increase power plant efficiency - and, in particular, theefficiency of power-generating units with supercritical steam parameters – has resulted in thelast 10 years in development of a whole series of new creep-resisting steels grades, which canbe used in outlet steam temperatures of c.a. 620°C (650°C). In case of a typical "supercritical"unit, with steam temperature of c.a. 600°C and steam pressure of c.a. 270 bar – with steamreheat in secondary part up to 600°C – applied creep-resisting steel grades have to assure therequired creep resistance of individual boiler components in design temperatures, as follows[4-6]:
• up to 500°C – for elements of boiler membrane walls,• up to 600 (620)°C – for large thickness boiler elements located outside the flue gas
zone,• up to 630 (650)°C – for steam superheater elements located within the flue gas zone
[6-10].Considerable European contribution, which has helped to determine the directions ofdevelopment and the scope of modifications of new martensitic steel grades consist inEuropean COST 522 – currently COST 536 – program "Power Generation into the 21 stCentury; Advanced Steam Power Plant". Already in the year 2000, RAFAKO S.A., in co-operation with Welding Institute and IMZ Gliwice, commenced its participation in COST 522program quickly becoming one of the major participants [3]. The objective of RAFAKO S.A.participation in COST 522 program was to recognize current directions of development ofcreep-resisting steel grades combined with use of its large manufacturing and implementationcapacities in applications of new materials, optimizing of manufacturing process such aswelding, plastic forming as well as implementation of new techniques of examinations ofpower-generating equipment for both local and European Community markets [5,6]
1. Materials and scope of examinations
Examinations were carried out an martensitic steels grades containing 9 and 12% Cr withtungsten addition such as P92, HCM12 and HCM12A. Materials subjected to testing, i.e.elements made of the new generation creep-resisting steel grades with the followingdimensions:
• (1)38x4 mm made of HCM12 steel,• (1)38x6,3 mm made of T122 (HCM12A) steel• (1)38x6 mm made of T91 steel
Specification of chemical composition of steel grades subject to examinations is shown inTab. 1 .This article shown only the selected results of strength and metallographic examinationswithin the field of assessment of base material properties and structure stability in both similarand dissimilar joints of welded joints of steam superheater coils elements made of HCM12,T122 (HCM12A.) and T91 steels:
• after welding and heat treatment,• after 20 000 and 30 000 hours of Operation in actual operating conditions of boiler no.
7 in Belchat6w Power Plant,• after annealing simulating actual steam superheater operating conditions – comparing
to actual operating condition.
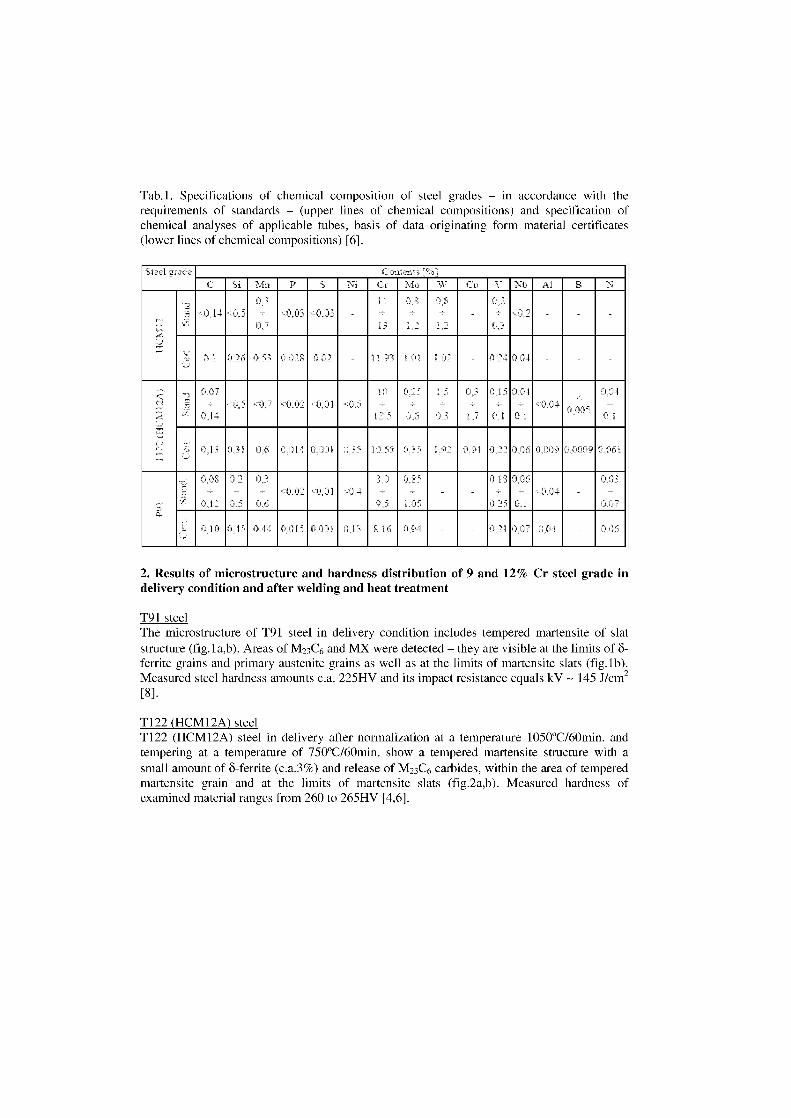
Tab. 1 . Specifications of chemical composition of steel grades — in accordance with therequirements of standards — (upper lines of chemical compositions) and specification ofchemical analyses of applicable tubes, basis of data originating form material certificates(lower lines of chemical compositions) [6].
1ee1 gh. c ii Mn Ni s 2, Io Cu Nb
053 o s 0.. 02 11.93 0.7'4 0.04
<0.02 ,: 0,0110
1 -,.. 5
0,25
Ü. 0 , 3
0,3
1,7
0.15+
0.1
0,04
0.1<0_04
0,04
0 . 31 0.6 f....;.,014 0.35 10.6 1.9? ". 4 ''
30&
,
02–
0 , 5
0-3–
0 , e-:0,0 ) -,, O > 01 -.- 0.4
8,0
--,
0 . s5
105
0.1 S+
0–
P f
. 0,040.03
007
133 4 -̀ 3 0,015 8.16 0.94 -., 0.0.6
2. Results of microstructure and hardness distribution of 9 and 12% Cr steel grade indelivery condition and after welding and heat treatment
T91 steel The microstructure of T91 steel in delivery condition includes tempered martensite of slatstructure (fig.la,b). Areas of M23C6 and MX were detected — they are visible at the limits of 8-ferrite grains and primary austenite grains as well as at the limits of martensite slats (fig.lb).Measured steel hardness amounts c.a. 225HV and its impact resistance equals kV 145 J/cm2[8].
T122 (HCM12A) steel T122 (HCM12A) steel in delivery after normalization at a temperature 1050°C/60min. andtempering at a temperature of 750°C/60min. show a tempered martensite structure with asmall amount of 5-ferrite (c.a.3%) and release of M23C6 carbides, within the area of temperedmartensite grain and at the limits of martensite slats (fig.2a,b). Measured hardness ofexamined material ranges from 260 to 265HV [4,6].
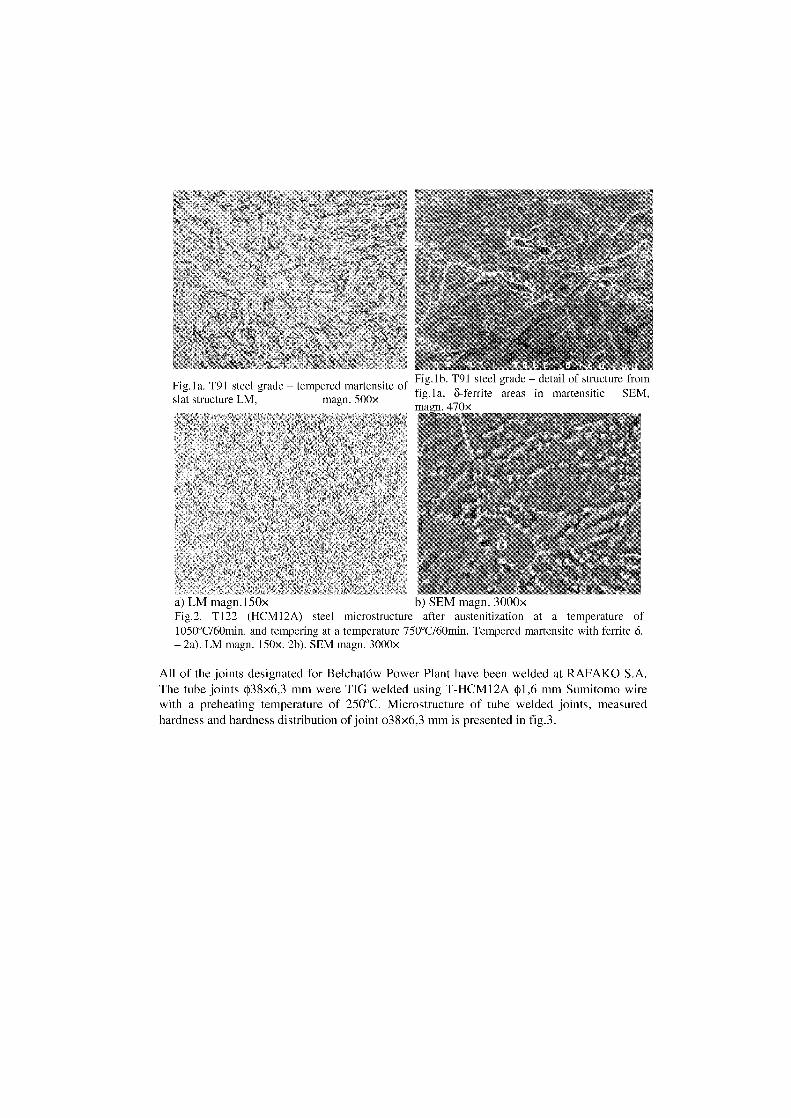
Fig.lb. T91 steel grade – detail of structure fromFig.la. T9I steel grade – tempered martensite of
LM, fig.1 a, 8-ferrite areas in martensiticslat structure LM magn. 500xmagn. 470x
a) LM ma g n.150x b) SEM magn. 3000xFig.2. T122 (HCM12A) steel microstructure after austenitization at a temperature of1050°C/60min. and tempering at a temperature 750°C/60min. Tempered martensite with ferrite S.– 2a). LM magn. 150x, 2b). SEM magn. 3000x
All of the joints designated for Belchatdw Power Plant have been welded at RAFAKO S.A.The tube joints 438x6,3 mm were TIG welded using T-HCM12A 41)1,6 mm Sumitomo wirewith a preheating temperature of 250°C. Microstructure of tube welded joints, measuredhardness and hardness distribution of joint ()38x6,3 mm is presented in fig.3.
SEM,
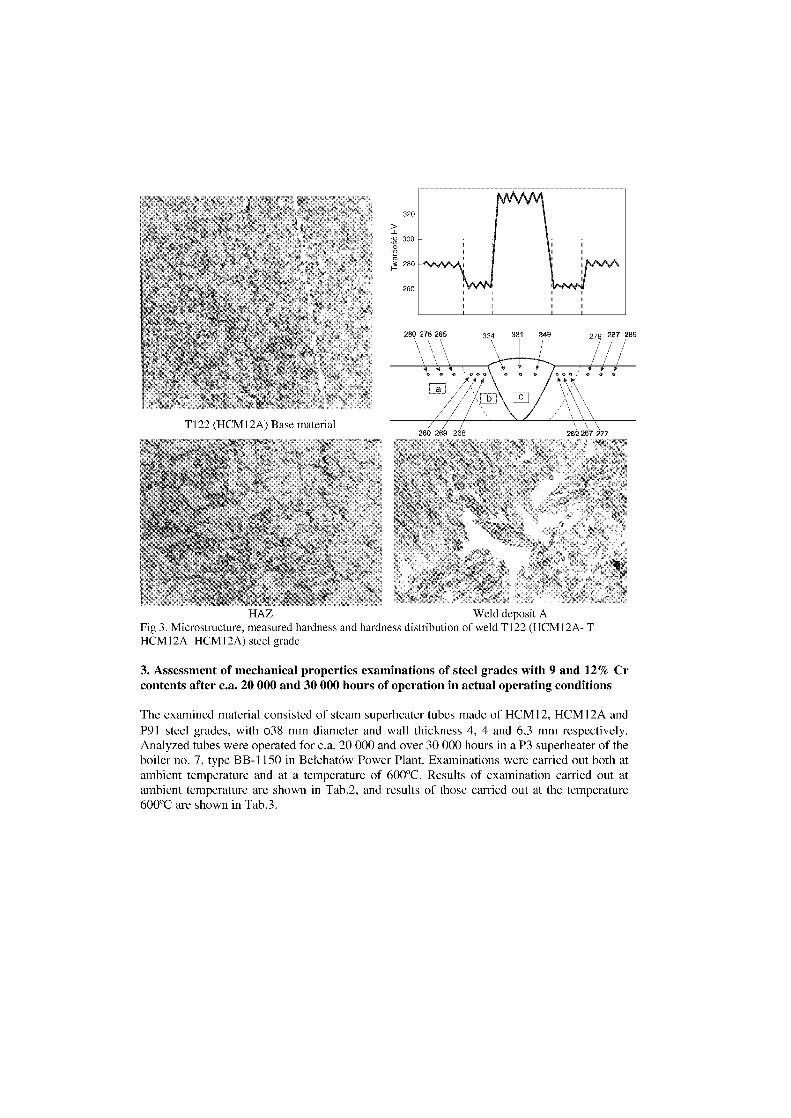
HAZ Weld deposit AFig 3. Microstructure, measured hardness and hardness distribution of weld T122 (HCM12A- THCM 1 2A -HCM 1 2A) steel grade
3. Assessment of mechanical properties examinations of steel grades with 9 and 12% Crcontents after c.a. 20 000 and 30 000 hours of operation in actual operating conditions
The examined material consisted of steam superheater tubes made of HCM12, HCM12A andP91 steel grades, with 108 mm diameter and wall thickness 4, 4 and 6,3 mm respectively.Analyzed tubes were operated for c.a. 20 000 and over 30 000 hours in a P3 superheater of theboiler no. 7, type BB-1150 in Belchat6w Power Plant. Examinations were carried out both atambient temperature and at a temperature of 600°C. Results of examination carried out atambient temperature are shown in Tab.2, and results of those carried out at the temperature600°C are shown in Tab.3.
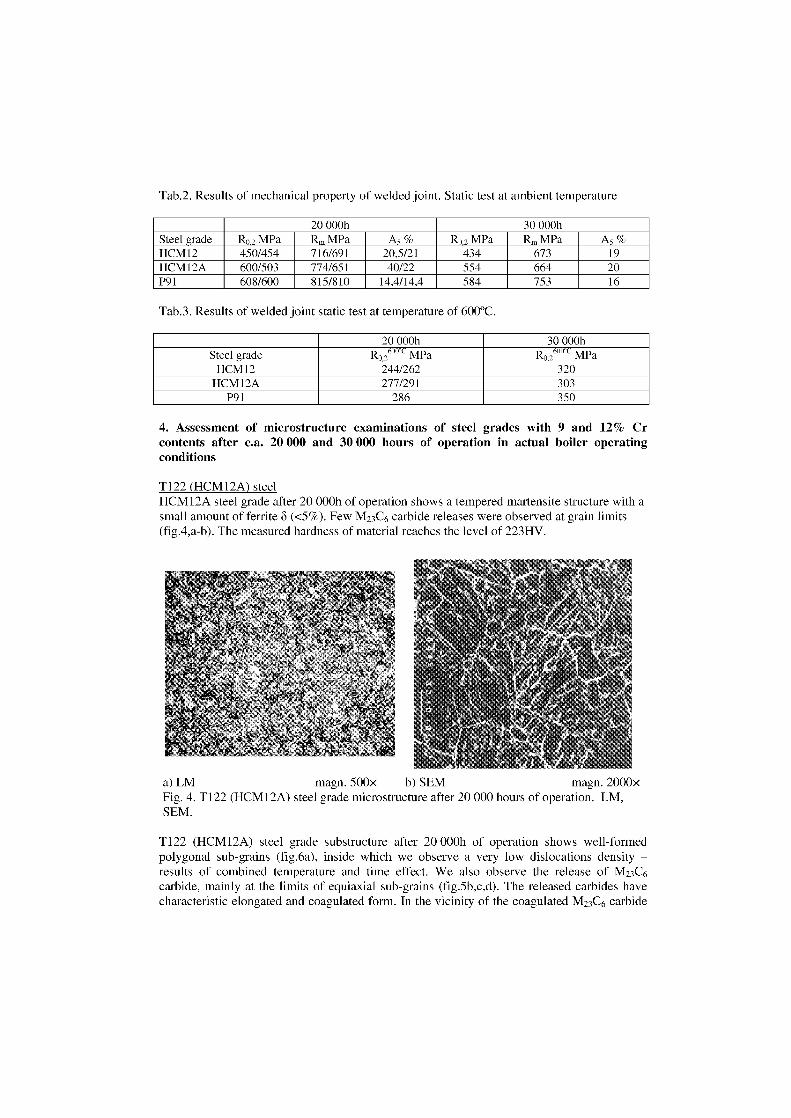
Tab.2. Results of mechanical property of welded joint. Static test at ambient temperature
20 000h 30 000hSteel grade R0,2 MPa 12,„ MPa As % R0,2 MPa R,, MPa A5 %HCM12 450/454 716/691 20,5/21 434 673 19HCM 12A 600/503 774/651 40/22 554 664 20P91 608/600 815/810 14,4/14,4 584 753 16
Tab.3. Results of welded joint static test at temperature of 600°C.
20 000h 30 000hSteel grade R0,260(c MPa R0,260(c MPa
HCMI2 244/262 320HCM12A 277/291 303
P91 286 350
4. Assessment of microstructure examinations of steel grades with 9 and 12% Crcontents after c.a. 20 000 and 30 000 hours of operation in actual boiler operatingconditions
T122 (HCM12A) steel HCM12A steel grade after 20 000h of Operation shows a tempered martensite structure with asmall amount of ferrite 8 (<5%). Few M23C6 carbide releases were observed at grain limits(fig.4,a-b). The measured hardness of material reaches the level of 223HV.
a) LM magn. 500x b) SEM magn. 2000xFig. 4. T122 (HCM12A) steel grade microstructure after 20 000 hours of operation. LM,SEM.
T122 (HCM12A) steel grade substructure after 20 000h of operation shows well-formedpolygonal sub-grains (fig.6a), inside which we observe a very low dislocations density –results of combined temperature and time effect. We also observe the release of M23C6carbide, mainly at the limits of equiaxial sub-grains (fig.5b,c,d). The released carbides havecharacteristic elongated and coagulated form. In the vicinity of the coagulated M23C6 carbide
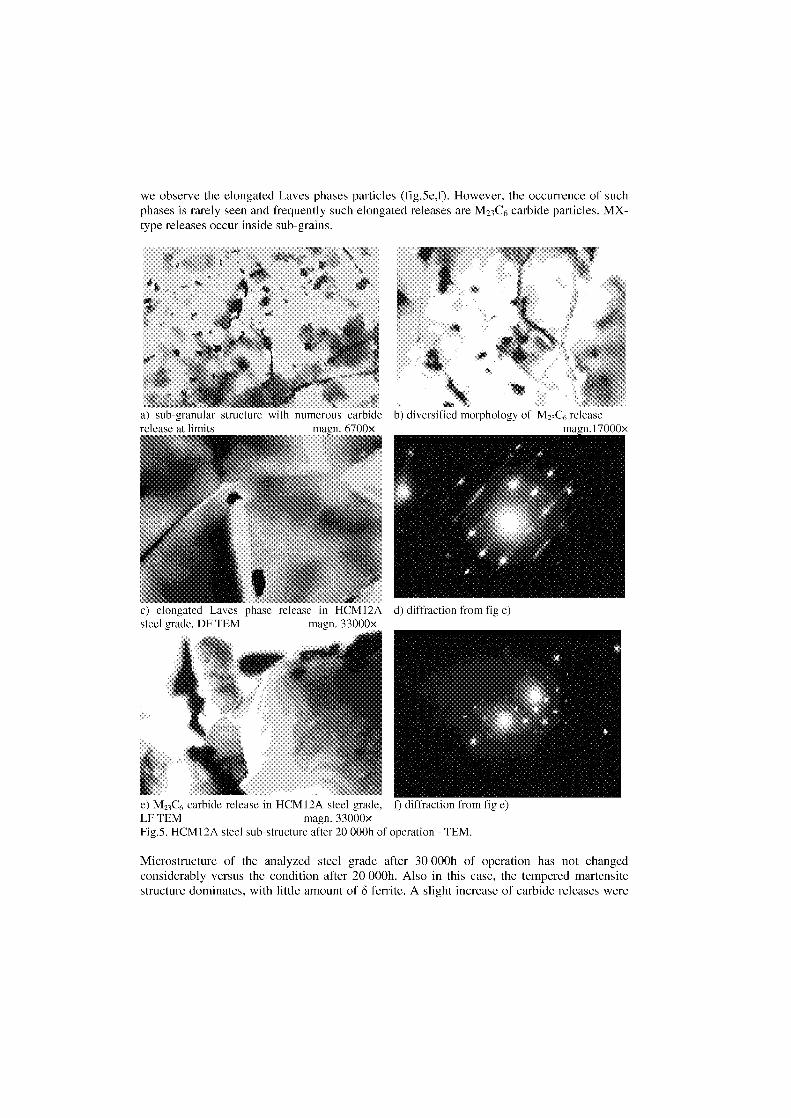
we observe the elongated Laves phases particles (fig.5e,f). However, the occurrence of suchphases is rarely Seen and frequently such elongated releases are M23C6 carbide particles. MX-type releases occur inside sub-grains.
a) sub-granular structure with numerous carbide b) diversified morphology of M2 3 C6 releaserelease limits mann K700x magn.17000x
elongated Laves phase release in HLM12A d) diffraction from fig c)steel grade. DF TEM magn. 33000x
e) M23C6 carbide release in HCM12A steel grade, f) diffraction from fig e)LF TEM magn. 33000xFig.5. HCM12A steel sub-structure after 20 000h of Operation - TEM.
Microstructure of the analyzed steel grade after 30 000h of Operation has not changedconsiderably versus the condition after 20 000h. Also in this case, the tempered martensitestructure dominates, with little amount of 8 ferrite. A slight increase of carbide releases were
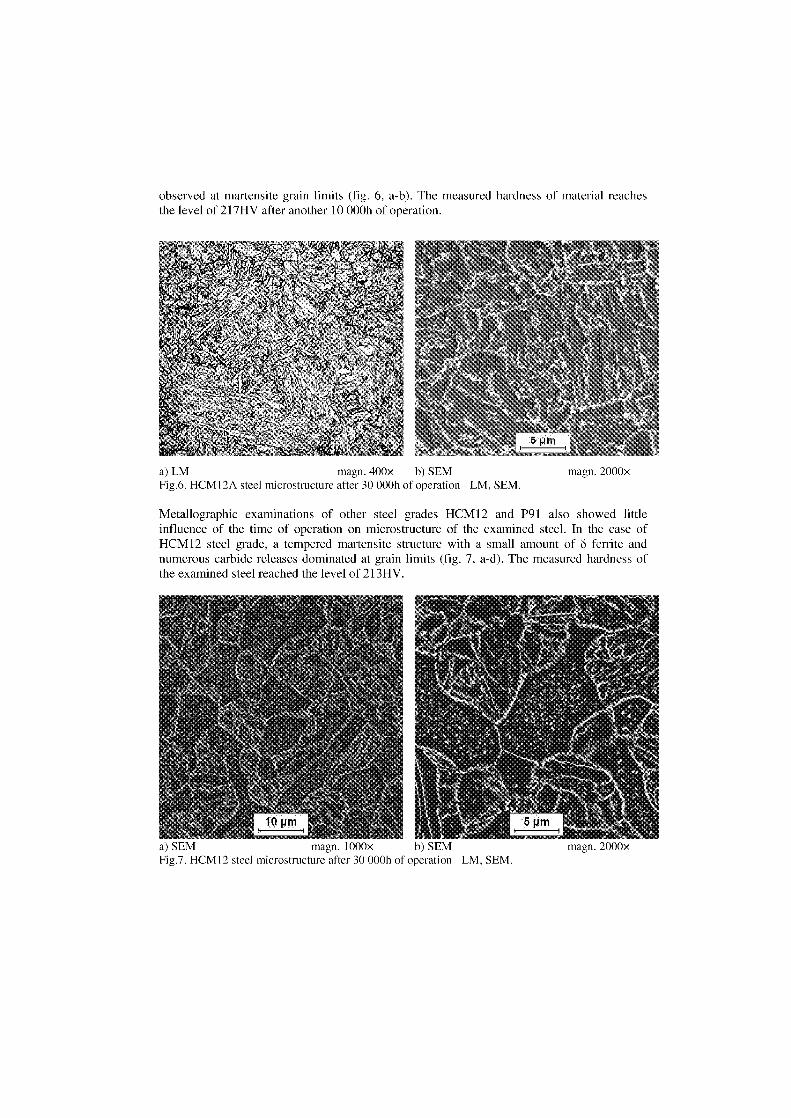
observed at martensite grain limits (fig. 6, a-b). The measured hardness of material reachesthe level of 217HV after another 10 000h of Operation.
a) LM magn. 400x b) SEM magn. 2000xFig.6. HCM12A steel microstructure after 30 000h of operation - LM, SEM.
Metallographic examinations of other steel grades HCM12 and P91 also showed littleinfluence of the time of Operation cm microstructure of the examined steel. In the case ofHCM12 steel grade, a tempered martensite structure with a Small amount of 8 ferrite andnumerous carbide releases dominated at grain limits (fig. 7, a-d). The measured hardness ofthe examined steel reached the level of 213HV.
a) SEM magn. 1000x b) SEM magn. 2000xFig.7. HCM12 steel microstructure after 30 000h of operation - LM, SEM.
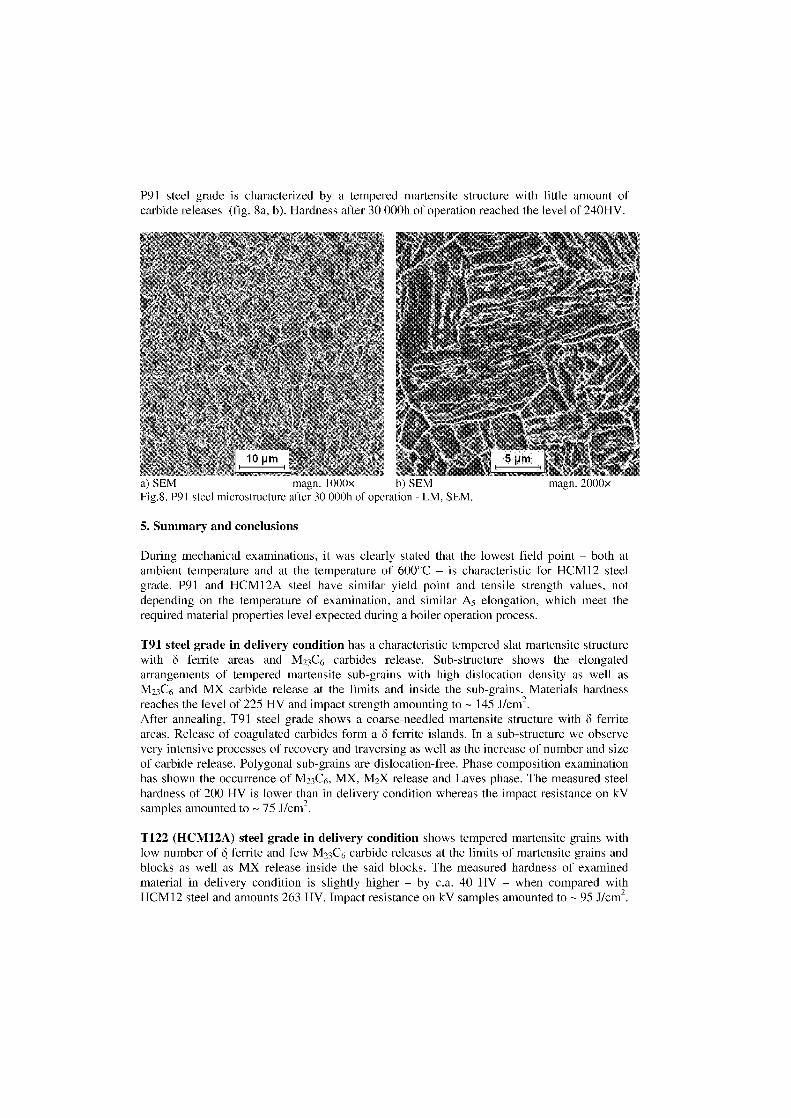
P91 steel grade is characterized by a tempered martensite structure with little amount ofcarbide releases (fig. 8a, b). Hardness after 30 000h of Operation reached the level of 240HV.
a) SEM magn. 1000x b) SEM magn. 2000xFig.8. P91 steel microstructure after 30 000h of Operation - LM, SEM.
5. Summary and conclusions
During mechanical examinations, it was clearly stated that the lowest field point – both atambient temperature and at the temperature of 600°C – is characteristic for HCM12 steelgrade. P91 and HCM12A steel have similar yield point and tensile strength values, notdepending on the temperature of examination, and similar A5 elongation, which meet therequired material properties level expected during a boiler Operation process.
T91 steel grade in delivery condition has a characteristic tempered slat martensite structurewith 8 ferrite areas and M23C6 carbides release. Sub-structure shows the elongatedarrangements of tempered martensite sub-grains with high dislocation density as well asM23C6 and MX carbide release at the limits and inside the sub-grains. Materials hardnessreaches the level of 225 HV and impact strength amounting to – 145 J/cm2.After annealing, T91 steel grade shows a coarse-needled martensite structure with 8 ferriteareas. Release of coagulated carbides form a 8 ferrite islands. In a sub-structure we observevery intensive processes of recovery and traversing as well as the increase of number and sizeof carbide release. Polygonal sub-grains are dislocation-free. Phase composition examinationhas shown the occurrence of M23C6, MX, M2X release and Laves phase. The measured steelhardness of 200 HV is lower than in delivery condition whereas the impact resistance on kVsamples amounted to – 75 J/cm2.
T122 (HCM12A) steel grade in delivery condition shows tempered martensite grains withlow number of 8 ferrite and few M23C6 carbide releases at the limits of martensite grains andblocks as well as MX release inside the Said blocks. The measured hardness of examinedmaterial in delivery condition is slightly higher – by c.a. 40 HV – when compared withHCM12 steel and amounts 263 HV. Impact resistance on kV samples amounted to – 95 J/cm2.
After annealing at the temperature of 700°C/100h, the structure of HCM12A steeldemonstrates the increase of the size of carbides released at grain limits as well as diversifieddislocation density when compared to delivery conditions. After annealing at the temperatureof 700°C/200h this process is further continued with clear coagulation of carbide released atthe limits of primary austenite grains. It was also demonstrated that the processes ofaccelerated carbide release and further spheroidising occur due to the annealing. Steelhardness is lower – when compared to delivery condition – and amounts to 232 HV.Completed examinations demonstrate that HCM12A steel grade is characterized withrelatively high stability of structure and properties.
HCM12A steel grade after c.a. 20 000h of Operation Shows a tempered martensite structurewith low 8 ferrite contents (<5%). Moreover, few M23C6 carbide releases were observed atgrain limits. Sub-structure is characterized with well-formed polygonal sub-grains, insidewhich we observe a low dislocation density resulting from the combined temperature andtime effect. M23C6 carbide releases were observed mainly at the limits of equiaxial sub-grains.Released carbides have a characteristic elongated and coagulated form. MX – type releaseoccur inside the sub-grains. Material hardness amounts to 123HV.
P91 steel grade after 30 000h did not show any major effects of microstructuredegradation either. Typical for that steel grade tempered martensite structure with carbidereleases was observed at and outside grain limits, as well as higher than the minimumrequired hardness at the level of 200HV - 240 HV. Mechanical characteristics fulfill therequirements of the relevant standards – plastic properties at ambient temperature higherthan 390 MPa; plastic properties at the temperature of 600°C higher than 250 MPa andelongation lower than minimum 20%T122 (HCM12A) steel grade after 30 000h showed typical of that steel grade two-stagetempered martensite structure with few 8 ferrite releases and few carbide releases at grainlimits, as well as higher than the minimum required hardness at the level of 200HV -214÷220 HV. Mechanical characteristics fulfill the requirements of the relevant standards– plastic properties at ambient temperature higher than 400 MPa; plastic properties at thetemperature of 600°C slightly lower than 310 MPa and elongation equal minimum 20%.HCM12 steel grade after 30 000h also showed typical of that steel grade two-stagetempered martensite structure with few 8 ferrite , releases but considerable amount ofcarbide releases at grain limits. Higher than the minimum required hardness was observed,at the level of 200HV - 211214 HV. Similarly as before, mechanical characteristicsfulfill the requirements of the relevant standards – plastic properties at ambient temperaturehigher than 390 MPa; plastic properties at the temperature of 600°C higher than 250 MPaand elongation lower than minimum 20%.
Final conclusionIn all examined cases, the materials condition show a minimum degree of degradation,related to the occurrence of few carbide releases within and at grain limits. The analyzedstructure is correct and stable; the level of mechanical properties considerably exceedsminimum values. Walls thickness measurements do not show any wear effect or losses ofthe steam superheater coils walls. Analysis of the carried out examinations results showedthat 30 000h of Operation had little impact an microstructure and level of characteristics ofcoils made of HCM12, T122 (HCM12A) and P91 steel grades.
The examined steel grades show considerable stability of microstructure at the temperatureof approximately 585°C, which was measured in the experimental sections of steamsuperheater coil elements.
References[1]. Development study of the electric energy production Subsystem until 2020. PolishElectric Networks S.A., Warszawa , 1994 (in Polish)[2]. The Energy Market Agency S.A.: Assumptions for the Polish energy policy until 2020.Working draft –version 2. Warszawa, 1999 (in Polish).[3]. Pasternak J., Hernas A., Milifiski P.: New martensitic steels for supercritical boilers.Energetyka No. 4, 1997 (in Polish).[4]. Zeman M., Br6zda J., Pasternak J.: Weldability evaluation of the HCM12A steel assignedfor elements of supercritical power boilers. Przeglqd Spawalnictwa No. 6, 1999, p. 1-7 (inPolish).[5]. Br6zda J.: Weldability characteristics and welding technology guidelines of the advancedheat resisting steels. COST 522 Progress Report No. 1 (12.03.2001) and No. 2 (28.09.2001).[6]. Pasternak J. Analysis of process and structural factors determining the properties andapplicability of steel grades with 9-12% Cr-Mo-V with tungsten in construction of boilerswith supercritical steam parameters, April 2000[7]. Hernas A., Ciega M., Niewielski G., Kielbus A., Lalik S: Assessment of deliverycondition properties of selected new Cr-Mo-V-W-(Cu) steel grades used for Boiler tubes andtheir welded connections to be operated in supercritical parameters, Research work NB-200/RM-7/98, November 1998.[8]. Hernas A., Kielbus A., CieMa M., Rodak K.: Assessment of large thickness welded jointsmade of P91, P92 steel grades and T23 base material, Research work P/IX-2/01, September2001.[9]. A.Kielbus, J.Pasternak: Structural stability of creep-resisting steel grades with 9% Crcontents", XI Scientific Seminar: New technologies and materials in metallurgy and materialengineering, Katowice, May 2003.[10] J. Pasternak, A. Kielbus: Stability of similar and dissimilar welded joints, high-temperature creep resistant martensitic steels containing 9% Cr. Proceedings of the EPRIFourth International Conference an Advances in Materials Technology for Fossil PowerPlants. October 25 – 28, 2004

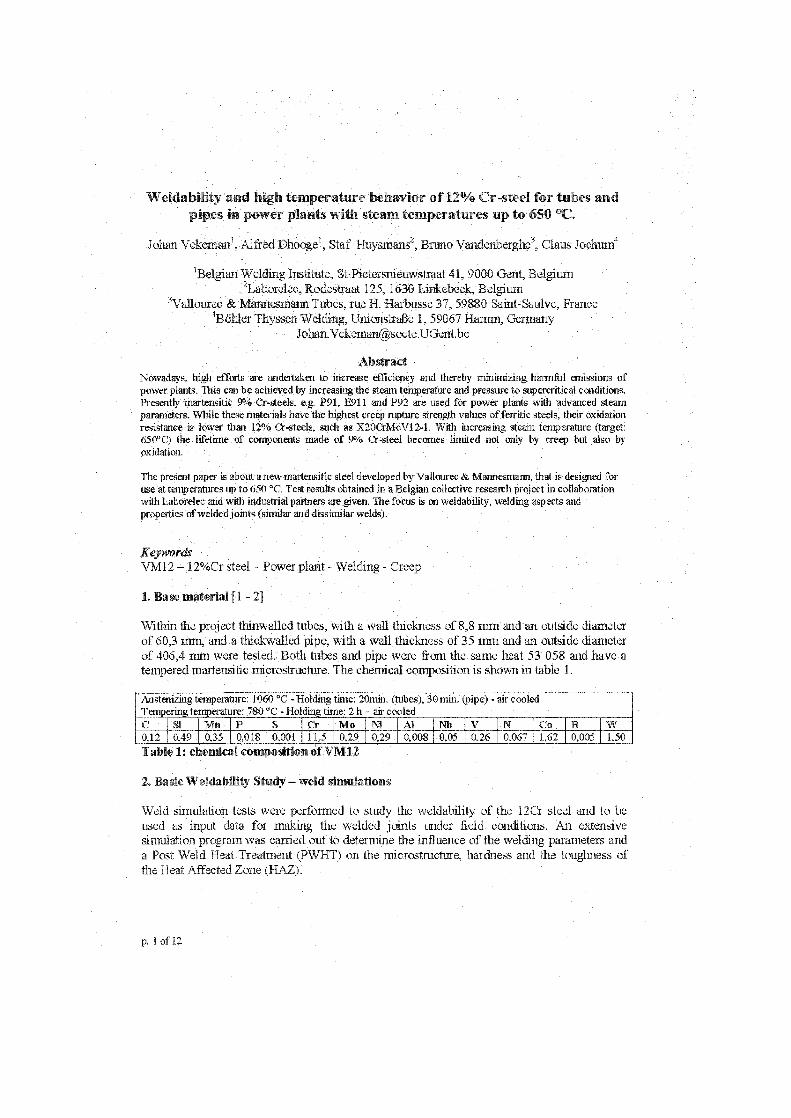
Welch
high temperatu ior of 12% Cr-steel for tubes andpower plants tempe -s up to 650 °C.
J an Veke
d Dhooge , Staf Huys ans`, Bruno Vandenberghe', Claus Jochum4
'Bellt ",A7elding Institute, St-Pietersnen -straat 41, 9000 Gent, Belgiumelec, Rodestlaof 125, 1630 Linkebeek, Belgium
Vallourec & Man3 I.e.flamm Tubes, rue H. Harbusse 37, 59880 Saint- Saulve, FranceSöhler Thvssen We•ditig, Unionstraße 1, 59067 Hamm, Ge' rrnany
Johan.Vekemanasoete.UGent.be
AbstractNowadays, high efforts are undertaken to increase efliciency and thereby mintinizing harmful ertissions ofpower plants. This can be achieved by increasing the steam temperature and pressure to supercritical conditions.Presently martensitic 9% Cr-steels, e.g. P91, E911 and P92 are used for power plants with advanced stearnparameters. While these materials have the highest creep rupture strenge, values of fen-itic steels, their oxidationresistance is lower than 12% cr-steets_ such as X2OCI-MoV12-1. With increasing steam temperature (target650°C) the intime of components made of 9c,vo Cr-steel becomes lintited not only by creep but also byoxidation.
The present paper is about tuartensitte steel developed by Vallourec & Mannesmann, that is designed foruse at temperatures up to 650 °C. Test results obtained in a Belgian coilective research project in collaborationwith Laborelec and with industrial partners are given. The focus is on weldability, welding aspects andproperties of welded joints (similar and dissimilar welds).
KeywordsVM12 – 12%Cr steel – Powe plant -
1. Base material [1 2]
Velding - Creep
Within the project thinwalled tubes, with a wall thickness of 8,8 mm and an outside diameterof 60,3 mm, and a thiekwalled pipe, with a wall thickness of 35 mm and an outside di &tueterof 406,4 mm were tested. Both tubes and pipe were from the same heat 53 058 and have atempered martensitic microstructure. The chemical composition is shown in table 1.
Aus-temz i ture: 1060 °C - Holding time: 20min. (tubes), 30 in. (pipe) - air cooledTempering temperature: 780 °C - Holding time: 2 h – an- cooledC Si Mai P 11 o Ni 41 Nb V N Co B '0,12 049 0,35 0,018 0.001 ,5 0,29 0,29 0,008 0,05 0,2 0,067 1,62 0,005 1,50Table 1: chemical compoution of VM12
2. Basic Weltlabile Study – eld simulatious
Weld simulation tests were performed to study the weldability of the 12Cr steel and to beused as input data for making the welded joints under field conditions. An extensivesimulation prograni was carried out to determine the influence of the welding parameters anda Post Wald Heat Treatment (PWHT) on the microstructure, hardness and the touglmess ofthe Heat Affected Zone (RAZ).
p. 1 of 12
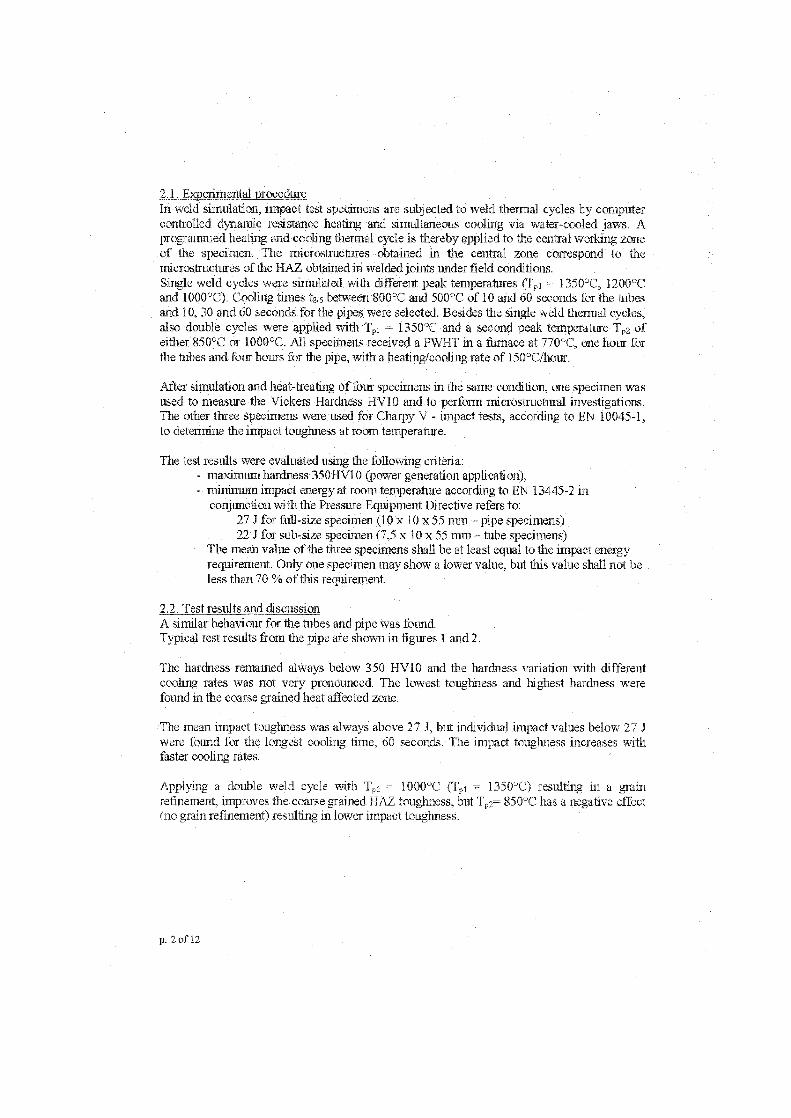
2.1. Experimental pr nre In weld simulation impact test specimens are subjected to weld thermal cycles by computer
trolled dynamic resistance heating and simultaneous cooling via water-cooled jaws. Aprogrammed heating and cooling thermal cycle is thereby applied to the central working zoneof the specimen. The microstructures obtained in the central zone correspond to themicrostructures of the HAZ obtained in welded Joints under field conditions.Single weld cycies viere simulated with different peak temperatures (T, 1 = 1350°C, 1200°Cand 1000°C) Cooling times t8/5 between 800°C and 500°C of 10 and 60 seconds tor the tubesand 10, 30 and 60 seconds for the pipes were selected. Besides the single weld thermal cycles,also double cycles were applied with To = 1350°C and a second peak temperature Tp2 ofeinher 850°C or 1000°C. All specimens received a PVJ-1T in a fumace at 770°C, one hour forthe tubes and four hours for the pipe, with a heating/cooling rate of 150°C/hour.
After simulation and heat-treating of four specimens in the same condition, one specimen wasused to measure the Vickers Hardness HV10 and to perform microstructural investigations.The other three specimens were used for Charpy V - impact tests, according to EN 10045-1,to determine the impact toughness at room temperature.
The test results were evaluated using the following critena:- maximum hardness 350HV10 (power generation application),- mitumum impact energy at room temperature according to EN 13445-2 in
conjunction with the Pressure Equipment Directive refers to:27 J for Full-size specimen (10 x 10 x 55 mm — pipe specimens)22 J for sub-size specimen (7,5 x 10 x 55 mm —tube specimens)
The mean value of the three specimens shall be at least equal to the impact energyrequirement. Only one specimen may show a lower value, but this value shall not beless than 70 % of this requirement.
2.2. Test results and discussionA similar behaviour for the tubes and pipe was found.Typical test results from the pipe are shown in figures 1 and 2.
The hardness remained always below 350 HVIO and the hardness variation with differentcooling rates was not very pronounced. The lowest toughness and highest hardness werefound in the coarse grained heat affected zone.
The inean impact toughness was always above 27 J, but individual impact values below 27 Jwere found for the longest cooling time, 60 sec onds. The impact toughness increases withfaster cooling rates.
Applying a double weld cycle with Tp2 = 1000°C (To = 1350°C) resulting in a grainrefinement, improves the coarse grained HAZ toughness, but Tp2= 850°C has a negative effect(no grain refinement) resulting in lower impact toughness.
p. 20 12
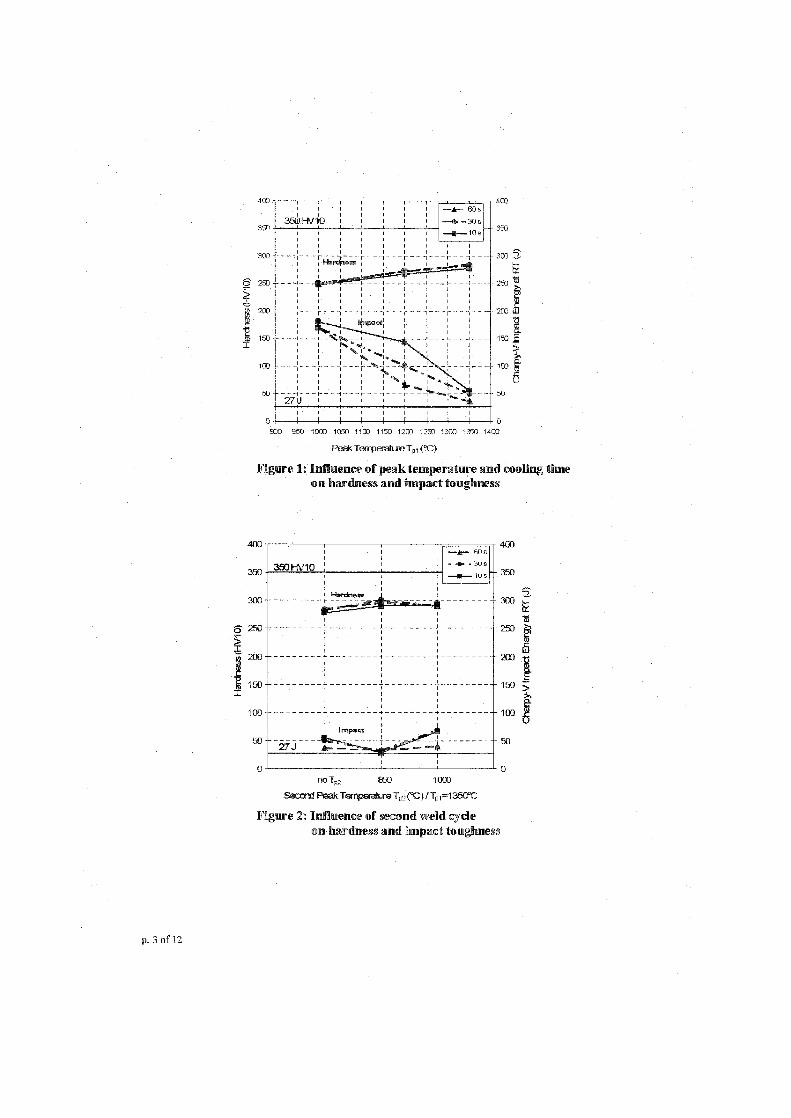
Figure Inftuence of peak temperature and cooling timeon hardness and impact toughness
no Tp2 850 1000Second Peak Temperature Tp2 (C) f 1=1350°C
Figure 2: Influence of second weld cycleon hardness and impact toughness
p. 3 of 12
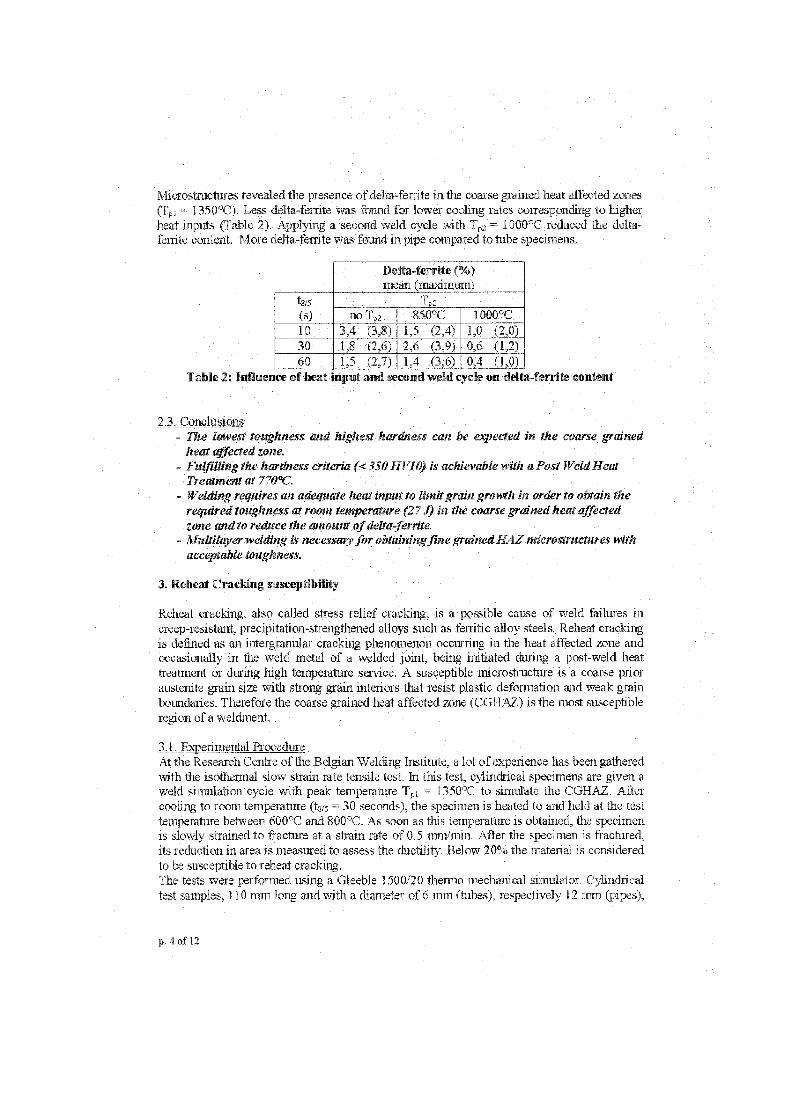
Microstructures revealed the presence of delta-ferrite in the coarse grained heat affected zones(To = 1350°C) Less delta-ferrite was found for lower cooling rates corresponding to higherheat inputs (fable 2). Applying a second weld cycle with Tee = 1000°C reduced the delta-fente content. More delta-fernfite was found in pipe compared to tube specimens.
D - ritte (%o)m urn)
t8/5
(s)Tp2
no Tp2 850°C 1000°C10 3,4 (3,8) 1,5 4) (2,0)30 1,8 42,6) 2,6 (3>9)) 0,6 (1,2)60 1,5 1, 3,6) 0;4 (1,0)
ta-fer ite tonten
2.3. Conclastotis- The lowest toughness and highest liardness can be expected in the coarse grained
heat affected zone.- Fielging the hardness criteria (< 350 HVI(I is achievable with a Post Weld Heut
Treatment at 770°C- Welding requires an adequMe hegt input to Limit grain growth in Order to obtain the
required toughness M room temperature (2' .1) in the coarse grained heat affectedzone and to reeluce the amount of delta-_ferrite.
- Multilager welding is neeessan, _for obtaining fine grained HAZ micros1ructures withacceptable toughness.
3. Reheat Cracking suscept lii 'y
Reheat cracking, also cailed stress relief cracking, is a possible cause of weld failures increep-resistant, precipitation-strengthened alloys such as temtic alloy steels. Reheat crackingis defined as an interganular cracking phenomenon occurring in the heat affected zone andoccasionally in the weld metal of a welded Joint, being initiated during a post-weld heattreatment or diging high temperature service. A susceptible microstructure is a coarse prioraustenite grain size with strong grain interiors that resist plastic deformation and weak grainboundaries. Therefore the coarse grained heat affected zone (CGHAZ) is the most susceptibleregion of a weldment.
3.1. Experimental Procedure At the Research Ceilie of the Belg,ian \Velding Institute, a lot of experience has been gatheredwith the isothermal slow strain rate tensile test. In this test, cylindrical specimens are given aweld simulation cycle with peak temperature To = 1350°C to simulate the CGHAZ. Aftercooling to room temperature (t315 = 30 seconds), the specimen is heated to and held at the testtemperature between 600°C and 800°C. As soon as this temperature is obtained, the specimenis slowly strained to fracture at a strain rate of 0.5 inni/min. After the specimen is fractured,its reduction in area is ineasured to assess the ductility. Below 20% the material is consideredto be susceptible to reheat cracking.The tests were performed using a Gleeble 1500/20 thermo mechanical simulator. Cylindricaltest Samples, 110 mm long and with a diameter of 6 mm (tubes), respectively 12 mm (pipes),
p. 4 of 12
with threaded ends were used. The samples were taken in axial direction. After simulation, azone of 10 min in the centre of the speeimen was machined to 4 nun (tubes), respectively 6mm (pipes) so that specimen fracture during tensile testing occurred in the simulated zone.
The infilierlee of double weld cycles, second peak temperature Tp2 = 850 or 1000°C, has beencompared to single weld cycles
3.2. Test results and discussionFigure 3 shows the reduction in area and the ultianate tensile strength as a function of the peaktemperature.
vutigPipe
0 0575 600 625 650 675 70D 725 750 775 800 825
Tem (°C)
Figure 3: Reheat cracking susceptibilily of VM12
Specimens from the VM12 Pipe showed a very high ductility, above 60%, in the wholetemperature range (600°C - 800°C). There is only a small drop at 675°C where the reductionin area decreases to 47 '170. For the specimens from the VM 12 Tube, a reduction of area above70% was found. At 675°C, a second weld cycle with a peak temperature at 1000°C increasesthe reduction in area from 47 to 62 %. A double weld cycle with a second peak temperature at850°C increased the reduction in area to 77 % Multi-pass simulation increases the ductility ofthe specimens. According to the above criterion, the material is considered not susceptible toreheat eracking. This confmns the trend that high alloyed ferritic steels are not susceptible toembrittlement at high temperature alter post weld heating.
3.3. Conclusion-13112is not susceptible to reheat crac
p. 5 of 12
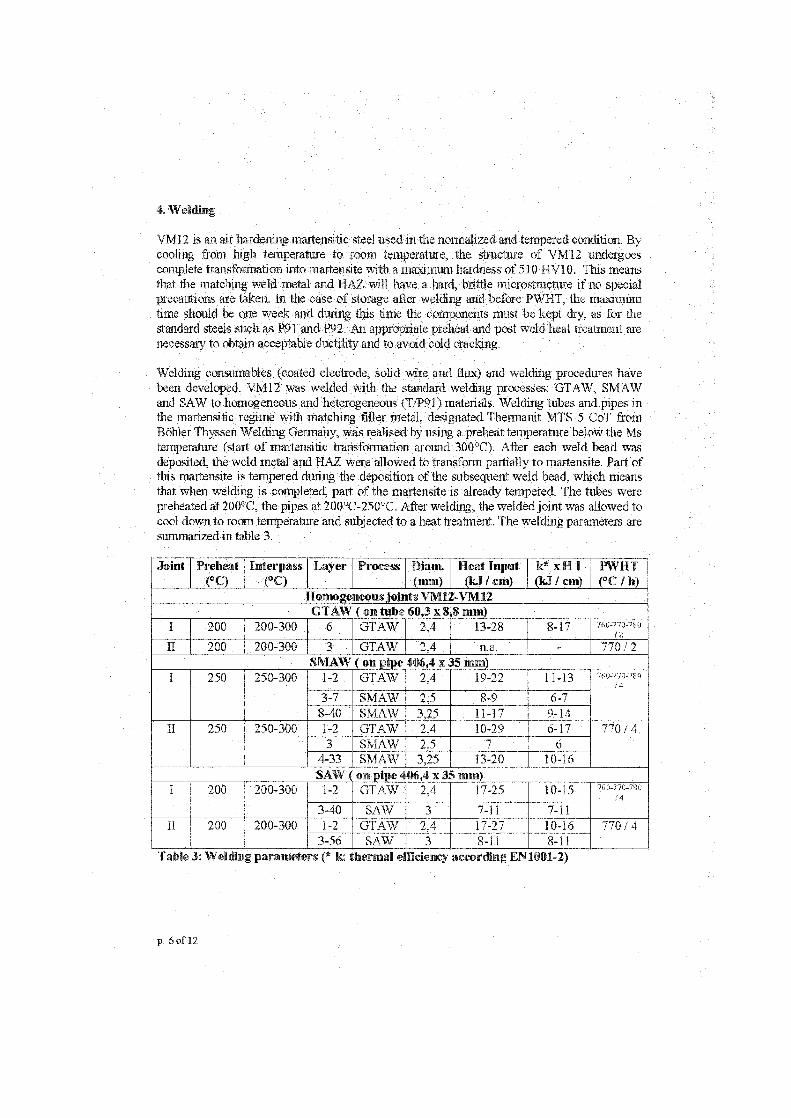
VM12 is an air hardening martensitic steel used in the nomialized a° .d tempered condition. Bycoohng froni high iemlrature to rooni tedupenture, the s',,:--uttre of VM 12 undergoescomplete transtbrmati .j. ,7 into marten.si.L Lb a haut ness 0 EV10. This meansthat the matching weld irk4a1 arid HIV, will have a •ard, thic-structute if no specialprecantions taken 11 the •asc of sturere aller and befote PM71-IT, the mmiintimtime should h ode ,Awk and during düs time the cmiponents ri-Just be kept dry, as for thestandard stees su.:If as P91 and P92. An apprOpriate 7-eh,-2i and post weld heat treatment arenecessary to obtai .-cceptable ductithy and to avcri cl diaeking.
Welding consurnables ed sclid vsire and ['Jux) and welding procedures havebeen developed. VM12 was weided the stud.irr processes: GTAW, SMAWand SAW to hor1ogenez. •uld heterogm.eous (T /P9: Welding tubes and pipes inthe martensitic regime r4 nullehing fil;e2 . metai clegriated Themianit MTS 5 CoT fromBöhler Thyssen Welding Germany, was realised by using a preheat temperature below the Msternperature (start of Mattensiiie traiiskamation .aroLuid 300°C After each weld head wasdeposited, the weld metal. and HAZ giere allowed to transform partially to martensite. Part ofthis martensite is tempered during the deposition of the subsequent weld bead, which meansthat when welding is completed, part of the martensite is alreadv tempered. The tubes werepreheated at 200°C, the pipes at 200°C-250°C. After welding, the welded joint was allowed tocool down to room temperature and subjected to a heat treatment. The welding parameters aresurnmanzed in table 3.
Joint Preheal(°C)
Inteirpa°C)
Lay e Proc Diam.(mm)
Heat Input(kJ / cm)
k* 1(kJ / cm)
HT°C /
Ho gen us 12-VM12GTAW ( on tube 60,3 x 8 mm)
200 200-300 6 GTAW 2,4 13-28 8-17 760H770-780/2
II 200 200-300 3 GTAW 2,4 770 /
SMA ( an pipe 406,4 x 35 mm)2 250-300 2 GTAW 2,4 19-22 11-13 760-770-780
/43-7 SMAW 6-7-40 SMAW 3,25 1117 9-14
250 250-30 1-2 GTAW 2 4 10-29 6-1 7 7 4S IA 6
4-3: SMAW 3,25 13-20 10-16n pipe 406,4 x 35 m)
1 200 200-30 1-2 GTAW 2,4 17-25 10-15 70-,0 70- 0/4
3-40 SA F 3 7-11 7-11II 200 200-300 1-2 GTAW 2,4 17-27 10-16 770 / 4
3-56 SAW 3 8-11 8-11Table 3: Wel g paramete s (* k: thermal efficiency according EN 001-2)
13,6of12,
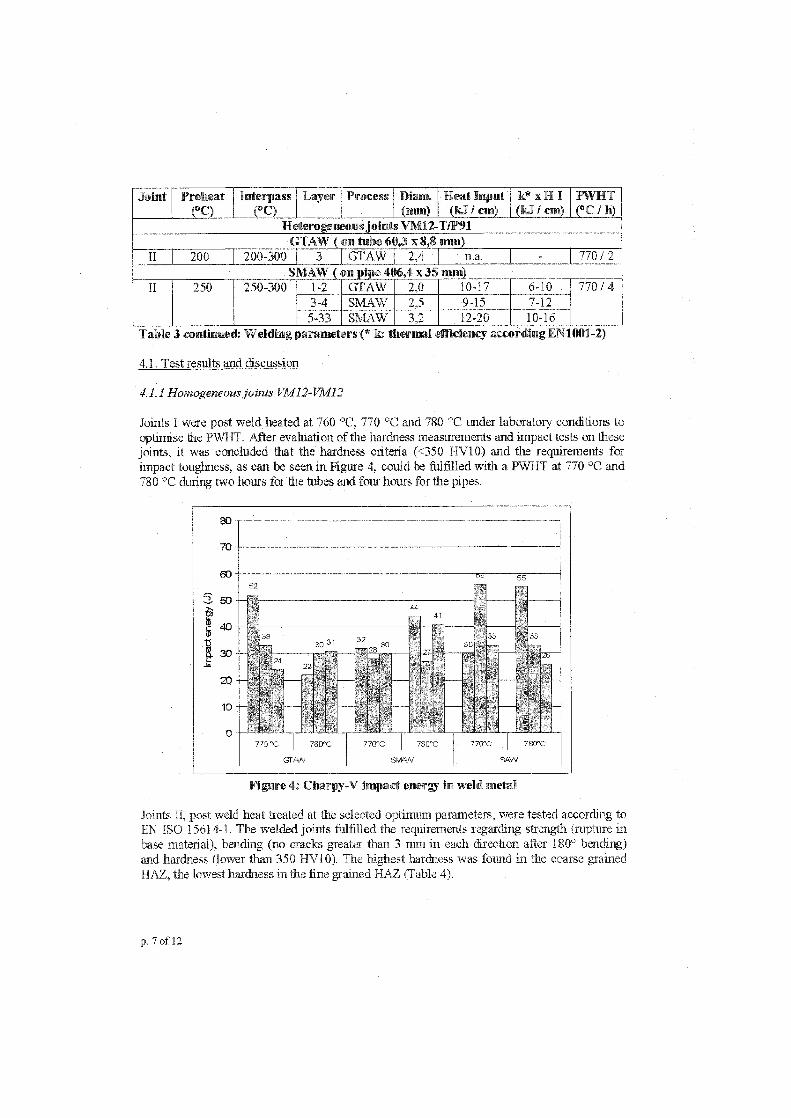
80
70
60 82
85
3
115
50
40
4441
3330 31 32
28
20 —
10—
0—770 C 780°C
GTJ8N
770`C 780C
51\414N
770C 780°C
SeIV
JointJohit Pre ea terpass Laye P ocess Diam. Heat Input x H I V(°C) (°C) (kJ / cm) kJ / cm) (°C / h)
Heterogeneousjoints VM12-T/P91GTAW ( on tube 60,3 x 8,8 mm)
200 20 -300 3 GTA 2,4 .a. 770 / 7SMAW ( pipe 4 ,4 x 35 mm)
250 250-300 1-2 GTAW 2,0 10-17 6-10 770 / 43-4 SMA 2,_ 9-15 7-125-3_ S A 3,2 12-20 10-16
Table 3 continued: Welding parame thermal efficiency according EN 001-2)
4.1. Test results and discussion
4.1.1 Homogeneousjoints VM12-TM12
Joints I were post weld heated at 760 °C, 770 °C and 780 °C under laboratory conditions tooptimise the PWHT. After evaluation of the hardness measurements and impact tests on fliesejoints, it was concluded that the hardness criteria (<350 HV10) and the requirements forimpact toughness, as can be seen in Figure 4, could be fulfdled with a PWHT at 770 °C and780 °C during two hours for the tubes and four hours for the pipes.
Fi e 4: Charpy-V impact energy in weld metal
Joints II, post weld heat treated at the selected optimum parameters, were tested according toEN ISO 15614-1. The welded joints fulfilled the requirements regarding strength (rupture inbase material), bending (no cracks greater than 3 mm in each direction after 180° bending)and hardness (lower than 350 HVIO). The highest hardness was found in the coarse grainedHAZ, the lowest hardness in the fine grained HAZ (Table 4).
p. 7of12
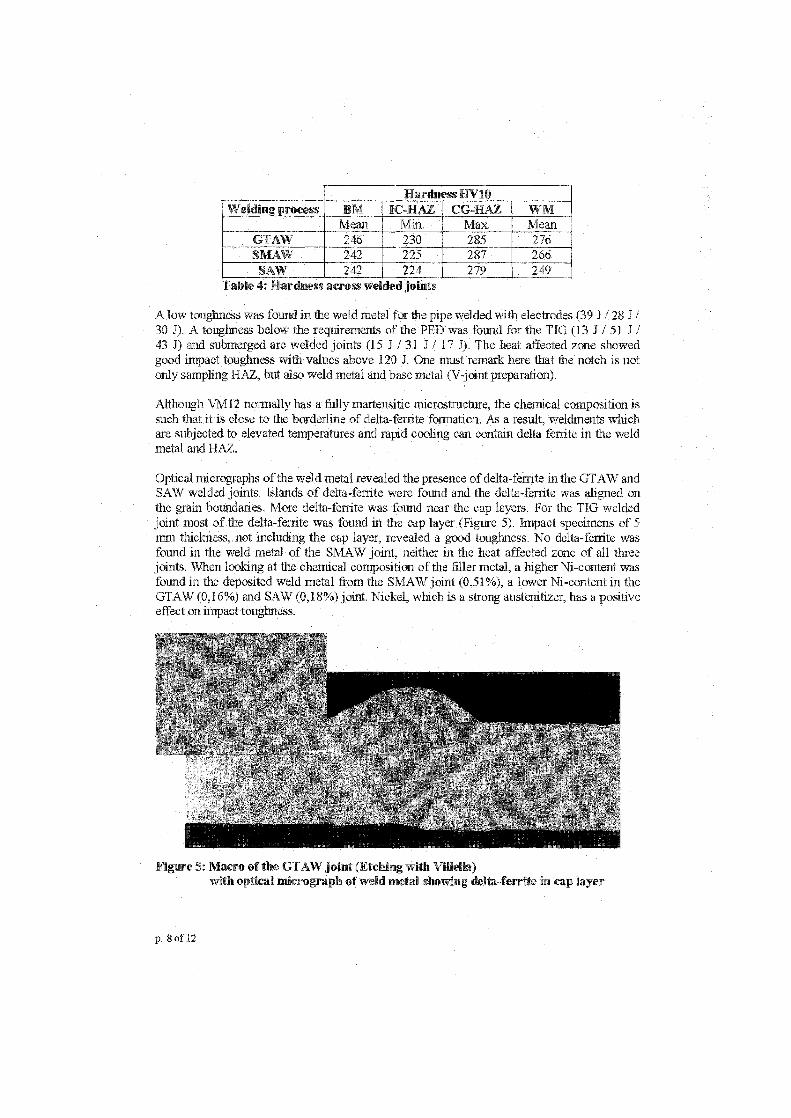
ess HV10We ding process BM IC-HAZ CG-HAZ
Mean Max. MeanGTAW 246 230 285 276SI42 W 242 225 287 266
242 224 279 249Tale 4: '.»-ardness across welded joints
A low toughness was found in the weld metal for the pipe welded with electrodes (39 J / 28 J.1). A toughness below the requirements of the PED was found for the TIG (13 J / 51 J /
43 J) and submerged arc welded joints (15 J 31 J / 17 J). The heat affected zone showedgood impact toughness with values above 120 J. One raust remark here that the notch is notonly sampling 1-I AZ, but also weld metal and bare metal (V jointpreparation).
Although VM 12 normally has a fully martensiüc microstnicture, the chemical composition issuch that it is close to the borderline of delta-ferrite fonnation. As a result, weldments wluchare subjected to elevated temperatures and rapid cooling can contain delta ferste in the weldmetal and HAZ.
Optical micrographs of the weld metal revealed the presence of delta-ferrite in the GTAW andSAW welded joints. Islands of delta-ferrite were found and the delta-ferste was aligned anthe grain boundaries. More delta-ferrite was found near the cap layers. For the TIG weldedjoint most of the delta-ferrite was found in the cap layer (Figure 5). Impact specimens of 5mm thickness not including the cap layer, revealed a good toughness. No delta-ferrite wasfound in the weld metal of the SMAW joint, neither in the heat affected zone of all threejoints. When looking at the chemical composition of the filler metal, a higher Ni-content wasfound in the deposited weld metal from the SMAW joint (0,51%), a lower Ni-content in theGTAW (0,16%) and SAW (0,18%) joint. which is a strong austenitizer, has a positiveeffect an impact toughness.
Figure 5: Macrol the GTAW joint (Etching with )with optical micrograph of weld metal showing delta-ferrite in cap layer
p. 8 of 12
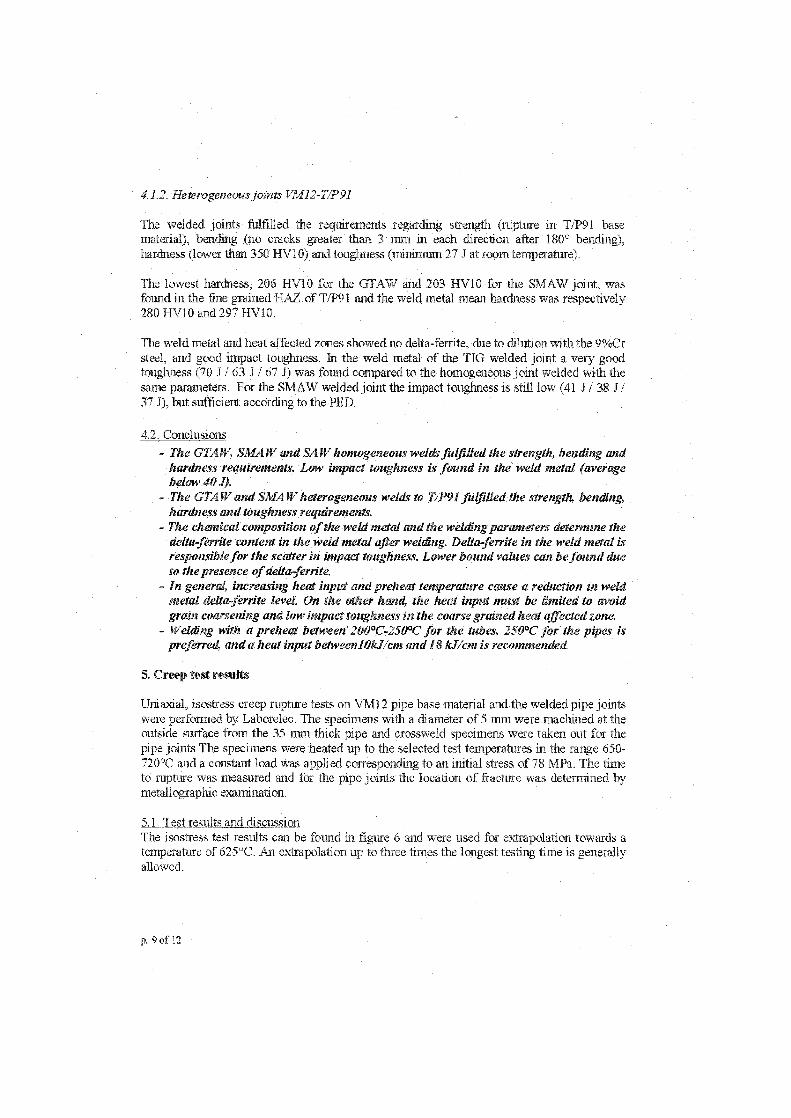
4.1.2. Heterogeneousjoints VMJ2-T/P91
The welded joints fulfilled the requirements regarding strength (rupture in T/P91 basematerial), bending (no eracks greater than 3 rum in each direetion after 180° bending),hardness (lower than 350 0) and toughness tininimum 27 J at room temperature).
The lowest hardness, 206 HV10 for the GTAW and 203 HV10 for the SMAW joint, wasfound in the fine grained HAZ of T/P91 and the weld metal mean hardness was respectively280 HV10 and 297 HVIO.
The weld metal and heat affected zones showed no delta-ferrite, due to dilution with the 9%Crsteel, and good impact touglmess. In the weld metal of the TIG welded joint a very goodtoughness (70 1 63 J I 67 J) was found compared to the homogeneous joint welded with thesame parameters. For the SMAW welded joint the impact toughness is still low (41 J 38 J37 J), but sufficient according to the PED.
4.2. Conclusions
- The GTAW, SMAW and £4 W homogeneous welds _Mißlied the strength, bending andhardness requirements. Low impact toughness is found in the weld metal (averagebelow 40 J.
- The GTAIV and SM4IV heterogeneous welds to T/P91 fulfilled 11w strength, bending,hardness and toughness reqzdrements.
- The chenzical composition of the weld metal and 11w welding parameters determine 11wdeltalerrite content in 11w weld metal after weide. Deha-fenite in the weld metal isrespon,sible for the scatter in impact toughness. Lower bound vahres can be found dueto the presence of delta-ferrite.
- In generai increasing heut input and preheat temperature eause a reduction in weldmetal delta-ftrrite leveL On the other hand, the heat input misst be limited to avoidgrain coarsening and low impact toughness in 11w coarse grained heut affected zone.
- Welding with a preheat between 200°C-250°C for the tubes, 250°C for the pipes ispreferred, and a heu.! input betweenlOkJkm and 18 k. 1 7cm is recommended.
5. Crem test results
Uniaxial, isostress creep rupture tests on VM12 pipe base material and the welded pipe jointswere perfonned by Laborelec. The specimens with a diameter of 5 mm were machined at theoutside surface from the 35 mm thick pipe and crossweld specimens were taken out for thepipe joints The specimens were heated up to the selected test temperatures in the range 650-720°C and a constant load was applied corresponding to an initial stress of 78 MPa. The timeto rupture was measured and for the pipe joints the location of fracture was determined bymetallographic examination.
5.1. Test results and discussionThe isostress test results cm be found in figure 6 and were used for extrapolation towards atemperature of 625°C. An extrapolation up to three times the longest testing time is generallyallowed.
p. 9 of 12
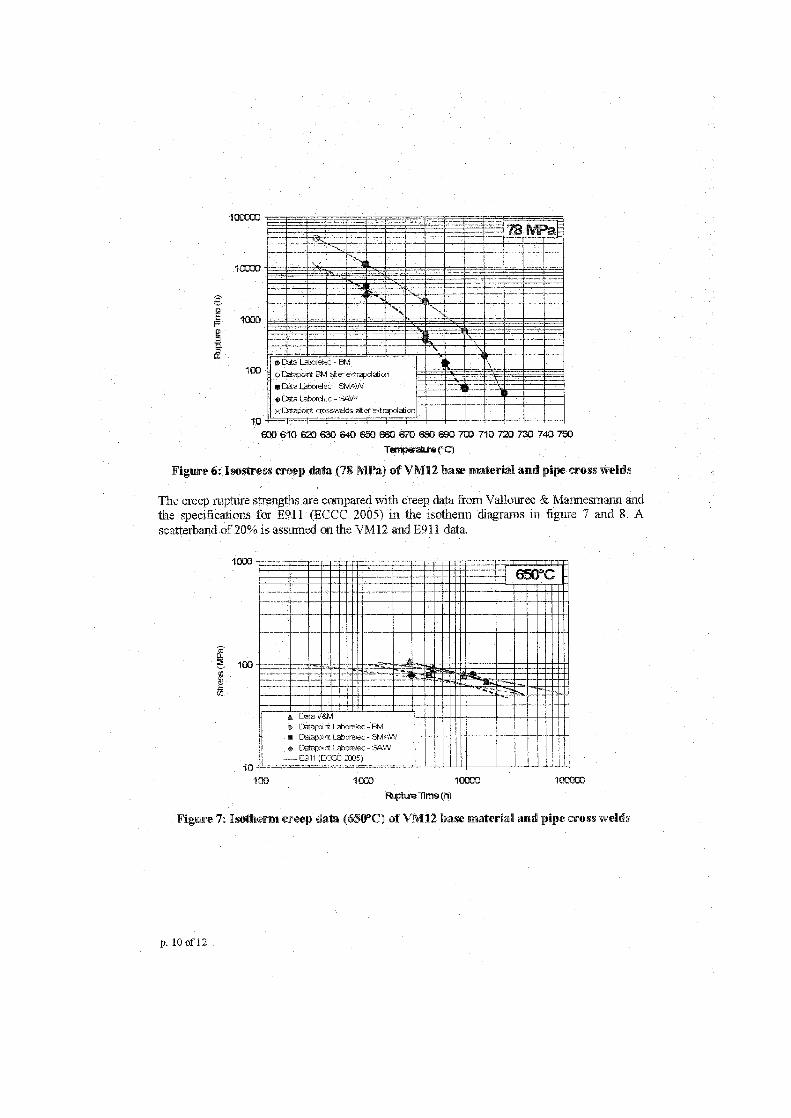
100000OMMINIMMINIMMIMM01■11111Mai"«""""«.."'■W=IMIll■"'1111■13111•1111111MIIIIIIII
111111111111111111111M111111111
''.'''''..".""'"'
=1=MIMMIMMIIIIM ._..7-
11111111111111111111110111111111111•1111111111111111M
11111111111111111•Maill11111111111111111
IIIIIIIIIIIMIN111111111111111
t............—Eliii
IMIIIIIIIIIIIIIIII1111111111111111111111
111■11111111111MMI11111111
1•111111111111111131111
IIINIMM= .181911M1■1111.1111.101.■wumm
ase.
111/111110.31•11101.wirm
woona.111•1111111•111111 IIIIIIIIMII
o C,ata L - BPBM edrapclaticrt
o Lia Laborelec - SMAW• Cuta Laborelec - SAWx Datapoint cmsswelds aker eztrapdation
Illialla,=......aar.•11111111MR
MeMit1111.10Mill111111111•1111131
10000
2
2100
10am 610 620 630 640 650 660 670 680 690 7C0 710 720 7
Temperattre (CC)
740 750
• Data V&M• Dtitaga rt Laborelec -■ Cotapunt Laborelec - SMAW♦ Entapoint Labon.Aec - SAVV
--- 9911 (ECCC Z05)-`t
Figure 6: Isostress creep data (78 MPa) of VM12 base material and pipe cross welds
The creep rupture strengths are compared with creep data from Vallourec & Mannesmann andthe specifications for E911 (ECCC 2005) in the isothenu diagrarns in figure 7 and 8. Ascatterband of 20% is assumed an the VM 12 and E911 data.
100 1003 10000 100000
Rt.ptize Time (h)
Figure 7: Isotlaer creep da (650°C) of VM12 base material and pipe cross welds
1000
10
p. 10 of 12
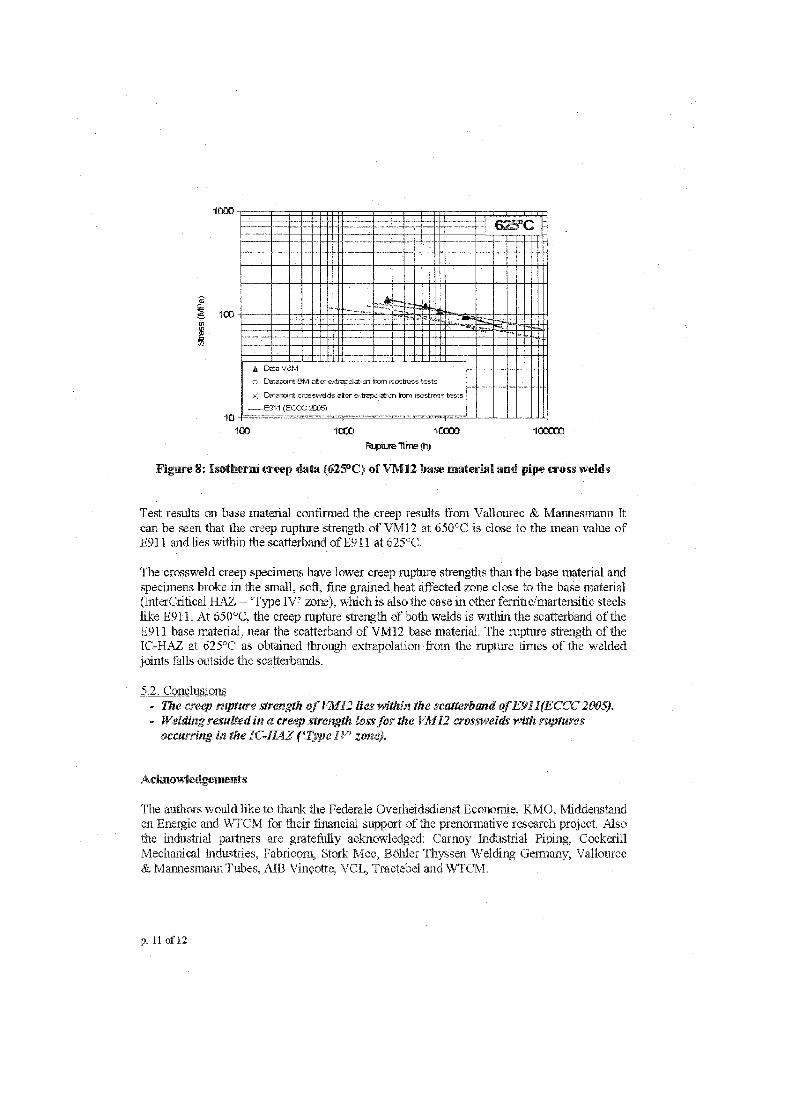
1000
10
111.111111111111111111110111111■1
INIIIIIIIIMMIIIIIIIIIM1111111111111111011111111111MIMINIIII111.1.313111Wilimilljneamilimil■FilirilimainäMr=71
nIIIIIIIII11111alinrniefflimmommumiimminuffl111111111111111111
11 - . ..-MIIMMIIIIIIMI1
111111111111111111111111111101111111112111111111011111111111111311111111111111111MalIIIIII
11111111111111111111trtatiMMIJOI
111111
1
II,111111111111•111111111111811011118111M ißllealla:::=
1111•11111111111111111111111111311111111111111111111•1111111111111MIMIIMIZIIIIIIIIIIIHIIIIIIIIIIIIIIIIIIZIIIIIIMIIIIIIIIIIIIIIIIMIIIII
1111•181111111111•11111111UMMIIIIIIIIIIIIIMI•11111111111111111131111111111111MWMMISUIN11111111110111•1•111111111111111111111111111111111111111111111111111113811■111111MIIIMUM
1111111111111113111OHIO111111111111
111,4717;1.zita V&M
o Beapare BM alter extrapeilaticn fturn isosteess te5ts
x Datapoint crussmel de. ater extrapelztim from Isostress tests
— E911 (EC= 2D05)
100 1030 10000
100000
aptue Tin-e (1-1)
Figure 8: Isotherm creep data (625°C) of V11112 base material and pipe cross welds
Test results on base material confirmed the creep resuits from Vallourec & Mannesmann Itcan be seen that the creep rupture strength of VM12 at 650°C is dose to the mean value ofE911 and lies within the scatterband of E911 at 625°C.
The crossweld creep specimens have lower creep rupture strengths than the base material andspecimens broke in the small, soft, fine grained heat affected zone dose to the base material(InterCritical HAZ — 'Type IV' wne), which is also the case in other ferriticimartensitic steelslike E911. At 650°C, the creep rupture strength of both welds is within the scatterband of theE911 base material, near the scatterband of VM12 base material. The rupture strength of theIC-HAZ at 625°C as obtained through extrapolation from the rupture times of the weldedjoints falls outside the scatterbands.
5.2. ConclusionsThe creep nipture strength of VM12 lies within the scatterband of E911(ECCC 2005).Welding resulled in a. creep strengt* loss for the 1, M12 crosswelds with rupturesoccurring in the IC-HAZ ('Type I V' zone).
Acknowledgements
The authors would like to thank the Federale Overheidsdienst Economie, KMO, Middenstanden Energie and WTCM for their financial support of the prenormative research project. Alsothe industrial partners are gratefully acknowledged: Carnoy In.dustrial Piping, CockerillMechanical Industries, Fabricom, Stork Mee, Böhler Thyssen Welding Germany, Vallourec& annesmaim Tubes, AIB Vincotte, VCL, Tractebel and WTCM.
p. 11 of 12
References
Gabrel J, Bendick W, Vaillant JC, Vandenberghe B, Lefebre B.VM12 - A new 12Cr steel for boiler tubes, headers and stearn pipes in Ultrasupercritical power plants.EPRI fourth International Conference an Advances in Materials Technology
Fossil
er Plants. October 26-28, 2004, South-Carolina.
[2]
Vandenberghe B, Gabrei J, Vaillant JC, Lefebvre B.Development of a new 121Cr-steel for tubes and pipes in power plants -with steamtemperatures up to 650 °C.Journees d'Etudes Europeennes sau les Equipements sous Pression. Paris 28,29 and 30Septembre
p. 12 of 12
EXPECTED CREEP LIFE OF WELDED 9-12% CR STEELS
Pertti Auerkari, Stefan Holmström, Jorma Salonen
VTT, Espoo, Finland
Abstract
The damage mechanisms affecting engineering steels at high temperatures include creep cavitation and crackingthat can form the path for final failure in susceptible locations such as welds. The useful experience of the in-service damage is not readily available from the newer heat resistant 9-12% chromium steels that are used in hotsteam lines of power plants.
inspection experience shows very modest creep cavitation in the conventional 11% Cr steel X20CrMoV11-1(X20) even after long term service. This is of interest because early creep failures have been reported from hightemperature components of Xl0CrMoVNb9-1 (P91), a newer martensitic high chromium steel.
Assessments of cross-weld creep rupture data of some 9% Cr steels suggest that the weld strength can fall belowthe traditionally assumed 80% of the parent material level, at least at the high temperature end of the testingrange. This can result in non-conservative (too long) predicted creep life for structures subjected to significantloading across the welds. For robust modeling of creep rupture strength of welds, two new procedures areproposed using the parent material master curve as a baseline. The first approach, or rigidity parametercorrection (RPC), is designed to suit for small data sets, and is always conservative by nature. The secondmethod, called logistic prediction (LP), accepts the apparent sigmoidal behaviour from the transition of failurelocation in welds, and is less conservative in extrapolation. Both procedures can be used to predict cross-weldrupture strength and weld strength factors (WSF) from any type of parent material master curve. Theseprocedures can be used to predict WSF for design and life assessment purposes.
Keywords: creep, weld, steel, strength, life
1. Creep damage in high chromium steels
Creep cavitation and subsequent cracking can limit component life when such damagegradually forms the path of final failure. The bright side of the damage is that the observedextent of it can also be used to indicate the material condition in the in-service inspections,particularly for welds that are common weakest links in creep. As a result, in-serviceinspections can be safely limited to a small fraction of a large structure such as pipeworkbetween boilers and turbines, and the inspection experience has facilitated guidelines ansetting safe inspection periods [1]. However, such experience is not available for newmaterials that may deviate from the usual course of creep damage evolution.
In addition to creep cavitation and cracking, high temperature damage involves paralleleffects of other mechanisms such as creep straining, strain-dependent damage (e.g. softening),thermal degradation as microstructural changes, and related redistribution of constitutiveelements and phases. However, although creep cavitation and cracking only represent a partof the total damage, creep cavitation also to some extent reflects the impact of othermechanisms that are weakening the material.
Unfortunately, plant service-like creep cavitation damage can be tedious to reproduce in thelaboratory. This is particularly true for steels with good creep ductility, such as low-alloy steel10CrMo9-10 (P22) or many higher alloyed 9-11% Cr steels including X20CrMoV11-1 (X20),
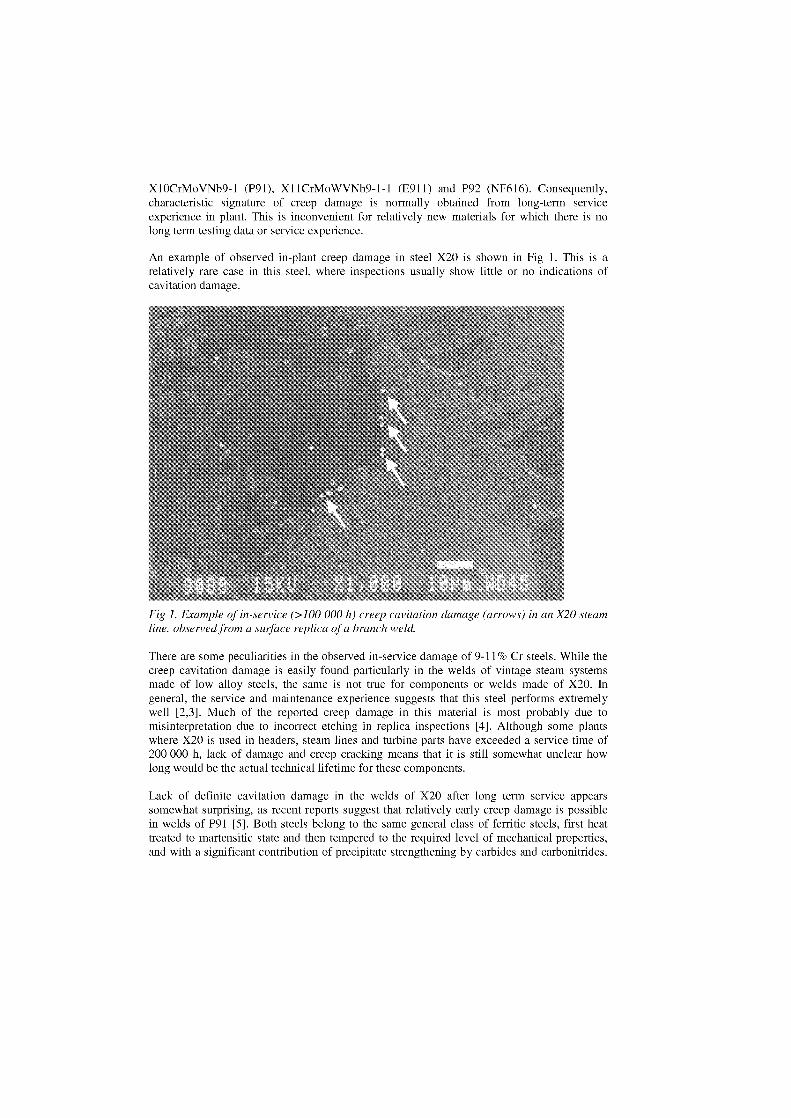
X10CrMoVNb9-1 (P91), X11CrMoWVNb9-1-1 (E911) and P92 (NF616). Consequently,characteristic signature of creep damage is normally obtained from long-term serviceexperience in plant. This is inconvenient for relatively new materials for which there is nolong term testing data or service experience.
An example of observed in-plant creep damage in steel X20 is shown in Fig 1. This is arelatively rare case in this steel, where inspections usually Show little or no indications ofcavitation damage.
Fig I. I ple of in-service (>100 000 h) creep cavitation age (arrows)1 an X20 steamline, observed from a stuface replica of a branch well.
There are some peculiarities in the observed in-service damage of 9-11% Cr steels. While thecreep cavitation damage is easily found particularly in the welds of vintage steam systemsmade of low alloy steels, the same is not true for components or welds made of X20. lngeneral, the service and maintenance experience suggests that this steel performs extremelywell [2,3]. Much of the reported creep damage in this material is most probably due tomisinterpretation due to incorrect etching in replica inspections [4]. Although some plantswhere X20 is used in headers, steam lines and turbine parts have exceeded a service time of200 000 h, lack of damage and creep cracking means that it is still somewhat unclear howJong would be the actual technical lifetime for these components.
Lack of definite cavitation damage in the welds of X20 after long term service appearssomewhat surprising, as recent reports suggest that relatively early creep damage is possiblein welds of P91 [5]. Both steels belong to the same general dass of ferritic steels, first heattreated to martensitic state and then tempered to the required level of mechanical properties,and with a significant contribution of precipitate strengthening by carbides and carbonitrides.

From design point of view, the actual creep life should not be very much materials dependentfor a given design life, because the design aims to compensate for the materials properties.When this is not the case, either some of the materials properties are not as expected or thereis other bias in the features that determine the actual creep life. The steel X20 was introducednearly half a century ago, and with generally good results until present. It could be seen a littledisappointing if a comparable relative performance were not provided by newer steels likeP91, first introduced some 30 years later. Since the alloy design is comparable, the differencescould also imply early creep failures in steels like E91 1 and P92, for which even less serviceexperience is available.
2. Design aspects of steels subjected to long term creep
For common steels intended for high temperature service, characteristic creep strength valuesare given in public standards and guidelines (Fig 2). The creep strength indicated by e.g. EN10216-2 is considerably higher for P91 than for X20, which itself once was at least a similarimprovement to the low alloy steel 14MoV6-3 (0.5CMV).
The differences between steel types are also reflected in the maximum allowed servicetemperatures. For example, X20 has been applied to steam temperatures up to about 560-565°C, and P91 in newer plants slightly higher, up to about 570-580°C. The actual servicetemperatures are usually somewhat lower for both steels, typically in the range 500-550°C.This is often because of other design limits, such as the limited inlet gas temperatures inHRSG' s, hot corrosion limits in biomass and process boilers, or other conservatism in processdesign. Even if such factors were not specifically considered, the temperature differencebetween systems made of X20 and P91 is only partly due to the limits in material strength.Another reason is related to design codes and design practices, resulting generally insomewhat lower temperatures in the geographical regions where X20 has been used forotherwise similar plant.
More detailed differences can be seen in the chemical composition: X20 has higher carboncontent than P91 and no specified nitrogen, with resulting differences in the composition ofMX precipitates. Higher carbon content in X20 also results in higher martensite hardness andlower toughness before tempering, though this is an issue for manufacturing rather than for in-service properties. X20 may be somewhat less sensitive than P91 to deviations in heattreatment, but requires more care in welding in both original fabrication and repairs.Additional scatter factors can be expected e.g. from variations in section thickness orproduction via rolling, drawing, forging, casting etc.
Comparing the long-term (200 000 h) creep rupture strength of different 9-11% Cr steels (Fig2) shows that at the usual levels of service temperatures the relative improvement from X20 toP91 is roughly similar as was the improvement from the traditional low-alloy steels to X20.However, the relative improvement from P91 to newer steels like P92 is less impressive.Particularly small difference now appears between P91 and E911.
As noted above, the plant experience with the X20 steel has been excellent. The reasons areprobably at least partly due to relatively low service temperatures and often also low stressesin comparison with the allowed maximum levels. However, there are also other factors
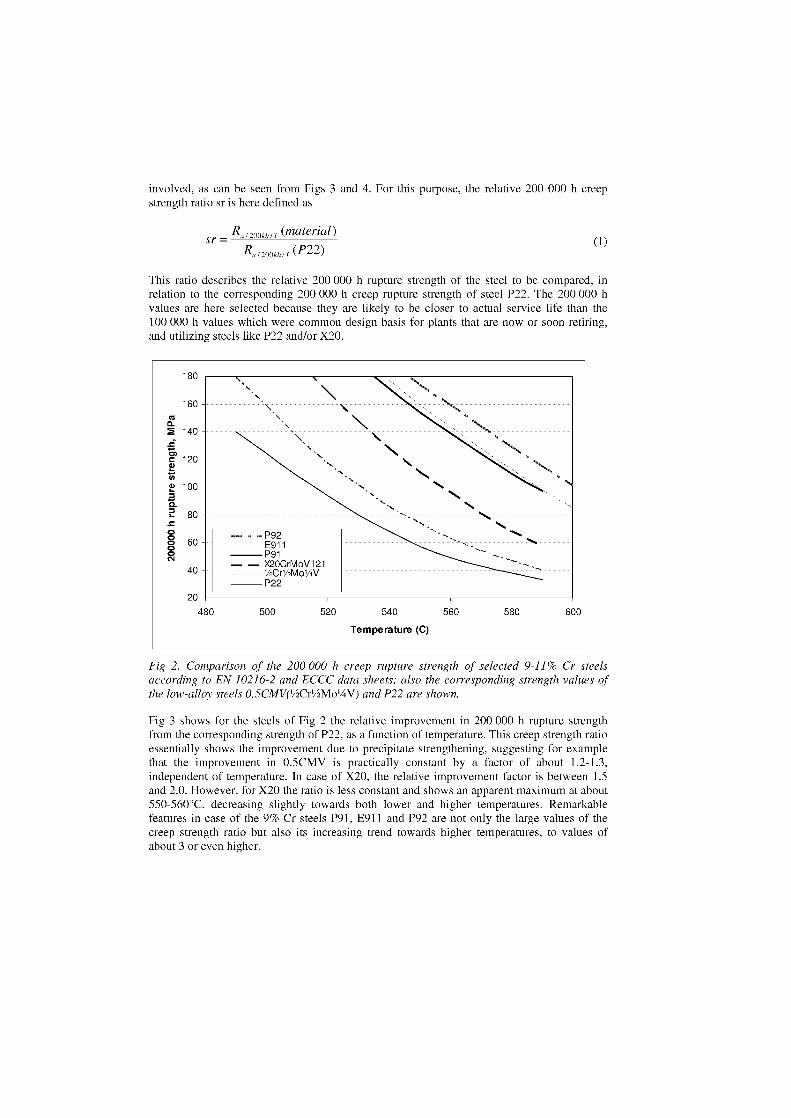
— -P92E911P91
— — X20CrMoV1211/2Cr1/2Mo1/4V P22
involved, as can be seen from Figs 3 and 4. For this purpose, the relative 200 000 h creepstrength ratio sr is here defined as
(material)sr =
Rix 200kh T (P22) (1)
This ratio describes the relative 200 000 h rupture strength of the steel to be compared, inrelation to the corresponding 200 000 h creep rupture strength of steel P22. The 200 000 hvalues are here selected because they are likely to be closer to actual service life than the100 000 h values which were common design basis for plants that are now or soon retiring,and utilizing steels like P22 and/or X20.
Fig 2. Comparison of the 200 000 h creep rupture strength of selected 9-11% Cr steelsaccording to EN 10216-2 and ECCC data sheets; also the corresponding strength values ofthe low-alloy steels 0.5CMV(1/2Cr1/2MoViV) and P22 are shown.
Fig 3 shows for the steels of Fig 2 the relative improvement in 200 000 h rupture strengthfrom the corresponding strength of P22, as a function of temperature. This creep strength ratioessentially shows the improvement due to precipitate strengthening, suggesting for examplethat the improvement in 0.5CMV is practically constant by a factor of about 1.2-1.3,independent of temperature. In case of X20, the relative improvement factor is between 1.5and 2.0. However, for X20 the ratio is less constant and shows an apparent maximum at about550-560°C, decreasing slightly towards both lower and higher temperatures. Remarkablefeatures in case of the 9% Cr steels P91, E911 and P92 are not only the large values of thecreep strength ratio but also its increasing trend towards higher temperatures, to values ofabout 3 or even higher.
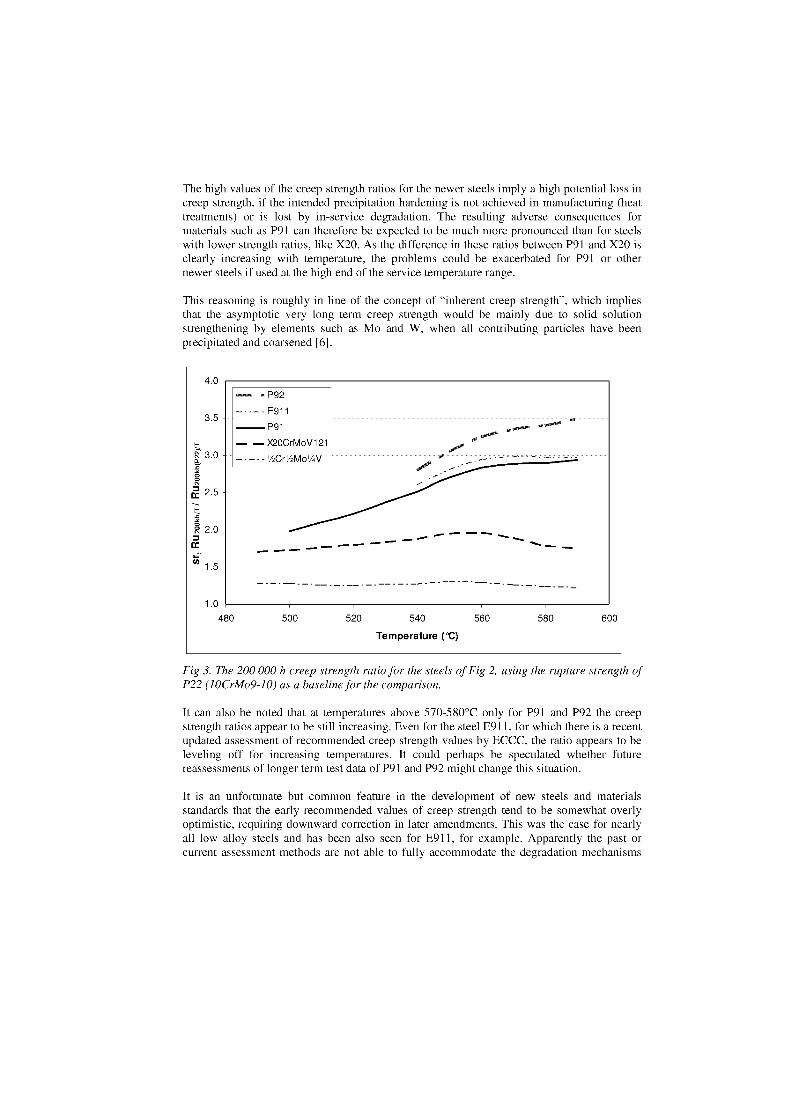
The high values of the creep strength ratios for the newer steels imply a high potential loss increep strength, if the intended precipitation hardening is not achieved in manufacturing (heattreatments) or is lost by in-service degradation. The resulting adverse consequences formaterials such as P91 can therefore be expected to be much more pronounced than for steelswith lower strength ratios, like X20. As the difference in these ratios between P91 and X20 isclearly increasing with temperature, the problems could be exacerbated for P91 or othernewer steels if used at the high end of the service temperature range.
This reasoning is roughly in line of the concept of "inherent creep strength", which impliesthat the asymptotic very long term creep strength would be mainly due to solid solutionstrengthening by elements such as Mo and W, when all contributing particles have beenprecipitated and coarsened [6].
4.0
600
3.5
il 3.0 -1
R=ce 2.5 -
II"Y9 2.0=
c7 1
1.0
■ ......,
----- P92
-E911
P91
— —X20CrMoV121
----- 1/2CrI/2Mo1/4V
480 500 520 540
Temperature (°C)
560 580
Fig 3. The 200 000 h creep strength ratio for the steels of Fig 2, using the rupture strength ofP22 (10CrMo9-10) as a baseline for the comparison.
lt can also be noted that at temperatures above 570-580°C only for P91 and P92 the creepstrength ratios appear to be still increasing. Even for the steel E911, for which there is a recentupdated assessment of recommended creep strength values by ECCC, the ratio appears to beleveling off for increasing temperatures. lt could perhaps be speculated whether futurereassessments of longer term test data of P91 and P92 might change this situation.
lt is an unfortunate but common feature in the development of new steels and materialsstandards that the early recommended values of creep strength tend to be somewhat overlyoptimistic, requiring downward correction in later amendments. This was the case for nearlyall low alloy steels and has been also seen for E911, for example. Apparently the past orcurrent assessment methods are not able to fully accommodate the degradation mechanisms
that are affecting the long-term mechanical properties, when extrapolated beyond the range ofuniaxial rupture data. Such non-conservative assessment results can be also expected for thenew steels. In Fig 3, the 200 000 h creep strength values for P91 are from extendedextrapolation (by a factor > 3 in time), and therefore changes would not be unexpected in laterreassessment of longer term data.
Here the nominal "time safety margin" or design life ratio dlr without additional safety factorsis defined as an isothermal time factor as follows:
dir - 1-,10.8xy ( 200kh )1T (2)200kh
where t„,„„(200kh)IT is the predicted rupture time at 80% of the 200 000 h rupture stress.
Fig 4 gives this time factor as a function of temperature for the same steels as Figs 2 and 3. ltis apparent that the steels fall into two distinct groups. The low-alloy steels and X20 formhere one group, with a dlr 2 - 4 at temperatures above 510°C. The second group includes the9% Cr steels P91, E911 and P92, for which dlr is much higher and strongly increases withdecreasing temperature (Fig 4).
The higher values of dlr for P91, E911 and P92 than for X20 would suggest higher inherentsafety margins for the 9% Cr steels, which as intact material should perform well. However,this could be more than compensated for, should the creep strength of the 9% Cr steelscollapse due to lacking precipitate strengthening. Such a collapse would have less drasticeffects an X20, which is in this respect more comparable to the low alloy steels.
Welds of classical steels tend to show cross-weld rupture strength reduced by about 20% fromthe level of the parent material. For newer 9% Cr steels, higher strength reduction appearspossible. However, the additional strength reduction could mainly apply to the hightemperature end of the application range, and for many applications the classical 20% rulewould still work reasonably well. As Jong as creep failure of welds remains in the heataffected zone or parent material, the above reasoning would largely apply to welds as well.
3. Prediction of weld strength factors (WSF)
In general the weld creep strength factor (WSF) is defined according to ECCCrecommendations [7] as
WSF =R.(w)itir
(3)
where is the rupture strength of the weld at specified time and temperature, and
R„ ,,„ is the corresponding strength of the parent material at the same time and temperature.
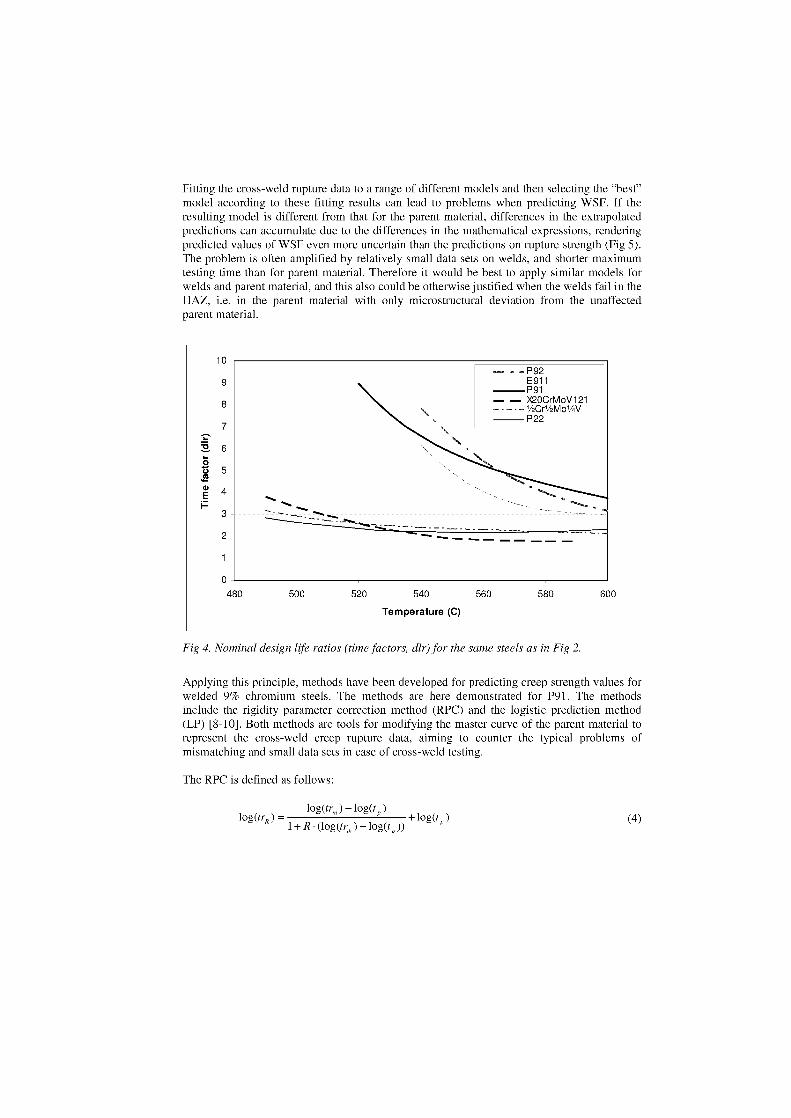
- P92E911P91
— — X20CrMoV121- - - - -1/2Cr1/2Mo1/4V P22
Temperature (C)
Fitting the cross-weld rupture data to a range of different models and then selecting the "best"model according to these fitting results can lead to problems when predicting WSF. If theresulting model is different from that for the parent material, differences in the extrapolatedpredictions can accumulate due to the differences in the mathematical expressions, renderingpredicted values of WSF even more uncertain than the predictions on rupture strength (Fig 5).The problem is often amplified by relatively small data sets on welds, and shorter maximumtesting time than for parent material. Therefore it would be best to apply similar models forwelds and parent material, and this also could be otherwise justified when the welds fail in theHAZ, i.e. in the parent material with only microstructural deviation from the unaffectedparent material.
Fig 4. Nominal design life ratlos (time factors, dlr) for the same steels as in Fig 2.
Applying this principle, methods have been developed for predicting creep strength values forwelded 9% chromium steels. The methods are here demonstrated for P91. The methodsinclude the rigidity parameter correction method (RPC) and the logistic prediction method(LP) [8-10]. Both methods are tools for modifying the master curve of the parent material torepresent the cross-weld creep rupture data, aiming to counter the typical problems ofmismatching and small data sets in case of cross-weld testing.
The RPC is defined as follows:
log(tr,„ ) - log(t , )log(trR ) - + log(tp)
1+ R • (log(tr,„)- log(tp))(4)
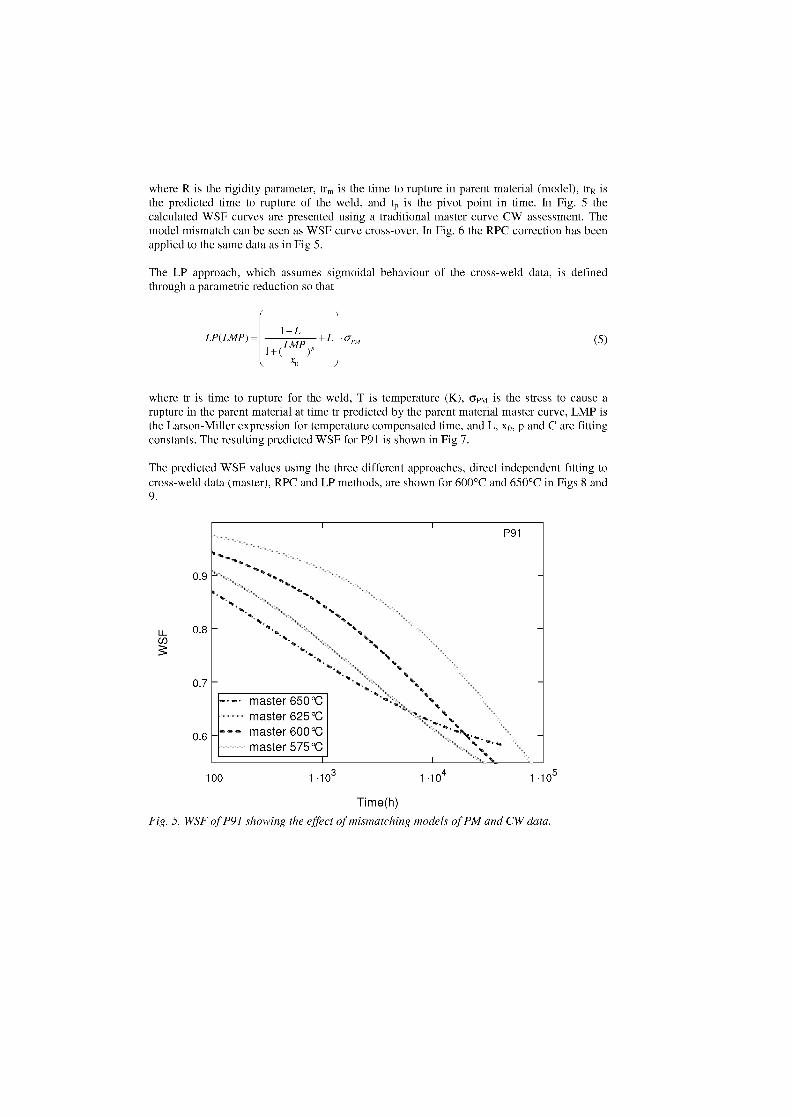
--• master 650°Cmaster 625°Cmaster 600°Cmaster 575°C
where R is the rigidity parameter, tr„, is the time to rupture in parent material (model), tr R isthe predicted time to rupture of the weld, and t p is the pivot point in time. In Fig. 5 thecalculated WSF curves are presented using a traditional master curve CW assessment. Themodel mismatch can be seen as WSF curve cross-over. In Fig. 6 the RPC correction has beenapplied to the same data as in Fig 5.
The LP approach, which assumes sigmoidal behaviour of the cross-weld data, is definedthrough a parametric reduction so that
LP(LMP) =1—L +L
1+(LMP
)Pxo
(5)
where tr is time to rupture for the weld, T is temperature (K), apm is the stress to cause arupture in the parent material at time tr predicted by the parent material master curve, LMP isthe Larson-Miller expression for temperature compensated time, and L, xo, p and C are fittingconstants. The resulting predicted WSF for P91 is shown in Fig 7.
The predicted WSF values using the three different approaches, direct independent fitting tocross-weld data (master), RPC and LP methods, are shown for 600°C and 650°C in Figs 8 and9.
P91
0.9
u_ 0.8
0.7
0.6
100 1-103 1.104 1.105
Time(h)Fig. 5. WSF of P91 showing the effect of mismatching modeln of PM and CW data.
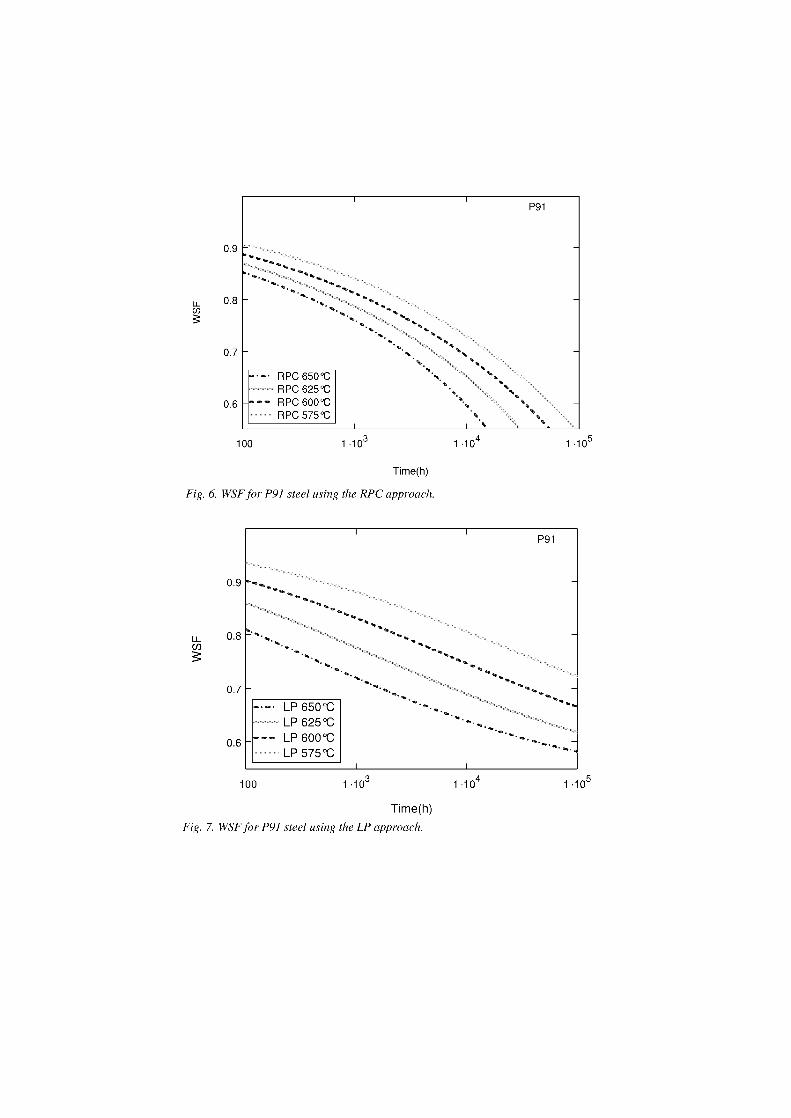
0.7
RPC 650°CRPC 625°CRPC 600°CRPC 575°C
0.6
0.9
u_ 0.8
0.7
-- LP 650°CLP 625°C
0.6 --- LP 600°CLP 575°C
P91
0.9
100 1 •103 1 •104
1 •105
Time(h)
Fig. 6. WSF for P91 steel using the RPC approach.
P91
Time(h)Fig. 7. WSF for P91 steel using the LP approach.
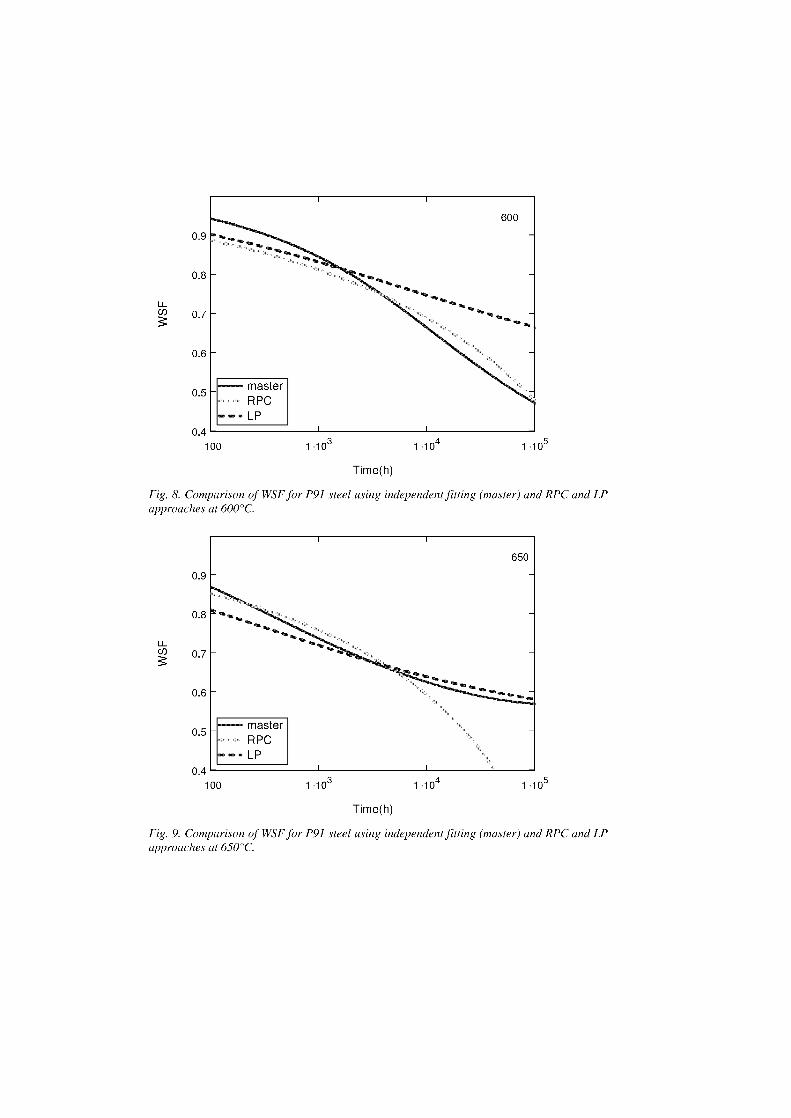
0.9
0.8
0.6
0.5
0.4
100
1 -103 1 -10
4 1 -105
Time(h)
Fig. 8. Comparison of WSF for P91 steel using independent fitting (master) and RPC and LPapproaches at 600°C.
100
1 -103 1 -10
4 1 -105
Time(h)
Fig. 9. Comparison of WSF for P91 steel using independent fitting (master) and RPC and LPapproaches at 650°C.
0.9
0.8
0.7
0.6
0.5
0.4
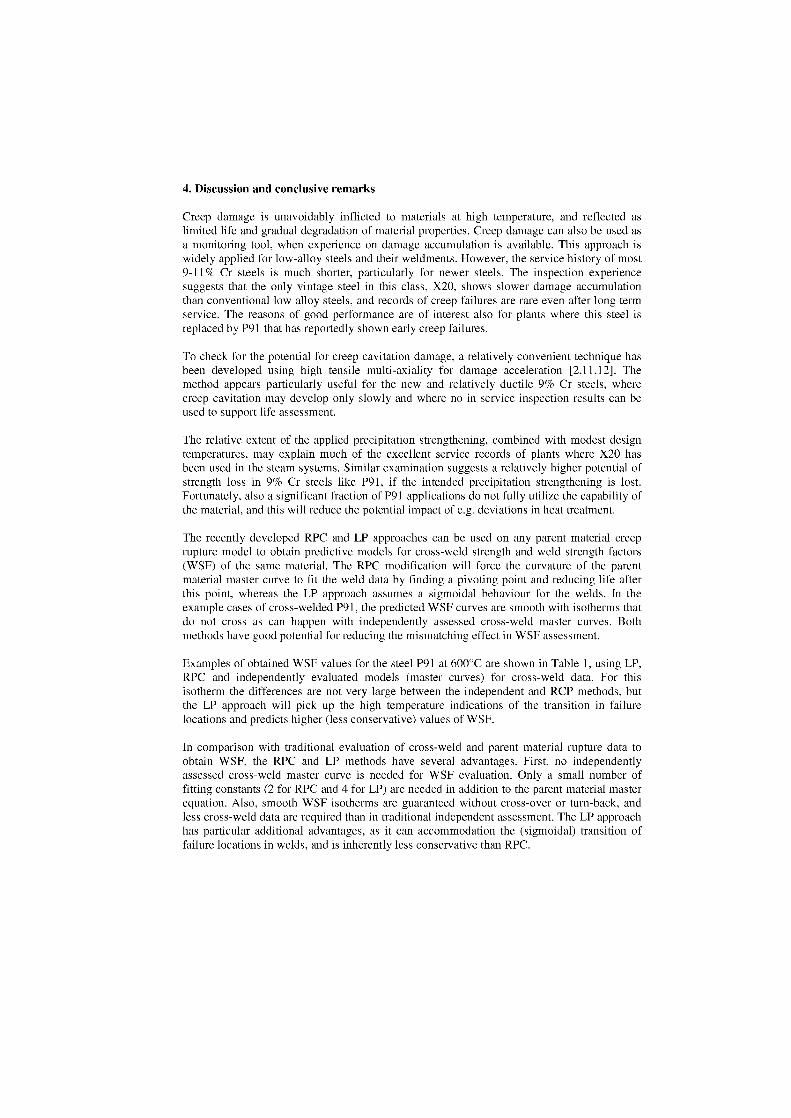
4. Discussion and conclusive remarks
Creep damage is unavoidably inflicted to materials at high temperature, and reflected aslimited life and gradual degradation of material properties. Creep damage can also be used asa monitoring tool, when experience on damage accumulation is available. This approach iswidely applied for low-alloy steels and their weldments. However, the service history of most9-11% Cr steels is much shorter, particularly for newer steels. The inspection experiencesuggests that the only vintage steel in this dass, X20, shows slower damage accumulationthan conventional low alloy steels, and records of creep failures are rare even after long termservice. The reasons of good performance are of interest also for plants where this steel isreplaced by P91 that has reportedly shown early creep failures.
To check for the potential for creep cavitation damage, a relatively convenient technique hasbeen developed using high tensile multi-axiality for damage acceleration [2,11,12]. Themethod appears particularly useful for the new and relatively ductile 9% Cr steels, wherecreep cavitation may develop only slowly and where no in-service inspection results can beused to support life assessment.
The relative extent of the applied precipitation strengthening, combined with modest designtemperatures, may explain much of the excellent service records of plants where X20 hasbeen used in the steam systems. Similar examination suggests a relatively higher potential ofstrength loss in 9% Cr steels like P91, if the intended precipitation strengthening is lost.Fortunately, also a significant fraction of P91 applications do not fully utilize the capability ofthe material, and this will reduce the potential impact of e.g. deviations in heat treatment.
The recently developed RPC and LP approaches can be used on any parent material creeprupture model to obtain predictive models for cross-weld strength and weld strength factors(WSF) of the same material. The RPC modification will force the curvature of the parentmaterial master curve to fit the weld data by finding a pivoting point and reducing life afterthis point, whereas the LP approach assumes a sigmoidal behaviour for the welds. In theexample cases of cross-welded P91, the predicted WSF curves are smooth with isotherms thatdo not cross as can happen with independently assessed cross-weld master curves. Bothmethods have good potential for reducing the mismatching effect in WSF assessment.
Examples of obtained WSF values for the steel P91 at 600°C are shown in Table 1, using LP,RPC and independently evaluated models (master curves) for cross-weld data. For thisisotherm the differences are not very large between the independent and RCP methods, butthe LP approach will pick up the high temperature indications of the transition in failurelocations and predicts higher (less conservative) values of WSF.
In comparison with traditional evaluation of cross-weld and parent material rupture data toobtain WSF, the RPC and LP methods have several advantages. First, no independentlyassessed cross-weld master curve is needed for WSF evaluation. Only a Small number offitting constants (2 for RPC and 4 for LP) are needed in addition to the parent material masterequation. Also, smooth WSF isotherms are guaranteed without cross-over or turn-back, andless cross-weld data are required than in traditional independent assessment. The LP approachhas particular additional advantages, as it can accommodation the (sigmoidal) transition offailure locations in welds, and is inherently less conservative than RPC.
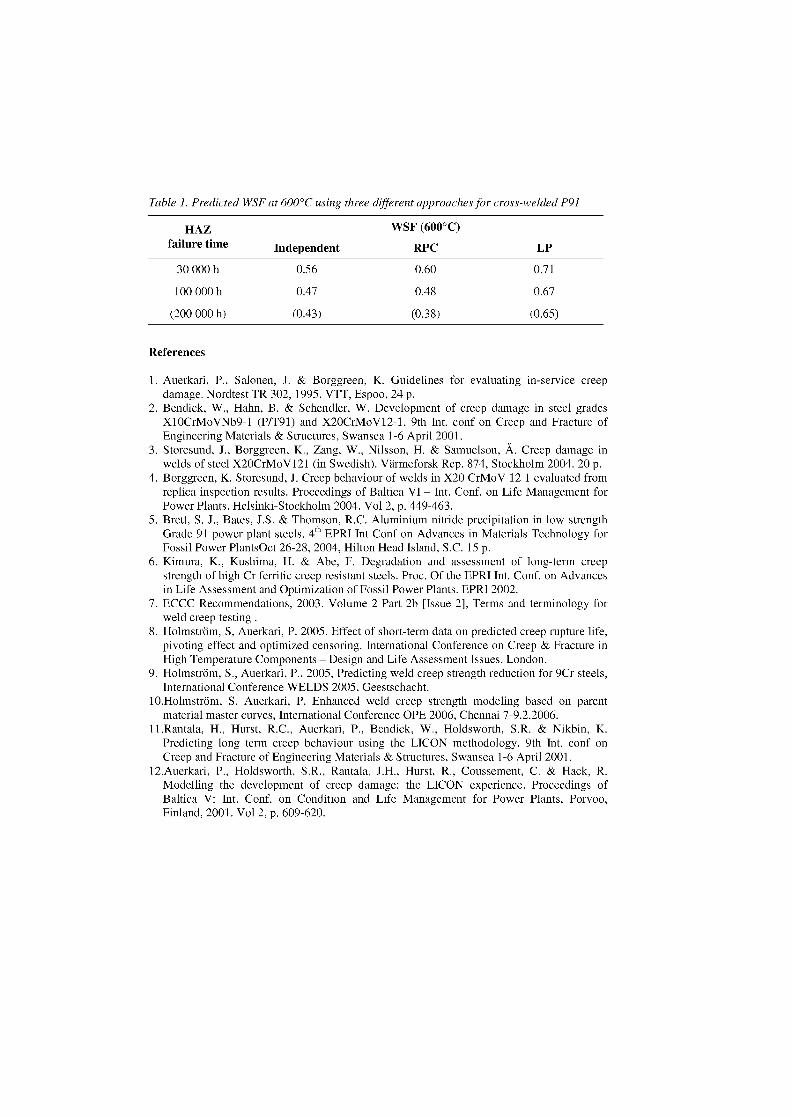
Table 1. Predicted WSF at 600°C using three different approaches for cross-welded P91
HAZ WSF (600°C)failure time Independent RPC LP
30 000 h 0.56 0.60 0.71
100 000 h 0.47 0.48 0.67
(200 000 h) (0.43) (0.38) (0.65)
References
1. Auerkari, P., Salonen, J. & Borggreen, K. Guidelines for evaluating in-service creepdamage. Nordtest TR 302, 1995. VTT, Espoo, 24 p.
2. Bendick, W., Hahn, B. & Schendler, W. Development of creep damage in steel gradesX10CrMoVNb9-1 (P/T91) and X20CrMoV12-1. 9th Int. conf on Creep and Fracture ofEngineering Materials & Structures, Swansea 1-6 April 2001.
3. Storesund, J., Borggreen, K., Zang, W., Nilsson, H. & Samuelson, Ä. Creep damage inwelds of steel X20CrMoV121 (in Swedish). Värmeforsk Rep. 874, Stockholm 2004. 20 p.
4. Borggreen, K. Storesund, J. Creep behaviour of welds in X20 CrMoV 12 1 evaluated fromreplica inspection results. Proceedings of Baltica VI – Int. Conf. on Life Management forPower Plants. Helsinki-Stockholm 2004. Vol 2, p. 449-463.
5. Brett, S. J., Bates, J.S. & Thomson, R.C. Aluminium nitride precipitation in low strengthGrade 91 power plant steels. 4 th EPRI Int Conf on Advances in Materials Technology forFossil Power PlantsOct 26-28, 2004, Hilton Head Island, S.C. 15 p.
6. Kimura, K., Kushima, H. & Abe, F. Degradation and assessment of long-term creepstrength of high Cr ferritic creep resistant steels. Proc. Of the EPRI Int. Conf. on Advancesin Life Assessment and Optimization of Fossil Power Plants. EPR1 2002.
7. ECCC Recommendations, 2003. Volume 2 Part 2b [Issue 2], Terms and terminology forweld creep testing .
8. Holmström, S, Auerkari, P. 2005. Effect of short-term data on predicted creep rupture life,pivoting effect and optimized censoring. International Conference on Creep & Fracture inHigh Temperature Components – Design and Life Assessment lssues. London.
9. Holmström, S., Auerkari, P., 2005, Predicting weld creep strength reduction for 9Cr steels,International Conference WELDS 2005, Geestschacht.
10.Holmström, S. Auerkari, P. Enhanced weld creep strength modeling based on parentmaterial master curves, International Conference OPE 2006, Chennai 7-9.2.2006.
11.Rantala, H., Hurst, R.C., Auerkari, P., Bendick, W., Holdsworth, S.R. & Nikbin, K.Predicting long term creep behaviour using the LICON methodology. 9th Int. conf onCreep and Fracture of Engineering Materials & Structures, Swansea 1-6 April 2001.
12.Auerkari, P., Holdsworth, S.R., Rantala, J.H., Hurst, R., Coussement, C. & Hack, R.Modelling the development of creep damage: the L1CON experience. Proceedings ofBaltica V: Int. Conf. on Condition and Life Management for Power Plants, Porvoo,Finland, 2001. Vol 2, p. 609-620.
STUDY OF THE SIMULATED HAZ OF A BORON ALLOYED CREEPRESISTANT 9% CHROMIUM STEEL
Peter Mayr and Horst Cerjak
Institute for Materials Science, Welding and FormingGraz University of Technology
Kopernikusgasse 24, 8010 Graz, AustriaEmail: [email protected]
Abstract
A basic study an the weldability of a boron alloyed advanced 9% Cr steel was performed applying the so-called`Heat Affected Zone Simulation' technique using a Gleeble 1500 thermo-mechanical testing machine. Changesin the microstructure and in the materials properties of the HAZ were examined, before and after a postweld heattreatment (PWHT) of 730°C for 12 hours by applying light-microscopy, scanning electron microscopy (SEM),different methods of analytical transmission electron microscopy, hardness measurements and Charpy-V notchedbar impact tests. The microstructures at representative points during a typical welding cycle and ensuing post-weld heat treatment were studied in detail. The evolution of precipitates during a characteristic welding cycleand subsequent PWHT was observed, showing the complete dissolution of all precipitates during the weldthermal cycle and re-precipitation during the PWHT. Delta-ferrite formation was observed for welding cycleswith high enough peak temperatures causing retained delta-ferrite in the material after PWHT.
Keywords: 9 Cr steel, boron alloyed, microstructure, delta-ferrite, HAZ-toughness
Introduction
Within the last decades worldwide, increased R&D effort was put into the development ofadvanced creep resistant 9-12% chromium steels. These steels are strongly required for theconstruction of critical components of coal fired power plants operating at much higherefficiencies than the current generation of supercritical plants. This increase in efficiency ismainly driven by the use of ultra supercritical steam conditions (USC). Within researchprograms in the USA, Japan and Europe, several types of creep resistant martensitic 9-12%chromium steels have been developed and brought into service. These steels are capable oflive steam temperatures up to 600°C and a steam pressure up to 290 bar [1]. Welding is themost important joining process for these components. Research [2,3] and in-serviceexperience [4] have shown that the heat affected zone (HAZ) of weldments is often theweckest part in these constructions. Microstructural changes within this zone caused by theinfluence of the weld thermal cycle lead to inferior mechanical properties of this zonecompared to the Base material. Reduced toughness values generated by the formation of abrittle and coarse grained microstructure and accelerated pore formation in softened regionsafter welding and subsequent post-weld heat treatment (PWHT) often result in a final fracturein the HAZ [5]. The method of thermo-mechanical simulation is widely used to generate themicrostructure of the different parts of the HAZ and subsequently investigate thesemicrostructures metallographically and by mechanical testing. In this work, apart fromconventional investigation methods, also advanced electron microscopy methods wereutilised. All work performed should lead to a better understanding of the complex processes
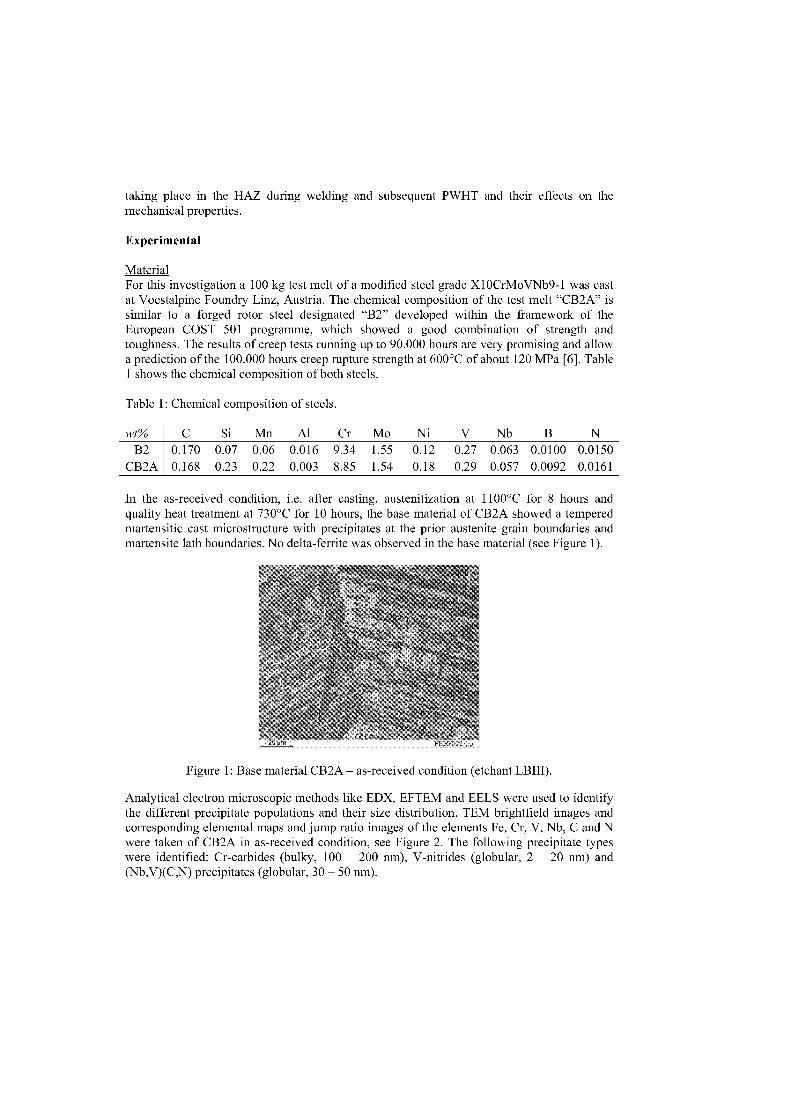
taking place in the HAZ during welding and subsequent PWHT and their effects an themechanical properties.
Experimental
MaterialFor this investigation a 100 kg test melt of a modified steel grade X10CrMoVNb9-1 was castat Voestalpine Foundry Linz, Austria. The chemical composition of the test melt "CB2A" issimilar to a forged rotor steel designated "B2" developed within the framework of theEuropean COST 501 programme, which showed a good combination of strength andtoughness. The results of creep tests running up to 90.000 hours are very promising and allowa prediction of the 100.000 hours creep rupture strength at 600°C of about 120 MPa [6]. Table1 Shows the chemical composition of both steels.
Table 1: Chemical composition of steels.
wt% C Si Mn Al Cr Mo Ni V Nb BB2
CB2A0.1700.168
0.070.23
0.060.22
0.0160.003
9.348.85
1.551.54
0.120.18
0.270.29
0.0630.057
0.01000.0092
0.01500.0161
In the as-received condition, i.e. alter casting, austenitization at 1100°C for 8 hours andquality heat treatment at 730°C for 10 hours, the base material of CB2A showed a temperedmartensitic cast microstructure with precipitates at the prior austenite grain boundaries andmartensite lath boundaries. No delta-ferrite was observed in the base material (see Figure 1).
Figure 1: Base material CB2A — as-received condition (etchant LBIII).
Analytical electron microscopic methods like EDX, EFTEM and EELS were used to identifythe different precipitate populations and their size distribution. TEM brightfield images andcorresponding elemental maps and jump ratio images of the elements Fe, Cr, V, Nb, C and Nwere taken of CB2A in as-received condition, see Figure 2. The following precipitate typenwere identified: Cr-carbides (bulky, 100 — 200 nm), V-nitrides (globular, 2 — 20 nm) and(Nb,V)(C,N) precipitates (globular, 30 — 50 nm).
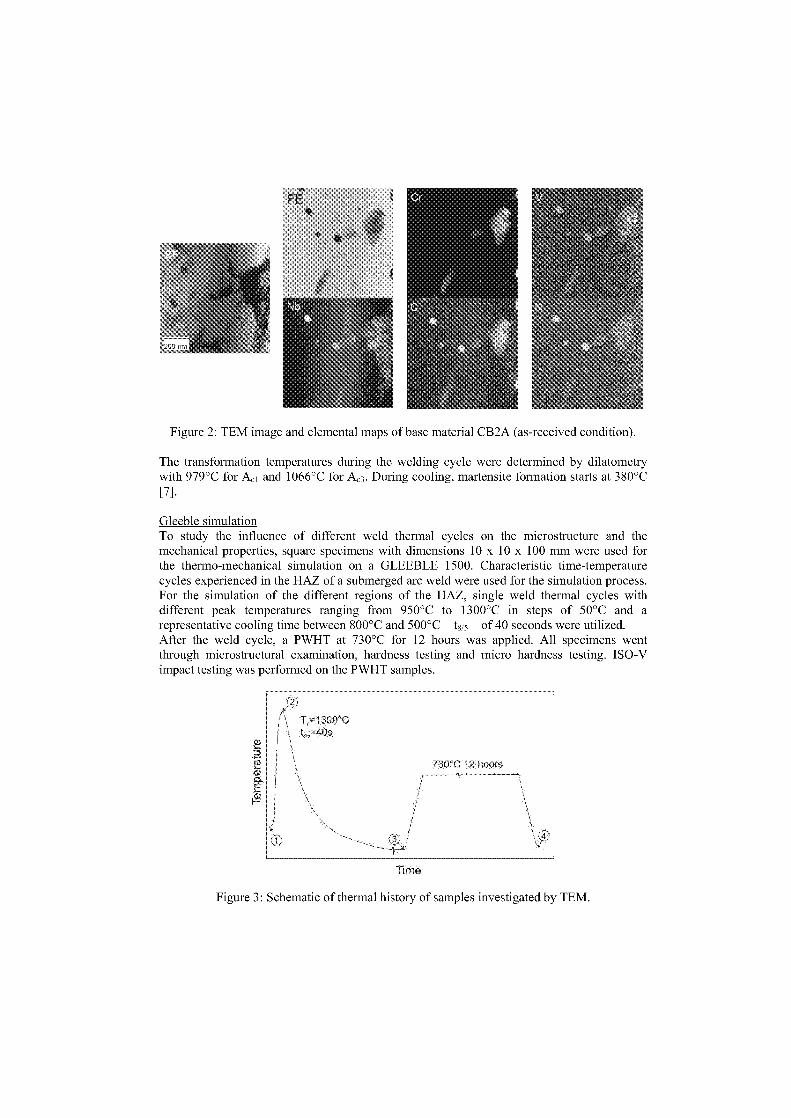
Figure 2: TEM image and elemental maps of bare material CB2A (as-received condition).
The transformation temperatures during the welding cycle were determined by dilatometrywith 979°C for Ad and 1066°C for Ac3. During cooling, martensite formation starts at 380°C
[71.
Gleeble simulationTo study the influence of different weld thermal cycles on the microstructure and themechanical properties, square specimens with dimensions 10 x 10 x 100 mm were used forthe thermo-mechanical simulation on a GLEEBLE 1500. Characteristic time-temperaturecycles experienced in the HAZ of a submerged arc weld were used for the simulation process.For the simulation of the different regions of the HAZ, single weld thermal cycles withdifferent peak temperatures ranging from 950°C to 1300°C in steps of 50°C and arepresentative cooling time between 800°C and 500°C – t815 — of 40 seconds were utilized.After the weld cycle, a PWHT at 730°C for 12 hours was applied. All specimens wentthrough microstructural examination, hardness testing and micro hardness testing. ISO-Vimpact testing was performed on the PWHT samples.
Time
Figure 3: Schematic of thermal history of samples investigated by TEM.
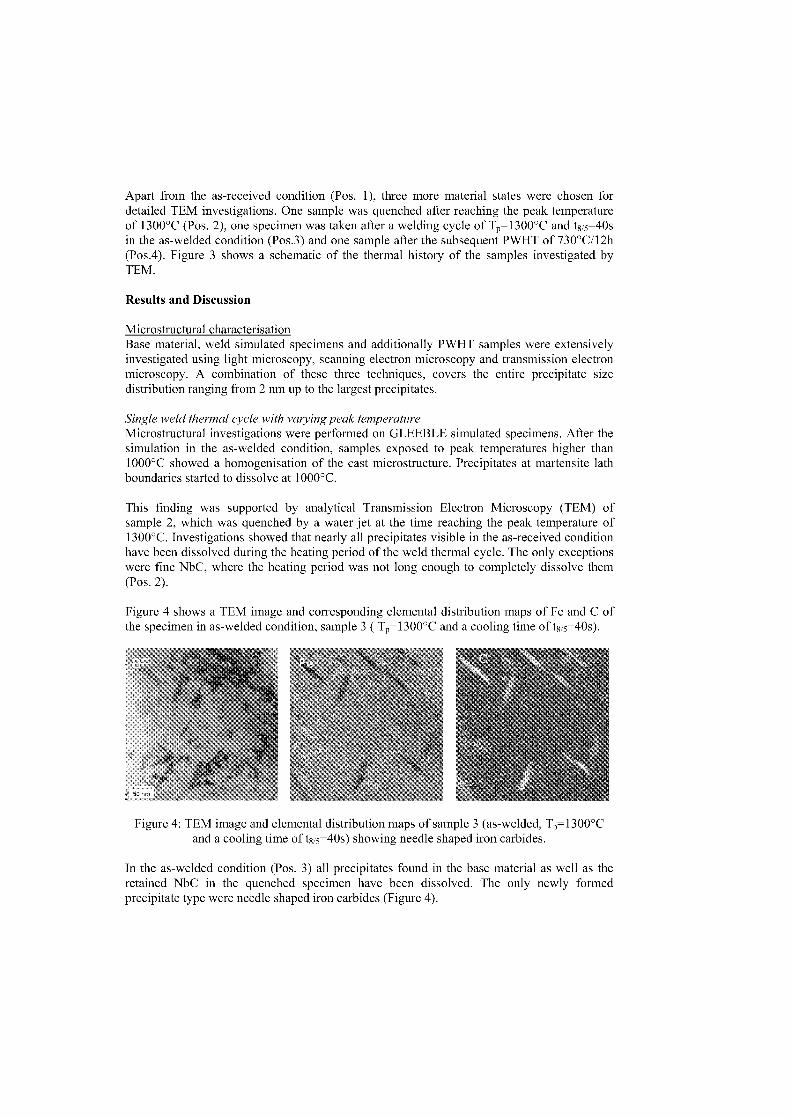
Apart from the as-received condition (Pos. 1), three more material states were chosen fordetailed TEM investigations. One sample was quenched after reaching the peak temperatureof 1300°C (Pos. 2), one specimen was taken after a welding cycle of Tp=1300°C and t815=40sin the as-welded condition (Pos.3) and one sample after the subsequent PWHT of 730°C/12h(Pos.4). Figure 3 shows a schematic of the thermal history of the samples investigated byTEM.
Results and Discussion
Microstructural characterisationBase material, weld simulated specimens and additionally PWHT samples were extensivelyinvestigated using light microscopy, scanning electron microscopy and transmission electronmicroscopy. A combination of these three techniques, covers the entire precipitate sizedistribution ranging from 2 nm up to the largest precipitates.
Single weld thermal cycle with varying peak temperatureMicrostructural investigations were performed an GLEEBLE simulated specimens. After theSimulation in the as-welded condition, samples exposed to peak temperatures higher than1000°C showed a homogenisation of the Gast microstructure. Precipitates at martensite lathboundaries started to dissolve at 1000°C.
This finding was supported by analytical Transmission Electron Microscopy (TEM) ofsample 2, which was quenched by a water jet at the time reaching the peak temperature of1300°C. Investigations showed that nearly all precipitates visible in the as-received conditionhave been dissolved during the heating period of the weld thermal cycle. The only exceptionswere fine NbC, where the heating period was not long enough to completely dissolve them(Pos. 2).
Figure 4 shows a TEM image and corresponding elemental distribution maps of Fe and C ofthe specimen in as-welded condition, sample 3 ( T p=1300°C and a cooling time of t8,5=40s).
Figure 4: TEM image and elemental distribution maps of sample 3 (as-welded, T=1300°Cand a cooling time of t 8,5=40s) showing needle shaped iron carbides.
In the as-welded condition (Pos. 3) all precipitates found in the bare material as well as theretained NbC in the quenched specimen have been dissolved. The only newly formedprecipitate type were needle shaped iron carbides (Figure 4).
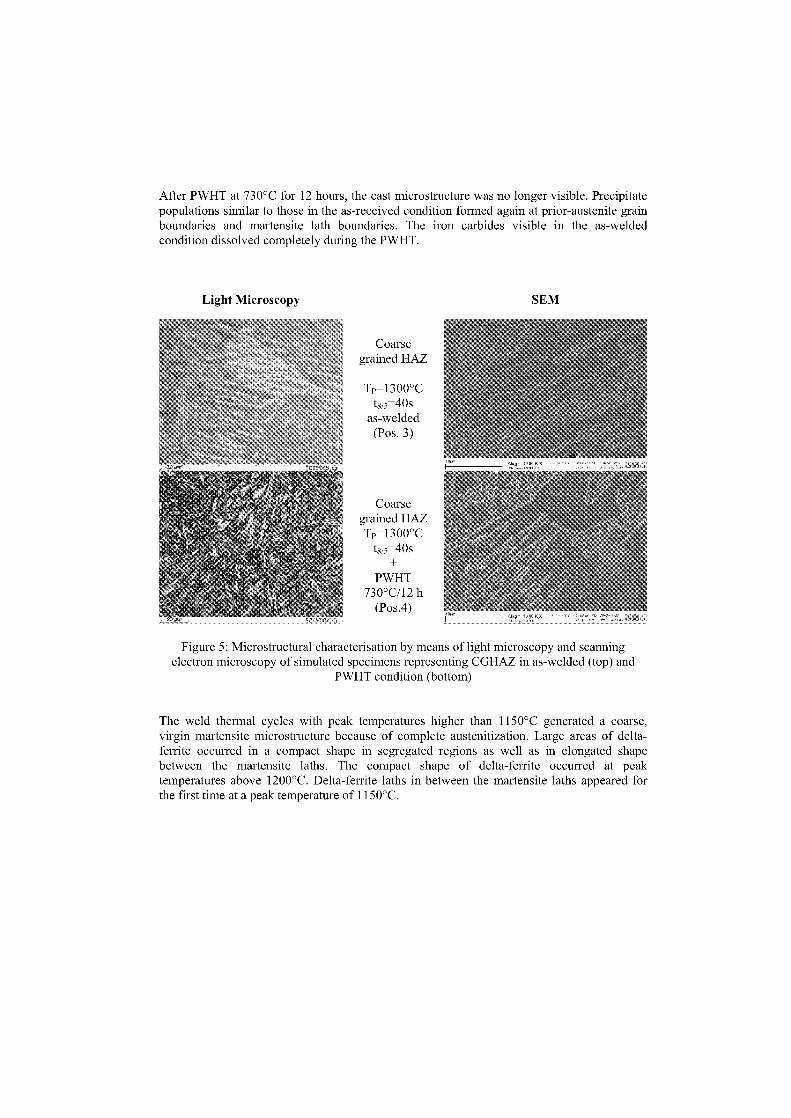
After PWHT at 730°C for 12 hours, the cast microstructure was no longer visible. Precipitatepopulations similar to those in the as-received condition formed again at prior-austenite grainboundaries and martensite lath boundaries. The iron carbides visible in the as-weldedcondition dissolved completely during the PWHT.
Light Microscopy SEM
Coarsegrained HAZ
Tp=1300°Ct8,5=40s
as-welded(Pos. 3)
Coarsegrained HAZTp=1300°C
t8,5=40s
PWHT730°C/12 h
(Pos.4)
Figure 5: Microstructural characterisation by means of light microscopy and scanningelectron microscopy of simulated specimens representing CGHAZ in as-welded (top) and
PWHT condition (bottom)
The weld thermal cycles with peak temperatures higher than 1150°C generated a coarse,virgin martensite microstructure because of complete austenitization. Large areas of delta-ferrite occurred in a compact shape in segregated regions as well as in elongated shapebetween the martensite laths. The compact shape of delta-ferrite occurred at peaktemperatures above 1200°C. Delta-ferrite laths in between the martensite laths appeared forthe first time at a peak temperature of 1150°C.
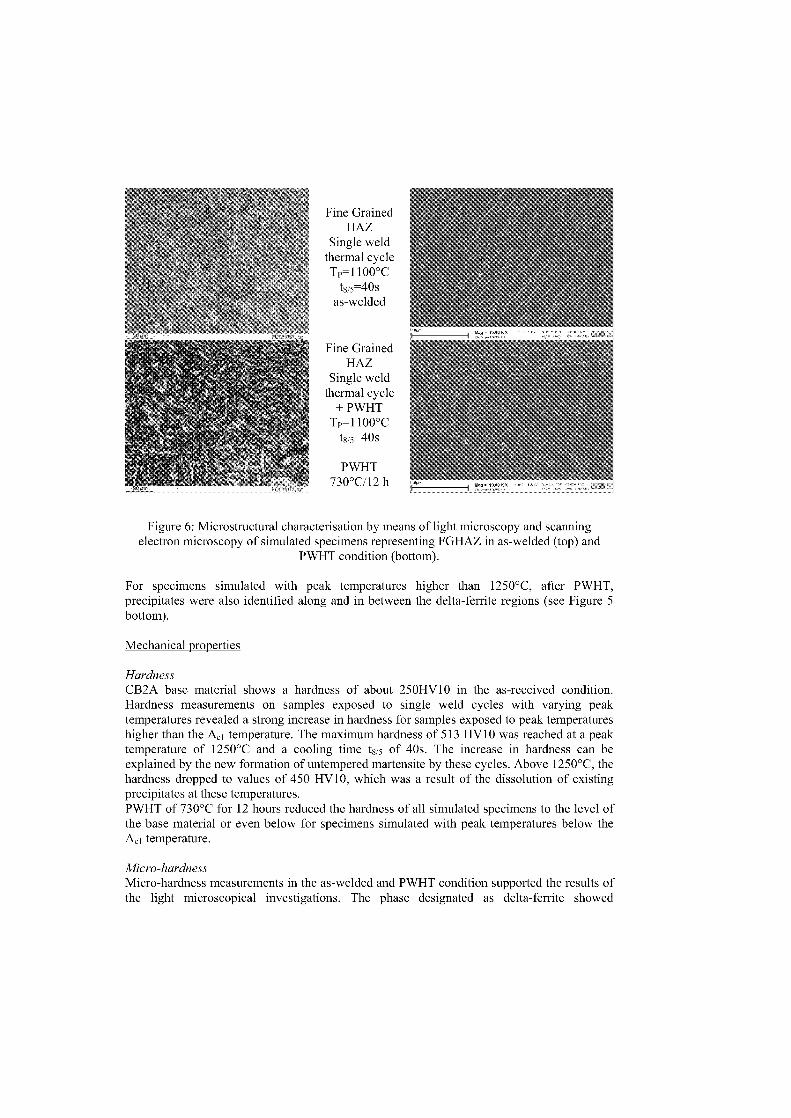
Fine GrainedHAZ
Single weldthermal cycleTp=1100°C
t815=40sas-welded
Fine GrainedHAZ
Single weldthermal cycle
+ PWHTTp=1100°C
t815=40s
PWHT730°C/12 h
Figure 6: Microstructural characterisation by means of light microscopy and scanningelectron microscopy of simulated specimens representing FGHAZ in as-welded (top) and
PWHT condition (bottom).
For specimens simulated with peak temperatures higher than 1250°C, after PWHT,precipitates were also identified along and in between the delta-ferrite regions (see Figure 5bottom).
Mechanical properties
HardnessCB2A base material shows a hardness of about 250HVI 0 in the as-received condition.Hardness measurements an samples exposed to single weld cycles with varying peaktemperatures revealed a strong increase in hardness for samples exposed to peak temperatureshigher than the Ad temperature. The maximum hardness of 513 HVI 0 was reached at a peaktemperature of 1250°C and a cooling time t8/5 of 40s. The increase in hardness can beexplained by the new formation of untempered martensite by these cycles. Above 1250°C, thehardness dropped to values of 450 HV10, which was a result of the dissolution of existingprecipitates at these temperatures.PWHT of 730°C for 12 hours reduced the hardness of all simulated specimens to the level ofthe base material or even below for specimens simulated with peak temperatures below theAd temperature.
Micro-hardnessMicro-hardness measurements in the as-welded and PWHT condition supported the results ofthe light microscopical investigations. The phase designated as delta-ferrite showed
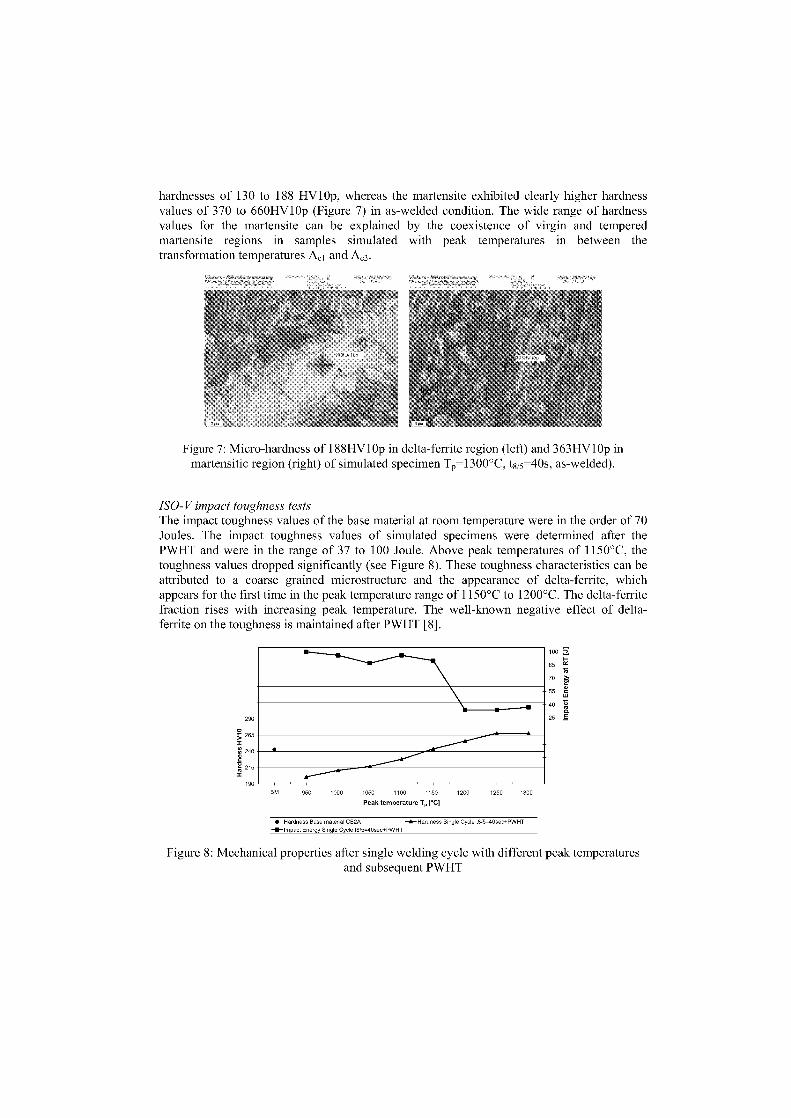
hardnesses of 130 to 188 HV10p, whereas the martensite exhibited clearly higher hardnessvalues of 370 to 660HV10p (Figure 7) in as-welded condition. The wide range of hardnessvalues for the martensite can be explained by the coexistence of virgin and temperedmartensite regions in Samples simulated with peak temperatures in between thetransformation temperatures A d and Ad.
Figure 7: Micro-hardness of 188HV1Op in delta-ferrite region (left) and 363HV10p inmartensitic region (right) of simulated specimen Tp=1300°C, t8 ,5=40s, as-welded).
ISO-V impact toughness testsThe impact toughness values of the Base material at room temperature were in the order of 70Joules. The impact toughness values of simulated specimens were determined after thePWHT and were in the range of 37 to 100 Joule. Above peak temperatures of 1150°C, thetoughness values dropped significantly (see Figure 8). These toughness characteristics can beattributed to a coarse grained microstructure and the appearance of delta-ferrite, whichappears for the first time in the peak temperature range of 1150°C to 1200°C. The delta-ferritefraction rises with increasing peak temperature. The well-known negative effect of delta-ferrite an the toughness is maintained after PWHT [8].
• 100 E85
70
55 M
40
25 g 290
265
1 240
7 2151
190 BM
950 1000 1050 1100 1150 1200 1250 1300
Peak temperature Tp [CC]
• Hardness Base material CB2A —*-Hardness Single Cycle t8/5=40sec+PWHT--Impact Energy Single Cycle t8/5=40sec+PWHT
Figure 8: Mechanical properties after single welding cycle with different peak temperaturesand subsequent PWHT
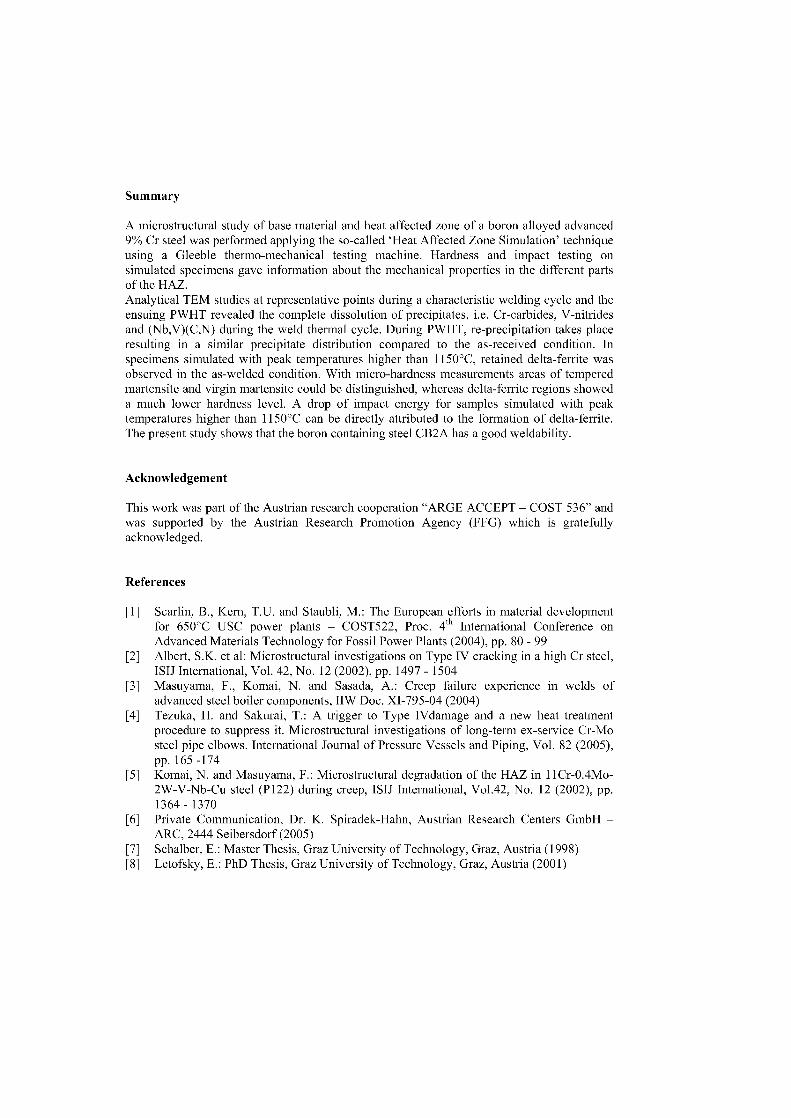
Summary
A microstructural study of bare material and heat affected zone of a boron alloyed advanced9% Cr steel was performed applying the so-called `Heat Affected Zone Simulation' techniqueusing a Gleeble thermo-mechanical testing machine. Hardness and impact testing onsimulated specimens gave information about the mechanical properties in the different partsof the HAZ.Analytical TEM studies at representative points during a characteristic welding cycle and theensuing PWHT revealed the complete dissolution of precipitates, i.e. Cr-carbides, V-nitridesand (Nb,V)(C,N) during the weld thermal cycle. During PWHT, re-precipitation takes placeresulting in a similar precipitate distribution compared to the as-received condition. Inspecimens simulated with peak temperatures higher than 1150°C, retained delta-ferrite wasobserved in the as-welded condition. With micro-hardness measurements areas of temperedmartensite and virgin martensite could be distinguished, whereas delta-ferrite regions showeda much lower hardness level. A drop of impact energy for Samples simulated with peaktemperatures higher than 1150°C can be directly attributed to the formation of delta-ferrite.The present study Shows that the boron containing steel CB2A has a good weldability.
Acknowledgement
This work was part of the Austrian research cooperation "ARGE ACCEPT – COST 536" andwas supported by the Austrian Research Promotion Agency (FFG) which is gratefullyacknowledged.
References
[1] Scarlin, B., Kern, T.U. and Staubli, M.: The European efforts in material developmentfor 650°C USC power plants – COST522, Proc. 4 ]1] International Conference onAdvanced Materials Technology for Fossil Power Plants (2004), pp. 80 - 99
[2] Albert, S.K. et al: Microstructural investigations on Type IV cracking in a high Cr steel,ISIJ International, Vol. 42, No. 12 (2002), pp. 1497 - 1504
[3] Masuyama, F., Komai, N. and Sasada, A.: Creep failure experience in welds ofadvanced steel boiler components, IIW Doc. XI-795-04 (2004)
[4] Tezuka, H. and Sakurai, T.: A trigger to Type IVdamage and a new heat treatmentprocedure to suppress it. Microstructural investigations of long-term ex-service Cr-Mosteel pipe elbows. International Journal of Pressure Vessels and Piping, Vol. 82 (2005),pp. 165 -174
[5] Komai, N. and Masuyama, F.: Microstructural degradation of the HAZ in 11Cr-0.4Mo-2W-V-Nb-Cu steel (P122) during creep, ISIJ International, Vol.42, No. 12 (2002), pp.1364 - 1370
[6] Private Communication, Dr. K. Spiradek-Hahn, Austrian Research Centers GmbH –ARC, 2444 Seibersdorf (2005)
[7] Schalber, E.: Master Thesis, Graz University of Technology, Graz, Austria (1998)[8] Letofsky, E.: PhD Thesis, Graz University of Technology, Graz, Austria (2001)
MICROSTRUCTURAL STUDIES OF SIMILAR AND DISSIMILARWELDS OF P91
Dagmar Jandoväl , Josef Kas1 1 , Eva Folkovä2 , Väclav Kantal
'SKODA RESEARCH s.r.o., Tylova 57, Pilsen, CZ 316 00, Czech Republic
2 SKODA POWER a.s., Tylova 57, Pilsen, CZ 316 00, Czech Republic
dagmar.jandova@ skoda.cz
Abstract
Creep testing of two trial weld joints of 9Cr-1Mo steel (similar weld joint and dissimilar 9Cr-lMo / 2.25Cr-1Moweld joint with filier metal on the base of 2.25Cr-1 Mo steel) were carried out at temperatures ranging from525°C to 625°C and stresses from 40 to 240 MPa. The weld joints were prepared using the GTAW & SMAWmethods. Post-weld heat treatment was applied. Creep rupture strength was evaluated according to the Larson-Miller parametric equation. Fractographic analysis, hardness measurement and detailed microstructural study ofthe creep tested specimens were performed using light, scanning and transmission electron microscopy.zones of creep failure were determined in dependency on conditions of the creep exposure. At highertemperatures and lower stresses fracture of the dissimilar weldment occurred in the weld metal while rupture ofthe similar weld was located in the heat affected zone of the parent material. The processes of recovery inconnection with fine carbide dissolution and high grain boundary diffusion in fine prior austenitic grain zonesseem to be the main causes of the decrease in creep rupture strength of both weld joints in comparison to thecorresponding parent materials.
Keywords: ferritic steels, welding, creep testing, microstructure, transmission electronmicroscopy.
1. Introduction
In the last two decades great efforts have been made to improve efficiency and reduce harmfulemissions in fossil fuel power plants. Both can be achieved by increasing the temperature andpressure of the steam. The components of the boilers and the turbines operating under severeservice conditions have to be produced from advanced materials with high strength, corrosionand creep-resistance and adequate fatigue properties. To meet these requirements, modified(9-12)%Cr martensitic steels were developed and some of them, such as ASTM Grades 91, 92and 911 are currently used in new power plants [1-3].
Long-term creep resistance depends on a high structural stability. Since welding effects thesteel structure and causes a decrease in the creep strength, great attention has to be paid towelding methods and the selection of suitable welding metals. Weld joints are commonlysusceptible to fracture especially if different materials are welded. Fracture is usually initiatedin a specific microscopic region which forms as a result of cyclic thermal and stress loadingafter each weld pass [4]. Structures that form after single and double rapid induction heatinghave been described and mechanical properties have been tested using standard bulkspecimens [5]. Detailed microstructural study of heat affected zones in real weld joints afterextended service was also performed [6,7]. In this study the Jong-term creep testing andmicrostructural investigation of trial weld joints were carried out within the verification of anew welding method for steam piping.
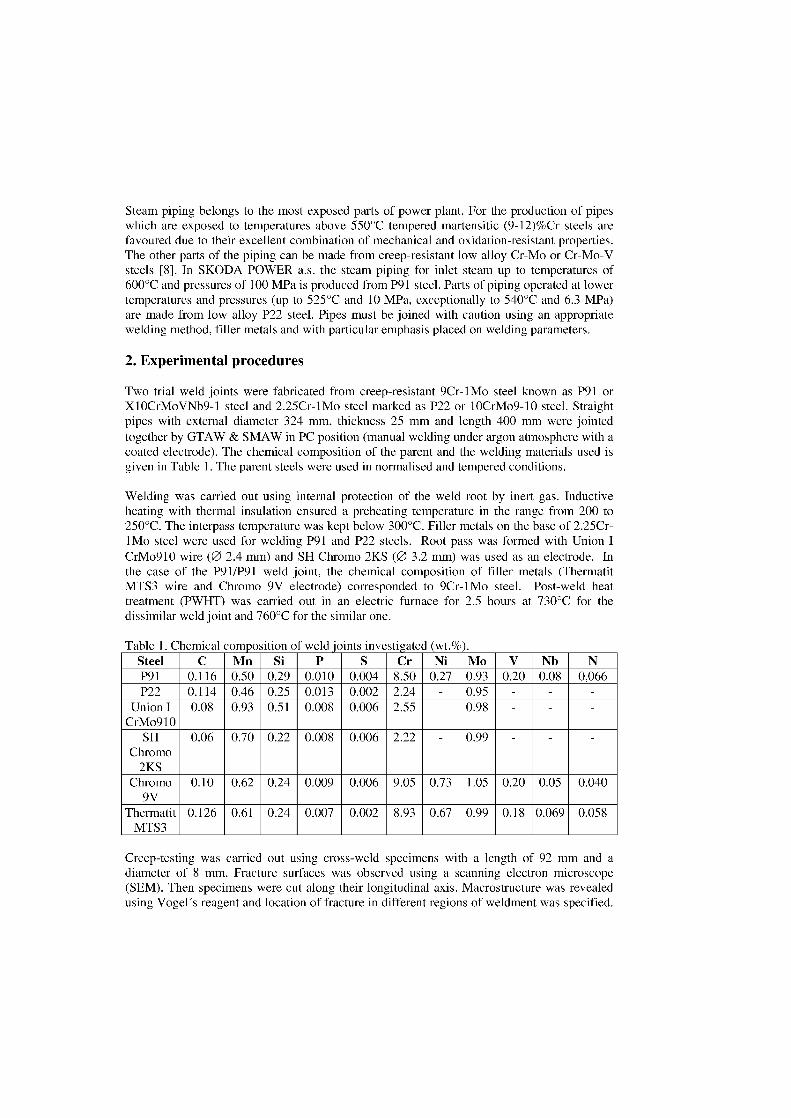
Steam piping belongs to the most exposed parts of power plant. For the production of pipeswhich are exposed to temperatures above 550°C tempered martensitic (9-12)%Cr steels arefavoured due to their excellent combination of mechanical and oxidation-resistant properties.The other parts of the piping can be made from creep-resistant low alloy Cr-Mo or Cr-Mo-Vsteels [8]. In SKODA POWER a.s. the steam piping for inlet steam up to temperatures of600°C and pressures of 100 MPa is produced from P91 steel. Parts of piping operated at lowertemperatures and pressures (up to 525°C and 10 MPa, exceptionally to 540°C and 6.3 MPa)are made from low alloy P22 steel. Pipes must be joined with caution using an appropriatewelding method, filler metals and with particular emphasis placed on welding parameters.
2. Experimental procedures
Two trial weld joints were fabricated from creep-resistant 9Cr- 1 Mo steel known as P91 orX10CrMoVNb9-1 steel and 2.25Cr-lMo steel marked as P22 or 10CrMo9-10 steel. Straightpipes with external diameter 324 mm, thickness 25 mm and length 400 mm were jointedtogether by GTAW & SMAW in PC position (manual welding under argon atmosphere with acoated electrode). The chemical composition of the parent and the welding materials used isgiven in Table 1. The parent steels were used in normalised and tempered conditions.
Welding was carried out using internal protection of the weld root by inert gas. Inductiveheating with thermal insulation ensured a preheating temperature in the range from 200 to250°C. The interpass temperature was kept below 300°C. Filier metals on the base of 2.25Cr-1Mo steel were used for welding P91 and P22 steels. Root pass was formed with Union ICrMo910 wire (0 2.4 mm) and SH Chromo 2KS (0 3.2 mm) was used as an electrode. Inthe case of the P91/P91 weld joint, the chemical composition of filier metals (ThermatitMTS3 wire and Chromo 9V electrode) corresponded to 9Cr-lMo steel. Post-weld heattreatment (PWHT) was carried out in an electric furnace for 2.5 hours at 730°C for thedissimilar weld joint and 760°C for the similar one.
Table 1. Chemical composition of weld Joints investi ated (wt.%).Steel C Mn Si P S Cr Ni Mo V Nb NP91 0.116 0.50 0.29 0.010 0.004 8.50 0.27 0.93 0.20 0.08 0,066P22 0.114 0.46 0.25 0.013 0.002 2.24 - 0.95 - - -
Union ICrMo910
0.08 0.93 0.51 0.008 0.006 2.55 0.98 - - -
SHChromo
2KS
0.06 0.70 0.22 0.008 0.006 2.22 - 0.99 - - -
Chromo9V
0.10 0.62 0.24 0.009 0.006 9.05 0.73 1.05 0.20 0.05 0.040
ThermatitMTS3
0.126 0.61 0.24 0.007 0.002 8.93 0.67 0.99 0.18 0.069 0.058
Creep-testing was carried out using cross-weld specimens with a length of 92 mm and adiameter of 8 mm. Fracture surfaces was observed using a scanning electron microscope(SEM). Then specimens were cut along their longitudinal axis. Macrostructure was revealedusing Vogel's reagent and location of fracture in different regions of weldment was specified.
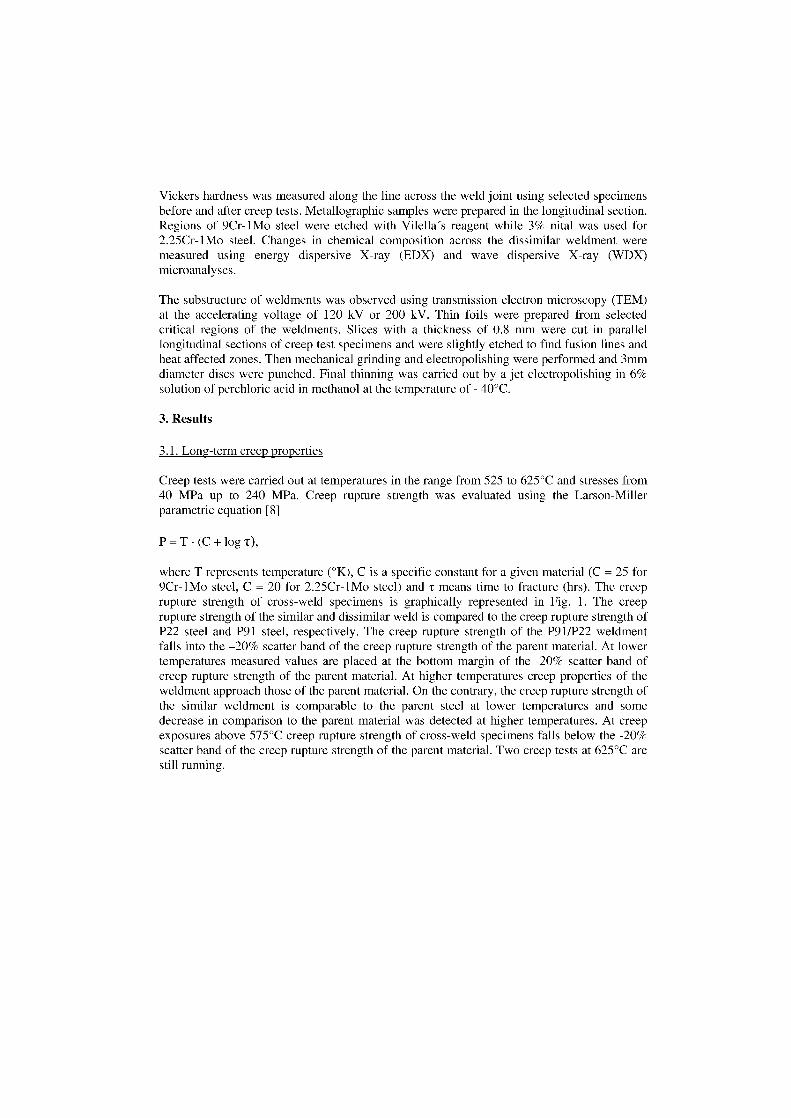
Vickers hardness was measured along the line across the weld joint using selected specimensbefore and alter creep tests. Metallographic Samples were prepared in the longitudinal section.Regions of 9Cr- 1 Mo steel were etched with Vilella's reagent while 3% nital was used for2.25Cr-lMo steel. Changes in chemical composition across the dissimilar weldment weremeasured using energy dispersive X-ray (EDX) and wave dispersive X-ray (WDX)microanalyses.
The substructure of weldments was observed using transmission electron microscopy (TEM)at the accelerating voltage of 120 kV or 200 kV. Thin foils were prepared from selectedcritical regions of the weldments. Slices with a thickness of 0.8 mm were cut in parallellongitudinal sections of creep test specimens and were slightly etched to find fusion lines andheat affected zones. Then mechanical grinding and electropolishing were performed and 3mmdiameter discs were punched. Final thinning was carried out by a jet electropolishing in 6%solution of perchloric acid in methanol at the temperature of - 40°C.
3. Results
3.1. Long-term creep properties
Creep tests were carried out at temperatures in the range from 525 to 625°C and stressec from40 MPa up to 240 MPa. Creep rupture strength was evaluated using the Larson-Millerparametric equation [8]
P = T (C + log t),
where T represents temperature (°K), C is a specific constant for a given material (C = 25 for9Cr- 1 Mo steel, C = 20 for 2.25Cr- 1 Mo steel) and i means time to fracture (hrs). The creeprupture strength of cross-weld specimens is graphically represented in Fig. 1. The creeprupture strength of the similar and dissimilar weld is compared to the creep rupture strength ofP22 steel and P91 steel, respectively. The creep rupture strength of the P91/P22 weldmentfalls into the –20% scatter band of the creep rupture strength of the parent material. At lowertemperatures measured values are placed at the bottom margin of the -20% scatter band ofcreep rupture strength of the parent material. At higher temperatures creep properties of theweldment approach those of the parent material. On the contrary, the creep rupture strength ofthe similar weldment is comparable to the parent steel at lower temperatures and somedecrease in comparison to the parent material was detected at higher temperatures. At creepexposures above 575°C creep rupture strength of cross-weld specimens falls below the -20%scatter band of the creep rupture strength of the parent material. Two creep tests at 625°C arestill running.
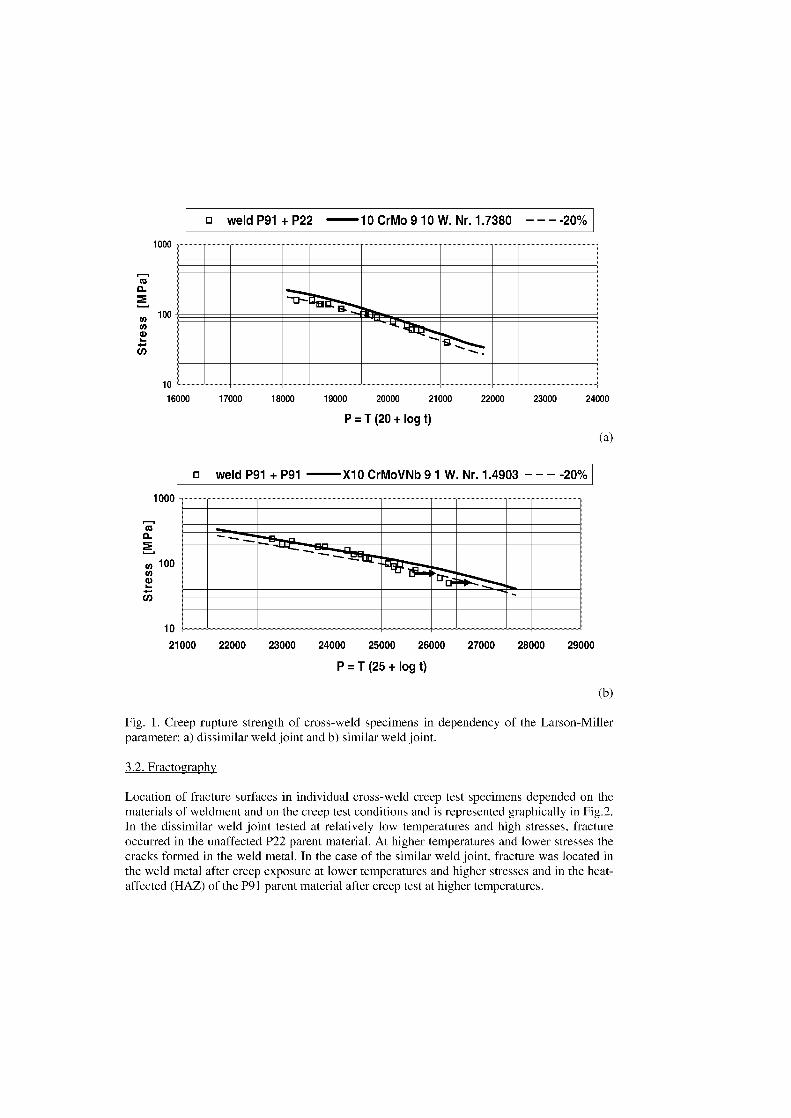
1000
100
1022000 23000 24000
0 weld P91 + P22 10 CrMo 910 W. Nr. 1.7380 — — — -20%
P=T(20+logt)(a)
o weld P91 + P91 X10 CrMoVNb 9 1 W. Nr. 1.4903 — — — -20%
21000 22000 23000 24000 25000 26000 27000 28000 29000
P = T (25 + log t)
(b)
Fig. 1. Creep rupture strength of cross-weld specimens in dependency of the Larson-Millerparameter: a) dissimilar weld joint and b) similar weld joint.
3.2. Fractography
Location of fracture surfaces in individual cross-weld creep test specimens depended on thematerials of weldment and on the creep test conditions and is represented graphically in Fig.2.In the dissimilar weld joint tested at relatively low temperatures and high stresses, fractureoccurred in the unaffected P22 parent material. At higher temperatures and lower stresses thecracks formed in the weld metal. In the case of the similar weld joint, fracture was located inthe weld metal after creep exposure at lower temperatures and higher stresses and in the heat-affected (HAZ) of the P91 parent material after creep test at higher temperatures.
1000
2co 100
10
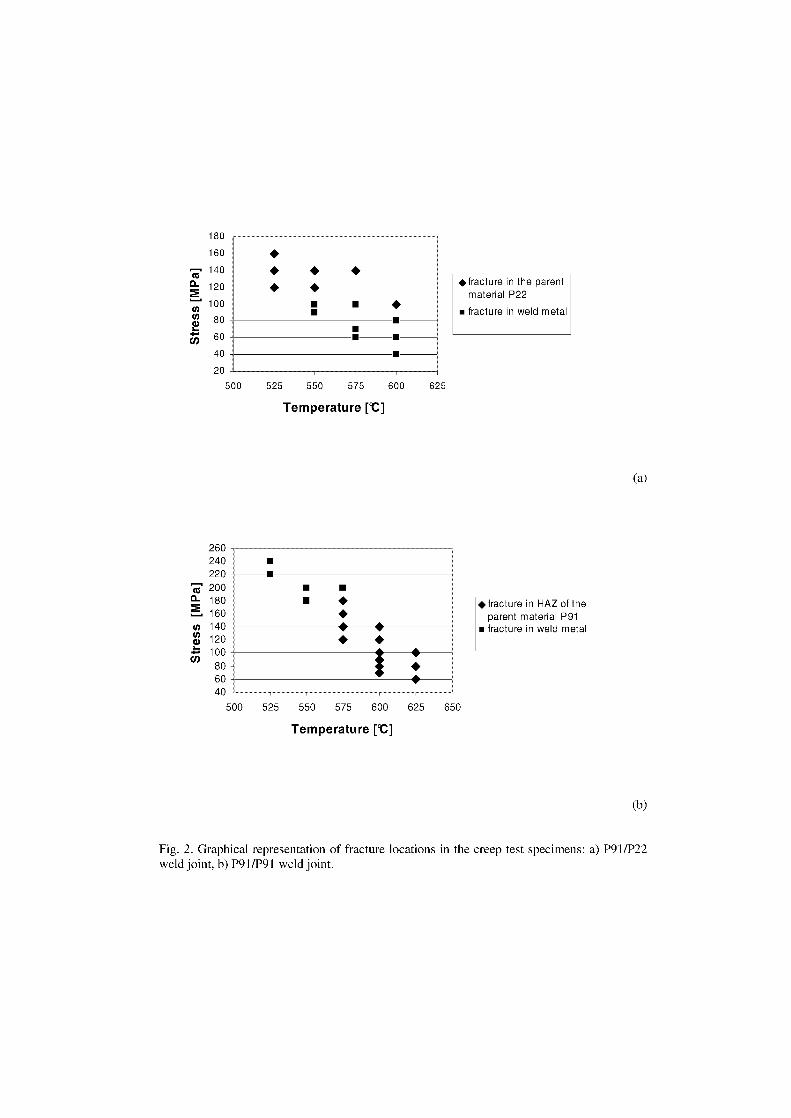
♦fracture in the parentmaterial P22
■ fracture in weld metal
625
Temperature [t]
(a)
■■
•fracture in HAZ of the♦ parent material P91
■ fracture in weld metal•
♦•♦
, , ,
525 550 575 600 625 650
Temperature [V]
(b)
Fig. 2. Graphical representation of fracture locations in the creep test specimens: a) P91/P22weld joint, b) P91/P91 weld joint.
3
260240220200180160140120100806040
500
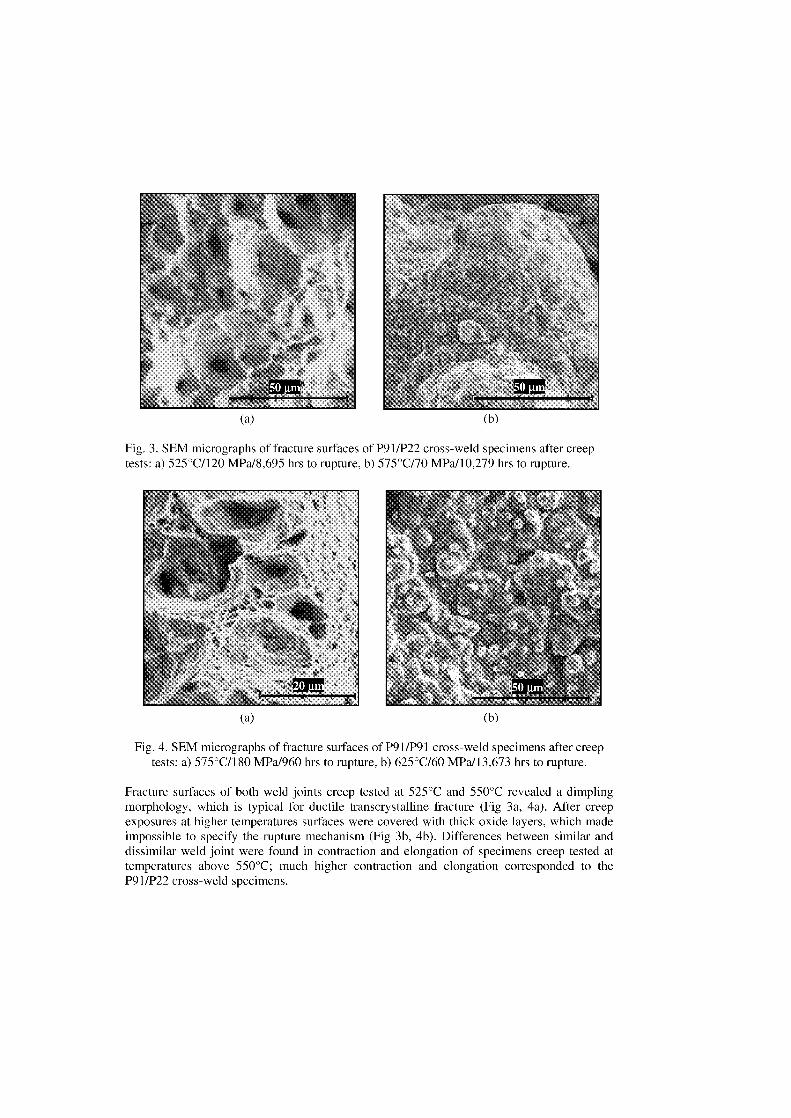
(a)
(b)
Fig. 3. SEM micrographs of fracture surfaces of P91/P22 cross-weld specimens after creeptests: a) 525°C/120 MPa/8,695 hrs to rupture, b) 575°C/70 MPa/10,279 hrs to rupture.
(a)
(b)
Fig. 4. SEM micrographs of fracture surfaces of P91/P91 cross-weld specimens after creeptests: a) 575°C/180 MPa/960 hrs to rupture, b) 625°C/60 MPa/13,673 hrs to rupture.
Fracture surfaces of both weld joints creep tested at 525°C and 550°C revealed a dimplingmorphology, which is typical for ductile transcrystalline fracture (Fig 3a, 4a). After creepexposures at higher temperatures surfaces were covered with thick oxide layers, which madeimpossible to specify the rupture mechanism (Fig 3b, 4b). Differences between similar anddissimilar weld joint were found in contraction and elongation of specimens creep tested attemperatures above 550°C; much higher contraction and elongation corresponded to theP91/P22 cross-weld specimens.
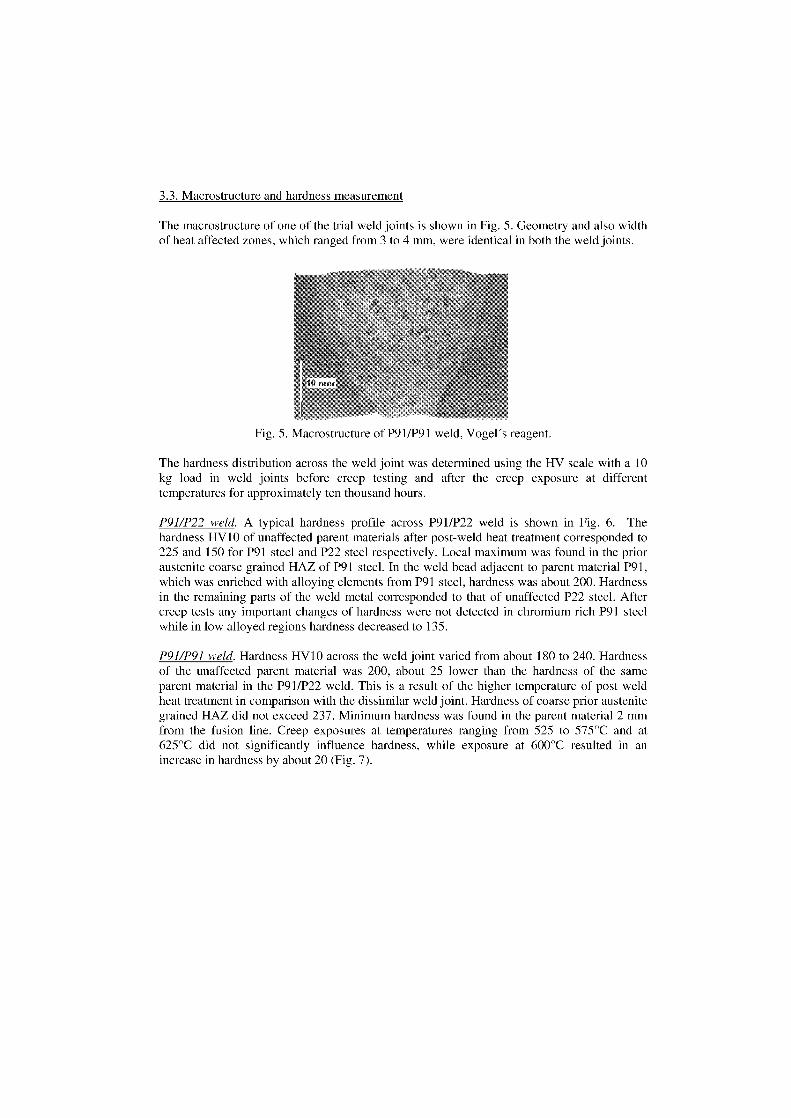
3.3. Macrostructure and hardness measurement
The macrostructure of one of the trial weld joints is shown in Fig. 5. Geometry and also widthof heat affected zones, which ranged from 3 to 4 mm, were identical in both the weld joints.
Fig. 5. Macrostructure of P91/P91 weld, Vogel's reagent.
The hardness distribution across the weld joint was determined using the HV scale with a 10kg load in weld joints before creep testing and after the creep exposure at differenttemperatures for approximately ten thousand hours.
P91/P22 weld. A typical hardness profile across P91/P22 weld is shown in Fig. 6. Thehardness HVIO of unaffected parent materials after post-weld heat treatment corresponded to225 and 150 for P91 steel and P22 steel respectively. Local maximum was found in the prioraustenite coarse grained HAZ of P91 steel. In the weld bead adjacent to parent material P91,which was enriched with alloying elements from P91 steel, hardness was about 200. Hardnessin the remaining parts of the weld metal corresponded to that of unaffected P22 steel. Aftercreep tests any important changes of hardness were not detected in chromium rich P91 steelwhile in low alloyed regions hardness decreased to 135.
P91/P91 weld. Hardness HV10 across the weld joint varied from about 180 to 240. Hardnessof the unaffected parent material was 200, about 25 lower than the hardness of the sameparent material in the P91/P22 weld. This is a result of the higher temperature of post weldheat treatment in comparison with the dissimilar weld joint. Hardness of coarse prior austenitegrained HAZ did not exceed 237. Minimum hardness was found in the parent material 2 mmfrom the fusion line. Creep exposures at temperatures ranging from 525 to 575°C and at625°C did not significantly influence hardness, while exposure at 600°C resulted in anincrease in hardness by about 20 (Fig. 7).
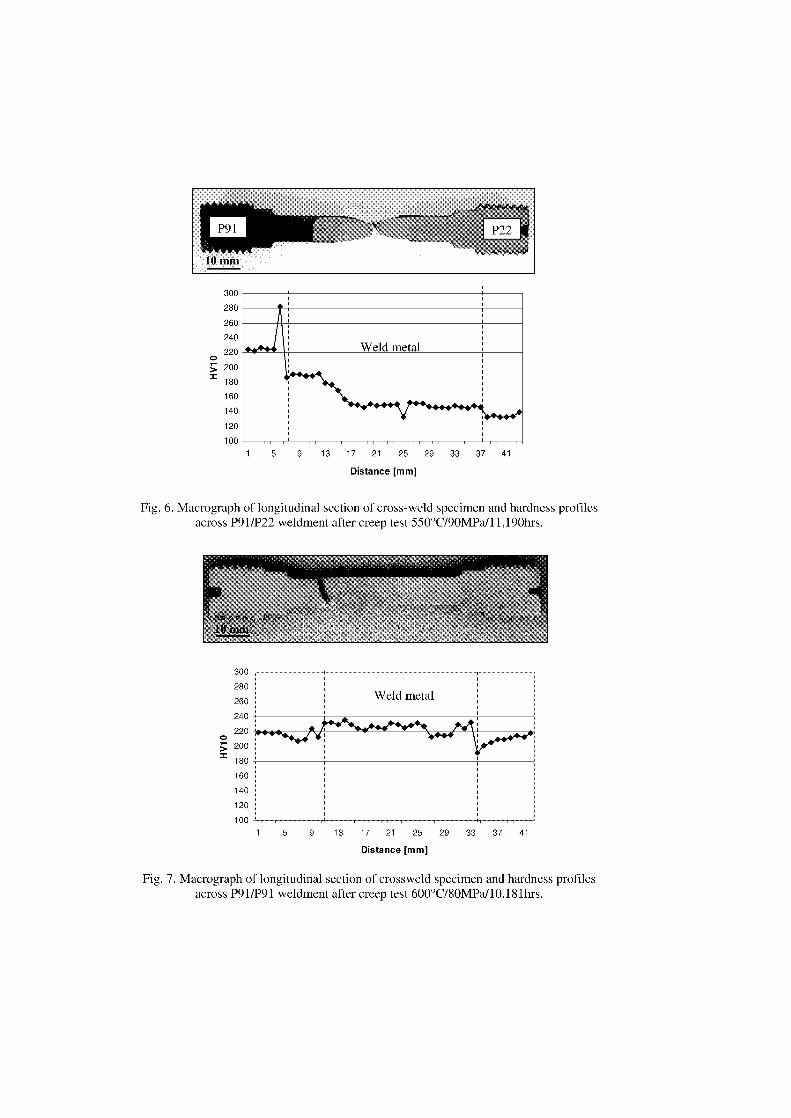
1
0;=
J Weld metal
1 5 9 13 17 21 25 29 33 37 41
Distance [mm]
Fig. 6. Macrograph of longitudinal section of cross-weld specimen and hardness profilesacross P91/P22 weldment after creep test 550°C/90MPa/11,190hrs.
0
;=
300
280
260
240
220
200
180
160
140
120
100
Distance [mm]
Fig. 7. Macrograph of longitudinal section of crossweld specimen and hardness profilesacross P91/P91 weldment after creep test 600°C/80MPa/10,181hrs.
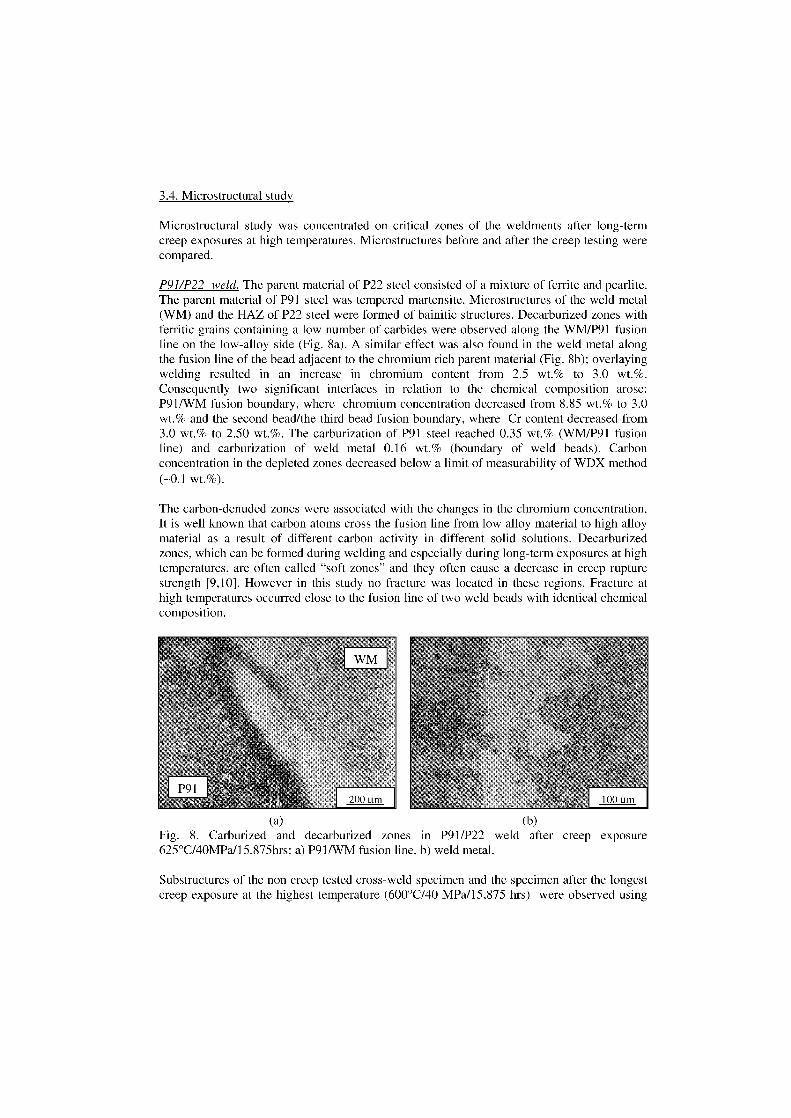
3.4. Microstructural study
Microstructural study was concentrated on critical zones of the weldments after long-termcreep exposures at high temperatures. Microstructures before and after the creep testing werecompared.
P91/P22 weld. The parent material of P22 steel consisted of a mixture of ferrite and pearlite.The parent material of P91 steel was tempered martensite. Microstructures of the weld metal(WM) and the HAZ of P22 steel were formed of bainitic structures. Decarburized zones withferritic grains containing a low number of carbides were observed along the WM/P91 fusionline on the low-alloy side (Fig. 8a). A similar effect was also found in the weld metal alongthe fusion line of the bead adjacent to the chromium rich parent material (Fig. 8b); overlayingwelding resulted in an increase in chromium content from 2.5 wt.% to 3.0 wt.%.Consequently two significant interfaces in relation to the chemical composition arose:P91/WM fusion boundary, where chromium concentration decreased from 8.85 wt.% to 3.0wt.% and the second bead/the third bead fusion boundary, where Cr content decreased from3.0 wt.% to 2.50 wt.%. The carburization of P91 steel reached 0.35 wt.% (WM/P91 fusionline) and carburization of weld metal 0.16 wt.% (boundary of weld beads). Carbonconcentration in the depleted zones decreased below a limit of measurability of WDX method(-0.1 wt.%).
The carbon-denuded zones were associated with the changes in the chromium concentration.It is well known that carbon atoms cross the fusion line from low alloy material to high alloymaterial as a result of different carbon activity in different solid solutions. Decarburizedzones, which can be formed during welding and especially during Jong-term exposures at hightemperatures, are often called "soft zones" and they often cause a decrease in creep rupturestrength [9,10]. However in this study no fracture was located in these regions. Fracture athigh temperatures occurred dose to the fusion line of two weld beads with identical chemicalcomposition.
(a) (b)Fig. 8. Carburized and decarburized zones in P91/P22 weld after creep exposure625°C/40MPa/15,875hrs: a) P91/WM fusion line, b) weld metal.
Substructures of the non creep tested cross-weld specimen and the specimen after the longestcreep exposure at the highest temperature (600°C/40 MPa/15,875 hrs) were observed using
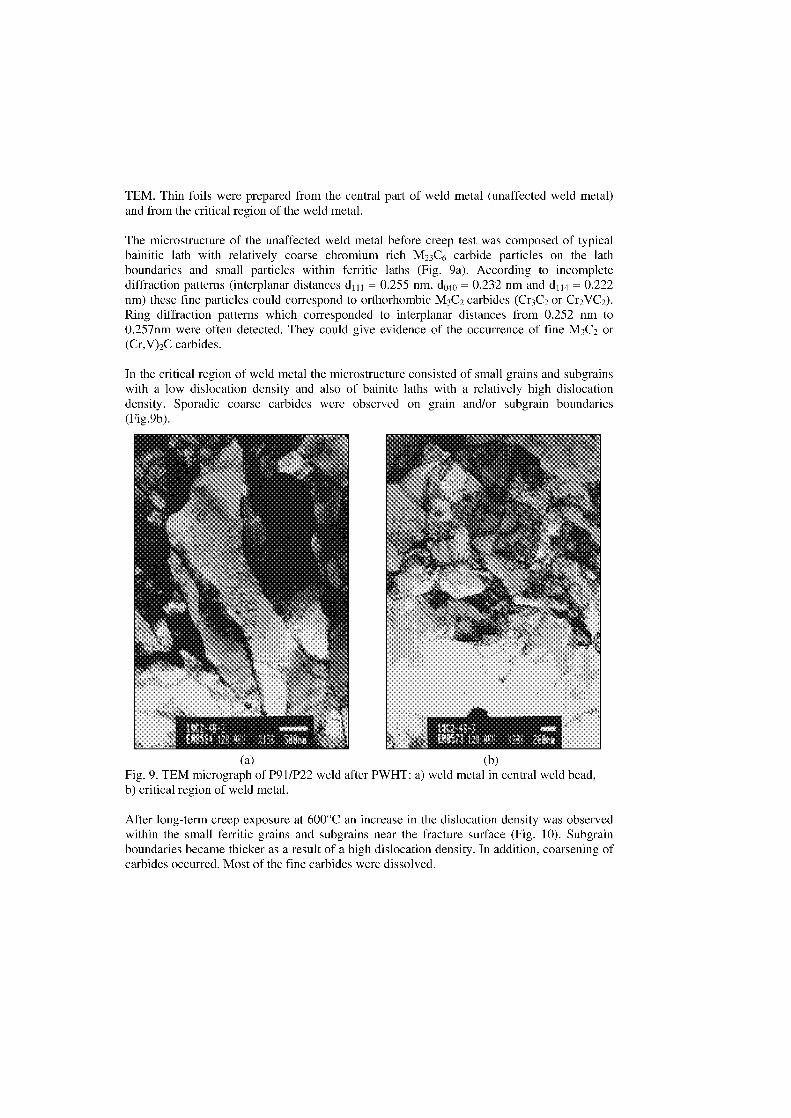
TEM. Thin foils were prepared from the central part of weld metal (unaffected weld metal)and from the critical region of the weld metal.
The microstructure of the unaffected weld metal before creep test was composed of typicalbainitic lath with relatively coarse chromium rich M23C6 carbide particles on the lathboundaries and small particles within ferritic laths (Fig. 9a). According to incompletediffraction patterns (interplanar distances d 111 = 0.255 nm, d040 = 0.232 nm and d 114 = 0.222nm) these fine particles could correspond to orthorhombic M 3C2 carbides (Cr3C2 or Cr2VC2).Ring diffraction patterns which corresponded to interplanar distances from 0.252 nm to0.257nm were often detected. They could give evidence of the occurrence of fine M 3C2 or(Cr,V)2C carbides.
In the critical region of weld metal the microstructure consisted of small grains and subgrainswith a low dislocation density and also of bainite laths with a relatively high dislocationdensity. Sporadic coarse carbides were observed on grain and/or subgrain boundaries(Fig.9b).
(a)
(b)Fig. 9. TEM micrograph of P91/P22 weld after PWHT: a) weld metal in central weld bead,b) critical region of weld metal.
After long-term creep exposure at 600°C an increase in the dislocation density was observedwithin the small ferritic grains and subgrains near the fracture surface (Fig. 10). Subgrainboundaries became thicker as a result of a high dislocation density. In addition, coarsening ofcarbides occurred. Most of the fine carbides were dissolved.
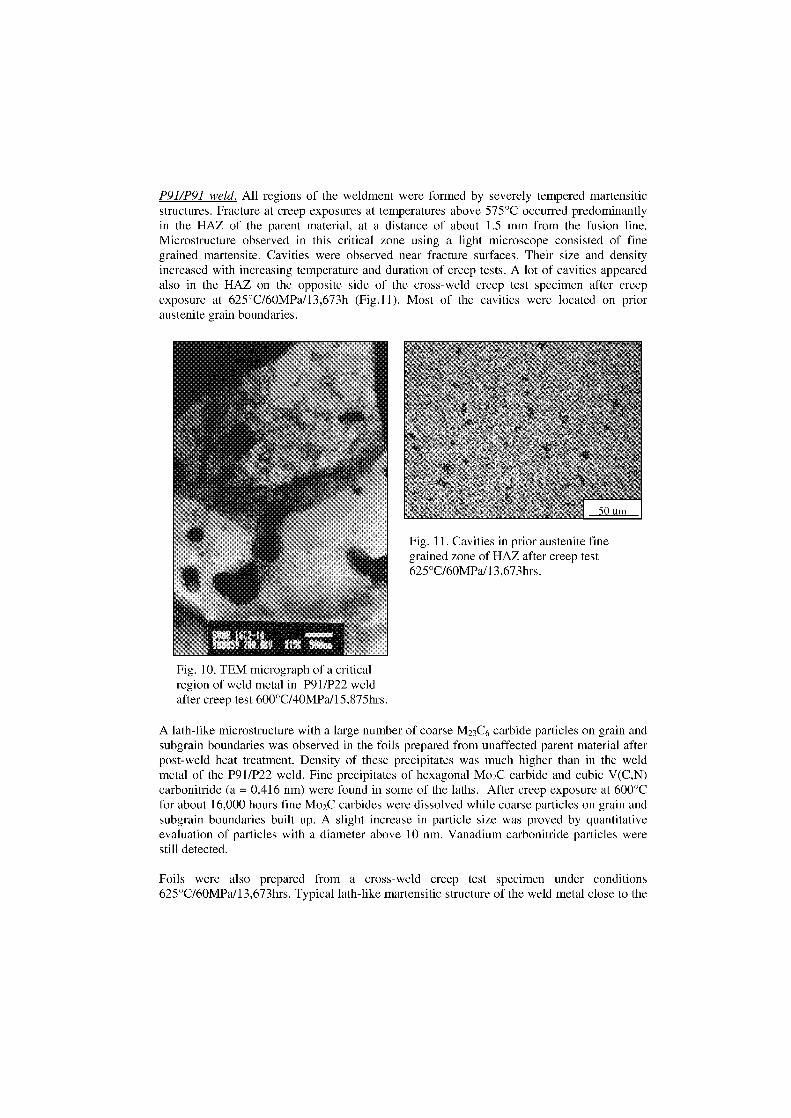
Fig. 11. Cavities in prior austenite finegrained zone of HAZ after creep test625°C/60MPa/13,673hrs.
P91/P91 weld. All regions of the weldment were formed by severely tempered martensiticstructures. Fracture at creep exposures at temperatures above 575°C occurred predominantlyin the HAZ of the parent material, at a distance of about 1.5 mm from the fusion line.Microstructure observed in this critical zone using a light microscope consisted of finegrained martensite. Cavities were observed near fracture surfaces. Their size and densityincreased with increasing temperature and duration of creep tests. A lot of cavities appearedalso in the HAZ on the opposite side of the cross-weld creep test specimen after creepexposure at 625°C/60MPa/13,673h (Fig.11). Most of the cavities were located on prioraustenite grain boundaries.
Fig. 10. TEM micrograph of a criticalregion of weld metal in P91/P22 weldafter creep test 600°C/40MPa/15,875hrs.
A lath-like microstructure with a large number of coarse M23C6 carbide particles on grain andsubgrain boundaries was observed in the foils prepared from unaffected parent material afterpost-weld heat treatment. Density of these precipitates was much higher than in the weldmetal of the P91/P22 weld. Fine precipitates of hexagonal Mo 2C carbide and cubic V(C,N)carbonitride (a = 0.416 nm) were found in some of the laths. After creep exposure at 600°Cfor about 16,000 hours fine Mo2C carbides were dissolved while coarse particles on grain andsubgrain boundaries built up. A slight increase in particle size was proved by quantitativeevaluation of particles with a diameter above 10 nm. Vanadium carbonitride particles werestill detected.
Foils were also prepared from a cross-weld creep test specimen under conditions625°C/60MPa/13,673hrs. Typical lath-like martensitic structure of the weld metal close to the
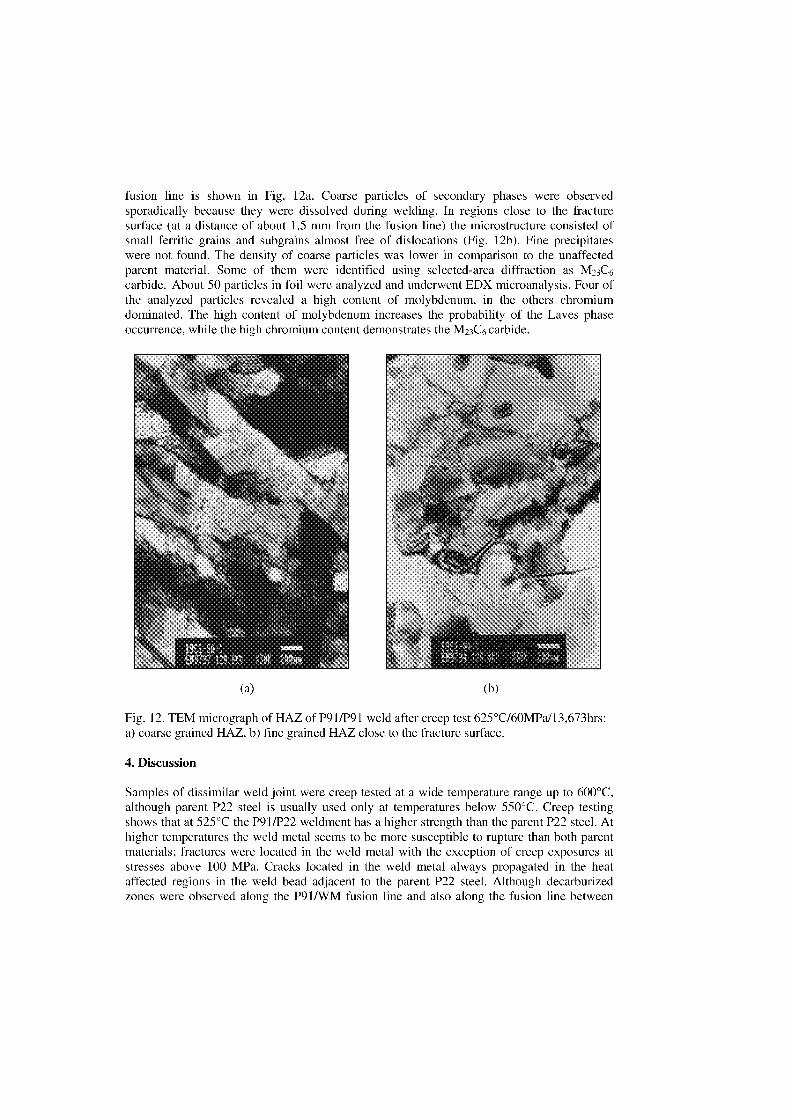
fusion line is shown in Fig. 12a. Coarse particles of secondary phases were observedsporadically because they were dissolved during welding. In regions close to the fracturesurface (at a distance of about 1.5 mm from the fusion line) the microstructure consisted ofsmall ferritic grains and subgrains almost free of dislocations (Fig. 12b). Fine precipitateswere not found. The density of coarse particles was lower in comparison to the unaffectedparent material. Some of them were identified using selected-area diffraction as M23C6carbide. About 50 particles in foil were analyzed and underwent EDX microanalysis. Four ofthe analyzed particles revealed a high content of molybdenum, in the others chromiumdominated. The high content of molybdenum increases the probability of the Laves phaseoccurrence, while the high chromium content demonstrates the M 3C6 carbide.
(a)
(b)
Fig. 12. TEM micrograph of HAZ of P91/P91 weld after creep test 625°C/60MPa/13,673hrs:a) coarse grained HAZ, b) fine grained HAZ dose to the fracture surface.
4. Discussion
Samples of dissimilar weld joint were creep tested at a wide temperature range up to 600°C,although parent P22 steel is usually used only at temperatures below 550°C. Creep testingshown that at 525°C the P91/P22 weldment has a higher strength than the parent P22 steel. Athigher temperatures the weld metal seems to be more susceptible to rupture than both parentmaterials; fractures were located in the weld metal with the exception of creep exposures atstressec above 100 MPa. Cracks located in the weld metal always propagated in the hegtaffected regions in the weld bead adjacent to the parent P22 steel. Although decarburizedzones were observed along the P91/WM fusion line and also along the fusion line between
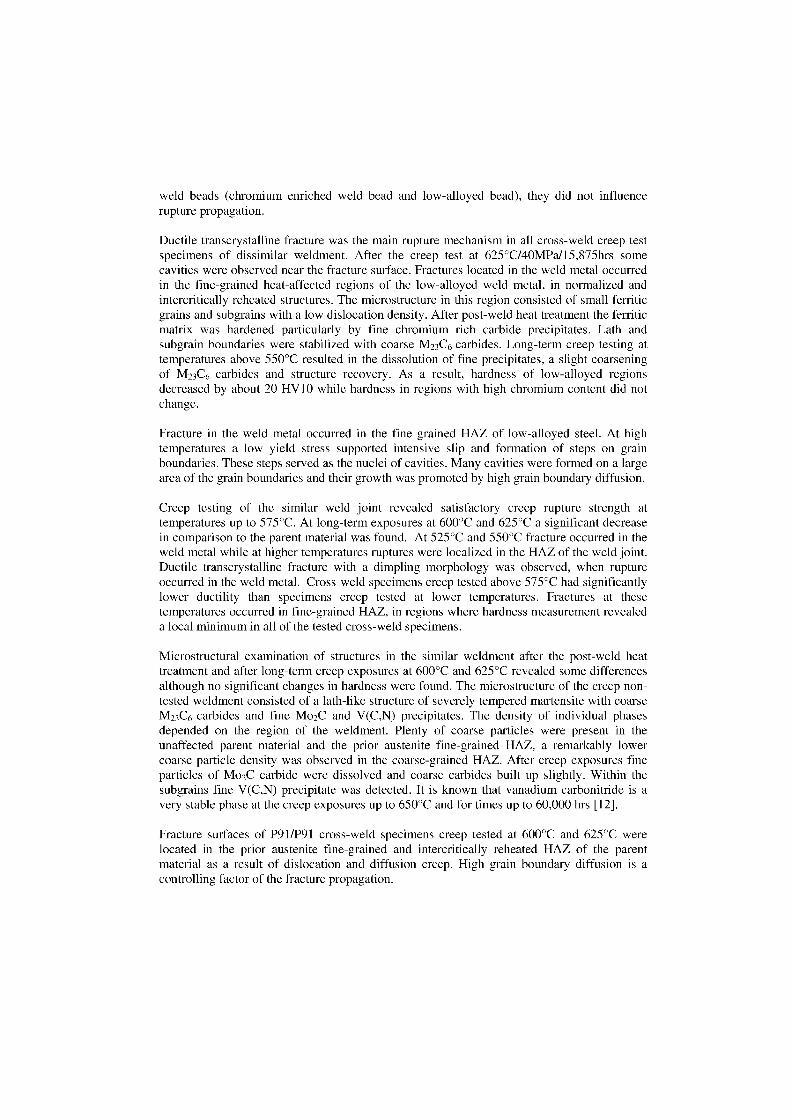
weld beads (chromium enriched weld bead and low-alloyed bead), they did not influencerupture propagation.
Ductile transcrystalline fracture was the main rupture mechanism in all cross-weld creep testspecimens of dissimilar weldment. After the creep test at 625°C/40MPa/15,875hrs somecavities were observed near the fracture surface. Fractures located in the weld metal occurredin the fine-grained heat-affected regions of the low-alloyed weld metal, in normalized andintercritically reheated structures. The microstructure in this region consisted of small ferriticgrains and subgrains with a low dislocation density. After post-weld heat treatment the ferriticmatrix was hardened particularly by fine chromium rich carbide precipitates. Lath andsubgrain boundaries were stabilized with coarse M23C6 carbides. Long-term creep testing attemperatures above 550°C resulted in the dissolution of fine precipitates, a slight coarseningof M23C6 carbides and structure recovery. As a result, hardness of low-alloyed regionsdecreased by about 20 HV 1 0 while hardness in regions with high chromium content did notchange.
Fracture in the weld metal occurred in the fine grained HAZ of low-alloyed steel. At hightemperatures a low yield stress supported intensive Slip and formation of steps on grainboundaries. These steps served as the nuclei of cavities. Many cavities were formed on a largearea of the grain boundaries and their growth was promoted by high grain boundary diffusion.
Creep testing of the similar weld joint revealed satisfactory creep rupture strength attemperatures up to 575°C. At long-term exposures at 600°C and 625°C a significant decreasein comparison to the parent material was found. At 525°C and 550°C fracture occurred in theweld metal while at higher temperatures ruptures were localized in the HAZ of the weld joint.Ductile transcrystalline fracture with a dimpling morphology was observed, when ruptureoccurred in the weld metal. Cross-weld specimens creep tested above 575°C had significantlylower ductility than specimens creep tested at lower temperatures. Fractures at thesetemperatures occurred in fine-grained HAZ, in regions where hardness measurement revealeda local minimum in all of the tested cross-weld specimens.
Microstructural examination of structures in the similar weldment after the post-weld heattreatment and after long-term creep exposures at 600°C and 625°C revealed some differencesalthough no significant changes in hardness were found. The microstructure of the creep non-tested weldment consisted of a lath-like structure of severely tempered martensite with coarseM23C6 carbides and fine Mo 2C and V(C,N) precipitates. The density of individual phasesdepended on the region of the weldment. Plenty of coarse particles were present in theunaffected parent material and the prior austenite fine-grained HAZ, a remarkably lowercoarse particle density was observed in the coarse-grained HAZ. After creep exposures fineparticles of Mo2C carbide were dissolved and coarse carbides built up slightly. Within thesubgrains fine V(C,N) precipitate was detected. It is known that vanadium carbonitride is avery stable phase at the creep exposures up to 650°C and for times up to 60,000 hrs [12].
Fracture surfaces of P91/P91 cross-weld specimens creep tested at 600°C and 625°C werelocated in the prior austenite fine-grained and intercritically reheated HAZ of the parentmaterial as a result of dislocation and diffusion creep. High grain boundary diffusion is acontrolling factor of the fracture propagation.
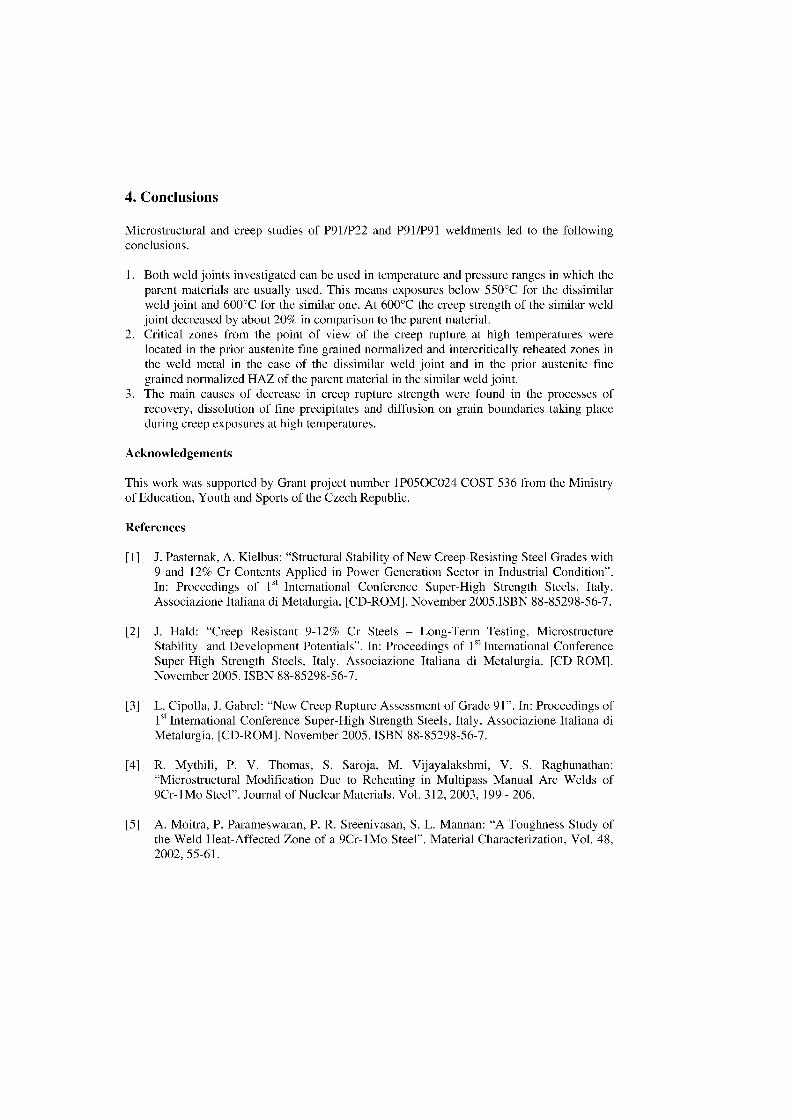
4. Conclusions
Microstructural and creep studier of P91/P22 and P91/P91 weldments led to the followingconclusions.
1. Both weld joints investigated can be used in temperature and pressure ranges in which theparent materials are usually used. This means exposures below 550°C for the dissimilarweld joint and 600°C for the similar one. At 600°C the creep strength of the similar weldjoint decreased by about 20% in comparison to the parent material.
2. Critical zones from the point of view of the creep rupture at high temperatures werelocated in the prior austenite fine grained normalized and intercritically reheated zones inthe weld metal in the case of the dissimilar weld joint and in the prior austenite finegrained normalized HAZ of the parent material in the similar weld joint.
3. The main causes of decrease in creep rupture strength were found in the processes ofrecovery, dissolution of fine precipitates and diffusion an grain boundaries taking placeduring creep exposures at high temperatures.
Acknowledgements
This work was supported by Grant project number 1P0500O24 COST 536 from the Ministryof Education, Youth and Sports of the Czech Republic.
References
[1] J. Pasternak, A. Kielbus: "Structural Stability of New Creep-Resisting Steel Grades with9 and 12% Cr Contents Applied in Power Generation Sector in Industrial Condition".In: Proceedings of Ist International Conference Super-High Strength Steels, Italy.Associazione Italiana di Metalurgia. [CD-ROM]. November 2005.ISBN 88-85298-56-7.
[2] J. Hald: "Creep Resistant 9-12% Cr Steels — Long-Term Testing, MicrostructureStability and Development Potentials". In: Proceedings of Ist International ConferenceSuper-High Strength Steels, Italy. Associazione Italiana di Metalurgia. [CD-ROM].November 2005. ISBN 88-85298-56-7.
[3] L. Cipolla, J. Gabrel: "New Creep Rupture Assessment of Grade 91". In: Proceedings ofI st International Conference Super-High Strength Steels, Italy. Associazione Italiana diMetalurgia. [CD-ROM]. November 2005. ISBN 88-85298-56-7.
[4] R. Mythili, P. V. Thomas, S. Saroja, M. Vijayalakshmi, V. S. Raghunathan:"Microstructural Modification Due to Reheating in Multipass Manual Arc Welds of9Cr-IMo Steel". Journal of Nuclear Materials. Vol. 312, 2003, 199 - 206.
[51 A. Moitra, P. Parameswaran, P. R. Sreenivasan, S. L. Mannan: "A Toughness Study ofthe Weld Heat-Affected Zone of a 9Cr-1Mo Steel". Material Characterization, Vol. 48,2002, 55-61.
[6] J. R. Yang, C. Y. Huang, C. N. Yang, J. L. Horng: "Microstructural Examination of2.25Cr-lMo Steel Steam Pipes After Extended service".Material Characterization, Vol.30, 1998, 75-88.
[7] C. D. Lundin, K. K. Khan, D. Yang: "Effect of Carbon Migration in Cr-Mo Weldmentsan Metallurgical Structure and Mechanical Properties". WRC Bulletin, Vol. 407, 1995,1-48.
[8] H. K. D. R. Bhadeshia: "Design of Creep–Resistant Steel Welds". In: Trends inWelding Research. Ed. S. A. David, T. DebRoy, J. A. Jonson, H. B. Smartt, J. M. Vitek.ASM International. Ohio. 1999, 795 – 804.
[9] R. Foret, B. Million, M. Svoboda, K. Stränsky: "Structural Stability of Dissimilar WeldJoints of Steel P91". Science and Technology of Welding and Joining, Vol. 6, No. 6,2001, 405 – 411.
[10] K. Laha, S. Latha, K. Bhanu Sankara Rao, S. L. Mannan, D. H. Sastry: "Comparison ofCreep Behaviour of 2.25Cr-lMo/Cr-lMo Dissimilar Weld Joint with Its Base and WeldMetals". Materials Science and Technology, Vol. 17, 2001, 1265 – 1272.
[11] A. Di Gianfrancesco, L. Cipolla, F. Cirilli: "Microstructural Stability and Creep DataAssessment of Tenaris Grades 91 and 911. In: Proceedings of InternationalConference Super-High Strength Steels, Italy. Associazione Italiana di Metalurgia. [CD-ROM]. November 2005.ISBN 88-85298-56-7.

PHYSICAL SIMULATION AND NUMERICAL MODELLINGOF X10CrMoVNb 9.10 (P91) STEEL REPAIR WELDING
Miroslaw Lomozik 1) , Edmund Tasak 2)
1) Instytut Spawalnictwa (Institute of Welding), Polandul. Bl. Czeslawa 16/18, 44-100 Gliwice,e-mail: [email protected]
AGH University of Science & Technology, Poland
Abstract
The characteristics of a welding thermal cycle is presented as well as phenomena which occur in the HAZ duringmulti-pass welding. Examples of examination results aimed at the determination of HAZ properties in P91 steelby using the Simulation technique are given and also some results of numerical modelling of thermal Fields andcycles in the HAZ by means of ANSYS 5.6 programme.
Keywords: thermal welding cycle, Heat Affected Zone, P91 steel, cooling time, martensite,plastic properties
1. Introduction
Safety during operation of welded structures is strictly connected with the quality andmechanical properties of welded joints. At operating conditions, where the welded jointis subjected to alternating and often dynamic loads, one of its most important characteristics,besides mechanical properties, is toughness, and especially in the region of the heat affectedzone (HAZ).
Due to degradation of welded structures, for instance welded installations in the powerindustry, their failures take place at present, and it should be reckoned with the possibility thatthey will occur also in future. The best solution in that case would be the replacement of oldstructures by new ones. Due to technical and economic reasons such a solution is most oftenimpossible. Therefore repair of welded constructions is necessary.
The next important problem is the necessity of post weld heat treatment (PWHT),as is the case for example at pressure vessel welding in the power industry. The objectiveof PWHT is the improvement of the HAZ and weld metal toughness and maximum reductionof welding residual stresses. But in the case of repair welding of big objects PWHT maycause serious difficulties.
In situations, where due to technical reasons conventional PWHT is restrictedor impossible, an effective means for ensuring proper high HAZ toughness is the applicationof so-called "temper bead welding". The method consist in such a means and sequenceof laying individual weld beads, to temper the martensitic microstructure in the HAZof previously welded beads by the controlled welding thermal cycle. The temper beadwelding technique enables lowering of hardness of martensitic and upper bainiticmicrostructures, which occur in the coarse grain region of the HAZ, and in consequencetoughness improvement of these welded joint regions.
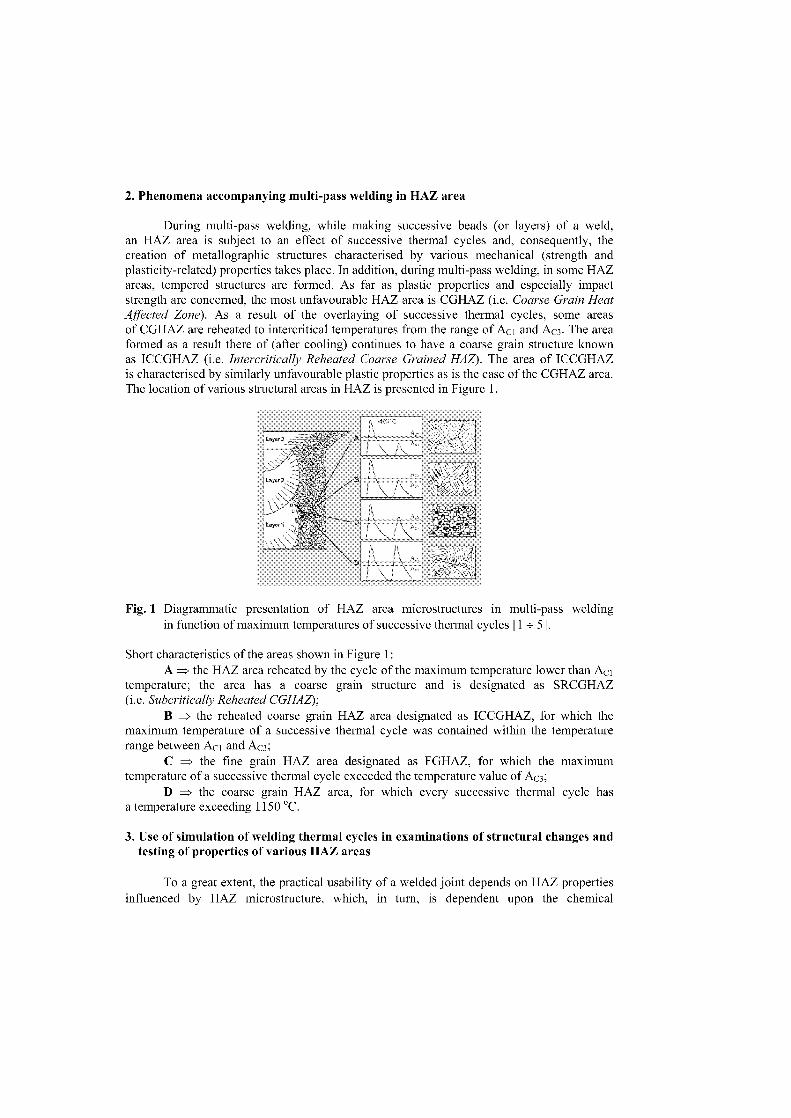
2. Phenomena accompanying multi-pass welding in HAZ area
During multi-pass welding, while making successive beads (or layers) of a weld,an HAZ area is subject to an effect of successive thermal cycles and, consequently, thecreation of metallographic structures characterised by various mechanical (strength andplasticity-related) properties takes place. In addition, during multi-pass welding, in some HAZareas, tempered structures are formed. As far as plastic properties and especially impactstrength are concerned, the most unfavourable HAZ area is CGHAZ (i.e. Coarse Grain HeatAffected Zone). As a result of the overlaying of successive thermal cycles, some areasof CGHAZ are reheated to intercritical temperatures from the range of Ac i and Ac3. The areaformed as a result there of (after cooling) continues to have a coarse grain structure knownas ICCGHAZ (i.e. Intercritically Reheated Coarse Grained HAZ). The area of ICCGHAZis characterised by similarly unfavourable plastic properties as is the case of the CGHAZ area.The location of various structural areas in HAZ is presented in Figure 1.
Fig. 1 Diagrammatic presentation of HAZ area microstructures in multi-pass weldingin function of maximum temperatures of successive thermal cycles [1 ÷ 5].
Short characteristics of the areas shown in Figure 1:A the HAZ area reheated by the cycle of the maximum temperature lower than Ac]
temperature; the area has a coarse grain structure and is designated as SRCGHAZ(i. e. Subcritically Reheated CGHAZ);
B the reheated coarse grain HAZ area designated as ICCGHAZ, for which themaximum temperature of a successive thermal cycle was contained within the temperaturerange between Ac i and Ac3;
C the fine grain HAZ area designated as FGHAZ, for which the maximumtemperature of a successive thermal cycle exceeded the temperature value of Ac3;
D the coarse grain HAZ area, for which every successive thermal cycle hasa temperature exceeding 1150 °C.
3. Use of simulation of welding thermal cycles in examinations of structural changes andtesting of properties of various HAZ areas
To a great extent, the practical usability of a welded joint depends an HAZ propertiesinfluenced by HAZ microstructure, which, in turn, is dependent upon the chemical
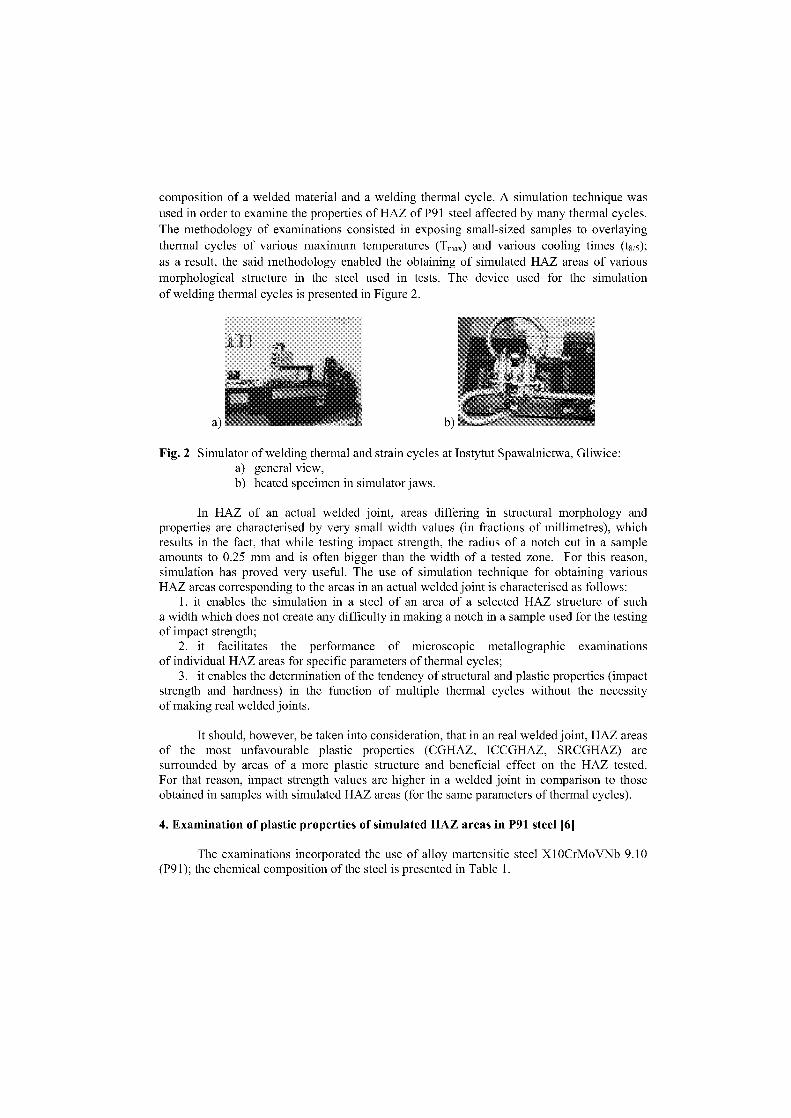
composition of a welded material and a welding thermal cycle. A simulation technique wasused in order to examine the properties of HAZ of P91 steel affected by many thermal cycles.The methodology of examinations consisted in exposing small-sized samples to overlayingthermal cycles of various maximum temperatures (Fm.) and various cooling times (t815);as a result, the Said methodology enabled the obtaining of simulated HAZ areas of variousmorphological structure in the steel used in tests. The device used for the simulationof welding thermal cycles is presented in Figure 2.
Fig. 2 Simulator of welding thermal and strain cycles at Instytut Spawalnictwa, Gliwice:a) general view,b) heated specimen in Simulator jaws.
In HAZ of an actual welded joint, areas differing in structural morphology andproperties are characterised by very Small width values (in fractions of millimetres), whichresults in the fact, that while testing impact strength, the radius of a notch cut in a sampleamounts to 0.25 mm and is often bigger than the width of a tested zone. For this reason,simulation has proved very useful. The use of simulation technique for obtaining variousHAZ areas corresponding to the areas in an actual welded joint is characterised as follows:
1. it enables the simulation in a steel of an area of a selected HAZ structure of sucha width which does not create any difficulty in making a notch in a sample used for the testingof impact strength;
2. it facilitates the performance of microscopic metallographic examinationsof individual HAZ areas for specific parameters of thermal cycles;
3. it enables the determination of the tendency of structural and plastic properties (impactstrength and hardness) in the function of multiple thermal cycles without the necessityof making real welded joints.
It should, however, be taken into consideration, that in an real welded joint, HAZ areasof the most unfavourable plastic properties (CGHAZ, ICCGHAZ, SRCGHAZ) aresurrounded by areas of a more plastic structure and beneficial effect an the HAZ tested.For that reason, impact strength values are higher in a welded joint in comparison to thoseobtained in samples with simulated HAZ areas (for the same parameters of thermal cycles).
4. Examination of plastic properties of simulated HAZ areas in P91 steel [6]
The examinations incorporated the use of alloy martensitic steel Xl0CrMoVNb 9.10(P91); the chemical composition of the steel is presented in Table 1.
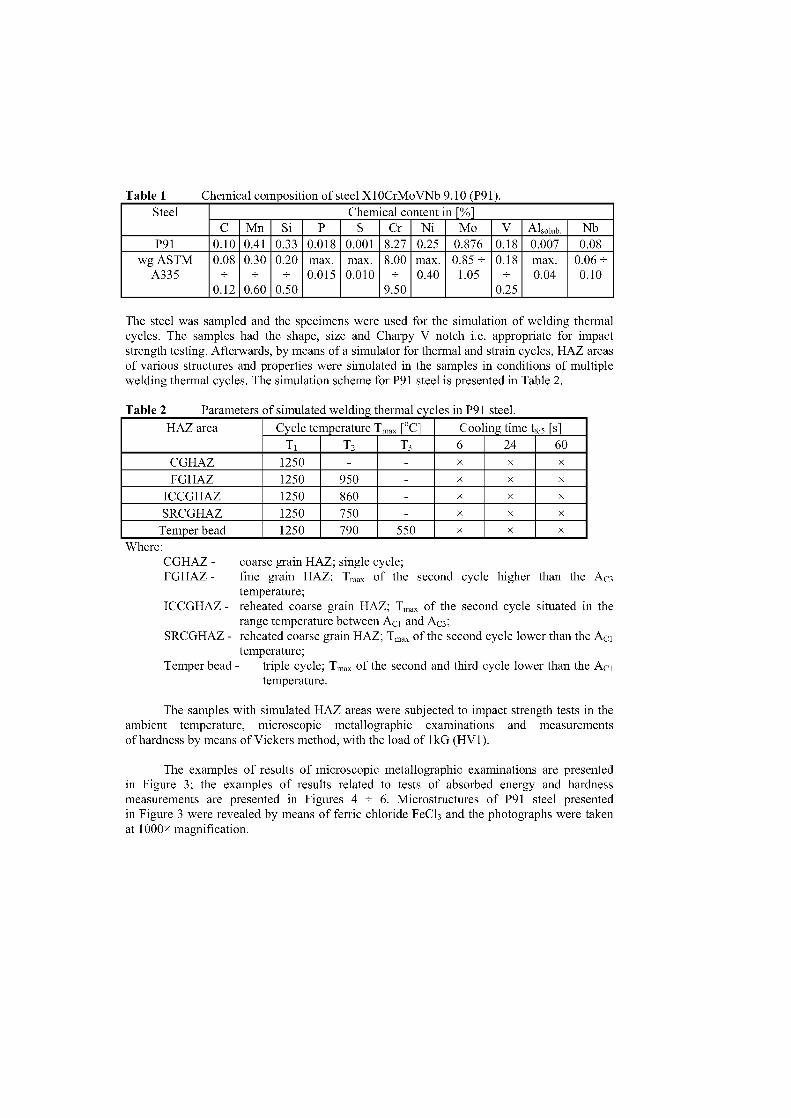
Table 1
Chemical composition of steel X10CrMoVNb 9.10 (P91).Steel Chemical content in [%]
C Mn Si P S Cr Ni Mo V Alsolub. NbP91 0.10 0.41 0.33 0.018 0.001 8.27 0.25 0.876 0.18 0.007 0.08
wg ASTM 0.08 0.30 0.20 max. max. 8.00 max. 0.85 ± 0.18 max. 0.06 ±A335 ÷ ± ± 0.015 0.010 ÷ 0.40 1.05 ± 0.04 0.10
0.12 0.60 0.50 9.50 0.25
The steel was sampled and the specimens were used for the simulation of welding thermalcycles. The samples had the shape, size and Charpy V notch i.e. appropriate for impactstrength testing. Afterwards, by means of a simulator for thermal and strain cycles, HAZ areasof various structures and properties were simulated in the samples in conditions of multiplewelding thermal cycles. The simulation scheme for P91 steel is presented in Table 2.
Table 2
Parameters of simulated weldine thermal cycles in P91 steel.
HAZ area Cycle temperature T. [°C] Cooling time t /5 [s]
T1 T2 T3 6 24 60
CGHAZ 1250 - - x x x
FGHAZ 1250 950 - x x
ICCGHAZ 1250 860 - x x
SRCGHAZ 1250 750 - x x x
Temper bead 1250 790 550 x x x
Where:CGHAZ - coarse grain HAZ; single cycle;FGHAZ - fine grain HAZ; Tim., of the second cycle higher than the Au
temperature;ICCGHAZ - reheated coarse grain HAZ; Tmax of the second cycle situated in the
range temperature between Ac i and Ac3;SRCGHAZ - reheated coarse grain HAZ; T max of the second cycle lower than the Ac1
temperature;Temper bead - triple cycle; T., of the second and third cycle lower than the Ac1
temperature.
The samples with simulated HAZ areas were subjected to impact strength tests in theambient temperature, microscopic metallographic examinations and measurementsof hardness by means of Vickers method, with the load of 1kG (HV1).
The examples of results of microscopic metallographic examinations are presentedin Figure 3; the examples of results related to tests of absorbed energy and hardnessmeasurements are presented in Figures 4 ± 6. Microstructures of P91 steel presentedin Figure 3 were revealed by means of ferric chloride FeC1 3 and the photographs were takenat 1000x magnification.
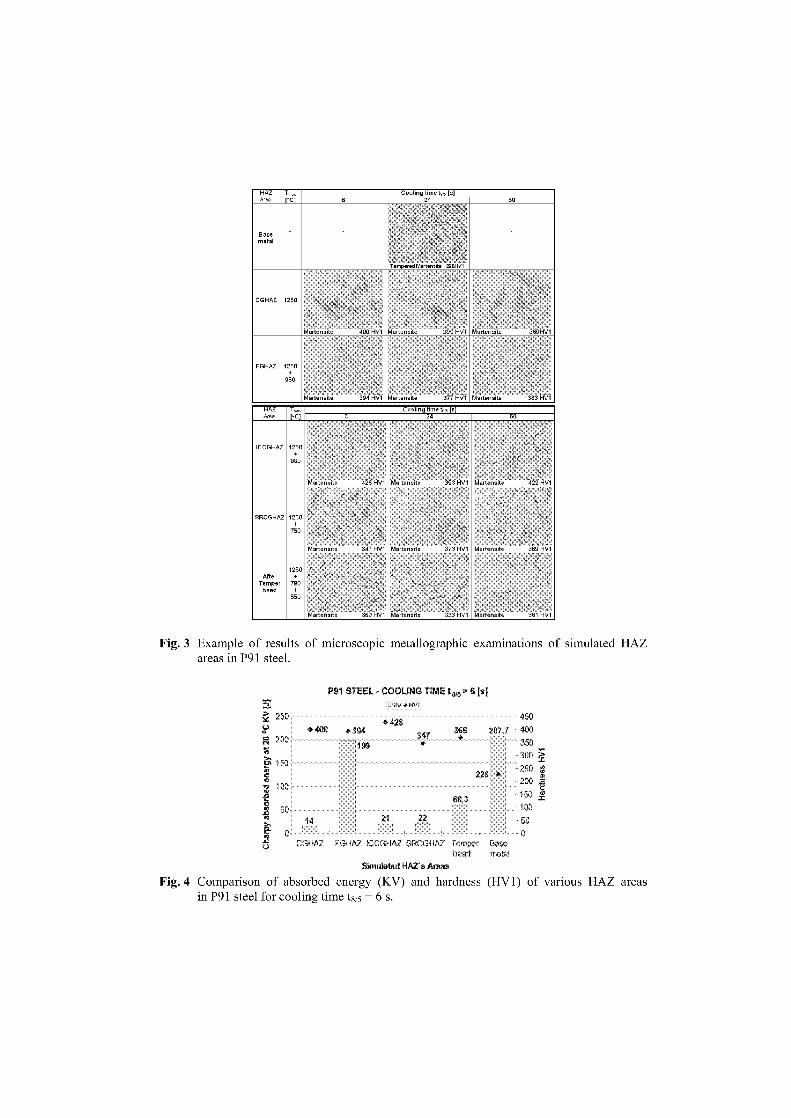
HAZ T,„„ Coolmp hna t, [b]Am [oC] 6 24 60
Baserbetal
r.r -1 t [ . 22
C HAZ 1260
IA ,rt -._ ite 450H. 1 Mal tem lt- :355 Hei Martensite 36:•H+1
FGHAZ 12509;0
Madenvite 384 H, I 1.1•rtenbite. 17- H'+1 1.1adenvite 783 IHAZ T,„„ 2 beling en.. t • [s]Aree [..C]
ICCGHAZ 1250850
Marbensibe
SRCGHAZ 1250750
Mar 34- H: I f.1,11-,11 4 1
1250After +
Tenwer 780bead •
550- :
biartenalte I Martens be 1 Marter,,te -,,C, I H ••• I
Fig. 3 Example of results of microscopic metallographic examinations of simulated HAZareas in P91 steel.
P91 STEEL - COOLING TIME t arn - [s
Simulatfid HAE't. Areas
Fig. 4 Comparison of absorbed energy (KV) and hardness (HV1) of various HAZ areasin P91 steel for cooling time t815 = 6 s.
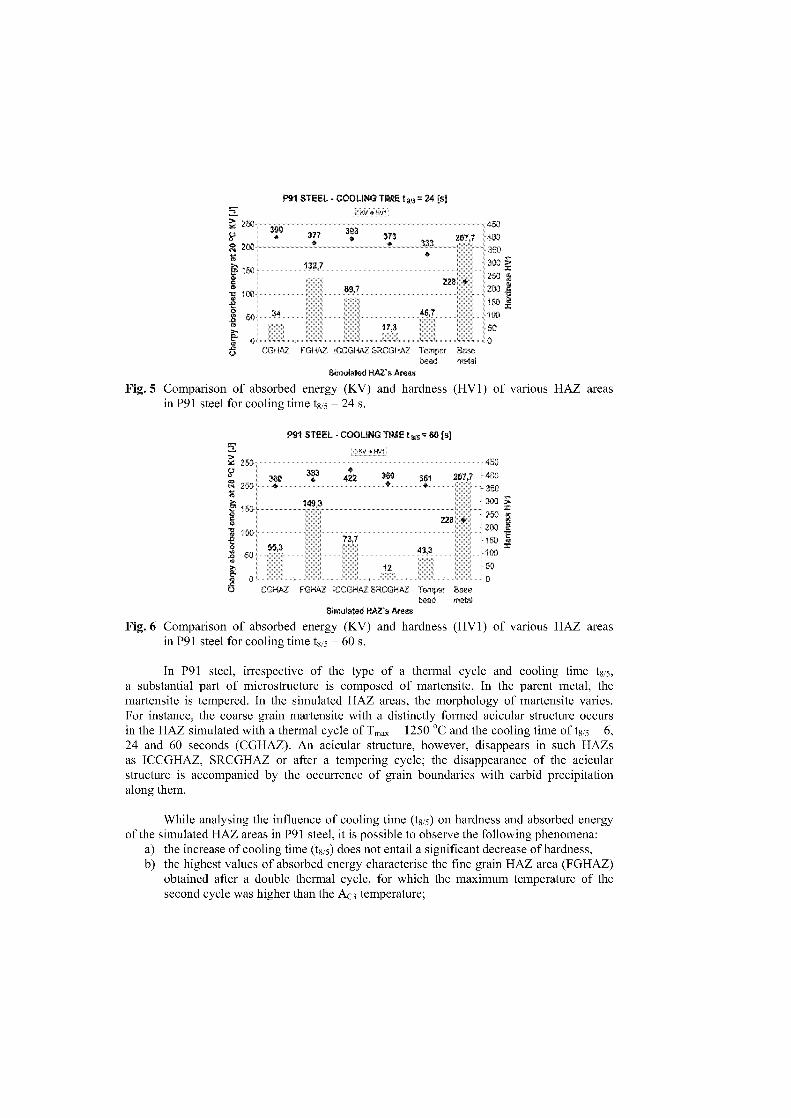
P91 STEEL - COOLING TIME t = 24 [6]
393377 373•
132,7
Surn,kt (I HA/ Ar0••
Fig. 5 Comparison of absorbed energy (KV) and hardness (HV1) of various HAZ areasin P91 steel for cooling time t8 1 5 = 24 s.
P STEEL COOLING TIME
25053" 380
383• 422 369 361 207,7
g 2ää
e 150 ,149,3
222 e130
73;755,3 43,3
12ki 0 0
CGHA7 FGHA7 ICCCHA7 GliA7 Te ',MA(
beadSimulated F1AZ j Aren
Fig. 6 Comparison of absorbed energy (KV) and hardness (HV1) of various HAZ areasin P91 steel for cooling time t815 = 60 s.
In P91 steel, irrespective of the type of a thermal cycle and cooling time t815,a substantial part of microstructure is composed of martensite. In the parent metal, themartensite is tempered. In the simulated HAZ areas, the morphology of martensite varies.For instance, the coarse grain martensite with a distinctly formed acicular structure occursin the HAZ simulated with a thermal cycle of = 1250 °C and the cooling time of t8/5 = 6,24 and 60 seconds (CGHAZ). An acicular structure, however, disappears in such HAZsas ICCGHAZ, SRCGHAZ or after a tempering cycle; the disappearance of the acicularstructure is accompanied by the occurrence of grain boundaries with carbid precipitationalong them.
While analysing the influence of cooling time (t 815 ) an hardness and absorbed energyof the simulated HAZ areas in P91 steel, it is possible to observe the following phenomena:
a) the increase of cooling time (t815) does not entail a significant decrease of hardness,b) the highest values of absorbed energy characterise the fine grain HAZ area (FGHAZ)
obtained after a double thermal cycle, for which the maximum temperature of thesecond cycle was higher than the Ac3 temperature;
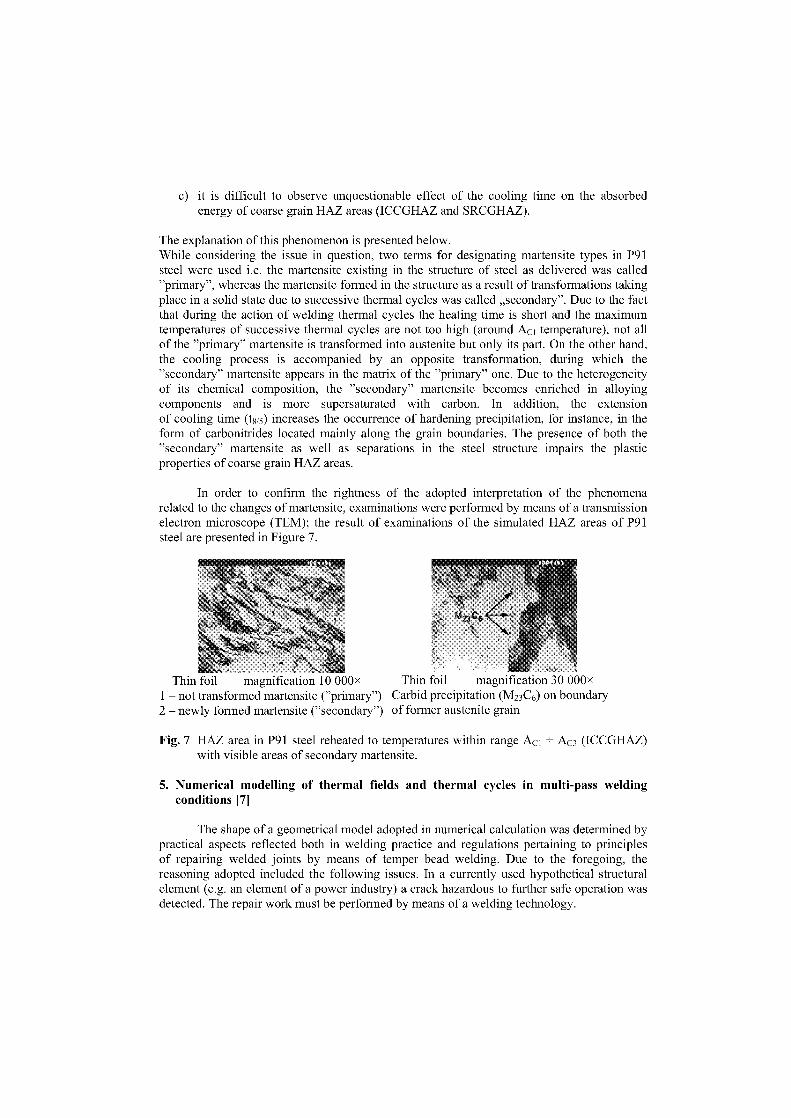
c) it is difficult to observe unquestionable effect of the cooling time on the absorbedenergy of coarse grain HAZ areas (ICCGHAZ and SRCGHAZ).
The explanation of this phenomenon is presented below.While considering the issue in question, two terms for designating martensite typen in P91steel were used i.e. the martensite existing in the structure of steel as delivered was called"primary", whereas the martensite formed in the structure as a result of transformations takingplace in a solid state due to successive thermal cycles was called „secondary". Due to the factthat during the action of welding thermal cycles the heating time is short and the maximumtemperatures of successive thermal cycles are not too high (around Ac i temperature), not allof the "primary" martensite is transformed into austenite but only its part. On the other hand,the cooling process is accompanied by an opposite transformation, during which the"secondary" martensite appears in the matrix of the "primary" one. Due to the heterogeneityof its chemical composition, the "secondary" martensite becomes enriched in alloyingcomponents and is more supersaturated with carbon. In addition, the extensionof cooling time (t815 ) increases the occurrence of hardening precipitation, for instance, in theform of carbonitrides located mainly along the grain boundaries. The presence of both the"secondary" martensite as well as separations in the steel structure impairs the plasticproperties of coarse grain HAZ areas.
In order to confirm the rightness of the adopted interpretation of the phenomenarelated to the changes of martensite, examinations were performed by means of a transmissionelectron microscope (TEM); the result of examinations of the simulated HAZ areas of P91steel are presented in Figure 7.
Thin foil magnification 10 000x Thin foil magnification 30 000x1 – not transformed martensite ("primary") Carbid precipitation (M23 C6) on boundary2 – newly formed martensite ("secondary") of former austenite grain
Fig. 7 HAZ area in P91 steel reheated to temperatures within range Ac 1(ICCGHAZ)with visible areas of secondary martensite.
5. Numerical modelling of thermal fields and thermal cycles in multi-pass weldingconditions [7]
The shape of a geometrical model adopted in numerical calculation was determined bypractical aspects reflected both in welding practice and regulations pertaining to principlesof repairing welded joints by means of temper bead welding. Due to the foregoing, thereasoning adopted included the following issues. In a currently used hypothetical structuralelement (e.g. an element of a power industry) a crack hazardous to further Safe operation wasdetected. The repair work must be performed by means of a welding technology.
Fig. 8 Example of crack in hypothetical construction and removal of defect throughmechanical working.
Fig. 9 A geometrical model adopted fornumerical calculation after divisioninto finite elements:
1 – parent metal,2 – molten metal (liquid state),3 – deposited metal after
solidification (dendritic form).
Fig. 10 Scheme of selection of characteristicpoints selected in order to determinethermal cycles.
The following input data were used for numerical calculation:a) parent metal: alloy steel – type 91,b) welding filler metal: filler metal-like material similar to P91 steel,c) welding method: TIG, no preheating, six layers in a weld,d) physical properties such as mass density [kg/mm3], thermal conductivity
[cal/(mmxsx°C)] and specific heat c [cal/(kgx°C)] were adopted for alloy steel andalloy deposited metal accordingly.
The purpose of numerical modelling was to present thermal phenomena occurring in HAZareas in the vicinity of a weld groove affected by multiple welding thermal cycles.The adopted procedure was as presented below. First, a thermal field in the temperature range1100 ÷ 1500 °C was selected. Then, for a model containing six welded layers, characteristicpoints situated in HAZ were selected (as presented in Fig. 10). Next, for the aforementionedpoints, thermal cycles were determined successively for individual layers of a weld.
After laying 2-nd la er of weld1500
After laying 3-rd and 4-th layers of werd After laying 5-th and 6-th layers of weld
a) b
c)
Fig. 11 Thermal cycles after laying successive layers of weld.
While analysing the results of examinations obtained an the basis of numerical calculation,it is possible to follow the tendencies of the changing parameters of welding cycles (seeFigure 12).
15001400
1300120011007 1000
— 9002 800
g 00000500400300200100
MODEL OF WELDING SIX LAYERS IN WELDLayer 1 Layer 3 Layer 4 Layer 5 Layer 6
acteristic pointsof steel
Chain HAZ
CGHAZ•
• 164
♦ 265
• 3 1
• 331
• 1FGHAZ•
• ICCGHAZ• 4
SRCGHAZTempor band
r1ast
o0 3 10 t5 25 25 30 35 40 45 55 55 90 b9 92 55 90 551513105110515129
Time [s]
Fig. 12 Distribution of temperatures for thermal cycles in characteristic points locatedin HAZ area next to faces of third and sixth layers of weld for P91 alloy steel.
The distribution of temperatures of thermal cycles in selected points of HAZ in P91steel after making successive layers of a weld Shows that the maximum temperatures of cyclesbecome stabilize between the fourth and sixth layers (Figure 12). The Said temperatures aresituated in the temperature range corresponding to a fine grain HAZ, which leads to theconclusion that the improvement of plastic properties of coarse grain HAZs during repairwelding may be obtained after making three or four layers of a weld.
6. Summing up
As a result of examinations conducted it was possible to obtain very important informationrelated to plastic properties of HAZ areas of different microstructures and the knowledgeabout the course and parameters of welding thermal cycles in the conditions of multiplewelding thermal cycles. Both the examinations performed by means of a simulator for thermaland strain cycles and numerical calculation made by means of ANSYS 5.6 programme proveduseful and efficient as despite the great complexity of phenomena accompanying an actualwelding process they made it possible to predict tendencies of changes of structuralmorphology of steel, plastic properties and the parameters of thermal cycles.
7. References
[1] Haze T., Aihara S.: Metallurgical Factors Controlling HAZ Toughness in HT50 Steels.IIW Doc. IX-1423-86.
[2] Guide to Weldability and Metallurgy of Welding of Steels Processed byThermomechanical Rolling or by Accelerated Cooling. IIW Doc. IX-1649-91.
[3] Devillers L., Kaplan D., Testard P.: Predicting the microstructure and toughness of weldHAZs. Welding International, nr 9, 1995, s. 128 138.
[4] Matsuda F. et al.: Review of Mechanical and Metallurgical Investigations of M-AConstituent in Welded Joint in Japan. IIW Doc. No IX-1782-94.
[5] Lomozik M.: Investigations an welding thermal cycles in temperbead welding process forductility improvement. Tarasaki R&D Center, Japan Power Engineering and InspectionCorporation, Hitachinaka, Japan, August 2000 - July 2001,
[6] Lomozik M.: Badanie zmian wlasnizAci SWC stali pod wplywem wielokrotnych cykliciepinych w oparciu o techni4 symulacji. Praca badawcza Instytutu SpawalnictwaNr Id-115, 2003.
[7] Lomozik M.: Modelowanie p61 temperatur w obszarach strefy wplywu ciepla zlftczyspawanych stali przy pomocy programu ANSYS. Praca badawcza Instytutu SpawalnictwaNr Da-99, 2004.
DISSIMILAR WELDED JOINTS WITHOUT A BUFFER AREAS OFSTEEL TYPE 9CR WITH 1CRMOV TO BE USED FOR STEAM
BOILER PIPELINES
Edmund Tasak*, Adam Hernas**, Jerzy Pasternak***, Stanislaw Fudali**** Academy of Mining, 30 Mickiewicza Str., 30-059 Krak6w, Poland
** KALLA Sp. z o.o., 17 Barbary Str., 40-053 Katowice, Poland*** Boiler Engineering Company RAFAKO S.A., 33 Lakowa Str, 47-400 Raciborz, Poland
Abstract
The main material which is used in Poland in fabrication of steam pipelines is steel grade 1CrMoV.Modernisation of the national power plants, among others through the use of P91 steel grade for pipelines,requires the application of proper technologies when joining the two very different steels.This paper includes the evaluation of strength properties, characteristics of low-cycle fatigue and technological,evaluation of welded joints' structure, HAZ and deposited metal by means of LM, SEM and TEM techniques.Conclusions were presented regarding the manufacturing process, recommended welding technology and heattreatment of pipeline welded joints of steel 1CrMoV to steel P91, ensuring full implementation thereof inmodernisation works of the existing 360MW units. This technology may also be applied in erection of thesupercritical power unit at Belchatow Power Station.
Keywords: Hastelloy alloys, flue gas desulphurisation plants, corrosion resistance, microstructure.
Introduction
The objectives of the Polish power policy include erection of power units with supercriticalparameters at the following power stations: PAK, Lagisza and Belchatow P.S. Moreover, de-capitalisation of the vast majority of the power units requires modernisation and promptrehabilitation of units with conventional parameters, as well as increase of their efficiency,also including modernisation of steam pipelines [1,2].The dominant steel grade applied in fabrication of steam pipelines is 13HMF steel (equivalentof 14MoV63 acc. to DIN Standard), which contains approx. 1%Cr, 1%Mo and up to 0.25%V.Therefore, some research works were taken up in order to gain more knowledge indispensablefor modernisation works at the national power stations and production of dissimilar weldedjoints on steam pipelines. The basic technological issues accompanying fabrication of thistype of joints cover the increased brittleness in P91 steel heat-affected zone, resulting fromso-called "reactive" diffusion. The diffusion results from a considerable difference betweenCr concentration in the P91 steel HAZ material and the welded joint made with electrodescharacterised by 1CrMoV steel chemical composition. Formation of coal enriched andimpoverished zones has a considerable impact on mechanical and functional properties of awelded joint [3].Technological experiments and examinations were carried out on three thick-wall butt testwelded joints on P91 – 1CrMoV tubes. The applied welding materials, welding and heattreatment parameters of the pipeline joints were determined on the basic of tests performed atRAFAKO S.A.[2,3]
1
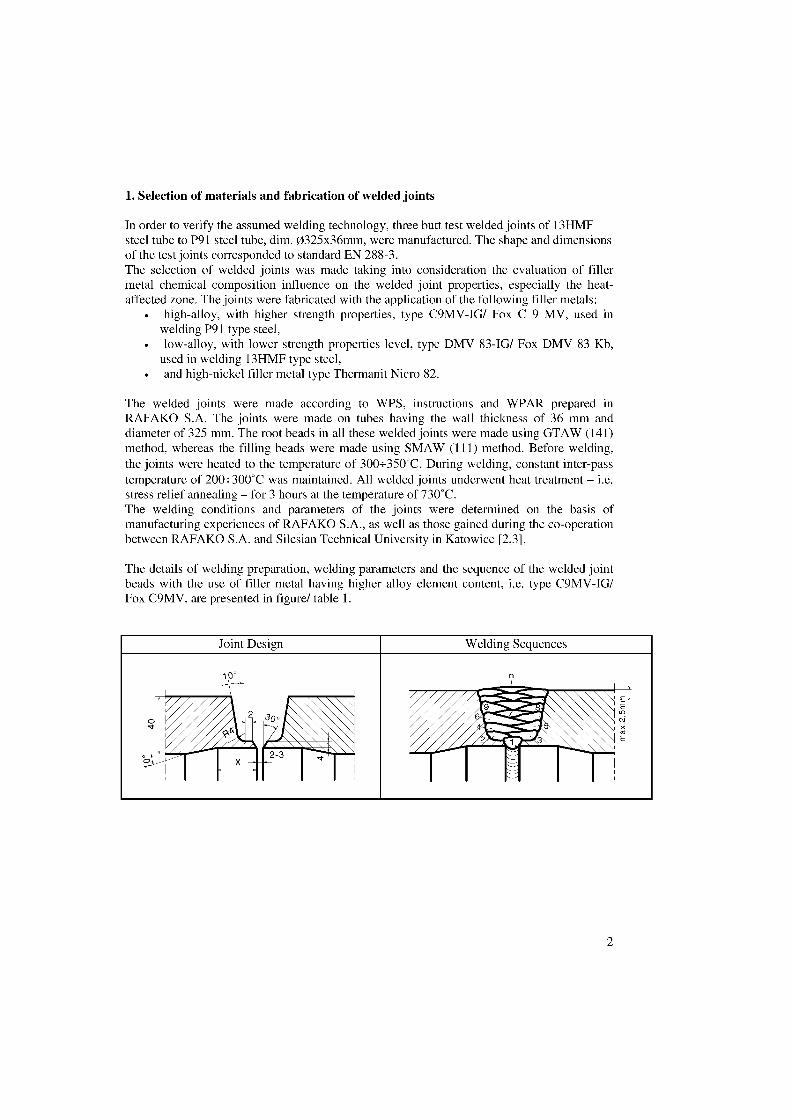
1. Selection of materials and fabrication of welded joints
In order to verify the assumed welding technology, three butt test welded joints of 13HMFsteel tube to P91 steel tube, dim. 0325x36mm, were manufactured. The shape and dimensionsof the test joints corresponded to standard EN 288-3.The selection of welded joints was made taking into consideration the evaluation of filiermetal chemical composition influence on the welded joint properties, especially the heat-affected zone. The joints were fabricated with the application of the following filler metals:
• high-alloy, with higher strength properties, type C9MV-IG/ Fox C 9 MV, used inwelding P91 type steel,
• low-alloy, with lower strength properties level, type DMV 83-IG/ Fox DMV 83 Kb,used in welding 13HMF type steel,
• and high-nickel filler metal type Thermanit Nicro 82.
The welded joints were made according to WPS, instructions and WPAR prepared inRAFAKO S.A. The joints were made on tubes having the wall thickness of 36 mm anddiameter of 325 mm. The root beads in all these welded joints were made using GTAW (141)method, whereas the filling beads were made using SMAW (111) method. Before welding,the joints were heated to the temperature of 300÷350°C. During welding, constant inter-passtemperature of 200÷300°C was maintained. All welded joints underwent heat treatment – i.e.stress relief annealing – for 3 hours at the temperature of 730°C.The welding conditions and parameters of the joints were determined on the basis ofmanufacturing experiences of RAFAKO S.A., as well as those gained during the co-operationbetween RAFAKO S.A. and Silesian Technical University in Katowice [2,3].
The details of welding preparation, welding parameters and the sequence of the welded jointbeads with the use of filler metal having higher alloy element content, i.e. type C9MV-IG/Fox C9MV, are presented in figure/ table 1.
Joint Design Welding Sequences
10°--■11.•--
.._........---,---st____el I I ii iie
......„..,
E0I I I I I il .
N-°v .11
2 3 . \AI Ir■ ■■ ■ .■ .■■m,--.mh,
Aiez....liw■10
XI23
eljI
2
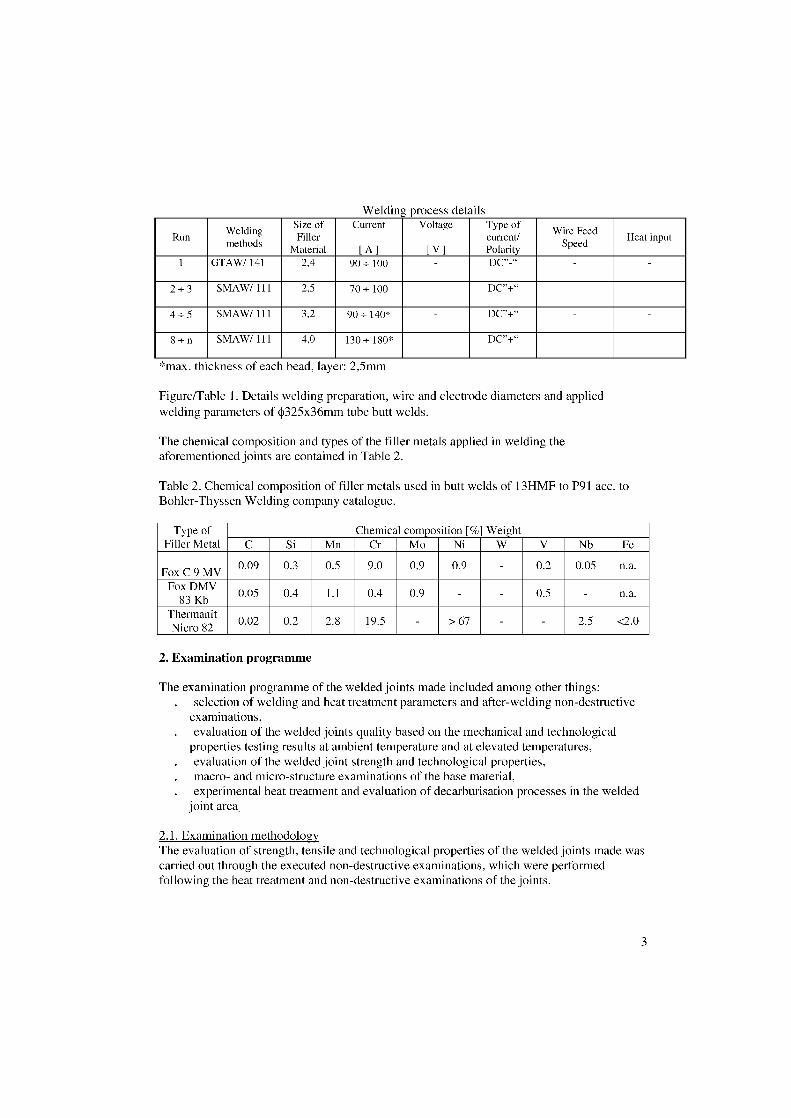
Welding process details
Run Weldingmethods
Size ofFilie
Material
Current
[ A 1
Voltage
[ V ]
Type ofcurrent/Polarity
Wire FeedSpeed Heat Input
1 GTAW/ 141 2,4 90 + 100 DC"-" - -
2 + 3 SMAW/ 111 2,5 70 + 100 DC"+" - -
4 + 5 SMAW/ 111 3,2 90 + 140* DC"+" - -
8 + n SMAW/ 111 4,0 130 + 180* DC"+" - -
*max. thickness of each bead, layer: 2,5mm
Figure/Table 1. Details welding preparation, wire and electrode diameters and appliedwelding parameters of 4325x36mm tube butt welds.
The chemical composition and types of the filier metals applied in welding theaforementioned joints are contained in Table 2.
Table 2. Chemical composition of filier metals used in butt welds of 13HMF to P91 acc. toBohler-Thyssen Welding company catalogue.
Type ofFilter Metal
Chemical composition [%] WeightC Si Mn Cr Mo Ni W V Nb Fe
Fox C 9 MV0.09 0.3 0.5 9.0 0,9 0.9 - 0.2 0.05 n.a.
Fox DMV83 Kb
0.05 0.4 1.1 0.4 0.9 - - 0.5 - n.a.
ThermanitNicro 82
0.02 0.2 2.8 19.5 - > 67 - - 2.5 <2.0
2. Examination programme
The examination programme of the welded joints made included among other things:• selection of welding and heat treatment parameters and alter-welding non-destructive
examinations,• evaluation of the welded joints quality based an the mechanical and technological
properties testing results at ambient temperature and at elevated temperatures,• evaluation of the welded joint strength and technological properties,
macro- and micro-structure examinations of the base material,• experimental heat treatment and evaluation of decarburisation processes in the welded
joint area.
2.1. Examination methodologyThe evaluation of strength, tensile and technological properties of the welded joints made wascarried out through the executed non-destructive examinations, which were performedfollowing the heat treatment and non-destructive examinations of the joints.
3
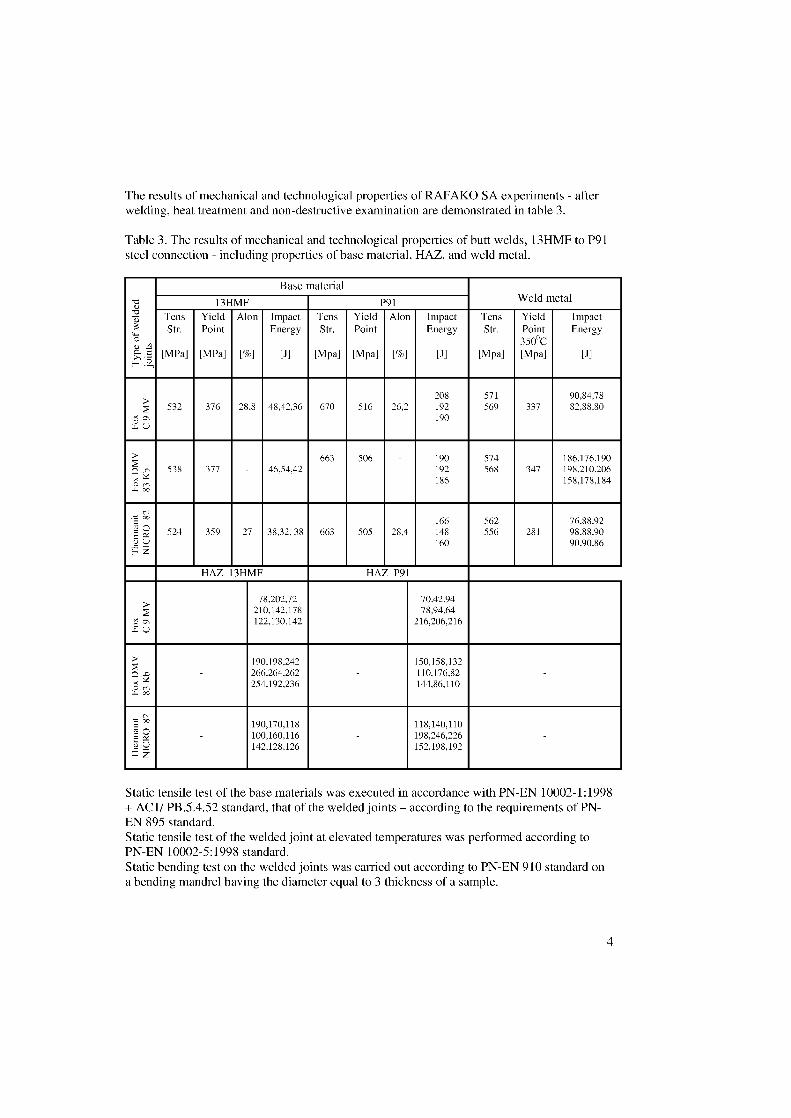
The results of mechanical and technological properties of RAFAKO SA experiments - afterwelding, heat treatment and non-destructive examination are demonstrated in table 3.
Table 3. The results of mechanical and technological properties of butt welds, 13HMF to P91steel connection - including properties of base material, HAZ, and weld metal.
7:1<1.)-a--e,
B ase materialWeld metal13HMF P91
Tens Yield Alon Impact Tens Yield Alon Impact Tens Yield Impact3
uo
,._,.
Str. Point Energy Str. Point Energy Str. Point350°C
Energy
9.z [MPa] [MPa] [%] [J] [Mpa] [Mpa] [%] [J] [Mpa] [Mpa] [J]
E– .5
208 571 90,84,78> 532 376 28,8 48,42,36 670 516 26,2 192 569 337 82,88,80
ö 'LT, t....)
190
> 663 506 190 574 186,176.190q "c 538 377 46,54,42 192 568 347 198,210,2060W co
186 158,178,184
cq
'-g 0°,,, 166 562 76,88,92ä 524 359 27 38.32.38 663 505 28.4 148 556 281 98.88.90o t24 Z
160 90.90.86
HAZ 13HMF HAZ P91
78,202,72 70.42.94> 210,142,178 78,94,64 -
ö 'LT, t....)
122,130,142 216,206,216
> 190.198,242 150,158,132Z - 266.264,262 110,176.8xo ,-,W co
254.192,236 144,86,110
,_, cqoc, 190,170,118 118,140,110
2 100,160,116 198,246,226o t.2 142,128,126 152,198,1924 Z
Static tensile test of the base materials was executed in accordance with PN-EN 10002-1:1998+ AC1/ PB.5.4.52 standard, that of the welded joints – according to the requirements of PN-EN 895 standard.Static tensile test of the welded joint at elevated temperatures was performed according toPN-EN 10002-5:1998 standard.Static bending test on the welded joints was carried out according to PN-EN 910 standard ona bending mandrel having the diameter equal to 3 thickness of a sample.
4
Impact test of the Base materials used in welding of the test welded joints and testing of theimpact strength of the samples cut out from the thick-walled tube welded joints wereperformed on normalised impact samples, having the dimensions of 10x10x55 mm – withCharpy V-notch cut on the depth of 2 mm.Hardness measurements of the welded joints with Vickers method: according to EN 1043-1and EN 288-3 standards, with the load of 98.1kG (HV10).The neatly planned fatigue testing at ambient temperature and at 550°C are just beingexecuted.
3. Influence of heat treatment on structural changes in welded joints of 13HMF steel toP91 steel
In accordance with the technological instruction, after welding, 13HMF to P91 welded jointsare annealed at the temperature range of 720÷750°C, in order to temper the martensite formedduring the welding process. In manufacturing conditions there is sometimes a necessity toperform heat treatment several times, when the welding process parameters are not alwaysmaintained. Therefore, on the welded joints, heat-treated in the industrial conditions, anotherheat treatment at the temperatures of 730, 750 and 780°C, and for 3, 5 and 10 hours wereperformed. The temperature of 780°C is beyond the admissible level for 13HMF steel. Thepurpose of the examinations was to Show unfavourable changes to the structure and propertiesduring heat treatment at various temperatures and time, as well as in overheat conditions andseeking ways of foreseeing such changes [4,5].After the renewed heat treatment, metallographic micro-sections were made and thoroughanalysis of structural and properties changes was carried out in the area where differentmaterials were joined. The width of the decarbonised zone was measured, as well as themicro-hardness in the decarbonised and carbonised zones. Moreover, an attempt was made tocalculate the width of the decarbonised zone with the use of Recarb programme.Examples of typical microstructures following heat treatment are shown in drawings 2 to 7.Microscopic examinations proved that another heat treatment at the temperature of 730°C andlasting 3+10 hrs does not have any significant impact on the structure change. Only someslightly brighter areas are visible on the 13HMF steel side or the side of welded joint made bymeans of Fox DMV 83 Kb electrode. It is the heat treatment, which lasts 10 hours, whichresults in appearance of decarbonised areas with large ferrite grain (Figure 2).
5
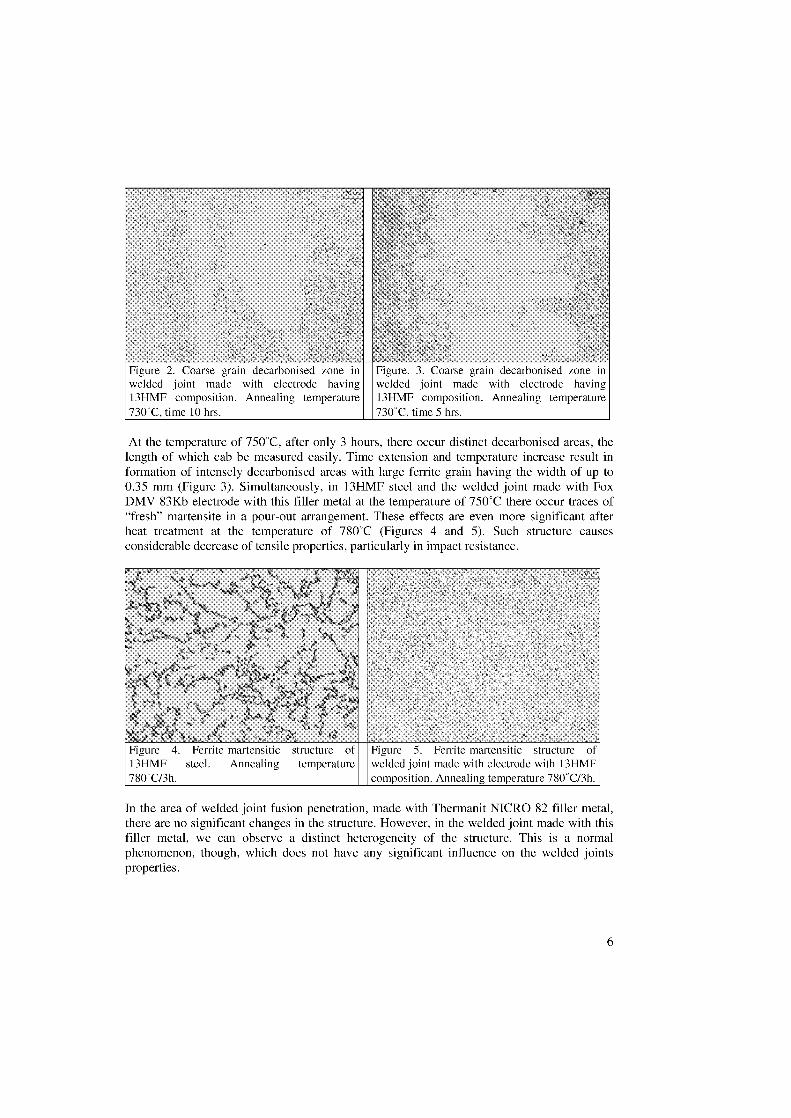
Figure 2. Coarse grain decarbonised zone inwelded joint made with electrode having13HMF composition. Annealing temperature730°C, time 10 hrs.
Figure. 3. Coarse grain decarbonised zone inwelded joint made with electrode having13HMF composition. Annealing temperature730°C, time 5 hrs.
At the temperature of 750°C, after only 3 hours, there occur distinct decarbonised areas, thelength of which cab be measured easily. Time extension and temperature increase result information of intensely decarbonised areas with large ferrite grain having the width of up to0.35 mm (Figure 3). Simultaneously, in 13HMF steel and the welded joint made with FoxDMV 83Kb electrode with this filler metal at the temperature of 750°C there occur traces of"fresh" martensite in a pour-out arrangement. These effects are even more significant afterheat treatment at the temperature of 780°C (Figures 4 and 5). Such structure causesconsiderable decrease of tensile properties, particularly in impact resistance.
Figure4. Ferrite-martensitic structure ot Figure 5. Ferrite-martensitic structure ot13HMF780°C/3h.
steel. Annealing temperature welded joint made with electrode with 13HMFcomposition. Annealing temperature 780°C/3h.
In the area of welded joint fusion penetration, made with Thermanit NICRO 82 filler metal,there are no significant changes in the structure. However, in the welded joint made with thisfiller metal, we can observe a distinct heterogeneity of the structure. This is a normalphenomenon, though, which does not have any significant influence an the welded jointsproperties.
6
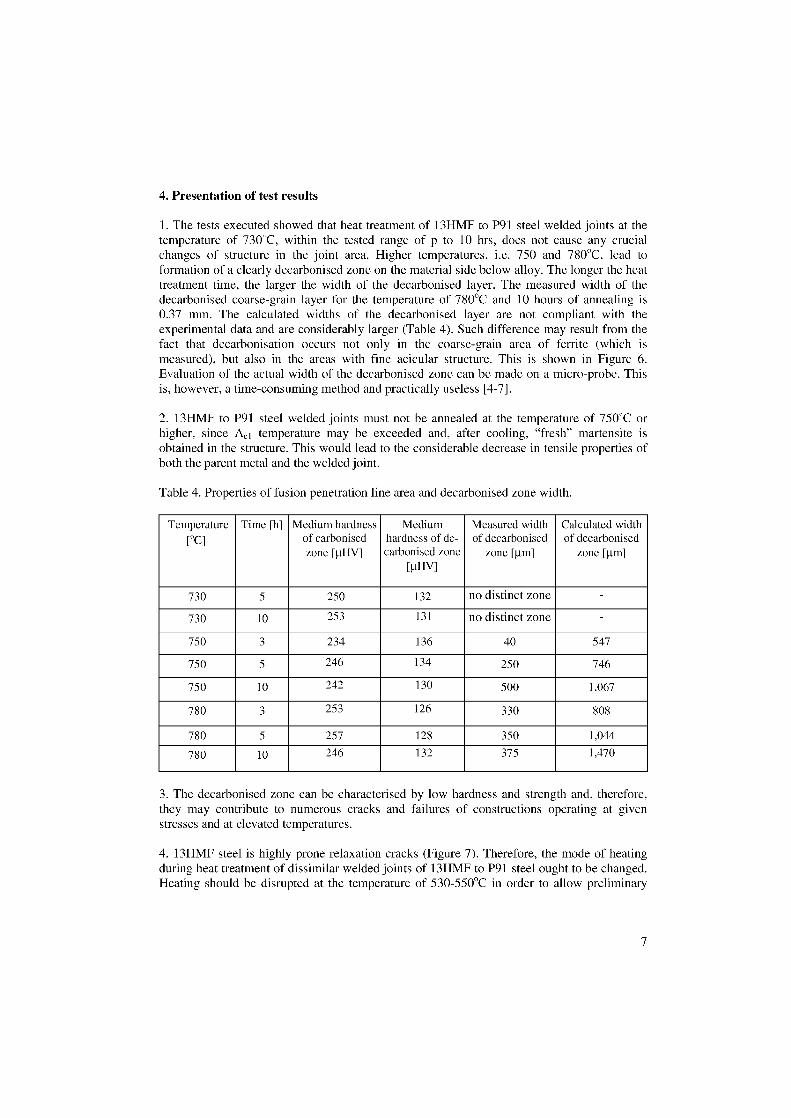
4. Presentation of test results
1. The tests executed showed that heat treatment of 13HMF to P91 steel welded joints at thetemperature of 730°C, within the tested range of p to 10 hrs, does not cause any crucialchanges of structure in the joint area. Higher temperatures, i.e. 750 and 780°C, lead toformation of a clearly decarbonised zone on the material side below alloy. The longer the heattreatment time, the larger the width of the decarbonised layer. The measured width of thedecarbonised coarse-grain layer for the temperature of 780°C and 10 hours of annealing is0.37 mm. The calculated widths of the decarbonised layer are not compliant with theexperimental data and are considerably larger (Table 4). Such difference may result from thefact that decarbonisation occurs not only in the coarse-grain area of ferrite (which ismeasured), but also in the areas with fine acicular structure. This is shown in Figure 6.Evaluation of the actual width of the decarbonised zone can be made on a micro-probe. Thisis, however, a time-consuming method and practically useless [4-7].
2. 13HMF to P91 steel welded joints must not be annealed at the temperature of 750°C orhigher, since Aci temperature may be exceeded and, after cooling, "fresh" martensite isobtained in the structure. This would lead to the considerable decrease in tensile properties ofboth the parent metal and the welded joint.
Table 4. Properties of fusion penetration line area and decarbonised zone width.
Temperature[°C]
Time [h] Medium hardnessof carbonisedzone [gFIV]
Mediumhardness of de-carbonised zone
Measured widthof decarbonised
zone [im]
Calculated widthof decarbonised
zone [im][111-1V]
730 5 250 132 no distinct zone -
730 10 253 131 no distinct zone -
750 3 234 136 40 547
750 5 246 134 250 746
750 10 242 130 500 1,067
780 3 253 126 330 808
780 5 257 128 350 1,044
780 10 246 132 375 1,470
3. The decarbonised zone can be characterised by low hardness and strength and, therefore,they may contribute to numerous cracks and failures of constructions operating at givenStresses and at elevated temperatures.
4. 13HMF steel is highly prone relaxation cracks (Figure 7). Therefore, the mode of heatingduring heat treatment of dissimilar welded joints of 13HMF to P91 steel ought to be changed.Heating should be disrupted at the temperature of 530-550°C in order to allow preliminary
7
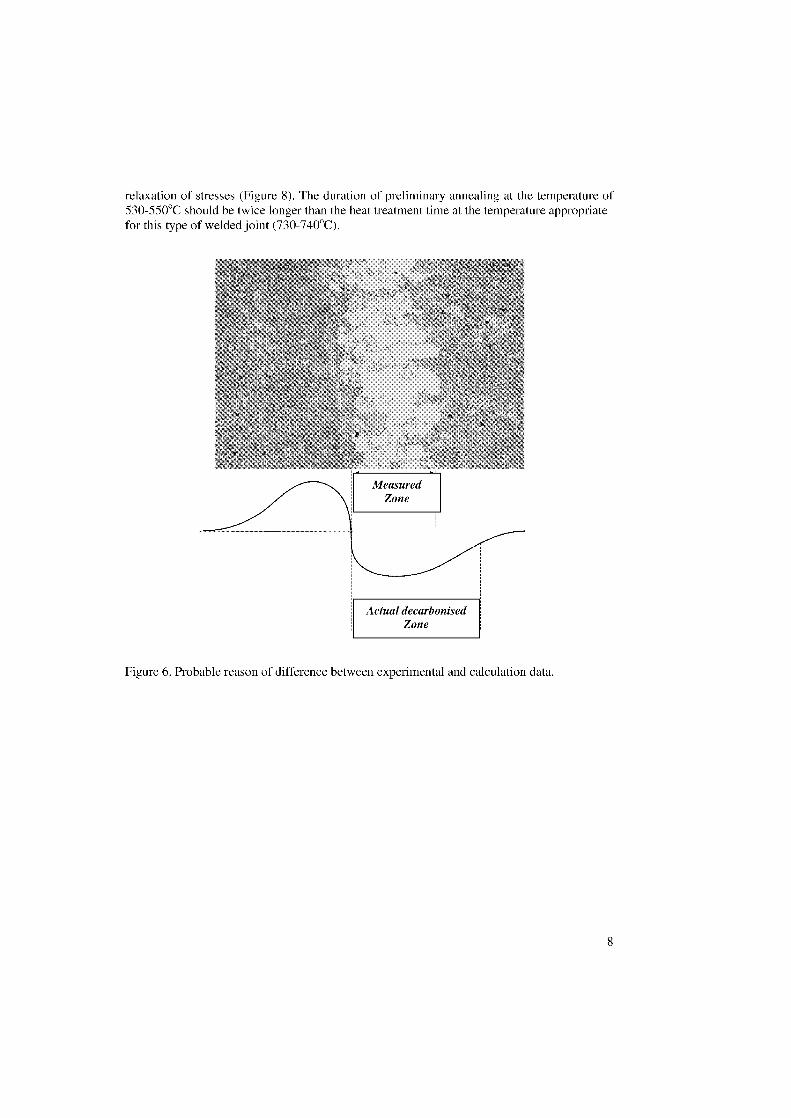
relaxation of stresses (Figure 8). The duration of preliminary annealing at the temperature of530-550°C should be twice longer than the heat treatment time at the temperature appropriatefor this type of welded joint (730-740°C).
Actual decarbonisedZone
Figure 6. Probable reason of difference between experimental and calculation data.
8
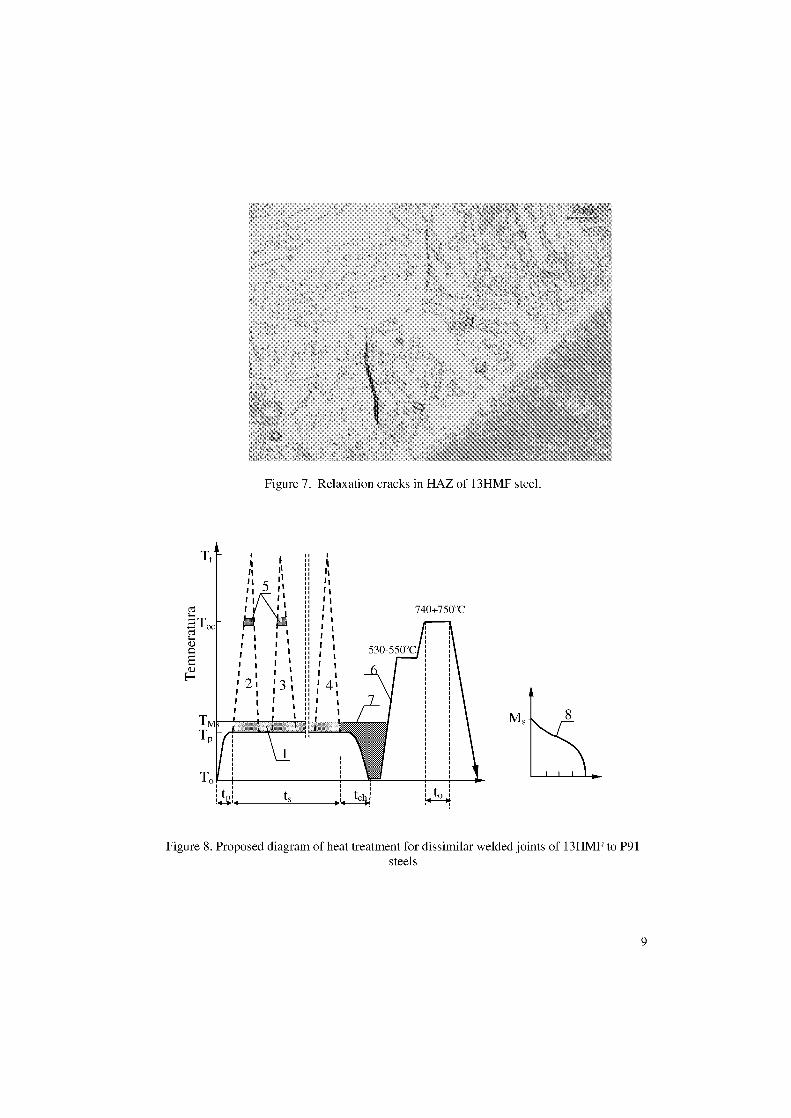
Figure 7. Relaxation cracks in HAZ of 13HMF steel.
I 11 I
4A
:1 4
►1 l► :: ►►
1►1ii 111 ::1 1 11 ►1: 11I 1 ►►
, 1c2 i i . ,I
1 qii 1 t2To, ii i tce 1 1 1 :: ► ►cu ► 1 i ►
740-750°C
i ►n 530-550°C.► e 1 1
► i 1 ► ,, i 1
cu 1: ►H
► , ► ►t ,, • ►1 21 11 3 1 H • 41► ► ,, • ►► 1 ► 1 ii 1 ►
1 1 1 ii 1 1T ►i
Figure 8. Proposed diagram of heat treatment for dissimilar welded joints of 13HMF to P91steels
9
6. Conclusions
It was unquestionably found out that the technologies of welding and heat treatment, whichare applied in the manufacturing process, in case of pipeline welded joints of 13HMF to P91steel, can be largely used in modemisation works of the existing standard boilers, as well asguarantee their full application for supercritical parameters Unit 13 which is to be erected atBelchatow Power Station [4,5].Introduction of P91 steel enables to decrease the design wall thickness of tubes, the weight ofsuperheaters and, thus, the investment and operational costs of a unit, with vast improvementof the unit efficiency, an condition that:
• the experiences regarding chosen techniques and technologies of welding 13HMFsteel to P91 steel tubes are made available to the power plant technical personnel,
• training shall be provided for welders from Belchatow Power Station, regarding therequired welding techniques of P91 steel.
7. References
[1]. Pasternak J., Hernas A., Milhiski P.: New martensitic steels for supercritical boilers.Energetyka No 4, 1997 (in Polish only).[2]. Hernas A., Ciega M., Niewielski G., Kielbus A., Lalik S: „Assessment of deliverycondition properties of selected new Cr-Mo-V-W-(Cu) steel grades used for Boiler tubes andtheir welded connections to be operated in supercritical parameters", Research work NB-200/RM-7/98, November 1998.[3]. Hernas A., Kielbus A., CieMa M., Rodak K.: „Assessment of large thickness weldedjoints made of P91, P92 steel grades and T23 base material", Research work P/IX-2/01,September 2001.[4] Tasak E., Hernas A.: Report No P/XII-4/ 2004, RAFAKO SA, Poland[5] Tasak E., Ziewiec A., Brzeziak: Przeglqd Spawalnictwa, nr 9, 2002[6]Pilous V., Stransky K.: Zvaranie 32, nr 8, 1983 i Zvaranie 33, nr 1 , 1984[7]Stransky K., Milion B., Kucera J.: Zvaranie 32, nr 1 1983
10
CREEP PROPERTIES OF HETEROGENEOUS P91/P23 WELDSAT 550 AND 600°C
Zden& Vlastimil Vodärek, Denisa Totgovä
VITKOVICE – Research and Development, Ltd., Ostrava, Czech [email protected]
Abstract
The experience indicates, that in majority of cases where high temperature failure of power plant componentsoccurs, defects predominate in the vicinity of weldments. P91 and P23 steels represent prospective materials forapplications in boilers of modern power plants. The use of heterogeneous welds made of these steels seems to beunavoidable. Practical application of such heterogeneous welds does require detailed knowledge about theircreep properties at design temperatures and stresses.
Heterogeneous welds made of tubes P91/P23 with dimension (1)219x25mm were prepared by combination ofGTAW and SMAW technologies. Two different filier materials were used: E CrMo91 B and Thyssen Cr2WV.The paper summarises results of creep rupture tests on crossweld specimens of heterogeneous welds P91/P23 attemperatures 550 and 600°C. Furthermore, results of metallographic investigations on longitudinal sections ofruptured test pieces and hardness profiles are discussed. The analysis of preferential failure locations ofheterogeneous welds in relation to the type of the filier material, temperature of testing and applied stress isperform ed.
Keywords: heterogeneous weld, P23 steel, P 91 steel, creep, microstructure
Introduction
The demand for the improvement of thermal efficiency of fossil fuelled power plants bymeans of increasing the operating parameters of boilers has recently led to the development ofnew creep-resistant steels like chromium modified steel grades T/P91 (X10 CrMoVNb 9-1according to EN 10216-2), E911 (X 11CrMoWVNb 9-1-1) and T/P92. They have improvedmechanical properties at high temperatures and in particular creep strength. The new gradesof low alloyed heat resistant steels T/P23 and T/P24 (7CrMoVTiB10-10) with substantiallyhigher creep resistance compared to the Grade 22 steel are designed for the water wall panelsfor USC boilers but can be also used for the superheaters of conventional boilers.
Mechanical properties including long-term creep resistance of all new boiler materials havebeen studied extensively and at the present time these steels are routinely used in constructionof the new as well as remedy of the existing power plant units. In all these structures it isinevitably necessary to make weldments, either among materials with the same chemicalcomposition or heterogeneous welds to join materials with different chemical composition. Asweldments are widely recognized as the life-limiting part of many high temperaturecomponents, special attention should be paid to the long-term creep behaviour of the welds.Moreover, the reliability of the heterogeneous welds is affected not only by the complex ofdesign, technology and service parameters [1], but also by the change of the chemicalcomposition through the weld joint due to the different chemical composition of theindividual bare metal [2, 3]. Therefore, it is necessary to study creep resistance, failure modeand failure locality of welded joint besides the parent materials.
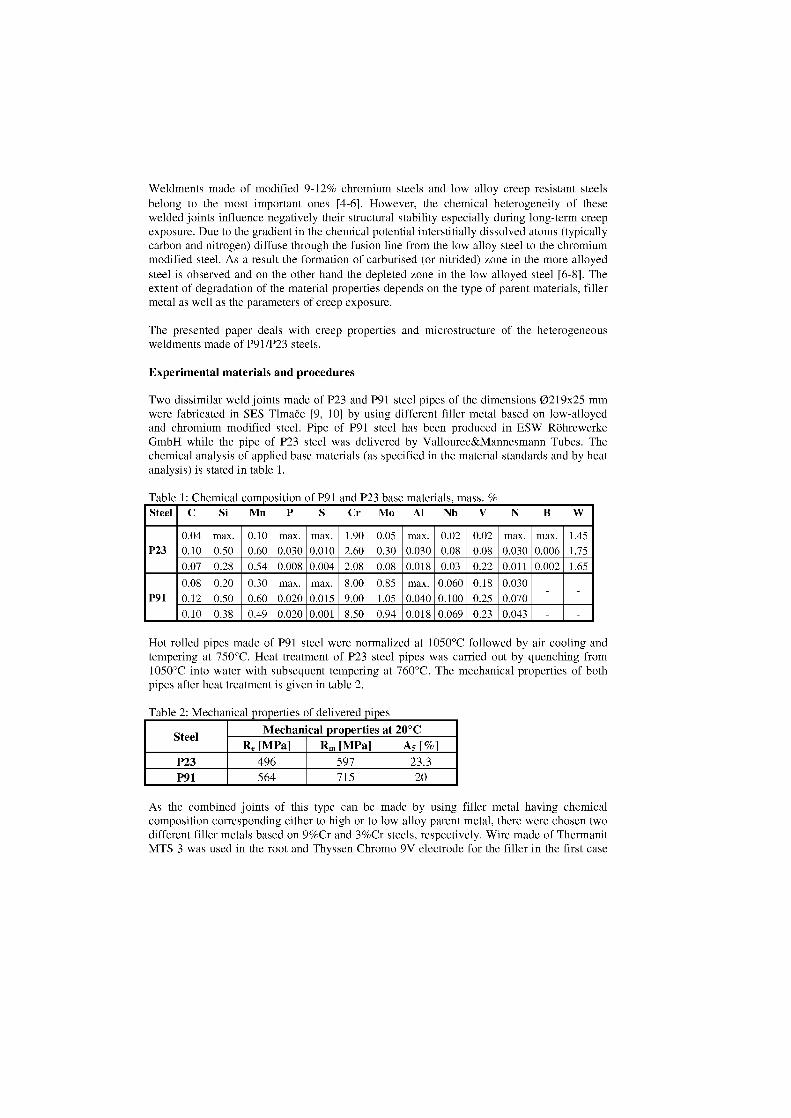
Weldments made of modified 9-12% chromium steels and low alloy creep resistant steelsbelong to the most important ones [4-6]. However, the chemical heterogeneity of therewelded joints influence negatively their structural stability especially during long-term creepexposure. Due to the gradient in the chemical potential interstitially dissolved atoms (typicallycarbon and nitrogen) diffuse through the fusion line from the low alloy steel to the chromiummodified steel. As a result the formation of carburised (or nitrided) zone in the more alloyedsteel is observed and on the other hand the depleted zone in the low alloyed steel [6-8]. Theextent of degradation of the material properties depends on the type of parent materials, fillermetal as well as the parameters of creep exposure.
The presented paper deals with creep properties and microstructure of the heterogeneousweldments made of P91/P23 steels.
Experimental materials and procedures
Two dissimilar weld joints made of P23 and P91 steel pipes of the dimensions 0219x25 mmwere fabricated in SES TlmaCe [9, 10] by using different filler metal based on low-alloyedand chromium modified steel. Pipe of P91 steel has been produced in ESW RöhrewerkeGmbH while the pipe of P23 steel was delivered by Vallourec&Mannesmann Tubes. Thechemical analysis of applied base materials (as specified in the material standards and by heatanalysis) is stated in table 1.
Table 1: Chemical composition of P91 and P23 base materials, mass. %Steel C Si Mn P S Cr Mo Al Nb V N BW
0.04 max. 0.10 max. max. 1.90 0.05 max. 0.02 0.02 max. max. 1.45P23 0.10 0.50 0.60 0.030 0.010 2.60 0.30 0.030 0.08 0.08 0.030 0.006 1.75
0.07 0.28 0.54 0.008 0.004 2.08 0.08 0.018 0.03 0.22 0.011 0.002 1.650.08 0.20 0.30 max. max. 8.00 0.85 max. 0.060 0.18 0.030
P91 0.12 0.50 0.60 0.020 0.015 9.00 1.05 0.040 0.100 0.25 0.0700.10 0.38 0.49 0.020 0.001 8.50 0.94 0.018 0.069 0.23 0.043 - -
Hot rolled pipes made of P91 steel were normalized at 1050°C followed by air cooling andtempering at 750°C. Heat treatment of P23 steel pipes was carried out by quenching from1050°C into water with subsequent tempering at 760°C. The mechanical properties of bothpipes after heat treatment is given in table 2.
Table 2: Mechanical properties of delivered pipes
SteelMechamcal properties at 20°C
Re [MPa] R„, IMPal A5 [%]
P23 496 597 23.3P91 564 715 20
As the combined joints of this type can be made by using filler metal having chemicalcomposition corresponding either to high or to low alloy parent metal, there were chosen twodifferent filier metals based on 9%Cr and 3%Cr steels, respectively. Wire made of ThermanitMTS 3 was used in the root and Thyssen Chromo 9V electrode for the filler in the first case
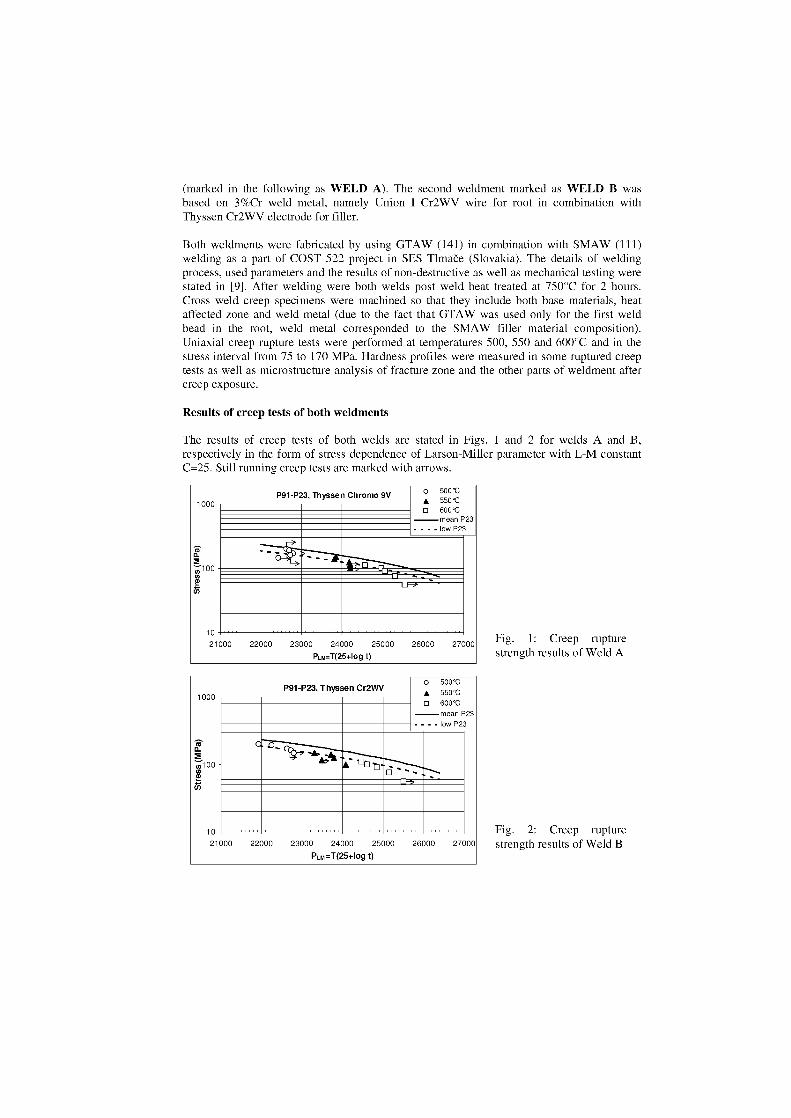
(marked in the following as WELD A). The second weldment marked as WELD B wasbased an 3%Cr weld metal, namely Union 1 Cr2WV wire for root in combination withThyssen Cr2WV electrode for filler.
Both weldments were fabricated by using GTAW (141) in combination with SMAW (111)welding as a part of COST 522 project in SES TlmaCe (Slovakia). The details of weldingprocess, used parameters and the results of non-destructive as well as mechanical testing werestated in [9]. After welding were both welds post weld heat treated at 750°C for 2 hours.Cross weld creep specimens were machined so that they include both base materials, heataffected zone and weld metal (due to the fact that GTAW was used only for the first weldbead in the root, weld metal corresponded to the SMAW filler material composition).Uniaxial creep rupture tests were performed at temperatures 500, 550 and 600°C and in thestress interval from 75 to 170 MPa. Hardness profiles were measured in some ruptured creeptests as well as microstructure analysis of fracture zone and the other parts of weldment aftercreep exposure.
Results of creep tests of both weldments
The results of creep tests of both welds are stated in Figs. 1 and 2 for welds A and B,respectively in the form of stress dependence of Larson-Miller parameter with L-M constantC=25. Still running creep tests are marked with arrows.
1 1000P91-P23, Thyssen Chromo 9V o 500 °C
♦ 550°Cq 600°C
mean P23
ra0.37,0 0 0
low P23
15",' 4 .. .• .•3 r1.—,.=-
c7)...g LH
1021000 22000 23000 24000 25000 26000 27000
Ptn=T(25+log t)
1 1000
0.100 -
e5
10
P91-P23, Thyssen Cr2WV°o 500 C
♦ 550°Cq 600°C
mean P23- - - - low P23
he.& ...
Ä- ilb(.... 0,
g z—
21000 22000 23000 24000 25000 26000 27000PLM=T(25+log t)
Fig. 1: Creep rupturestrength results of Weld A
Fig. 2: Creep rupturestrength results of Weld B
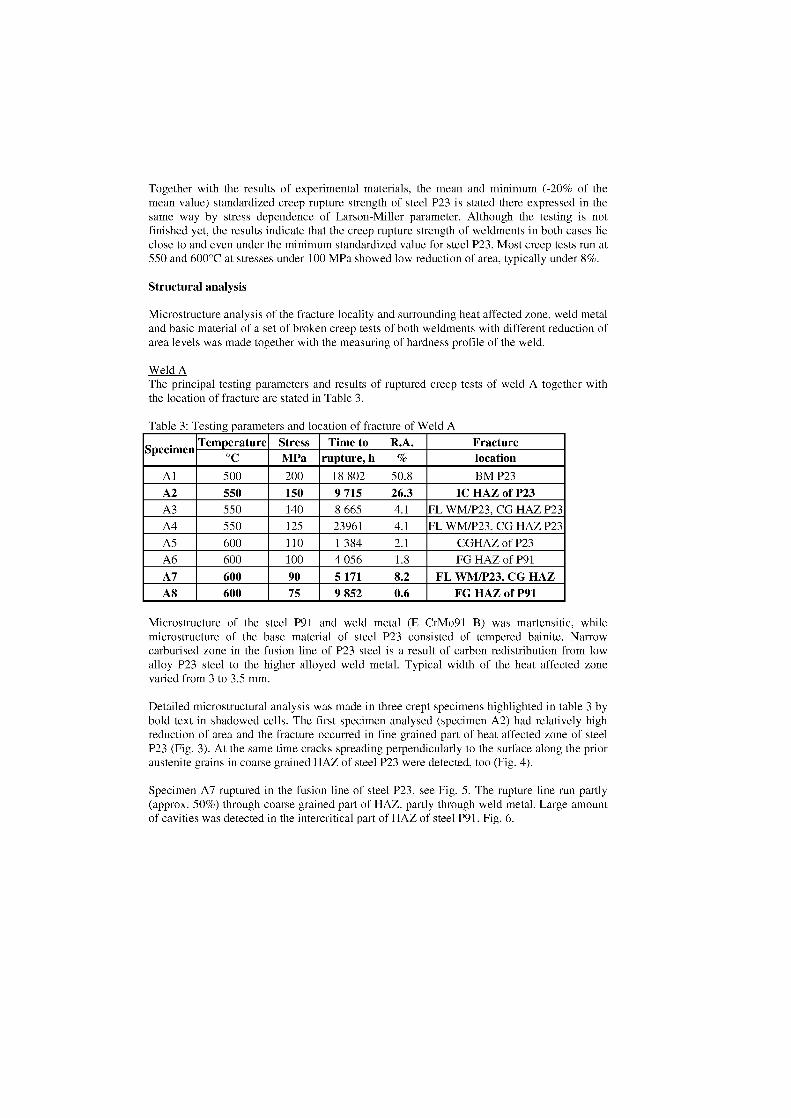
Together with the results of experimental materials, the mean and minimum (-20% of themean value) standardized creep rupture strength of steel P23 is stated there expressed in thesame way by stress dependence of Larson-Miller parameter. Although the testing is notfinished yet, the results indicate that the creep rupture strength of weldments in both cases liedose to and even under the minimum standardized value for steel P23. Most creep tests run at550 and 600°C at stresses under 100 MPa showed low reduction of area, typically under 8%.
Structural analysis
Microstructure analysis of the fracture locality and surrounding heat affected zone, weld metaland basic material of a set of broken creep tests of both weldments with different reduction ofarea levels was made together with the measuring of hardness profile of the weld.
Weld A The principal testing parameters and results of ruptured creep tests of weld A together withthe location of fracture are stated in Table 3.
Table 3: Testing parameters and location of fracture of Weld A
SpecimeneT mperature Stress Time to R.A. Fracture
°C MPa rupture, h % location
Al 500 200 18 802 50.8 BM P23
A2 550 150 9 715 26.3 IC HAZ of P23A3 550 140 8 665 4.1 FL WM/P23, CG HAZ P23A4 550 125 23961 4.1 FL WM/P23, CG HAZ P23
A5 600 110 1 384 2.1 CGHAZ of P23A6 600 100 4 056 1.8 FG HAZ of P91
A7 600 90 5 171 8.2 FL WM/P23, CG HAZA8 600 75 9 852 0.6 FG HAZ of P91
Microstructure of the steel P91 and weld metal (E CrMo9l B) was martensitic, whilemicrostructure of the base material of steel P23 consisted of tempered bainite. Narrowcarburised zone in the fusion line of P23 steel is a result of carbon redistribution from lowalloy P23 steel to the higher alloyed weld metal. Typical width of the heat affected zonevaried from 3 to 3.5 mm.
Detailed microstructural analysis was made in three crept specimens highlighted in table 3 bybold text in shadowed cells. The first specimen analysed (specimen A2) had relatively highreduction of area and the fracture occurred in fine grained part of heat affected zone of steelP23 (Fig. 3). At the same time cracks spreading perpendicularly to the surface along the prioraustenite grains in coarse grained HAZ of steel P23 were detected, too (Fig. 4).
Specimen A7 ruptured in the fusion line of steel P23, see Fig. 5. The rupture line run partly(approx. 50%) through coarse grained part of HAZ, partly through weld metal. Large amountof cavities was detected in the intercritical part of HAZ of steel P91, Fig. 6.
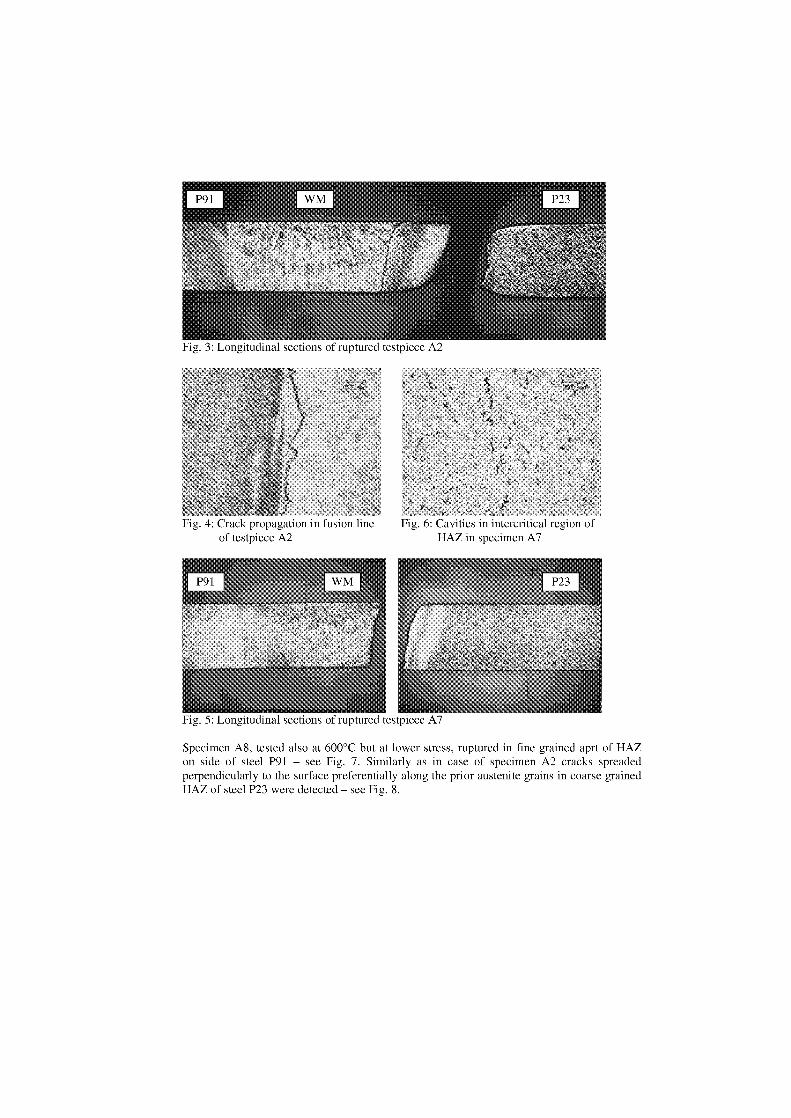
Fig. 3: Longitudinal sections of ruptured testpiece A2
hg. 4: Crack propagation in fusion lineof testpiece A2
Fig. 6: Cavities in intercritical region ofHAZ in specimen A7
Fig. 5: Longitudinal sections of ruptured testpiece A7
Specimen A8, tested also at 600°C but at lower stress, ruptured in fine grained aprt of HAZan side of steel P91 — see Fig. 7. Similarly as in case of specimen A2 cracks spreadedperpendicularly to the surface preferentially along the prior austenite grains in coarse grainedHAZ of steel P23 were detected — see Fig. 8.
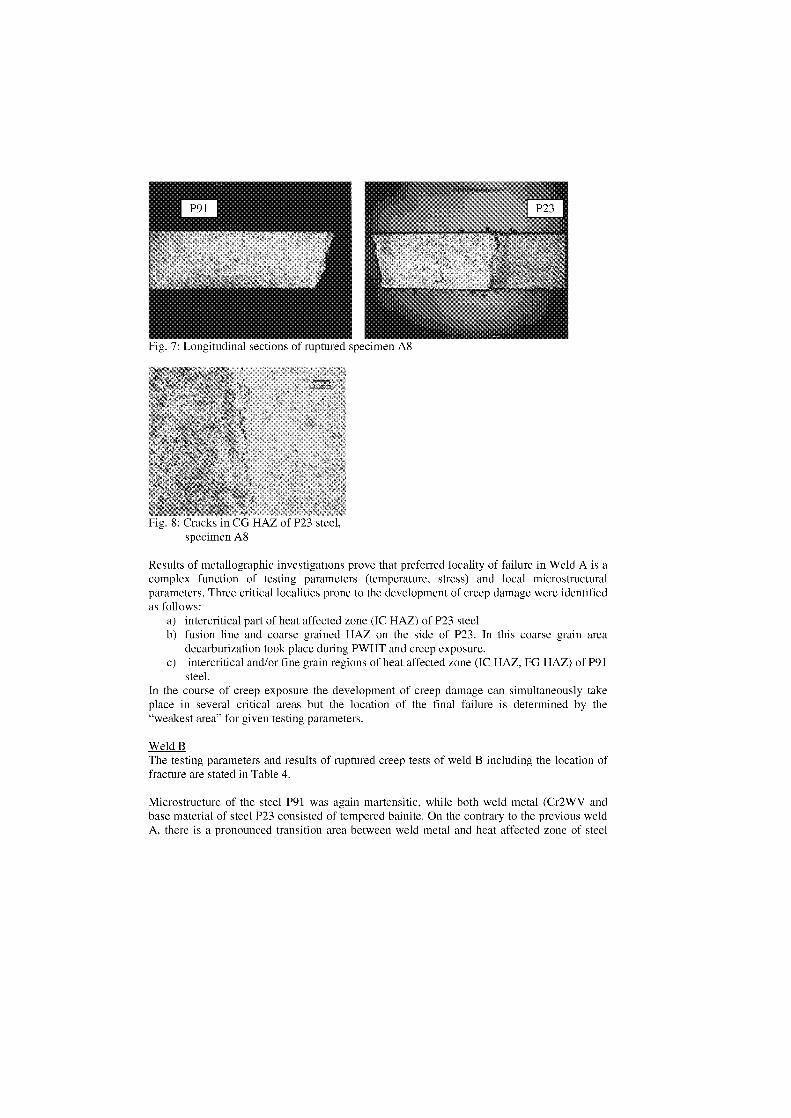
Fig. 7: Longitudinal sections of ruptured specimen A8
Fig. 8: Cracks in CG HAZ of P23 steel,specimen A8
Results of metallographic investigations prove that preferred locality of failure in Weld A is acomplex function of testing parameters (temperature, stress) and local microstructuralparameters. Three critical localities prone to the development of creep damage were identifiedas follows:
a) intercritical part of heat affected zone (1C HAZ) of P23 steelb) fusion line and coarse grained HAZ an the side of P23. In this coarse grain area
decarburization took place during PWHT and creep exposure.c) intercritical and/or fine grain regions of heat affected zone (1C HAZ, FG HAZ) of P91
steel.In the coarse of creep exposure the development of creep damage can simultaneously takeplace in several critical areas but the location of the final failure is determined by the"weakest area" for given testing parameters.
Weld B The testing parameters and results of ruptured creep tests of weld B including the location offracture are stated in Table 4.
Microstructure of the steel P91 was again martensitic, while both weld metal (Cr2WV andbase material of steel P23 consisted of tempered bainite. On the contrary to the previous weldA, there is a pronounced transition area between weld metal and heat affected zone of steel
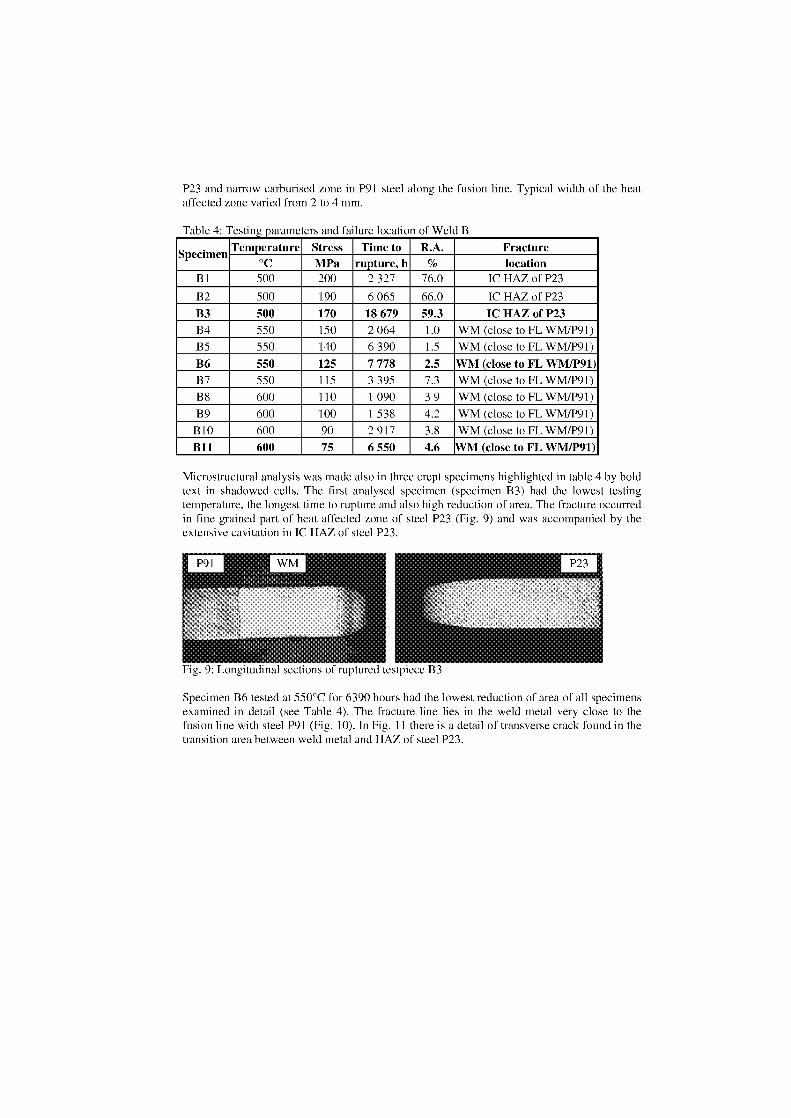
P23 and narrow carburised zone in P91 steel along the fusion line. Typical width of the heataffected zone varied from 2 to 4 mm.
Table 4: Testing parameters and failure location of Weld B
Specimene. T mperature Stress Time to R.A. Fracture
°C MPa rupture, h % locationB1 500 200 2 327 76.0 IC HAZ of P23
B2 500 190 6 065 66.0 IC HAZ of P23
B3 500 170 18 679 59.3 IC HAZ of P23B4 550 150 2 064 1.0 WM (dose to FL WM/P91)B5 550 140 6 390 1.5 WM (dose to FL WM/P91)
B6 550 125 7 778 2.5 WM (dose to FL WM/P91)B7 550 115 3 395 7.3 WM (close to FL WM/P91)B8 600 110 1 090 3 9 WM (dose to FL WM/P91)
B9 600 100 1 538 4.2 WM (close to FL WM/P91)B10 600 90 2 917 3.8 WM (dose to FL WM/P91)
B11 600 75 6 550 4.6 WM (dose to FL WM/P91)
Microstructural analysis was made also in three crept specimens highlighted in table 4 by boldtext in shadowed cells. The first analysed specimen (specimen B3) had the lowest testingtemperature, the longest time to rupture and also high reduction of area. The fracture occurredin fine grained part of heat affected zone of steel P23 (Fig. 9) and was accompanied by theextensive cavitation in IC HAZ of steel P23.
Fig. 9: Longitudinal sections of ruptured testpiece B3
Specimen B6 tested at 550°C for 6390 hours had the lowest reduction of area of all specimensexamined in detail (see Table 4). The fracture line lies in the weld metal very dose to thefusion line with steel P91 (Fig. 10). In Fig. 11 there is a detail of transverse crack found in thetransition area between weld metal and HAZ of steel P23.
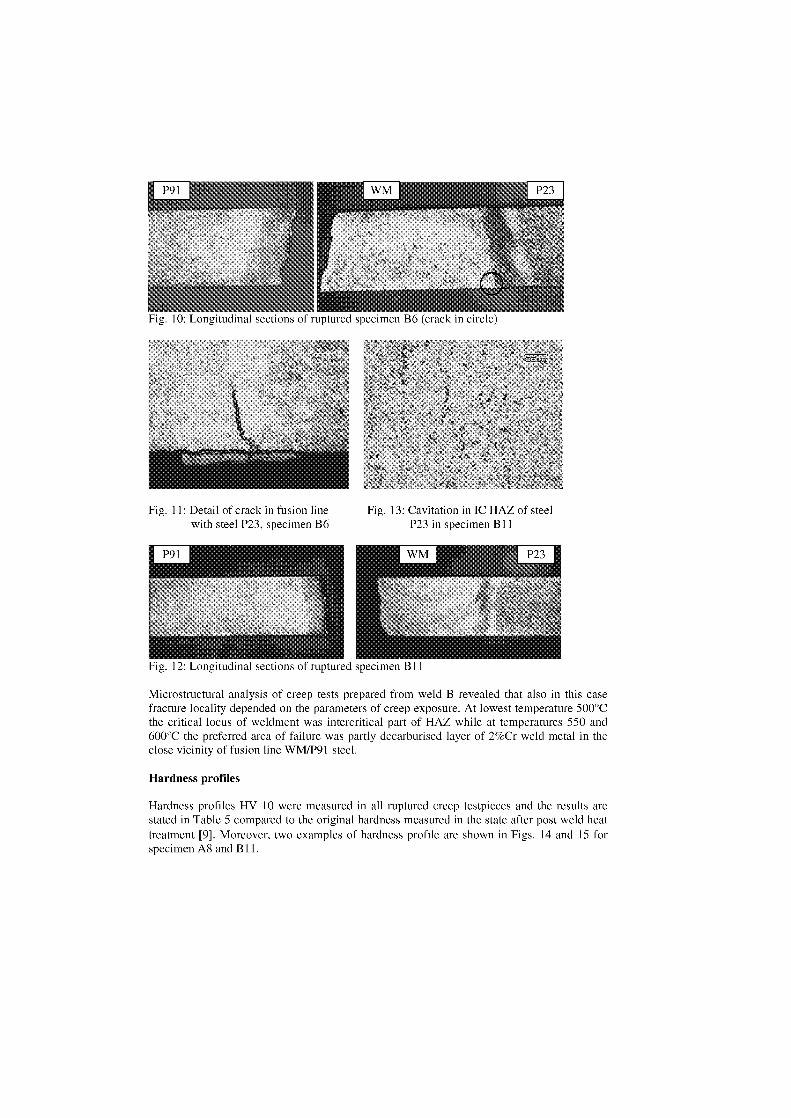
P91
Fig. 10: Longitudinal sections of specimen B6 (crack in circle)
Fig. 11: Detail of crack in fusion line Fig. 13: Cavitation in IC HAZ of steel
with steel P23, specimen B6
P23 in specimen B11
Fig. 12: Longitudinal sections of ruptured specimen B11
Microstructural analysis of creep tests prepared from weld B revealed that also in this casefracture locality depended an the parameters of creep exposure. At lowest temperature 500°Cthe critical locus of weldment was intercritical part of HAZ while at temperatures 550 and600°C the preferred area of failure was partly decarburised layer of 2%Cr weld metal in thedose vicinity of fusion line WM/P91 steel.
Hardness profiles
Hardness profiles HV 10 were measured in all ruptured creep testpieces and the results arestated in Table 5 compared to the original hardness measured in the state after post weld heattreatment [9]. Moreover, two examples of hardness profile are shown in Figs. 14 and 15 forspecimen A8 and B11.
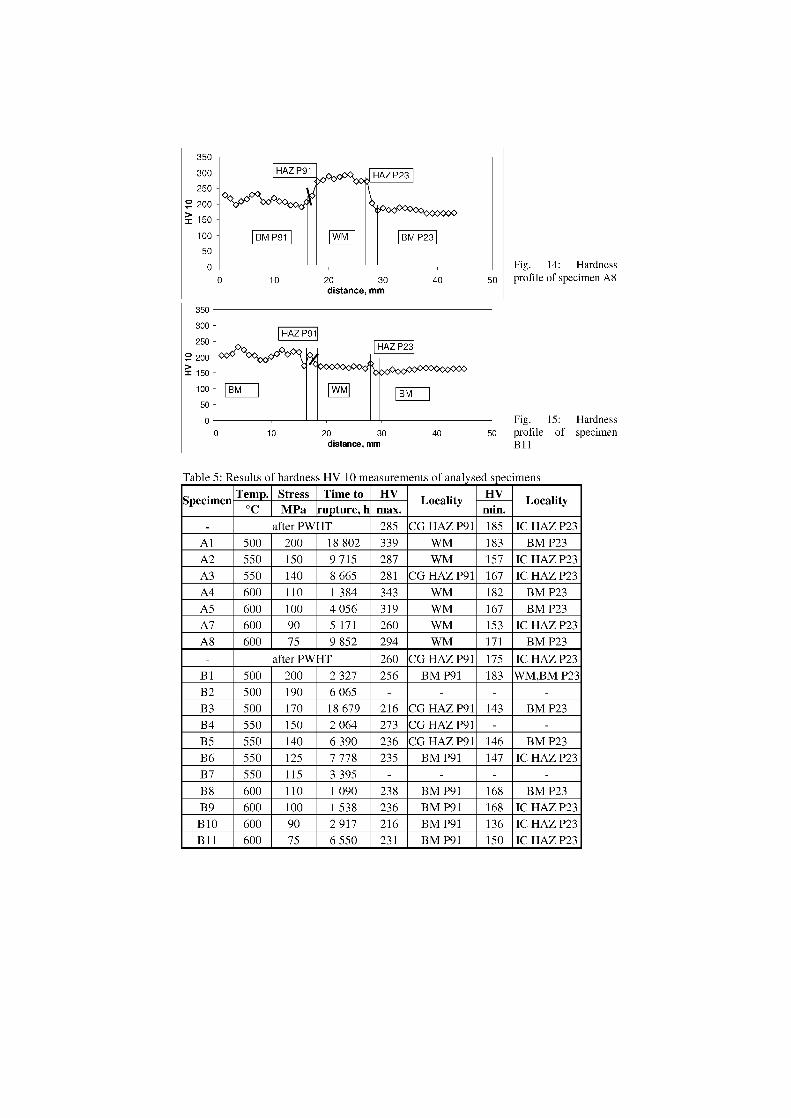
HAZ P91 HAZ P23
••..••••••...,•••
I BM P91 I WM BM P23
0 10 20 30 40 50distance, mm
350300250
2 20015010050
0
350300 -250 -
° 200= 150 -
10050
I HAZ P91•• • ••.••• •••••• • •
BM I virvi
0
HAZ P23
BM I
0 10 20 30 40 50distance, mm
Fig. 14: Hardnessprofile of specimen A8
Fig. 15: Hardnessprofile of specimenB11
Table 5: Results of hardness HV 10 measurements of analysed specimens
Specimen Temp. Stress Time to HV Locality HV Locality°C MPa rupture, h max. min.
- after PWHT 285 CG HAZ P91 185 IC HAZ P23
Al 500 200 18 802 339 WM 183 BM P23
A2 550 150 9 715 287 WM 157 IC HAZ P23A3 550 140 8 665 281 CG HAZ P9I 167 IC HAZ P23A4 600 110 1 384 343 WM 182 BM P23A5 600 100 4 056 319 WM 167 BM P23A7 600 90 5 171 260 WM 153 IC HAZ P23A8 600 75 9 852 294 WM 171 BM P23
after PWHT 260 CG HAZ P91 175 IC HAZ P23B1 500 200 2 327 256 BM P91 183 WM,BM P23B2 500 190 6 065 - - - -B3 500 170 18 679 216 CG HAZ P9I 143 BM P23B4 550 150 2 064 273 CG HAZ P91 - -B5 550 140 6 390 236 CG HAZ P91 146 BM P23B6 550 125 7 778 235 BM P9I 147 IC HAZ P23B7 550 115 3 395 - - - -B8 600 110 1 090 238 BM P9I 168 BM P23B9 600 100 1 538 236 BM P91 168 IC HAZ P23
BIO 600 90 2 917 216 BM P9I 136 IC HAZ P23B11 600 75 6 550 231 BM P91 150 IC HAZ P23

Weld metal is the part of Weld A where the maximum hardness was found in most cases,while in Weld B it was either base metal of steel P91 or coarse grained part of HAZ in steelP91. The weakest part of weldment is then mostly the intercritical part of heat affected zoneof steel P23 and in some cases also base metal of steel P23. In weld A the weakest part of theweldment corresponded to the failure locality. On the contrary, the most rupture loci in weldB was not the place of minimum hardness, which is typically IC HAZ of steel P23, but thedecarburised part of weld metal adjacent to steel P91 (Fig. 15).So far, there is no detectable dependence of hardness HV 10 an the testing parameters ofcreep tests, although the clear secondary hardening of 9Cr-1 Mo weld metal in weld A isevident at least at shorter times to rupture. No such clear evidence of secondary hardening canbe found in weld B, as the only case where the hardness was higher after creep exposure thanafter welding was specimen B4 tested at 550°C/150 MPa for 2064 hours. Hardnessmeasurement of minimum values in intercritical part of HAZ or base metal of steel P23 didnot revealed signs of secondary hardening in both welds. The only exception was testpiece B1(500°C/200 MPa/2327 h).
Summary and conclusion
The results of creep tests of two dissimilar weld joints made of P91 and P23 steels with either9Cr-lMo base weld metal (THYSSEN Chromo 9V – weld A) or 2Cr-W-Mo (THYSSENCr2WV – weld B) conformed that:
■ creep rupture strength of both welds lie dose to the lower bound of ±20% scatterbandround the mean creep rupture strength curve of steel P23
■ low reduction of area (below 8%) is typical for creep tests run at 550 and 600°C atstresses lower than 100 MPa
■ creep deformation and final fracture occurred in several critical parts of weldmentaccording to the creep exposure parameters, namely:
- IC HAZ of steel P23
- dose to the fusion line between weld metal and P23 steel (weld A)
- dose to the fusion line between weld metal and P91 steel (weld B)
- IC HAZ and FG HAZ of steel P91
■ creep deformation can develop simultaneously in several parts of weldment, fracturethen occurs in the "weakest" locality, which has not to be necessarily the locus withthe lowest hardness values
■ in order to get relevant information about deformation and failure mechanisms ofheterogeneous weldments of advanced creep resistant steels, it is necessary to prolongthe creep testing of both weldments at stresses that are comparable to those used inreal high temperature components.
Acknowledgement
The authors would like to express thanks to Ministry of Education, Youth and Sport of CzechRepublic for the financial support in the frame of the projects 00099 and OC 100.
References[1] Price, A. T., Williams, J. A.: The Influence of Welding an the Creep Rupture Properties
of Steeels, in Recent Advances in Creep and Fracture of Engineering Materials andStructures, Ed. B. Wilshire, D.R.J. Owen, Pineridge Press, Swansea, U.K., 1982, p. 265
[2] Kuüera, J., Million, B., Stränsky,K.: Chemical Diffusion of Al, Cr, Fe, Ni in SteelWeldments in the Temperature Range of 500-1100 Degrees C. Kovove Mater. 41, 2003,p. 325
[3] Bhadeshia, H.K.D.H.: Design of Heat Resistant Alloys for the Energy Industries, inParsons 2000—Advanced Materials for 21 st Century Turbines and Power Plants, IOM,London, U. K., 2000, p. 1
[4] Laha, K., et al.: Comparison of Creep Behaviour of 2.25Cr-lMo/9Cr-lMo DissimilarWeld Joint with its Base and Weld Metals, Material Science and Technology, 17, 2001,p. 1285
[5] Allen, D. J.: Creep Performance of Dissimilar P91 to Low Alloy Weldments, in Parsons2003, Engineering Issues in Turbine Machinery, Power Plant and Renewables, IOM,London, UK., 2003, p. 281
[6] Kozeschnik, E.: Dissimilar 2.25Cr/9Cr and 2Cr/0.5CrMoV Steel Welds, Science andTechnology of Welding and Joining, 7, 2002, p. 63
[7] Vodirek, V. Fyzikälni metalurgie modifikovanYch (9-12)%Cr ocelf, Ostrava, VSB TUO,2003, p. 169
[8] Pilous, V., Stränsky, K.: Strukturnf stälost svarovych spojü pro energetiku, StudieCSAV, Academia Praha, 1989
[9] Pecha, J., Bcp'ansky, J.: Welding of similar and dissimilar steels, COST 536 ProgressReport, SES Tlmaüe-WRI Bratislava, 2002
[10] Pecha, J., Kaszäsovä, E., Boboniü, M.: Welding test welds steel P23 and steel P23 withsteel P91, COST 536 Progress Report, SES Tlmaüe, 2002

STRUCTURAL STABILITY OF HETEROGENEOUS WELD JOINT OF6CrMoV 8-3-2 AND X12CrMoV 10-1 STEELS WITH INCREASED
NITROGEN CONTENT
Rudolf Foret Bronislav Zlämal Sopougek b , Jiri Bußik
Brno University of Technology, b Masaryk University,Institute of Physics of Materials, AS CR; Czech Republic
föret(cifme.v-utbr.cz; sopousek(Wcherni.munixz; bursik(iijp.m.ez
Abstract
Heterogeneous weld joints of creep-resistant steels are used with increasing frequency in the construction of newor repair and reconstruction of existing facilities of power generating and chemical industries. The structuralinstability of these weld joints appearing during PWHT and in the course of subsequent Operation shows bycarbon redistribution and subsequent sequence of changes in the structure that lead to the formation of a carbonand nitrogen-depleted zone (CNDZ) in low-alloy steel and, on the contrary, the appearance of a carbon- andnitrogen-enriched zone (CNEZ) in high-alloy steel, with the differences in chromium content having the greatestsignificance. The paper includes the results of a study of structural changes taking place in laboratory weld jointsof the 6CrMoV 8-3-2 (T25) and X12CrMoVNb 10-1 (P91) steels annealed at temperatures of 600 and 900 °C.The nitrogen content in both steels was increased by ion-nitriding and subsequent homogenization. Carbon andnitrogen redistribution measurement by the EPMA method was complemented with detailed structural analysesaimed at the phase and chemical composition of coexisting carbides and carbonitrides.Results of experimental work were compared with thermodynamic and kinetic calculations using theThermo-Calc and DICTRA software. A good agreement between the calculations and the experiments wasobtained in particular for the phase composition of individual areas of the weld joints.
Keywords: creep-resistant steel, weld joints, structural analyses, thermodynamic and kineticmodelling, carbon and nitrogen redistribution
Introduction
Structural stability of dissimilar welds of creep-resistant steelsAn integral part of the development of creep-resistant steels with ferritic matrix is the study ofthe degradation processes occurring during their Operation in power generating and chemicalplants, inclusive of the structural instability of both the steels themselves and their weld joints.The term structural instability usually refers to the successive microstructural changestowards equilibrium state, when the Gibbs energy is minimal and when in creep-resistantsteels the metastable minority phases dissolve and the stable ones precipitate, and the densityof dislocations and the size of grain boundary area (phase interface) decrease. An example ofthe effect of structural instability on the creep properties of some modified 9-12% Cr steels isthe sigmoidal form of the stress-rupture plots [1].
In view of the exhausted service life of a number of power generating blocks (2 x 10⁵ andmore hours of Operation) and with regard to the growing power demand, increased capitalinvestment activities are expected in the area of constructing conventional power plants. It canbe expected that in the construction of new power generating blocks and in the reconstructionof existing blocks attention will focus on increasing their efficiency, which will entailcontinuous development of creep-resistant steels with ferritic matrix, as given, for example, in[2, 3]. Both nuclear and conventional power plants are complex systems, in which it ispractically impossible to rule out welding different kinds of creep-resistant steel. In the Gase
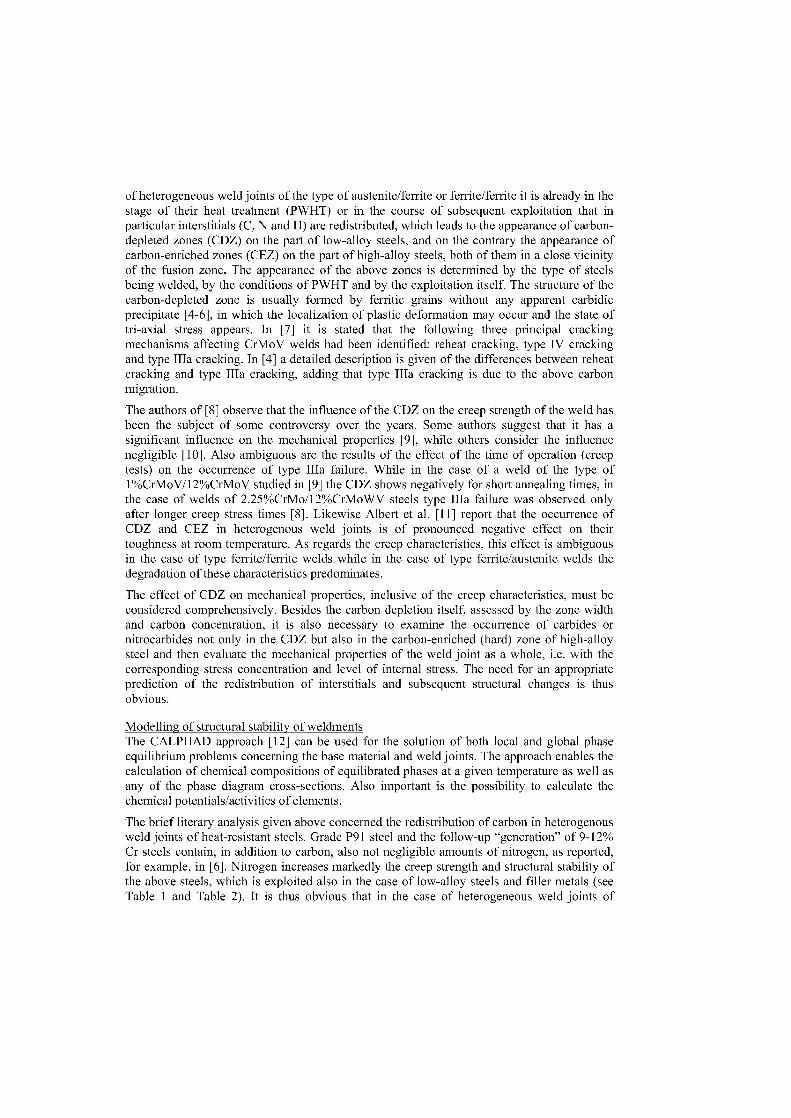
of heterogeneous weld joints of the type of austenite/ferrite or ferrite/ferrite it is already in thestage of their heat treatment (PWHT) or in the course of subsequent exploitation that inparticular interstitials (C, N and H) are redistributed, which leads to the appearance of carbon-depleted zones (CDZ) on the part of low-alloy steels, and on the contrary the appearance ofcarbon-enriched zones (CEZ) on the part of high-alloy steels, both of them in a dose vicinityof the fusion zone. The appearance of the above zones is determined by the type of steelsbeing welded, by the conditions of PWHT and by the exploitation itself. The structure of thecarbon-depleted zone is usually formed by ferritic grains without any apparent carbidicprecipitate [4-6], in which the localization of plastic deformation may occur and the state oftri-axial stress appears. In [7] it is stated that the following three principal crackingmechanisms affecting CrMoV welds had been identified: reheat cracking, type IV crackingand type lila cracking. In [4] a detailed description is given of the differences between reheatcracking and type lila cracking, adding that type lila cracking is due to the above carbonmigration.
The authors of [8] observe that the influence of the CDZ on the creep strength of the weld hasbeen the subject of some controversy over the years. Some authors suggest that it has asignificant influence on the mechanical properties [9], while others consider the influencenegligible [10]. Also ambiguous are the results of the effect of the time of operation (creeptests) on the occurrence of type lila failure. While in the case of a weld of the type of1%CrMoV/12%CrMoV studied in [9] the CDZ Shows negatively for short annealing times, inthe case of welds of 2.25%CrMo/12%CrMoWV steels type lila failure was observed onlyafter longer creep stress times [8]. Likewise Albert et al. [11] report that the occurrence ofCDZ and CEZ in heterogenous weld joints is of pronounced negative effect on theirtoughness at room temperature. As regards the creep characteristics, this effect is ambiguousin the case of type ferrite/ferrite welds while in the case of type ferrite/austenite welds thedegradation of these characteristics predominates.
The effect of CDZ on mechanical properties, inclusive of the creep characteristics, must beconsidered comprehensively. Besides the carbon depletion itself, assessed by the zone widthand carbon concentration, it is also necessary to examine the occurrence of carbides ornitrocarbides not only in the CDZ but also in the carbon-enriched (hard) zone of high-alloysteel and then evaluate the mechanical properties of the weld joint as a whole, i.e. with thecorresponding stress concentration and level of internal stress. The need for an appropriateprediction of the redistribution of interstitials and subsequent structural changes is thusobvious.
Modelling of structural stability of weldments The CALPHAD approach [12] can be used for the solution of both local and global phaseequilibrium problems concerning the base material and weld joints. The approach enables thecalculation of chemical compositions of equilibrated phases at a given temperature as well asany of the phase diagram cross-sections. Also important is the possibility to calculate thechemical potentials/activities of elements.
The brief literary analysis given above concerned the redistribution of carbon in heterogenousweld joints of heat-resistant steels. Grade P91 steel and the follow-up "generation" of 9-12%Cr steels contain, in addition to carbon, also not negligible amounts of nitrogen, as reported,for example, in [6]. Nitrogen increases markedly the creep strength and structural stability ofthe above steels, which is exploited also in the case of low-alloy steels and filler metals (seeTable 1 and Table 2). It is thus obvious that in the case of heterogeneous weld joints of
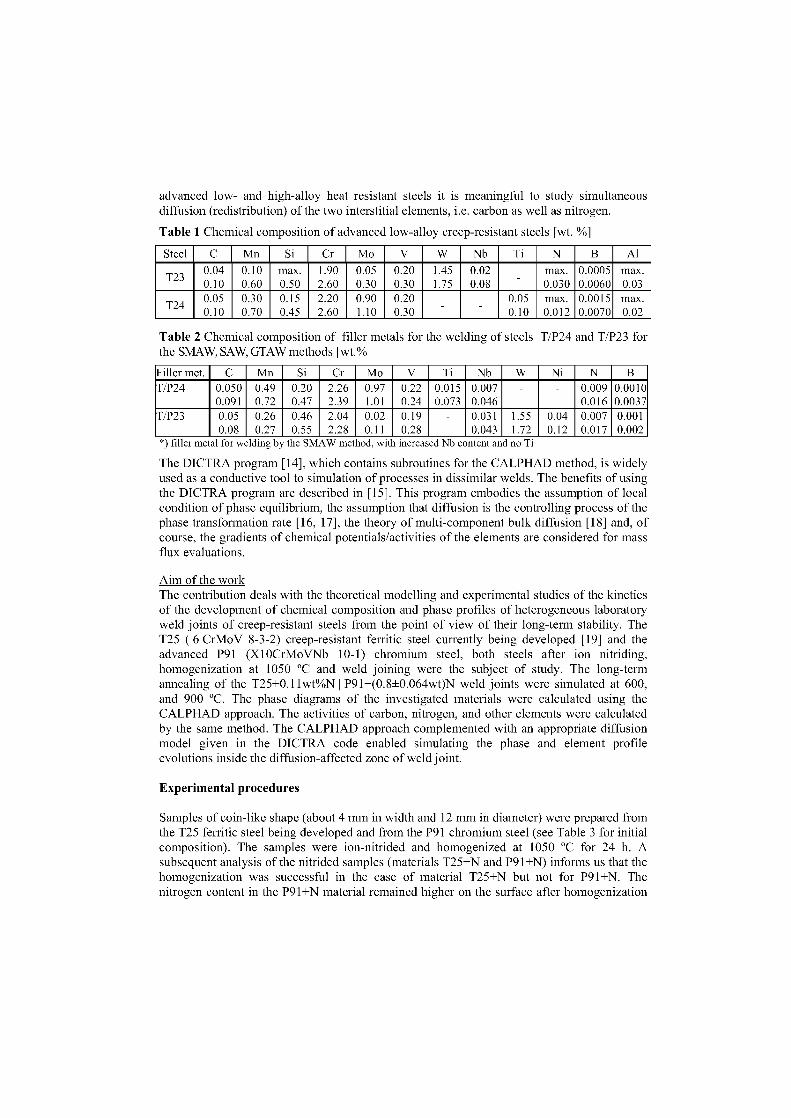
advanced low- and high-alloy heat resistant steels it is meaningful to study simultaneousdiffusion (redistribution) of the two interstitial elements, i.e. carbon as well as nitrogen.
Table 1 Chemical composition of advanced low-alloy creep-resistant steels [wt. %]
Steel C Mn Si Cr Mo V W Nb Ti N B Al
T23 0 04'0.10
0.100.60
max.0.50
1.902.60
0.050.30
0.200.30
1.451.75
0.020.08
- max.0.030
0.00050.0060
max.0.03
T240 05
'0.10
0.300.70
0.150.45
2.202.60
0.901.10
0.200.30
- -0.050.10
max.0.012
0.00150.0070
max.0.02
Table 2 Chemical composition of filler metals for the welding of steels T/P24 and T/P23 forthe SMAW, SAW, GTAW methods [wt %]
Filler met. C Mn Si Cr Mo V Ti Nb W Ni N BT/P24 0.050 0.49 0.20 2.26 0.97 0.22 0.015 0.007 0.009 0.0010
0.091 0.72 0.47 2.39 1.01 0.24 0.073 0.046 0.016 0.0037T/P23 0.05 0.26 0.46 2.04 0.02 0.19 0.031 1.55 0.04 0.007 0.001
0.08 0.27 0.55 2.28 0.11 0.28 0.043 1.72 0.12 0.017 0.002*) filier metal for welding by the SMAW method, with increased Nb content and no Ti
The DICTRA program [14], which contains subroutines for the CALPHAD method, is widelyused as a conductive tool to simulation of processes in dissimilar welds. The benefits of usingthe DICTRA program are described in [15]. This program embodies the assumption of localcondition of phase equilibrium, the assumption that diffusion is the controlling process of thephase transformation rate [16, 17], the theory of multi-component bulk diffusion [18] and, ofcourse, the gradients of chemical potentials/activities of the elements are considered for massflux evaluations.
Aim of the workThe contribution deals with the theoretical modelling and experimental studies of the kineticsof the development of chemical composition and phase profiles of heterogeneous laboratoryweld joints of creep-resistant steels from the point of view of their Jong-term stability. TheT25 ( 6 CrMoV 8-3-2) creep-resistant ferritic steel currently being developed [19] and theadvanced P91 (X10CrMoVNb 10-1) chromium steel, both steels after ion nitriding,homogenization at 1050 °C and weld joining were the subject of study. The long-termannealing of the T25+0.11wt%N1P91+(0.8±0.064wt)N weld joints were simulated at 600,and 900 °C. The phase diagrams of the investigated materials were calculated using theCALPHAD approach. The activities of carbon, nitrogen, and other elements were calculatedby the same method. The CALPHAD approach complemented with an appropriate diffusionmodel given in the DICTRA code enabled simulating the phase and element profileevolutions inside the diffusion-affected zone of weld joint.
Experimental procedures
Samples of coin-like shape (about 4 mm in width and 12 mm in diameter) were prepared fromthe T25 ferritic steel being developed and from the P91 chromium steel (see Table 3 for initialcomposition). The samples were ion-nitrided and homogenized at 1050 °C for 24 h. Asubsequent analysis of the nitrided samples (materials T25+N and P91+N) informs us that thehomogenization was successful in the Gase of material T25+N but not for P91+N. Thenitrogen content in the P91+N material remained higher an the surface after homogenization
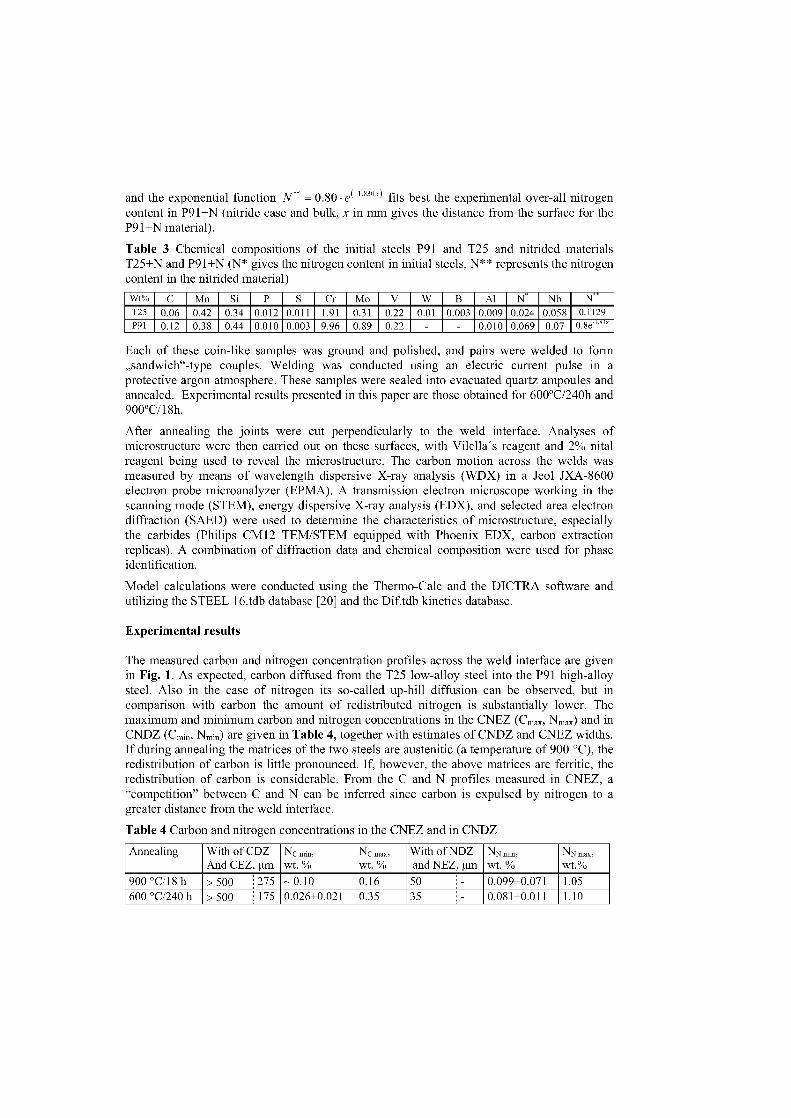
and the exponential function N** = 0.80 • e ( ") fits best the experimental over-all nitrogencontent in P91+N (nitride case and bulk, x in mm gives the distance from the surface for theP91+N material).
Table 3 Chemical compositions of the initial steels P91 and T25 and nitrided materialsT25+N and P91+N (N* gives the nitrogen content in initial steels, N** represents the nitrogencontent in the nitrided material)
Wt% C Mn Si P S Cr Mo V W B Al Nb N**T25 0.06 0.42 0.34 0.012 0.011 1.91 0.31 0.22 0.01 0.003 0.009 0.024 0.058 0.1129
P91 0.12 0.38 0.44 0.010 0.003 9.96 0.89 0.22 - - 0.010 0.069 0.07 0.8e-'
Each of these coin-like samples was ground and polished, and pairs were welded to form„sandwich"-type couples. Welding was conducted using an electric current pulse in aprotective argon atmosphere. These samples were sealed into evacuated quartz ampoules andannealed. Experimental results presented in this paper are those obtained for 600°C/240h and900°C/18h.
After annealing the joints were cut perpendicularly to the weld interface. Analyses ofmicrostructure were then carried out an these surfaces, with Vilella's reagent and 2% nitalreagent being used to reveal the microstructure. The carbon motion across the welds wasmeasured by means of wavelength dispersive X-ray analysis (WDX) in a Jeol JXA-8600electron probe microanalyzer (EPMA). A transmission electron microscope working in thescanning mode (STEM), energy dispersive X-ray analysis (EDX), and selected area electrondiffraction (SAED) were used to determine the characteristics of microstructure, especiallythe carbides (Philips CM12 TEM/STEM equipped with Phoenix EDX, carbon extractionreplicas). A combination of diffraction data and chemical composition were used for phaseidentification.
Model calculations were conducted using the Thermo-Calc and the DICTRA software andutilizing the STEEL 16.tdb database [20] and the Dif.tdb kinetics database.
Experimental results
The measured carbon and nitrogen concentration profiles across the weld interface are givenin Fig. 1. As expected, carbon diffused from the T25 low-alloy steel into the P91 high-alloysteel. Also in the case of nitrogen its so-called up-hill diffusion can be observed, but incomparison with carbon the amount of redistributed nitrogen is substantially lower. Themaximum and minimum carbon and nitrogen concentrations in the CNEZ (C ma,„ Nmax) and inCNDZ (Cmin, Nmin) are given in Table 4, together with estimates of CNDZ and CNEZ widths.If during annealing the matrices of the two steels are austenitic (a temperature of 900 °C), theredistribution of carbon is little pronounced. If, however, the above matrices are ferritic, theredistribution of carbon is considerable. From the C and N profiles measured in CNEZ, a"competition" between C and N can be inferred since carbon is expulsed by nitrogen to agreater distance from the weld interface.
Table 4 Carbon and nitrogen concentrations in the CNEZ and in CNDZ
Annealing With of CDZAnd CEZ, tim
Nc,„,„,wt. %
Nc n„,,wt. %
With of NDZand NEZ, Im
NN mm,
wt. %NN maxe
wt.%900 °C/18 h > 500 ; 275 – 0.10 0.16 50 0.099±0.071 1.05600 °C/240 h > 500 ; 175 0.026±0.021 0.35 35 - 0.081±0.011 1.10
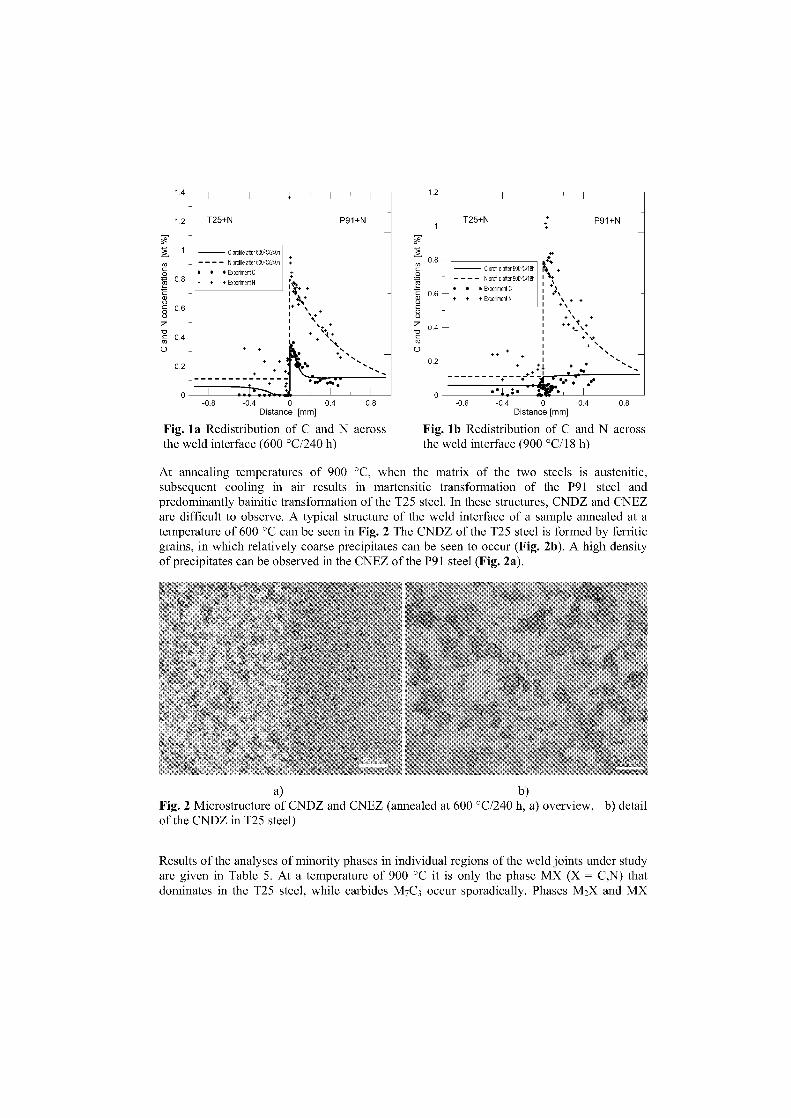
1.4
1.2 T25+N
Ö97:3 1
•,.rt•
P91+N
3
8
1.2
1 —
-
0 .8 —
°
T25+N
.‘?■• •
P91+N
— C profile ater 600PCl240h_ - - - - N profile afier 600'C/240h
• • • Experiment C0 • 8 Experiment N -
•+
C profile after 9000CI18h- - - N profile aber900°C118h
• • Experiment C+ + Experiment N
g 0.6ti
••g 0.44
0.2• +.■
+
•+ 4, • •••• .....-. .0
0 I . 1 4;;...,. ä, , I , I 0 I • • 1.: • I 1 I -0.8 -0.4 0 0.4 0.8 -0.8 -0.4 0 0.4 0.8
Distance [mm] Distance [mm]
•0.4 —‘4ss0 •
0.2,
•• •
Fig. la Redistribution of C and N acrossthe weld interface (600 °C/240 h)
Fig. lb Redistribution of C and N acrossthe weld interface (900 °C/18 h)
At annealing temperatures of 900 °C, when the matrix of the two steels is austenitic,subsequent cooling in air results in martensitic transformation of the P91 steel andpredominantly bainitic transformation of the T25 steel. In these structures, CNDZ and CNEZare difficult to observe. A typical structure of the weld interface of a Sample annealed at atemperature of 600 °C can be seen in Fig. 2 The CNDZ of the T25 steel is formed by ferriticgrains, in which relatively coarse precipitates can be seen to occur (Fig. 2b). A high densityof precipitates can be observed in the CNEZ of the P91 steel (Fig. 2a).
a) b)Fig. 2 Microstructure of CNDZ and CNEZ (annealed at 600 °C/240 h, a) overview, b) detailof the CNDZ in T25 steel)
Results of the analyses of minority phases in individual regions of the weld joints under studyare given in Table 5. At a temperature of 900 °C it is only the phase MX (X = C,N) thatdominates in the T25 steel, while carbides M 7C3 occur sporadically. Phases M2X and MX
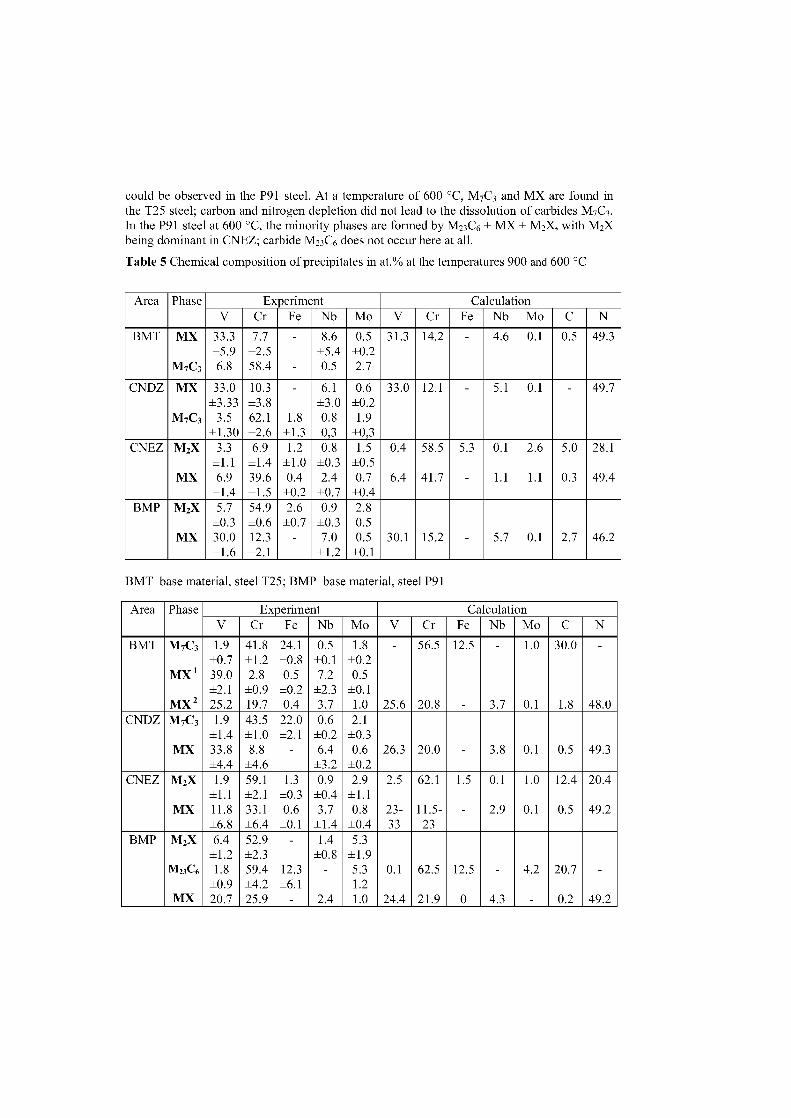
could be observed in the P91 steel. At a temperature of 600 °C, M 7C3 and MX are found inthe T25 steel; carbon and nitrogen depletion did not lead to the dissolution of carbides M7C3.In the P91 steel at 600 °C, the minority phases are formed by M23C6 MX M2X, with M2Xbeing dominant in CNEZ; carbide M23C6 does not occur here at all.
Table 5 Chemical composition of precipitates in at.% at the temperatures 900 and 600 °C
Area Phase Experiment CalculationV Cr Fe Nb Mo V Cr Fe Nb Mo C N
BMT MX
M7C3
33.3±5.96.8
7.7±2.558.4
-
-
8.6±5.40.5
0.5±0.22.7
31.3 14.2 - 4.6 0.1 0.5 49.3
CNDZ MX
M7C3
33.0±3.33
3.5±1.30
10.3±3.862.1±2.6
-
1.8±1.3
6.1±3.00.80,3
0.6±0.21.9
±0,3
33.0 12.1 - 5.1 0.1 - 49.7
CNEZ M2X
MX
3.3±1.16.9
±1.4
6.9±1.439.6±1.5
1.2±1.00.4
±0.2
0.8±0.32.4
±0.7
1.5±0.50.7
±0.4
0.4
6.4
58.5
41.7
5.3
-
0.1
1.1
2.6
1.1
5.0
0.3
28.1
49.4
BMP M2X
MX
5.7±0.330.0±1.6
54.9±0.612.3±2.1
2.6±0.7
-
0.9±0.37.0
±1.2
2.80.50.5
±0.130.1 15.2 - 5.7 0.1 2.7 46.2
BMT Basematerial, steel T25; BMP Basematerial, steel P91
Area Phase Experiment CalculationV Cr Fe Nb Mo V Cr Fe Nb Mo C N
BMT M7C3 1.9 41.8 24.1 0.5 1.8 - 56.5 12.5 - 1.0 30.0 -±0.7 ±1.2 ±0.8 ±0.1 ±0.2
MX 1 39.0 2.8 0.5 7.2 0.5±2.1 ±0.9 ±0.2 ±2.3 ±0.1
MX 2 25.2 19.7 0.4 3.7 1.0 25.6 20.8 - 3.7 0.1 1.8 48.0CNDZ M7C3 1.9 43.5 22.0 0.6 2.1
±1.4 ±1.0 ±2.1 ±0.2 ±0.3MX 33.8 8.8 - 6.4 0.6 26.3 20.0 - 3.8 0.1 0.5 49.3
±4.4 ±4.6 ±3.2 ±0.2CNEZ M2X 1.9 59.1 1.3 0.9 2.9 2.5 62.1 1.5 0.1 1.0 12.4 20.4
±1.1 ±2.1 ±0.3 ±0.4 ±1.1MX 11.8 33.1 0.6 3.7 0.8 23- 11.5- - 2.9 0.1 0.5 49.2
±6.8 ±6.4 ±0.1 ±1.4 ±0.4 33 23BMP M2X 6.4 52.9 - 1.4 5.3
±1.2 ±2.3 ±0.8 ±1.9M 23C6 1.8 59.4 12.3 - 5.3 0.1 62.5 12.5 - 4.2 20.7 -
±0.9 ±4.2 ±6.1 1.2MX 20.7 25.9 - 2.4 1.0 24.4 21.9 0 4.3 - 0.2 49.2
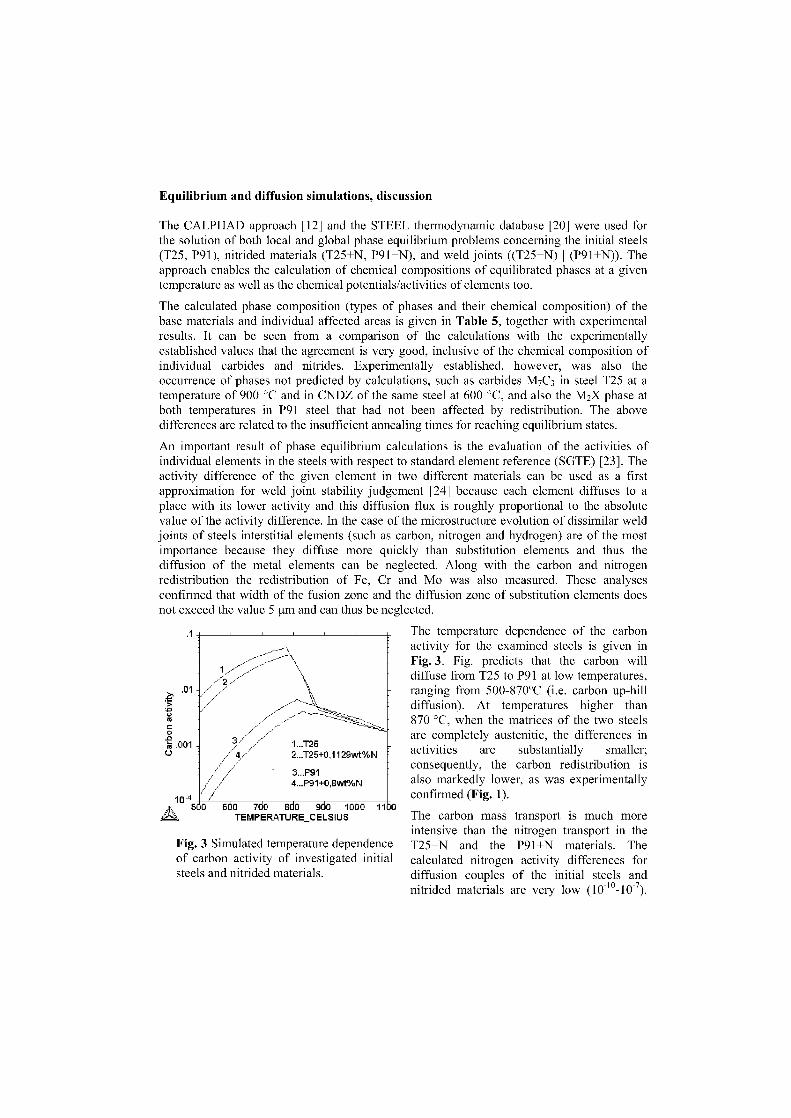
1...T252...T26+0,1129wt%N
3...P914...P91+0,8wt%N
Equilibrium and diffusion simulations, discussion
The CALPHAD approach [12] and the STEEL thermodynamic database [20] were used forthe solution of both local and global phase equilibrium problems concerning the initial steels(T25, P91), nitrided materials (T25+N, P91+N), and weld joints ((T25+N) (P91+N)). Theapproach enables the calculation of chemical compositions of equilibrated phases at a giventemperature as well as the chemical potentials/activities of elements too.
The calculated phase composition (types of phases and their chemical composition) of thebase materials and individual affected areas is given in Table 5, together with experimentalresults. It can be seen from a comparison of the calculations with the experimentallyestablished values that the agreement is very good, inclusive of the chemical composition ofindividual carbides and nitrides. Experimentally established, however, was also theoccurrence of phases not predicted by calculations, such as carbides M7C3 in steel T25 at atemperature of 900 °C and in CNDZ of the same steel at 600 °C, and also the M2X phase atboth temperatures in P91 steel that had not been affected by redistribution. The abovedifferences are related to the insufficient annealing times for reaching equilibrium states.
An important result of phase equilibrium calculations is the evaluation of the activities ofindividual elements in the steels with respect to standard element reference (SGTE) [23]. Theactivity difference of the given element in two different materials can be used as a firstapproximation for weld joint stability judgement [24] because each element diffuses to aplace with its lower activity and this diffusion flux is roughly proportional to the absolutevalue of the activity difference. In the case of the microstructure evolution of dissimilar weldjoints of steels interstitial elements (such as carbon, nitrogen and hydrogen) are of the mostimportance because they diffuse more quickly than substitution elements and thus thediffusion of the metal elements can be neglected. Along with the carbon and nitrogenredistribution the redistribution of Fe, Cr and Mo was also measured. These analysesconfirmed that width of the fusion zone and the diffusion zone of substitution elements doesnot exceed the value 5 !Im and can thus be neglected.
la '6C 0 6d0 7d0 8d0 9d0 10b0 11)0
TEMPERATURE_CELSIUS
Fig. 3 Simulated temperature dependenceof carbon activity of investigated initialsteels and nitrided materials.
The temperature dependence of the carbonactivity for the examined steels is given inFig. 3. Fig. predicts that the carbon willdiffuse from T25 to P91 at low temperatures,ranging from 500-870°C (i.e. carbon up-hilldiffusion). At temperatures higher than870 °C, when the matrices of the two steelsare completely austenitic, the differences inactivities are substantially smaller;consequently, the carbon redistribution isalso markedly lower, as was experimentallyconfirmed (Fig. 1).
The carbon mass transport is much moreintensive than the nitrogen transport in theT25+N and the P91+N materials. Thecalculated nitrogen activity differences fordiffusion couples of the initial steels andnitrided materials are very low (10-10-10-7).
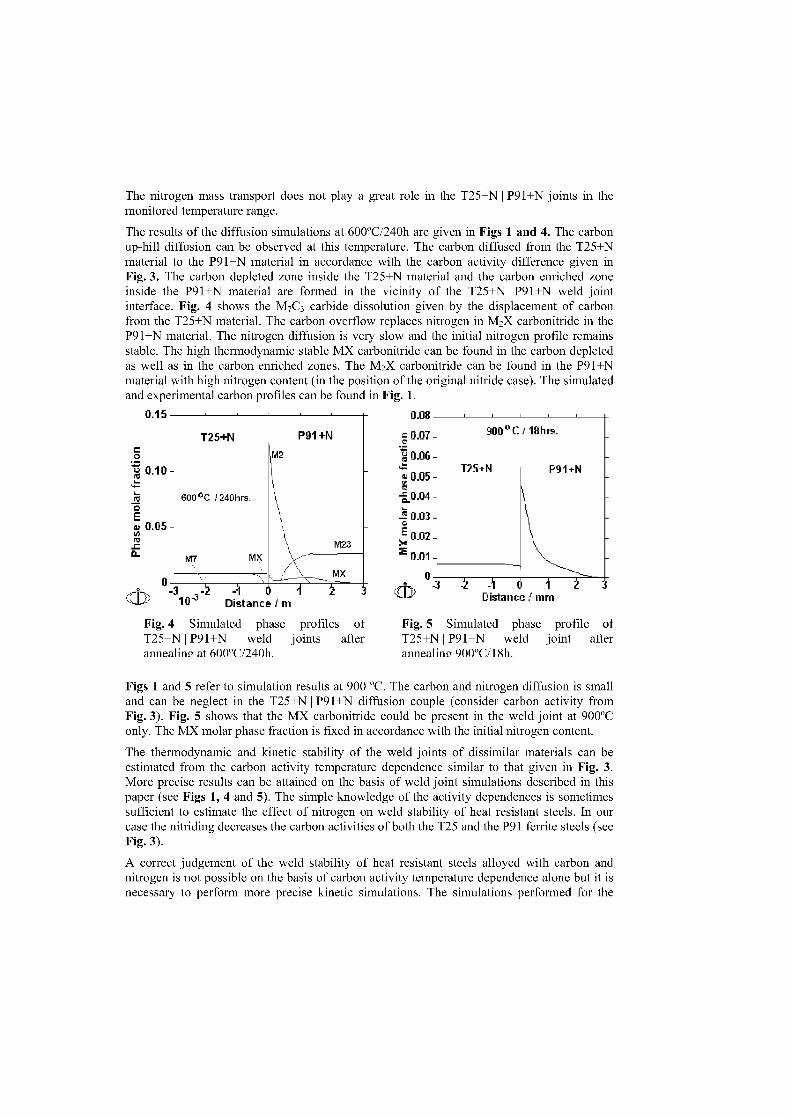
The nitrogen mass transport does not play a great role in the T25+N1P91+N joints in themonitored temperature range.
The results of the diffusion simulations at 600°C/240h are given in Figs 1 and 4. The carbonup-hill diffusion can be observed at this temperature. The carbon diffused from the T25+Nmaterial to the P91+N material in accordance with the carbon activity difference given inFig. 3. The carbon depleted zone inside the T25+N material and the carbon enriched zoneinside the P91+N material are formed in the vicinity of the T25+N1P91+N weld jointinterface. Fig. 4 shows the M7C3 carbide dissolution given by the displacement of carbonfrom the T25+N material. The carbon overflow replaces nitrogen in M2X carbonitride in theP91+N material. The nitrogen diffusion is very slow and the initial nitrogen profile remainsstable. The high thermodynamic stable MX carbonitride can be found in the carbon depletedas well as in the carbon enriched zones. The M2X carbonitride can be found in the P91+Nmaterial with high nitrogen content (in the position of the original nitride case). The simulatedand experimental carbon profiles can be found in Fig. 1.
0.15
T25+N
00.10
600 °C 240hrs0Ew 0.0
M23
0
(112- -3
) Distance 11111
Fig. 4 Simulated phase profiles of Fig. 5 Simulated phase profile ofT25+N1P91+N weld joints after T25+N1P91+N weld joint afterannealing at 600°C/240h. annealing 900°C/18h.
Figs 1 and 5 refer to Simulation results at 900 °C. The carbon and nitrogen diffusion is smalland can be neglect in the T25+N1P91+N diffusion couple (consider carbon activity fromFig. 3). Fig. 5 shows that the MX carbonitride could be present in the weld joint at 900°Conly. The MX molar phase fraction is fixed in accordance with the initial nitrogen content.
The thermodynamic and kinetic stability of the weld joints of dissimilar materials can beestimated from the carbon activity temperature dependence similar to that given in Fig. 3.More precise results can be attained on the basis of weld joint simulations described in thispaper (see Figs 1, 4 and 5). The simple knowledge of the activity dependences is sometimessufficient to estimate the effect of nitrogen on weld stability of heat resistant steels. In ourcase the nitriding decreases the carbon activities of both the T25 and the P91 ferrite steels (seeFig. 3).
A correct judgement of the weld stability of heat resistant steels alloyed with carbon andnitrogen is not possible on the basis of carbon activity temperature dependence alone but it isnecessary to perform more precise kinetic simulations. The simulations performed for the
a.
0
(WD
0.08
2
P91+N = 0.07 -
0.06
0.05 -
900°C /18hrs.
T25+N P91+N
_e 0.03 -
0.02-x3 0.01 -
T25+N P91+N weld joint show a great difference in the diffusion and phase stability at600 °C and at 900 °C. The T25+N P91+N diffusion joint reveals the formation of carbondepleted zone and carbon enriched zone at 600°C, which is confirmed by the experiment. Thisweld joint combination represents much risk in practical service conditions at 600 °C.
The weck point of heterogeneous weld joints of heat-resistant steels is CDZ, in which in thecases of welding only CrMo steels there is an almost complete carbon depletion and apractically perfect dissolution of carbidic phases. In this area, a rapid recrystallization of theferritic matrix then follows. In more advanced steels, which are usually alloyed withvanadium, niobium and nitrogen there is in the CDZ non-dissolved carbonitride MX (M = V,Nb, Cr,...), which provides precipitation hardening and, at the same time, deaceleratesrecrystallization processes. In advanced creep-resistant steels the appearance of a CDZ doesnot necessarily lead to failure by type lila cracking.
High diffusion stability is reached at 900°C. The diffusion is negligible at this temperature butit has to be noted that the matrix is formed by the FCC phase (austenite) at this temperature,which is above the temperature range of the applications of the steels under study.
Conclusion
The simulation results enable understanding the processes taking place in the diffusion-affected zone of the studied weld joint under different temperature conditions. It was foundthat the nitriding of both heat resistant steels decreased their carbon activities. The kineticsimulation of the T25+N P91+N weld joint has confirmed it. It can be concluded that themethod used provides results that are in good agreement with experimental observations.
The simulation procedure used can be transferred to weld joints of heat resistant steels withsimultaneous carbon/nitrogen diffusion. In this case, the simulation method can offer resultsthat can be used for the evaluation of long-term microstructural stability of weldments at hightemperatures.
AcknowledgementThe present work was supported by the Ministry of Education, Youth and Sports, project NoMSM0021630508.
References
[1] STRANG, A., VODAREK, V. Microstructural degradation of martensitic 12%Cr powerplant steel during prolonged high temperature creep exposure. Proc. of the 61h LiegeConference Materials for Advanced Power Engineering. 1998, eds. J. Lecomte-Beckers etal., p.601, Jülich Forschungszentrum.
[2] MASUYAMA, F. Trends in power engineering in Japan and requirements for improvedmaterials and components. Proc. of the 7th Liege Conference Materials for AdvancedPower Engineering 2002, eds.J. Lecomte-Beckers et al. pp. 1767-1782. JülichForschungszentrum.
[3] MAYER, K.H. et al. Development of new steels for advanced steam power plants. Proc.of the 7th Liege Conference Materials forAadvanced Power Engineering 2002, eds. J.Lecomte-Beckers et al. pp. 1385-1397.Jülich Forschungszentrum.
[4] BRETT, S.J. Type III cracking in 1/2CrMoV steam pipe work systems. Science andTechnology of Welding and Joining, 9, 2004, 1, pp.41-45.
[5] FORET, R. et al. Structural stability of dissimilar weld joints of steel P91. Science andTechnology of Welding and Joining. 6, 2001. 6, pp. 405-411.
[6] SUDHA, C. et al. Systematic study of formation of soft and hard zones in dissimilarweldments of Cr-Mo steels. Journal of Nuclear Materials. 302, 2002, 4), pp. 193-205.
[7] BRET, S.J. 1998. In-service cracking mechanism affecting 2CrMo welds in1/2CrMoVsteam pipe work system. Proc. of int. con. Integrity of high-temperature Welds. pp.3-14.Professional Engineering Publishing Limited London.
[8] HELANDER, T, ANDERSSON, C.M., OSKARSSON, M. 2000. Structural changes in12-2.25 weldments – an experimental and theoretical approach. Materials at HighTemperatures, 17, 2000, 3, pp. 389-396.
[9] BUCHMAYR, B. et al. Experimental and numerical investigations of the creep behaviorof the dissimilar weldment GS-17 CrMoV 5 11 and X 20 CrMoV 12 1. Steel Research. 61,1990, 6, pp. 268-273.
[10] ROBERTS, D.I., RYDER, R.., VISWANATHAN, R. 1985. Performance of dissimilarwelds in service. Journal of Pressure Vessel Technology. 107, 1985, 3, pp. 247-254.
[11] ALBERT, S.K. et al. 1997. Soft zone formation in dissimilar welds between two Cr-Mo steels. Welding Journal. 76, 1997, 3, pp. 135-142.
[12] SAUNDERS, N., MIODOVNIK, A.P. CALPHAD (Calculation of phase diagram – AComprehensive Guide). Amsterdam 1998, Elsevier Science Publishing.
[13] VISWANATHAN, R., PURGERT, R., RAO, U. Materials Technology for AdvancedCoal Power Plants. In Proc. of Conf. Super-High Strength Steels [CD-ROM]. Rome, Italy,November 2-4, 2005.
[14] ANDERSON, J.O. et al. Thermo-Calc and DICTRA, computational tools for materialsscience. CALPHAD. 26, 2002, pp. 273-312.
[15] BORGENSTAM, A., et al. 2000. DICTRA, a tool for simulation of diffusionaltransformations in alloys. Journal of Phase Equilibria, 21, 2000, 3, pp. 269-280.
[16] KIRKALDY, J.S., YOUNG, D.J. Diffusion in the Condensed State, London 1985, TheInstitute of Metals.
[17] ENGSTRÖM, A, HOGLUND, L., ÄGREN, J. Computer simulation of diffusion inmultiphase system. Metallurgical and Materials Transactions A. 25A, 1994, 2, pp. 1127-1134.
[18] ANDERSSON, J.O. et al. Computer simulation of multicomponent diffusionaltransformations in steel. Proc. Fundamentals and Applications of Ternary Diffusion. Eds.G. R. Purdy, pp.153-163. Pergamon Press, New York 1990.
[19] FOLDYNA, V. et al. Microstructure and properties of modified 3%Cr steels. Proc. ofthe 7th Liege Conference Materials for Advanced Power Engineering 2002, eds. J.Lecomte-Beckers et al. pp. 1477-1486. Jülich Forschungszentrum.
[20] KROUPA, A. et al. Phase diagram in the iron-rich corner of the Fe-Cr-Mo-V-Csystem below 1000 K. Journal of Phase Equilibria. 22, 2001, 3, pp. 312-323.
[21] SOPOUSEK, J., JAN, V., FORET, R. Simulation of dissimilar weld joints of steelP91. Science and Technology of Welding and Joining. 9, 2004, 1, pp. 59-63..
[22] KUBON, Z., FOLDYNA, V., VODÄREK, V., Optimized chemical composition of 9-12%Cr steels with respect to maximum creep resistance. . Proc.of the 61h LiegeConference Materials for Advanced Power Engineering. 1998. eds. J. Lecomte-Beckers etal., pp.311-325, Jülich: Forschungszentrum.
[23] DINSDALE, A.T. SGTE data for pure elements. CALPHAD 15, 1991, 4, pp. 317-425.[24] JAN, V., SOPOUSEK, J., FORET, R. Weld joint simulation of heat-resistant steels
Archives of Metallurgy and Materials. 49, 2004, 3, pp. 439-480.
Part III
Advanced Steam Turbine Materials
Contributed Papers
Steam Oxidation and Coatings

OXIDATION OF CANDIDATE CHROMIUM STEELS IN STEAMENVIRONMENT
Josef Cizner, Jan Hakl
SVÜM a.s., Prague, Czech Republic
Abstract
Laboratory tests of ferritic chromium steels and model alloys in steam environment at testing temperature 600and 650 °C. Gravimetric evaluation performed minimal differences between ferritic steels. Metallographyanalysis made it possible to separate steels with low-grade oxidic safety layer. Model alloys with higher contentof chromium or Ni+Cr alloys had the best results.
Keywords: Oxidation, steam environment, chromium steels
Introduction
For development of advanced steam boilers of a new generation it is necessary to havematerial data for steels to be used at high temperatures and pressure regimes. These materials,apart from having excellent creep properties, have to be resistant against corrosion attack(both an the combustion gas - outer side of tubes - as well as the steam side).
Low alloy steels are applicable up to temperature 560 °C. For higher temperatures it isnecessary to use more highly alloyed elements steels- ferritic steels (8 - 12% Cr base) and/oraustenitic steels. These steels are usually alloyed with additional elements (Mo, W, V, Co, Nbetc) which positively influence creep properties. However in some cases, this could negativelyinfluence high temperature corrosion resistance.
For this reason, it is necessary to test candidate materials in laboratory conditions andlater in the field. The question of steam oxidation resistance in candidate steels at thetemperatures 600 and 650 °C was investigated in COST 522 „Steam power plant" programme[1] and now is also being further studied in COST 536. Project of SVUM is located in section„Oxidation", marked as CZ4b SVUM.
Testing programme
Long - term testing of candidate steels and model alloys were performed at SVÜM.Chemical composition of tested materials is shown in table 1. There is a group of ferriticsteels in their wrought and cast states with different alloying elements. Chromium content is11,5 wt%, molybdenum content is 1,5 wt% and other alloying elements like Nb, V, N and Bimprove the strength of metal basic material. In VM 12 steel are also present Co, Cu and W.
Model alloys tested were FelOCr, Fe20Cr, NilOCr and Ni25Cr. Long - term testingconditions are shown in table 2.
For these tests, superkanthal furnaces with metal gas proof muffles made from AISI 310steel were utilized with programmable temperature control.
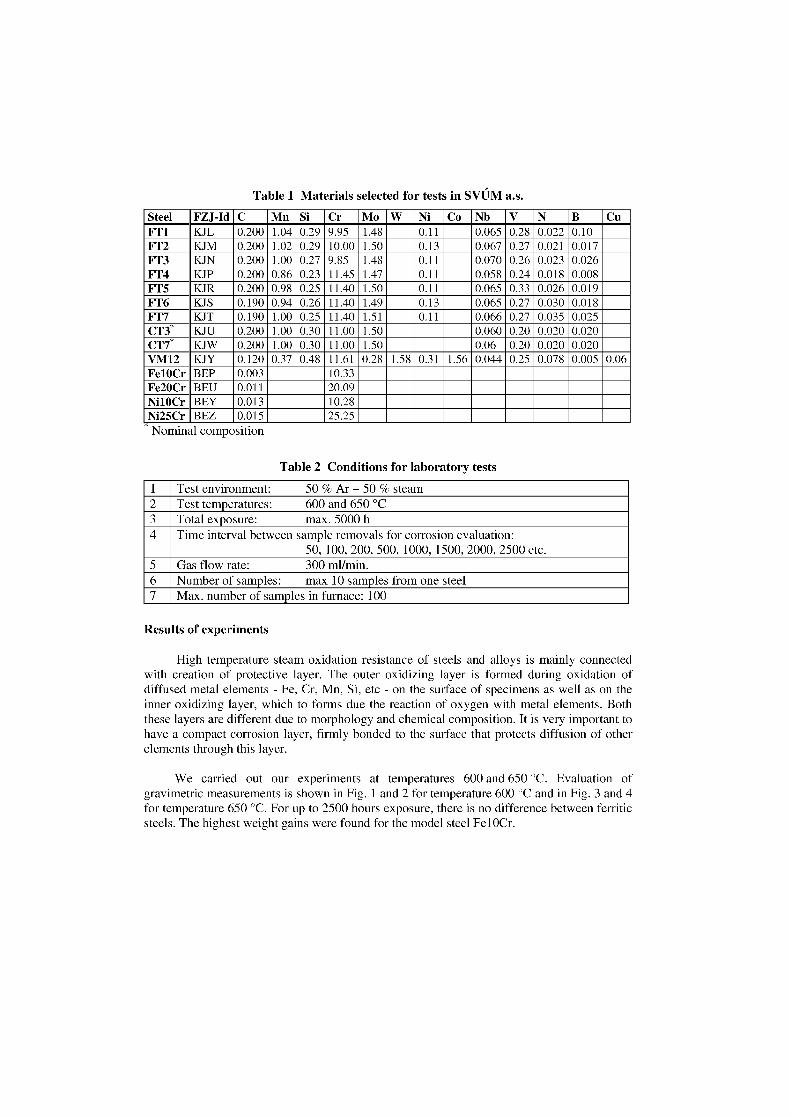
Table 1 Materials selected for tests in SVÜM a.s.
Steel FZJ-Id C Mn Si Cr Mo W Ni Co Nb V N B CuFT1 KJL 0.200 1.04 0.29 9.95 1.48 0.11 0.065 0.28 0.022 0.10FT2 KJ M 0.200 1.02 0.29 10.00 1.50 0.13 0.067 0.27 0.021 0.017FT3 KJ N 0.200 1.00 0.27 9.85 1.48 0.11 0.070 0.26 0.023 0.026FT4 KJP 0.200 0.86 0.23 11.45 1.47 0.11 0.058 0.24 0.018 0.008FT5 KJR 0.200 0.98 0.25 11.40 1.50 0.11 0.065 0.33 0.026 0.019FT6 KJS 0.190 0.94 0.26 11.40 1.49 0.13 0.065 0.27 0.030 0.018FT7 KJT 0.190 1.00 0.25 11.40 1.51 0.11 0.066 0.27 0.035 0.025CT3* KJ U 0.200 1.00 0.30 11.00 1.50 0.060 0.20 0.020 0.020CT7* KJW 0.200 1.00 0.30 11.00 1.50 0.06 0.20 0.020 0.020VM12 KJY 0.120 0.37 0.48 11.61 0.28 1.58 0.31 1.56 0.044 0.25 0.078 0.005 0.06FelOCr BEP 0.003 10.33Fe20Cr BEU 0.011 20.09Nil OCr BEY 0.013 10.28Ni25Cr BEZ 0.015 25.25
Nominal composition
Table 2 Conditions for laboratory tests
1 Test environment: 50 % Ar + 50 % steam2 Test temperatures: 600 and 650 °C3 Total exposure: max. 5000 h4 Time interval between sample removals for corrosion evaluation:
50, 100, 200, 500, 1000, 1500, 2000, 2500 etc.5 Gas flow rate: 300 ml/min.6 Number of samples: max 10 samples from one steel7 Max. number of samples in furnace: 100
Results of experiments
High temperature steam oxidation resistance of steels and alloys is mainly connectedwith creation of protective layer. The outer oxidizing layer is formed during oxidation ofdiffused metal elements - Fe, Cr, Mn, Si, etc - on the surface of specimens as well as on theinner oxidizing layer, which to forms due the reaction of oxygen with metal elements. Boththese layers are different due to morphology and chemical composition. It is very important tohave a compact corrosion layer, firmly bonded to the surface that protects diffusion of otherelements through this layer.
We carried out our experiments at temperatures 600 and 650 °C. Evaluation ofgravimetric measurements is shown in Fig. 1 and 2 for temperature 600 °C and in Fig. 3 and 4for temperature 650 °C. For up to 2500 hours exposure, there is no difference between ferriticsteels. The highest weight gains were found for the model steel FelOCr.
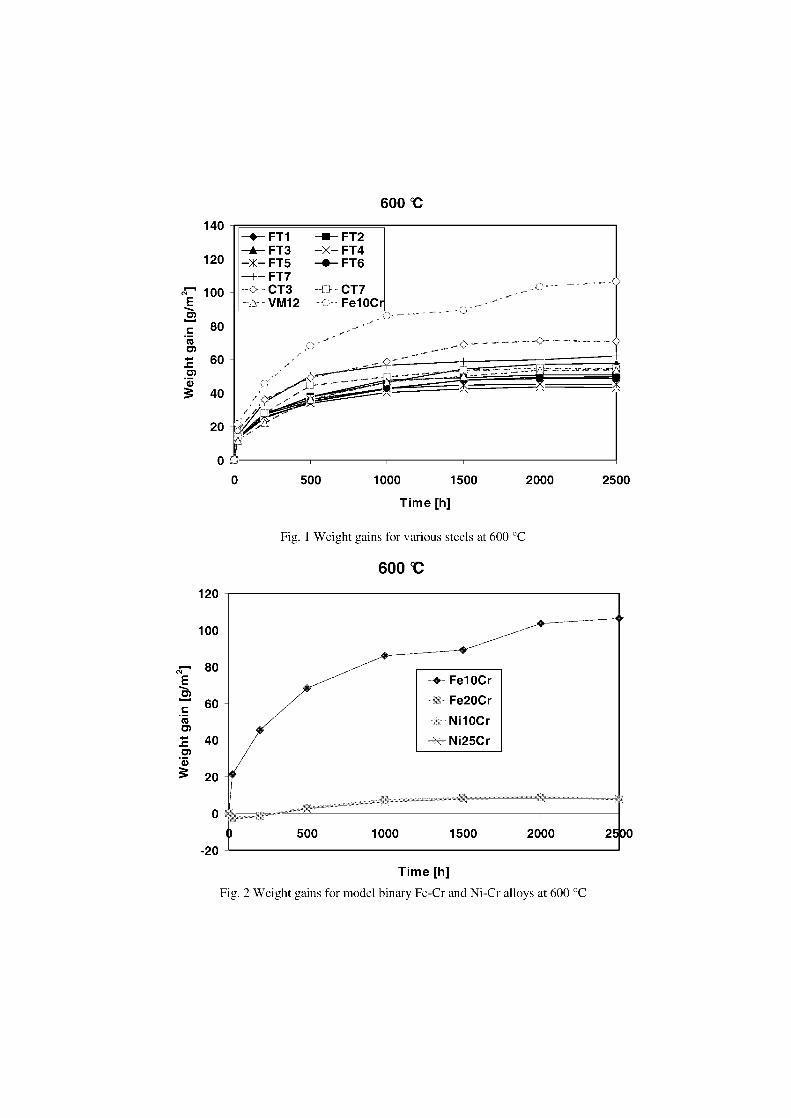
–•– FT1–A– FT3–X– FT5–+– FT7–0- CT3- VM12
600 °C
0 500 1000 1500Time [h]
Fig. 1 Weight gains for various steels at 600 °C
600 cc
2000 2500
120
100 -
• Fel OCrFe20CrNil0CrNi25Cr
500 1000 1500 2000 400
Time [h]Fig. 2 Weight gains for model binary Fe-Cr and Ni-Cr alloys at 600 °C
-20
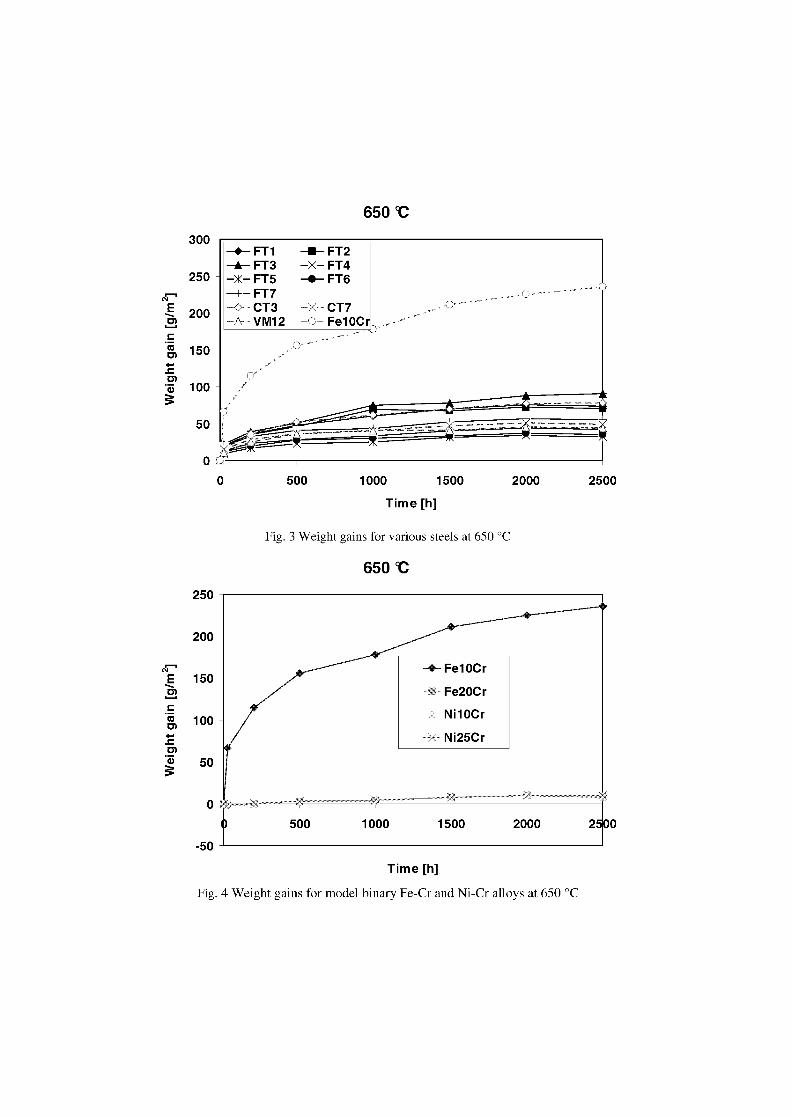
- FT1 -3- FT2-A- FT3 -X- FT4- FT5 -0- FT6-+- FT7- CT3 -X- CT7-A- - VM12 -o- Fe10Cr
300
250 -
200 -
150 -
100 -
50 -
- - Fe10Cr
Fe20Cr
Ni10Cr
-X- Ni25Cr
65090
cr-Ernc
rn:5cn
'4T)
Fig. 3 Weight gains for various steels at 650 °C
650
2 0500 1000 1500 2000
-50
Time [h]
Fig. 4 Weight gains for model binary Fe-Cr and Ni-Cr alloys at 650 °C
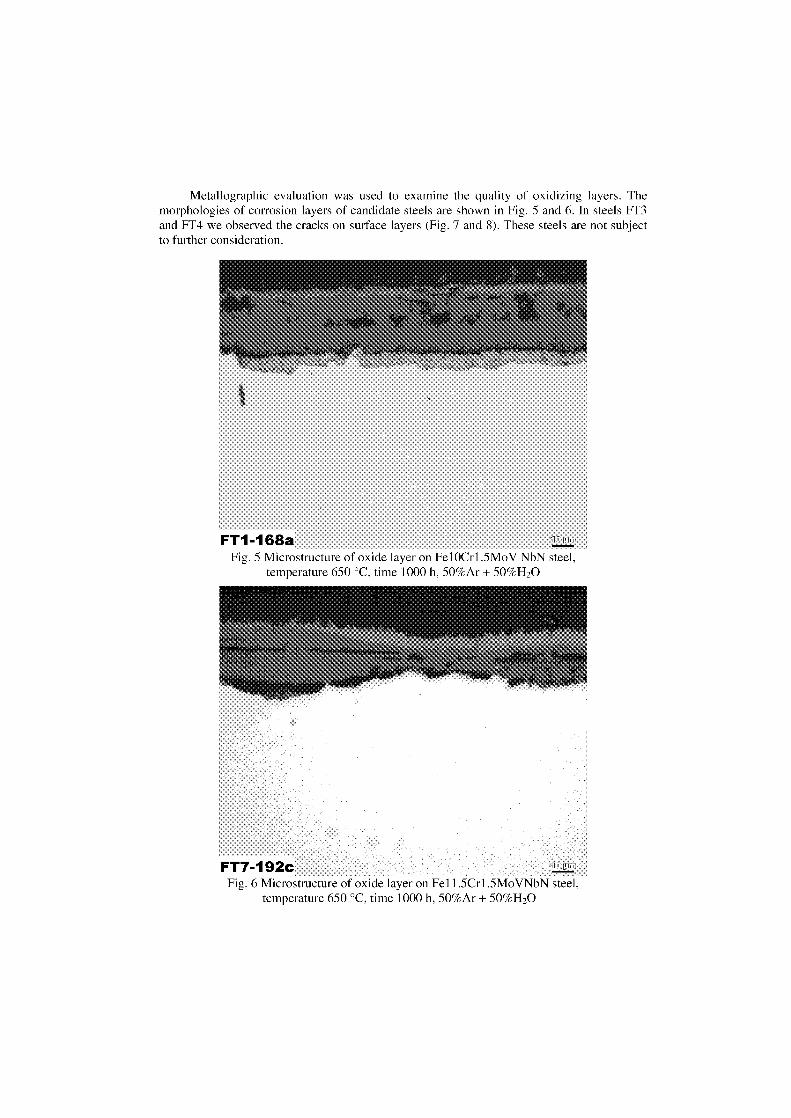
Metallographic evaluation was used to examine the quality of oxidizing layers. Themorphologies of corrosion layers of candidate steels are shown in Fig. 5 and 6. In steels FT3and FT4 we observed the cracks on surface layers (Fig. 7 and 8). These steels are not subjectto further consideration.
FT1-168aFig. 5 Microstructure of oxide layer on FelOCr1.5MoV NbN steel,
temperature 650 °C, time 1000 h, 50%Ar + 50%FT 0
FT7-192c ,Kcpn
Fig. 6 Microstructure of oxide layer on Fel 1 .5Cr1.5MoVNbN steel,temperature 650 °C, time 1000 h, 50%Ar + 50%H20
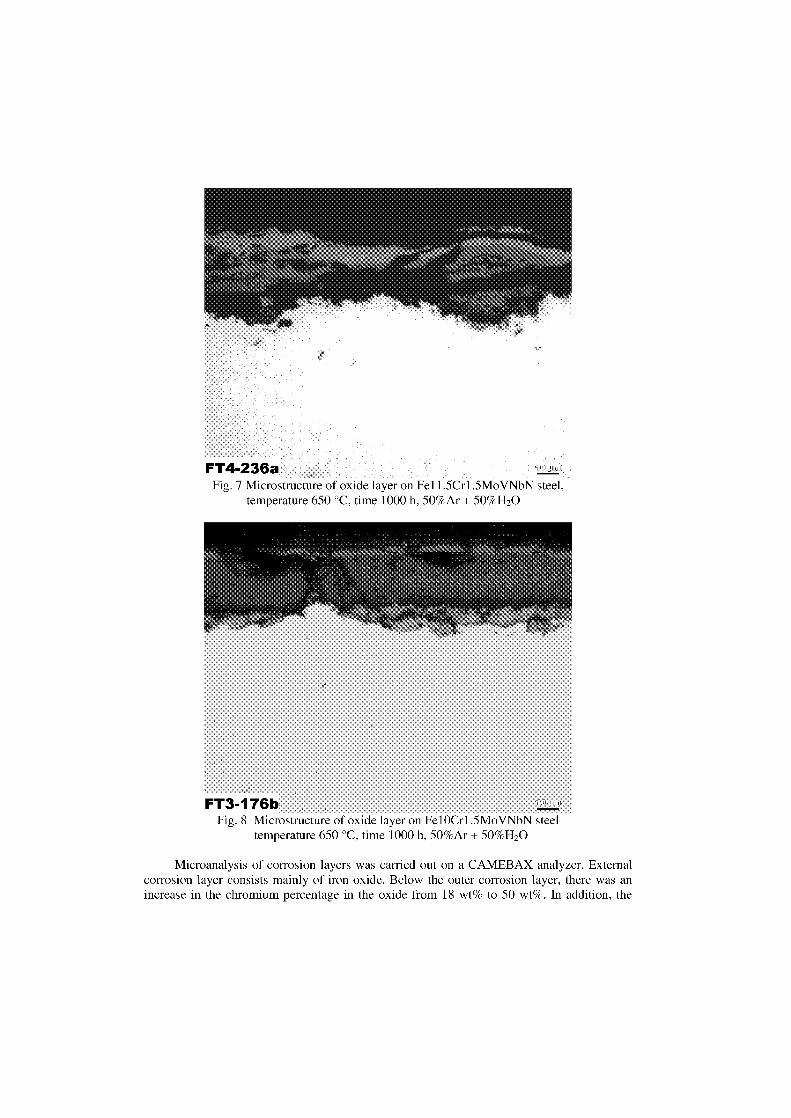
FT4-236aFig. 7 Microstructure of oxide layer on Fe11.5Cr1.5MoVNbN steel,
temperature 650 °C, time 1000 h, 50%Ar + 50%H20
FT3-176bFig. 8 Microstructure of oxide layer on FelOCr1.5MoVNbN steel
temperature 650 °C, time 1000 h, 50%Ar + 50%H20
Microanalysis of corrosion layers was carried out on a CAMEBAX analyzer. Externalcorrosion layer consists mainly of iron oxide. Below the outer corrosion layer, there was anincrease in the chromium percentage in the oxide from 18 wt% to 50 wt%. In addition, the
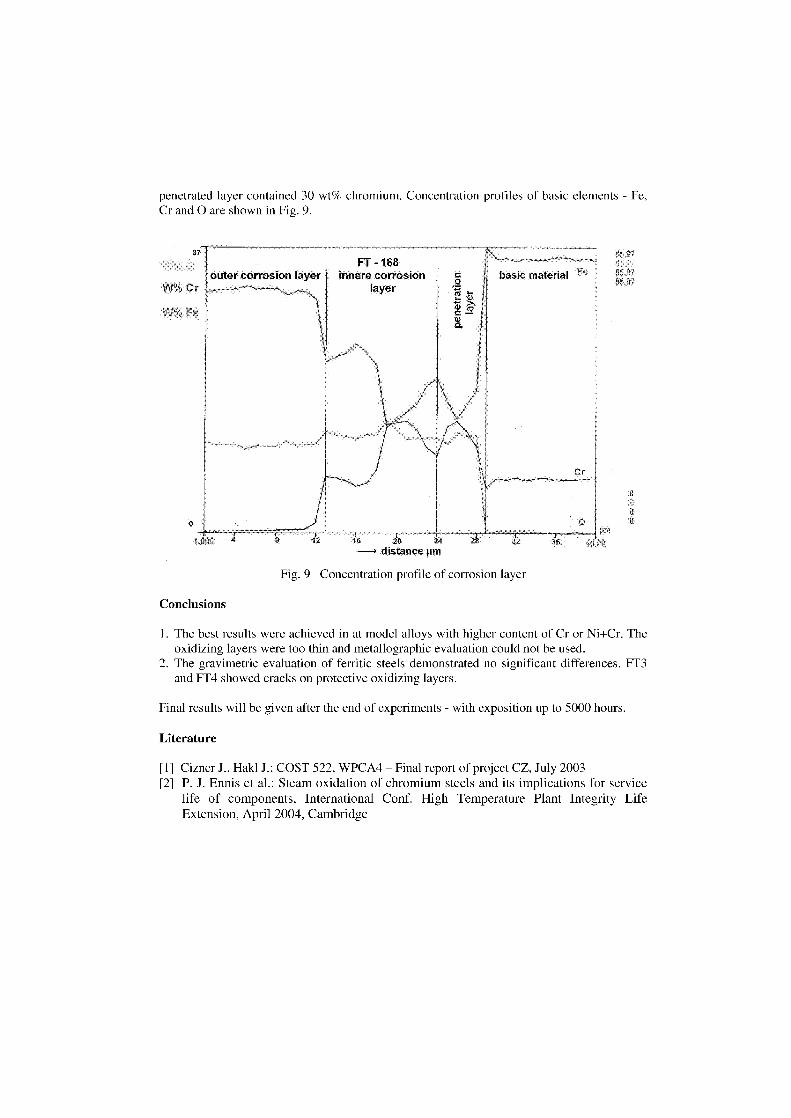
penetrated layer contained 30 wt% chromium. Concentration profiles of basic elements - Fe,Cr and 0 are shown in Fig. 9.
Fig. 9 Concentration profile of corrosion layer
Conclusions
1. The best results were achieved in at model alloys with higher content of Cr or Ni+Cr. Theoxidizing layers were too thin and metallographic evaluation could not be used.
2. The gravimetric evaluation of ferritic steels demonstrated no significant differences. FT3and FT4 showed cracks an protective oxidizing layers.
Final results will be given after the end of experiments - with exposition up to 5000 hours.
Literature
[1] Cizner J., Hakl J.; COST 522, WPCA4 – Final report of project CZ, July 2003[2] P. J. Ennis et al.: Steam oxidation of chromium steels and its implications for service
life of components, International Conf. High Temperature Plant Integrity LifeExtension, April 2004, Cambridge

OXIDE SCALE GROWTH AND SPALLATION IN STEAMENVIRONMENTS - AN ASSESSMENT OF DIFFERENT MODELLING
APPROACHES
A T Fry, S OsgerbyNational Physical Laboratory, Hampton Road, Teddington, UK
Abstract
The ability to model accurately the oxide scale growth of materials in high temperature and pressure steamenvironments is an attractive and desirable tool for designers and utility managers. A number of techniques havebeen used to develop models to predict the oxide scale growth and scale spallation for a range of hightemperature materials. These include an oxide grain growth model which uses experimental thermogravimetricdata to calculate instantaneous values for the oxidation kinetics, which can then be used to determine the oxidegrowth mechanism; an analytical model which uses key composition variables to model the growth kinetics andneural networks which form relationships based on experimental data. Although all of the techniques can beused for oxide growth modelling, not all are applicable for predicting the onset of spallation. The results fromthese different approaches have been compared and the relative merits and disadvantages discussed.
Keywords: Modelling, Neural Network, Oxide Growth, Chromium Steel, Steam
Introduction
All modelling techniques have a basic requirement of either fundamental understanding of theprocesses occurring with mathematical expressions that describe them, or a set of data thatcan be analysed to establish trends and relationships, which can then be modelled. This lattertechnique does not require any knowledge of the processes occurring, although this is, ofcourse preferable. Since oxidation is a time dependant process it can take exposures of manythousands of hours to degrade the material to such an extent that metal loss and spallationbecome problematic. Thus the evaluation of materials purely based on accelerated laboratorytests, whilst very beneficial, does not always supply enough information. This is particularlythe case with very oxidation resistant materials where oxide growth can be very slow. Withsteam power plants typically designed for a lifetime of 25 years, and with the economicpressure to extend this life further, long-term performance is a very important issue. Thus theuse of modelling techniques is advantageous.
Three techniques have been used to develop a model for predicting the specific mass changeof 9-12% (by weight) chromium containing steels. Some of these models can also be used topredict the likelihood of spallation occurring. The following describes the differenttechniques used and presents the results obtained. The merits and disadvantages of eachtechnique are discussed.
Oxide Growth Model
BasisThis model assumes that the rate-determining factor in the steam oxidation of martensiticsteels is the diffusion of the reactive species through the oxide scale. This is controlled
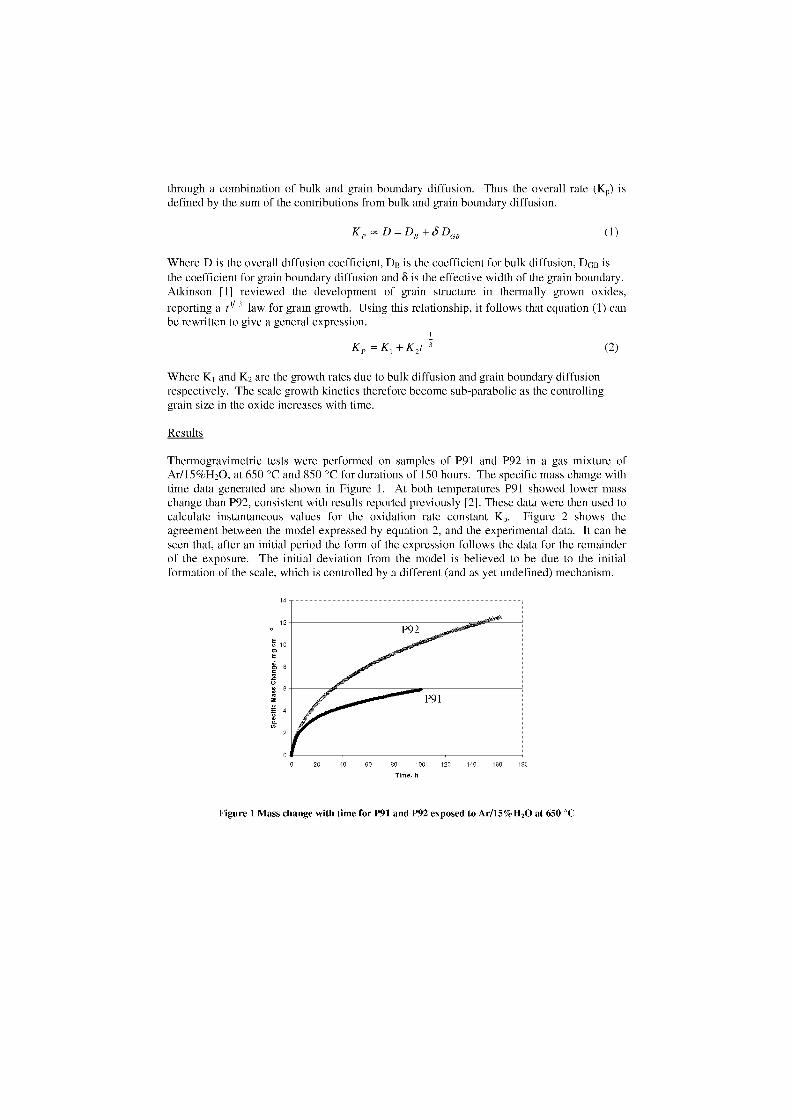
through a combination of bulk and grain boundary diffusion. Thus the overall rate (K p) isdefined by the sum of the contributions from bulk and grain boundary diffusion.
K,,«D=DB+ÖD„ (1)
Where D is the overall diffusion coefficient, DB is the coefficient for bulk diffusion, DGB isthe coefficient for grain boundary diffusion and 8 is the effective width of the grain boundary.Atkinson [1] reviewed the development of grain structure in thermally grown oxides,reporting a law for grain growth. Using this relationship, it follows that equation (1) canbe rewritten to give a general expression.
Kr = K, + K 2t 3 (2)
Where K I and K2 are the growth rates due to bulk diffusion and grain boundary diffusionrespectively. The scale growth kinetics therefore become sub-parabolic as the controllinggrain size in the oxide increases with time.
Results
Thermogravimetric tests were performed an samples of P91 and P92 in a gas mixture ofAr/15%H20, at 650 °C and 850 °C for durations of 150 hours. The specific mass change withtime data generated are shown in Figure 1. At both temperatures P91 showed lower masschange than P92, consistent with results reported previously [2]. These data were then used tocalculate instantaneous values for the oxidation rate constant Kp. Figure 2 shows theagreement between the model expressed by equation 2, and the experimental data. lt can beseen that, after an initial period the form of the expression follows the data for the remainderof the exposure. The initial deviation from the model is believed to be due to the initialformation of the scale, which is controlled by a different (and as yet undefined) mechanism.
Figure 1 Mass change with time for P91 and P92 exposed to Ar/15%H 20 at 650 °C
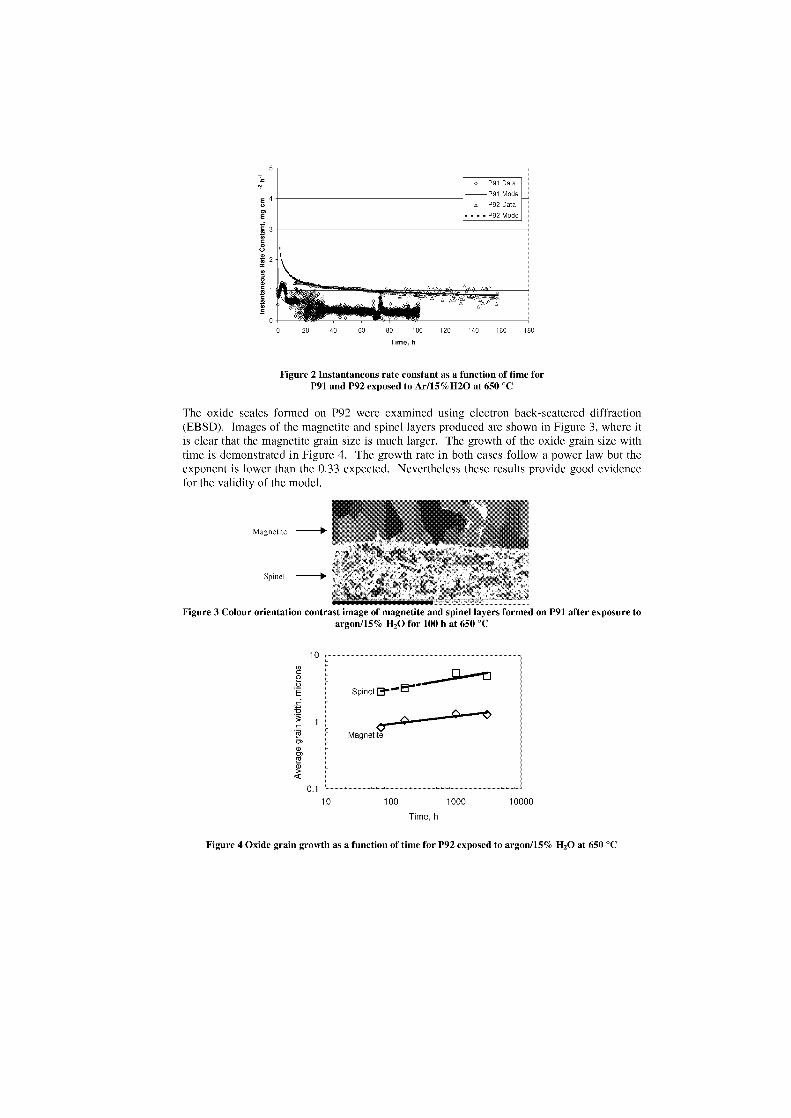
o P91 Data
P91 Model
A P92 Data
- P92 Model
20
40
60
80 100
120
140
160
180
Time, h
Figure 2 Instantaneous rate constant as a function of time forP91 and P92 exposed to Ar/15%H20 at 650 °C
The oxide scales formed on P92 were examined using electron back-scattered diffraction(EBSD). Images of the magnetite and spinel layers produced are shown in Figure 3, where itis clear that the magnetite grain size is much larger. The growth of the oxide grain size withtime is demonstrated in Figure 4. The growth rate in both cases follow a power law but theexponent is lower than the 0.33 expected. Nevertheless these results provide good evidencefor the validity of the model.
Magnetfite -11›
Spinel -II>
Figure 3 Colour orientation contrast image of magnetite and spinel layers formed on P91 after exposure toargon/15% H20 for 100 h at 650 °C
Figure 4 Oxide grain growth as a function of time for P92 exposed to argon/15% H 20 at 650 °C
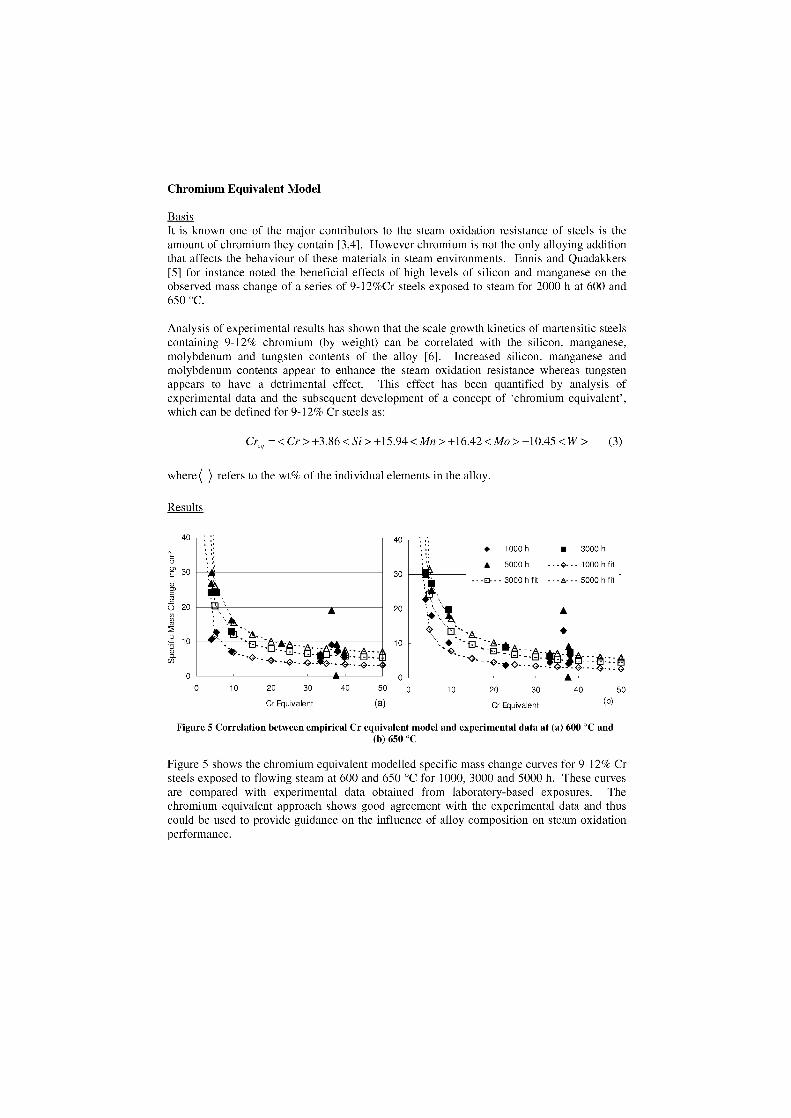
Chromium Equivalent Model
BasisIt is known one of the major contributors to the steam oxidation resistance of steels is theamount of chromium they contain [3,4]. However chromium is not the only alloying additionthat affects the behaviour of these materials in steam environments. Ennis and Quadakkers[5] for instance noted the beneficial effects of high levels of silicon and manganese on theobserved mass change of a series of 9-12%Cr steels exposed to steam for 2000 h at 600 and650 °C.
Analysis of experimental results has shown that the scale growth kinetics of martensitic steelscontaining 9-12% chromium (by weight) can be correlated with the silicon, manganese,molybdenum and tungsten contents of the alloy [6]. Increased silicon, manganese andmolybdenum contents appear to enhance the steam oxidation resistance whereas tungstenappears to have a detrimental effect. This effect has been quantified by analysis ofexperimental data and the subsequent development of a concept of `chromium equivalent',which can be defined for 9-12% Cr steels as:
Crq = < Cr > +3.86 < Si > +15.94 < Mn > +16.42 < Mo > –10.45 <W > (3)
where() refers to the wt% of the individual elements in the alloy.
Results
40
E
E 300)0)2Ü 2
03
2 1
(f)
0
40
30
20
101 lt: A
♦
A-8-..
::.0.:4
0 10 20 300
40 50 0
Cr Equivalent (a) Cr Equivalent
10 20 30•
40 50(b)
•Q •
--- --- 3000 h fit -•- -- 5000 h f it
♦ 1000 h ■ 3000 h
• 5000h -• -- 1000 h fit
Figure 5 Correlation between empirical Cr equivalent model and experimental data at (a) 600 °C and(b) 650 °C
Figure 5 shows the chromium equivalent modelled specific mass change curves for 9-12% Crsteels exposed to flowing steam at 600 and 650 °C for 1000, 3000 and 5000 h. These curvesare compared with experimental data obtained from laboratory-based exposures. Thechromium equivalent approach shows good agreement with the experimental data and thuscould be used to provide guidance on the influence of alloy composition on steam oxidationperformance.
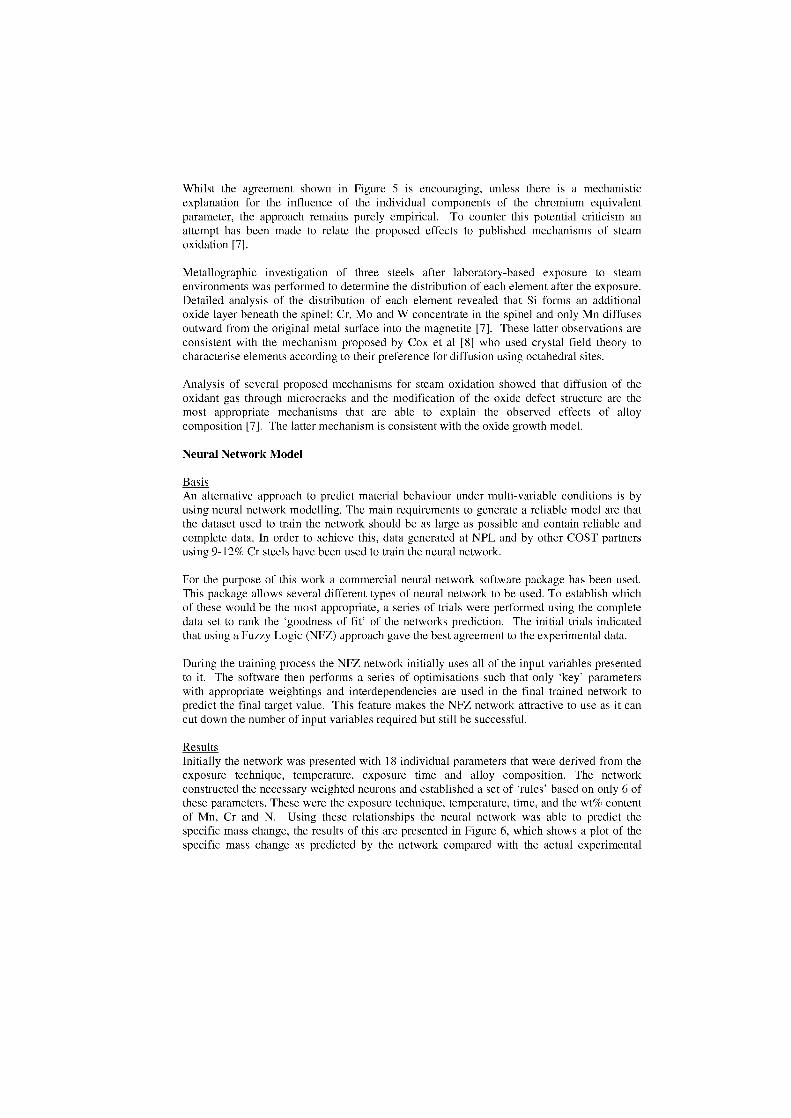
Whilst the agreement shown in Figure 5 is encouraging, unless there is a mechanisticexplanation for the influence of the individual components of the chromium equivalentparameter, the approach remains purely empirical. To counter this potential criticism anattempt has been made to relate the proposed effects to published mechanisms of steamoxidation [7].
Metallographic investigation of three steels after laboratory-based exposure to steamenvironments was performed to determine the distribution of each element after the exposure.Detailed analysis of the distribution of each element revealed that Si forms an additionaloxide layer beneath the spinel; Cr, Mo and W concentrate in the spinel and only Mn diffusesoutward from the original metal surface into the magnetite [7]. These latter observations areconsistent with the mechanism proposed by Cox et al [8] who used crystal field theory tocharacterise elements according to their preference for diffusion using octahedral sites.
Analysis of several proposed mechanisms for steam oxidation showed that diffusion of theoxidant gas through microcracks and the modification of the oxide defect structure are themost appropriate mechanisms that are able to explain the observed effects of alloycomposition [7]. The latter mechanism is consistent with the oxide growth model.
Neural Network Model
BasisAn alternative approach to predict material behaviour under multi-variable conditions is byusing neural network modelling. The main requirements to generate a reliable model are thatthe dataset used to train the network should be as large as possible and contain reliable andcomplete data. In order to achieve this, data generated at NPL and by other COST partnersusing 9-12% Cr steels have been used to train the neural network.
For the purpose of this work a commercial neural network software package has been used.This package allows several different types of neural network to be used. To establish whichof these would be the most appropriate, a series of trials were performed using the completedata set to rank the `goodness of fit' of the networks prediction. The initial trials indicatedthat using a Fuzzy Logic (NFZ) approach gave the best agreement to the experimental data.
During the training process the NFZ network initially uses all of the input variables presentedto it. The software then performs a series of optimisations such that only 'key' parameterswith appropriate weightings and interdependencies are used in the final trained network topredict the final target value. This feature makes the NFZ network attractive to use as it cancut down the number of input variables required but still be successful.
Results Initially the network was presented with 18 individual parameters that were derived from theexposure technique, temperature, exposure time and alloy composition. The networkconstructed the necessary weighted neurons and established a set of 'mies' based an only 6 ofthese parameters. These were the exposure technique, temperature, time, and the wt% contentof Mn, Cr and N. Using these relationships the neural network was able to predict thespecific mass change, the results of this are presented in Figure 6, which shown a plot of thespecific mass change as predicted by the network compared with the actual experimental
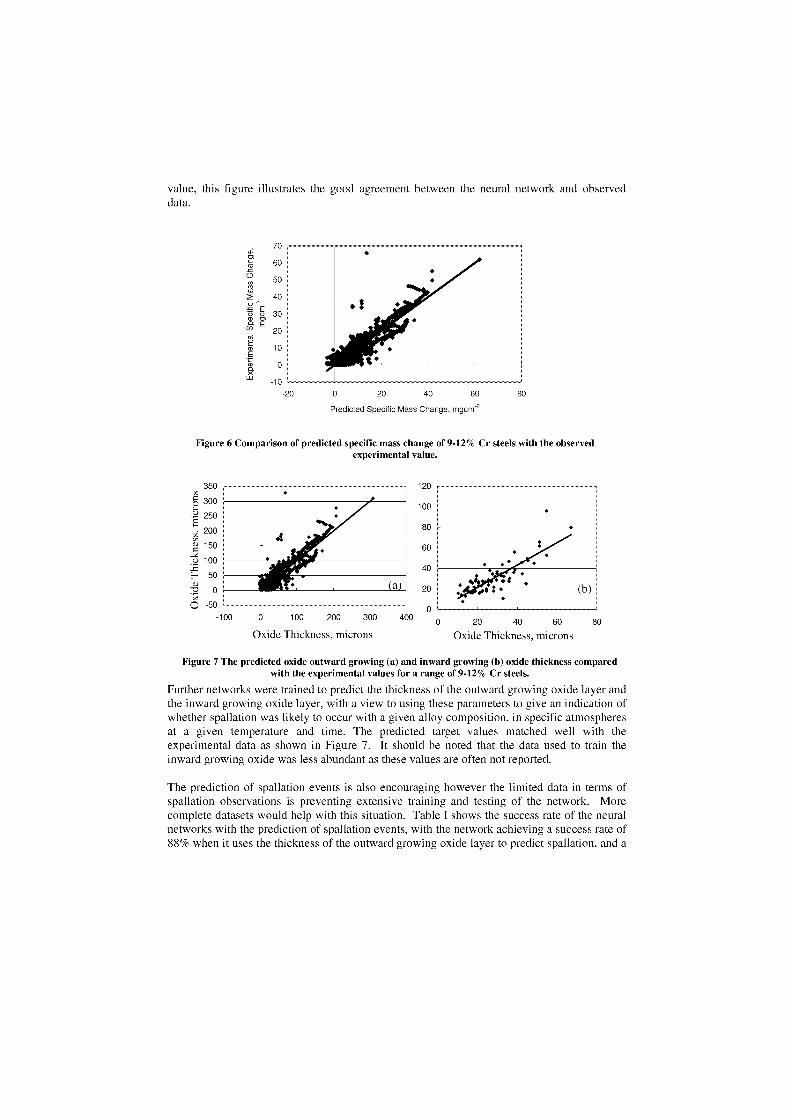
60 80
350
g 300
•"--5 250
200
2 150
o 100
E– 50
re 0•><C) -50
80
Oxide Thickness, microns
value, this figure illustrates the good agreement between the neural network and observeddata.
700)
60
50ro
2 40
e, v 30E3,CI) 20
a) 10E0
10
Predicted Specific Mass Change, mgcre
Figure 6 Comparison of predicted specific mass change of 9-12% Cr steels with the observedexperimental value.
Figure 7 The predicted oxide outward growing (a) and inward growing (b) oxide thickness comparedwith the experimental values for a range of 9-12% Cr steels.
Further networks were trained to predict the thickness of the outward growing oxide layer andthe inward growing oxide layer, with a view to using these parameters to give an indication ofwhether spallation was likely to occur with a given alloy composition, in specific atmospheresat a given temperature and time. The predicted target values matched well with theexperimental data as shown in Figure 7. lt should be noted that the data used to train theinward growing oxide was less abundant as these values are often not reported.
The prediction of spallation events is also encouraging however the limited data in terms ofspallation observations is preventing extensive training and testing of the network. Morecomplete datasets would help with this situation. Table I Shows the success rate of the neuralnetworks with the prediction of spallation events, with the network achieving a success rate of88% when it uses the thickness of the outward growing oxide layer to predict spallation, and a
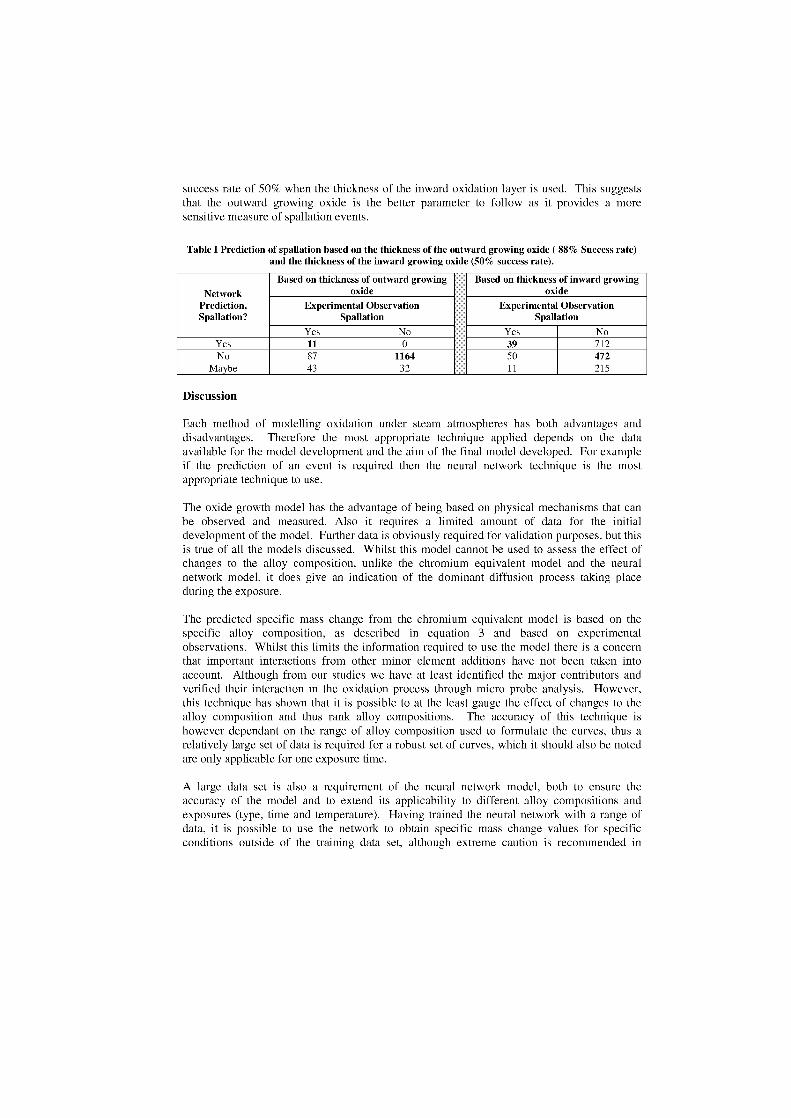
success rate of 50% when the thickness of the inward oxidation layer is used. This suggeststhat the outward growing oxide is the better parameter to follow as it provides a moresensitive measure of spallation events.
Table I Prediction of spallation based on the thickness of the outward growing oxide ( 88% Success rate)and the thickness of the inward growing oxide (50% success rate).
NetworkPrediction,Spallation?
Based on thickness of outward growingoxide
Based on thickness of inward growingoxide
Experimental ObservationSpallation
Experimental ObservationSpallation
Yes No Yes NoYes 11 0 39 712No 87 1164 50 472
Maybe 43 32 11 215
Discussion
Each method of modelling oxidation under steam atmospheres has both advantages anddisadvantages. Therefore the most appropriate technique applied depends on the dataavailable for the model development and the aim of the final model developed. For exampleif the prediction of an event is required then the neural network technique is the mostappropriate technique to use.
The oxide growth model has the advantage of being based on physical mechanisms that canbe observed and measured. Also it requires a limited amount of data for the initialdevelopment of the model. Further data is obviously required for validation purposes, but thisis true of all the modeln discussed. Whilst this model cannot be used to assess the effect ofchanges to the alloy composition, unlike the chromium equivalent model and the neuralnetwork model, it does give an indication of the dominant diffusion process taking placeduring the exposure.
The predicted specific mass change from the chromium equivalent model is based on thespecific alloy composition, as described in equation 3 and based on experimentalobservations. Whilst this limits the information required to use the model there is a concernthat important interactions from other minor element additions have not been taken intoaccount. Although from our studier we have at least identified the major contributors andverified their interaction in the oxidation process through micro probe analysis. However,this technique has shown that it is possible to at the least gauge the effect of changes to thealloy composition and thus rank alloy compositions. The accuracy of this technique ishowever dependant on the range of alloy composition used to formulate the curves, thus arelatively large set of data is required for a robust set of curves, which it should also be notedare only applicable for one exposure time.
A large data set is also a requirement of the neural network model, both to ensure theaccuracy of the model and to extend its applicability to different alloy compositions andexposures (type, time and temperature). Having trained the neural network with a range ofdata, it is possible to use the network to obtain specific mass change values for specificconditions outside of the training data set, although extreme caution is recommended in
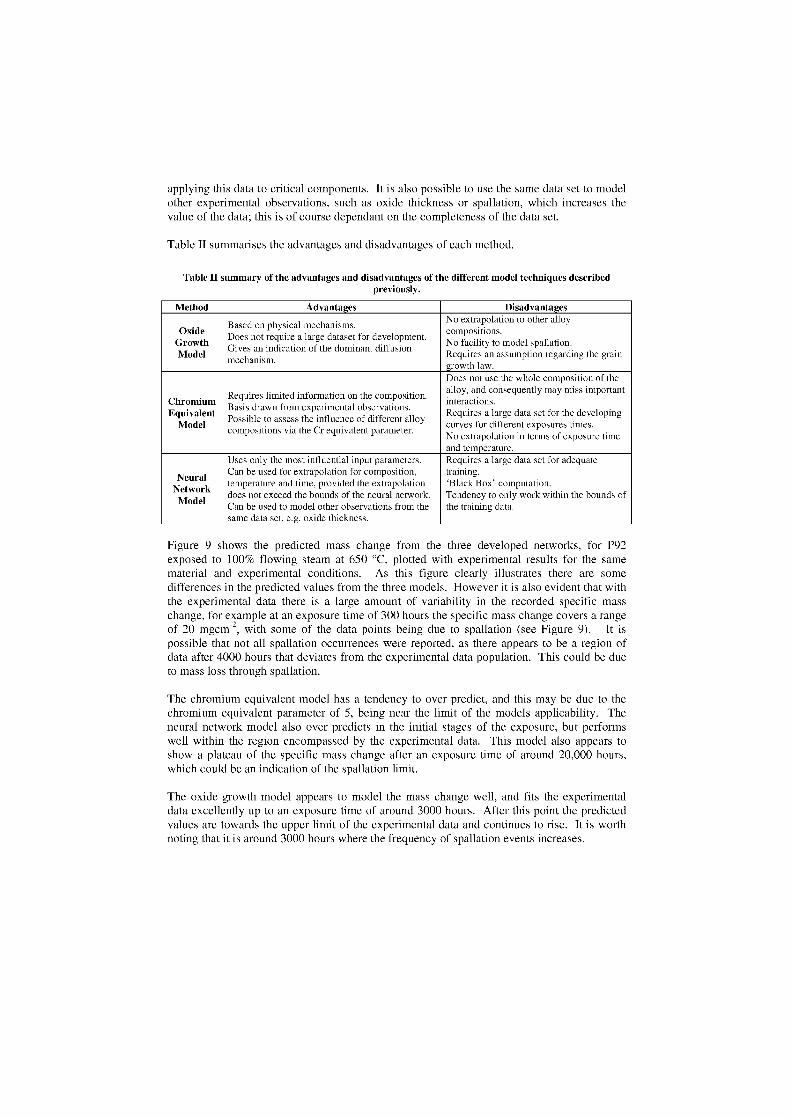
applying this data to critical components. lt is also possible to use the same data set to modelother experimental observations, such as oxide thickness or spallation, which increases thevalue of the data; this is of course dependant on the completeness of the data set.
Table II summarises the advantages and disadvantages of each method.
Table II summary of the advantages and disadvantages of the different model techniques describedpreviously.
Method Advantages Disadvantages
Based on physical mechanisms. No extrapolation to other alloyOxide
GrowthModel
Does not require a large dataset for development.Gives an indication of the dominant diffusionmechanism.
compositions.No facility to model spallation.Requires an assumption regarding the graingrowth law.Does not use the whole composition of the
chromiumEquivalent
Model
Requires limited information on the composition.Basis drawn from experimental observations.Possible to assess the influence of different alloycompositions via the Cr equivalent parameter.
alloy, and consequently may miss importantinteractions.Requires a large data set for the developingcurves for different exposures times.No extrapolation in terms of exposure timeand temperature.
Uses only the most influential input parameters. Requires a large data set for adequate
NeuralCan be used for extrapolation for composition,temperature and time, provided the extrapolation
training.`Black Box' computation.
Network does not exceed the bounds of the neural network. Tendency to only work within the bounds ofModel Can be used to model other observations from the
same data set, e.g. oxide thickness.the training data.
Figure 9 shows the predicted mass change from the three developed networks, for P92exposed to 100% flowing steam at 650 °C, plotted with experimental results for the samematerial and experimental conditions. As this figure clearly illustrates there are somedifferences in the predicted values from the three models. However it is also evident that withthe experimental data there is a large amount of variability in the recorded specific masschange, for example at an exposure time of 300 hours the specific mass change covers a rangeof 20 mgcm -2, with some of the data points being due to spallation (see Figure 9). It ispossible that not all spallation occurrences were reported, as there appears to be a region ofdata after 4000 hours that deviates from the experimental data population. This could be dueto mass loss through spallation.
The chromium equivalent model has a tendency to over predict, and this may be due to thechromium equivalent parameter of 5, being near the limit of the models applicability. Theneural network model also over predicts in the initial stages of the exposure, but performswell within the region encompassed by the experimental data. This model also appears toshow a plateau of the specific mass change after an exposure time of around 20,000 hours,which could be an indication of the spallation limit.
The oxide growth model appears to model the mass change well, and fits the experimentaldata excellently up to an exposure time of around 3000 hours. After this point the predictedvalues are towards the upper limit of the experimental data and continues to rise. lt is worthnoting that it is around 3000 hours where the frequency of spallation events increases.
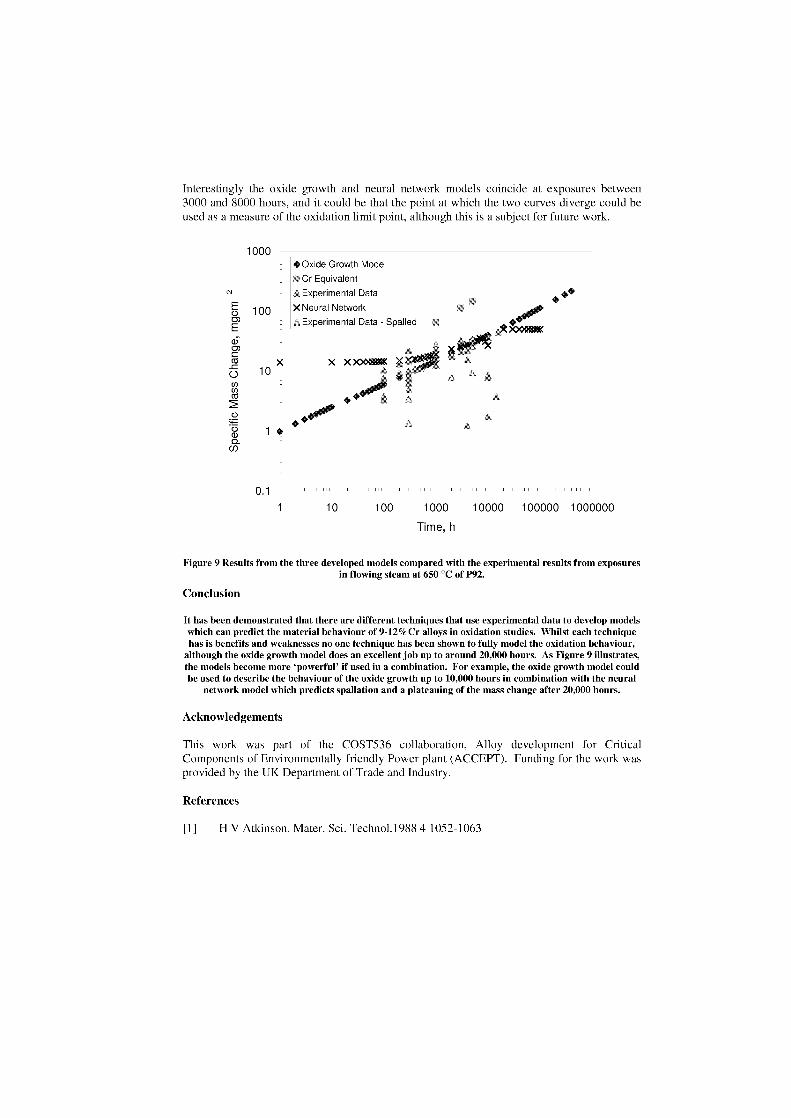
0 100
X X X >0001:38K_c 1 0 _co -
roco
2
♦Oxide Growth ModelCr EquivalentExperimental Data
X Neural NetworkExperimental Data - Spalled
lnterestingly the oxide growth and neural network models coincide at exposures between3000 and 8000 hours, and it could be that the point at which the two curves diverge could beused as a measure of the oxidation limit point, although this is a subject for future work.
Time, h
Figure 9 Results from the three developed models compared with the experimental results from exposuresin flowing steam at 650 °C of P92.
Conclusion
It has been demonstrated that there are different techniques that use experimental data to develop modelswhich can predict the material behaviour of 9-12% Cr alloys in oxidation studies. Whilst each techniquehas is benefits and weaknesses no one technique has been shown to fully model the oxidation behaviour,
although the oxide growth model does an excellent job up to around 20,000 hours. As Figure 9 illustrates,the models become more `powerfur if used in a combination. For example, the oxide growth model couldbe used to describe the behaviour of the oxide growth up to 10,000 hours in combination with the neural
network model which predicts spallation and a plateauing of the mass change after 20,000 hours.
Acknowledgements
This work was part of the COST536 collaboration, Alloy development for CriticalComponents of Environmentally friendly Power plant (ACCEPT). Funding for the work wasprovided by the UK Department of Trade and lndustry.
References
[1] H V Atkinson, Mater. Sci. Techno1.1988 4 1052-1063
[2] P J Ennis and W J Quadakkers, Parsons 2000 Advanced Materials for 21' ` CenturyTurbines and Power Plant, eds A Strang, W M Banks, R D Conroy, G M McColvin, JC Neal and S Simpson, 10M Communications Ltd 2000 pp 265-275
[3] H.L.Solberg, G.A. Hawkins and A.A. Potter, Transactions of the American Society ofMechanical Engineers, 1942, 64, 303.F. Eberle and C.H. Anderson, Journal of Engineering Power, 1962, 84, 223.
[5] P J Ennis and W J Quadakkers in Materials for Advanced Power Engineering 2002,eds J Lecomte-Beckers, M Carton, F Schubert and P J Ennis, pub ForschungszentrumJulich GmbH 2002 pp 1131-1142.
[6] S Osgerby and A T Fry, Advance in Materials Technology for Fossil Power Plants,Proceeding from the Forth International Conference, October 25-28, 2004, 388-397.
[7] S Osgerby and A T Fry, International Symposium an High Temperature Oxidationand Corrosion, Nara, Japan, Nov 2005
[8] M G C Cox, B McEnaney and V D Scott, Nature Physical Science, 1972 237 140
THE INFLUENCE OF OXIDATION ON LONG TERM CREEPRUPTURE STRENGTH DATA
D J Allen' and B Harvey2
E.ON UK, Power Technology, Ratcliffe-on-Soar, Nottingham, NG11 OEE, UK'Mitsui Babcock Energy Ltd, Porterfield Rd., Renfrew, PA4 8DJ, UK2
Abstract
Long term creep tests on ferritic steels in air often show substantial oxidation. This may act to shorten creep lifeand produce over-conservative long term strength data. A recent E911 cross-weld test failed in just below70,000 hours, less than half the predicted life, but the presence of a thick oxide layer gave rise to concern.Failure examination included measurement of metal and oxide thickness variations along the gauge length andcorrelation of diametral contraction data with measured axial elongation. This made it possible to separate outthe effects of creep strain and hence determine metal loss due to oxidation. The results then indicated relativelysmall metal loss values, probably because the oxide was highly porous, and therefore occupied a large volumewhile consuming relatively little metal. The effect of oxidation on long term creep strength values in this highalloy steel thus appears to be a fairly small factor, but it is not negligible. For less oxidation-resistant materials,the development of appropriate oxidation correction techniques and their validation by inert atmosphere testingmay be essential to obtain reliable long term creep strength values.
Keywords: Creep, testing, oxidation, high alloy steel, advanced power plant materials
Introduction
Recently, the final high alloy steel E911 cross-weld creep rupture test specimen from theMitsui Babcock (MBEL) "ACCTS" project [1], tested at 650°C and 26 MPa, failed after69,334 hours. This was over twice the duration of the previous longest failed test in theEuropean Creep Collaborative Committee (ECCC) E911 weld data set. Its rupture life wasbelow half that predicted [2] from previous ECCC data, but considerable oxidation wasevident. A simple calculation based on overall diameter measurement suggested that the lifeshortfall might be largely due to oxidation-induced loss of section. This gave rise to theconcern that even in high alloy ferritic steels, long term creep test results or dataextrapolations to realistic end-of-life conditions might be seriously compromised by oxidationeffects.
Initial measurements indicated a 0.6mm increase in specimen diameter at the weld. On theconventional assumption of a Pilling-Bedworth ratio of two, this suggested an oxide thicknessof 0.6mm (single layer), with the total diameter thus increased to 8.57mm, and the metaldiameter reduced by oxidation (ignoring the additional effects of creep strain) to 7.37mm. Onsuch an assumption, the effective stress would be increased by 17% at the end of the test.
Many workers have modelled the effects of oxidation on creep life, with differing results. Forexample, Hart [3] attempted to allow for the fact that as oxidation progresses, the net sectionstress on the remaining metal increases, and so the enhancement in rate of creep lifeconsumption increases throughout the test. This analysis produced a rather complex formulaand introduced a factor described as the "creep life fraction at failure". This was treated as an
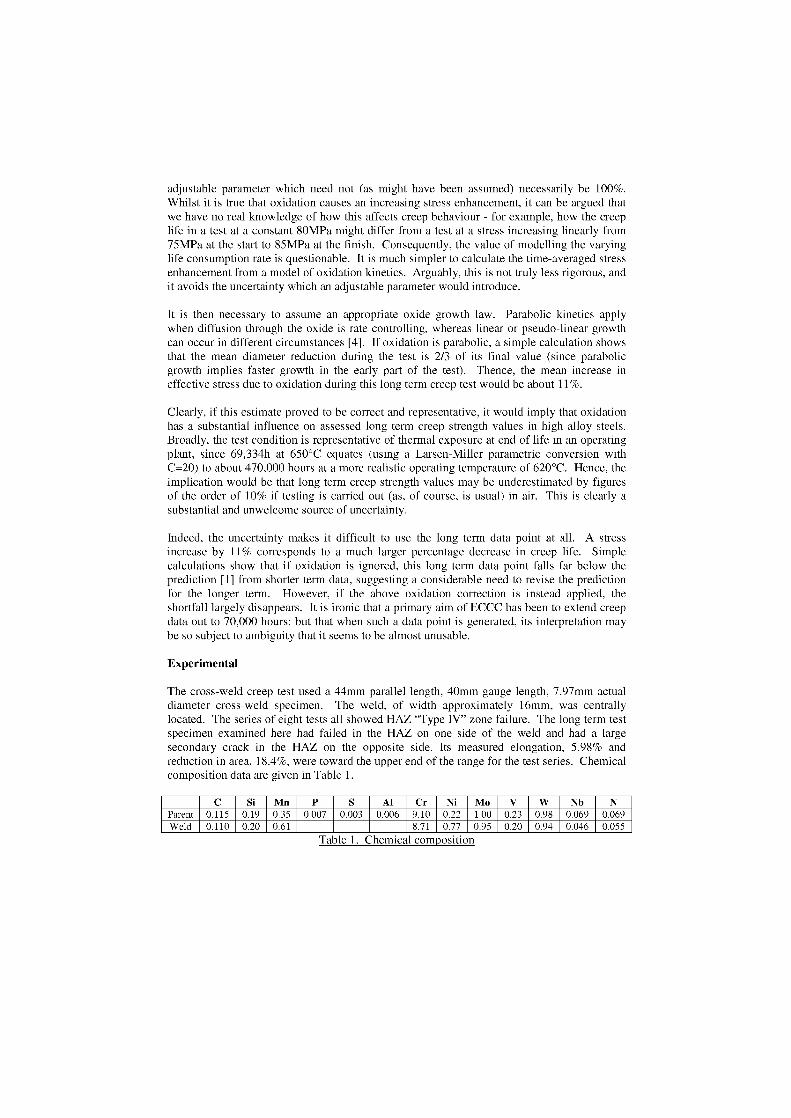
adjustable parameter which need not (as might have been assumed) necessarily be 100%.Whilst it is true that oxidation causes an increasing stress enhancement, it can be argued thatwe have no real knowledge of how this affects creep behaviour - for example, how the creeplife in a test at a constant 80MPa might differ from a test at a stress increasing linearly from75MPa at the start to 85MPa at the finish. Consequently, the value of modelling the varyinglife consumption rate is questionable. lt is much simpler to calculate the time-averaged stressenhancement from a model of oxidation kinetics. Arguably, this is not truly less rigorous, andit avoids the uncertainty which an adjustable parameter would introduce.
lt is then necessary to assume an appropriate oxide growth law. Parabolic kinetics applywhen diffusion through the oxide is rate controlling, whereas linear or pseudo-linear growthcan occur in different circumstances [4]. If oxidation is parabolic, a simple calculation showsthat the mean diameter reduction during the test is 2/3 of its final value (since parabolicgrowth implies faster growth in the early part of the test). Thence, the mean increase ineffective stress due to oxidation during this long term creep test would be about 11%.
Clearly, if this estimate proved to be correct and representative, it would imply that oxidationhas a substantial influence on assessed long term creep strength values in high alloy steels.Broadly, the test condition is representative of thermal exposure at end of life in an operatingplant, since 69,334h at 650°C equates (using a Larsen-Miller parametric conversion withC=20) to about 470,000 hours at a more realistic operating temperature of 620°C. Hence, theimplication would be that long term creep strength values may be underestimated by figuresof the order of 10% if testing is carried out (as, of course, is usual) in air. This is clearly asubstantial and unwelcome source of uncertainty.
Indeed, the uncertainty makes it difficult to use the long term data point at all. A stressincrease by 11% corresponds to a much larger percentage decrease in creep life. Simplecalculations show that if oxidation is ignored, this long term data point falls far below theprediction [1] from shorter term data, suggesting a considerable need to revise the predictionfor the longer term. However, if the above oxidation correction is instead applied, theshortfall largely disappears. It is ironic that a primary aim of ECCC has been to extend creepdata out to 70,000 hours: but that when such a data point is generated, its interpretation maybe so subject to ambiguity that it seems to be almost unusable.
Experimental
The cross-weld creep test used a 44mm parallel length, 40mm gauge length, 7.97mm actualdiameter cross-weld specimen. The weld, of width approximately 16mm, was centrallylocated. The series of eight tests all showed HAZ "Type 1V" zone failure. The long term testspecimen examined here had failed in the HAZ on one side of the weld and had a largesecondary crack in the HAZ on the opposite side. Its measured elongation, 5.98% andreduction in area, 18.4%, were toward the upper end of the range for the test series. Chemicalcomposition data are given in Table 1.
C Si Mn P S Al Cr Ni Mo V W Nb NParent 0.115 0.19 0.35 0.007 0.003 0.006 9.10 0.22 1.00 0.23 0.98 0.069 0.069Weld 0.110 0.20 0.61 8.71 0.77 0.95 0.20 0.94 0.046 0.055
Table 1. Chemical composition
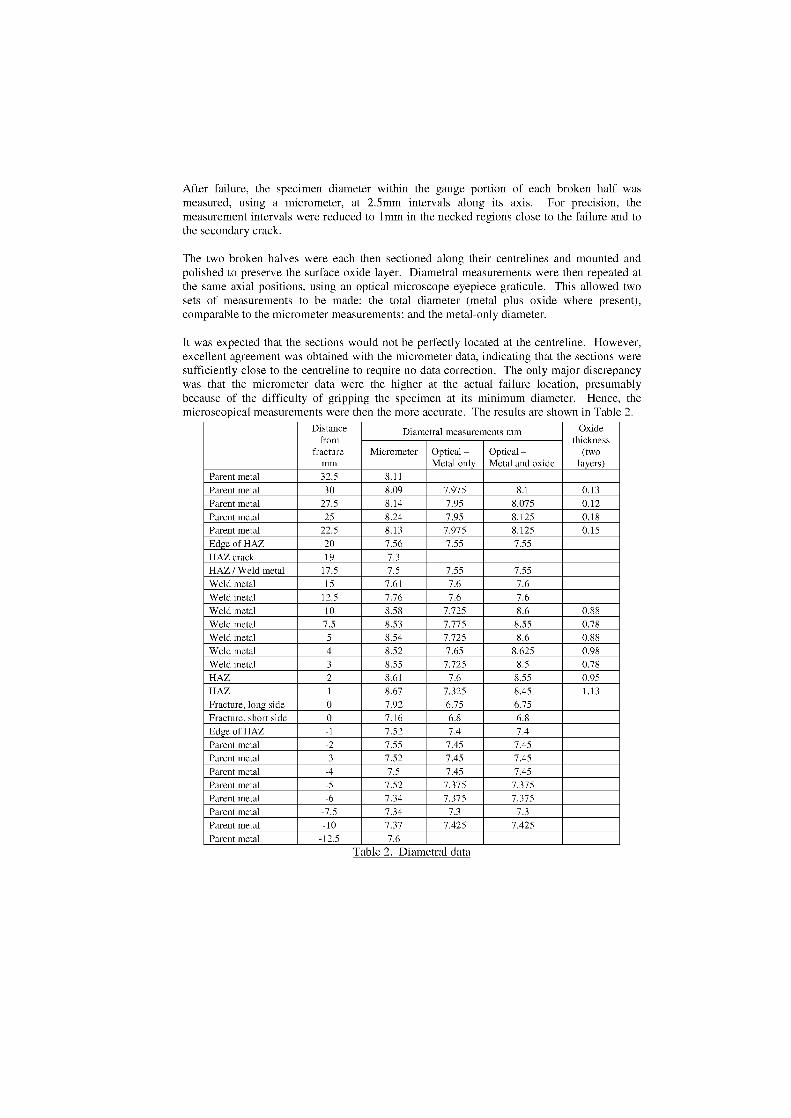
After failure, the specimen diameter within the gauge portion of each broken half wasmeasured, using a micrometer, at 2.5mm intervals along its axis. For precision, themeasurement intervals were reduced to lmm in the necked regions dose to the failure and tothe secondary crack.
The two broken halves were each then sectioned along their centrelines and mounted andpolished to preserve the surface oxide layer. Diametral measurements were then repeated atthe same axial positions, using an optical microscope eyepiece graticule. This allowed twosets of measurements to be made: the total diameter (metal plus oxide where present),comparable to the micrometer measurements; and the metal-only diameter.
lt was expected that the sections would not be perfectly located at the centreline. However,excellent agreement was obtained with the micrometer data, indicating that the sections weresufficiently dose to the centreline to require no data correction. The only major discrepancywas that the micrometer data were the higher at the actual failure location, presumablybecause of the difficulty of gripping the specimen at its minimum diameter. Hence, themicroscopical measurements were then the more accurate. The results are shown in Table 2.
Distancefrom
fracturemm
Diametral measurements mm Oxidethickness
(twolayers)
Micrometer Optical -Metal only
Optical -Metal and oxide
Parent metal 32.5 8.11Parent metal 30 8.09 7.975 8.1 0.13Parent metal 27.5 8.14 7.95 8.075 0.12Parent metal 25 8.24 7.95 8.125 0.18Parent metal 22.5 8.13 7.975 8.125 0.15Edge of HAZ 20 7.56 7.55 7.55HAZ crack 19 7.3HAZ / Weld metal 17.5 7.5 7.55 7.55Weld metal 15 7.61 7.6 7.6Weld metal 12.5 7.76 7.6 7.6Weld metal 10 8.58 7.725 8.6 0.88Weld metal 7.5 8.53 7.775 8.55 0.78Weld metal 5 8.54 7.725 8.6 0.88Weld metal 4 8.52 7.65 8.625 0.98Weld metal 3 8.55 7.725 8.5 0.78HAZ 2 8.61 7.6 8.55 0.95HAZ 1 8.67 7.325 8.45 1.13Fracture, long side 0 7.92 6.75 6.75Fracture, short side 0 7.16 6.8 6.8Edge of HAZ -1 7.52 7.4 7.4Parent metal -2 7.55 7.45 7.45Parent metal -3 7.52 7.45 7.45Parent metal -4 7.5 7.45 7.45Parent metal -5 7.52 7.375 7.375Parent metal -6 7.34 7.375 7.375Parent metal -7.5 7.34 7.3 7.3Parent metal -10 7.37 7.425 7.425Parent metal -12.5 7.6
Table 2. Diametral data
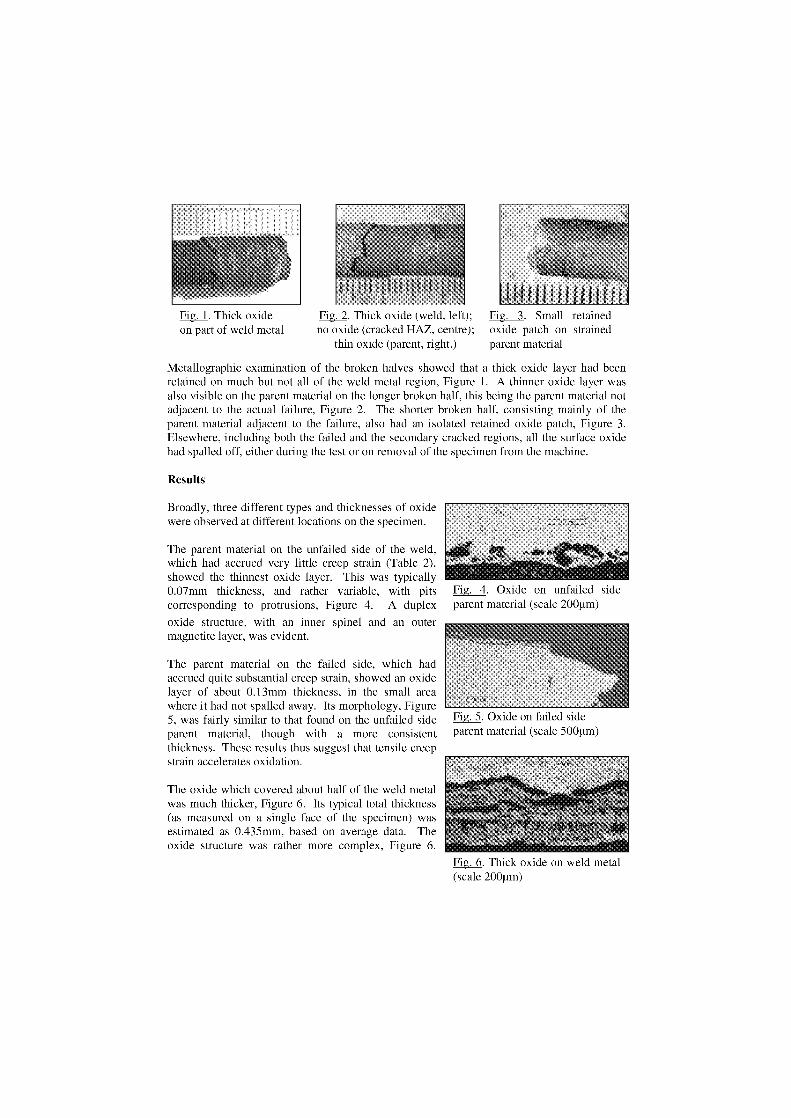
Fig. 1. Thick oxide Fig. 2. Thick oxide (weld, left); Fig. 3. Small retainedon part of weld metal no oxide (cracked HAZ, centre); oxide patch on strained
thin oxide (parent, right.) parent material
Metallographic examination of the broken halves showed that a thick oxide layer had beenretained on much but not all of the weld metal region, Figure 1. A thinner oxide layer wasalso visible on the parent material on the longer broken half, this being the parent material notadjacent to the actual failure, Figure 2. The shorter broken half, consisting mainly of theparent material adjacent to the failure, also had an isolated retained oxide patch, Figure 3.Elsewhere, including both the failed and the secondary cracked regions, all the surface oxidehad spalled off, either during the test or on removal of the specimen from the machine.
Results
Broadly, three different types and thicknesses of oxidewere observed at different locations on the specimen.
The parent material on the unfailed side of the weld,which had accrued very little creep strain (Table 2),showed the thinnest oxide layer. This was typically0.07mm thickness, and rather variable, with pitscorresponding to protrusions, Figure 4. A duplex
oxide structure, with an inner spinel and an outermagnetite layer, was evident.
The parent material on the failed side, which hadaccrued quite substantial creep strain, showed an oxidelayer of about 0.13mm thickness, in the small areawhere it had not spalled away. lts morphology, Figure5, was fairly similar to that found on the unfailed sideparent material, though with a more consistentthickness. These results thus suggest that tensile creepstrain accelerates oxidation.
The oxide which covered about half of the weld metalwas much thicker, Figure 6. lts typical total thickness(as measured on a single face of the specimen) wasestimated as 0.435mm, based on average data. Theoxide structure was rather more complex, Figure 6.
Fig. 4. Oxide on unfailed sideparent material (scale 200)tm)
Fig. 5. Oxide on failed sideparent material (scale 500)1m)
Fig. 6. Thick oxide on weld metal(scale 200)tm)
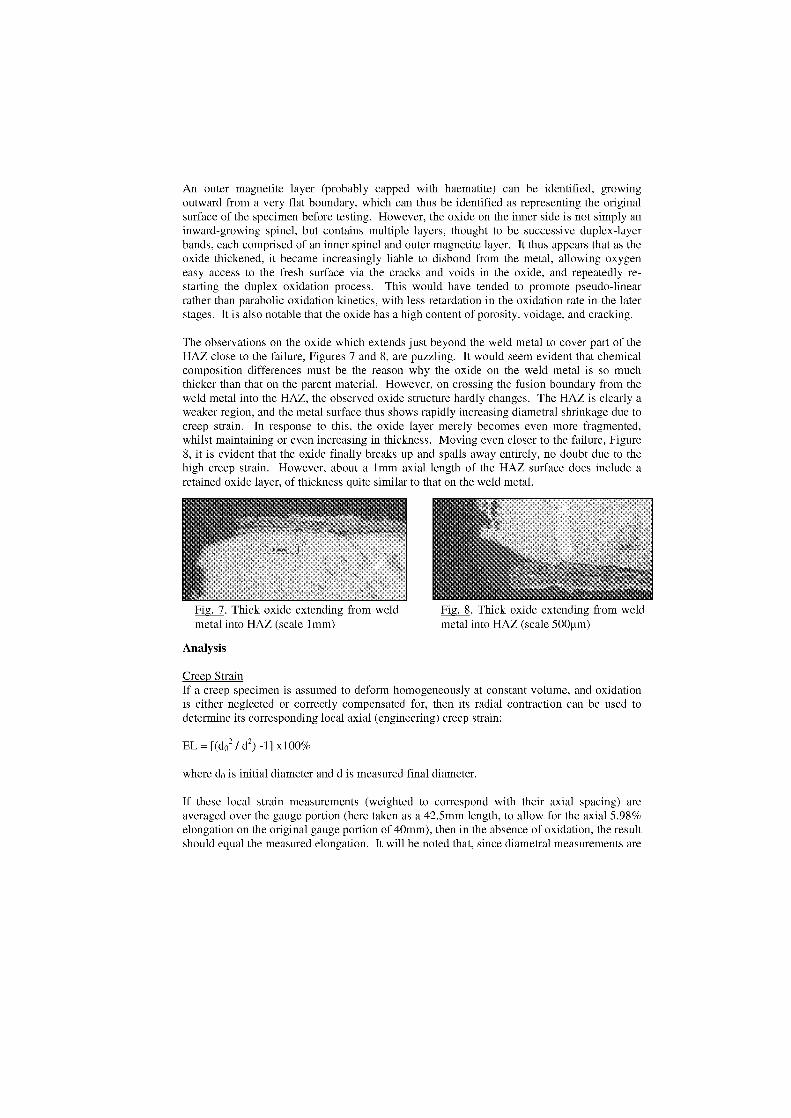
An outer magnetite layer (probably capped with haematite) can be identified, growingoutward from a very flat boundary, which can thus be identified as representing the originalsurface of the specimen before testing. However, the oxide on the inner side is not simply aninward-growing spinel, but contains multiple layers, thought to be successive duplex-layerbands, each comprised of an inner spinel and outer magnetite layer. lt thus appears that as theoxide thickened, it became increasingly liable to disbond from the metal, allowing oxygeneasy access to the fresh surface via the cracks and voids in the oxide, and repeatedly re-starting the duplex oxidation process. This would have tended to promote pseudo-linearrather than parabolic oxidation kinetics, with less retardation in the oxidation rate in the laterstages. lt is also notable that the oxide has a high content of porosity, voidage, and cracking.
The observations on the oxide which extends just beyond the weld metal to cover part of theHAZ dose to the failure, Figures 7 and 8, are puzzling. lt would seem evident that chemicalcomposition differences must be the reason why the oxide on the weld metal is so muchthicker than that on the parent material. However, on crossing the fusion boundary from theweld metal into the HAZ, the observed oxide structure hardly changes. The HAZ is clearly aweaker region, and the metal surface thus shows rapidly increasing diametral shrinkage due tocreep strain. In response to this, the oxide layer merely becomes even more fragmented,whilst maintaining or even increasing in thickness. Moving even closer to the failure, Figure8, it is evident that the oxide finally breaks up and spalls away entirely, no doubt due to thehigh creep strain. However, about a 1 mm axial length of the HAZ surface does include aretained oxide layer, of thickness quite similar to that on the weld metal.
Fig. 7. Thick oxide extending from weld Fig. 8. Thick oxide extending from weldmetal into HAZ (scale 1 mm)
metal into HAZ (scale 500jim)
Analysis
Creep Strain If a creep specimen is assumed to deform homogeneously at constant volume, and oxidationis either neglected or correctly compensated for, then its radial contraction can be used todetermine its corresponding local axial (engineering) creep strain:
EL = [(d02 / d2) -1 x l 00%
where do is initial diameter and d is measured final diameter.
If these local strain measurements (weighted to correspond with their axial spacing) areaveraged over the gauge portion (here taken as a 42.5mm length, to allow for the axial 5.98%elongation on the original gauge portion of 40mm), then in the absence of oxidation, the resultshould equal the measured elongation. lt will be noted that, since diametral measurements are
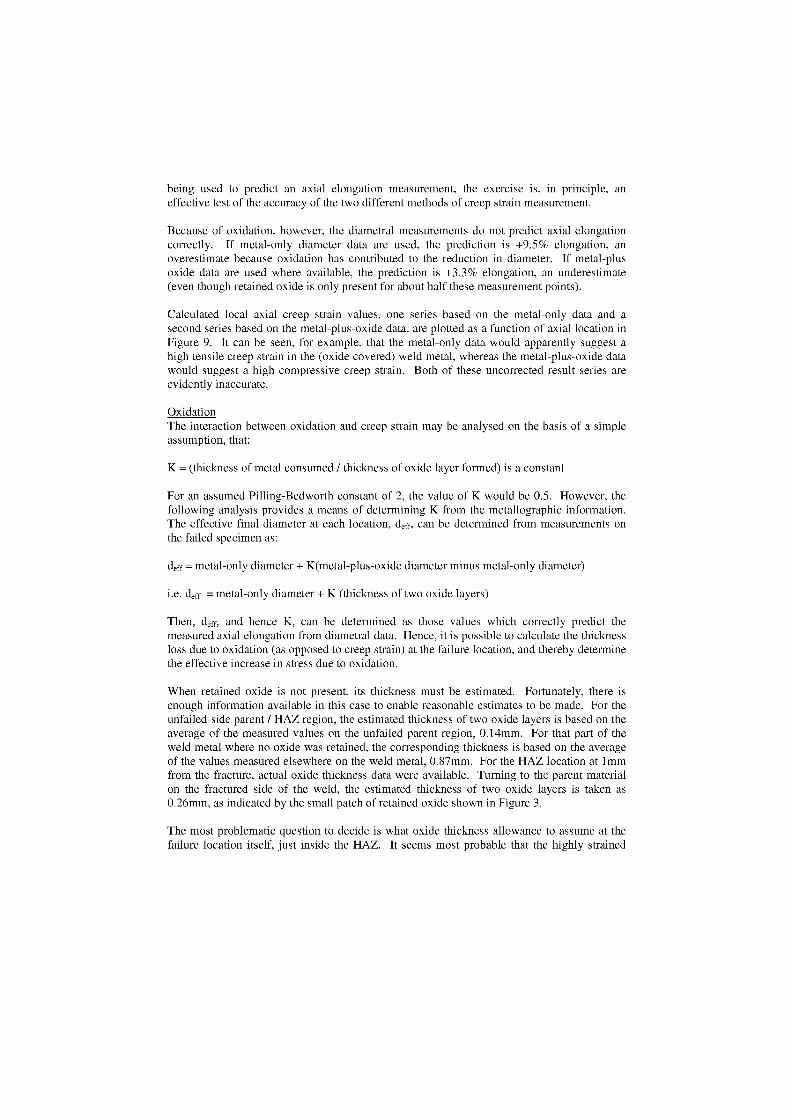
being used to predict an axial elongation measurement, the exercise is, in principle, aneffective test of the accuracy of the two different methods of creep strain measurement.
Because of oxidation, however, the diametral measurements do not predict axial elongationcorrectly. If metal-only diameter data are used, the prediction is +9.5% elongation, anoverestimate because oxidation has contributed to the reduction in diameter. If metal-plusoxide data are used where available, the prediction is +3.3% elongation, an underestimate(even though retained oxide is only present for about half these measurement points).
Calculated local axial creep strain values, one series based on the metal-only data and asecond series based on the metal-plus-oxide data, are plotted as a function of axial location inFigure 9. lt can be seen, for example, that the metal-only data would apparently suggest ahigh tensile creep strain in the (oxide covered) weld metal, whereas the metal-plus-oxide datawould suggest a high compressive creep strain. Both of these uncorrected result series areevidently inaccurate.
Oxidation The interaction between oxidation and creep strain may be analysed on the basis of a simpleassumption, that:
K = (thickness of metal consumed / thickness of oxide layer formed) is a constant
For an assumed Pilling-Bedworth constant of 2, the value of K would be 0.5. However, thefollowing analysis provides a means of determining K from the metallographic information.The effective final diameter at each location, d eff, can be determined from measurements onthe failed specimen as:
deff = metal-only diameter + K(metal-plus-oxide diameter minus metal-only diameter)
i.e. deff = metal-only diameter + K (thickness of two oxide layers)
Then, deff, and hence K, can be determined as those values which correctly predict themeasured axial elongation from diametral data. Hence, it is possible to calculate the thicknessloss due to oxidation (as opposed to creep strain) at the failure location, and thereby determinethe effective increase in stress due to oxidation.
When retained oxide is not present, its thickness must be estimated. Fortunately, there isenough information available in this case to enable reasonable estimates to be made. For theunfailed-side parent / HAZ region, the estimated thickness of two oxide layers is based on theaverage of the measured values on the unfailed parent region, 0.14mm. For that part of theweld metal where no oxide was retained, the corresponding thickness is based on the averageof the values measured elsewhere on the weld metal, 0.87mm. For the HAZ location at 1 mmfrom the fracture, actual oxide thickness data were available. Turning to the parent materialon the fractured side of the weld, the estimated thickness of two oxide layers is taken as0.26mm, as indicated by the small patch of retained oxide shown in Figure 3.
The most problematic question to decide is what oxide thickness allowance to assume at thefailure location itself, just inside the HAZ. lt seems most probable that the highly strained
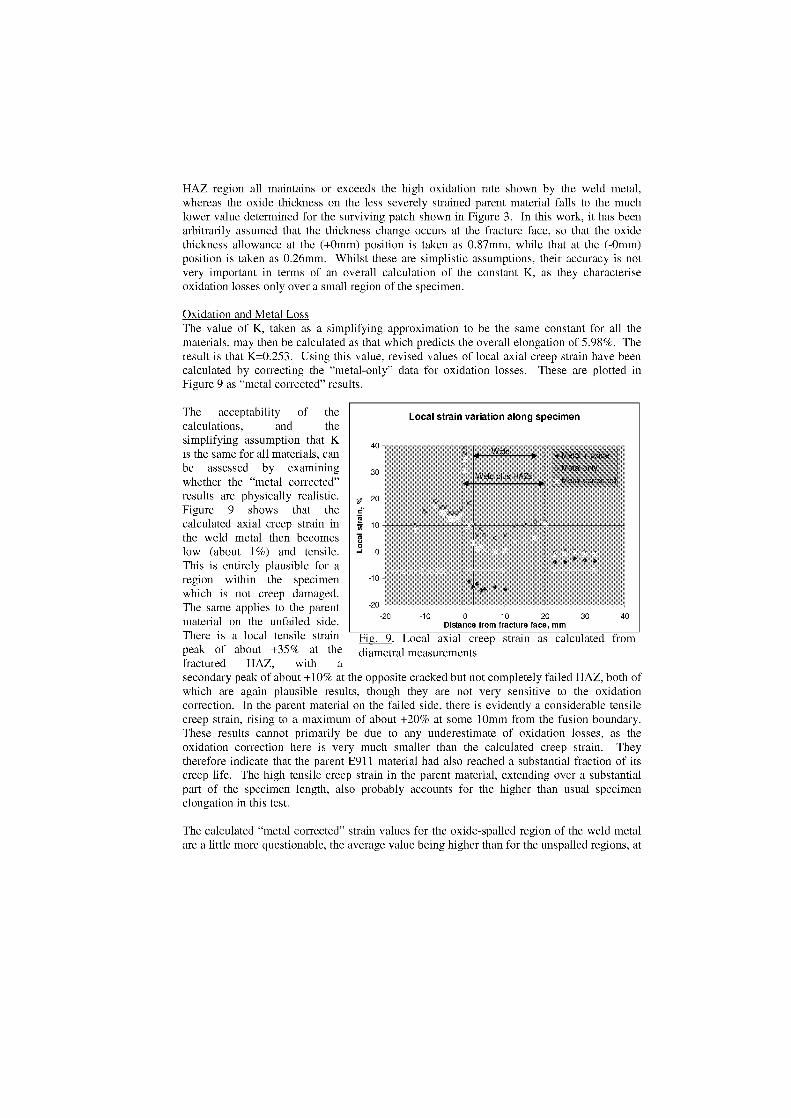
W
Local strain variation along specimen
ci plus HAZs
40
30
20
•
7, 10
00
-10
-20-10 0 10 20 30
Distance from fracture face, mm-20 40
Fig. 9. Local axial creep strain as calculated fromdiametral measurements
HAZ region all maintains or exceeds the high oxidation rate shown by the weld metal,whereas the oxide thickness on the less severely strained parent material falls to the muchlower value determined for the surviving patch shown in Figure 3. In this work, it has beenarbitrarily assumed that the thickness change occurs at the fracture face, so that the oxidethickness allowance at the (+Omm) position is taken as 0.87mm, while that at the (-Omm)position is taken as 0.26mm. Whilst these are simplistic assumptions, their accuracy is notvery important in terms of an overall calculation of the constant K, as they characteriseoxidation losses only over a small region of the specimen.
Oxidation and Metal Loss The value of K, taken as a simplifying approximation to be the same constant for all thematerials, may then be calculated as that which predicts the overall elongation of 5.98%. Theresult is that K=0.253. Using this value, revised values of local axial creep strain have beencalculated by correcting the "metal-only" data for oxidation losses. These are plotted inFigure 9 as "metal corrected" results.
The acceptability of thecalculations, and thesimplifying assumption that Kis the same for all materials, canbe assessed by examiningwhether the "metal corrected"results are physically realistic.Figure 9 shows that thecalculated axial creep strain inthe weld metal then becomeslow (about 1%) and tensile.This is entirely plausible for aregion within the specimenwhich is not creep damaged.The same applies to the parentmaterial on the unfailed side.There is a local tensile strainpeak of about +35% at thefractured HAZ, with asecondary peak of about +10% at the opposite cracked but not completely failed HAZ, both ofwhich are again plausible results, though they are not very sensitive to the oxidationcorrection. In the parent material on the failed side, there is evidently a considerable tensilecreep strain, rising to a maximum of about +20% at some lOmm from the fusion boundary.These results cannot primarily be due to any underestimate of oxidation losses, as theoxidation correction here is very much smaller than the calculated creep strain. Theytherefore indicate that the parent E91 1 material had also reached a substantial fraction of itscreep life. The high tensile creep strain in the parent material, extending over a substantialpart of the specimen length, also probably accounts for the higher than usual specimenelongation in this test.
The calculated "metal corrected" strain values for the oxide-spalled region of the weld metalare a little more questionable, the average value being higher than for the unspalled regions, at

around 4%. lt is conceivable that these regions did accrue greater strains than the oxide-unspalled weld metal, but it is more probable that the oxidation losses have been somewhatunderestimated. 1f the metal losses in the spalled region were in fact some 50% greater thanthose in the unspalled region, then the creep strain data on the two regions would be broughtinto line. This seems credible, as spallation exposes a fresh surface which can oxidise morerapidly. lt thus seems likely that oxide spallation does increase the metal loss rate, albeit to afairly moderate extent. To test sensitivity to the assumptions made, the K calculation wasrepeated with weld metal strain values adjusted to 1% for the spalled weld metal regions.This gave only a marginal reduction in the calculated K value, from 0.253 to 0.235.
The result that K=0.253 can thus be confirmed as a reasonable best estimate for thisspecimen. There is some uncertainty, but it is clearly more appropriate than the conventional(and very different) assumption that K=0.5. The main explanation is probably that the oxidelayer is highly porous and fractured, and therefore occupies more space. In consequence, thetrue metal loss is much smaller than would be calculated on the K=0.5 assumption.
Effect of Oxidation on Applied Stress The derived K value may then be used to calculate the extent of metal loss, at the failurelocation, at the end of the test. This, however, is the stage at which the most criticalassumption is required. lt is necessary to assume a value for the oxide layer thickness at thefailure, given that no retained oxide is present in this highly strained region.
As noted earlier, the oxide layer on the HAZ seems to become somewhat thicker, but alsomore porous or fractured, than that on the weld metal. lt seems reasonable, therefore, to adoptthe average thickness value (two oxide layers) of 0.87mm which was obtained for the weldmetal. On that assumption, and with K = 0.253, the metal loss is 0.22mm. This acts to reducethe diameter from 7.97mm to 7.75mm by the end of the test, and thus to increase the stress by5.8%. As noted earlier, however, the mean stress increase during the course of the test is, ifoxidation is parabolic, 2/3 of the final value. Hence, the effect of oxidation is to increase themean applied stress by 3.8%. This equates to a change in the applicable stress value from26 MPa (applied engineering stress) to 26.98 MPa. (For a linear oxidation model, the meanstress would be half of the final value, and so the effect would be somewhat less.)
The assumptions on oxide thickness at the position of failure, however, can only be bestguesses. A higher value will apply if repeated oxide spallation and regrowth causes fastermetal loss in the rapidly straining zone dose to the failure. The calculated effect of oxidationtherefore probably represents a lower bound estimate. The real effect could be greater.
Implications
E91 1 cross-weld data assessmentAccording to this analysis, the long term creep strength value in this test is underpredicted byslightly less than 4%. This is equivalent [2] to an underprediction of about 18% in terms ofmean creep life. These are not entirely negligible figures, but they are considerably smallerthan the 11 % strength underprediction figure previously suggested on the basis of simpleestimates from the overall diametral measurements. Micrometer measurement alone istherefore not sufficient to assess the effects of oxidation with any accuracy.
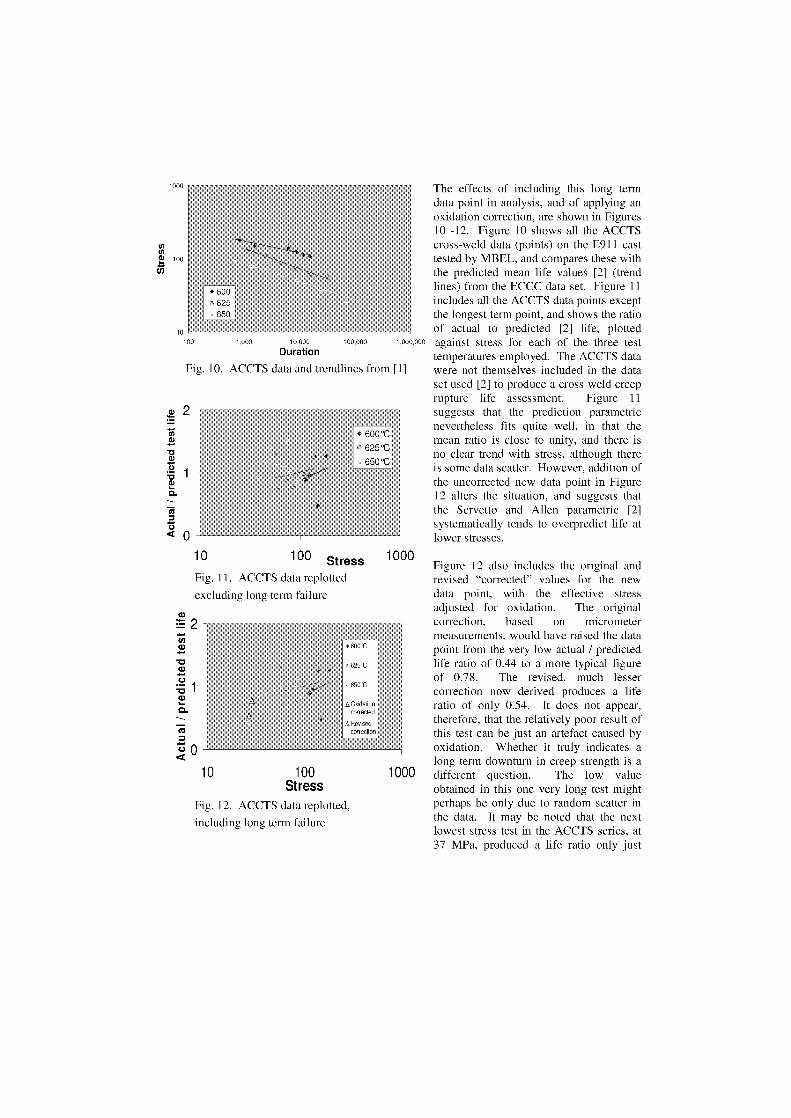
1000 The effects of including this long termdata point in analysis, and of applying anoxidation correction, are shown in Figures10 -12. Figure 10 shows all the ACCTScross-weld data (points) on the E911 cast
100 tested by MBEL, and compares there withthe predicted mean life values [2] (trendlines) from the ECCC data set. Figure 11includes all the ACCTS data points exceptthe longest term point, and shows the ratio
0 of actual to predicted [2] life, plotted100 1,000 10,000 100,000 1,000,000 against stress for each of the three test
Duration temperatures employed. The ACCTS dataFig. 10. ACCTS data and trendlines from [1]
were not themselves included in the dataset used [2] to produce a cross-weld creeprupture life assessment. Figure 11suggests that the prediction parametricnevertheless fits quite well, in that themean ratio is dose to unity, and there isno clear trend with stress, although therecu
0 2
100 StressFig. 11. ACCTS data replotted
excluding long term failure
w0_
100Stress
Fig. 12. ACCTS data replotted,
including long term failure
6251C
6501C
A 0,1datIoncorrectedRevsecorrecl
is some data scatter. However, addition ofthe uncorrected new data point in Figure12 alters the situation, and suggests thatthe Servetto and Allen parametric [2]systematically tends to overpredict life atlower Stresses.
1000Figure 12 also includes the original andrevised "corrected" values for the newdata point, with the effective stressadjusted for oxidation. The originalcorrection, based on micrometermeasurements, would have raised the datapoint from the very low actual / predictedlife ratio of 0.44 to a more typical figureof 0.78. The revised, much lessercorrection now derived produces aratio of only 0.54. lt does not appear,therefore, that the relatively poor result ofthis test can be just an artefact caused byoxidation. Whether it truly indicates along term downturn in creep strength is a
1000 different question. The low valueobtained in this one very long test mightperhaps be only due to random scatter inthe data. lt may be noted that the nextlowest stress test in the ACCTS series, at37 MPa, produced a life ratio only just
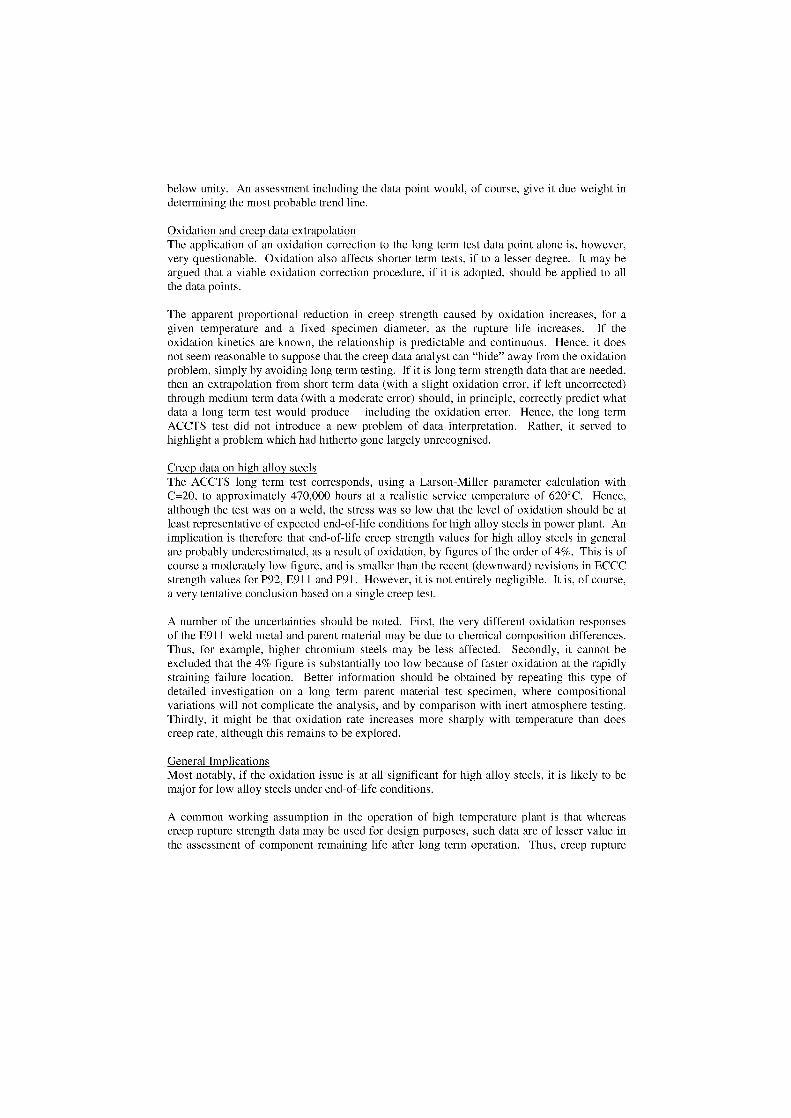
below unity. An assessment including the data point would, of course, give it due weight indetermining the most probable trend line.
Oxidation and creep data extrapolation The application of an oxidation correction to the long term test data point alone is, however,very questionable. Oxidation also affects shorter term tests, if to a lesser degree. lt may beargued that a viable oxidation correction procedure, if it is adopted, should be applied to allthe data points.
The apparent proportional reduction in creep strength caused by oxidation increases, for agiven temperature and a fixed specimen diameter, as the rupture life increases. If theoxidation kinetics are known, the relationship is predictable and continuous. Hence, it doesnot seem reasonable to suppose that the creep data analyst can "hide" away from the oxidationproblem, simply by avoiding long term testing. If it is long term strength data that are needed,then an extrapolation from short term data (with a slight oxidation error, if left uncorrected)through medium term data (with a moderate error) should, in principle, correctly predict whatdata a long term test would produce – including the oxidation error. Hence, the long termACCTS test did not introduce a new problem of data interpretation. Rather, it served tohighlight a problem which had hitherto gone largely unrecognised.
Creep data on high alloy steels The ACCTS long term test corresponds, using a Larson-Miller parameter calculation withC=20, to approximately 470,000 hours at a realistic service temperature of 620°C. Hence,although the test was on a weld, the stress was so low that the level of oxidation should be atleast representative of expected end-of-life conditions for high alloy steels in power plant. Animplication is therefore that end-of-life creep strength values for high alloy steels in generalare probably underestimated, as a result of oxidation, by figures of the order of 4%. This is ofcourse a moderately low figure, and is smaller than the recent (downward) revisions in ECCCstrength values for P92, E911 and P91. However, it is not entirely negligible. lt is, of course,a very tentative conclusion based on a single creep test.
A number of the uncertainties should be noted. First, the very different oxidation responsesof the E91 1 weld metal and parent material may be due to chemical composition differences.Thus, for example, higher chromium steels may be less affected. Secondly, it cannot beexcluded that the 4% figure is substantially too low because of faster oxidation at the rapidlystraining failure location. Better information should be obtained by repeating this type ofdetailed investigation on a long term parent material test specimen, where compositionalvariations will not complicate the analysis, and by comparison with inert atmosphere testing.Thirdly, it might be that oxidation rate increases more sharply with temperature than doescreep rate, although this remains to be explored.
General Im pli cati on s Most notably, if the oxidation issue is at all significant for high alloy steels, it is likely to bemajor for low alloy steels under end-of-life conditions.
A common working assumption in the operation of high temperature plant is that whereascreep rupture strength data may be used for design purposes, such data are of lesser value inthe assessment of component remaining life after long term operation. Thus, creep rupture
data on as-manufactured materials inevitably relate to short and medium term exposure,whereas remaining life may perhaps be better investigated by testing the actual long termexposed material. However, this approach does place reliance on obtaining and testingspecific samples with differing service histories, while making less use of establishedinformation databases on creep rupture properties.
Recent developments, for example references [5, 6], suggest that creep rupture dataassessment is now – if rather belatedly - becoming a reasonably exact science. With theabandonment of unsuitable techniques and the development of more accurate models, it mayno longer be appropriate to ignore what can be done to predict component remaining life fromthe data on as-manufactured materials. For example, a creep rupture database on a largenumber of different casts of a specified steel should, in principle, provide a good way ofidentifying its lower bound material characteristics and properties. Remanent life testing,which will inevitably be limited to a restricted selection of samples taken from aged plant,may not easily pick out the particular cast from a wide range of components which will havethe lowest remaining life.
Oxidation remains a substantial stumbling block. Even for the E91 1 example, an uncertaintyof the Order of 18% in predicted mean life would significantly impair predictive capabilities.Thus for example, if an E911 component that had run for 220,000 hours had a predicted lowerbound rupture life of 250,000 hours, it would be reasonable to schedule it for replacement.This could be wasteful if a better lower bound life prediction, correcting for oxidation effects,was in fact 305,000 hours, as would be implied by an 18% life underprediction figure.Indeed, much effort would probably be put into alternative approaches, such as in-servicemonitoring and remanent life assessment testing, to stave off any premature replacement. Forlow alloy steels, the uncertainties are larger. Research to reduce these uncertainties couldpotentially bring large savings in component replacement costs.
Acknowledgements
This paper is published by permission of E.On UK plc and Mitsui Babcock Energy Ltd.
References
[1] MITSUI BABCOCK ENERGY LTD, (2000), "A New Creep-Resistant Ferritic Steelfor Improved Energy Efficiency", Future Practice Report No. 66, prepared for theEnergy Efficiency Best Practice Programme, ETSU, Harwell.
[2] SERVETTO, C, and ALLEN, D J, (2002) "An Assessment of Creep Rupture Data onE911 Steel Weldments", 7th Liege Conference on Materials for Advanced PowerEngineering, 2002, pp. 1661-1670.
[3] HART, R V, (1985), "The Effect of Test Piece Oxidation on Creep Life Predictions ofThick Components", CEGB, unpublished report.
[4] NICHOLLS, T, (2000), "Oxidation Correction in Creep Life Assessment", M. Res.Thesis, Swansea University.

[5] MERCKL1NG, G, (2005), "Long Term Creep Rupture Strength Assessment: TheDevelopment of the European Creep Collaborative Committee Post AssessmentTests", Proc. Conf. "Creep and Fracture in High Temperature Components", London,Sept 12-14, pp. 3-19.
[6] BENDICK, W, and GABREL, J, (2005), "Assessment of Creep Rupture Strength forthe New Martensitic 9%Cr Steels E911 and T/P92", Proc. Conf. "Creep and Fracturein High Temperature Components", London, Sept 12-14, pp. 406-418.
NEW EXPERIENCE IN THE FIELD OF APPLICATION OFCORROSION RESISTANCE PROTECTION IN FLUE GAS
DESULPHURISATION PLANT ABSORBERS
Adam Hernas , Macin Imosa 1 , Jerzy Pasternak2, Stanislaw Fudali2Silesian University of Technology, 8 Krashiskiego Str, 40-019 Katowice, Poland
2 Boiler Engineering Company RAFAKO S.A., 33 Lakowa Str, 47-400 Raciborz, [email protected]
AbstractAbsorbers form the main part of the flue gas desulphurisation plants for 360MW units at Belchatow PowerStation. The plant working cycle and service life depend on the material grades of the absorber lining corrosion-resistance protection materials in its individual zones. The objective of manufacturer activities in this field is toextend the service life of the flue gas desulphurisation plant by implementation of the "wallpapering" technologyin the absorber cylindrical part with plate sheet having the thickness from 0.5 to 1,6mtn, made of Hastelloy typenickel alloys. The experiment carried out on Hastelloy nickel alloys, grades C-22 and C-2000, among others bymeans of evaluation of corrosion resistance of the base material, "wallpaper" plate sheet, welded joints andHAZ.The corrosion tests were executed for three different conditions of corrosive environment:1.The environment of actual chemical composition of boiler outlet flue gases, with 10% weight addition ofK2SO4 . Test temperature 70°C, testing time up to 1,000 hrs.2. The environment of actual chemical composition of boiler outlet flue gases, with 6% weight addition ofK2SO4 and 4% weight addition of NaCI. Test temperature 70°C, testing time up to 1,000 hrs.3. Simulation of the actual conditions of waste incineration environment, pertaining during thermal utilisation ofwastes with the following chemical composition: N2 + 9%02 + 0.08%S02 + 0.2%HCL. Test temperature 450and 600°C, testing time up to 1,150 hrs.For the purpose of comparison, corrosion resistance tests were carried out on boiler steel types T22, E911,HCM12 and TP347H.This document includes the results of evaluation of welded joints structure and HAZ (Heat Affected Zones),joint corrosion resistance characteristics, corrosion product test results, as well as requirements andrecommendations with regard to fabrication of welded joints, the preparation degree of lining plate join surfaces,and requirements in field of weld joints.
Keywords: nickel alloys, tlue gas desulphurisation plants, wallpapering, corrosion resistance, microstructure
Introduction
The development of the power rector plays a dominant role in the welfare of each country,however, its development has become the main cause of degradation of the naturalenvironment. Degradation of the environment – which in consequence leads to deteriorationof the living conditions – must not be neglected by a power equipment manufacturer.Therefore, in the 90-th years has been taken up some environmental activities, i.e. limitationof sulphur emissions, and offers our customers, among others:• various techniques of sulphur emissions reduction in the boiler furnace chamber by
means of so-called primary methods,• designing and erection of fluidised bed Boilers,• boiler outlet flue gas cleaning installations, reducing sulphur oxides by means of
secondary methods, including the most efficient desulphurisation method, i.e. wetlimestone method.
Owing to considerable costs of plant shutdown and time-consuming repairs, if any, the plantoperational cycle should not be shorter than 100,000hrs. The service life of a flue gasdesulphurisation plant depends on the type of applied absorber corrosion resistance materialsin its selected parts [6-10].
1
The objective of this elaboration is to show activities aimed at increasing the service life offlue gas desulphurisation plants, including implementation of stainless steels and alloys basedan nickel contents, used as absorber protective lining in the wet limestone desulphurisationplants. This paper includes selection of materials, preparation of WPS (Welding ProcedureSpecification), elaboration and requirements of welding technology, "wallpapering"technology (sheet lining using the high nickel alloyed, corrosion resistance plates in absorbersurfaces), as well as the evaluation of welded joints and HAZ (Heat Affected Zones)corrosion resistance.
1. Examples of selected applications for corrosion resistance lining in flue gasdesulphurisation plants
Flue gas desulphurisation by means of the wet limestone method is the most common andefficient method of SO2 removal from the flue gases. The desulphurisation efficiency of thismethod ranges between 90-95%. The flue gas desulphurisation process takes place in theabsorber, which is the main part of the flue gas desulphurisation plant. The absorber is atower-type washer designed for SO 2 removal, as well as almost complete removal of HCIfrom the flue gases. This method is to rinse the flue gases with lime slurry (or limestoneslurry) in the absorption tower [1]. As the slurry is of acid reaction, the absorber bottom andsides have to be lined inside with a material to resist the influence of the absorberenvironment. Therefore, the materials applied have to be resistant, among others, to thetemperatures of 55-75°C, condensate including dissolved acids or salts with pH value equal to1-2, to influence of gases, i.e. SO2, HC1, HF and NOx , surface abrasion, influence of steamand formation of deposits.It is assumed that the following corrosion resistance types of constructional steels protectioncan be used in the flue gas desulphurisation plants [2,3], e.g.:• special types of rubber,• ceramic materials or plastic materials,• application of stainless steels or high-alloy materials with nickel and chromium.The experiences of manufacturer have had so far; reveal some parallel concepts of applicationof corrosion resistance lining made of high-alloy steels or nickel alloys in the absorberworking area. One of them is manufacture of complete austenitic material elements –especially ones having not too large dimensions. Another offer includes surfacing by weldingwith austenitic electrodes. Still another one is the promotion of "wallpapering" technology(sheet lining using the high alloyed, corrosion resistance material in absorber, scrubbersurfaces). This is the technology highly recommended in order to provide protection for largesurfaces exposed to chemically aggressive substances [6-9]. The areas where such materialsare applied include absorber inlet stubs, bottom and lower part of the absorber, damper andflue gas ducts. The lining is fixed to the absorber casing, made of carbon steel, by means ofsome welding techniques [2,3].
2. Selection of materials and technologies of welded joints fabrication
The objective of any reliable manufacturer, is to extend the effected service life of any fluegas desulphurisation plant by implementation of new materials and technologies for absorberprotection, including "wallpapering" with lining of plate sheet, having the thickness of 0.5 –1,6mm, made of Hastelloy nickel alloys, grades C-22 and C-2000 [2-5,7,8].The experiment to implement the new corrosion resistance protection technology, includedamong others:
2
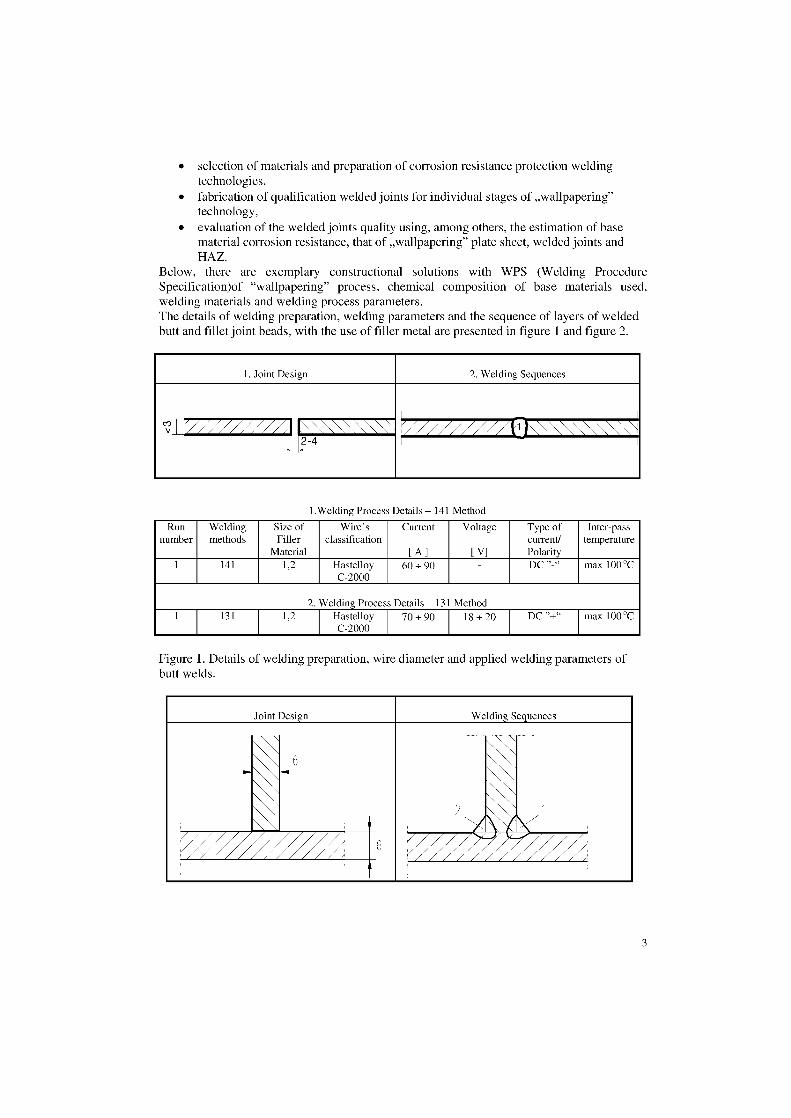
• selection of materials and preparation of corrosion resistance protection weldingtechnologies,
• fabrication of qualification welded joints for individual stages of „wallpapering"technology,
• evaluation of the welded joints quality using, among others, the estimation of basematerial corrosion resistance, that of „wallpapering" plate sheet, welded joints andHAZ.
Below, there are exemplary constructional solutions with WPS (Welding ProcedureSpecification)of "wallpapering" process, chemical composition of base materials used,welding materials and welding process parameters.The details of welding preparation, welding parameters and the sequence of layers of weldedbutt and fillet joint beads, with the use of filier metal are presented in figure 1 and figure 2.
1. Joint Design 2. Welding Sequences
c? r// AAL2 -4
1.Welding Process Details – 141 MethodRun
numberWeldingmethods
Size ofFiller
Material
Wire'sclassification
Current
1 A l
Voltage
[ V]
Type ofcurrent/Polarity
Inter-passtemperature
1 141 1,2 HastelloyC-2000
60 ÷ 90 DC "-" max 100°C
2. Welding Process Details –131 Method131 1,2 Hastelloy
C-200070 + 90 18 + 20 DC "+" max 100°C
Figure 1. Details of welding preparation, wire diameter and applied welding parameters ofbutt welds.
Joint Design Welding Sequences
A KAge
r-..mi• 'MW. AdogOr
3
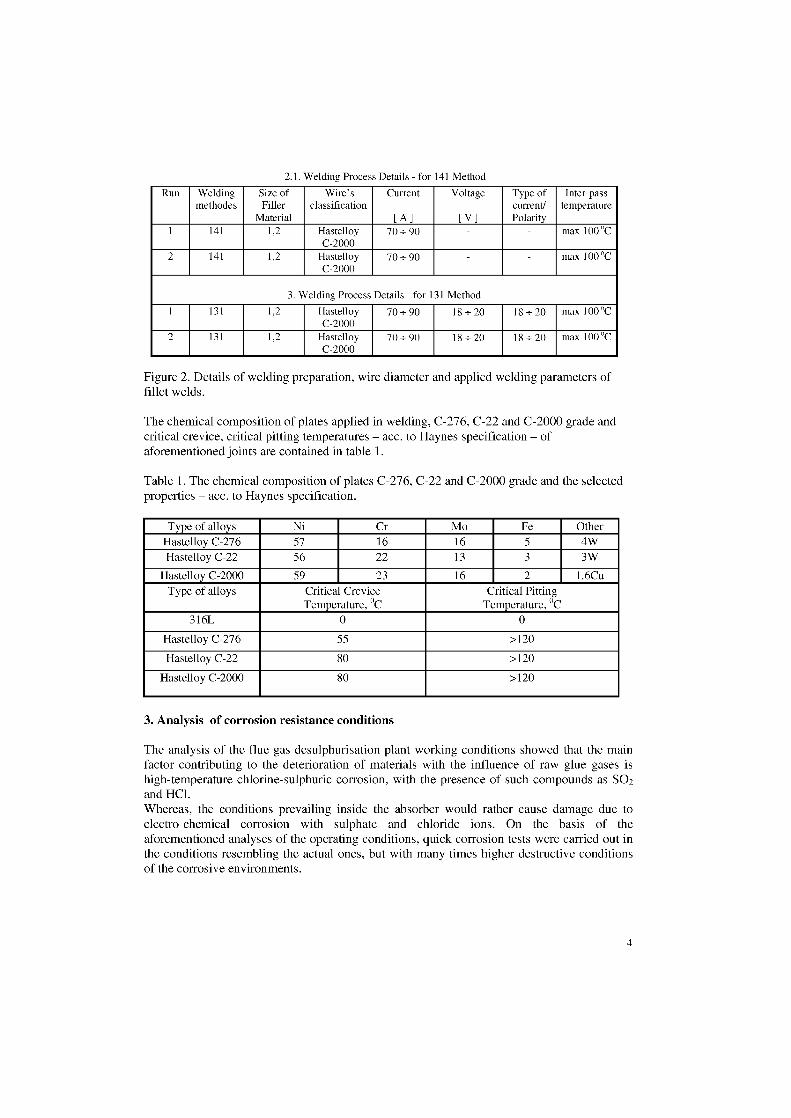
2.1. Welding Process Details - for 141 Method
Run Weldingmethodes
Size ofFiller
Material
Wire'sclassification
Current
[ A ]
Voltage
[ V ]
Type ofcurrent/Polarity
Inter-passtemperature
1 141 1,2 HastelloyC-2000
70 ÷ 90 max 100°C
2 141 1,2 HastelloyC-2000
70 ÷ 90 max 100°C
3. Welding Process Details - for 131 Method
1 131 1,2 HastelloyC-2000
70 ÷ 90 18 ÷ 20 18 ÷ 20 max 100 "C
2 131 1,2 HastelloyC-2000
70 ÷ 90 18 ÷ 20 18 ÷ 20 max 100 "C
Figure 2. Details of welding preparation, wire diameter and applied welding parameters offallet welds.
The chemical composition of plates applied in welding, C-276, C-22 and C-2000 grade andcritical crevice, critical pitting temperatures — acc. to Haynes specification — ofaforementioned joints are contained in table 1.
Table 1. The chemical composition of plates C-276, C-22 and C-2000 grade and the selectedproperties — acc. to Haynes specification.
Type of alloys Ni Cr Mo Fe OtherHastelloy C-276 57 16 16 5 4WHastelloy C-22 56 22 13 3 3W
Hastelloy C-2000 59 23 16 2 l.6CuType of alloys Critical Crevice
Temperature, °CCritical Pitting
Temperature, °C316L 0 0
Hastelloy C-276 55 >120
Hastelloy C-22 80 >120
Hastelloy C-2000 80 >120
3. Analysis of corrosion resistance conditions
The analysis of the flue gas desulphurisation plant working conditions showed that the mainfactor contributing to the deterioration of materials with the influence of raw glue gasen ishigh-temperature chlorine-sulphuric corrosion, with the presence of such compounds as SO2and HC1.Whereas, the conditions prevailing inside the absorber would rather cause damage due toelectro-chemical corrosion with sulphate and chloride ions. On the basis of theaforementioned analyses of the operating conditions, quick corrosion tests were carried out inthe conditions resembling the actual ones, but with many times higher destructive conditionsof the corrosive environments.
4
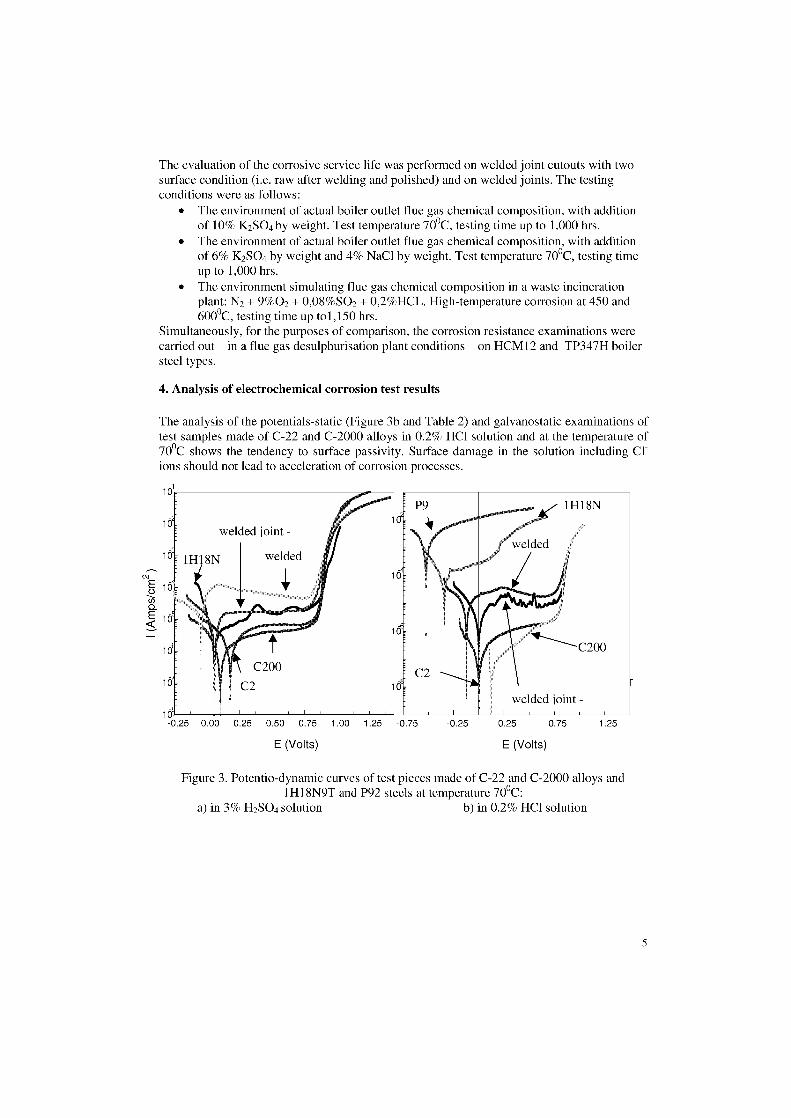
d
-0.25
The evaluation of the corrosive service life was performed on welded joint cutouts with twosurface condition (i.e. raw alter welding and polished) and on welded joints. The testingconditions were as follows:
• The environment of actual boiler outlet flue gas chemical composition, with additionof 10% K2SO4 by weight. Test temperature 70°C, testing time up to 1,000 hrs.
• The environment of actual boiler outlet flue gas chemical composition, with additionof 6% K2SO4 by weight and 4% NaC1 by weight. Test temperature 70°C, testing timeup to 1,000 hrs.
• The environment simulating flue gas chemical composition in a waste incinerationplant: N2 + 9%02 + 0,08%S02 + 0,2%HCL. High-temperature corrosion at 450 and600°C, testing time up to1,150 hrs.
Simultaneously, for the purposes of comparison, the corrosion resistance examinations werecarried out – in a flue gas desulphurisation plant conditions – on HCM12 and TP347H boilersteel typen.
4. Analysis of electrochemical corrosion test results
The analysis of the potentials-static (Figure 3b and Table 2) and galvanostatic examinations oftest samples made of C-22 and C-2000 alloys in 0.2% HC1 solution and at the temperature of70°C shows the tendency to surface passivity. Surface damage in the solution including Cl -ions should not lead to acceleration of corrosion processes.
E (Volts)
E (Volts)
Figure 3. Potentio-dynamic curves of test pieces made of C-22 and C-2000 alloys and1H18N9T and P92 steels at temperature 70°C:
a) in 3% H2SO4 solution b) in 0.2% HC1 solution
5
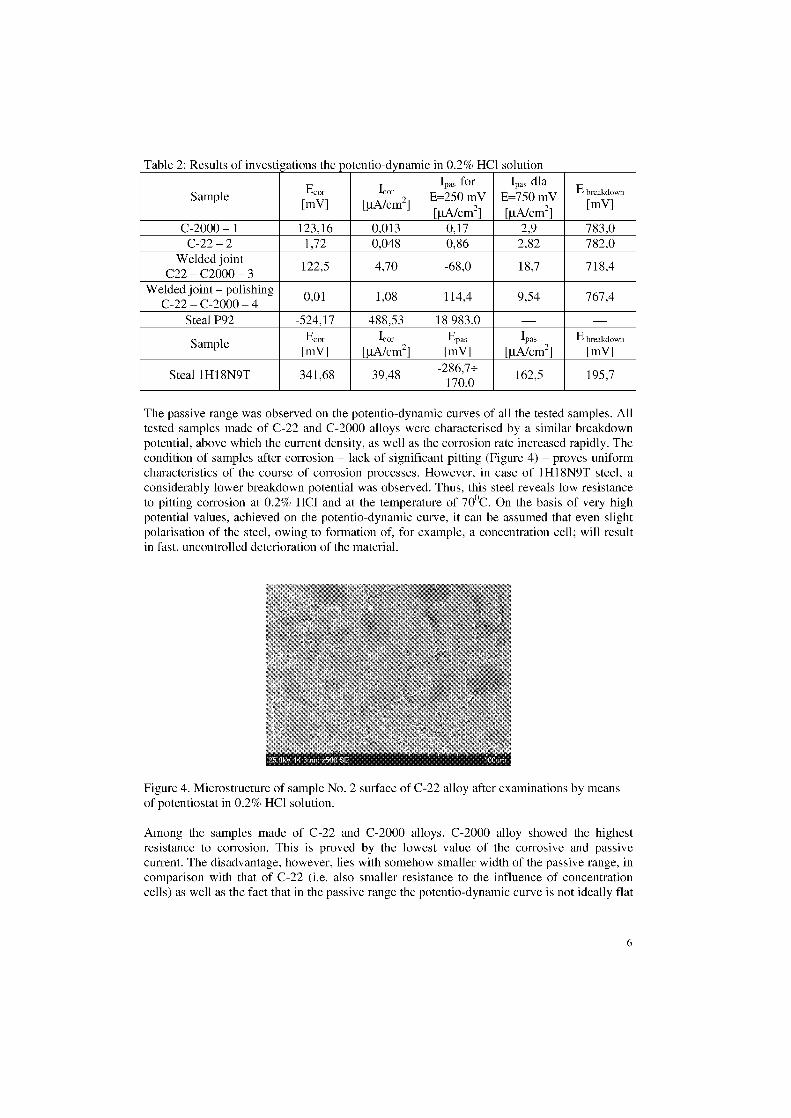
Table 2: Results of investigations the potentio-dynamic in 0.2% HC1 solution
SampleE
[IncorVlIcor
niA/cm21
p. forE
I=250 mVniA/cm2 1
Ipas dE=750
lamV
DiA/cm21
E rmvibreakdown
C-2000— 1 123,16 0,013 0,17 2,9 783,0C-22 — 2 1,72 0,048 0,86 2,82 782,0
Welded jointC22 — C2000 — 3
122,5 4,70 -68,0 18,7 718,4
Welded joint — polishingC-22 — C-2000 — 4
0,01 1,08 114,4 9,54 767,4
Steal P92 -524,17 488,53 18 983,0
SampleEcor
[mV]Icor
[gA/cm2]Epas
[mV]I pas
[gA/cm2]E breakdown
[mV]
Steal 1H18N9T -341,68 39,48-,+2867-170,0
162,5 195,7
The passive range was observed on the potentio-dynamic curves of all the tested samples. Alltested samples made of C-22 and C-2000 alloys were characterised by a similar breakdownpotential, above which the current density, as well as the corrosion rate increased rapidly. Thecondition of samples after corrosion — lack of significant pitting (Figure 4) — proves uniformcharacteristics of the course of corrosion processes. However, in case of 1H18N9T steel, aconsiderably lower breakdown potential was observed. Thus, this steel reveals low resistanceto pitting corrosion at 0.2% HC1 and at the temperature of 70°C. On the basis of very highpotential values, achieved on the potentio-dynamic curve, it can be assumed that even slightpolarisation of the steel, owing to formation of, for example, a concentration cell; will resultin fast, uncontrolled deterioration of the material.
Figure 4. Microstructure of Sample No. 2 surface of C-22 alloy after examinations by meansof potentiostat in 0.2% HC1 solution.
Among the samples made of C-22 and C-2000 alloys, C-2000 alloy showed the highestresistance to corrosion. This is proved by the lowest value of the corrosive and passivecurrent. The disadvantage, however, lies with somehow smaller width of the passive range, incomparison with that of C-22 (i.e. also smaller resistance to the influence of concentrationcells) as well as the fact that in the passive range the potentio-dynamic curve is not ideally f1at
6
which may prove that the passive layer formed is not ideally tight which, in turn, contributesto gradually faster pacing corrosion speed with the growth of the potential, which should nottake place.
The analysis of the potentiostatic (Figure 3 and Table 3) and galvanostatic tests, executed in3% H2SO4 solution, showed that the samples made of C-22 alloy and the samples without apolished welded joint could be characterised by a tendency to surface passivity. In case ofthese materials, it can be assumed that a surface defect would not result in acceleration ofcorrosion processes. In case of samples made of C-2000 alloy and comparatively tested1H18N9T and P92 steels, after the initial passivity there occurred surface activation, followedby passivity, etc. Possible damage to the material surface exposed to corrosion in the solutionincluding SO42 ions – may result in acceleration of corrosion processes. Solely in case of thesample made of C-22 and C-2000 alloys with a polished welded joint, the proneness forsurface activation was detected.
Table 3: Results of investi ations the otentio-d namic in 3% H 2SO4 solution
Sample E cor
[mV]I cor
DIA/cm21E pas
[mV]Ipas
[i.tA/cm2]E breakdown
[mV]C-2000 – 1 103,16 0,491 207,2 4,14 806,4
C-22 – 2 178,92 0,980 270,0 6,72 825,1Welded joint
C-22 – C-2000 – 345,22 9,53 94,6 65,5 782,0
Welded joint – polishingC-22 – C-2000 – 4
59,774,56 144,0 15,2 790,0
Steel 1H18N9T 560,97 2,19 457,71 26,70 757,0Steel P92 -496,98 4 486,0 — — —
Similarly as in case of tests in 0.2% HC1 solution, passive range was observed on thepotentio-dynamic curves. The breakdown potential was slightly lower for the samples with awelded joint. The examinations of the sample surface condition (Figure 4), followingcorrosion tests, showed no pitting, which proves the uniform characteristics of corrosion andcan be considered highly advantageous. In case of samples made of 1H18N9T steel, pittingwas found. The most disadvantageous was the condition of samples made of P92 alloy, wherethe quench annealing effects were detected. The samples made of C-2000 alloy showed thehighest corrosion resistance, which can be backed up by the lower corrosive and passivecurrent density value.
5. Test results analysis of electrochemical corrosion on welded joints and HAZ
The macro and micro-structure tests of the welded joints, both and fillet ones, made of C-22and C-2000 nickel alloys, show the proper bare material structure – HAZ properties, as wellas the correct joint shapes. In the both C-22 and C-2000 nickel alloys tested, there werepartial structural uniformities, which is due to the plate plastic deformation. In case of C-2000 alloy, some lamer extractions were observed, which are characteristic for the platematerial supplied. How euer, the extractions in C-22 alloy are of pointwise character, withuniform distribution.The welded samples, in comparison with monolithic ones, were characterised with lowercorrosion resistance, which was proved especially by higher value of the corrosion andpassive current, i.e. also by faster corrosion rate. The samples with polished welded jointsshowed higher corrosion resistance than the samples without polished welded joints. The
7
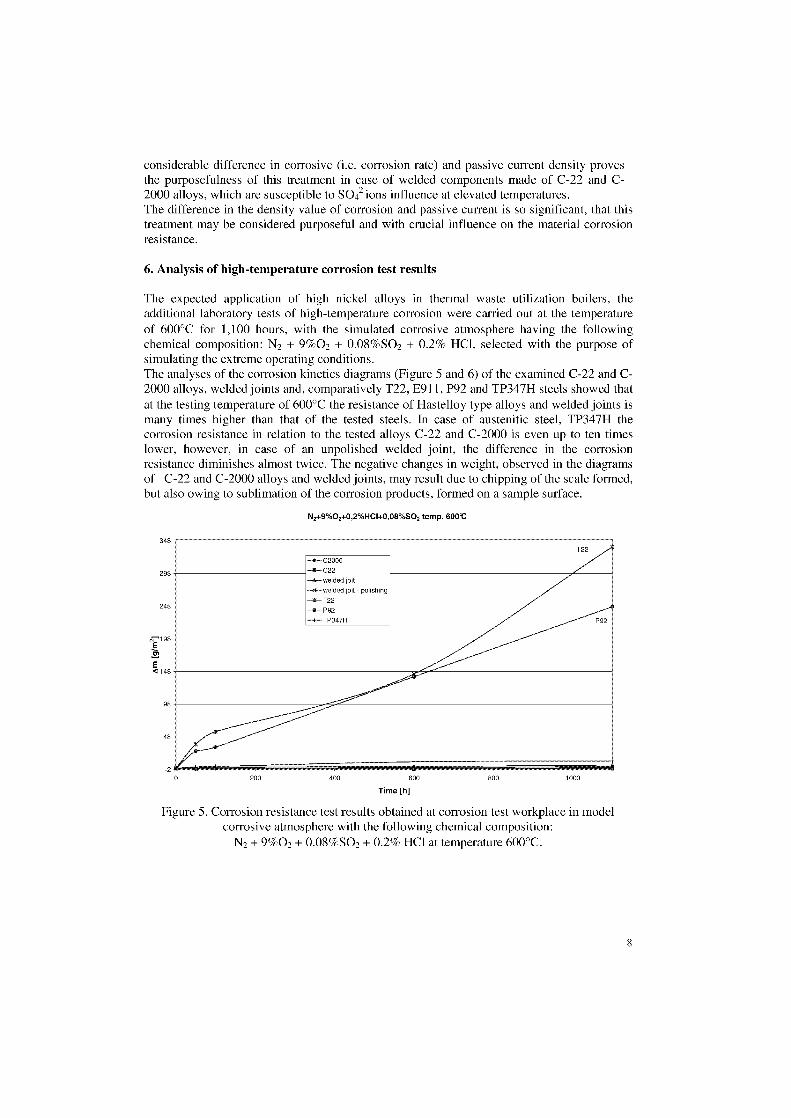
—t—C2000
welded joit—34—welded joit - polishing
T22P92
—+—TP347H
considerable difference in corrosive (i.e. corrosion rate) and passive current density provesthe purposefulness of this treatment in case of welded components made of C-22 and C-2000 alloys, which are susceptible to SO42 ions influence at elevated temperatures.The difference in the density value of corrosion and passive current is so significant, that thistreatment may be considered purposeful and with crucial influence on the material corrosionresistance.
6. Analysis of high-temperature corrosion test results
The expected application of high nickel alloys in thermal waste utilization boilers, theadditional laboratory tests of high-temperature corrosion were carried out at the temperatureof 600°C for 1,100 hours, with the simulated corrosive atmosphere having the followingchemical composition: N2 + 9%02 + 0.08%S02 + 0.2% HC1, selected with the purpose ofsimulating the extreme operating conditions.The analyses of the corrosion kinetics diagrams (Figure 5 and 6) of the examined C-22 and C-2000 alloys, welded joints and, comparatively T22, E911, P92 and TP347H steels showed thatat the testing temperature of 600°C the resistance of Hastelloy type alloys and welded joints ismany times higher than that of the tested steels. In case of austenitic steel, TP347H thecorrosion resistance in relation to the tested alloys C-22 and C-2000 is even up to ten timeslower, however, in case of an unpolished welded joint, the difference in the corrosionresistance diminishes almost twice. The negative changes in weight, observed in the diagramsof C-22 and C-2000 alloys and welded joints, may result due to chipping of the scale formed,but also owing to sublimation of the corrosion products, formed on a sample surface.
N2+9%02+0,2%HCI+0,08%S02 temp. 600°C
200
400
600
800
1000
Time [h]
Figure 5. Corrosion resistance test results obtained at corrosion test workplace in modelcorrosive atmosphere with the following chemical composition:
N2 + 9%02 + 0.08%S02 + 0.2% HC1 at temperature 600°C.
348
298
248
"198E
E<148
98
48
8
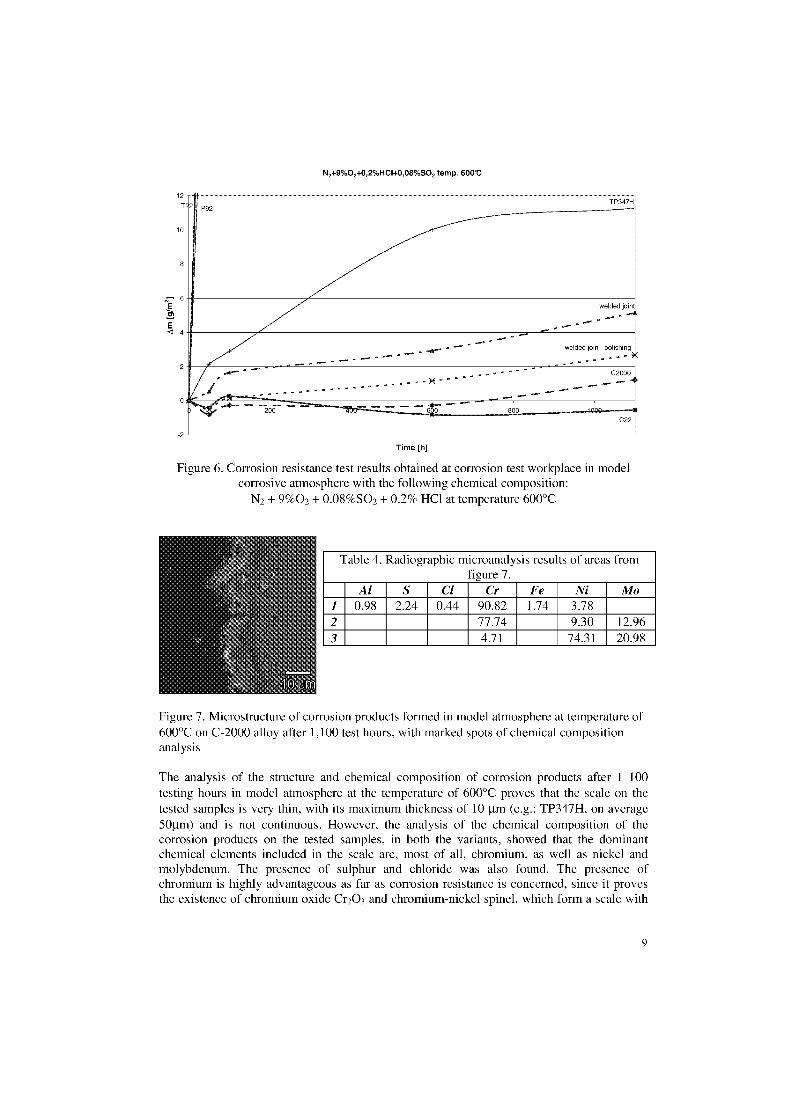
1P347H1 --j-
-r--'------------ :
welded joint-4
P92
200.....
.......
12T
E
E< 4
1,12+9%02+0,2%HC1+0,08%602 temp. 600V
Time [h]
Figure 6. Corrosion resistance test results obtained at corrosion test workplace in modelcorrosive atmosphere with the following chemical composition:
N2 + 9%02 + 0.08%S02 + 0.2% HC1 at temperature 600°C
Table 4. Radiographit microanalysis results of areas fromfigure 7.
Al S Cl Cr Fe Ni MoI 0.98 2.24 0.44 90.82 1.74 3.782 77.74 9.30 12.963 4.71 74.31 20.98
Figure 7. Microstructure of corrosion products formed in model atmosphere at temperature of600°C on C-2000 alloy after 1,100 test hours, with marked spots of chemical compositionanalysis
The analysis of the structure and chemical composition of corrosion products after 1 100testing hours in model atmosphere at the temperature of 600°C proves that the scale on thetested samples is very thin, with its maximum thickness of 10 i.tm (e.g.: TP347H, on average501.1m) and is not continuous. However, the analysis of the chemical composition of thecorrosion products on the tested samples, in both the variants, showed that the dominantchemical elements included in the scale are, most of all, chromium, as well as nickel andmolybdenum. The presence of sulphur and chloride was also found. The presence ofchromium is highly advantageous as far as corrosion resistance is concerned, since it provesthe existente of chromium oxide Cr203 and chromium-nickel spinel, which form a scale with
9
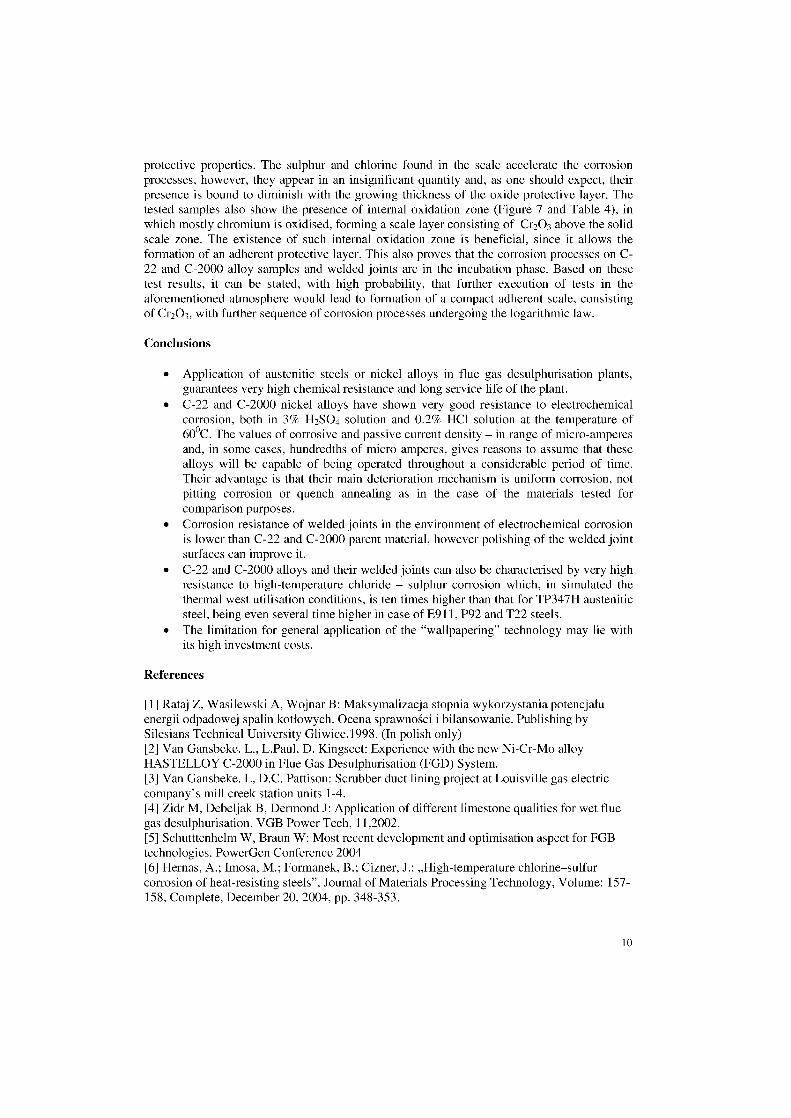
protective properties. The sulphur and chlorine found in the scale accelerate the corrosionprocesses, however, they appear in an insignificant quantity and, as one should expect, theirpresence is bound to diminish with the growing thickness of the oxide protective layer. Thetested samples also Show the presence of internal oxidation zone (Figure 7 and Table 4), inwhich mostly chromium is oxidised, forming a scale layer consisting of Cr 203 above the solidscale zone. The existence of such internal oxidation zone is beneficial, since it allows theformation of an adherent protective layer. This also proves that the corrosion processes on C-22 and C-2000 alloy samples and welded joints are in the incubation phase. Based on thesetest results, it can be stated, with high probability, that further execution of tests in theaforementioned atmosphere would lead to formation of a compact adherent scale, consistingof Cr203 , with further sequence of corrosion processes undergoing the logarithmic law.
Conclusions
• Application of austenitic steels or nickel alloys in flue gas desulphurisation plants,guarantees very high chemical resistance and long service life of the plant.
• C-22 and C-2000 nickel alloys have shown very good resistance to electrochemicalcorrosion, both in 3% H2SO4 solution and 0.2% HC1 solution at the temperature of60°C. The values of corrosive and passive current density – in range of micro-amperesand, in some cases, hundredths of micro-amperes, gives reasons to assume that thesealloys will be capable of being operated throughout a considerable period of time.Their advantage is that their main deterioration mechanism is uniform corrosion, notpitting corrosion or quench annealing as in the case of the materials tested forcomparison purposes.
• Corrosion resistance of welded joints in the environment of electrochemical corrosionis lower than C-22 and C-2000 parent material, however polishing of the welded jointsurfaces can improve it.
• C-22 and C-2000 alloys and their welded joints can also be characterised by very highresistance to high-temperature chloride – sulphur corrosion which, in simulated thethermal west utilisation conditions, is ten times higher than that for TP347H austeniticsteel, being even several time higher in case of E911, P92 and T22 steels.
• The limitation for general application of the "wallpapering" technology may lie withits high investment costs.
References
[1] Rataj Z, Wasilewski A, Wojnar B: Maksymalizacja stopnia wykorzystania potencjaluenergii odpadowej spalin kotlowych. Ocena sprawnoki i bilansowanie. Publishing bySilesians Technical University Gliwice,1998. (In polish only)[2] Van Gansbeke. L., L.Paul, D. Kingseet: Experience with the new Ni-Cr-Mo alloyHASTELLOY C-2000 in Flue Gas Desulphurisation (FGD) System.[3] Van Gansbeke. L, D.C. Pattison: Scrubber duct lining project at Louisville gas electriccompany' s mill creek station units 1-4.[4] Zidr M, Debeljak B, Dermond J: Application of different limestone qualities for wet fluegas desulphurisation. VGB Power Tech, 11,2002.[5] Schutttenhelm W, Braun W: Most recent development and optimisation aspect for FGBtechnologies. PowerGen Conference 2004[6] Hernas, A.; Imosa, M.; Formanek, B.; Cizner, J.: „High-temperature chlorine–sulfurcorrosion of heat-resisting steels", Journal of Materials Processing Technology, Volume: 157-158, Complete, December 20, 2004, pp. 348-353.
10

[7] A. Hernas, M. Imosa, J. Cizner: „ High-temperature corrosion resistance of new creep-resisting steels", Proc. Mezi. Konf. Kode, energeticka zarizeni a spalovny odpadu, Brno 2002.[8] Khanna A.S. High Temperature Oxidation and Corrosion, ASM International 2002.[9] Cahn R.W. Haasen P. Kramer E.J. Corrosion and Environmental Degradation, MaterialsScience and Technology Series, WILEY – VCH 2000.[10] Neumann J., Kautz H.R.: „Evaluation of international literature an fireside corrosion incoal-fired power plants and waste-to-energy plants", VGB Kraftwerkstechnik 77(1997),
11

CORROSION AND OXIDATION EXPERIENCES IN AVEDORE IIMULTIFUEL BOILER
M. Montgomery', S.A. Jensen, 0. Biede2, O.H. Larsen3 , C. Andersson4'Energi E2/Elsam/IPL - DTU, Kemitorvet, 2800 Lyngby, Denmark ([email protected])
2Energi E2 Power Company, Teglholmen, AC Meyers Vxnge 9, 2450 Kobenhavn, Denmark.3 Elsam A/S, Kraftwerksvej 53, Skzerbxk, 7000 Fredericia, Denmark,
4Vattenfall Nordic Heat AB, 81426 Älvkarleby, Sweden.
AbstractAvedore II was commissioned in 2001, and since then corrosion and oxidation have been investigated
each year. In the first year heavy oil and gas were used as fuels and in the following years, heavy oil + gas +wood pellets have been utilised. Superheater 3 is fabricated in TP347H FG, however part of the superheater is atest section which has alternate sections of TP347H FG and Esshete 1250. The reason for this was to comparethe fireside corrosion and steamside oxidation of the two steels in the actual plant. After 1 years exposure wherethe boiler had been fuelled with heavy oil and gas, the deposit on the specimens was sodium sulphate withparticles of vanadium oxide. After the second year, where the fuel had been wood pellets + gas + heavy oil, thedeposit consisted of predominately potassium sulphate with sodium sulphate present at the outer part of thedeposit. Vanadate particles were still present within the deposit. Fireside corrosion occurred by sulphidation.This was the same after three years exposure, however as well as an enrichment of sulphur present in thecorrosion product, there was some attack at grain boundaries. Corrosion morphology and corrosion rates weresimilar for Esshete 1250 and TP347H FG. Steam oxidation showed similar results for Esshete 1250 and TP347HFG after the first year. However in the following two years, the steam oxide of Esshete 1250 was thicker thanthat of TP347H FG.
Keywords: TP347H FG, Esshete 1250, fireside corrosion, steamside oxidation, co-firing
Introduction
Avedore 2 CHP (combined heat and power) plant was commissioned in 2001 and islocated south of Copenhagen in the Energi E2 area in Denmark. Avedore 2 comprises of threemodules – a large USC (ultra super critical) plant, two parallel-powered gas turbines and abiomass plant. The steam pressure of the USC boiler is 300 bar and that of the reheatercomponents is 80 bar. The main boiler is a once through tower boiler of the Benson type withsingle reheat and it is designed for ultra super critical steam data, i.e. 300 bar and 580/600°C.It has a thermal capacity of 800MW. The outlet temperature varies depending on fuel type.On the steamside, the feedwater treatment was alkaline water treatment (AVT) during the firstyear (3000 hrs) and CWT (combined water treatment) in following years (pH 9.1, 0 2 120 ppband NH3 used for regulating pH).
Use of biomass as a fuel is an important measure for reduction of CO 2 emissions inDenmark. In addition Energi E2 is committed by the government to use 300,000 tons/yearwood pellets in the main USC boiler. A wood pellet manufacturing plant has been built on thecoast 30 km from Avedore, and the pellets are transported to Avedore 2 by ship. At presentthe main boiler uses a mixture of heavy fuel oil, gas and wood pellets, however thetemperature has been held at 540°C to avoid potential corrosion problems.
Operational Conditions
In superheater 3 at Avedore 2, a test tube has been welded in with alternate sections ofTP347H FG and Esshete 1250 to compare both steamside and fireside oxidation for these twotypen of steel. The alloy specifications are given in Table 1.
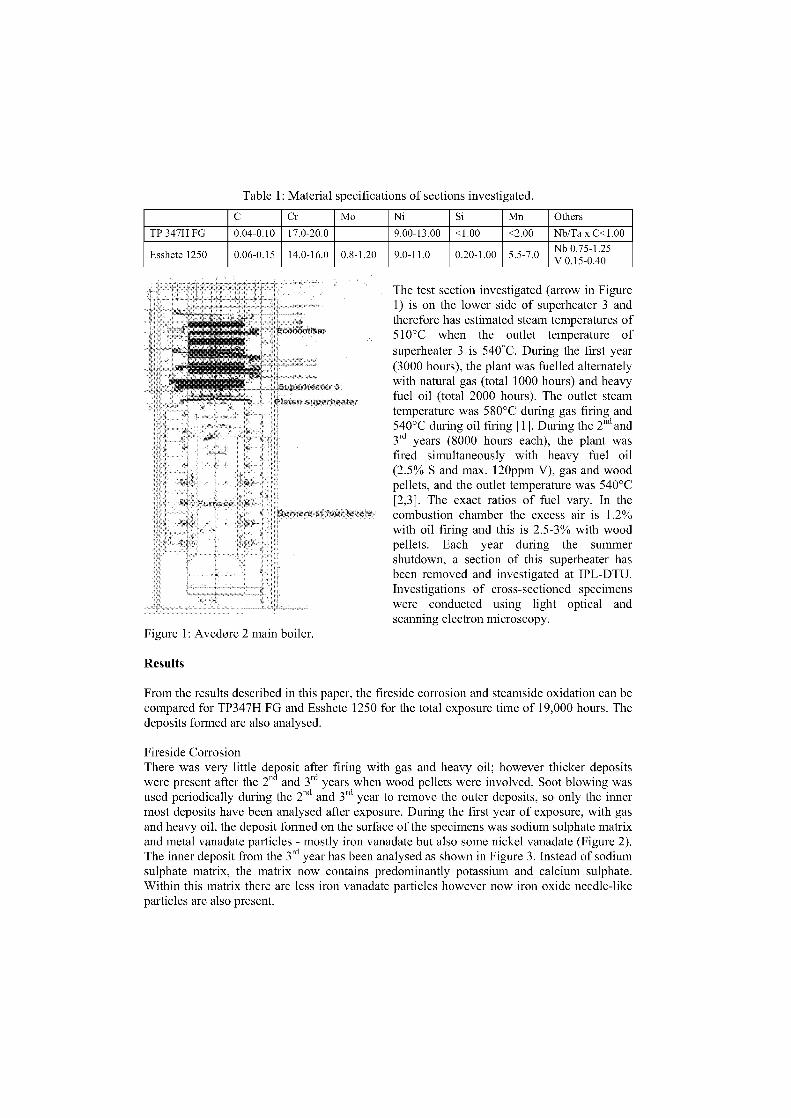
Table 1: Material specifications of sections investigated.
C Cr Mo Ni Si Mn OthersTP 347H FG 0.04-0.10 17.0-20.0 9.00-13.00 <1.00 <2.00 Nb/Ta x C<1.00
Esshete 1250 0.06-0.15 14.0-16.0 0.8-1.20 9.0-11.0 0.20-1.00 5.5-7.0 Nb 0.75-1.25V 0.15-0.40
The test section investigated (arrow in Figure1) is on the lower side of superheater 3 andtherefore has estimated steam temperatures of510°C when the outlet temperature ofsuperheater 3 is 540°C. During the first year(3000 hours), the plant was fuelled alternatelywith natural gas (total 1000 hours) and heavyfuel oil (total 2000 hours). The outlet steamtemperature was 580°C during gas firing and540°C during oil firing [1]. During the 2nd and3rd years (8000 hours each), the plant wasfired simultaneously with heavy fuel oil(2.5% S and max. 120ppm V), gas and woodpellets, and the outlet temperature was 540°C[2,3]. The exact ratios of fuel vary. In thecombustion chamber the excess air is 1.2%with oil firing and this is 2.5-3% with woodpellets. Each year during the summershutdown, a section of this superheater hasbeen removed and investigated at IPL-DTU.Investigations of cross-sectioned specimenswere conducted using light optical andscanning electron microscopy.
Figure 1: Avedore 2 main boiler.
Results
From the results described in this paper, the fireside corrosion and steamside oxidation can becompared for TP347H FG and Esshete 1250 for the total exposure time of 19,000 hours. Thedeposits formed are also analysed.
Fire side CorrosionThere was very little deposit after firing with gas and heavy oil; however thicker depositswere present after the ri and 3rd years when wood pellets were involved. Soot blowing wasused periodically during the 2 nd and 3 rd year to remove the outer deposits, so only the innermost deposits have been analysed after exposure. During the first year of exposure, with gasand heavy oil, the deposit formed on the surface of the specimens was sodium sulphate matrixand metal vanadate particles - mostly iron vanadate but also some nickel vanadate (Figure 2).The inner deposit from the 3rd year has been analysed as shown in Figure 3. Instead of sodiumsulphate matrix, the matrix now contains predominantly potassium and calcium sulphate.Within this matrix there are less iron vanadate particles however now iron oxide needle-likeparticles are also present.
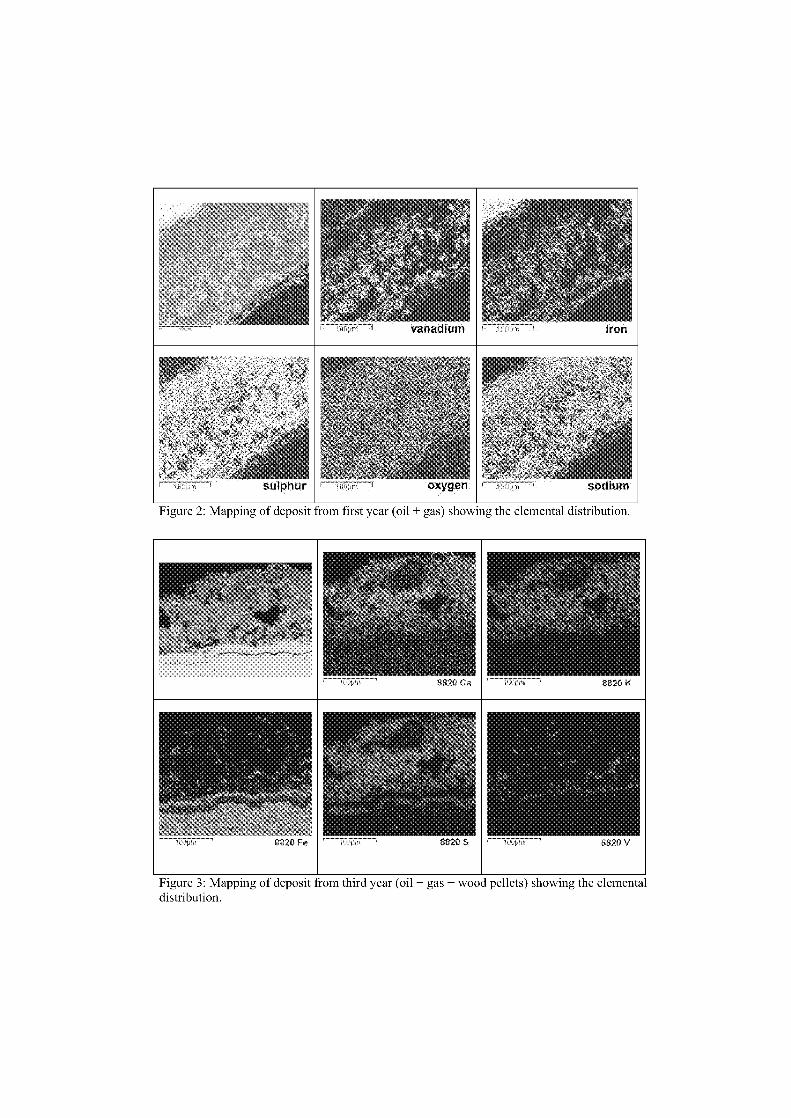
Figure 2: Mapping of deposit from first year (oil + gas) showing the elemental distribution.
Figure 3: Mapping of deposit from third year (oil + gas + wood pellets) showing the elementadistribution.
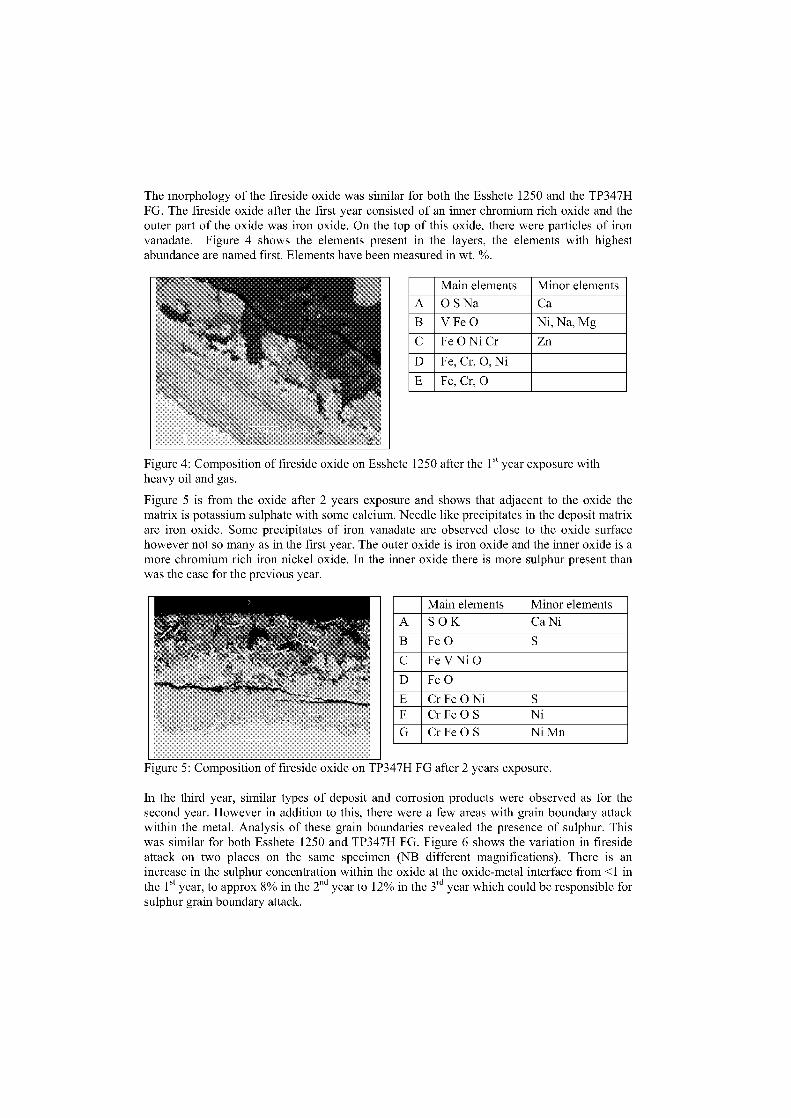
The morphology of the fireside oxide was similar for both the Esshete 1250 and the TP347HFG. The fireside oxide after the first year consisted of an inner chromium rich oxide and theouter part of the oxide was iron oxide. On the top of this oxide, there were particles of ironvanadate. Figure 4 shows the elements present in the layers, the elements with highestabundance are named first. Elements have been measured in wt. %.
Main elements Minor elements
A 0 S Na Ca
B V Fe 0 Ni, Na, Mg
C Fe 0 Ni Cr Zn
D Fe, Cr, 0, Ni
E Fe, Cr, 0
Figure 4: Composition of fireside oxide on Esshete 1250 after the Ist year exposure withheavy oil and gas.
Figure 5 is from the oxide after 2 years exposure and shows that adjacent to the oxide thematrix is potassium sulphate with some calcium. Needle like precipitates in the deposit matrixare iron oxide. Some precipitates of iron vanadate are observed dose to the oxide surfacehowever not so many as in the first year. The outer oxide is iron oxide and the inner oxide is amore chromium rich iron nickel oxide. In the inner oxide there is more sulphur present thanwas the case for the previous year.
Main elements Minor elements
A S 0 K Ca Ni
B Fe 0 S
C FeVNiO
D Fe 0
E Cr Fe 0 Ni SF Cr Fe 0 S Ni
G Cr Fe 0 S Ni Mn
Figure 5: Composition of fireside oxide on TP347H FG after 2 years exposure.
In the third year, similar types of deposit and corrosion products were observed as for thesecond year. However in addition to this, there were a few areas with grain boundary attackwithin the metal. Analysis of these grain boundaries revealed the presence of sulphur. Thiswas similar for both Esshete 1250 and TP347H FG. Figure 6 shows the variation in firesideattack on two places on the same specimen (NB different magnifications). There is anincrease in the sulphur concentration within the oxide at the oxide-metal interface from <1 inthe I st year, to approx 8% in the 2nd year to 12% in the ri year which could be responsible forsulphur grain boundary attack.
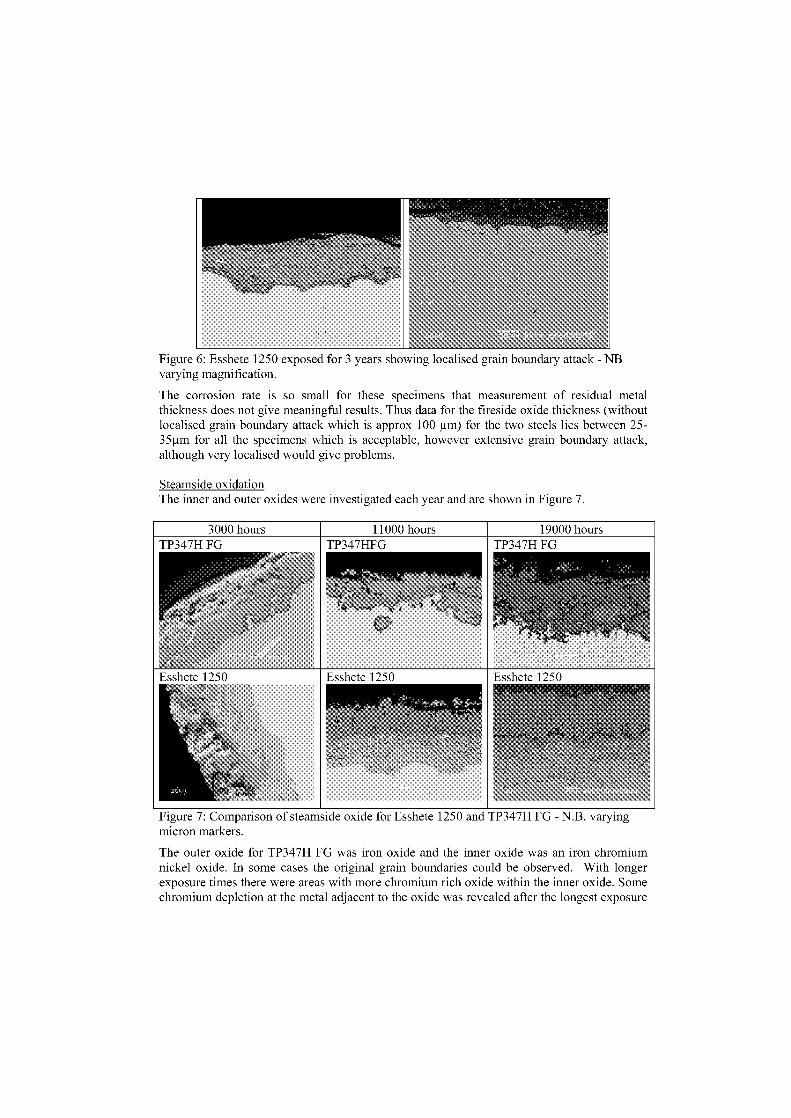
Figure 6: Esshete 1250 exposed for 3 years showing localised grain boundary attack - NBvarying magnification.
The corrosion rate is so small for these specimens that measurement of residual metalthickness does not give meaningful results. Thus data for the fireside oxide thickness (withoutlocalised grain boundary attack which is approx 100 1.1m) for the two steels lies between 25-35µm for all the specimens which is acceptable, however extensive grain boundary attack,although very localised would give problems.
Steamside oxidationThe inner and outer oxides were investigated each year and are shown in Figure 7.
3000 hours 11000 hours 19000 hoursTP347H FG TP347HFG TP347H FG
EssliL IL I ) Esshete 1250 1 —1ILL .)
Figure 7: Comparison of steamside oxide for Esshete 1250 and TP347H FG - N.B. varyingmicron markers.
The outer oxide for TP347H FG was iron oxide and the inner oxide was an iron chromiumnickel oxide. In some cases the original grain boundaries could be observed. With longerexposure times there were areas with more chromium rich oxide within the inner oxide. Somechromium depletion at the metal adjacent to the oxide was revealed alter the longest exposure
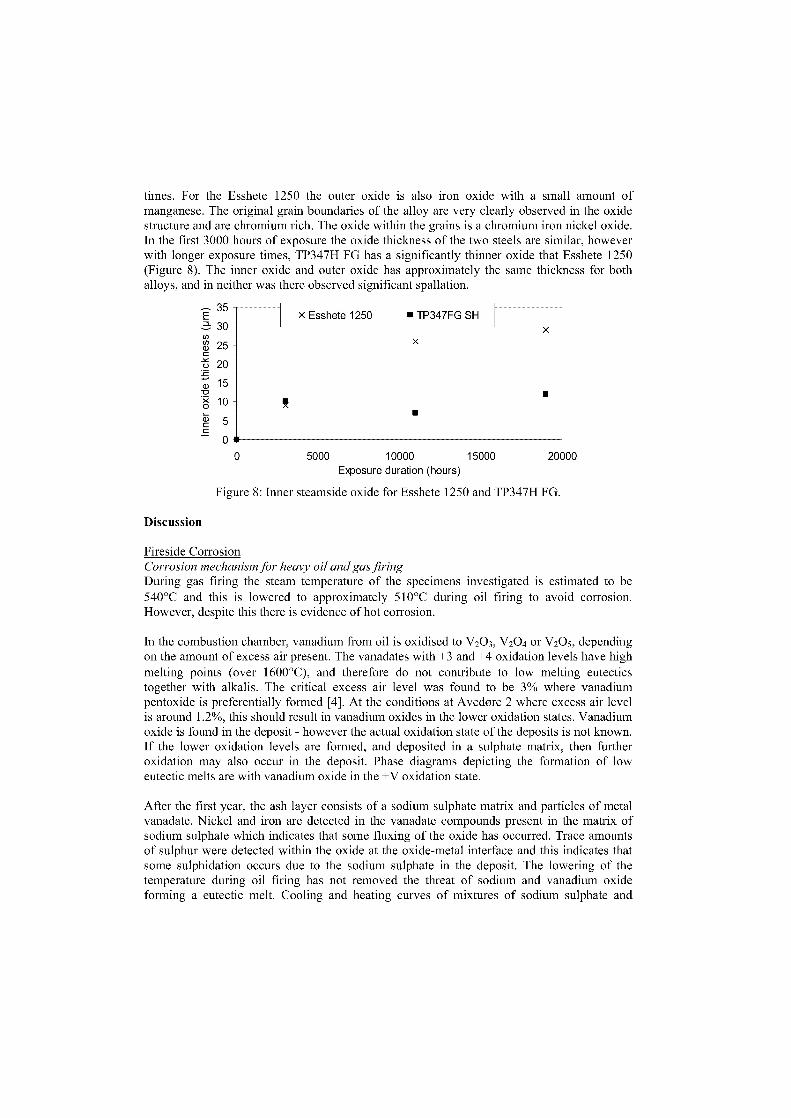
times. For the Esshete 1250 the outer oxide is also iron oxide with a small amount ofmanganese. The original grain boundaries of the alloy are very clearly observed in the oxidestructure and are chromium rich. The oxide within the grains is a chromium iron nickel oxide.In the first 3000 hours of exposure the oxide thickness of the two steels are similar, howeverwith longer exposure times, TP347H FG has a significantly thinner oxide that Esshete 1250(Figure 8). The inner oxide and outer oxide has approximately the same thickness for bothalloys, and in neither was there observed significant spallation.
E 35x Esshete 1250 ■ TP347FG SH
30
2▪ 25 -cO 20 -:Ec, 15
10 -07) 5 -c
0
xx
■
0
5000 10000 15000 20000Exposure duration (hours)
Figure 8: Inner steamside oxide for Esshete 1250 and TP347H FG.
Discussion
Fire side CorrosionCorrosion mechanism .för heavy oil and gas . firingDuring gas firing the steam temperature of the specimens investigated is estimated to be540°C and this is lowered to approximately 510°C during oil firing to avoid corrosion.However, despite this there is evidence of hot corrosion.
In the combustion chamber, vanadium from oil is oxidised to V 203 , V204 or V205 , dependingan the amount of excess air present. The vanadates with +3 and +4 oxidation levels have highmelting points (over 1600°C), and therefore do not contribute to low melting eutecticstogether with alkalis. The critical excess air level was found to be 3% where vanadiumpentoxide is preferentially formed [4]. At the conditions at Avedore 2 where excess air levelis around 1.2%, this should result in vanadium oxides in the lower oxidation states. Vanadiumoxide is found in the deposit - however the actual oxidation state of the deposits is not known.If the lower oxidation levels are formed, and deposited in a sulphate matrix, then furtheroxidation may also occur in the deposit. Phase diagrams depicting the formation of loweutectic melts are with vanadium oxide in the +V oxidation state.
After the first year, the ash layer consists of a sodium sulphate matrix and particles of metalvanadate. Nickel and iron are detected in the vanadate compounds present in the matrix ofsodium sulphate which indicates that some fluxing of the oxide has occurred. Trace amountsof sulphur were detected within the oxide at the oxide-metal interface and this indicates thatsome sulphidation occurs due to the sodium sulphate in the deposit. The lowering of thetemperature during oil firing has not removed the threat of sodium and vanadium oxideforming a eutectic melt. Cooling and heating curves of mixtures of sodium sulphate and
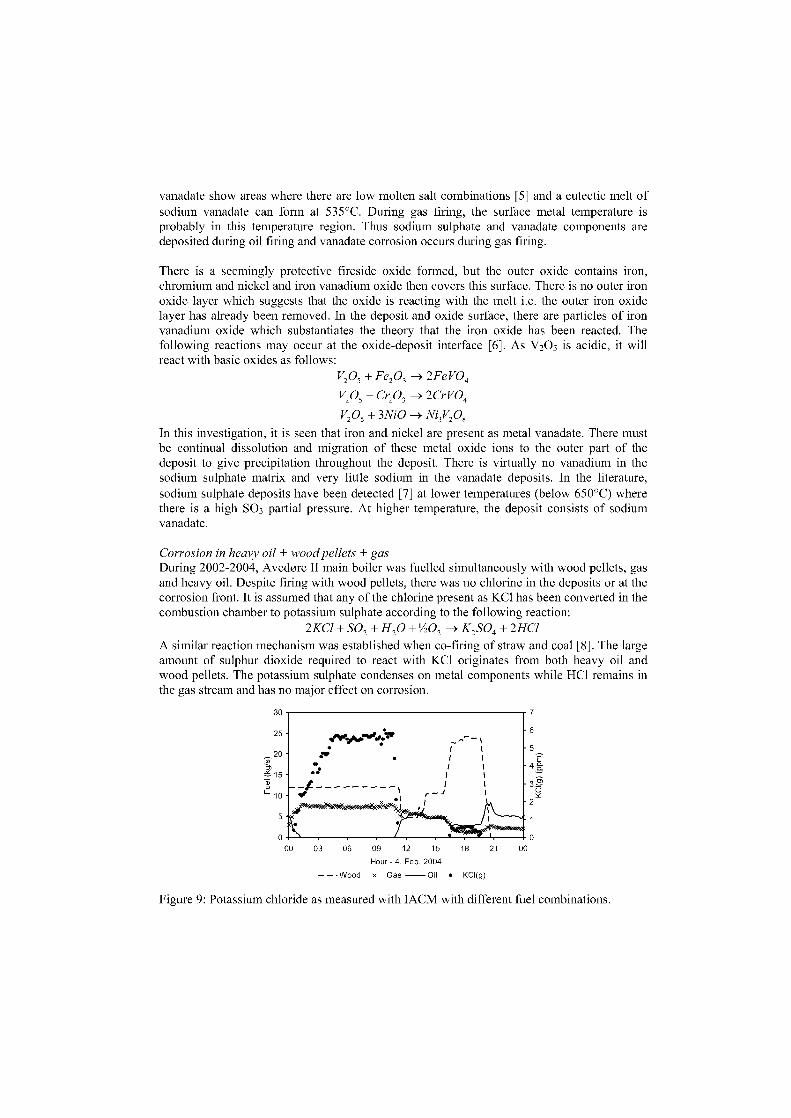
00 21 00
• KCI(g)
vanadate Show areas where there are low molten Salt combinations [5] and a eutectic melt ofsodium vanadate can form at 535°C. During gas firing, the surface metal temperature isprobably in this temperature region. Thus sodium sulphate and vanadate components aredeposited during oil firing and vanadate corrosion occurs during gas firing.
There is a seemingly protective fireside oxide formed, but the outer oxide contains iron,chromium and nickel and iron vanadium oxide then covers this surface. There is no outer ironoxide layer which suggests that the oxide is reacting with the melt i.e. the outer iron oxidelayer has already been removed. In the deposit and oxide surface, there are particles of ironvanadium oxide which substantiates the theory that the iron oxide has been reacted. Thefollowing reactions may occur at the oxide-deposit interface [6]. As V 205 is acidic, it willreact with basic oxides as follows:
V205 + Fe2 03 —> 2FeVO4
V205 + Cr203 —> 2CrVO4
V2 05 + 3NiO —> Ni3V,08
In this investigation, it is seen that iron and nickel are present as metal vanadate. There mustbe continual dissolution and migration of these metal oxide ions to the outer part of thedeposit to give precipitation throughout the deposit. There is virtually no vanadium in thesodium sulphate matrix and very little sodium in the vanadate deposits. In the literature,sodium sulphate deposits have been detected [7] at lower temperatures (below 650°C) wherethere is a high SO 3 partial pressure. At higher temperature, the deposit consists of sodiumvanadate.
Corrosion in heavy oil + wood pellets + gasDuring 2002-2004, Avedore II main boiler was fuelled simultaneously with wood pellets, gasand heavy oil. Despite firing with wood pellets, there was no chlorine in the deposits or at thecorrosion front. It is assumed that any of the chlorine present as KC1 has been converted in thecombustion chamber to potassium sulphate according to the following reaction:
2KC1 + SO, + H20 + 1/20, —> K2SO4 + 2HC1A similar reaction mechanism was established when co-firing of straw and coal [8]. The largeamount of sulphur dioxide required to react with KC1 originates from both heavy oil andwood pellets. The potassium sulphate condenses on metal components while HC1 remains inthe gas stream and has no major effect on corrosion.
Figure 9: Potassium chlorine as measured with IACM with different fuel combinations.
From the extensive amount of research on straw-firing, the fear of potassium chloride depositcorrosion was known. Therefore potassium chloride in the gas phase was measured using anIACM system (In situ alkali continuous Monitor System) developed by Vattenfall which isbased on differential optic absorbance spectroscopy [9]. Figure 9 Shows the fluctuation ofpotassium chloride measured in the superheater area when burning different fuelcombinations. Thus wood pellets + gas results in high potassium chloride emissions, howeverthe addition of oil removes potassium chloride. The ratio of oil to wood is very importantsuch that it has been decided that wood pellets will only be used with at least 10% heavy fueloil containing 2% sulphur.
The ash from wood pellets has a high amount of calcium, thus more calcium is alsoincorporated in the deposit. The deposit consists of a matrix of potassium-calcium-sodiumsulphate with particles of vanadate or metal vanadate. However the content of sodium wasvery small and was only present in the deposit at the gas-deposit interface. The deposit wasmuch thicker than during the first year's operation, which was due to the additionalcontribution of potassium and other sulphates, which makes up the bulk of the matrix. Hupa[10] describes thick deposits that were formed on a plant with steam temperature at 535°Cwhere bark was fired together with oil. Similar to this investigation, deposits consisted ofalkali and alkali earth metal sulphates where the alkali sulphates were present dose to thetube. However the presence of vanadium was not seen by Hupa and this may be due to thetype of oil used or bark to oil ratio.
Much work has been conducted on the presence of sodium sulphate and vanadium oxideshowever there is no information on potassium sulphate and vanadium oxide corrosion. Fromphase diagrams [11], it is seen that potassium oxide together with vanadate can give eutecticmelts at even lower temperatures from 390°C. Alkali vanadate corrosion is similar to othersulphate hot corrosion mechanisms where a melt reacts with the oxide and fluxes it away tobe precipitated in the deposit [12]. A difference exists in the corrosion rate in that the sulphatecorrosion mechanisms have a bell-shaped curve with respect to temperature. Corrosionincreases as the temperature to the eutectic melt is approached and then decreases as thecomponents in the eutectic melt decompose. For vanadium corrosion there are mang eutecticmelts that are present as temperature increases, and finally there is vanadium oxide itself as amelt, so corrosion increases exponentially [7].
For the austenitic specimens described, corrosion is caused by the presence of the ash layeradjacent to the tube. The ash layer consists of predominantly potassium sulphate matrix with asmall contribution by calcium. The particles present in the deposit were vanadium oxide andiron oxide, however there were less vanadium compounds in the deposits adjacent the oxidecompared with I st year. Vanadium compounds may have been present in the outer deposit andremoved by soot blowing. The tubes were exposed to a lower temperature than the first yearso the vanadium compounds are not so mobile within the deposit. In addition, due to thegreater amount of ash present, the percentage of vanadium particles has decreased. All factorsprobably contribute to the fewer metal vanadates present adjacent to the oxide. Sulphur isdetected within the oxide at the oxide-metal interface and this indicates that sulphidationoccurs due to the alkali sulphate in the deposit. There is little indication of vanadate corrosion,i.e. that vanadates have dissolved the oxide and precipitated them in the deposit as metalvanadates as was the case last year. Instead, there is evidence of some sulphate fluxing ofoxide, where iron oxides are precipitated within the matrix.
After 3 years exposure, localised grain boundary attack of approx. 100gm of the metaladjacent the oxide was observed. Since sulphur is present at the oxide-metal interface, it canalso diffuse via grain boundaries and form sulphides together with chromium [13]. Internalattack has been observed for especially austenitic alloys at intermediate and low sulphurpartial pressures but at higher temperatures of 800°C. The explanation of such behaviour wasas follows: at low sulphur pressures, the diffusion rate in the alloy plays an important role insulphidation kinetics because of preferential sulphidation of chromium to form the surfacescale. Chromium diffuses faster at grain boundaries than in the bulk such that thecounterflowing will inject vacancies and nucleate voids at the grain boundaries and sulphurcan migrate rapidly through these voids, perhaps as gaseous molecules [14]. The sectionsinvestigated were close to the Boot blower which also could have had some effect.
Both steels have similar low corrosion rates and morphology based on residual metalmeasurements and fireside oxide thickness. However the localised grain boundary attackneeds to be monitored with continued exposure. It must be noted that a corrosion probe hasbeen used to investigate corrosion rates at higher temperatures in this plant with the additionof coal-flyash. The corrosion probe was exposed for a 3 month period and showed thatTP347HFG had a better corrosion resistance compared to Esshete 1250 at higher temperaturesup to 620°C [9].
Steamside oxidationAlthough oxidation for the two steels was similar after the first 3000 hours exposure,subsequent results show a stabilisation of the oxide growth for TP347H FG and a parabolicincrease of the Esshete 1250. Esshete 1250 has oxide morphology where there is chromiumrich oxide at the original alloy grain boundary and fron chromium nickel spinel within thegrains. This is similar to the morphology observed by Osgerby and Fry [15]. Otsuka andFujikawa [16] showed a higher oxidation rate for Esshete 1250 compared to TP347H FG afteronly 1000 hours however this was at temperatures of 700°C. This could indicate that thehigher temperature leads to more chromium diffusion to form a chromium rich protectivelayer faster for TP347H FG. Esshete 1250 has insufficient chromium diffusion due to it lowerchromium concentration to produce such an oxide. As shown from previous investigations ofTP347H FG the oxidation rate of TP347H FG is not parabolic with time, and has a change inkinetics with different temperature ranges. Jianmin et al [17,18] revealed that in this metaltemperature of approximately 540°C, the thickness of the inner oxide is almost stable for
30,000 hours of exposure. Hansson et al [19] showed that at temperatures below 520°C, after60,000 hours exposure, a faster oxidation rate was observed and this needs to be monitored.
Conclusions
Comparisons of the deposits in the different environments show that in oil and gas, thedeposit is sodium sulphate and vanadium compounds which can result in fluxing of the oxide.Change of fuel to wood pellets + gas + heavy oil results in a deposit which is predominantlypotassium sulphate with only a little vanadate. With this deposit, sulphidation and alkalisulphate attack on the oxides has occurred giving modest corrosion rates. However Esshete1250 and TP347HFG do not differ in either corrosion morphology or corrosion rates. On thecontrary for steamside oxidation, Esshete 1250 has a significantly higher oxidation rate. Thiscould result in spallation problems after longer exposures.
References[1] "Corrosion Investigations at Avedore 2 USC Boiler" Internal Energi E2 report, 2002.[2] "Corrosion Investigations at Avedore 2 USC Boiler Part II" Internal Energi E2 report,
December 2003.[3] "Corrosion Investigations at Avedore 2 USC Boiler Part III" Internal Energi E2 report,
December 2004.[4] R.W. Bryers, "Fireside slagging, fouling and high temperature corrosion of heat-transfer
surface due to impurities in steam-raising fuels" Progress Energy Combustion Science,Vol 22 pp. 29-130 (1996)
[5] G. Lai "High Temperature Corrosion of Engineering Alloys" Publ ASTM Internationalpp 154-160.
[6] M. Seierstein, H.J. Ratzer-Sheibe, P. Kofstad. "Sodium vanadate induced corrosion ofMCrA1Y coatings - Burner rig studies" Werkstoffe u Korrosion 38 532-540 (1987)
[7] A. Wong-Moreno, D. Lopez-Lopez L. Martinez L "High temperature corrosionmechanism by combustion products of heavy high sulphur fuel oils: An extension of theWilson Model" NACE Corrosion 2002 Paper 02734.
[8] M. Montgomery, O.H. Larsen "Field test corrosion experiments in Denmark withbiomass fuels Part 2: Co-firing of straw and coal" Materials and Corrosion 53 pp. 185-194 (2002).
[9] J. P. Jensen, K. Nielsen, M. Montgomery, C. Andersson "Ash Chemistry, Corrosion andHeavy Metal Emissions from a 800Mal wood pellet + oil+ natural gas fired powerplant" 14th European Biomass Conference, Paris, 17-21 October, 2005.
[10] M. Hupa "Ash problems when burning bark with oil" VGB Kraftwerkstechnik 59 H7July 1979 pp. 568-576.
[11] "Phase diagrams for ceramists" Two oxides, p89. Publ. American Ceramists Society1964.
[12] R.A. Rapp "Hot corrosion of materials: a fluxing mechanism" Corrosion Science 44, pp209-221 (2002)
[13] R.E. Lobnig, H.J. Grabke "Mechanism of Simultaneous Sulfidation and oxidation of Fe-Cr and Fe-Cr- Ni Alloys and of the failure of protective chromia scales" CorrosionScience Vol 30, 10 pp.1045-1071 (1990).
[14] T. Narita and T. Ishikawa: "Internal sulphidation phenomena of heat resistant alloys atlow sulpur pressures"Materials Science and Engineering, Al20 (1989) pp31-38.
[15] S. Osgerby, A.T. Fry "Steam oxidation resistance of selected austenitic steels" MaterialsScience Forum Vols 461-464 (2004) pp. 1023-1030
[16] N. Otsuka and H. Fujikawa "Scaling of austenitic stainless steels and nickel-base alloysin high temperature steam at 973K" Corrosion April 1991 pp240-248.
[17] J. Jianmin, M. Montgomery, O.H. Larsen, S.A Jensen "Investigation of steam oxidationbehaviour of TP347H FG Part 1: Exposure at 256 bar" Materials and Corrosion 56 pp459-467, 2005
[18] J. Jianmin, M. Montgomery, O.H. Larsen, S.A. Jensen "Investigation of steam oxidationbehaviour of TP347H FG Part 2: Exposure at 91 bar" Materials and Corrosion 56 pp.542-549, 2005.
[19] A.N. Hansson, L. Korcakova, M. Montgomery "Long-term steam oxidation of TP347HFG in power plants" Microscopy of oxidation 6 Conference, Birmingham UK, April2005.
Acknowledgements: PSO has financially supported the IACM analysis.
HEAT EXCHANGER CORROSION IN BIOMASS AND COALCO-FIRED POWER PLANTS
N J Simms , P J Kilgallon and J E Oakey
Energy Technology Centre, Cranfield University,Cranfield, Bedfordshire, MK43 OAL, UK
Abstract
Co-firing of biomass in conventional pulverized coal power generating systems offers a means to rapidlyintroduce renewable and CO 2 neutral fuels into the power generation market. The existing coal-fired powerstations are both much larger and more efficient than potential new biomass power plants; so a few % of biomassfed into an existing large coal fired Station will give more biomass derived power than a new dedicated biomassstation using the same amount of biomass. The introduction of biomass can be achieved by relatively minormodifications to existing coal-fired plants and so avoids the large capital costs and risks of building a newbiomass-only fired power system. However, for the existing coal fired power stations, this gives some potentialpractical problems: the control of co-firing two fuels; changes to bottom/fly ash chemistry; changes to deposition(fouling and slagging) within the boiler; reduced reliability of key high temperature components (e.g. heatexchangers), due to increased corrosion problems relative to those experienced with coal alone.
This paper reports the results of a series of laboratory corrosion tests that have been carried out to assess theeffects of co-firing coal on the fireside corrosion of heat exchangers. The 1000 hour corrosion tests have beencarried out using the deposit recoat method in controlled atmosphere furnaces, at typical superheater andevaporator metal temperatures using simulated deposit compositions and gaseous environments (selected on thebasis of plant experience and potential fuel compositions). Five materials were exposed in these tests: 1 Cr steel,2.25 Cr steel, X20CrMoV121, AISI 347H and alloy 625. During the tests, the materials degradation wasmonitored using mass measurements. However, one of the aims of the work was to produce statistically validdata on the actual metal loss from the materials and so the performance of the material in these tests wasdetermined from dimensional metrology before and after exposure. For each material, these data have been usedto determine the sensitivity of the corrosion damage to changes in the exposure conditions (e.g. depositcomposition, gas composition). SEM/EDX analyses of selected samples have been used to confirm whetherchanges in corrosion mechanism were associated with changes in damage levels (e.g. pitting to internalcorrosion). Taking the analysis of the numerical data further, models of the corrosion performance of thematerials have been produced for the Tange of test conditions investigated.
Keywords: co-firing; biomass; coal; heat exehanger; fireside corrosion
Introduction
Co-firing of biomass in conventional pulverized coal power generating systems offers ameans to rapidly introduce renewable and CO2 neutral fuels into the power generation market.Interest in this type of co-firing is being stimulated by the search for electricity generationmethods that minimise environmental emissions and utilise available sustainable fuel sources,as well as regulatory pressures. The existing coal-fired power stations are both much largerand more efficient than potential new biomass power plants; so a few % of biomass fed intoan existing large coal fired station will give more biomass derived power than a newdedicated biomass station using the same amount of biomass. The introduction of biomasscan be achieved by relatively minor modifications to existing coal-fired plants and so avoidsthe large capital costs and risks of building a new biomass-only fired power system. However,for the existing coal fired power stations, this gives some potential practical problems:handling and feeding biomass fuels, the control of co-firing two fuels; changes to bottom/fly
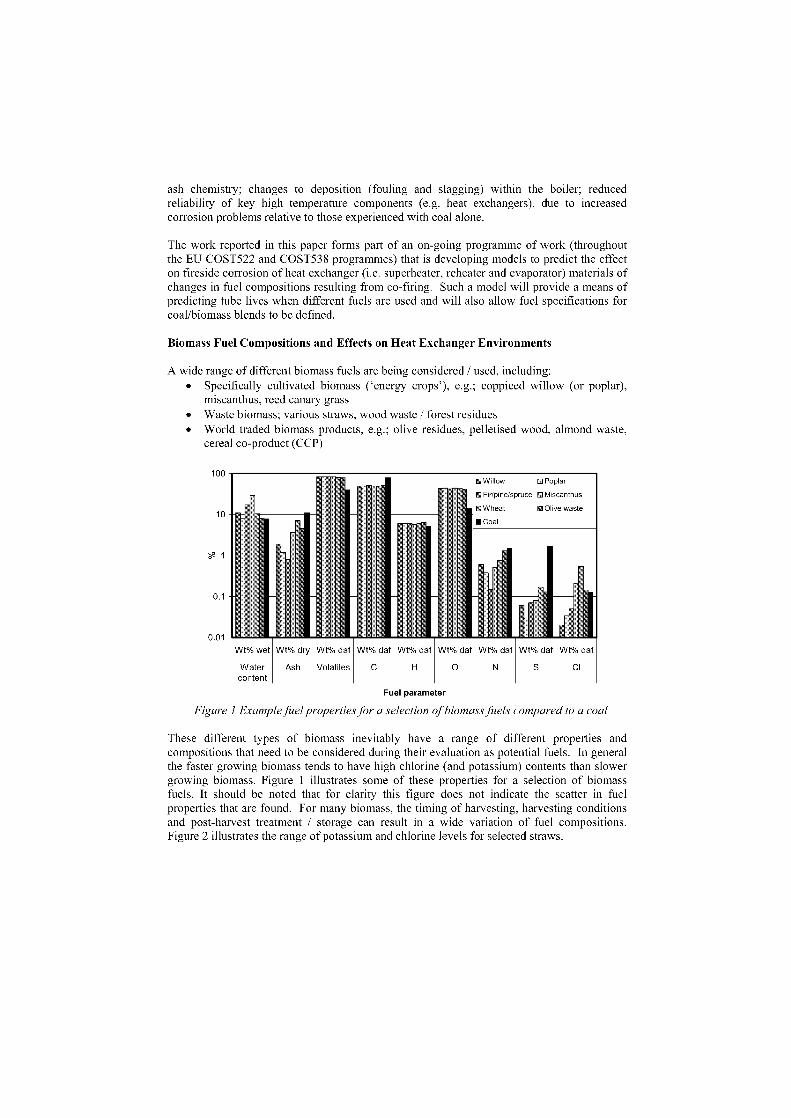
100
10
■1
0.1
0.01Wt% wet Wt% dry Wt% daf Wt% daf Wt% daf
Watercontent
Ash Volatiles C H
Willow D Poplar
IEI Fir/pine/spruce 0 Miscanthus
O Wheat El Olive waste
■ Coal
ash chemistry; changes to deposition (fouling and slagging) within the boiler; reducedreliability of key high temperature components (e.g. heat exchangers), due to increasedcorrosion problems relative to those experienced with coal alone.
The work reported in this paper forms part of an on-going programme of work (throughoutthe EU COST522 and COST538 programmes) that is developing models to predict the effectan fireside corrosion of heat exchanger (i.e. superheater, reheater and evaporator) materials ofchanges in fuel compositions resulting from co-firing. Such a model will provide a means ofpredicting tube lives when different fuels are used and will also allow fuel specifications forcoal/biomass blends to be defined.
Biomass Fuel Compositions and Effects an Heat Exchanger Environments
A wide range of different biomass fuels are being considered / used, including:• Specifically cultivated biomass (`energy crops'), e.g.; coppiced willow (or poplar),
miscanthus, reed canary grass• Waste biomass; various straws, wood waste / forest residues• World traded biomass products, e.g.; olive residues, pelletised wood, almond waste,
cereal co-product (CCP)
Fuel parameter
Figure 1 Example fuel properties for a selection of biomass fuels compared to a coal
These different types of biomass inevitably have a range of different properties andcompositions that need to be considered during their evaluation as potential fuels. In generalthe faster growing biomass tends to have high chlorine (and potassium) contents than slowergrowing biomass. Figure 1 illustrates some of these properties for a selection of biomassfuels. It should be noted that for clarity this figure does not indicate the scatter in fuelproperties that are found. For many biomass, the timing of harvesting, harvesting conditionsand post-harvest treatment / storage can result in a wide variation of fuel compositions.Figure 2 illustrates the range of potassium and chlorine levels for selected straws.
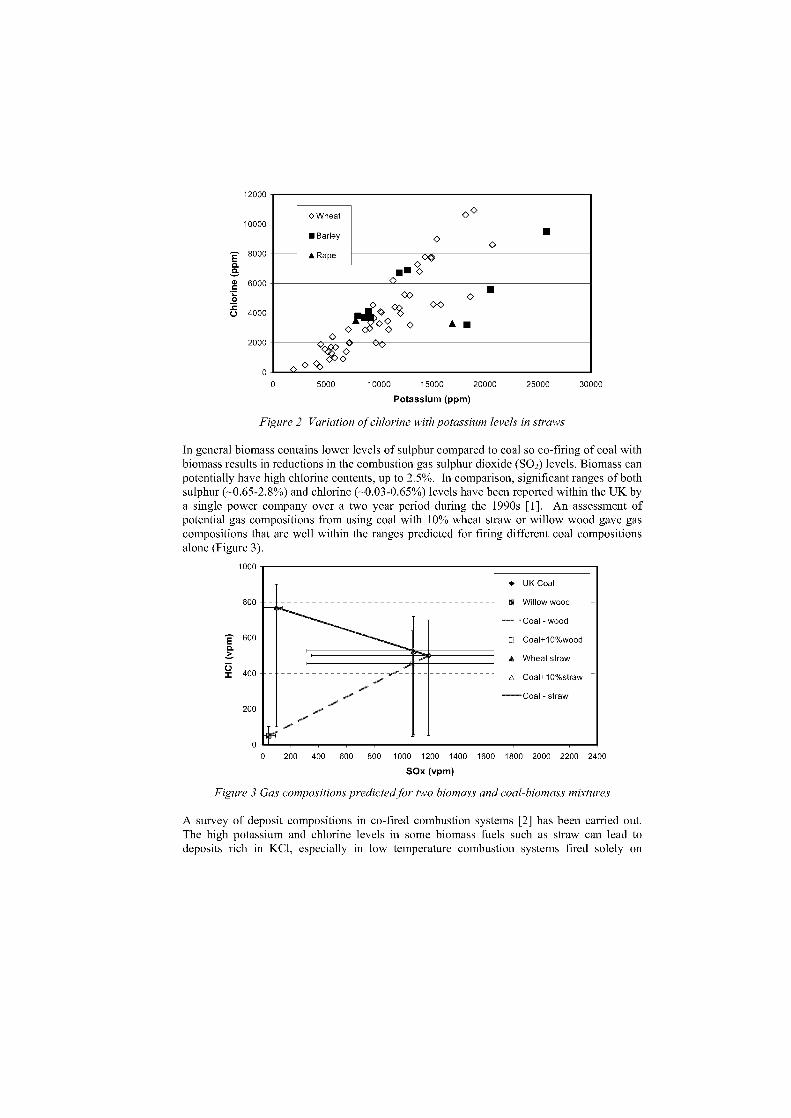
000 VVheat
■ Barley 0 •
O• Rape
<>
0 .
<X>
•0 •
_
OO
o o • ■
.
ö 0
-.0o
5000 10000 15000 20000 25000
30000
12000
10000
• 8000
g:2 6000
O 4000
2000
00
• UK Coal
■ VVillow wood
— Coal - wood
• Coal+10%wood
1 VVheat straw
A Coal+10%straw
—Coal - straw
Potassium (ppm)
Figure 2 Variation of chlorine with potassium levels in straws
In general biomass contains lower levels of sulphur compared to coal so co-firing of coal withbiomass results in reductions in the combustion gas sulphur dioxide (80 2) levels. Biomass canpotentially have high chlorine contents, up to 2.5%. In comparison, significant ranges of bothsulphur (-0.65-2.8%) and chlorine (-0.03-0.65%) levels have been reported within the UK bya single power company over a two year period during the 1990s [1]. An assessment ofpotential gas compositions from using coal with 10% wheat straw or willow wood gave gascompositions that are well within the ranges predicted for firing different coal compositionsalone (Figure 3).
200 400 600 800 1000 1200 1400 1600 1800 2000 2200 2400
SOx (vpm)
Figure 3 Gas compositions predicted for two biomass and coal-biomass mixtures
A survey of deposit compositions in co-fired combustion systems [2] has been carried out.The high potassium and chlorine levels in some biomass fuels such as straw can lead todeposits rich in KC1, especially in low temperature combustion systems fired solely an
1000
800
-g 600
400
200
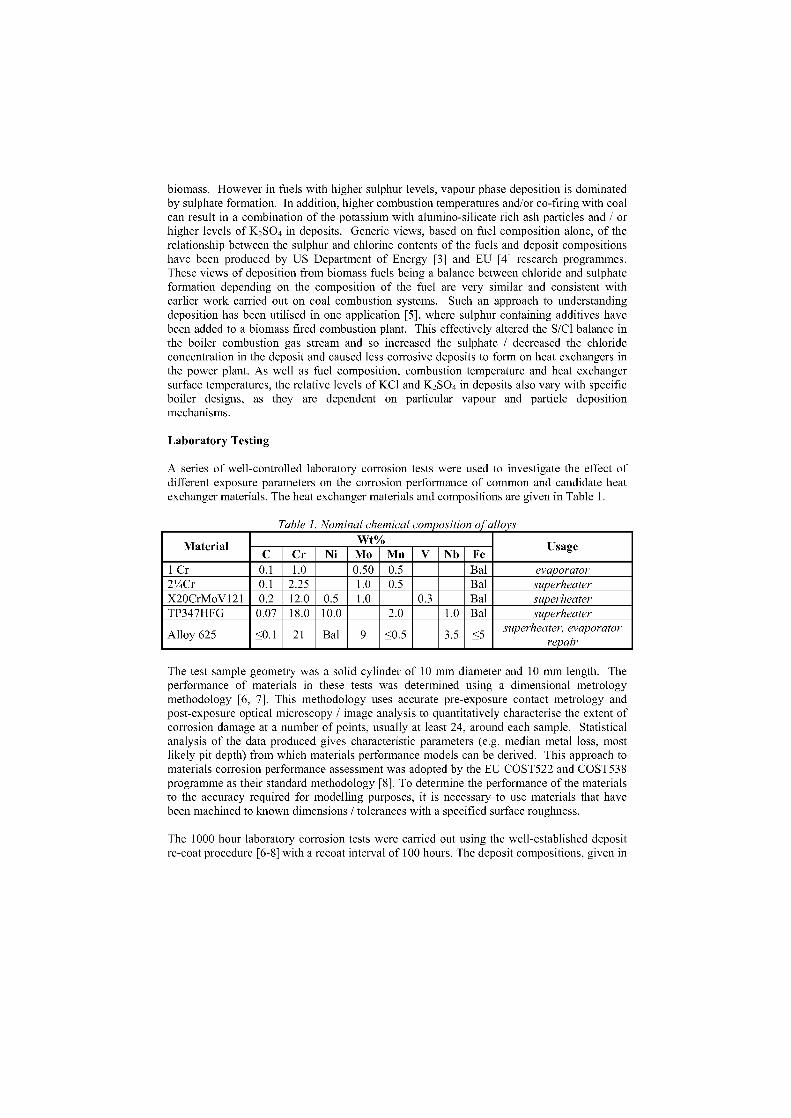
biomass. However in fuels with higher sulphur levels, vapour phase deposition is dominatedby sulphate formation. In addition, higher combustion temperatures and/or co-firing with coalcan result in a combination of the potassium with alumino-silicate rich ash particles and / orhigher levels of K2 SO 4 in deposits. Generic views, based on fuel composition alone, of therelationship between the sulphur and chlorine contents of the fuels and deposit compositionshave been produced by US Department of Energy [3] and EU [4] research programmes.These views of deposition from biomass fuels being a balance between chloride and sulphateformation depending on the composition of the fuel are very similar and consistent withearlier work carried out on coal combustion systems. Such an approach to understandingdeposition has been utilised in one application [5], where sulphur containing additives havebeen added to a biomass fired combustion plant. This effectively altered the S/C1 balance inthe boiler combustion gas stream and so increased the sulphate / decreased the chlorideconcentration in the deposit and caused less corrosive deposits to form on heat exchangers inthe power plant. As well as fuel composition, combustion temperature and heat exchangersurface temperatures, the relative levels of KC1 and K 2 SO4 in deposits also vary with specificboiler designs, as they are dependent on particular vapour and particle depositionmechanisms.
Laboratory Testing
A series of well-controlled laboratory corrosion tests were used to investigate the effect ofdifferent exposure parameters on the corrosion performance of common and candidate heatexchanger materials. The heat exchanger materials and compositions are given in Table 1.
Table 1. Nominal chemical composition of alloys
Material Wt% UsageC Cr Ni Mo Mn V Nb Fe
1 Cr 0.1 1.0 0.50 0.5 Bal evaporator2 1/4Cr 0.1 2.25 1.0 0.5 Bal superheater
superheatersuperheater
superheater, evaporatorrepair
X20CrMoV121 0.2 12.0 0.5 1.0 0.3 BalTP347HFG 0.07 18.0 10.0 2.0 1.0 Bal
Alloy 625 <0.1 21 Bal 9 <0.5 3.5 <5
The test sample geometry was a solid cylinder of 10 mm diameter and 10 mm length. Theperformance of materials in these tests was determined using a dimensional metrologymethodology [6, 7]. This methodology uses accurate pre-exposure contact metrology andpost-exposure optical microscopy / image analysis to quantitatively characterise the extent ofcorrosion damage at a number of points, usually at least 24, around each sample. Statisticalanalysis of the data produced gives characteristic parameters (e.g. median metal loss, mostlikely pit depth) from which materials performance models can be derived. This approach tomaterials corrosion performance assessment was adopted by the EU COST522 and COST538programme as their standard methodology [8]. To determine the performance of the materialsto the accuracy required for modelling purposes, it is necessary to use materials that havebeen machined to known dimensions / tolerances with a specified surface roughness.
The 1000 hour laboratory corrosion tests were carried out using the well-established depositre-coat procedure [6-8] with a recoat interval of 100 hours. The deposit compositions, given in
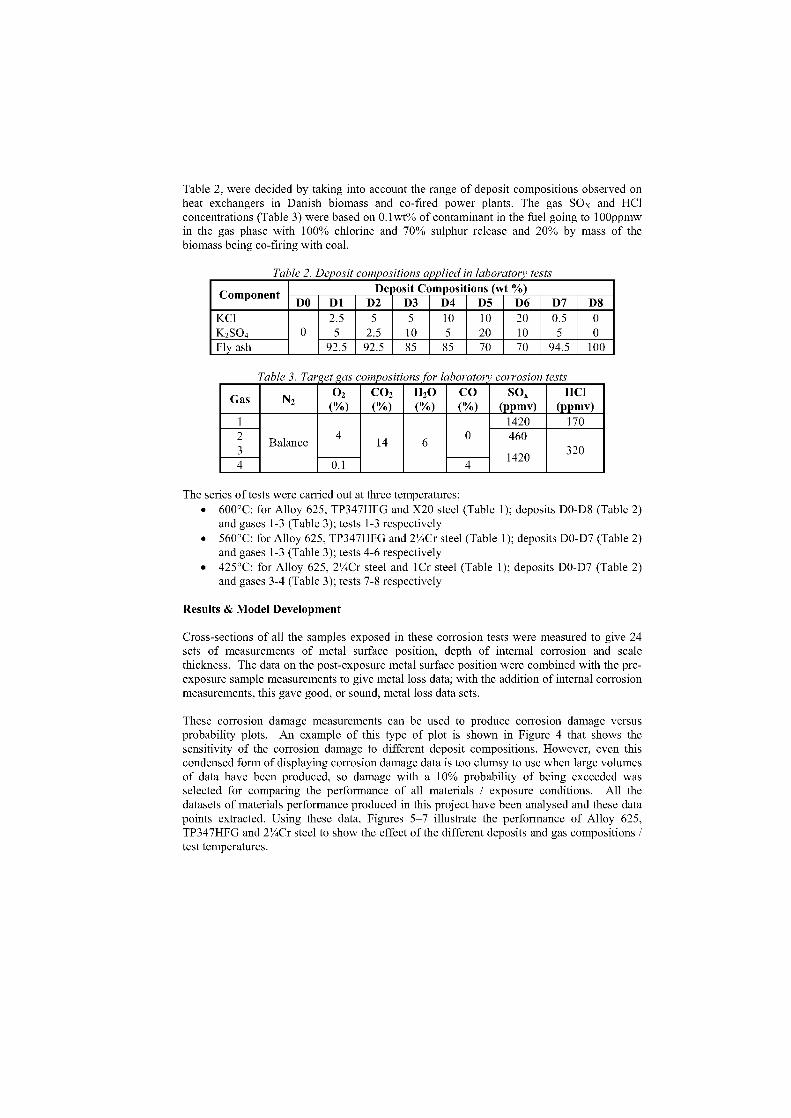
Table 2, were decided by taking into account the range of deposit compositions observed onheat exchangers in Danish biomass and co-fired power plants. The gas SOx and HC1concentrations (Table 3) were based on 0.1wt% of contaminant in the fuel going to 100ppmwin the gas phase with 100% chlorine and 70% sulphur release and 20% by mass of thebiomass being co-firing with coal.
Table 2. Deposit compositions annlied in laboratorv tests
Component Deposit Compositions (wt %)DO D1 D2 D3 D4 D5 D6 D7 D8
KC1 2.5 5 5 10 10 20 0.5 0K2SO4 0 5 2.5 10 5 20 10 5 0Fly ash 92.5 92.5 85 85 70 70 94.5 100
Table 3. Target gas compos ons for laboratory corrosion tests
Gas N202
(%)
4
CO2(%)
14
H20(%)
6
CO(%)
0
SOx(ppmv)
1420
HC1(ppmv)
1701
Balance2 460320
14204 0.1 4
The series of tests were carried out at three temperatures:• 600°C: for Alloy 625, TP347HFG and X20 steel (Table 1); deposits D0-D8 (Table 2)
and gases 1-3 (Table 3); tests 1-3 respectively• 560°C: for Alloy 625, TP347HFG and 2 14Cr steel (Table 1); deposits D0-D7 (Table 2)
and gases 1-3 (Table 3); tests 4-6 respectively• 425°C: for Alloy 625, 21/4Cr steel and 1Cr steel (Table 1); deposits D0-D7 (Table 2)
and gases 3-4 (Table 3); tests 7-8 respectively
Results & Model Development
Cross-sections of all the samples exposed in these corrosion tests were measured to give 24sets of measurements of metal surface position, depth of internal corrosion and scalethickness. The data on the post-exposure metal surface position were combined with the pre-exposure sample measurements to give metal loss data; with the addition of internal corrosionmeasurements, this gave good, or sound, metal loss data sets.
These corrosion damage measurements can be used to produce corrosion damage versusprobability plots. An example of this type of plot is shown in Figure 4 that Shows thesensitivity of the corrosion damage to different deposit compositions. However, even thiscondensed form of displaying corrosion damage data is too clumsy to use when large volumesof data have been produced, so damage with a 10% probability of being exceeded wasselected for comparing the performance of all materials / exposure conditions. All thedatasets of materials performance produced in this project have been analysed and these datapoints extracted. Using these data, Figures 5-7 illustrate the performance of Alloy 625,TP347HFG and 21/4Cr steel to show the effect of the different deposits and gas compositions /test temperatures.
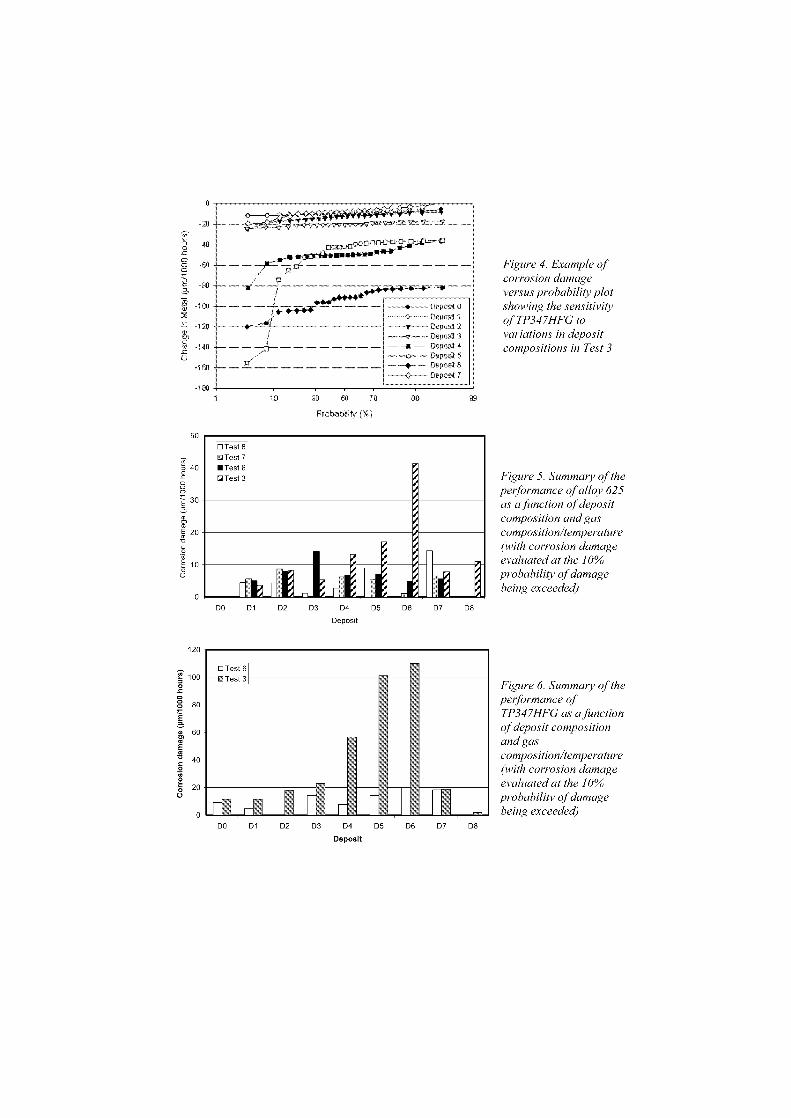
Figure 4. Example ofcorrosion damageversus probability plotshowing the sensitivityof TP347HFG tovariations in depositcompositions in Test 3
50 70
• D rst()Deo, MI 1
r 3— -tu — A1 4
M 5--r^ Es3t6
Deposit 7
qTest 8▪ Test 7■ Test 6
Test 3
[irt 1 " r qTest 6
Test 3
r
DO D1 D2 D3 D4 D5
D6 D7 D8
Deposit
DO D1 D2 D3 D4 D5 D6 D7 D8Deposit
Figure 5. Summaiy of theperformance of alloy 625as a function of depositcomposition and gascomposition/temperature(with corrosion damageevaluated at the 10%probability of damagebeing exceeded)
Figure 6. Summaiy of theperformance ofTP347HFG as a functionof deposit compositionand gascomposition/temperature(with corrosion damageevaluated at the 10%probability of damagebeing exceeded)
50
400
"2 30
20
10
0
120
e 100
80EO 600)
0 40
0
0 20
0
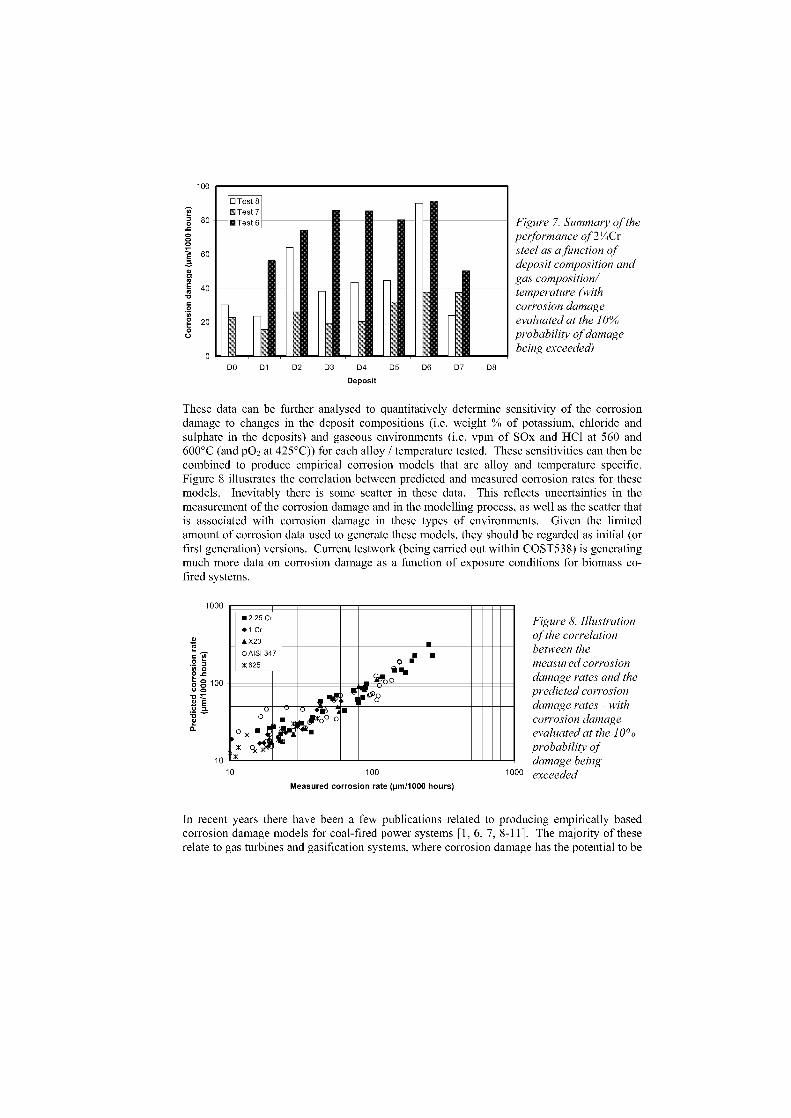
O Test 8Test 7
■ Test 6
100
80
60
40
20
0
Figure 7. Summary of theperformance of 21/4Crsteel as a function ofdeposit composition andgas composition/temperature (withcorrosion damageevaluated at the 10%probability of damagebeing exceeded)
DO D1 D2 D3 D4 D5 D6 D7 D8Deposit
These data can be further analysed to quantitatively determine sensitivity of the corrosiondamage to changes in the deposit compositions (i.e. weight % of potassium, chloride andsulphate in the deposits) and gaseous environments (i.e. vpm of SOx and HC1 at 560 and600°C (and p02 at 425°C)) for each alloy / temperature tested. These sensitivities can then becombined to produce empirical corrosion models that are alloy and temperature specific.Figure 8 illustrates the correlation between predicted and measured corrosion rates for thesemodels. Inevitably there is some scatter in these data. This reflects uncertainties in themeasurement of the corrosion damage and in the modelling process, as well as the scatter thatis associated with corrosion damage in these types of environments. Given the limitedamount of corrosion data used to generate these models, they should be regarded as initial (orfirst generation) versions. Current testwork (being carried out within COST538) is generatingmuch more data an corrosion damage as a function of exposure conditions for biomass co-fired systems.
1000
10
• 2.25 Cr
• 1 Cr
• X20 •0 AISI 347
X 625 0il%
sitio0
••
•
141,°0 • t■epo 0
• II - ;0
0
(3,■
10 100
1000
Measured corrosion rate (pm/1000 hours)
Figure 8. Illustrationof the correlationbetween themeasured corrosiondamage rotes and thepredicted corrosiondamage rotes - withcorrosion damageevaluated at the 10%probability ofdamage beingexceeded
In recent years there have been a few publications related to producing empirically basedcorrosion damage models for Goal-fired power systems [1, 6, 7, 8-11]. The majority of theserelate to gas turbines and gasification systems, where corrosion damage has the potential to be
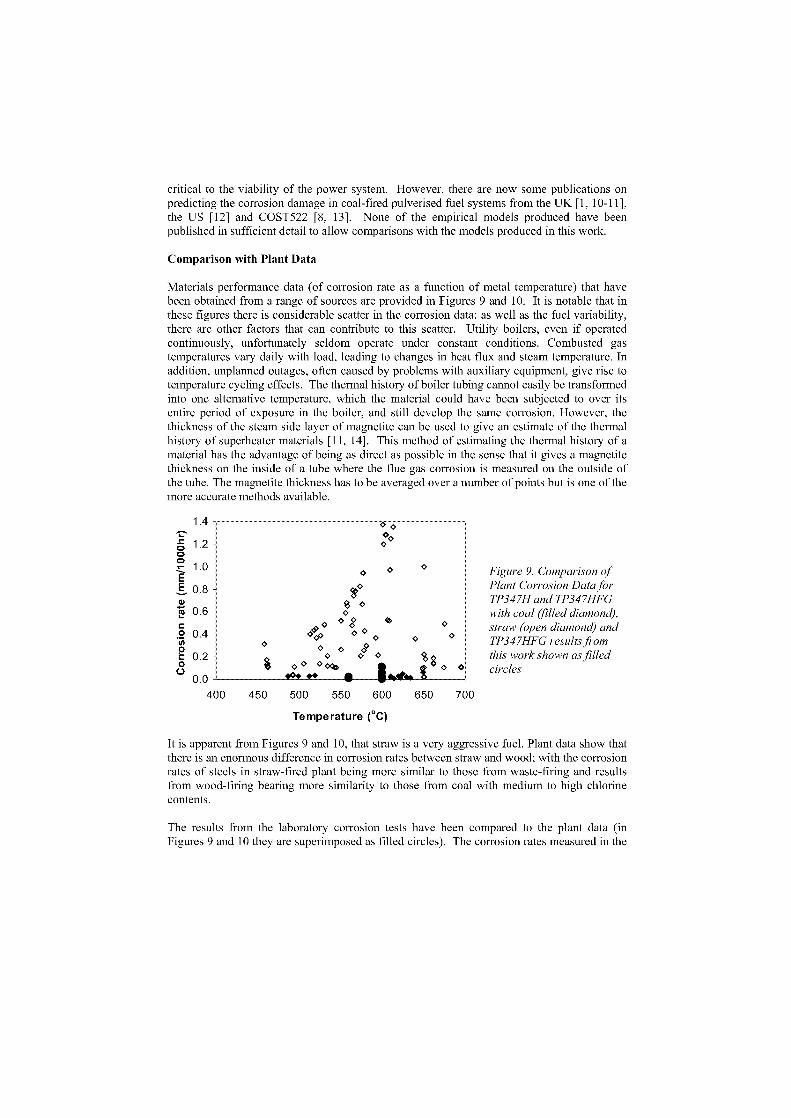
critical to the viability of the power system. However, there are now some publications onpredicting the corrosion damage in coal-fired pulverised fuel systems from the UK [1, 10-11],the US [12] and COST522 [8, 13]. None of the empirical models produced have beenpublished in sufficient detail to allow comparisons with the models produced in this work.
Comparison with Plant Data
Materials performance data (of corrosion rate as a function of metal temperature) that havebeen obtained from a range of sources are provided in Figures 9 and 10. It is notable that inthere figures there is considerable scatter in the corrosion data: as well as the fuel variability,there are other factors that can contribute to this scatter. Utility boilers, even if operatedcontinuously, unfortunately seldom operate under constant conditions. Combusted gastemperatures vary daily with load, leading to changes in heat flux and steam temperature. Inaddition, unplanned outages, often caused by problems with auxiliary equipment, give rise totemperature cycling effects. The thermal history of boiler tubing cannot easily be transformedinto one alternative temperature, which the material could have been subjected to over itsentire period of exposure in the Boiler, and still develop the same corrosion. However, thethickness of the steam side layer of magnetite can be used to give an estimate of the thermalhistory of superheater materials [11, 14]. This method of estimating the thermal history of amaterial has the advantage of being as direct as possible in the Sense that it gives a magnetitethickness on the inside of a tube where the flue gas corrosion is measured on the outside ofthe tube. The magnetite thickness has to be averaged over a number of points but is one of themore accurate methods available.
Figure 9. Comparison ofPlant Corrosion Data forTP347H and TP347HFGwith coal (filled diamond),straw (open diamond) andTP347HFG results fromthis work shown as filledcircles
Temperature (°C)
It is apparent from Figures 9 and 10, that straw is a very aggressive fuel. Plant data show thatthere is an enormous difference in corrosion rates between straw and wood; with the corrosionrates of steels in straw-fired plant being more similar to those from waste-firing and resultsfrom wood-firing bearing more similarity to those from coal with medium to high chlorinecontents.
The results from the laboratory corrosion tests have been compared to the plant data (inFigures 9 and 10 they are superimposed as filled circles). The corrosion rates measured in the
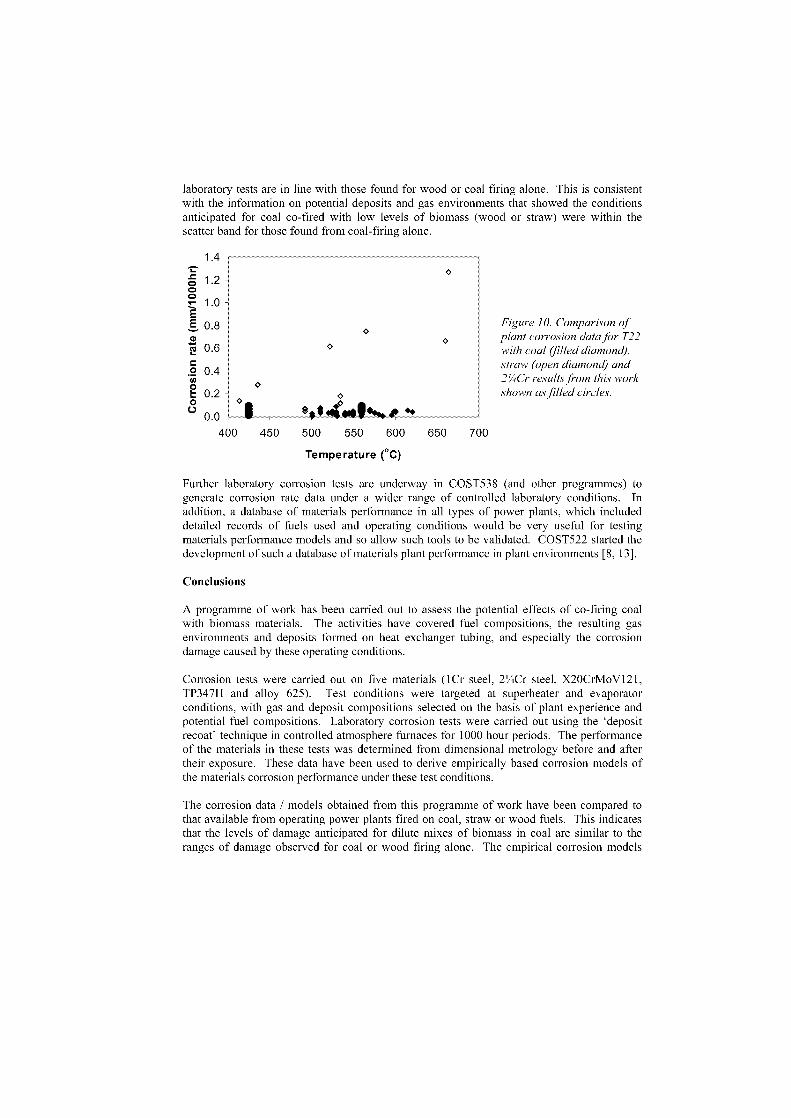
Figure 10. Comparison ofplant corrosion data for T22with coal (filled diamond),straw (open diamond) and21/2Cr results from this workshown as filled circles.
700
laboratory tests are in line with those found for wood or coal firing alone. This is consistentwith the information on potential deposits and gas environments that showed the conditionsanticipated for coal co-fired with low levels of biomass (wood or straw) were within thescatter band for those found from coal-firing alone.
Temperature (°C)
Further laboratory corrosion tests are underway in COST538 (and other programmes) togenerate corrosion rate data under a wider range of controlled laboratory conditions. Inaddition, a database of materials performance in all typen of power plants, which includeddetailed records of fuels used and operating conditions would be very useful for testingmaterials performance models and so allow such tools to be validated. COST522 started thedevelopment of such a database of materials plant performance in plant environments [8, 13].
Conclusions
A programme of work has been carried out to assess the potential effects of co-firing coalwith biomass materials. The activities have covered fuel compositions, the resulting gasenvironments and deposits formed on heat exchanger tubing, and especially the corrosiondamage caused by these operating conditions.
Corrosion tests were carried out on five materials (1Cr steel, 21/4Cr steel, X20CrMoV121,TP347H and alloy 625). Test conditions were targeted at superheater and evaporatorconditions, with gas and deposit compositions selected on the basis of plant experience andpotential fuel compositions. Laboratory corrosion tests were carried out using the `depositrecoat' technique in controlled atmosphere furnaces for 1000 hour periods. The performanceof the materials in these tests was determined from dimensional metrology before and aftertheir exposure. These data have been used to derive empirically based corrosion models ofthe materials corrosion performance under these test conditions.
The corrosion data / models obtained from this programme of work have been compared tothat available from operating power plants fired on coal, straw or wood fuels. This indicatesthat the levels of damage anticipated for dilute mixen of biomass in coal are similar to theranges of damage observed for coal or wood firing alone. The empirical corrosion models
developed within this work are based on a limited set of experimental data. A more extensiveset of linked corrosion tests would give rise to a more comprehensive corrosion model, withincreased scope in terms of the range of conditions covered and increased confidence in itsreliability. This work is being carried out within the on-going COST538 programme.
References
[1] P.J. James and L.W. Pinder, Materials at High Temperature 14 (2/3) (1997) p117[2] Reliability Improvements For Co-Combustion Plants, Final Report of ECSC Project
7220-PR-080 (2002)[3] A. Robinson, L. Baxter, H. Junker, C. Shaddix, M. Freeman, R. James and D. Dayton,
`Fireside Issues Associated with Coal-Biomass Co-firing', NREL Report TP-570-25767(1998)
[4] 'Operational Problems, Trace Emissions and By-Product Management for IndustrialBiomass Co-Combustion', Publishable Final Summary Report on EU contract JOR3-CT95-0057 (OPTEB), 1999
[5] P.J. Henderson, J. Hogberg and M. Mattsson, 'Reduction in Fireside Corrosion ofSuperheater Materials in a Biomass-fired Circulating Fluidised Bed Boiler', Materialsfor Advanced Power 2002, Eds J Lecomte-Beckers et al (Forschungszentrum Jülich),p883.
[6] 'Erosion/Corrosion of Advanced Materials for Coal-fired Combined Cycle PowerGeneration', EC JOULE Project, JOUF-0022.
[7] N.J. Simms, J.E. Oakey, D.J. Stephenson, P J Smith and J R Nicholls, Trosion/Corrosionof Gas Turbine Materials for Coal-Fired Combined Cycle Power Generation', Erosion byLiquid and Solid Impact, Cambridge, 4-8 September 1994
[8] S.R.J. Saunders, N.J. Simms, S. Osgerby and J.E. Oakey, 'Degradation of Boiler andHeat Exchanger Materials: Data generation, Databases and Predictive Modelling',Materials for Advanced Power 2002, Eds J Lecomte-Beckers et al (ForschungszentrumJülich,), p801
[9] N.J. Simms, J.R. Nicholls and J.E. Oakey, Materials Science Forum 369-372 (2001)p947
[10] L. Pinder and C. Davis, 'Effect of Fuel Type on the Fireside Corrosion of BoilerMaterials for Advanced Clean Coal Technologies', Materials for Advanced Power2002, Eds J Lecomte-Beckers et al (Forschungszentrum Jülich), p893
[11] P.J. Henderson, A. Karlsson, C. Davis, P. Rademakers, J. Cizner, B. Formanek, K.Goransson and J. Oakey, 'In-situ Fireside Corrosion Testing of Advanced BoilerMaterials with Diverse Fuels', Materials for Advanced Power 2002, Eds J Lecomte-Beckers et al (Forschungszentrum Jülich), p785
[12] T.M. Linjewile, J. Valentine, K.A. Davis, N.S. Harding and W.M. Cox, Materials atHigh Temperatures 20 (2) (2003), pp175-185
[13] N.J. Simms, S.R.J Saunders, S. Osgerby and J.E. Oakey, `Measurement and andcompilation of materials degradation data in the COST522 programme', Materials atHigh Temperatures 20(2) (2003), pp137-152
[14] M. Montgomery and A. Karlsson, 'Corrosion Investigations at Masnedo CombinedHeat and Power Plant', Part 1 (DTU and ELKRAFT, July 1997), Part II (DTU andELKRAFT, November 1997) and Part V (DTU, ELKRAFT and Elsam, December1999)
HOT CORROSION MONITORING OF ALLOY 617 IN MOLTENCHLORIDES USING ELECTROCHEMICAL TECHNIQUES
F. J. Nrez, M.P. Hierro and J. NietoGrupo de Investigaci6n de Ingenieria de Superficies. Universidad Complutense de
Madrid. Departamento de Ciencia de los Materiales. Facultad de Ciencias Quimicas.28040 Madrid. Spain
Abstract
Molten chloride mixtures are formed in waste incineration plants during waste firing and energyproduction. These mixtures are responsible for degradation processes like hot corrosion. In order toevaluate the damage of molten salt mixtures in waste incineration environments, the alloy 617 wasexposed beneath a molten KCI-ZnC1 2 mixture at 650 °C in air. The corrosion process was monitored byelectrochemical impedance spectroscopy (EIS). An extensive microscopy analysis have been done inorder to correlate the electrochemical results, and to establish an electrochemical mechanism for suchhigh temperature corrosion process.
Keywords: Waste Incineration, Molten Salt Corrosion, Electrochemical Impedance.
1. Introduction
Incineration plants are recognized as a valid and efficient technology to treatmunicipal solid wastes, particularly when they are part of integrated treatment plants.Waste incineration reduces the waste volume and weight, thus saving space an thelandfill; also the end products are hygienized by transforming organic matter into waterand carbon dioxide (CO 2); it is also possible to recover steam and/or energy. The mainenvironmental impact in an incineration plant is due to the residues of the process(solid, liquid and gaseous emissions). Also, these residues cause the corrosion processin boiler superheater tubes used in incinerators and biomass-fired plants. The gaseousspecies (HC1, C12 , SO2, etc.) and solid impurities as the alkali and heavy metals (K, Na,Zn, Pb, Sn, etc.) can form chlorides and sulphates with a low melting point, theseeutectic salts allow the accelerated attack of metallic materials in oxidizingenvironments [1-5] .
In this work the corrosion resistance of Ni-base alloy 617 was studied under theinfluence of molten KC1(70%mol)-ZnC12(30%mol) salt mixture at 650 °C in airatmosphere. This salt mixture has frequently been identified in the ash deposits of wasteincinerations. Chlorine played an important role in the degradation of 617 alloy, thematerial corrosion resistance was altered by loss of structural elements as volatilechlorides (CrC13 , NiC12).The corrosion process was monitored by electrochemical impedance spectroscopy. Thistechnique provides a real time monitoring process of the experiment without disturbingthe thermodynamic system; so many measurements can be taken at different times toestablish the corrosion mechanism.
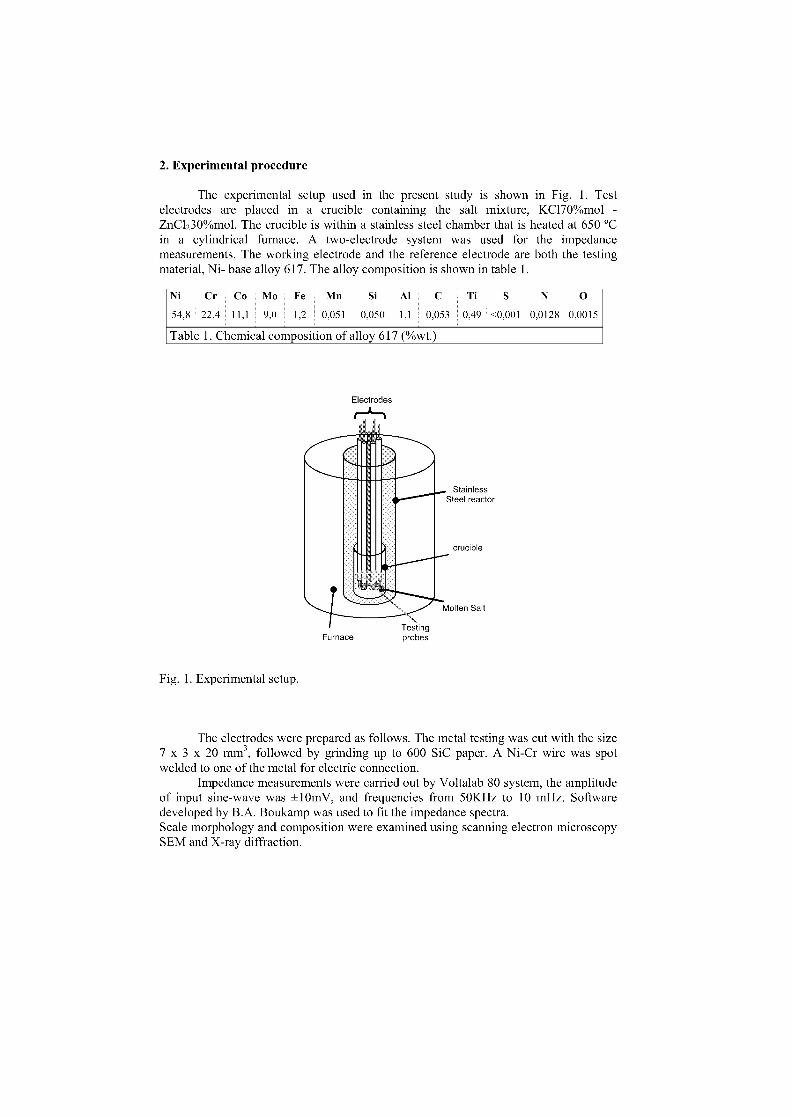
StainlessSteel reactor
crucible
Molten Salt
2. Experimental procedure
The experimental setup used in the present study is shown in Fig. 1. Testelectrodes are placed in a crucible containing the Salt mixture, KC170%mol -ZnC1230%mol. The crucible is within a stainless steel chamber that is heated at 650 °Cin a cylindrical furnace. A two-electrode system was used for the impedancemeasurements. The working electrode and the reference electrode are both the testingmaterial, Ni- base alloy 617. The alloy composition is shown in table 1.
Ni Cr Co Mo Fe Mn Si Al C
54,8 22,4 11,1 9,0 1,2 0,051 0,050 1,1 0,053
Table 1. Chemical composition of alloy 617 (%wt.)
Ti S N 0
0,49 <0,001 0,0128 0,0015
Electrodes
r-A-n
Fig. 1. Experimental setup.
The electrodes were prepared as follows. The metal testing was cut with the size7 x 3 x 20 mm3 , followed by grinding up to 600 SiC paper. A Ni-Cr wire was spotwelded to one of the metal for electric connection.
Impedance measurements were carried out by Voltalab 80 system, the amplitudeof input sine-wave was ±10mV, and frequencies from 50KHz to 10 mHz. Softwaredeveloped by B.A. Boukamp was used to fit the impedance spectra.Scale morphology and composition were examined using scanning electron microscopySEM and X-ray diffraction.
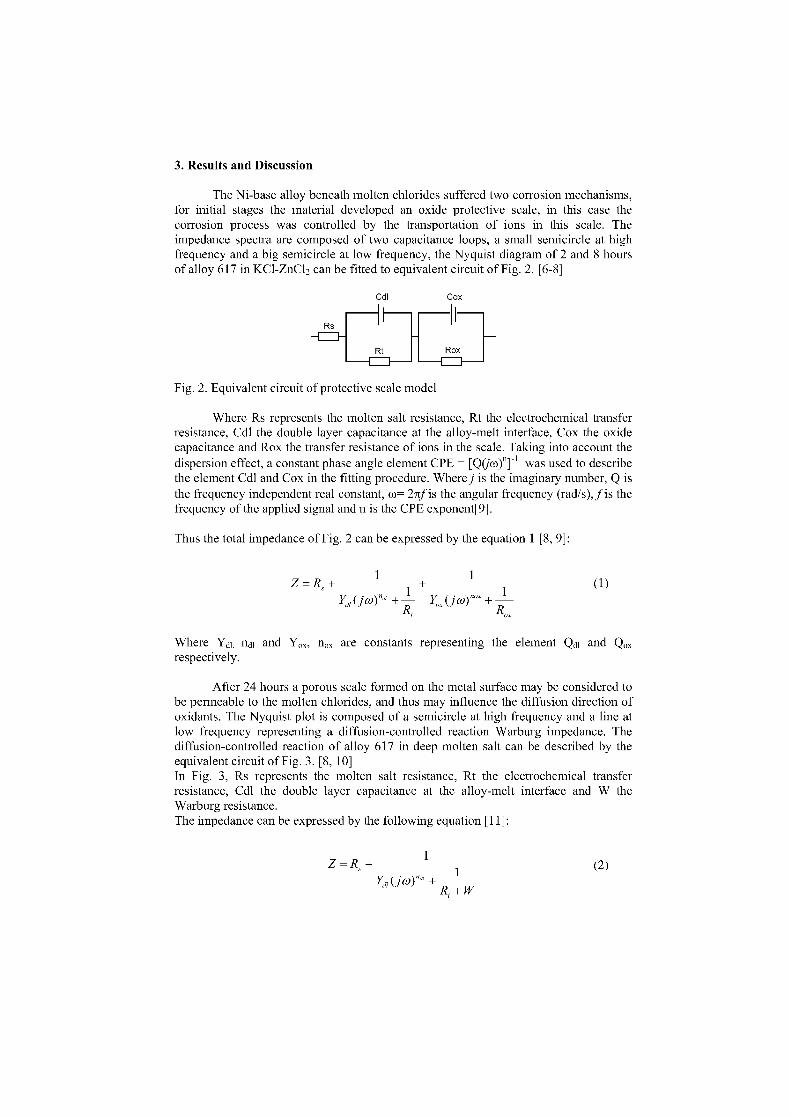
3. Results and Discussion
The Ni-base alloy beneath molten chlorides suffered two corrosion mechanisms,for initial stages the material developed an oxide protective scale, in this case thecorrosion process was controlled by the transportation of ions in this scale. Theimpedance spectra are composed of two capacitance loops, a Small semicircle at highfrequency and a big semicircle at low frequency, the Nyquist diagram of 2 and 8 hoursof alloy 617 in KC1-ZnC1 2 can be fitted to equivalent circuit of Fig. 2. [6-8]
Cdl
Cox
Rs-1
Rt Rox
Fig. 2. Equivalent circuit of protective scale model
Where Rs represents the molten salt resistance, Rt the electrochemical transferresistance, Cdl the double layer capacitance at the alloy-melt interface, Cox the oxidecapacitance and Rox the transfer resistance of ions in the scale. Taking into account thedispersion effect, a constant phase angle element CPE = [Q(jco)°r i was used to describethe element Cdl and Cox in the fitting procedure. Where j is the imaginary number, Q isthe frequency independent real constant, co= 4f is the angular frequency (rad/s),f is thefrequency of the applied Signal and n is the CPE exponent[9].
Thus the total impedance of Fig. 2 can be expressed by the equation 1 [8, 9]:
Z=R + 1 1
Y1
o7 (i cor" + R, Y„x (icor"' Rox
Where Ydi ndi and Yox , nox are constants representing the element Qdi and Q.„respectively.
After 24 hours a porous scale formed an the metal surface may be considered tobe permeable to the molten chlorides, and thus may influence the diffusion direction ofoxidants. The Nyquist plot is composed of a semicircle at high frequency and a line atlow frequency representing a diffusion-controlled reaction Warburg impedance. Thediffusion-controlled reaction of alloy 617 in deep molten salt can be described by theequivalent circuit of Fig. 3. [8, 10]In Fig. 3, Rs represents the molten salt resistance, Rt the electrochemical transferresistance, Cdl the double layer capacitance at the alloy-melt interface and W theWarburg resistance.The impedance can be expressed by the following equation [11]:
Z=R + 11
Ydi cor' + R, +W
(1)
(2)
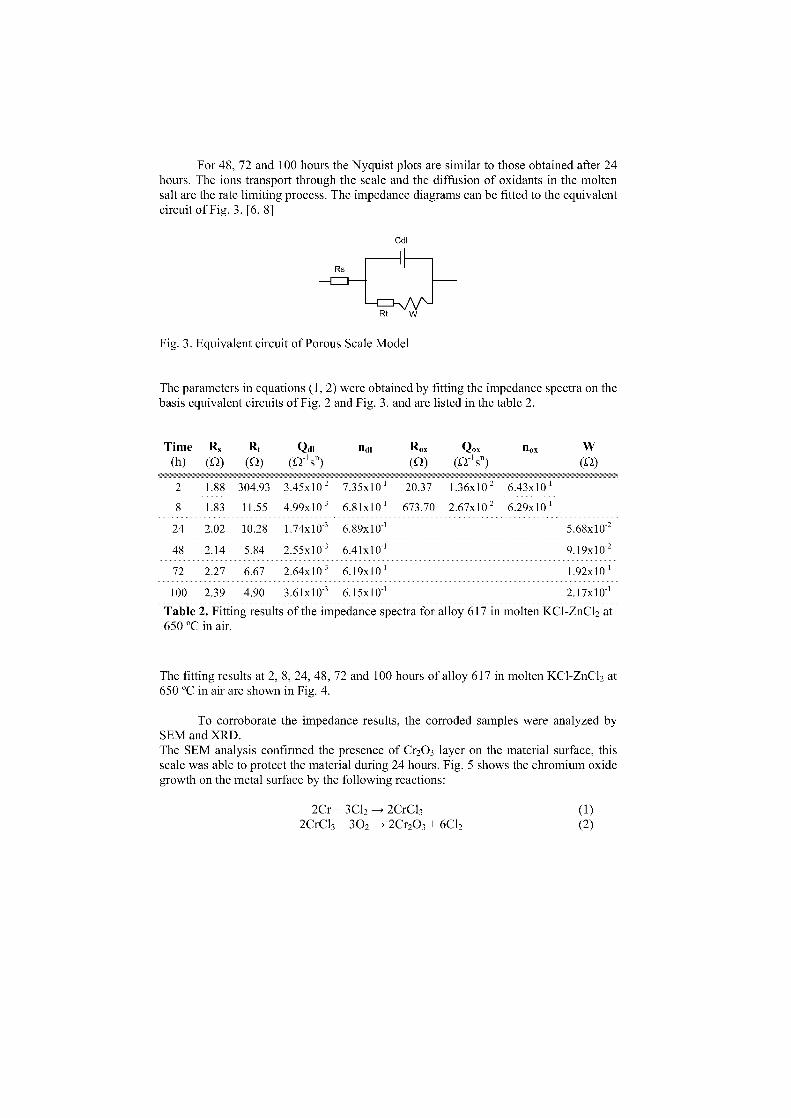
For 48, 72 and 100 hours the Nyquist plots are similar to those obtained after 24hours. The ions transport through the scale and the diffusion of oxidants in the moltenSalt are the rate limiting process. The impedance diagrams can be fitted to the equivalentcircuit of Fig. 3. [6, 8]
Cdl
Rs-I I-
\/\/\-Rt W
Fig. 3. Equivalent circuit of Porous Scale Model
The parameters in equations (1, 2) were obtained by fitting the impedance spectra on thebasis equivalent circuits of Fig. 2 and Fig. 3. and are listed in the table 2.
Time R,
(h) (Q)Rt
(-2)
Qui(f-21sn)
Rox())
Q..sn)
nox w(2)
2
8
24
48
72
100
1.88
1.83
2.02
2.14
2.27
2.39
304.93
11.55
10.28
5.84
6.67
4.90
3.45x10 2
4.99x10³
1.74x10 3
2.55x10³
2.64x10³
3.61x10³
7.35x10
6.81x10⁻¹
6.89x10
6.41x10⁻¹
6.19x101
6.15x10⁻¹
20.37
673.70
1.36x10 2
2.67x10 2
6.43x10
6.29x10⁻¹
5.68x10²
9.19x10²
1.92x10⁻¹
2.17x10⁻¹
Table 2. Fitting results of the impedance spectra for alloy 617 in molten KC1-ZnC1 2 at650 °C in air.
The fitting results at 2, 8, 24, 48, 72 and 100 hours of alloy 617 in molten KC1-ZnC1 2 at650 °C in air are shown in Fig. 4.
To corroborate the impedance results, the corroded Samples were analyzed bySEM and XRD.The SEM analysis confirmed the presence of Cr203 layer on the material surface, thisscale was able to protect the material during 24 hours. Fig. 5 shows the chromium oxidegrowth on the metal surface by the following reactions:
2Cr + 3C12 -> 2CrC132CrC1 3 + 302 -> 2Cr2O3 + 6C12
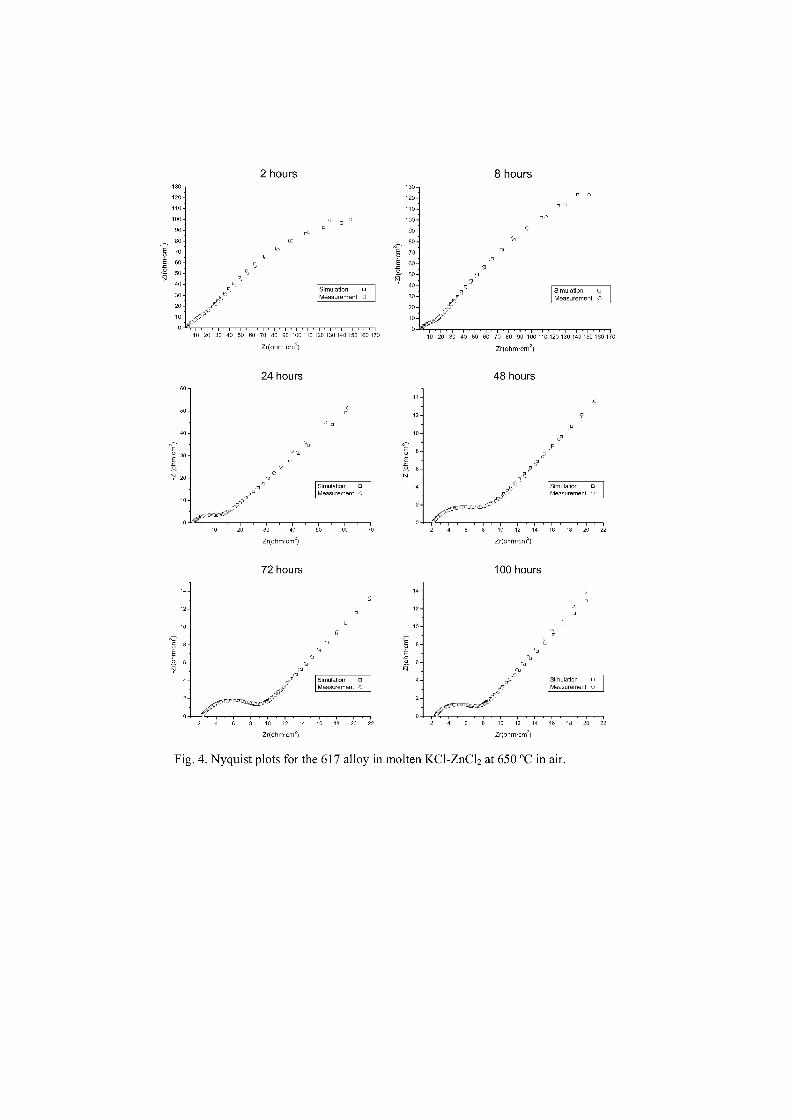
13012011010090
E 6050
N40302010
2 hours130 -120 -110-100 -90 -80-70-
E 60:5̀- soN
40-30 -20-10-
0
flv
e
8 hours
SimulationMeasurement
q Simulation qMeasurement o
0
60
50 -
40
E30-
E 30-
20-
10-
10 20 30 40 50 60 70 80 90 100 110
Zr(ohm•cm2)
24 hours
120 130 140 150 160 170
14
12
10
EE
52, 6
4
2
0
10 20 30 40 50 60 70 80 90 100 110
Zr(ohm.cm')
48 hours
120 30 140 150 160170
Simulation qMeasurement
Simulation qMeasurement
14-
12-
10-
8 -Ef,
2 -
30 40
Zr(ohm•cm2)
72 hours
2
70
§E
14
12
10
6
4
2
2 8 10 12 14
Zr(ohm•cm)
100 hours
:2
16 18 20 22
Simulation qMeasurement
Simulation oMeasurement .
8 10 12 14 16 18 20 22
Zr(ohm•cm)
8 10 12 14 16 18 20 22
Zr(ohm•om2)
Fig. 4. Nyquist plots for the 617 alloy in molten KC1-ZnC1 2 at 650 °C in air.
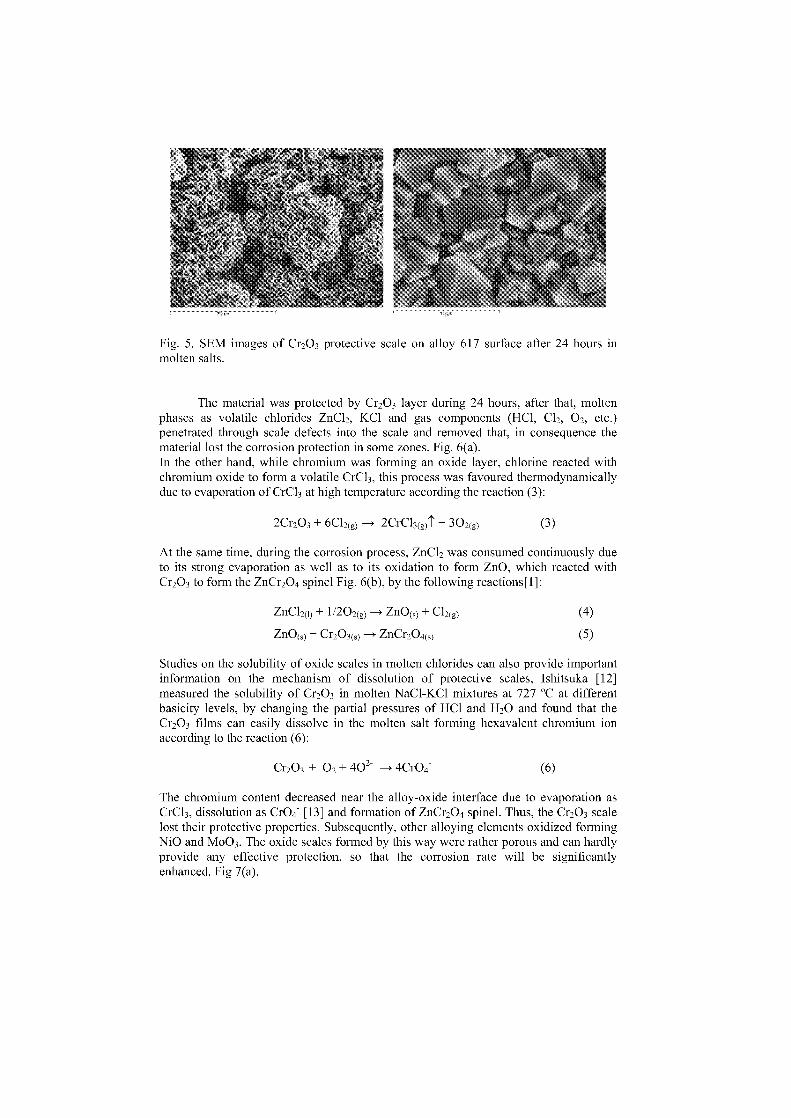
Fig. 5. SEM images of Cr 203 protective scale on alloy 617 surface after 24 hours inmolten salts.
The material was protected by Cr203 layer during 24 hours, after that, moltenphases as volatile chlorides ZnC12 , KC1 and gas components (HC1, C12, 02 , etc.)penetrated through scale defects into the scale and removed that, in consequence thematerial lost the corrosion protection in some zones. Fig. 6(a).In the other hand, while chromium was forming an oxide layer, chlorine reacted withchromium oxide to form a volatile CrC1 3 , this process was favoured thermodynamicallydue to evaporation of CrC1 3 at high temperature according the reaction (3):
2Cr203 + 6C12(g) —> 2CrC13(g)i + 302(g)
(3)
At the same time, during the corrosion process, ZnC1 2 was consumed continuously dueto its strong evaporation as well as to its oxidation to form ZnO, which reacted withCr203 to form the ZnCr2O4 spinel Fig. 6(b), by the following reactions[1]:
ZnC12(1) + 1/202(g) —> ZnO (S) + C12(g) (4)
ZnO(s) + Cr203( ,) —> ZnCr204(,)
(5)
Studies on the solubility of oxide scales in molten chlorides can also provide importantinformation on the mechanism of dissolution of protective scales, Ishitsuka [12]measured the solubility of Cr203 in molten NaC1-KC1 mixtures at 727 °C at differentbasicity levels, by changing the partial pressures of HC1 and H20 and found that theCr203 films can easily dissolve in the molten Salt forming hexavalent chromium ionaccording to the reaction (6):
Cr203 + 02 + 402- —> 4Cr04
(6)
The chromium content decreased near the alloy-oxide interface due to evaporation asCrC13 , dissolution as Cr04 [13] and formation of ZnCr 204 spinel. Thus, the Cr203 scalelost their protective properties. Subsequently, other alloying elements oxidized formingNiO and Mo0 3 . The oxide scales formed by this way were rather porous and can hardlyprovide any effective protection, so that the corrosion rate will be significantlyenhanced. Fig 7(a).
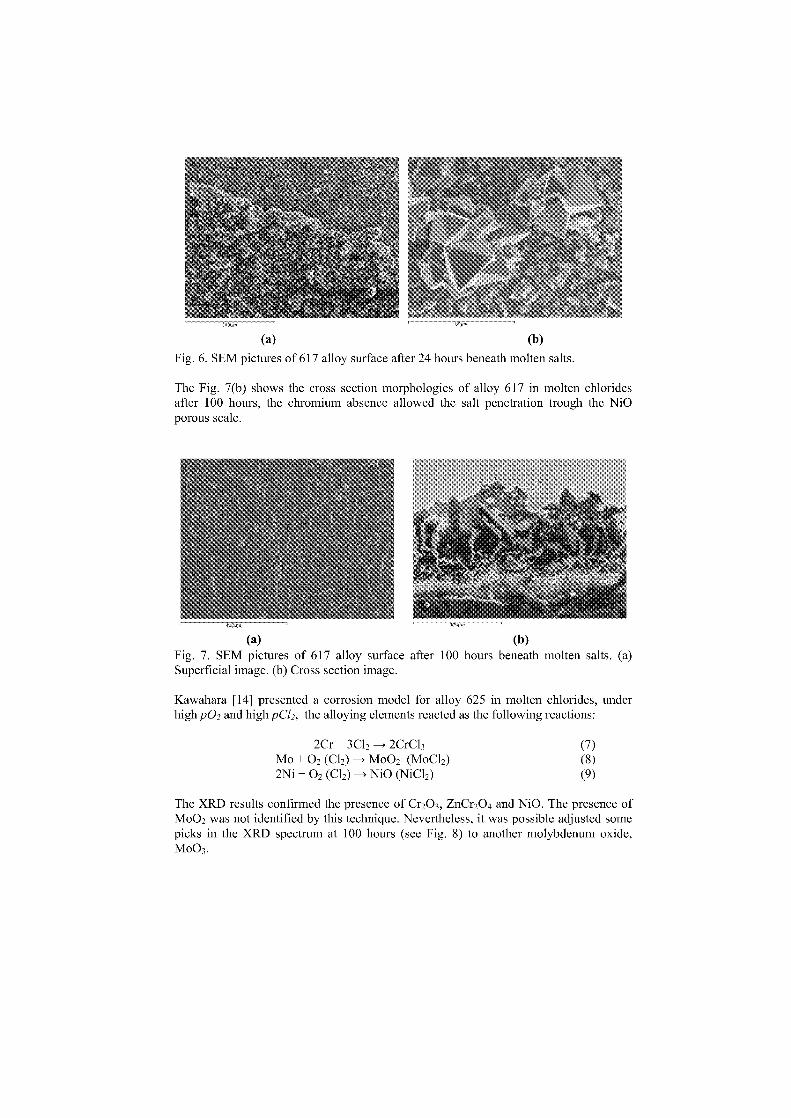
(a)
(b)
Fig. 6. SEM pictures of 617 alloy surface after 24 hours beneath molten salts.
The Fig. 7(b) shows the cross section morphologies of alloy 617 in molten chloridesafter 100 hours, the chromium absence allowed the salt penetration trough the NiOporous scale.
(a) (b)Fig. 7. SEM pictures of 617 alloy surface after 100 hours beneath molten salts. (a)Superficial image. (b) Cross section image.
Kawahara [14] presented a corrosion model for alloy 625 in molten chlorides, underhigh p02 and high pC12, the alloying elements reacted as the following reactions:
2Cr + 3C12 —> 2CrC13 (7)Mo + 02 (C12) —> Mo02 (MoC12)
(8)
2Ni + 02 (C12) —> NiO (NiC12)
(9)
The XRD results confirmed the presence of Cr 203 , ZnCr2O4 and NiO. The presence ofMo02 was not identified by this technique. Nevertheless, it was possible adjusted somepicks in the XRD spectrum at 100 hours (see Fig. 8) to another molybdenum oxide,Mo03.
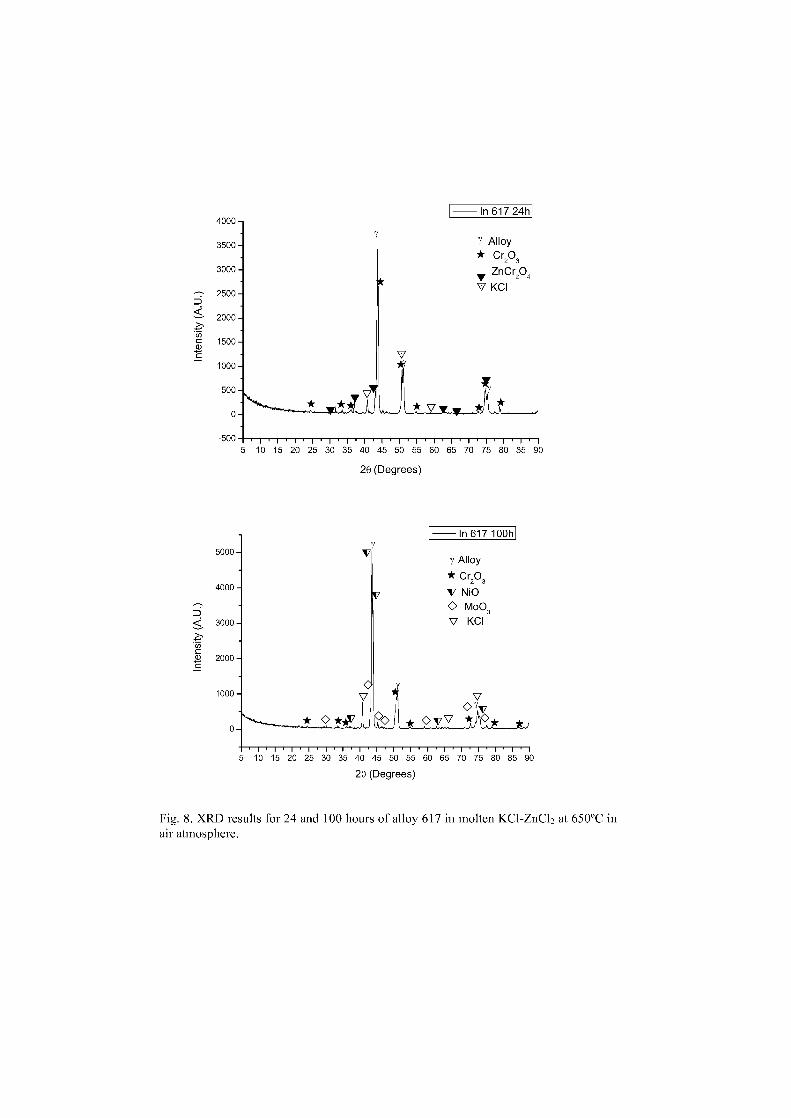
5000-
4000-
3000-
2000-
1000-
0-
v
V
In 617 24h4000-
3500- 7 Alley
* Cr2033000- v ZnCr204
V KCI2500-
500 . 1 .1 .1 .1 .1 .1 .1 .1 .1 .1 .1 .1 .1 .1 .1 . 1. 15 10 15 20 25 30 35 40 45 50 55 60 65 70 75 80 85 90
20 (Degrees)
In 617 100h
y Alley
* Cr203
V MO
0 Mo03
7 KCI
vlv
9 ...i Oyn9jr ep)5 10 15 20 25 30 35 40 45 50 55 60 65 70 75 80 85 90
20 (Degrees)
Fig. 8. XRD results for 24 and 100 hours of alloy 617 in molten KC1-ZnC1 2 at 650°C inair atmosphere.
4 Conclusions:
The corrosion behaviour of Ni-bare alloy 617 in presence of molten chlorideshas been monitored by electrochemical impedance spectroscopy.This alloy formed a protective oxide scale which became porous after a certain period oftime leading to the oxidation and chlorination of alloying elements such Cr, Ni and Mo.In spite of the high chromium content of the alloy 617, it was not an efficiencyprotection to the corrosion of molten chlorides, due to evaporation and dissolution of Cras CrC13 and Cr04. Neither the oxides scales formed by Ni and Mo were enough toprotect the alloy in this severity corrosion environment.
The EIS profiles were fitted to a protective scale model before 24 hours and to a porousscale model after that. The monitoring system allowed following the corrosionmechanism in real time.
5. References
1. Li, Y.S., Y. Niu, and W.T. Wu, Accelerated corrosion of pure Fe, Ni, Cr andseveral Fe-based alloys induced by ZnC12-KC1 at 450 degrees C in oxidizingenvironment. Materials Science and Engineering a-Structural MaterialsProperties Microstructure and Processing, 2003. 345(1-2): p. 64-71.
2. Spiegel, M., G. Schroer, and H.J. Grabke, Corrosion of high alloy steels and Fe-Cr-alloys beneath deposits from waste incinerator plants, in High TemperatureCorrosion and Protection of Materials 4, Pts 1 and 2. 1997. p. 527-534.
3. Spiegel, M., Corrosion mechanisms and failure cases in waste incinerationplants, in High Temperature Corrosion and Protection of Materials 5, Pts 1 and2. 2001. p. 971-978.
4. Spiegel, M., Salt melt induced corrosion of metallic materials in wasteincineration plants. Materials and Corrosion-Werkstoffe Und Korrosion, 1999.50(7): p. 373-393.
5. Li, Y.S. and M. Spiegel, Models describing the degradation of FeAl and NiAlalloys induced by ZnC12-KC1 melt at 400-450 degrees C. Corrosion Science,2004. 46(8): p. 2009-2023.
6. Zeng, C.L. and J. Li, Electrochemical impedance studies of molten(0.9Na,0.1K)(2)SO4-induced hot corrosion of the Ni-based superalloy M38G at900 degrees C in air. Electrochimica Acta, 2005. 50(28): p. 5533-5538.
7. Macdonald, J.R., Impedance Spectroscopy and Its Use in Analyzing the Steady-State Ac Response of Solid and Liquid Electrolytes. Journal of ElectroanalyticalChemistry, 1987. 223(1-2): p. 25-50.
8. Zeng, C.L., W. Wang, and W.T. Wu, Electrochemical impedance models förmolten salt corrosion. Corrosion Science, 2001. 43(4): p. 787-801.
9. Mansfeld, F., H. Xiao, and Y. Wang, Evaluation of Localized CorrosionPhenomena with Electrochemical Impedance Spectroscopy (Eis) andElectrochemical Noise-Analysis (Ena). Werkstoffe Und Korrosion-Materials andCorrosion, 1995. 46(1): p. 3-12.
10. Mansfeld, F., et al., Evaluation of corrosion protection by polymer coatingsusing electrochemical impedance spectroscopy and noise analysis.Electrochimica Acta, 1998. 43(19-20): p. 2933-2945.

11. Mansfeld, F., Electrochemical Impedance Spectroscopy (Eis) as a New Tool forInvestigating Methods of Corrosion Protection. Electrochimica Acta, 1990.35(10): p. 1533-1544.
12. Ishitsuka, T. and K. Nose, Stability of protective oxide films in wasteincineration environment - solubility measurement of oxides in molten chlorides.Corrosion Science, 2002. 44(2): p. 247-263.
13. Rapp, R.A., Hot corrosion of materials: a fluxing mechanism? CorrosionScience, 2002. 44(2): p. 209-221.
14. Kawahara, Y., High temperature corrosion mechanisms and effect of alloyingelements for materials used in waste incineration environment. CorrosionScience, 2002. 44(2): p. 223-245.
METAL WASTAGE IN LOW ALLOY STEELS UNDERALTERNATING ATMOSPHERES AT ELEVATED TEMPERATURE
S Osgerby and D D Gohil
National Physical Laboratory, Teddington, Middlesex, TW11 OLW, United [email protected]
AbstractT22 and T23 steels have been exposed to two atmospheres, representative of low NOx combustion conditions, at540 °C for times up to 4000 h. One atmosphere corresponded to `base' conditions whilst the other represented a`high sulphur' environment. Exposures have been carried out in each atmosphere singly and alternating betweenatmospheres every 250 or 500 h. Significant differences were found in rates of mass change and in scalemicrostructure between the different exposure sequences in both alloys. Several effects of fluctuatingatmosphere have been identified; the occurrence of each in a particular specimen having a degree of stochasticbehaviour. The detailed mechanism may be due to transient behaviour in the early stages of exposure todifferent atmospheres but further investigation is required to fully understand this behaviour.
Keywords: Low alloy steels, corrosion, alternating atmospheres
Introduction
Laboratory exposures are traditionally carried out under conditions that are kept as constant aspossible. However industrial plant is operated under conditions where both the thermal andservice atmosphere conditions vary with time. Cyclic oxidation testing is well established butthe influence of changing the atmosphere during laboratory testing has so far been neglected.
Previous work on metal wastage of low alloy steels in atmospheres that simulate low NOxcombustion environments [1] demonstrated that the addition of Small amounts of activespecies in the test environment has a significant effect both on metal wastage rates and onscale composition and microstructure. The current work studies the material response tosystematically alternating the gaseous atmosphere.
Experimental
An experimental matrix was set up to expose two low alloy steels, T22 and T23, to twoatmospheres at 540 °C. The materials were alternated between the two atmospheres atdifferent intervals. The composition of the steels, the atmospheres and the test schedule aregiven in Tables I, II and II respectively. Specimens were removed for mass changedetermination every 250 h.
Table I Com osition of the test steels, wt%Alloy Fe C Si S P Mn Cr Mo V N Nb W B
ppmAl
T22 Bal 0.10 0.5 0.025 0.025 0.6 2.25 0.54T23 Bal 0.07 0.5 0.01 0.03 0.35 20.5 0.17 0.25 0.03 0.05 1.6 6 0.03
Table II Composition of the test atmospheresDescription Com-position, vol%
02 CO CO2 H2 H2 S HC1 H20 COS N2Base 1.0 3.98 0.97 1.39 0.03 0.01 3.0 - Bal
High COS 1.0 3.98 0.97 1.39 0.05 0.01 3.0 0.04 Bal
Table III Testine MatrixRun No. Sequence of Atmospheres Time between changes
1 Base Continuous2 High COS Continuous2 Base High COS-Base-High COS 250 h
Base Hi h COSBase÷fli h COS 5 CHD h
5 High COSBaseHigh COSBase 250 h6 High COS-Base-High COS-Base 500 h
Specimens were withdrawn from the exposure schedule at 1000, 2000, 3000 and 4000 h formetallographic investigation. These specimens were sectioned, mechanically polished andexamined in the SEM using both energy-dispersive and wavelength-dispersive X-ray analysis.`Digimaps' showing the elemental distribution were generated.
One specimen of T22 has been exposed in a continuous microbalance using sequence 2 inorder to study the detailed kinetics associated with changing between atmospheres.
Results and Discussion
Mass change data as a function of time and exposure sequence are shown in Figure 1 for T22.Each graph contains data from 4 nominally identical specimens. Figures la and lb show thatfor exposures to continuous atmospheres the mass change data are similar for the first 1500 hof exposure after which exposure to the High COS atmosphere leads to accelerated mass gainthrough the growth of a non-protective scale. The measured parabolic rate constant during theinitial period is lower under the High COS atmosphere - however the difference is notsignificant, being –17%.
When the specimens are switched between atmospheres (Figures lc-lf) again little differenceis seen until the exposures exceed 1500 h. After this period the variation in behaviourbetween specimens experiencing nominally identical exposure histories apparently increaseswith the range of mass change measured increasing significantly in most cases.
T23 shown more erratic behaviour with the variation in behaviour between Samples that haveexperienced similar exposure histories starting earlier (after about 750 h exposure) and evenin the case of exposure to the same atmosphere. In this case the difference betweenspecimens is attributed to spallation of the corrosion product from some specimens and is aconsequence of the higher creep strength of T23 compared to T22.
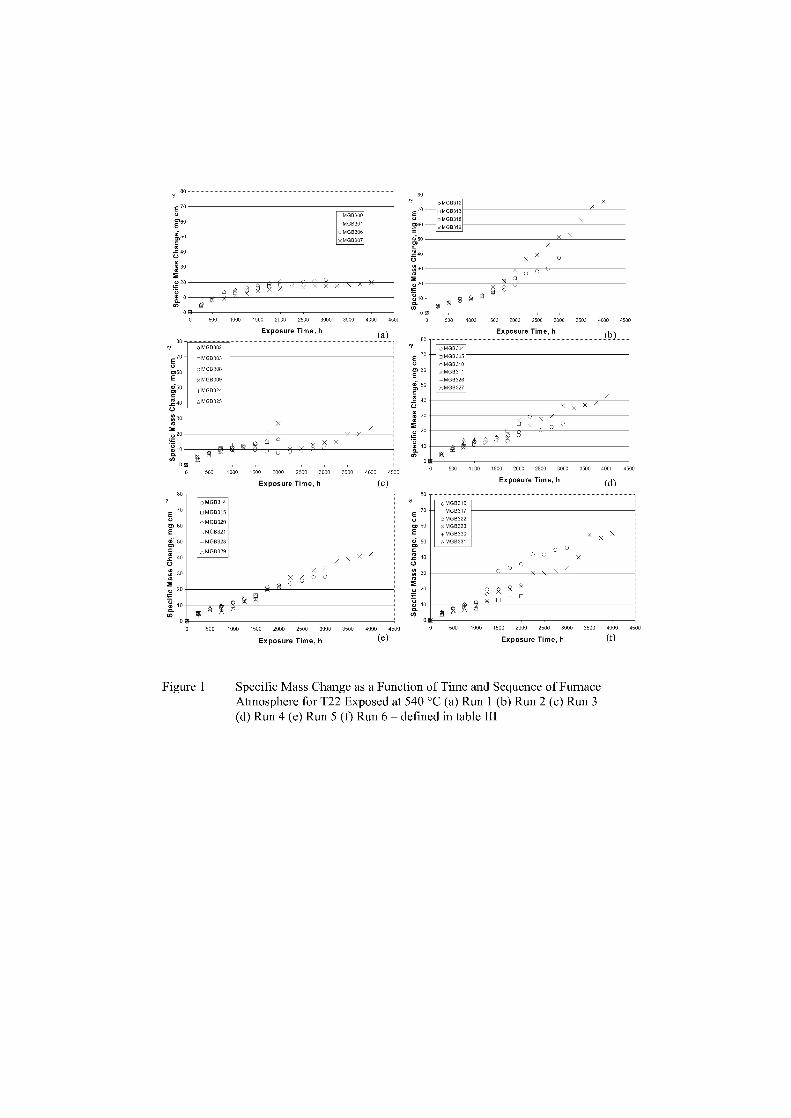
(c)80 --
MG13314u MGB315
X X0 0
000 500 1000 1500 2C00 2500 3000 3500 4000 4500
Exposure Time, h (e)
E 70
g,MGB32060
EE xmcs321a■ 50 +MGB328
MGB329.0 40
e 303
20
&BLQ)
80
E70 nMGB313onAGB312
O 08.8318 X
re — 01066319
t;„
2.
3
oMGB300n 666301o 666306xMGB307
O 0
e 30
U20 0! e0 e '66 X X • ,, 20
8la y10- g 2 e
co 2 0 b
0 500 1000 1500 2000 200 6000 3500 4000 45000
0 500 1000 1500 2000 2500 3000 3500 4000 4500Exposure Time, h Exposure Time, h
80(a) 80 (b)
6 oMGB30270
oMGB304—,
0nMGB303 E 3 MGB305
0 M663100,60 0 MGB308 2!' . — x 6, 6.:1
xMGB3094 S0
+M6B324 la .,1868,327
AMGB325=2 40g
40u, 30
C..)E 303 h
C,., 20
A 1i, 10.) ,,
ä g
4500 0 500 1000 1500 2000 2500 3000 3500 4000 4500
80
g,50
.0 40
E 30
Figure 1 Specific Mass Change as a Function of Time and Sequence of FurnaceAtmosphere for T22 Exposed at 540 °C (a) Run 1 (b) Run 2 (c) Run 3(d) Run 4 (e) Run 5 (f) Run 6 — defined in fable III
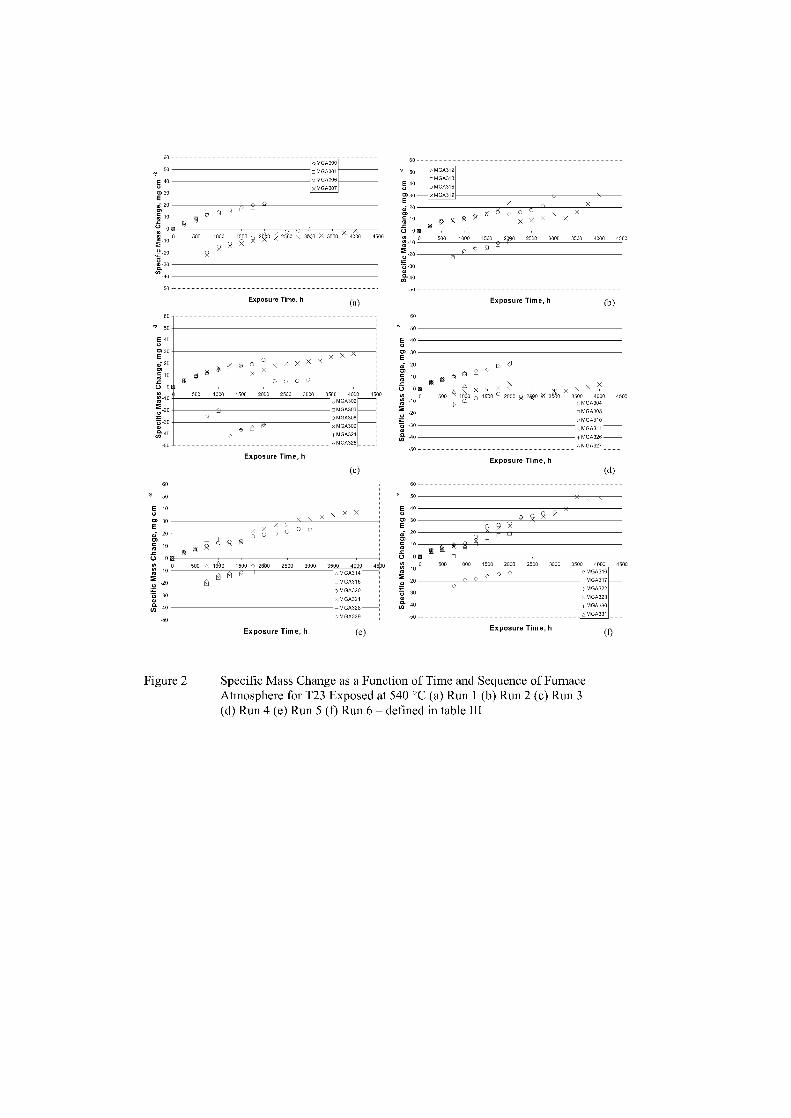
6050
E 40+99 30E
0 MG4300o 604301
MGA306X MG4307
60
50
E 40
E01 30E4jII)z 10
0
e20
° 0 0 g3
1 r 92 e. 5 3050 X 35 X 40,500 1000 4500° E 10
o
500 1000 1500 2090 2500 3000 3500 4000 450
A g2
O MGA312MGA313MGA318
x MGA319
(a)
0
60
so
E 40
01 30E
206
°m0
‘‘i 103 -20
9ä 30043- -40
-50
50 -50 -Exposure Time, h (b)
0 4A X'
e ,
500 1000 0 DO 2000 05 200 05 3ec0 3500 4000 4oMG4304 nMGA3059 MGA310xMG4311*MG4326A MGA327
60
so
Exposure Time, h
)
0
E
rn
0 0
50
E 40CD 30
2 0
sc0
- 1 0
Exposure Time, h(d)
E 40X 901 30
E4i -
g
x00
0
n
0 0 °.
500 1000 1500 2000 2500 3000 3500 4000 4590.0 MG431611MGA317 0 MGA322X MGA3231 MGA330 4 MGA331
lyq
0 050 A 500 0 2 0 2500 3000 3500 4000 45b0
-10
-20
's -30
rGr o MG4314nMG4315
M GA320MG4321
-M GA328A M GA329
-40
-50
Exposure Time, h (e) Exposure Time, h (f)
Figure 2 Specific Mass Change as a Function of Time and Sequence of FurnaceAtmosphere for T23 Exposed at 540 °C (a) Run 1 (b) Run 2 (c) Run 3(d) Run 4 (e) Run 5 (f) Run 6 – defined in fable III
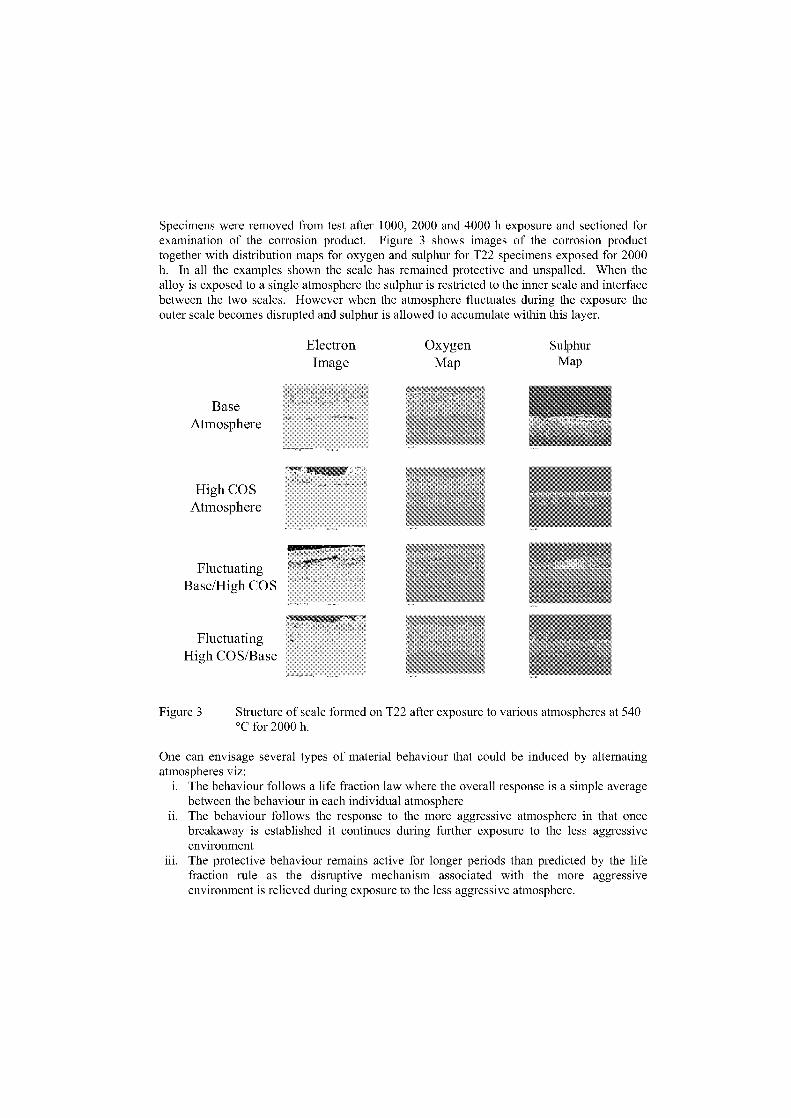
Specimens were removed from test after 1000, 2000 and 4000 h exposure and sectioned forexamination of the corrosion product. Figure 3 shows images of the corrosion producttogether with distribution maps for oxygen and sulphur for T22 specimens exposed for 2000h. In all the examples shown the scale has remained protective and unspalled. When thealloy is exposed to a single atmosphere the sulphur is restricted to the inner scale and interfacebetween the two scales. However when the atmosphere fluctuates during the exposure theouter scale becomes disrupted and sulphur is allowed to accumulate within this layer.
Electron Oxygen Sulphur
Image Map Map
BaseAtmosphere
High COSAtmosphere
FluctuatingBase/High COS
FluctuatingHigh COS/Base
Figure 3 Structure of scale formed an T22 after exposure to various atmospheres at 540°C for 2000 h.
One can envisage several typen of material behaviour that could be induced by alternatingatmospheres viz:
i. The behaviour follows a life fraction law where the overall response is a simple averagebetween the behaviour in each individual atmosphere
ii. The behaviour follows the response to the more aggressive atmosphere in that oncebreakaway is established it continues during further exposure to the less aggressiveenvironment
iii. The protective behaviour remains active for Tonger periods than predicted by the lifefraction rule as the disruptive mechanism associated with the more aggressiveenvironment is relieved during exposure to the less aggressive atmosphere.
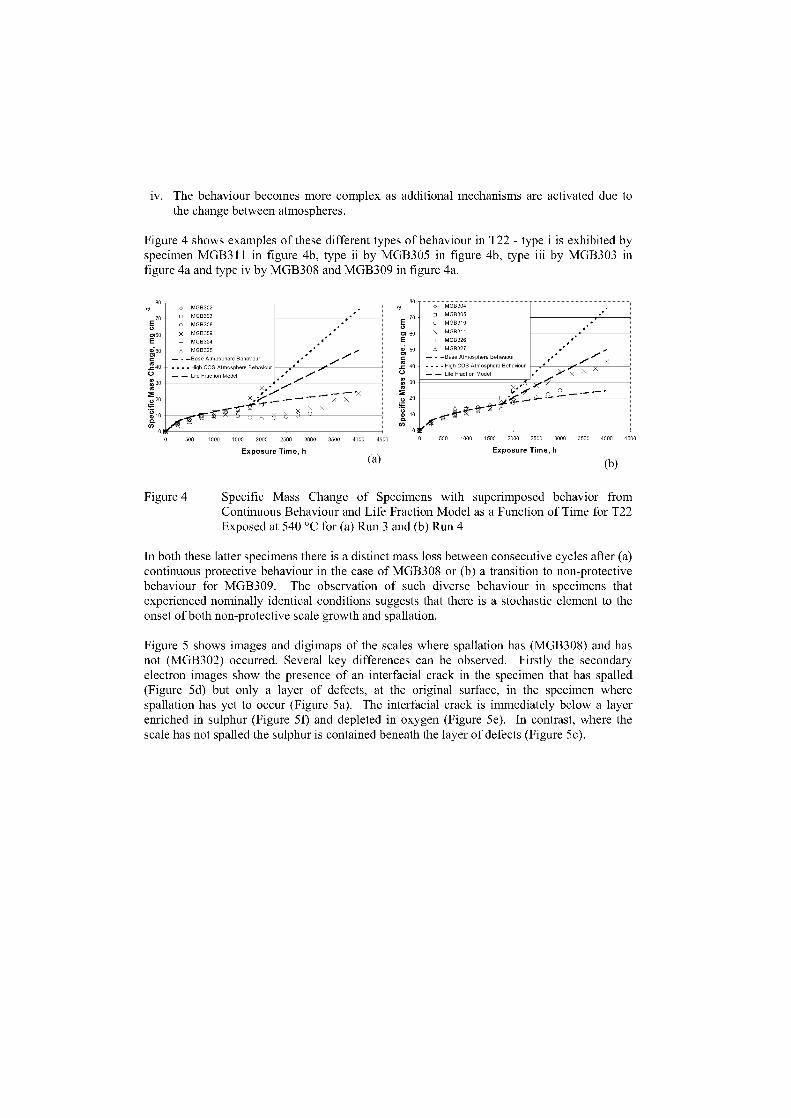
80 -o MGB302• MGB303o MGB308
X MGB309
▪ MGB324A MGB325
— —Base Atmosphere Behavour
• • - - High COS Atmosphere BehaMur— — Life Fraction Model
o MGB304• MGB305• MGB310x MGB311
MGB326A MGB327
— - —Base Atmosphere BehaNiour- High COS Atmosphere Behaviour
— — Life Fraction Model
80
2 400
30
En060E050cr,
500 1C00 1560 2000 2500 3000 3500 4000 4500
Exposure Time, h(a) Exposure Time, h
(b)
0 20
2,10
0
iv. The behaviour becomes more complex as additional mechanisms are activated due tothe change between atmospheres.
Figure 4 shows examples of these different types of behaviour in T22 - type i is exhibited byspecimen MGB311 in figure 4b, type ii by MGB305 in figure 4b, type iii by MGB303 infigure 4a and type iv by MGB308 and MGB309 in figure 4a.
Figure 4 Specific Mass Change of Specimens with superimposed behavior fromContinuous Behaviour and Life Fraction Model as a Function of Time for T22Exposed at 540 °C for (a) Run 3 and (b) Run 4
In both these latter specimens there is a distinct mass loss between consecutive cycles alter (a)continuous protective behaviour in the Gase of MGB308 or (b) a transition to non-protectivebehaviour for MGB309. The observation of such diverse behaviour in specimens thatexperienced nominally identical conditions suggests that there is a stochastic element to theonset of both non-protective scale growth and spallation.
Figure 5 shows images and digimaps of the scales where spallation has (MGB308) and hasnot (MGB302) occurred. Several key differences can be observed. Firstly the secondaryelectron images Show the presence of an interfacial crack in the specimen that has spalled(Figure 5d) but only a layer of defects, at the original surface, in the specimen wherespallation has yet to occur (Figure 5a). The interfacial crack is immediately below a layerenriched in sulphur (Figure 50 and depleted in oxygen (Figure 5e). In contrast, where thescale has not spalled the sulphur is contained beneath the layer of defects (Figure 5c).
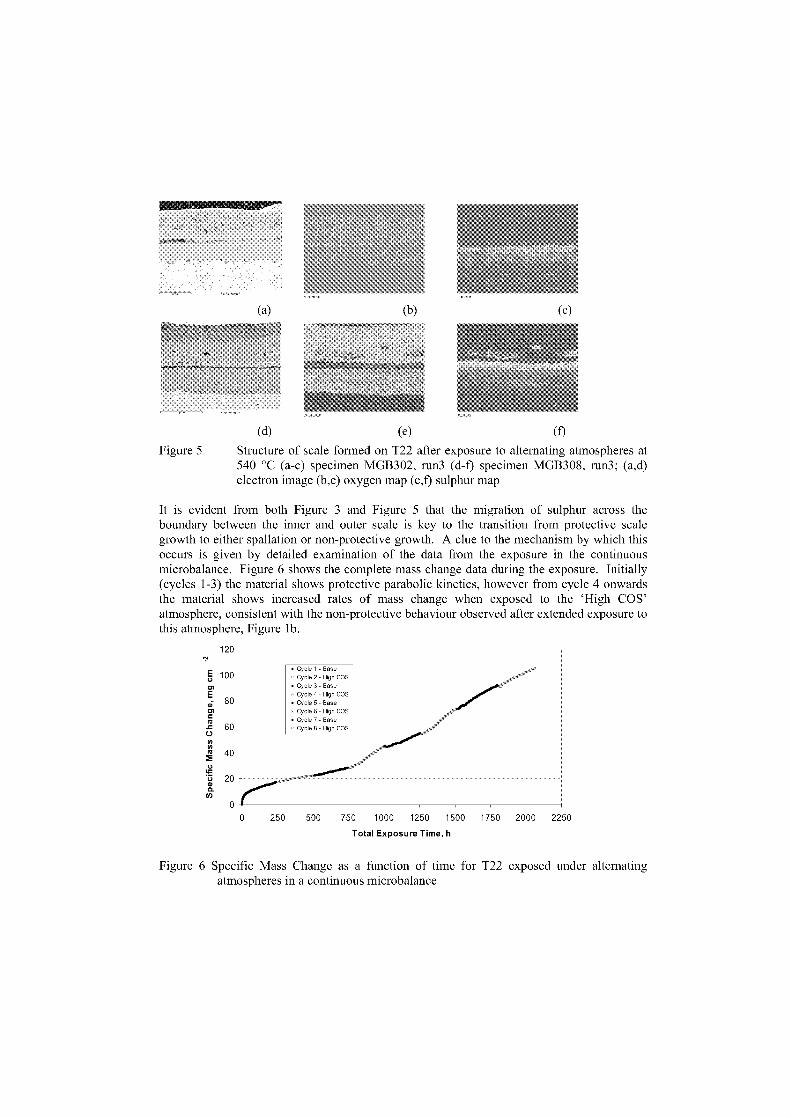
120
• Cycle 15 100 Cycle 2
ia • Cycle 3
Cycle 480 • Cycle 5
cn Cycle 6
• Cycle 7
60 Cycle 80
40
20Q3
0
- Base
- High COS
- Base
- High COS
- Base
- High COS
- Base
- High COS
(d)
(e) (f)
Figure 5 Structure of scale formed an T22 after exposure to alternating atmospheres at540 °C (a-c) specimen MGB302, run3 (d-f) specimen MGB308, run3; (a,d)electron image (b,e) oxygen map (c,f) sulphur map
It is evident from both Figure 3 and Figure 5 that the migration of sulphur across theboundary between the inner and outer scale is key to the transition from protective scalegrowth to either spallation or non-protective growth. A clue to the mechanism by which thisoccurs is given by detailed examination of the data from the exposure in the continuousmicrobalance. Figure 6 shows the complete mass change data during the exposure. Initially(cycles 1-3) the material shows protective parabolic kinetics, however from cycle 4 onwardsthe material shows increased raten of mass change when exposed to the 'High COS'atmosphere, consistent with the non-protective behaviour observed after extended exposure tothis atmosphere Figure lb.
0 250 500 750 1000 1250 1500 1750 2000 2250
Total Exposure Time, h
Figure 6 Specific Mass Change as a function of time for T22 exposed under alternatingatmospheres in a continuous microbalance
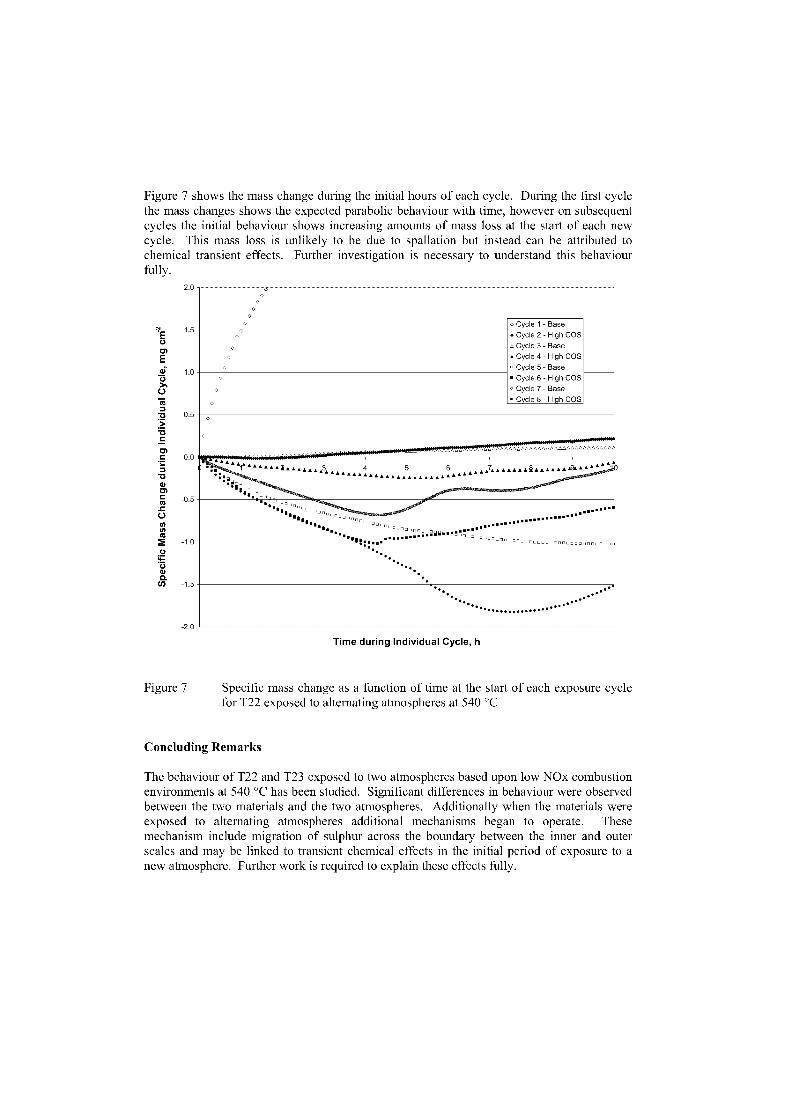
... °@@@@@ ne @@ „
............
......................................
Figure 7 shows the mass change during the initial hours of each cycle. During the first cyclethe mass changes shows the expected parabolic behaviour with time, however an subsequentcycles the initial behaviour shows increasing amounts of mass loss at the start of each newcycle. This mass loss is unlikely to be due to spallation but instead can be attributed tochemical transient effects. Further investigation is necessary to understand this behaviourfully.
2.0
1.5
1.0
0.5
o Cycle 1 - Base
• Cycle 2 - High COS
Cycle 3 - Base
• Cycle 4 - High COS
Cycle 5 - Base
• Cycle 6 - High COS
▪ Cycle 7 - Base
• Cycle 8 - High COS
0.0
AALAAALAAAAACAAAAAAAAA,AAAA4
... .. ...1 ..... Ä ...... ...... ...... 5 ...... 6 .............. .9. ...
0.5
.0
.5
...................... ...••
-2.0 -
Time during Individual Cycle, h
Figure 7 Specific mass change as a function of time at the start of each exposure cyclefor T22 exposed to alternating atmospheres at 540 °C
Concluding Remarks
The behaviour of T22 and T23 exposed to two atmospheres based upon low NOx combustionenvironments at 540 °C has been studied. Significant differences in behaviour were observedbetween the two materials and the two atmospheres. Additionally when the materials wereexposed to alternating atmospheres additional mechanisms began to operate. Thesemechanism include migration of sulphur across the boundary between the inner and outerscales and may be linked to transient chemical effects in the initial period of exposure to anew atmosphere. Further work is required to explain these effects fully.

Acknowledgements
This work was carried out under the COST538 Collaboration an Plant Life Extension.Funding for the work was provided by Materials – Performance, a programme ofunderpinning research commissioned by the United Kingdom Department of Trade andIndustry.
References[1] S Osgerby, A T Fry and D D Gohil, "Metal Wastage in Low Alloy Ferritic Steels
Exposed to Multi-component Gaseous Atmospheres: Data Representation andPredictive Modelling", Materials at High Temperature (in press)

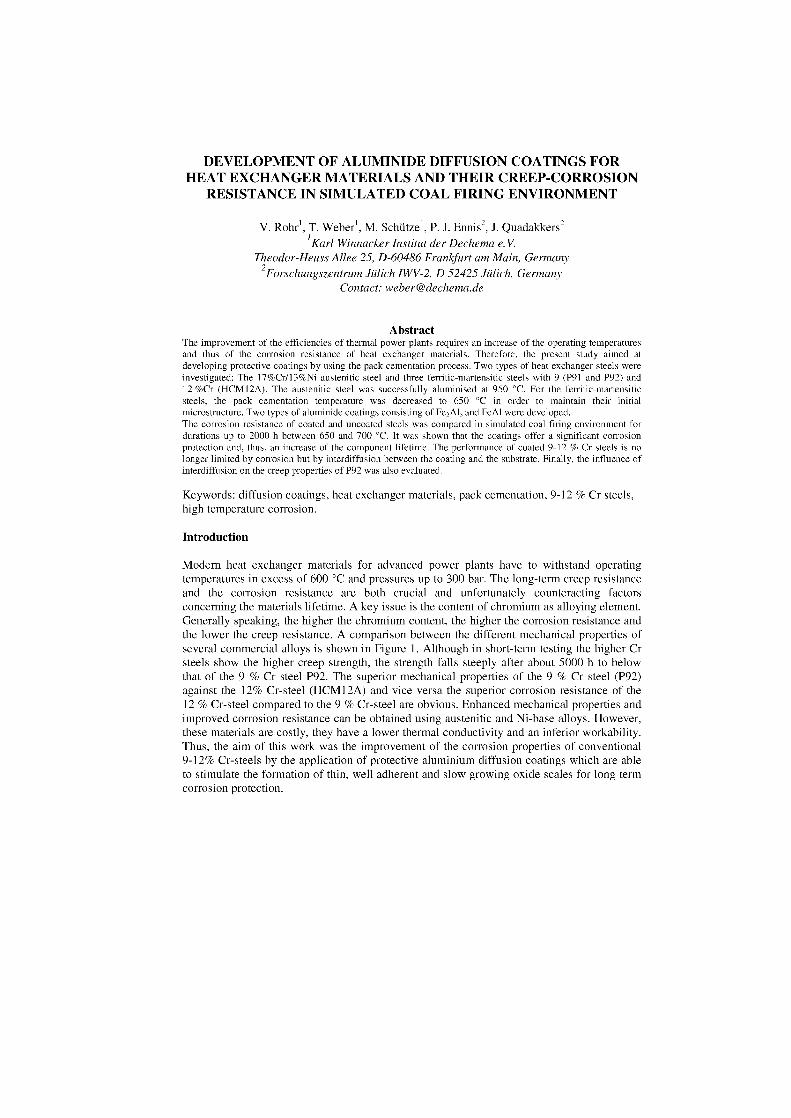
DEVELOPMENT OF ALUMINIDE DIFFUSION COATINGS FORHEAT EXCHANGER MATERIALS AND THEIR CREEP-CORROSION
RESISTANCE IN SIMULATED COAL FIRING ENVIRONMENT
V. Rohr, T. Weber ] , M. Schütze ] , P. J. Ennis 2 , J. Quadakkers 2
Karl Winnacker Institut der Dechema e.V.Theodor-Heuss Allee 25, D-60486 Frankfurt am Main, Germany
2Forschungszentrum Jülich IWV-2, D 52425 Jülich, GermanyContact: [email protected]
AbstractThe improvement of the efficiencies of thermal power plants requires an increase of the operating temperaturesand thus of the corrosion resistance of heat exchanger materials. Therefore, the present study aimed atdeveloping protective coatings by using the pack cementation process. Two types of heat exchanger steels wereinvestigated: The 17%Cr/13%Ni austenitic steel and three ferritic-martensitic steels with 9 (P91 and P92) and12 %Cr (HCM12A). The austenitic steel was successfully aluminised at 950 °C. For the ferritic-martensiticsteels, the pack cementation temperature was decreased to 650 °C in order to maintain their initialmicrostructure. Two types of aluminide coatings consisting of Fe2AI5 and FeAI were developed.The corrosion resistance of coated and uncoated steels was compared in simulated coal firing environment fordurations up to 2000 h between 650 and 700 °C. lt was shown that the coatings offer a significant corrosionprotection and, thus, an increase of the component lifetime. The performance of coated 9-12 % Cr steels is nolonger limited by corrosion but by interdiffusion between the coating and the Substrate. Finally, the influence ofinterdiffusion an the creep properties of P92 was also evaluated.
Keywords: diffusion coatings, heat exchanger materials, pack cementation, 9-12 % Cr steels,high temperature corrosion.
Introduction
Modern heat exchanger materials for advanced power plants have to withstand operatingtemperatures in excess of 600 °C and pressures up to 300 bar. The long-term creep resistanceand the corrosion resistance are both crucial and unfortunately counteracting factorsconcerning the materials lifetime. A key issue is the content of chromium as alloying element.Generally speaking, the higher the chromium content, the higher the corrosion resistance andthe lower the creep resistance. A comparison between the different mechanical properties ofseveral commercial alloys is shown in Figure 1. Although in short-term testing the higher Crsteels Show the higher creep strength, the strength falls steeply after about 5000 h to belowthat of the 9 % Cr steel P92. The superior mechanical properties of the 9 % Cr steel (P92)against the 12% Cr-steel (HCM12A) and vice versa the superior corrosion resistance of the12 % Cr-steel compared to the 9 % Cr-steel are obvious. Enhanced mechanical properties andimproved corrosion resistance can be obtained using austenitic and Ni-base alloys. However,these materials are costly, they have a lower thermal conductivity and an inferior workability.Thus, the aim of this work was the improvement of the corrosion properties of conventional9-12% Cr-steels by the application of protective aluminium diffusion coatings which are ableto stimulate the formation of thin, well adherent and slow growing oxide scales for Jong termcorrosion protection.
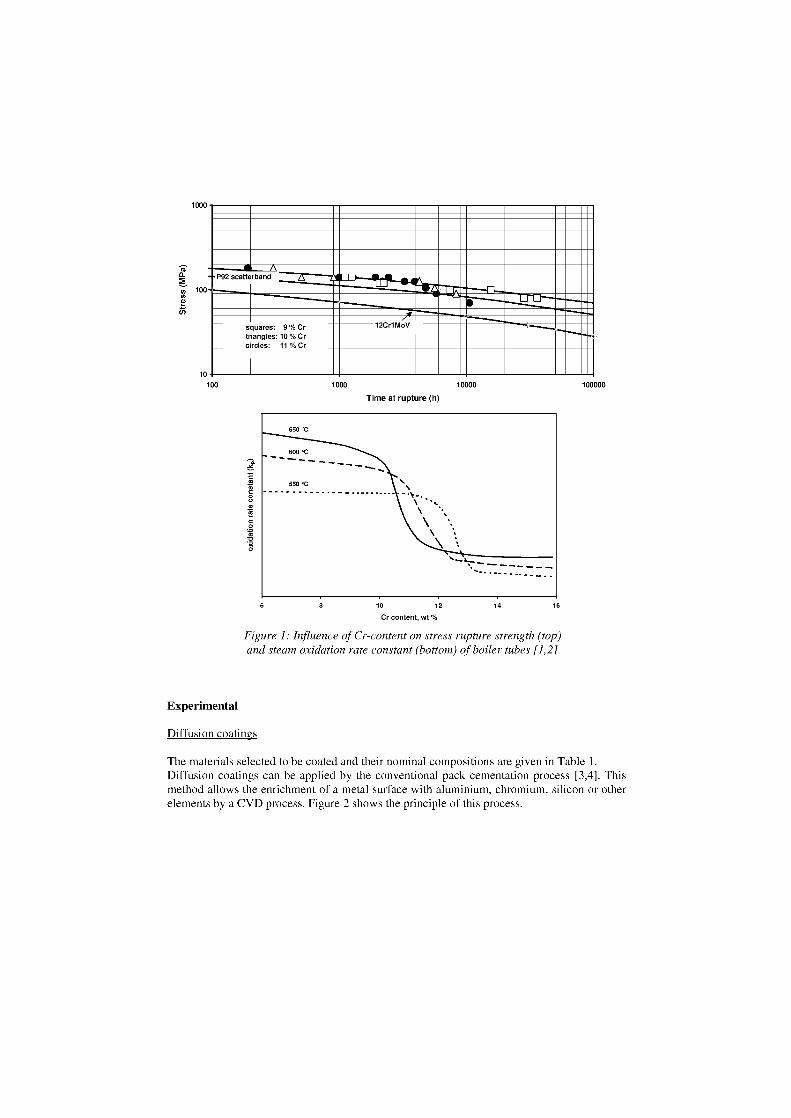
650 °C
600 °C
550 °C
1000
0100
1 0100 1000 1 0000
1 00000
Time at rupture (h)
8
10 12
14 16
Cr content, wt %
Figure 1: Influence of Cr-content an stress rupture strength (top)and steam oxidation rate constant (bottom) of boiler tubes [1,2]
Experimental
Diffusion coatings
The materials selected to be coated and their nominal compositions are given in Table 1.Diffusion coatings can be applied by the conventional pack cementation process [3,4]. Thismethod allows the enrichment of a metal surface with aluminium, chromium, silicon or otherelements by a CVD process. Figure 2 Shows the principle of this process.
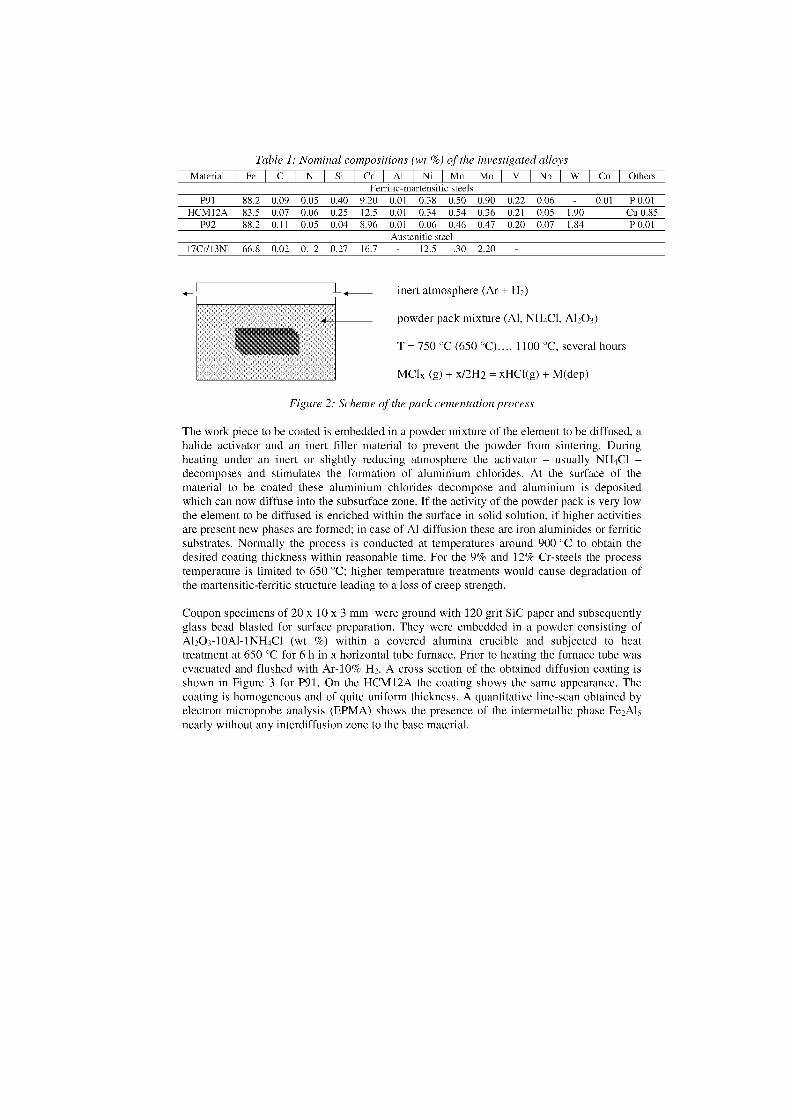
Table 1: Nominal compositions (wt %) of the investigated alloysMaterial 1Fel C N SilCrIA1 INI1MnMol V 1NbIWIColOthers
Ferritic-martensitic steelsP91 88.2 0.09 0.05 0.40 9.20 0.01 0.38 0.50 0.90 0.22 0.06 - 0.01 P 0.01
HCM12A 83.5 0.07 0.06 0.25 12.5 0.01 0.34 0.54 0.36 0.21 0.05 1.90 Cu 0.85P92 88.2 0.11 0.05 0.04 8.96 0.01 0.06 0.46 0.47 0.20 0.07 1.84 P 0.01
Austenitic steel17Cr/13N1 66.8 0.02 0.12 0.27 16.7 12.5 1.30 2.20
inert atmosphere (Ar + H2)
powder pack mixture (Al, NH 4C1, Al203)
T = 750 °C (650 °C).... 1100 °C, several hours
MClx (g) + x/2H2 = xHC1(g) + M(dep)
Figure 2: Scheme of the pack cementation process
The work piece to be coated is embedded in a powder mixture of the element to be diffused, ahalide activator and an inert filler material to prevent the powder from sintering. Duringheating under an inert or slightly reducing atmosphere the activator - usually NH 4C1 -decomposes and stimulates the formation of aluminium chlorides. At the surface of thematerial to be coated these aluminium chlorides decompose and aluminium is depositedwhich can now diffuse into the subsurface zone. If the activity of the powder pack is very lowthe element to be diffused is enriched within the surface in solid solution, if higher activitiesare prevent new phases are formed; in case of Al-diffusion these are fron aluminides or ferriticSubstrates. Normally the process is conducted at temperatures around 900 °C to obtain thedesired coating thickness within reasonable time. For the 9% and 12% Cr-steels the processtemperature is limited to 650 °C; higher temperature treatments would cause degradation ofthe martensitic-ferritic structure leading to a loss of creep strength.
Coupon specimens of 20 x 10 x 3 mm were ground with 120 grit SiC paper and subsequentlyglass bead blasted for surface preparation. They were embedded in a powder consisting ofAl203-10A1-1NH4C1 (wt %) within a covered alumina crucible and subjected to heattreatment at 650 °C for 6 h in a horizontal tube furnace. Prior to heating the furnace tube wasevacuated and flushed with Ar-10% H2. A cross section of the obtained diffusion coating isshown in Figure 3 for P91. On the HCM12A the coating shows the same appearance. Thecoating is homogeneous and of quite uniform thickness. A quantitative line-scan obtained byelectron microprobe analysis (EPMA) shows the presence of the intermetallic phase Fe2A15nearly without any interdiffusion zone to the Base material.
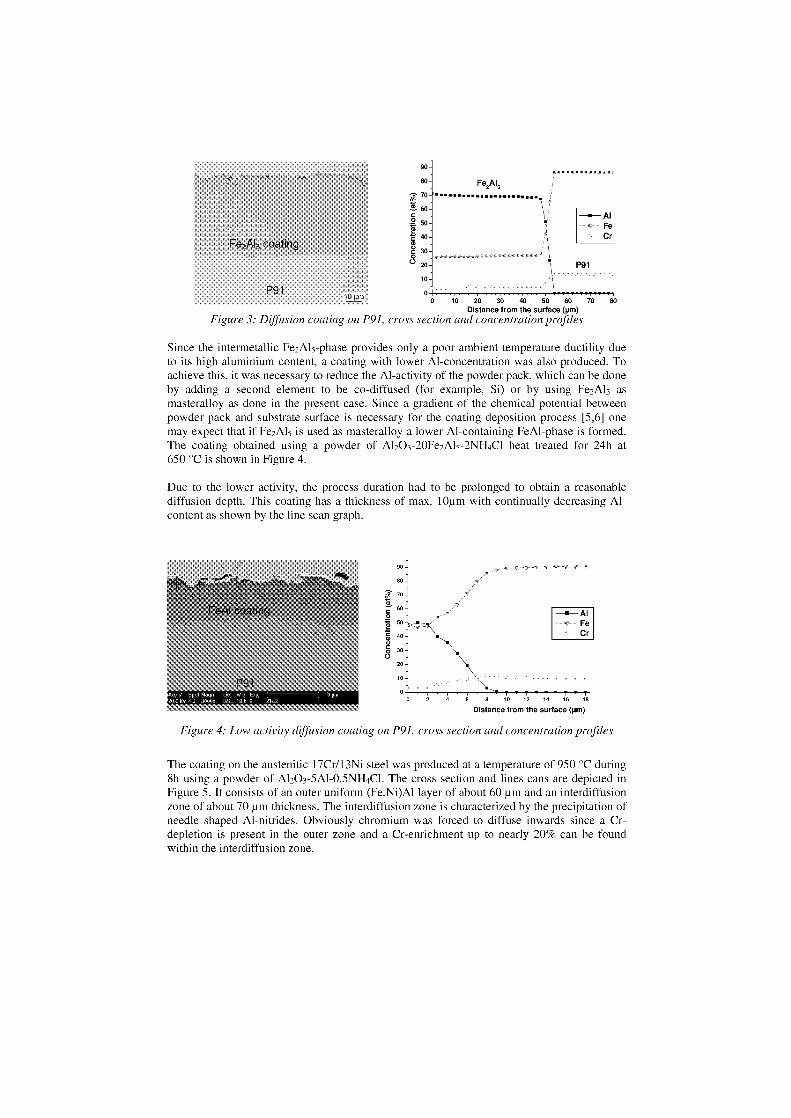
90-
80- Fe2Al6
c s▪ o: -
50-eE 40-1>> 30-o• 20-
10 -
Fe2A1 5 coat lig
AIe Fe
Cr
P91
prA 10 20 30 40 50 60 70 80• " • • " • • • " " • • • ,,,,,
Distance from the surface (um)Figure 3: Diffusion coating on P91, cross section and concentration profiles
Since the intermetallic Fe 2A15-phase provides only a poor ambient temperature ductility dueto its high aluminium content, a coating with lower Al-concentration was also produced. Toachieve this, it was necessary to reduce the Al-activity of the powder pack, which can be doneby adding a second element to be co-diffused (for example, Si) or by using Fe 2A1 5 asmasteralloy as done in the present case. Since a gradient of the chemical potential betweenpowder pack and substrate surface is necessary for the coating deposition process [5,6] onemay expect that if Fe2A15 is used as masteralloy a lower Al-containing FeA1-phase is formed.The coating obtained using a powder of Al203-20Fe2A15 -2NH4C1 heat treated for 24h at650 °C is shown in Figure 4.
Due to the lower activity, the process duration had to be prolonged to obtain a reasonablediffusion depth. This coating has a thickness of max. 101.1m with continually decreasing Al-content as shown by the line scan graph.
P91
ocTitino —3— Alv Fe
Cr
90
80
:7, 70
60
Aiy2 50
40
30
20
10
Figure 4: Low activity ffusion coating on P91, cross section and concentration profiles
The coating on the austenitic 17Cr/13Ni steel was produced at a temperature of 950 °C during8h using a powder of Al 203 -5A1-0.5NH4C1. The cross section and lines cans are depicted inFigure 5. It consists of an outer uniform (Fe,Ni)A1 layer of about 60 jam and an interdiffusionzone of about 70 gm thickness. The interdiffusion zone is characterized by the precipitation ofneedle shaped Al-nitrides. Obviously chromium was forced to diffuse inwards since a Cr-depletion is present in the outer zone and a Cr-enrichment up to nearly 20% can be foundwithin the interdiffusion zone.
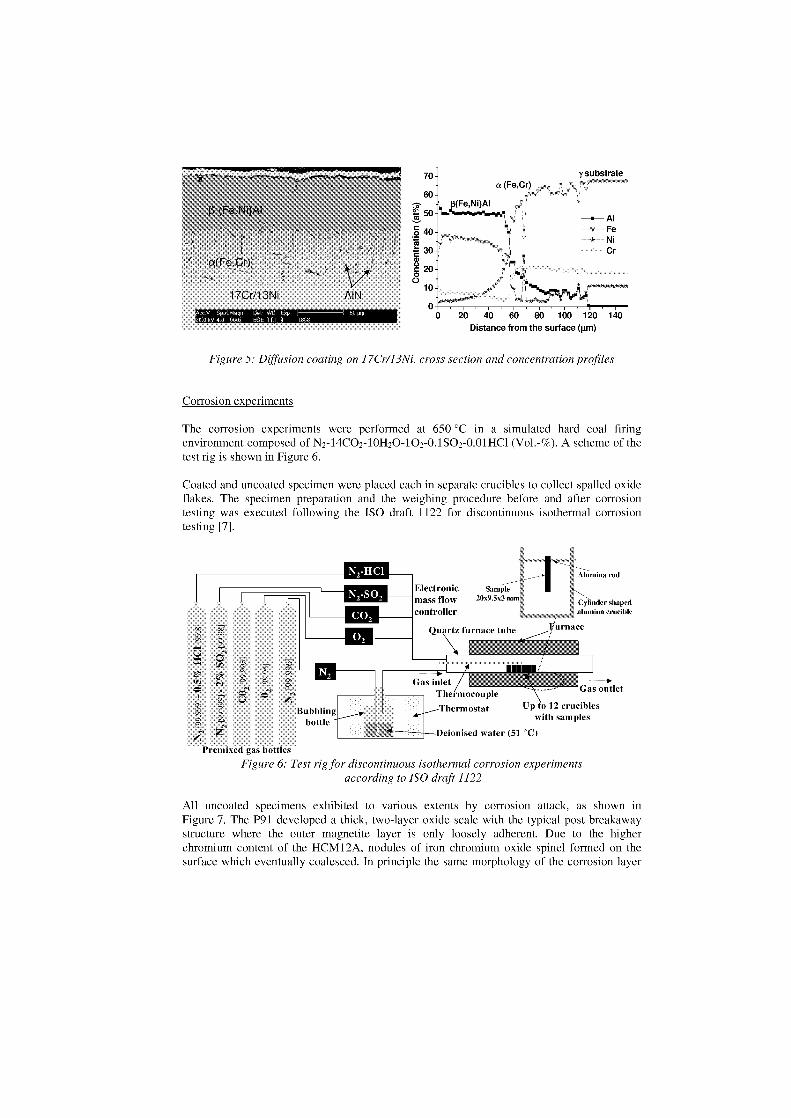
0 20 40 60 80 100 120 140Distance from the surface (Nm)
Qu 1\1: furnace tube I ace
111 1 11
Gas outlet
Up to 12 crucibleswith samples
Deionised water (51 °C)
Electronicmass flowcontroller
Sample20x9.5x3mrn Cylmder shaped
alumina crucible
Gas inletTheinocouple
4/Thermostat
Figure 5: Diffusion coating on 17Cr/13Ni, cross section and concentration profiles
Corrosion experiments
The corrosion experiments were performed at 650 °C in a simulated hard coal firingenvironment composed of N2-14CO2-10H20-1 02-0.1 S02-0.01HC1 (V ol.-%). A scheme of thetest rig is shown in Figure 6.
Coated and uncoated specimen were placed each in separate crucibles to collect spalled oxideflakes. The specimen preparation and the weighing procedure before and after corrosiontesting was executed following the ISO draft 1122 for discontinuous isothermal corrosiontesting [7].
Premixed gas bottlesFigure 6: Test rig for discontinuous isothermal corrosion experiments
according to ISO draft 1122
All uncoated specimens exhibited to various extents by corrosion attack, as shown inFigure 7. The P91 developed a thick, two-layer oxide scale with the typical post breakawaystructure where the outer magnetite layer is only loosely adherent. Due to the higherchromium content of the HCM12A, nodules of iron chromium oxide spinel formed on thesurface which eventually coalesced. In principle the same morphology of the corrosion layer
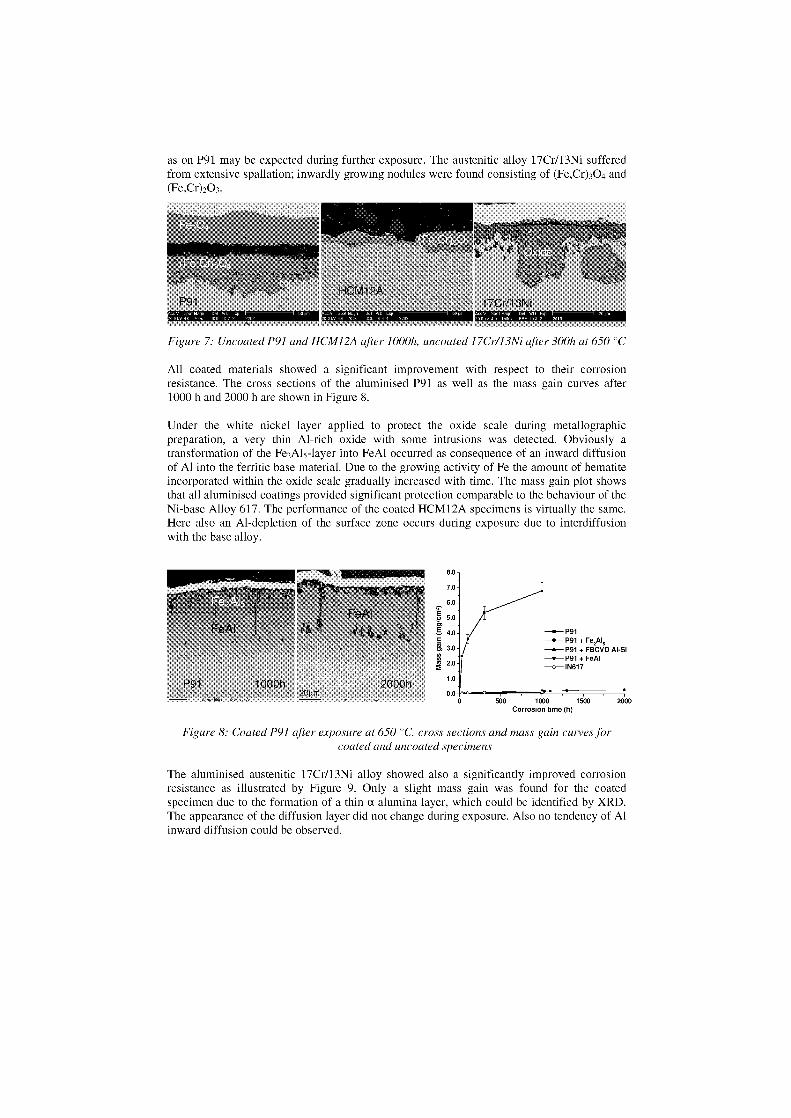
Paiiialaiffln111111111111Iiiia V Spot Mem UI WO Exp
0 IN /A lb. EISE 10.8 2
- P91- P91 + Fe,Als—A— P91 + FBCVD Al-Si—*— P91 + FeAI—o-1N617
I -I
as an P91 may be expected during further exposure. The austenitic alloy 17Cr/13Ni sufferedfrom extensive spallation; inwardly growing nodules were found consisting of (Fe,Cr) 304 and(Fe,Cr)203.
Figure 7: Uncoated P91 and HCM12A after 1000h, uncoated 17Cr/13Ni after 300h at 650 °C
All coated materials showed a significant improvement with respect to their corrosionresistance. The cross sections of the aluminised P91 as well as the mass gain curves after1000 h and 2000 h are shown in Figure 8.
Under the white nickel layer applied to protect the oxide scale during metallographicpreparation, a very thin Al-rich oxide with some intrusions was detected. Obviously atransformation of the Fe 2A1 5-layer into FeAI occurred as consequence of an inward diffusionof Al into the ferritic base material. Due to the growing activity of Fe the amount of hematiteincorporated within the oxide scale gradually increased with time. The mass gain plot shownthat all aluminised coatings provided significant protection comparable to the behaviour of theNi-base Alloy 617. The performance of the coated HCM12A specimens is virtually the same.Here also an Al-depletion of the surface zone occurs during exposure due to interdiffusionwith the base alloy.
500 1000 1500
2000Corrosion time (h)
Figure 8: Coated P91 after exposure at 650 °C, cross sections and mass gain curves forcoated and uncoated specimens
The aluminised austenitic l7Cr/l3Ni alloy showed also a significantly improved corrosionresistance as illustrated by Figure 9. Only a slight mass gain was found for the coatedspecimen due to the formation of a thin a-alumina layer, which could be identified by XRD.The appearance of the diffusion layer did not change during exposure. Also no tendency of Alinward diffusion could be observed.
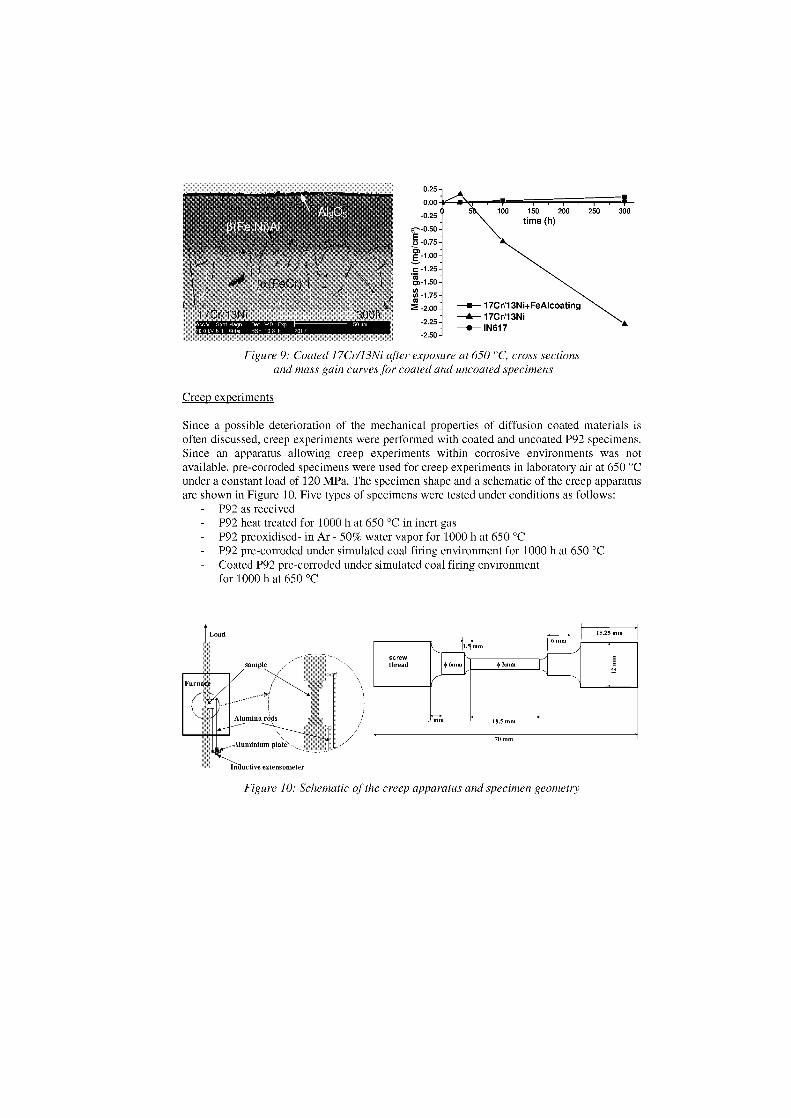
g 100 150 200 250 300
time (h)
17Cri13N1+FeAlcoating—Ä— 17C r/13N i—0— 1N617
0.25 -
0.00
-0.25
-0.50-Eo -0.75-a)E -1.00-
c -125-r30) -1.50 -en(1) -1.75-
m -2.00:
-2.25:
-2.50-
15.25 nun
6mm
11.5mm
screwthread
18.5 nun
70 mm
sample
Figure 9: Coated 17Cr/13Ni after exposure at 650 °C, cross sectionsand mass gain curves for coated and uncoated specimens
Creep experiments
Since a possible deterioration of the mechanical properties of diffusion coated materials isoften discussed, creep experiments were performed with coated and uncoated P92 specimens.Since an apparatus allowing creep experiments within corrosive environments was notavailable, pre-corroded specimens were used for creep experiments in laboratory air at 650 °Cunder a constant load of 120 MPa. The specimen shape and a schematic of the creep apparatusare shown in Figure 10. Five types of specimens were tested under conditions as follows:
- P92 as receivedP92 heat treated for 1000 h at 650 °C in inert gasP92 preoxidised- in Ar - 50% water vapor for 1000 h at 650 °C
- P92 pre-corroded under simulated coal firing environment for 1000 h at 650 °CCoated P92 pre-corroded under simulated coal firing environmentfor 1000 h at 650 °C
..i.teuetive extensometer
Load
Figure 10: Schematic of the creep apparatus and specimen geometry
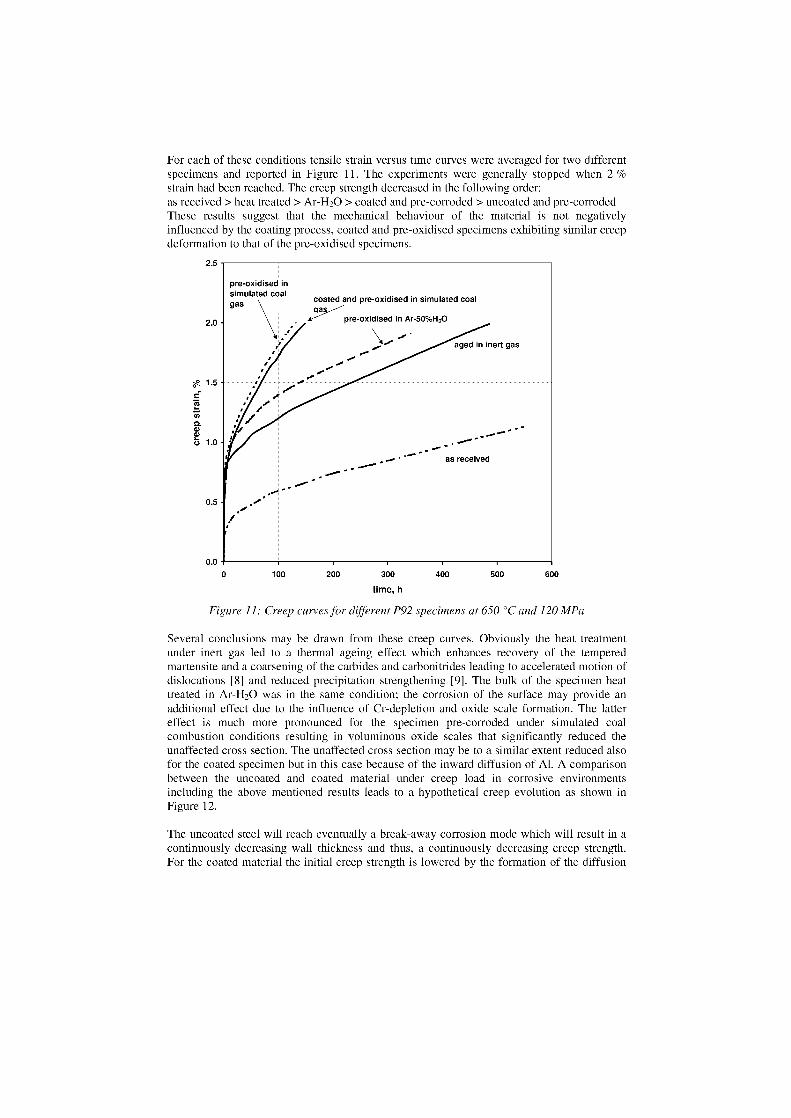
2.5
2.0 -
pre-oxidised insimulated coalgas coated and pre-oxidised in simulated coal
oapre-oxidised in Ar-50%H20
aged in inert gas
0.5 -
0.0
For each of these conditions tensile strain versus time curves were averaged for two differentspecimens and reported in Figure 11. The experiments were generally stopped when 2 %strain had been reached. The creep strength decreased in the following order:as received > heat treated > Ar-H20 > coated and pre-corroded > uncoated and pre-corrodedThese results suggest that the mechanical behaviour of the material is not negativelyinfluenced by the coating process, coated and pre-oxidised specimens exhibiting similar creepdeformation to that of the pre-oxidised specimens.
0
100
200
300
400
500
600
time, h
Figure I I : Creep curves for different P92 specimens at 650 °C and 120 MPa
Several conclusions may be drawn from these creep curves. Obviously the heat treatmentunder inert gas led to a thermal ageing effect which enhances recovery of the temperedmartensite and a coarsening of the carbides and carbonitrides leading to accelerated motion ofdislocations [8] and reduced precipitation strengthening [9]. The bulk of the specimen heattreated in Ar-H20 was in the same condition; the corrosion of the surface may provide anadditional effect due to the influence of Cr-depletion and oxide scale formation. The lattereffect is much more pronounced for the specimen pre-corroded under simulated coalcombustion conditions resulting in voluminous oxide scales that significantly reduced theunaffected cross section. The unaffected cross section may be to a similar extent reduced alsofor the coated specimen but in this case because of the inward diffusion of Al. A comparisonbetween the uncoated and coated material under creep load in corrosive environmentsincluding the above mentioned results leads to a hypothetical creep evolution as shown inFigure 12.
The uncoated steel will reach eventually a break-away corrosion mode which will result in acontinuously decreasing wall thickness and thus, a continuously decreasing creep strength.For the coated material the initial creep strength is lowered by the formation of the diffusion
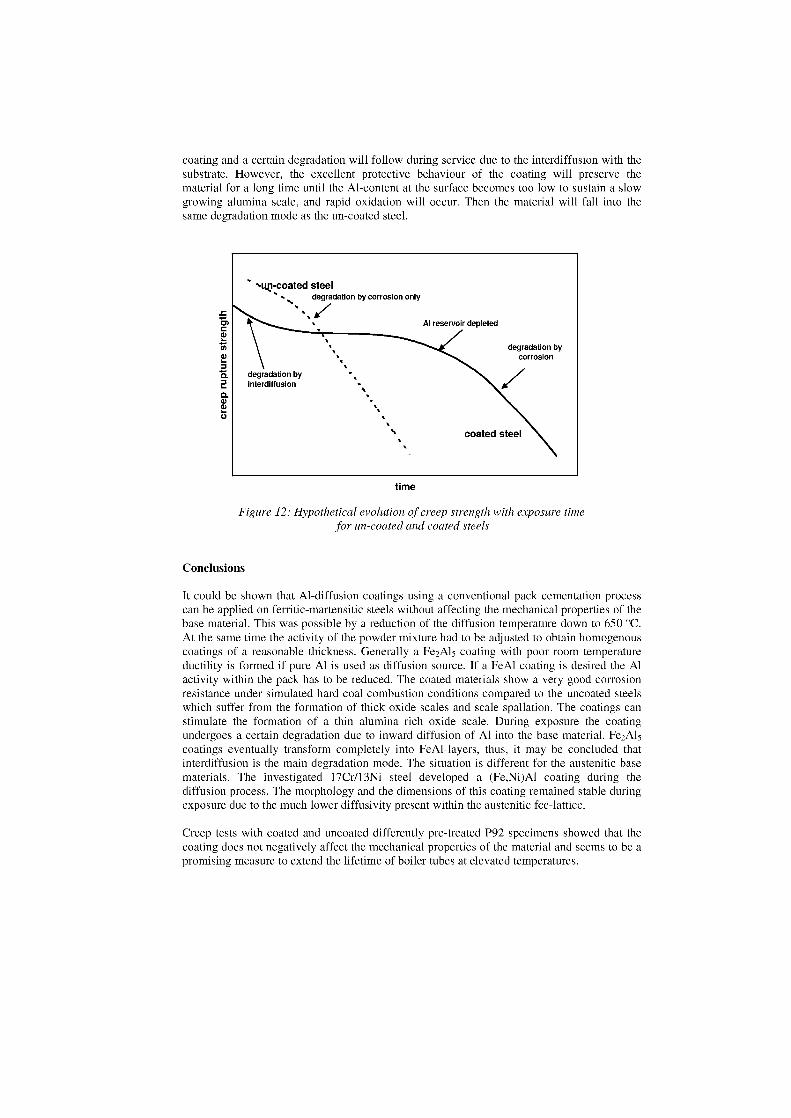
•suzi-coated steel•••• degradation by corrosion only
.c • A7Al reservoir depleted
To' ‘‘‘ degradation bycorrosion
degradation byinterdiffusion
coated steel
coating and a certain degradation will follow during service due to the interdiffusion with theSubstrate. However, the excellent protective behaviour of the coating will preserve thematerial for a long time until the Al-content at the surface becomes too low to sustain a slowgrowing alumina scale, and rapid oxidation will occur. Then the material will fall into thesame degradation mode as the un-coated steel.
time
Figure 12: Hypothetical evolution of creep strength with exposure timefor un-coated and coated steels
Conclusions
It could be shown that Al-diffusion coatings using a conventional pack cementation processcan be applied an ferritic-martensitic steels without affecting the mechanical properties of thebase material. This was possible by a reduction of the diffusion temperature down to 650 °C.At the same time the activity of the powder mixture had to be adjusted to obtain homogenouscoatings of a reasonable thickness. Generally a Fe 2A1 5 coating with poor room temperatureductility is formed if pure Al is used as diffusion source. 1f a FeAl coating is desired the Alactivity within the pack has to be reduced. The coated materials show a very good corrosionresistance under simulated hard coal combustion conditions compared to the uncoated steelswhich suffer from the formation of thick oxide scales and scale spallation. The coatings canstimulate the formation of a thin alumina rich oxide scale. During exposure the coatingundergoes a certain degradation due to inward diffusion of Al into the base material. Fe2A15coatings eventually transform completely into FeA1-layers, thus, it may be concluded thatinterdiffusion is the main degradation mode. The situation is different for the austenitic basematerials. The investigated 17Cr/13Ni steel developed a (Fe,Ni)Al coating during thediffusion process. The morphology and the dimensions of this coating remained stable duringexposure due to the much lower diffusivity present within the austenitic fcc-lattice.
Creep tests with coated and uncoated differently pre-treated P92 specimens showed that thecoating does not negatively affect the mechanical properties of the material and seems to be apromising measure to extend the lifetime of boiler tubes at elevated temperatures.
Acknowledgements
The authors would like to thank for the support of this work in the frame of the SUNASPOnetwork project (RTN project N° HPRN-CT-2001-00201) funded by the EuropeanCommission. They also would like to thank all project partners and co-workers for theircontributions concerning the experimental work and the post-experimental investigations.
Literature
[1] P.J. Ennis, in Advances in Materials Technology for Fossil Power Plants,Proc 4th International Conference, 25-28 October 2004, Hilton Head Island, SouthCarolina, USA, ed R Viswanathan, D Gandy, K Coleman, EPRI Report Number1011381, ISBN 0-87170-818-3, ASM International, Ohio, 2005, pp 1146-1159
[2] J. Zurek, L. Nieto-Hierro, J. Piron-Abellan, L. Niewolak, L. Singheiser,W.J. Quadakkers, Materials Science Forum 2004, 461-464
[3] R. Wvrel, C. Duret, R. Pichoir, Materials Science and Technology 3/1986, 201-206[4] R.L. Wachtell, Science and Technology of surface coating, B.N. Chapman & J.C.
Anderson (eds.), Academic Press London, NY (1974) 105-118[5] B.K. Gupta, L.L. Seigle, Thin Solid Films 73/1980, 365-371[6] R.A. Rapp, Proceedings of Corrosion 89, April 17-21, New Orleans 1989, paper 352[7] Corrosion of metals and alloys – Test method for Isothermal Exposure Testing under
High Temperature Corrosion Conditions for Metallic Materials, ISO DocumentISO/TC 156 N 1122 - Working Draft
[8] G.E. Dieter, Mechanical Metallurgy, 2. Edition, Int. Student Edition, McGraw-HillKogakusha Ltd. (1976) 451-489
[9] 0. Wachter, P.J. Ennis, VGB Kraftwerkstechnik 9/1997, 770-785
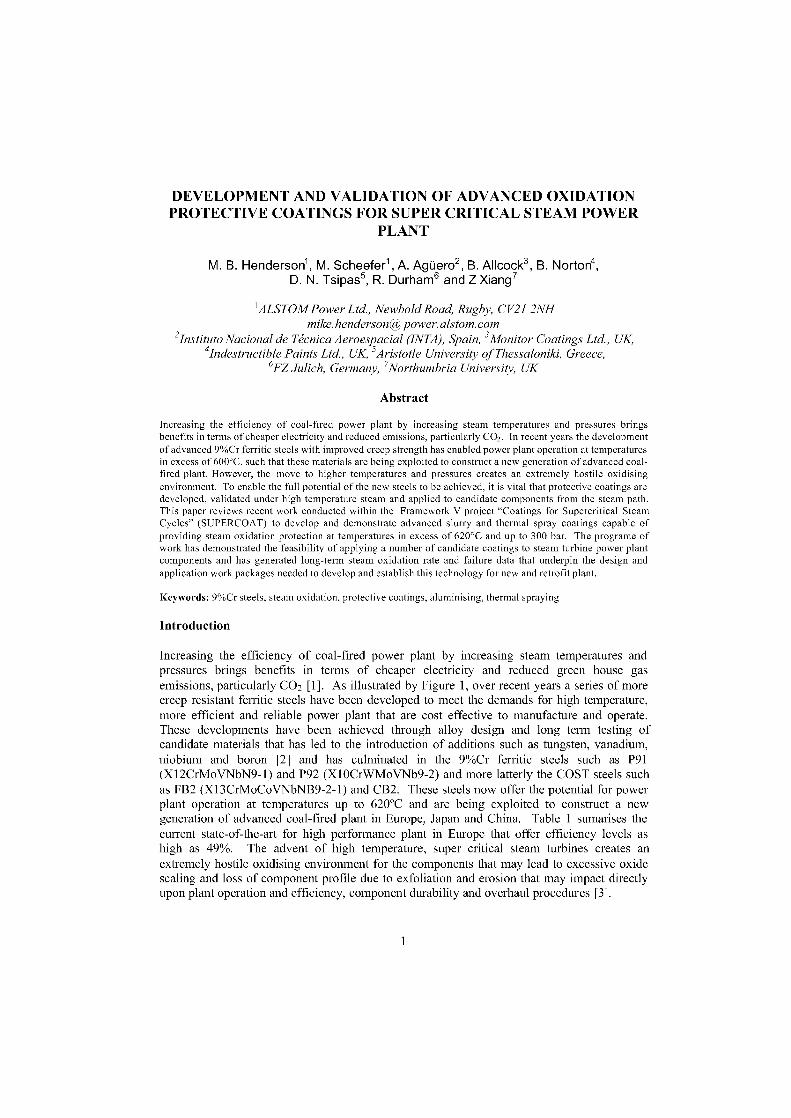
DEVELOPMENT AND VALIDATION OF ADVANCED OXIDATIONPROTECTIVE COATINGS FOR SUPER CRITICAL STEAM POWER
PLANT
M. B. Henderson1 , M. Scheefer 1 , A. Agüero2 , B. Allcock3 , B. Norton4,D. N. Tsipas 5 , R. Durham 6 and Z Xiang7
1 ALSTOM Power Ltd., Newbold Road, Rugby, CV21 2NHmike.hendersong power.alstom.com
2 Institut° Nacional de Tjcnica Aeroespacial (INTA), Spain, 3 Monitor Coatings Ltd., UK,4 Indestructible Paints Ltd., UK, 5 Aristotle University of Thessaloniki, Greece,
6FZ Jülich, Germany, 7Northumbria University, UK
Abstract
Increasing the efficiency of coal-fired power plant by increasing steam temperatures and pressures bringsbenefits in terms of cheaper electricity and reduced emissions, particularly CO 2 . In recent years the developmentof advanced 9%Cr ferritic steels with improved creep strength has enabled power plant operation at temperaturesin excess of 600°C, such that these materials are being exploited to construct a new generation of advanced coal-fired plant. However, the move to higher temperatures and pressures creates an extremely hostile oxidisingenvironment. To enable the full potential of the new steels to be achieved, it is vital that protective coatings aredeveloped, validated under high temperature steam and applied to candidate components from the steam path.This paper reviews recent work conducted within the Framework V project "Coatings for Supercritical SteamCycles" (SUPERCOAT) to develop and demonstrate advanced slurry and thermal spray coatings capable ofproviding steam oxidation protection at temperatures in excess of 620°C and up to 300 bar. The programe ofwork has demonstrated the feasibility of applying a number of candidate coatings to steam turbine power plantcomponents and has generated long-term steam oxidation rate and failure data that underpin the design andapplication work packages needed to develop and establish this technology for new and retrofit plant.
Keywords: 9%Cr steels, steam oxidation, protective coatings, aluminising, thermal spraying
Introduction
Increasing the efficiency of coal-fired power plant by increasing steam temperatures andpressures brings benefits in terms of cheaper electricity and reduced green house gasemissions, particularly CO 2 [1]. As illustrated by Figure 1, over recent years a series of morecreep resistant ferritic steels have been developed to meet the demands for high temperature,more efficient and reliable power plant that are cost effective to manufacture and operate.These developments have been achieved through alloy design and Jong term testing ofcandidate materials that has led to the introduction of additions such as tungsten, vanadium,niobium and boron [2] and has culminated in the 9%Cr ferritic steels such as P91(X12CrMoVNbN9-1) and P92 (X 10CrWMoVNb9-2) and more latterly the COST steels suchas FB2 (X13CrMoCoVNbNB9-2-1) and CB2. These steels now offer the potential for powerplant Operation at temperatures up to 620°C and are being exploited to construct a newgeneration of advanced coal-fired plant in Europe, Japan and China. Table 1 sumarises thecurrent state-of-the-art for high performance plant in Europe that offer efficiency levels ashigh as 49%. The advent of high temperature, super critical steam turbines creates anextremely hostile oxidising environment for the components that may lead to excessive oxidescaling and loss of component profile due to exfoliation and erosion that may impact directlyupon plant operation and efficiency, component durability and overhaul procedures [3].
1
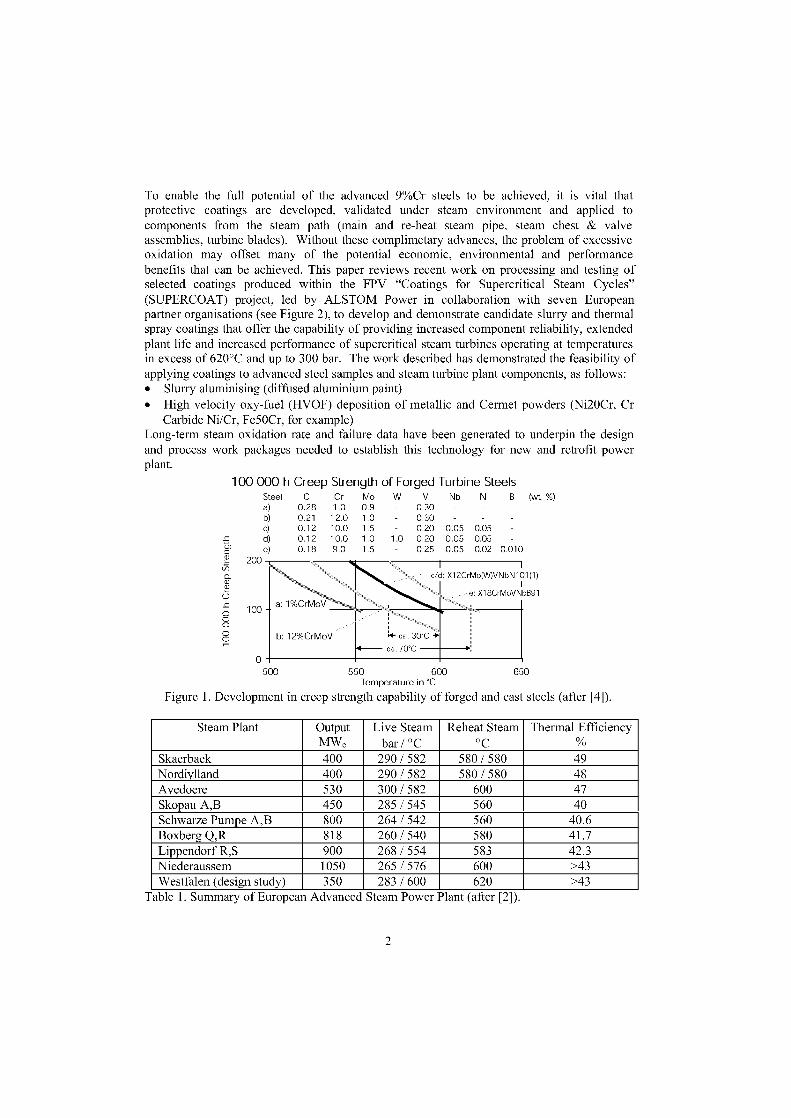
To enable the fall potential of the advanced 9%Cr steels to be achieved, it is vital thatprotective coatings are developed, validated under steam environment and applied tocomponents from the steam path (main and re-heat steam pipe, steam chest & valveassemblier, turbine blades). Without these complimetary advances, the problem of excessiveoxidation may offset many of the potential economic, environmental and performancebenefits that can be achieved. This paper reviews recent work an processing and testing ofselected coatings produced within the FPV "Coatings for Supercritical Steam Cycles"(SUPERCOAT) project, led by ALSTOM Power in collaboration with seven Europeanpartner organisations (see Figure 2), to develop and demonstrate candidate slurry and thermalspray coatings that offer the capability of providing increased component reliability, extendedplant life and increased performance of supercritical steam turbines operating at temperaturesin excess of 620°C and up to 300 bar. The work described has demonstrated the feasibility ofapplying coatings to advanced steel samples and steam turbine plant components, as follows:• Slurry aluminising (diffused aluminium paint)• High velocity oxy-fuel (HVOF) deposition of metallic and Cermet powders (Ni20Cr, Cr
Carbide Ni/Cr, Fe50Cr, for example)Long-term steam oxidation rate and failure data have been generated to underpin the designand process work packages needed to establish this technology for new and retrofit powerplant.
100 000 h Creep Strength of Forged Turbine SteelsSteel C Cr Mo W V Nb N B (wt %)a 0.28 1.0 0.9 - 0.30b 0.21 12.0 1.0 0.30c) 0.12 10.0 1.5 - 0.20 0.05 0.05 -d 0.12 10.0 1.0 1.0 0.20 0.05 0.05 -e) 0.18 9.0 1.5 - 0.25 0.05 0.02 0.010
200
c/d: X1 2CrMo(W)VNbN101 (1)
e:X18CrMoVNbB91a: 1%CrMo'v
100 -
b: 12%CrMoV
0
.1- ca. 30°C +ca. 70°C -01>
500 550 600
650Temperature in °C
Figure 1. Development in creep strength capability of forged and cast steels (after [4]).
Steam Plant OutputMW,
Live Steambar / °C
Reheat Steam°C
Thermal Efficiency%
Skaerbaek 400 290 / 582 580 / 580 49Nordiylland 400 290 / 582 580 / 580 48Avedoere 530 300 / 582 600 47Skopau A,B 450 285 / 545 560 40Schwarze Pumpe A,B 800 264 / 542 560 40.6Boxberg Q,R 818 260 / 540 580 41.7Lippendorf R,S 900 268 / 554 583 42.3Niederaussem 1050 265 / 576 600 >43Westfalen (design study) 350 283 / 600 620 >43
Table 1. Summary of European Advanced Steam Power Plant (after [2]).
2
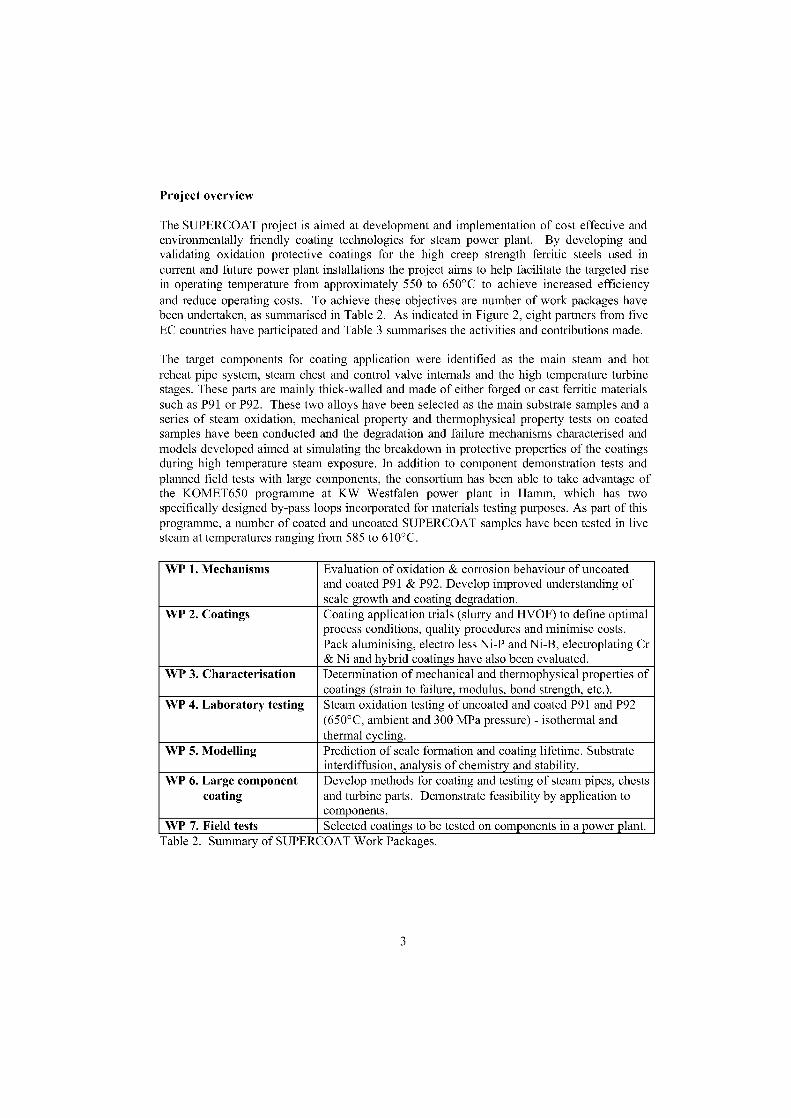
Project overview
The SUPERCOAT project is aimed at development and implementation of cost effective andenvironmentally friendly coating technologies for steam power plant. By developing andvalidating oxidation protective coatings for the high creep strength ferritic steels used incurrent and future power plant installations the project aims to help facilitate the targeted risein operating temperature from approximately 550 to 650°C to achieve increased efficiencyand reduce operating costs. To achieve these objectives are number of work packages havebeen undertaken, as summarised in Table 2. As indicated in Figure 2, eight partners from fiveEC countries have participated and Table 3 summarises the activities and contributions made.
The target components for coating application were identified as the main steam and hotreheat pipe system, steam chest and control valve internals and the high temperature turbinestages. These parts are mainly thick-walled and made of either forged or cast ferritic materialssuch as P91 or P92. These two alloys have been selected as the main substrate samples and aseries of steam oxidation, mechanical property and thermophysical property tests on coatedsamples have been conducted and the degradation and failure mechanisms characterised andmodels developed aimed at simulating the breakdown in protective properties of the coatingsduring high temperature steam exposure. In addition to component demonstration tests andplanned field tests with large components, the consortium has been able to take advantage ofthe KOMET650 programme at KW Westfalen power plant in Hamm, which has twospecifically designed by-pass loops incorporated for materials testing purposes. As part of thisprogramme, a number of coated and uncoated SUPERCOAT samples have been tested in livesteam at temperatures ranging from 585 to 610°C.
WP 1. Mechanisms Evaluation of oxidation & corrosion behaviour of uncoatedand coated P91 & P92. Develop improved understanding ofscale growth and coating degradation.
WP 2. Coatings Coating application trials (slurry and HVOF) to define optimalprocess conditions, quality procedures and minimise costs.Pack aluminising, electro less Ni-P and Ni-B, electroplating Cr& Ni and hybrid coatings have also been evaluated.
WP 3. Characterisation Determination of mechanical and thermophysical properties ofcoatings (strain to failure, modulus, bond strength, etc.).
WP 4. Laboratory testing Steam oxidation testing of uncoated and coated P91 and P92(650°C, ambient and 300 MPa pressure) - isothermal andthermal cycling.
WP 5. Modelling Prediction of scale formation and coating lifetime. Substrateinterdiffusion, analysis of chemistry and stability.
WP 6. Large component Develop methods for coating and testing of steam pipes, chestscoating and turbine parts. Demonstrate feasibility by application to
components.WP 7. Field tests Selected coatings to be tested on components in a power plant.
Table 2. Summary of SUPERCOAT Work Packages.
3
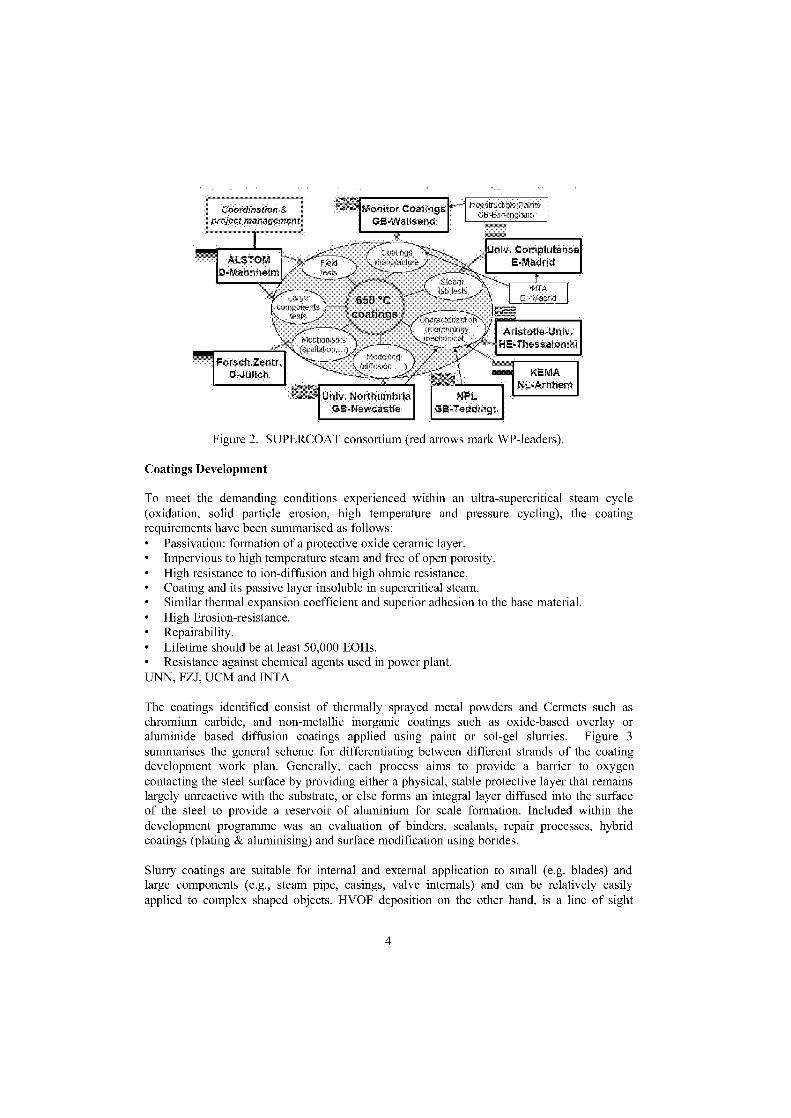
rnz,,n Ifa,iuretests
Monitor CoatingsGE-Walsend
Iroestr..ct:Ne Pa;n5GB-Li:rTInpar
ALSTOMD-iVannheim
Ste..iirtests
Lauge 650 °Ccompoeerts
ee3ts coatiiicis haractenzatiQn;morphology.
Mechan:sms mechanical,..(spatlation....))
hng
Univ. NorthumbriaOB-Newcastle
Univ. CornplutenseE-Madrid
Aristotle-Univ.E-Thessaioni14
KEMANL-Arnhem
Forsch2entr.D-Jülich
NTA.1- d.
N PtCiE-Teddingt.
Figure 2. SUPERCOAT consortium (red arrows mark WP-leaders).
Coatings Development
To meet the demanding conditions experienced within an ultra-supercritical steam cycle(oxidation, solid particle erosion, high temperature and pressure cycling), the coatingrequirements have been summarised as follows:• Passivation: formation of a protective oxide ceramic layer.• Impervious to high temperature steam and free of open porosity.• High resistance to ion-diffusion and high ohmic resistance.• Coating and its passive layer insoluble in supercritical steam.• Similar thermal expansion coefficient and superior adhesion to the base material.• High Erosion-resistance.• Repairability.• Lifetime should be at least 50,000 EOHs.• Resistance against chemical agents used in power plant.UNN, FZJ, UCM and INTA
The coatings identified consist of thermally sprayed metal powders and Cermets such aschromium carbide, and non-metallic inorganic coatings such as oxide-based overlay oraluminide based diffusion coatings applied using paint or sol-gel slurries. Figure 3summarises the general scheine for differentiating between different strands of the coatingdevelopment work plan. Generally, each process aims to provide a barrier to oxygencontacting the steel surface by providing either a physical, stable protective layer that remainslargely unreactive with the Substrate, or else forms an integral layer diffused into the surfaceof the steel to provide a reservoir of aluminium for scale formation. Included within thedevelopment programme was an evaluation of binders, sealants, repair processes, hybridcoatings (plating & aluminising) and surface modification using borides.
Slurry coatings are suitable for internal and external application to Small (e.g. blades) andlarge components (e.g., steam pipe, casings, valve internals) and can be relatively easilyapplied to complex shaped objects. HVOF deposition an the other hand, is a line of sight
4
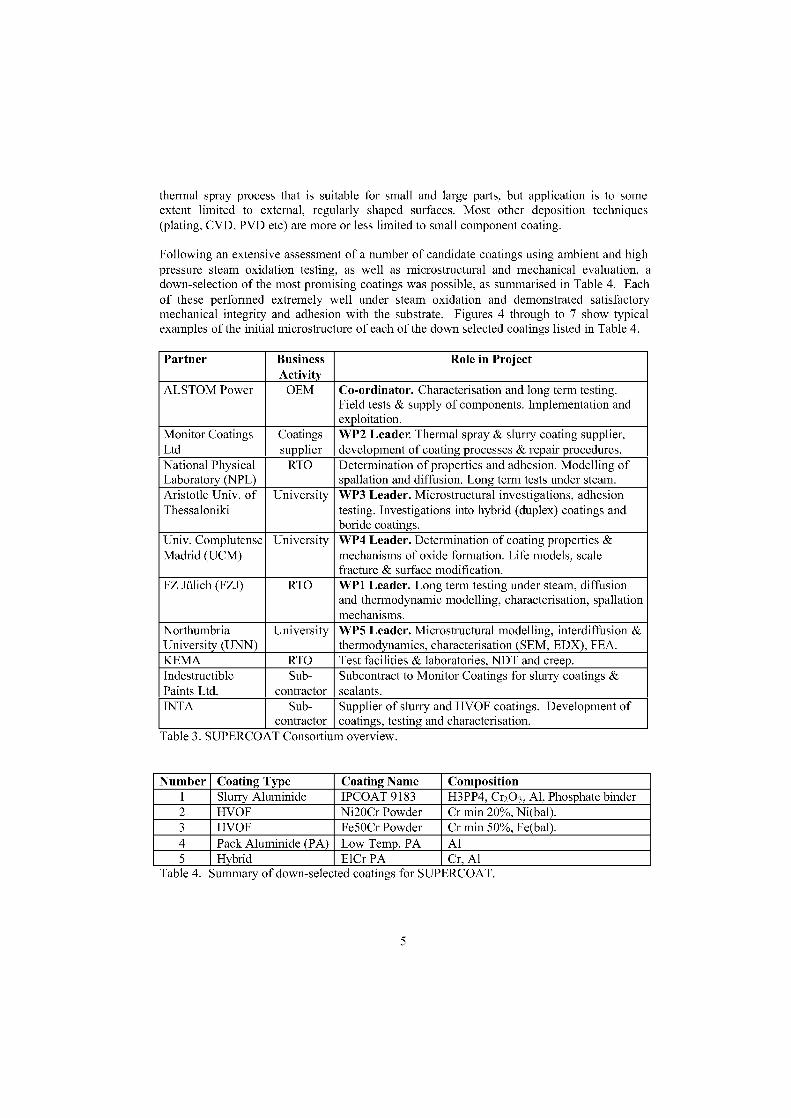
thermal spray process that is suitable for small and large parts, but application is to someextent limited to external, regularly shaped surfaces. Most other deposition techniques(plating, CVD, PVD etc) are more or less limited to small component coating.
Following an extensive assessment of a number of candidate coatings using ambient and highpressure steam oxidation testing, as well as microstructural and mechanical evaluation, adown-selection of the most promising coatings was possible, as summarised in Table 4. Eachof these performed extremely well under steam oxidation and demonstrated satisfactorymechanical integrity and adhesion with the substrate. Figures 4 through to 7 Show typicalexamples of the initial microstructure of each of the down selected coatings listed in Table 4.
Partner BusinessActivity
Role in Project
ALSTOM Power OEM Co-ordinator. Characterisation and Jong term testing.Field tests & supply of components. Implementation andexploitation.
Monitor Coatings Coatings WP2 Leader. Thermal spray & slurry coating supplier,Ltd supplier development of coating processes & repair procedures.National Physical RTO Determination of properties and adhesion. Modelling ofLaboratory (NPL) spallation and diffusion. Long term tests under steam.Aristotle Univ. of University WP3 Leader. Microstructural investigations, adhesionThessaloniki testing. Investigations into hybrid (duplex) coatings and
boride coatings.Univ. Complutense University WP4 Leader. Determination of coating properties &Madrid (UCM) mechanisms of oxide formation. Life models, scale
fracture & surface modification.FZ Jülich (FZJ) RTO WP1 Leader. Long term testing under steam, diffusion
and thermodynamic modelling, characterisation, spallationmechanisms.
Northumbria University WP5 Leader. Microstructural modelling, interdiffusion &University (UNN) thermodynamics, characterisation (SEM, EDX), FEA.KEMA RTO Test facilities & laboratories, NDT and creep.Indestructible Sub- Subcontract to Monitor Coatings for slurry coatings &Paints Ltd. contractor sealants.INTA Sub- Supplier of slurry and HVOF coatings. Development of
contractor coatings, testing and characterisation.Table 3. SUPERCOAT Consortium overview.
Number Coating Type Coating Name Composition1 Slurry Aluminide IPCOAT 9183 H3PP4, Cr203 , Al, Phosphate binder2 HVOF Ni20Cr Powder Cr min 20%, Ni(bal).3 HVOF Fe50Cr Powder Cr min 50%, Fe(bal).4 Pack Aluminide (PA) Low Temp. PA Al5 Hybrid ElCr PA Cr, Al
Table 4. Summary of down-selected coatings for SUPERCOAT.
5
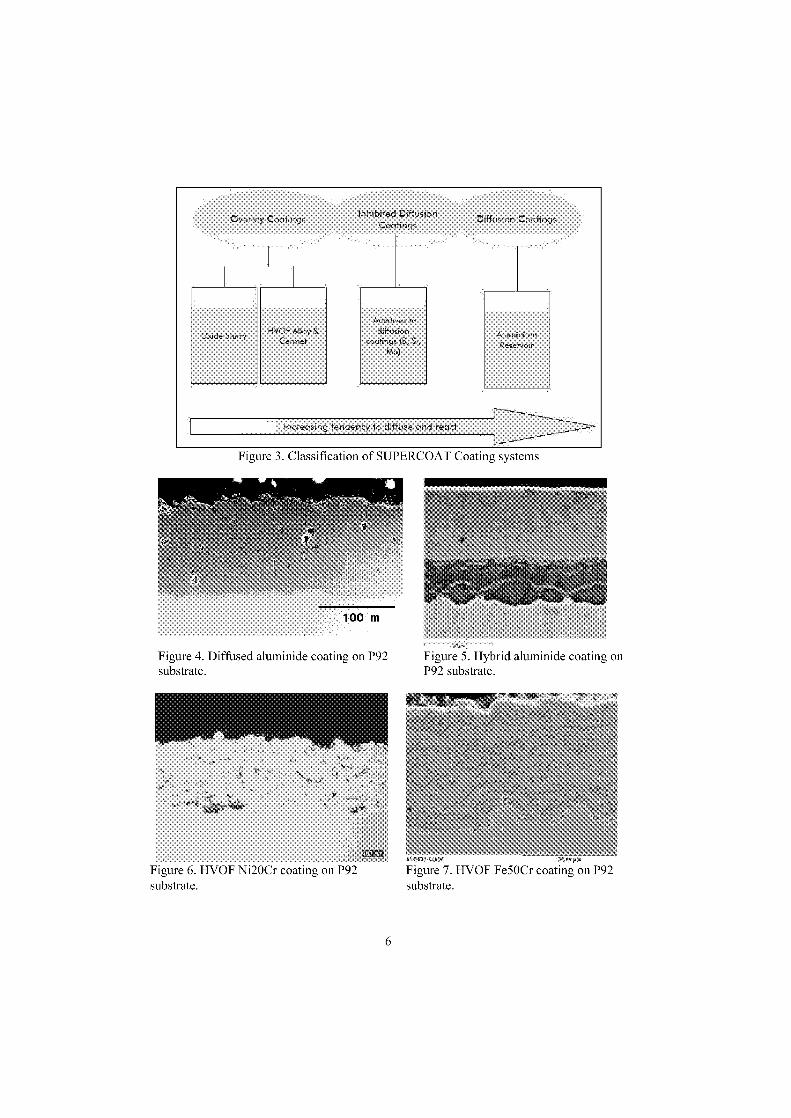
Inhibited DiffusionOverlay Coaiings Diffusian Caating sCoatings
Additives to
')xide Slurry HVOF Ailoy &Cermet
diffutio,coritings (B, Si,
Mo)
AbreiriornReservoir
Increasing tendency to diffuse and react
Figure 3. Classification of SUPERCOAT Coating systems
Figure 4. Diffused aluminide coating on P92
Figure 5. Hybrid aluminide coating onsubstrate. P92 substrate.
Figure 6. HVOF Ni20Cr coating on P92substrate.
Figure 7. HVOF Fe50Cr coating on P92substrate.
6
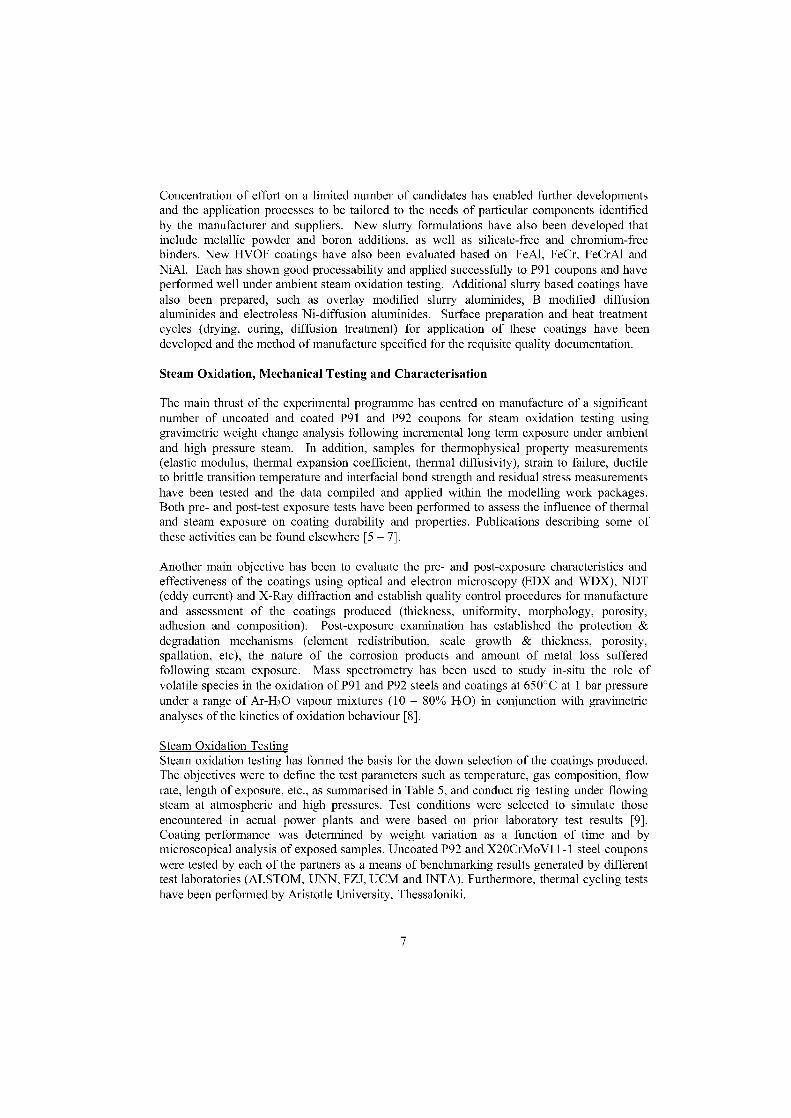
Concentration of effort on a limited number of candidates has enabled further developmentsand the application processes to be tailored to the needs of particular components identifiedby the manufacturer and suppliers. New slurry formulations have also been developed thatinclude metallic powder and boron additions, as well as silicate-free and chromium-freebinders. New HVOF coatings have also been evaluated based on FeAl, FeCr, FeCrAl andNiAl. Each has shown good processability and applied successfully to P91 coupons and haveperformed well under ambient steam oxidation testing. Additional slurry based coatings havealso been prepared, such as overlay modified slurry aluminides, B modified diffusionaluminides and electroless Ni-diffusion aluminides. Surface preparation and heat treatmentcycles (drying, curing, diffusion treatment) for application of these coatings have beendeveloped and the method of manufacture specified for the requisite quality documentation.
Steam Oxidation, Mechanical Testing and Characterisation
The main thrust of the experimental programme has centred on manufacture of a significantnumber of uncoated and coated P91 and P92 coupons for steam oxidation testing usinggravimetric weight change analysis following incremental Jong term exposure under ambientand high pressure steam. In addition, samples for thermophysical property measurements(elastic modulus, thermal expansion coefficient, thermal diffusivity), strain to failure, ductileto brittle transition temperature and interfacial bond strength and residual stress measurementshave been tested and the data compiled and applied within the modelling work packages.Both pre- and post-test exposure tests have been performed to assess the influence of thermaland steam exposure on coating durability and properties. Publications describing some ofthese activities can be found elsewhere [5 – 7].
Another main objective has been to evaluate the pre- and post-exposure characteristics andeffectiveness of the coatings using optical and electron microscopy (EDX and WDX), NDT(eddy current) and X-Ray diffraction and establish quality control procedures for manufactureand assessment of the coatings produced (thickness, uniformity, morphology, porosity,adhesion and composition). Post-exposure examination has established the protection °radation mechanisms (element redistribution, scale growth & thickness, porosity,spallation, etc), the nature of the corrosion products and amount of metal loss sufferedfollowing steam exposure. Mass spectrometry has been used to study in-situ the role ofvolatile species in the oxidation of P91 and P92 steels and coatings at 650°C at 1 bar pressureunder a range of Ar-H2 0 vapour mixtures (10 – 80% HO) in conjunction with gravimetricanalyses of the kinetics of oxidation behaviour [8].
Steam Oxidation TestingSteam oxidation testing has formed the basis for the down selection of the coatings produced.The objectives were to define the test parameters such as temperature, gas composition, flowrate, length of exposure, etc., as summarised in Table 5, and conduct rig testing under flowingsteam at atmospheric and high pressures. Test conditions were selected to simulate thoseencountered in actual power plants and were based on prior laboratory test results [9].Coating performance was determined by weight variation as a function of time and bymicroscopical analysis of exposed samples. Uncoated P92 and X20CrMoV11-1 steel couponswere tested by each of the partners as a means of benchmarking results generated by differenttest laboratories (ALSTOM, UNN, FZJ, UCM and INTA). Furthermore, thermal cycling testshave been performed by Aristotle University, Thessaloniki.
7
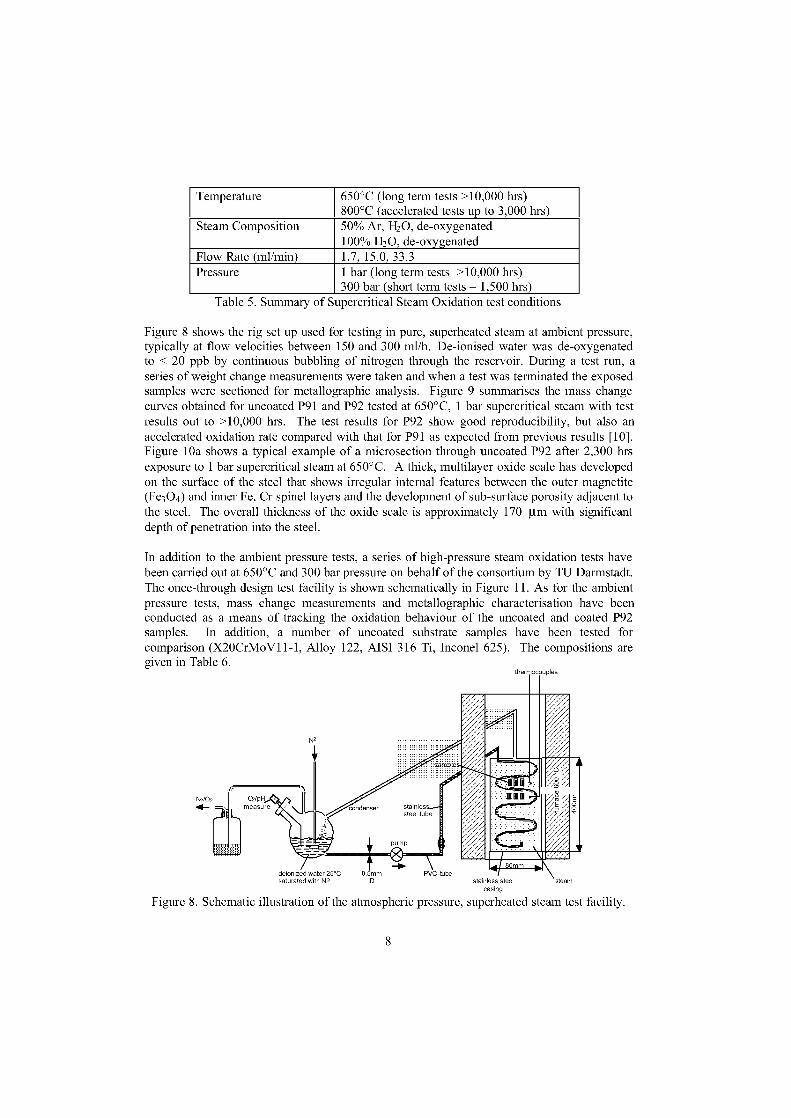
delonzed water 25°C 0,5mm PVC-tubesaturated with N2 ID stalnless steel
casIng
Figure 8. Schematic illustration of the atmospheric pressure, superheated steam test facility.
Temperature 650°C (long term tests >10,000 hrs)800°C (accelerated tests up to 3,000 hrs)
Steam Composition 50% Ar, H20, de-oxygenated100% H20, de-oxygenated
Flow Rate (ml/min) 1.7, 15.0, 33.3Pressure 1 bar (long term tests >10,000 hrs)
300 bar (short term tests – 1,500 hrs)Table 5. Summary of Supercritical Steam Oxidation test conditions
Figure 8 shows the rig set up used for testing in pure, superheated steam at ambient pressure,typically at flow velocities between 150 and 300 ml/h. De-ionised water was de-oxygenatedto < 20 ppb by continuous bubbling of nitrogen through the reservoir. During a test run, aseries of weight change measurements were taken and when a test was terminated the exposedsamples were sectioned for metallographic analysis. Figure 9 summarises the mass changecurves obtained for uncoated P91 and P92 tested at 650°C, 1 bar supercritical steam with testresults out to >10,000 hrs. The test results for P92 show good reproducibility, but also anaccelerated oxidation rate compared with that for P91 as expected from previous results [10].Figure 10a shows a typical example of a microsection through uncoated P92 after 2,300 hrsexposure to 1 bar supercritical steam at 650°C. A thick, multilayer oxide scale has developedon the surface of the steel that shows irregular internal features between the outer magnetite(Fe3 04) and inner Fe, Cr spinel layers and the development of sub-surface porosity adjacent tothe steel. The overall thickness of the oxide scale is approximately 170 i.tm with significantdepth of penetration into the steel.
In addition to the ambient pressure tests, a series of high-pressure steam oxidation tests havebeen carried out at 650°C and 300 bar pressure on behalf of the consortium by TU Darmstadt.The once-through design test facility is shown schematically in Figure 11. As for the ambientpressure tests, mass change measurements and metallographic characterisation have beenconducted as a means of tracking the oxidation behaviour of the uncoated and coated P92samples. In addition, a number of uncoated Substrate samples have been tested forcomparison (X20CrMoV11-1, Alloy 122, AISI 316 Ti, Inconel 625). The compositions aregiven in Table 6.
8
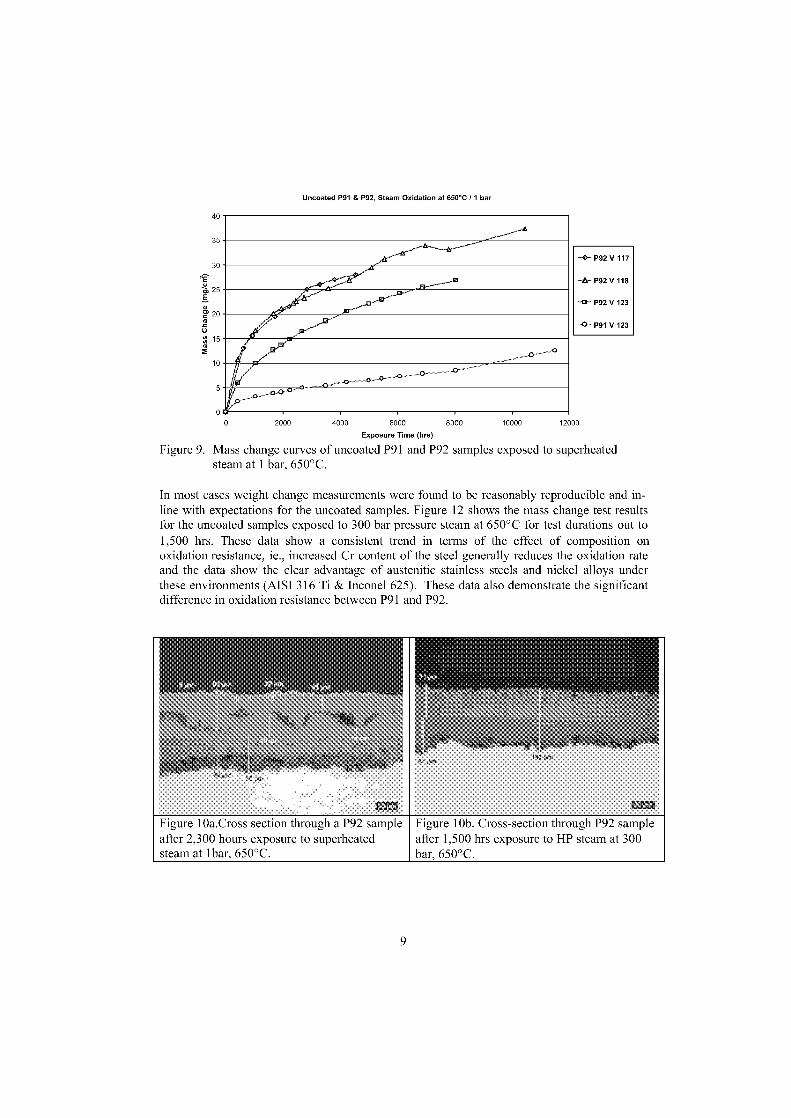
P92 V 117
-10x- P92 V 118
-12-- P92 V 123
-0- P91 V 123
0 2000 4000 6000 8000
10000
12000
Exposure Time (hrs)
Figure 9. Mass change curves of uncoated P91 and P92 samples exposed to superheatedsteam at 1 bar, 650°C.
In most cases weight change measurements were found to be reasonably reproducible and in-line with expectations for the uncoated samples. Figure 12 shows the mass change test resultsfor the uncoated samples exposed to 300 bar pressure steam at 650°C for test durations out to1,500 hrs. These data show a consistent trend in terms of the effect of composition anoxidation resistance, ie., increased Cr content of the steel generally reduces the oxidation rateand the data show the clear advantage of austenitic stainless steels and nickel alloys underthese environments (AISI 316 Ti & Inconel 625). These data also demonstrate the significantdifference in oxidation resistance between P91 and P92.
Figure 10a.Cross section through a P92 sampleafter 2,300 hours exposure to superheatedsteam at 1 bar, 650°C.
Figure 10b. Cross-section through P92 sampleafter 1,500 hrs exposure to HP steam at 300bar, 650°C.
9
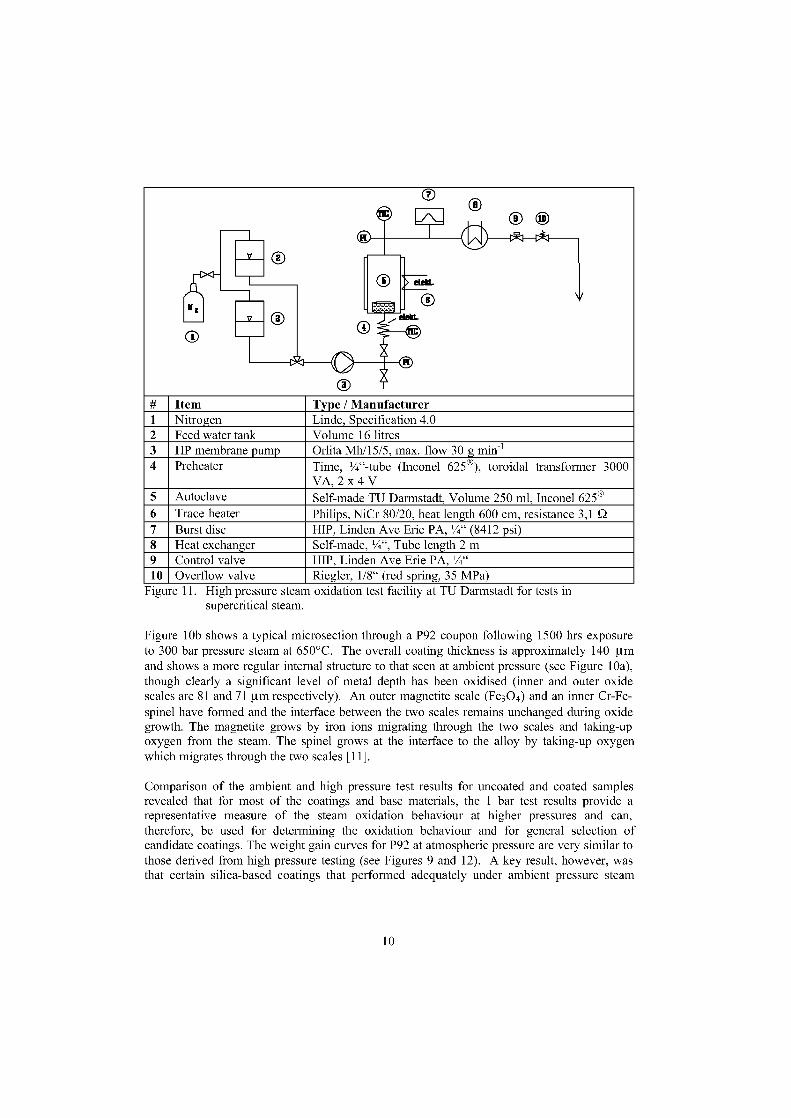
13
■•• •
(2
f>
Z
O®
0
® ®
.7-• • •
EN
0
■VA
0Ili
0V
A/
•
# Item Type / Manufacturer1 Nitrogen Linde, Specification 4.02 Feed water tank Volume 16 litres3 HP membrane pump Orlita Mh/15/5, max. flow 30 g min-14 Preheater Time, '/4"-tube (Inconel 625°), toroidal transformer 3000
VA, 2 x 4 V5 Autoclave Self-made TU Darmstadt, Volume 250 ml, Inconel 625®6 Trace heater Philips, NiCr 80/20, heat length 600 cm, resistance 3,1 27 Burst disc HIP, Linden Ave Erie PA, 1/4" (8412 psi)8 Heat exchanger Self-made, '/4", Tube length 2 m9 Control valve HIP, Linden Ave Erie PA, 1/4"10 Overflow valve Riegler, 1/8" (red spring, 35 MPa)
Figure 11. High pressure steam oxidation test facility at TU Darmstadt for tests insupercritical steam.
Figure 10b shows a typical microsection through a P92 coupon following 1500 hrs exposureto 300 bar pressure steam at 650°C. The overall coating thickness is approximately 140 !imand shows a more regular internal structure to that seen at ambient pressure (see Figure 10a),though clearly a significant level of metal depth has been oxidised (inner and outer oxidescales are 81 and 71 !im respectively). An outer magnetite scale (Fe 3 04) and an inner Cr-Fe-spinel have formed and the interface between the two scales remains unchanged during oxidegrowth. The magnetite grows by iron ions migrating through the two scales and taking-upoxygen from the steam. The spinel grows at the interface to the alloy by taking-up oxygenwhich migrates through the two scales [11].
Comparison of the ambient and high pressure test results for uncoated and coated samplesrevealed that for most of the coatings and bare materials, the 1 bar test results provide arepresentative measure of the steam oxidation behaviour at higher pressures and can,therefore, be used for determining the oxidation behaviour and for general selection ofcandidate coatings. The weight gain curves for P92 at atmospheric pressure are very similar tothose derived from high pressure testing (see Figures 9 and 12). A key result, however, wasthat certain silica-based coatings that performed adequately under ambient pressure steam
10
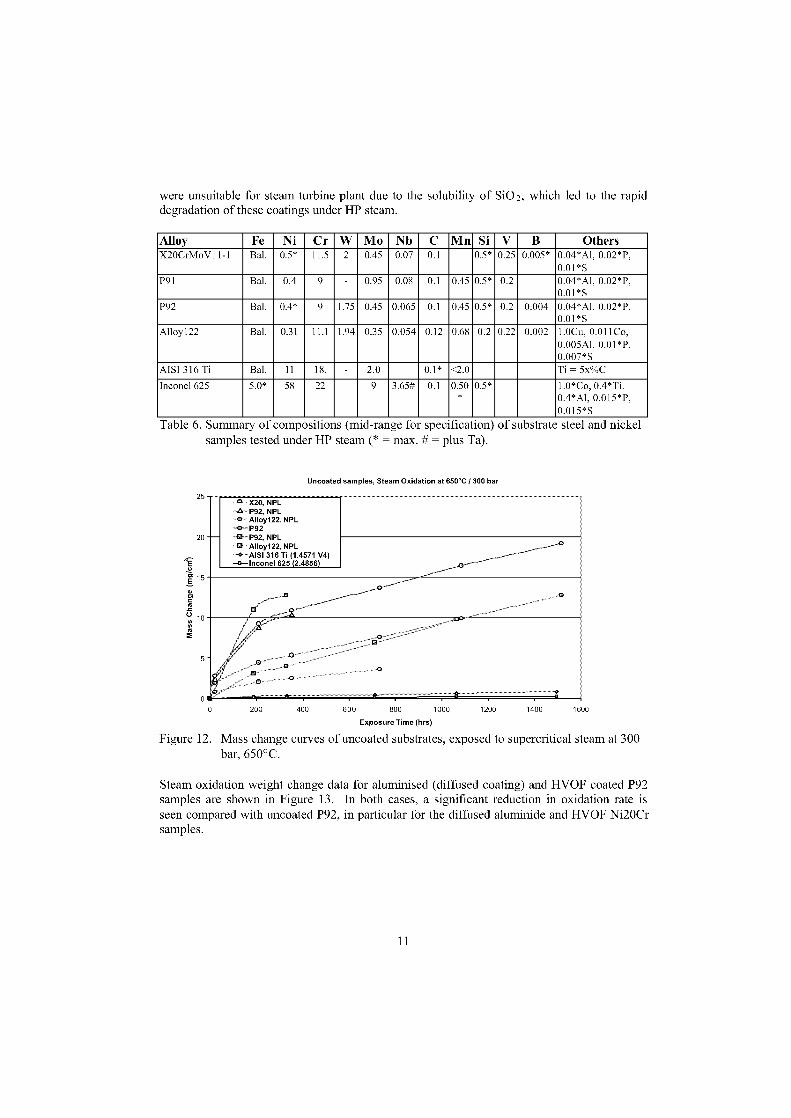
1200 1400 1600
O X20, NPL-ter- P92, NPLO Alloy122, NPL
-0---- P92-43-- P92, NPL• Alloy122, NPL
316 Ti (1.4571 V4)-n-Inconel 625 2.4856
were unsuitable for steam turbine plant due to the solubility of SiO which led to the rapiddegradation of these coatings under HP steam.
Alloy Fe Ni Cr W Mo Nb C Mn Si V B OthersX20CrMoV11-1 Bal. 0.5* 11.5 2 0.45 0.07 0.1 0.5* 0.25 0.005* 0.04*A1, 0.02*P,
0.01*SP91 Bal. 0.4 9 - 0.95 0.08 0.1 0.45 0.5* 0.2 0.04*A1, 0.02*P,
0.01*SP92 Bal. 0.4* 9 1.75 0.45 0.065 0.1 0.45 0.5* 0.2 0.004 0.04*A1, 0.02*P,
0.01*SAlloy122 Bal. 0.31 11.1 1.94 0.35 0.054 0.12 0.68 0.2 0.22 0.002 1.0Cu, 0.011Co,
0.005A1, 0.01*P,0.007*S
AISI 316 Ti Bal. 11 18. 2.0 0.1* <2.0 Ti = 5x%C
Inconel 625 5.0* 58 22 9 3.65# 0.1 0.50 0.5* 1.0*Co, 0.4*Ti.* 0.4*A1, 0.015*P,
0.015*STable 6. Summary of compositions (mid-range for specification) of Substrate steel and nickel
samples tested under HP steam (* = max. # = plus Ta).
Figure 12. Mass change curves of uncoated substrates, exposed to supercritical steam at 300bar, 650°C.
Steam oxidation weight change data for aluminised (diffused coating) and HVOF coated P92samples are shown in Figure 13. In both cases, a significant reduction in oxidation rate isseen compared with uncoated P92, in particular for the diffused aluminide and HVOF Ni20Crsamples.
11
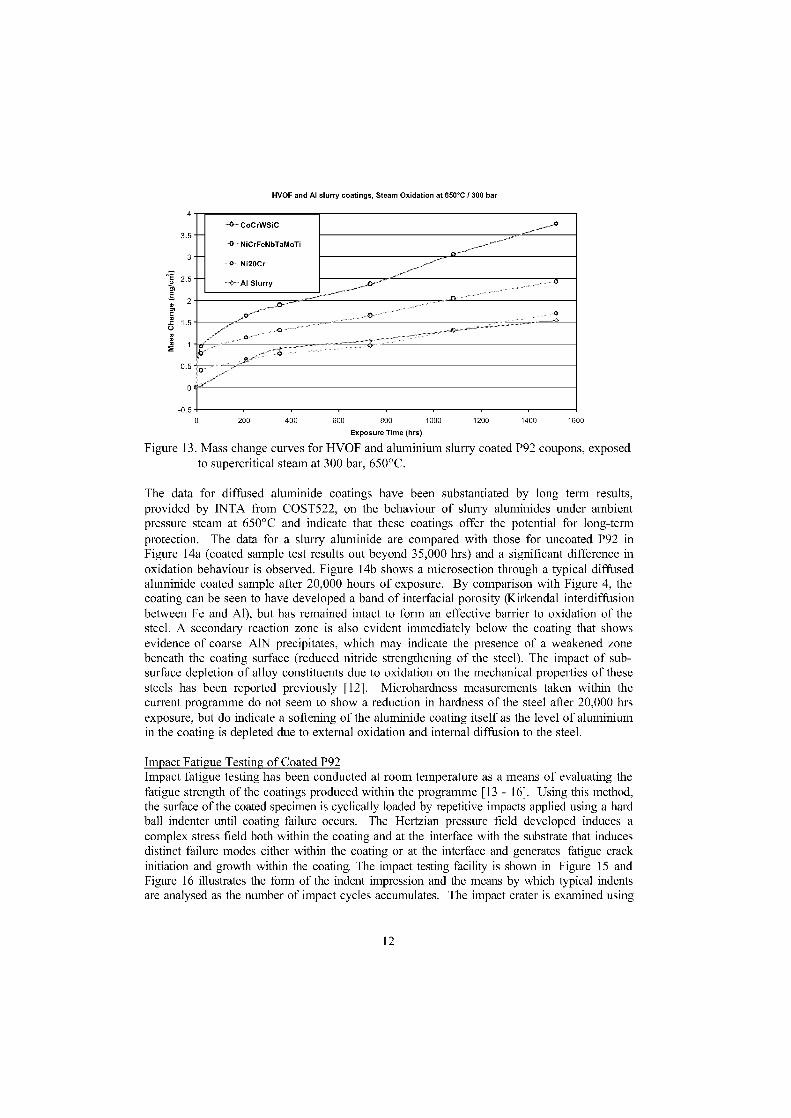
E2.5
Al Slurry
2cn
CoCrWSiC
3.50 NiCrFeNbTaMoTi
Ni20Cr
0
-0.5
HVOF and Al slurry coatings, Steam Oxidation at 650°C / 300 bar
0 200 400 600 800 1000 1200 1400 1600
Exposure Time (hrs)
Figure 13. Mass change curves for HVOF and aluminium slurry coated P92 coupons, exposedto supercritical steam at 300 bar, 650°C.
The data for diffused aluminide coatings have been substantiated by long term results,provided by INTA from COST522, on the behaviour of slurry aluminides under ambientpressure steam at 650°C and indicate that these coatings offer the potential for long-termprotection. The data for a slurry aluminide are compared with those for uncoated P92 inFigure 14a (coated sample test results out beyond 35,000 hrs) and a significant difference inoxidation behaviour is observed. Figure 14b shows a microsection through a typical diffusedaluminide coated sample after 20,000 hours of exposure. By comparison with Figure 4, thecoating can be seen to have developed a band of interfacial porosity (Kirkendal interdiffusionbetween Fe and Al), but has remained intact to form an effective barrier to oxidation of thesteel. A secondary reaction zone is also evident immediately below the coating that showsevidence of coarse A1N precipitates, which may indicate the presence of a weakened zonebeneath the coating surface (reduced nitride strengthening of the steel). The impact of sub-surface depletion of alloy constituents due to oxidation on the mechanical properties of thesesteels has been reported previously [12]. Microhardness measurements taken within thecurrent programme do not seem to show a reduction in hardness of the steel after 20,000 hrsexposure, but do indicate a softening of the aluminide coating itself as the level of aluminiumin the coating is depleted due to external oxidation and internal diffusion to the steel.
Impact Fatigue Testing of Coated P92Impact fatigue testing has been conducted at room temperature as a means of evaluating thefatigue strength of the coatings produced within the programme [13 - 16]. Using this method,the surface of the coated specimen is cyclically loaded by repetitive impacts applied using a hardball indenter until coating failure occurs. The Hertzian pressure field developed induces acomplex stress field both within the coating and at the interface with the Substrate that inducesdistinct failure modes either within the coating or at the interface and generates fatigue crackinitiation and growth within the coating. The impact testing facility is shown in Figure 15 andFigure 16 illustrates the form of the indent impression and the means by which typical indentsare analysed as the number of impact cycles accumulates. The impact crater is examined using
12
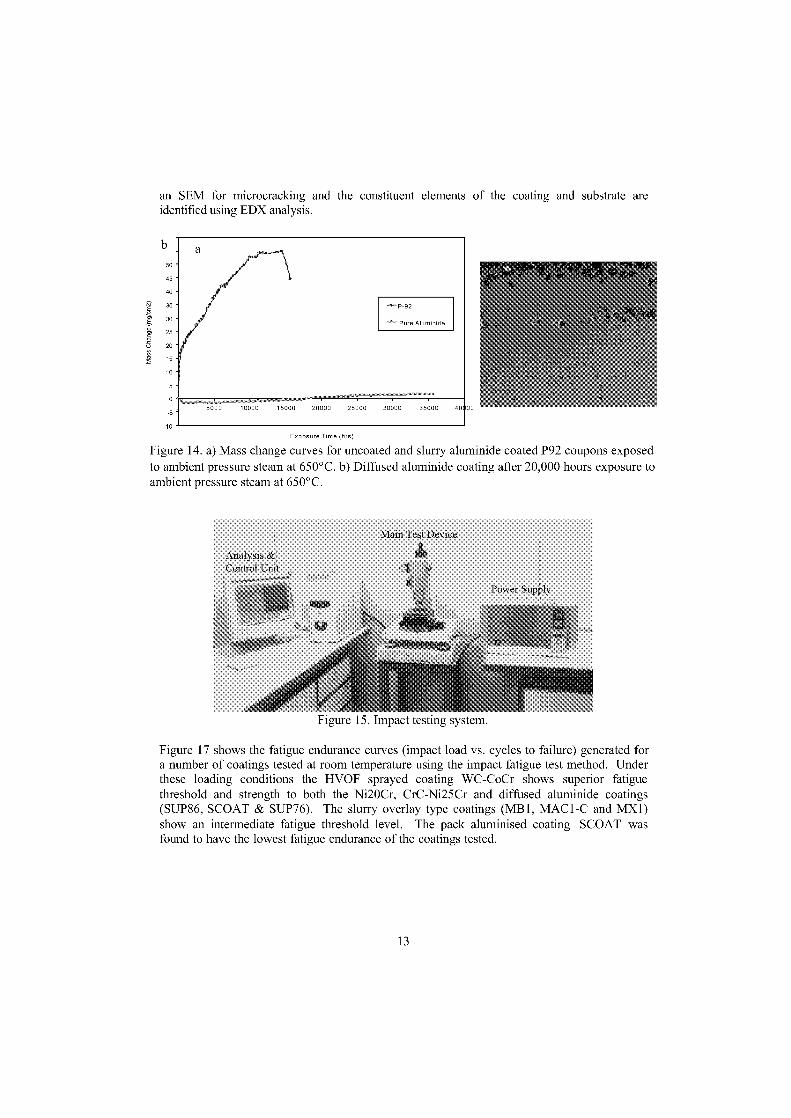
-11-1P-92
111111 Pure Aluminide
5ü 1 15000 20000 25000 30000 35000 40 00
50
45
40
Fi•35
30
25
3.) 20
510
5
-5
-10
an SEM for microcracking and the constituent elements of the coating and Substrate areidentified using EDX analysis.
Exposure Time (hrs)
Figure 14. a) Mass change curves for uncoated and slurry aluminide coated P92 coupons exposedto ambient pressure steam at 650°C. b) Diffused aluminide coating alter 20,000 hours exposure toambient pressure steam at 650°C.
Main Test Device
Figure 15. Impact testing system.
Figure 17 shows the fatigue endurance curves (impact load vs. cycles to failure) generated fora number of coatings tested at room temperature using the impact fatigue test method. Underthese loading conditions the HVOF sprayed coating WC-CoCr shows superior fatiguethreshold and strength to both the Ni20Cr, CrC-Ni25Cr and diffused aluminide coatings(SUP86, SCOAT & SUP76). The slurry overlay type coatings (MB1, MAC1-C and MX1)show an intermediate fatigue threshold level. The pack aluminised coating SCOAT wasfound to have the lowest fatigue endurance of the coatings tested.
13
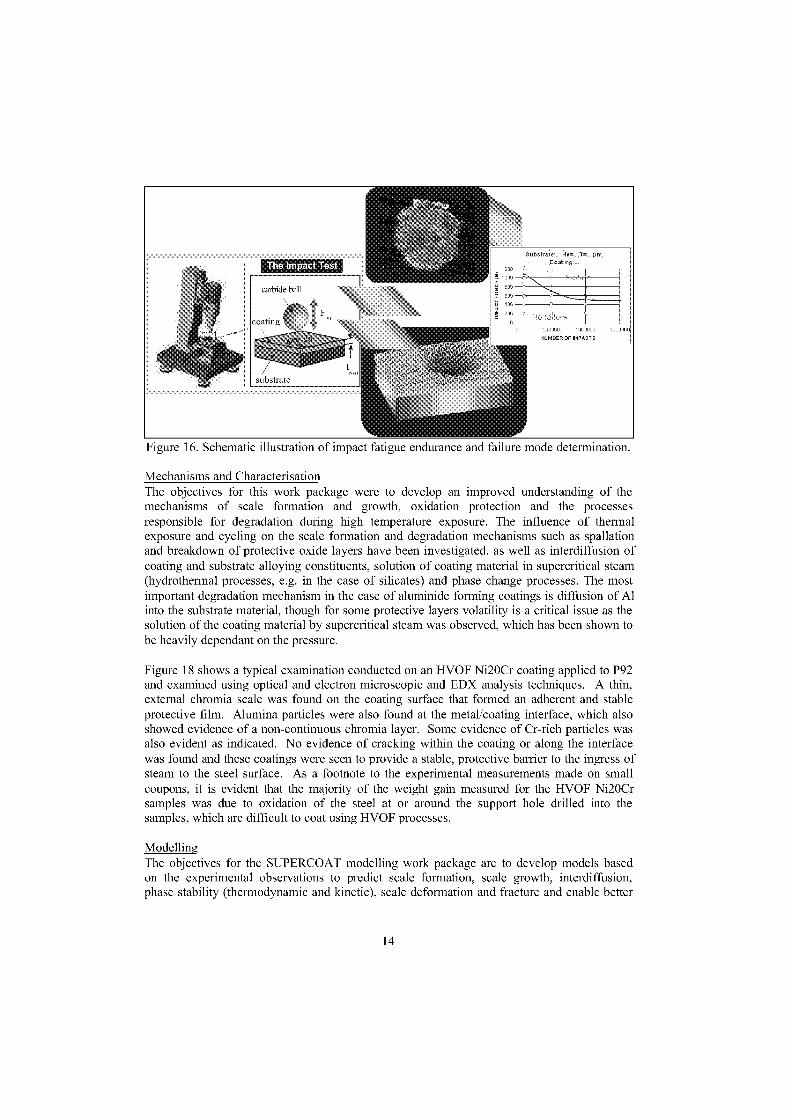
Figure 16. Schematic illustration of impact fatigue endurance and failure mode determination.
Mechanisms and CharacterisationThe objectives for this work package were to develop an improved understanding of themechanisms of scale formation and growth, oxidation protection and the processesresponsible for degradation during high temperature exposure. The influence of thermalexposure and cycling on the scale formation and degradation mechanisms such as spallationand breakdown of protective oxide layers have been investigated, as well as interdiffusion ofcoating and substrate alloying constituents, solution of coating material in supercritical steam(hydrothermal processes, e.g. in the case of Silicates) and phase change processes. The mostimportant degradation mechanism in the case of aluminide forming coatings is diffusion of Alinto the substrate material, though for some protective layers volatility is a critical issue as thesolution of the coating material by supercritical steam was observed, which has been shown tobe heavily dependant on the pressure.
Figure 18 Shows a typical examination conducted on an HVOF Ni20Cr coating applied to P92and examined using optical and electron microscopic and EDX analysis techniques. A thin,external chromia scale was found on the coating surface that formed an adherent and stableprotective film. Alumina particles were also found at the metal/coating interface, which alsoshowed evidence of a non-continuous chromia layer. Some evidence of Cr-rich particles wasalso evident as indicated. No evidence of cracking within the coating or along the interfacewas found and these coatings were Seen to provide a stable, protective barrier to the ingress ofsteam to the steel surface. As a footnote to the experimental measurements made on Smallcoupons, it is evident that the majority of the weight gain measured for the HVOF Ni20Crsamples was due to oxidation of the steel at or around the support hole drilled into thesamples, which are difficult to coat using HVOF processes.
ModellingThe objectives for the SUPERCOAT modelling work package are to develop models basedon the experimental observations to predict scale formation, scale growth, interdiffusion,phase stability (thermodynamic and kinetic), scale deformation and fracture and enable better
14
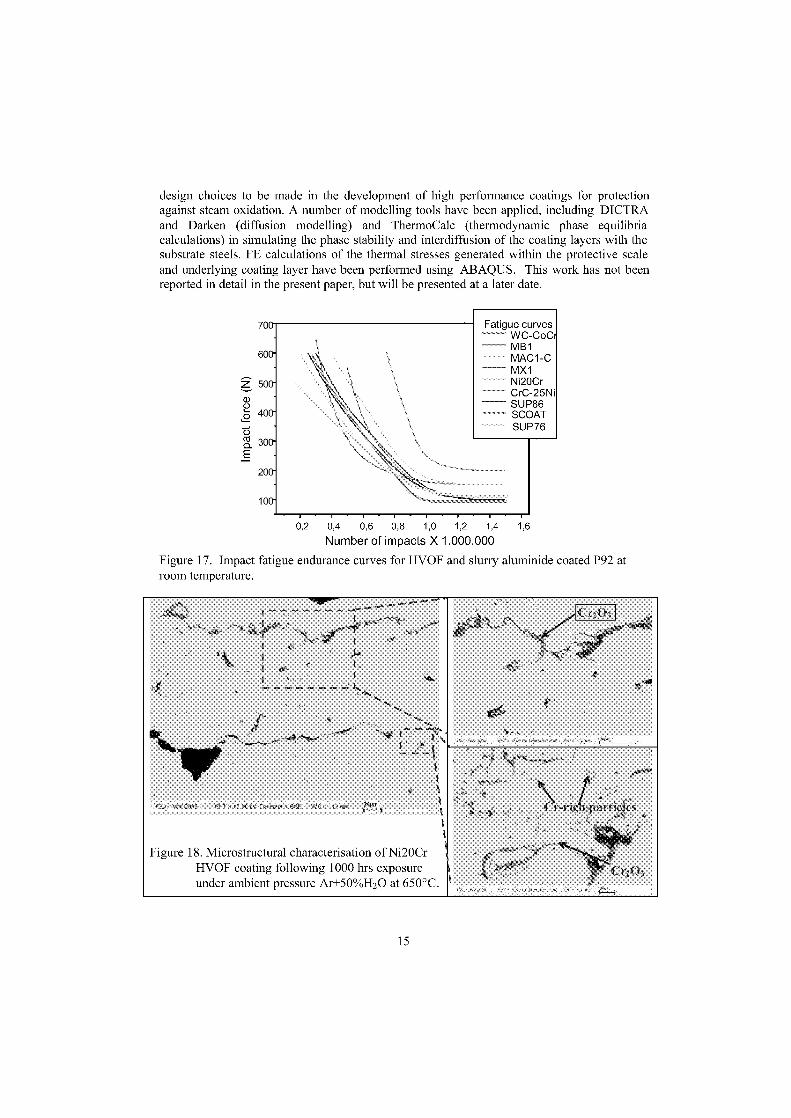
Figure 18. Microstructural characterisation of Ni20CrHVOF coating following 1000 hrs exposureunder ambient pressure Ar+50%H 20 at 650°C.
design choices to be made in the development of high performance coatings for protectionagainst steam oxidation. A number of modelling tools have been applied, including DICTRAand Darken (diffusion modelling) and ThermoCalc (thermodynamic phase equilibriacalculations) in simulating the phase stability and interdiffusion of the coating layers with thesubstrate steels. FE calculations of the thermal stressec generated within the protective scaleand underlying coating layer have been performed using ABAQUS. This work has not beenreported in detail in the present paper, but will be presented at a later date.
Fatigue curvesWC-CoCr
MAC1-C
700
600-MB1
MX1Z 500- Ni20Cr
CrC-25Ni
,(20 400-SUP86SCOATSUP76
ocu 300-_E
200-
100-
0,2 0,4 0,6 0,8 1,0 1,2 1,4 1,6
Number of impacts X 1.000.000Figure 17. Impact fatigue endurance curves for HVOF and slurry aluminide coated P92 atroom temperature.
15
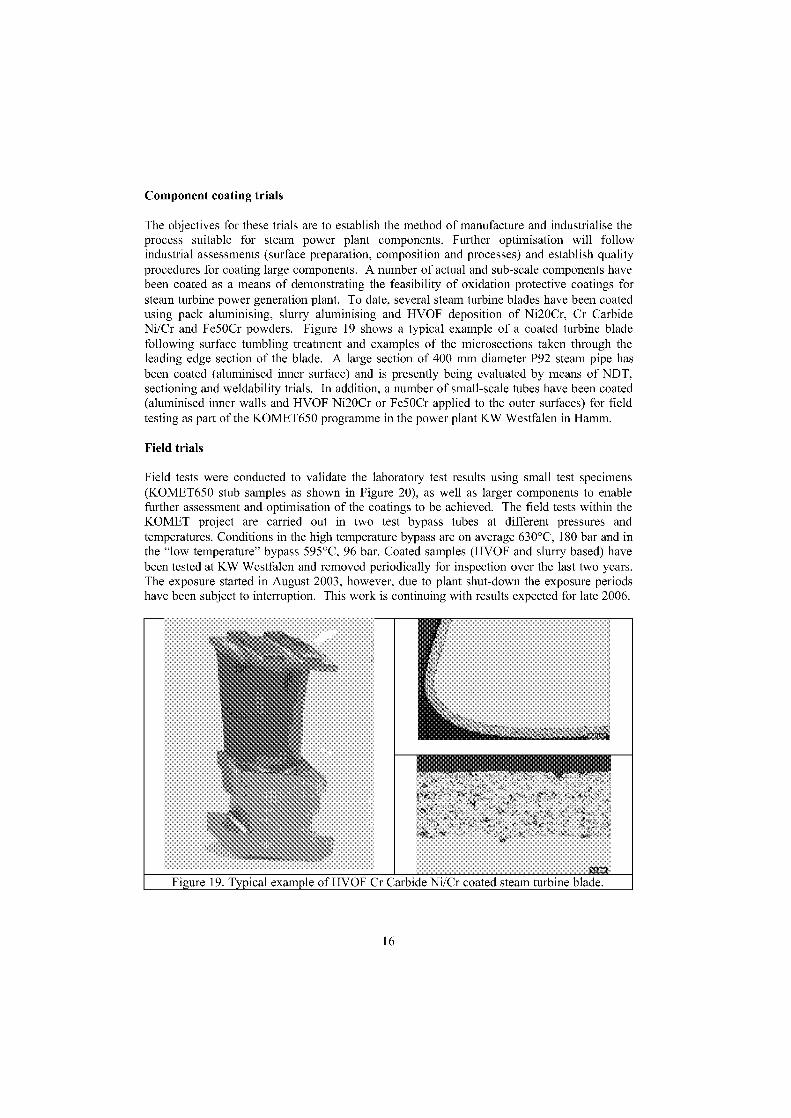
Figure 19. Typical example of HVOF Cr Carbide Ni/Cr coated steam turbine blade.
Component coating trials
The objectives for these trials are to establish the method of manufacture and industrialise theprocess suitable for steam power plant components. Further optimisation will followindustrial assessments (surface preparation, composition and processes) and establish qualityprocedures for coating large components. A number of actual and sub-scale components havebeen coated as a means of demonstrating the feasibility of oxidation protective coatings forsteam turbine power generation plant. To date, several steam turbine blades have been coatedusing pack aluminising, slurry aluminising and HVOF deposition of Ni20Cr, Cr CarbideNi/Cr and Fe50Cr powders. Figure 19 Shows a typical example of a coated turbine bladefollowing surface tumbling treatment and examples of the microsections taken through theleading edge section of the blade. A large section of 400 mm diameter P92 steam pipe hasbeen coated (aluminised inner surface) and is presently being evaluated by means of NDT,sectioning and weldability trials. In addition, a number of small-scale tubes have been coated(aluminised inner walls and HVOF Ni20Cr or Fe50Cr applied to the outer surfaces) for fieldtesting as part of the KOMET650 programme in the power plant KW Westfalen in Hamm.
Field trials
Field tests were conducted to validate the laboratory test results using small test specimens(KOMET650 stub samples as shown in Figure 20), as well as larger components to enablefurther assessment and optimisation of the coatings to be achieved. The field tests within theKOMET project are carried out in two test bypass tubes at different pressures andtemperatures. Conditions in the high temperature bypass are an average 630°C, 180 bar and inthe "low temperature" bypass 595°C, 96 bar. Coated samples (HVOF and slurry based) havebeen tested at KW Westfalen and removed periodically for inspection over the last two years.The exposure started in August 2003, however, due to plant shut-down the exposure periodshave been subject to interruption. This work is continuing with results expected for late 2006.
16
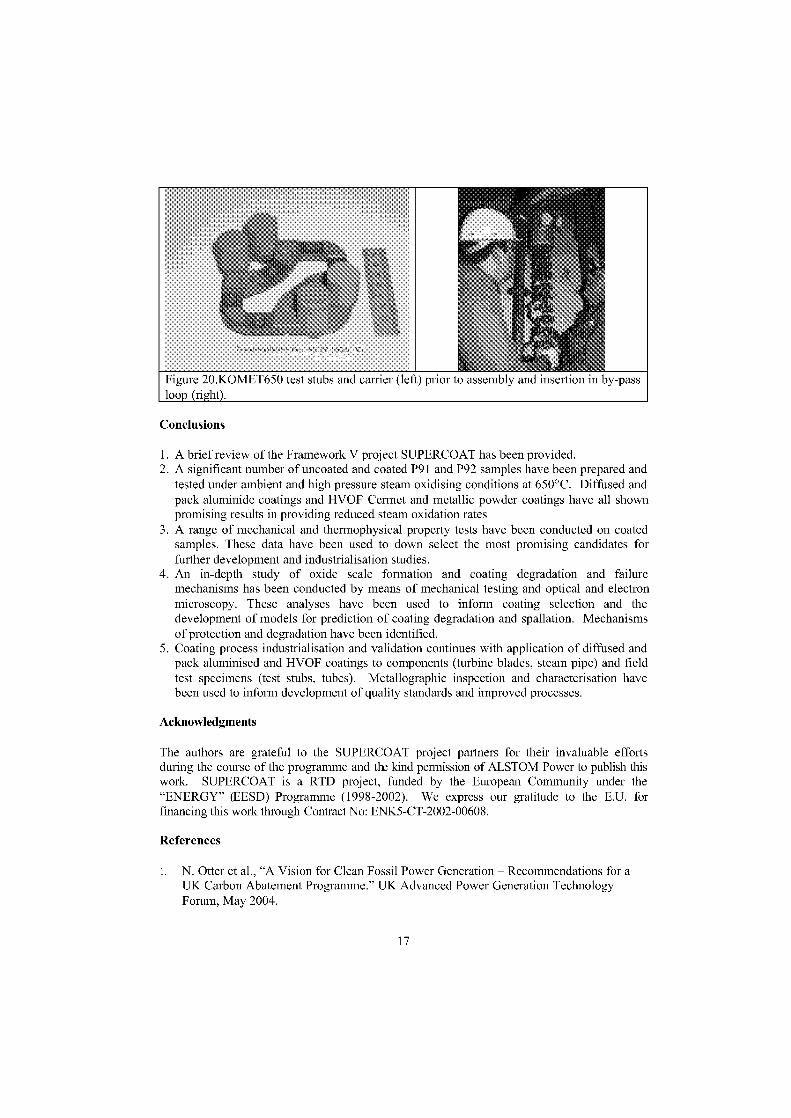
Figure 20.KOMET650 test stubs and carrier (left) prior to assembly and insertion in by-passloop (right).
Conclusions
1. A brief review of the Framework V project SUPERCOAT has been provided.2. A significant number of uncoated and coated P91 and P92 samples have been prepared and
tested under ambient and high pressure steam oxidising conditions at 650°C. Diffused andpack aluminide coatings and HVOF Cermet and metallic powder coatings have all shownpromising results in providing reduced steam oxidation rates
3. A range of mechanical and thermophysical property tests have been conducted an coatedsamples. These data have been used to down select the most promising candidates forfurther development and industrialisation studier.
4. An in-depth study of oxide scale formation and coating degradation and failuremechanisms has been conducted by means of mechanical testing and optical and electronmicroscopy. These analyses have been used to inform coating selection and thedevelopment of models for prediction of coating degradation and spallation. Mechanismsof protection and degradation have been identified.
5. Coating process industrialisation and validation continues with application of diffused andpack aluminised and HVOF coatings to components (turbine blades, steam pipe) and fieldtest specimens (test stubs, tubes). Metallographic inspection and characterisation havebeen used to inform development of quality standards and improved processes.
Acknowledgments
The authors are grateful to the SUPERCOAT project partners for their invaluable effortsduring the course of the programme and the kind permission of ALSTOM Power to publish thiswork. SUPERCOAT is a RTD project, funded by the European Community under the"ENERGY" (EESD) Programme (1998-2002). We express our gratitude to the E.U. forfinancing this work through Contract No: ENK5-CT-2002-00608.
References
1. N. Otter et al., "A Vision for Clean Fossil Power Generation – Recommendations for aUK Carbon Abatement Programme." UK Advanced Power Generation TechnologyForum, May 2004.
17
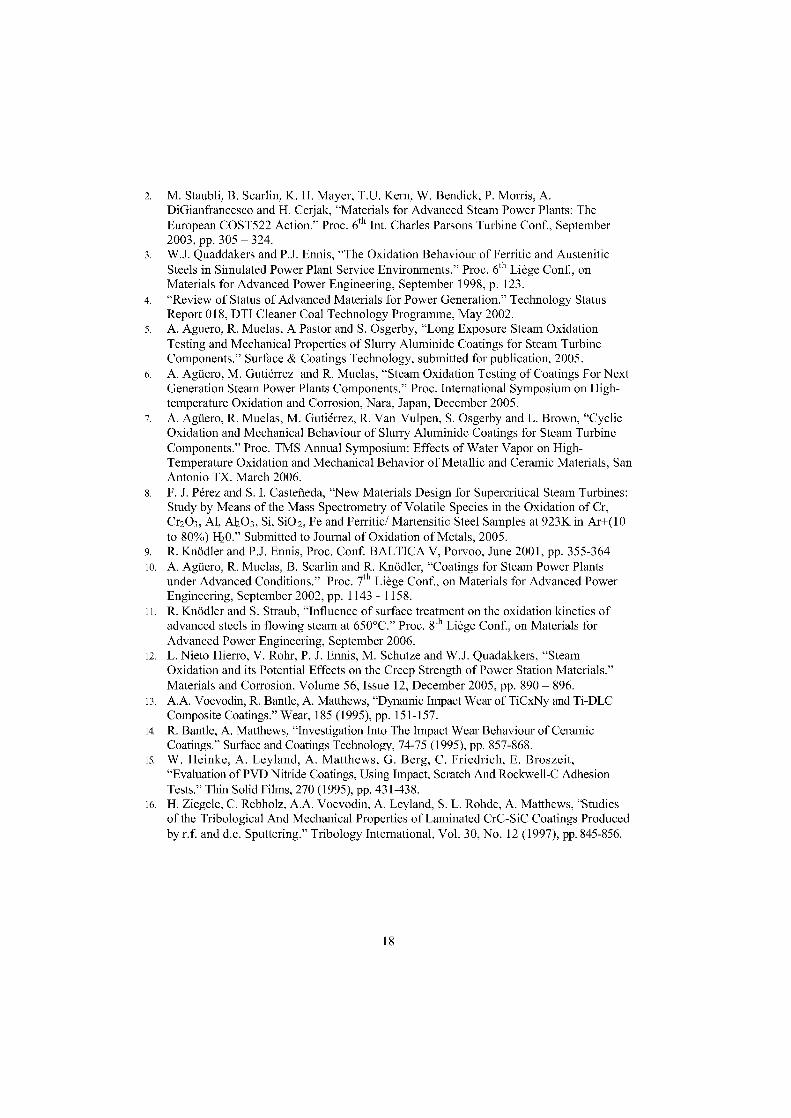
2. M. Staubli, B. Scarlin, K. H. Mayer, T.U. Kern, W. Bendick, P. Morris, A.DiGianfrancesco and H. Cerjak, "Materials for Advanced Steam Power Plants: TheEuropean COST522 Action." Proc. 6th Int. Charles Parsons Turbine Conf., September2003, pp. 305 – 324.
3. W.J. Quaddakers and P.J. Ennis, "The Oxidation Behaviour of Ferritic and AusteniticSteels in Simulated Power Plant Service Environments." Proc. 6th Liege Conf., onMaterials for Advanced Power Engineering, September 1998, p. 123.
4. "Review of Status of Advanced Materials for Power Generation." Technology StatusReport 018, DTI Cleaner Coal Technology Programme, May 2002.
5. A. Aguero, R. Muelas, A Pastor and S. Osgerby, "Long Exposure Steam OxidationTesting and Mechanical Properties of Slurry Aluminide Coatings for Steam TurbineComponents." Surface & Coatings Technology, submitted for publication, 2005.
6. A. Agüero, M. Guti&rez and R. Muelas, "Steam Oxidation Testing of Coatings For NextGeneration Steam Power Plants Components." Proc. International Symposium on High-temperature Oxidation and Corrosion, Nara, Japan, December 2005.
7. A. Agüero, R. Muelas, M. Guti&rez, R. Van Vulpen, S. Osgerby and L. Brown, "CyclicOxidation and Mechanical Behaviour of Slurry Aluminide Coatings for Steam TurbineComponents." Proc. TMS Annual Symposium: Effects of Water Vapor on High-Temperature Oxidation and Mechanical Behavior of Metallic and Ceramic Materials, SanAntonio TX. March 2006.
8. F. J. Nrez and S. I. Casterieda, "New Materials Design for Supercritical Steam Turbines:Study by Means of the Mass Spectrometry of Volatile Species in the Oxidation of Cr,Cr2 03 , Al, Al203, Si, Si0 2 , Fe and Ferritic/ Martensitic Steel Samples at 923K in Ar+(10to 80%) H0." Submitted to Journal of Oxidation of Metals, 2005.
9. R. Knödler and P.J. Ennis, Proc. Conf. BALTICA V, Porvoo, June 2001, pp. 355-36410. A. Agüero, R. Muelas, B. Scarlin and R. Knödler, "Coatings for Steam Power Plants
under Advanced Conditions." Proc. 7th Liege Conf., on Materials for Advanced PowerEngineering, September 2002, pp. 1143 - 1158.R. Knödler and S. Straub, "Influence of surface treatment on the oxidation kinetics ofadvanced steels in flowing steam at 650°C." Proc. 8th Liege Conf., on Materials forAdvanced Power Engineering, September 2006.
12. L. Nieto Hierro, V. Rohr, P. J. Ennis, M. Schutze and W.J. Quadakkers, "SteamOxidation and its Potential Effects on the Creep Strength of Power Station Materials."Materials and Corrosion, Volume 56, Issue 12, December 2005, pp. 890 – 896.
13. A.A. Voevodin, R. Bantle, A. Matthews, "Dynamic Impact Wear of TiCxNy and Ti-DLCComposite Coatings." Wear, 185 (1995), pp. 151-157.
14. R. Bantle, A. Matthews, "Investigation Into The Impact Wear Behaviour of CeramicCoatings." Surface and Coatings Technology, 74-75 (1995), pp. 857-868.
15. W. Heinke, A. Leyland, A. Matthews, G. Berg, C. Friedrich, E. Broszeit,"Evaluation of PVD Nitride Coatings, Using Impact, Scratch And Rockwell-C AdhesionTests." Thin Solid Films, 270 (1995), pp. 431-438.
16. H. Ziegele, C. Rebholz, A.A. Voevodin, A. Leyland, S. L. Rohde, A. Matthews, "Studierof the Tribological And Mechanical Properties of Laminated CrC-SiC Coatings Producedby r.f. and d.c. Sputtering." Tribology International, Vol. 30, No. 12 (1997), 845-856.
18
IMPROVEMENT OF OXIDATION RESISTANCE OF TUBES
BY PULSED SILICONISING
K. Maile, K. Berreth, A. Lyutovich
Material Testing Institute (MPA), University of Stuttgart,Pfaffenwaldring 32, D-70569 Stuttgart, Germany
ABSTRACT
Tubes for boilers of new conventional power plants with increased steam parameters (T> 600°C) show water-side oxidation. Experimental work was performed to produce and investigate siliconised inner surfaces to im-prove the oxidation resistance of tubes made of 9-11 %Cr-steels. The siliconising process of the internal surfaceof steel tube specimen represents a combination of standard heat treatment with a CVD coating technology. Thecoating process works under H2 atmosphere with pulsed chemical vapour deposition of Si from SiC1 4 precursor.The pulsed CVD mode of operation promotes dechlorination, the transition from gas to solid phase, diffusion ofSi into the inner surface of the tube and the formation of new phases as Fe-Si, Si-Cr. This new ferritic layer ex-hibits a Si content of about 5%. The number and duration of cycles influences the thickness of the Si-diffusionlayer. A layer thickness up to 200 pm has been achieved. Aging tests in steam with cycling temperatures havebeen performed. Microstructural investigations by SEM with EDS, EPMA and X-ray diffraction show that oxi-dation is reduced due to the formation of Cr-oxide and silicides at the surface. Since the new layer is a ductilecoherent part of the tube a negative influence on the workability, e.g. bending, could not be assumed. Ongoingcreep tests with siliconised specimens also demonstrate that the creep strength is within the scatterband of thebase metal.
Keywords: siliconising, steel tubes, CVD, oxidation resistance
Introduction
Ultrasupercritical boilers being considered for future high efficiency fossile fired power plantswill require the utilization of advanced steels and alloys with improved creep strength. How-ever, environmental resistance, e. internal steam oxidation will be the factor limiting theapplication of materials with decreased Cr-content. In those cases, the operating range of such9%Cr-steels can be significantly extended by use of surface modification techniques. Surfacemodification methods are under review as a way to mitigate alloy degradation and permit theuse of less expensive alloy composition.
The requirements for technical application of a surface modification technique could be sum-marized as follows:
- Sustainable increase of oxidation resistance- Low costs (no special preparationkleaning of the tubes)
No impact on environment using toxic elementsApplicability to long tubesNo negative impact on workability (e. g. welding, bending)No negative impact on creep strengthNo stripping/debonding of the coating or hard particles e. g. due to erosion, or cyclic ther-mal loading
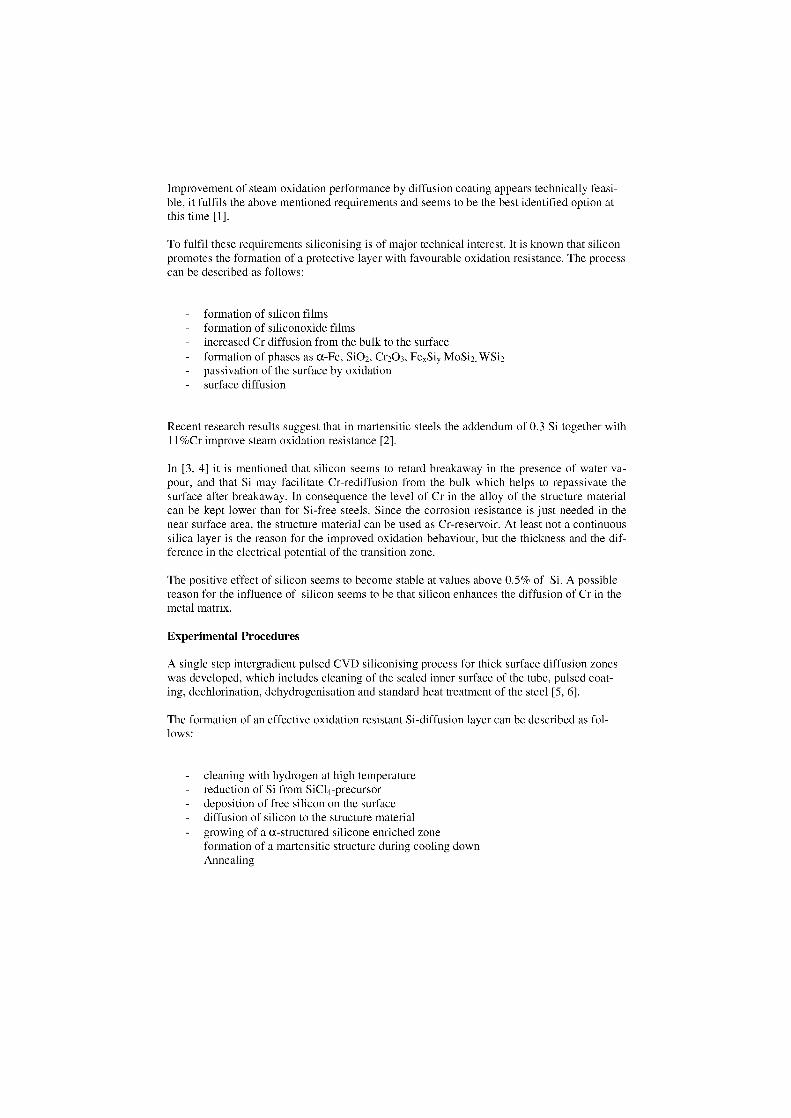
lmprovement of steam oxidation performance by diffusion coating appears technically feasi-ble, it fulfils the above mentioned requirements and seems to be the best identified option atthis time [1].
To fulfil these requirements siliconising is of major technical interest. lt is known that siliconpromoten the formation of a protective layer with favourable oxidation resistance. The processcan be described as follows:
formation of silicon filmsformation of siliconoxide filmsincreased Cr diffusion from the bulk to the surface
- formation of phases as a-Fe, Si02, Cr203 , Fe„Si, MoSi 2, WSi2passivation of the surface by oxidation
- surface diffusion
Recent research results suggest that in martensitic steels the addendum of 0.3 Si together with11%Cr improve steam oxidation resistance [2].
In [3, 4] it is mentioned that silicon seems to retard breakaway in the presence of water va-pour, and that Si may facilitate Cr-rediffusion from the bulk which helps to repassivate thesurface after breakaway. In consequence the level of Cr in the alloy of the structure materialcan be kept lower than for Si-free steels. Since the corrosion resistance is just needed in thenear surface area, the structure material can be used as Cr-reservoir. At least not a continuoussilica layer is the reason for the improved oxidation behaviour, but the thickness and the dif-ference in the electrical potential of the transition zone.
The positive effect of silicon seems to become stable at values above 0.5% of Si. A possiblereason for the influence of silicon seems to be that silicon enhances the diffusion of Cr in themetal matrix.
Experimental Procedures
A single step intergradient pulsed CVD siliconising process for thick surface diffusion zoneswas developed, which includes cleaning of the scaled inner surface of the tube, pulsed coat-ing, dechlorination, dehydrogenisation and standard heat treatment of the steel [5, 6].
The formation of an effective oxidation resistant Si-diffusion layer can be described as fol-lows:
cleaning with hydrogen at high temperaturereduction of Si from SiC14-precursor
- deposition of free silicon an the surfacediffusion of silicon to the structure materialgrowing of a a-structured silicone enriched zoneformation of a martensitic structure during cooling downAnnealing
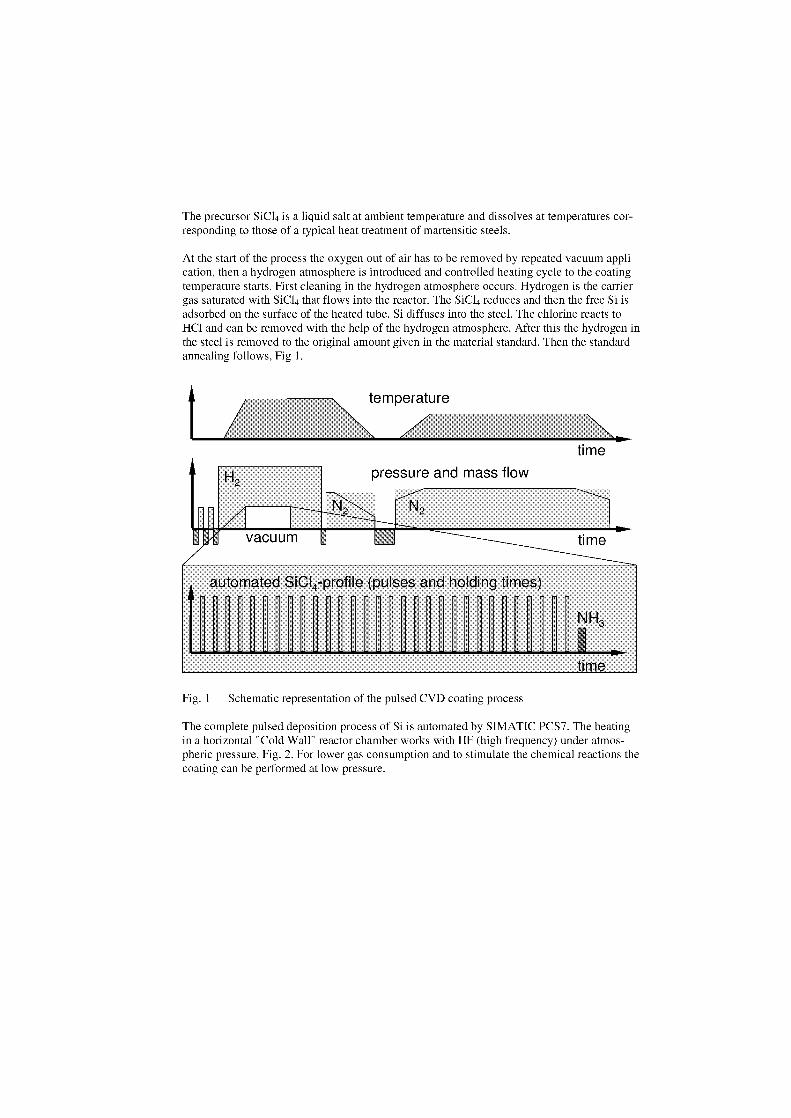
The precursor SiC1 4 is a liquid salt at ambient temperature and dissolves at temperatures cor-responding to those of a typical heat treatment of martensitic steels.
At the start of the process the oxygen out of air has to be removed by repeated vacuum appli-cation, then a hydrogen atmosphere is introduced and controlled heating cycle to the coatingtemperature starts. First cleaning in the hydrogen atmosphere occurs. Hydrogen is the carriergas saturated with SiC14 that flows into the reactor. The SiC14 reduces and then the free Si isadsorbed an the surface of the heated tube. Si diffuses into the steel. The chlorine reacts toHC1 and can be removed with the help of the hydrogen atmosphere. After this the hydrogen inthe steel is removed to the original amount given in the material standard. Then the standardannealing follows, Fig 1.
temperature
automated SiCI4-pr file (pulses an ho ding times
time
Fig. 1 Schematic representation of the pulsed CVD coating process
The complete pulsed deposition process of Si is automated by SIMATIC PCS7. The heatingin a horizontal "Cold Wall" reactor chamber works with HF (high frequency) under atmos-pheric pressure, Fig. 2. For lower gas consumption and to stimulate the chemical reactions thecoating can be performed at low pressure.
time
time
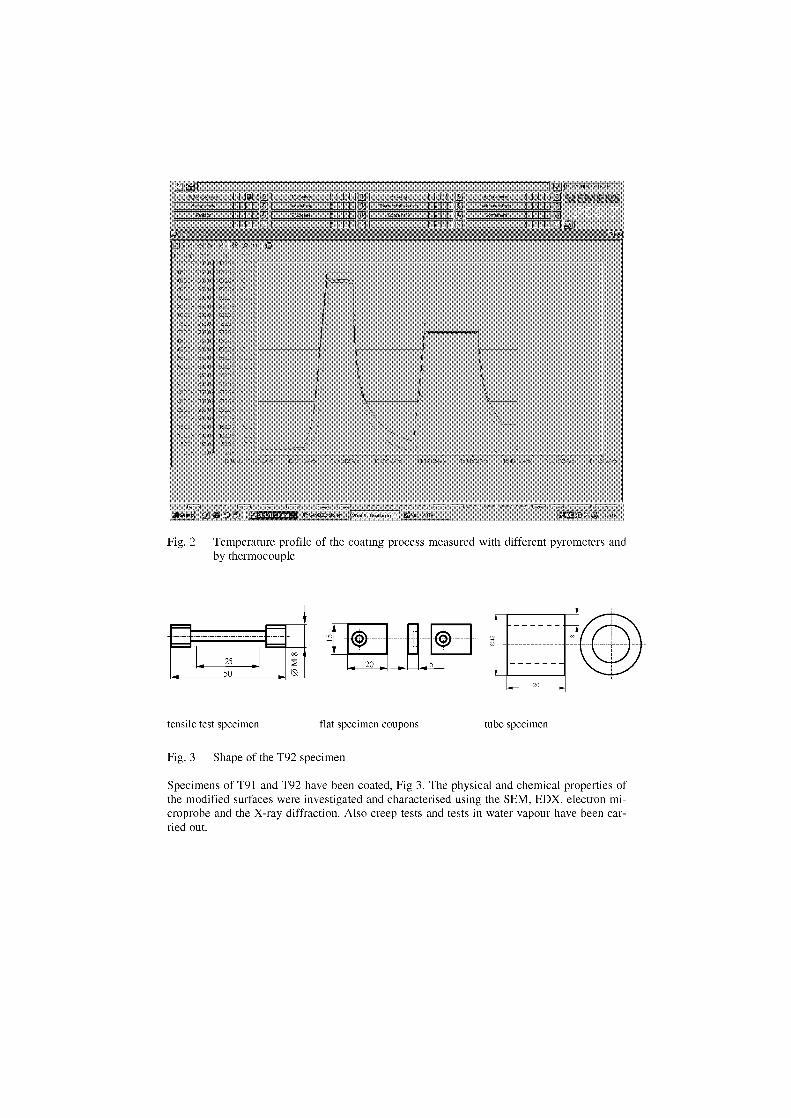
I 1 121 111 1111 1111
11111" T1T 111111111' I 1111 n 1111
I t t fiFtt
Fig. 2 Temperature profile of the coating process measured with different pyrometers andby thermocouple
11
25
SO20
tensile test specimen flat specimen coupons
Fig. 3 Shape of the T92 specimen
tube specimen
Specimens of T91 and T92 have been coated, Fig 3. The physical and chemical properties ofthe modified surfaces were investigated and characterised using the SEM, EDX, electron mi-croprobe and the X-ray diffraction. Also creep tests and tests in water vapour have been car-ried out.
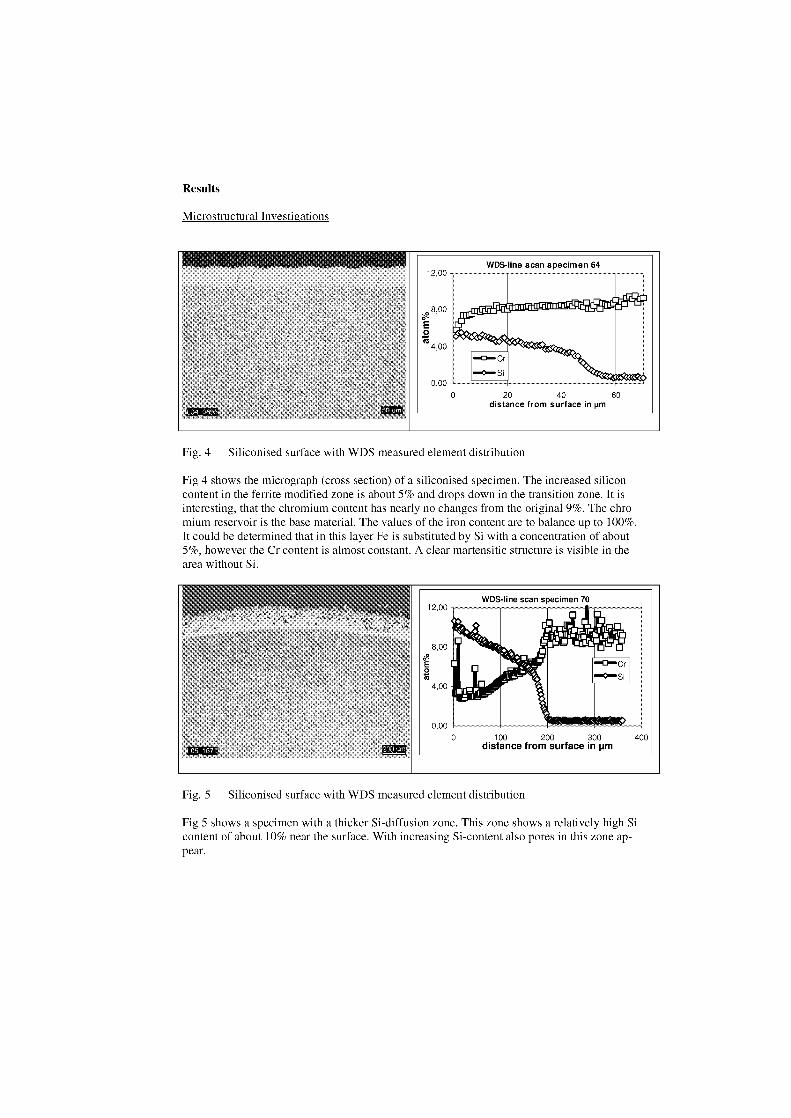
WDS-line scan specimen 64
20 40 60distance from surface in pm
WDS-line scan specimen 70
0 100 200 300
400distance from surface in um
12,00
8,00
E0
4,00
0,00
Results
Microstructural Investigations
Fig. 4 Siliconised surface with WDS measured element distribution
Fig 4 shows the micrograph (cross section) of a siliconised specimen. The increased siliconcontent in the ferrite modified zone is about 5% and drops down in the transition zone. It isinteresting, that the chromium content has nearly no changes from the original 9%. The chro-mium reservoir is the bare material. The values of the fron content are to balance up to 100%.lt could be determined that in this layer Fe is substituted by Si with a concentration of about5%, however the Cr content is almost constant. A clear martensitic structure is visible in thearea without Si.
Fig. 5 Siliconised surface with WDS measured element distribution
Fig 5 shows a specimen with a thicker Si-diffusion zone. This zone shows a relatively high Sicontent of about 10% near the surface. With increasing Si-content also pores in this zone ap-pear.
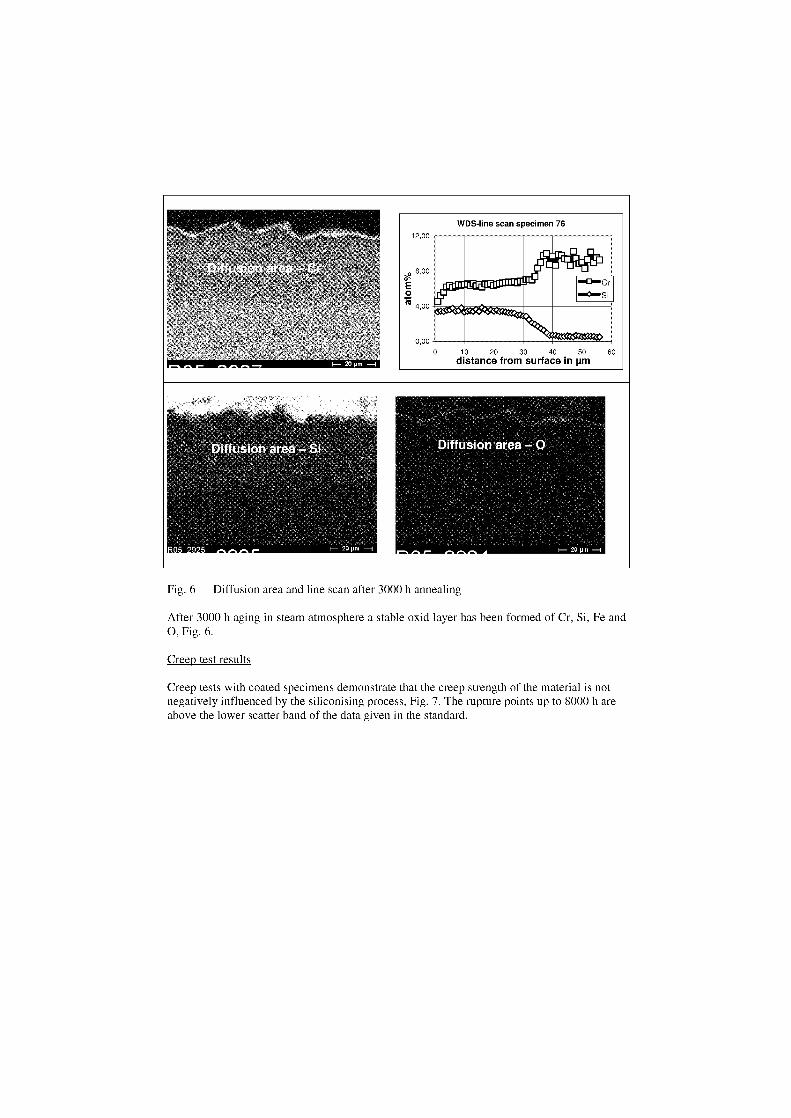
12,00
0,00
IIII 1.3121:313r.111.111"911:■141111Wird11111 lllll jl_
MIEN7;<■•4t7;•■••;•47Zere..
Ilike,<«,.«<eb•
Fig. 6 Diffusion area and line scan after 3000 h annealing
After 3000 h aging in steam atmosphere a stable oxid layer has been formed of Cr, Si, Fe and0, Fig. 6.
Creep test results
Creep tests with coated specimens demonstrate that the creep strength of the material is notnegatively intluenced by the siliconising process, Fig. 7. The rupture points up to 8000 h areabove the lower scatter band of the data given in the standard.
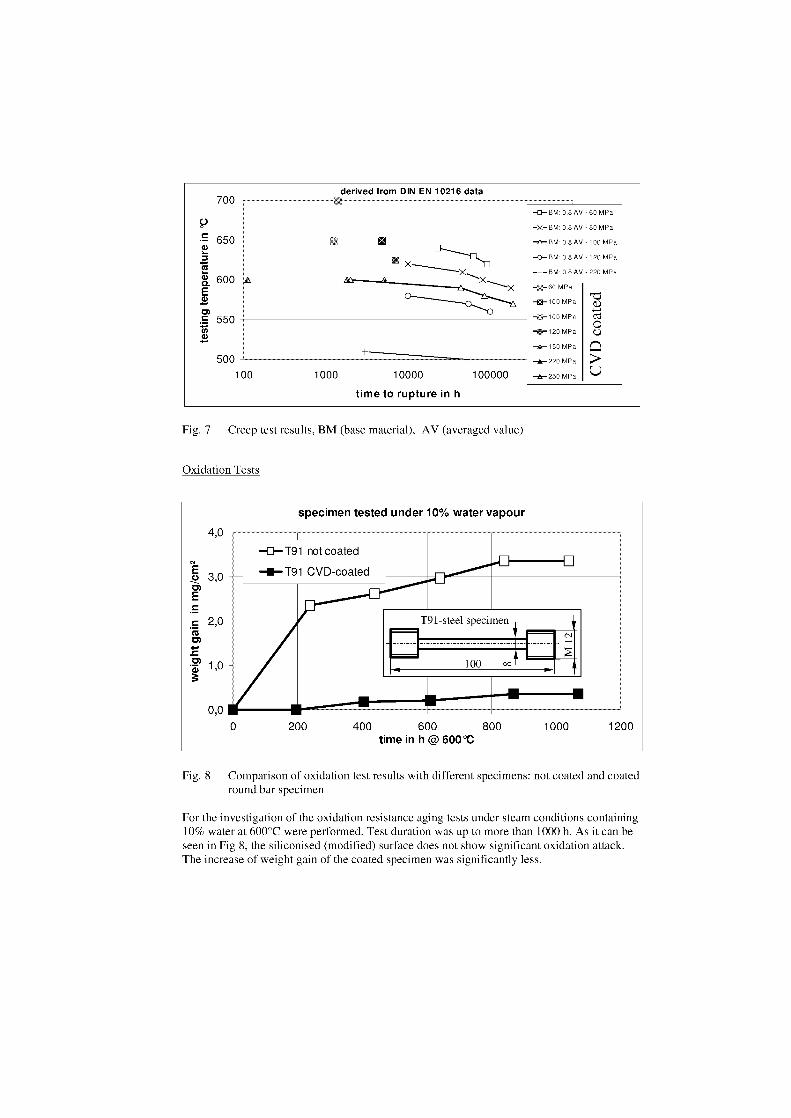
700
500100
1000
–0– BM:0.8 AV -60 MPa
–X– BM: 0.8 AV -80 MPa
–,A– BM: 0.8 AV - 100 MPa
–0–BM:0.8 AV - 120 MPa
–+– BM: 0.8 AV -220 MPa
–5-60 MPa
MPa
MPa
20 MPa
–A-150 MPa
–A-220 MPa
–A-250 MPa
specimen tested under 10% water vapour
time to rupture in h
Fig. 7 Creep test results, BM (base material), AV (averaged value)
Oxidation Tests
Fig. 8 Comparison of oxidation test results with different specimens: not coated and coatedround bar specimen
For the investigation of the oxidation resistance aging tests under steam conditions containing10% water at 600°C were performed. Test duration was up to more than 1000 h. As it can beSeen in Fig 8, the siliconised (modified) surface does not show significant oxidation attack.The increase of weight gain of the coated specimen was significantly less.
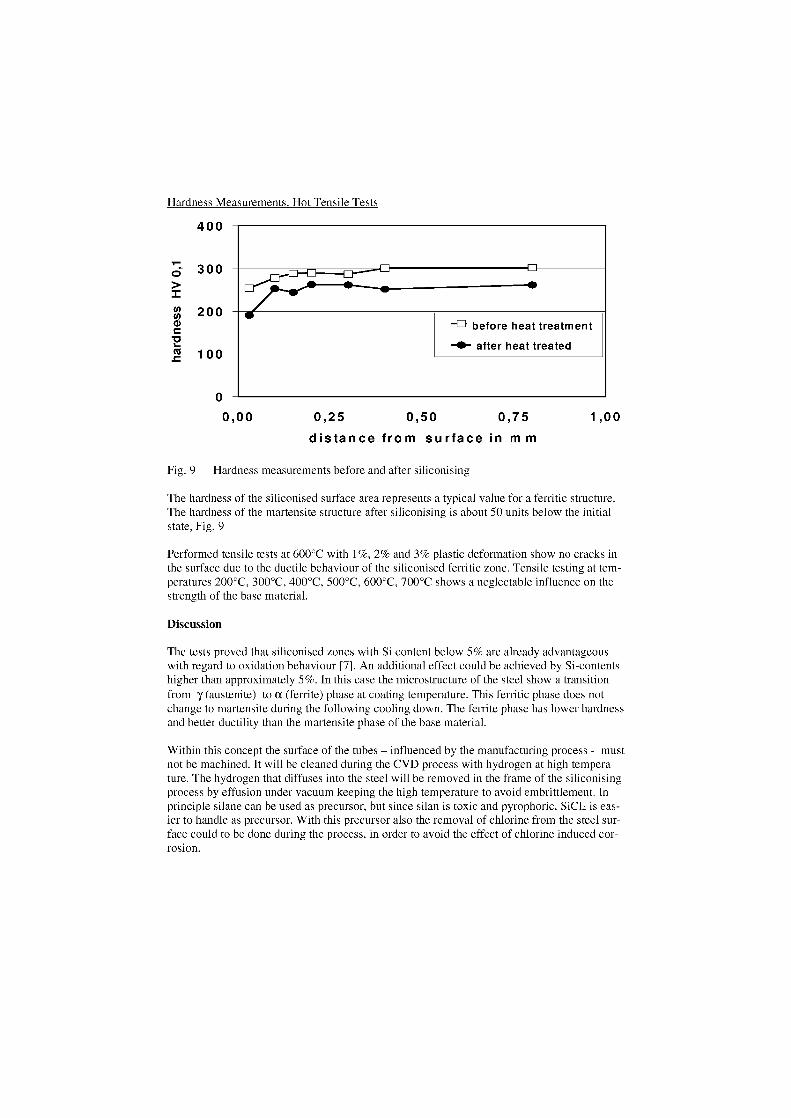
400
300
200
100
before heat treatment
after heat treated
0
0,00 1 ,000,50 0,750,25
Hardness Measurements, Hot Tensile Tests
distance from surface in m m
Fig. 9 Hardness measurements before and after siliconising
The hardness of the siliconised surface area represents a typical value for a ferritic structure.The hardness of the martensite structure after siliconising is about 50 units below the initialstate, Fig. 9
Performed tensile tests at 600°C with 1%, 2% and 3% plastic deformation show no cracks inthe surface due to the ductile behaviour of the siliconised ferritic zone. Tensile testing at tem-peratures 200°C, 300°C, 400°C, 500°C, 600°C, 700°C shows a neglectable influence an thestrength of the base material.
Discussion
The tests proved that siliconised zones with Si content below 5% are already advantageouswith regard to oxidation behaviour [7]. An additional effect could be achieved by Si-contentshigher than approximately 5%. In this case the microstructure of the steel show a transitionfrom y (austenite) to a (ferrite) phase at coating temperature. This ferritic phase does notchange to martensite during the following cooling down. The ferrite phase has lower hardnessand better ductility than the martensite phase of the base material.
Within this concept the surface of the tubes – influenced by the manufacturing process - mustnot be machined. lt will be cleaned during the CVD process with hydrogen at high tempera-ture. The hydrogen that diffuses into the steel will be removed in the frame of the siliconisingprocess by effusion under vacuum keeping the high temperature to avoid embrittlement. Inprinciple silane can be used as precursor, but since silan is toxic and pyrophoric, SiC1 4 is eas-ier to handle as precursor. With this precursor also the removal of chlorine from the steel sur-face could to be done during the process, in order to avoid the effect of chlorine induced cor-rosion.
The surface modifying siliconising process is at least not a coating process with an additionallayer. The strength of the tube materials is not influenced by changing the optimised micro-structure of the steel, since the Si-diffusion takes place as a continuous intergradient processwithin the limits of the standard heat treatment. The temperatures applied during the coatingprocess therefore are in accordance with the given limits of the respective specific steel alloy.In addition the fabricability is not influenced, as the coating is ductile. No problems withbending and welding of long tubes arise. There is no risk that hard particles spalled fromcoated surfaces may cause damage as blockage or erosion.
Conclusion
A surface modifying CVD coating technology, considering the specific requirements of heattreatment as a single continuous intergradient process has been successfully developed. Bymeans of this technology Si diffusion occurs in a limited zone at the inner surface of tubes.
The thickness of the transformed zone is about 50 gm after 20 minutes of pulsed siliconising.
Experimental investigations modifying the inner surface of tubes of 9%Cr steel via pulsedCVD with silicon containing precursors have been performed to provide improved protectionagainst high temperature oxidation in steam atmosphere.
The diffusion layer consists in a ductile ferritic structure coherent to the original martensiticstructure. Fe atoms were substituted by Si with a maximum concentration of approximately5% Si. No negative impacts on the fabricability of the tubes (bending, welding) could bestated. The strength and creep behaviour of the substrate was not influenced, but oxidationbehaviour was improved.
Increased Si content of more than 10% and thicker layers of more than 50 larn could beachieved by optimisation of the pulsing process.
Acknowledgment
The authors performed their work at MPA University of Stuttgart with support from AVIF(project A176) that is gratefully acknowledged here. Thanks are also extended to the GermanCOST 536 partners and to the German Government for the financial support of the investiga-tions (Project 1501 285).
References
[1] S. Goodstine, J. Nava: Use of Surface Modification for Alloys for Supercritical Coal-Fired Boilers. EPRI/DOE Fourth International Conference on Advances in MaterialsTechnology for Fossil Power Plants, October 26 –28, 2004 Hilton Oceanfront Resort –Hilton Head Island, South Carolina
[2] Phil. J. Ennis and W. J. Quadakkers: The Steam Oxidation Resistance of 9-12% Chro-mium Steels; IWV2, Research Centre Juelich (FZJ); Proceedings of the 7 th Liege Con-ference PART II, Liege, 2002, pp 1131- 1142

[3] V. Rohr, A. Donchev, M. Schütze: Diffusion coatings for the high temperature corro-sion protection of 9 – 12% Cr steels, Proc. EUROCORR 2004 Nice, 2004 (CD-ROM),paper no. 237
[4] T. Weber, M. Schütze: Kodiffusionsschichten aus Aluminium, Silizium und Titan zurVerbesserung der Hochtemperatur-Korrosionsbeständigkeit von Apparatebauwerkstof-fe, Werkstoffe und werkstofftechnischen Anwendungen (TU Chemnitz) 18 (2004) 181–] 86
[5] Berreth, K.; Lyutovich, A.; Maile, K.:Deutsches Patent 10 2004 053 502.7: „Verfahren zur Beschichtung von Innenoberflä-chen langer Rohre", Priorität 27.10.2004.
[6] Berreth, K.; Lyutovich, A.; Maile, K.:Europäische Patentanmeldung und PCT, PCT/EP 2005/011399: „Verfahren zum Korro-sionsschutz von Bauteilen aus warmfestem Stahl"
[7] W. Quadakkers; Dampfoxidation von Chromstählen; Beitrag GfKORR-Arbeitskreis,09.11.05
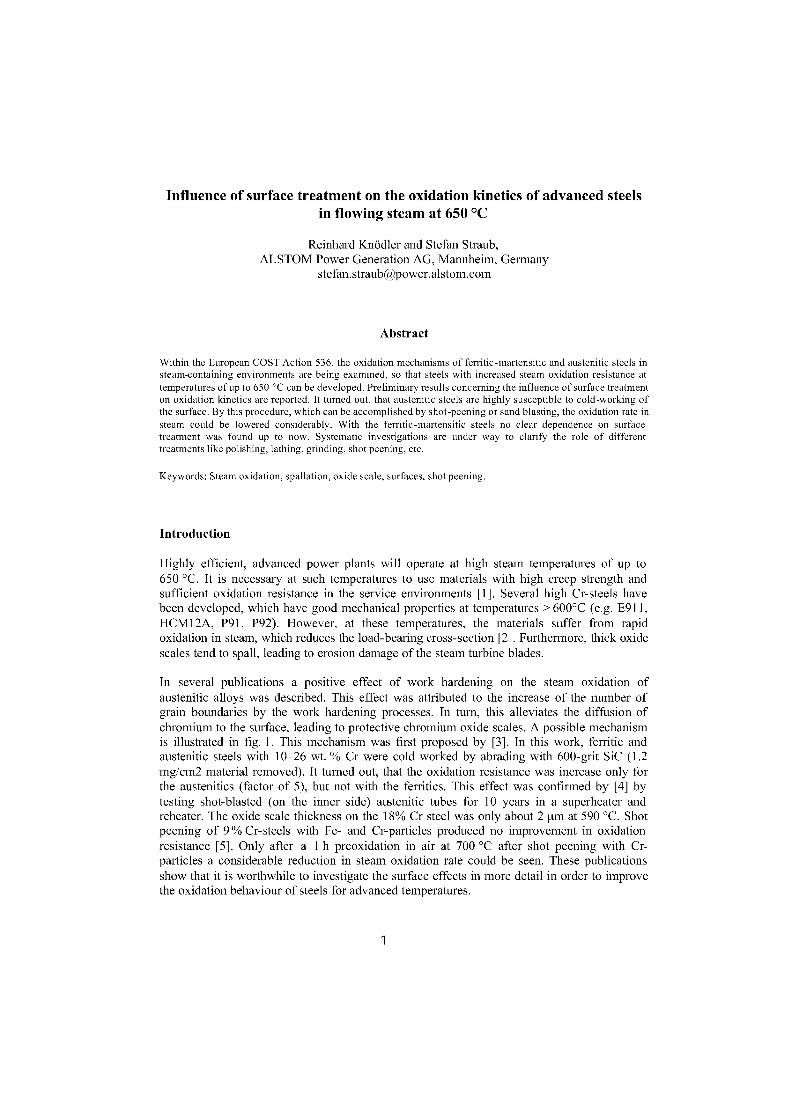
Influence of surface treatment on the oxidation kinetics of advanced steelsin flowing steam at 650 °C
Reinhard Knödler and Stefan Straub,ALSTOM Power Generation AG, Mannheim, Germany
stefan. straub @power alstom. com
Abstract
Within the European COST Action 536, the oxidation mechanisms of ferritic-martensitic and austenitic steels insteam-containing environments are being examined, so that steels with increased steam oxidation resistance attemperatures of up to 650 °C can be developed. Preliminary results concerning the influence of surface treatmenton oxidation kinetics are reported. It turned out, that austenitic steels are highly susceptible to cold-working ofthe surface. By this procedure, which can be accomplished by shot-peening or sand blasting, the oxidation rate insteam could be lowered considerably. With the ferritic-martensitic steels no clear dependence on surfacetreatment was found up to now. Systematic investigations are under way to clarify the role of differenttreatments like polishing, lathing, grinding, shot peening, etc.
Keywords: Steam oxidation, spallation, oxide scale, surfaces, shot peening.
Introduction
Highly efficient, advanced power plants will operate at high steam temperatures of up to650 °C. It is necessary at such temperatures to use materials with high creep strength andsufficient oxidation resistance in the service environments [1]. Several high Cr-steels havebeen developed, which have good mechanical properties at temperatures > 600°C (e.g. E911,HCM12A, P91, P92). However, at these temperatures, the materials Buffer from rapidoxidation in steam, which reduces the load-bearing Cross-section [2]. Furthermore, thick oxidescales tend to spall, leading to erosion damage of the steam turbine blades.
In several publications a positive effect of work hardening on the steam oxidation ofaustenitic alloys was described. This effect was attributed to the increase of the number ofgrain boundaries by the work hardening processes. In turn, this alleviates the diffusion ofchromium to the surface, leading to protective chromium oxide scales. A possible mechanismis illustrated in fig. 1. This mechanism was first proposed by [3]. In this work, ferritic andaustenitic steels with 10-26 wt. % Cr were cold worked by abrading with 600-grit SiC (1.2mg/cm2 material removed). It turned out, that the oxidation resistance was increase only forthe austenitics (factor of 5), but not with the ferritics. This effect was confirmed by [4] bytesting shot-blasted (on the inner side) austenitic tubes for 10 years in a superheater andreheater. The oxide scale thickness on the 18% Cr steel was only about 2 tm at 590 °C. Shotpeening of 9 % Cr-steels with Fe- and Cr-particles produced no improvement in oxidationresistance [5]. Only after a 1 h preoxidation in air at 700 °C after shot peening with Cr-particles a considerable reduction in steam oxidation rate could be seen. These publicationsshow that it is worthwhile to investigate the surface effects in more detail in order to improvethe oxidation behaviour of steels for advanced temperatures.
1
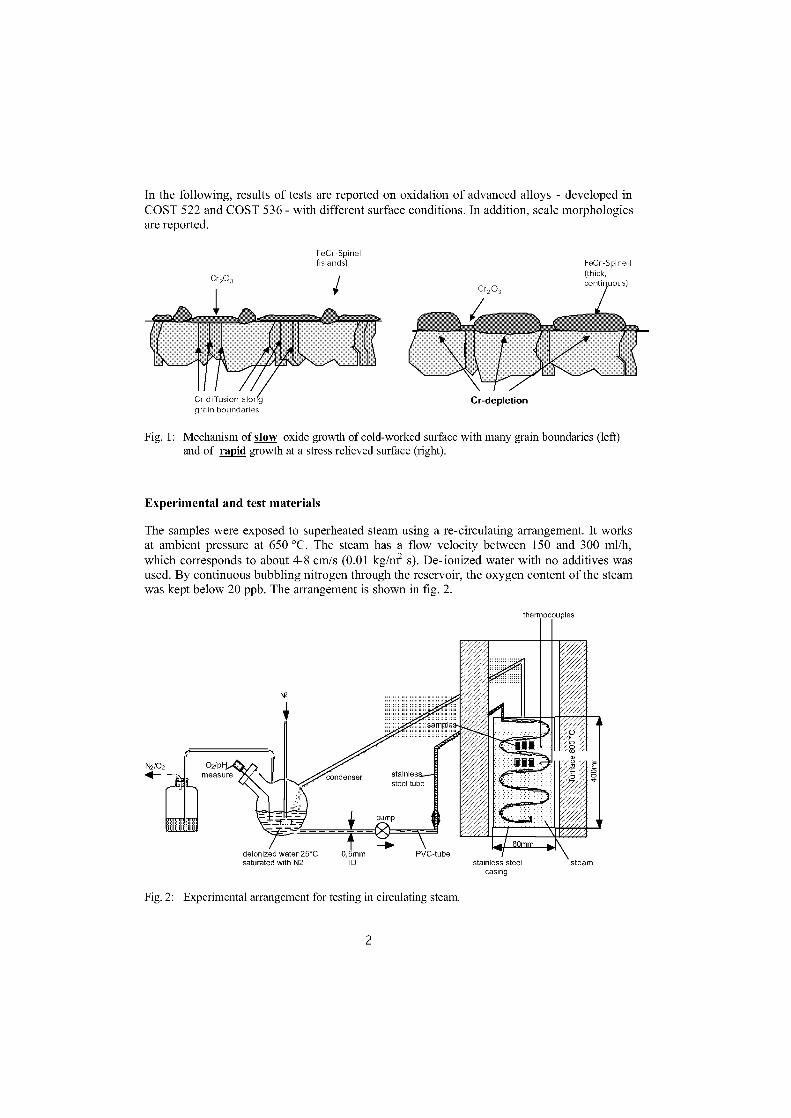
Cr203
FeCr-Spinell(thick,continuous)
FeCr-Spinell(islands)
1
steam
In the following, results of tests are reported an oxidation of advanced alloys - developed inCOST 522 and COST 536 - with different surface conditions. In addition, scale morphologiesare reported.
Fig. 1: Mechanism of slow oxide growth of cold-worked surface with many grain boundaries (left)and of rapid growth at a stress relieved surface (right).
Experimental and test materials
The Samples were exposed to superheated steam using a re-circulating arrangement. It worksat ambient pressure at 650 °C. The steam has a flow velocity between 150 and 300 ml/h,which corresponds to about 48 cm/s (0.01 kg/m2 s). De- ionized water with no additives wasused. By continuous bubbling nitrogen through the reservoir, the oxygen content of the steamwas kept below 20 ppb. The arrangement is shown in fig. 2.
thermocouples
Fig. 2: Experimental arrangement for testing in circulating steam.
2
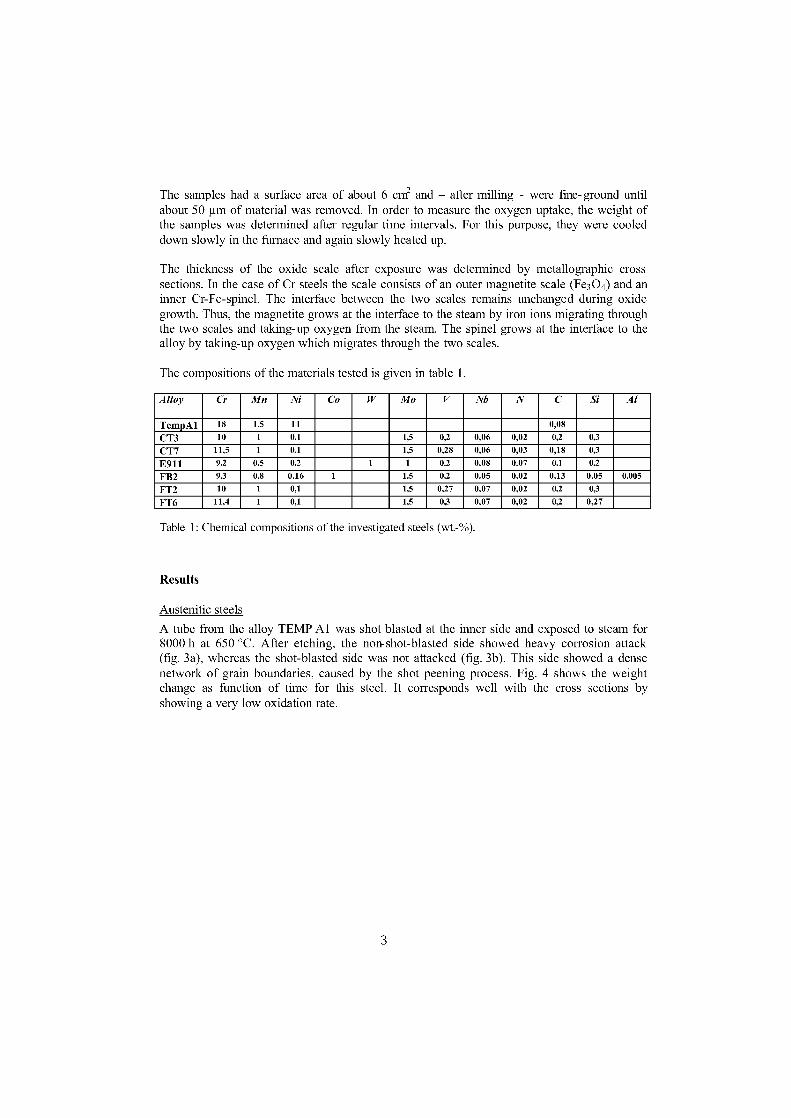
The samples had a surface area of about 6 cm2 and — after milling - were fme-ground untilabout 50 iam of material was removed. In order to measure the oxygen uptake, the weight ofthe samples was determined after regular time intervals. For this purpose, they were cooleddown slowly in the furnace and again slowly heated up.
The thickness of the oxide scale after exposure was determined by metallographic crosssections. In the case of Cr steels the scale consists of an outer magnetite scale (Fe 3 04) and aninner Cr-Fe-spinel. The interface between the two scales remains unchanged during oxidegrowth. Thus, the magnetite grows at the interface to the steam by iron ions migrating throughthe two scales and taking- up oxygen from the steam. The spinel grows at the interface to thealloy by taking-up oxygen which migrates through the two scales.
The compositions of the materials tested is given in table 1.
Alloy Cr Mn Ni Co W Mo V M N C Si Al
TempAl 18 1.5 11 0,08
CT3 10 1 0,1 1,5 0,2 0,06 0,02 0,2 0,3
CT7 11,5 1 0,1 1,5 0,28 0,06 0,03 0,18 0,3
E911 9.2 0.5 0.2 1 1 0.2 0.08 0.07 0.1 0.2
FB2 9.3 0.8 0.16 1 1.5 0.2 0.05 0.02 0.13 0.05 0.005
FT2 10 1 0,1 1,5 0,27 0,07 0,02 0,2 0,3
FT6 11,4 1 0,1 1,5 0,3 0,07 0,02 0,2 0,27
Table 1: Chemical compositions of the investigated steels (wt.-%).
Results
Austenitic steels
A tube from the alloy TEMP Al was shot blasted at the inner side and exposed to steam for8000 h at 650 °C. After etching, the non-shot-blasted side showed heavy corrosion attack(fig. 3a), whereas the shot-blasted side was not attacked (fig. 3b). This side showed a densenetwork of grain boundaries, caused by the shot peening process. Fig. 4 Shows the weightchange as function of time for this steel. It corresponds well with the cross sections byshowing a very low oxidation rate.
3
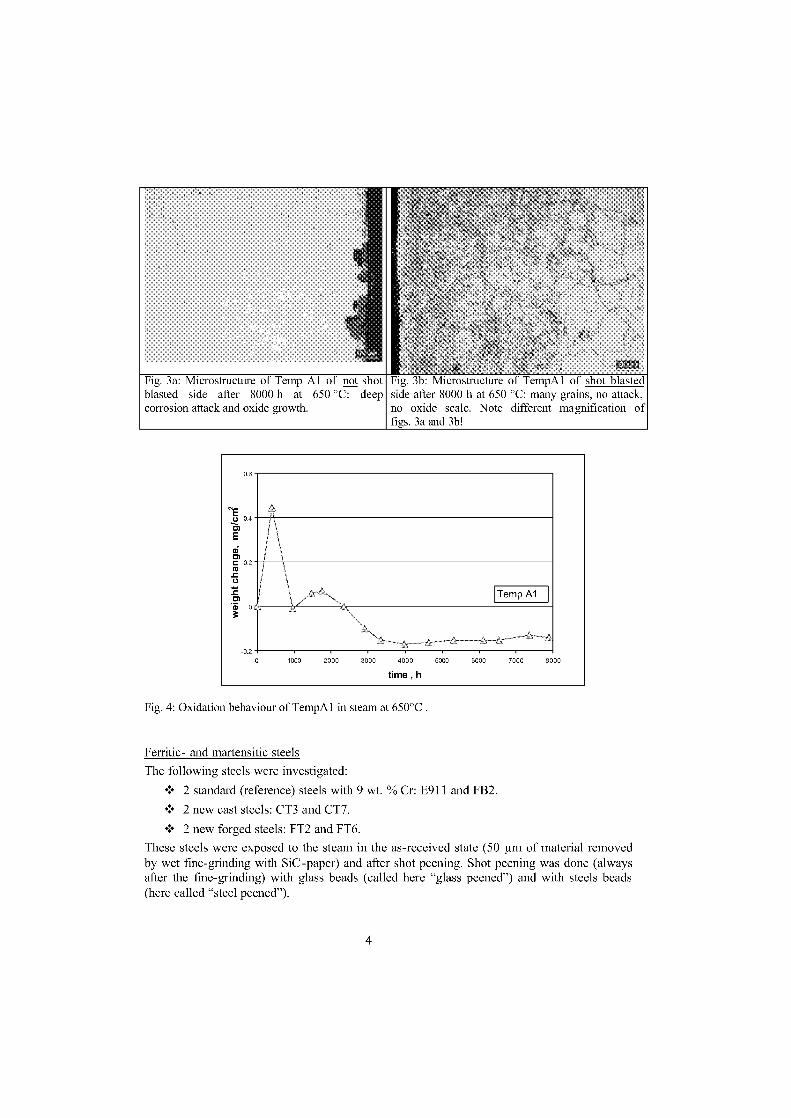
Fig. 3a: Microstructure of Temp Al of not shotblasted side after 8000 h at 650 °C: deepcorrosion attack and oxide growth.
Fig. 3b: Microstructure °I 1 empAl of shot blastedside after 8000 h at 650 °C: many grains, no attack,no oxide scale. Note different magnification offigs. 3a and 3b!
0.6
o 0.4
toEci0)C 0.2to.c
tcm_
Temp Alo o3
ä A.
-02
0 1000 2000 3000 4000
time,h
5000 6000 7000 8000
Fig. 4: Oxidation behaviour of TempAl in steam at 650°C .
Ferritic- and martensitic steels
The following steels were investigated:
v 2 standard (reference) steels with 9 wt. % Cr: E911 and FB2.
e 2 new cast steels: CT3 and CT7.
e 2 new forged steels: FT2 and FT6.
These steels were exposed to the steam in the as-received state (50 pm of material removedby wet fine-grinding with SiC -paper) and after shot peening. Shot peening was done (alwaysafter the fine-grinding) with glass beads (called here "glass peened") and with steels beads(here called "steel peened").
4
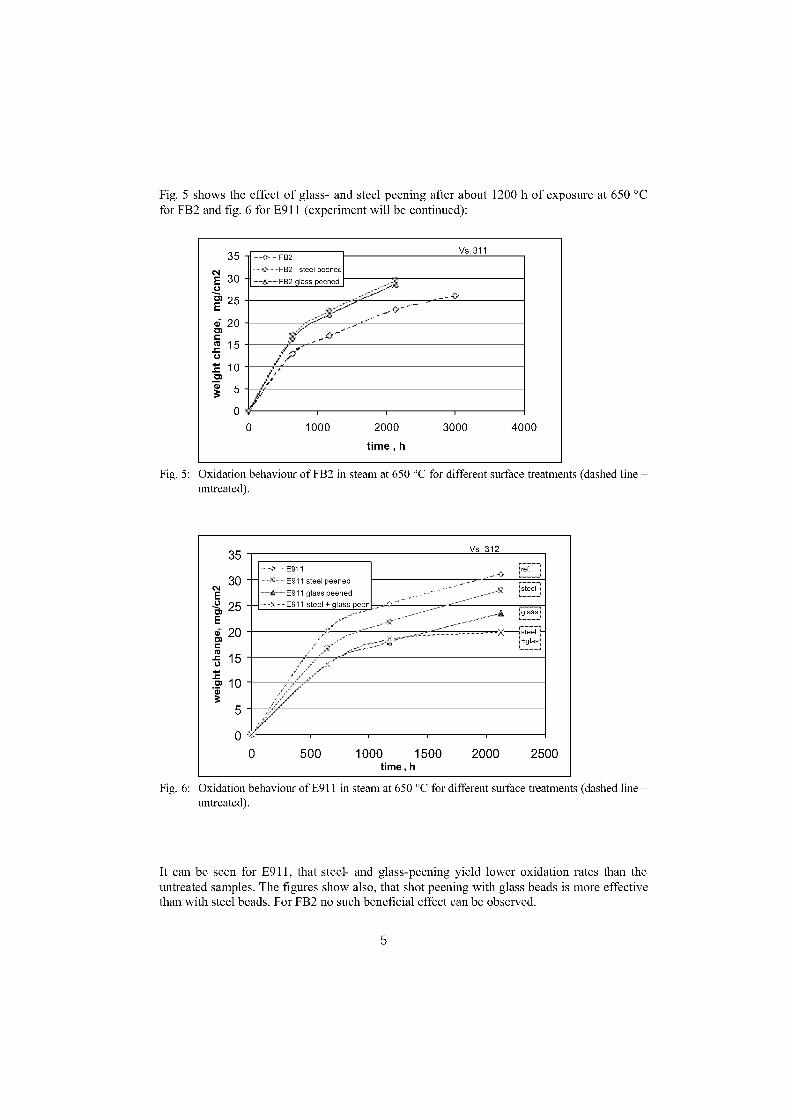
- -
A
FB2FB2 steel peenedFB2 glass peened
VS JI
'
0
1000
2000
3000
4000
time,h
35
E 30
C» 25
• 20rn
cu 15
• 10rn
3 5
0
35
30Eci,"' 25Emai. 20
ct9-5 15›C'
C» 103
5
0
Vs. 312
,C, E911— E911 steel peened
E911 glass peened
tre t
„.,.„m Isteel
— E911 steel + glass peen
Oglassi
steel --rglas
0 500 1000 1500 2000
2500time, h
Fig. 5 shows the effect of glass- and steel peening after about 1200 h of exposure at 650 °Cfor FB2 and fig. 6 for E911 (experiment will be continued):
Fig. 5: Oxidation behaviour of FB2 in steam at 650 °C for different surface treatments (dashed line –untreated).
Fig. 6: Oxidation behaviour of E911 in steam at 650 °C for different surface treatments (dashed line –untreated).
It can be seen for E911, that steel- and glass-peening yield lower oxidation rates than theuntreated samples. The figures Show also, that shot peening with glass beads is more effectivethan with steel beads. For FB2 no such beneficial effect can be observed.
5
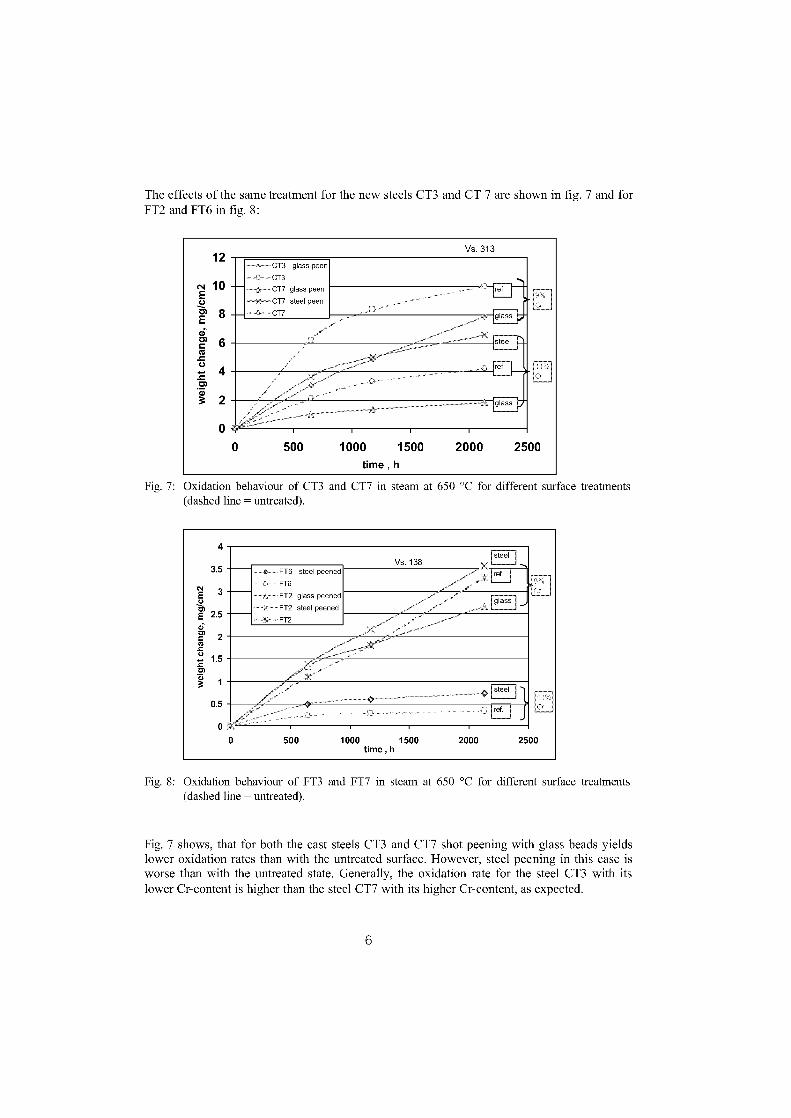
Vs. 31312
CT3 glass peen..•CT3
CT7 glass peenCT7 steel peenCn••
CNI 10 —c.)E
8
617 6 som
4 a)
3 2
glass
I
steel
re
glass
0 500 1000 1500 2000 2500time , h
FT6 steel peenedVs. 138
ref.
glass—11— FT2 glass peened—X—FT2 steel peened
FT2
steel
4
0
500 1000 1500
2000
2500time, h
3.5
3
E 2.5tirnc 2ca.c
1.5zrs)
0.5
The effects of the same treatment for the new steels CT3 and CT 7 are shown in fig. 7 and forFT2 and FT6 in fig. 8:
Fig. 7: Oxidation behaviour of CT3 and CT7 in steam at 650 °C for different surface treatments(dashed line = untreated).
Fig. 8: Oxidation behaviour of FT3 and FT7 in steam at 650 °C for different surface treatments(dashed line = untreated).
Fig. 7 Shows, that for both the cast steels CT3 and CT7 shot peening with glass beads yieldslower oxidation raten than with the untreated surface. However, steel peening in this case isworse than with the untreated state. Generally, the oxidation rate for the steel CT3 with itslower Cr-content is higher than the steel CT7 with its higher Cr-content, as expected.
6
In the case of the forged steels FT2 and FT6 no benefit is gained from shot peening as fig. 8Shows. This can not be explained so far and is therefore the focus of further investigations(hardness measurements, microstructure investigations, etc.). As in the case of the cast steelsCT3 and CT7, the steel with the higher Cr-content (FT6) exhibit a lower oxidation rate thanFT2.
These are preliminary results, which will be supplemented by microstructure and hardnessinvestigations.
Conclusions
- Shot peening of steel surfaces of austenitic steels generally is beneficial for the oxidationbehaviour. The reason is martensitic work- hardening and an increase of the number ofgrain boundaries.For some of the 9 % Cr-steels a similar (beneficial) effect is observed. The reason for thisbehaviour is not yet clear and will be investigated in the future.
- The 10-11.5 Cr-steels in their cast versions show also an increase in the oxidationresistance after shot peening. However, it is not yet clear, why the forged versions did notfollow these observations.
- The increase in the Cr-content from 10 to 11.5 wt resulted in a doubling of theoxidation resistance of the steels.Further investigations are necessary to elucidate the mechanisms by which the work-hardening processes act upon the oxidation behaviour.
Acknowledgement
The authors would like to thank the german Bundesministerium für Wirtschaft und Arbeit forthe financial support of the investigations.
References
[1] G. Scheffknecht, Q. Chen, 5 ]11 Intl. Parsons Conf., July 2000, Cambridge.[2] R. Knödler, B. Scarlin, Oxidation of advanced ferritic/martensitic steels and of coatings inflowing steam at 650 °C, Materials for Advanced Power Engineering 2002, Liege , 1601-1611.[3] D. Caplan, Effect of cold work on the oxidation of Fe-Cr-alloys in water vapor at 600 °C,Corr. Sci. 6 (1966), 509-515.[4] Y. Minami, A. Tooyama, M. Seki, K. Nonaka, K. Koga, Steam oxidation resistance ofshot blasted stainless steel tubing after 10-year service, NKK Techn. Rev. No. 75 (1996), 1-10.[5] H. Haruyama, H. Kutsumi, S. Kuroda, F. Abe, Effect of shot peening and pre-oxidationtreatment on steam oxidation resistance of Mod.9Cr- 1Mo steel, EPRI Conf. 2004, 659-667.
7

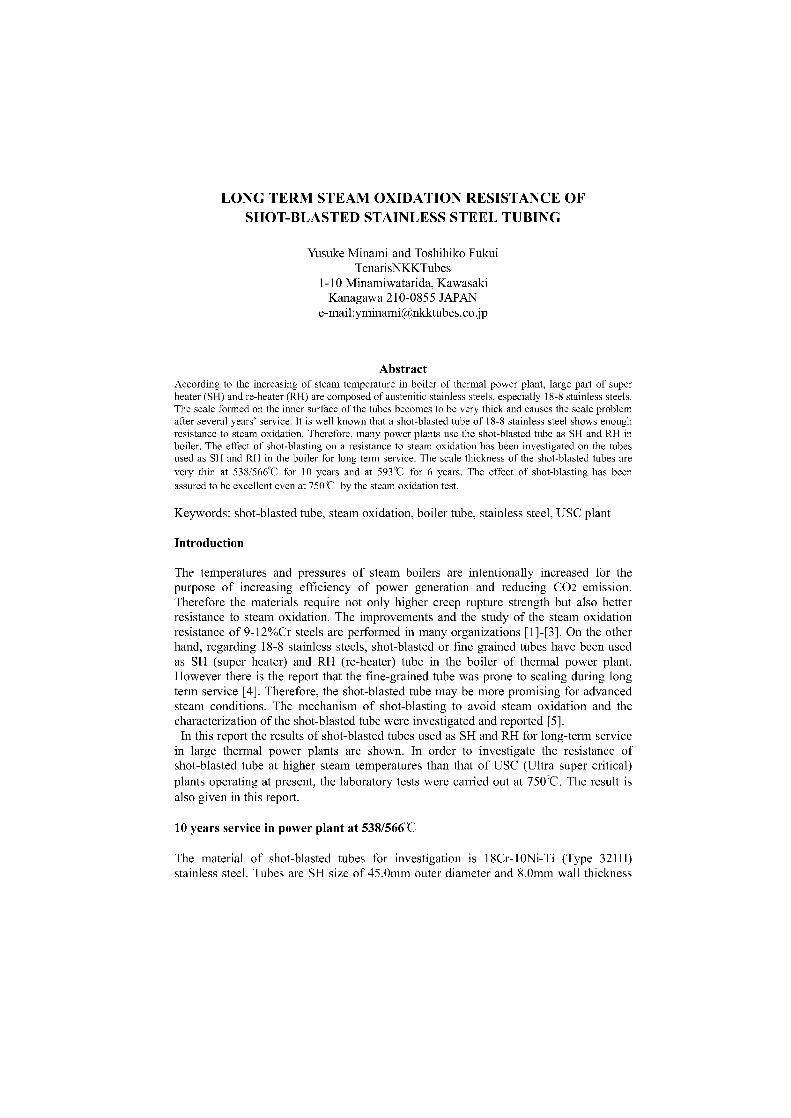
LONG TERM STEAM OXIDATION RESISTANCE OFSHOT-BLASTED STAINLESS STEEL TUBING
Yusuke Minami and Toshihiko FukuiTenarisNKKTubes
1-10 Minamiwatarida, KawasakiKanagawa 210-0855 JAPAN
e-mail:[email protected]
AbstractAccording to the increasing of steam temperature in boiler of thermal power plant, large part of superheater (SH) and re-heater (RH) are composed of austenitic stainless steels, especially 18-8 stainless steels.The scale formed on the inner surface of the tubes becomes to be very thick and causes the scale problemafter several years' service. lt is well known that a shot-blasted tube of 18-8 stainless steel shows enoughresistance to steam oxidation. Therefore, many power plants use the shot-blasted tube as SH and RH inboiler. The effect of shot-blasting on a resistance to steam oxidation has been investigated on the tubesused as SH and RH in the boiler for long term service. The scale thickness of the shot-blasted tubes arevery thin at 538/566°C for 10 years and at 593°C for 6 years. The effect of shot-blasting has beenassured to be excellent even at 750°C by the steam oxidation test.
Keywords: shot-blasted tube, steam oxidation, boiler tube, stainless steel, USC plant
Introduction
The temperatures and pressures of steam boilers are intentionally increased for thepurpose of increasing efficiency of power generation and reducing CO2 emission.Therefore the materials require not only higher creep rupture strength but also betterresistance to steam oxidation. The improvements and the study of the steam oxidationresistance of 9-12%Cr steels are performed in many organizations [1]-[3]. On the otherhand, regarding 18-8 stainless steels, shot-blasted or fine grained tubes have been usedas SH (super heater) and RH (re-heater) tube in the boiler of thermal power plant.However there is the report that the fine-grained tube was prone to scaling during longterm service [4]. Therefore, the shot-blasted tube may be more promising for advancedsteam conditions. The mechanism of shot-blasting to avoid steam oxidation and thecharacterization of the shot-blasted tube were investigated and reported [5].In this report the results of shot-blasted tubes used as SH and RH for long-term service
in large thermal power plants are shown. In order to investigate the resistance ofshot-blasted tube at higher steam temperatures than that of USC (Ultra super critical)plants operating at present, the laboratory tests were carried out at 750°C. The result isalso given in this report.
10 years service in power plant at 538/566°C
The material of shot-blasted tubes for investigation is 18Cr-IONi-Ti (Type 321H)stainless steel. Tubes are SH size of 45.0mm outer diameter and 8.0mm wall thickness
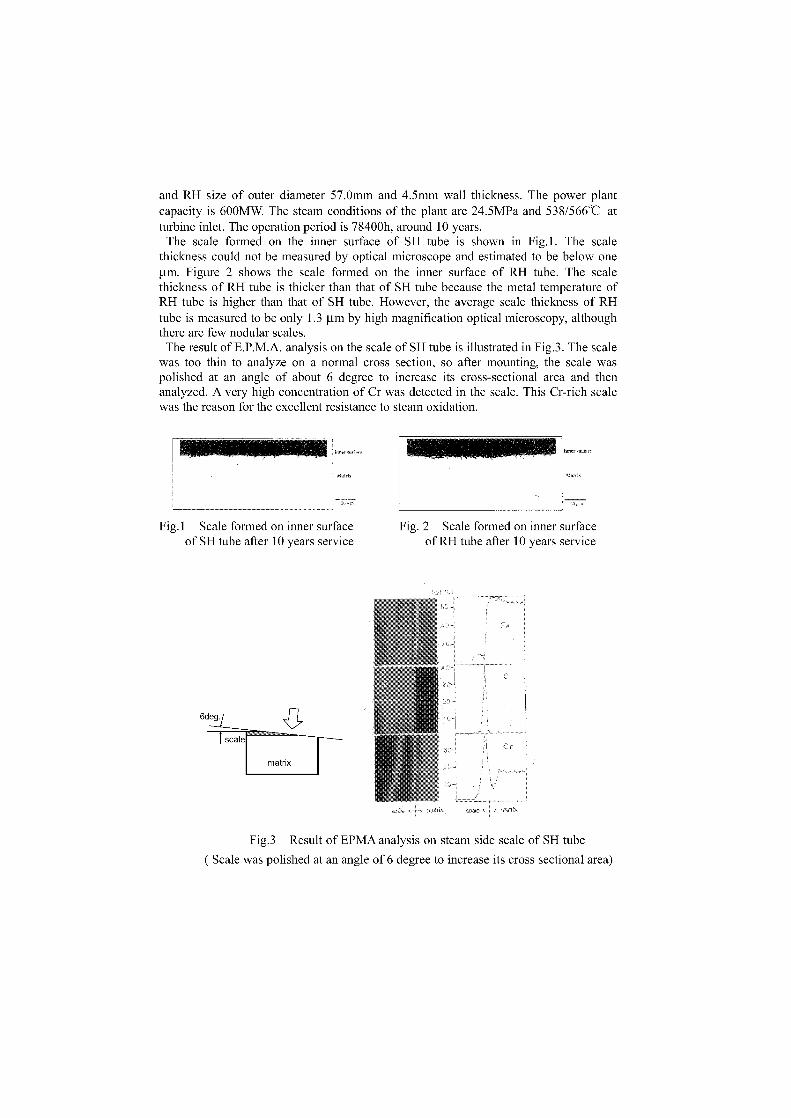
and RH size of outer diameter 57.0mm and 4.5mm wall thickness. The power plantcapacity is 600MW. The steam conditions of the plant are 24.5MPa and 538/566°C atturbine inlet. The operation period is 78400h, around 10 years.The scale formed on the inner surface of SH tube is shown in Fig.l. The scale
thickness could not be measured by optical microscope and estimated to be below onegm. Figure 2 shown the scale formed on the inner surface of RH tube. The scalethickness of RH tube is thicker than that of SH tube because the metal temperature ofRH tube is higher than that of SH tube. However, the average scale thickness of RHtube is measured to be only 1.3 !im by high magnification optical microscopy, althoughthere are few nodular scales.
The result of E.P.M.A. analysis on the scale of SH tube is illustrated in Fig.3. The scalewas too thin to analyze on a normal cross section, so after mounting, the scale waspolished at an angle of about 6 degree to increase its cross-sectional area and thenanalyzed. A very high concentration of Cr was detected in the scale. This Cr-rich scalewas the reason for the excellent resistance to steam oxidation.
Fig.1 Scale formed on inner surfaceof SH tube after 10 years service
Fig. 2 Scale formed on inner surfaceof RH tube after 10 years service
Fig.3 Result of EPMA analysis on steam side scale of SH tube
( Scale was polished at an angle of 6 degree to increase its cross sectional area)
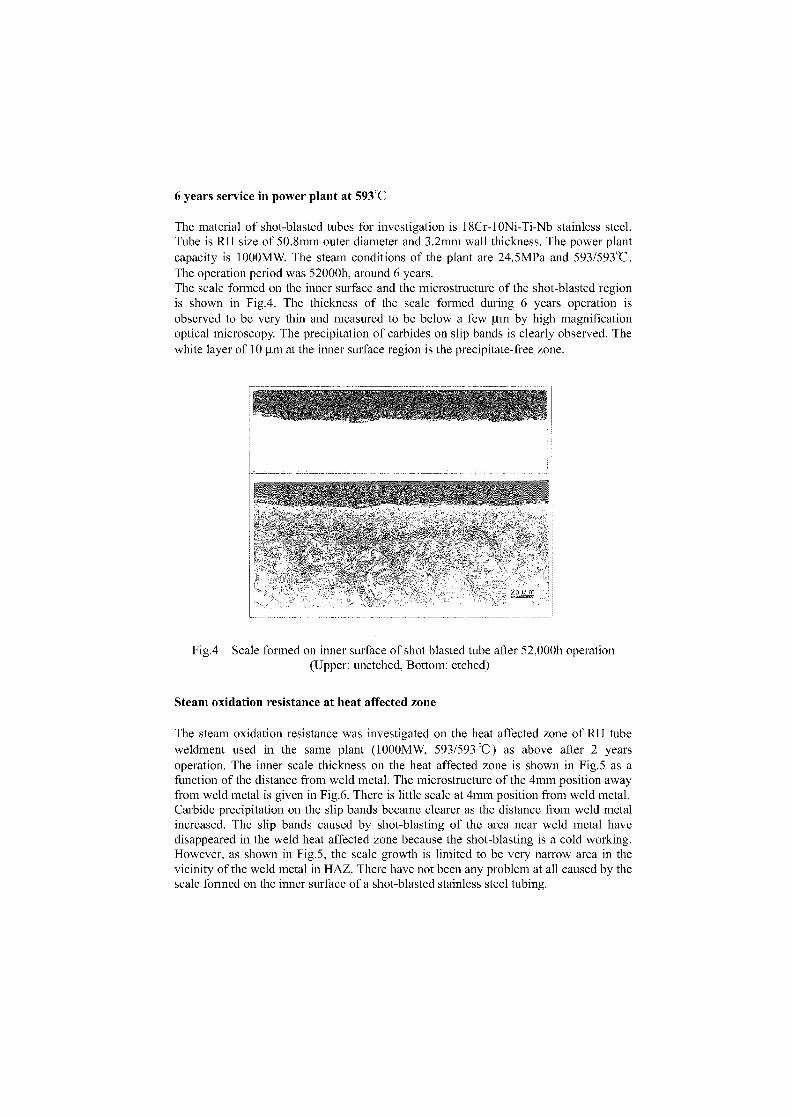
6 years service in power plant at 593°C
The material of shot-blasted tubes for investigation is 18Cr-10Ni-Ti-Nb stainless steel.Tube is RH size of 50.8mm outer diameter and 3.2mm wall thickness. The power plantcapacity is 1000MW. The steam conditions of the plant are 24.5MPa and 593/593°C.The Operation period was 52000h, around 6 years.The scale formed on the inner surface and the microstructure of the shot-blasted regionis shown in Fig.4. The thickness of the scale formed during 6 years operation isobserved to be very thin and measured to be below a few tm by high magnificationoptical microscopy. The precipitation of carbides on slip bands is clearly observed. Thewhite layer of 10 i.tm at the inner surface region is the precipitate-free zone.
Fig.4 Scale formed on inner surface of shot blasted tube after 52,000h operation(Upper: unetched, Bottom: etched)
Steam oxidation resistance at heat affected zone
The steam oxidation resistance was investigated on the heat affected zone of RH tubeweldment used in the same plant (1000MW, 593/593 °C) as above after 2 yearsoperation. The inner scale thickness on the heat affected zone is shown in Fig.5 as afunction of the distance from weld metal. The microstructure of the 4mm position awayfrom weld metal is given in Fig.6. There is little scale at 4mm position from weld metal.Carbide precipitation on the slip bands became clearer as the distance from weld metalincreased. The slip bands caused by shot-blasting of the area near weld metal havedisappeared in the weld heat affected zone because the shot-blasting is a cold working.However, as shown in Fig.5, the scale growth is limited to be very narrow area in thevicinity of the weld metal in HAZ. There have not been any problem at all caused by thescale formed on the inner surface of a shot-blasted stainless steel tubing.
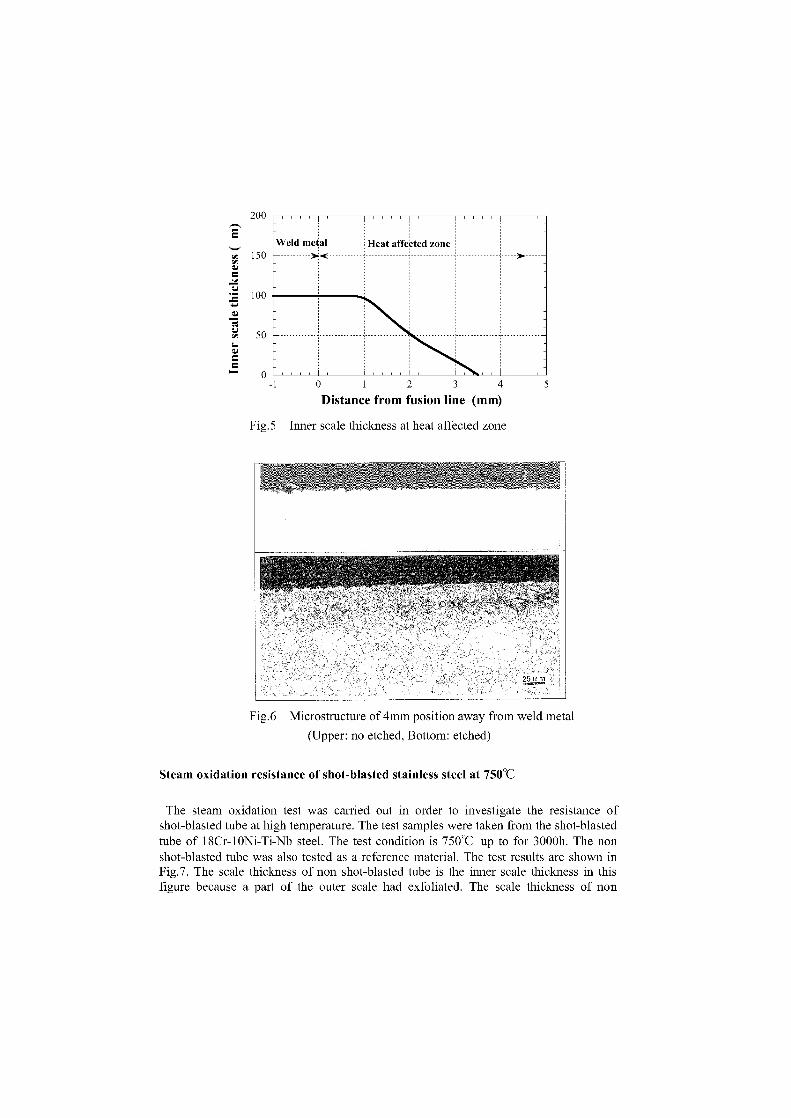
-Weld metal ><
Heat affected zone
200
5150
1J
100
1J
501J
1 2 3 4 5
Distance from fusion line (mm)
Fig.5 Inner scale thickness at heat affected zone
Fig.6 Microstructure of 4mm position away from weld metal
(Upper: no etched, Bottom: etched)
Steam oxidation resistance of shot-blasted stainless steel at 750°C
The steam oxidation test was carried out in order to investigate the resistance ofshot-blasted tube at high temperature. The test Samples were taken from the shot-blastedtube of 18Cr-10Ni-Ti-Nb steel. The test condition is 750°C up to for 3000h. The nonshot-blasted tube was also tested as a reference material. The test results are shown inFig.7. The scale thickness of non shot-blasted tube is the inner scale thickness in thisfigure because a part of the outer scale had exfoliated. The scale thickness of non
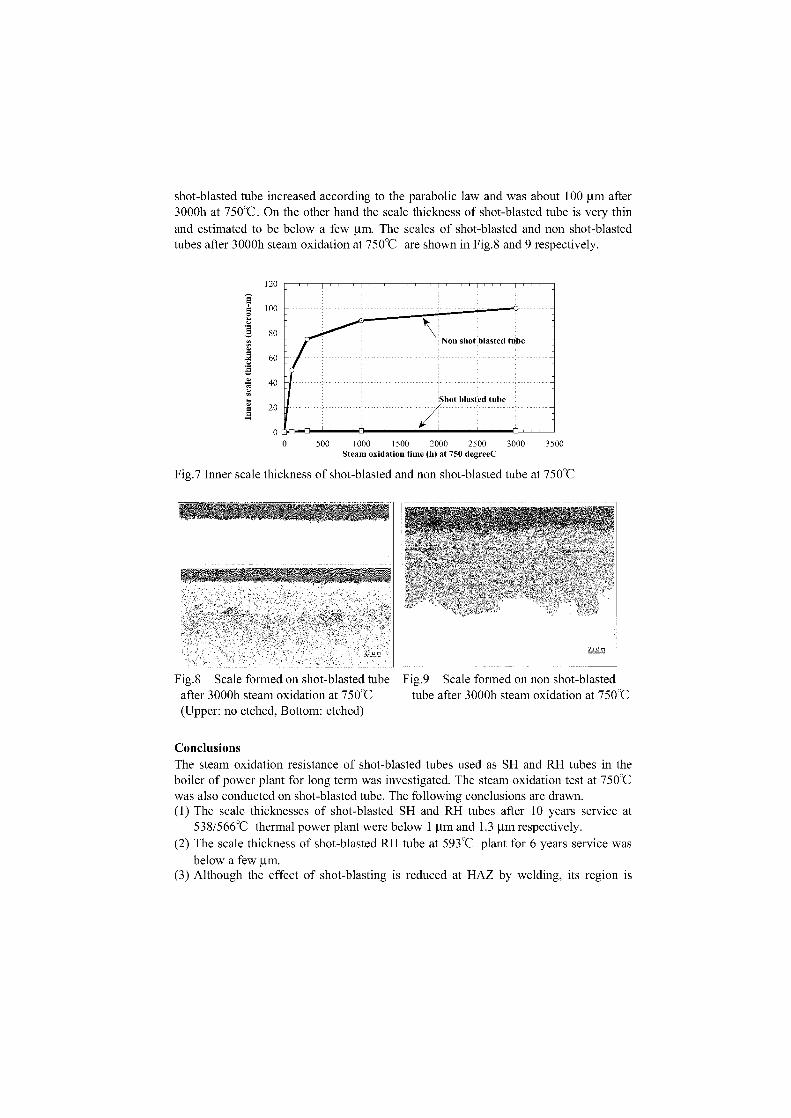
0 500 1000 1500 2000 2500 3000Steam oxidation time (h) at 750 degreeC
shot-blasted tube increased according to the parabolic law and was about 100 !im after3000h at 750°C. On the other hand the scale thickness of shot-blasted tube is very thin
and estimated to be below a few gm. The scales of shot-blasted and non shot-blastedtubes after 3000h steam oxidation at 750°C are shown in Fig.8 and 9 respectively.
120
EA 100O
80
A 60
340
20
0
Fig.7 Inner scale thickness of shot-blasted and non shot-blasted tube at 750°C
Fig.8 Scale formed on shot-blasted tube Fig.9 Scale formed on non shot-blastedafter 3000h steam oxidation at 750°C tube after 3000h steam oxidation at 750°C(Upper: no etched, Bottom: etched)
ConclusionsThe steam oxidation resistance of shot-blasted tubes used as SH and RH tubes in theboiler of power plant for Jong term was investigated. The steam oxidation test at 750°Cwas also conducted on shot-blasted tube. The following conclusions are drawn.(1) The scale thicknesses of shot-blasted SH and RH tubes after 10 years service at
538/566°C thermal power plant were below 1 !im and 1.3 respectively.
(2) The scale thickness of shot-blasted RH tube at 593°C plant for 6 years service was
below a few(3) Although the effect of shot-blasting is reduced at HAZ by welding, its region is
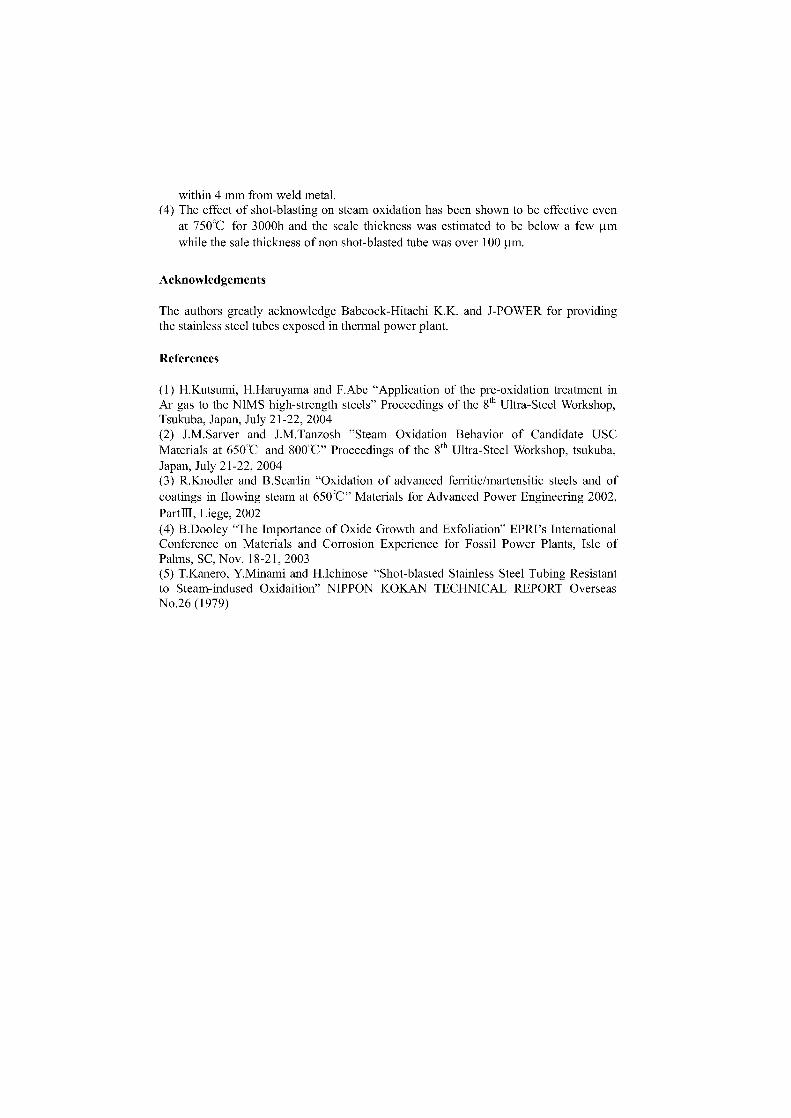
within 4 mm from weld metal.(4) The effect of shot-blasting on steam oxidation has been shown to be effective even
at 750°C for 3000h and the scale thickness was estimated to be below a fewwhile the sale thickness of non shot-blasted tube was over 100 gm.
Acknowledgements
The authors greatly acknowledge Babcock-Hitachi K.K. and J-POWER for providingthe stainless steel tubes exposed in thermal power plant.
References
(1) H.Kutsumi, H.Haruyama and F.Abe "Application of the pre-oxidation treatment inAr gas to the NIMS high-strength steels" Proceedings of the 8 th Ultra-Steel Workshop,Tsukuba, Japan, July 21-22, 2004(2) J.M.Sarver and J.M.Tanzosh "Steam Oxidation Behavior of Candidate USCMaterials at 650°C and 800°C" Proceedings of the 8 th Ultra-Steel Workshop, tsukuba,Japan, July 21-22, 2004(3) R.Knodler and B.Scarlin "Oxidation of advanced ferritic/martensitic steels and ofcoatings in flowing steam at 650°C" Materials for Advanced Power Engineering 2002,
PartIII, Liege, 2002(4) B.Dooley "The Importance of Oxide Growth and Exfoliation" EPRI's InternationalConference on Materials and Corrosion Experience for Fossil Power Plants, Isle ofPalms, SC, Nov. 18-21, 2003(5) T.Kanero, Y.Minami and H.Ichinose "Shot-blasted Stainless Steel Tubing Resistantto Steam-indused Oxidaition" NIPPON KOKAN TECHNICAL REPORT OverseasNo.26 (1979)
Part III
Advanced Steam Turbine Materials
Contributed Papers
Austenitic Steels and Nickel-base Alloys

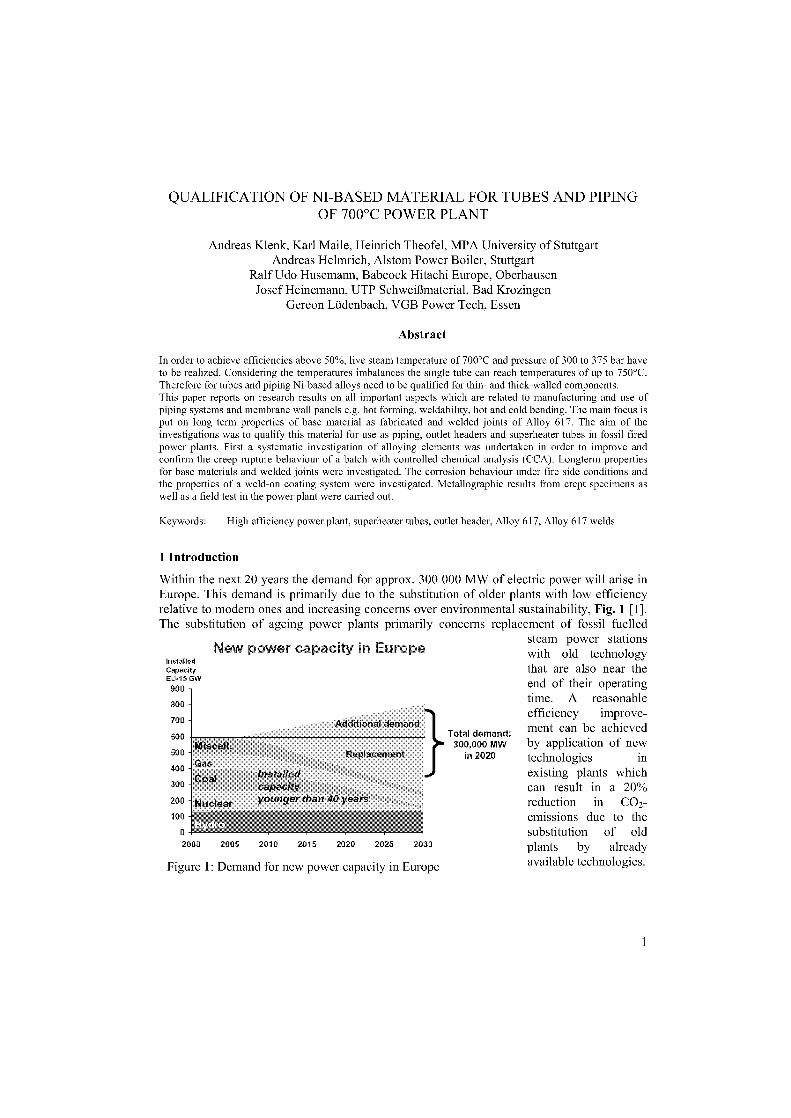
QUALIFICATION OF NI-BASED MATERIAL FOR TUBES AND PIPINGOF 700°C POWER PLANT
Andreas Klenk, Karl Maile, Heinrich Theofel, MPA University of StuttgartAndreas Heimrich, Alstom Power Boiler, Stuttgart
Ralf Udo Husemann, Babcock Hitachi Europe, OberhausenJosef Heinemann, UTP Schweißmaterial, Bad Krozingen
Gereon Lüdenbach, VGB Power Tech, Essen
Abstract
In order to achieve efficiencies above 50%, live steam temperature of 700°C and pressure of 300 to 375 bar haveto be realized. Considering the temperatures imbalances the single tube can reach temperatures of up to 750°C.Therefore for tubes and piping Ni-based alloys need to be qualified for thin- and thick-walled components.This paper reports on research results on all important aspects which are related to manufacturing and use ofpiping systems and membrane wall panels e.g. hot forming, weldability, hot and cold bending. The main focus isput on long term properties of base material as fabricated and welded joints of Alloy 617. The aim of theinvestigations was to qualify this material for use as piping, outlet headers and superheater tubes in fossil firedpower plants. First a systematic investigation of alloying elements was undertaken in order to improve andconfirm the creep rupture behaviour of a batch with controlled chemical analysis (CCA). Longterm propertiesfor base materials and welded joints were investigated. The corrosion behaviour under Lire side conditions andthe properties of a weld-on coating system were investigated. Metallographic results from crept specimens aswell as a field test in the power plant were carried out.
Keywords: High efficiency power plant, superheater tubes, outlet header, Alloy 617, Alloy 617 welds
1 Introduction
Within the next 20 years the demand for approx. 300 000 MW of electric power will arise inEurope. This demand is primarily due to the substitution of older plants with low efficiencyrelative to modern ones and increasing concerns over environmental sustainability, Fig. 1 [1].The substitution of ageing power plants primarily concerns replacement of fossil fuelled
steam power stationsNew power capacity in Europe with old technology
InslaliedCapacity that are also near theEU-15 GW
900
800
00 Additional demand600 Total dernand:
Mise II. 340,000 MW500 Replacement in 2020
Gas as
Coal
200 Nuclear
Inhtoliedcapacityyountjer than 40 years
1 n O
201 2005 2010 .-1,15 2020 1125 2030 plants
by already
Figure 1: Demand for new power capacity in Europe available technologies.
end of their operatingtime. A reasonableefficiency improve-ment can be achievedby application of newtechnologies inexisting plants whichcan result in a 20%reduction in CO2-emissions due to thesubstitution of old
1
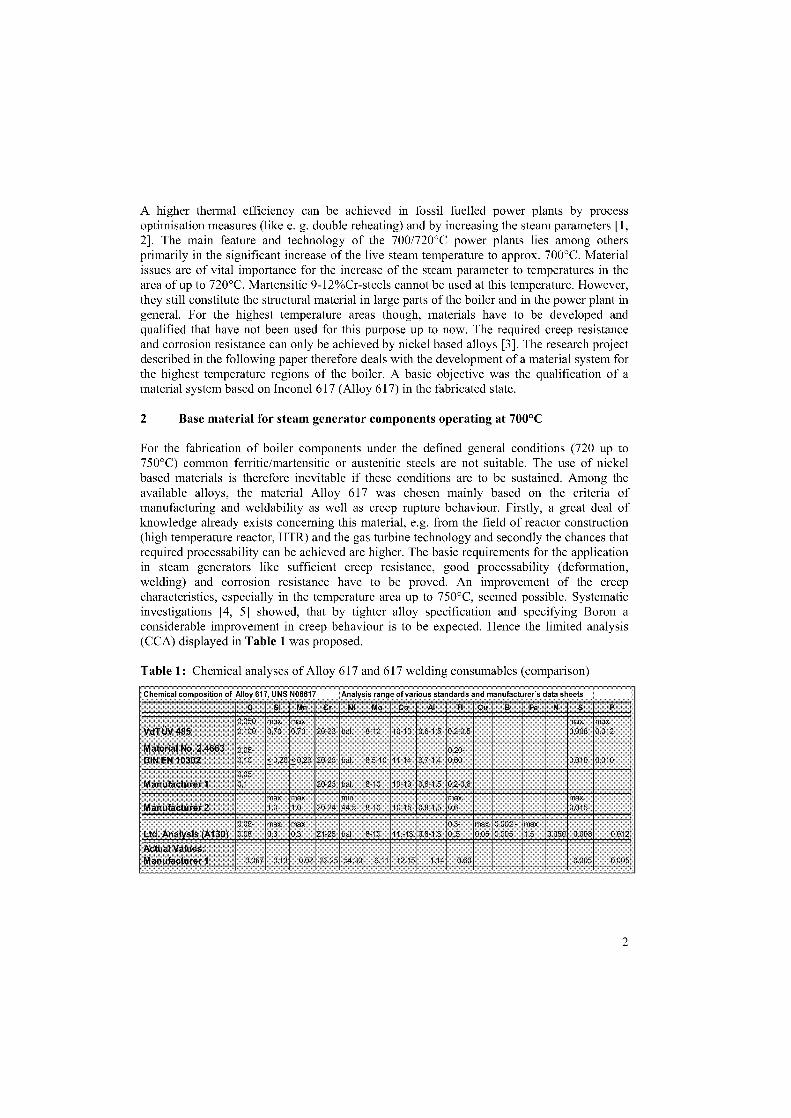
A higher thermal efficiency can be achieved in fossil fuelled power plants by processoptimisation measures (like e. g. double reheating) and by increasing the steam parameters [1,2]. The main feature and technology of the 700/720°C power plants lies among othersprimarily in the significant increase of the live steam temperature to approx. 700°C. Materialissues are of vital importance for the increase of the steam parameter to temperatures in thearea of up to 720°C. Martensitic 9-12%Cr-steels cannot be used at this temperature. However,they still constitute the structural material in large parts of the boiler and in the power plant ingeneral. For the highest temperature areas though, materials have to be developed andqualified that have not been used for this purpose up to now. The required creep resistanceand corrosion resistance can only be achieved by nickel based alloys [3]. The research projectdescribed in the following paper therefore deals with the development of a material system forthe highest temperature regions of the boiler. A basic objective was the qualification of amaterial system based on Inconel 617 (Alloy 617) in the fabricated state.
2 Base material for steam generator components operating at 700°C
For the fabrication of boiler components under the defined general conditions (720 up to750°C) common ferritic/martensitic or austenitic steels are not suitable. The use of nickelbased materials is therefore inevitable if these conditions are to be sustained. Among theavailable alloys, the material Alloy 617 was chosen mainly based on the criteria ofmanufacturing and weldability as well as creep rupture behaviour. Firstly, a great deal ofknowledge already exists concerning this material, e.g. from the field of reactor construction(high temperature reactor, HTR) and the gas turbine technology and secondly the chances thatrequired processability can be achieved are higher. The basic requirements for the applicationin steam generators like sufficient creep resistance, good processability (deformation,welding) and corrosion resistance have to be proved. An improvement of the creepcharacteristics, especially in the temperature area up to 750°C, seemed possible. Systematicinvestigations [4, 5] showed, that by tighter alloy specification and specifying Boron aconsiderable improvement in creep behaviour is to be expected. Hence the limited analysis(CCA) displayed in Table 1 was proposed.
Table 1: Chemical analyses of Alloy 617 and 617 welding consumables (comparison)
Chemical composition of Alloy 617, UNS N06617 Analysis range of vadous standards and manufacturer's data sheets
C Si Mn Cr Ni Mo Co Al Ti
VdTOV 485 0.050-0,100
max.0,70
max0,70 20-23 bal. 8-10 10-13 0,6-1,5 0,2-0,5
max.0,008
max.0012
Material No. 2.4663DIN EN 10302
0,05-0,10 <0,20 <020 20-23 bal. 8,5-10 11-14 0,7-1,4
0.20-0,60 0.010 0.010
Manufacturer 10,05-0,1 20-23 bal. 8-10 10-13 0,6-t5 02-0,6
Manufacturer 2max1.0
max
1.0 20-24min44.5 8-10 10-15 0,8-1,5
max.
0.6max.0,015
Ltd. Analysis (A130)0.05-0.08
max.0.3
max0.3 21-23 bal 8-10 11.-13. 0.8-1.3
0.3-0.,5
max.0.05
0.002-0.005
max1.5 0.050 0.008 0.012
Actual Values:Manufacturer 1 0.067 0.13 0.02 22.25 54.30 9.11 12.15 1.14 0.60 0.005 0.005
2
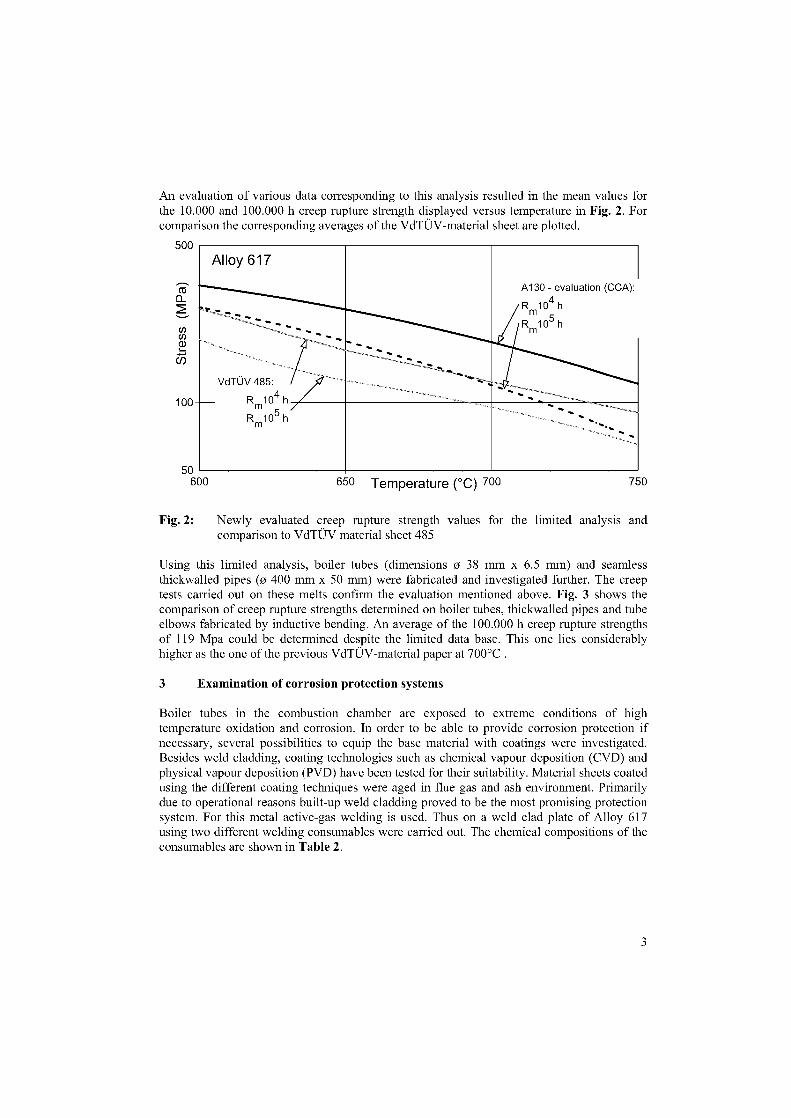
An evaluation of various data corresponding to this analysis resulted in the mean values forthe 10.000 and 100.000 h creep rupture strength displayed versus temperature in Fig. 2. Forcomparison the corresponding averages of the VdTÜV-material sheet are plotted.
Alloy 617
VdTÜV 485:
Rh
A130 - evaluation (CCA):
Rm 104 h
Rm 105 h
m 10
R m 10
600 650 Temperature (°C) 700
750
Fig. 2:
Newly evaluated creep rupture strength values for the limited analysis andcomparison to VdTÜV material sheet 485
Using this limited analysis, boiler tubes (dimensions o 38 mm x 6.5 mm) and seamlessthickwalled pipes (o 400 mm x 50 mm) were fabricated and investigated further. The creeptests carried out on these melts confirm the evaluation mentioned above. Fig. 3 shows thecomparison of creep rupture strengths determined on boiler tubes, thickwalled pipes and tubeelbows fabricated by inductive bending. An average of the 100.000 h creep rupture strengthsof 119 Mpa could be determined despite the limited data base. This one lies considerablyhigher as the one of the previous VdTÜV-material paper at 700°C .
3 Examination of corrosion protection systems
Boiler tubes in the combustion chamber are exposed to extreme conditions of hightemperature oxidation and corrosion. In order to be able to provide corrosion protection ifnecessary, several possibilities to equip the base material with coatings were investigated.Besides weld cladding, coating technologies such as chemical vapour deposition (CVD) andphysical vapour deposition (PVD) have been tested for their suitability. Material sheets coatedusing the different coating techniques were aged in flue gas and ash environment. Primarilydue to operational reasons built-up weld cladding proved to be the most promising protectionsystem. For this metal active-gas welding is used. Thus on a weld clad plate of Alloy 617using two different welding consumables were carried out. The chemical compositions of theconsumables are shown in Table 2.
500
02
0)
(7)
100
50
3
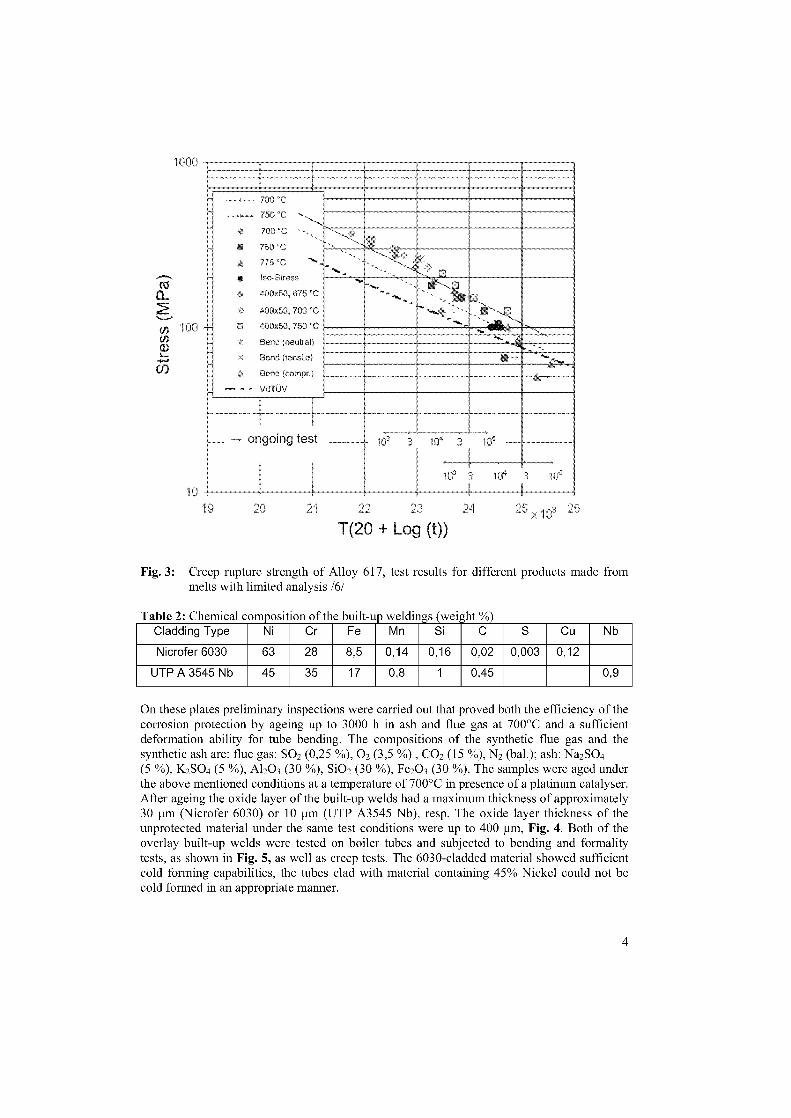
==11311111111111111•1■11111M1/331=13.311
ongoing test
7:0
701, "C
70 ,0 'C
■ 7:50 "C
775'C
• [so-Stress
400x5C. 675 °C
400", 0 70) *Cs
1000
(j) 100(/)
$(12
19
21 22 23 24
T(20 + Log (t))
Fig. 3: Creep rupture strength of Alloy 617, test results for different products made frommelts with limited analysis /6/
Table 2: Chemical composition of the built-up weldings (weight %)Cladding Type Ni Cr Fe Mn Si C S Cu Nb
Nicrofer 6030 63 28 8,5 0,14 0,16 0,02 0,003 0,12
UTP A 3545 Nb 45 35 17 0,8 1 0,45 0,9
On these plates preliminary inspections were carried out that proved both the efficiency of thecorrosion protection by ageing up to 3000 h in ash and flue gas at 700°C and a sufficientdeformation ability for tube bending. The compositions of the synthetic flue gas and thesynthetic ash are: flue gas: SO 2 (0,25 %), 02 (3,5 %) , CO2 (15 %), N2 (bal.); ash: Na2SO4(5 %), K2 SO4 (5 %), Al 203 (30 %), Si02 (30 %), Fe203 (30 %). The samples were aged underthe above mentioned conditions at a temperature of 700°C in presence of a platinum catalyser.After ageing the oxide layer of the built-up welds had a maximum thickness of approximately30 um (Nicrofer 6030) or 10 um (UTP A3545 Nb), resp. The oxide layer thickness of theunprotected material under the same test conditions were up to 400 !Im, Fig. 4. Both of theoverlay built-up welds were tested an boiler tubes and subjected to bending and formalitytests, as shown in Fig. 5, as well as creep tests. The 6030-cladded material showed sufficientcold forming capabilities, the tubes clad with material containing 45% Nickel could not becold formed in an appropriate manner.
4
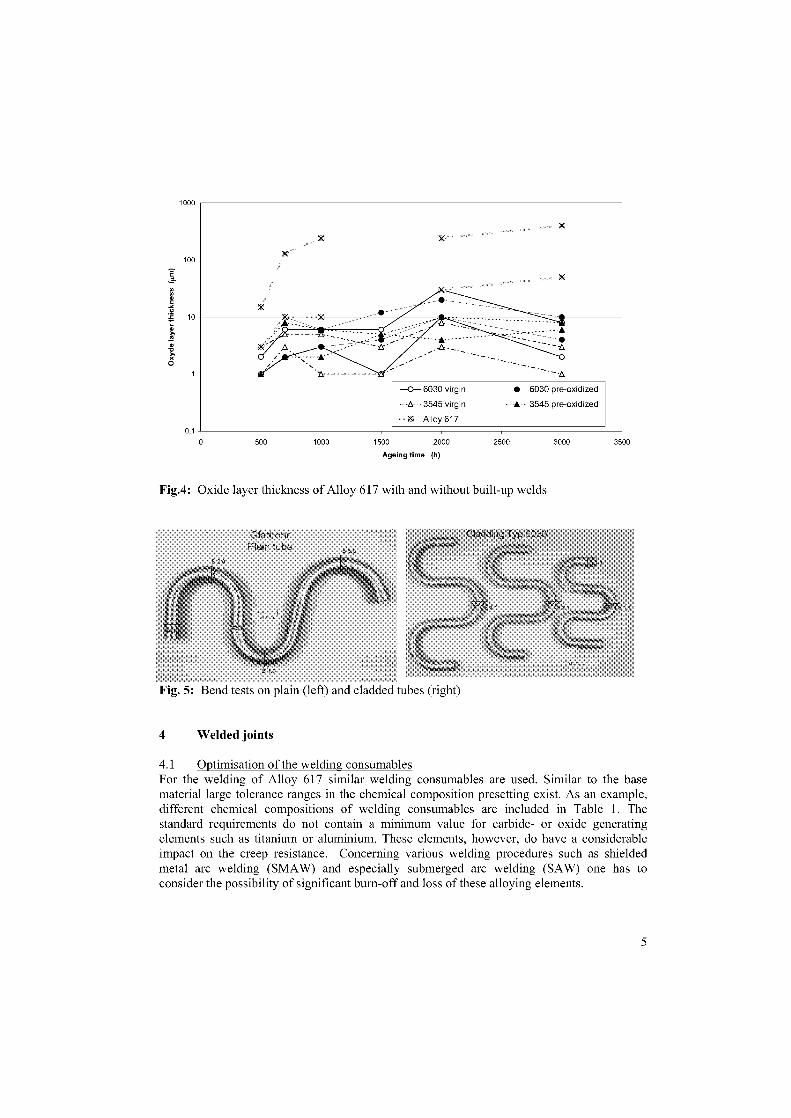
GlattrohrPlain tube
1000
x).(
—0— 6030 virgin • 6030 pre-oxidized
•3545 virgin - 3545 pre-oxidized
X Alloy 617
500 1000 1500 2000 2500 3000 3500Ageing time (h)
Fig.4: Oxide layer thickness of Alloy 617 with and without built-up welds
Fig. 5: Bend tests on plain (left) and cladded tubes (right)
4 Welded joints
4.1 Optimisation of the welding consumables For the welding of Alloy 617 similar welding consumables are used. Similar to the Basematerial large tolerance ranges in the chemical composition presetting exist. As an example,different chemical compositions of welding consumables are included in Table 1. Thestandard requirements do not contain a minimum value for carbide- or oxide generatingelements such as titanium or aluminium. These elements, however, do have a considerableimpact on the creep resistance. Concerning various welding procedures such as shieldedmetal arc welding (SMAW) and especially submerged arc welding (SAW) one has toconsider the possibility of significant burn-off and loss of these alloying elements.
0,10
100
E
10
0
5
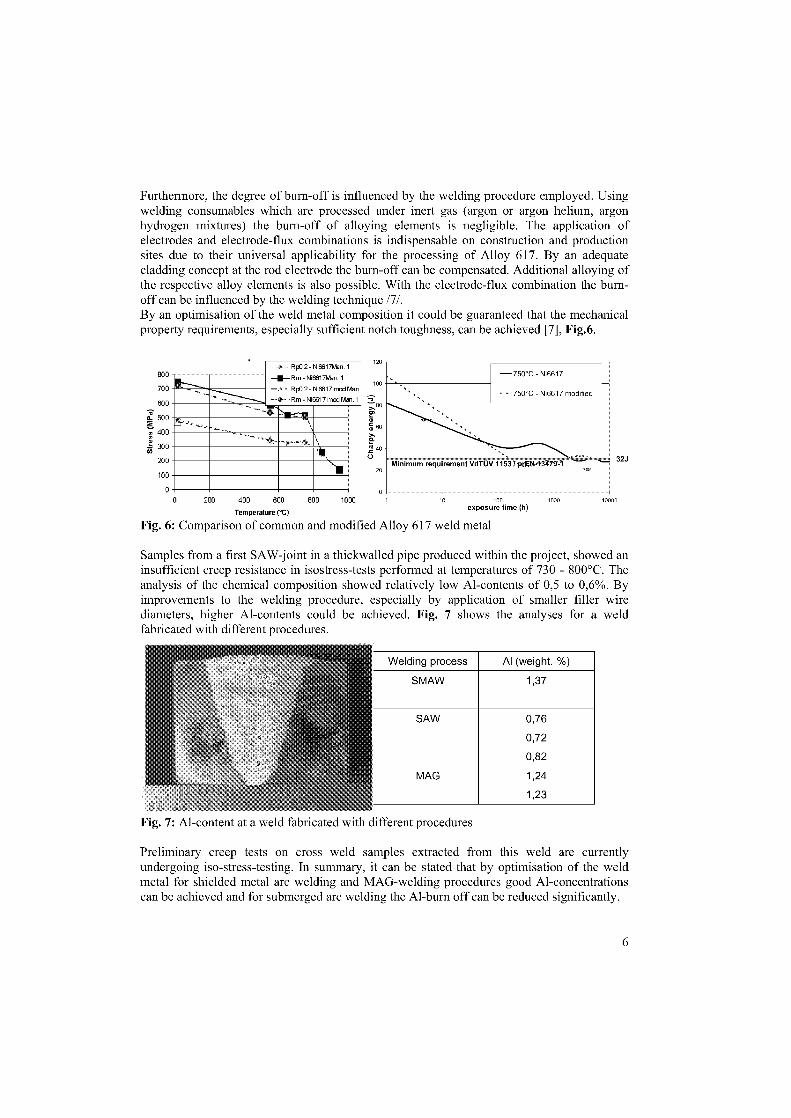
Rp0,2- Ni6617Man. 1
—B—Rm - Ni6617Man. 1
L Rp0,2- Ni6617 mal Man.Rm - Ni6617mcd Man. 1
20
750°C - Ni6617 modified
800
700
600
50022 400
300
200
00
32J
Furthermore, the degree of bum-off is influenced by the welding procedure employed. Usingwelding consumables which are processed under inert gas (argon or argon helium, argonhydrogen mixtures) the burn-off of alloying elements is negligible. The application ofelectrodes and electrode-flux combinations is indispensable on construction and productionsites due to their universal applicability for the processing of Alloy 617. By an adequatecladding concept at the rod electrode the burn-off can be compensated. Additional alloying ofthe respective alloy elements is also possible. With the electrode-flux combination the burn-off can be influenced by the welding technique /7/.By an optimisation of the weld metal composition it could be guaranteed that the mechanicalproperty requirements, especially sufficient notch toughness, can be achieved [7], Fig.6.
0 200 400 600 800 1000 10 100
re (°C) exposure time (h)Temperature
Fig. 6: Comparison of common and modified Alloy 617 weld metal
Samples from a first SAW-joint in a thickwalled pipe produced within the project, showed aninsufficient creep resistance in isostress-tests performed at temperatures of 730 - 800°C. Theanalysis of the chemical composition showed relatively low Al-contents of 0,5 to 0,6%. Byimprovements to the welding procedure, especially by application of smaller filier wirediameters, higher Al-contents could be achieved. Fig. 7 shows the analyses for a weldfabricated with different procedures.
1000
10000
Welding process Al (weight.-%)
SMAW
SAW
MAG
1,37
0,76
0,72
0,82
1,24
1,23
Fig. 7: Al-content at a weld fabricated with different procedures
Preliminary creep tests on cross weld samples extracted from this weld are currentlyundergoing iso-stress-testing. In summary, it can be stated that by optimisation of the weldmetal for shielded metal arc welding and MAG-welding procedures good Al-concentrationscan be achieved and for submerged arc welding the Al-burn off can be reduced significantly.
6
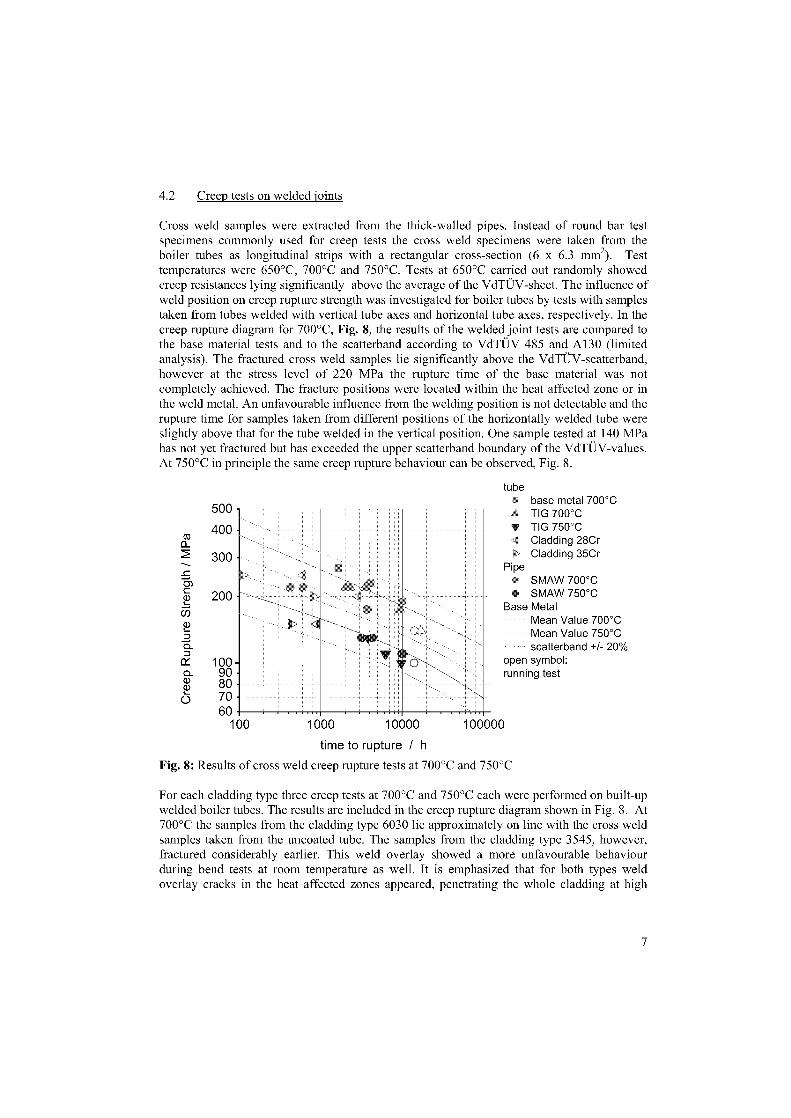
4.2 Creep tests on welded joints
Cross weld samples were extracted from the thick-walled pipes. Instead of round bar testspecimens commonly used for creep tests the cross weld specimens were taken from theboiler tubes as longitudinal strips with a rectangular cross-section (6 x 6.3 mm 2). Testtemperatures were 650°C, 700°C and 750°C. Tests at 650°C carried out randomly showedcreep resistances lying significantly above the average of the VdTÜV-sheet. The influence ofweld position on creep rupture strength was investigated for boiler tubes by tests with samplestaken from tubes welded with vertical tube axes and horizontal tube axes, respectively. In thecreep rupture diagram for 700°C, Fig. 8, the results of the welded joint tests are compared tothe base material tests and to the scatterband according to VdTÜV 485 and A130 (limitedanalysis). The fractured cross weld samples lie significantly above the VdTÜV-scatterband,however at the stress level of 220 MPa the rupture time of the base material was notcompletely achieved. The fracture positions were located within the heat affected zone or inthe weld metal. An unfavourable influence from the welding position is not detectable and therupture time for samples taken from different positions of the horizontally welded tube wereslightly above that for the tube welded in the vertical position. One Sample tested at 140 MPahas not yet fractured but has exceeded the upper scatterband boundary of the VdTÜV-values.At 750°C in principle the same creep rupture behaviour can be observed, Fig. 8.
500400 -
300 -
200 -
10090 -80 -70 -60
100 1000 10000time to rupture / h
Fig. 8: Results of cross weld creep rupture tests at 700°C and 750°C
For each cladding type three creep tests at 700°C and 750°C each were performed on built-upwelded boiler tubes. The results are included in the creep rupture diagram shown in Fig. 8. At700°C the samples from the cladding type 6030 lie approximately on line with the cross weldsamples taken from the uncoated tube. The samples from the cladding type 3545, however,fractured considerably earlier. This weld overlay showed a more unfavourable behaviourduring bend tests at room temperature as well. It is emphasized that for both typen weldoverlay cracks in the heat affected zones appeared, penetrating the whole cladding at high
tube• base metal 700°C• TIG 700°C• TIG 750°C• Cladding 28Cr• Cladding 35Cr
PipeSMAW 700°C
• SMAW 750°CBase Metal Mean Value 700°C
Mean Value 750°Cscatterband +/- 20%
open symbol:running test
1 0 0 0 0 0
7
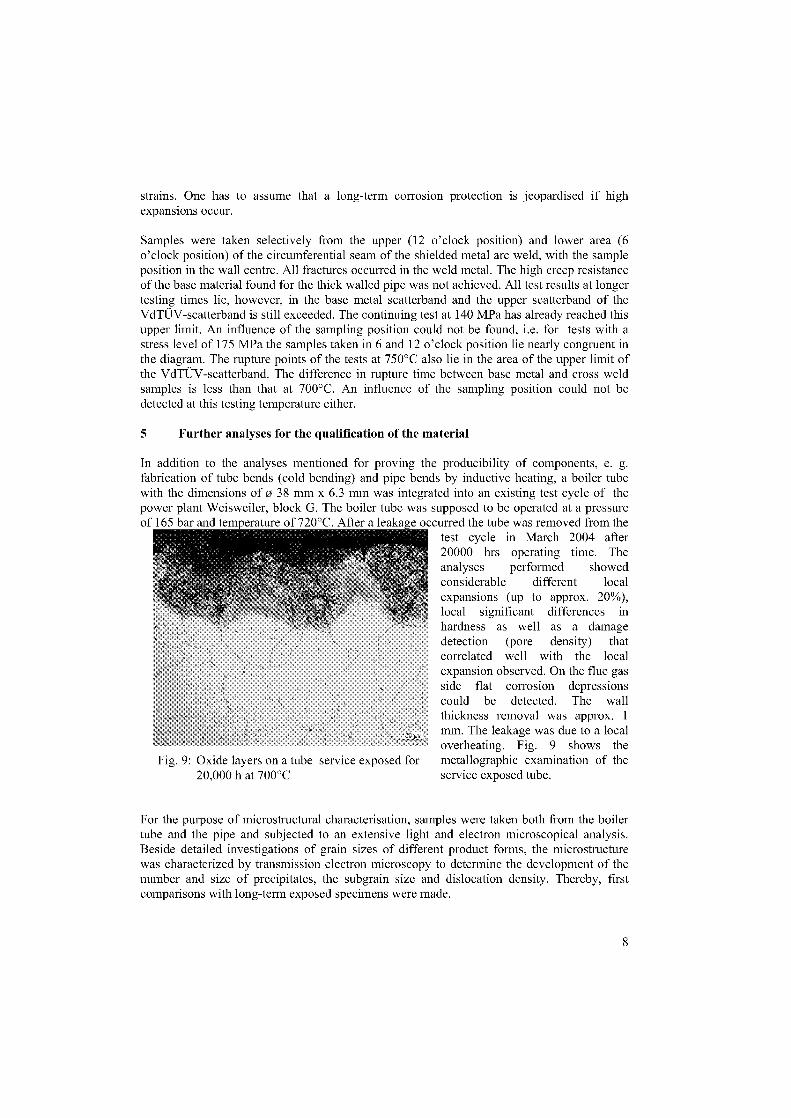
Fig. 9: Oxide layers an a tube service exposed for20,000 h at 700°C
strains. One has to assume that a long-term corrosion protection is jeopardised if highexpansions occur.
Samples were taken selectively from the upper (12 o'clock position) and lower area (6o'clock position) of the circumferential seam of the shielded metal arc weld, with the sampleposition in the wall centre. All fractures occurred in the weld metal. The high creep resistanceof the base material found for the thick walled pipe was not achieved. All test results at longertesting times lie, however, in the base metal scatterband and the upper scatterband of theVdTÜV-scatterband is still exceeded. The continuing test at 140 MPa has already reached thisupper limit. An influence of the sampling position could not be found, i.e. for tests with astress level of 175 MPa the samples taken in 6 and 12 o'clock position lie nearly congruent inthe diagram. The rupture points of the tests at 750°C also lie in the area of the upper limit ofthe VdTÜV-scatterband. The difference in rupture time between base metal and cross weldsamples is less than that at 700°C. An influence of the sampling position could not bedetected at this testing temperature either.
5 Further analyses for the qualification of the material
In addition to the analyses mentioned for proving the producibility of components, e. g.fabrication of tube bends (cold bending) and pipe bends by inductive heating, a boiler tubewith the dimensions of o 38 mm x 6.3 mm was integrated into an existing test cycle of thepower plant Weisweiler, block G. The boiler tube was supposed to be operated at a pressureof 165 bar and temperature of 720°C. After a leakage occurred the tube was removed from the
test cycle in March 2004 after20000 hrs operating time. Theanalyses performed showedconsiderable different localexpansions (up to approx. 20%),local significant differences inhardness as well as a damagedetection (pore density) thatcorrelated well with the localexpansion observed. On the flue gasside flat corrosion depressionscould be detected. The wallthickness removal was approx. 1mm. The leakage was due to a localoverheating. Fig. 9 Shows themetallographic examination of theservice exposed tube.
For the purpose of microstructural characterisation, samples were taken both from the boilertube and the pipe and subjected to an extensive light and electron microscopical analysis.Beside detailed investigations of grain sizes of different product forms, the microstructurewas characterized by transmission electron microscopy to determine the development of thenumber and size of precipitates, the subgrain size and dislocation density. Thereby, firstcomparisons with long-term exposed specimens were made.
8
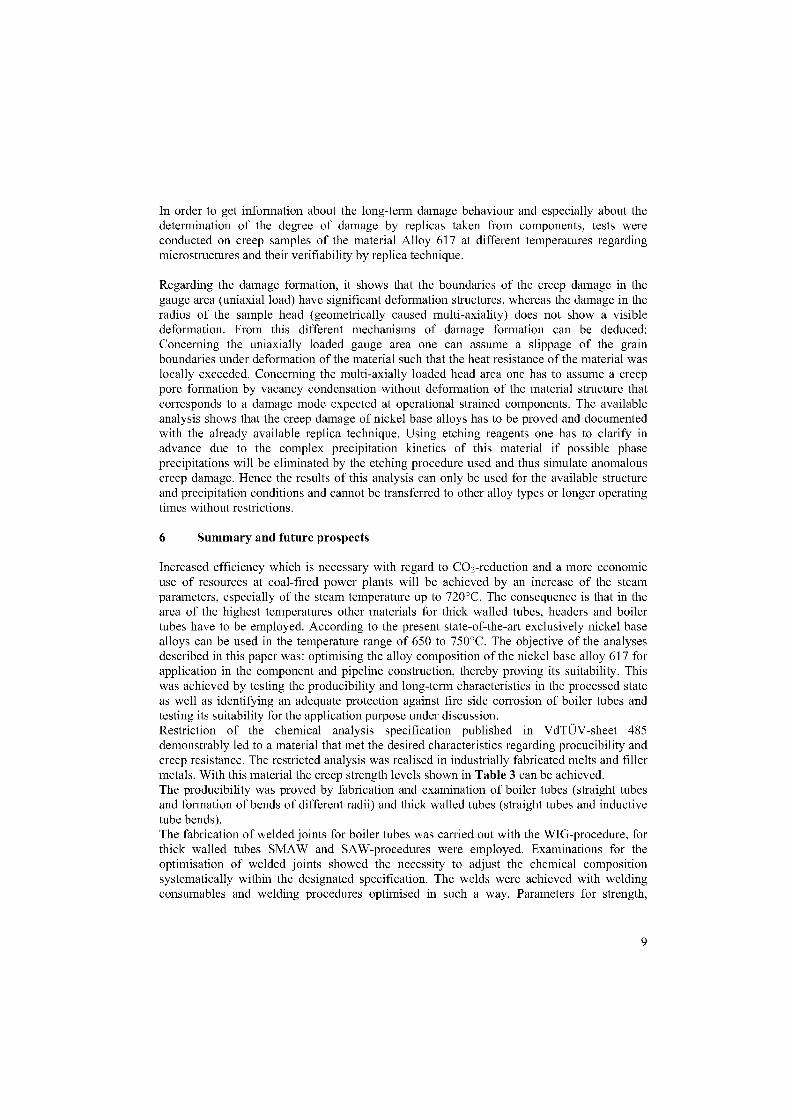
In order to get information about the Jong-term damage behaviour and especially about thedetermination of the degree of damage by replicas taken from components, tests wereconducted an creep Samples of the material Alloy 617 at different temperatures regardingmicrostructures and their verifiability by replica technique.
Regarding the damage formation, it shows that the boundaries of the creep damage in thegauge area (uniaxial load) have significant deformation structures, whereas the damage in theradius of the Sample head (geometrically caused multi-axiality) does not Show a visibledeformation. From this different mechanisms of damage formation can be deduced:Concerning the uniaxially loaded gauge area one can assume a slippage of the grainboundaries under deformation of the material such that the heat resistance of the material waslocally exceeded. Concerning the multi-axially loaded head area one has to assume a creeppore formation by vacancy condensation without deformation of the material structure thatcorresponds to a damage mode expected at operational strained components. The availableanalysis shows that the creep damage of nickel base alloys has to be proved and documentedwith the already available replica technique. Using etching reagents one has to clarify inadvance due to the complex precipitation kinetics of this material if possible phaseprecipitations will be eliminated by the etching procedure used and thus simulate anomalouscreep damage. Hence the results of this analysis can only be used for the available structureand precipitation conditions and cannot be transferred to other alloy types or longer operatingtimes without restrictions.
6 Summary and future prospects
Increased efficiency which is necessary with regard to CO 2-reduction and a more economicuse of resources at coal-fired power plants will be achieved by an increase of the steamparameters, especially of the steam temperature up to 720°C. The consequence is that in thearea of the highest temperatures other materials for thick walled tubes, headers and boilertubes have to be employed. According to the present state-of-the-art exclusively nickel basealloys can be used in the temperature range of 650 to 750°C. The objective of the analysesdescribed in this paper was: optimising the alloy composition of the nickel base alloy 617 forapplication in the component and pipeline construction, thereby proving its suitability. Thiswas achieved by testing the producibility and long-term characteristics in the processed stateas well as identifying an adequate protection against Eire side corrosion of boiler tubes andtesting its suitability for the application purpose under discussion.Restriction of the chemical analysis specification published in VdTÜV-sheet 485demonstrably led to a material that met the desired characteristics regarding procucibility andcreep resistance. The restricted analysis was realised in industrially fabricated melts and filiermetals. With this material the creep strength levels shown in Table 3 can be achieved.The producibility was proved by fabrication and examination of boiler tubes (straight tubesand formation of bends of different radii) and thick walled tubes (straight tubes and inductivetube bends).The fabrication of welded joints for boiler tubes was carried out with the WIG-procedure, forthick walled tubes SMAW and SAW-procedures were employed. Examinations for theoptimisation of welded joints showed the necessity to adjust the chemical compositionsystematically within the designated specification. The welds were achieved with weldingconsumables and welding procedures optimised in such a way. Parameters for strength,
9
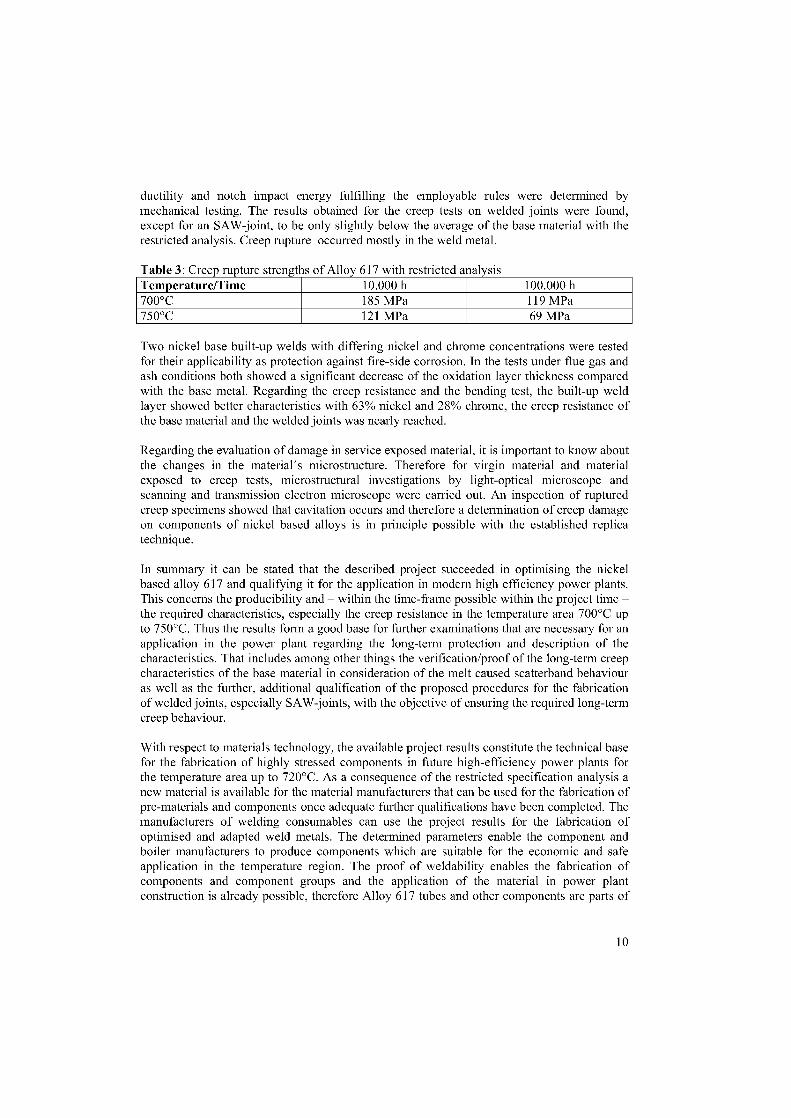
ductility and notch impact energy fulfilling the employable rules were determined bymechanical testing. The results obtained for the creep tests on welded joints were found,except for an SAW-joint, to be only slightly below the average of the base material with therestricted analysis. Creep rupture occurred mostly in the weld metal.
Table 3: Creep rupture strengths of Alloy 617 with restricted analysisTemperature/Time 10.000 h 100.000 h700°C 185 MPa 119 MPa750°C 121 MPa 69 MPa
Two nickel base built-up welds with differing nickel and chrome concentrations were testedfor their applicability as protection against fire-side corrosion. In the tests under flue gas andash conditions both showed a significant decrease of the oxidation layer thickness comparedwith the base metal. Regarding the creep resistance and the bending test, the built-up weldlayer showed better characteristics with 63% nickel and 28% chrome, the creep resistance ofthe base material and the welded joints was nearly reached.
Regarding the evaluation of damage in service exposed material, it is important to know aboutthe changes in the material's microstructure. Therefore for virgin material and materialexposed to creep tests, microstructural investigations by light-optical microscope andscanning and transmission electron microscope were carried out. An inspection of rupturedcreep specimens showed that cavitation occurs and therefore a determination of creep damageon components of nickel based alloys is in principle possible with the established replicatechnique.
In summary it can be stated that the described project succeeded in optimising the nickelbased alloy 617 and qualifying it for the application in modern high efficiency power plants.This concerns the producibility and – within the time-frame possible within the project time –the required characteristics, especially the creep resistance in the temperature area 700°C upto 750°C. Thus the results form a good base for further examinations that are necessary for anapplication in the power plant regarding the long-term protection and description of thecharacteristics. That includes among other things the verification/proof of the Jong-term creepcharacteristics of the base material in consideration of the melt caused scatterband behaviouras well as the further, additional qualification of the proposed procedures for the fabricationof welded joints, especially SAW-joints, with the objective of ensuring the required long-termcreep behaviour.
With respect to materials technology, the available project results constitute the technical basefor the fabrication of highly stressed components in future high-efficiency power plants forthe temperature area up to 720°C. As a consequence of the restricted specification analysis anew material is available for the material manufacturers that can be used for the fabrication ofpre-materials and components once adequate further qualifications have been completed. Themanufacturers of welding consumables can use the project results for the fabrication ofoptimised and adapted weld metals. The determined parameters enable the component andboiler manufacturers to produce components which are suitable for the economic and Safeapplication in the temperature region. The proof of weldability enables the fabrication ofcomponents and component groups and the application of the material in power plantconstruction is already possible, therefore Alloy 617 tubes and other components are parts of
10
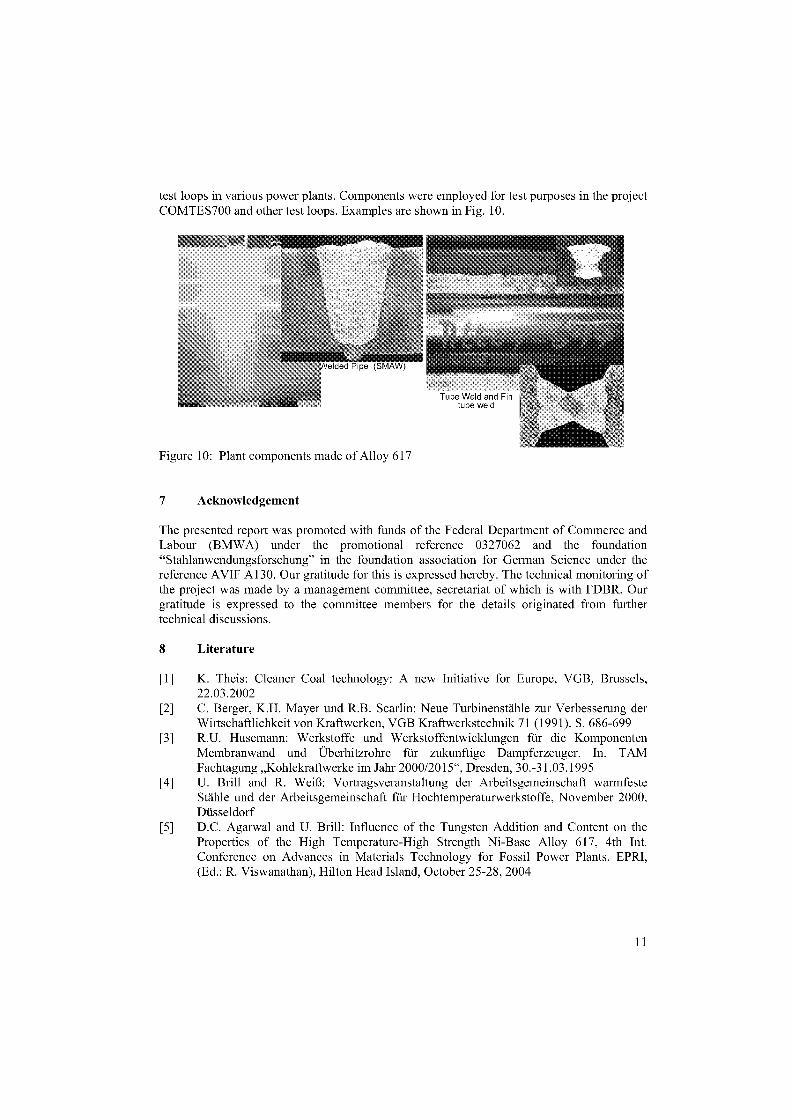
test loops in various power plants. Components were employed for test purposes in the projectCOMTES700 and other test loops. Examples are shown in Fig. 10.
Figure 10: Plant components made of Alloy 617
7 Acknowledgement
The presented report was promoted with funds of the Federal Department of Commerce andLabour (BMWA) under the promotional reference 0327062 and the foundation"Stahlanwendungsforschung" in the foundation association for German Science under thereference AVIF A130. Our gratitude for this is expressed hereby. The technical monitoring ofthe project was made by a management committee, secretariat of which is with FDBR. Ourgratitude is expressed to the committee members for the details originated from furthertechnical discussions.
8 Literature
[1] K. Theis: Cleaner Coal technology: A new Initiative for Europe, VGB, Brussels,22.03.2002
[2] C. Berger, K.H. Mayer und R.B. Scarlin: Neue Turbinenstähle zur Verbesserung derWirtschaftlichkeit von Kraftwerken, VGB Kraftwerkstechnik 71 (1991), S. 686-699
[3] R.U. Husemann: Werkstoffe und Werkstoffentwicklungen für die KomponentenMembranwand und Überhitzrohre für zukunftige Dampferzeuger. In. TAMFachtagung „Kohlekraftwerke im Jahr 2000/2015", Dresden, 30.-31.03.1995
[4] U. Brill and R. Weiß: Vortragsveranstaltung der Arbeitsgemeinschaft warmfesteStähle und der Arbeitsgemeinschaft für Hochtemperaturwerkstoffe, November 2000,Düsseldorf
[5] D.C. Agarwal and U. Brill: Influence of the Tungsten Addition and Content on theProperties of the High Temperature-High Strength Ni-Base Alloy 617, 4th Int.Conference on Advances in Materials Technology for Fossil Power Plants. EPRI,(Ed.: R. Viswanathan), Hilton Head Island, October 25-28, 2004
11

[6] A. Klenk, H. Theofel, A. Heimrich, R.U. Husemann, R. Weiß, U. Brill, T. Kremser, .J. Heeschen: MARCKO-DE 2: Neue Rohrwerkstoffe für Dampferzeuger mitWirkungsgraden über 50% , Final Report, BMWA, AVIF, Stuttgart, 2005
[7] Heinemann, A. Heimrich and R.U. Husemann: Applicability of Ni-Based WeldingConsumables for Boiler Tubes and Piping in the Temperature Range up 720°C. 4ffi Int.Conference an Advances in Materials Technology for Fossil Power Plants. EPRI, (Ed.:R. Viswanathan), Hilton Head Island, October 25-28, 2004
12
AN INVESTIGATION ON STRUCTURE STABILITY AND ITS
IMPROVEMENT ON A NEW DEVELOPMENTAL
NI-CR-CO-MO- NB-TI-AL SUPERALLOY FOR USC POWER PLANT
APPLICATION AT TEMPERATURE ABOVE 750°C
Xishan Xie 1 , Shuangqun Zhao 2 , Jianxin Dong 1 , G. D. Smith 3 , B. A. Baker3 , S. J. Patel3
I High Temperature Materials Research Laboratories, University of Science and TechnologyBeijing, Beijing 100083, China
2 Department of Physics, Ningxia University, Yinchuan 750021, China3 Special Metals Corporation, Huntington, WV 25705, USA
E-mail: I [email protected], 2 [email protected], 3 gsmith@ smcwv.com
AbstractA new Ni-Cr-Co-Mo-Nb-Ti-Al superalloy INCONEL ® 740 is under development for the application of USC
boilers above 750°C. This paper introduces the structure stability of this new alloy briefly. Experimental results
show that the most important structure changes at high temperatures are coarsening,'( to rl transformation and
G phase formation. The coarsening of phase follows a cube rate law: r 3 a t and the phase develops to aWidmanstätten pattern structure following long term exposure at elevated temperatures. Phase computation by
Thermo-Calc has been adopted to study main influencing factors an precipitates. Chemical composition
modifications were attempted to improve the alloys' structure stability. Several suggested new modified alloys in
adjustment of Al and Ti contents and/or in control of Si level were designed and melted for experimental study.
The preliminary results indicate that the modified alloys exhibit more stable structure stability at 750°C long
time aging till 5000h. A bright perspective has been shown for the development of this kind new alloy and for
the application in USC power plants in the near future.
Keywords: Superalloy; INCONEL 740; USC; Structure Stability; Phase Computation
Introduction
Increasing demand for more electricity, reduced plant emissions and greater efficiency isforcing power plants to increase steam temperature and pressure of pulverized coal-firedboilers. It has been shown that the efficiency of pulverized coal-fired boilers can be increasedto over 50% LHV (lower heating value) when ultra supercritical steam (USC) conditionshigher than 300 bar and 600°C are adopted. In these power plants, the superheater/reheatermidwall temperature can be 660°C or higher which means the well-established 9-12%Crsteels must be replaced by austenitic stainless steels with higher creep strength and bettercorrosion resistance.
INCONEL is trademark of the Special Metals Corporation group of companies.
Recent ultra-supercritical steam conditions up to 35 MPa and 700°C, are being planned byboth the European THERMIE AD700 and the German MARCKO DE2 projects, will enhancethe efficiencies of coal-fired boilers to about 50% and lead to superheater/reheater midwalltemperatures as high as 740°C to 760°C as well. At these temperatures and pressures, thesuperheater and reheater materials will therefore be required which have a high creep rupturestrength (100MPa/10 5h) at temperatures of about 750°C, together with high corrosionresistance (<2mm cross-section loss in 2x10⁵h). For long-term service at these high pressuresand temperatures, neither solid solution strengthening austenitic stainless steels nor acurrently available nickel-base superalloy, such as NIMONIC 263, INCONEL 617, CCA617,INCONEL 690 and INCONEL 671, can meet the requirements for stress rupture strength andcorrosion resistance [1-4]. A new precipitation-hardenable Ni-Cr-Co-Mo-Nb-Ti-Al superalloy,designated as INCONEL 740, is under development at Special Metals Corporation(Huntington) for USC power plant application at temperatures above 750°C. The nominalchemical composition is (in wt.%): Cr 25.0, Co 20.0, Mo 0.5, Al 0.9, Ti 1.8, Nb 2.0, Fe 0.7,Mn 0.3, Si 0.5, Ni balance [5, 6]. In collaboration with Special Metals Corporation,University of Science and Technology Beijing has investigated strengthening mechanism,structure stability and corrosion resistance of this new alloy [7-10]. So far, the preliminarystudies prove that the this alloy successfully surpasses the established strength design target asmentioned above and exhibits favorable resistance to coal ash corrosion in laboratory testsdesigned to simulate boiler conditions as well. Although the alloy keeps a goodmicrostructural stability during prolonged aging at temperatures under 725°C, the structurestability of the alloy needs to be improved above 750°C. This paper briefly introduces theimportant results of structure stability of the alloy during long-term aging at elevatedtemperatures. On the basis of thermodynamic calculation, the methods for structure stabilityimprovement have been suggested and four experimental heats of modified alloys (two heatsmade in Beijing and two heats made in Huntington) have been produced and their structurestabilities have been also evaluated at 750°C.
Structure characterization of INCONEL 740
Microstructure of the alloy at standard heat-treatmentMicrostructures of the alloy in the state of solution-annealed plus precipitation treatment areshown in Figure 1. SEM micrograph (Figure 1 a) of the alloy indicates that carbidesprecipitated in matrix and at grain boundaries. The blocky particles distributed in the matrixand the grain boundaries are MC and M 23C6 carbides mainly, which can be electro-extractedin a solution of HC1 and CH 3OH and be ascertained by X-ray diffraction. The exact anddetailed results of the precipitates as shown in Tab. 1, which were analyzed by physical andchemical phase analyses, indicate that the precipitates are 17, MC, M2 3C6 and G phase. TheMC and M2 3C6 are (Nb,Ti)C and Cr23C6 type carbides, respectively. As shown in Figure lb,the uniformly dispersed fine y precipitates are observed in the matrix, which contributes themain strengthening effect for the new alloy. The formation of cubic morphology can beattributed to the medium degree of 7-7' lattice mismatch. The average radium of is about15nm. INCONEL 740 is based an Ni-25Cr-20Co with Mo for solid solution strengthening and
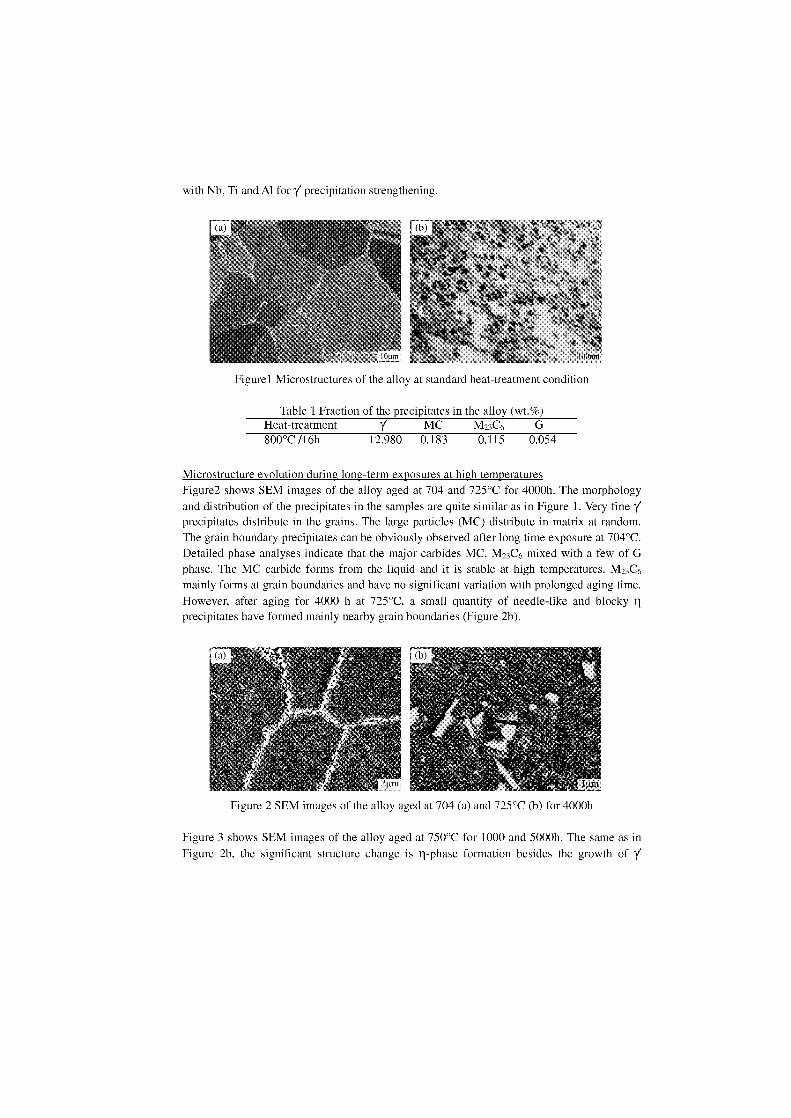
with Nb, Ti and Al for precipitation strengthening.
Figurel Microstructures of the alloy at standard heat-treatment condition
Table 1 Fraction of the precipitates in the alloy (wt.%)Heat-treatment MC M23C6800°C /16h 12.980 0.183 0.115 0.054
Microstructure evolution during long-term exposures at high temperatures Figure2 shows SEM images of the alloy aged at 704 and 725°C for 4000h. The morphologyand distribution of the precipitates in the samples are quite similar as in Figure 1. Very fineprecipitates distribute in the grains. The large particles (MC) distribute in matrix at random.The grain boundary precipitates can be obviously observed after long time exposure at 704°C.Detailed phase analyses indicate that the major carbides MC, M23C6 mixed with a few of Gphase. The MC carbide forms from the liquid and it is stable at high temperatures. M23C6mainly forms at grain boundaries and have no significant Variation with prolonged aging time.However, after aging for 4000 h at 725°C, a small quantity of needle-like and blockyprecipitates have formed mainly nearby grain boundaries (Figure 2b).
Figure 2 SEM images of the alloy aged at 704 (a) and 725°C (b) for 4000h
Figure 3 shows SEM images of the alloy aged at 750°C for 1000 and 5000h. The same as inFigure 2b, the significant structure change is ltphase formation besides the growth of
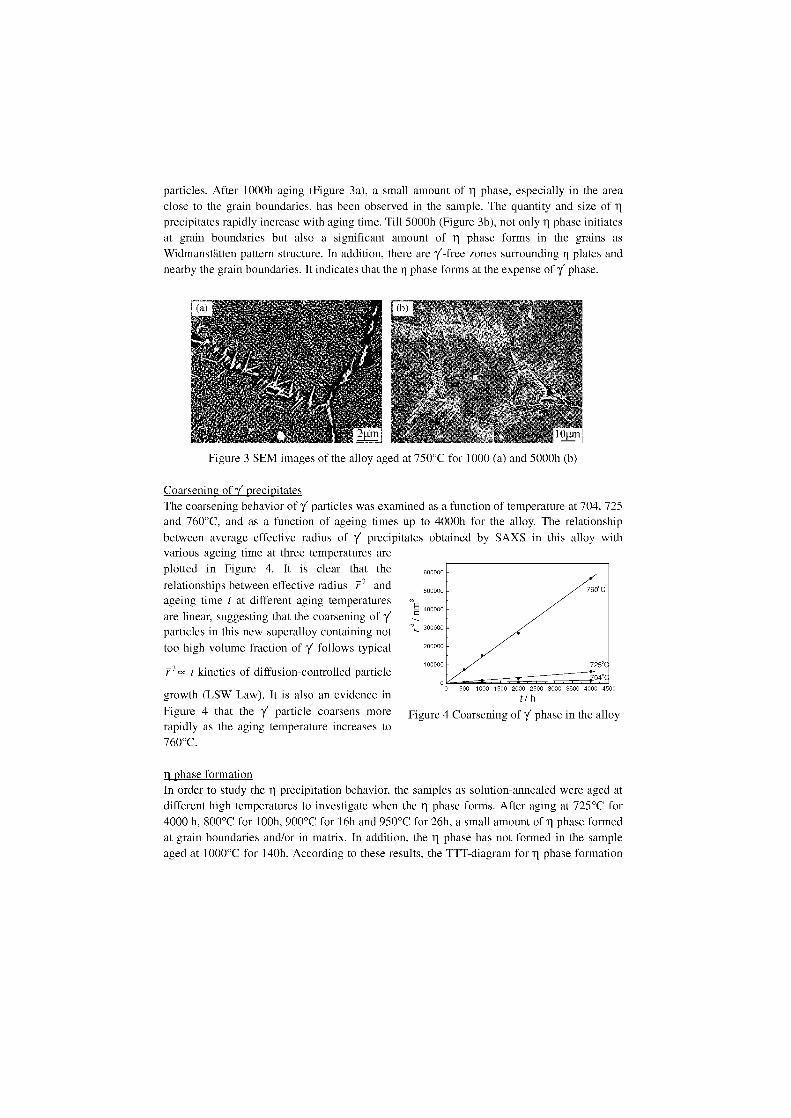
particles. After 1000h aging (Figure 3a), a small amount of phase, especially in the areadose to the grain boundaries, has been observed in the sample. The quantity and size of IIprecipitates rapidly increase with aging time. Till 5000h (Figure 3b), not only phase initiatesat grain boundaries but also a significant amount of rl phase forms in the grains asWidmanstätten pattern structure. In addition, there are y'-free zones surrounding rl plates andnearby the grain boundaries. lt indicates that the rl phase forms at the expense of y' phase.
Figure 3 SEM images of the alloy aged at 750°C for 1000 (a) and 5000h (b)
Coarsening of y' precipitates The coarsening behavior of 7' particles was examined as a function of temperature at 704, 725and 760°C, and as a function of ageing times up to 4000h for the alloy. The relationshipbetween average effective radius of y' precipitates obtained by SAXS in this alloy withvarious ageing time at three temperatures areplotted in Figure 4. lt is clear that the 600000
relationships between effective radius T- 3 and500000
ageing time t at different aging temperaturesE 400000
are linear, suggesting that the coarsening of y'7,particles in this new superalloy containing not 300000
too high volume fraction of y' follows typical 200000
100000
t kinetics of diffusion-controlled particle
growth (LSW Law). lt is also an evidence inFigure 4 that the y' particle coarsens morerapidly as the aging temperature increases to760°C.
°O 500 1000 1500 2000 2500 3000 3500 4000 450C
h
Figure 4 Coarsening of y' phase in the alloy
rl phase formationIn order to study the rl precipitation behavior, the Samples as solution-annealed were aged atdifferent high temperatures to investigate when the II phase forms. After aging at 725°C for4000 h, 800°C for 100h, 900°C for 16h and 950°C for 26h, a small amount of 11 phase formedat grain boundaries ancl/or in matrix. In addition, the II phase has not formed in the sampleaged at 1000°C for 140h. According to these results, the TTT-diagram for II phase formation
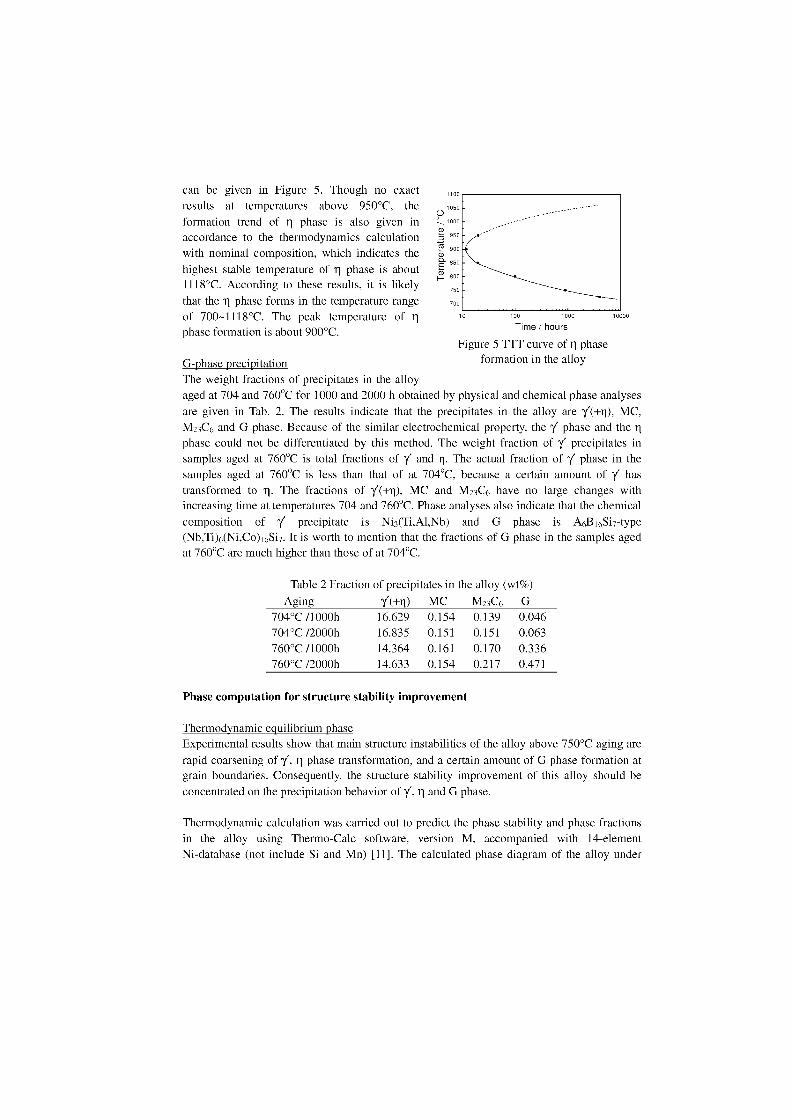
100 1000
10000
Time / hours
Figure 5 TTT curve of 11 phaseformation in the alloy
1100
0 1050
1000
9) 950
§ 900
eso
800
can be given in Figure 5. Though no exactresults at temperatures above 950°C, theformation trend of phase is also given inaccordance to the thermodynamics calculationwith nominal composition, which indicates thehighest stable temperature of ri phase is about1118°C. According to these results, it is likelythat the rl phase forms in the temperature rangeof 700-1118°C. The peak temperature of ri
phase formation is about 900°C.
G-phase precipitation The weight fractions of precipitates in the alloyaged at 704 and 760°C for 1000 and 2000 h obtained by physical and chemical phase analysesare given in Tab. 2. The results indicate that the precipitates in the alloy are MC,M23C6 and G phase. Because of the similar electrochemical property, the y phase and thephase could not be differentiated by this method. The weight fraction of 7' precipitates insamples aged at 760°C is total fractions of 7' and The actual fraction of y phase in thesamples aged at 760°C is less than that of at 704°C, because a certain amount of y hastransformed to .1. The fractions of Y(+1)), MC and M23C6 have no large changes withincreasing time at temperatures 704 and 760°C. Phase analyses also indicate that the chemicalcomposition of y precipitate is Ni3 (Ti,A1,Nb) and G phase is A6B16Si7-type(Nb,Ti) 6(Ni,Co) 16Si7 . lt is worth to mention that the fractions of G phase in the samples agedat 760°C are much higher than those of at 704°C.
Table 2 Fraction of precipitates in the alloy (wt%)Aging )7(+11) MC M23C6 G
704°C /1000h 16.629 0.154 0.139 0.046704°C /2000h 16.835 0.151 0.151 0.063760°C /1000h 14.364 0.161 0.170 0.336760°C /2000h 14.633 0.154 0.217 0.471
Phase computation for structure stability improvement
Thermodynamic equilibrium phaseExperimental results Show that main structure instabilities of the alloy above 750°C aging arerapid coarsening of y, phase transformation, and a certain amount of G phase formation atgrain boundaries. Consequently, the structure stability improvement of this alloy should beconcentrated an the precipitation behavior of y, 11 and G phase.
Thermodynamic calculation was carried out to predict the phase stability and phase fractionsin the alloy using Thermo-Calc software, version M, accompanied with 14-elementNi-database (not include Si and Mn) [11]. The calculated phase diagram of the alloy under
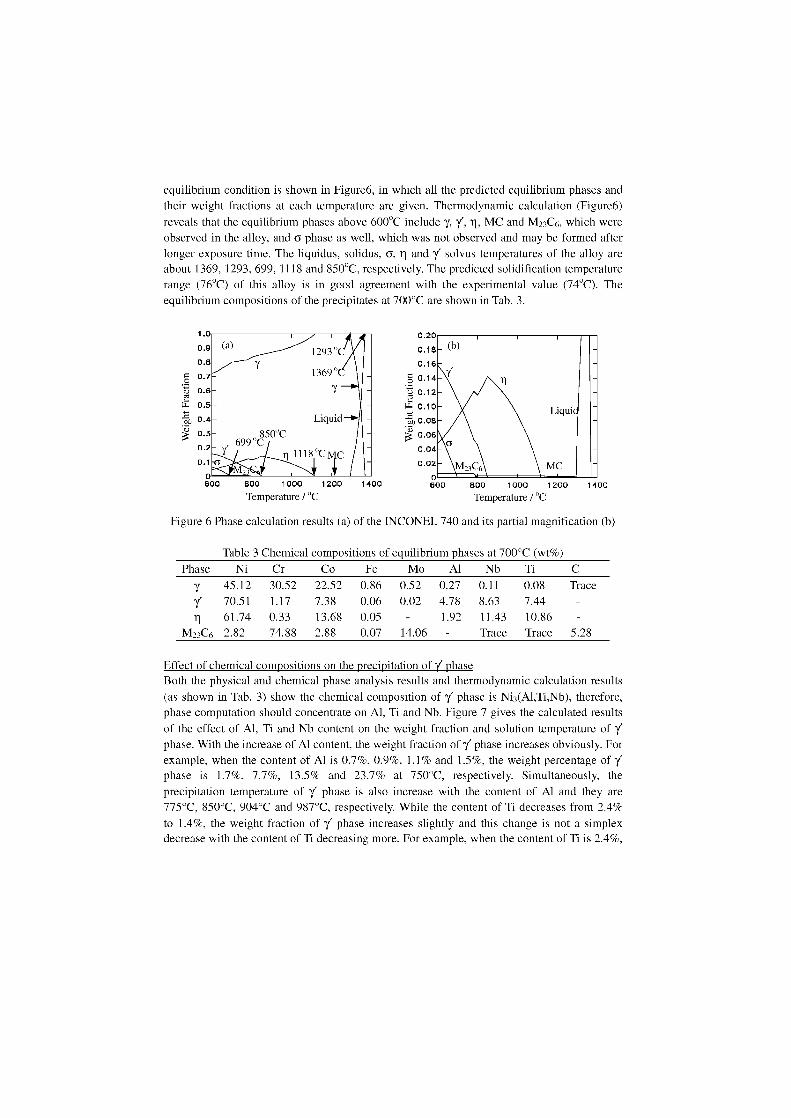
equilibrium condition is shown in Figure6, in which all the predicted equilibrium phases andtheir weight fractions at each temperature are given. Thermodynamic calculation (Figure6)reveals that the equilibrium phases above 600°C include 7, y', MC and M23C6, which wereobserved in the alloy, and 6 phase as well, which was not observed and may be formed afterlonger exposure time. The liquidus, solidus, a, .11 and 7' solvus temperatures of the alloy areabout 1369, 1293, 699, 1118 and 850°C, respectively. The predicted solidification temperaturerange (76°C) of this alloy is in good agreement with the experimental value (74°C). Theequilibrium compositions of the precipitates at 700°C are shown in Tab. 3.
1.00.9 - (a) 1293°0.8 -0.7 - 1369°
125 0.6 -ü;' 0.5 -wj 0.4- Liquid-1>
0.30.20.1
0
--IS
850°C699°C
23
11180C/C
600 500 1000 1200 400Temperature /
0.200.180.16
g 0.140.12
4: 0.10
pq 0.087.3 0.06
0.040.02
0600 800 1000 1200 1400
Temperature /
-Liqui
MC
Figure 6 Phase calculation results (a) of the INCONEL 740 and its partial magnification (b)
Table 3 Chemical compositions of equilibrium phases at 700°C (wt%)Phase Ni Cr Co Fe Mo Al Nb Ti C
y 45.12 30.52 22.52 0.86 0.52 0.27 0.11 0.08 Tracey 70.51 1.17 7.38 0.06 0.02 4.78 8.63 7.44 -i 61.74 0.33 13.68 0.05 - 1.92 11.43 10.86
M23C6 2.82 74.88 2.88 0.07 14.06 Trace Trace 5.28
Effect of chemical compositions on the precipitation of y phaseBoth the physical and chemical phase analysis results and thermodynamic calculation results(as shown in Tab. 3) Show the chemical composition of y' phase is Ni3 (A1,Ti,Nb), therefore,phase computation should concentrate on Al, Ti and Nb. Figure 7 gives the calculated resultsof the effect of Al, Ti and Nb content on the weight fraction and solution temperature of 1/'phase. With the increase of Al content, the weight fraction of 7' phase increases obviously. Forexample, when the content of Al is 0.7%, 0.9%, 1.1% and 1.5%, the weight percentage of y'phase is 1.7%, 7.7%, 13.5% and 23.7% at 750°C, respectively. Simultaneously, theprecipitation temperature of y' phase is also increase with the content of Al and they are775°C, 850°C, 904°C and 987°C, respectively. While the content of Ti decreases from 2.4%to 1.4%, the weight fraction of 7' phase increases slightly and this change is not a simplexdecrease with the content of Ti decreasing more. For example, when the content of Ti is 2.4%,
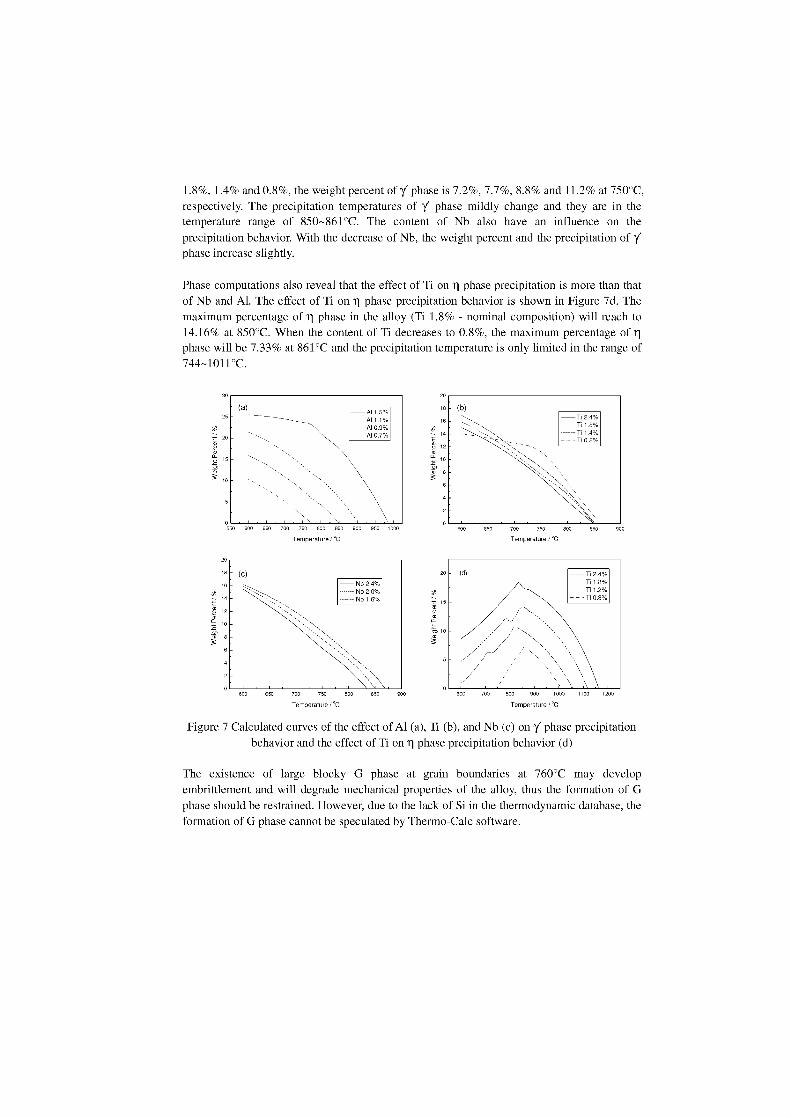
30
25
7
,3 20
10
20
18
16
14
Nb 2.4%Nb 2.0%Nb 1.6%
Al 1.5%Al 1.1%Al 0.9%Al 0.7%
10
8
4
2
0900
20
18
16
14
- T12.4% Ti 1.8%
Ti 1.4%Ti 0.8%
▪ 10
8
6
900
20 T 2.4%Ti 1.8%T 1.2%Ti 0.8%
5::1 1•
10
5
0600 1200
Temperature rC
1.8%, 1.4% and 0.8%, the weight percent of phase is 7.2%, 7.7%, 8.8% and 11.2% at 750°C,respectively. The precipitation temperatures of phase mildly change and they are in thetemperature range of 850-861°C. The content of Nb also have an influence on theprecipitation behavior. With the decrease of Nb, the weight percent and the precipitation ofphase increase slightly.
Phase computations also reveal that the effect of Ti on 11 phase precipitation is more than thatof Nb and Al. The effect of Ti on rl phase precipitation behavior is shown in Figure 7d. Themaximum percentage of phase in the alloy (Ti 1.8% - nominal composition) will reach to14.16% at 850°C. When the content of Ti decreases to 0.8%, the maximum percentage of 11
phase will be 7.33% at 861°C and the precipitation temperature is only limited in the range of744-1011°C.
Figure 7 Calculated curves of the effect of Al (a), Ti (b), and Nb (c) on phase precipitationbehavior and the effect of Ti on rl phase precipitation behavior (d)
The existence of large blocky G phase at grain boundaries at 760°C may developembrittlement and will degrade mechanical properties of the alloy, thus the formation of Gphase should be restrained. However, due to the lack of Si in the thermodynamic database, theformation of G phase cannot be speculated by Thermo-Calc software.
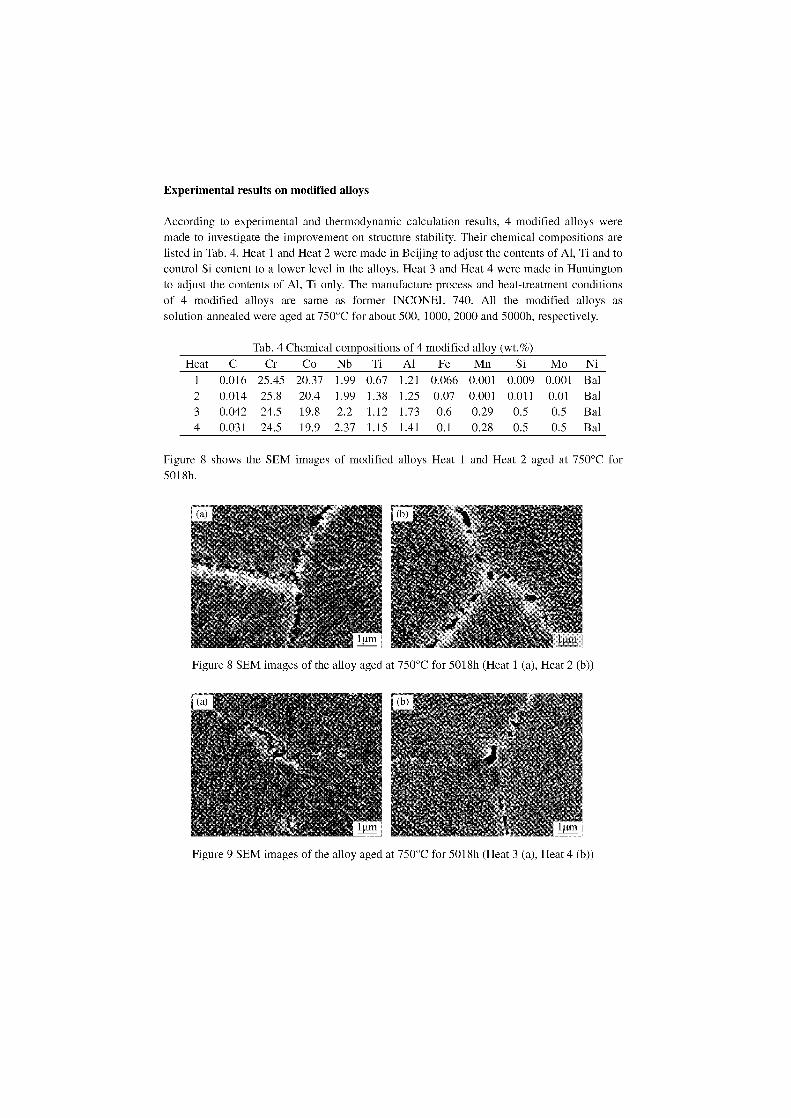
Experimental results on modified alloys
According to experimental and thermodynamic calculation results, 4 modified alloys weremade to investigate the improvement on structure stability. Their chemical compositions arelisted in Tab. 4. Heat 1 and Heat 2 were made in Beijing to adjust the contents of Al, Ti and tocontrol Si content to a lower level in the alloys. Heat 3 and Heat 4 were made in Huntingtonto adjust the contents of Al, Ti only. The manufacture process and heat-treatment conditionsof 4 modified alloys are same as former INCONEL 740. All the modified alloys assolution-annealed were aged at 750°C for about 500, 1000, 2000 and 5000h, respectively.
Tab. 4 Chemical compositions of 4 modified alloy (wt.%)Heat C Cr Co Nb Ti Al Fe Mn Si Mo Ni
1 0.016 25.45 20.37 1.99 0.67 1.21 0.066 0.001 0.009 0.001 Bal2 0.014 25.8 20.4 1.99 1.38 1.25 0.07 0.001 0.011 0.01 Bal3 0.042 24.5 19.8 2.2 1.12 1.73 0.6 0.29 0.5 0.5 Bal4 0.031 24.5 19.9 2.37 1.15 1.41 0.1 0.28 0.5 0.5 Bal
Figure 8 Shows the SEM images of modified alloys Heat 1 and Heat 2 aged at 750°C for5018h.
Figure 8 SEM images of the alloy aged at 750°C for 5018h (Heat 1 (a), Heat 2 (b))
Figure 9 SEM images of the alloy aged at 750°C for 5018h (Heat 3 (a), Heat 4 (b))
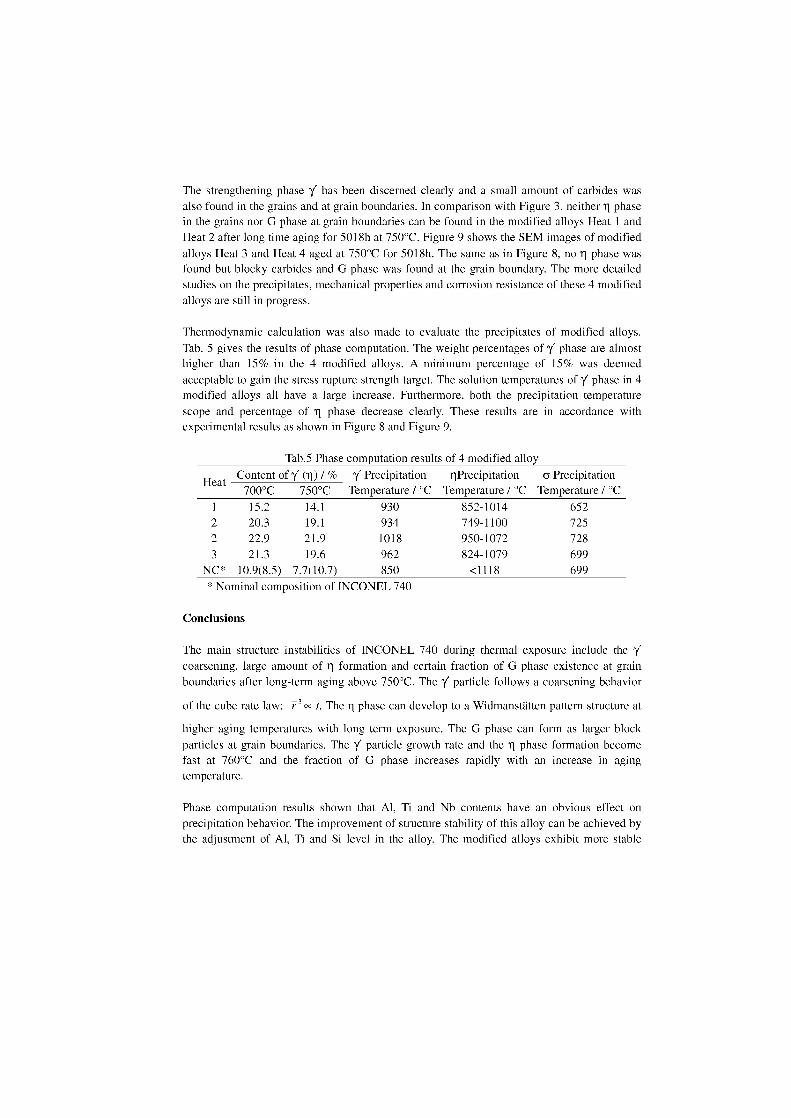
The strengthening phase y' has been discerned clearly and a small amount of carbides wasalso found in the grains and at grain boundaries. In comparison with Figure 3, neither il phasein the grains nor G phase at grain boundaries can be found in the modified alloys Heat 1 andHeat 2 after long time aging for 5018h at 750°C. Figure 9 shows the SEM images of modifiedalloys Heat 3 and Heat 4 aged at 750°C for 5018h. The same as in Figure 8, no phase wasfound but blocky carbides and G phase was found at the grain boundary. The more detailedstudies on the precipitates, mechanical properties and corrosion resistance of these 4 modifiedalloys are still in progress.
Thermodynamic calculation was also made to evaluate the precipitates of modified alloys.Tab. 5 gives the results of phase computation. The weight percentages of 7' phase are almosthigher than 15% in the 4 modified alloys. A minimum percentage of 15% was deemedacceptable to gain the stress rupture strength target. The solution temperatures of y phase in 4modified alloys all have a large increase. Furthermore, both the precipitation temperaturescope and percentage of phase decrease clearly. These results are in accordance withexperimental results as shown in Figure 8 and Figure 9.
Tab.5 Phase computation results of 4 modified alloy Content of y' (ri) / % y' Precipitation riPrecipitation a Precipitation
Heat700°C 750°C Temperature / °C Temperature / °C Temperature / °C
1 15.2 14.1 930 852-1014 6522 20.3 19.1 934 749-1100 7252 22.9 21.9 1018 950-1072 7283 21.3 19.6 962 824-1079 699
NC* 10.9(8.5) 7.7(10.7) 850 <1118 699* Nominal composition of INCONEL 740
Conclusions
The main structure instabilities of INCONEL 740 during thermal exposure include the 7'coarsening, large amount of formation and certain fraction of G phase existence at grainboundaries after long-term aging above 750°C. The 'y' particle follows a coarsening behavior
of the cube rate law: t. The rl phase can develop to a Widmanstätten pattern structure at
higher aging temperatures with long term exposure. The G phase can form as larger blockparticles at grain boundaries. The 7' particle growth rate and the phase formation becomefast at 760°C and the fraction of G phase increases rapidly with an increase in agingtemperature.
Phase computation results shown that Al, Ti and Nb contents have an obvious effect onprecipitation behavior. The improvement of structure stability of this alloy can be achieved bythe adjustment of Al, Ti and Si level in the alloy. The modified alloys exhibit more stable
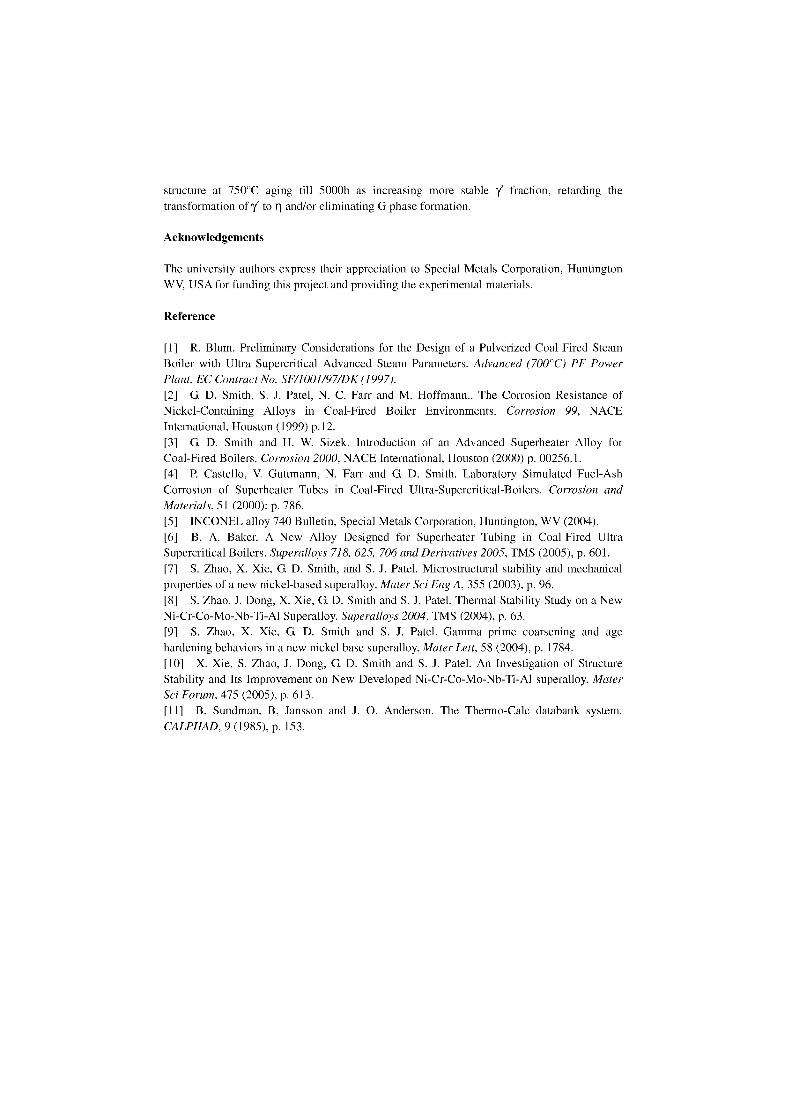
structure at 750°C aging till 5000h as increasing more stable fraction, retarding thetransformation of 7' to .11 and/or eliminating G phase formation.
Acknowledgements
The university authors express their appreciation to Special Metals Corporation, HuntingtonWV, USA for funding this project and providing the experimental materials.
Reference
[1] R. Blum. Preliminary Considerations for the Design of a Pulverized Coal Fired SteamBoiler with Ultra Supercritical Advanced Steam Parameters. Advanced (700°C) PF PowerPlant, EC Contract No. SF/1001/97/DK (1997).[2] G. D. Smith, S. J. Patel, N. C. Farr and M. Hoffmann.. The Corrosion Resistance ofNickel-Containing Alloys in Coal-Fired Boiler Environments. Corrosion 99, NACEInternational, Houston (1999) p.12.[3] G. D. Smith and H. W. Sizek. lntroduction of an Advanced Superheater Alloy forCoal-Fired Boilers. Corrosion 2000, NACE International, Houston (2000) p. 00256.1.[4] P. Castello, V. Guttmann, N. Farr and G. D. Smith. Laboratory Simulated Fuel-AshCorrosion of Superheater Tubes in Coal-Fired Ultra-Supercritical-Boilers. Corrosion andMaterials, 51 (2000): p. 786.[5] INCONEL alloy 740 Bulletin, Special Metals Corporation, Huntington, WV (2004).[6] B. A. Baken A New Alloy Designed for Superheater Tubing in Coal-Fired UltraSupercritical Boilers. Superalloys 718, 625, 706 and Derivatives 2005, TMS (2005), p. 601.[7] S. Zhao, X. Xie, G D. Smith, and S. J. Patel. Microstructural stability and mechanicalproperties of a new nickel-based superalloy. Mater Sci Eng A, 355 (2003), p. 96.[8] S. Zhao, J. Dong, X. Xie, G. D. Smith and S. J. Patel. Thermal Stability Study on a NewNi-Cr-Co-Mo-Nb-Ti-Al Superalloy. Superalloys 2004, TMS (2004), p. 63.[9] S. Zhao, X. Xie, G. D. Smith and S. J. Patel. Gamma prime coarsening and agehardening behaviors in a new nickel base superalloy. Mater Lett, 58 (2004), p. 1784.[10] X. Xie, S. Zhao, J. Dong, G D. Smith and S. J. Patel. An Investigation of StructureStability and Its Improvement on New Developed Ni-Cr-Co-Mo-Nb-Ti-Al superalloy. MaterSci Forum, 475 (2005), p. 613.[11] B, Sundman, B, Jansson and J. 0. Anderson. The Thermo-Calc databank system.CALPHAD, 9 (1985), p. 153.
Chemistry Modifications of Inconel 706 for Improved MicrostructuralStability
D. Del Genovese, D. Mukherji l , J. Rösler I , V. Kindrachuk2, N. Wanderka2 and J. Banhart2
1 Institut für Werkstoffe, TU Braunschweig, Langer Kamp 8, 38106 Braunschweig, Germany2 Hahn-Meitner-Institut Berlin, Glienickerstr. 100, 14109 Berlin, Germany
Due to its combination of high mechanical strength with good fabricability and machinability, Inconel 706 isunder consideration for ultra high temperature steam turbine applications with prospective steam temperaturesup to 973 K. The alloy properties directly depend on the precipitation hardening system, which is based on thecoherent precipitation of two kinds of A3B-type compounds: the fcc Ni3 [Ti,Nb,A11 y' phase and the bctNi3 [Nb,Til y" phase. However, the 7' and 7" precipitates in this alloy exhibit a metastable character, andtransform to large laths of ri phase (hcp upon exposure at T > 923 K. This overageing process isaccompanied by an unacceptable loss of creep and tensile strength. In order to overcome this impasse, twodifferent stabilization concepts were probed. On the one hand, it was attempted to create a diffusion barrier in thematrix surrounding the 777" precipitates by adding Rhenium to the composition of Inconel 706. Rhenium isknown to effectively retard the 7' coarsening in cast single crystal Ni-base superalloys, as it strongly partitions tothe matrix. On the other hand, the [Ti+Alf[Nb] ratio of Inconel 706 was specifically refined in order tominimize the thermodynamical tendency to transformation of y'/y". This modification was associated with aredesign of the Inconel 706 chemistry, resulting in a new alloy, named DT706.The microstructures of Inconel 706, Re-modified 706, and DT706 were investigated by means of electronmicroscopy (SEM, TEM) and three-dimensional atom probe (3DAP) in the as-heat treated condition as well asafter long-term exposure at 1023 K. Results show that Rhenium was homogeneously dissolved in the matrix, butits partitioning ratio is too low to provide an effective obstacle to the y'/y" coarsening. In contrast, themicrostructural degradation in DT706 was retarded as compared to Inconel 706, although the formation of riphase was not completely suppressed.
Keywords: IN706, Chemistry modification, microstructure, SEM, TEM, 3DAP
1. Introduction
Although initially conceived as material for gas-turbine components in the aerospace industry,alloy 706 has been successively developed to substitute steels in large forging parts ofindustrial gas turbines [1, 2]. This development was driven by the quest for higher efficienciesin the electric utility rector, which requires higher operating temperatures and largermachines. Nonetheless, it has provided extreme challenges to the metal processing industry,since the size of the forgings for land based gas turbines exceeds the largest aircraft engine byalmost an order of magnitude [3]. The recent need for increased efficiency in the steamturbine industry could jack up the development of 706 one step further. For instance, theobjective of the European THERMIE project is to develop an ultrasupercritical (USC) steamturbine operating with steam inlet temperatures of 700°C and higher, aiming at athermodynamic efficiency of approximately 55% (today 48%). As steam turbine componentsare uncooled, substitution of currently employed ferritic steels in the hottest turbine sectionsconstitutes a complex proposition. The use of Ni-base wrought superalloys appears as alogical consequence, but indeed the transition from gas turbine to steam turbine uses is not astraightforward enterprise as it may seem. Several challenging requirements are in factintroduced, outpacing significantly the aeroengine needs. In particular, two aspects are ofdominant importance: the capability of manufacturing very large forgings (up to 50 tons) andan exceptional long term stability of the microstructure in the aimed temperature range, toensure stable mechanical performance over the entire operating life of the power plant.Among the commercial wrought nickel-iron-base superalloys, Inconel 706 Stands out for thisapplication because it combines high mechanical strength with good fabricability and
machinability. These properties directly relate to the precipitation hardening system of alloy706, which provides the desirable characteristic of delayed the hardening response duringexposure to precipitation temperatures [4]. Similarly to alloy Inconel 718, from which Inconel706 is derived, the primary precipitation hardening elements of 706 are niobium, titanium andaluminum. The balance between Niobium and Titanium has been judiciously chosen inInconel 706 to minimize the tendency of Segregation during solidification of the ingot, thusallowing the casting of larger ingots than those of Inconel 718. The austenitic Ni-Fe-Cr matrixof Inconel 706 is mainly strengthened by the precipitation of two kinds of coherent A3B-typecompounds: the tetragonal Ni3Nb y" phase (bct, D022 structure) and the cubic Ni3 [A1,Ti] y'phase (fcc, L1 2 structure). The major source of strengthening in Inconel 706 is y", resultingfrom coherency strain and caused by a relatively large lattice misfit between the tetragonalcell of y" and the cubic cell of the y matrix. Further, precipitation of intergranular Ni3Ti(hcp, D024 structure) platelets can occur in some heat treatment conditions. Theprecipitation is reported to stabilize the grain boundaries against environmental embrittlementand enhances the creep crack growth resistance of Inconel 706 up to three orders ofmagnitude compared to the unstabilized material [5].Although Inconel 706 exhibits an excellent manufacturability and adequate mechanicalproperties, a recent research study [6] has pointed out that Inconel 706 does not fully meet thestringent requirements of the aimed application. Namely, the thermal stability of 706 isinsufficient for Jong term service at 700°C, which leads to a dramatic loss of creep and tensilestrength. This deterioration is caused by the metastable character of the strengthening y' and y"precipitates, which rapidly transform upon exposure at temperatures > 700°C intosemicoherent p laths.In order to overcome this impasse, a compositional modification of 706 seems to benecessary. In this article we report on two different strategies for the optimization of themicrostructural stability. On the one hand, it was attempted to create a diffusion barrier in thematrix surrounding the 777" precipitates by adding Rhenium to the standard composition ofInconel 706. Rhenium is known to effectively retard the 7' coarsening in cast single crystalNi-Base superalloys, as it strongly partitions to the matrix. On the other hand, the chemistryof Inconel 706 was specifically refined in order to minimize the thermodynamical tendencyfor the transformation of 77y". As the stability of the metastable 7' phase depends, amongother factors, on the [Ti+A1]/[Nb] ratio of the alloy, a new alloy composition was designed,resulting in the alloy named DT706 presented here.This article reports on the microstructural characterisation of Inconel 706 and its twoderivative variants Re706 and DT706 in the as heat treated condition as well as after anoverageing treatment. In order to achieve a precise determination of the phase compositions,three dimensional atom probe (3DAP) was used to complement the measurements fromconventional scanning and transmission electron microscopes (SEM and TEM).
2. Experimental
2.1 Material & Heat TreatmentsThe compositions of the alloys used for this study are given in Tab. 1. The samples of Inconel706 were cut from a triple melted (VIM, ESR and VAR) and forged turbine disc supplied byAlstom Ltd. Switzerland. DT706 samples were sectioned from a double melted (VIM+VAR)forged bar (final dimensions: 65 x 30 x 900 mm 3 ) manufactured by Saarschmiede GmbH,Germany. The Re-modified alloy Re706 was a – 0.3 kg ingot manufactured in our laboratory.The ingot was VIM melted and cast into a plate-shaped mould. In order to achieve a fullrecrystallization in the subsequent stabilizing and ageing heat treatment, the plate was first
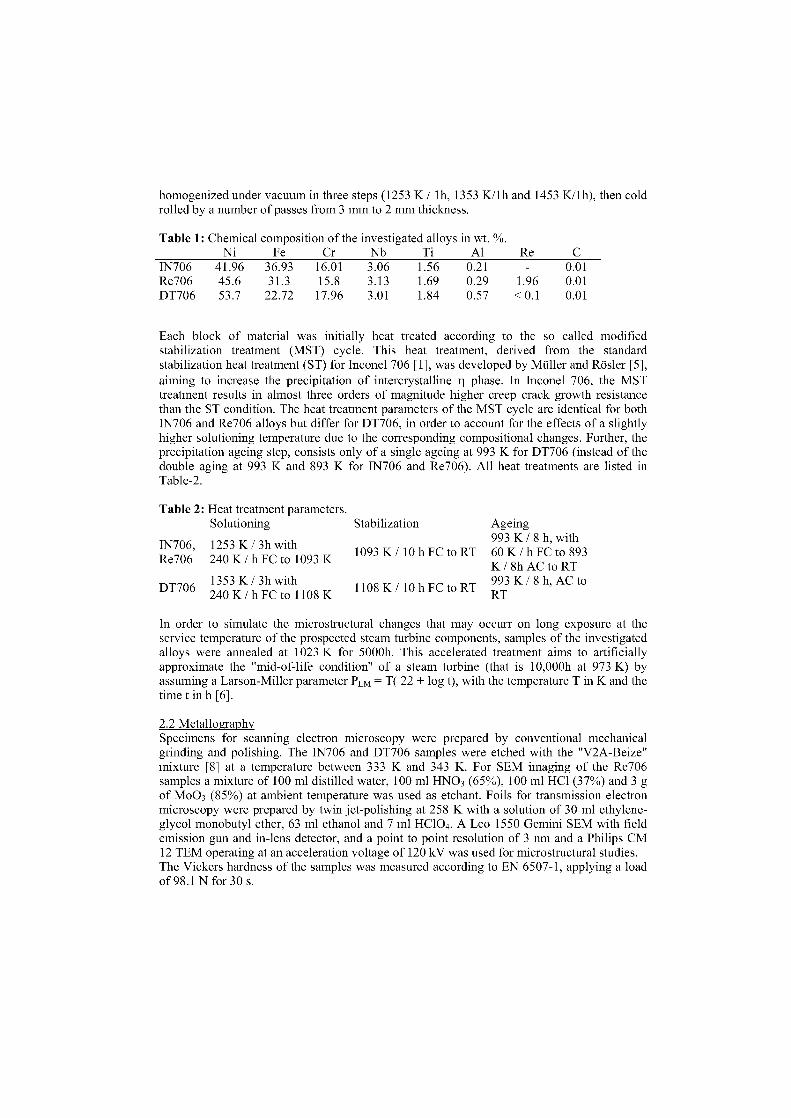
DT706
Table 2: Heat treatment parameters.Solutioning
1N706, 1253 K / 3h withRe706 240 K / h FC to 1093 K
1353 K / 3h with240K/hFCto 1108K
Stabilization
1093 K / 10 h FC to RT
1108K/10 hFCtoRT
Ageing993 K / 8 h, with60 K /hFC to 893K / 8h AC to RT993 K / 8 h, AC toRT
homogenized under vacuum in three steps (1253 K / lh, 1353 K/lh and 1453 K/1h), then coldrolled by a number of passes from 3 mm to 2 mm thickness.
Table 1: Chemical composition of the investigated alloys in wt. %.Ni Fe Cr Nb Ti Al Re C
IN706 41.96 36.93 16.01 3.06 1.56 0.21 0.01Re706 45.6 31.3 15.8 3.13 1.69 0.29 1.96 0.01DT706 53.7 22.72 17.96 3.01 1.84 0.57 < 0.1 0.01
Each block of material was initially heat treated according to the so called modifiedstabilization treatment (MST) cycle. This heat treatment, derived from the standardstabilization heat treatment (ST) for Inconel 706 [1], was developed by Müller and Rösler [5],aiming to increase the precipitation of intercrystalline phase. In Inconel 706, the MSTtreatment results in almost three orders of magnitude higher creep crack growth resistancethan the ST condition. The heat treatment parameters of the MST cycle are identical for both1N706 and Re706 alloys but differ for DT706, in order to account for the effects of a slightlyhigher solutioning temperature due to the corresponding compositional changes. Further, theprecipitation ageing step, consists only of a single ageing at 993 K for DT706 (instead of thedouble aging at 993 K and 893 K for IN706 and Re706). All heat treatments are listed inTable-2.
In order to simulate the microstructural changes that may occurr an long exposure at theservice temperature of the prospected steam turbine components, samples of the investigatedalloys were annealed at 1023 K for 5000h. This accelerated treatment aims to artificiallyapproximate the "mid-of-life condition" of a steam turbine (that is 10,000h at 973 K) byassuming a Larson-Miller parameter PLM = T( 22 + log t), with the temperature T in K and thetime t in h [6].
2.2 MetallographySpecimens for scanning electron microscopy were prepared by conventional mechanicalgrinding and polishing. The IN706 and DT706 samples were etched with the "V2A-Beize"mixture [8] at a temperature between 333 K and 343 K. For SEM imaging of the Re706samples a mixture of 100 ml distilled water, 100 ml HNO 3 (65%), 100 ml HC1 (37%) and 3 gof Mo03 (85%) at ambient temperature was used as etchant. Foils for transmission electronmicroscopy were prepared by twin jet-polishing at 258 K with a solution of 30 ml ethylene-glycol monobutyl ether, 63 ml ethanol and 7 ml HC1O 4. A Leo 1550 Gemini SEM with fieldemission gun and in-lens detector, and a point to point resolution of 3 nm and a Philips CM12 TEM operating at an acceleration voltage of 120 kV was used for microstructural studies.The Vickers hardness of the samples was measured according to EN 6507-1, applying a loadof 98.1 N for 30 s.
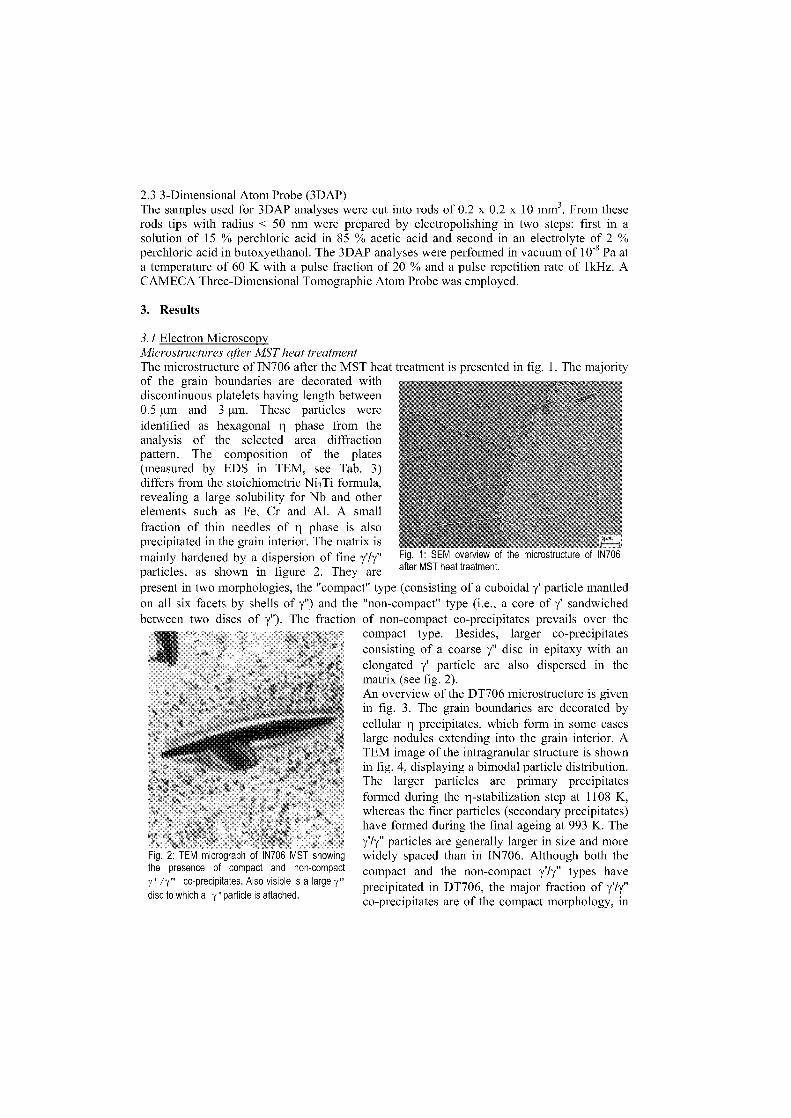
an all six facets by shells of y") and thebetween two discs of y"). The fraction
Fig. 2: TEM Turograph of 'Nipp 1v1ST showingthe presence of compact and non-compacty' /7" co-precipitates. Also visible is a large y"disc to which a y' particle is attached.
2.3 3-Dimensional Atom Probe (3DAP) The Samples used for 3DAP analyses were cut into rods of 0.2 x 0.2 x 10 mm 3 . From theserods tips with radius < 50 nm were prepared by electropolishing in two steps: first in asolution of 15 % perchloric acid in 85 acetic acid and second in an electrolyte of 2 %perchloric acid in butoxyethanol. The 3DAP analyses were performed in vacuum of 10-8 Pa ata temperature of 60 K with a pulse fraction of 20 % and a pulse repetition rate of 11(Hz. ACAMECA Three-Dimensional Tomographic Atom Probe was employed.
3. Results
3.1 Electron Microscopy Microstructures alter MST heat treatmentThe microstructure of 1N706 after the MST heat treatment is presented in fig. 1. The majorityof the grain boundaries are decorated withdiscontinuous platelets having length between0.5 pn and 3 p.m. These particles wereidentified as hexagonal 3l phase from theanalysis of the selected area diffractionpattern. The composition of the plates(measured by EDS in TEM, see Tab. 3)differs from the stoichiometric Ni 3 Ti formula,revealing a large solubility for Nb and otherelements such as Fe, Cr and Al. A Smallfraction of thin needles of p phase is alsoprecipitated in the grain interior. The matrix ismainly hardened by a dispersion of fine y'/y"particles, as shown in figure 2. They arepresent in two morphologies, the "compact" type (consisting of a cuboidal y' particle mantled
Fig. 1: SEM overview of the microstructure of IN706after MST heat treatment.
"non-compact" type (i.e., a core of y' sandwichedof non-compact co-precipitates prevails over thecompact type. Besides, larger co-precipitatesconsisting of a coarse y" disc in epitaxy with anelongated y' particle are also dispersed in thematrix (see fig. 2).An overview of the DT706 microstructure is givenin fig. 3. The grain boundaries are decorated bycellular p precipitates, which form in some caseslarge nodules extending into the grain interior. ATEM image of the intragranular structure is shownin fig. 4, displaying a bimodal particle distribution.The larger particles are primary precipitatesformed during the 1-stabilization step at 1108 K,whereas the finer particles (secondary precipitates)have formed during the final ageing at 993 K. They'/y" particles are generally larger in size and morewidely spaced than in 1N706. Although both thecompact and the non-compact y'/y" typen haveprecipitated in DT706, the major fraction of y'/y"co-precipitates are of the compact morphology, in
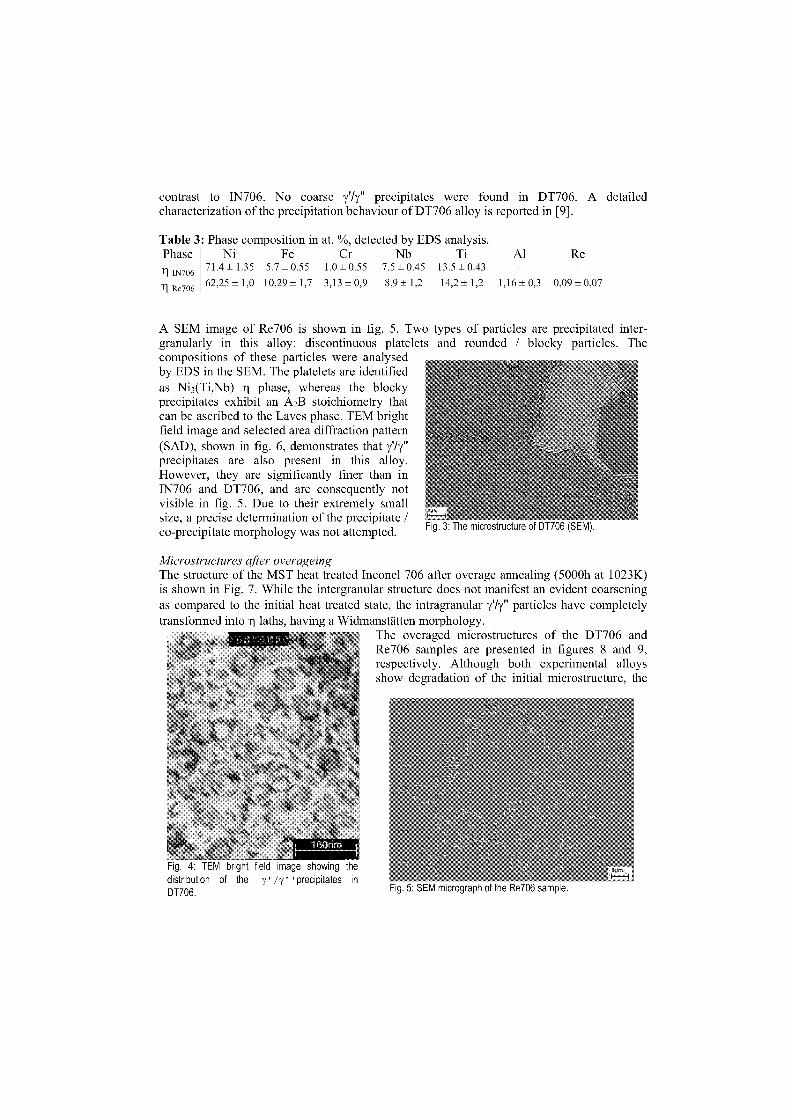
Fig. 3: Trio microsuucture 01 DT7u6 SEiv1).
contrast to 1N706. No coarse y77" precipitates were found in DT706. A detailedcharacterization of the precipitation behaviour of DT706 alloy is reported in [9].
Table 3: Phase composition in at. %, detected by EDS analysis.Phase Ni Fe Cr Nb Ti Al Re
71.4 + 1.35 5.7 + 0.55 1.0 + 0.55 7.5 + 0.45 13.5 + 0.431N706
-
62,25 + 1,0 10,29 + 1,7 3,13 + 0,9 8,9 + 1,2 14,2 + 1,2 1,16 + 0,3 0,09 + 0,07Re706
A SEM image of Re706 is shown in fig. 5. Two types of particles are precipitated inter-granularly in this alloy: discontinuous platelets and rounded / blocky particles. Thecompositions of these particles were analysedby EDS in the SEM. The platelets are identifiedas Ni3(Ti,Nb) phase, whereas the blockyprecipitates exhibit an A2B stoichiometry thatcan be ascribed to the Laves phase. TEM brightfield image and selected area diffraction pattern(SAD), shown in fig. 6, demonstrates that 77y"precipitates are also present in this alloy.However, they are significantly finer than in1N706 and DT706, and are consequently notvisible in fig. 5. Due to their extremely Smallsize, a precise determination of the precipitate /co-precipitate morphology was not attempted.
Microstructures after overageingThe structure of the MST heat treated Inconel 706 after overage annealing (5000h at 1023K)is shown in Fig. 7. While the intergranular structure does not manifest an evident coarseningas compared to the initial heat treated state, the intragranular y77" particles have completelytransformed into P laths, having a Widmanstätten morphology.
The overaged microstructures of the DT706 andRe706 Samples are presented in figures 8 and 9,respectively. Although both experimental alloysshow degradation of the initial microstructure, the
Fig. 4: TEIvi bright field image showing thedistribution of the 7' /y' precipitates inDT706. Fig. 5: SEM micrograph ot the Re 7U6 sample.
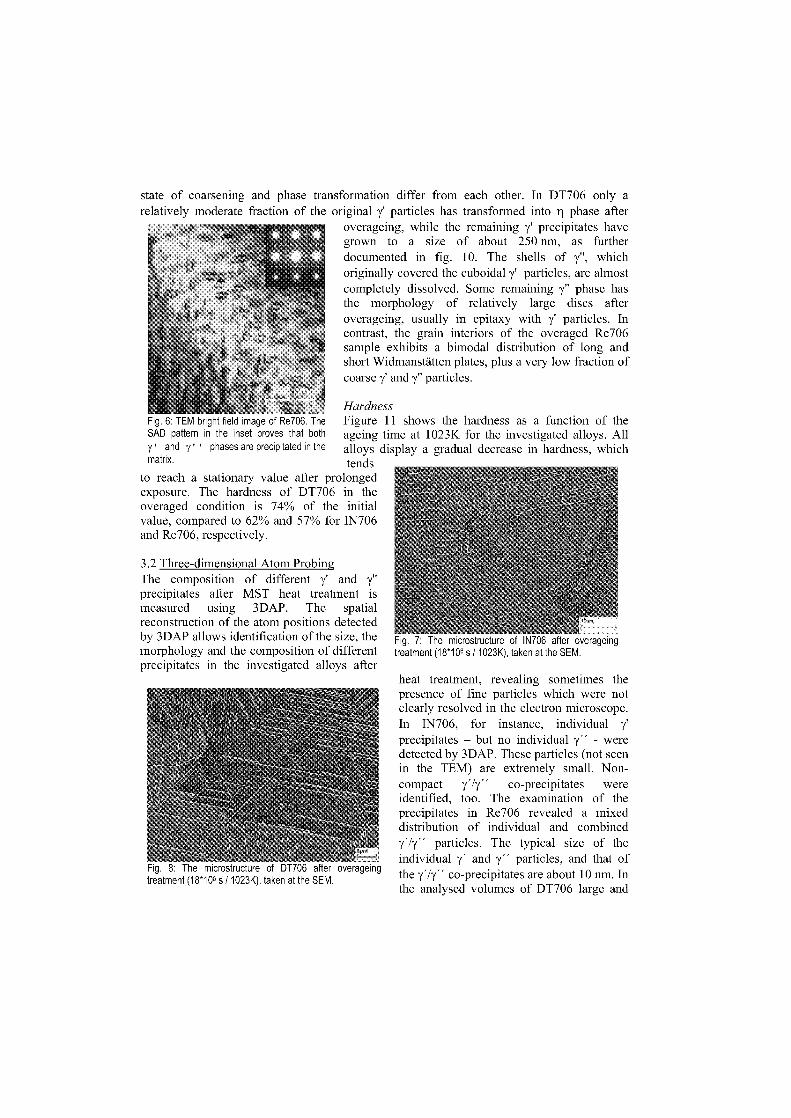
Fig. 6: TEM bright field image ot Re706. TheSAD pattern in the inset proves that bothy' and y' phases are precipitated in thematrix.
Fig. 7: The microstructure ot IN706 after overageingtreatment (18*10 6 s / 1023K), taken at the SEM.
state of coarsening and phase transformation differ from each other. In DT706 only arelatively moderate fraction of the original y' particles has transformed into phase after
overageing, while the remaining y' precipitates havegrown to a size of about 250 nm, as furtherdocumented in fig. 10. The shells of y", whichoriginally covered the cuboidal y' particles, are almostcompletely dissolved. Some remaining y" phase hasthe morphology of relatively large discs afteroverageing, usually in epitaxy with y' particles. Incontrast, the grain interiors of the overaged Re706sample exhibits a bimodal distribution of long andshort Widmanstätten plates, plus a very low fraction ofcoarse y' and y" particles.
Hardness
Figure 11 Shows the hardness as a function of theageing time at 1023K for the investigated alloys. Allalloys display a gradual decrease in hardness, whichtends
to reach a stationary value after prolongedexposure. The hardness of DT706 in theoveraged condition is 74% of the initialvalue, compared to 62% and 57% for 1N706and Re706, respectively.
3.2 Three-dimensional Atom ProbingThe composition of different y' and 7"precipitates after MST heat treatment ismeasured using 3DAP. The spatialreconstruction of the atom positions detectedby 3DAP allows identification of the size, themorphology and the composition of differentprecipitates in the investigated alloys after
Fig. 8: The microstructure of DT706 after overageingtreatment (1810 6 s / 1023K), taken at the SEM.
heat treatment, revealing sometimes thepresence of fine particles which were notclearly resolved in the electron microscope.In IN706, for instance, individual y'precipitates – but no individual y" - weredetected by 3DAP. These particles (not Seenin the TEM) are extremely small. Non-compact y7y" co-precipitates wereidentified, too. The examination of theprecipitates in Re706 revealed a mixeddistribution of individual and combined77y" particles. The typical size of theindividual 7' and y" particles, and that ofthe y' /y" co-precipitates are about 10 nm. Inthe analysed volumes of DT706 large and
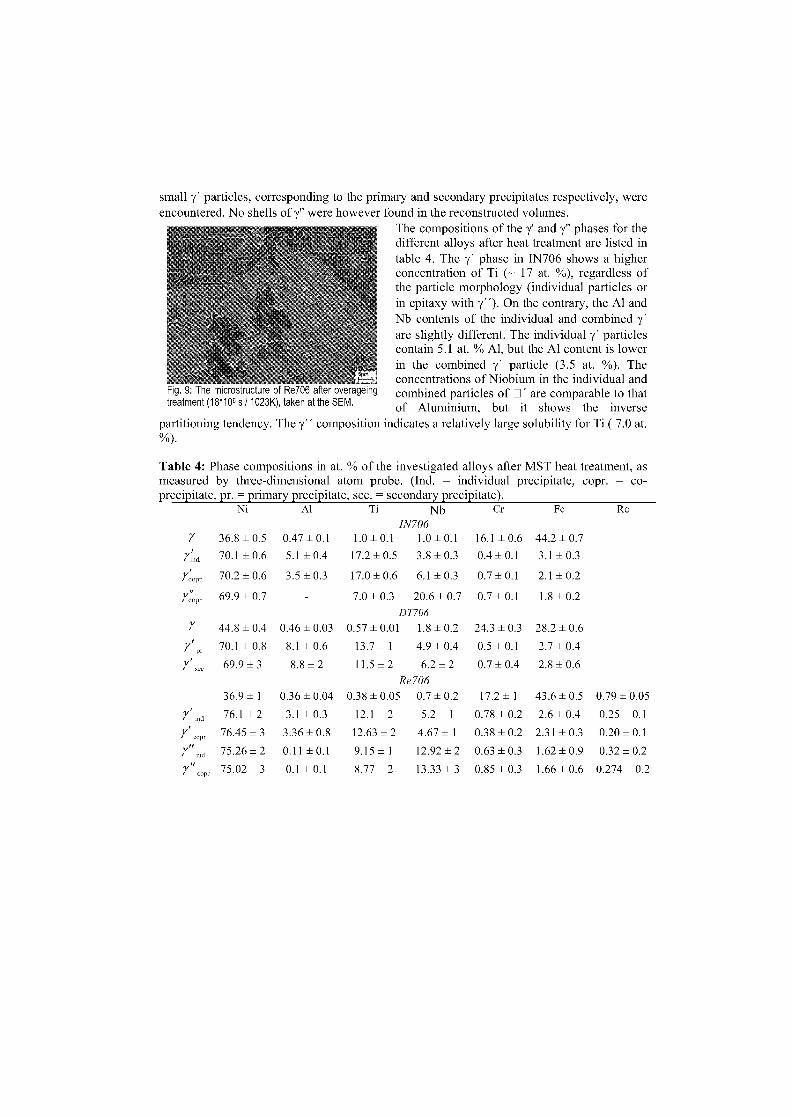
Fig. 1 ne microstructure ot ke7uo atter overageingtreatment (18*10 6 s / 1023K), taken at the SEM.
small y' particles, corresponding to the primary and secondary precipitates respectively, wereencountered. No shells of y" were however found in the reconstructed volumes.
The compositions of the y' and y" phases for thedifferent alloys after heat treatment are listed intable 4. The y' phase in 1N706 shows a higherconcentration of Ti (- 17 at. %), regardless ofthe particle morphology (individual particles orin epitaxy with y"). On the contrary, the Al andNb contents of the individual and combined y'are slightly different. The individual y' particlescontain 5.1 at. % Al, but the Al content is lowerin the combined 7' particle (3.5 at. %). Theconcentrations of Niobium in the individual andcombined particles of q are comparable to thatof Aluminium, but it shows the inverse
partitioning tendency. The y" composition indicates a relatively large solubility for Ti ( 7.0 at.%).
Table 4: Phase compositions in at. % of the investigated alloys after MST heat treatment, asmeasured by three-dimensional atom probe. (Ind. = individual precipitate, copr. = co-precipitate, pr. = primary precipitate, sec. = secondary precipitate).
Ni Al Ti Nb Cr Fe ReIN706
7 36.8 + 0.5 0.47 + 0.1 1.0 ± 0.1 1.0 + 0.1 16.1 ± 0.6 44.2 ± 0.7
lind 70.1 ± 0.6 5.1 ± 0.4 17.2 ± 0.5 3.8 ± 0.3 0.4 ± 0.1 3.1 ± 0.3
7',„pr 70.2 ± 0.6 3.5 ± 0.3 17.0 ± 0.6 6.1 ± 0.3 0.7 ± 0.1 2.1 ± 0.2
7:0„r 69.9 ± 0.7 7.0 ± 0.3 20.6 ± 0.7 0.7 ± 0.1 1.8 ± 0.2DT706
7 44.8 ± 0.4 0.46±0.03 0.57 + 0.01 1.8 ± 0.2 24.3 + 0.3 28.2 + 0.6
7 1 ,
,„
70.1 ± 0.8
69.9 ± 3
8.1 ± 0.6
8.8 ± 2
13.7 ± 1 4.9 ± 0.4
11.5 ± 2 6.2 ± 20.5 ± 0.1
0.7 ± 0.4
2.7 ± 0.4
2.8 ± 0.6Re706
36.9 ± 1 0.36 + 0.04 0.38 ± 0.05 0.7 1 0.2 17.2 1 1 43.6 ± 0.5 0.79 ± 0.05
md 76.1 1 2 3.1 ± 0.3 12.1 ± 2 5.2 ± 1 0.78 1 0.2 2.6 ± 0.4 0.25 ± 0.1
7',„"r
76.45 ± 3 3.36 ± 0.8 12.63 ± 2 4.67 ± 1 0.38 1 0.2 2.31 1 0.3 0.20 ± 0.1
7" 1„„ 75.26 + 2 0.11 + 0.1 9.15 + 1 12.92 ± 2 0.63 ± 0.3 1.62 ± 0.9 0.32 + 0.2
c„pr 75.02 ± 3 0.1 ± 0.1 8.77 ± 2 13.33 1 3 0.85 1 0.3 1.66 1 0.6 0.274 0.2
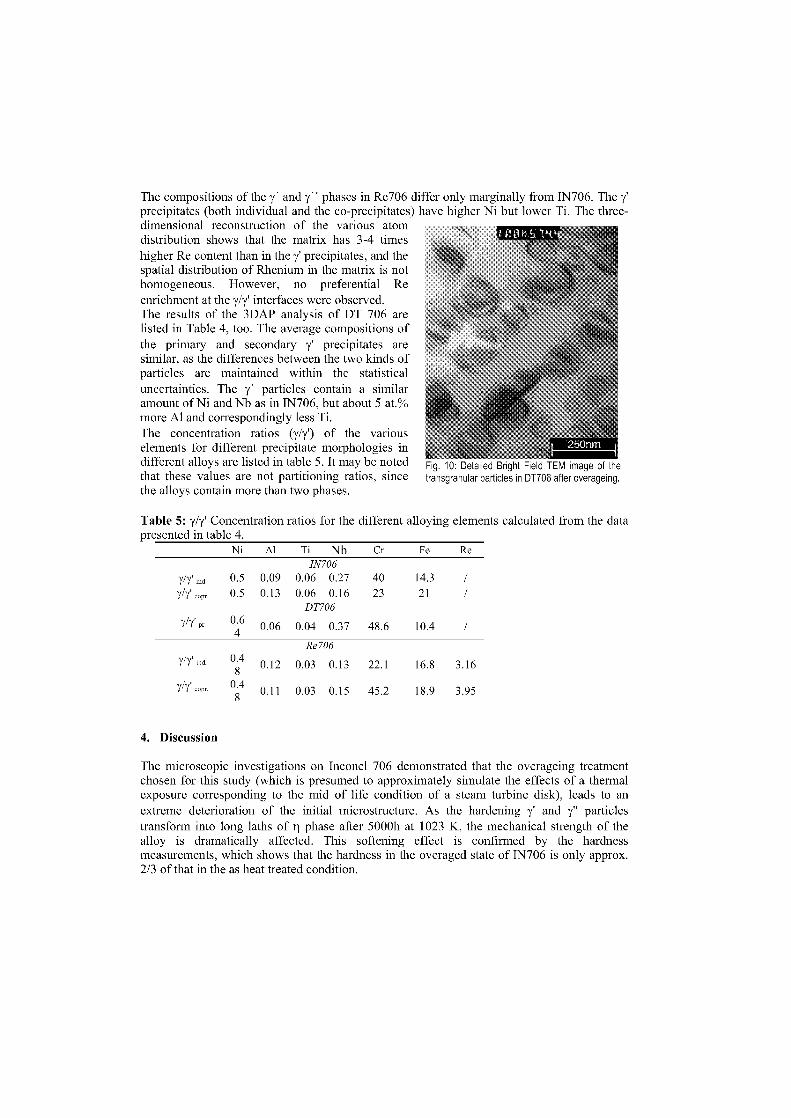
Fig. 10: Detailea Etrignt Fieia TEM image of thetransgranular particles in DT706 after overageing.
The compositions of the y' and y" phases in Re706 differ only marginally from 1N706. The y'precipitates (both individual and the co-precipitates) have higher Ni but lower Ti. The three-dimensional reconstruction of the various atomdistribution shows that the matrix has 3-4 timeshigher Re content than in the y' precipitates, and thespatial distribution of Rhenium in the matrix is nothomogeneous. However, no preferential Reenrichment at the y/y' interfaces were observed.The results of the 3DAP analysis of DT 706 arelisted in Table 4, too. The average compositions ofthe primary and secondary y' precipitates aresimilar, as the differences between the two kinds ofparticles are maintained within the statisticaluncertainties. The y' particles contain a similaramount of Ni and Nb as in 1N706, but about 5 at.%more Al and correspondingly less Ti.The concentration ratios (y/y') of the variouselements for different precipitate morphologies indifferent alloys are listed in table 5. It may be notedthat these values are not partitioning ratios, sincethe alloys contain more than two phases.
Table 5: y/y' Concentration ratios for the different alloying elements calculated from the datapresented in table 4.
Ni Al Ti Nb Cr Fe ReIN706
y/7' ind 0.5 0.09 0.06 0.27 40 14.3 /7/Y copr. 0.5 0.13 0.06 0.16 23 21 /
DT706
7/11' 0.64 0.06 0.04 0.37 48.6 10.4 /
Re706
y/7' md 0.48
0.12 0.03 0.13 22.1 16.8 3.16
7/y' copr. 0.48 0.11 0.03 0.15 45.2 18.9 3.95
4. Discussion
The microscopic investigations an Inconel 706 demonstrated that the overageing treatmentchosen for this study (which is presumed to approximately simulate the effects of a thermalexposure corresponding to the mid of life condition of a steam turbine dick), leads to anextreme deterioration of the initial microstructure. As the hardening y' and y" particlestransform into long laths of p phase after 5000h at 1023 K, the mechanical strength of thealloy is dramatically affected. This softening effect is confirmed by the hardnessmeasurements, which shows that the hardness in the overaged state of 1N706 is only approx.2/3 of that in the as heat treated condition.
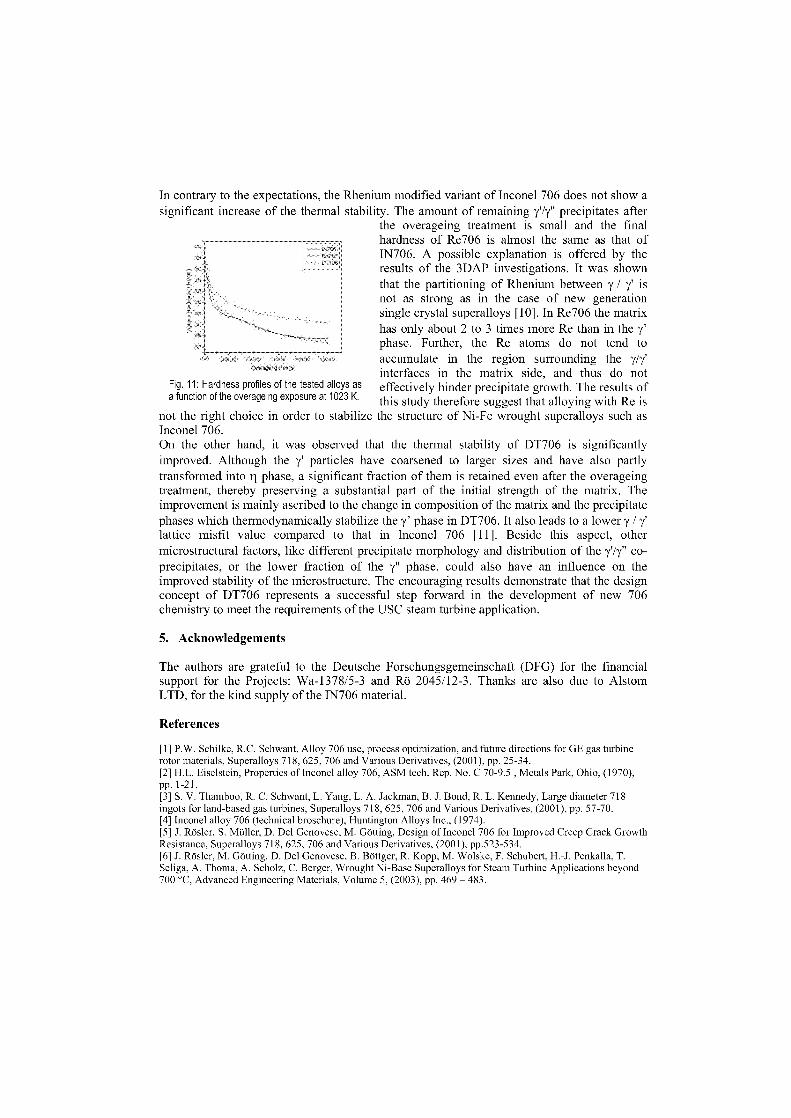
Fig. 11: Hardness profiles of the tested alloys as
In contrary to the expectations, the Rhenium modified variant of Inconel 706 does not show asignificant increase of the thermal stability. The amount of remaining 777" precipitates after
the overageing treatment is small and the finalhardness of Re706 is almost the same as that ofIN706. A possible explanation is offered by theresults of the 3DAP investigations. It was shownthat the partitioning of Rhenium between y / y' isnot as strong as in the case of new generationsingle crystal superalloys [10]. In Re706 the matrixhas only about 2 to 3 times more Re than in the y'phase. Further, the Re atoms do not tend toaccumulate in the region surrounding the 7/7'interfaces in the matrix side, and thus do noteffectively hinder precipitate growth. The results of
a function of the overageing exposure at 1023 K. this study therefore suggest that alloying with Re isnot the right choice in order to stabilize the structure of Ni-Fe wrought superalloys such asInconel 706.On the other hand, it was observed that the thermal stability of DT706 is significantlyimproved. Although the y' particles have coarsened to larger sizes and have also partlytransformed into fl phase, a significant fraction of them is retained even after the overageingtreatment, thereby preserving a substantial part of the initial strength of the matrix. Theimprovement is mainly ascribed to the change in composition of the matrix and the precipitatephases which thermodynamically stabilize the y' phase in DT706. It also leads to a lower y /lattice misfit value compared to that in Inconel 706 [11]. Beside this aspect, othermicrostructural factors, like different precipitate morphology and distribution of the y'/y" co-precipitates, or the lower fraction of the y" phase, could also have an influence an theimproved stability of the microstructure. The encouraging results demonstrate that the designconcept of DT706 represents a successful step forward in the development of new 706chemistry to meet the requirements of the USC steam turbine application.
5. Acknowledgements
The authors are grateful to the Deutsche Forschungsgemeinschaft (DFG) for the financialsupport for the Projects: Wa-1378/5-3 and Rö 2045/12-3. Thanks are also due to AlstomLTD, for the kind supply of the 1N706 material.
References
[1] P.W. Schilke, R.C. Schwant, Alloy 706 use, process optimization, and future directions for GE gas turbinerotor materials, Superalloys 718, 625, 706 and Various Derivatives, (2001), pp. 25-34.[2] H.L. Eiselstein, Properties of Inconel alloy 706, ASM tech. Rep. No. C 70-9.5 , Metals Park, Ohio, (1970),pp. 1-21.[3] S. V. Thamboo, R. C. Schwant, L. Yang, L. A. Jackman, B. J. Bond, R. L. Kennedy, Large diameter 718ingots for land-based gas turbines, Superalloys 718, 625, 706 and Various Derivatives, (2001), pp. 57-70.[4] Inconel alloy 706 (technical broschure), Huntington Alloys Inc., (1974).[5] J. Rösler, S. Müller, D. Del Genovese, M. Götting, Design of Inconel 706 for Improved Creep Crack GrowthResistance, Superalloys 718, 625, 706 and Various Derivatives, (2001), pp.523-534.[6] J. Rösler, M. Götting, D. Del Genovese, B. Böttger, R. Kopp, M. Wolske, F. Schubert, H.J. Penkalla, T.Seliga, A. Thoma, A. Scholz, C. Berger, Wrought Ni-Base Superalloys for Steam Turbine Applications beyond700 °C, Advanced Engineering Materials, Volume 5, (2003), pp. 469 – 483.

[7] D. Mukherji, P. Strunz, D. Del Genovese, R. Gilles, J. Rösler; A. Wiedenmann, Investigation ofmicrostructural changes in INCONEL 706 at high temperatures by in-situ small-angle neutron scattering, Metal.Mater. Trans. A, 34A, (2003), pp. 2781-2792.[8] G. Petzow, Metallographisches, keramographisches, plastographisches Ätzen, (1994), p. 241.[9] D. Del Genovese, P. Strunz, D. Mukherji, R. Gilles, J. Rösler, Microstructural Characterization of a Modified706-type Ni-Fe Superalloy by Small-Angle Neutron Scattering and Electron Microscopy, Metal. Mater. Trans.A, 36A, (2005), pp. 3439-3450.[10]D. Mukherji and J. Rösler, Effect of the y' volume fraction an the creep strength of Ni-bae superalloys, Z.Metallkd. 94 (2003) 478-484[11] M. Hoelzel, D. Del Genovese, R. Gilles, D. Mukherji, D.M. Toebbens, J. Roessler and H. Fuess, Phase analysisand lattice mismatches in superalloys DT706 and Iconel 706, Physica B (2006) in print.
CRACK GROWTH BEHAVIOUR OF WASPALOY AT 700 °C INDIFFERENT ATMOSPHERES
H.J. Penkalla, F. Schubert, L. Singheiser
Research Centre Jülich, Institute for Materials and Processes in Energy SystemD-52425 Jülich, Germany
Abstract:
An investigation of the fatigue and creep fatigue crack growth behaviour at 700 °C in vacuumand in air of the material Waspaloy is presented. Beside the presentation of the mechanicalproperties in form of crack growth raten a main aspect of this investigation is the observationof the micro structural processes near the crack tip and their dependency on the environment.Particularly hints for the SAGBO effect (stress accelerated grain boundary oxidation) wereobserved by transmission electron microscopy (TEM). A special method to prepare suitableTEM specimens from CT specimens with focused ion beam (F1B) was developed.
Keywords: Waspaloy, fatigue and creep fatigue crack growth, SAGBO effect, SEM and TEM
1. Introduction
The efficiency of fossil fired steam power plants can be markedly improved by the construc-tion of steam turbines with steam inlet temperatures of 700°C or above. The realisation ofultra supercritical steam cycle plants leads to an efficiency level of about 55% [1].
The application temperatures of advanced ferritic steels are limited to temperatures below650°C. lt seemed to be mandatory to use Ni-bare alloys for the hottest parts in an ultra-supercritical steam turbine. Following the trend to large engines (increased power supply)some parts, like the rotors, are increasing loaded by additional higher loadings due to theincreased centrifugal forces. A certain number of Ni-bare superalloys, which can withstandthese high temperature loadings, are known from the use in air-jet-turbine-engines. But due tothe expected component size (rotor discs with >1 m diameter) and weights (above 10 tons) thefabricability of this kind of components is still not satisfactorily solved. In a former researchprogram [2] some of the wrought superalloys have been examined concerning their potentialfor the application for rotors in steam turbine. The alloys are representative for 1) a solidsolution hardened material (Alloy 617) 2) for a y'-precipitation hardened superalloy(Waspaloy) and 3) for the Vy"-precipitation hardened Fe-Ni-base alloys (Inconel 706).
Beside the questions concerning fabricability (melting and remelting procedures, forgingprocedures) the high temperature behaviour of yield strength, the creep resistance and thecrack initiation and the crack growth at high temperature are the most important designcriterions for gas and steam turbine rotors. The crack growth behaviour under cyclic andsteady loading seems to be very dependent on the microstructural processes in and at the grainboundarie. For alloy 706, the crack growth can be too high due to environmental
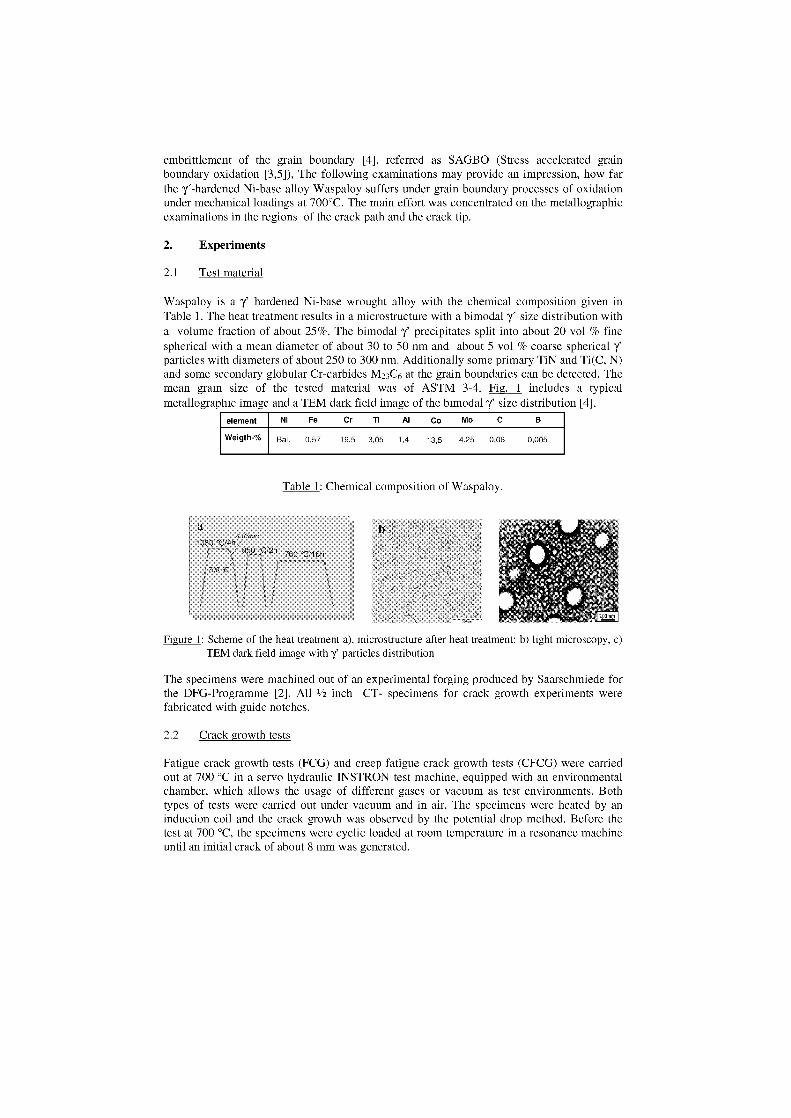
embrittlement of the grain boundary [4], referred as SAGBO (Stress accelerated grainboundary oxidation [3,5]), The following examinations may provide an impression, how farthe y'-hardened Ni-base alloy Waspaloy suffers under grain boundary processes of oxidationunder mechanical loadings at 700°C. The main effort was concentrated an the metallographicexaminations in the regions of the crack path and the crack tip.
2. Experiments
2.1 Test material
Waspaloy is a hardened Ni-base wrought alloy with the chemical composition given inTable 1. The heat treatment results in a microstructure with a bimodal 7'-size distribution witha volume fraction of about 25%. The bimodal 7' precipitates split into about 20 vol-% finespherical with a mean diameter of about 30 to 50 nm and about 5 vol-% coarse sphericalparticles with diameters of about 250 to 300 nm. Additionally some primary TiN and Ti(C, N)and some secondary globular Cr-carbides 1\42 3C6 at the grain boundaries can be detected. Themean grain size of the tested material was of ASTM 3-4. Fig. 1 includes a typicalmetallographic image and a TEM dark field image of the bimodal y' size distribution [4].
element Ni Fe Cr Ti Al Co Mo C B
Weigth-% Bal. 0,57 19,5 3,05 1,4 13,5 4,25 0,06 0,005
Table 1: Chemical composition of Waspaloy.
Figure 1: Scheme of the heat treatment a), microstructure after heat treatment: b) light microscopy, c)TEM dark field image with y' particles distribution
The specimens were machined out of an experimental forging produced by Saarschmiede forthe DFG-Programme [2]. All 1/2 inch CT- specimens for crack growth experiments werefabricated with guide notches.
2.2 Crack growth tests
Fatigue crack growth tests (FCG) and creep fatigue crack growth tests (CFCG) were carriedout at 700 °C in a servo hydraulic INSTRON test machine, equipped with an environmentalchamber, which allows the usage of different gases or vacuum as test environments. Bothtypen of tests were carried out under vacuum and in air. The specimens were heated by aninduction coil and the crack growth was observed by the potential drop method. Before thetest at 700 °C, the specimens were cyclic loaded at room temperature in a resonance machineuntil an initial crack of about 8 mm was generated.
The loading cycles of the FCG tests were of Sinus shape with a frequency of 5 Hz.. Theloading cycle of the CFCG test was a trapezoid cycle with 300 s dwell time at the maximumtensile load of 5.6 kN, 1 s uploading and downloading and 1 s dwell time at the minimumload of 0.5 kN. The R value was 0.1.
After the crack growth tests at 700 °C the specimens were post cyclic loaded within the highfrequency resonance machine at room temperature until final rupture. After the rupture thecrack length generated at 700 °C was determined under a light microscope for thenormalisation of the potential drop measurements results. After that the K ] values weredetermined by the program "Cracker" [5].
Two additional CFCG test were carried out to prepare TEM specimens from the area near thecrack tip and to demonstrate the change of crack growth rate with changing environment(vacuum and air). The first CFCG test was terminated after 1000 cycles in vacuum and the CTspecimen was directly prepared to TEM specimen. The other CFCG test was terminated after1200 cycles in vacuum, then cooled down to room temperature and deloaded to a minimumload of 0.5 kN. After changing the environment into air, the specimen was reheated andreloaded for further 900 cycles. The resulting crack length during this test was calculated bythe observed potential drop curve, which has been calibrated before the experiments with thepotential calibration curve. This specimen was also used for the later crack tip preparation forTEM ob servati on.
2.3 Micro structural investigations
The fracture modes and the resulting oxide scales at the surfaces of fracture branches wereinvestigated by light microscopy (LM) and by scanning electron microscopy (SEM). Aspecial software from PROIMAGE for light microscopy was used to create sharp images ofthe rough fracture surface with high magnification. Using a layer technique, this softwarereconstructs a sharp image from a set of images with different focal planes. This techniquewas important to observe the oxide scales near the crack tip of the broken specimens after theFCG and CFCG tests.
For SEM investigations a ZEISS Gemini 1540 scanning electron microscope was used.
2.4 Crack tip preparation by Focused Ion Beam (FIB)
For the investigation of the crack tip of the CFCG tests after the simulation an air ingress andthe propagation in air were terminated and not post ruptured at room temperature. In a firststep one side surface was grinded and polished to eliminate the crack guide notch. Thisprocedure was applied to observe the penetration depth of the crack under a light microscope.Then the CT specimen was cut under an angle of 45 ° to slices of about 2 mm thickness. Bythis way each slice contains a part of the crack and the crack front is now oriented about 45 °to the slice surface. This fact is important for the subsequent cutting of a TEM specimen andprevents a break of the very thin TEM specimen during the subsequent FIB preparation. Fig. 2demonstrates the procedure of CT specimen machining schematically. Fig. 3 Shows the pathof the diversified crack in the slice used for subsequent FIB preparation and the marks theprepared crack tip.
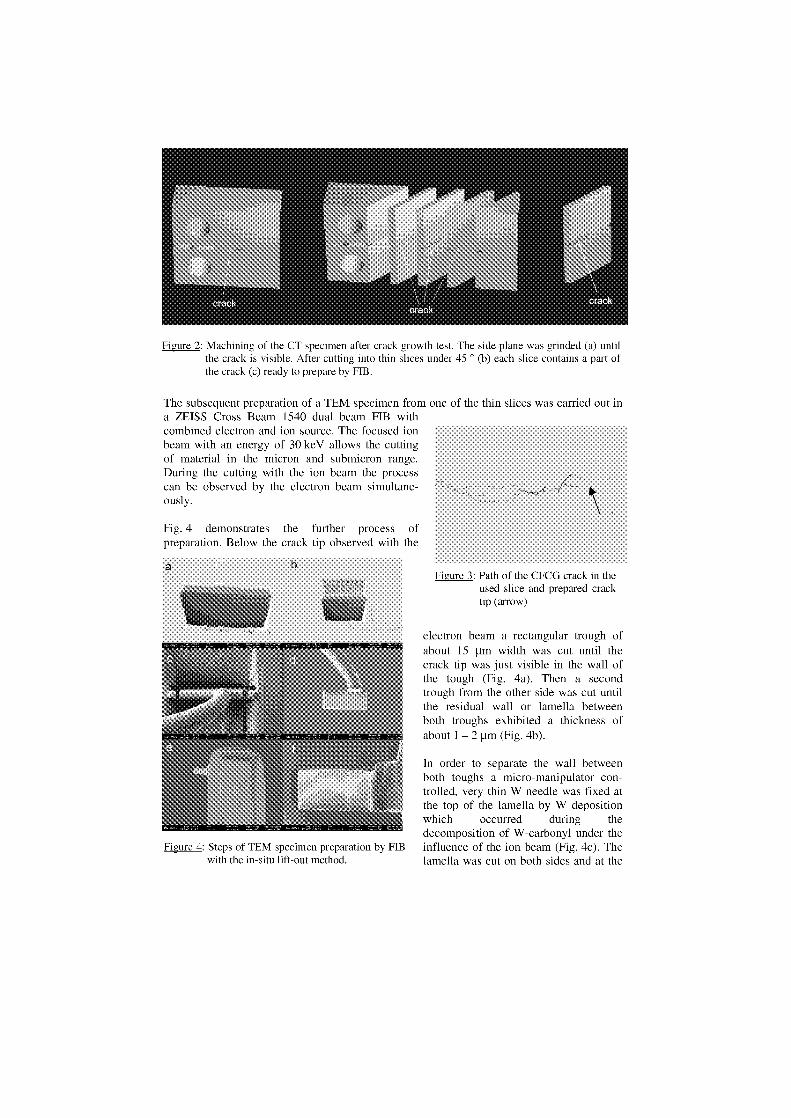
Figure 2: Machining of the CT specimen after crack growth test. The side plane was grinded (a) untilthe crack is visible. After cutting into thin slices under 45 ° (b) each slice contains a part ofthe crack (c) ready to prepare by HB.
The subsequent preparation of a TEM specimen from one of the thin slices was carried out ina ZEISS Cross Beam 1540 dual beam FIB withcombined electron and ion source. The focused ionbeam with an energy of 30 keV allows the cuttingof material in the micron and submicron range.During the cutting with the ion beam the processcan be observed by the electron beam simultane-ously.
Fig. 4 demonstrates the further process ofpreparation. Below the crack tip observed with the
b
Figure 4: Steps of TEM specimen preparation by FIBwith the in-situ lift-out method.
Figure 3: Path of the CFCG crack in theused slice and prepared cracktip (arrow)
electron beam a rectangular trough ofabout 15 pm width was cut until thecrack tip was just visible in the wall ofthe tough (Fig. 4a). Then a secondtrough from the other side was cut untilthe residual wall or lamella betweenboth troughs exhibited a thickness ofabout 1 – 2 gm (Fig. 4b).
In order to separate the wall betweenboth toughs a micro-manipulator con-trolled, very thin W needle was fixed atthe top of the lamella by W depositionwhich occurred during thedecomposition of W-carbonyl under theinfluence of the ion beam (Fig. 4c). Thelamella was cut an both sides and at the
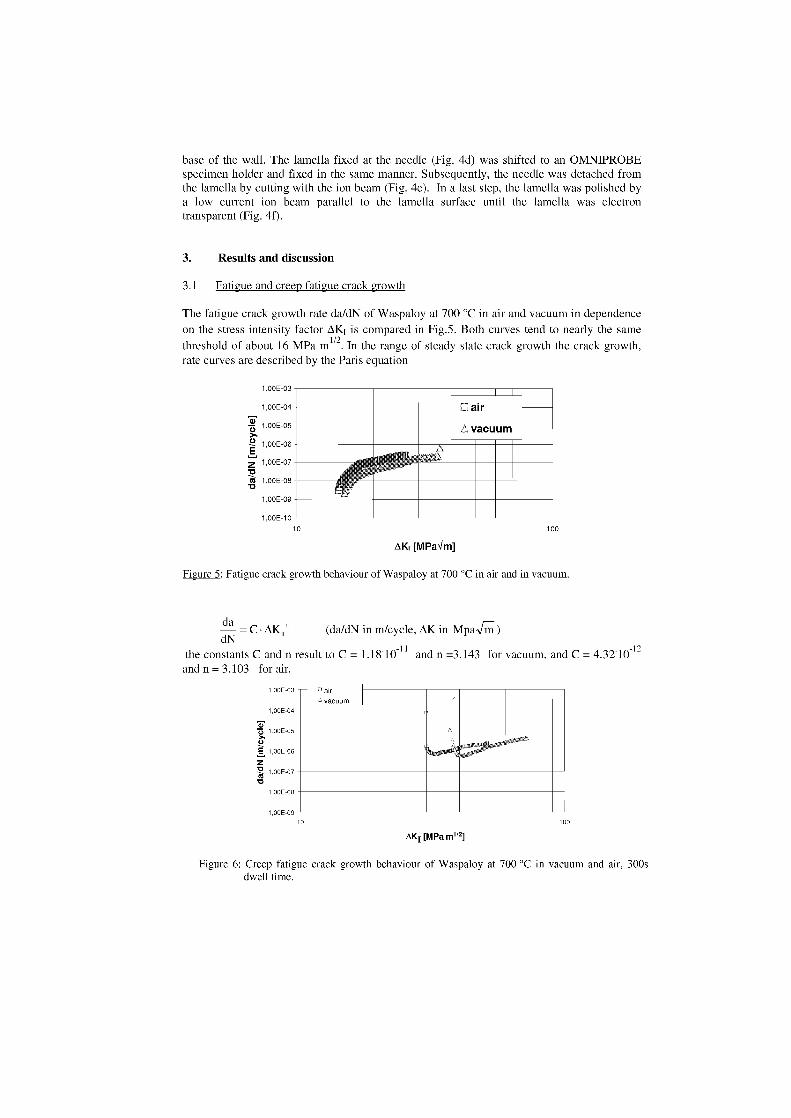
E 1,00E-06
z1:1 1,00E-07
1,00E-08
1,00E-09
7,77.)
Ez'Zu-m
1,00E 03
1,00E 04
1,00E 05
1,00E-06
1,00E 07
1,00E 08
1,00E-09
1,00E 10
bare of the wall. The lamella fixed at the needle (Fig. 4d) was shifted to an OMNIPROBEspecimen holder and fixed in the same manner. Subsequently, the needle was detached fromthe lamella by cutting with the ion beam (Fig. 4e). In a last step, the lamella was polished bya low current ion beam parallel to the lamella surface until the lamella was electrontransparent (Fig. 4f).
3. Results and discussion
3.1 Fatigue and crem fatigue crack growth
The fatigue crack growth rate da/cIN of Waspaloy at 700 °C in air and vacuum in dependencean the stress intensity factor AK I is compared in Fig.5. Both curves tend to nearly the samethreshold of about 16 MPa In the range of steady state crack growth the crack growth,rate curves are described by the Paris equation
11.11M■ZZIE10 100
AKI [MPaJm]
Figure 5: Fatigue crack growth behaviour of Waspaloy at 700 °C in air and in vacuum.
da= C • AK,' (da/dN in m/cycle, AK in Mpa- ‘7n )
dNthe constants C and n result to C = 1.18'10 11 and n =3.143 for vacuum, and C = 4.32'10 12
and n = 3.103 for air.
10
100
AKI [MPa m1/2]
Figure 6: Creep fatigue crack growth behaviour of Waspaloy at 700 °C in vacuum and air, 300sdwell time.
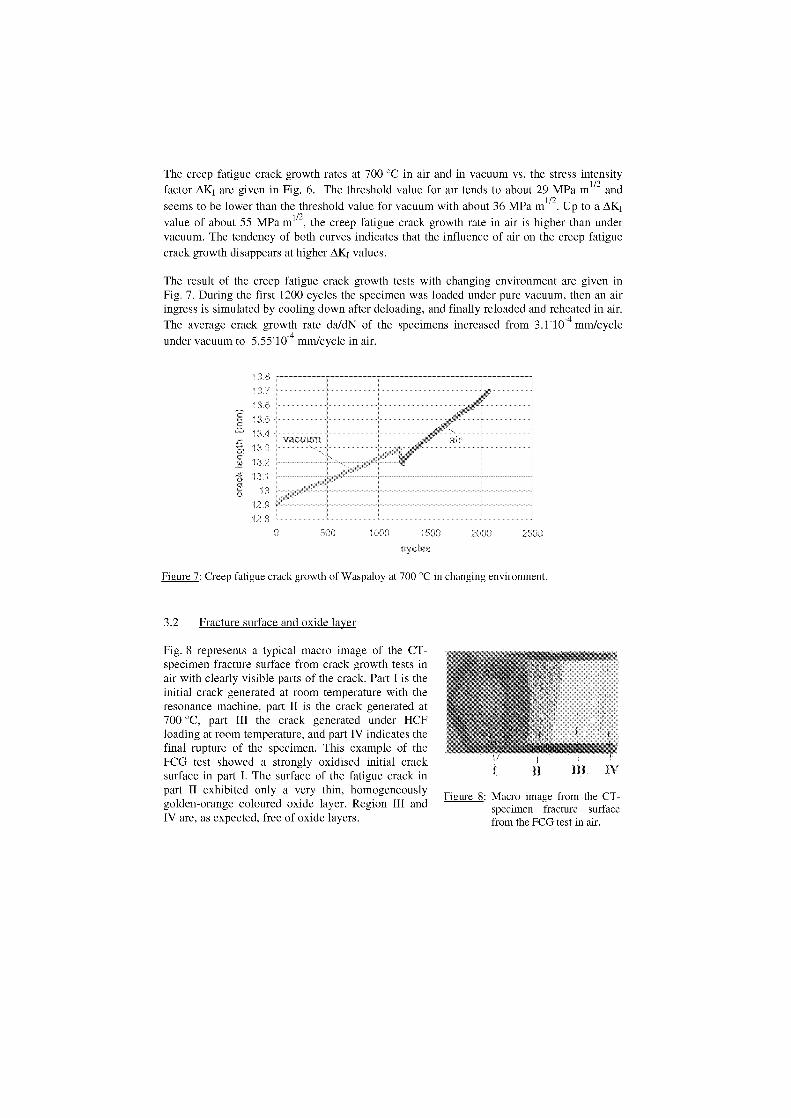
The creep fatigue crack growth rates at 700 °C in air and in vacuum vs. the stress intensityfactor AKI are given in Fig. 6. The threshold value for air tends to about 29 MPa m 112 andseems to be lower than the threshold value for vacuum with about 36 MPa m U2 . Up to a AKIvalue of about 55 MPa m !/2, the creep fatigue crack growth rate in air is higher than undervacuum. The tendency of both curves indicates that the influence of air an the creep fatiguecrack growth disappears at higher AKT values.
The result of the creep fatigue crack growth tests with changing environment are given inFig. 7. During the first 1200 cycles the specimen was loaded under pure vacuum, then an airingress is simulated by cooling down after deloading, and finally reloaded and reheated in air.The average crack growth rate da/dN of the specimens increased from 3.1'104 mm/cycleunder vacuum to 5.55'104 mm/cycle in air.
5e0 2500
Figure 7: Creep fatigue crack growth of Waspaloy at 700 °C in changing environment.
3.2 Fracture surface and oxide layer
Fig. 8 represents a typical macro image of the CT-specimen fracture surface from crack growth tests inair with clearly visible parts of the crack. Part I is theinitial crack generated at room temperature with theresonance machine, part II is the crack generated at700 °C, part 111 the crack generated under HCFloading at room temperature, and part IV indicates thefinal rupture of the specimen. This example of theFCG test showed a strongly oxidised initial cracksurface in part I. The surface of the fatigue crack inpart II exhibited only a very thin, homogeneouslygolden-orange coloured oxide layer. Region 111 andIV are, as expected, free of oxide layers.
Figure 8: Macro image from the CT-specimen fracture surfacefrom the FCG test in air.
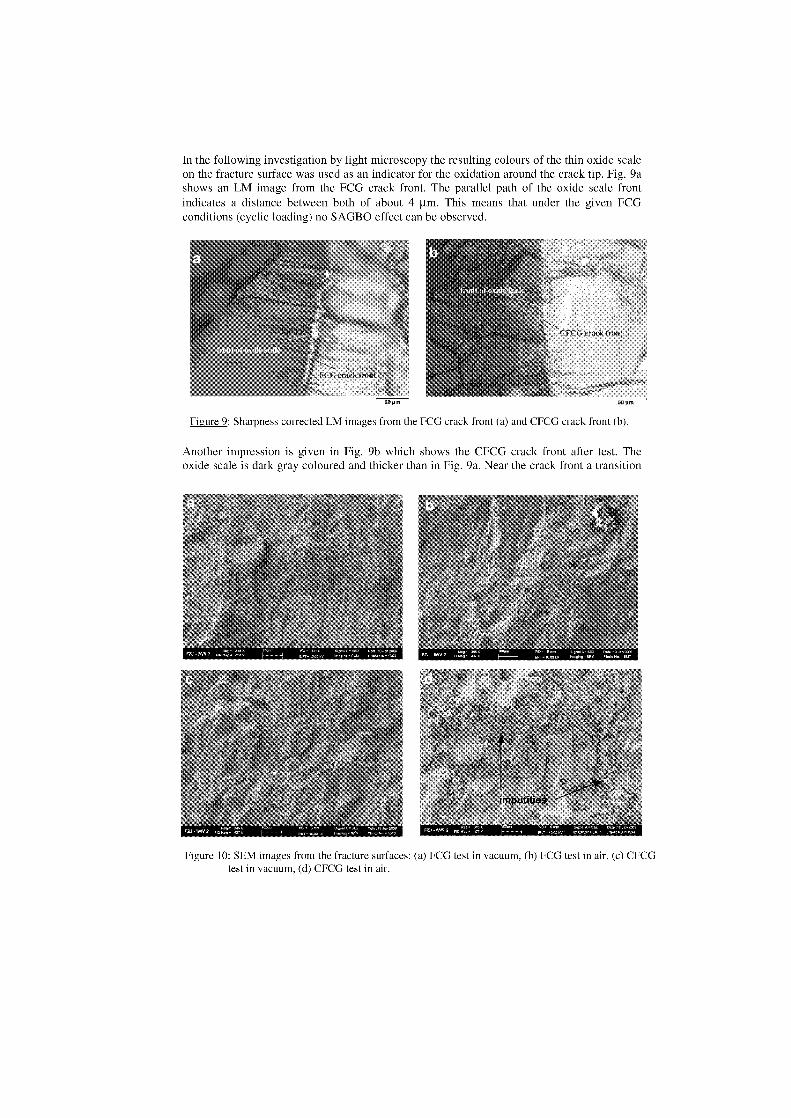
In the following investigation by light microscopy the resulting colours of the thin oxide scalean the fracture surface was used as an indicator for the oxidation around the crack tip. Fig. 9ashows an LM image from the FCG crack front. The parallel path of the oxide scale frontindicates a distance between both of about 4 ttm. This means that under the given FCGconditions (cyclic loading) no SAGBO effect can be observed.
Figure 9: Sharpness corrected LM images from the FCG crack front (a) and CFCG crack front (b).
Another impression is given in Fig. 9b which shows the CFCG crack front after test. Theoxide scale is dark gray coloured and thicker than in Fig. 9a. Near the crack front a transition
Figure 10: SEM images from the fracture surfaces: (a) FCG test in vacuum, (b) FCG test in air, (c) CFCGtest in vacuum, (d) CFCG test in air.
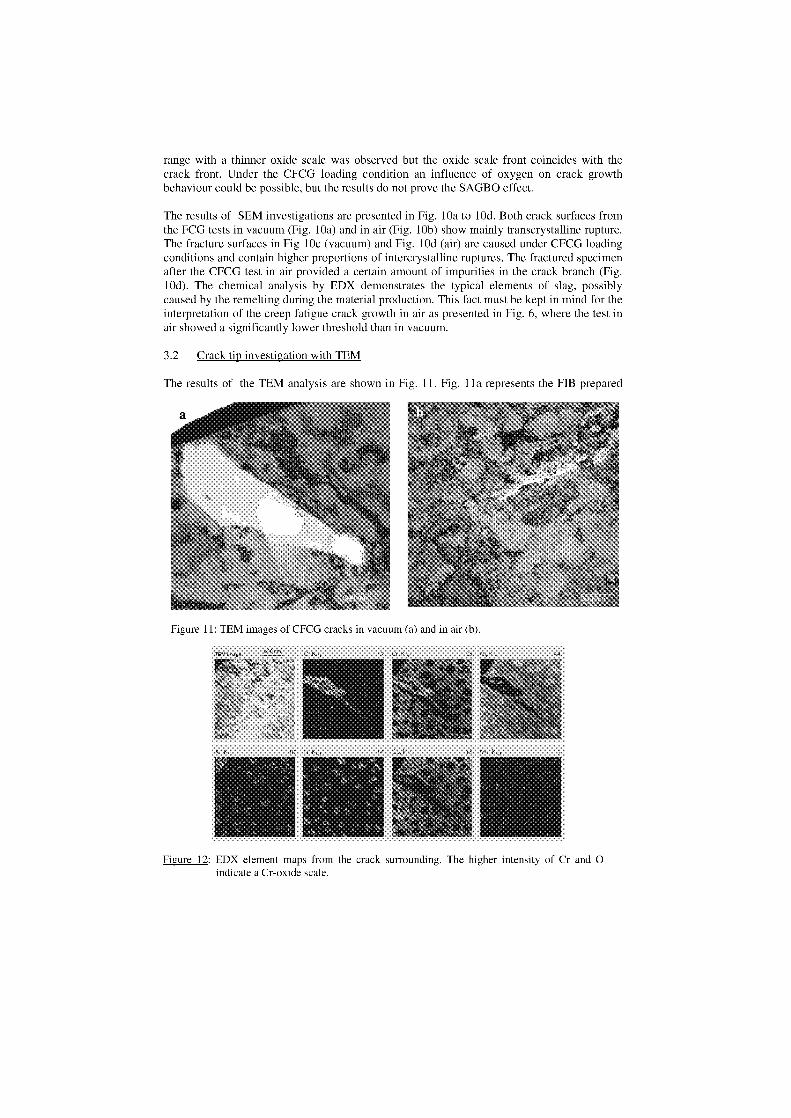
range with a thinner oxide scale was observed but the oxide scale front coincides with thecrack front. Under the CFCG loading condition an influence of oxygen an crack growthbehaviour could be possible, but the results do not prove the SAGBO effect.
The results of SEM investigations are presented in Fig. 10a to 10d. Both crack surfaces fromthe FCG tests in vacuum (Fig. 10a) and in air (Fig. 10b) Show mainly transcrystalline rupture.The fracture surfaces in Fig 10c (vacuum) and Fig. 10d (air) are caused under CFCG loadingconditions and contain higher proportions of intercrystalline ruptures. The fractured specimenafter the CFCG test in air provided a certain amount of impurities in the crack branch (Fig.10d). The chemical analysis by EDX demonstrates the typical elements of slag, possiblycaused by the remelting during the material production. This fact must be kept in mind for theinterpretation of the creep fatigue crack growth in air as presented in Fig. 6, where the test inair showed a significantly lower threshold than in vacuum.
3.2 Crack tip investigation with TEM
The results of the TEM analysis are shown in Fig. 11. Fig. 1 la represents the HB prepared
a
Figure 11: TEM Images of CFCG cracks in vacuum (a) and in air (b).
Figure 12: EDX element maps from the crack surrounding. The higher intensity of Cr and 0indicate a Cr-oxide scale.
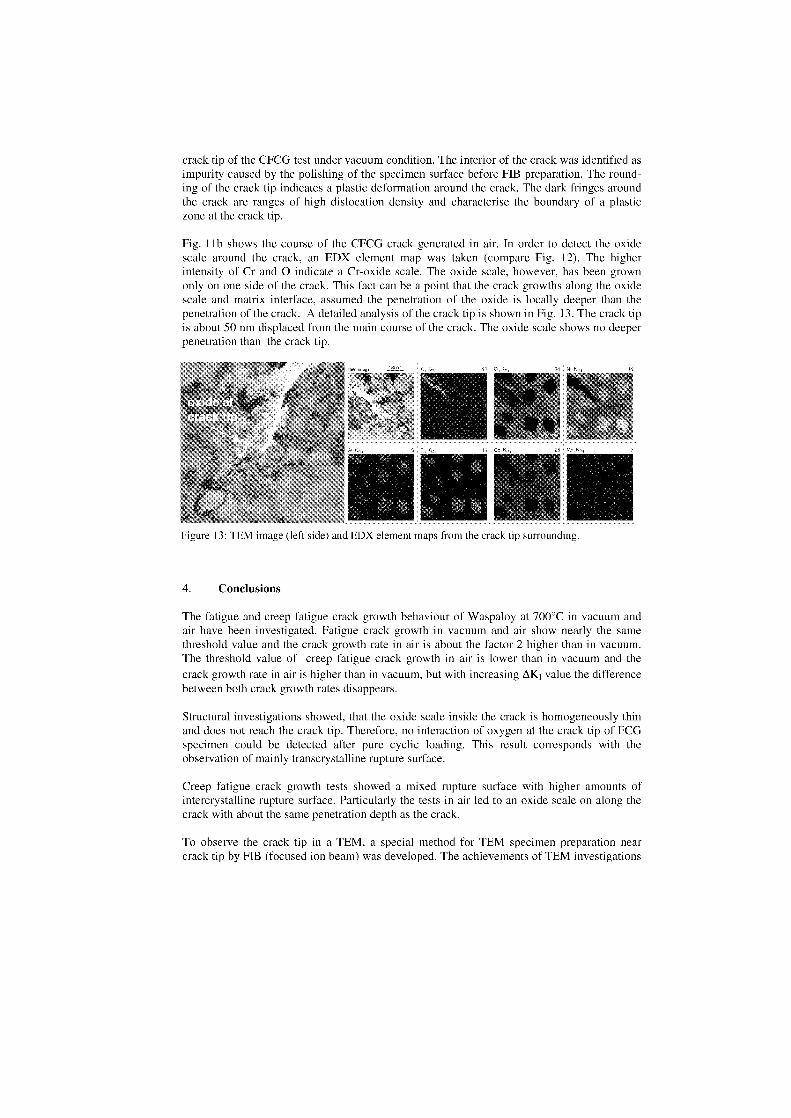
crack tip of the CFCG test under vacuum condition. The interior of the crack was identified asimpurity caused by the polishing of the specimen surface before FIB preparation. The round-ing of the crack tip indicates a plastic deformation around the crack. The dark fringes aroundthe crack are ranges of high dislocation density and characterise the boundary of a plastictone at the crack tip.
Fig. 1 1 b shows the course of the CFCG crack generated in air. In order to detect the oxidescale around the crack, an EDX element map was taken (compare Fig. 12). The higherintensity of Cr and 0 indicate a Cr-oxide scale. The oxide scale, however, has been grownonly on one side of the crack. This fact can be a point that the crack growths along the oxidescale and matrix interface, assumed the penetration of the oxide is locally deeper than thepenetration of the crack. A detailed analysis of the crack tip is shown in Fig. 13. The crack tipis about 50 nm displaced from the main course of the crack. The oxide scale shows no deeperpenetration than the crack tip.
Figure 13: TEM image (left side) and EDX element maps from the crack tip surrounding.
4. Conclusions
The fatigue and creep fatigue crack growth behaviour of Waspaloy at 700°C in vacuum andair have been investigated. Fatigue crack growth in vacuum and air show nearly the samethreshold value and the crack growth rate in air is about the factor 2 higher than in vacuum.The threshold value of creep fatigue crack growth in air is lower than in vacuum and thecrack growth rate in air is higher than in vacuum, but with increasing AKI value the differencebetween both crack growth raten disappears.
Structural investigations showed, that the oxide scale inside the crack is homogeneously thinand does not reach the crack tip. Therefore, no interaction of oxygen at the crack tip of FCGspecimen could be detected after pure cyclic loading. This result corresponds with theobservation of mainly transcrystalline rupture surface.
Creep fatigue crack growth tests showed a mixed rupture surface with higher amounts ofintercrystalline rupture surface. Particularly the tests in air led to an oxide scale on along thecrack with about the same penetration depth as the crack.
To observe the crack tip in a TEM, a special method for TEM specimen preparation nearcrack tip by FIB (focused ion beam) was developed. The achievements of TEM investigations
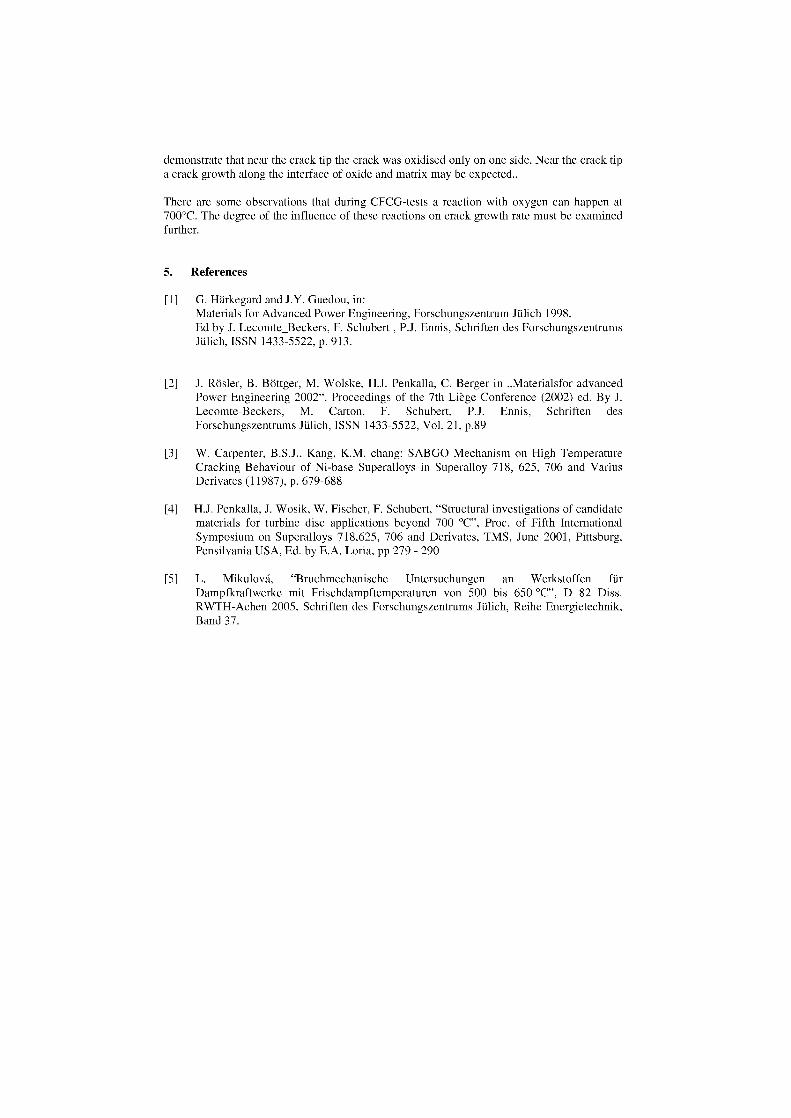
demonstrate that near the crack tip the crack was oxidised only on one side. Near the crack tipa crack growth along the interface of oxide and matrix may be expected..
There are some observations that during CFCG-tests a reaction with oxygen can kappen at700°C. The degree of the influence of these reactions on crack growth rate must be examinedfurther.
5. References
[1] G. Härkegard and J.Y. Guedou, in:Materials for Advanced Power Engineering, Forschungszentrum Jülich 1998,Ed by J. Lecomte_Beckers, F. Schubert , P.J. Ennis, Schriften des ForschungszentrumsJülich, ISSN 1433-5522, p. 913.
[2] J. Rösler, B. Böttger, M. Wolske, H.J. Penkalla, C. Berger in „Materialsfor advancedPower Engineering 2002", Proceedings of the 7th Liege Conference (2002) ed. By J.Lecomte-Beckers, M. Carton, F. Schubert, P.J. Ennis, Schriften desForschungszentrums Jülich, ISSN 1433-5522, Vol. 21, p.89
[3] W. Carpenter, B.S.J., Kang, K.M. chang: SABGO Mechanism on High TemperatureCracking Behaviour of Ni-base Superalloys in Superalloy 718, 625, 706 and VariusDerivates (11987), p. 679-688
[4] H.J. Penkalla, J. Wosik, W. Fischer, F. Schubert, "Structural investigations of candidatematerials for turbine disc applications beyond 700 °C", Proc. of Fifth InternationalSymposium on Superalloys 718,625, 706 and Derivates, TMS, June 2001, Pittsburg,Pensilvania USA, Ed. by E.A. Loria, pp 279 - 290
[5] L. Mikulovä, "Bruchmechanische Untersuchungen an Werkstoffen fürDampfkraftwerke mit Frischdampftemperaturen von 500 bis 650 °C", D 82 Diss.RWTH-Achen 2005, Schriften des Forschungszentrums Jülich, Reihe Energietechnik,Band 37.
ASSESSMENT OF THE INFLUENCE OF LASER-DRILLED HOLES ONTHE DAMAGE BEHAVIOUR OF ALLOY 617
B Mülders*, E Wessel l , F Schubert
1.) Institute for Materials and Processes in Energy Systems, Research Centre Jülich, 52425Jülich, Germany
*Philips Technology GmbH, Philipsstr.8, 52068 Aachen,E-mail: [email protected]
ABSTRACT
The objective of the Collaborative Research Centre (SFB 561) at the RWTH Aachen uses effusion cooling forvery high temperature exposed structures. Investigations an the deformation behaviour of flat specimens (Alloy617) with laser drilled pores has been carried out at temperatures of 20 and 400°C. The specimens simulate thestructure of an effusion cooled high temperature component. The crack initiation and propagation was studied byconducting the tensile tests in the scanning electron microscope chamber. Some theoretical ideal to use thetriaxiality for estimating the crack initiation (micro scale) and crack propagation (meso scale) and failure (macroscale) are discussed.
Key words: Alloy 617, crack initiation, damage, in-situ observation in SEM
Introduction
Rising energy demands coupled with the need to reduce emissions lie behind the developmentof high efficiency, environmentally benign fossil fired advanced power plants, both the USC(ultra super critical) steam plants and the combined cycle plants (combination of gas andsteam turbine plants). The objective of the collaborative research centre SFB 561 (TechnicalUniversity of Aachen, Germany) is to evaluate the scientific and technological basis forraising the thermal efficiency of a combined cycle plant to 65 %. This ambitious target maybe achieved by increasing the gas turbine inlet temperature.
Ni-bare superalloys are currently under consideration for the structural material ofcombustion chamber internal walls and for gas turbine blades. Although the expected load ofcombustion chamber wall is very low compared with the load of rotating blades, the thermallyinduced stresses may be sufficient to cause crack initiation and failure. In order to avoid muchhigher (surface) material temperatures, the cooling systems must be improved, but without anincrease in the consumption of the cooling gas. The combination of convection and filmcooling cannot guarantee a complete protection over the whole structure because of turbulentflow, possibly due to the relatively large distance between the cooling holes. lt would bebeneficial to increase the number and decrease the spacing between the cooling holes, so thatprotection of the whole surface can be achieved. This cooling technique is referred to aseffusion cooling.For the assessment of effusion cooled structures, made by laser drilling of cooling pores, theknowledge of the mechanisms controlling the long term integrity (safety and function) of the
components exposed at high temperature are required. The loss of stiffness of a component,that means the loss of function by plastic deformation with consequent ductile fracture ofstructural material (as a continuum without drilled pores), is controlled either by rateindependent or rate dependant plasticity, depending on the temperature. The change incomponent stiffness caused by the presence of chains of laser drilled cooling pores cannot beestimated by a simple change of the load bearing cross section. The array of cooling poresproduces an inhomogeneous local stress-strain situation (meso-scaled) in the materialsurrounding the cooling pores, which does not allow a simple global (macro-scaled) approach.Therefore the classical fracture mechanics approach does not enable the prediction of thedamage behaviour and the theory of damage mechanics has to be used.
The present paper describes a study intended to assess the influence of the laser-drilledcooling holes on the damage behaviour of tensile test specimens of Alloy 617, one of thecandidate structural materials for combustion chamber walls. For this, tensile tests werecarried out in the scanning electron microscope (SEM) in which in-situ observations of crackinitiation and propagation could be made. FE-Element calculations were carried out todetermine the local stress-strain situation.
Theoretical background
Face-centred-cubic metals and alloys typically exhibit ductile failure, which is a result of thenucleation, the growth and the coalescence of cavities. For the nucleation process of cavities,the existence of particles or non-metallic inclusions plays a dominant role [2]. Twomechanisms for this heterogeneous nucleation process are possible: i) failure of the particles,if the particle size is greater than a critical size and ii) the separation of particle/ matrixinterface due to a low cohesive energy of the interface if the particles are sufficiently small.The latter is caused by the formation and pile–up of dislocations around the non-deformingparticles and leads to an inhomogeneous internal stress situation in the material surroundingof the particles. Internal parameters that influence such dislocation arrangements aremicrostructural features, such as particle size and hardness, volume fraction of precipitatesand orientation of grains. External parameters are the deformation temperature and the strainrate; both determine the density of dislocations and their mobility. If the incoming andoutgoing dislocation densities are in equilibrium, a pile-up could not be formed [1].
Taking into account all these microstructural features does not allow a feasible quantificationof micro-crack initiation to guarantee the integrity of the structural material. In this context acontinuums mechanics approach appears to be more appropriate. The damage of the materialdue to void nucleation, growth and coalescence is strongly influenced by stress triaxiality, it isgenerally accepted that the stress triaxiality is the controlling parameter for the growth ofvoids [4-12]. The stress triaxiality is given by
[0- 1 + 0-2 +
3
(1)With ai main stress components and avm von Mises stress. The influence of the level ofstress triaxiality is shown in Figure 1. The coalescence of growing cavities is then defined asmicrocrack-initiation. The strong influence of the cooling pores on the local stress-straindistribution in of the material must be taken into account. The classical continuum mechanics
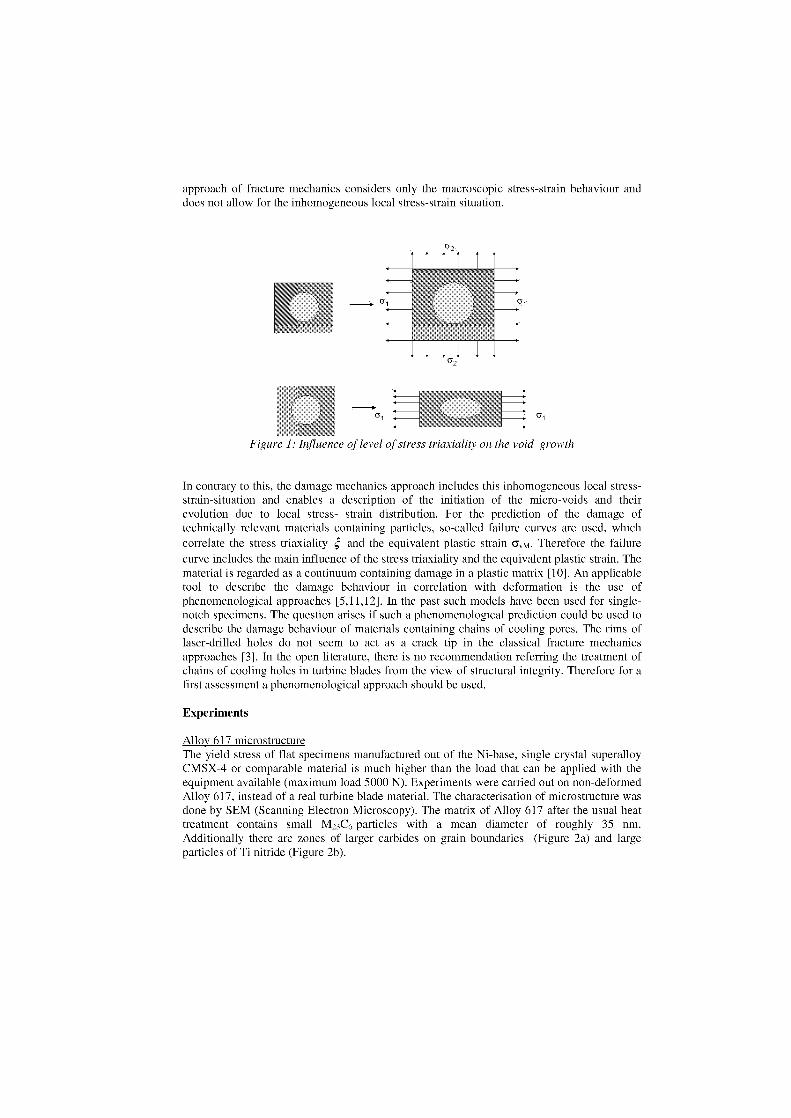
approach of fracture mechanics considers only the macroscopic stress-strain behaviour anddoes not allow for the inhomogeneous local stress-strain situation.
11,2
Figure 1: Influence of level of stress tric , iality on the void growth
In contrary to this, the damage mechanics approach includes this inhomogeneous local stress-strain-situation and enables a description of the initiation of the micro-voids and theirevolution due to local stress- strain distribution. For the prediction of the damage oftechnically relevant materials containing particles, so-called failure curves are used, whichcorrelate the stress triaxiality and the equivalent plastic strain a vm. Therefore the failurecurve includes the main influence of the stress triaxiality and the equivalent plastic strain. Thematerial is regarded as a continuum containing damage in a plastic matrix [10]. An applicabletool to describe the damage behaviour in correlation with deformation is the use ofphenomenological approaches [5,11,12]. In the past such modeln have been used for single-notch specimens. The question arises if such a phenomenological prediction could be used todescribe the damage behaviour of materials containing chains of cooling pores. The rims oflaser-drilled holes do not seem to act as a crack tip in the classical fracture mechanicsapproaches [3]. In the open literature, there is no recommendation referring the treatment ofchains of cooling holes in turbine blades from the view of structural integrity. Therefore for afirst assessment a phenomenological approach should be used.
Experiments
Alloy 617 microstructureThe yield stress of flat specimens manufactured out of the Ni-base, single crystal superalloyCMSX-4 or comparable material is much higher than the load that can be applied with theequipment available (maximum load 5000 N). Experiments were carried out on non-deformedAlloy 617, instead of a real turbine blade material. The characterisation of microstructure wasdone by SEM (Scanning Electron Microscopy). The matrix of Alloy 617 after the usual heattreatment contains small M 23C6-particles with a mean diameter of roughly 35 nm.Additionally there are zones of larger carbides on grain boundaries (Figure 2a) and largeparticles of Ti nitride (Figure 2b).
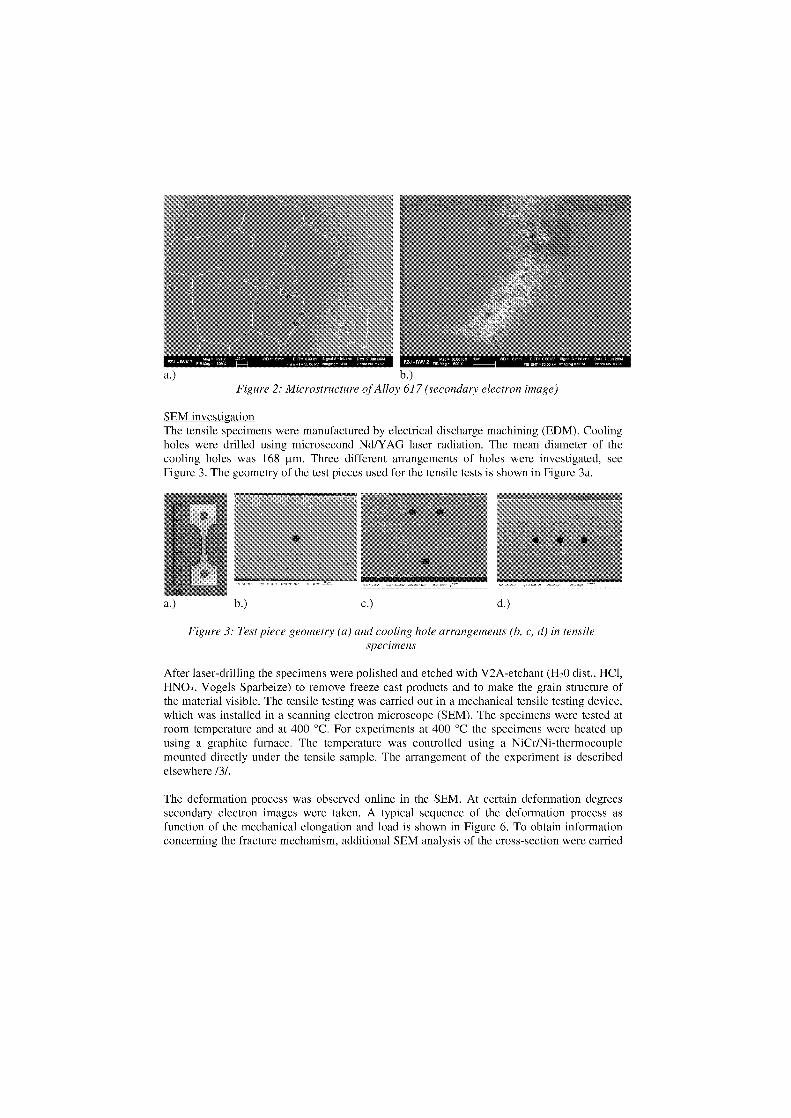
am nee Omda•Mam oevamFIS EliFeellf1 ee. aMenw. -See FZI- INN 2
em, mem. %■1•1/1•Fla•
a.)
b.)Figure 2: Microstructure of Alloy 617 (secondary electron image)
SEM investigation The tensile specimens were manufactured by electrical discharge machining (EDM). Coolingholes were drilled using microsecond Nd/YAG laser radiation. The mean diameter of thecooling holes was 168 nm. Three different arrangements of holes were investigated, seeFigure 3. The geometry of the test pieces used for the tensile tests is shown in Figure 3a.
a.)
b.)
c.)
d.)
Figure 3: Test piece geometry (a) and cooling hole arrangements (b, c, d) in tensilespecimens
After laser-drilling the specimens were polished and etched with V2A-etchant (H20 dist., HCI,HNO3 , Vogels Sparbeize) to remove freeze cast products and to make the grain structure ofthe material visible. The tensile testing was carried out in a mechanical tensile testing device,which was installed in a scanning electron microscope (SEM). The specimens were tested atroom temperature and at 400 °C. For experiments at 400 °C the specimens were heated upusing a graphite furnace. The temperature was controlled using a NiCr/Ni-thermocouplemounted directly under the tensile sample. The arrangement of the experiment is describedelsewhere /3/.
The deformation process was observed online in the SEM. At certain deformation degreessecondary electron images were taken. A typical sequence of the deformation process asfunction of the mechanical elongation and load is shown in Figure 6. To obtain informationconcerning the fracture mechanism, additional SEM analysis of the cross-section were carried
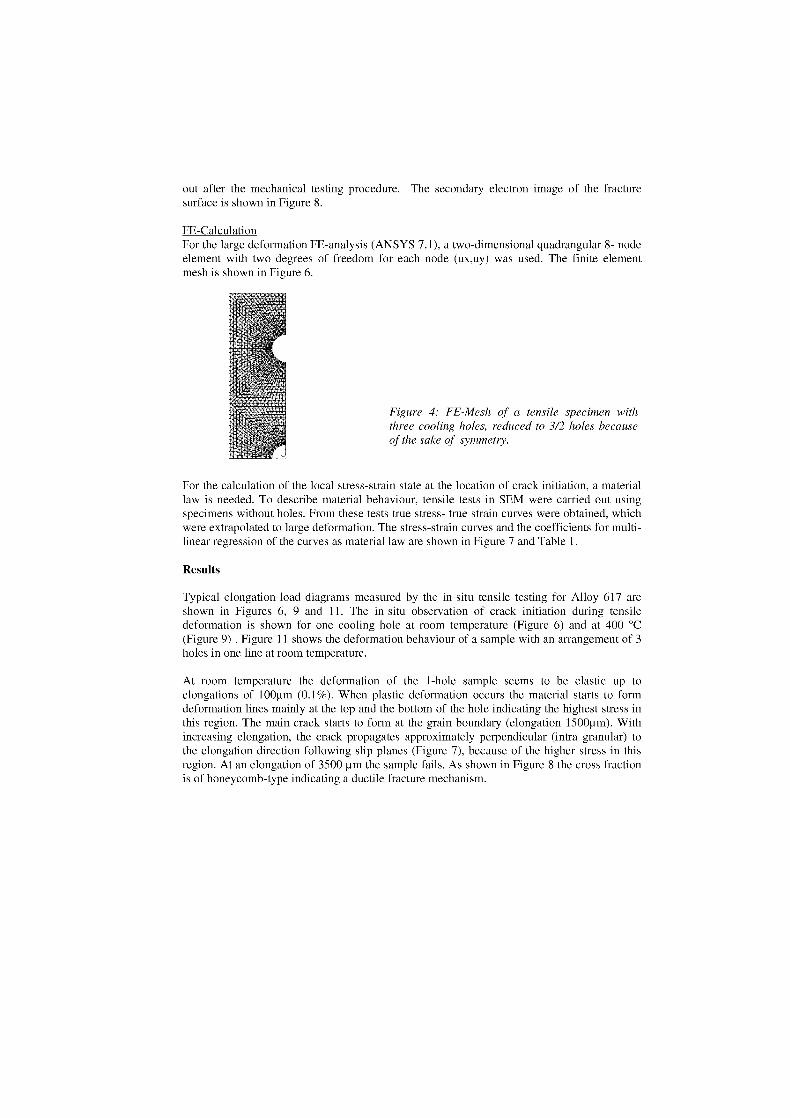
out after the mechanical testing procedure. The secondary electron image of the fracturesurface is shown in Figure 8.
FE-Calculation For the large deformation FE-analysis (ANSYS 7.1), a two-dimensional quadrangular 8- nodeelement with two degrees of freedom for each node (ux,uy) was used. The finite elementmesh is shown in Figure 6.
Figure 4: FE-Mesh of a tensile specimen withthree cooling holes, reduced to 3/2 holes becauseof the Bake of symmetry.
For the calculation of the local stress-strain state at the location of crack initiation, a materiallaw is needed. To describe material behaviour, tensile tests in SEM were carried out usingspecimens without holes. From these tests true stress- true strain curves were obtained, whichwere extrapolated to large deformation. The stress-strain curves and the coefficients for multi-linear regression of the curves as material law are shown in Figure 7 and Table 1.
Results
Typical elongation-load diagrams measured by the in-situ tensile testing for Alloy 617 areshown in Figures 6, 9 and 11. The in-situ observation of crack initiation during tensiledeformation is shown for one cooling hole at room temperature (Figure 6) and at 400 °C(Figure 9) . Figure 11 shows the deformation behaviour of a sample with an arrangement of 3holes in one line at room temperature.
At room temperature the deformation of the 1-hole sample seems to be elastic up toelongations of 100ttm (0.1%). When plastic deformation occurs the material starts to formdeformation lines mainly at the top and the bottom of the hole indicating the highest stress inthis region. The main crack starts to form at the grain boundary (elongation 1500pm). Withincreasing elongation, the crack propagates approximately perpendicular (intra granular) tothe elongation direction following slip planes (Figure 7), because of the higher stress in thisregion. At an elongation of 3500 prn the sample fails. As shown in Figure 8 the cross fractionis of honeycomb-type indicating a ductile fracture mechanism.
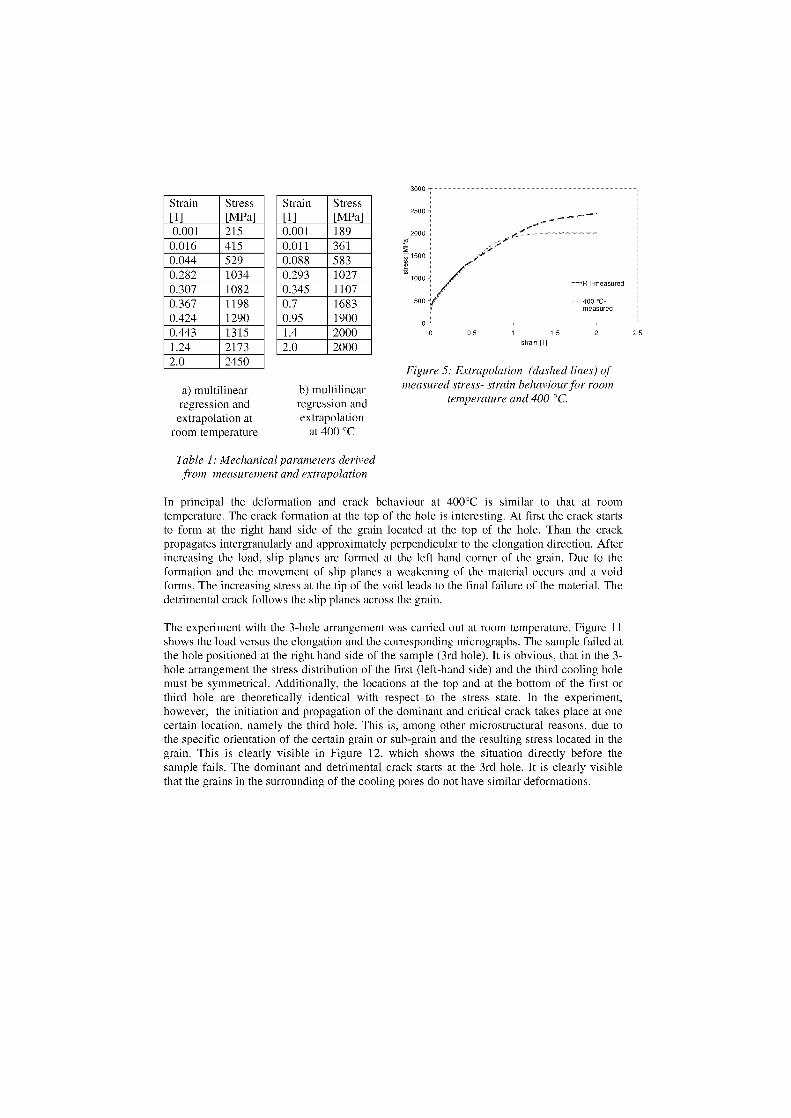
3000
Strain[1]
Stress[MPa]
0.001 2150.016 4150.044 5290.282 10340.307 10820.367 11980.424 12900.443 13151.24 21732.0 2450
Strain Stress[1] [MPa]0.001 1890.011 3610.088 5830.293 10270.345 11070.7 16830.95 19001.4 20002.0 2000
a) multilinear b) multilinearregression and regression andextrapolation at extrapolation
room temperature at 400 °C
2500
22
2000
1500
1000
500
0 00.5 1 1.5
strain [1]2 25
Figure 5: Extrapolation (dashed lines) ofmeasured stress- st rain behaviour for room
temperature and 400 °C.
Table 1: Mechanical parameters derivedfrom measurement and extrapolation
In principal the deformation and crack behaviour at 400°C is similar to that at roomtemperature. The crack formation at the top of the hole is interesting. At first the crack startsto form at the right hand side of the grain located at the top of the hole. Than the crackpropagates intergranularly and approximately perpendicular to the elongation direction. Afterincreasing the load, slip planes are formed at the left hand corner of the grain. Due to theformation and the movement of slip planes a weakening of the material occurs and a voidforms. The increasing stress at the tip of the void leads to the final failure of the material. Thedetrimental crack follows the slip planes across the grain.
The experiment with the 3-hole arrangement was carried out at room temperature. Figure 11shows the load versus the elongation and the corresponding micrographs. The sample failed atthe hole positioned at the right hand side of the sample (3rd hole). lt is obvious, that in the 3-hole arrangement the stress distribution of the first (left-hand side) and the third cooling holemust be symmetrical. Additionally, the locations at the top and at the bottom of the first orthird hole are theoretically identical with respect to the stress state. In the experiment,however, the initiation and propagation of the dominant and critical crack takes place at onecertain location, namely the third hole. This is, among other microstructural reasons, due tothe specific orientation of the certain grain or sub-grain and the resulting stress located in thegrain. This is clearly visible in Figure 12, which shows the situation directly before thesample fails. The dominant and detrimental crack starts at the 3rd hole. lt is clearly visiblethat the grains in the surrounding of the cooling pores do not have similar deformations.
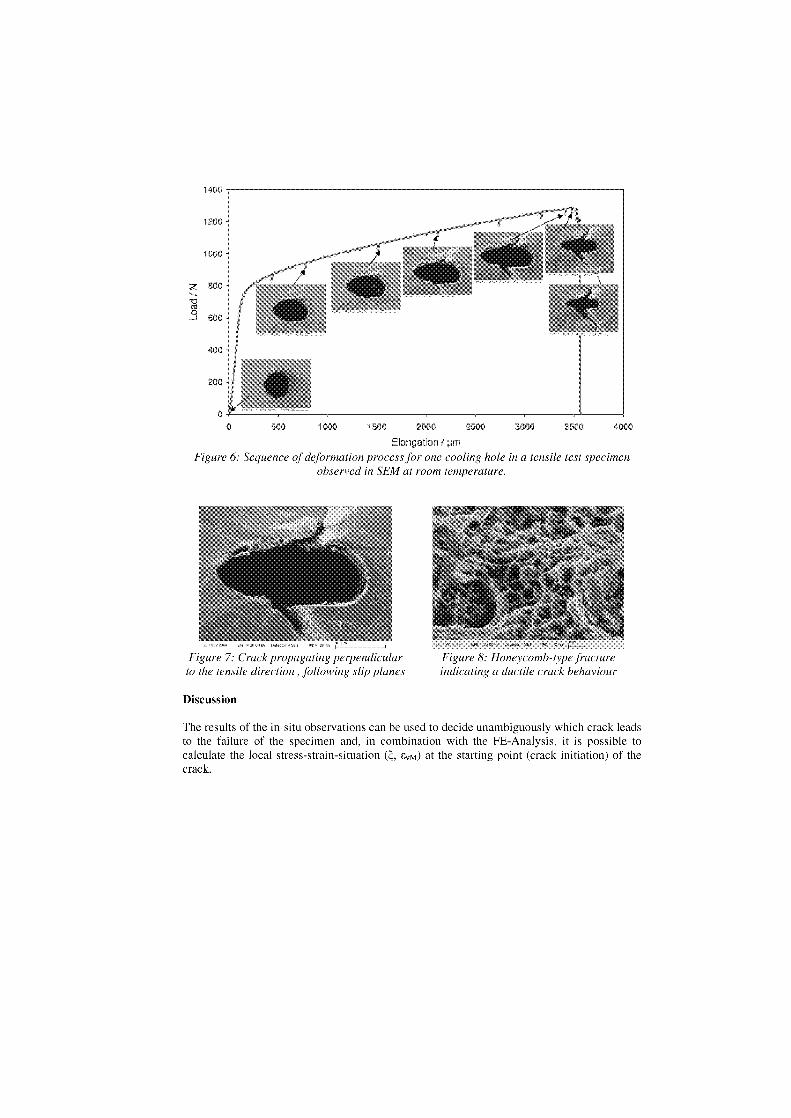
502 1500 2000 2500
4000
Elongaton l prn
Figure 6: Sequence of deformation process for one cooling hole in a tensile test specimenobserved in SEM at room te, pera i eire.
Figure 7: Crack propag. g perpendic Klar Figure 8: Honeycm .. b-type fito the tensile direction , following slip planes indicating a ductile crack behaviour
Discussion
The results of the in-situ observations can be used to decide unambiguously which crack leadsto the failure of the specimen and, in combination with the FE-Analysis, it is possible tocalculate the local stress-strain-situation (g, cvm) at the starting point (crack initiation) of thecrack.
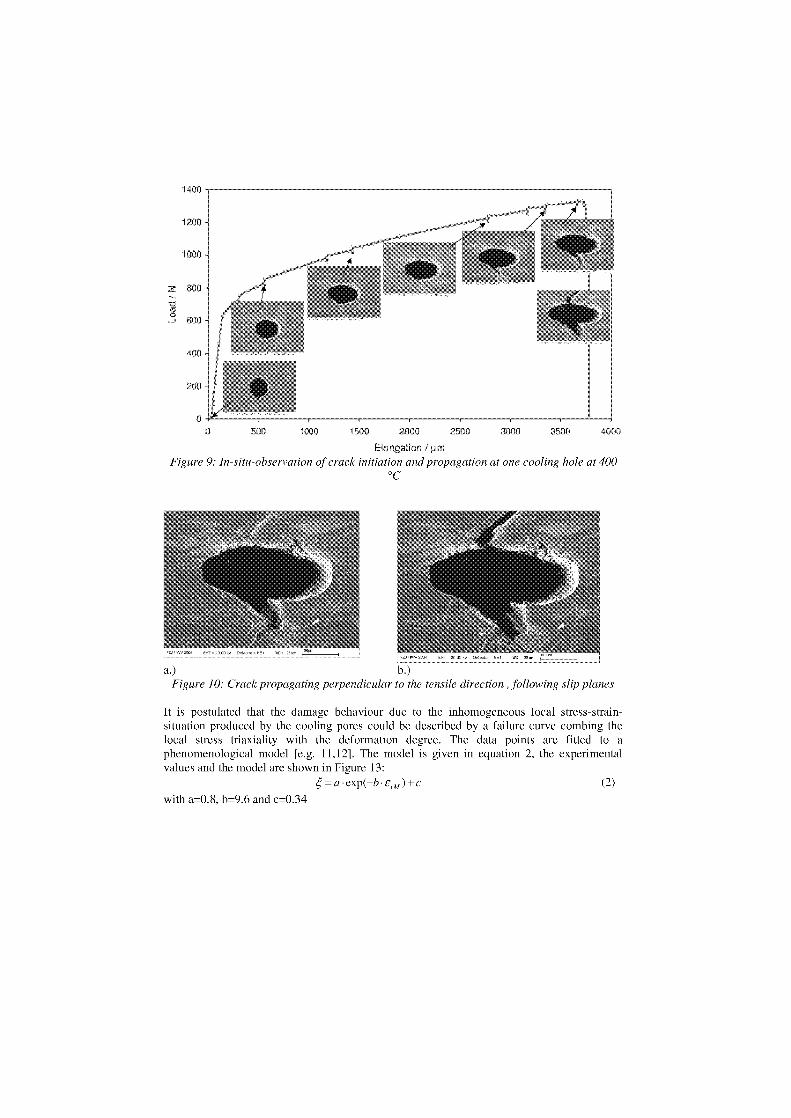
0 i500 2000 2500 3500 4
Elongation 1 11 rr
Figure 9: In-situ-observation of crack initiation and propagation at one cooling hole at 400°C
a.) b.)Figure 10: Crack propagating perpendicular to the tensile direction , following Flip planes
lt is postulated that the damage behaviour due to the inhomogeneous local stress-strain-situation produced by the cooling pores could be described by a failure curve combing thelocal stress triaxiality with the deformation degree. The data points are fitted to aphenomenological model [e.g. 11,12]. The model is given in equation 2, the experimentalvalues and the model are shown in Figure 13:
= a- exp(—b • e,„)+c (2)
with a=0.8, b=9.6 and c=0.34
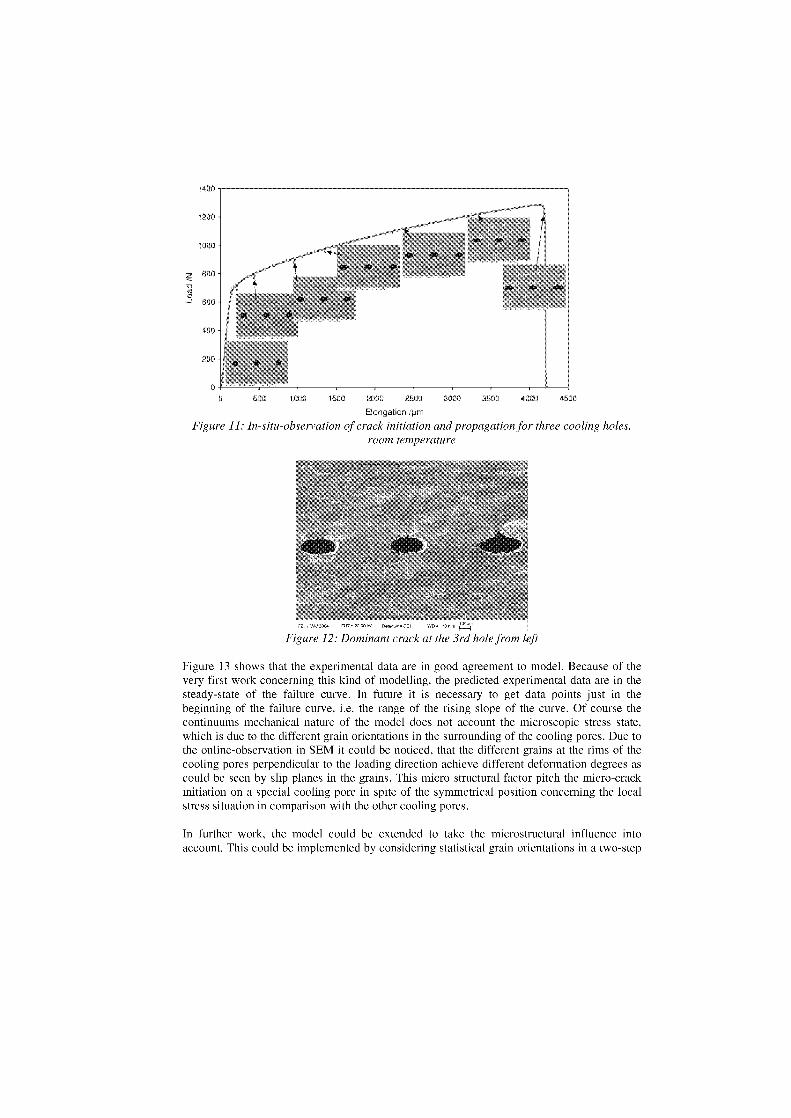
1400
1200
1000
0 1000 1500 2000 2500 3000 3.600 400: 4500
Elangation Ihm
Figure 11: In-situ-observation of crack initiation and propagation for three cooling holes,room temperature
Figure 12: Dominant crack at the 3i,' hole from left
Figure 13 shows that the experimental data are in good agreement to model. Because of thevery first work concerning this kind of modelling, the predicted experimental data are in thesteady-state of the failure curve. In future it is necessary to get data points just in thebeginning of the failure curve, i.e. the range of the rising slope of the curve. Of course thecontinuums mechanical nature of the model does not account the microscopic stress state,which is due to the different grain orientations in the surrounding of the cooling pores. Due tothe online-observation in SEM it could be noticed, that the different grains at the rims of thecooling pores perpendicular to the loading direction achieve different deformation degrees ascould be seen by slip planes in the grains. This micro structural factor pitch the micro-crackinitiation an a special cooling pore in spite of the symmetrical position concerning the localstress situation in comparison with the other cooling pores.
In further work, the model could be extended to take the microstructural influence intoaccount. This could be implemented by considering statistical grain orientations in a two-step
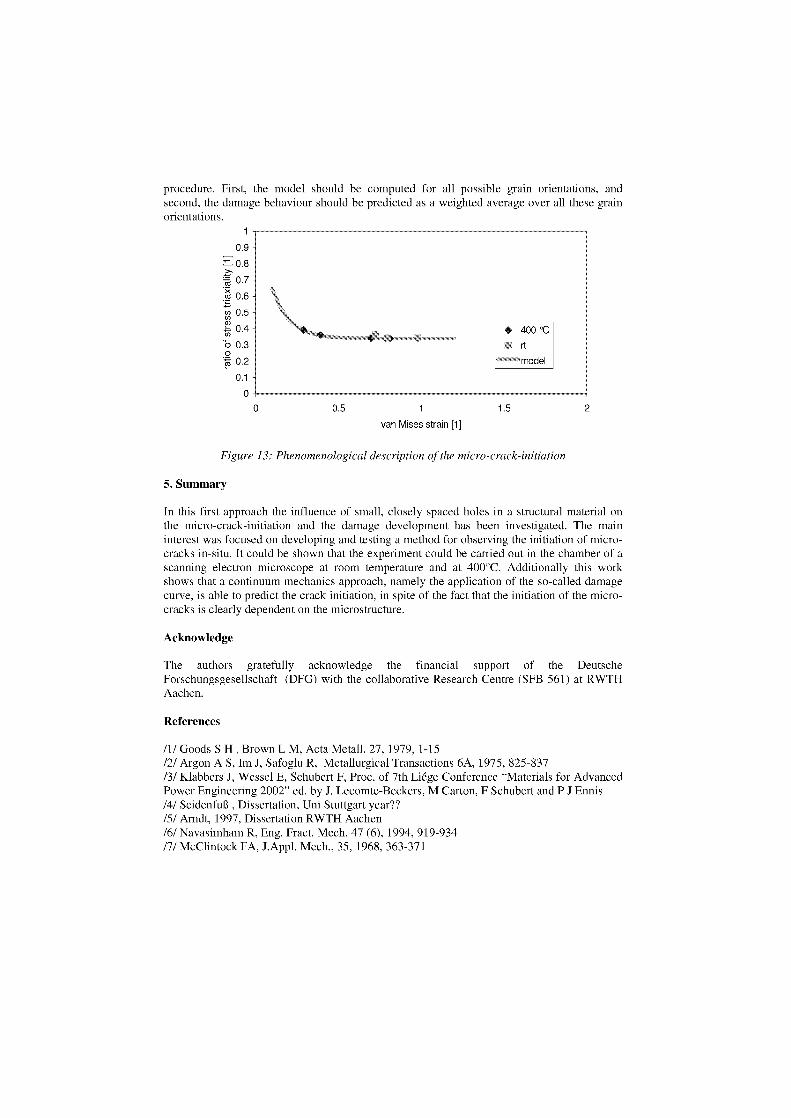
procedure. First, the model should be computed for all possible grain orientations, andsecond, the damage behaviour should be predicted as a weighted average over all these grainorientations.
1
0.9
0.8
0.7
c% 0.6
cou) 0.5
g 0.4
"E) 0.30
0.2
0.1 -
0 0 0.5 1 1.5 2
van Mises strain [1]
• 400 `Crt
model
Figure 13: Phenomenological description of the micro-crack-initiation
5. Summary
In this first approach the influence of small, closely spaced holes in a structural material onthe micro-crack-initiation and the damage development has been investigated. The maininterest was focused on developing and testing a method for observing the initiation of micro-cracks in-situ. lt could be shown that the experiment could be carried out in the chamber of ascanning electron microscope at room temperature and at 400°C. Additionally this workshows that a continuum mechanics approach, namely the application of the so-called damagecurve, is able to predict the crack initiation, in spite of the fact that the initiation of the micro-cracks is clearly dependent on the microstructure.
Acknowledge
The authors gratefully acknowledge the financial support of the DeutscheForschungsgesellschaft (DFG) with the collaborative Research Centre (SFB 561) at RWTHAachen.
References
/1/ Goods S H , Brown L M, Acta Metall. 27, 1979, 1-15/2/ Argon A S, Im J, Safoglu R, Metallurgical Transactions 6A, 1975, 825-837/3/ Klabbers J, Wessel E, Schubert F, Proc. of 7th Liege Conference "Materials for AdvancedPower Engineering 2002" ed. by J. Lecomte-Beckers, M Carton, F Schubert and P J Ennis/4/ Seidenfuß , Dissertation, Uni Stuttgart year??/5/ Arndt, 1997, Dissertation RWTH Aachen/6/ Navasimham R, Eng. Fract. Mech. 47 (6), 1994, 919-934/7/ McClintock FA, J.Appl. Mech., 35, 1968, 363-371

/8/ Rice J R, Tracey D M, L.Mech.Phys.Sol., 17, 1969, 201-217/9/ Jun S, Jie D Z, Jing T M, Eng,Fract.Mech., 39 (6), 1991, 1051-1060/10/ Hancock J W, Mackenzie A C, J. Mech. Phys. Sol. 24, 1976,147-169/11/ Achenbach U J, Dissertation RWTH Aachen, Shaker-Verlag 7/99, 1999/12/ Prahl U, Dissertation RWTH Aachen, Berichte aus der Eisenhüttenkunde, Bd.2003,2Shaker-Verlag, 2003

DEFORMATION BEHAVIOUR OF ALLOY INCONEL 617 TUBES INTHE TEMPERATURE RANGE 600°C TO 850°C
L.Z. Makhele-Lekala l , P.J. Ennis and F. SchubertResearch Centre Jülich (FZJ), Germany
AbstractTensile tests an tubular test pieces of boiler tube dimensions have been carried out at 600°C,
700°C, 800°C, and 850°C at different deformation rates. The results were used to determinethe parameters of constitutive equations for the material. The deformation behaviour at both700°C and 800°C are different at low and high strain rate.
Keywords: Inconel 617, tensile test, constitutive equation, strain rate
IntroductionThere is a world-wide effort to improve fossil fired steam cycle power plants to achieve totalefficiencies higher than 50%. This target can be achieved through the production of lifesteam of 700°C at (30 -35) 1\ IPa. That means the materials for the last stage of the super-heater (tubing and heaters) in the boiler have to withstand temperatures between 720°Cand 730°C,since the superheater or reheater metal can exceed the steam temperature by asmuch as 28° [1]. For this operational conditions the advanced (9-12)% ferritic Cr-steels arenot Jong term creep resistant enough and have poor steam oxidation resistance. Austeniticsteels with Cr-content above 20% may provide the required steam oxidation resistance,but the creep resistance at temperatures above 700°C is insufficient. Moreover thesematerials have the disadvantage of high thermal expansion and low thermal conductivity.The requirements of high temperature superheater components may be met by Ni-basedalloys, which are workable, forgeable and weldable for the manufacture of heat exchangecomponents of hot headers and high temperature resistant tubing.
The alloy Inconel 617 is rich in nickel and chromium, with exceptional high tem-perature resistance properties. This makes the alloy a candidate material, for example,for boiler tubes in the super heater and re-heater of advanced supercritical steam powerplants that are operating at steam temperatures around 700°C. Originally this alloy wasdeveloped for use as a sheet material for combustion chambers in gas turbines, and hasbeen qualified in the 1980s for the main components for a He/He-heat exchanger (IHX) inadvanced gas cooled high temperature reactors (HTGR) with experimental temperaturesof 900°C to 950°C [2]. At that time, the materials qualification was concerned with testtemperatures above 850°C. Thus a gap of information is remaining for application tem-perature in the range 600°C to 850°C. This range of operational temperatures is expectedfor advanced boilers in the ultra-supercritical (USC) steam cycle power plants with 700°Clive steam.
The aim of this paper is to examine the deformation behaviour of the alloy Inconel 617in the temperature range 600°C to 850°C. To this end hot extruded tubings manufacturedfor the investigation of HTGR components are used.
'Guest Scicntist at IWV2 FZJ
1
Parameter Dimension
LengthOuter DiameterWall thickness
742mm22mm2mm
Experimental Details
Material The test material was manufactured by the VDM factory according to the German spec-ification of the "werkstoffblatt". From this material, tubular specimens with physicaldimensions given in Table 1 were made for use in the tests. The chemical composition,in mass %, is summerised in Table 2 below and the time-temperature-transformationdiagram for Alloy 617 has been reported in [3] .
Table 1: Physical dimensions of the specimens used
Table 2: Chemical composition for Inconel 617 alloy in mass percentage
Ni Cr Co 1110 Ti Al C N BRemainder 22.23 11.58 9.75 0.48 0.74 0.067 0.038 <0.003
Test ProcedureIn Fig. 1 a photo of a typical tubular specimen used in this investigation is shown. Spec-imens described above are bolted between flanges that are fixed to the loading extensiongauge. These specimens were tensile tested in four columns Servo hydraulic Instron testmachine (Type 1345). The strain rate was cross-head controlled. All tests were inter-rupted alter reaching a total elongation of about 15%.
Experimental ResultsFollowing the procedure outlined above, several tensile tests were carried out an thetubular specimens of the alloy at 600°C, 700°C, 800°C and 850°C; and at different strainrates of 1 x 10- 6 s- 4 , 1 x 10- 5 s- 4 , 1 x 10⁻⁴ s- 4 , and 1 x 10⁻³ At 600°C it was sufficientto perform the tests only at 1 x 10- 6 s- 1 and 1 x 10' s'. The measured data wasused to determine the constitutive equations for the Inconel 617 for the aforementionedoperational conditions.
The experimental true stress-strain results, together with the results obtained fromthe constitutive equations are plotted in Figures 4. The corresponding experimental dataat room temperature (RT) is also shown in Figure 5 for completeness.
2
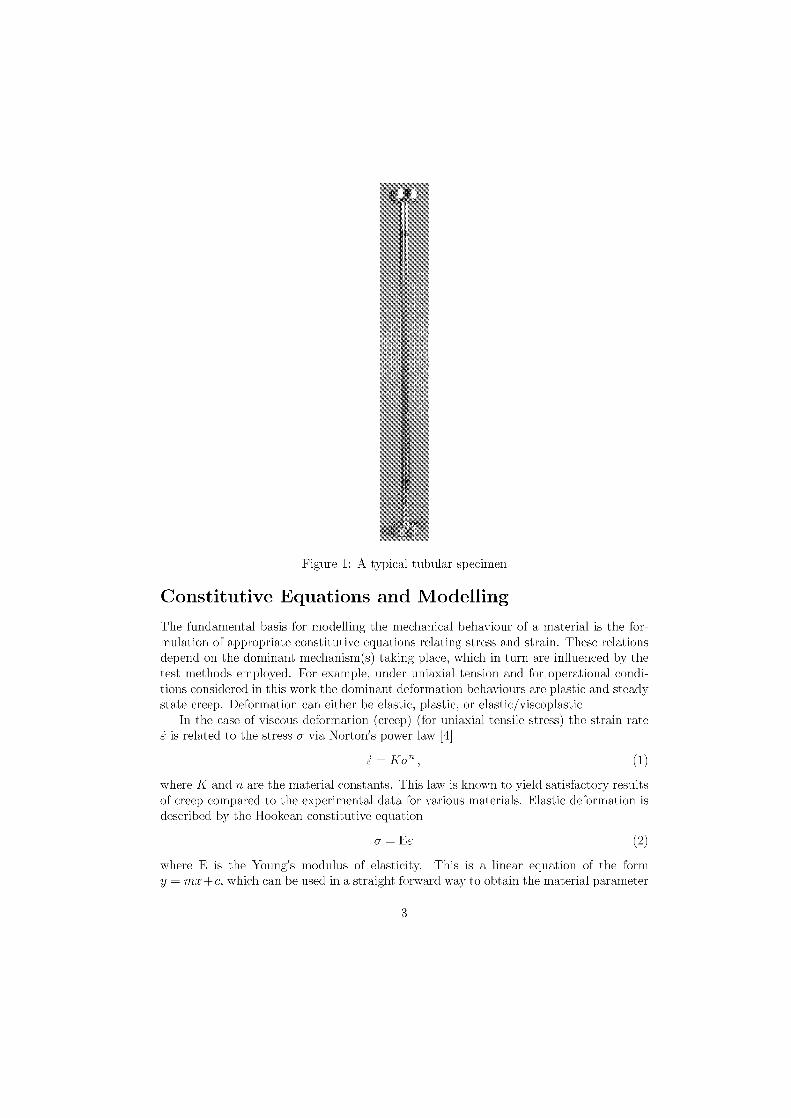
Figure 1: A typical tubular specimen
Constitutive Equations and Modelling
The fundamental basis for modelling the mechanical behaviour of a material is the for-mulation of appropriate constitutive equations relating stress and strain. These relationsdepend an the dominant mechanism(s) taking place, which in turn are influenced by thetest methods employed. For example, under uniaxial tension and for operational condi-tions considered in this work the dominant deformation behaviours are plastic and steadystate creep. Deformation can either be elastic, plastic, or elastic/viscoplastic
In the Gase of viscous deformation (creep) (for uniaxial tensile stress) the strain rateis related to the stress o- via Norton's power law [4]
= K an , (1)
where K and n are the material constants. This law is known to yield satisfactory resultsof creep compared to the experimental data for various materials. Elastic deformation isdescribed by the Hookean constitutive equation
0- = EE
(2)
where E is the Young's modulus of elasticity. This is a linear equation of the formy = nix -1 c, which can be used in a straight forward way to obtain the material parameter
3
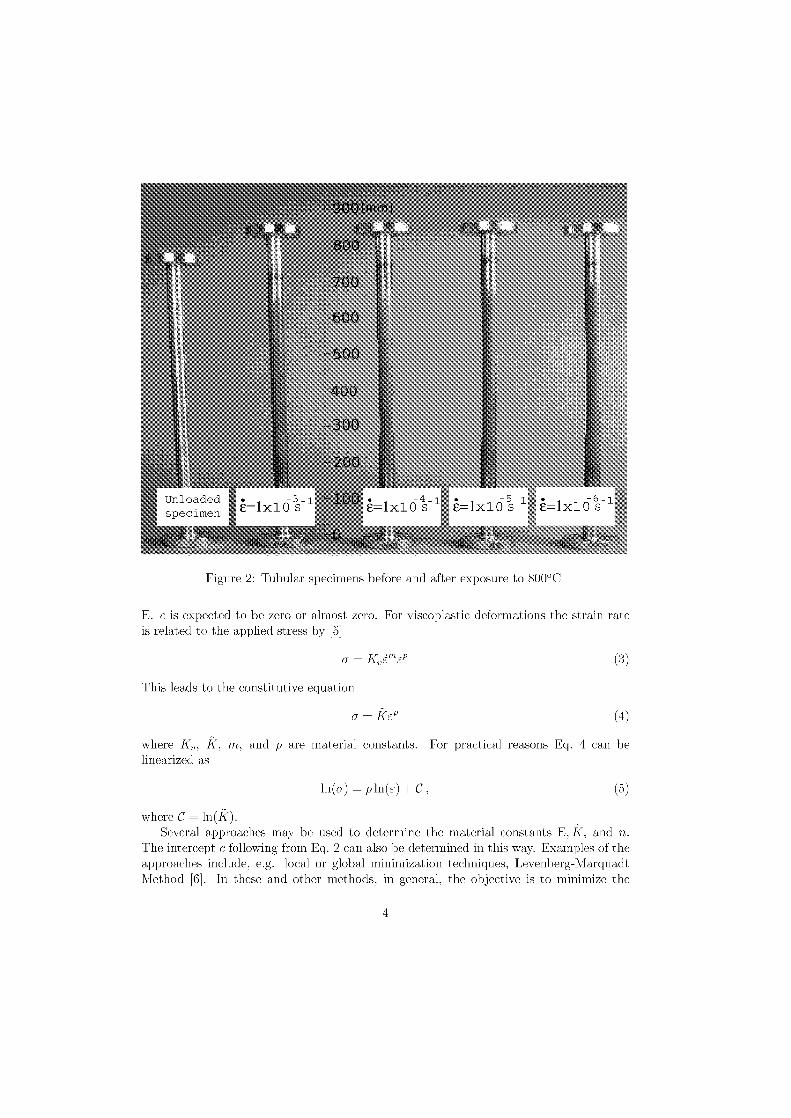
;•= ix l
Figure 2: Tubular specimens before and after exposure to 800°C
E. c is expected to be zero or almost zero. For viscoplastic deformations the strain rateis related to the applied stress by [5]
u = Kvin'EP
(3)
This leads to the constitutive equation
o- = EP
(4)
where k, m, and p are material constants. For practical reasons Eq. 4 can belinearized as
ln(u) = p 1n(E) + C, (5)
where C = ln(k).Several approaches may be used to determine the material constants E, k, and n.
The intercept c following from Eq. 2 can also be determined in this way. Examples of theapproaches include, e.g. local or global minimization techniques, Levenberg-MarquadtMethod [6]. In these and other methods, in general, the objective is to minimize the
4
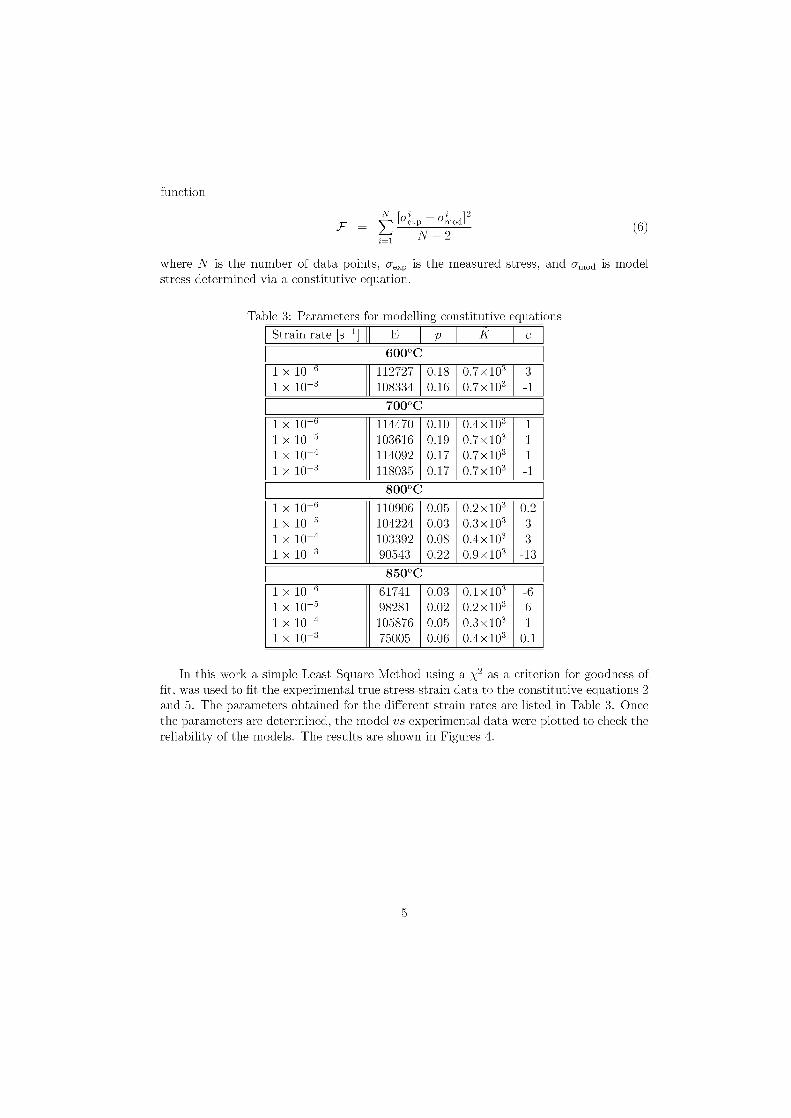
function
xp cfri% 0,112
i=1 N - 2
where N is the number of data points, Uexp is the measured stress, and o mod is modelstress determined via a constitutive equation.
Table 3: Parameters for modelling constitutive equations
Strain rate [s- 1 ]
E
p c
600°C1 x 10-6 112727 0.18 0.7x10³ 31 x 10-3 108334 0.16 0.7x10³ -1
700°C1 x 10-6 114470 0.10 0.4x10³ 11 x 10- 5 103616 0.19 0.7x10³ 11 x 10-4 114092 0.17 0.7x10³ 11 x 10-3 118035 0.17 0.7x10³ -1
800°C1 x 10-6 110906 0.05 0.2 x10³ 0.21 x 10- 5 104224 0.03 0.3 x10³ 31 x 10-4 103392 0.08 0.4 x10³ 31 x 10- 3 90543 0.22 0.9 x10³ -13
850°C1 x 10-6 61741 0.03 0.1 x10³ -61 x 10- 5 98281 0.02 0.2 x 10 3 61 x 10-4 105876 0.05 0.3 x10³ 11 x 10-3 75005 0.06 0.4 x10³ 0.1
In this work a simple Least Square Method using a X2 as a criterion for goodness offit, was used to fit the experimental true stress-strain data to the constitutive equations 2and 5. The parameters obtained for the different strain rates are listed in Table 3. Oncethe parameters are determined, the model vs experimental data were plotted to check thereliability of the modeln. The results are shown in Figures 4.
(6)
5
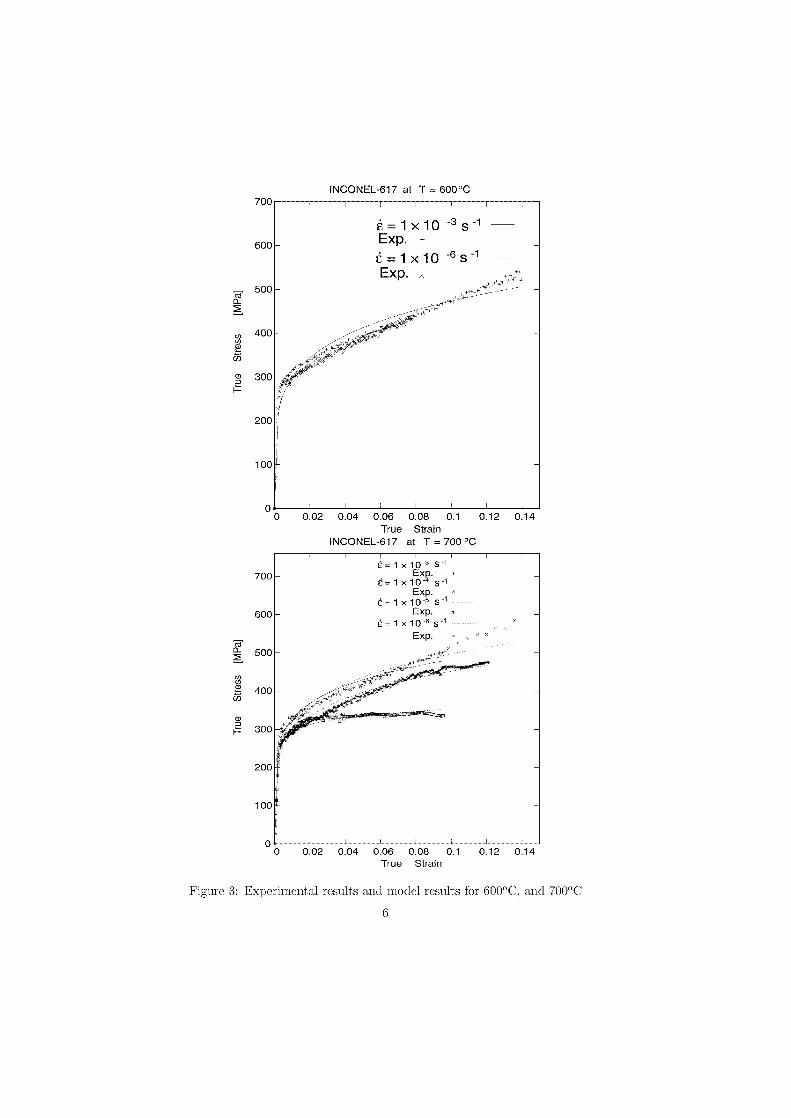
Ü= 1 x 10 3 S-1 Exp.
Ü-= 1 X 10 4 s-1 Exp.
= 1X 10⁻⁵ s11Exp.
ü=1x 10' s'lExp.
2
'1=
0.02 0.04 0.06 0.08 0.1 0.12 0.14True Strain
INCONEL-617 at T = 700 °C
Figure 3: Experimental results and model results for 600°C, and 700°C
6
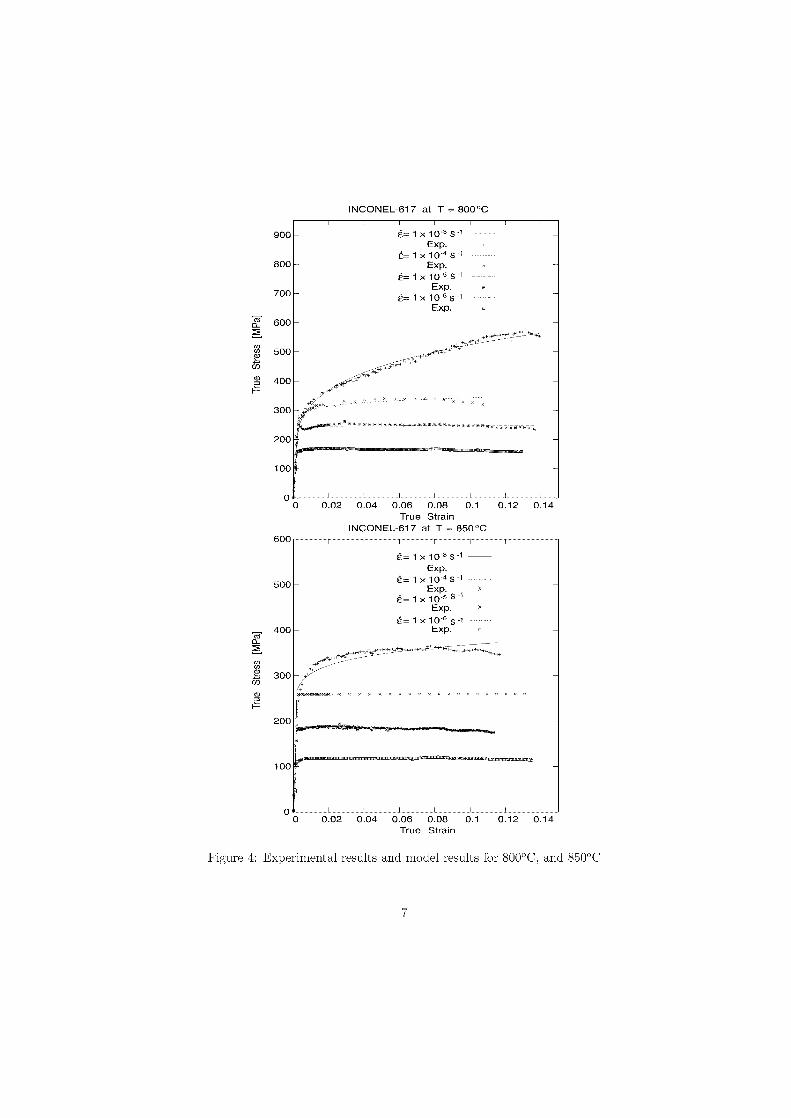
0.12 0.14
600
ü= 1 x 10⁻³ S -1 Exp.
ü=1 x10⁻⁴ S-1Exp.
ü= 1 x 10⁻⁵ 8 -1Exp.
1 x 10 -6 s 1Exp.
500
400
300
200
100
INCONEL-617 at T = 800°C
900
800
700
600
500
400
300
200
100
S= 1 X 1 0 S 1Exp.
=1x10-45 - 1Exp.
ü= 1 X 10⁻⁵ S -1
Exp.ü= 1 x 10⁻⁶ s -1
Exp.
Figure 4: Experimental results and model results for 800°C, and 850°C
7
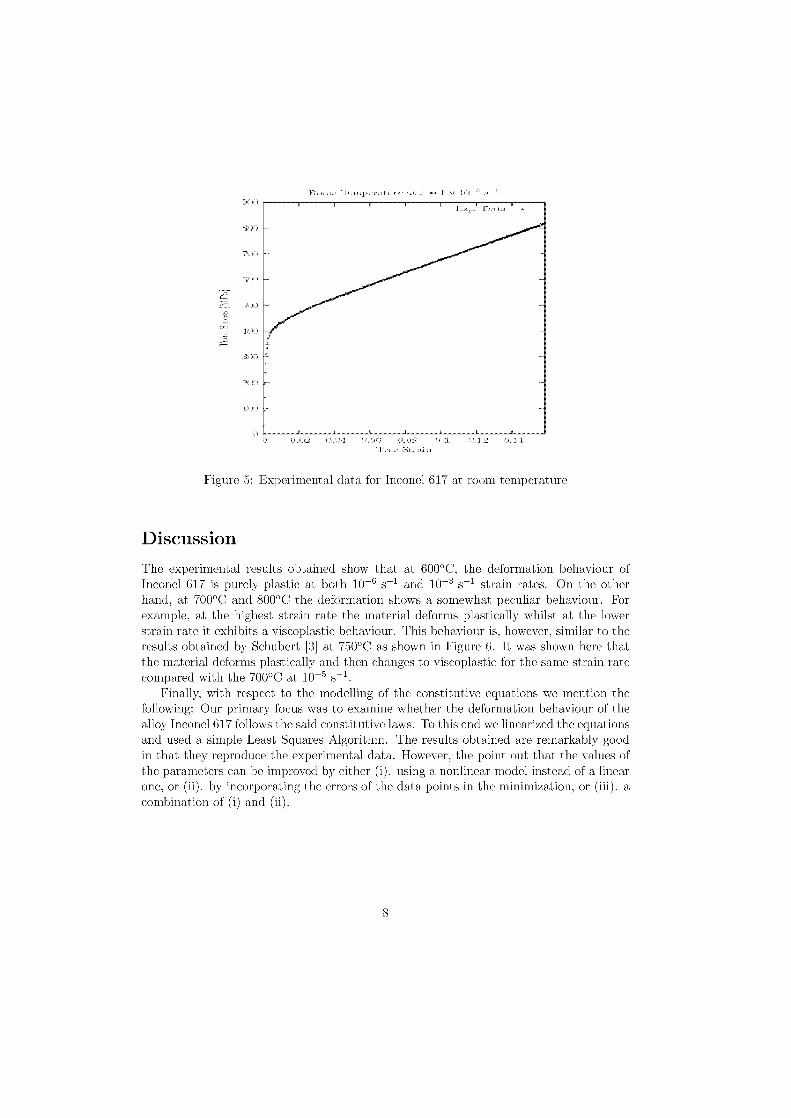
Figure 5: Experimental data for Inconel 617 at room temperature
Discussion
The experimental results obtained show that at 600°C, the deformation behaviour ofInconel 617 is purely plastic at both 10- 6 s- 1 and 10-3 s- 1 strain rates. On the otherhand, at 700°C and 800°C the deformation shows a somewhat peculiar behaviour. Forexample, at the highest strain rate the material deforms plastically whilst at the lowerstrain rate it exhibits a viscoplastic behaviour. This behaviour is, however, similar to theresults obtained by Schubert [3] at 750°C as shown in Figure 6. It was shown here thatthe material deforms plastically and then changes to viscoplastic for the same strain ratecompared with the 700°C at 10-5
Finally, with respect to the modelling of the constitutive equations we mention thefollowing: Our primary focus was to examine whether the deformation behaviour of thealloy Inconel 617 follows the Said constitutive laws. To this end we linearized the equationsand used a simple Least Squares Algorithm. The results obtained are remarkably goodin that they reproduce the experimental data. However, the point out that the values ofthe parameters can be improved by either (i). using a nonlinear model instead of a linearone, or (ii). by incorporating the errors of the data points in the minimization, or (iii). acombination of (i) and (ii).
8
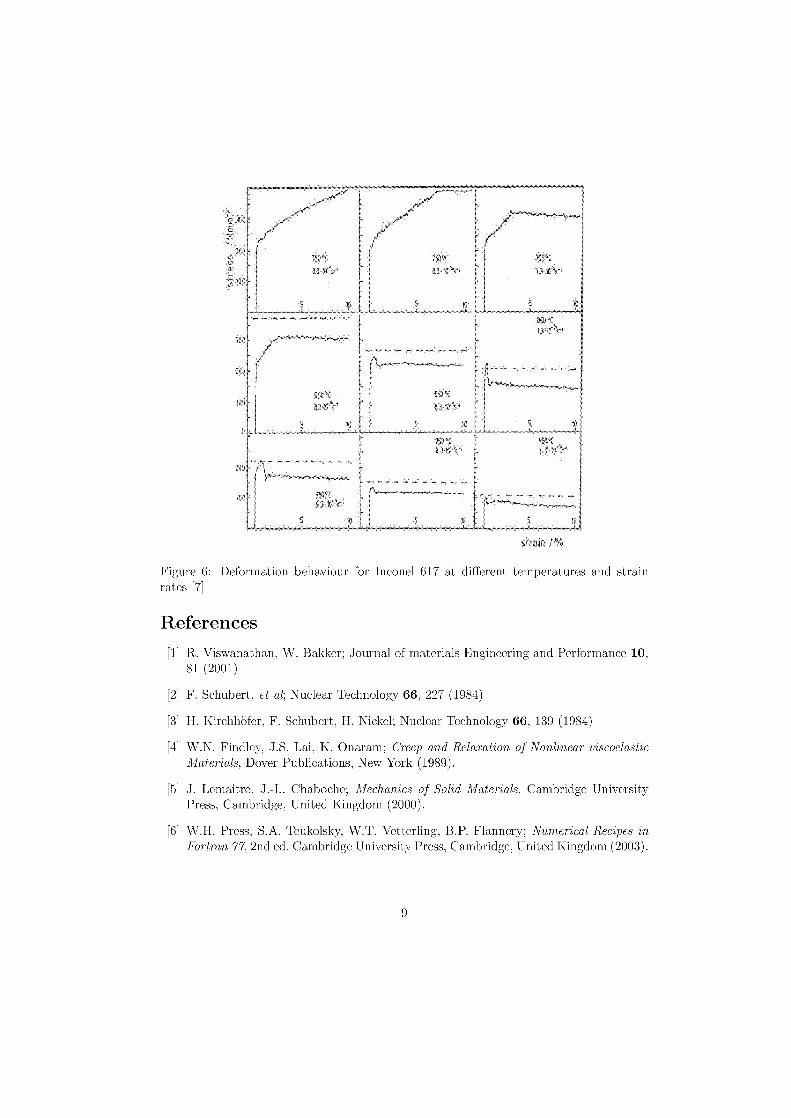
Figure 6: Deformation behaviour for Inconel 617 at different temperatures and strainrates [7]
References[1] R. Viswanathan, W. Bakker; Journal of materials Engineering and Performance 10,
81 (2001)
[2] F. Schubert, et al; Nuclear Technology 66, 227 (1984)
[3] H. Kirchhöfer, F. Schubert, H. Nickel; Nuclear Technology 66, 139 (1984)
[4] W.N. Findley, J.S. Lai, K. Onaram; Creep and Relaxation of Nonlinear viscoelasticMaterials, Dover Publications, New York (1989).
[5] J. Lemaitre, J.-L. Chaboche; Mechanics of Solid Materials, Cambridge UniversityPress, Cambridge, United Kingdom (2000).
[6] W.H. Press, S.A. Teukolsky, W.T. Vetterling, B.P. Flannery; Numerical Recipes inFortran 77, 2nd ed. Cambridge University Press, Cambridge, United Kingdom (2003).

[7] F. Schubert; Habilitation Thesis,"Werkstoffkunliche Gesichtspunkte bei der Ausle-gung kriechbeanspruchter Hochtemperaturkomponenten morderner Ernegieerzeu-gungsalagen" Univ. Aachen, German 1990.
10
FIELD TESTING OF TP 347H FG AT ULTRA SUPERCRITICAL STEAM
CONDITIONS
A.N. Hanssona and M. Montgomeryb
Department of Manufacturing Engineering and Management, Technical University of Denmark,
Kemitorvet b. 204, DK-2800 Kgs. Lyngby, Denmark
[email protected], [email protected]
Abstract
TP 347H FG was exposed in test superheater loops in a Danish coal-fired power plant. The superheaters wereexposed at ultra supercritical steam conditions for 7720 h, 22985 h, 29588 h, and 57554 h. The steam oxidationresults from the superheaters with the 3 shortest exposure times have been reported previously [1]. It was found thatthe thickness of the inner layer did not change significantly with oxidation time and temperature. Instead, the innerlayer became more Cr rich at higher temperatures and consequently, it offered a higher protectiveness againstoxidation.
In this paper, the steam oxidation results from the superheater exposed for the longest duration are reported.Surprisingly, extensive oxide growth had occurred at the lowest temperatures (506°C and 534°C) as compared to theprevious exposures, and the inner layer had become more Fe rich. The microstructure and the average thickness ofthe inner oxide layer for the samples, which were exposed between 541°C and 620°C, reflected the earlier testresults. Considerable oxide growth had also occurred at the highest temperature (648°C) such that the inner layerconsisted of a Fe-Ni-Cr spinel layer, which was sandwiched between two Cr 203 layers. The morphology shows thatthe first formed Cr 203 layer does not remain protective. This paper focuses on the differences in the morphologybetween the samples exposed for 57554 h and those exposed at shorter times. The results are discussed in terms ofhydrogen effects, Cr diffusion and growth stresses.
Keywords: Steam oxidation, Cr-diffusion, hydrogen effects, growth stresses.
Introduction
The goal of increasing the efficiency of steam power plants in order to reduce fuel consumptionand the CO2 emissions has been pursued for many years. lt can be achieved by raising the steamtemperature and pressure. Higher steam temperatures may result in thicker steamside oxide layerson superheater tubes, which will increase the metal temperature, and thereby the corrosion andcreep degradation of the steel tubes [2]. Furthermore, thick oxides are more susceptible toexfoliation, which can cause blockage of the superheater tubes [3]. Therefore, knowledge aboutthe steam oxidation behaviour of the steels is required in order to predict the lifetime ofsuperheater tubes.
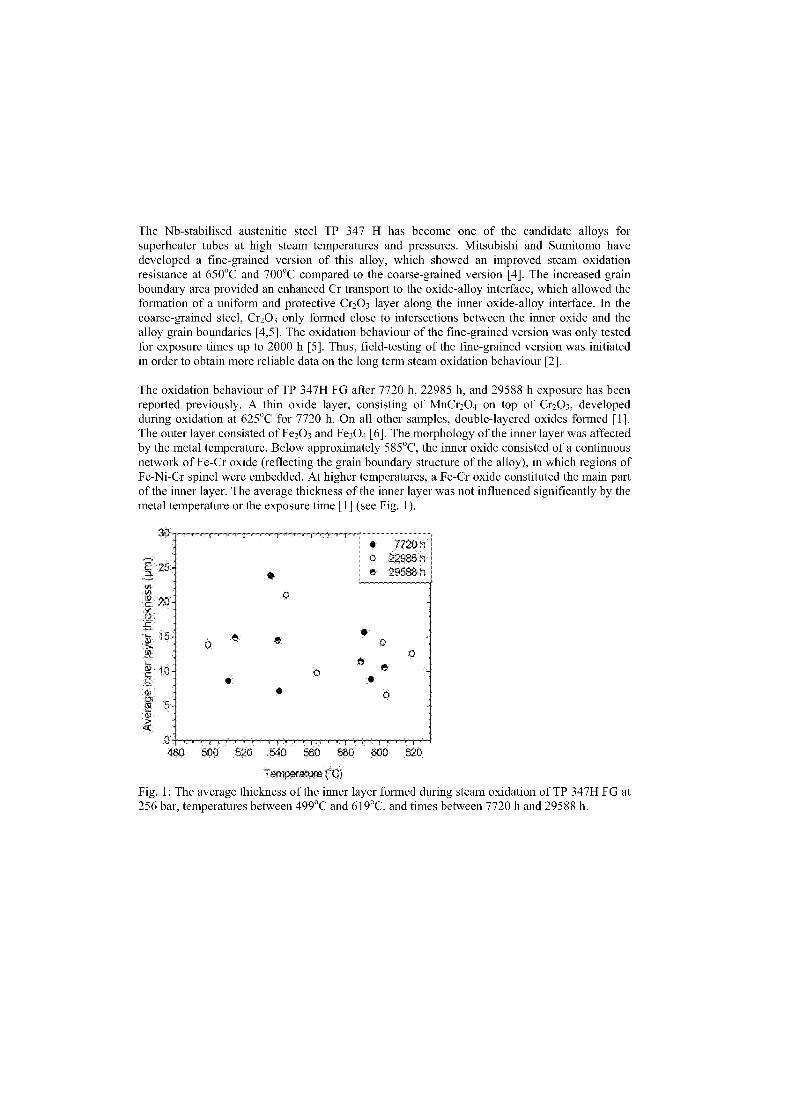
7720 h22985 h29538 h
The Nb-stabilised austenitic steel TP 347 H has become one of the candidate alloys forsuperheater tubes at high steam temperatures and pressures. Mitsubishi and Sumitomo havedeveloped a fine-grained version of this alloy, which showed an improved steam oxidationresistance at 650°C and 700°C compared to the coarse-grained version [4]. The increased grainboundary area provided an enhanced Cr transport to the oxide-alloy interface, which allowed theformation of a uniform and protective Cr203 layer along the inner oxide-alloy interface. In thecoarse-grained steel, Cr203 only formed dose to intersections between the inner oxide and thealloy grain boundaries [4,5]. The oxidation behaviour of the fine-grained version was only testedfor exposure times up to 2000 h [5]. Thus, field-testing of the fine-grained version was initiatedin order to obtain more reliable data on the long term steam oxidation behaviour [2].
The oxidation behaviour of TP 347H FG after 7720 h, 22985 h, and 29588 h exposure has beenreported previously. A thin oxide layer, consisting of MnCr2O4 on top of Cr203 , developedduring oxidation at 625°C for 7720 h. On all other samples, double-layered oxides formed [1].The outer layer consisted of Fe203 and Fe304 [6]. The morphology of the inner layer was affectedby the metal temperature. Below approximately 585°C, the inner oxide consisted of a continuousnetwork of Fe-Cr oxide (reflecting the grain boundary structure of the alloy), in which regions ofFe-Ni-Cr spinel were embedded. At higher temperatures, a Fe-Cr oxide constituted the main partof the inner layer. The average thickness of the inner layer was not influenced significantly by themetal temperature or the exposure time [1] (see Fig. 1).
480 500 520 540
0 580
0 620
Tempenture C)
Fig. 1: The average thickness of the inner layer formed during steam oxidation of TP 347H FG at256 bar, temperatures between 499°C and 619°C, and times between 7720 h and 29588 h.
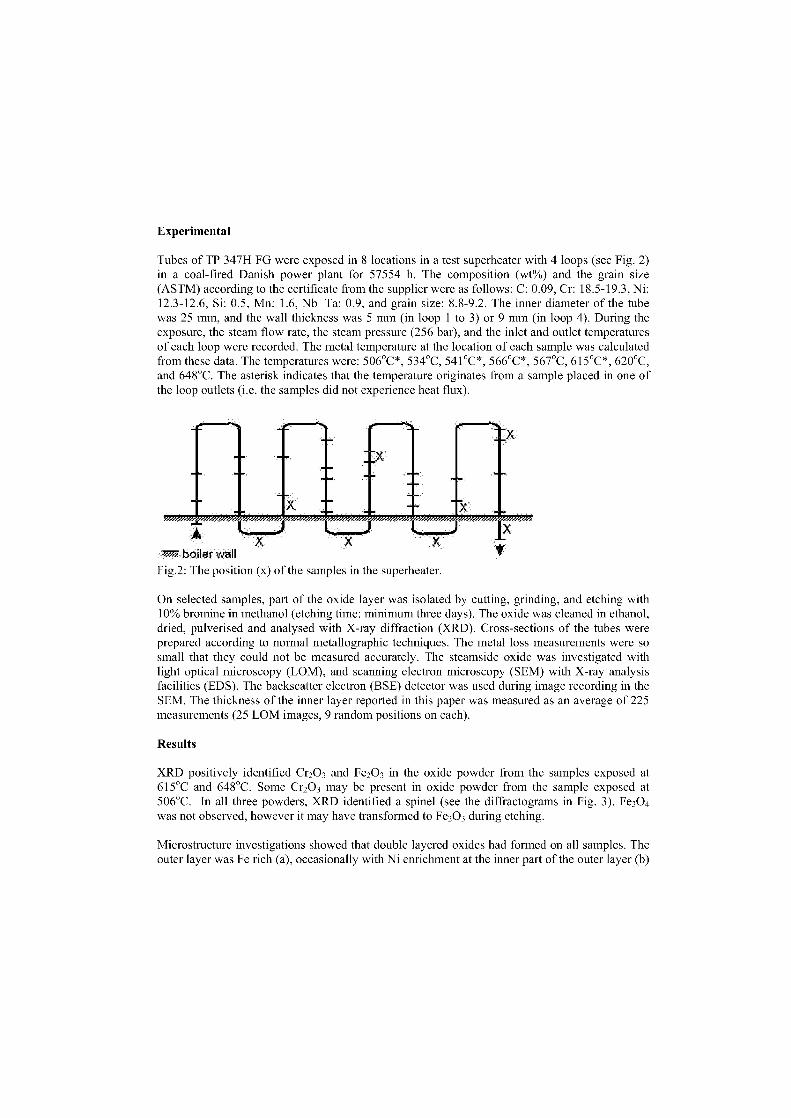
Experimental
Tubes of TP 347H FG were exposed in 8 locations in a test superheater with 4 loops (see Fig. 2)in a coal-fired Danish power plant for 57554 h. The composition (wt%) and the grain size(ASTM) according to the certificate from the supplier were as follows: C: 0.09, Cr: 18.5-19.3, Ni:12.3-12.6, Si: 0.5, Mn: 1.6, Nb+Ta: 0.9, and grain size: 8.8-9.2. The inner diameter of the tubewas 25 mm, and the wall thickness was 5 mm (in loop 1 to 3) or 9 mm (in loop 4). During theexposure, the steam flow rate, the steam pressure (256 bar), and the inlet and outlet temperaturesof each loop were recorded. The metal temperature at the location of each sample was calculatedfrom these data. The temperatures were: 506°C*, 534°C, 541°C*, 566°C*, 567°C, 615°C*, 620°C,and 648°C. The asterisk indicates that the temperature originates from a sample placed in one ofthe loop outlets (i.e. the samples did not experience heat flux).
X
XX
boiler wall
Fig.2: The position (x) of the samples in the superheater.
On selected samples, part of the oxide layer was isolated by cutting, grinding, and etching with10% bromine in methanol (etching time: minimum three days). The oxide was cleaned in ethanol,dried, pulverised and analysed with X-ray diffraction (XRD). Cross-sections of the tubes wereprepared according to normal metallographic techniques. The metal loss measurements were sosmall that they could not be measured accurately. The steamside oxide was investigated withlight optical microscopy (LOM), and scanning electron microscopy (SEM) with X-ray analysisfacilities (EDS). The backscatter electron (BSE) detector was used during image recording in theSEM. The thickness of the inner layer reported in this paper was measured as an average of 225measurements (25 LOM images, 9 random positions on each).
Results
XRD positively identified Cr203 and Fe203 in the oxide powder from the samples exposed at615°C and 648°C. Some Cr203 may be present in oxide powder from the sample exposed at506°C. In all three powders, XRD identified a spinel (see the diffractograms in Fig. 3). Fe3O4was not observed, however it may have transformed to Fe 203 during etching.
Microstructure investigations showed that double layered oxides had formed on all samples. Theouter layer was Fe rich (a), occasionally with Ni enrichment at the inner part of the outer layer (b)
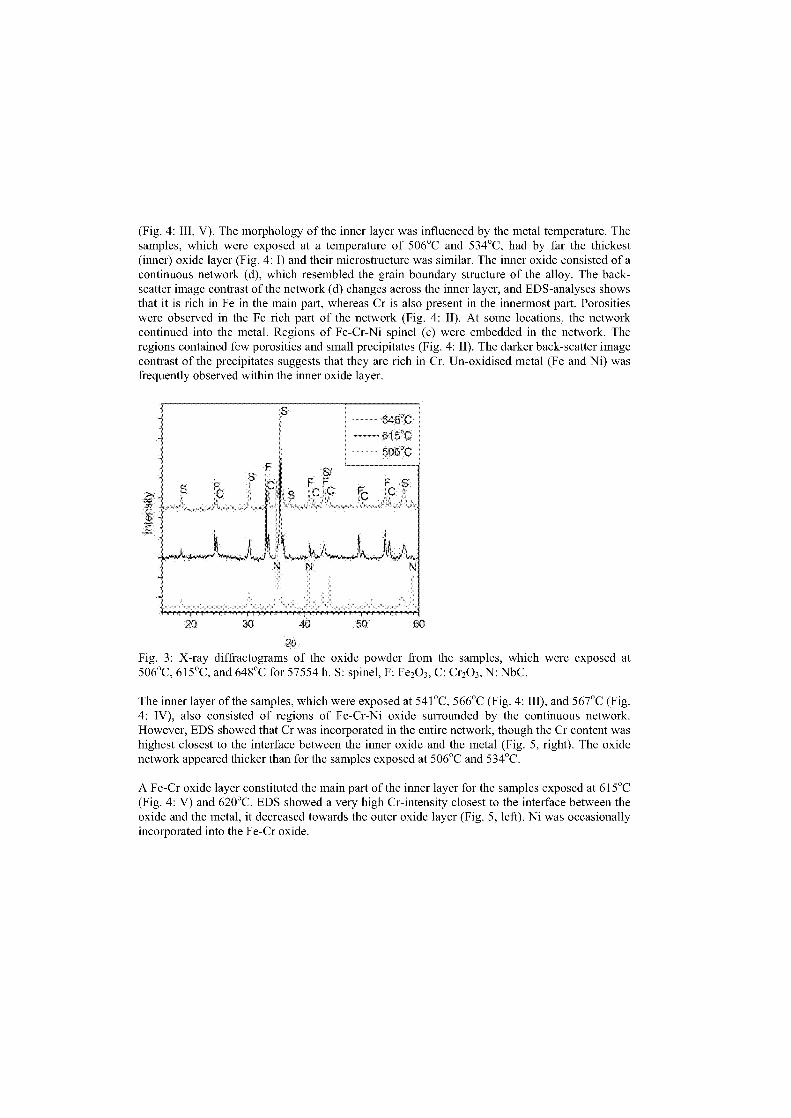
(Fig. 4: III, V). The morphology of the inner layer was influenced by the metal temperature. Thesamples, which were exposed at a temperature of 506°C and 534°C, had by far the thickest(inner) oxide layer (Fig. 4: I) and their microstructure was similar. The inner oxide consisted of acontinuous network (d), which resembled the grain boundary structure of the alloy. The back-scatter image contrast of the network (d) changes across the inner layer, and EDS-analyses showsthat it is rich in Fe in the main part, whereas Cr is also present in the innermost part. Porositieswere observed in the Fe rich part of the network (Fig. 4: II). At some locations, the networkcontinued into the metal. Regions of Fe-Cr-Ni spinel (c) were embedded in the network. Theregions contained few porosities and Small precipitates (Fig. 4: II). The darker back-scatter imagecontrast of the precipitates suggests that they are rich in Cr. Un-oxidised metal (Fe and Ni) wasfrequently observed within the inner oxide layer.
20Fig. 3: X-ray diffractograms of the oxide powder from the samples, which were exposed at506°C, 615°C, and 648°C for 57554 h. S: spinel, F: Fe 203 , C: C(203 , N: NbC.
The inner layer of the samples, which were exposed at 541°C, 566°C (Fig. 4: III), and 567°C (Fig.4: IV), also consisted of regions of Fe-Cr-Ni oxide surrounded by the continuous network.However, EDS showed that Cr was incorporated in the entire network, though the Cr content washighest closest to the interface between the inner oxide and the metal (Fig. 5, right). The oxidenetwork appeared thicker than for the samples exposed at 506°C and 534°C.
A Fe-Cr oxide layer constituted the main part of the inner layer for the samples exposed at 615°C(Fig. 4: V) and 620°C. EDS showed a very high Cr-intensity closest to the interface between theoxide and the metal, it decreased towards the outer oxide layer (Fig. 5, left). Ni was occasionallyincorporated into the Fe-Cr oxide.
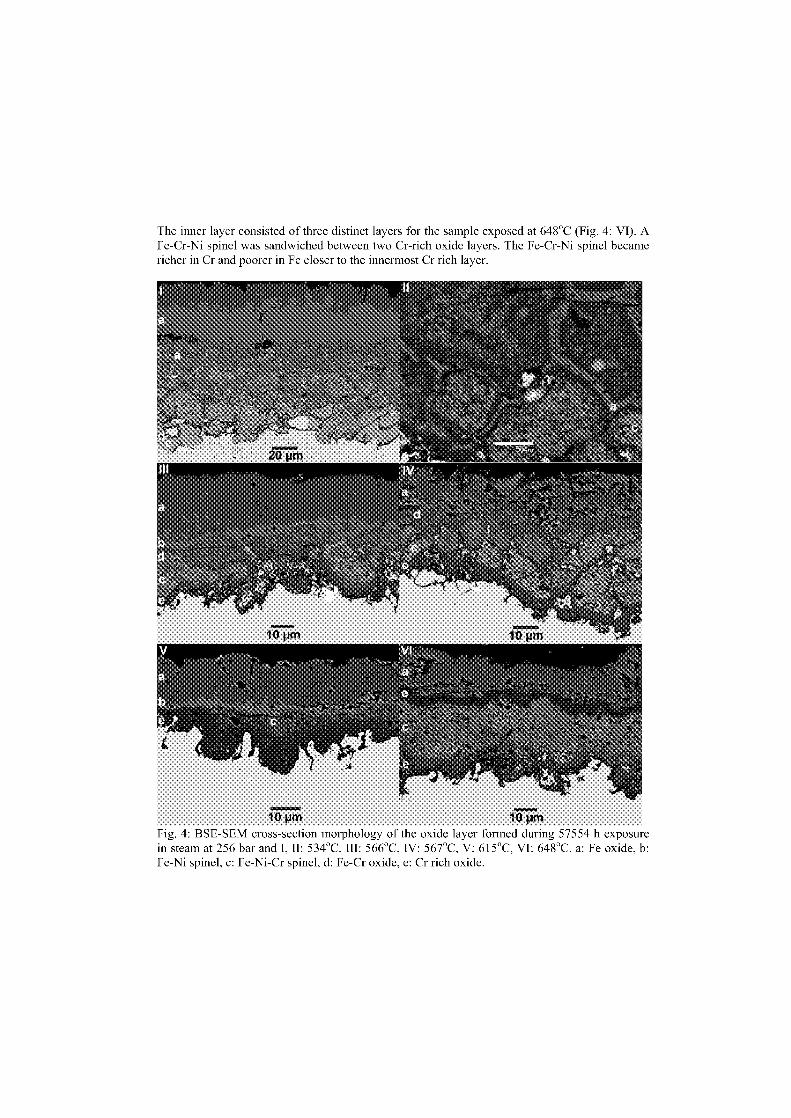
The inner layer consisted of three distinct layers for the sample exposed at 648°C (Fig. 4: VI). AFe-Cr-Ni spinel was sandwiched between two Cr-rich oxide layers. The Fe-Cr-Ni spinel becamericher in Cr and poorer in Fe closer to the innermost Cr rich layer.
10 WM 10 iJmFig. 4: BSE-SEM cross-section morphology of the oxide layer formed during 57554 h exposurein steam at 256 bar and I, II: 534°C, III: 566°C, IV: 567°C, V: 615°C, VI: 648°C. a: Fe oxide, b:Fe-Ni spinel, c: Fe-Ni-Cr spinel, d: Fe-Cr oxide, e: Cr rich oxide.
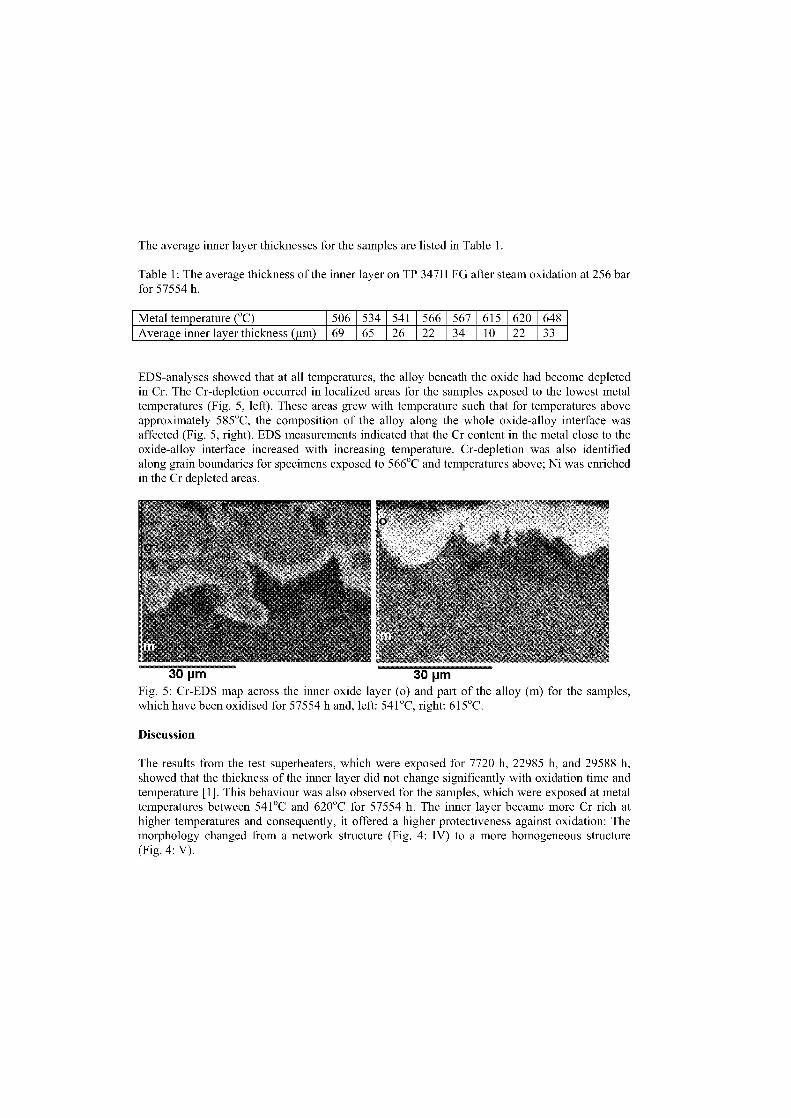
The average inner layer thicknesses for the samples are listed in Table 1.
Table 1: The average thickness of the inner layer an TP 347H FG alter steam oxidation at 256 barfor 57554 h.
Metal temperature (°C) 506 534 541 566 567 615 620 648Average inner layer thickness (tn) 69 65 26 22 34 10 22 33
EDS-analyses showed that at all temperatures, the alloy beneath the oxide had become depletedin Cr. The Cr-depletion occurred in localized areas for the samples exposed to the lowest metaltemperatures (Fig. 5, left). These areas grew with temperature such that for temperatures aboveapproximately 585°C, the composition of the alloy along the whole oxide-alloy interface wasaffected (Fig. 5, right). EDS measurements indicated that the Cr content in the metal dose to theoxide-alloy interface increased with increasing temperature. Cr-depletion was also identifiedalong grain boundaries for specimens exposed to 566°C and temperatures above; Ni was enrichedin the Cr depleted areas.
30 pm 30 pmFig. 5: Cr-EDS map across the inner oxide layer (o) and part of the alloy (m) for the samples,which have been oxidised for 57554 h and, left: 541°C, right: 615°C.
Discussion
The results from the test superheaters, which were exposed for 7720 h, 22985 h, and 29588 h,showed that the thickness of the inner layer did not change significantly with oxidation time andtemperature [1]. This behaviour was also observed for the samples, which were exposed at metaltemperatures between 541°C and 620°C for 57554 h. The inner layer became more Cr rich athigher temperatures and consequently, it offered a higher protectiveness against oxidation: Themorphology changed from a network structure (Fig. 4: IV) to a more homogeneous structure(Fig. 4: V).
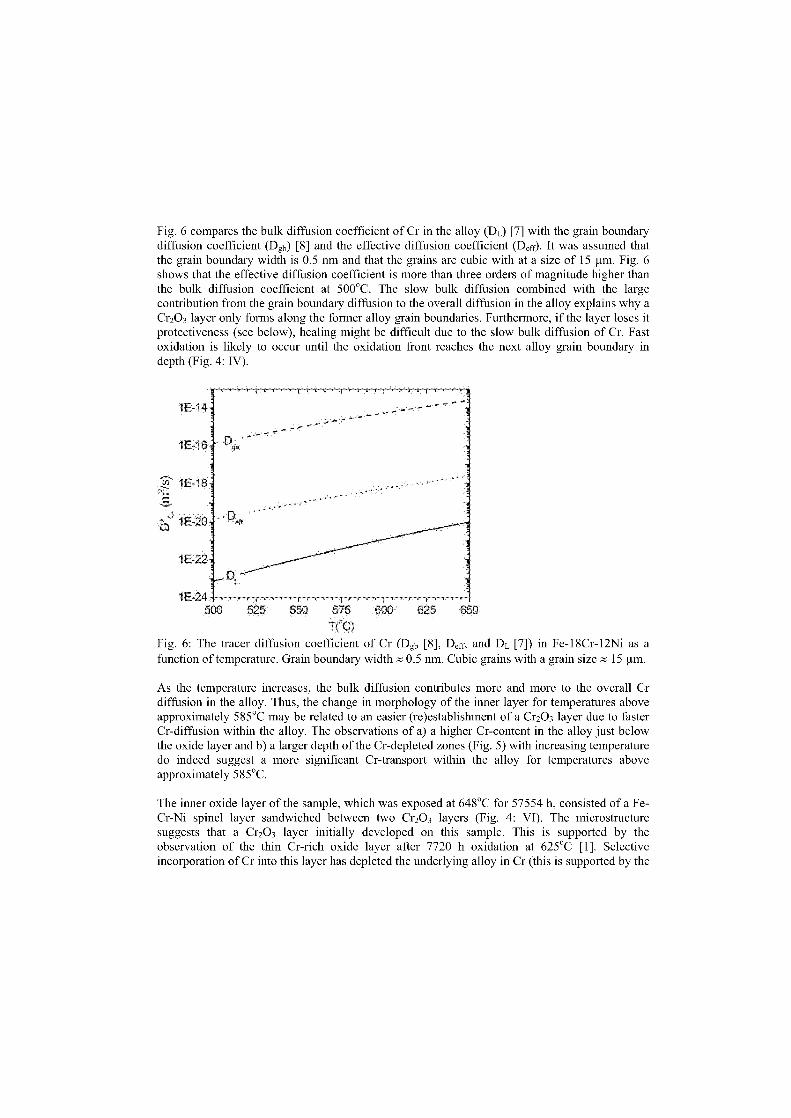
650
Fig. 6 compares the bulk diffusion coefficient of Cr in the alloy (D L) [7] with the grain boundarydiffusion coefficient (D gb) [8] and the effective diffusion coefficient (Da t.). lt was assumed thatthe grain boundary width is 0.5 nm and that the grains are cubic with at a size of 15 nm. Fig. 6shows that the effective diffusion coefficient is more than three orders of magnitude higher thanthe bulk diffusion coefficient at 500°C. The slow bulk diffusion combined with the largecontribution from the grain boundary diffusion to the overall diffusion in the alloy explains why aCr203 layer only forms along the former alloy grain boundaries. Furthermore, if the layer loses itprotectiveness (see below), healing might be difficult due to the slow bulk diffusion of Cr. Fastoxidation is likely to occur until the oxidation front reaches the next alloy grain boundary indepth (Fig. 4: IV).
Fig. 6: The tracer diffusion coefficient of Cr (D gb [8], Den-, and D L [7]) in Fe-18Cr-12Ni as afunction of temperature. Grain boundary width z' 0.5 nm. Cubic grains with a grain size 15 tim.
As the temperature increases, the bulk diffusion contributes more and more to the overall Crdiffusion in the alloy. Thus, the change in morphology of the inner layer for temperatures aboveapproximately 585°C may be related to an easier (re)establishment of a Cr 203 layer due to fasterCr-diffusion within the alloy. The observations of a) a higher Cr-content in the alloy just belowthe oxide layer and b) a larger depth of the Cr-depleted zones (Fig. 5) with increasing temperaturedo indeed suggest a more significant Cr-transport within the alloy for temperatures aboveapproximately 585°C.
The inner oxide layer of the sample, which was exposed at 648°C for 57554 h, consisted of a Fe-Cr-Ni spinel layer sandwiched between two Cr 203 layers (Fig. 4: VI). The microstructuresuggests that a Cr203 layer initially developed an this sample. This is supported by theobservation of the thin Cr-rich oxide layer after 7720 h oxidation at 625°C [1]. Selectiveincorporation of Cr into this layer has depleted the underlying alloy in Cr (this is supported by the
Cr gradient in the Fe-Cr-Ni spinel layer). At some point the oxidation front has broken throughthis layer. Chemical breakthrough is generally considered unlikely at the temperatures of interest[9,10] as Cr203 coexists in equilibrium with an alloy containing 3.5*10 -5 wt% Cr (648°C) [11].The breakthrough has more likely been caused by localized spallation [10] and/or micro cracking[9] as a result of geometrically induced growth stresses. Fast oxidation of the depleted alloy didoccur until a depth was reached, at which the Cr-content was high enough for the protective layerto reform [9,10] (i.e. the innermost Cr203 layer).
The oxide network was Fe rich and the oxide layer was thicker for the samples exposed at 506°Cand 534°C for 57554 h as compared to all the other samples. The cation diffusion rates in Fe-Crspinels increases with decreasing Cr content [12,13] thus the two observations are probablyrelated. But why has the network become more Fe rich? One reason could be that the network hasbecome more and more depleted in Cr due to the formation of gaseous Cr0 2(OH)2 . Such amechanism has been proven detrimental for the oxidation resistance of chromia forming alloys infast flowing atmospheres with high oxygen and water contents [14,15]. However, thermodynamiccalculation suggests that the amount of volatile Cr components in steam is negligible due to thelow oxygen content (in the order of 10 ppb) [16].
During oxidation in steam, H2 develops both at the oxide-gas interface and at the oxide-alloyinterface (as a result of the inward growth of the inner layer) [17]. Perhaps, the formed H wasaccumulated with time within the alloy of the samples, which was exposed at the lowesttemperatures (506°C and 534°C) [18]. H is believed to change the defect structure of the spinel[19], leading to an enhanced cation transport [19,20]: Oxidation of Fe and H-induced Fe (i.e. theH-content of Fe was increased by electrolysis of H 20) at 500°C in 0 2 showed faster oxide growthon the H-induced sample [20]. The oxidation rate of ferritic steels with Cr content between 2 and12 wt% at 600°C in air was enhanced when the steels were exposed to steam on one side and airon the other side as compared to air on both sides. H was found to penetrate through the samplefrom the steam side to the air side [21]. H2 desorption occurred at approx. 330°C during coolingin Ar after steam oxidation of Fe-10Cr-0.8C for 1000 h at 650°C. H2 desorption was not observedat this temperature during heating of the non-exposed steel in Ar. H was believed primarily todissolve in the Fe-Cr spinel [19]. Preliminary results indicate that the H content of the metal didindeed increase during the 57554 h oxidation at 506°C [22] thus a H-induced, enhanced outwardFe cation diffusion may possibly explain the increased growth for the samples exposed at 506°Cand 534°C for 57554 h.
Conclusion
The large contribution from grain boundary diffusion to the Cr transport within the alloy explainswhy a protective Cr203 layer is only observed along former alloy grain boundaries at the lowesttemperatures. Bulk diffusion contributes more and more to the Cr transport within the alloy withincreasing temperature, which eases the (re)formation of a protective Cr 203 layer. This explainsthe Charge in morphology of the inner layer for temperatures above approximately 585°C.At 648°C the first formed Cr203 layer has lost it protectiveness during the 57554 h exposure as aresult of localized spallation and/or micro cracking. The spallation or cracking occurred as a
result of geometrical induced growth stresses. Fast oxidation of the depleted alloy did occur untila depth was reached, at which the Cr-content was high enough for Cr203 to reform.
Increased oxide growth was observed for the samples, which were exposed at 506°C and 534°Cfor 57554 h. Moreover, the oxide network along the former grain boundaries had become Fe-rich.It is suggested that H has accumulated with time within the alloy during steam oxidation,resulting in an enhanced outward Fe cation diffusion.
Acknowledgement
Elsam and Energy E2 are acknowledged for partnership. ELTRA and Eikraft systems areacknowledged for funding (PSO project no. 5293).
References
[1] J. Jianmin, M. Montgomery, O.H. Larsen, and S.A. Jensen, Investigation on steam oxidationbehaviour of TP 347H FG. Part 1: Exposure at 256 bar, Materials and Corrosion, 2005, 56(7),459-467.[2] Von G. Scheffknecht, R. Blum, Q. Chen, and A. Vanderschaeghe, Ein Vorhaben zurErmittlung der Hochtemperaturkorrosionseigenschaften verschiedener Dampferzeugerwerkstoffeunter Betriebbedingungen bis 620°C, VGB Kraftwerkstechnik, Vol. 76(10), 1996, 856-862.[3] O.H. Larsen, R.B. Frandsen, and R. Blum, Exfoliation of Steamside Oxides from AusteniticSuperheaters, VGB PowerTech, 84(7), 2004, 89-94.[4] H. Teranishi, Y. Sawaragi, M. Kubota, and Y. Hayase, Fine-grained TP 347H Steel Tubingwith High Elevated Temperature Strength and Corrosion Resistance for Boiler Applications, TheSumitomo Search, 38(5), 1989, 63-74.[5] N. Otsuka, and H. Fujikawa, Scaling of Austenitic Stainless Steels and Nickel-Base Alloysin High-Temperature Steam at 973 K, Corrosion, April, 1991, 240-248.[6] Pantleon, K. and Montgomery, M., Phase identification and internal stress analysis ofsteamside oxides on superheater tubes by means of X-ray diffraction, Värmeforsk report M4-312,2004.[7] DICTRA Software, SE.[8] J. üermak, Grain Boundary Diffusion of 51 Cr in Fe-Cr-Ni Alloys, Zeitschrift für Metallkunde,81(3), 1990, 193-195.[9] J.P. Vossen, K. Gawenda, K. Rahts, M. Röhrig, M. Schorr, and M. Schütze, Limits in theOxidation Resistance of Several Heat-Resistant Steels under Isothermal and Cyclic Oxidation aswell as under creep in air, Materials at High Temperatures, 14(4), 1997, 387-401.[10] H.E. Evans, A.T. Donaldson, and T.C. Gilmour, The Development of Localized Pits DuringStainless Steel Oxidation, Oxidation of Metals, 14(3), 1980, 235-247.[11] Thermo Calc Software, SE.[12] J. Töpfer, S. Aggarwal, and R. Dieckmann, Point Defects and Cation Tracer Diffusion in(Cr„Fe1-.)3-s04 Spinels, Solid State Tonics, 81, 1995, 251-266.[13] R. Dieckmann, T.O. Mason, J.D. Hogde and H. Schmalzried, Defects and Cation Diffusionin Magnetite (III) Tracer Diffusion of Foreign Tracer Cations as a Function of Temperature andOxygen Potential, Berichte der Bunsen-Gesellschaft Physik Chemie, 82, 1978, 778-783.
[14] H. Asteman, K. Segerdahl, J.-E. Svensson, and L.-G. Johansson, The Influence of WaterVapour on the Corrosion of Chromia-forming Steel, Materials Science Forum, 369-372, 2001,277-286.[15] H. Asteman, K. Segerdahl, J.-E. Svensson, and L.-G. Johansson, Evidence of ChromiumEvaporation Influencing the Oxidation of 304L: The Effect of Temperature and Flow Rate,Oxidation of Metals, 57(3/4), 2002, 193-216.[16] B.B. Ebbinghaus, Thermodynamics of Gas Phase Chromium Species: The ChromiumOxides, the Chromium Oxyhydroxides, and Volatility Calculations in Waste IncinerationProcesses, Combustion and Flame, 93, 1993, 119-137.[17] L. Thomlinson and N.J. Cory, Hydrogen Emission during the Steam Oxidation of FerriticSteels: Kinetics and Mechanism, Corrosion Science, 29(8), 1989, 939-965.[18] G. Hultquist, private communication with M. Montgomery, December 2005.[19] M. Nakai, K. Nagai, Y. Murata, M. Morinaga, S. Matsuda, and M. Kanno, Correlation ofHigh-Temperature Steam Oxidation with Hydrogen Dissolution in Pure Iron and Ternary High-chromium Ferritic Steel, ISIJ International, 45(7), 2005, 1066-1072.[20] D. Wallinder, E. Hörnlund, and G. Hultquist, Influence of Hydrogen in Iron and in TwoStainless Steels on Aqueous and Gaseous Corrosion, Journal of the Electrochemical Society,149(9), 2002, B393-B397.[21] K. Nakagawa, Y. Matsunaga, and T. Yanagisawa, Corrosion Behavior of Ferritic Steels onthe Air Sides of Boiler Tubes in a Steam/Air Dual Environment, Materials at High Temperatures,20(1), 2003, 63-73.[22] Measurements performed by G. Hultquist, Division of Corrosion Science, Department ofMaterials Science and Engineering, Royal Institute of Technology, Stockholm, Sweden, January2006.
AN IMPROVED METHOD TO CALCULATE THE CREEP-FATIGUEENDURANCE OF TYPE 316H STAINLESS STEEL
M W Spindler
British Energy, Barnett Way, Barnwood, Gloucester, GL4 3RS, [email protected]
Abstract
Austenitic stainless steels are susceptible to creep-fatigue failures, which arise from thermal cycling.Consequently, life extension of stainless components requires accurate predictions of creep-fatigue endurance.Calculations of creep damage during creep-fatigue cycling are often carried out using either a time fractionapproach or a ductility exhaustion approach. In the case of the time fraction approach the rupture strength isused to calculate creep damage, whereas creep ductility is used in the ductility exhaustion approach. This paperexamines whether the time fraction approach or the ductility exhaustion approach gives the better predictions ofcreep damage in creep-fatigue tests on Type 316H steel. In addition, a new creep damage model, which wasdeveloped by removing some of the simplifying assumptions that are made in the ductility exhaustion approach,was used. This new creep damage model is a function of the strain rate, stress and temperature and was derivedfrom creep and constant strain rate test data using a reverse modelling technique. It is shown that the new creepdamage model gives better predictions of creep damage in the creep-fatigue tests than the time fraction and theductility exhaustion approaches.
Keywords: R5, Creep-Fatigue, Type 316H, Creep Damage.
1. Introduction
Within the UK' s advanced gas cooled reactors, AGR, Type 316H stainless steel has been usedfor Boiler tubes, steam pipework and steam headers. Many of these components experienceboth thermal cycles and long periods of steady operation, which lead to the accumulation ofboth fatigue and creep damage. Consequently, life extension of stainless components requiresaccurate predictions of creep-fatigue endurance. The typical design codes and assessmentprocedures that address creep-fatigue loading are ASME III [1], RCC-MR [2] and R5 [3]. InASME III and RCC-MR, calculations of creep damage under conditions of strain control arecarried out using a time fraction approach. The R5 procedure uses a ductility exhaustionapproach to calculate creep damage. It is usual to validate the approaches used to calculatedamage by using isothermal creep-fatigue tests in which a strain controlled dwell is placed atthe maximum strain in the cycle. In particular, UKAEA Springfields and latterly AEATechnology Risley have conducted a series of creep-fatigue tests on cast BQ at 570°C [4].Cast BQ is now the 'best tested' cast of Type 316H at temperatures below 600°C. Thus, it isof particular interest to the operation of AGR and to the validation of R5 Volume 2/3 [3].Previous analyses of the creep and fatigue damage for cast BQ [4] have been used to Showthat the ductility exhaustion approach gives more realistic predictions of creep damage thanthe time fraction approach. In particular, the microstructural evidence of the failuremechanisms corresponded well with the ductility exhaustion approach, in that tests withcalculated creep damages of unity and low fatigue damages failed in a wholly intergranularmanner. In addition, tests with similar levels of calculated creep and fatigue damages failedwith a mixture of transgranular fatigue cracking and intergranular cracking. However, thetime fraction approach did not correspond with the microstructural evidence, in that low creepdamages were calculated for tests which failed in a wholly intergranular manner and high
creep damages were calculated for tests that failed with a mixture of transgranular fatiguecracking and intergranular cracking.
Recently, it has been shown that a new creep damage model, called 'stress modified' ductilityexhaustion gives better predictions of creep damage in the creep-fatigue tests than both thetime fraction and the ductility exhaustion approaches [5,6,7]. The 'stress modified' approachwas developed by removing some of the simplifying assumptions that are made in theductility exhaustion approach and the validation tests were conducted on a Type 347 weldmetal and on a cast Type 304L stainless steel. This paper examines which of the timefraction, the ductility exhaustion or the 'stress modified' approaches give the best predictionsof creep damage in creep-fatigue tests on Type 316H cast BQ at 570°C.
2. Test Data
UKAEA Springfields and latterly AEA Technology Risley (now superseded by SercoAssurance) have conducted fatigue and creep-fatigue tests on cast BQ at 570°C. Many ofthese data have been analysed and reported previously [4]. Nevertheless, for the purposes ofthis paper the fatigue and creep-fatigue data have been reinterpreted in order to calculatefatigue and creep damage. The data were provided by Bretherton [8] under a collaborativeprogramme to develop the R5 procedures.
2.1 Fatigue DataThe data from four fatigue tests are available for cast BQ at 570°C. The tests were carried outunder diametral strain control with a strain rate of either 0.02 or 0.06 %/s. It can be seen fromFigure 1 that the fatigue endurance of cast BQ is dose to the mean for Type 316H, which isgiven in the AGR Materials Data Manual R66 [9]. The definition of fatigue endurance that isused in this report is the number of cycles to give a 25% drop in the peak load, N25%. Thiscorresponds to a crack of 2.6mm in a 7mm diameter specimen.
2.2 Creep-Fatigue DataTwenty six creep-fatigue tests have been conducted on cast BQ at 570°C with strain ranges ofbetween 1.85 and 0.35% and with dwell times of between 1/4 and 48 hours (see Fig. 1). Itshould be noted that there are differences between the test methods for these creep-fatiguetests. Twenty of the tests (with prefix H or S) were carried out under diametral strain control,whereas six of the tests were carried out under axial strain control. The tests with large strainranges and diametral control were subject to elastic follow-up as a consequence of the testmethod. Values for the elastic follow-up factor, Z, have been estimated for these tests and arereported in Table 1.
For the purpose of calculating the creep damage the stress drop during the dwell, Aa, wasfitted to the Feltham equation
AG = G o — a = G o B".1n(b.t/Z +1) (1)
where a and Go are the instantaneous and initial stressec respectively, t is the time and B" andb are material constants. The stress relaxation constants that have been obtained are given inTable 1. Typically stress relaxation data were available for only one cycle of each test,usually this was a mid life cycle, i.e. at saturation.
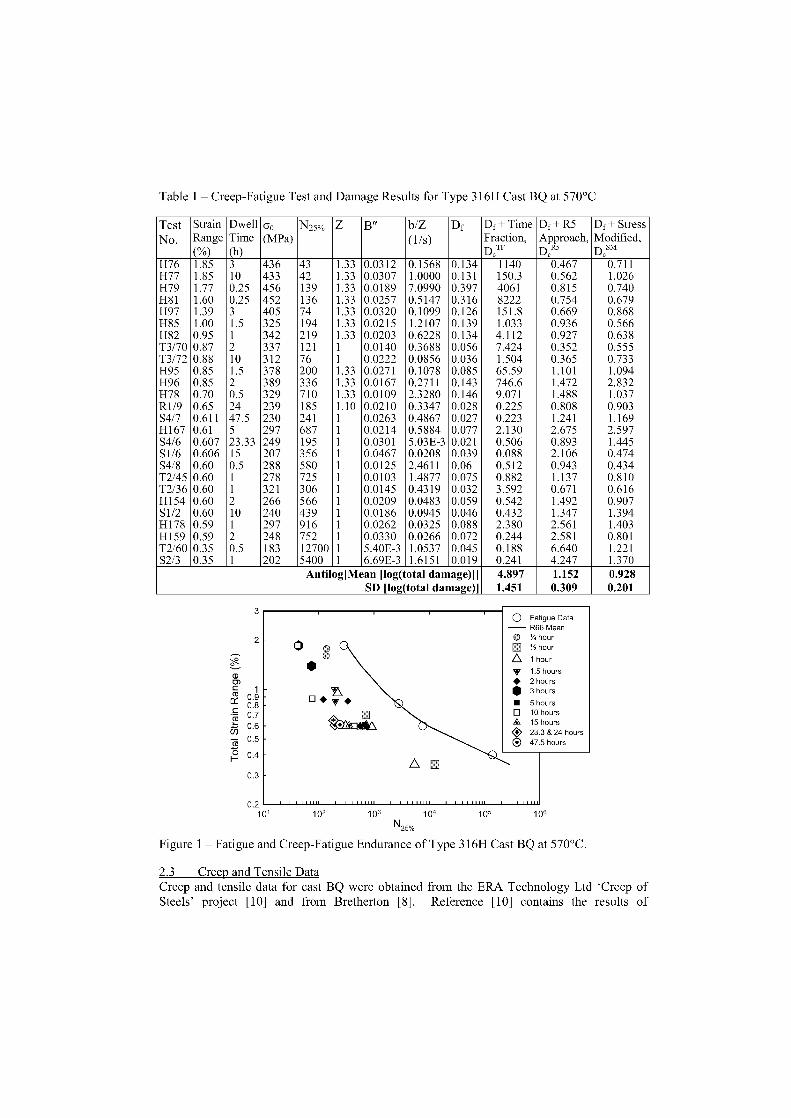
• Fatigue Data- R66 Mean
• % hour13 % hourA 1 hour3 1.5 hours• 2 hours
3 hours■ 5 hoursq 10 hoursA 15 hours• 23.3 & 24 hours® 47 5 hours
Table 1 - Creep-Fatigue Test and Damage Results for Type 316H Cast BQ at 570°C
TestNo.
StrainRange(%)
DwellTime(h)
1:50(MPa)
N25% Z B" b/Z(1/s)
Df Df + TimeFraction,D,TF
Df + R5Approach,DeR5
Dt + StressModified,D,SM
H76 1.85 3 436 43 1.33 0.0312 0.1568 0.134 1140 0.467 0.711H77 1.85 10 433 42 1.33 0.0307 1.0000 0.131 150.3 0.562 1.026H79 1.77 0.25 456 139 1.33 0.0189 7.0990 0.397 4061 0.815 0.740H81 1.60 0.25 452 136 1.33 0.0257 0.5147 0.316 8222 0.754 0.679H97 1.39 3 405 74 1.33 0.0320 0.1099 0.126 151.8 0.669 0.868H85 1.00 1.5 325 194 1.33 0.0215 1.2107 0.139 1.033 0.936 0.566H82 0.95 1 342 219 1.33 0.0203 0.6228 0.134 4.112 0.927 0.638T3/70 0.87 2 337 121 1 0.0140 0.3688 0.056 7.424 0.352 0.555T3/72 0.88 10 312 76 1 0.0222 0.0856 0.036 1.504 0.365 0.733H95 0.85 1.5 378 200 1.33 0.0271 0.1078 0.085 65.59 1.101 1.094H96 0.85 2 389 336 1.33 0.0167 0.2711 0.143 746.6 1.472 2.832H78 0.70 0.5 329 710 1.33 0.0109 2.3280 0.146 9.071 1.488 1.037R1/9 0.65 24 239 185 1.10 0.0210 0.3347 0.028 0.225 0.808 0.903S4/7 0.611 47.5 230 241 1 0.0263 0.4867 0.027 0.223 1.241 1.169H167 0.61 5 297 687 1 0.0214 0.5884 0.077 2.130 2.675 2.597S4/6 0.607 23.33 249 195 1 0.0301 5.03E-3 0.021 0.506 0.893 1.445S1/6 0.606 15 207 356 1 0.0467 0.0208 0.039 0.088 2.106 0.474S4/8 0.60 0.5 288 580 1 0.0125 2.4611 0.06 0.512 0.943 0.434T2/45 0.60 1 278 725 1 0.0103 1.4877 0.075 0.882 1.137 0.810T2/36 0.60 1 321 306 1 0.0145 0.4319 0.032 3.592 0.671 0.616H154 0.60 2 266 566 1 0.0209 0.0483 0.059 0.542 1.492 0.907S1/2 0.60 10 240 439 1 0.0186 0.0945 0.046 0.432 1.347 1.394H178 0.59 1 297 916 1 0.0262 0.0325 0.088 2.380 2.561 1.403H159 0.59 2 248 752 1 0.0330 0.0266 0.072 0.244 2.581 0.801T2/60 0.35 0.5 183 12700 1 5.40E-3 1.0537 0.045 0.188 6.640 1.221S2/3 0.35 1 202 5400 1 6.69E-3 1.6151 0.019 0.241 4.247 1.370
Antilog[Mean [log(total damage)]] 4.897 1.152 0.928SD [log(total damage)] 1.451 0.309 0.201
0)1
• 0.90.8
.2 0.7
▪ 0.6
To 0.5
O• 0.4
0.3
0.2 ,,ou ,.,ou ■■■■
10 1102 103 104 105 106
N25%
Figure 1- Fatigue and Creep-Fatigue Endurance of Type 316H Cast BQ at 570°C.
2.3 Creep and Tensile DataCreep and tensile data for Gast BQ were obtained from the ERA Technology Ltd `Creep ofSteels' project [10] and from Bretherton [8]. Reference [10] contains the results of
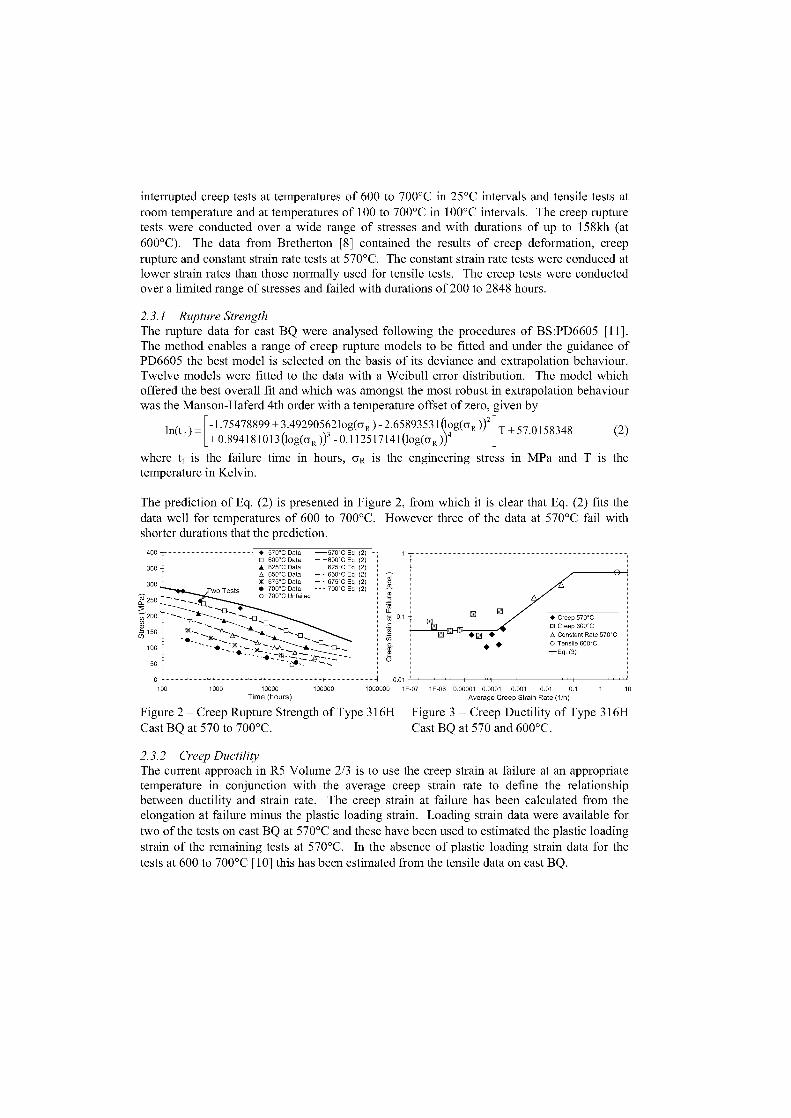
interrupted creep tests at temperatures of 600 to 700°C in 25°C intervals and tensile tests atroom temperature and at temperatures of 100 to 700°C in 100°C intervals. The creep rupturetests were conducted over a wide range of stresses and with durations of up to 158kh (at600°C). The data from Bretherton [8] contained the results of creep deformation, creeprupture and constant strain rate tests at 570°C. The constant strain rate tests were conduced atlower strain raten than those normally used for tensile tests. The creep tests were conductedover a limited range of stresses and failed with durations of 200 to 2848 hours.
2.3.1 Rupture StrengthThe rupture data for cast BQ were analysed following the procedures of BS:PD6605 [11].The method enables a range of creep rupture models to be fitted and under the guidance ofPD6605 the best model is selected on the basis of its deviance and extrapolation behaviour.Twelve models were fitted to the data with a Weibull error distribution. The model whichoffered the best overall fit and which was amongst the most robust in extrapolation behaviourwas the Manson-Haferd 4th order with a temperature offset of zero, given by
-1.75478899 +3.49290562log(GR)-2.65893531(log(aR))2ln(t f ) =
T +57.0158348 (2)+0.8941810130og(%))3 -0.11251714fflog(GR))4
where tf is the failure time in hours, G R is the engineering stress in MPa and T is thetemperature in Kelvin.
The prediction of Eq. (2) is presented in Figure 2, from which it is clear that Eq. (2) fits thedata well for temperatures of 600 to 700°C. However three of the data at 570°C fail withshorter durations that the prediction.
400
350 —
300
• 570°C Data —570°C Eq. (2)171 800°C Data — —800°C Eq. (2)♦ 825°C Data —825°C Eq. (2)A 650°C Data — - 650°C Eq. (2)X 675°C Data — - 675°C Eq. (2)• 700°C Data - - - 700°C Eq. (2)O 700°C Unfailed
100
1000 10000 100000Time (hours)
1E-08 0.00001 0.0001 0.001 0.01 0.1Average Creep Strain Rate (1/h)
Figure 2 – Creep Rupture Strength of Type 316H Figure 3 – Creep Ductility of Type 316HCast BQ at 570 to 700°C. Cast BQ at 570 and 600°C.
2.3.2 Creep DuctilityThe current approach in R5 Volume 2/3 is to use the creep strain at failure at an appropriatetemperature in conjunction with the average creep strain rate to define the relationshipbetween ductility and strain rate. The creep strain at failure has been calculated from theelongation at failure minus the plastic loading strain. Loading strain data were available fortwo of the tests on cast BQ at 570°C and these have been used to estimated the plastic loadingstrain of the remaining tests at 570°C. In the absence of plastic loading strain data for thetests at 600 to 700°C [10] this has been estimated from the tensile data on cast BQ.
The relationship between creep strain at failure and average creep strain usually takes theform of a lower shelf at low strain rates and an upper shelf at high strain rates, which areconnected by a transition region. In this region the ductility, is a function of the average
creep strain rate, ca'' which is given by c f /t, . The ductility on the upper shelf and the
transition region has been defined by the elongation at failure measured from tensile tests at570 and 600°C. The tensile tests at 570°C were conducted at constant strain rate. The uppershelf was set to 0.5, which is the elongation of the highest strain rate tensile test, and thelower shelf was defined by the average of the logarithm of creep strains at failure from thecreep data at 570 and 600°C. Regression analysis was then used to define the transitionregion. The results of the fit to the creep strain at failure and tensile data is shown in Figure 3and the resulting relationship is given by
E f = MIN[0.5, MAX(0.0604, l.04960325)] s (3)
were E f is in absolute units and the strain rate is in units of h-1.
3. Calculation of Damage
The modeln to predict creep-fatigue failure that have been investigated in this report calculatethe total creep damage, De , and the total fatigue damage, D f, separately. Failure is concededwhen the sum of the fatigue and creep damages reaches some failure criterion; for example inR5 [3] a linear damage summation is used and failure is conceded when D e+Df �1 It is usualfor the failure criterion to vary depending on the method used to calculate the creep damageand in ASME III [1] and RCC-MR [2] the interaction diagram that best describes failure ofcreep-fatigue tests is selected empirically. This presupposes that the calculations of damagehave used the optimal method and that the choice of interaction diagram is the main factordetermining failure. The bilinear interaction diagram used in [1,2] for Type 316 steel, isshown in Figure 4. The approach adopted in this work was to critically examine thecalculation of damage as the main factor determining failure and then to test the hypothesisthat the linear interaction is the most appropriate. The methods for calculating fatigue andcreep damage are described in the following Sections.
3.1 Fatigue DamageThe approach for the calculation of fatigue damage per cycle, d f, in ASME III [1], RCC-MR[2] and R5 [3] is simply
df =1/N0 (4)
where N 0 is the continuous cycling fatigue endurance to create a crack of depth a 0 at the
appropriate total strain range. For the analysis of these tests N 0 is given by N25% and is
calculated from the R66 line (Fig. 1). Thus, for this analysis a 0 corresponds to the crack
length that reduces the area of the specimen by 25%, which corresponds to a crack of 2.6mmin a 7mm diameter specimen.
3.2 Time FractionThe time fraction rule for the estimation of creep damage is widely used in design codes suchas ASME III [1] and RCC-MR [2]. The time fraction rule for the creep damage per cycle is
= f t, dt (5)
t f (cs, t)
where tf is calculated as a function of the stress and temperature, which prevail for the increment
of time, dt, during stress relaxation and t h is the dwell time. The creep rupture strength for cast
BQ was given by Eq. (2). The stress history during relaxation was calculated from Eq. (1).
3.3 R5 Ductility Exhaustion
The ductility exhaustion approach of R5 for the creep damage per cycle, is given by
dis = dt (6)0 crK,T)
where is the instantaneous creep strain rate, c r k,T) is the corresponding uniaxial creep
ductility at the appropriate temperature as a function of the creep strain rate, which for castBQ is given by Eq. (3). The instantaneous creep strain rate was obtained by differentiatingEq. (1) and replacing d by – ERZ, where Eis Young' s Modulus, so that
= ZB"cs o b/[E(b.t + Z)] (7)
3.4 Stress Modified Ductility ExhaustionThe ductility exhaustion approach of R5 can be modified to include the effect of stress oncreep damage by treating the ductility as a function of both strain rate and stress [5,6,7]. Theresulting expression for the creep damage per cycle calculated from a ductility exhaustion
approach, which includes the effect of stress, d esm , is given by
d esm = dt (8)E t (E C5 T)
where g f (C C ,G,T) is the creep ductility at the appropriate temperature as a function of both
strain rate and stress. This approach has been called the 'stress modified' approach. In [5]and in [7] it was shown that the creep ductility of Type 347 weld and the creep ductility ofcast Type 304L respectively can be described by
Ef = A i exp(Q/T) (9)where A 1 , n 1 , m1 and Q are material constants. In this paper the same approach will beapplied to Type 316H cast BQ. Furthermore, in [5,6,7] it was shown that the use of `reverseddamage modelling' to determine the relationship between ductility, stress and strain rate gaveimprovement in the prediction of creep-fatigue failure when compared to the time fraction andthe current R5 ductility exhaustion approach. In 'reverse damage modelling' theinstantaneous true inelastic strain rate and the true stress as calculated from the availablecreep curves in conjunction with an appropriate creep ductility model (i.e. the logarithmicform of Eq. (9)) to calculate creep damage using Eq. (8). Thus, the creep damage in eachcreep test is calculated from
d e' = töze /exp [1n(A,)+ Q/T + n i lnK )+ (– mi )1n(o)] } (10)
where ÖE, is the inelastic strain increment between test measurements, and includes plasticloading strains. The use of the instantaneous inelastic strain rate and the true stress enablesthe large differences between the strain rates during loading and creep and the increasing truestress during the tests, to be taken into account. This also enables the constant strain rate teststo be used as well as the constant load tests. The creep damage model, Eq. (10), is then
solved by iterating on the constants, to give des to dose to one for all of the available tests.
This has been achieved using non-linear regression to minimise the sum of (logden". The
use of log d esm assumes that like the ductility the creep damage is log normally distributed.
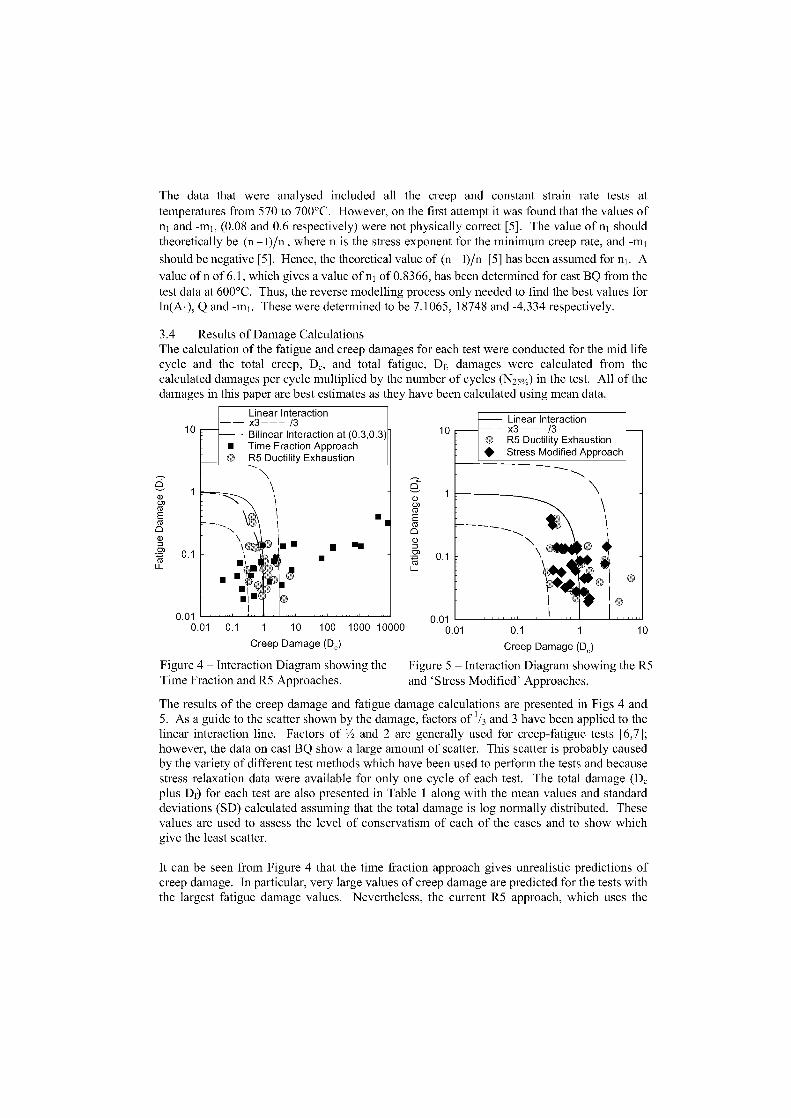
• •■
■ I■ I■
■•
The data that were analysed included all the creep and constant strain rate tests attemperatures from 570 to 700°C. However, on the first attempt it was found that the values ofn1 and -mi , (0.08 and 0.6 respectively) were not physically correct [5]. The value of n i shouldtheoretically be (n —1)/n , where n is the stress exponent for the minimum creep rate, and -m1
should be negative [5]. Hence, the theoretical value of (n —1)/n [5] has been assumed for n 1 . A
value of n of 6.1, which gives a value of n i of 0.8366, has been determined for cast BQ from thetest data at 600°C. Thus, the reverse modelling process only needed to find the best values forln(A 1 ), Q and -m 1 . These were determined to be 7.1065, 18748 and -4.334 respectively.
3.4 Results of Damage CalculationsThe calculation of the fatigue and creep damages for each test were conducted for the mid lifecycle and the total creep, IX and total fatigue, Df, damages were calculated from thecalculated damages per cycle multiplied by the number of cycles (N 25%) in the test. All of thedamages in this paper are best estimates as they have been calculated using mean data.
0.010.01 0.1 10 100 1000 10000
Linear Interactionx3 /3
- Bilinear Interaction at (0.3,0.3)■ Time Fraction Approach0 R5 Ductility Exhaustion
Creep Damage (Dc)
Linear Interaction— – x3-- /3
0 R5 Ductility Exhaustion• Stress Modified Approach
0.01
0.1 1
Creep Damage (Dc)
10
10
■■
Figure 4 – Interaction Diagram showing the Figure 5 – Interaction Diagram showing the R5Time Fraction and R5 Approaches. and 'Stress Modified' Approaches.
The results of the creep damage and fatigue damage calculations are presented in Figs 4 and5. As a guide to the scatter shown by the damage, factors of 1 /3 and 3 have been applied to thelinear interaction line. Factors of 1/2 and 2 are generally used for creep-fatigue tests [6,7];however, the data on cast BQ show a large amount of scatter. This scatter is probably causedby the variety of different test methods which have been used to perform the tests and becausestress relaxation data were available for only one cycle of each test. The total damage (D,plus Df) for each test are also presented in Table 1 along with the mean values and standarddeviations (SD) calculated assuming that the total damage is log normally distributed. Thesevalues are used to assess the level of conservatism of each of the cases and to show whichgive the least scatter.
It can be seen from Figure 4 that the time fraction approach gives unrealistic predictions ofcreep damage. In particular, very large values of creep damage are predicted for the tests withthe largest fatigue damage values. Nevertheless, the current R5 approach, which uses the
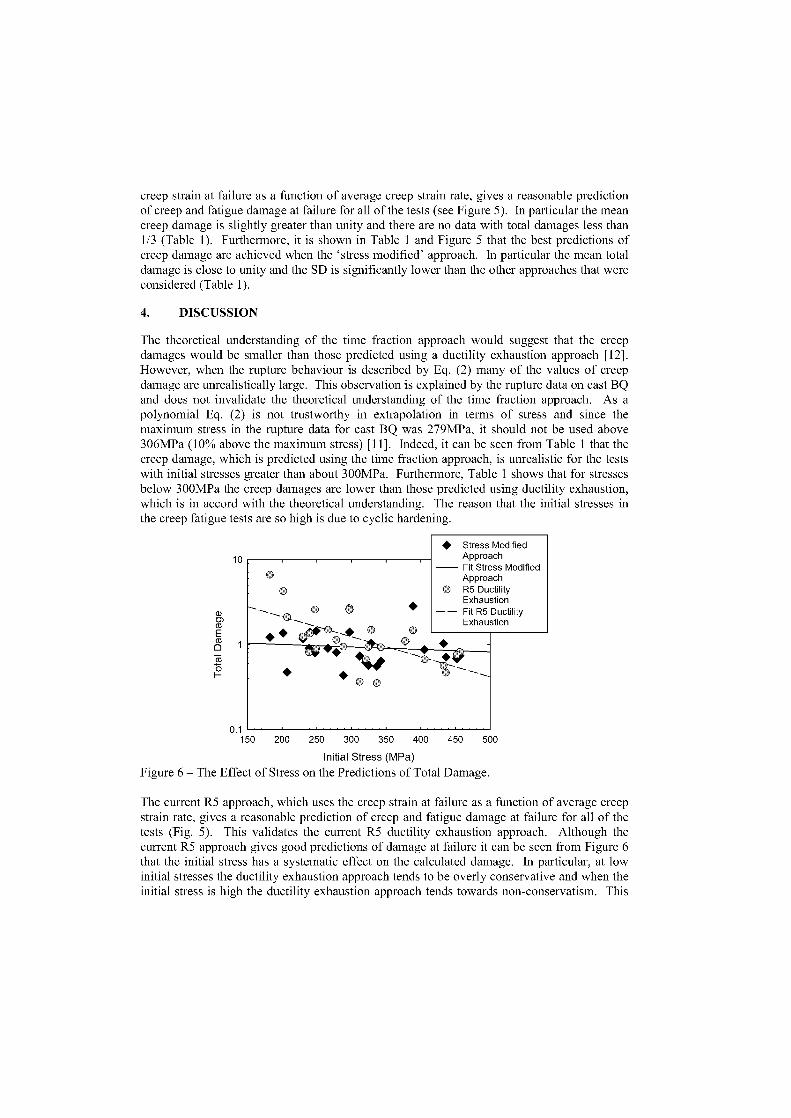
creep strain at failure as a function of average creep strain rate, gives a reasonable predictionof creep and fatigue damage at failure for all of the tests (see Figure 5). In particular the meancreep damage is slightly greater than unity and there are no data with total damages less than1/3 (Table 1). Furthermore, it is shown in Table 1 and Figure 5 that the best predictions ofcreep damage are achieved when the 'stress modified' approach. In particular the mean totaldamage is dose to unity and the SD is significantly lower than the other approaches that wereconsidered (Table 1).
4. DISCUSSION
The theoretical understanding of the time fraction approach would suggest that the creepdamages would be smaller than those predicted using a ductility exhaustion approach [12].However, when the rupture behaviour is described by Eq. (2) many of the values of creepdamage are unrealistically large. This observation is explained by the rupture data on cast BQand does not invalidate the theoretical understanding of the time fraction approach. As apolynomial Eq. (2) is not trustworthy in extrapolation in terms of stress and since themaximum stress in the rupture data for cast BQ was 279MPa, it should not be used above306MPa (10% above the maximum stress) [11]. Indeed, it can be seen from Table 1 that thecreep damage, which is predicted using the time fraction approach, is unrealistic for the testswith initial stresses greater than about 300MPa. Furthermore, Table 1 Shows that for stressesbelow 300MPa the creep damages are lower than those predicted using ductility exhaustion,which is in accord with the theoretical understanding. The reason that the initial stresses inthe creep fatigue tests are so high is due to cyclic hardening.
10StressApproachFit Stress
Modified
ModifiedApproach0
0 0 R5 DuctilityExhaustion
0 0 -- Fit R5 Ductility
• ,---4- ----• 0 0_-e,:>..._.___.___4;;____o.44e -----0._•♦ -0 0
Exhaustion
•
- -•,
0.1 150 200 250 300 350 400 450 500
Initial Stress (MPa)Figure 6 – The Effect of Stress on the Predictions of Total Damage.
The current R5 approach, which uses the creep strain at failure as a function of average creepstrain rate, gives a reasonable prediction of creep and fatigue damage at failure for all of thetests (Fig. 5). This validates the current R5 ductility exhaustion approach. Although thecurrent R5 approach gives good predictions of damage at failure it can be seen from Figure 6that the initial stress has a systematic effect on the calculated damage. In particular, at lowinitial stresses the ductility exhaustion approach tends to be overly conservative and when theinitial stress is high the ductility exhaustion approach tends towards non-conservatism. This
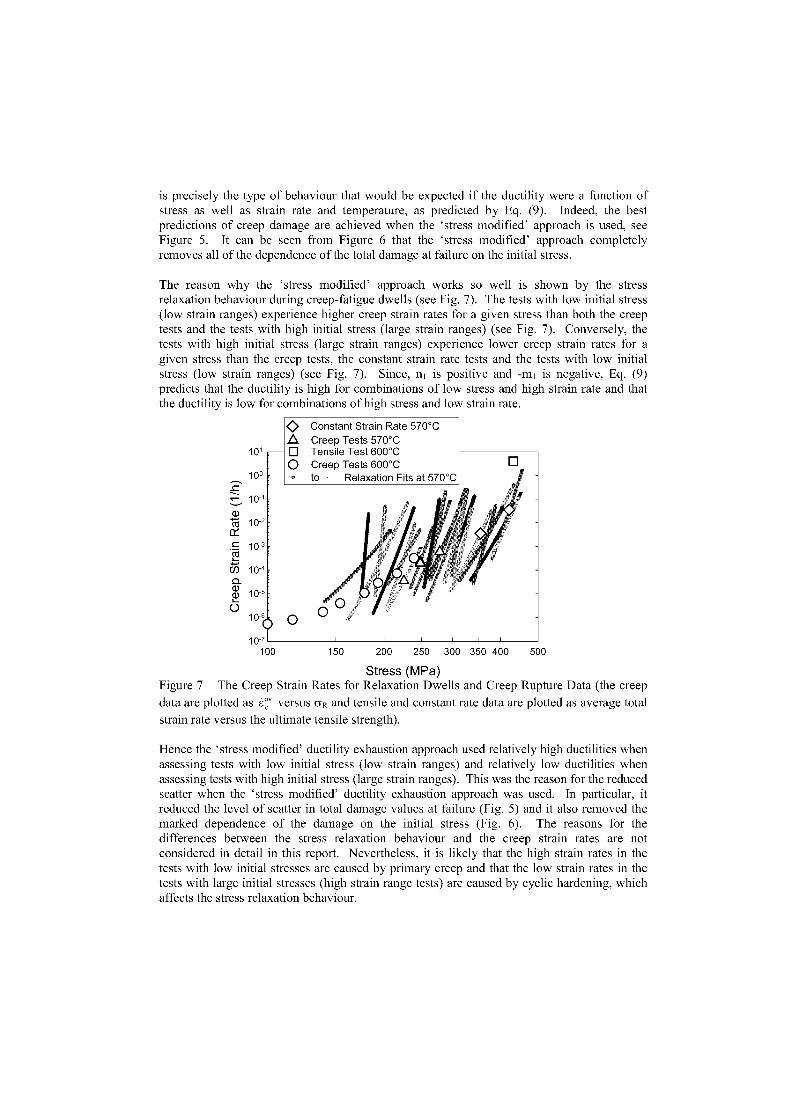
is precisely the type of behaviour that would be expected if the ductility were a function ofstress as well as strain rate and temperature, as predicted by Eq. (9). Indeed, the bestpredictions of creep damage are achieved when the 'stress modified' approach is used, seeFigure 5. It can be seen from Figure 6 that the 'stress modified' approach completelyremoves all of the dependence of the total damage at failure on the initial stress.
The reason why the 'stress modified' approach works so well is shown by the stressrelaxation behaviour during creep-fatigue dwells (see Fig. 7). The tests with low initial stress(low strain ranges) experience higher creep strain rates for a given stress than both the creeptests and the tests with high initial stress (large strain ranges) (see Fig. 7). Conversely, thetests with high initial stress (large strain ranges) experience lower creep strain rates for agiven stress than the creep tests, the constant strain rate tests and the tests with low initialstress (low strain ranges) (see Fig. 7). Since, n 1 is positive and -m 1 is negative, Eq. (9)predicts that the ductility is high for combinations of low stress and high strain rate and thatthe ductility is low for combinations of high stress and low strain rate.
A1 01 q
010°
210-1
CD"Eict
10-2
10-3
CD
ci)
10-4
10-5
10-6 010-7
Constant Strain Rate 570°CCreep Tests 570°CTensile Test 600°CCreep Tests 600°Cto Relaxation Fits at 570°C
100 150 200 250 300 350 400 500
Stress (MPa)Figure 7 — The Creep Strain Rates for Relaxation Dwells and Creep Rupture Data (the creep
data are plotted as e: versus GR and tensile and constant rate data are plotted as average total
strain rate versus the ultimate tensile strength).
Hence the 'stress modified' ductility exhaustion approach used relatively high ductilities whenassessing tests with low initial stress (low strain ranges) and relatively low ductilities whenassessing tests with high initial stress (large strain ranges). This was the reason for the reducedscatter when the 'stress modified' ductility exhaustion approach was used. In particular, itreduced the level of scatter in total damage values at failure (Fig. 5) and it also removed themarked dependence of the damage on the initial stress (Fig. 6). The reasons for thedifferences between the stress relaxation behaviour and the creep strain rates are notconsidered in detail in this report. Nevertheless, it is likely that the high strain rates in thetests with low initial stresses are caused by primary creep and that the low strain rates in thetests with large initial stresses (high strain range tests) are caused by cyclic hardening, whichaffects the stress relaxation behaviour.
5. Conclusions
Creep-fatigue data for Type 316H cast BQ at 570°C have been used to investigate differentapproaches for calculating creep damage. It has been found that:1. The time fraction approach is inferior to the R5 ductility exhaustion approach for
predicting creep damage at failure in Type 316H steel. Indeed the time fraction giveswholly unrealistic and overly conservative predictions of creep damage for creep-fatigue cycles with large strain ranges.
2. The R5 ductility exhaustion approach gives a reasonable prediction of creep damage atfailure for all of the tests.
3. The most accurate predictions of creep damage and thus the best approach to be usedfor life extension studies was the 'stress modified' ductility exhaustion approach.
6. Acknowledgements
This paper is published by permission of British Energy Generation Ltd. The authoracknowledges UKAEA and latterly AEA Technology and Serco Assurance for providing thetest data. Acknowledgement for permission to publish the creep test results is given to thesponsors of the ERA Technology Project-4080 from which the long term data originate, inparticular ALSTOM Power (UK) Ltd, British Energy and E.On UK plc.
7. References
[1] ASME, Section III Div. 1 Sub-Section NH, ASME New York USA, 2001.[2] RCC-MR, Design and Construction Rules for Mechanical Components of FBR Nuclear
Islands, AFCEN, Paris, France, 2002.[3] R5, Assessment Procedure for the High Temperature Response of Structures Issue 3,
British Energy, Gloucester, UK, 2003.[4] Wareing J, Bretherton I and Livesey V B, Life Prediction for Elevated Temperature
Components Subjected to Cyclic Deformation, Proc. IMechE Conf. EngineeringMaterials and Structures, Sheffield UK, IMechE Paper C269/86, Sept. 1986.
[5] Spindler M W. The prediction of creep damage in Type 347 weld metal: part 1. Thedetermination of material properties from creep and tensile tests. Int. J. of Press. Vess.and Piping, Vol. 82, 2005, pp. 175-184.
[6] Spindler M W. The prediction of creep damage in Type 347 weld metal: part II creepfatigue tests, Int. J. of Press. Vess. and Piping, Vol. 82, 2005, pp. 185-194
[7] Spindler M W, Effects of Dwell Location on The Creep-Fatigue Endurance of CastType 304L, in Creep & Fracture in High Temperature Components ConferenceProceedings, DEStech, Lancaster, USA, 2005, pp. 615-627.
[8] Bretherton I, Serco Assurance, Private Communication, 2002.[9] R66, AGR Materials Data Handbook, Issue 6, British Energy, Gloucester, UK, 2004.[10] Grover H K & Higginbottom A, Final Report on the Elevated Temperature Tensile and
Creep Rupture Properties of Type 316 Steel, ERA Technology Report 2A/858, 1983.[11] PD6605-1998, Guidelines on Methodology for Assessment of Stress Rupture Data,
British Standards Institute, 1998.[12] Takahashi Y, Further Evaluation of Creep-Fatigue Life Prediction Methods for Low-
Carbon Nitrogen–Added 316 Stainless Steel, J. of Press. Vess. Techn., Vol. 121, 1999,pp. 142-148.
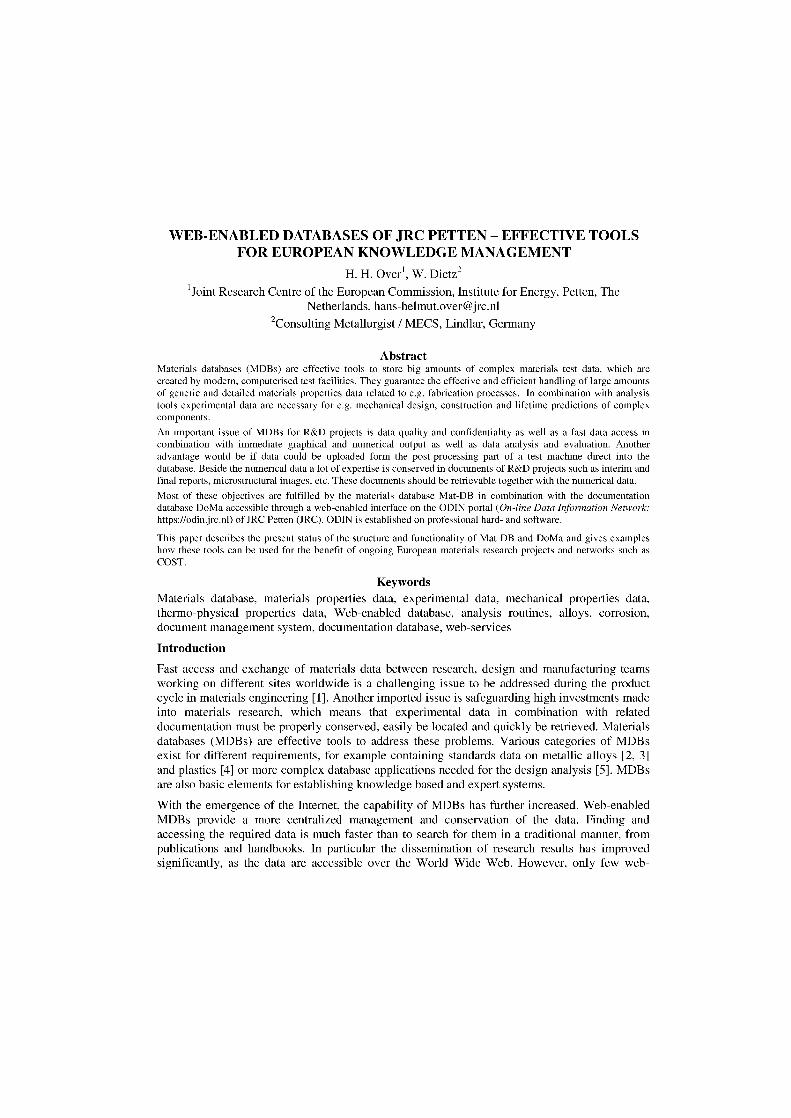
WEB-ENABLED DATABASES OF JRC PETTEN - EFFECTIVE TOOLSFOR EUROPEAN KNOWLEDGE MANAGEMENT
H. H. Over', W. Dietz2
'Joint Research Centre of the European Commission, Institute for Energy, Petten, TheNetherlands, [email protected]
2Consulting Metallurgist / MECS, Lindlar, Germany
AbstractMaterials databases (MDBs) are effective tools to store big amounts of complex materials test data, which arecreated by modern, computerised test facilities. They guarantee the effective and efficient handling of large amountsof generic and detailed materials properties data related to e.g. fabrication processes. In combination with analysistools experimental data are necessary for e.g. mechanical design, construction and lifetime predictions of complexcomponents.
An important issue of MDBs for R&D projects is data quality and confidentiality as well as a fast data access incombination with immediate graphical and numerical output as well as data analysis and evaluation. Anotheradvantage would be if data could be uploaded form the post-processing part of a test machine direct into thedatabase. Beside the numerical data a lot of expertise is conserved in documents of R&D projects such as interim andfinal reports, microstructural images, etc. These documents should be retrievable together with the numerical data.
Most of these objectives are fulfilled by the materials database Mat-DB in combination with the documentationdatabase DoMa accessible through a web-enabled interface on the ODIN portal (On-line Data Information Network:https://odin.jrc.n1) of JRC Petten (JRC). ODIN is established on professional hard- and software.
This paper describes the present status of the structure and functionality of Mat-DB and DoMa and gives exampleshow these tools can be used for the benefit of ongoing European materials research projects and networks such asCOST.
KeywordsMaterials database, materials properties data, experimental data, mechanical properties data,thermo-physical properties data, Web-enabled database, analysis routines, alloys, corrosion,document management system, documentation database, web-services
Introduction
Fast access and exchange of materials data between research, design and manufacturing teamsworking on different sites worldwide is a challenging issue to be addressed during the productcycle in materials engineering [1]. Another imported issue is safeguarding high investments madeinto materials research, which means that experimental data in combination with relateddocumentation must be properly conserved, easily be located and quickly be retrieved. Materialsdatabases (MDBs) are effective tools to address these problems. Various categories of MDBsexist for different requirements, for example containing standards data on metallic alloys [2, 3]and plastics [4] or more complex database applications needed for the design analysis [5]. MDBsare also basic elements for establishing knowledge based and expert systems.
With the emergence of the Internet, the capability of MDBs has further increased. Web-enabledMDBs provide a more centralized management and conservation of the data. Finding andaccessing the required data is much faster than to search for them in a traditional manner, frompublications and handbooks. In particular the dissemination of research results has improvedsignificantly, as the data are accessible over the World Wide Web. However, only few web-
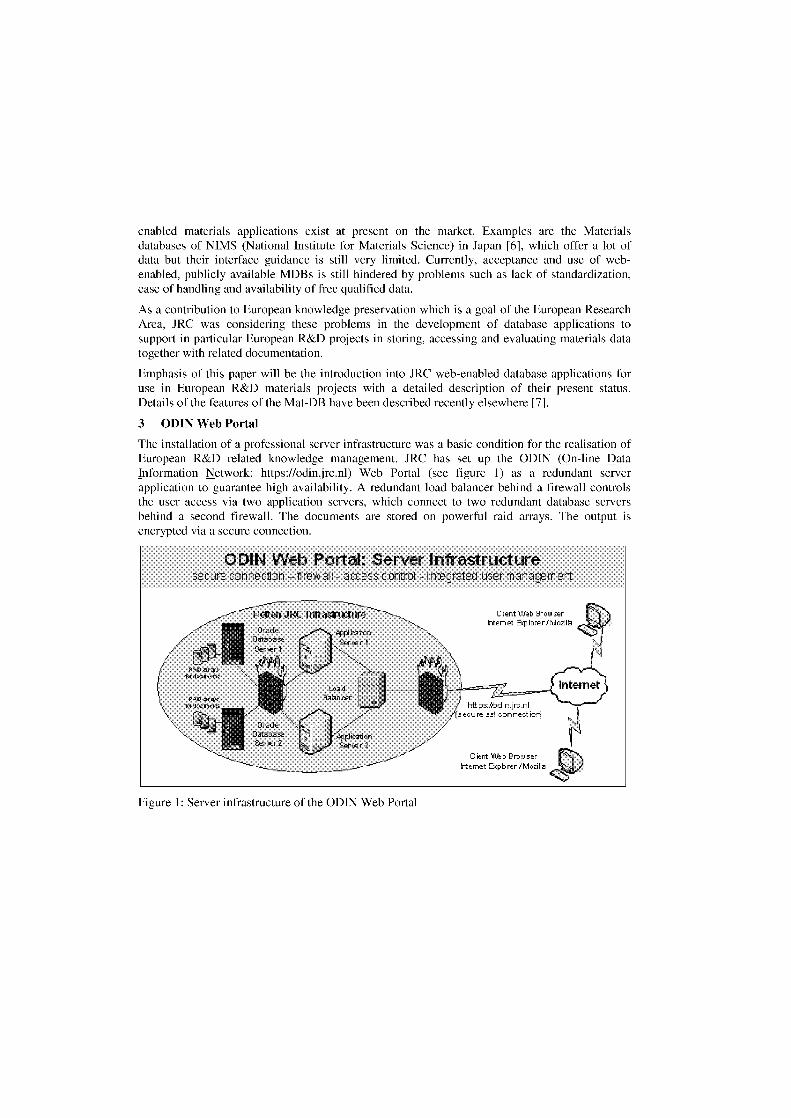
Oracle ApplintionDatabase Se 1Sener 1
Retten JRC Inh itemetute Cient BrowserInternet 5plorerikdozilb
PADRa denn eilt
Los dBalancer
httpsAbdin.jrc.n1ecu re ssl connect 1°1
t4
OracleDatabaseSerer 2
ApplicationSerte r 2
Client 'Mb Browserhtemet apbrer
enabled materials applications exist at present on the market. Examples are the Materialsdatabases of NIMS (National Institute for Materials Science) in Japan [6], which offer a lot ofdata but their interface guidance is still very limited. Currently, acceptance and use of web-enabled, publicly available MDBs is still hindered by problems such as lack of standardization,ease of handling and availability of free qualified data.
As a contribution to European knowledge preservation which is a goal of the European ResearchArea, JRC was considering these problems in the development of database applications tosupport in particular European R&D projects in storing, accessing and evaluating materials datatogether with related documentation.
Emphasis of this paper will be the introduction into JRC web-enabled database applications foruse in European R&D materials projects with a detailed description of their present status.Details of the features of the Mat-DB have been described recently elsewhere [7].
3 ODIN Web Portal
The Installation of a professional server infrastructure was a basic condition for the realisation ofEuropean R&D related knowledge management. JRC has set up the ODIN (On-line DataInformation Network: https://odin.jrc.nl) Web Portal (see figure 1) as a redundant serverapplication to guarantee high availability. A redundant load balancer behind a firewall controlsthe user access via two application servers, which connect to two redundant database serversbehind a second firewall. The documents are stored on powerful raid arrays. The output isencrypted via a secure connection.
°DIN Web Portal: Server Infrastructuresecure connection –Irewall - access control - Integrated user management
Figure 1: Server infrastructure of the ODIN Web Portal

ODIN Web Portal on Petten Server
secure connection - fire-wall - access control - integrated user management
Engineering DBs
Mat-DB, Gasket-DB,HTR-Fuel-DB,
Hiad-DB, Nesshy-DB
Nuclear DBs
Senuf-DB, NuC oC-DB,Dares-DB, Catt-DB
DocumentManagement DB
DoMa
Open Interfaces toEuropean competencesites:Webservice between Mat-DEand FIT-IT for life-timeprediction at Fraunhofer FIZPI,Freiburg
Relational Database Management System (ORACLE)
Figure 2: Databases and interfaces within the ODIN Web portal
The various databases within the ODIN Web Portal are shown in figure 2. The applicationservers control the access rights to public and confidential domains of these databases and also tothe linked Fitit web interface. Since Mat-DB and DoMa share this common user management, itis possible to synchronise access to protected areas in both databases, i.e. a user who has accessto protected numerical data in Mat-DB can transparently access the corresponding documentationin DoMa and vice-versa.
The databases within ODIN are euer growing. New energy related applications are alreadyrequested. The soft- and hardware of server infrastructure is maintained, continuously updatedand upgraded. It is the aim of JRC to link together European web competences for the time beingwithin the area of materials properties data such as Fitit complex materials modeling (describedin the data retrieval part) and a network of web-enabled Mat-DBs on different customer sites.
4 Mat-DB features
The JRC has been developing a materials database for safeguarding and managing itsexperimental materials data resulting from in-house research some 20 years ago [8,9]: Mat-DBcovers mechanical and thermo-physical properties data of engineering alloys at low, elevated andhigh temperatures for Base materials and joints [10] as well as high temperature corrosion. ltincludes e.g. irradiation materials testing in the field of fusion and fission, tests on single crystalswith thermal barrier coating for gas turbines and mechanical properties testing on a corrodedspecimen, which refers to weight gain/loss data of high temperature exposed engineering alloys,ceramics and hot isostatic pressed powder materials and covers corrosion tests such as oxidation,sulfidation and nitridation. The Mat-DB database structure has continuously grown and theapplication developed from the initial mainframe database without graphical user guidance, overstand-alone PC and client/server applications to the new web-enabled application (see section 3).All current applications use an identical database structure simplifying data exchange betweenthe JRC and its external MDB partners. The commercially available Mat-DB is being used asstand-alone PC or client/server applications by a number of European industry and research
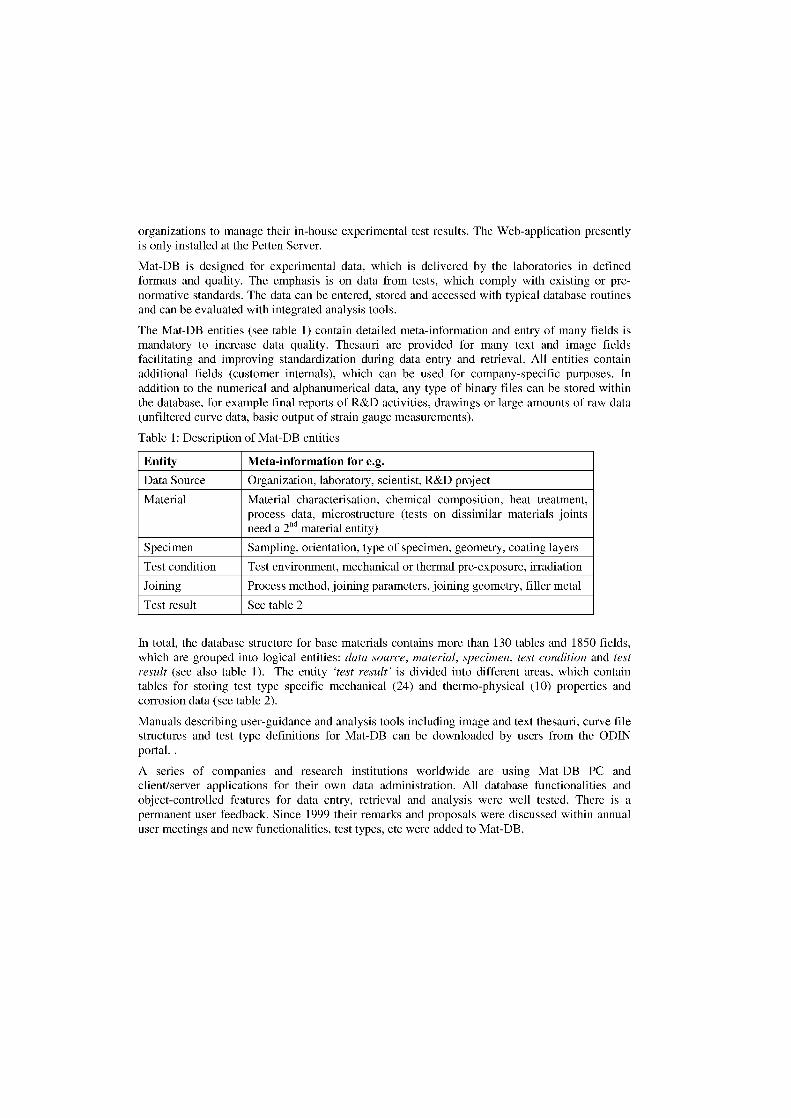
organizations to manage their in-house experimental test results. The Web-application presentlyis only installed at the Petten Server.
Mat-DB is designed for experimental data, which is delivered by the laboratories in definedformats and quality. The emphasis is on data from tests, which comply with existing or pre-normative standards. The data can be entered, stored and accessed with typical database routinesand can be evaluated with integrated analysis tools.
The Mat-DB entities (see table 1) contain detailed meta-information and entry of many fields ismandatory to increase data quality. Thesauri are provided for many text and image fieldsfacilitating and improving standardization during data entry and retrieval. All entities containadditional fields (customer internals), which can be used for company-specific purposes. Inaddition to the numerical and alphanumerical data, any type of binary files can be stored withinthe database, for example final reports of R&D activities, drawings or large amounts of raw data(unfiltered curve data, basic output of strain gauge measurements).
Table 1: Description of Mat-DB entities
Entity Meta-information for e.g.
Data Source Organization, laboratory, scientist, R&D project
Material Material characterisation, chemical composition, heat treatment,process data, microstructure (tests on dissimilar materials jointsneed a 2nd material entity)
Specimen Sampling, orientation, type of specimen, geometry, coating layers
Test condition Test environment, mechanical or thermal pre-exposure, irradiation
Joining Process method, joining parameters, joining geometry, filier metal
Test result See table 2
In total, the database structure for Base materials contains more than 130 tables and 1850 fields,which are grouped into logical entities: data source, material, specimen, test condition and testresult (see also table 1). The entity 'test result' is divided into different areas, which containtables for storing test type specific mechanical (24) and thermo-physical (10) properties andcorrosion data (see table 2).
Manuals describing user-guidance and analysis tools including image and text thesauri, curve filestructures and test type definitions for Mat-DB can be downloaded by users from the ODINportal. .
A series of companies and research institutions worldwide are using Mat-DB PC andclient/server applications for their own data administration. All database functionalities andobject-controlled features for data entry, retrieval and analysis were well tested. There is apermanent user feedback. Since 1999 their remarks and proposals were discussed within annualuser meetings and new functionalities, test types, etc were added to Mat-DB.

Table 2: Mat-DB test result entity
MECHANICAL PROPERTIES IRRADIATIONCRACK GROWTH & FRACTURE Irradiation creep
Creep crack growth Swelling
Cyclic creep crack growth TENSILEFatigue crack growth Compression
Fracture toughness Multiaxial tensile
Impact Uniaxial tensile
CREEP Small punch tensile
Cyclic creep Complex testMultiaxial creep THERMO-PHYSICAL PROPERTIESTorsional creep Density
Uniaxial creep Electrical resistivity
Small punch creep Emissivity
RELAXATION Linear thermal expansion
Multiaxial relaxation Poisson' s ratio
Uniaxial relaxation Specific heat
FATIGUE Shear modulus
High cycle fatigue Thermal conductivity
Low cycle fatigue (load control) Thermal diffusivity
Low cycle fatigue (strain control) Young's modulus
Thermal fatigue CORROSIONThermo-mechanical fatigue High temperature corrosion
5 Web-enabled Mat-DB
The emergence of the Internet created new opportunities for materials databases. Therefore theJRC has ported Mat-DB to the Internet. Objectives of the web-enabled application are:
• Facilitating data management, exchange and dissemination within European R&Dprojects free of charge
• Providing data pools which contain public and restricted data for use in industry,research and education
• Providing the web-enabled Mat-DB to interested multi-national organizations andcustomers, with which they can make confidential data accessible to authorisedemployees at different sites via their Intranet.
Any public user can check the presently available materials data content sorted by materials, testtypes and depending an the test types by temperatures.
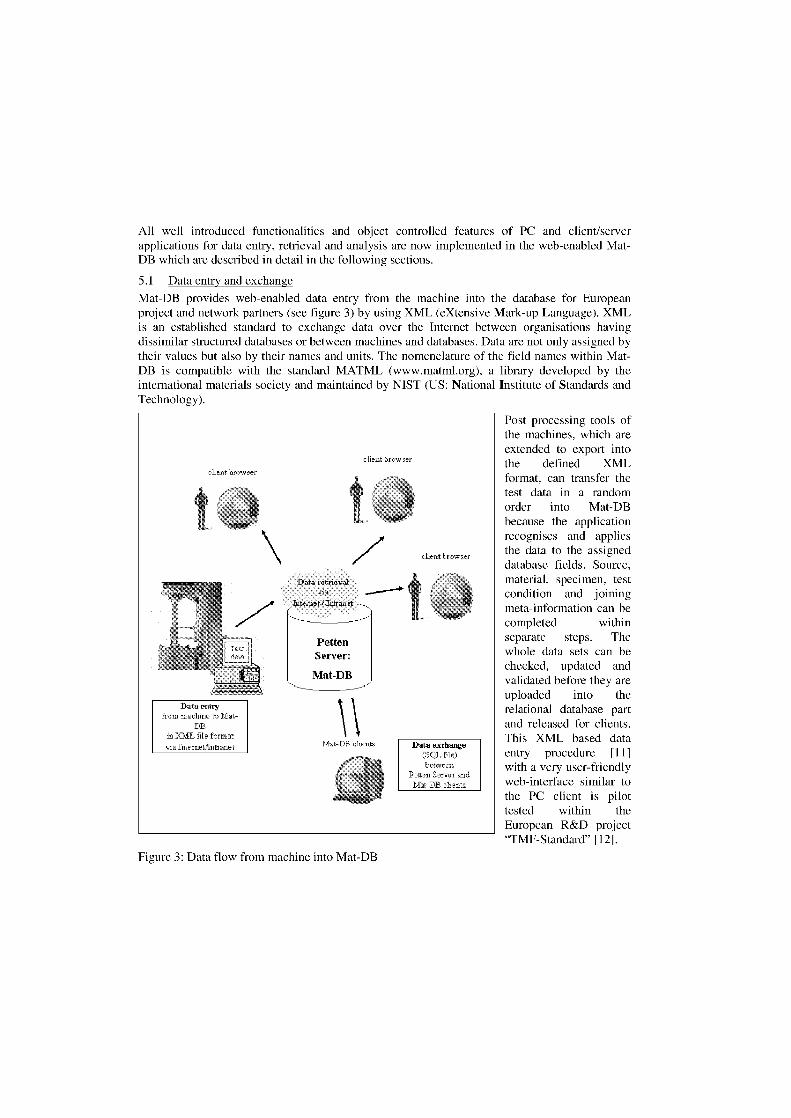
eben
client browser
Dang ‚en,from maehirxI Met-
DBniT- fit e törme
via Lit rnetIntranet Maz-DE Data exchange(S,:.;• I ..he")butwe
Peter, Se_srerMit JE c1:2:ro
7-1
All well introduced functionalities and object controlled features of PC and client/serverapplications for data entry, retrieval and analysis are now implemented in the web-enabled Mat-DB which are described in detail in the following sections.
5.1 Data entry and exchange
Mat-DB provides web-enabled data entry from the machine into the database for Europeanproject and network partners (see figure 3) by using XML (eXtensive Mark-up Language). XMLis an established standard to exchange data over the Internet between organisations havingdissimilar structured databases or between machines and databases. Data are not only assigned bytheir values but also by their names and units. The nomenclature of the field names within Mat-DB is compatible with the standard MATML (www.matml.org), a library developed by theinternational materials society and maintained by NIST (US: National Institute of Standards andTechnology).
Figure 3: Data flow from machine into Mat-DB
Post processing tools ofthe machines, which areextended to export intothe defined XMLformat, can transfer thetest data in a randomorder into Mat-DBbecause the applicationrecognises and appliesthe data to the assigneddatabase fields. Source,material, specimen, testcondition and joiningmeta-information can becompleted withinseparate steps. Thewhole data sets can bechecked, updated andvalidated before they areuploaded into therelational database partand released for clients.This XML based dataentry procedure [1 1]
with a very user-friendlyweb-interface similar tothe PC client is pilottested within theEuropean R&D project"TMF-Standard" [12].
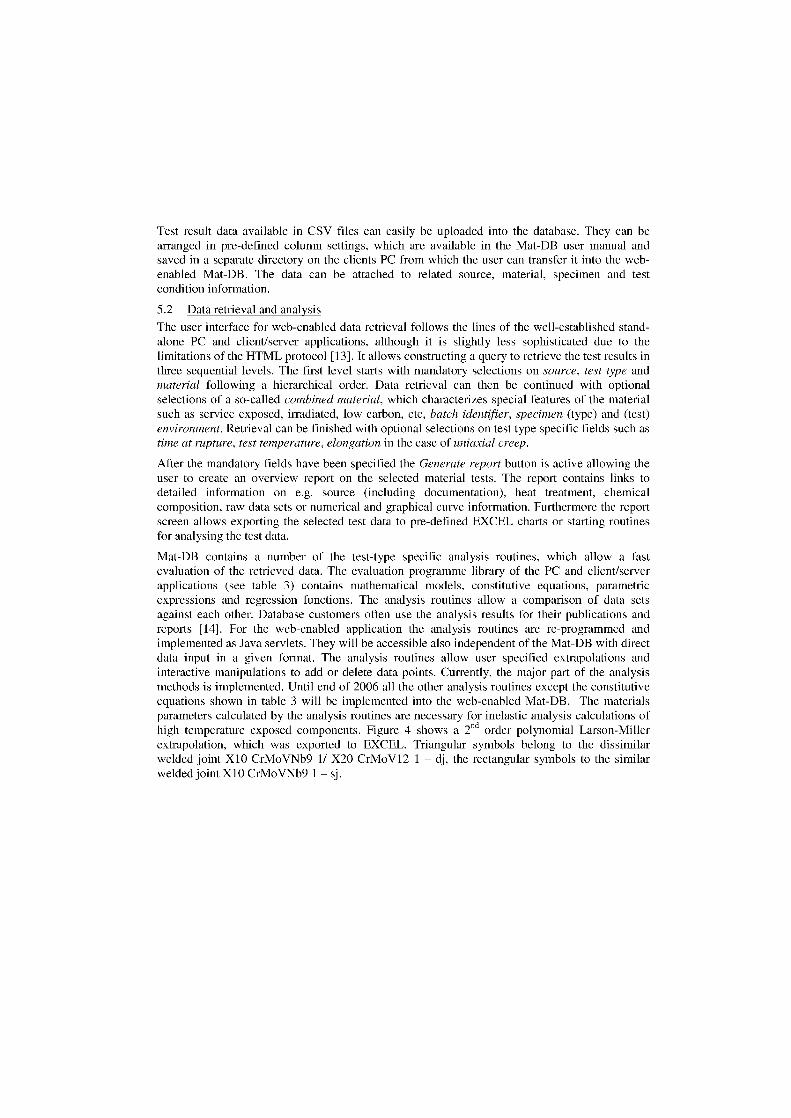
Test result data available in CSV files can easily be uploaded into the database. They can bearranged in pre-defined column settings, which are available in the Mat-DB user manual andsaved in a separate directory on the clients PC from which the user can transfer it into the web-enabled Mat-DB. The data can be attached to related source, material, specimen and testcondition information.
5.2 Data retrieval and analysis
The user interface for web-enabled data retrieval follows the lines of the well-established stand-alone PC and client/server applications, although it is slightly less sophisticated due to thelimitations of the HTML protocol [13]. It allows constructing a query to retrieve the test results inthree sequential levels. The first level starts with mandatory selections on source, test type andmaterial following a hierarchical order. Data retrieval can then be continued with optionalselections of a so-called combined material, which characterizes special features of the materialsuch as service exposed, irradiated, low carbon, etc, batch identifier, specimen (type) and (test)environment. Retrieval can be finished with optional selections on test type specific fields such astime at rupture, test temperature, elongation in the Gase of uniaxial creep.
After the mandatory fields have been specified the Genrate report button is active allowing theuser to create an overview report on the selected material tests. The report contains links todetailed information on e.g. source (including documentation), heat treatment, chemicalcomposition, raw data sets or numerical and graphical curve information. Furthermore the reportscreen allows exporting the selected test data to pre-defined EXCEL charts or starting routinesfor analysing the test data.
Mat-DB contains a number of the test-type specific analysis routines, which allow a fastevaluation of the retrieved data. The evaluation programme library of the PC and client/serverapplications (see table 3) contains mathematical models, constitutive equations, parametricexpressions and regression functions. The analysis routines allow a comparison of data setsagainst each other. Database customers often use the analysis results for their publications andreports [14]. For the web-enabled application the analysis routines are re-programmed andimplemented as Java servlets. They will be accessible also independent of the Mat-DB with directdata input in a given format. The analysis routines allow user specified extrapolations andinteractive manipulations to add or delete data points. Currently, the major part of the analysismethods is implemented. Until end of 2006 all the other analysis routines except the constitutiveequations shown in table 3 will be implemented into the web-enabled Mat-DB. The materialsparameters calculated by the analysis routines are necessary for inelastic analysis calculations ofhigh temperature exposed components. Figure 4 shows a 2nd order polynomial Larson-Millerextrapolation, which was exported to EXCEL. Triangular symbols belong to the dissimilarwelded joint X10 CrMoVNb9 1/ X20 CrMoV12 1 – dj, the rectangular symbols to the similarwelded joint X10 CrMoVNb9 1 – sj.
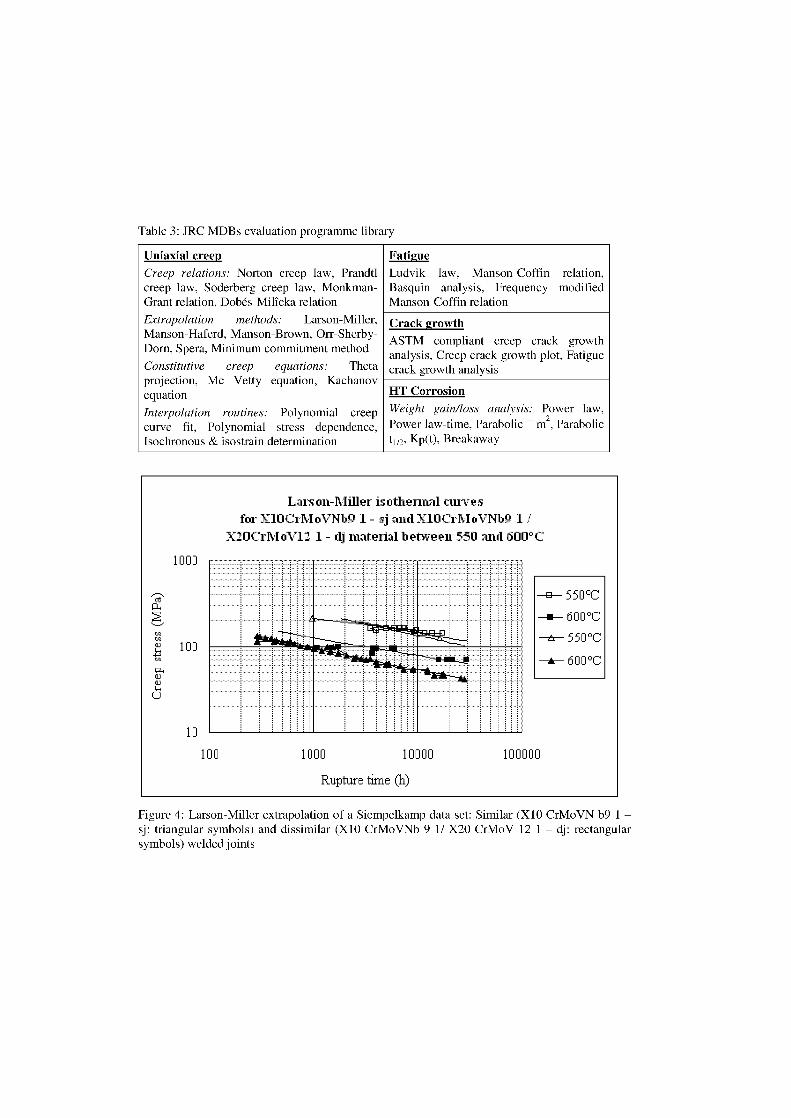
Uniaxial creep Creep relations: Norton creep law, Prandtlcreep law, Soderberg creep law, Monkman-Grant relation, Dob6s-Milicka relation
Extrapolation methods: Larson-Miller,Manson-Haferd, Manson-Brown, Orr-Sherby-Dorn, Spera, Minimum commitment method
Constitutive creep equations: Thetaprojection, Mc Vetty equation, Kachanovequation
Interpolation routines: Polynomial creepcurve fit, Polynomial stress dependence,Isochronous & isostrain determination
FatigueLudvik law, Manson-Coffin relation,Basquin analysis, Frequency modifiedManson-Coffin relation
Crack growthASTM compliant creep crack growthanalysis, Creep crack growth plot, Fatiguecrack growth analysis
HT CorrosionWeight gain/loss analysis: Power law,Power law-time, Parabolic -m2 , Parabolict 112 , Kp(t), Breakaway
Lars on-Miller isothennal cm-yes
for X10CrMoVNb9 1 - sj and Xl0erMoVNb9 1
X20Cr11.1oV12 1 - dj matelial berween 550 and 600°C
1000
100
550°C
600°C
—AL— 550°C
-4L- 600°C
10
100 1000 10000
100000
Rupture time (1-i)
Table 3: JRC MDBs evaluation programme library
Figure 4: Larson-Miller extrapolation of a Siempelkamp data set: Similar (X10 CrMoVN b9 1 –sj: triangular symbols) and dissimilar (X10 CrMoVNb 9 1/ X20 CrMoV 12 1 – dj: rectangularsymbols) welded joints
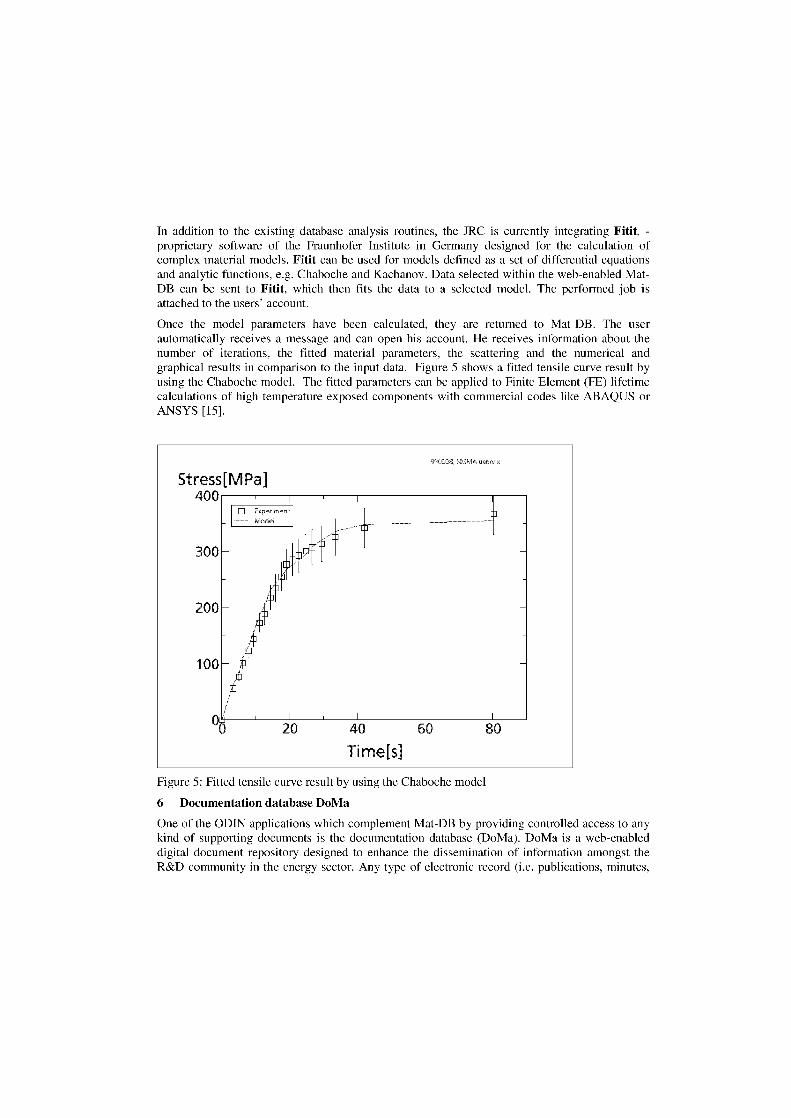
In addition to the existing database analysis routines, the JRC is currently integrating Fitit, -proprietary software of the Fraunhofer Institute in Germany designed for the calculation ofcomplex material models. Fitit can be used for models defined as a set of differential equationsand analytic functions, e.g. Chaboche and Kachanov. Data selected within the web-enabled Mat-DB can be sent to Fitit, which then fits the data to a selected model. The performed job isattached to the users' account.
Once the model parameters have been calculated, they are returned to Mat-DB. The userautomatically receives a message and can open his account. He receives information about thenumber of iterations, the fitted material parameters, the scattering and the numerical andgraphical results in comparison to the input data. Figure 5 shows a fitted tensile curve result byusing the Chaboche model. The fitted parameters can be applied to Finite Element (FE) lifetimecalculations of high temperature exposed components with commercial codes like ABAQUS orANSYS [15].
Figure 5: Fitted tensile curve result by using the Chaboche model
6 Documentation database DoMa
One of the ODIN applications which complement Mat-DB by providing controlled access to anykind of supporting documents is the documentation database (DoMa). DoMa is a web-enableddigital document repository designed to enhance the dissemination of information amongst theR&D community in the energy sector. Any type of electronic record (i.e. publications, minutes,
spreadsheet, graphic, etc.) may be stored. Documents are organized in a hierarchical structure asin any standard file system with folders and sub-folders and document retrieval is controlledthrough access rights: a public document can be retrieved by any registered user, a confidentialdocument requires that the user has been granted specific access rights for the document.Document upload and administration of access rights is delegated to the responsible persons ofthe various projects, i.e. each project can upload their documents and control the access their arearemotely via the DoMa web-interface. DoMa provides an indexed full text search and a very fastsearch on abstracts, titles, keywords, etc. It contains manuals as well as for the user and theadministrator.
7 Benefit for European materials projects
The intention of JRC as a supra-national institution is safeguarding high investments made intoEuropean materials research and to conserve the knowledge. As one way in achieving this goal,the JRC offers Mat-DB and DoMa to European R&D projects and other European groups andcommittees as a free tool to manage and exchange their experimental data and documentation,similar to the Japanese 'Data Freeway', which was set up to exchange data between severalresearch centres [16]. European R&D participants, who are supported by public funding, areencouraged to release their data for public access at the end of the project. Thus, the projectbenefits from a sophisticated web-enabled database for the management and conservation ofmaterials data and related documentation. The European research community may benefit fromthe availability of valuable data and analysis routines.
Mat-DB contains the experimental properties data, which are filtered, smoothed, reduced, etc. Acomplex thermo-mechanical fatigue test for instance could run depending on the loadingconditions several hundred or thousands cycles. To store all of them would slow down even themost powerful database. Therefore usually only some specific cycles together with hysteresisinformation (usually reduced to 200-300 data points per hysteresis) are stored in a database. But,if necessary, the complete raw data sets can be stored as binary objects in Mat-DB. A projectpartner can conserve for example his original EXCEL file and all other partners who have accessrights can then open this file within a Mat-DB retrieval session. Moreover, project documentationrelated to the data sets such as final reports can be stored in DoMa. Project responsible himselfcan enter the documentation in DoMa and determines the access rights. The general projectdescription could be publicly available; documentation such as reports accessible only for achosen group of customers could have a confidentiality level 1 and minutes of project meetingsan even more restricted confidentiality level 2. If somebody would request any access to theconfidential parts the project responsible receives a mail and can make his decision. DoMa andMat-DB are linked with each other. Having logged-in in ODIN the user can retrieve data fromMat-DB and related documentation from DoMa and vice versa. The access rights together withpassword and user identification are administrated in the ODIN application server.
The web-enabled Mat-DB provides access to public, restricted and confidential materials dataand documentation from former and current European R&D activities and from extensivematerial programmes, e.g. the German High Temperature Reactor Programme [17]. It currentlycontains a Pool of with approximately 25000 test results. Public data are open to anybody whoregisters, restricted data are released after agreement by the data owner and confidential data areaccessible by the project participants only. The quality of data is the responsibility of the
laboratory where they have been generated. JRC controls mandatory input, but does not take anyliability for the data. Offering a broad range of materials data together with the analysis optionsand related documentation would make the ODIN platform an address of interest both forresearch and industry.
However, proprietary data are often very sensitive and/or the data owners invested significantresources for testing the materials. Therefore they do not want to release the data without anyreturn. In such a case, the ODIN portal may act in future as a tool for exchange of materials dataand documentation over the Internet or could act as data warehouse [18] for European groups andcommittees, which retain full control over their own data. Therefore the web-enabled Mat-DBhas also been installed at FZ Jülich. FZ Karlsruhe is using the JRC server to upload their data inan own domain, which is totally under their control. Other European research centres such asBAM and CEA Saclay are also interested in the web-enabled Mat-DB. The goal of JRC is toimplement a web-enabled data content functionality, which browse through all accessible data onthe different Mat-DB servers. The individual sites control the access rights to these data. Theadded value for these network partners is the use of all implemented analysis routines, theinterface to Fitit and DoMa.
Partners from industry and research are represented in COST materials projects. They create a lotof experimental data, which are supported partly by European funding. Therefore they should feelobliged to conserve the gained knowledge in form of data and documentation, especially thepublic part. On the other hand if there is any interest to commercialise confidential data anddocumentation, the COST projects as a whole or single partners could make use of the ODINplatform free of charge. Interested partners could upload the data into assigned data pools.Documentation related to the data sets can be implemented linked to DoMa. The data owners canthen determine the rules for data exchange or data release, which may include e_commerce andcan control the access for those customers who subscribe for the data. JRC is guaranteeing dataconfidentiality, encryption of the data and maintenance of the ODIN platform free of charge.
A lot of data and documentation of finished COST projects have already been uploaded to DoMaand Mat-DB. Many other R&D projects such as the High Temperature and Generation IVReactor related ones make meanwhile use of the ODIN Web Portal.
8 Summary and Conclusion
Material databases (MDBs) are important and effective tools for the conservation, exchange anddissemination of data. The potential has even further increased with the emergence of theInternet. The availability of experimental materials data in a defined and traceable quality isnecessary for structural integrity and inelastic analysis calculations or complex materialsmodelling. In combination with FE calculations lifetime predictions can result in a much betteruse of high temperature exposed components, which improves safety and reliability and savescosts. Therefore the European scientific and engineering community on materials technology andthe European Commission itself would have an added value in conserving valuable data anddocumentation and in establishing an ever-growing data Pool promptly accessible via theInternet.
The JRC has a long history of developing material databases and can offer a mature web-enabledMat-DB to manage mechanical, thermo-physical and corrosion properties data. The database
structure includes detailed meta-information on the material, test condition, data source etc. Mat-DB and the related analysis routines are installed on a powerful and secure server within the On-line Data Information Network (ODIN: https://odin.jrc.nl). The application is offered at nocharge to support European R&D activities as well as European groups and committees for themanagement and conservation of their experimental materials data. Under the aspect ofknowledge conservation the project participants are encouraged by the EU to release their datafor public access at the end of the project. Data owners such as COST partners who invested a lotof money for testing the materials and intend to seil restricted materials data and documentationvia the Internet could also use ODIN to form a materials data warehouse.
Since ODIN is a central Web Portal to a series of its activities, the JRC intends to ensure a long-term continuation of the related applications including maintenance and further development ofthe various web-enabled database applications for engineering and nuclear safety.
The web-enabled Mat-DB will be further developed to include the entire cycle of data entry frommachine to database, data retrieval and analysis. New test types will be added as required. Thestructure has already been upgraded to include ceramics and composites.
References
[1] Advanced Engineering Materials Vol. 4, 2002, Nr. 6, pages 317-416: Special Issue "Materialsand Process Selection"
[2] Plantfacts Database of the German VDEh (Verein Deutscher Eisenhüttenleute - German Ironand Steel Institute): http://www.vdeh.de/deutsch/arbeit/informat/plantfe.htm
[3] WIAM®-METALLINFO DB, IMA-Dresden: http://www.ima-dresden.de/deutsch/startde.htm
[4] Materials Databases of MBase, Aachen, Germany: http://www.m-base.de/main/en/index.html
[5] MSC.Mvision Databanks, USA: http://www.mscsoftware.com
[6] Materials Databases of NIMS - National Institute for Materials Science, Japan:hap://mits nims .go.jp/db_top_eng.htm
[7] H.H. Over, E. Wolfart, W. Dietz, L. Toth, "A web-enabled materials database to supportEuropean R&D projects and network activities", Advanced Engineering Materials, August, 2005
[8] R.C. Hurst, H. Kröckel, H.H. Over, P. Vannson, "The Use of Models in MaterialsDatabanks", Materials 88 - Materials and Eng. Design, The Institute of Metals, London 1988
[9] H. Kröckel, H. H. Over, "The Need for an European Approach to Materials Characterisationand Data Management", International Symposium on Advanced Materials for LightweightStructures, March 1994
[10] H.H. Over, J. H. Rantala N. Taylor, W. Dietz, "A materials properties database approach tocover welded joints", 2nd International Conference on Integrity of High Temperature Welds,London, UK, 10 th — 12 th November, 2003
[11] M. Nagy, H.H. Over, A. Smith, "XML related Data Exchange from the Test Machine intothe Web-enabled Alloys-DB", 19th International CODATA Conference, "The Information
7th -Society: New Horizons for Science", Berlin Germany, 10th November 2004
[12] Thermo-mechanical fatigue – the route to standardisation', CORDIS R&D project no.GRD2-2000-30014
[13] H.H. Over, E. Wolfart, E. Veragten, "Data Retrieval and Evaluation within the Web-enabledAlloys-DB", 19th International CODATA Conference, "The Information Society: New Horizonsfor Science", Berlin, Germany, 7-10 November 2004
[14] P.J. Ennis, "Candidate Materials for a Modular High Temperature Reactor Power Plant inEngineering Issues in Turbine Machinery, Power Plant and Renewables", editors A Strang, R.D.Conroy, W.M. Banks, M. Blackler, J. Leggett, G.M. McColvin, S. Simpson, M. Smith, F. Starr,R. Vanstone, Maney, IoM3 Publications, Book Number B0800, ISBN 1-904350-20-8, 2003, pp1029 – 1037
[15] R. Mohrmann, V. Denner, T. Hollstein, "'Zur Lebensdauervorhersage von Austenit-Ferrit-Mischverbindungen"', Tagungsband FDBR Düsseldorf (2003) Teil 4
[16] 15th International CODATA Conference, M. Fujita, Some Trials an WWW Servers in the"Data Freeway", Scientific Data in the Age of Networking 29 September - 3 October 1996,Tsukuba, Japan
[17] Endbericht zum Verbund-Forschungsvorhaben des BMFT, "Auslegungskriterien fürhochtemperaturbelastete metallische und keramische Komponenten sowie des Spannbeton-Reaktordruckbehälters zukünftiger HTR-Anlagen", Teil B: Metallische Komponenten, KFA Jülich,August 1988
[18] Y. Li, "Building the Data Warehouse for Materials Selection in Mechanical Design",Advanced Engineering Materials 2004, 6, No. 1 - 2, pp 92 - 95


Part III
Addendum
lnvited papers
These papers arrived too late for reviewing
and are reproduced as received

ADVANCED COATINGS FOR GAS TURBINES
J. R. Nicholls+ and B. Bordenet*Cranfield University, Cranfield, Bedford MK43 OAL,UK
* ALSTOM (Switzerland) Ltd, Brown Boveri, Strasse 7, CH-5401, Baden, Switzerland
Abstract
Coating systems and the associated surface engineering are now key materials technologies in the design of advancedgas turbines. This paper focuses on the concept of the `coating system' to provide environmental and/or thermalprotection to hot gas path components.
This paper provides a review of available coating systems and discusses their relative benefits in terms ofperformance against manufacturing complexity and therefore cost. Systems may vary from low cost, aluminidediffusion coatings through to the more exotic 'smart' corrosion resistance coatings and 'seif diagnostic' thermalbarrier coating concepts.
Future trends in the design of environmental protection and thermal protection coatings are discussed including thelatest advances in modified aluminide coatings, with the addition of reactive elements, diffusion barrier conceptsapplicable beneath advanced overlay coatings, the new y+y, strong bondcoat systems and the latest structurallymodified, low thermal conductivity thermal barrier coating systems.
Keywords: Gas turbine coatings, diffusion coatings, platinum aluminides, yttrium aluminides, MCrAIY overlaycoatings, APS, VPS, HVOF, PVD, EB-PVD, diffusion barriers, thermal barriers, smart coating systems
Introduction and Background
Over recent years, gas turbine based systems have become the equipment of choice for powergeneration and now form an integral part of modern advanced power plant engineering [1,2].They are featured in the most efficient of designs, where they are used as a means of convertingraw fuel into electrical energy, plus the exhaust residual heat from the turbine can also be used toraise steam. Their versatility allows them to burn many fuel types including natural gas, syntheticgas, produced from coal or other feedstock such as biomass, or a range of liquid fuels. Thusmodern power plants designs can be quite complex involving combined cycles, intercoolers,reheat reformers and recuperation to improve the overall efficiency of the plant. Efficiencies upto 55-60% have been projected for combined cycle plant [1-3], requiring heavy duty gas turbineinlet temperatures up to 1450°C [2,3], although many plants may operate at lower temperatures inthe range 900-1425°C [2].
The current popularity of gas turbine power plant relates the shorter construction lead times andease of installation, with the modular nature of such plant design permitting an incrementalincrease in capacity when growth in demand require it [2]. These design considerations coupledwith increased fuel flexibility, low CO 2 projected emissions through projected increasedefficiencies and the availability of power units in the 180-400MWe have ensured that futureutility power plants will be based on gas turbine technologies as part of a combined cycleapplication.
Thus strategically, the view is that alternative fuels/operating cycles will play a major role infuture world power generation [1,2]. The challenge to the gas turbine rector is to continue toincrease turbine efficiency (Siemens Westinghouse ATS has exceeded 60% efficiencies for a
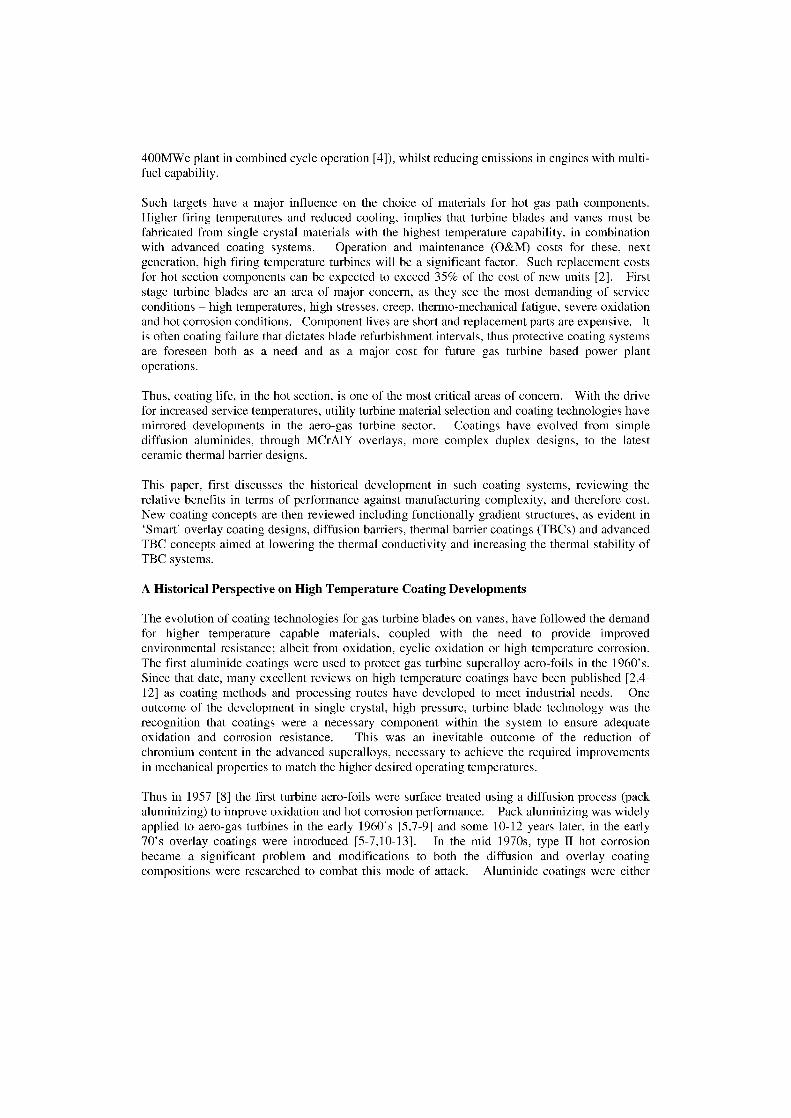
400MWe plant in combined cycle Operation [4]), whilst reducing emissions in engines with multi-fuel capability.
Such targets have a major influence on the choice of materials for hot gas path components.Higher firing temperatures and reduced cooling, implies that turbine blades and vanes must befabricated from single crystal materials with the highest temperature capability, in combinationwith advanced coating systems. Operation and maintenance (O&M) costs for these, nextgeneration, high firing temperature turbines will be a significant factor. Such replacement costsfor hot section components can be expected to exceed 35% of the cost of new units [2]. Firststage turbine blades are an area of major concern, as they see the most demanding of serviceconditions – high temperatures, high stressec, creep, thermo-mechanical fatigue, severe oxidationand hot corrosion conditions. Component lives are short and replacement parts are expensive. Itis often coating failure that dictates blade refurbishment intervals, thus protective coating systemsare foreseen both as a need and as a major cost for future gas turbine based power plantoperations.
Thus, coating life, in the hot section, is one of the most critical areas of concern. With the drivefor increased service temperatures, utility turbine material selection and coating technologies havemirrored developments in the aero-gas turbine sector. Coatings have evolved from simplediffusion aluminides, through MCrA1Y overlays, more complex duplex designs, to the latestceramic thermal barrier designs.
This paper, first discusses the historical development in such coating systems, reviewing therelative benefits in terms of performance against manufacturing complexity, and therefore cost.New coating concepts are then reviewed including functionally gradient structures, as evident in`Smart' overlay coating designs, diffusion barriers, thermal barrier coatings (TBCs) and advancedTBC concepts aimed at lowering the thermal conductivity and increasing the thermal stability ofTBC systems.
A Historical Perspective on High Temperature Coating Developments
The evolution of coating technologies for gas turbine blades on vanes, have followed the demandfor higher temperature capable materials, coupled with the need to provide improvedenvironmental resistance; albeit from oxidation, cyclic oxidation or high temperature corrosion.The first aluminide coatings were used to protect gas turbine superalloy aero-foils in the 1960's.Since that date, many excellent reviews on high temperature coatings have been published [2,4-12] as coating methods and processing routes have developed to meet industrial needs. Oneoutcome of the development in single crystal, high pressure, turbine blade technology was therecognition that coatings were a necessary component within the system to ensure adequateoxidation and corrosion resistance. This was an inevitable outcome of the reduction ofchromium content in the advanced superalloys, necessary to achieve the required improvementsin mechanical properties to match the higher desired operating temperatures.
Thus in 1957 [8] the first turbine aero-foils were surface treated using a diffusion process (packaluminizing) to improve oxidation and hot corrosion performance. Pack aluminizing was widelyapplied to aero-gas turbines in the early 1960's [5,7-9] and some 10-12 years later, in the early70's overlay coatings were introduced [5-7,10-13]. In the mid 1970s, type II hot corrosionbecame a significant problem and modifications to both the diffusion and overlay coatingcompositions were researched to combat this mode of attack. Aluminide coatings were either
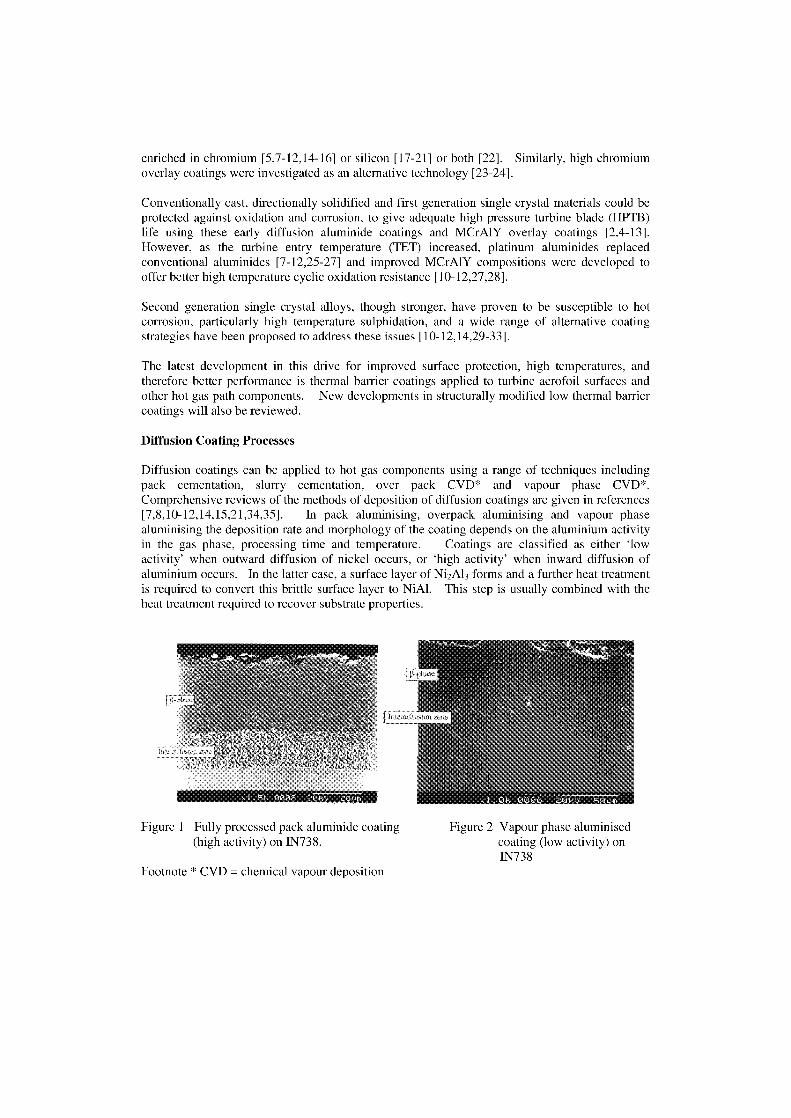
enriched in chromium [5,7-12,14-16] or silicon [17-21] or both [22]. Similarly, high chromiumoverlay coatings were investigated as an alternative technology [23-24].
Conventionally cast, directionally solidified and first generation single crystal materials could beprotected against oxidation and corrosion, to give adequate high pressure turbine blade (HPTB)life using these early diffusion aluminide coatings and MCrA1Y overlay coatings [2,4-13].However, as the turbine entry temperature (TET) increased, platinum aluminides replacedconventional aluminides [7-12,25-27] and improved MCrA1Y compositions were developed tooffer better high temperature cyclic oxidation resistance [10-12,27,28].
Second generation single crystal alloys, though stronger, have proven to be susceptible to hotcorrosion, particularly high temperature sulphidation, and a wide range of alternative coatingstrategies have been proposed to address these issues [10-12,14,29-33].
The latest development in this drive for improved surface protection, high temperatures, andtherefore better performance is thermal barrier coatings applied to turbine aerofoil surfaces andother hot gas path components. New developments in structurally modified low thermal barriercoatings will also be reviewed.
Diffusion Coating Processes
Diffusion coatings can be applied to hot gas components using a range of techniques includingpack cementation, slurry cementation, over pack CVD* and vapour phase CVD*.Comprehensive reviews of the methods of deposition of diffusion coatings are given in references[7,8,10-12,14,15,21,34,35]. In pack aluminising, overpack aluminising and vapour phasealuminising the deposition rate and morphology of the coating depends on the aluminium activityin the gas phase, processing time and temperature. Coatings are classified as eitheractivity' when outward diffusion of nickel occurs, or 'high activity' when inward diffusion ofaluminium occurs. In the latter case, a surface layer of Ni 2A1 3 forms and a further heat treatmentis required to convert this brittle surface layer to NiA1. This step is usually combined with theheat treatment required to recover substrate properties.
Figure 1 Fully processed pack aluminide coating
Figure 2 Vapour phase aluminised(high activity) on IN738. coating (low activity) on
1N738Footnote * CVD = chemical vapour deposition
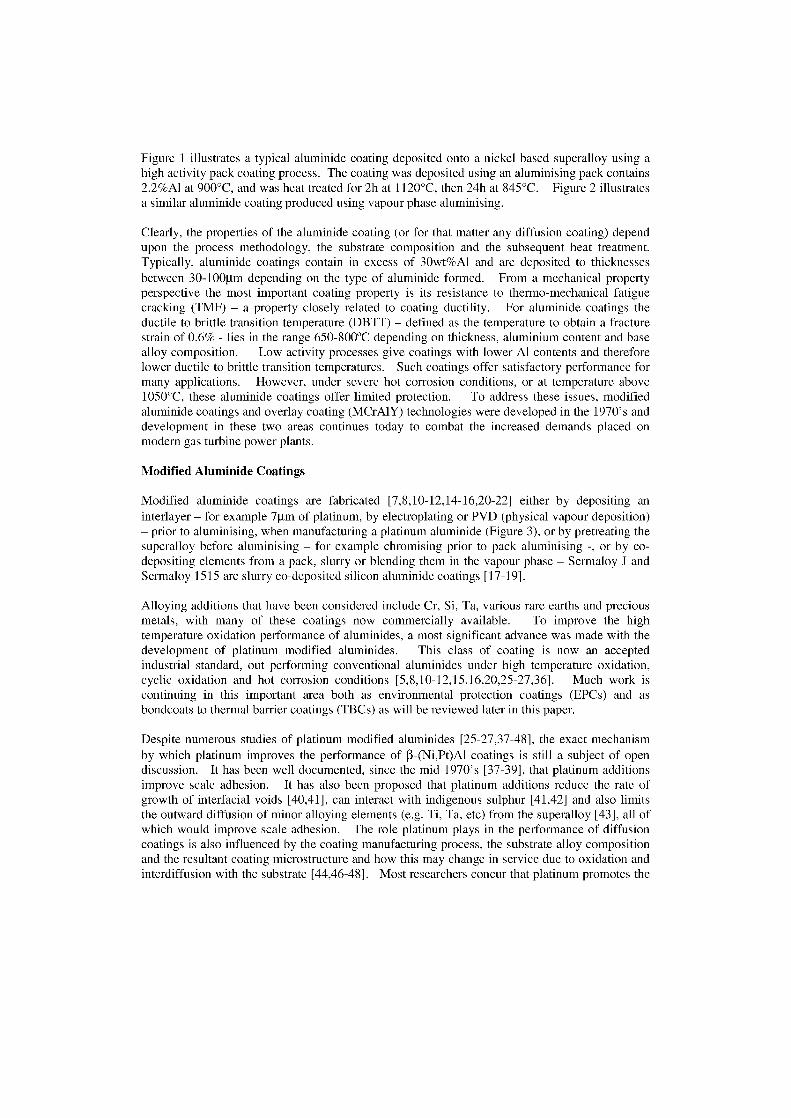
Figure 1 illustrates a typical aluminide coating deposited onto a nickel based superalloy using ahigh activity pack coating process. The coating was deposited using an aluminising pack contains2.2%Al at 900°C, and was heat treated for 2h at 1120°C, then 24h at 845°C. Figure 2 illustratesa similar aluminide coating produced using vapour phase aluminising.
Clearly, the properties of the aluminide coating (or for that matter any diffusion coating) dependupon the process methodology, the substrate composition and the subsequent heat treatment.Typically, aluminide coatings contain in excess of 30wt%Al and are deposited to thicknessesbetween 30-100gm depending on the type of aluminide formed. From a mechanical propertyperspective the most important coating property is its resistance to thermo-mechanical fatiguecracking (TMF) – a property closely related to coating ductility. For aluminide coatings theductile to brittle transition temperature (DBTT) – defined as the temperature to obtain a fracturestrain of 0.6% - lies in the range 650-800°C depending on thickness, aluminium content and basealloy composition. Low activity processes give coatings with lower Al contents and thereforelower ductile to brittle transition temperatures. Such coatings offer satisfactory performance formany applications. However, under severe hot corrosion conditions, or at temperature above1050°C, these aluminide coatings offer limited protection. To address these issues, modifiedaluminide coatings and overlay coating (MCrAlY) technologies were developed in the 1970's anddevelopment in these two areas continues today to combat the increased demands placed onmodern gas turbine power plants.
Modified Aluminide Coatings
Modified aluminide coatings are fabricated [7,8,10-12,14-16,20-22] either by depositing aninterlayer – for example 71.tm of platinum, by electroplating or PVD (physical vapour deposition)– prior to aluminising, when manufacturing a platinum aluminide (Figure 3), or by pretreating thesuperalloy before aluminising – for example chromising prior to pack aluminising or by co-depositing elements from a pack, slurry or blending them in the vapour phase – Sermaloy J andSermaloy 1515 are slurry co-deposited silicon aluminide coatings [17-19].
Alloying additions that have been considered include Cr, Si, Ta, various rare earths and preciousmetals, with many of these coatings now commercially available. To improve the hightemperature oxidation performance of aluminides, a most significant advance was made with thedevelopment of platinum modified aluminides. This dass of coating is now an acceptedindustrial standard, out performing conventional aluminides under high temperature oxidation,cyclic oxidation and hot corrosion conditions [5,8,10-12,15,16,20,25-27,36]. Much work iscontinuing in this important area both as environmental protection coatings (EPCs) and asbondcoats to thermal barrier coatings (TBCs) as will be reviewed later in this paper.
Despite numerous studies of platinum modified aluminides [25-27,37-48], the exact mechanismby which platinum improves the performance of 13-(Ni,P0A1 coatings is still a subject of opendiscussion. It has been well documented, since the mid 1970's [37-39], that platinum additionsimprove scale adhesion. It has also been proposed that platinum additions reduce the rate ofgrowth of interfacial voids [40,41], can interact with indigenous sulphur [41,42] and also limitsthe outward diffusion of minor alloying elements (e.g. Ti, Ta, etc) from the superalloy [43], all ofwhich would improve scale adhesion. The role platinum plays in the performance of diffusioncoatings is also influenced by the coating manufacturing process, the substrate alloy compositionand the resultant coating microstructure and how this may change in service due to oxidation andinterdiffusion with the substrate [44,46-48]. Most researchers concur that platinum promoten the
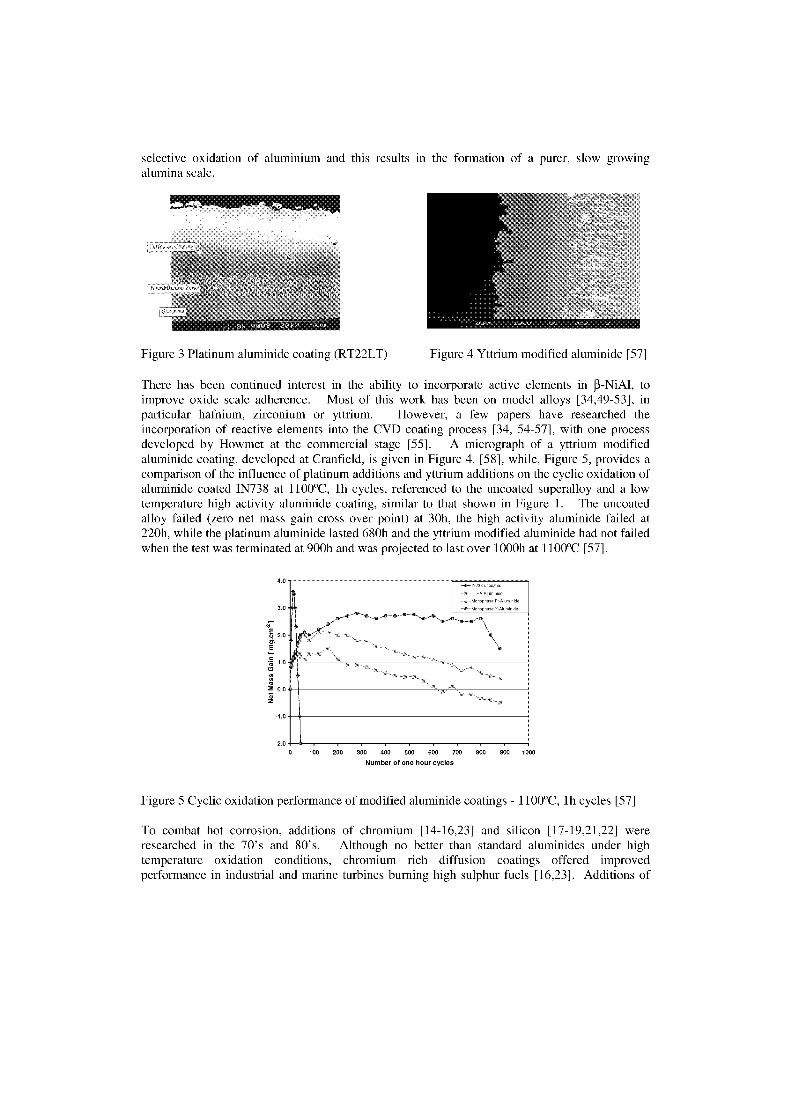
-LTHA AlurnInde
• Monophase Pt-Alurninitle
—4...Monophase V-Aluminitle
selective oxidation of aluminium and this results in the formation of a purer, slow growingalumina scale.
Figure 3 Platinum aluminide coating (RT22LT) Figure 4 Yttrium modified aluminide [57]
There has been continued interest in the ability to incorporate active elements in ß-NiAl, toimprove oxide scale adherence. Most of this work has been on model alloys [34,49-53], inparticular hafnium, zirconium or yttrium. However, a few papers have researched theincorporation of reactive elements into the CVD coating process [34, 54-57], with one processdeveloped by Howmet at the commercial stage [55]. A micrograph of a yttrium modifiedaluminide coating, developed at Cranfield, is given in Figure 4. [58], while, Figure 5, provides acomparison of the influence of platinum additions and yttrium additions on the cyclic oxidation ofaluminide coated 1N738 at 1100°C, lh cycles, referenced to the uncoated superalloy and a lowtemperature high activity aluminide coating, similar to that shown in Figure 1. The uncoatedalloy failed (zero net mass gain cross over point) at 30h, the high activity aluminide failed at220h, while the platinum aluminide lasted 680h and the yttrium modified aluminide had not failedwhen the test was terminated at 900h and was projected to last over 1000h at 1100°C [57].
0.0
1.0
100 200 300 400 500 600 700 800 900 1000Number of one hour cycles
Figure 5 Cyclic oxidation performance of modified aluminide coatings - 1100°C, lh cycles [57]
To combat hot corrosion, additions of chromium [14-16,23] and silicon [17-19,21,22] wereresearched in the 70's and 80's. Although no better than standard aluminides under hightemperature oxidation conditions, chromium rich diffusion coatings offered improvedperformance in industrial and marine turbines burning high sulphur fuels [16,23]. Additions of
4.0
.0
ry2, 2.E3
2.0
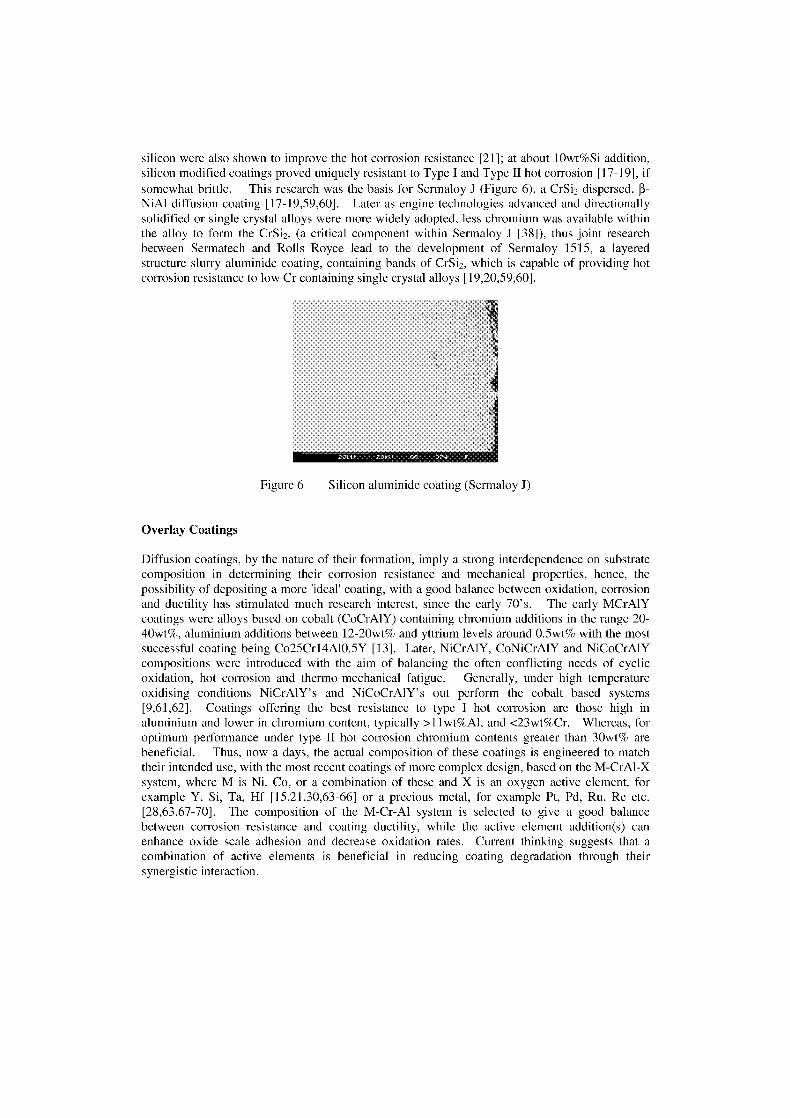
silicon were also shown to improve the hot corrosion resistance [21]; at about lOwt%Si addition,silicon modified coatings proved uniquely resistant to Type I and Type II hot corrosion [17-19], ifsomewhat brittle. This research was the basis for Sermaloy J (Figure 6), a CrSi 2 dispersed, 13-NiAl diffusion coating [17-19,59,60]. Later as engine technologies advanced and directionallysolidified or single crystal alloys were more widely adopted, less chromium was available withinthe alloy to form the CrSi 2 , (a critical component within Sermaloy J [38]), thus joint researchbetween Sermatech and Rolls Royce lead to the development of Sermaloy 1515, a layeredstructure slurry aluminide coating, containing bands of CrSi 2 , which is capable of providing hotcorrosion resistance to low Cr containing single crystal alloys [19,20,59,60].
Figure 6 Silicon aluminide coating (Sermaloy J)
Overlay Coatings
Diffusion coatings, by the nature of their formation, imply a strong interdependence on Substratecomposition in determining their corrosion resistance and mechanical properties, hence, thepossibility of depositing a more 'ideal' coating, with a good balance between oxidation, corrosionand ductility has stimulated much research interest, since the early 70's. The early MCrA1Ycoatings were alloys based on cobalt (CoCrAIY) containing chromium additions in the range 20-40wt%, aluminium additions between 12-20wt% and yttrium levels around 0.5wt% with the mostsuccessful coating being Co25Cr14A10.5Y [13]. Later, NiCrA1Y, CoNiCrAIY and NiCoCrA1Ycompositions were introduced with the aim of balancing the often conflicting needs of cyclicoxidation, hot corrosion and thermo-mechanical fatigue. Generally, under high temperatureoxidising conditions NiCrAIY's and NiCoCrA1Y's out perform the cobalt based systems[9,61,62]. Coatings offering the best resistance to type I hot corrosion are those high inaluminium and lower in chromium content, typically >11wt%Al, and <23wt%Cr. Whereas, forOptimum performance under type II hot corrosion chromium contents greater than 30wt% arebeneficial. Thus, now a days, the actual composition of these coatings is engineered to matchtheir intended use, with the most recent coatings of more complex design, based on the M-CrA1-Xsystem, where M is Ni, Co, or a combination of these and X is an oxygen active element, forexample Y, Si, Ta, Hf [15,21,30,63-66] or a precious metal, for example Pt, Pd, Ru, Re etc.[28,63,67-70]. The composition of the M-Cr-Al system is selected to give a good balancebetween corrosion resistance and coating ductility, while the active element addition(s) canenhance oxide scale adhesion and decrease oxidation raten. Current thinking suggests that acombination of active elements is beneficial in reducing coating degradation through theirsynergistic interaction.
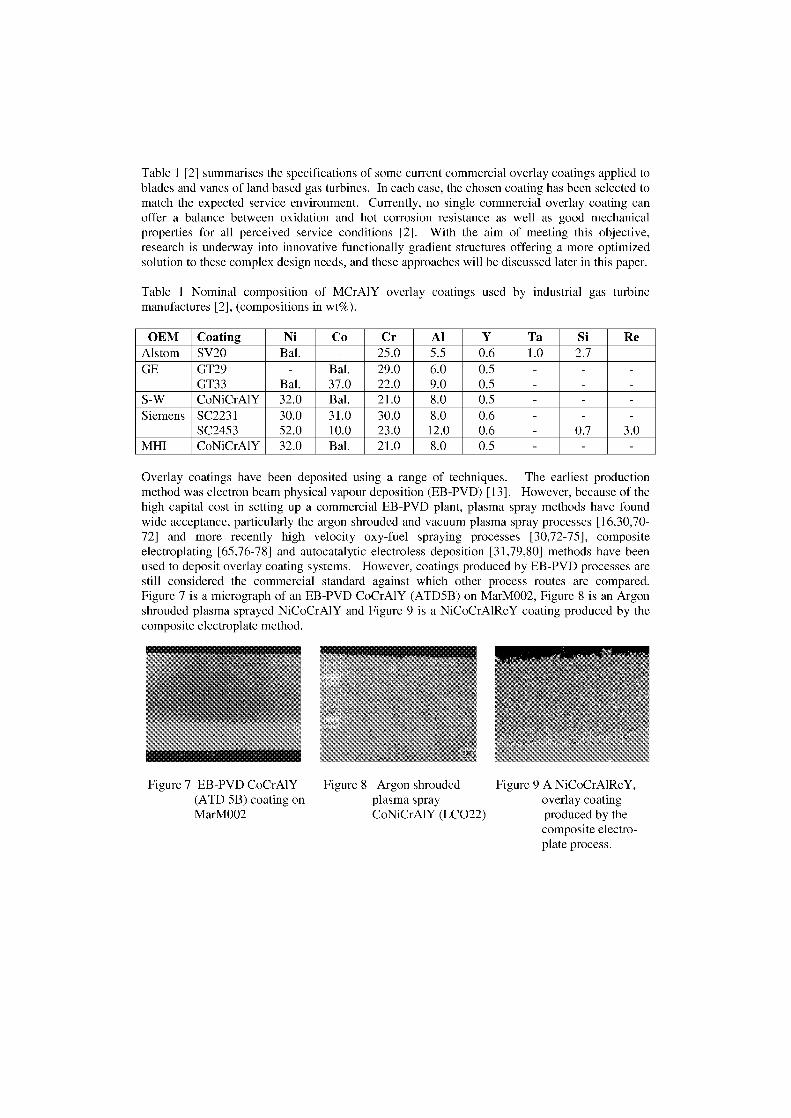
Table 1 [2] summarises the specifications of some current commercial overlay coatings applied toblades and vanes of land based gas turbines. In each case, the chosen coating has been selected tomatch the expected service environment. Currently, no single commercial overlay coating canoffer a balance between oxidation and hot corrosion resistance as well as good mechanicalproperties for all perceived service conditions [2]. With the aim of meeting this objective,research is underway into innovative functionally gradient structures offering a more optimizedsolution to these complex design needs, and these approaches will be discussed later in this paper.
Table 1 Nominal composition of MCrA1Y overlay coatings used by industrial gas turbinemanufactures [2], (compositions in wt%).
OEM Coating Ni Co Cr Al Y Ta Si ReAlstom SV20 Bal. 25.0 5.5 0.6 1.0 2.7 -GE GT29 Bal. 29.0 6.0 0.5 - - -
GT33 Bal. 37.0 22.0 9.0 0.5 - - -S-W CoNiCrA1Y 32.0 Bal. 21.0 8.0 0.5 - - -Siemens SC2231 30.0 31.0 30.0 8.0 0.6 - - -
SC2453 52.0 10.0 23.0 12.0 0.6 0.7 3.0MHI CoNiCrA1Y 32.0 Bal. 21.0 8.0 0.5 - - -
Overlay coatings have been deposited using a range of techniques. The earliest productionmethod was electron beam physical vapour deposition (EB-PVD) [13]. However, because of thehigh capital cost in setting up a commercial EB-PVD plant, plasma spray methods have foundwide acceptance, particularly the argon shrouded and vacuum plasma spray processes [16,30,70-72] and more recently high velocity oxy-fuel spraying processes [30,72-75], compositeelectroplating [65,76-78] and autocatalytic electroless deposition [31,79,80] methods have beenused to deposit overlay coating systems. However, coatings produced by EB-PVD processes arestill considered the commercial standard against which other process routes are compared.Figure 7 is a micrograph of an EB-PVD CoCrA1Y (ATD5B) on MarM002, Figure 8 is an Argonshrouded plasma sprayed NiCoCrAIY and Figure 9 is a NiCoCrAIReY coating produced by thecomposite electroplate method.
Figure 7 EB-PVD CoCrAIY Figure 8 Argon shrouded Figure 9 A NiCoCrAIReY,(ATD 5B) coating on plasma spray overlay coatingMarM002 CoNiCrAIY (LCO22) produced by the
composite electro-plate process.
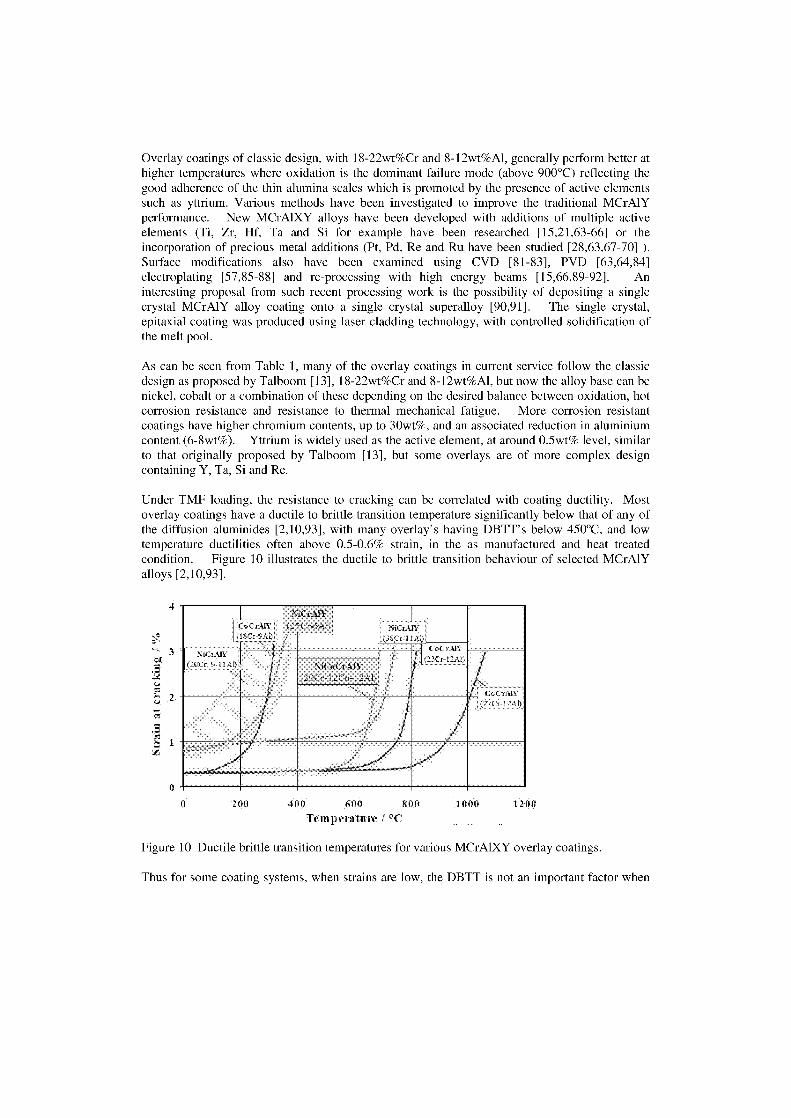
Overlay coatings of classic design, with 18-22wt%Cr and 8-12wt%Al, generally perform better athigher temperatures where oxidation is the dominant failure mode (above 900°C) reflecting thegood adherence of the thin alumina scales which is promoted by the presence of active elementssuch as yttrium. Various methods have been investigated to improve the traditional MCrA1Yperformance. New MCrA1XY alloys have been developed with additions of multiple activeelements (Ti, Zr, Hf, Ta and Si for example have been researched [15,21,63-66] or theincorporation of precious metal additions (Pt, Pd, Re and Ru have been studied [28,63,67-70] ).Surface modifications also have been examined using CVD [81-83], PVD [63,64,84]electroplating [57,85-88] and re-processing with high energy beams [15,66,89-92]. Aninteresting proposal from such recent processing work is the possibility of depositing a singlecrystal MCrA1Y alloy coating onto a single crystal superalloy [90,91]. The single crystal,epitaxial coating was produced using laser cladding technology, with controlled solidification ofthe melt Pool.
As can be seen from Table 1, many of the overlay coatings in current service follow the classicdesign as proposed by Talboom [13], 18-22wt%Cr and 8-12wt%Al, but now the alloy base can benickel, cobalt or a combination of these depending an the desired balance between oxidation, hotcorrosion resistance and resistance to thermal mechanical fatigue. More corrosion resistantcoatings have higher chromium contents, up to 30wt%, and an associated reduction in aluminiumcontent (6-8wt%). Yttrium is widely used as the active element, at around 0.5wt% level, similarto that originally proposed by Talboom [13], but some overlays are of more complex designcontaining Y, Ta, Si and Re.
Under TMF loading, the resistance to cracking can be correlated with coating ductility. Mostoverlay coatings have a ductile to brittle transition temperature significantly below that of any ofthe diffusion aluminides [2,10,93], with many overlay's having DBTT's below 450°C, and lowtemperature ductilities often above 0.5-0.6% strain, in the as manufactured and heat treatedcondition. Figure 10 illustrates the ductile to brittle transition behaviour of selected MCrA1Yalloys [2,10,93].
,NiCrAIY
') C1 -41Y (.. C r-5AU Ni( rAll'( 3 Kr-1 lA.1.3C1-':'
t. /An:, ,1/21
I., I
9.7..
',.1
NiCoCiAFV2(DC r-12Co-12A1
..,
400 ,6o0 1000 1200Temperatme
Figure 10 Ductile brittle transition temperatures for various MCrA1XY overlay coatings.
Thus for some coating systems, when strains are low, the DBTT is not an important factor when
0
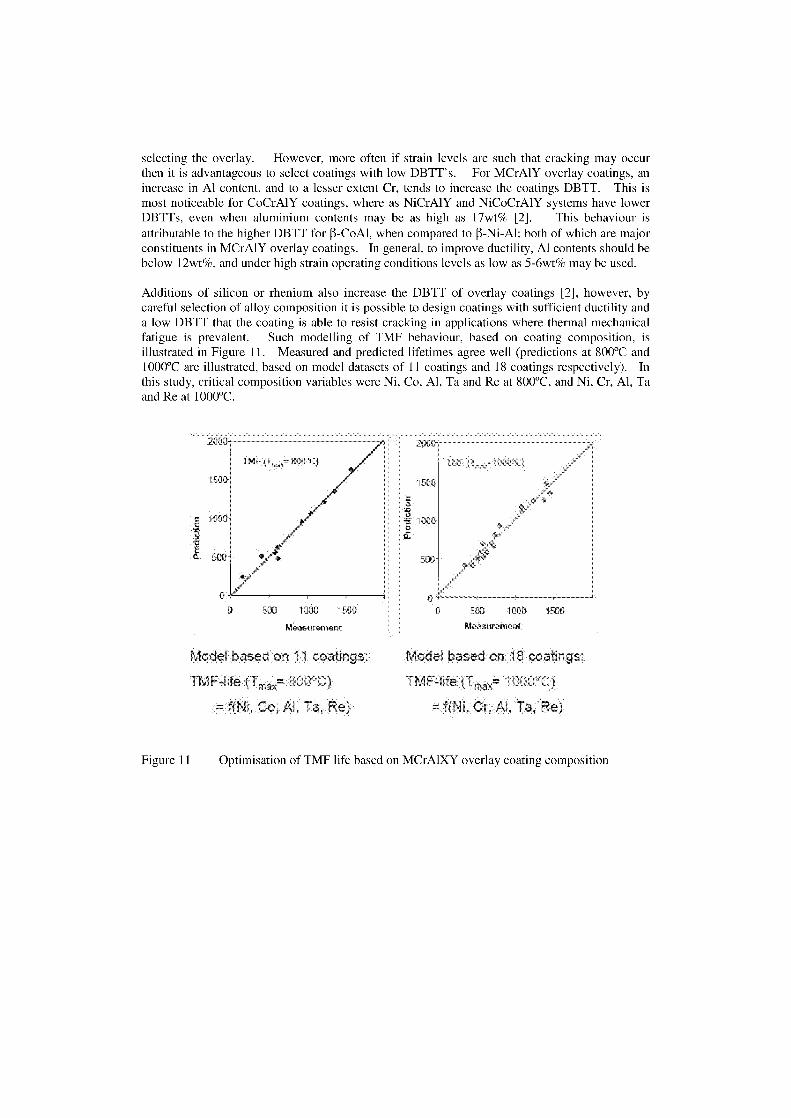
200C
50C IC1'20 1E.00
M9asurement
1 :CIO I 5
Meas
selecting the overlay. However, more often if strain levels are such that cracking may occurthen it is advantageous to select coatings with low DBTT's. For MCrA1Y overlay coatings, anincrease in Al content, and to a lesser extent Cr, tends to increase the coatings DBTT. This ismost noticeable for CoCrA1Y coatings, where as NiCrA1Y and NiCoCrAlY systems have lowerDBTTs, even when aluminium contents may be as high as 17wt% [2]. This behaviour isattributable to the higher DBTT for ß-CoAl, when compared to ß-Ni-Al; both of which are majorconstituents in MCrAIY overlay coatings. In general, to improve ductility, Al contents should bebelow 12wt%, and under high strain operating conditions levels as low as 5-6wt% may be used.
Additions of silicon or rhenium also increase the DBTT of overlay coatings [2], however, bycareful selection of alloy composition it is possible to design coatings with sufficient ductility anda low DBTT that the coating is able to resist cracking in applications where thermal mechanicalfatigue is prevalent. Such modelling of TMF behaviour, based on coating composition, isillustrated in Figure 11. Measured and predicted lifetimes agree well (predictions at 800°C and1000°C are illustrated, based on model datasets of 11 coatings and 18 coatings respectively). Inthis study, critical composition variables were Ni, Co, Al, Ta and Re at 800°C, and Ni, Cr, Al, Taand Re at 1000°C.
Model based or ,:atings: Moder based on 18 coatings:
TMF-life (T m iz-life (T„›
= f(Ni. Co, Al, Ta, Rej = f(Ni. Cr. Ta. Re)
Figure 11 Optimisation of TMF life based on MCrA1XY overlay coating composition
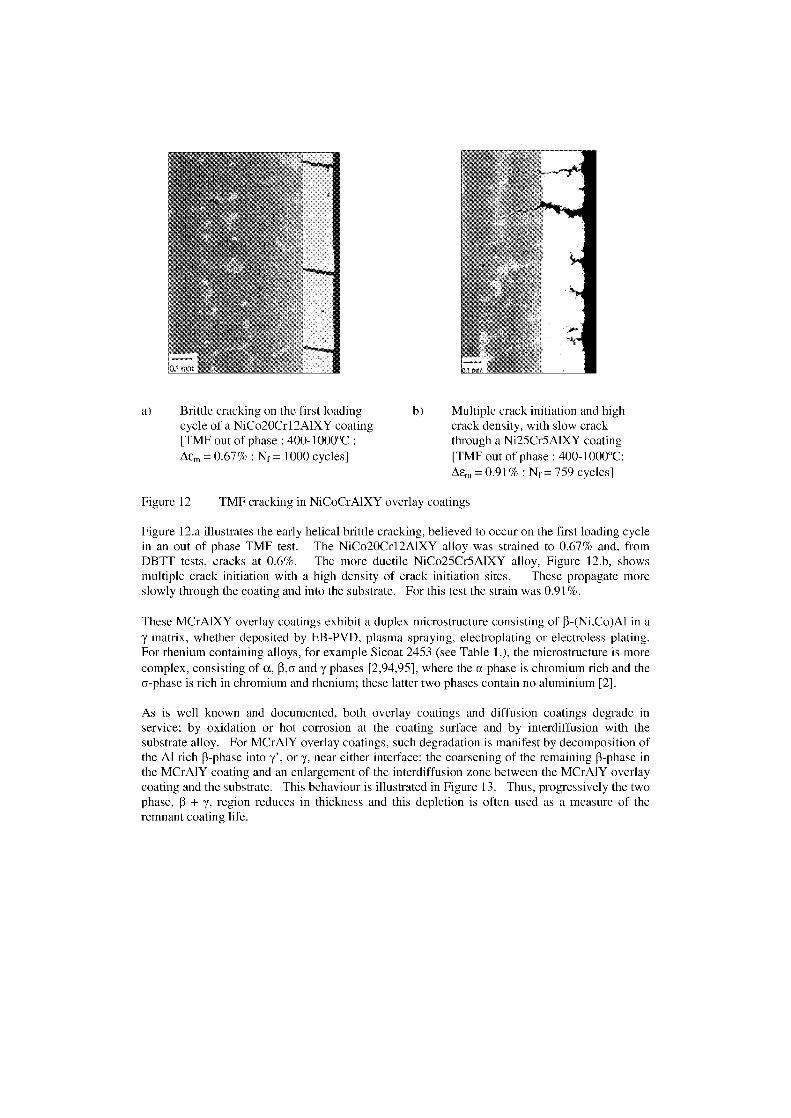
a) Brittle cracking on the first loadingcycle of a NiCo20Cr12A1XY coating[TMF out of phase : 400-1000°C :Aen, = 0.67% : Nf = 1000 cycles]
b) Multiple crack initiation and highcrack density, with slow crackthrough a Ni25Cr5A1XY coating[TMF out of phase : 400-1000°C:Aen, = 0.91% : Nf = 759 cycles]
Figure 12 TMF cracking in NiCoCrA1XY overlay coatings
Figure 12.a illustrates the early helical brittle cracking, believed to occur on the first loading cyclein an out of phase TMF test. The NiCo20Cr12A1XY alloy was strained to 0.67% and, fromDBTT tests, cracks at 0.6%. The more ductile NiCo25Cr5A1XY alloy, Figure 12.b, Showsmultiple crack initiation with a high density of crack initiation sites. These propagate moreslowly through the coating and into the substrate. For this test the strain was 0.91%.
These MCrA1XY overlay coatings exhibit a duplex microstructure consisting of 13-(Ni,Co)A1 in amatrix, whether deposited by EB-PVD, plasma spraying, electroplating or electroless plating.
For rhenium containing alloys, for example Sicoat 2453 (see Table 1.), the microstructure is morecomplex, consisting of a, i3,cs and y phases [2,94,95], where the u-phase is chromium rich and the6-phase is rich in chromium and rhenium; these latter two phases contain no aluminium [2].
As is well known and documented, both overlay coatings and diffusion coatings degrade inservice; by oxidation or hot corrosion at the coating surface and by interdiffusion with thesubstrate alloy. For MCrAlY overlay coatings, such degradation is manifest by decomposition ofthe Al rich ß-phase into y', or y, near either interface; the coarsening of the remaining ß-phase inthe MCrA1Y coating and an enlargement of the interdiffusion zone between the MCrA1Y overlaycoating and the substrate. This behaviour is illustrated in Figure 13. Thus, progressively the twophase, ß + y, region reduces in thickness and this depletion is often used as a measure of theremnant coating life.
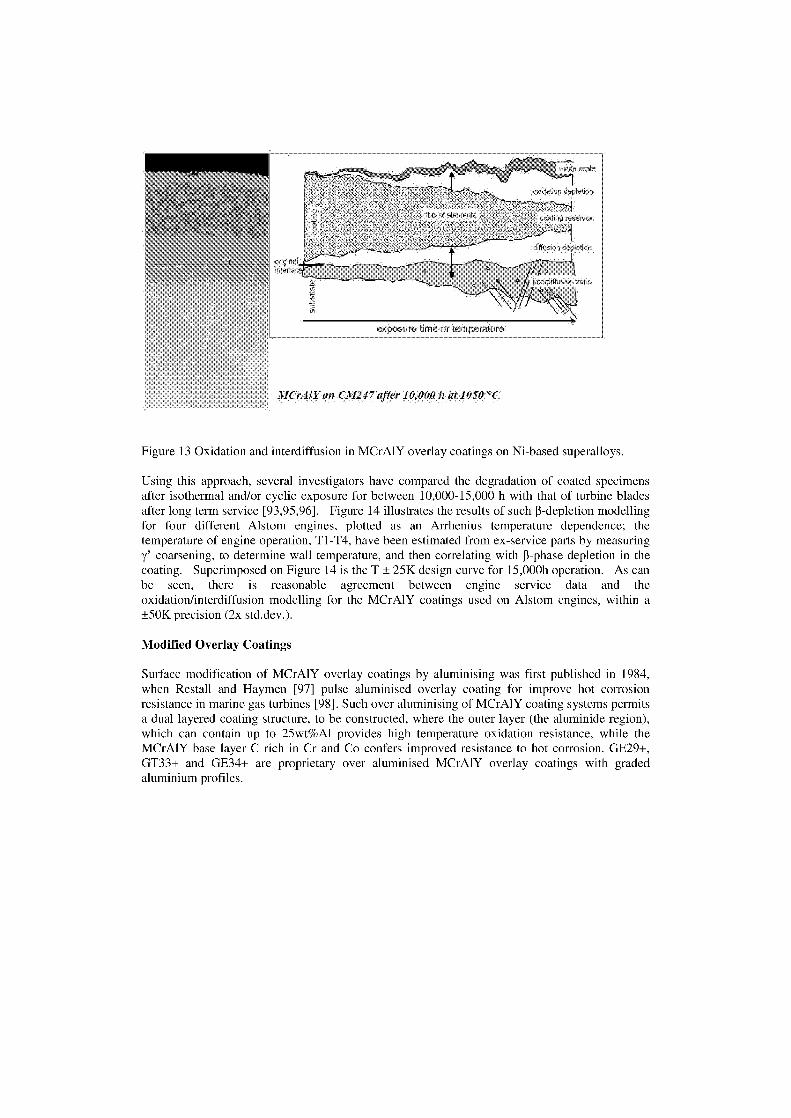
Es Inne. ')r tem p53,raU.
MrrAll'on C:112-17 alter 10,000Ir at 1050 'C
Figure 13 Oxidation and interdiffusion in MCrAIY overlay coatings on Ni-based superalloys.
Using this approach, several investigators have compared the degradation of coated specimensafter isothermal and/or cyclic exposure for between 10,000-15,000 h with that of turbine bladesafter long term service [93,95,96]. Figure 14 illustrates the results of such ß-depletion modellingfor four different Alstom engines, plotted as an Arrhenius temperature dependence; thetemperature of engine operation, T1-T4, have been estimated from ex-service parts by measuringy' coarsening, to determine wall temperature, and then correlating with ß-phase depletion in thecoating. Superimposed on Figure 14 is the T ± 25K design curve for 15,000h Operation. As canbe seen, there is reasonable agreement between engine service data and theoxidation/interdiffusion modelling for the MCrAIY coatings used on Alstom engines, within a±50K precision (2x std.dev.).
Modified Overlay Coatings
Surface modification of MCrA1Y overlay coatings by aluminising was first published in 1984,when Restall and Haymen [97] pulse aluminised overlay coating for improve hot corrosionresistance in marine gas turbines [98]. Such over aluminising of MCrAIY coating systems permitsa dual layered coating structure, to be constructed, where the outer layer (the aluminide region),which can contain up to 25wt%Al provides high temperature oxidation resistance, while theMCrA1Y base layer C rich in Cr and Co confers improved resistance to hot corrosion. GE29+,GT33+ and GE34+ are proprietary over aluminised MCrAIY overlay coatings with gradedaluminium profiles.
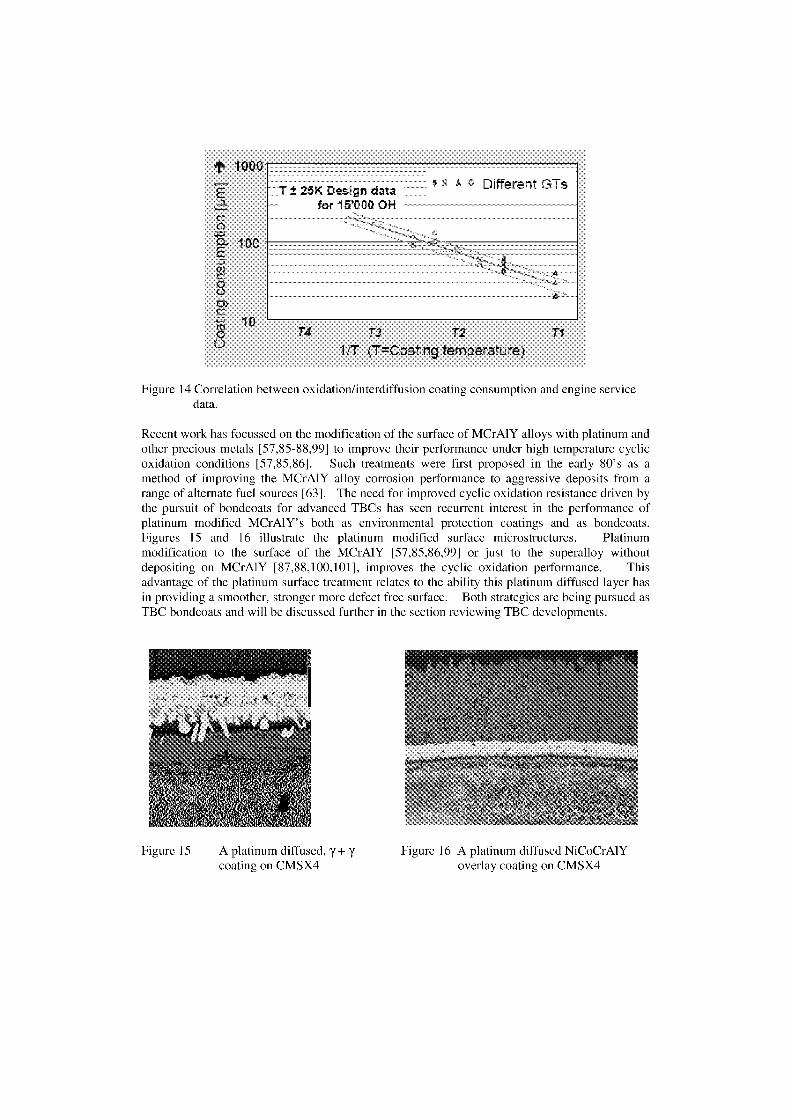
T 25K Design datafor 15'000 OH
T 1000
100
1 0T4 T3 T2
ri
T=Coating temperatu re}
Figure 14 Correlation between oxidation/interdiffusion coating consumption and engine servicedata.
Recent work has focussed on the modification of the surface of MCrA1Y alloys with platinum andother precious metals [57,85-88,99] to improve their performance under high temperature cyclicoxidation conditions [57,85,86]. Such treatments were first proposed in the early 80's as amethod of improving the MCrAIY alloy corrosion performance to aggressive deposits from arange of alternate fuel sources [63]. The need for improved cyclic oxidation resistance driven bythe pursuit of bondcoats for advanced TBCs has seen recurrent interest in the performance ofplatinum modified MCrAlY's both as environmental protection coatings and as bondcoats.Figures 15 and 16 illustrate the platinum modified surface microstructures. Platinummodification to the surface of the MCrA1Y [57,85,86,99] or just to the superalloy withoutdepositing on MCrA1Y [87,88,100,101], improves the cyclic oxidation performance. Thi sadvantage of the platinum surface treatment relates to the ability this platinum diffused layer hasin providing a smoother, stronger more defect free surface. Both strategies are being pursued asTBC bondcoats and will be discussed further in the section reviewing TBC developments.
Figure 15 A platinum diffused, 7+7 Figure 16 A platinum diffused NiCoCrAIYcoating on CMSX4 overlay coating on CMSX4
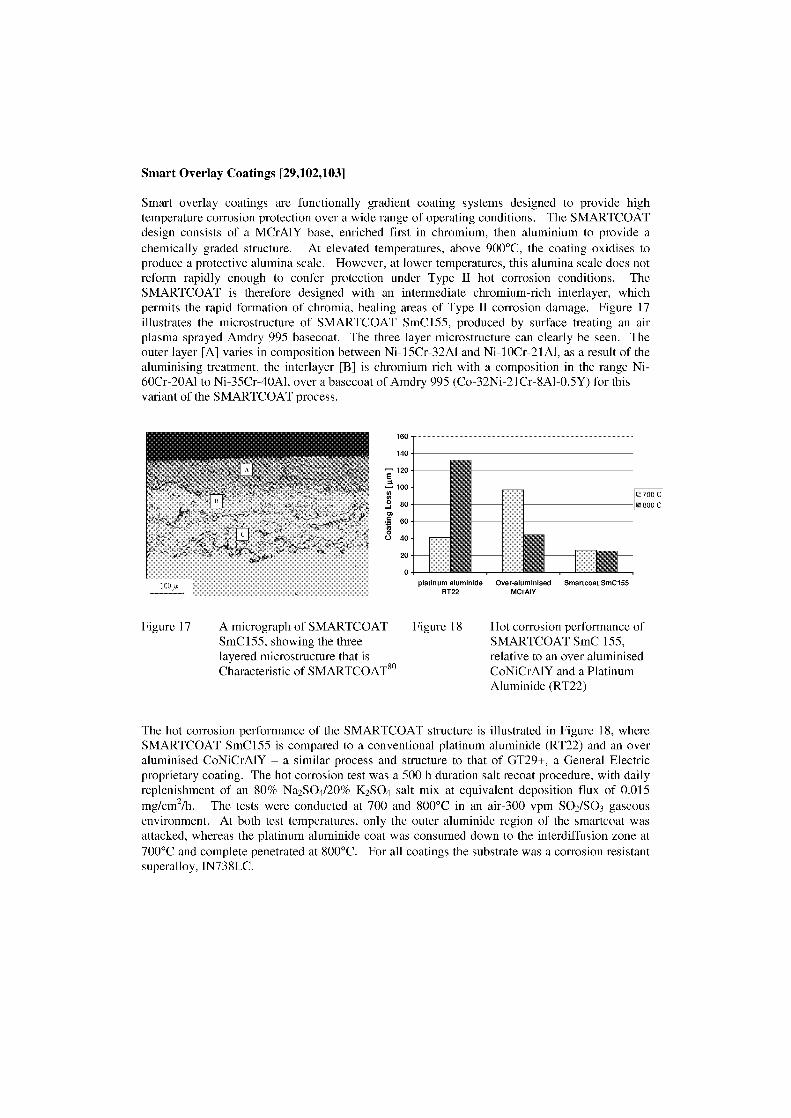
Smart Overlay Coatings [29,102,103]
Smart overlay coatings are functionally gradient coating systems designed to provide hightemperature corrosion protection over a wide range of operating conditions. The SMARTCOATdesign consists of a MCrA1Y base, enriched first in chromium, then aluminium to provide achemically graded structure. At elevated temperatures, above 900°C, the coating oxidises toproduce a protective alumina scale. However, at lower temperatures, this alumina scale does notreform rapidly enough to confer protection under Type II hot corrosion conditions. TheSMARTCOAT is therefore designed with an intermediate chromium-rich interlayer, whichpermits the rapid formation of chromia, healing areas of Type II corrosion damage. Figure 17illustrates the microstructure of SMARTCOAT SmC155, produced by surface treating an airplasma sprayed Amdry 995 basecoat. The three layer microstructure can clearly be seen. Theouter layer [A] varies in composition between Ni-15Cr-32A1 and Ni-10Cr-21A1, as a result of thealuminising treatment, the interlayer [B] is chromium rich with a composition in the range Ni-60Cr-20A1 to Ni-35Cr-40A1, over a basecoat of Amdry 995 (Co-32Ni-21Cr-8A1-0.5Y) for thisvariant of the SMARTCOAT process.
160
140
0700 C
EM 800 C
^ 120E
100cc22 800)
60
0 40
20
pla inum aluminide Over-aluminised Smartcoat SmC155RT22 MCrAIY
Figure 17 A micrograph of SMARTCOATSmC155, showing the threelayered microstructure that isCharacteristic of SMARTCOAT8°
Figure 1 8 Hot corrosion performance ofSMARTCOAT SmC 155,relative to an over aluminisedCoNiCrAIY and a PlatinumAluminide (RT22)
The hot corrosion performance of the SMARTCOAT structure is illustrated in Figure 18, whereSMARTCOAT SmC155 is compared to a conventional platinum aluminide (RT22) and an overaluminised CoNiCrAIY – a similar process and structure to that of GT29+, a General Electricproprietary coating. The hot corrosion test was a 500 h duration salt recoat procedure, with dailyreplenishment of an 80% Na 2SO4/20% K2SO4 salt mix at equivalent deposition flux of 0.015mg/cm2/h. The tests were conducted at 700 and 800°C in an air-300 vpm S0 2/S03 gaseousenvironment. At both test temperatures, only the outer aluminide region of the smartcoat wasattacked, whereas the platinum aluminide coat was consumed down to the interdiffusion zone at700°C and complete penetrated at 800°C. For all coatings the substrate was a corrosion resistantsuperalloy, IN738LC.
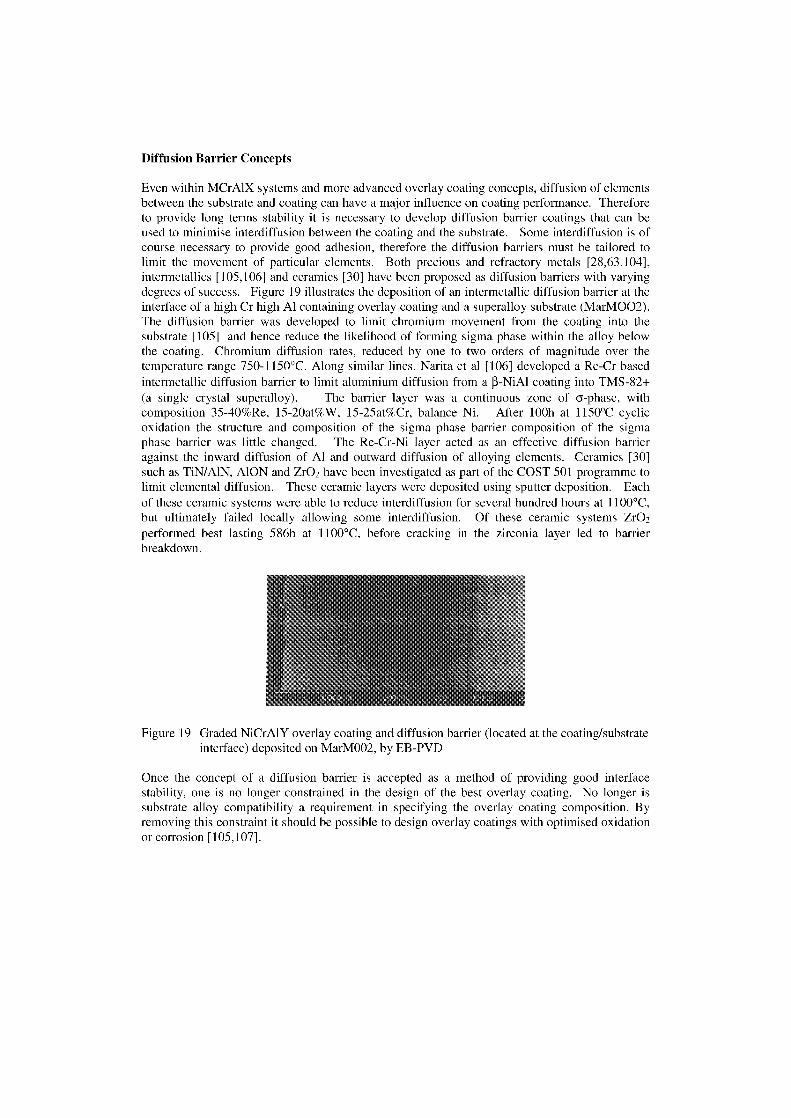
Diffusion Barrier Concepts
Even within MCrA1X systems and more advanced overlay coating concepts, diffusion of elementsbetween the substrate and coating can have a major influence on coating performance. Thereforeto provide long terms stability it is necessary to develop diffusion barrier coatings that can beused to minimise interdiffusion between the coating and the substrate. Some interdiffusion is ofcourse necessary to provide good adhesion, therefore the diffusion barriers must be tailored tolimit the movement of particular elements. Both precious and refractory metals [28,63,104],intermetallics [105,106] and ceramics [30] have been proposed as diffusion barriers with varyingdegrees of success. Figure 19 illustrates the deposition of an intermetallic diffusion barrier at theinterface of a high Cr high Al containing overlay coating and a superalloy substrate (MarMOO2).The diffusion barrier was developed to limit chromium movement from the coating into thesubstrate [105] and hence reduce the likelihood of forming sigma phase within the alloy belowthe coating. Chromium diffusion rates, reduced by one to two orders of magnitude over thetemperature range 750-1150°C. Along similar lines, Narita et al [106] developed a Re-Cr basedintermetallic diffusion barrier to limit aluminium diffusion from a ß-NiAl coating into TMS-82+(a single crystal superalloy). The barrier layer was a continuous zone of cs-phase, withcomposition 35-40%Re, 15-20at%W, 15-25at%Cr, balance Ni. After 100h at 1150°C cyclicoxidation the structure and composition of the sigma phase barrier composition of the sigmaphase barrier was little changed. The Re-Cr-Ni layer acted as an effective diffusion barrieragainst the inward diffusion of Al and outward diffusion of alloying elements. Ceramics [30]such as TiN/A1N, A1ON and Zr0 2 have been investigated as part of the COST 501 programme tolimit elemental diffusion. These ceramic layers were deposited using sputter deposition. Eachof these ceramic systems were able to reduce interdiffusion for several hundred hours at 1100°C,but ultimately failed locally allowing some interdiffusion. Of these ceramic systems Zr02performed best lasting 586h at 1100°C, before cracking in the zirconia layer led to barrierbreakdown.
Figure 19 Graded NiCrA1Y overlay coating and diffusion barrier (located at the coating/substrateinterface) deposited on MarM002, by EB-PVD
Once the concept of a diffusion barrier is accepted as a method of providing good interfacestability, one is no longer constrained in the design of the best overlay coating. No longer issubstrate alloy compatibility a requirement in specifying the overlay coating composition. Byremoving this constraint it should be possible to design overlay coatings with optimised oxidationor corrosion [105,107].
THERMAL BARBIER COATING TECHNOLOGIES
An alternative strategy to the development of environmental protection coatings [EPC], based oncorrosion resistant alloys and intermetallics, is to design coating systems that a lower the metalsurface temperature. Thermal barrier coatings (TBCs) work in this way and provide the potentialto drop metal surface temperatures by up to 150°C, using current technologies in conjunction withcomponent cooling. A 150°C reduction in the component surface temperature would have theeffect of reducing oxidation rates by an order of magnitude and would provide further benefits byreducing the components propensity to creep and limiting the extent of interdiffusion between thebondcoat and Substrate superalloy.
Thermal barrier coatings (TBCs) have been used for this purpose within the aero-gas turbine sincethe 1970's [85,108-115]. They are now widely used in land based gas turbines for powergeneration [2,93] to provide thermal protection to hot section components. For aero-applicationsthe TBC is not considered `prime reliant' to the extent that they can be used with assurance thatfailure will not occur [116]. However, for some industrial turbine applications, TBCs are usedas `prime reliant' on hot section components [G and H dass] while on other classes (D, E and Fdass) they are applied to extend service life, but are not `prime reliant' [2].
Commercial TBC systems are typically two layered structures, consisting of a ceramic topcoatand an underlying metallic bondcoat. Between the ceramic topcoat and bondcoat a thinthermally grown oxide (TGO) forms during manufacture and thickens during service. The TGOimparts oxidation resistance and also serves to bond the ceramic topcoat to the substrate/bondcoatsystem. Oxidation induced failure of the TBC is associated with cracking and spallation of thethickening TGO, above some critical thickness. This is considered the ultimate failuremechanism of commercial TBCs, particularly those produced by electron beam physical vapourdeposition (EB-PVD) [117-119]. Since their introduction, PYSZ TBCs have performed well inservice, significantly increasing the life of components. For example, the application of 7wt%PYSZ TBC to combustion can walls reduces the thermal stresses in the can and can result incomponent lives in excess of 20,000 hours [120]. Thus, by virtue of its low thermal conductivity,and good thermal stability at temperatures up 1500°C, 8wt% yttria partially stabilised zirconiaTBCs have become the industrial standard to reduce the heat flux into hot path components withingas turbine engines. Their use allows a high thermal gradient to be subtended across the ceramicthickness without any increase in metal surface temperature, potentially allowing up to 150°Cincrease in turbine entry temperature (TET).
Although plasma sprayed TBCs have performed well in service on annular surfaces in the engine,their microstructure does yield coatings with the necessary strain compliance, erosion resistanceor surface finish required for successful application on blade or nozzle guide vane aerofoils withinthe aero-gas turbine [117]. They are however, used on blades and nozzle guide vanes in largeutility gas turbines [2,93,121-123] where service lives up to 24,000h of operation are expected[2,93,122]. An example of the structure of the plasma sprayed TBC is shown in Figure 20. Forcomparison Figure 21 shows a micrograph of an electron-beam physical vapour deposition (EB-PVD) TBC which, because of their columnar microstructure exhibit very high levels of straincompliance and is most often found on high pressure turbine blades and nozzle guide vanes inaero-gas turbines [11,12,116]. The columnar microstructure is due to the atomistic nature of thedeposition process, with nucleation and growth of the coating controlled by condensation fromthe vapour phase. In addition to their good compliance, EB-PVD TBC systems also offer otherbenefits over plasma sprayed TBCs in terms of improved adhesion, surface finish and erosion
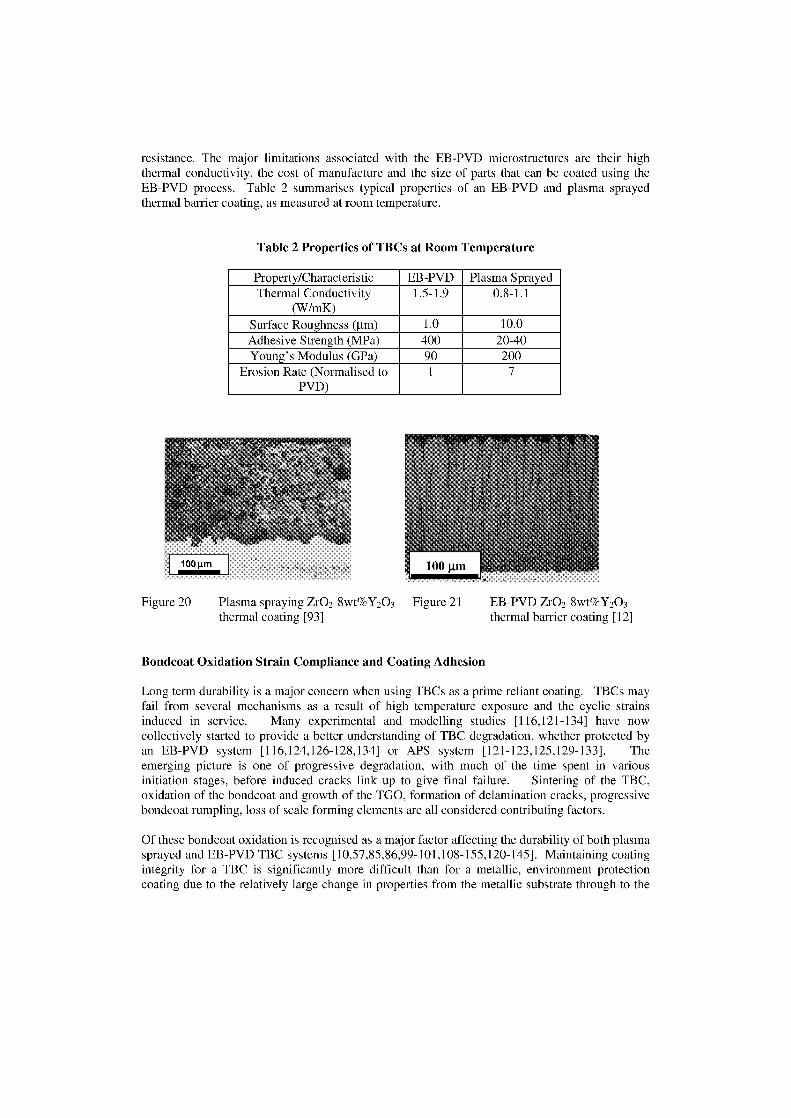
resistance. The major limitations associated with the EB-PVD microstructures are their highthermal conductivity, the cost of manufacture and the size of parts that can be coated using theEB-PVD process. Table 2 summarises typical properties of an EB-PVD and plasma sprayedthermal barrier coating, as measured at room temperature.
Table 2 Properties of TBCs at Room Temperature
Property/Characteristic EB-PVD Plasma Sprayed0.8-1.1Thermal Conductivity
(W/mK)1.5-1.9
Surface Roughness (Iim) 1.0 10.0Adhesive Strength (MPa) 400 20-40Young's Modulus (GPa) 90 200
Erosion Rate (Normalised toPVD)
1 7
Figure 20 Plasma spraying Zr0 2-8wt%Y203 Figure 21
EB-PVD Zr02-8wt%Y203thermal coating [93]
thermal barrier coating [12]
Bondcoat Oxidation Strain Compliance and Coating Adhesion
Long term durability is a major concern when using TBCs as a prime reliant coating. TBCs mayfail from several mechanisms as a result of high temperature exposure and the cyclic strainsinduced in service. Many experimental and modelling studies [116,121-134] have nowcollectively started to provide a better understanding of TBC degradation, whether protected byan EB-PVD system [116,124,126-128,134] or APS system [121-123,125,129-133]. Theemerging picture is one of progressive degradation, with much of the time spent in variousinitiation stages, before induced cracks link up to give final failure. Sintering of the TBC,oxidation of the bondcoat and growth of the TGO, formation of delamination cracks, progressivebondcoat rumpling, loss of scale forming elements are all considered contributing factors.
Of these bondcoat oxidation is recognised as a major factor affecting the durability of both plasmasprayed and EB-PVD TBC systems [10,57,85,86,99-101,108-155,120-145]. Maintaining coatingintegrity for a TBC is significantly more difficult than for a metallic, environment protectioncoating due to the relatively large change in properties from the metallic substrate through to the
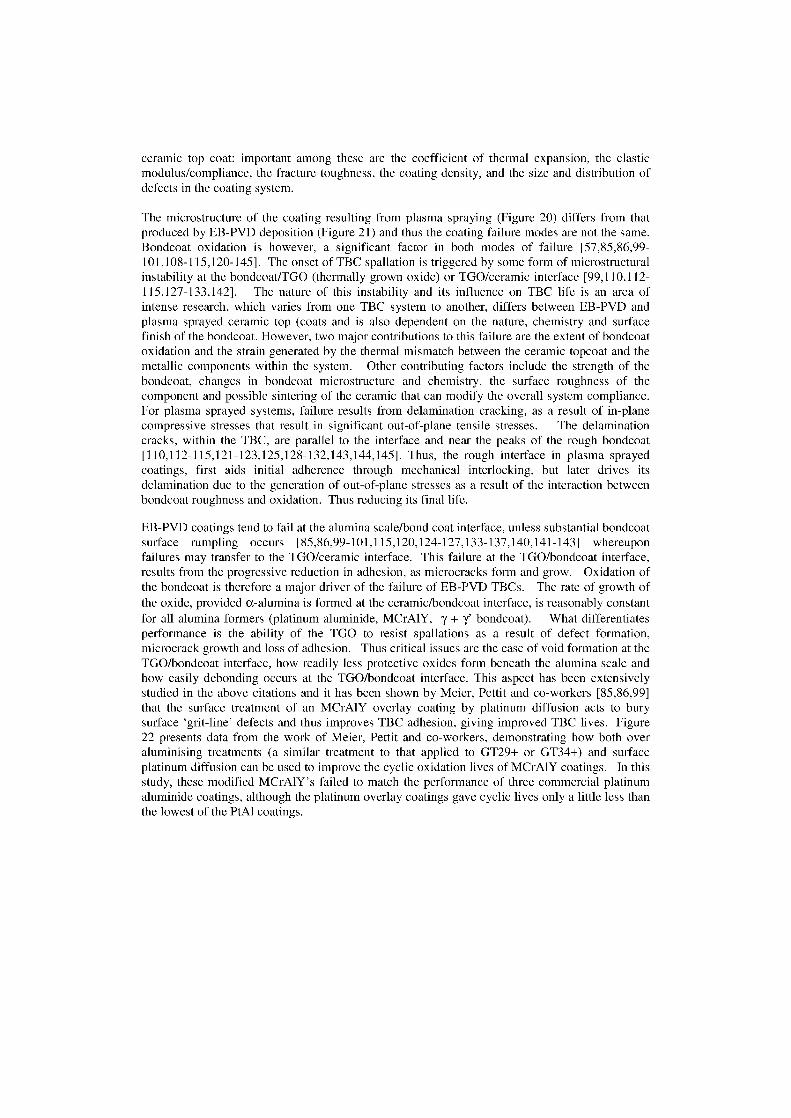
ceramic top coat; important among these are the coefficient of thermal expansion, the elasticmodulus/compliance, the fracture toughness, the coating density, and the size and distribution ofdefects in the coating system.
The microstructure of the coating resulting from plasma spraying (Figure 20) differs from thatproduced by EB-PVD deposition (Figure 21) and thus the coating failure modes are not the same.Bondcoat oxidation is however, a significant factor in both modes of failure [57,85,86,99-101,108-115,120-145]. The onset of TBC spallation is triggered by some form of microstructuralinstability at the bondcoat/TGO (thermally grown oxide) or TGO/ceramic interface [99,110,112-115,127-133,142]. The nature of this instability and its influence on TBC life is an area ofintense research, which varies from one TBC system to another, differs between EB-PVD andplasma sprayed ceramic top (coats and is also dependent on the nature, chemistry and surfacefinish of the bondcoat. However, two major contributions to this failure are the extent of bondcoatoxidation and the strain generated by the thermal mismatch between the ceramic topcoat and themetallic components within the system. Other contributing factors include the strength of thebondcoat, changes in bondcoat microstructure and chemistry, the surface roughness of thecomponent and possible sintering of the ceramic that can modify the overall system compliance.For plasma sprayed systems, failure results from delamination cracking, as a result of in-planecompressive stresses that result in significant out-of-plane tensile stresses. The delaminationcracks, within the TBC, are parallel to the interface and near the peaks of the rough bondcoat[110,112-115,121-123,125,128-132,143,144,145]. Thus, the rough interface in plasma sprayedcoatings, first aids initial adherence through mechanical interlocking, but later drives itsdelamination due to the generation of out-of-plane stresses as a result of the interaction betweenbondcoat roughness and oxidation. Thus reducing its final life.
EB-PVD coatings tend to fail at the alumina scale/bond coat interface, unless substantial bondcoatsurface rumpling occurs [85,86,99-101,115,120,124-127,133-137,140,141-143] whereuponfailures may transfer to the TGO/ceramic interface. This failure at the TGO/bondcoat interface,results from the progressive reduction in adhesion, as microcracks form and grow. Oxidation ofthe bondcoat is therefore a major driver of the failure of EB-PVD TBCs. The rate of growth ofthe oxide, provided oc-alumina is formed at the ceramic/bondcoat interface, is reasonably constantfor all alumina Formers (platinum aluminide, MCrA1Y, y + y' bondcoat). What differentiatesperformance is the ability of the TGO to resist spallations as a result of defect formation,microcrack growth and loss of adhesion. Thus critical issues are the ease of void formation at theTGO/bondcoat interface, how readily less protective oxides form beneath the alumina scale andhow easily debonding occurs at the TGO/bondcoat interface. This aspect has been extensivelystudied in the above citations and it has been shown by Meier, Pettit and co-workers [85,86,99]that the surface treatment of an MCrAIY overlay coating by platinum diffusion acts to burysurface `grit-line' defects and thus improves TBC adhesion, giving improved TBC lives. Figure22 presents data from the work of Meier, Pettit and co-workers, demonstrating how both overaluminising treatments (a similar treatment to that applied to GT29+ or GT34+) and surfaceplatinum diffusion can be used to improve the cyclic oxidation lives of MCrA1Y coatings. In thisstudy, these modified MCrA1Y's failed to match the performance of three commercial platinumaluminide coatings, although the platinum overlay coatings gave cyclic lives only a little less thanthe lowest of the PtAI coatings.
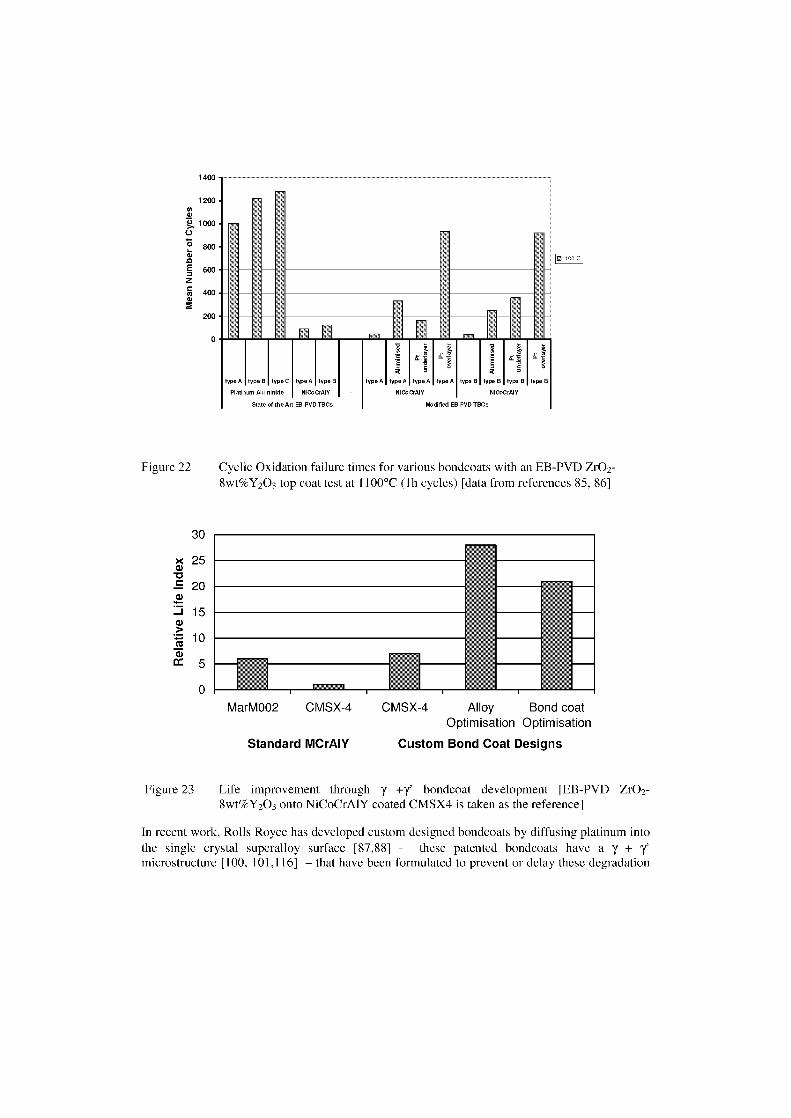
1400
200
000 -
800 -
600
400
200
1 El0
Zo o co
type A type B type C type A type B type A type A type A type A type B type B type B type BPlatinum Alu minide NiCoCrAlY NiCoCrAlY Ni CoCrAIY
State-of-the-Art EB-PVD TBCs Modified EB-PVD TBCs
Figure 22 Cyclic Oxidation failure times for various bondcoats with an EB-PVD Zr02-8wt%Y203 top coat test at 1100°C (lh cycles) [data from references 85, 86]
30
x 25cs-cs20
3 15
10G)cc 5
0MarM002 CMSX-4 CMSX-4 Alloy Bond coat
Optimisation Optimisation
Standard MCrAIY Custom Bond Coat Designs
Figure 23 Life improvement through y +y' bondcoat development [EB-PVD Zr02-8wt%Y203 onto NiCoCrAIY coated CMSX4 is taken as the reference]
In recent work, Rolls Royce has developed custom designed bondcoats by diffusing platinum intothe single crystal superalloy surface [87,88] - these patented bondcoats have a y + 7'microstructure [100, 101,116] – that have been formulated to prevent or delay these degradation
1
g0
-2
3
E;311■Do c
processes. The y + y' bondcoat provide a stronger bondcoat system offer high creep strength thusresisting "rumpling". They also provide a physical barrier and a metallurgical stable
microstructure to limit substrate element diffusion. Figure 23 illustrates such bondcoatdevelopment and demonstrates that relative to CMSX4 with a standard NiCoCrA1Y bondcoat thenew y + y' microstructures provide a 20 fold increase in life for an optimised bondcoat depositedon CMSX4. With further optimisation of the single crystal superalloy (fourth generation alloys)the life can be increased still further.
Low Thermal Conductivity, EB-PVD Thermal Barrier Coatings
As eluded to in the previous sections the first concern of the materials engineer was the thermalstability of the TBC system. Thus, in the early days of TBC research much work was undertakento determine the best stabilising agent for zirconia. For very high temperature applications(mostly driven by the aero industry) there was broad agreement that 6-8wt% yttria partiallystabilised zirconia offered the best solution as it showed the highest resistance to spallation underthermal cycling conditions [114] and excellent thermal stability. Later, explanations of thisphenomenon identified the Formation of the well know t' phase in partially stabilised zirconia[146] and its toughening mechanism [147]. Thus, yttria stabilised zirconia based thermal barriercoatings are viewed as todays "standard" and will meet the need for thermal protection in thelatest generation of high powered, high performance gas turbine engines, whether for aero- orindustrial applications.
Having addressed many of the mechanical stability issues, the research focus has now changedand is directed towards future engine performance. From Table 2, it is apparent that although thecolumnar microstructure of the EB-PVD TBC offers improved mechanical properties its thermalconductivity (1.65 W/mK) is significantly higher than its plasma sprayed counterpart (0.8W/mK). Therein lies the challenge "How to reduce the thermal conductivity of an EB-PVD TBCto 0.8 W/mK, while still maintaining strain tolerance and thermal stability?"
Many have taken up this challenge [11,12,127,148-156] and a new generation of low thermalconductivity' TBC ceramics have been developed based on lanthanide doped zirconia orpyrochlore phases. Research at Cranfield, under Rolls Royce sponsorship, has examined theinfluence of tertiary and quaternary lanthanide dopants on the thermal conductivity of EB-PVDTBCs [153-155]. The aim was to produce partially stabilised zirconia, within the t' phase field,that contained phonon scattering centres to lower the ceramic thermal conductivity. Further, ifthe dopants also colours the ceramic this could be beneficial in reducing radiative transport.Following this concept, our work on dopant effects concentrating on the role of high atomic massadditions as there should theoretically provide the more effective scattering centres. Dopantsevaluated included: NiO (atomic mass 51), Nd 203 (atomic mass 144) and Gd203 (atomic mass157) Er203 (atomic mass 167) and Yb 203 (atomic mass 173). These five dopants were evaluatedboth as ternary and quaternary additions by manufacturing custom evaporation rods with knowndopant levels; selected from 1.0, 2.0, 4.0 and 8.0 mole % addition. The additions were introducedto maximise lattice strains and discordant lattice vibrations. The thermal conductivity of eachdoped TBC was measured using a laser flash technique and the results for various ternaryadditions are presented in Figure 24, at a 4mole% addition of tertiary dopant.
Erbia, gadolinia, neodymia and ztterbia all lower the thermal conductivity of zirconia-4.5 mole%yttria (8wt% yttria), when added at a 4 mole% level. Nickel oxide, the only divalent oxideaddition used, produced only a small decrease in contrast to the work of Tamerin et. al [156].
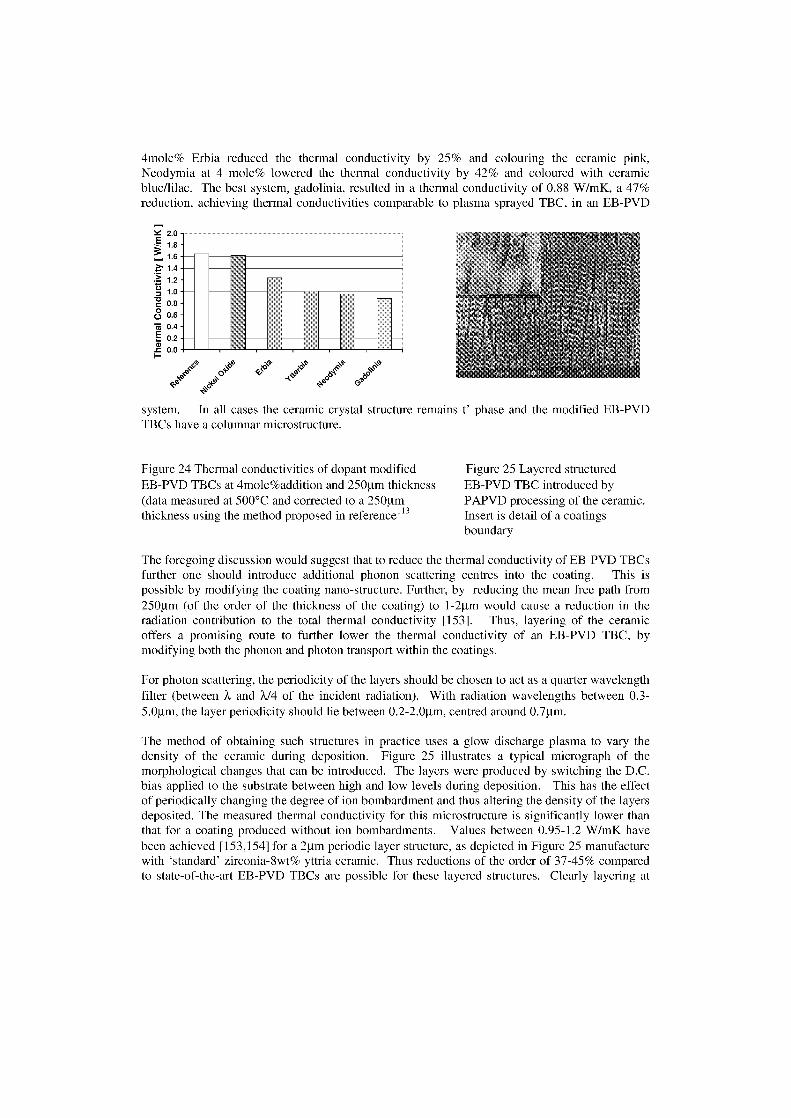
4mole% Erbia reduced the thermal conductivity by 25% and colouring the ceramic pink,Neodymia at 4 mole% lowered the thermal conductivity by 42% and coloured with ceramicblue/lilac. The best system, gadolinia, resulted in a thermal conductivity of 0.88 W/mK, a 47%reduction, achieving thermal conductivities comparable to plasma sprayed TBC, in an EB-PVD
2.0 -1.81.6
>" 1.41.2g 1.0
-csc 0.800 0.6 -R 0.4 -E 0.2-c 0.0
system. In all cases the ceramic crystal structure remains t' phase and the modified EB-PVDTBCs have a columnar microstructure.
Figure 24 Thermal conductivities of dopant modifiedEB-PVD TBCs at 4mole%addition and 250i.tm thickness(data measured at 500°C and corrected to a 250i.tmthickness using the method proposed in reference113
Figure 25 Layered structuredEB-PVD TBC introduced byPAPVD processing of the ceramic.Insert is detail of a coatingsboundary
The foregoing discussion would suggest that to reduce the thermal conductivity of EB-PVD TBCsfurther one should introduce additional phonon scattering centres into the coating. This ispossible by modifying the coating nano-structure. Further, by reducing the mean free path from250pm (of the order of the thickness of the coating) to 1-21.1m would cause a reduction in theradiation contribution to the total thermal conductivity [153]. Thus, layering of the ceramicoffers a promising route to further lower the thermal conductivity of an EB-PVD TBC, bymodifying both the phonon and photon transport within the coatings.
For photon scattering, the periodicity of the layers should be chosen to act as a quarter wavelengthfilter (between X and X/4 of the incident radiation). With radiation wavelengths between 0.3-5.0µm, the layer periodicity should lie between 0.2-2.0gm, centred around 0.71.1m.
The method of obtaining such structures in practice uses a glow discharge plasma to vary thedensity of the ceramic during deposition. Figure 25 illustrates a typical micrograph of themorphological changes that can be introduced. The layers were produced by switching the D.C.bias applied to the Substrate between high and low levels during deposition. This has the effectof periodically changing the degree of ion bombardment and thus altering the density of the layersdeposited. The measured thermal conductivity for this microstructure is significantly lower thanthat for a coating produced without ion bombardments. Values between 0.95-1.2 W/mK havebeen achieved [153,154] for a 21.1m periodic layer structure, as depicted in Figure 25 manufacturewith 'standard' zirconia-8wt% yttria ceramic. Thus reductions of the order of 37-45% comparedto state-of-the-art EB-PVD TBCs are possible for these layered structures. Clearly layering at
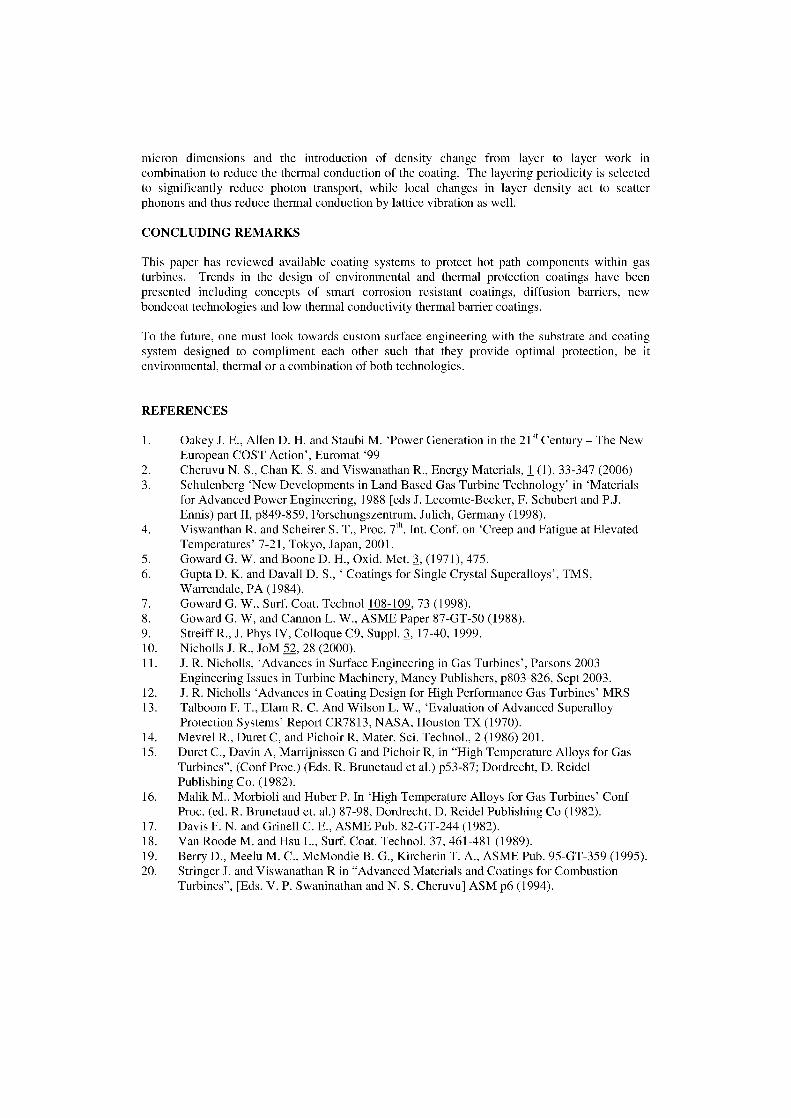
micron dimensions and the introduction of density change from layer to layer work incombination to reduce the thermal conduction of the coating. The layering periodicity is selectedto significantly reduce photon transport, while local changes in layer density act to scatterphonons and thus reduce thermal conduction by lattice vibration as well.
CONCLUDING REMARKS
This paper has reviewed available coating systems to protect hot path components within gasturbines. Trends in the design of environmental and thermal protection coatings have beenpresented including concepts of smart corrosion resistant coatings, diffusion barriers, newbondcoat technologies and low thermal conductivity thermal barrier coatings.
To the future, one must look towards custom surface engineering with the substrate and coatingsystem designed to compliment each other such that they provide optimal protection, be itenvironmental, thermal or a combination of both technologies.
REFERENCES
1. Oakey J. E., Allen D. H. and Staubi M. 'Power Generation in the 21 st Century - The NewEuropean COST Action', Euromat '99
2. Cheruvu N. S., Chan K. S. and Viswanathan R., Energy Materials, 1 (1), 33-347 (2006)3. Schulenberg 'New Developments in Land Based Gas Turbine Technology' in 'Materials
for Advanced Power Engineering, 1988 [eds J. Lecomte-Becker, F. Schubert and P.J.Ennis) part II, p849-859, Forschungszentrum, Julich, Germany (1998).
4. Viswanthan R. and Scheirer S. T., Proc. 7 ffi . Int. Conf. an 'Creep and Fatigue at ElevatedTemperatures' 7-21, Tokyo, Japan, 2001.
5. Goward G. W. and Boone D. H., Oxid. Met. 3, (1971), 475.6. Gupta D. K. and Davall D. S., Coatings for Single Crystal Superalloys', TMS,
Warrendale, PA (1984).7. Goward G. W., Surf. Coat. Technol 108-109, 73 (1998).8. Goward G. W, and Cannon L. W., ASME Paper 87-GT-50 (1988).9. Streiff R., J. Phys IV, Colloque C9, Suppl. 3, 17-40, 1999.10. Nicholls J. R., JoM 52, 28 (2000).11. J. R. Nicholls, 'Advances in Surface Engineering in Gas Turbines', Parsons 2003
Engineering Issues in Turbine Machinery, Maney Publishers, p803-826, Sept 2003.12. J. R. Nicholls 'Advances in Coating Design for High Performance Gas Turbines' MRS13. Talboom F. T., Elam R. C. And Wilson L. W., 'Evaluation of Advanced Superalloy
Protection Systems' Report CR7813, NASA, Houston TX (1970).14. Mevrel R., Duret C, and Pichoir R, Mater. Sci. Technol., 2 (1986) 201.15. Duret C., Davin A, Marrijnissen G and Pichoir R, in "High Temperature Alloys for Gas
Turbines", (Conf Proc.) (Eds. R. Brunetaud et al.) p53-87; Dordrecht, D. ReidelPublishing Co. (1982).
16. Malik M., Morbioli and Huber P. In 'High Temperature Alloys for Gas Turbines' ConfProc. (ed. R. Brunetaud et. al.) 87-98, Dordrecht, D. Reidel Publishing Co (1982).
17. Davis F. N. and Grinell C. E., ASME Pub. 82-GT-244 (1982).18. Van Roode M. and Hsu L., Surf. Coat. Technol. 37, 461-481 (1989).19. Berry D., Meelu M. C., McMondie B. G., Kircherin T. A., ASME Pub. 95-GT-359 (1995).20. Stringer J. and Viswanathan R in "Advanced Materials and Coatings for Combustion
Turbines", [Eds. V. P. Swaninathan and N. S. Cheruvu] ASM p6 (1994).
21. Goward G. W., in 'High temperature corrosion' (Conf. Proc. NACE-6), (Ed. R. A. Rapp),p553-560; Houston, TX, NACE (1983).
22. Fitzer F. and Schlichting J., in 'High Temperature Corrosion' NACE-6 p604-614 (1984).23. Luthra K. L and LeBlanc 0. H., Mater, Sci. & Eng. 88 (1987), 329-335.24. Luthra K. L., J. Electrochem Soc. 132, 1293-8 (1985).25. Lehnert G. and Meinhardt H., Surf. Treatment 1, 72, (1972).26. Levin S. R., and Caves R. M., J. Electrochem. Soc. 120, C232 (1973).27. Pint B. A., Materials Science Forum, 251-254, 397 (1997).28. Czech N., Schmitz F. and Stamm W., Surf. Coat. Technol. 68-69, 17-21 (1994).29. Nicholls J. R., Simms N. J., Chan W. Y. and Evans H., E., Surf Coat. Technol. 149, 236
(2002).30. Peichl L. and Bettridge D. F., in "Materials for Advanced Power Engineering 1994", pt 1,
p717-740 (1994).31. Bacos M. P., Girard B., Josso P. and Rio C. "MCrAIY Coating by an Electrochemical
Route" in "Materials for Advanced Power Engineering 2002", [Eds. J. Lecomte-Beckers,M. Carton, f. Schubert and P. Ennos] publisher Forschungzentrum, Julich, Germany, part1. p429-437 (2002).
32. Chan K. S., Cheruvu N. S, Leverant G.R. and Viswanathan R., in 'Materials Lifetime:Science and Engineering (Ed. P. K. Liaw et al) TMS, San Diego, CA, USA (2003).
33. Viswanathan R. In ,Damage Mechanisms and Life Assessment Techniques for HighTemperature Components, ASM, Metals Park, OH (1987).
34. Bianco R. And Rapp R. A., J. Electrochem. Soc. 140, 1181-1191 (1993).35. Bianco R., Haprer M. A. And Rapp R. A., JoM, 43, 68-73 (1991).36. Stringer J. and Viswanathan R., 'Gas Turbine Hot-Section Materials and Coatings in
Electric Utility Applications' pp1-21 in Proceedings of ASM 1993 Materials CongressMaterials Week '93, Pittsburgh, Pennsylvannia, October 17-21, Materials, Park Ohio;ASM International 1993.
37. Felten E. J. and Pettit F. S. , Oxid. Met. 10, 189-223 (1976).38. Fountain J. G, Golightly F. A., Stott F. S. and Wood G. C., Oxid.Met. 10, 341-345 (1976).39. I. M. Allam, H. C. Akuezlte and D. P.Whittle, Oxid. Met. 14, 517-530 (1980).40. Pint B. A., Oxid. Met. 48, 303-333, (1997).41. Y. Zhang, J. Haynes, W. Y. Lee, I. G. Wright, B. A. Pint, K. M. Cooley and P. K. Laiw,
Met. Mater. Tran. A. 32A, 1727-(2001).42. E. C. Dickey, B. A. Pint, K. B. Alexander and I. G. Wright, in High Temperature Surface
Engineering [ed. J. R. Nicholls, and D. S. Rickerby] p115-128, IoM Communications,London, (2000).
43. B. A. Pint, I. G. Wright, W. Y. Lee, Y. Zhang, K. Prüssner and K. B. Alexander, Mat. Sci.Eng. A245, 201-211 (1998).
44. R. Streiff and D. Boone, J. Mater. Eng. 10, 15- (1988).45. G. H. Meier and F. S. Pettit, Surf. Coat Technol. 39/40, 1- (1989).46. J. Angenete and K. Stiller, Mater. High Temp 17, 179, (2000).47. J. Angenete and K. Stiller, Surf. Coat. Technol. 150, 107 (2002).48. V. K. Tolpygo, D. R. Clarke and K. Murphy, Met. Mater. Trans 32A, 1467- (2001).49. Pint B. A, More K. L. and Wright I. G., Materials at High Temperature (2002).50. Bennett I. J. and Sloof W. G., Materials at High Temperature (2002).51. Schumann E., Yang J. C., Graham M. J., and Ruhle M. , Mater. Corrosion, 47, 631-632
(1996).52. Pint B. A., Garrett-Reed A. J., and Hobbs L. W., Microscopy of Oxidation, Vol. 2, 463-
475 (1993).53. Pint B. A., Wright I. G., Lee W. Y., Zhang Y., Prussner K. and Alexander K. B.. Mat. Sci.
Eng A245, 201-, 1998.54. Naveos S., Oberlaender G., Cadoret, Y., Josso. P., and Bacos M-P, Les Embiez (2004).55. Haynes J. A., Pint B. A., More K. L., Zhang Y., and Wright I. G., Oxid. Met. 58, 513-544
(2002).
56. Haynes J. A., Pint B. A., More, K. A., Zhang Y. and Wright I. G., Oxid. Met. 58, 513-(2002).
57. Nicholls J. R., Wing R., "Advanced Coating Systems for Utility Gas Turbines" in"Materials for Advanced Power Engineering 2002, "[Ed. J. Lecomte-Beckers, M. Carton,F. Schubert and P. J. Ennis], publishers Forschungzcentrum Julich, Germany, Part 1P57-71 (2002).
58. Amperiawan G., PhD Thesis, Cranfield University, (2002).59. McMordie B. G. and Weatherill A. in "Turbine Forum", Nice, France (2002).60. Sermaloy 1515, U. S. Patent 5,547,70061. Mom, A.J. A., NLR Report MP 81003U, Amsterdam. 1981.62. Novak R. C. (1994), `Coatings for High Temperature Structural Materials' NMAB, NRC,
National Academy Press, Washington DC (1996).63. Prater J. T., Patten J. W., Hayes D. D. and Moss R. W, im Proc. 2 nd Conf. on 'Advanced
materials for alternate fuels capable heat engines', (eds J. W. Firbanks and J. Stringer),Report No. 2639SR, 7/29-7/43; Palo Alto, CA EPRI (1981).
64. Goebel J. A., Giggins C S., Krasij M. and Stringer J, in Proc. 2 nd Conf. on 'Advancedmaterials for alternate fuel capable heat engines', (ed. J. W. Firbanks and J. Stringer),Report No. 2639SR, 7/1; Palto Alto, CA EPRI (1981).
65. Forster J., Cameron B. P. and Carews J. A., Trans. Inst. Metal Finish, 63 (1985) 115.66. Bornstein N. S. and Smeggil J., in `Corrosion of Metals Processed by Directed Energy
Beams', Met. Soc. AIME, p147-158 (1982).67. Coupland D. R., Hall C. W. and McGill I. R. Platinum Metal Review 26 (4) 146-157
(1982).68. Wolff I. M., Iorio L. E., Rumpt T., Scheers P. V. T., Potgieter J. H., Mater. Sci. Eng.
A241, 264-276 (1998).69. Juarez F., Monceau D., Tetard D., Pieraggi B. and Vahlas C., Surf Coating. Technol.
163, 44-49 (2003).70. Czech N. and Stamm W. in "High Temperature Surface Engineering" [Eds. J. R. Nicholls
and D. S. Rickerby] p61-65, IoM Communications, London (2000).71. Taylor T. A., Overs M. P., Gill B. J., and Tucker R. C., J. Vac. Sci. Tech. 3 (1985), 2526.72. Herman H., "Powders for Thermal Spray Technology" Thermal Spray Technology.
Powder Science and Technology 9: 187-199 1991.73. Kaufol R. W., Rotolico A. J., Nerz J. and Kushner B. A., "Deposition of Coatings Using a
New High Velocity Combustion Spray Gun", pp561-569 in Thermal Spray Research andApplications, T. F. Bernecki ed. Materials Park, Ohio: ASM International 1990.
74. Russo L. and Dorfman M. "High-Temperature Oxidation of MCrA1Y Coatings Producedby HVOF. Pp1179-1194 in Proceedings of the International Thermal Spray Conference,A. Ohmori, ed. Japan: High Temperature Society of Japan.
75. Lugscheider E., Herbst C. and Zhao L in "High Temperature Surface Engineering" [Ed. J.R. Nicholls and D. S. Rickerby] p67-76 IoM Communications, London (2000).
76. Kedward E. C., Metallurgia, 79, (1969) 225.77. Honey F. J., Kedward E. C. and Wride V., J. Vac. Sci. Tech., A4, 2593-(1986)78. Foster J., Turbine Forum", Nice, France, April 2002.79. Bacos M-P., Girard B., Josso P. And Rio C., Surface and Coatings Technology 162,
248-260, (2003).
80. Bacos M-P andJosso P. US Patent No. 868267 (2001).81. Restall J.E. and Hayman C, in `Coatings for heat engines' (Workshop Proc.,) (ed. R. L.
Clarke et al.) 347-357; Washington, DC, US Department of Energy (1984).82. Chan K. S., Cheruvu N. S. and Leverant G. R., Materials Science Forum,Vol, 369-372,
623-630 (2001)83. Warnes B. M., Surf. Coat. Technol. 163-164, 106-111 (2003)84. Swadzba L., Saunders S. R. J., Hetmanczyk M. and Mendala B. in "Materials for
Advanced Power Engineering" (2002), Forschungszentrum Julich, Germany, (2002)85. Steiger M. J., Yanar N. M., Topping M. G., Pettit F. S. and Meier G. H., Z. Metallkund
90, 1069-1078 (1999).86. Yanar, N. M., Kim G. M., Pettit F. S., and Meier G. H., in 'Turbine Forum', Nice, France
(2002)87. Rickerby D. S. and Wing R. G. "Thermal Barrier Coating for a Superalloy and a Method
of Application Thereof' US Patent 5,942,337 Aug (1999).88. Rickerby D. S, Bell S. R. and Wing R. G., "Article Including Thermal Barrier Coated
Superalloy Substrates", U. S. Patent 5,981,901 Nov (1999).89. Saunders S. R. J. and Nicholls J. R., Thin Solid Films 119, 247- (1984).90. Bezencon, C, Konter M., Wagniere J-D and Kurz W. "Microstructural Development in
Laser Cladding of a Single Crystal Nickel Based Alloy", in Proc. of Lasers inManufacturing, German Scientific Laser Society, June 2001, Munich, Germany, p580-589 (2001).
91. Bezemcon, C., Wagniere J-D, Hobel M., Schrell A., Konter M., and Kurz W, "SingleCrystal Coating of a Single Crystal Turbine Blades by a Laser Cladding Technique" in"Materials for Advanced Power Engineering 2002", [Eds. J. Lecomte-Beckers, M.Carton, F. Schubert and P. Ennis], publisher Forschungszentrum Julich, GermanyPart 1, p503-510 (2002).
92. Muller G., and Strauss D. "Improvement of MCrA1Y Properties by Pulsed ElectronBeams", in "Turbine Forum", Nice, France, April 2002.
93. Bossman H-P, 'Development and Optimisation of High Temperature Turbine Coatings inTurbine Forum, Nice, France, April 2006.
94. Czech N., Schmitz F. and Stamm W., Surf. Coat. Technol. 94-95, 41-45 (1997).95. Chez N., Schmitz F. and Stamm W., Surf. Coat. Technol. 76-75, 28-33 (1995).96. Dallio J. A. and Doone D. H., Proc. ASME Conf. on 'Gas Turbine and Aero-engineering',
Orlando F1, USA, June 1997, paper 97-GT-486.97. Restall J. E. and Hayman C., in Proc. Workshop for Heat Engines, [Ed. R. L. Clarke et all
p347-357, Washington DC, US DoE (1984)98. Nicholls J. R., Stephenson D. J., Hancock P., Wood M. I. and Restall J. E. in Proc.
Workshop on Gas Turbine Materials in Marine Environment, Bath UK Ministry ofDefence, Session 2, paper 7 (Nov. 1984).
99. Evans A. G., Mumm D. R., Hutchinson J. W., Meier G. H., and Pettit F. S., Progress inMaterials Science, 46, 505, (2001).
100. Bouhanek K., Adesanya 0 A., Stott F. H., Skeldon P., Lees D. G., and Wood G. C,Materials Science Forum Vol 369-372, 615-622 (2001).
101. Adesanya 0. A., Bouhanek K., Stott F. H., Skeldon P., Lees D. G. and Wood G. C.,Materials Science Forum Vol. 369-372, 639-646 (2001).
102. Nicholls J. R., Simms N. J., Neseyif S., Evans H. E., Ponton C. and Taylor M, J.Electrochem Soc. 99-38, 305-316 (2002).
103. Nicholls J. R., Simms N. J., Taylor M. and Evans H. E., 'Smart Overlay Coatings'"Turbine Forum", Nice, France, April 2002.
104. Young S. G. and Zellars G. R., Thin Solid Films 53, 241-250 (1987).
105. Nicholls J. R., Lawson k. J., Chester G., Yasiri L. H., Hancock P., in 'EuropeanResearch on Materials Substitution (eds. I. V. Mitchell and H. Nosbuch), p295-307,Elsevier, London (1988).
106. Nartia T., Thosen K. Z., Fengqun L., Murakami H., Gleeson B. and Young D., Surf.Coating Technol. (2004).
107. Nicholls J.R., Lawson K. J., Al-Yasiri L. H. and Hancock P. Corr. Sci. 35, (1993), 1209.108. Liebert C. H. et al. "Durability of Zirconia Thermal Barrier Coatings on Air Cooled
Turbine Blades in Cyclic Jet Engine Operation," report TMX-3410, NASA (1976).109. Grisaffe S. J., "Thermal Barrier Coatings" report TMX-78848, NASA, (1978).110. Miller R. A., "Current Status of TBCs - An Overview", Surface Coat. Technol. 30, 1,
(1987).111. Strangman T. E., Thin Solid Films, 127, 93-95 (1985).112. Meier S. M. and Gupta D. K., J. Eng. Gas Turbine and Power 116, 250, (1994).113. Soechting F. 0., "A Design Perspective on Thermal Barrier Coatings", Thermal Barrier
Coating Workshop, NASA-CP-3312 p3, NASA (1995).114. Bose S., and Demasi-Marcin J., Thermal Barrier Coating Experience in Gas Turbine
Engines at Pratt and Whitney, pp63-'7'7, in Thermal Barrier Coatings Workshop, NASA-CP-3312. Cleveland, Ohio, National Aeronautics and Space Administration LewisResearch Centre 1995.
115. AGARD Report 823, "Thermal Barrier Coatings" (1998).116. Gleeson B., J. Propulsion and Power 22, 375-382 (2006).117. Meier S. M., and Gupta D. K., Transactions of the ASME 116, 250- (1994).118. Shillington E. A. G and Clarke D. R., Acta Materialia 47 (4), 1297- (1999).119. Barber B., Jordon E., Gell N. and Geary A., J. Thermal Spray 8(1), 79-, (1999).120. Morrell P. and Rickerby D. S., ibid 20-1, (1998).121. Subranmanian R. and Burns A., 'Turbine forum, 2004' Nice, France, (April 2004).122. Cheruvu N. S. and Chan K. S., `Combustion Turbine Hot Section Coating Life
Management', EPRI Report, 1011593, Electric Power Research Institute, Palo. Alto, CA,USA (2005).
123. Herzog R., Steinbrech R. W., Singheiser L.,Turbine Forum 2006 Nice, France (April2006).
124. Stiger M. J., Yanar N. M., Pettit F. S. and Meier G. H., in 'Elevated TemperatureCoatings : Science and Technology' [Eds. J. M. Hamkin and N. B. Dahotri] TMS,Warrendale, PA, USA pp51- (1999).
125. Padture N. P., Gell M. and Jordon E. H., Science 296 280- (2002).126. Peters M., Leyens C., Schutz U. And Kaysser W., Advanced Engineering Materials 3 (4),
193- (2001).127. Clarke D. R., and Levi C. G., `Annual Review of Materials Research 33, 383- (2003).128. Akaa J., Sfar K. and Munz D., Acta Materialia 53, 4399-(2005).129. Sridharan S., Xie L., Jordon E. J., Gell M. and Murphy K. S., Material Science and
Engineering A, A393, 51- (2005).130. Spitsburg I. T., Mumm D. R. and Evans A. G., Material Science and Engineering A,
A394, 176-(2005).131. Schlichteng K. W., Padture N. P., Jordon E. H. and Gell M., Material Science and
Engineering A, A342, 120- (2003).132. Rabiei A. and Evans A. G., Acta Materialia 48, 3963 (2000).133. Xu T., He M. Y., Evans A. G., Acta Materialia 51 3807- (2003).134. Shilling E. A. G. and Clarke D. R., Acta Mater. 47, 1297-1305 (1999).135. Wright P. K. and Evans A. G., Current Opinions Sol. State and Mater. Sci. 4, 255 (1999).136. Mumm D. R. and Evans A. G., Acta. Mater. 48, 1815-1827, (2000).
137. Tolpygo V. K., Clarke D. R. and Murphy K. S., Surf. Coat. Technol. 146-147 124,(2001).
138. Chang G. C., Phuchaeron W., Miller R. A., Surf. Coat. Technol. 32, 307 (1987).139. Meier S. M., Nissley D. M., and Sheffler K. D., "Thermal Barrier Coating Life Prediction
Model Development, Phase II, report CR-18911, NASA, (1991).140. Pint B. A., Garratt-Reed A. J. and Hobbs L. W., Mater. High Temp. 13, 3 (1995).141. Smialek J. L., Met. Trans. A22, 739, (1991).142. Evans H. E. Strawbridge A, Carolan R. A. and Ponton C. B., Mater. Sic. Eng., 1997,
A225, 1143. Atkinson A., Selcuk A. and Webb S. J., Oxid. Met. 54, 371, (2000).144. Brindley W. J., "Workshop an Thermal Barrier Coatings", Report CP-3312, NASA
Cleveland, p189, (1995).145. Freborg A. M., Ferguson B. L., Brindley W. J. and Petrus G. J., in "Thermal Barrier
Coatings", AGARD report 823, 17-1, (1998).146. Miller R. A., Garlick R. G. and Smialek J. L., Am. Ceram. Soc. Bull, 62, 1355, (1983).147. Lelait L : cited in Alperine S., Derrien M., Jaslier Y., and Mevrel R. in "Thermal Barrier
Coatings" AGARD Report 823.148. Maloney M. J., US Patent No. 6,007,880 Dec. 1999.149. Maloney M. J., US Patent No. 6,057,047 May 2002.150. Levi C. G., Current Opinion in Solid State and Material Science, 8, 77-91 (2004.151. Zhu D. and Miller R. A., Ceram. Eng. Sci. 23, 457-468 (2002).152. Zhu D., Chen Y. L. And Miller R. A., Ceram. Eng. Sci. 24, 525-534 (2003).153. Nicholls J. R., Lawson K. J. Rickerby D.S and Morrell P. in "Thermal Barrier Coatings",
AGARD Report, 823; 6-1, (1998).154. Nicholls J. R., Lawson K. J., Johnstone A. and Rickerby D. S., Mater. Sci. Forum, 369,
595 (2001).155. Nicholls J. R., Lawson K. J., Johnstone A. and Rickerby D. S, Surf. Coat. Technol. 151-
152 383 (2002).156. Tamarin Y. A., Kachanov E. B. and Zherzdev S. V, Mater. Sci. Forum 251, 949 (1997).
APS-TBCS FOR GAS TURBINES: FAILURE MODES, DAMAGEEVOLUTION AND LIFE-TIME ASSESSMENT
Roland Herzog, Piotr Bednarz, Olena Trunova, Rolf W. Steinbrech, Egbert Wessel,Willem J. Quadakkers, Florian Schubert, Lorenz Singheiser
Research Center Jülich, Institute of Energy Research, 1EF-2, 52425 Jülich, Germany
Abstract
Ceramic thermal barrier coatings (TBCs) for hot-section components of advanced gas turbines are exposed tocomplex thermo-mechanical loads, which may lead to failure in form of macroscopic spallations from the metal-lic component. The durability of TBCs is limited by the interaction of different processes and parameters, suchas bond coat oxidation, sintering of the ceramic top coat, cyclic strains, phase transformations, visco-plastic andrelaxation properties, fracture toughness, interface roughness and others. The effect of loading conditions on theactivation of different crack propagation paths will be addressed using results from isothermal and cyclic oxida-tion tests as well as thermal cycle tests. lt will be further shown that macroscopic spallation failure of plasma-sprayed TBCs is the final step of a continuous damage evolution and accumulation, which starts before 5% oflife-time and is strongly related to bond coat oxidation. Furthermore, a life-time prediction model approach forplasma-sprayed TBCs will be presented, which comprises loading and material parameters such as thermalstrain mismatch, oxidation kinetics, interface roughness and slow crack growth. The approach has been devel-oped particularly for cyclic oxidation loading on the basis of experimentally observed crack growth kinetics.
Keywords: Thermal Barrier Coatings, Failure Modes, Damage Evolution
1. Introduction
The development of highly efficient gas turbines in the last two decades was essentially dueto optimized construction, advanced cooling techniques and complex material composites.Highly loaded turbine blades of the first stages do not longer consist of a single metallic al-loy, but rather of a material composite that has to fulfil several talks. The load carrying bodyis frequently manufactured from high temperature resistant nickel-base alloys with optimizedstrength and fatigue properties. Chemical composition as well as a tailored microstructureachieved by advanced single-crystal casting technology guarantees the high-level mechanicalproperties. Metallic coatings with high aluminium and chromium contents protect the bladesagainst high temperature corrosion and oxidation. Ceramic thermal barrier coatings on top ofthe highly loaded, internally cooled blades provide thermal insulation and prevent overheat-ing in order to extend their life-time. With increasing operating temperature of advanced gasturbines, spallation failure of thermal barrier coatings becomes more and more important,since the loss of the thermal barrier causes exposure of the metallic blade material to hotgases. Thus, the understanding of spallation failure and underlying damage mechanisms aswell as the development of life prediction concepts is a key issue for further TBC develop-ment and a prerequisite for the full integration of TBCs into component design. Over the pasttwo decades a considerable amount of insight into damage mechanisms and factors control-ling the life-time has been achieved [e.g. 1,2,3,4,5,6,7,8,9,10,11]. The present paper addressesvarious failure modes with respect to the activated crack propagation path and their relationto the load profile, the evolution of damage from crack formation at early stages of exposureto macroscopic spallation and a basic concept for calculating the life-time of APS TBCs.
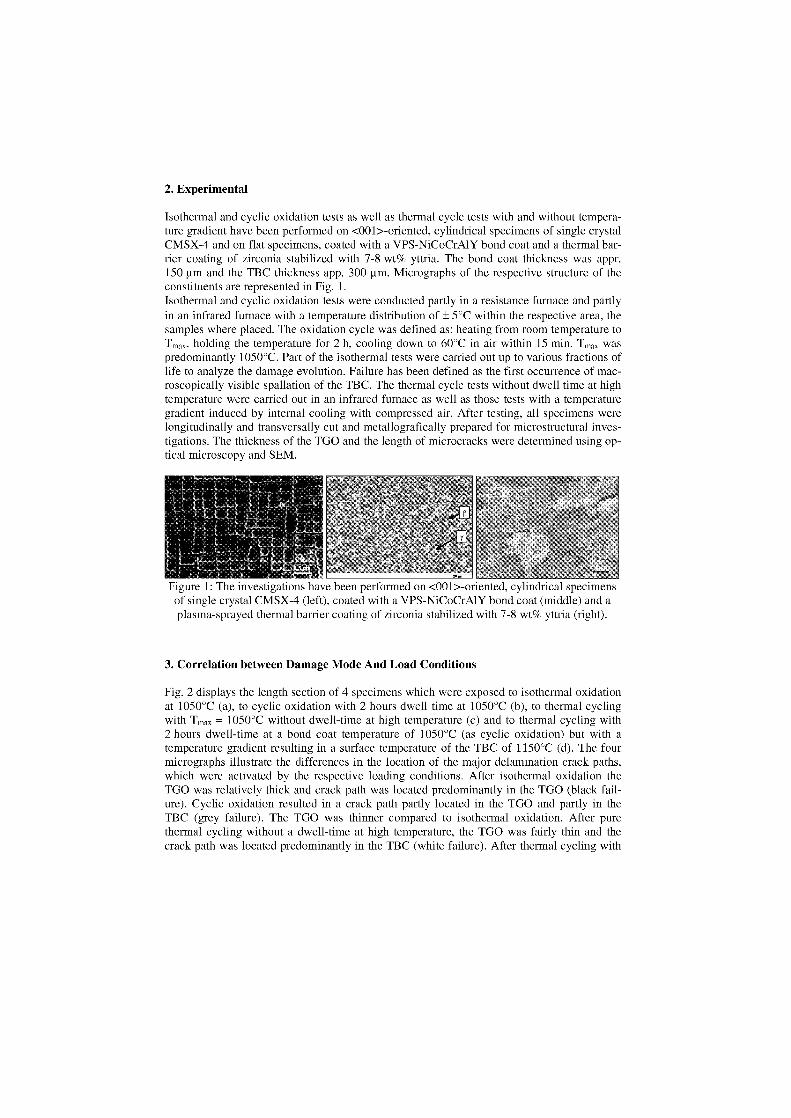
2. Experimental
Isothermal and cyclic oxidation tests as well as thermal cycle tests with and without tempera-ture gradient have been performed on <001>-oriented, cylindrical specimens of single crystalCMSX-4 and on flat specimens, coated with a VPS-NiCoCrA1Y bond coat and a thermal bar-rier coating of zirconia stabilized with 7-8 wt% yttria. The bond coat thickness was appr.150 µm and the TBC thickness app. 300 gm. Micrographs of the respective structure of theconstituents are represented in Fig. 1.lsothermal and cyclic oxidation tests were conducted partly in a resistance furnace and partlyin an infrared furnace with a temperature distribution of ± 5°C within the respective area, thesamples where placed. The oxidation cycle was defined as: heating from room temperature toT,„a„, holding the temperature for 2 h, cooling down to 60°C in air within 15 min. T rna„ waspredominantly 1050°C. Part of the isothermal tests were carried out up to various fractions oflife to analyze the damage evolution. Failure has been defined as the first occurrence of mac-roscopically visible spallation of the TBC. The thermal cycle tests without dwell time at hightemperature were carried out in an infrared furnace as well as those tests with a temperaturegradient induced by internal cooling with compressed air. After testing, all specimens werelongitudinally and transversally cut and metallografically prepared for microstructural inves-tigations. The thickness of the TGO and the length of microcracks were determined using op-tical microscopy and SEM.
Figure 1: The investigations have been performed on <001>-oriented, cylindrical specimensof single crystal CMSX-4 (left), coated with a VPS-NiCoCrAlY bond coat (middle) and aplasma-sprayed thermal barrier coating of zirconia stabilized with 7-8 wt% yttria (right).
3. Correlation between Damage Mode And Load Conditions
Fig. 2 displays the length section of 4 specimens which were exposed to isothermal oxidationat 1050°C (a), to cyclic oxidation with 2 hours dwell-time at 1050°C (b), to thermal cyclingwith Tmax = 1050°C without dwell-time at high temperature (c) and to thermal cycling with2 hours dwell-time at a bond coat temperature of 1050°C (as cyclic oxidation) but with atemperature gradient resulting in a surface temperature of the TBC of 1150°C (d). The fourmicrographs illustrate the differences in the location of the major delamination crack paths,which were activated by the respective loading conditions. After isothermal oxidation theTGO was relatively thick and crack path was located predominantly in the TGO (black fail-ure). Cyclic oxidation resulted in a crack path partly located in the TGO and partly in theTBC (grey failure). The TGO was thinner compared to isothermal oxidation. After purethermal cycling without a dwell-time at high temperature, the TGO was fairly thin and thecrack path was located predominantly in the TBC (white failure). After thermal cycling with
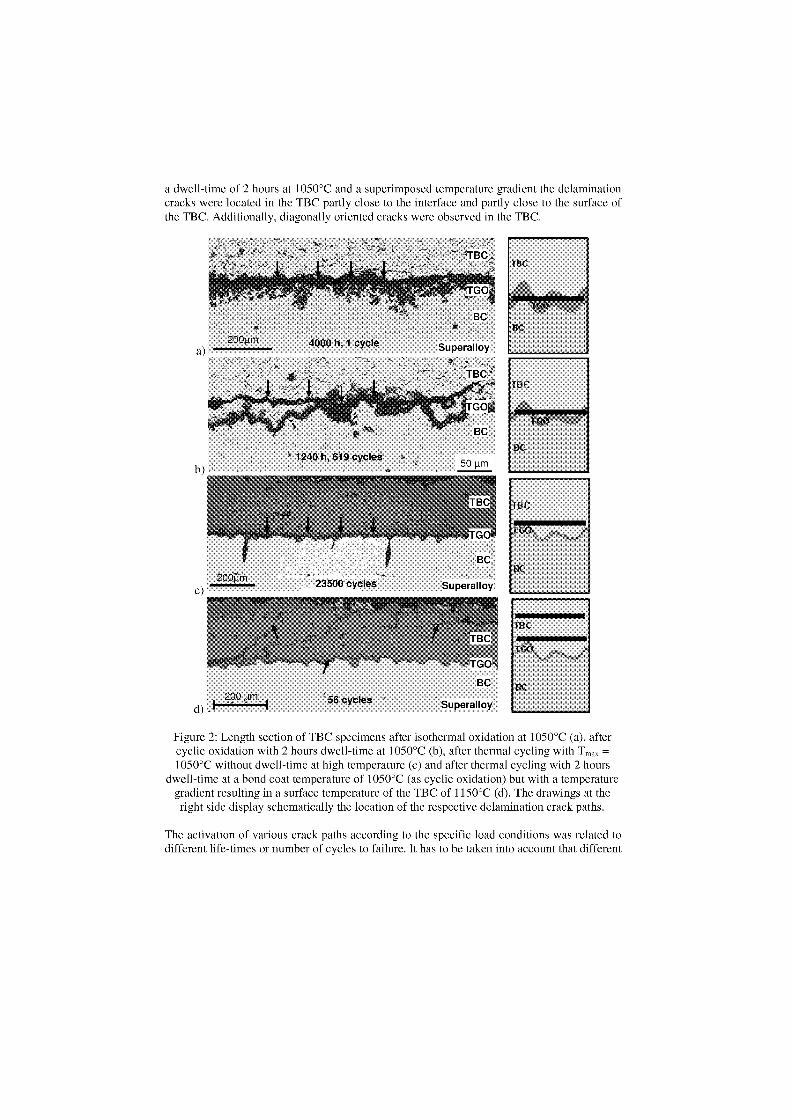
a dwell-time of 2 hours at 1050°C and a superimposed temperature gradient the delaminationcracks were located in the TBC partly dose to the interface and partly dose to the surface ofthe TBC. Additionally, diagonally oriented cracks were observed in the TBC.
Figure 2: Length section of TBC specimens after isothermal oxidation at 1050°C (a), aftercyclic oxidation with 2 hours dwell-time at 1050°C (b), after thermal cycling with Tma. =1050°C without dwell-time at high temperature (c) and after thermal cycling with 2 hours
dwell-time at a bond coat temperature of 1050°C (as cyclic oxidation) but with a temperaturegradient resulting in a surface temperature of the TBC of 1150°C (d). The drawings at theright side display schematically the location of the respective delamination crack paths.
The activation of various crack paths according to the specific load conditions was related todifferent life-times or number of cycles to failure. lt has to be taken into account that different
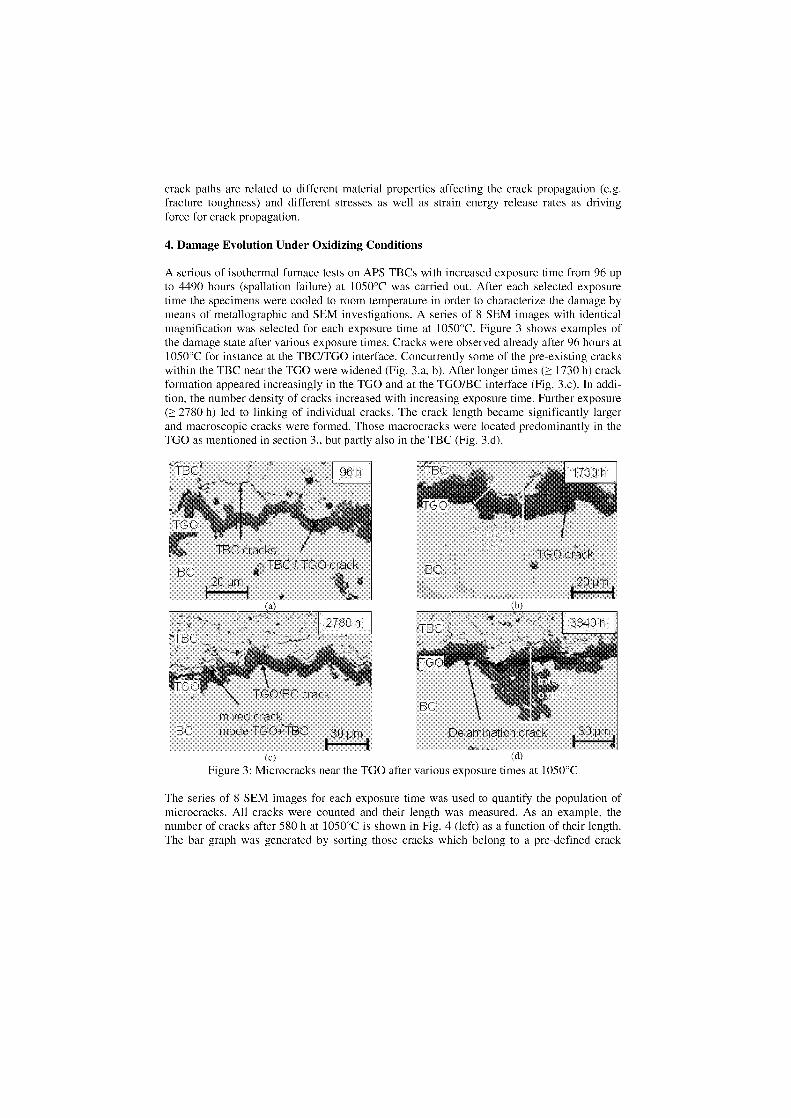
mixed crackBC mode TGO+YBC 30 pm1-1
crack paths are related to different material properties affecting the crack propagation (e.g.fracture toughness) and different stresses as well as strain energy release rates as drivingforce for crack propagation.
4. Damage Evolution Under Oxidizing Conditions
A serious of isothermal furnace tests an APS TBCs with increased exposure time from 96 upto 4490 hours (spallation failure) at 1050°C was carried out. After each selected exposuretime the specimens were cooled to room temperature in order to characterize the damage bymeans of metallographic and SEM investigations. A series of 8 SEM images with identicalmagnification was selected for each exposure time at 1050°C. Figure 3 shows examples ofthe damage state after various exposure times. Cracks were observed already after 96 hours at1050°C for instance at the TBC/TGO interface. Concurrently some of the pre-existing crackswithin the TBC near the TGO were widened (Fig. 3.a, b). After longer times (> 1730 h) crackformation appeared increasingly in the TGO and at the TGO/BC interface (Fig. 3.c). In addi-tion, the number density of cracks increased with increasing exposure time. Further exposure(> 2780 h) led to linking of individual cracks. The crack length became significantly largerand macroscopic cracks were formed. Those macrocracks were located predominantly in theTGO as mentioned in section 3., but partly also in the TBC (Fig. 3.d).
(c)
(d)
Figure 3: Microcracks near the TGO after various exposure times at 1050°C
The series of 8 SEM images for each exposure time was used to quantify the population ofmicrocracks. All cracks were counted and their length was measured. As an example, thenumber of cracks after 580 h at 1050°C is shown in Fig. 4 (left) as a function of their length.The bar graph was generated by sorting those cracks which belong to a pre-defined crack
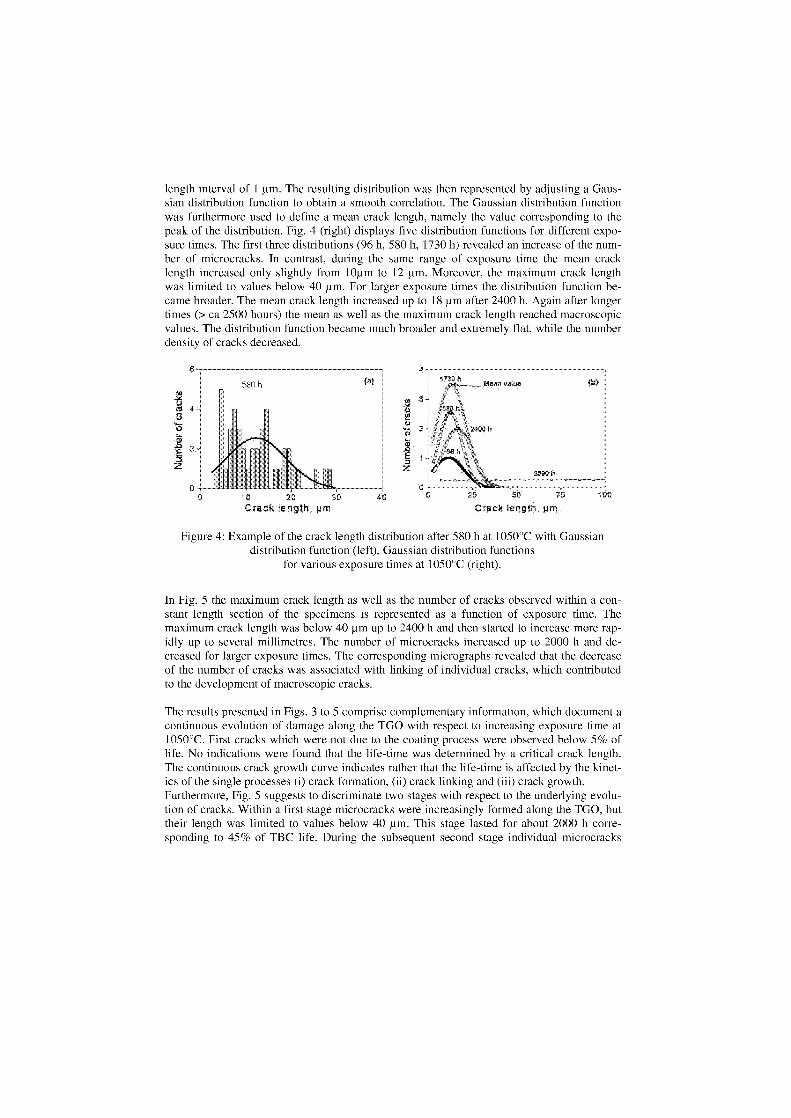
length interval of 1 pm. The resulting distribution was then represented by adjusting a Gaus-sian distribution function to obtain a smooth correlation. The Gaussian distribution functionwas furthermore used to define a mean crack length, namely the value corresponding to thepeak of the distribution. Fig. 4 (right) displays five distribution functions for different expo-sure times. The first three distributions (96 h, 580 h, 1730 h) revealed an increase of the num-ber of microcracks. In contrast, during the same range of exposure time the mean cracklength increased only slightly from 101am to 12 pm. Moreover, the maximum crack lengthwas limited to values below 40 p.m. For larger exposure times the distribution function be-came broader. The mean crack length increased up to 18 pm after 2400 h. Again after longertimes (> ca 2500 hours) the mean as well as the maximum crack length reached macroscopicvalues. The distribution function became much broader and extremely flat, while the numberdensity of cracks decreased.
Figure 4: Example of the crack length distribution after 580 h at 1050°C with Gaussiandistribution function (left), Gaussian distribution functions
for various exposure times at 1050°C (right).
In Fig. 5 the maximum crack length as well as the number of cracks observed within a con-stant length section of the specimens is represented as a function of exposure time. Themaximum crack length was below 40 gm up to 2400 h and then started to increase more rap-idly up to several millimetres. The number of microcracks increased up to 2000 h and de-creased for larger exposure times. The corresponding micrographs revealed that the decreaseof the number of cracks was associated with linking of individual cracks, which contributedto the development of macroscopic cracks.
The results presented in Figs. 3 to 5 comprise complementary information, which document acontinuous evolution of damage along the TGO with respect to increasing exposure time at1050°C. First cracks which were not due to the coating process were observed below 5% oflife. No indications were found that the life-time was determined by a critical crack length.The continuous crack growth curve indicates rather that the life-time is affected by the kinet-ics of the single processes (i) crack formation, (ii) crack linking and (iii) crack growth.Furthermore, Fig. 5 suggests to discriminate two stages with respect to the underlying evolu-tion of cracks. Within a first stage microcracks were increasingly formed along the TGO, buttheir length was limited to values below 40 grn. This stage lasted for about 2000 h corre-sponding to 45% of TBC life. During the subsequent second stage individual microcracks
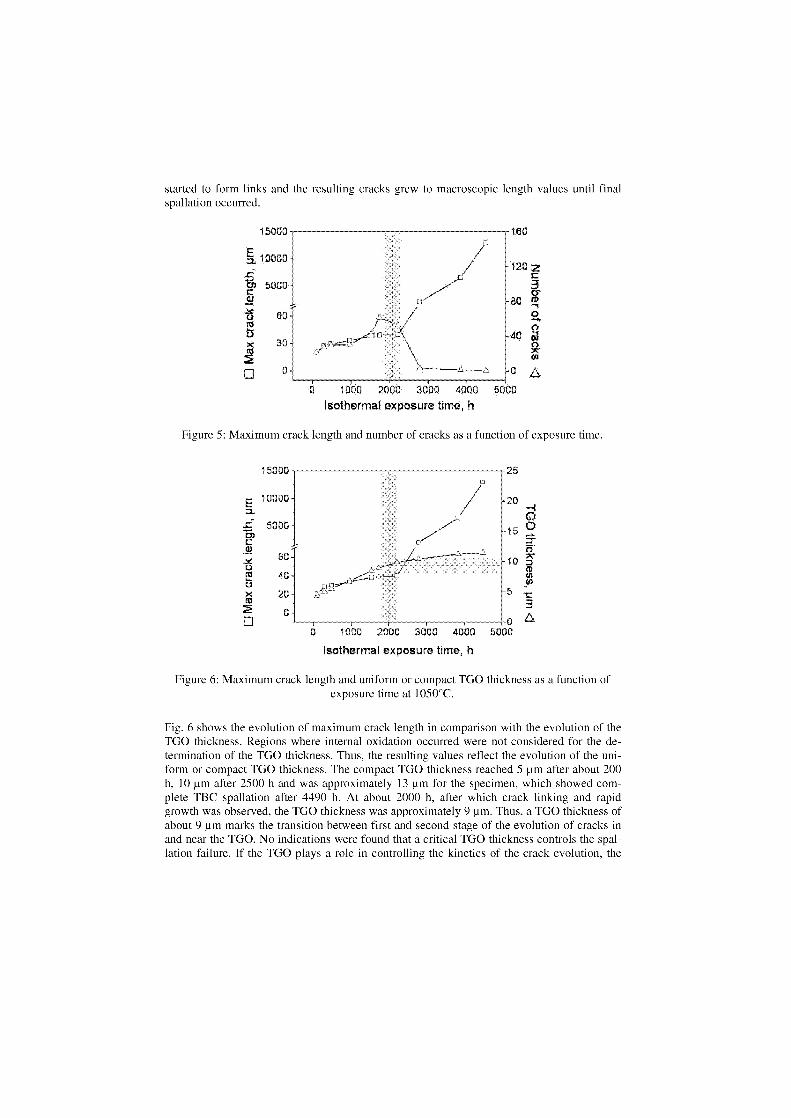
started to form links and the resulting cracks grew to macroscopic length values until finalspallation occurred.
15000
a, 10000-Cen* 5000-c
60
312q
160
1'20 z
380
0
40 0
A0 1000 2000 3000 t1000 5000
I othermal exposure time, h
Figure 5: Maximum crack length and number of cracks as a function of exposure time.
E
15000 25
10000-
-7
-20
a)5000 - 15 0
3C 60-
40 --10
tD
.9)
tu2
20 -
0-3
0 1000 2000 3000 4000 5000
Isothermal exposure firne, h
Figure 6: Maximum crack length and uniform or compact TGO thickness as a function ofexposure time at 1050°C.
Fig. 6 Shows the evolution of maximum crack length in comparison with the evolution of theTGO thickness. Regions where internal oxidation occurred were not considered for the de-termination of the TGO thickness. Thus, the resulting values reflect the evolution of the uni-form or compact TGO thickness. The compact TGO thickness reached 5 pm after about 200h, 10 gin after 2500 h and was approximately 13 gin for the specimen, which showed com-plete TBC spallation after 4490 h. At about 2000 h, after which crack linking and rapidgrowth was observed, the TGO thickness was approximately 9 pm. Thus, a TGO thickness ofabout 9 pirn marks the transition between first and second stage of the evolution of cracks inand near the TGO. No indications were found that a critical TGO thickness controls the spal-lation failure. lf the TGO plays a role in controlling the kinetics of the crack evolution, the
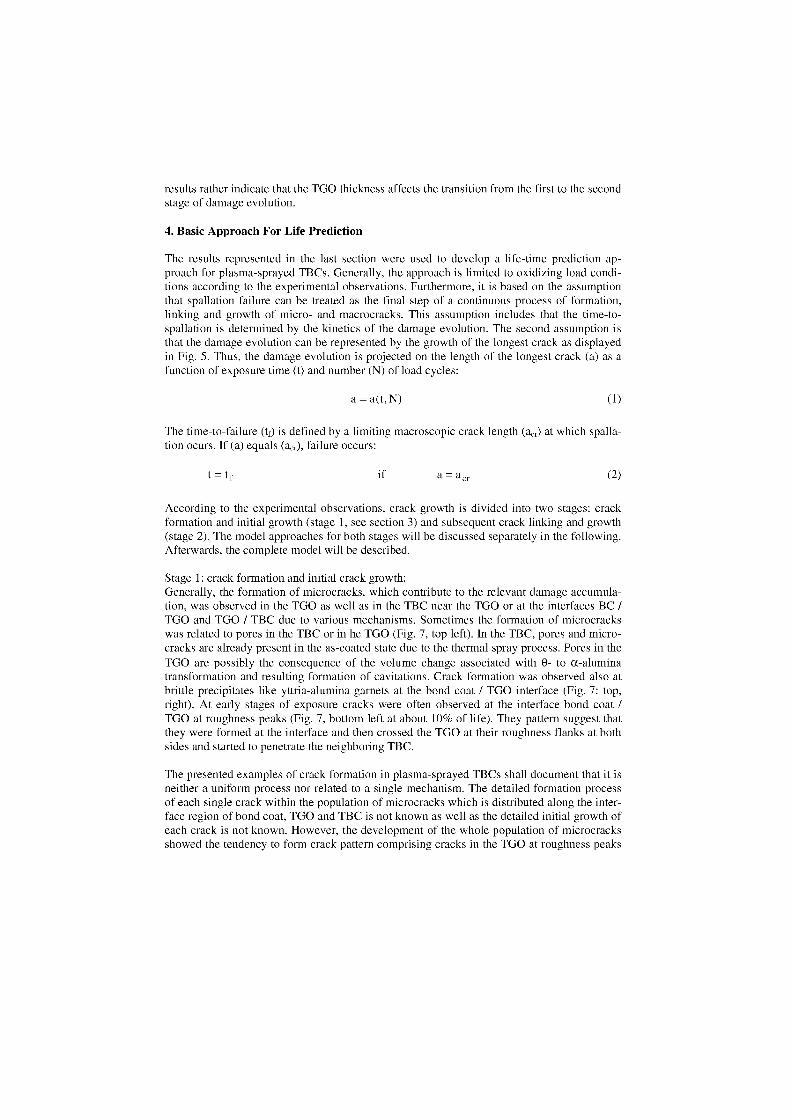
results rather indicate that the TGO thickness affects the transition from the first to the secondstage of damage evolution.
4. Basic Approach For Life Prediction
The results represented in the last section were used to develop a life-time prediction ap-proach for plasma-sprayed TBCs. Generally, the approach is limited to oxidizing load condi-tions according to the experimental observations. Furthermore, it is based on the assumptionthat spallation failure can be treated as the final step of a continuous process of formation,linking and growth of micro- and macrocracks. This assumption includes that the time-to-spallation is determined by the kinetics of the damage evolution. The second assumption isthat the damage evolution can be represented by the growth of the longest crack as displayedin Fig. 5. Thus, the damage evolution is projected on the length of the longest crack (a) as afunction of exposure time (t) and number (N) of load cycles:
a = a(t,N)
(1)
The time-to-failure (t f) is defined by a limiting macroscopic crack length (acr) at which spalla-tion ocurs. If (a) equals (a, r), failure occurs:
t = t f if a = a„ (2)
According to the experimental observations, crack growth is divided into two stages: crackformation and initial growth (stage 1, see section 3) and subsequent crack linking and growth(stage 2). The model approaches for both stages will be discussed separately in the following.Afterwards, the complete model will be described.
Stage 1: crack formation and initial crack growth:Generally, the formation of microcracks, which contribute to the relevant damage accumula-tion, was observed in the TGO as well as in the TBC near the TGO or at the interfaces BC /TGO and TGO / TBC due to various mechanisms. Sometimes the formation of microcrackswas related to pores in the TBC or in he TGO (Fig. 7, top left). In the TBC, pores and micro-cracks are already present in the as-coated state due to the thermal spray process. Pores in theTGO are possibly the consequence of the volume change associated with 0- to oc-aluminatransformation and resulting formation of cavitations. Crack formation was observed also atbrittle precipitates like yttria-alumina garnets at the bond coat / TGO interface (Fig. 7: top,right). At early stages of exposure cracks were often observed at the interface bond coat /TGO at roughness peaks (Fig. 7, bottom left at about 10% of life). They pattern suggest thatthey were formed at the interface and then crossed the TGO at their roughness flanks at bothsides and started to penetrate the neighboring TBC.
The presented examples of crack formation in plasma-sprayed TBCs shall document that it isneither a uniform process nor related to a single mechanism. The detailed formation processof each single crack within the population of microcracks which is distributed along the inter-face region of bond coat, TGO and TBC is not known as well as the detailed initial growth ofeach crack is not known. However, the development of the whole population of microcracksshowed the tendency to form crack pattern comprising cracks in the TGO at roughness peaks
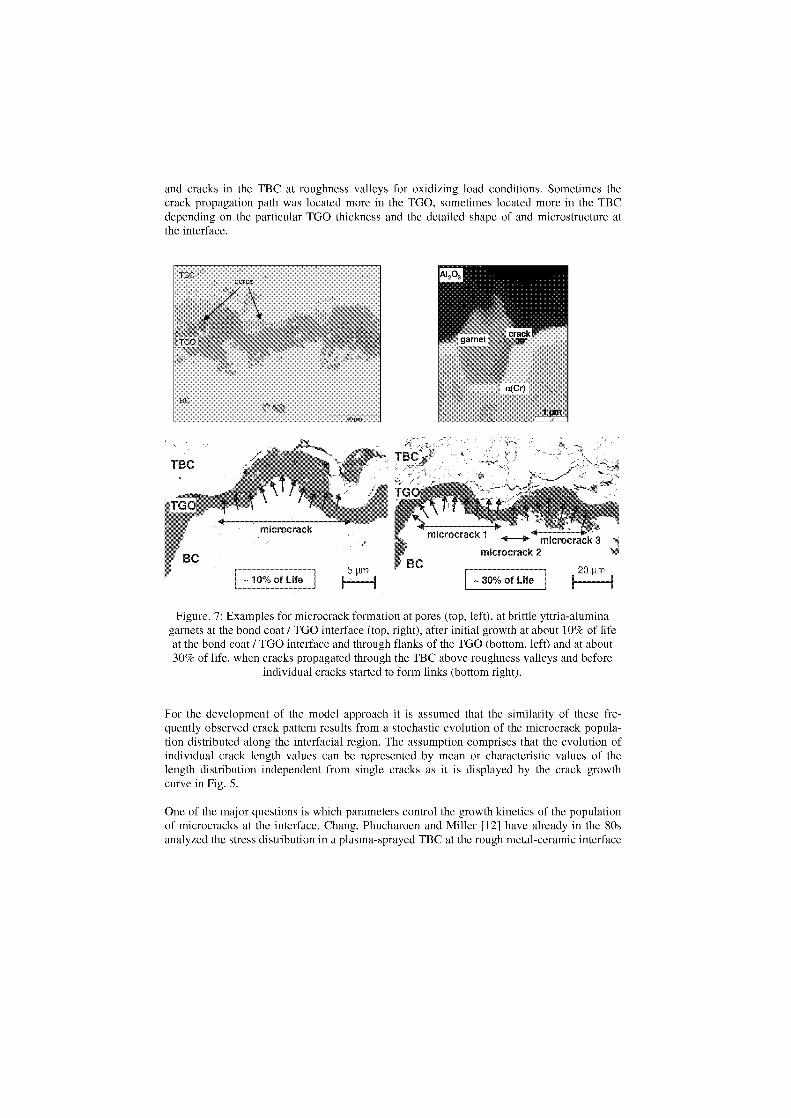
microcrack 1 •1—► microcrack 3
microcrack 2
and cracks in the TBC at roughness valleys for oxidizing load conditions. Sometimes thecrack propagation path was located more in the TGO, Sometimes located more in the TBCdepending an the particular TGO thickness and the detailed shape of and microstructure atthe interface.
Figure. 7: Examples for microcrack formation at pores (top, left), at brittle yttria-aluminagarnets at the bond coat / TGO interface (top, right), after initial growth at about 10% of lifeat the bond coat / TGO interface and through flanks of the TGO (bottom, left) and at about30% of life, when cracks propagated through the TBC above roughness valleys and before
individual cracks started to form links (bottom right).
For the development of the model approach it is assumed that the similarity of these fre-quently observed crack pattern results from a stochastic evolution of the microcrack popula-tion distributed along the interfacial region. The assumption comprises that the evolution ofindividual crack length values can be represented by mean or characteristic values of thelength distribution independent from single cracks as it is displayed by the crack growthcurve in Fig. 5.
One of the major questions is which parameters control the growth kinetics of the populationof microcracks at the interface. Chang, Phucharoen and Miller [12] have already in the 80sanalyzed the stress distribution in a plasma-sprayed TBC at the rough metal-ceramic interface
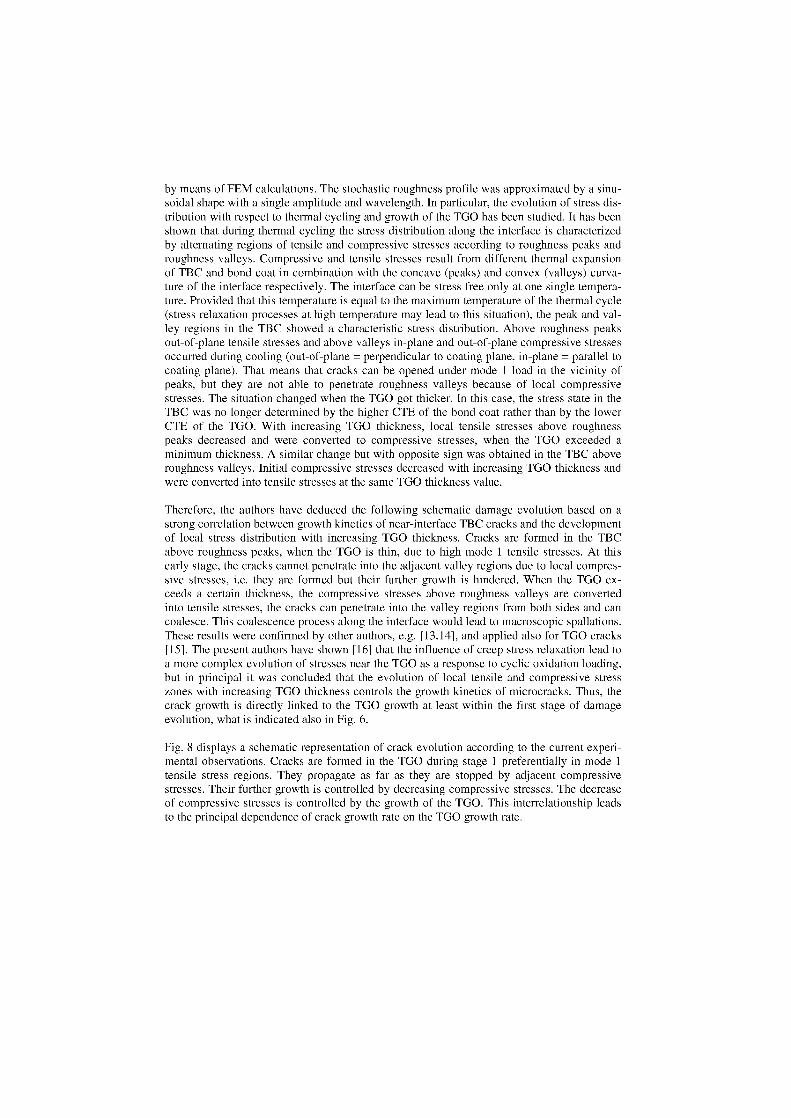
by means of FEM calculations. The stochastic roughness profile was approximated by a sinu-soidal shape with a single amplitude and wavelength. In particular, the evolution of stress dis-tribution with respect to thermal cycling and growth of the TGO has been studied. lt has beenshown that during thermal cycling the stress distribution along the interface is characterizedby alternating regions of tensile and compressive stresses according to roughness peaks androughness valleys. Compressive and tensile stresses result from different thermal expansionof TBC and bond coat in combination with the concave (peaks) and convex (valleys) curva-ture of the interface respectively. The interface can be stress free only at one single tempera-ture. Provided that this temperature is equal to the maximum temperature of the thermal cycle(stress relaxation processes at high temperature may lead to this situation), the peak and val-ley regions in the TBC showed a characteristic stress distribution. Above roughness peaksout-of-plane tensile stresses and above valleys in-plane and out-of-plane compressive stressesoccurred during cooling (out-of-plane = perpendicular to coating plane, in-plane = parallel tocoating plane). That means that cracks can be opened under mode 1 load in the vicinity ofpeaks, but they are not able to penetrate roughness valleys because of local compressivestresses. The situation changed when the TGO got thicker. In this case, the stress state in theTBC was no longer determined by the higher CTE of the bond coat rather than by the lowerCTE of the TGO. With increasing TGO thickness, local tensile stresses above roughnesspeaks decreased and were converted to compressive stresses, when the TGO exceeded aminimum thickness. A similar change but with opposite sign was obtained in the TBC aboveroughness valleys. Initial compressive stresses decreased with increasing TGO thickness andwere converted into tensile stresses at the same TGO thickness value.
Therefore, the authors have deduced the following schematic damage evolution based on astrong correlation between growth kinetics of near-interface TBC cracks and the developmentof local stress distribution with increasing TGO thickness. Cracks are formed in the TBCabove roughness peaks, when the TGO is thin, due to high mode 1 tensile stresses. At thisearly stage, the cracks cannot penetrate into the adjacent valley regions due to local compres-sive stresses, i.e. they are formed but their further growth is hindered. When the TGO ex-ceeds a certain thickness, the compressive stresses above roughness valleys are convertedinto tensile stresses, the cracks can penetrate into the valley regions from both sides and cancoalesce. This coalescence process along the interface would lead to macroscopic spallations.These results were confirmed by other authors, e.g. [13,14], and applied also for TGO cracks[15]. The present authors have shown [16] that the influence of creep stress relaxation lead toa more complex evolution of stresses near the TGO as a response to cyclic oxidation loading,but in principal it was concluded that the evolution of local tensile and compressive stresszones with increasing TGO thickness controls the growth kinetics of microcracks. Thus, thecrack growth is directly linked to the TGO growth at least within the first stage of damageevolution, what is indicated also in Fig. 6.
Fig. 8 displays a schematic representation of crack evolution according to the current experi-mental observations. Cracks are formed in the TGO during stage 1 preferentially in mode 1tensile stress regions. They propagate as far as they are stopped by adjacent compressivestresses. Their further growth is controlled by decreasing compressive stresses. The decreaseof compressive stresses is controlled by the growth of the TGO. This interrelationship leadsto the principal dependence of crack growth rate on the TGO growth rate.
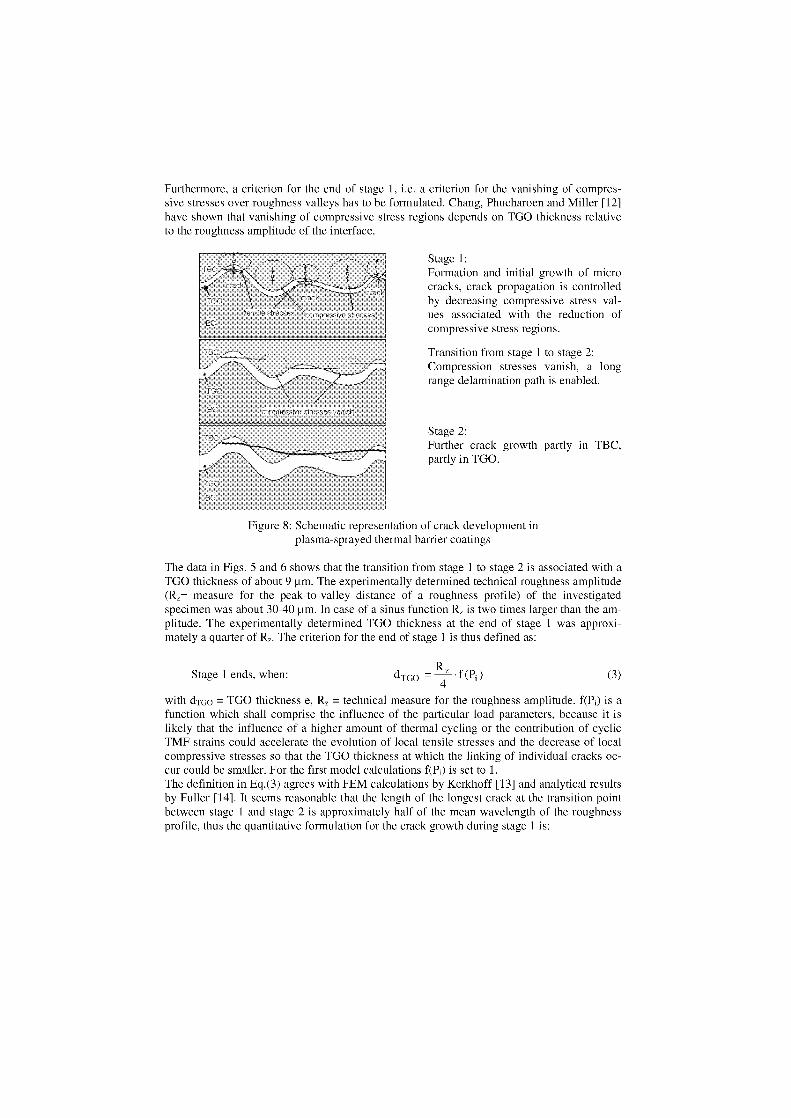
Furthermore, a criterion for the end of stage 1, i.e. a criterion for the vanishing of compres-sive stresses over roughness valleys has to be formulated. Chang, Phucharoen and Miller [12]have shown that vanishing of compressive stress regions depends an TGO thickness relativeto the roughness amplitude of the interface.
Stage 1:Formation and initial growth of microcracks, crack propagation is controlledby decreasing compressive stress val-ues associated with the reduction ofcompressive stress regions.
Transition from stage 1 to stage 2:Compression stresses vanish, a longrange delamination path is enabled.
Stage 2:Further crack growth partly in TBC,partly in TGO.
Figure 8: Schematic representation of crack development inplasma-sprayed thermal barrier coatings
The data in Figs. 5 and 6 shows that the transition from stage 1 to stage 2 is associated with aTGO thickness of about 9 um. The experimentally determined technical roughness amplitude(Rz= measure for the peak-to-valley distance of a roughness profile) of the investigatedspecimen was about 30-40 um. ln case of a Sinus function R z is two times larger than the am-plitude. The experimentally determined TGO thickness at the end of stage 1 was approxi-mately a quarter of Rz. The criterion for the end of stage 1 is thus defined as:
Stage 1 ends, when: d TG° = Rz • f (Pi ) (3)4
with &Go = TGO thickness e, Rz = technical measure for the roughness amplitude. f(P1) is afunction which shall comprise the influence of the particular load parameters, because it islikely that the influence of a higher amount of thermal cycling or the contribution of cyclicTMF strains could accelerate the evolution of local tensile stresses and the decrease of localcompressive stresses so that the TGO thickness at which the linking of individual cracks oc-cur could be smaller. For the first model calculations f(P i) is set to 1.The definition in Eq.(3) agrees with FEM calculations by Kerkhoff [13] and analytical resultsby Fuller [14]. lt seems reasonable that the length of the longest crack at the transition pointbetween stage 1 and stage 2 is approximately half of the mean wavelength of the roughnessprofile, thus the quantitative formulation for the crack growth during stage 1 is:
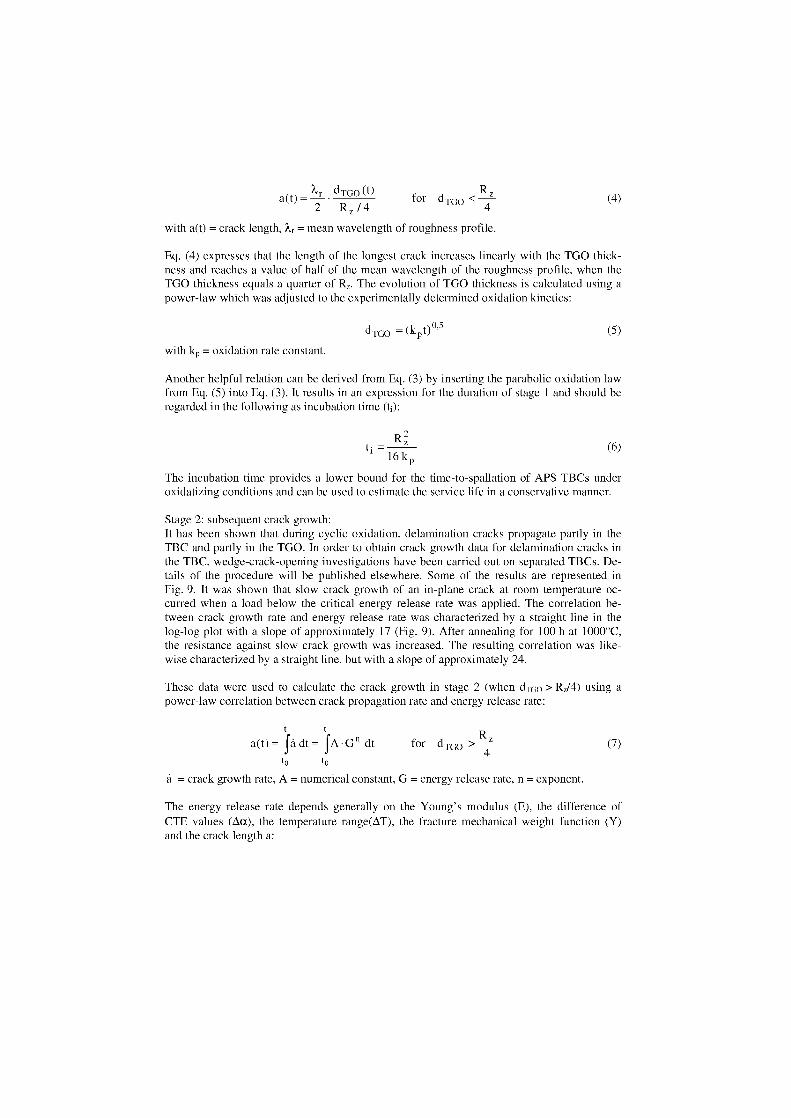
X r d TGO (I)a(t) = for dmo <
2 R z / 4 4
with a(t) = crack length, a = mean wavelength of roughness profile.
Eq. (4) expresses that the length of the longest crack increases linearly with the TGO thick-ness and reaches a value of half of the mean wavelength of the roughness profile, when theTGO thickness equals a quarter of Rz. The evolution of TGO thickness is calculated using apower-law which was adjusted to the experimentally determined oxidation kinetics:
ciTco = (kp t. )°' 5 (5)
with kp = oxidation rate constant.
Another helpful relation can be derived from Eq. (3) by inserting the parabolic oxidation lawfrom Eq. (5) into Eq. (3). lt results in an expression for the duration of stage 1 and should beregarded in the following as incubation time (ti):
R z
16 k p
The incubation time provides a lower bound for the time-to-spallation of APS TBCs underoxidatizing conditions and can be used to estimate the service life in a conservative manner.
Stage 2: subsequent crack growth:lt has been shown that during cyclic oxidation, delamination cracks propagate partly in theTBC and partly in the TGO. In order to obtain crack growth data for delamination cracks inthe TBC, wedge-crack-opening investigations have been carried out on separated TBCs. De-tails of the procedure will be published elsewhere. Some of the results are represented inFig. 9. lt was shown that slow crack growth of an in-plane crack at room temperature oc-curred when a load below the critical energy release rate was applied. The correlation be-tween crack growth rate and energy release rate was characterized by a straight line in thelog-log plot with a slope of approximately 17 (Fig. 9). After annealing for 100 h at 1000°C,the resistance against slow crack growth was increased. The resulting correlation was like-wise characterized by a straight line, but with a slope of approximately 24.
These data were used to calculate the crack growth in stage 2 (when & Go > RI4) using apower-law correlation between crack propagation rate and energy release rate:
a(t)= Sä dt = A •G n dt
for d TGo > 4 (7)
t oto
ä = crack growth rate, A = numerical constant, G = energy release rate, n = exponent.
The energy release rate depends generally on the Young's modulus (E), the difference ofCTE values (Aa), the temperature range(AT), the fracture mechanical weight function (Y)and the crack length a:
(4)
(6)
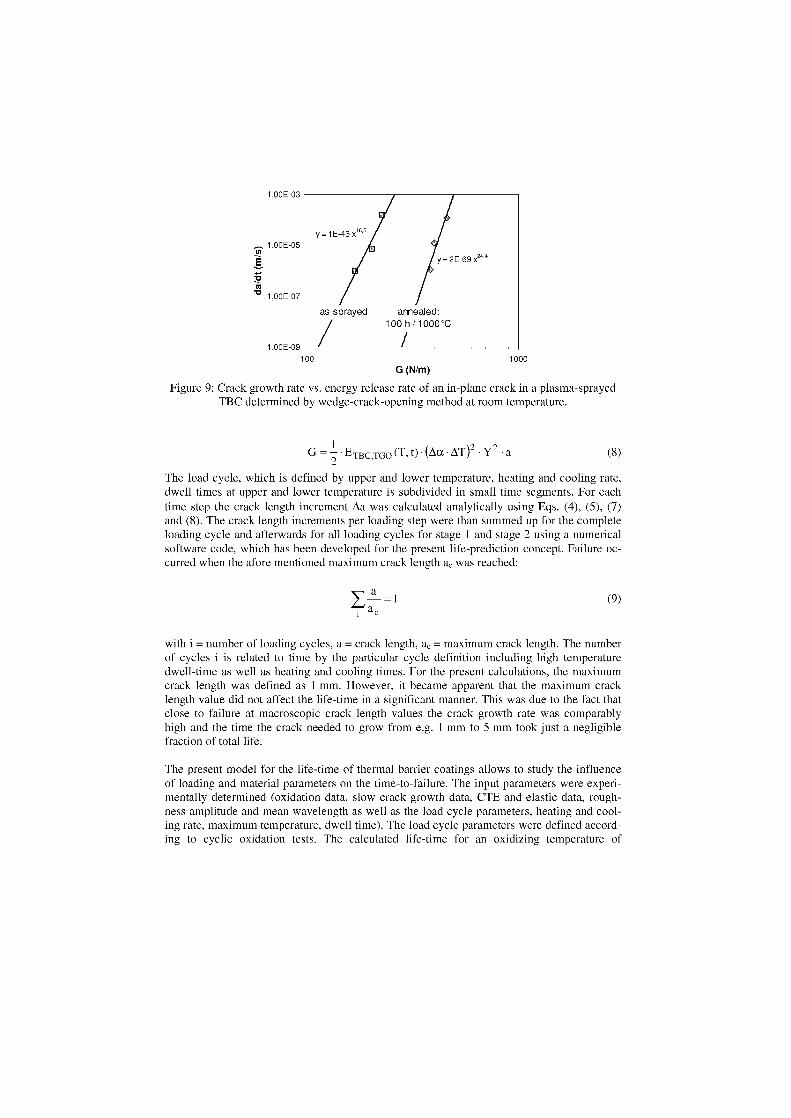
1,00E 03
1,00E 05
E
1,00E-07
1,00E-09100
1000G (N/m)
Figure 9: Crack growth rate vs. energy release rate of an in-plane crack in a plasma-sprayedTBC determined by wedge-crack-opening method at room temperature.
1G – • TBC,TGO (T, • (Aa • AT)2 • Y 2 a (8)
The load cycle, which is defined by upper and lower temperature, heating and cooling rate,dwell times at upper and lower temperature is subdivided in small time segments. For eachtime step the crack length increment Aa was calculated analytically using Eqs. (4), (5), (7)and (8). The crack length increments per loading step were than summed up for the completeloading cycle and afterwards for all loading cycles for stage 1 and stage 2 using a numericalsoftware code, which has been developed for the present life-prediction concept. Failure oc-curred when the afore mentioned maximum crack length ac was reached:
v a =(9)
ac
with i = number of loading cycles, a = crack length, = maximum crack length. The numberof cycles i is related to time by the particular cycle definition including high temperaturedwell-time as well as heating and cooling times. For the present calculations, the maximumcrack length was defined as 1 mm. However, it became apparent that the maximum cracklength value did not affect the life-time in a significant manner. This was due to the fact thatdose to failure at macroscopic crack length values the crack growth rate was comparablyhigh and the time the crack needed to grow from e.g. 1 mm to 5 mm took just a negligiblefraction of total life.
The present model for the life-time of thermal barrier coatings allows to study the influenceof loading and material parameters an the time-to-failure. The Input parameters were experi-mentally determined (oxidation data, slow crack growth data, CTE and elastic data, rough-ness amplitude and mean wavelength as well as the load cycle parameters, heating and cool-ing rate, maximum temperature, dwell time). The load cycle parameters were defined accord-ing to cyclic oxidation tests. The calculated life-time for an oxidizing temperature of
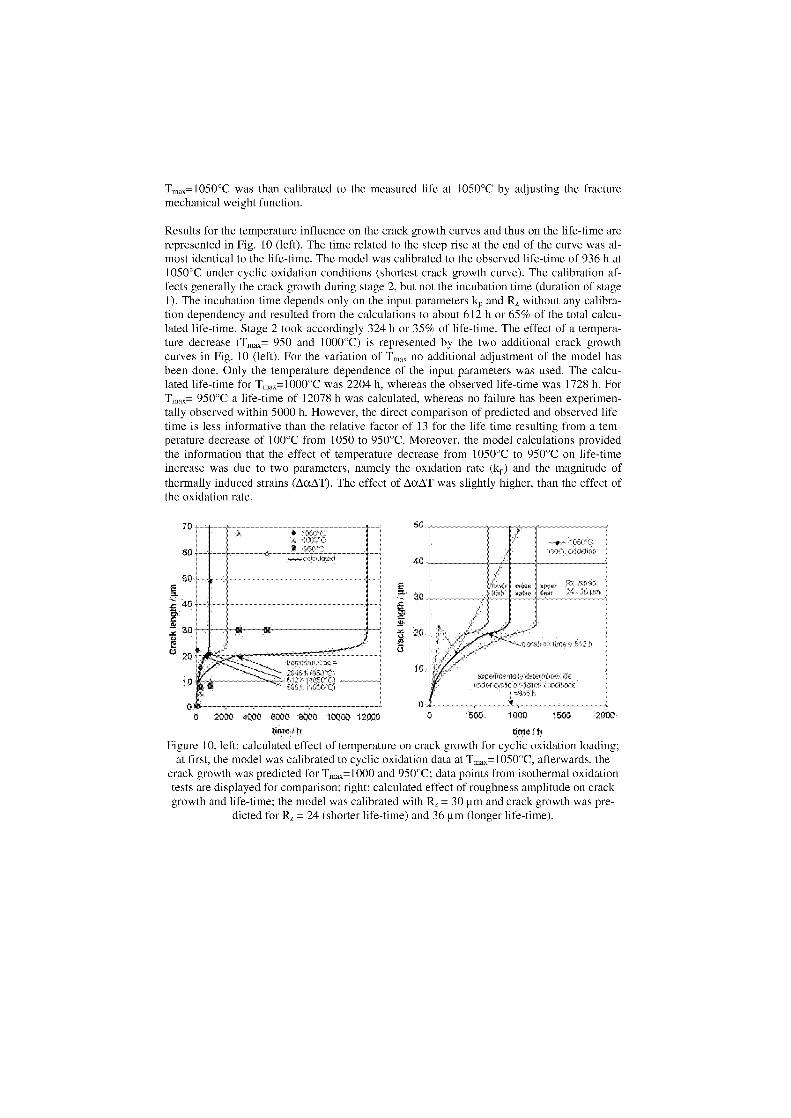
Tm,,,=1050°C was than calibrated to the measured life at 1050°C by adjusting the fracturemechanical weight function.
Results for the temperature influence on the crack growth curves and thus on the life-time arerepresented in Fig. 10 (left). The time related to the steep rise at the end of the curve was al-most identical to the life-time. The model was calibrated to the observed life-time of 936 h at1050°C under cyclic oxidation conditions (shortest crack growth curve). The calibration af-fects generally the crack growth during stage 2, but not the incubation time (duration of stage1). The incubation time depends only on the input parameters k p and Rz without any calibra-tion dependency and resulted from the calculations to about 612 h or 65% of the total calcu-lated life-time. Stage 2 took accordingly 324 h or 35% of life-time. The effect of a tempera-ture decrease (Tmax= 950 and 1000°C) is represented by the two additional crack growthcurves in Fig. 10 (left). For the Variation of T ma„ no additional adjustment of the model hasbeen done. Only the temperature dependence of the input parameters was used. The calcu-lated life-time for Tm.=1000°C was 2204 h, whereas the observed life-time was 1728 h. ForTmax= 950°C a life-time of 12078 h was calculated, whereas no failure has been experimen-tally observed within 5000 h. However, the direct comparison of predicted and observed life-time is less informative than the relative factor of 13 for the life-time resulting from a tem-perature decrease of 100°C from 1050 to 950°C. Moreover, the model calculations providedthe information that the effect of temperature decrease from 1050°C to 950°C on life-timeincrease was due to two parameters, namely the oxidation rate (4) and the magnitude ofthermally induced strains (AaAT). The effect of AocAT was slightly higher, than the effect ofthe oxidation rate.
2060 4000 6C._' 500 1 003 1 500 2000
WI-1e I I time I h
Figure 10, left: calculated effect of temperature on crack growth for cyclic oxidation loading;at first, the model was calibrated to cyclic oxidation data at Tmax=1050°C, afterwards, the
crack growth was predicted for Ta.=1000 and 950°C; data points from isothermal oxidationtests are displayed for comparison; right: calculated effect of roughness amplitude on crackgrowth and life-time; the model was calibrated with R, = 301.1m and crack growth was pre-
dicted for 12, = 24 (shorter life-time) and 36 gm (longer life-time).
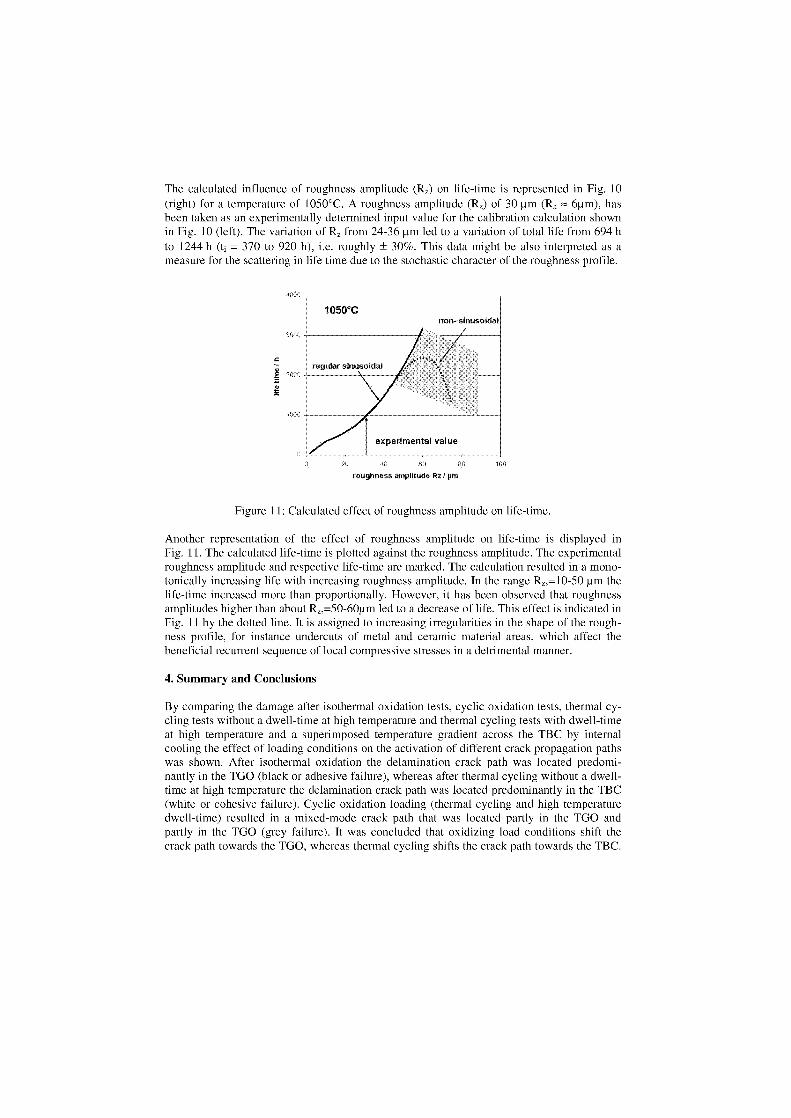
The calculated influence of roughness amplitude (R z) on life-time is represented in Fig. 10(right) for a temperature of 1050°C. A roughness amplitude (12,) of 30 um (R a 6‚.1m), hasbeen taken as an experimentally determined input value for the calibration calculation shownin Fig. 10 (left). The variation of 12, from 24-36 um led to a variation of total life from 694 hto 1244 h = 370 to 920 h), i.e. roughly ± 30%. This data might be also interpreted as ameasure for the scattering in life time due to the stochastic character of the roughness profile.
Figure 11: Calculated effect of roughness amplitude on life-time.
Another representation of the effect of roughness amplitude on life-time is displayed inFig. 11. The calculated life-time is plotted against the roughness amplitude. The experimentalroughness amplitude and respective life-time are marked. The calculation resulted in a mono-tonically increasing life with increasing roughness amplitude. In the range R z,=10-50 gm thelife-time increased more than proportionally. However, it has been observed that roughnessamplitudes higher than about 12,,=50-60pm led to a decrease of life. This effect is indicated inFig. 11 by the dotted line. lt is assigned to increasing irregularities in the shape of the rough-ness profile, for instance undercuts of metal and ceramic material areas, which affect thebeneficial recurrent sequence of local compressive stresses in a detrimental manner.
4. Summary and Conclusions
By comparing the damage after isothermal oxidation tests, cyclic oxidation tests, thermal cy-ding tests without a dwell-time at high temperature and thermal cycling tests with dwell-timeat high temperature and a superimposed temperature gradient across the TBC by internalcooling the effect of loading conditions on the activation of different crack propagation pathswas shown. After isothermal oxidation the delamination crack path was located predomi-nantly in the TGO (black or adhesive failure), whereas after thermal cycling without a dwell-time at high temperature the delamination crack path was located predominantly in the TBC(white or cohesive failure). Cyclic oxidation loading (thermal cycling and high temperaturedwell-time) resulted in a mixed-mode crack path that was located partly in the TGO andpartly in the TGO (grey failure). It was concluded that oxidizing load conditions shift thecrack path towards the TGO, whereas thermal cycling shifts the crack path towards the TBC.
Thermal cycling with dwell-time at high temperature (cyclic oxidation) plus a superimposedtemperature gradient across the TBC showed delamination cracks in the TBC dose to theTGO but also delamination cracks closer to the surface of the TBC and diagonally orientedmacroscopic cracks. By comparison with damage after cyclic oxidation it can be concludedthat a temperature gradient shifts the activated delamination crack path into the TBC.
Investigations about the damage evolution in APS TBCs using isothermal oxidation tests withincreasing exposure time at 1050°C from 100 h up to spallation failure were carried out. ltwas shown by quantitatively analyzing the population of microcracks distributed along theTGO that spallation failure of APS TBCs is the final step of a continuous evolution and ac-cumulation of damage. Generally, the microcracks showed a statistical distribution of theirlength values, which could be represented by a Gaussian number distribution over the cracklength. The sequence of distribution curves for increasing exposure times revealed a continu-ous increase of the number density of microcracks along the TGO up to a fraction of 45% oftime-to-spallation. At the same time the mean crack length increased only from 10 to 12 pmand the maximum crack length was limited to values below 40 gm. For exposure times> 45% of life-time individual cracks started to form links and the maximum crack length in-creased rapidly up to macroscopic values. A maximum crack length of 6 mm was observedfor a fraction of 90% of time-to-spallation. The observed evolution of cracks suggested thatthe life-time is governed by the kinetics of crack formation, linking of individual cracks andcrack growth. The shape of the crack growth curve revealed decelerated growth before andaccelerated growth after 45% of life. The transition point corresponded with a TGO thicknessof about 9µm. Based on these results a general discrimination of two stages for the damageevolution in APS TBCs under oxidation conditions is proposed:1. stage: Formation and initial, decelerated growth of microcracks: more and more microcracks are formed along the TGO, but their growth is restricted to values below 50 p.m. TheTGO thickness was below 9µm. This stage is regarded as incubation phase.2. stage: Crack linking and accelerated crack growth: individual microcracks started to formlinks resulting in accelerated crack growth up to the exposure time at which macroscopicspallations occurred. The TGO thickness was larger than 9 pm. Spallation occurred at a TGOthickness of about 13 pm.
Based on these results a phenomenological life prediction model was developed. lt comprisesthe calculation of crack growth for the incubation phase and the actual crack growth phase.The duration of the incubation phase (incubation time) is related to the oxidation kinetics andthe roughness parameters, the calculation of crack growth during stage 2 is based on subcriti-cal crack growth data for the ABS TBC and the calculation of a mean energy release rate asdriving force. The transitional crack length was one half of the mean wavelength of theroughness profile according to experimental data. The current model state allowed to calcu-late for example the influence of Trnax of cyclic oxidation loading, the influence of the oxida-tion rate as well as the influence of the roughness amplitude on the time-to-failure. The pre-dictions of their respective influence on life-time are based on physical data, thus the predic-tions can be validated and used for ranking.
AcknowledgmentsThe authors gratefully acknowledge the support of Priv.-Doz. Dr. R. Vaßen by manufacturingthe coatings at the Institute of Materials and Processes in Energy Systems, 1WV 1 (nowInstitute of Energy Research, lEF 1) of Research Centre Juelich.
References
[1] R.A. Miller, C.E. Lowell. Failure mechanisms of thermal barrier coatings exposed to elevatedtemperatures. Thin Solid Films 95 (1982) 265-273.[2] A. G. Evans, D. R. Mumm, J. W. Hutchinson, G. H. Meier and F. S. Pettit:Mechanisms controlling the durability of thermal barrier coatings, Progress in Material Science 46 5(2001), 505-553[3] L. Singheiser, R. Steinbrech, W.J. Quadakkers, D. Clemens, R. Herzog: Thermal BarrierCoatings — [Properties and Failure Mechanisms, Proceedings of NACE 2000, 26.-31.03.2000, Or-lando, Paper No. 231[4] R. Vaßen, G. Kerkhoff, D. Stöver: Development of a micromechanical life prediction modelfor Plasma sprayed thermal barrier coatings, Materials Science and Engineering A303 (2001) 100-109.[5] D. Renusch, H. Echsler and M. Schütze: Life Time Modeling of High Temperature CorrosionProcesses, Workshop of the European Federation of Corrosion (EFC-Event No. 248), Frankfurt amGermany, Feb. 22,23 (2001), Eds. M. Schütze, W. J. Quadakkers,J. K.Nicholls, EFC-Publication No. 34, loM Publication London (2001)[6] W.J. Quadakkers, A.K. Tyagi, D. Clemens, R. Anton, L. Singheiser: The Significance ofBond Coat Oxidation for the Life of TBC Coatings, Elevated TemperatureCoatings: Science and Technology 111, Proceedings of the TMS Annual Meeting inSan Diego, California, Feb 28 — Mar 4, 1999, 119-130[7] E.P. Busso, J. Lin, S. Sakurai: A mechanistic study of oxidation-induced degradation in aplasma-sprayed thermal barrier coating system. Part life prediction model, Acta mater. 49 (2001)1529-1536.[8] A.M. Karlsson, J.W. Hutchinson, A.G. Evans: A fundamental model of cyclic instabilities inthermal barrier systems, Journal of the Mechanics and Physics of Solids 50 (2002) 1565-1589.[9] J. Rösler, M. Bäker, K. Aufzug: A parametric study of the stress state of thermal barrier coat-ings, Part I: creep relaxation, Acta Materialia 52 (2004) 4809-4817.[10] H. Echsler, D. Renusch, M. Schütze: Bond coat oxidation and its significance for lifeexpectancy of thermal barrier coatings, Mat. Sci. Techn. 20 (2004) pp. 307-318.[11] R. Herzog, P. Bednarz, E. Trunova, V. Shemet, R.W. Steinbrech, F. Schubert, L. Singheiser:Simulation of Stress Development and Crack Formation in APS-TBCs for Cyclic Oxidation Loadingand Comparison with Experimental Observations, Proceedings of the 30th International Conferenceand Exposition on Advanced Ceramics and Composites,January 22-27, 2006, Cocoa Beach, to be published[12] G.C. Chang, W. Phucharoen, R.A. Miller: Behaviour of Thermal Barrier Coatings for Ad-vanced Gas Turbine Blades, Surface and Coatings Technology 30 (1987), 13-28[13] G. Kerkhoff: Reports of Research Centre Jülich, Jül-3784, 2000[14] E.R. Fuller, M.R. Locatelly: Fracture Mechanics Model of Damage Evolution in Air-Plasma-Sprayed Thermal Barrier Coatings, Proceedings of the 27th Annual International Conference on Ad-vanced Ceramics & Composites, January 26-31, 2003, Cocoa Beach,Florida[15] K.W. Schlichting, N.P. Padture, E.H. Jordan, M. Gell: Failure modes in plasma-sprayed ther-mal barrier coatings, Materials Science and Engineering A342 (2003) 120-130.[16] R. Herzog, P. Bednarz, E. Trunova, V. Shemet, R.W. Steinbrech, F. Schubert,L. Singheiser: Simulation of Stress Development and Crack Formation in APS-TBCs for Cyclic Oxi-dation Loading and Comparison with Experimental Observations, Proceedings of the 30th Interna-tional Conference and Exposition on Advanced Ceramics and Composites,January 22-27, 2006, Cocoa Beach
AUTHOR INDEX
A c
Abe F, 11965,111019,111041Affeldt E, 11 633Aguero A, II 949, III 1553Allcock B, III 1553Allen D J, 111 1479Andersson C, 111 1503Andren H 0, III 1267Ang J, II 655, II 691Armaki H G, 11 1157Asahi H, 11 1157Auerkari P, III 1309, III 1385
B
Baker B A, III 1609Banhart J, III 1651Barnard P M, 1 485Batfalsky P, 1 69Bauer M, III 1341Baune E, II 871Bednarz P, II 747, III 1722Bendick W, 11 1065, 11 1077Berger C, 11 1053, 11 1137BernasovskY P, 1 261Berreth K, III 1571Bhanu Sankara Rao K, 1 121Bialas M, 11 747Biede 0, III 1503Birnbaum U, I 161Blackler M, 1 485Blum L, I 69Blum R, 1 41Blum W, III 1241Bück N, II 1031, III 1207Boit H, 1 81Bordenet B, GT103Brabetz M, II 1031Brekelmans W A M, I1595Brözda J, 111 1331Brückner U, 1 317, 1 507Brziak P, I 261, II 985Burgik J, III 1449
Caminada S, II 871Cappuccini F, 11 717Casu A, 11 727Cempura G, II 773, II 1077Cerjak H, II 871, III 1191, III 1199, III1217, 111 1393Chen Q, 11 931Chilukuru H, III 1181, III 1241Cizner J, 111 1461Cui C, I 385Czyrska-Filemonowicz A, 1485, II 773,11 1077
D
Dahl K V, 11 675Daleo J A, 11 737Danielsen H K, 111 1251, 111 1275De Carlan Y, 111 1319De Maria L, I 217Dechamps P, 1 25Del Genovese D, 111 1651Del Puglia P, 11 829Dhooge A, 111 1369Dietz W, 111 1683DiGianfrancesco A, 11 843Dinkel M, 11 633Doi H, 1 355Dong J, 111 1609Donth B, II 843Du X, 11 819Dubiel B, 1 485Durham R, 111 1553Durst K, 1111181,1111241
E
Efendi, 1561El-Magd E, 11 1147Emura S, 11 767Ennis P J, III 1285, II 1077, III 1543,III 1651
11
Epishin A, I 205, 1 317, 1 475, I 507, 1 521
Faulkner R G, 11 1117,111 1299Fedelich B, 1475Feng D, 1533Folkova E, III 1401Foret R, 111 1449Fry A T, 111 1469Fudali S, 111 1427, 111 1491Fujioka J, 1 385Fukui T, 111 1589
Gabrel J, 11 1065Gajda B, 11 1087Gaude-Fugarolas D, III 1319Gebhard J, II 1147Geers M G D, II 595Giannozzi M, 11 699, 11 707, 11 717Giorni E, 11645, II 699, 11 707Giovannetti I, II 699Gohil D D, III 1533Göken M, 11633,111 111 1181, 111 1241Golanski G, 11 1087Golpayegani A, III 1267Goto N, 1561Grumsen F, III 1251Gu Y, I 385Guan H R, 1413, 11 627Guo J T, 1 189, 1393, 1403, 1435, 1447, II819Guo X G, 1403
H
Hagiwara M, II 767Haibel A, 1 521Hake J F, I 161Hakl J, 1365, 11 985, 111 1461Hald J, II 917, II 675, 111 1251, 111 1275Hansson A N, III 1663Hanus R, II 855Harada H, 1 287, 1 309, 1 327, I 347, 1 385,1495, 11655, 11 691Harvey B, III 1479Hashizume R, I 273
Hattori M, 1561Heinemann J, 111 1597Heinz P, II 633Heimrich A, II 931, III 1597Henderson M B, 111 1553Henry J F, 11 893Hernas A, III 1357, III 1427, III 1491Herzog R, II 747, III 1722Hierro M P, 111 1523Höfinger S, 11 1031Holdsworth S R, 1 91, 111 1309Holdway P, II 793Holmström S, III 1309, III 1385Holzer I, 111 1191Homkrajai W, 1 377Hou J S, I 393, I 435, I 447Hu Z Q, I 189, I 413, I1627Husemann R U, 111 1597Hussain K, 11 737Huysmans S, 111 1369
Igarashi M, II 1095Imai H, II 655, II 757Imazato T, 11 997Imosa M, 111 1491Innocenti M, II 645Iseda A, II 1095
J
Jandovä D, III 1401Jensen S A, 111 1503Jin T, 11 627Jochum C, II 871, III 1341, III 1369
K
Kager F, 11 1031Kakehi K, 1299Kan T, 11 1095Kanta V, III 1401Kasl J, III 1401Kauffmann F, 111 1171Kawagishi K, 11 655, 11 691Kern T -U, II 843, II 855Kilgallon P J, III 1513Kimura K, 11 1019, 11 1105,111 1227
F
G
111
Kindratschuk V, 111 1619Kitashima T, 1 495Kiyono T, I 273Klenk A, III 1341, III 1597Klingelhöffer H, 1 317Kloc L, 11 1011, 11 1127Knoedler R, III 1581Kobayashi T, I 287, I 309, I 327, I 347,1 495Koizumi Y, 1 309, 1 327Komai N, 11 997Kondo Y, I 455, 1 465Kong S, I 549, I 555Kothleitner G, 111 1217Koyabu H, 1 299Koyama T, I 561Kozeschnik E, II 619, III 1191Kuboü Z, 111 1437Kucharova K, 11 1127Kudrman J, 11 1127Kunecke G, 1 475Kupczyk J, II 1087Kurita K, 1465Kuroda S, 1 541, 11 757Kushima H, II 1019, II 1105, III 1227
Lamm M, 1 335Lanese N, II 829Lapin J, II 803Lardon J M, 1111319Larsen 0 H, 111 1503, 1 245Lee J S, 1I1157Lefebvre B, 11 1065Li G, II 819Li J, I 549, I 555Li W, 1 549, 1 555Li Y L, 1 393, 1 435Li Z J, 1435Link T, 1205, I317, I 507, 1 521Linssen J, 1 161Liu J D, II 627Lomozik M, III 1417Lou L H, I 583Lucas K, II 793Lüdenbach G, 111 1597Luesebrink 0, 1 335Lupine V, II 607Lyutovich A, III 1571
M
Mack D E, 11 727Maier H, 1 81Maile K, III 1171,1111341,1111571,III 1597Makhele-Lekala L Z, 111 1651Maldini M, 11 607Mao Y, II 767Marchant G, 1 571Marchionni M, I 423Mareeek J, 11 803Maresca P, 11 645Maruyama K, II 1157Masset P, II 783Masuyama F, 1 175Mathieu P, 1 143Matsumoto K, II 691Matsuo H, II 1095Matsuo T, 1 455, 1 465Mayer K H, 11 843, 11 855, 11 1053,1111171Mayr P, III 1393McColvin G, I 571Menzler N H, 1 69Meyr P, 11 871Minami Y, III 1589Mitsche S, III 1199Miura N, 1 455, 1 465Montagnon J, 111 1319Montgomery M, 1 245, 111 1503, 111 1663Morinaga M, 1 273, 1 561Moskal G, III 1357Mukherji D, III 1619Mülders B, 111 1639Müller M, 11 665Murakami H, I 541, II 757Muraki T, II 1157Murakumo T, 1 287Murata Y, I 273, I 561
Nazmy M, 1205Nicholls J R, III 1696Nieto J, 111 1523Nisaratanaporn E, 1 377Norton B, III 1553
L
N
IV
0
Oakey J, I 233, III 1513Ohata H, 1347Onofrio G, 1423Osgerby S, I 217, III 1469, III 1533Osinkolu G A, 1 423Ott M, 11 633Over H H, III 1683
Pasternak J, II 871, III 1331, III 1357, III1427, III 1491Patel S J, 111 1609Pein C, II 619Pelachovä T, II 803Penkalla H J, II 773, III 1629Wrez F J, 111 1523Ping D, 1 385, 1 495Pirön Abellän J, III 1285Polsilapa S, 1 377Portella P, I 317Pratesi F, II 645, II 699, II 707, II 717Pyczak F, 11 633
Qin X Z, 1435, 1447Quadakkers W J, 111 1285, 111 1543, 1111722
Raj B, 1121Rajek J, 111 1191Rechberger W, III 1217Rinaldi C, I 217Ro Y, 1 347Rohr V, III 1543Roos E, 111 1341Rösler J, 111 1619Ruoff H, III 1171
Sato A, I 287, 1 385, 11 655, 11 691Sawada K, 11 1105, 111 1227Scarlin B, II 931Scheefer M, III 1553Scheu C, 111 1171Scholz A, 11 1053, II 1137Schubert F, 11 773, 111 1629, III 1639, III1651, III 1722Schütze M, 11 783, 111 1543Schwienheer M, 11 1137Seibert T, 111 1181Semba H, II 1041Shao C, 1549, I 555Shibata M, 1 541Shingledecker J P, 1 107, 11 893Simms N J, III 1513Singer R F, II 633,1 335Singheiser L, 111 1285, 111 1629, 111 1722Sklenicka V, 11 1011, 11 1127Smith G D, 111 1609Sonderegger B, 111 1199, 111 1217Sopougek J, III 1449Spindler M W, III 1673Spiradek-Hahn K, 11 1031Stachura S, II 1087Stamatelopoulos G, 11 931Stanko G, 11 893Staubli M, 1205, 11 843, 11 855Steinbrech R, 1 69, 111 1722Stöver D, 11 727Strang A, I 571,111 1251Straub S, III 1171, III 1581Stuhrmann J, 11 1147Sun C, 1 583Sun X F, I 41 3, 11 627Suzuki A, II 757Suzuki T, 1309Svoboda M, 11 1127
Tamaki H, I 355Tanaka F, 1465Tanzosh J, 11 893Tasak E, III 1417, III 1427Terzigli V, II 645Theofel H, 111 1597Tinga T, 11 595Toda Y, II 1019, II 1105Toshiharu K, II 655
P
Q
R
Sakai T, 1541Salonen J, III 1385
T

v
Tougovä D, 111 1437Traeger F, 11 727Trunova 0, III 1722Tschaffon H, 161Tsuno N, 1 299Tsipas D N, 111 1553
Vandenberghe B, 11 1065, 11 1077,1111369Vanstone R W, I 41Vaßen R, 11 727Vekeman J, 111 1369Viswanathan R, 11 893Vitalis B, II 893Vlasäk T, 1 365, 11 985Vodarek V, 111 1251, 111 1437Volek A, 1 335, 11 633Vossberg A, II 633
Wabderka N, III 1651Walbeck M, 1 161Wall G, 15Wang L, 1 583Wang Y, 11 1053Wang Y L, 1 413Wang Z H, II 627Wangyao P, 1377Weber T, II 855, 111 1543Wenglarz R, I 233Wessel E, 111 1639, 111 1722Willer D, 111 1171Wisbey A, II 793Wright I G, I 107Wu J, 1 549, 1 555Wu Y N, II 757
X
Yamaguchi A, 1 541, 11 757Yang H C, 1 403Yang J X, 1 413Yardley V, III 1319Ye H Q, 1 435, 1 447Yeh A C, 1 287Yin Y F, II 1117, III 1299Yokokawa T, 287, I 309, 327, 1 347Yoshinari A, 1 273, 1 355Yoshizawa M, 11 1095Yuan C, 1 393, 1 403, 1 447Yutaka K, II 655
Zabler S, I 521Zeller G, II 843, II 1031Zeman M, 111 1331Zhang B, 1 533Zhang J, 287, I 583Zhao G, I 533Zhao M, 1 549, 1 555Zhao N R, 11 627Zhao S, III 1609Zheng Q, 1 413Zhou L Z, 1 435Zieliäska-Lipiec A, 11 1077Zies G, III 1171Zifcak P, 11 985Zlämal B, 111 1449Zonfrillo G, 11 699, 11 707, 11 717, 11 829Zrnik J, I 377Zschau H E, II 783
W
Xie G, 1 583Xie X, III 1609Xu G, 1 533
Y

vl
VII
KEYWORD INDEX
(Nb,V) CrN particles: III.125110Cr steels: 11.84312% Cr steel: 11.1077, 111.1285,111.136912CrMoVNbN steels: 111.12513DAP: 111.16195th generation Ni-base superalloys:11.6556025HT: 11.11479% Cr steels: 111.1393, 111.15539% Cr cast steel: 11.8559% Cr martensitic steel: 11.10419-12% Cr steels: 11.917, HH 207,11.1031, 11.1065, 11.1127, 11.1137,1111181, 111.1199, 111.1241, 111.1267,111.1275, 111.1357, 111.15439-12Cr ferritic steels: 1.107Acoustic emission: 11.727Activation energy: 1.533AD700: 1.41Advanced creep laws: 111.1341Advanced power plant materials:111.1479Advanced power plants: 1.143AFM: 111.1181Allowable stress: 11.1095Alloy 617 welds: 111.1597Alloy 617: 111.1597, 111.1639Alloy composition: 1.347Alloy design: 11.917Alloy-80A: 1.91Alloys: 111.1683Alternating atmospheres: 111.1533Aluminising: 1.541, 11.757, 111.1553Analysis routines: 111.1683Analytical TEM: 11.1077Anisotropy: 1.299Application: 1.161, 11.855APS: 11.717Atom-probe field-ion microscopy:1.495Bainitic structure: 11.1087Biomass: 1.245, 111.1513Blading: 1.205Boiler tube: 111.1589
Boiler: I.41,11.931Boron alloyed: 111.1393Boron: 11.917, 11.965, 11.1031Brazing: 11.633Burgers vectors: 1.465Burner rig test: 11.727Carbides: 1.393, 1.413, 11.985Carbon and nitrogenredistribution: 111.1449Cast steel: 11.1087CDM modelling: 111.1299Ceramic matrix composites: 11.829Ceramic membranes: 1.143Chemistry modification: 111.1619Chlorination: 1.245Chromium steel: 111.1461, 111.1469CM186LC: 1.485CMSX-10: 1.507CMSX-4: 1.317, 1.507CO2 capture: 1.143CO2 emissions mitigation: 1.143CO2 : 1.25Coal: 111.1513Coarsening of laves phase: 11.1157Coatings: 1.217, 1.583, 11.707, 11.737,11.893, 11.949Co-firing: 1.245, 111.1503, 111.1513Co-free: 1.309Cohesive zone modelling: 11.747Compositional modification: 11.767Conceptual design: 11.893CoNiCrA1Y: 1.541Constitutive equation: 11.607,111.1341, 111.1651Constitutive model: 11.595, 111.1207Conventional Casting (CC): 1.355Cooling time: 111.1417Corrosion resistance: 11.893,111.1427, 111.1491Corrosion: 111.1533, 111.1683COST536: 11.843, 11.855CPFBC: 11.665Crack growth: 1.413Crack initiation: 1.403, 111.1639Crack propagation: 1.403
VIII
Crack: 1.393Cr-diffusion: 111.1663Creep behaviour 11-12% CrWCo(Cu)B(V,Ta,T) steels:11.1053Creep behaviour: 11.1127Creep damage: IH 117, 111.1299,III.1673Creep equations: 11.1137Creep failure: 1.175Creep fatigue: 11.1137Creep properties: 1.365, 11.871,11.985, 11.1065Creep rate: 11.1117Creep resistance: 11.855, HH 171Creep resistant steel: 11.1011,111.1217, 111.1449Creep resisting steels: 111.1331Creep rupture: 11.627, 11.1137Creep strain: 11.1117Creep strength: 1.273, 11.843,III.1267Creep testing: 111.1401Creep: 1.107, 1.287, 1.299, 1.317,1.455, 1.475, 1.485, 1.507, 1.521,11.607, 11.619, 11.767, 11.965, 11.1019,11.1031,11.1041, 11.1077, 11.1105,111.1309, 111.1319, 111.1369, 111.1381,111.1437, 111.1479Creep-fatigue: HH 673Creep-resistance: 111.1357Cr-steel: 111.1319Crystal growth: 11.803Crystal plasticity: 11.595CVD: 111.1571Cyclic strain: 1.403Damage parameter: 111.1341Damage: 111.1639De-cohesion: 11.747Deformation mechanism: 11.819Degradation: 1.205, 1.571D-electrons concept: 1.273Delta ferrite: II.1105, IU 393Development of FBR materials:1.121DICTRA: 11.675Diffusion coatings: 111.1543Diffusion coefficient: 1.561Diffusion: 11.619, 11.633Directional solidification: 1.335Directionally solidified (DS): 1.355
Disk application: 1.385Dislocation dynamics: 111.1207Dislocation Substructure: 1.465Distribution: 1.161Document management system:111.1683Documentation database: 111.1683Dynamic recrystallisation: 1.533EBSD: 11.633, 111.1199ECCC Data sheets: 1.91ECCC: 111.1309Ecological engineering: 1.5EFTEM: HH 217Electrochemical impedance:111.1523Electron diffraction: 111.1251Energy alternatives: 1.121Energy and natural resources: 1.5Energy supply chain: 1.161Energy: 1.25Energy-filtered TEM: 111.1267Environmental effect: 1.423Environmental sciences: 1.5Equilibrium: 11.691Esshete 1250: 111.1503European Commission: 1.25Exergy: 1.5Experience: 11.855Experimental data: 111.1683ExtreMat Integrated Project: 1.81Fatigue and creep fatigue crackgrowth: HH 629Fatigue crack propagation: 1.423Fatigue: 1.317, 1.335, 11.793Ferrite matrix: 11.1019Ferritic steel: 1.69, 11.985, 111.1299,111.1309, 111.1401Ferritic/austenitic steels: 11.949Filler metals matching to T/P 23,TIP 24, VM 12, Cost CB 2: 11.871Fireside corrosion: 111.1503,111.1513Flame thermal cycling: 11.707Flow behaviour: 1.533Flue gas desulphurisation plants:111.1427, 111.1491Fossil fuels: 1.25Free energy: 1.447Frequency-Scanning EddyCurrent: 1.217Furnace cooling: 11.1019
Ix
Gamma channel: 1.455Gamma prime: 1.205, 11.737Gamma prime precipitate: 1.435,1.447, 1.465Gamma TiAI: 11.773, 11.793Gas turbine: 1.189, 1.217, 1.423,11665, 11.737GH2984 superheater alloy: 1.189GH690 alloy tube: 1.189Glass ceramics: 1.69Grade 92 steel: 1.91, IH 157Grain boundary sliding: 11.819Growth stresses: 111.1663HI.2530: 1.571Halogen effect: 11.783Hardness: 1.571Hastelloy alloys: 111.1427HAZ-toughness: 111.1393HCM12: 11.1095Heat affected zone: 111.1417Heat exchanger materials: 111.1543Heat exchanger: 111.1513Heat resistant alloy: 1.175Heat treatment: 1.435, 11.803,11.997,1I1.1191Heterogeneous creep: 11.1095Heterogeneous weld: 111.1437High alloy steel: 111.1479High chromium ferritic steel:11.1105High efficiency power plant:111.1597High heat flux materials: 1.81High temperature corrosion: 1.245,111.1543High temperature materials: 1.189High temperature properties:11.655High temperature: 1.61, 11.645,11.707, 11.717, 11.949High-temperature application:11.843Homogenisation: 1.335Hot corrosion resistance: 1.273Hot corrosion resistantsuperalloys: I.189Hot corrosion: 11.665Hot isostatic pressing (HIP): 1.377Hot working: 1.533Hydrogen effects: 111.1663Hydrogen generation: 1.161
Impact energy: 11.1087Implantation: 11.783IN706: III.1619Inconel 617: HH 651Inconel 740: 111.1609Industrial gas turbine: 1.485Influence of multiaxiality of thestress state: HH 341In-situ observation in SEM:111.1639Interdiffusion: 11.675,1I.691Intergranular fracture: IH 157Intermetallic compound: II.1019Intermetallic: 11.773Intermittent heating: 11.1127Issues: 1.233K418 superalloy turbine: 1.549K4537 turbine: 1.555K465 cast superalloy: 1.413Laminate: 11.829Larson-Miller parameter: 1.327Laser back-Scattering: 1.217Laser cladding: 11.699Lattice misfit: 1.287, 1.309Laves phases: 111.1285LCF: 11.773Life prediction: 11.1105Life: 111.1381Lifetime extension: 1.261Lifing: 1.365Liquid erosion: 11.699Liquid metal cooling: 1.335Long term aging: 1.447Long term exposure: 1.377Long-term creep strength: 11.1105Long-term creep: 1.327, 111.1227Low activation materials: 1.81Low alloy steel: 11.997, 11.1011Low alloy steels: 111.1533Low cycle fatigue: 1.403, 1.423,11.1147Low stress creep: 11.1011LPPS: 1.541M23C6 carbide: 1.447, 11.965,11.1041MA 6000: 11.645Martensite: 111.1199, 111.1417Martensitic microstructure: 11.965Martensitic phase: 11.1019Material compatibility: 1.69
X
Material development: 11.843Materials database: 111.1683Materials properties data: 111.1683Materials: 1.41, 1.233, 11.931Mathematical models: 1.365MCrA1Y: 11.675Mechanical properties data:111.1683Mechanical properties of weldjoints: 111.1357Mechanical properties: 1.347, 1.555,11.803,1I.871, 11.893Microhardness: 1.435Micromechanics: 11.595Microporosity: 1.521Microstructural changes: 11.1127Microstructural evolution: 111.1299Microstructural parameter: 1.347Microstructural stability: 11.1041Microstructure and modelling:11.917Microstructure evolution: 111.1191Microstructure: 1.507, 1.571, 11.619,11.767, 11.803, 11.985, 11.1031,11.1077,111.1181, 111.1393, 111.1401,111.1427, 111.1437, 111.1491, 111.1619Minimum creep rate: 11.997Mismatched weld materials:111.1341Mod. Z-phase: HH 217Model: 111.1309Modelling: 1.261, I.475,11.619,111.1469Modified Z phase: 111.1251Molten salt corrosion: 111.1523Morphological evolution: 1.447Morphology instability: 1.435Multiphase nickel aluminides:11.803MX and M2X Phase: 111.1241MX carbonitride: 11.965MX precipitates: 111.1285MX: 11.1041Nanoindentation: 11.633NDE: 1.217, 1.261Neural network: 11I.1319, HH 469Ni-31Cr-3 Mo (Dy) alloy: 11.819Ni-base single crystal superalloy:1.287, 1.309, 1.347Ni-base superalloy: 1.327, 1.385,11.757
Ni-based alloy: 1.107, 1.561Ni-based superalloy: 1.273, 1.299,1.377, 1.423, 1.455, 1.465, 1.475,1.533, 1.541, 1.583Nickel alloys: 111.1491Nickel based materials: 1.61Nickel content: 11.1019Nickel-base single-crystalsuperalloy: 1.495Ni-Co-base superalloy: 1.385Ni-YSZ cermet: 1.69Non-conventional sand case: 1.549Non-destructive evaluation: 11.1157Nuclear fission: 1.81Nuclear power programme: 1.121Nuclear technology: 1.121Numerical simulation: 1.549, 1.555ODS: 11.645Omega method: 11.1117Outlet header: 111.1597Oxidation resistance: 111.1571,1.273, 1.287, 11.691, 11.949Oxidation: 1.107, 1.393, 1.413,11.645, 11.655, 11.783, 11.793, 11.997,11I.1461, 111.1479Oxide growth: 111.1469Oxide scale: 111.1581Oxyfuel: 1.143P122: 11.1095P23 steel: 111.1437P91 steel: 111.1417, 111.1437P92 steel: 11.1147Pack cementation: 111.1543Partitioning ratio: 1.309PBMR: 1.309Phase computation: 111.1609Photo-luminescencepiezospectroscopy: 1.217Plasma facing materials: 1.81Plastic properties: 111.1417PM 3030: 11.645Porosity: 111.1319Power generation: 111.1331, 111.1357Power plant: 1.61, 1.175, 111.1369,11.985PPCC: 11.665Precipitates: HH 217Precipitation analysis: 111.1171Precipitation kinetics: 111.1191Precipitation site: 111.1227
XI
Premature breakdown of creepstrength: 11.1157Primary creep: 1.299,11.1011Processing: 11.1065Protective coatings: 111.1553Pt-Ir alloy: 11.757R5: 111.1673Rafting: 1.475Recovery: 11.1019Recrystallization (RX): 1.583Regenerative heat treatment:11.1087Regression analysis: 1.347Remanent life: II.1117Research: 1.25Rhenium: 1.561Ruthenium or Iridium addition:1.495Ruthenium: 1.561SAGBO effect: 111.1629Sandwich-structures: IH 147Second generation: 1.327SEM and TEM: 111.1629SEM: 11I.1181,111.1619Short-range ordering: 1.495Shot peening: 1.583, 111.1581Shot-blasted tube: 111.1589Shroud: 11.829Si: 11.655Siliconising: 111.1571Simulation of diffraction patterns:111.1251Simulation: 111.1191, 111.1207Single crystal superalloy: 1.335Single crystal: 1.205, 1.299, 1.317,1.327, 1.455, 1.465, 1.475, 1.485,11.737Single crystalline: 11.633Single-crystal superalloy: 11.627Size distribution: 111.1217Slip system: 1.455SNMS: III.1285Solid oxide fuel cell: 1.69Spallation: 111.1581Sputtering: 11.757SRZ: 11.691Stainless steel: 111.1589Steam environment: 111.1461Steam oxidation: 1.175, 111.1285,111.1553, 111.1581, 111.1589, 111.1663
Steam power plant: 1.261, 11.931,11.949Steam side oxidation: 11.1065Steam turbine: 1.41Steam: 111.1469Steamside oxidation andresistance: 11.893Steamside oxidation: 111.1503Steel tubes: 111.1571Steel: HH 381Stellite: 11.699Storage: 1.161Strain rate: HH 651Strain: 111.1309Straw: 1.245Strength: 111.1381Stress analysis: 11.829Stress and/or strain effect: 111.1227Stress exponent: 11.1011Stress: 11.619Structural analyses: 11.773, 111.1449Structural stability: 111.1357Structure analysis: 1.377Structure degradation: 1.377Structure stability: HH 609Superalloy: 1.205, 1.317, 1.355,I.365,1.393, 1.435, 1.507, 1.521,11.595, 11.607, 11.645, 11.675, 11.699,III.1609Supercritical: 11.931Superheater tubes: 111.1597Superplasticity: 11.819Surfaces: 111.1581Sustainable development: 1.5Syngas: 1.233T/P23: 11.997T122: 11.1095TBC: 11.717TCP phase: 1.541TEM: 111.1171, 111.1181, 111.1401,111.1619Temperature estimation: 11.737Tensile test: 111.1651Testing: HH 479Thermal analysis: 11.829Thermal barriers: 11.707Thermal barrier coating: 11.727Thermal cycles: 11.717Thermal cycling: 11.727, 11.747Thermal exposure: 11.793
Thermal fatigue: 1.175, 1.393, 1.413Thermal mechanical fatigue: 1.347Thermal shock: 11.707Thermal spraying: 111.1553Thermal welding cycle: 111.1417Thermo mechanical fatigue: 1.287Thermodynamic and kineticmodelling: 111.1449Thermodynamic modelling: 11.665Thermo-physical properties data:111.1683Ti2AINb: 11.767Ti6242: 11.773TiAl: 11.783Titanium alloy: 11.767TLP Bonding: 11.627Tomography: 1.521TP347H FG: 111.1503Tungsten: 1.561Turbine: 1.233, 1.365, 11.699Type 316H: 111.1673U720Li: 1.385Ultrasupercritical: 1.107USC plant: 111.1589USC: HH 609Variable creep loading: 11.1127VM12: 11.1065, 11.1077, 111.1369VN precipitation: HH 319Wallpapering: HH 491Waspaloy: 111.1629Waste incineration: 111.1523Water quenching: 11.1019Web-enable data: 111.1683Web-services: HH 683Weld joints: HH 449Weld: HH 381Weldability: 11.855, 11.893, 111.1331Welded joints: 111.1331Welding of pipe E911: 11.871Welding: 111.1369, 111.1401Woodchip: 1.245Wrought Ni-based superalloy:1.403YH61: 1.355Z phase: 11.917, III.1171, III.1227,111.1241, 111.1267, 111.1275Zirconia: 11.717
XII
Schriften des Forschungszentrums JülichReihe Energietechnik / Energy Technology
1. Fusion TheoryProceedings of the Seventh European Fusion Theory Conferenceedited by A. Rogister (1998); X, 306 pagesISBN: 3-89336-219-3
2. Radioactive Waste Products 1997Proceedings of the 3rd International Seminar an Radioactive Waste Productsheld in Würzburg (Germany) from 23 to 26 June 1997edited by R. Odoj, J. Baier, P. Brennecke et al. (1998), XXIV, 506 pagesISBN: 3-89336-225-8
3. Energieforschung 1998Vorlesungsmanuskripte des 4. Ferienkurs „Energieforschung"vom 20. bis 26. September 1998 im Congrescentrum Rolduc undim Forschungszentrum Jülichherausgegeben von J.-Fr. Hake, W. Kuckshinrichs, K. Kugeler u. a. (1998),500 SeitenISBN: 3-89336-226-6
4. Materials for Advances Power Engineering 1998Abstracts of the 6th Liege Conferenceedited by J. Lecomte-Beckers, F. Schubert, P. J. Ennis (1998), 184 pagesISBN: 3-89336-227-4
5. Materials for Advances Power Engineering 1998Proceedings of the 6th Liege Conferenceedited by J. Lecomte-Beckers, F. Schubert, P. J. Ennis (1998),Part I XXIV, 646, X pages; Part II XXIV, 567, X pages; Part III XXIV, 623, XpagesISBN: 3-89336-228-2
6. Schule und Energie1. Seminar Energiesparen, Solarenergie, Windenergie. Jülich, 03. und04.06.1998herausgegeben von P. Mann, W. Welz, D. Brandt, B. Holz (1998), 112 SeitenISBN: 3-89336-231-2
7. EnergieforschungVorlesungsmanuskripte des 3. Ferienkurses „Energieforschung"vom 22. bis 30. September 1997 im Forschungszentrum Jülichherausgegeben von J.-Fr. Hake, W. Kuckshinrichs, K. Kugeler u. a. (1997),505 SeitenISBN: 3-89336-211-8
Schriften des Forschungszentrums JülichReihe Energietechnik / Energy Technology
8. Liberalisierung des EnergiemarktesVortragsmanuskripte des 5. Ferienkurs „Energieforschung"vom 27. September bis 1. Oktober 1999 im Congrescentrum Rolduc undim Forschungszentrum Jülichherausgegeben von J.-Fr. Hake, A. Kraft, K. Kugeler u. a. (1999), 350 SeitenISBN: 3-89336-248-7
9. Models and Criteria for Prediction of Deflagration-to-Detonation Transition(DDT) in Hydrogen-Air-Steam-Systems under Severe Accident Conditionsedited by R. Klein, W. Rehm (2000), 178 pagesISBN: 3-89336-258-4
10. High Temperature Materials ChemistryAbstracts of the 10th International IUPAC Conference, April 10 - 14 2000, Jülichedited by K. Hilpert, F. W. Froben, L. Singheiser (2000), 292 pagesISBN: 3-89336-259-2
11. Investigation of the Effectiveness of Innovative Passive Safety Systems forBoiling Water Reactorsedited by E. F. Hicken, K. Verfondern (2000), X, 287 pagesISBN: 3-89336-263-0
12. Zukunft unserer EnergieversorgungVortragsmanuskripte des 6. Ferienkurs „Energieforschung"vom 18. September bis 22. September 2000 im Congrescentrum Rolduc undim Forschungszentrum Jülichherausgegeben von J.-Fr. Hake, S. Vögele, K. Kugeler u. a. (2000),IV, 298 SeitenISBN: 3-89336-268-1
13. Implementing Agreement 026For a programme of research, development and demonstration an advances fuelcellsFuel Cell Systems for TransportationAnnex X. Final Report 1997 - 1999edited by B. Höhlein; compiled by P. Biedermann (2000), 206 pagesISBN: 3-89336-275-4
14. Vorgespannte Guß-Druckbehälter (VGD) als berstsichere Druckbehälter fürinnovative Anwendungen in der KerntechnikPrestressed Cast Iron Pressure Vessels as Burst-Proof Pressure Vessels forInnovative Nuclear Applicationsvon W. Fröhling, D. Bounin, W. Steinwarz u. a. (2000) XIII, 223 SeitenISBN: 3-89336-276-2
Schriften des Forschungszentrums JülichReihe Energietechnik / Energy Technology
15. High Temperature Materials ChemistryProceedings of the 10 th International IUPAC Conferenceheld from 10 to 14 April 2000 at the Forschungszentrum Jülich, GermanyPart I and IIedited by K. Hilpert, F. W. Froben, L. Singheiser (2000), xvi, 778, VII pagesISBN: 3-89336-259-2
16. Technische Auslegungskriterien und Kostendeterminanten von SOFC- undPEMFC-Systemen in ausgewählten Wohn- und Hotelobjektenvon S. König (2001), XII, 194 SeitenISBN: 3-89336-284-3
17. Systemvergleich: Einsatz von Brennstoffzellen in Straßenfahrzeugenvon P. Biedermann, K. U. Birnbaum, Th. Grube u. a. (2001), 185 SeitenISBN: 3-89336-285-1
18. Energie und MobilitätVorlesungsmanuskripte des 7. Ferienkurs „Energieforschung"vom 24. September bis 28. September 2001 im Congrescentrum Rolduc undim Forschungszentrum Jülichherausgegeben von J.-Fr. Hake, J. Linßen, W. Pfaffenberger u. a. (2001),205 SeitenISBN: 3-89336-291-6
19. Brennstoffzellensysteme für mobile Anwendungenvon P. Biedermann, K. U. Birnbaum, Th. Grube u. a. (2002)PDF-Datei auf CDISBN: 3-89336-310-6
20. Materials for Advances Power Engineering 2002Abstracts of the 7th Liege Conferenceedited by J. Lecomte-Beckers, M. Carton, F. Schubert, P. J. Ennis (2002),c. 200 pagesISBN: 3-89336-311-4
21. Materials for Advanced Power Engineering 2002Proceedings of the 7th Liege ConferencePart I, II and IIIedited by J. Lecomte-Beckers, M. Carton, F. Schubert, P. J. Ennis (2002),XXIV, 1814, XII pagesISBN: 3-89336-312-2
22. Erneuerbare Energien: Ein Weg zu einer Nachhaltigen Entwicklung?Vorlesungsmanuskripte des 8. Ferienkurs „Energieforschung"vom 23. bis 27. September 2002 in der Jakob-Kaiser-Stiftung, Königswinterherausgegeben von J.-Fr. Hake, R. Eich, W. Pfaffenberger u. a. (2002),IV, 230 SeitenISBN: 3-89336-313-0
Schriften des Forschungszentrums JülichReihe Energietechnik / Energy Technology
23. Einsparpotenziale bei der Energieversorgung von Wohngebäuden durchInformationstechnologienvon A. Kraft (2002), XII, 213 SeitenISBN: 3-89336-315-7
24. Energieforschung in DeutschlandAktueller Entwicklungsstand und Potentiale ausgewählter nichtnuklearerEnergietechnikenherausgegeben von M. Sachse, S. Semke u. a. (2002), II, 158 Seiten,zahlreiche farb. Abb.ISBN: 3-89336-317-3
25. Lebensdaueranalysen von Kraftwerken der deutschen Elektrizitäts-wirtschaftvon A. Nollen (2003), ca. 190 SeitenISBN: 3-89336-322-X
26. Technical Session: Fuel Cell Systems of the World Renewable EnergyCongress VIIProceedingsedited by D. Stolten and B. Emonts (2003), VI, 248 pagesISBN: 3-89336-332-7
27. Radioactive Waste Products 2002 (RADWAP 2002)Proceedingsedited by R. Odoj, J. Baier, P. Brennecke and K. Kühn (2003), VI, 420 pagesISBN: 3-89336-335-1
28. Methanol als Energieträgervon B. Höhlein, T. Grube, P. Biedermann u. a. (2003), XI, 109 SeitenISBN: 3-89336-338-6
29. Hochselektive Extraktionssysteme auf Basis der Dithiophosphinsäuren:Experimentelle und theoretische Untersuchungen zur Actinoiden(III)-Abtrennungvon S. A. H. Nabet (2004), VI, 198 SeitenISBN: 389336-351-3
30. Benchmarking-Methodik für Komponenten in Polymerelektrolyt-Brenn-stoffzellenvon Matthias Gebert (2004), 194 SeitenISBN: 3-89336-355-6
31. Katalytische und elektrochemische Eigenschaften von eisen- und kobalt-haltigen Perowskiten als Kathoden für die oxidkeramische Brennstoffzelle(SOFC)von Andreas Mai (2004), 100 SeitenISBN: 3-89336-356-4
Schriften des Forschungszentrums JülichReihe Energietechnik / Energy Technology
32. Energy Systems Analysis for Political Decision-Makingedited by J.-Fr. Hake, W. Kuckshinrichs, R. Eich (2004), 180 pagesISBN: 3-89336-365-3
33. Entwicklung neuer oxidischer Wärmedämmschichten für Anwendungen instationären und Flug-Gasturbinenvon R. Vaßen (2004), 141 SeitenISBN: 3-89336-367-X
34. Neue Verfahren zur Analyse des Verformungs- und Schädigungsverhaltensvon MCrAIY-Schichten im Wärmedämmschichtsystemvon P. Majerus (2004), 157 SeitenISBN: 3-89336-372-6
35. Einfluss der Oberflächenstrukturierung auf die optischen Eigenschaftender Dünnschichtsolarzellen auf der Basis von a-Si:H und pc-Si:Hvon N. Senoussaoui (2004), 120 SeitenISBN: 3-89336-378-5
36. Entwicklung und Untersuchung von Katalysatorelementen für innovativeWasserstoff-Rekombinatorenvon I.M. Tragsdorf (2005), 119 SeitenISBN: 3-89336-384-X
37. Bruchmechanische Untersuchungen an Werkstoffen für Dampfkraftwerkemit Frischdampftemperaturen von 500 bis 650°Cvon L. Mikulovä (2005), 149 SeitenISBN: 3-89336-391-2
38. Untersuchungen der Strukturstabilität von Ni-(Fe)-Basislegierungen fürRotorwellen in Dampfturbinen mit Arbeitstemperaturen über 700 °Cvon T. Seliga (2005), 106 SeitenISBN: 3-89336-392-0
39. IWV-3 Report 2005. Zukunft als Herausforderung(2005), 115 SeitenISBN: 3-89336-393-9
40. Integrierter Photodetektor zur Längenmessungvon E. Bunte (2005), XI, 110 SeitenISBN: 3-89336-397-1
41. Microcrystalline Silicon Films and Solar Cells Investigated byPhotoluminescence Spectroscopyby T. Merdzhanova (2005), X, 137 pagesISBN: 3-89336-401-3
Schriften des Forschungszentrums JülichReihe Energietechnik / Energy Technology
42. IWV-3 Report 2005. Future as a challenge(2005), 115 pagesISBN: 3-89336-405-6
43. Electron Spin Resonance and Transient Photocurrent Measurements anMicrocrystalline Siliconby T. Dylla (2005), X, 138 pagesISBN: 3-89336-410-2
44. Simulation und Analyse des dynamischen Verhaltens von Kraftwerken mitoxidkeramischer Brennstoffzelle (SOFC)von M. Finkenrath (2005), IV, 155 SeitenISBN: 3-89336-414-5
45. The structure of magnetic field in the TEXTOR-DEDby K.H. Finken, S.S. Abdullaev, M. Jakubowski, M. Lehnen, A. Nicolai,K.H. Spatschek (2005), 113 pagesISBN: 3-89336-418-8
46. Entwicklung und Modellierung eines Polymerelektrolyt-Brennstoffzellenstapels der 5 kW Klassevon T. Wüster (2005), 211 SeitenISBN: 3-89336-422-6
47. Die Normal-Wasserstoffelektrode als Bezugselektrode in der Direkt-Methanol-Brennstoffzellevon M. Stähler (2006), VI, 96 SeitenISBN: 3-89336-428-5
48. Stabilitäts- und Strukturmodifikationen in Katalysatordispersionen derDirektmethanolbrennstoffzellevon C. Schlumbohm (2006), II, 211 SeitenISBN: 3-89336-429-3
49. Eduktvorbereitung und Gemischbildung in Reaktionsapparaten zurautothermen Reformierung von dieselähnlichen Kraftstoffenvon Z. Por§ (2006), XX, 182, XII SeitenISBN: 3-89336-432-2
50. Spektroskopische Untersuchung der poloidalen Plasmarotation unter demEinfluß statischer und dynamischer Ergodisierung am Tokamak TEXTORvon C. Busch (2006), IV, 81 SeitenISBN: 3-89336-433-1
51. Entwicklung und Optimierung von Direktmethanol-Brennstoffzellstapelnvon M. J. Müller (2006), 167 SeitenISBN: 3-89336-434-X
Schriften des Forschungszentrums JülichReihe Energietechnik / Energy Technology
52. Untersuchung des reaktiven Sputterprozesses zur Herstellung vonaluminiumdotierten Zinkoxid-Schichten für Silizium-Dünnschichtsolarzellenvon J. Hüpkes (2006), XIV, 170 SeitenISBN: 3-89336-435-8
53. Materials for Advanced Power Engineering 2006Proceedings of the 8th Liege ConferencePart 1, II and IIIedited by J. Lecomte-Beckers, M. Carton, F. Schubert, P. J. Ennis (2006),Getr. Pag.ISBN: 3-89336-436-6

EnergietechnikEnergy Technology
Band /Volume 53, Part IIIISBN 3-89336-436-6
COST is supported by the EU framework programme
COST is an intergovernmental European frame-work for international cooperation betweennationally funded research activities. COSTcreates scientific networks and enables scientiststo collaborate in a wide spectrum of activitiesin research and technology. COST activities areadministered by the COST Office.
ESF provides and manages the scientific andtechnical secretariat for COST