Master Thesis European Union's Budget Support and the ...
63
Master Thesis European Union’s Budget Support and the conditions under which it is effective: the case of Sector Budget Support in Health sector Dissertation submitted by: Tiholaz Diana EURO2MS/G: Master 120 in European Studies Supervisor: Prof. Tom Delreux Reader : Marcel Gérard Academic year 2017-2018
-
Upload
khangminh22 -
Category
Documents
-
view
0 -
download
0
Transcript of Master Thesis European Union's Budget Support and the ...

Master Thesis
European Union’s Budget Support and the conditions under which
it is effective: the case of Sector Budget Support in Health sector
Dissertation submitted by: Tiholaz Diana
EURO2MS/G: Master 120 in European Studies
Supervisor: Prof. Tom Delreux
Reader : Marcel Gérard
Academic year 2017-2018

‘I declare on my honor that this dissertation is my own work,
completed without unauthorized external assistance, that it
has been submitted to no another institution for
assessment, and that it has never been published, either in
whole or in part. All the information (ideas, sentences,
graphs, maps, tables, etc.) taken from or referring to
primary or secondary sources are properly referenced using
the current university method.
I declare that I have taken note of and adhere to the Code of
Ethics for students with regard to borrowing, quoting from
and using various sources, and am aware that plagiarism is a
serious offence.’

‘Thank you to my wonderful family and my great friends for
all their support encouragement!’

Contents
Abbreviations 5
Introduction
6
1. The Budget Support Context 7 1.1. Defining Budget Support 7 1.2. The research question 9 1.3 Short description of donor community and EU aid policies and methods, 1950s-
1990s 11
1.4. The raise of Budget Support during the 2000s 12 1.4.1. The disappointment with the old aid methods 13 1.4.2. The Millennium Declaration Goals 13 1.4.3. The Paris Declaration 13 1.4.4. EU increased role in shaping aid agenda 15 1.5. The EU and Budget Support 16 1.5.1. The EU’s approach on Budget Support 16 1.5.2. The Evolution of Budget Support in the EU 17 3 Literature Review 21 2.1. Aid Effectiveness debate 21 2.2. Institutions and Aid Effectiveness 22 2.3. Policies and Aid Effectiveness 23 2.4. Aid instruments, diminishing returns and Aid Effectiveness 24 2.5. Dismissed Hypothesis 26 3. Research Design and Methodology 27 3.1. Rational Choice Institutionalism as analytical framework 27 3.2. Research design 28 3.2.1. Dependent Variables 28 3.2.2. Independent Variables and Hypotheses 29 3.2.3. Method and scope 29 3.2.4. Operationalization of variables and the data 30 3.2.5. Research limits 32 4 Empirical Research 33 4.1. Empirical strategy and descriptive statistics 33 4.1.1. The empirical strategy 33 4.1.2. The descriptive statistics 35 4.2. Presentation and Interpretation of the Research results 36 4.2.1. The impact of budget support on MDGs indicators 37 4.2.2. The verdict concerning the analyzed hypotheses 38 4.2.2.1. Infant mortality rate as dependent variable 38 4.2.2.2. Maternal mortality rate as dependent variable 39 4.2.2.3. HIV prevalence rate as dependent variable 40 5. Conclusion
41
Bibliography 42 Annexes 49

Abbreviations
ADB Asian Development Bank
AEL Aid Effectiveness Literature
BoPs Balance of Payments Support
BS Budget Support
BWI Bretton Woods Institutions
CFSP Common Foreign and Security policy
CRS Creditor Reporting System
DAC Development Assistance Committee
DD Development Decade
DFID Department for International Development
DG DEVCO Directorate General for Development Cooperation
EC European Commission
EU European Union
GBS General Budget Support
GDP Gross Domestic product
HI Historical Institutionalism
HIPC Heavily Indebted Poor Countries
HLC High Level Conference
IDD International Development Department
IFIs International Financial Institutions
IMF International Monetary Fund
IOB Policy and Operations Evaluation Department of Netherlands, Min. of Foreign Affairs
KKZ Kaufmann, Kraay and Zoido-Lobaton indicators
MDG(s) Millennium Development Goal(s)
MS Member States
NGO Non-Governmental Organization
ODA Official Development Assistance
OECD Organization of Economic Cooperation and Development
OLS Ordinary Least Square regression
PFM Public Financial Management
PG Partner Government
PRSP Poverty Reduction Strategy Paper
RCI Rational Choice Institutionalism
SAP(s) Structural Adjustment Programmes
SBS Sector Budget Support
SWAp Sector Wide Approach
WB World Bank

Introduction
6
Introduction
At the beginnings of the 2000s, both the international aid arena and development policy of
the EU went through major reforms. During these events, Budget Support (BS) has been presented
as a new and effective aid delivery method. Being a government-to-government direct financial
transfer, it was viewed capable to cope with the drawbacks of other aid instruments, to support
attaining the Millennium Development Goals (MDGs) and to implement the Paris Declaration
principles. The European Union (EU) had a particular interest in promoting this aid method. After a
period of glory, its popularity decreased dramatically. The critical voices started to call it a blank
check for corrupt regimes. Its supporters were bringing as proof of its effectiveness the various
evaluation reports. Nevertheless, these assessment reports show mixed results and the
effectiveness of this instrument appears to depend on a country by country basis.
This master thesis puts forward two questions. The first one asks whether BS has
contributed to one of its missions: the attainment of MDGs. This question ignores the mixed results
of the evaluation reports and checks whether EU Budget Support works independent of the
characteristics of the beneficiary countries. The second question which is the main question of this
study tries to identify the conditions for the BS effectiveness in the MDGs’ attainment.
Analyzing the 16 beneficiaries of the EU Sector Budget Support in the health sector during
2004-2015, and applying an econometric method, this dissertation argues that these countries had
better results in diminishing the infant mortality in the years with EU BS disbursements in the health
sector. However, it is difficult to say that there is a causal relation. Finding the response to the
second question involved studying the aid effectiveness literature. Based on it, there are identified
three possible hypotheses for the BS to be effective. The recipient country should have: (i) a
qualitative institutional environment; (ii) a qualitative policy environment; or (iii) it should invest
high domestic resources in the health sector. The results suggest that the quality of the economic
policies might be the right response for the BS to have immediate results in reducing the infant and
maternal mortality rate. In case of HIV prevalence the estimations bring an unexpected outcome.
The provision of higher volumes of budget support in a country with qualitative institutions affects
negatively the reduction of HIV prevalence rate. Such results are ascribed to the limits of the used
model, and it calls for further investigations.
The Thesis is organized as follows: Chapter I discusses the context of Budget support;
Chapter II reviews the aid effectiveness literature that underpins the 3 identified hypotheses for
responding to the thesis main question; Chapter III lays the research design and methodology;
Chapter IV describes the obtained results. Finally, the last part is reserved for the Conclusion.

Chapter I: The Budget Support Context
7
Chapter I: The Budget Support Context
As specified in the introduction, the main purpose of this Master Thesis is to identify when
the Budget Support provided by the EU proved to be an effective method. Nevertheless, this chapter
aims to describe the context of Budget Support. It firstly defines the Budget Support. Secondly, it
introduced the research question. Thirdly, it includes the BS in the evolution of EU development
policies. This gives the chance to understand the rise of this instrument and its current place in the
range of aid tools used by EU.
1.1. Defining Budget Support
The Budget Support (BS) can be simply defined as: an aid delivery method which involves a
direct transfer of funds from the donor to the recipient’s budget. Once the transfer is done, the
funds are managed using Partner Government (PG) national system. During the late 1990s and at
the beginnings of 2000s, the BS was presented as a new aid method by the donor community.
Nevertheless, similar mechanisms have been used in the past (Langan,2015). Two main examples:
the balance-of-payment support which continued under Structural Adjustment Programmes in the
1980s. Both of them supposed government-to-government financial transfers from donor to
recipient (Knoll, 2008). Is it the “Lack of Historical Memory in the Aid Community” mentioned by
Easterly, 2002 or the BS has specific characteristics? In order to identify these particular features, it
is necessary to give a general overview on the aid approaches and on the hierarchy of aid methods.
This will be the purpose of this section.
Despite the existence of different classifications, hierarchies and definitions of aid
approaches and modalities, this dissertation will follow a classical vision which is also consistent with
the EU’s aid methods framework (European Commission, 2004). This framework refers to three
approaches: project approach, sector approach and programme approach. Each of them will be
presented below.
The project approach is materialized through the use of the projects. A simple example
would be: financing the construction of a hospital or a school. For more details check the Annex 1.
The sector approach is an intermediary approach. This supposes that aid is directed to
comprehensive programmes for development of whole sectors as health, education, agriculture…
(Degnbol-Martinussen, Engberg-Pedersen, 2003: 49) The sector approach may be implemented
through different financing instruments including the project or sector budget support (check Annex
2).

Chapter I: The Budget Support Context
8
The programme approach1 is quite difficult to be defined (Van Bilzen, 2015: 11-13). In 1991,
the OECD has formulated it as “[programme which] consists of contribution made available to
recipient country for general development purposes, i.e. balance of payment support, general budget
support and commodity assistance, not [being] linked to specific project activities”( IOB Evaluation,
2012: 33 citing OECD (1991) Principles of Programme Assistance. OECD, Paris). The Fig. 1.1 presents
a well-known classification of the programme aid instruments and each these instruments will be
cursory defined further down.
Source: IDD and Associates, 2005: 203
The food programme aid is a transfer of resources in kind providing balance of payments or
budgetary support2. These resources could be sold on the open market and provided either as a
grant or loan.
The financial programme aid supposes a transfer of financial resources for the balance of
payments or budgetary support. The Balance of payment support (BoPs) is a wide aid method. It
might be provided to support the imports. In this case, BoPs purposes to maintain or increase the
foreign exchange reserves (European Commission,2008). Also, it may aim to support the exports (the
Fig. 1.1 omits mentioning it). Usually, it is done through price subsidies for balancing the short term
fluctuations in export earnings (eg: the EU’s Stabex and Sysmin)( Van Bilzen, 2015: 15). The Debt
Relief is a particular form of BoPs. This may imply various mechanisms from lowering the interest
rate to cancelling the principal (Ibid.: 16). The rational is that the relief of debt frees up national
1 Other terms used to define approximately the same thing are: programme-based approach (PBA), macro-
support, macro or global approach, budgetary aid… 2 OECD site: “Food Aid” https://data.oecd.org/oda/food-aid.htm last checked 7th of April, 2018;
Fig. 1.1: Programme Aid
Chapter I: The Budget Support Context
9
resources which could be used to invest in social development or economic growth (Hauck, V. et
al.,2005).
The BS implies a direct transfer of financial resources to recipient’s national budget. One of
its ancestor methods was the controversial Structural Adjustment Programmes (SAPs). For
understanding the novelty of BS, it would be useful to mention the differences between them. The
SAP presumed a transfer of financial resources made conditional on a number of requirements (ex-
ante conditionality) (Koeberle, Stavreski, 2006: 4). These conditions were usually determined by the
donors and it involved the adoption of a range of neoliberal institutional and economic reforms
(Ibidem). It was a policy-based programme as it focused on policy action (Ibid. p. 5). Conversely, in
case of BS, there is a policy dialogue between the donor and recipient. Both decide the policies to be
implemented (partnership-based) and the targets to measure the results (result-based). The funds
are transferred before the adoption of policies (ex-post conditionality). It aims the reduction of
poverty and economic growth3. Following what it has just been said, a comprehensive definition of
BS would be: BS is a pro-poor focused aid method which “involves policy dialogue, financial transfer
to the national treasury account of the partner country, performance assessment and capacity
development, based on partnership and mutual accountability” (European Commission,2012:11).
The difference that arises between different types of Budget Support refers to the extent of
earmarking (European Union,2007:12-13). The General Budget Support (GBS) funds are not
earmarked and the policy dialogue concentrates on the overall government policy (Ibidem.). While
the Sector Budget Support (SBS) is earmarked for a selected sector and, respectively, the policy
dialogue focuses only on the sector in issue.
1.2. The research question
The effectiveness of Budget Support is a controversial subject. The BS proponents call to
analyze the BS evaluation and assessment reports. These show a range of positive results: increase
of public spending in social sectors, improvement of government capacity in public finance
management, strengthening government ownership and accountability, positive impact on the
dialogue between EU and PGs, improved coordination and harmonization among donors (DEval,
2017:xii; Beynon, Dusu, 2010). On the other side, the BS opponents either disregard these studies or
consider them biased. They say BS is ideal for feeding the corruption in the developing countries.
Thus, a first question would be: what is the impact of budget support in the recipient countries?
Has it helped to progress the achievement of any objectives, of MDGs, for example? It is true that
3 For a comparative chart, check the Annex 3;

Chapter I: The Budget Support Context
10
many evaluation reports presented positive performance (Burkina Faso, Bangladesh, Pakistan) (ECA,
2010), but there are, also, reports which revealed mixed (Namibia, Nepal, Tanzania, Niger) (Ibid.) or
unsatisfactory results (Moldova, Egypt, Ukraine) (ECA Press 2013, 2016a, 2016b). The results seem to
depend on a country by country basis. But all BS recipients need to meet a set of eligibility criteria
before and during the BS programme (European Commission, 2012). Despite them, there is a
variation in the effectiveness of BS to achieve its objectives and namely this aspect represents the
main research problem of this Master Thesis.
Taking into account the aforementioned problem, it may be inferred that there is a
conditional effectiveness of BS. This study attempts to identify these conditions. In order to limit its
scope, it takes the EU SBS in Health sector (SBS Health) as a case study. Thus, the main research
question of this Master Thesis is: “Under which conditions the EU Sector Budget Support proved to
be an effective aid delivery method in the Health Sector?”
Part of the Aid Effectiveness Literature (AEL) confirms the conditionality of aid effectiveness
(see Chapter II) and the same could be assumed regarding the BS. Based on this literature, three
hypotheses are selected: that EU SBS Health is more effective in (i) a qualitative institutional
environment; (ii) in qualitative policy environment; (iii) in a country with high domestic resources
invested in the health sector.
For replying to this question, the study employs the cross country regression as a research
method analyzing all 16 EU SBS Health recipients in the period 2004-2015 (see Annex 9). 2004 is the
year of the first EU SBS disbursement in health sector. The unavailability of certain data did not allow
extending the covered period beyond 2015. The effectiveness of SBS Health is measured based on
achievement of the MDGs in the Health sector. As the succeeding sections clarify, BS was viewed as
the best method to help the developing countries attaining the MDGs. More information about the
research design, method and operationalization is provided in Chapter III.
The justifications for choosing the health sector are manifold. First of all, the MDGs reserved
a special role for the health sector (check goals 4-6, Annex 4). This wasn’t accidentally; it is a
strategic sector with important positive externalities for the long-term development of a country. It
would be more justifiable to study how BS works in such sectors, so, its improvement would have a
multiplication effect. Secondly, thanks to MDGs, all SBS programmes linked to health followed, at
least partially, common objectives; thereby, it is easier to define its effectiveness. The SBS in
education sector could have worked too, especially, that the EU has been more active in this sector.
Though, the availability of data for measuring the evolution of MDGs in the education is reduced in
comparison with the one referring to the health sector. Thirdly, other options have been dismissed

Chapter I: The Budget Support Context
11
based on various grounds. The GBS is not a good option. Its purpose is to support the entire National
Poverty Reduction Strategy of a country, thus it’s difficult to grasp its impact. In addition, there will
be more problems with the endogeneity for GBS and SBS in Public Administration and Justice in
comparison with other types of BS.
The following sections present the historical evolution of EU development policy and of BS.
The purpose is to offer a general overview about the EU aid policy, to provide the historical context
in which the BS has been adopted and its evolution.
1.3. Short description of donor community and EU aid policies and methods, 1950s-1990s
In Europe, the provision of aid goes back to the interwar period. The same could be said
about budget support. The Great Britain, France, Belgium provided forms of budget support (Van
Bilzen, 2015:199-200). Nevertheless, the European Union aid dates back to 1957 Rome Treaty: after
the French delegation put the issue on the table in the last moment (Holland, Doidge, 2012: 2). The
result was the creation of FEDOM4. Since then, the EU aid policy and methods witnessed many
metamorphoses as result of decolonization, enlargements, economic crises, new geopolitical
conjunctures, new economic development theories... A cursory exposition of these trends will be
provided below.
The United Nations (UN) declared the 1960s as the first decade of development aid (DD1)
(Van Bilzen, 2015:227). Like most of the other donors, during the 1960s the EEC preferred method
was the projects which promoted industrialization (Moyo,2009:14). Unfortunately, the EAMA/ACP
countries’ weak industries, lack of entrepreneurial class and qualified labor force, cronyism, and
mismanagement were generating inefficient projects, later-on called “white elephants” (Defraigne,
Belliogoli, 2010). The next decades brought other aid modalities; notwithstanding, the project
approach remained the main aid delivery method of EEC/EU.
During the 1970s, the G-77 started to speak about the New International Economic Order
(NIEO). The Lomé Convention (1975), being viewed, at the moment, as the best model of
development, realized a couple of NIEO objectives (Holland, Doidge,2012: 59). One of them was:
BoPs schemes creation for compensating the instability of export revenue from agricultural (STABEX)
and mining (SYSMIN) products (Holland,2002:32-35). After the 1973 oil crisis, and the flow of petro-
dollars into the international banks, the poor countries were borrowing a lot. The donor community
placed the focus on poverty (Moyo, 2010: 16-17) increasing the use of programme-based approach
4 At that time the EDF was called FEDOM;

Chapter I: The Budget Support Context
12
for tackling the balance-of-payment problems of non-oil developing countries (Van Bilzen,
2015:392).
The 1980s or the DD3 remained in the history as the “lost decade”. A world-wide recession
led to a decline of commodity price, raise of interest rate and skyrocketed international debt
(Ibidem). The solution was restructuring the debt and the SAPs came into spotlight. Their slogan
was: “Adjustment with growth”, but their result: zero growth per capita (Easterly, 2001:101-104).
The EEC remained rather neutral to the adjustment process. It applied partially the conditionality
(Holland, Doidge,2012: 59) and moved towards import support programmes (Van Bilzen, 2015:444).
The DD4 was the decade of the 2nd generation of structural adjustments through debt relief
(Ibid. p. 490). The very high debt of many poor countries made the BWI to establish the HIPS (Heavily
Indebted Countries Initiative) in 1996 and require the Poverty reduction Strategy Papers (PRSPs).
The programme included partial forgiveness of loans for countries with good (id est neoliberal)
policies (Easterly, 2001:124). Though in 1999, the HIPC become Enhanced HIPC and this time,
basically, every country received debt relief (Ibid. p. 123-124). The debt was, primarily, the domain
of Member States (MS) and the Community stayed distanced from this issue till 2005 (Holland,
Doidge,2012:62).
In EU, the Maastricht Treaty was signed which included the development policy in the
competence of the EC/EU development policy and created the Common Foreign and Security Policy
(CFSP). This was the official end of political neutrality (Frisch,2008:23-24) and the emergence of
conditionality. The Community could earmark the aid to mirror the BWI adjustment reforms
(Holland, Doidge,2012: 60-61).
The end of Cold War and the “aid fatigue” resulted in a sharp decrease of aid flows (Van
Bilzen, 2015:495). The international organizations as OECD/DAC, UN, BWI retried to re-galvanize the
interest in aid through different initiatives (Riddell,2007: 40-41). Their reports and publications
depicted the plight of poor countries and highlighted the high gap between the donors’ grand talks
and declining aid levels. As the next section will show, these initiatives formed a propitious backdrop
for the raise of BS.
1.4. The raise of Budget Support during the 2000s
The switch to BS has been facilitated by a number of events and factors. The most important
of them were: (i) the disappointment and uselessness of traditional aid methods; (ii) the Millennium
Declaration Goals (MDGs); (iii) the Paris Declaration on aid effectiveness and (iv) EU increased role in
shaping aid agenda. Each of them will be presented in the following subsections.
1.4.1. The disappointment with the old aid methods

Chapter I: The Budget Support Context
13
During the 1990s, there was a disappointment with aid, in general. After, 4 decades of
development cooperation, the results were unsatisfactory as shown in the Human Development
Report, 1996 (Van Bilzen, 2015:495). The way the aid was provided was one of the concerns. The
traditional project approach was considered as unproductive (check disadvantages in Annex 1).
Another concern was the need to replace the SAPs and its ex-ante conditionality which proved to be
inefficient. The export support programmes were accused for creating dependency. The BoPs
(import programmes) lost its popularity as in the mid of 1990s, many of developing countries were
no longer in need of foreign exchange thanks to the drop of regulated exchange rate. Finally, the
Enhanced HIPC transformed the debt relief in a useless instrument (IOB Evaluation, 2012: 33).
1.4.2. The Millennium Declaration Goals
At the beginnings of the 2000s, the DD5 has not been announced; instead the 189 nations
signed the Millennium Declaration (MD). This was a series of 8 goals with 19 measurable targets
(check the Annex 4). The MDGs put a stress on fighting the poverty and supporting the education
and health care. It highlighted the PGs shortage of funds thus promoting budgetary aid. As well, it
criticized the donors' aid policies for their uncertainty, lack of common goals and weak possibilities
to assess the outcomes (Ibid. p. 36).
In order to attain the MDGs, the developed countries pledged to increase the volume of aid
by 0.7% ODA/GNI signing the Monterrey Consensus in Mexico, in 2002 (Riddell, 2007:43). The
change in quantity of aid made the donors to review its quality too and the following High Level
Conferences (HLC) came with solutions for it. The most important so far, was the Paris HCL.
1.4.3. The Paris Declaration
The demand to improve the quality of aid made the donors to adopt different commitments;
the most important: Rome Declaration on Harmonization (2003), Paris Declaration on Aid
Effectiveness (2005); Accra Agenda for Action (2008); and Busan Partnership for Effective
Development Cooperation (2011). The Paris Declaration constituted a turning point in the history of
foreign aid, as: Rome Declaration was just a preparing stage, while the other 2 HLC issued follow-up
declarations. It formulated 5 principles presented in Fig. 1.2.: ownership, alignment, harmonization,
managing for results and mutual accountability (DAC, 2006b:50-51) (check Annex 5):

Chapter I: The Budget Support Context
14
Paris recommended the donors to employ the programme-based approach, especially
budget support. Below, a short analysis of BS will permit to see how BS helps to implement these
principles.
Fig. 1.2: Aid Effectiveness Pyramid
Source: DAC (2006b) “Development cooperation report 2005”, Paris: DAC, p. 52;
The BS should improve the partnership among the donor and PG through the policy
dialogue. This translates in a shift of rights and obligations to PG; respectively, this increases the PG’s
ownership. The BS mechanism implies medium and long term commitments, thus it ensures more
predictability and stability. This, also, gives the possibility to the PG to deliver its own agenda.
Through the Policy Dialogue, PRSP or CSP, the donors align to the PGs’ Poverty alleviation strategies
(Koeberle, Stavreski,2006: 3-5). In addition, BS uses the country’s institutional and administrative
structures to channel the funds; this strengthens the principle of alignment. Normally, BS is
coordinated in groups of donors. It might be even jointly implemented. These arrangements
facilitate to achieve the harmonization among donors (Gerster,2007). BS demands the PGs to report
regularly to national Parliaments and other stakeholders about the way the budget is managed.
Thanks to this, the transparency and government accountability will increase (Hauck et al.2005). In
the same time, the donors commit to provide timely and transparent information on BS flows and
disbursements. Both of these aspects contribute to the Paris Declaration principle of mutual
accountability. The International Community is encouraged to link BS with the “result oriented
Chapter I: The Budget Support Context
15
outcome”. Renouncing to policy-based conditionality, the donors focus more on what is actually
happening. With the other words, the donors focus on the results of their actions and how these
results help to attain the proposed goals. Another policy dialogue product is an agreed set of result-
based indicators thanks to which the final results can be measured. In this way, the BS goes in line
with the managing for results practice.
1.4.4. EU increased role in shaping aid agenda
The European Commission was an important advocate of budget support (Schimdt,2006: 13)
and its role in promoting this aid modality should not be overlooked. After massive criticism,
corruption scandals at the end of 1990s, threatens from certain MS to repatriate their aid funds
contributions (Carbone, 2013b), the EU development policy witnessed extensive reforms
(Holland,2012:101-103). Improving its aid architecture and receiving accolades for from its previous
critics (Carbone,2013a), EU could significantly influence the global aid agenda which resulted in the
promotion of BS. For backing this saying, it’s worth mentioning, the MDGs endorsed the EU priorities
(Holland, Doidge,2012: 231). The European Union declared its full commitment to MDGs by adopting
various strategies as the Barcelona Commitments (2002) or the EU Strategy for Africa (2005)
(Ibid.:229). The latter clearly indicated the use of BS as part of the strategy. EU was one of the first
agencies that defined its policy on BS (in 2002) (Hauck et al.,2005) afterwards it became the largest
BS provider in the world (Oxfam, July 29, 2011). The Paris Declaration largely reflected the EU’s
position (Carbone,2013a). The European donors became front-runners in following Paris agenda,
aspect confirmed in the “European Consensus on Development” (2005) (Koch et al.,2016). The Accra
Agenda for Action (2008) depicted the same strategies for improving the donors’ coordination
adopted by the EU in its “Code of Conduct on Complementarity and Division of Labour” (2007)
(Carbone,2013a). All of these initiatives at both the EU and international levels strengthened the
commitment to BS.
The reasons why the EU was so assertive in shaping the international aid agenda and
pushing the BS are multiple. Firstly, EU wished to enhance its international visibility and legitimacy.
It aimed to offer an alternative to Washington Consensus by contrasting the principle of ownership
with the BWI conditionality (Ibidem). Secondly, by advocating the donors to work together, it
advanced its preference for the multilateralism (Ibidem) conversely to the USA approach. Thirdly,
the principles of BS gave a good opportunity for the EU to wholeheartedly embrace the Maastricht
enounced principle of complementarity (Holland, Doidge,2012:184). Despite the EU active role, it

Chapter I: The Budget Support Context
16
failed to attain most commitments including the use of BS. After that, the EU’s position at the
international arena was quite modest5.
1.5. The EU and Budget Support
This section has two objectives. The first one is to provide an overview of the EU approach
on BS. Despite the BS being named the EU’s preferred aid modality, its evolution in Europe wasn’t
that smooth. The analysis of its evolution represents the second objective.
1.5.1. The EU’s approach on Budget Support
The overall philosophy of EU BS does not differ very much from the ones of the other
donors. The EC views the BS as a transfer of financial resources to the National Treasury Account.
According to the BS Guidelines, first the payment is made to the foreign exchange reserve of the
Central Bank and after the Central Bank credits the National Treasury account. The transfers are
made only after the agreed conditions are respected. Next, the funds are spent by PG in accordance
to their public financial management (PFM) system. The Commission’s responsibility resumes in
checking that the conditions are met and the transfer is made. Any follow-up of how the funds are
used is done according to the mandate of the PG (European Union, 2007:11). The thick line from the
Figure 1.3 delimitates the EC responsibilities from what the PG is doing.
Source: European Union, 2007: 11
5 There’s another reading of what happened in the last HLF, at Busan. The EU changed its strategy because
context was different. One of the main Busan objectives was to keep the non-DAC donors on board. Thus EU
had to renounce to its role of norm-maker for the one of “leadiator” in the international (Lightfoot, Kim, 2017);

Chapter I: The Budget Support Context
17
The BS delivered by the EC is released under the form of fixed and variable tranches (EC
Directorate General for Development, 2006:81-89). This approach is not a typical one, few donors
adopted it, another example is Switzerland (Sweden, Norway and UK embraced it occasionally)
(Gerster,2007). Both types of tranches are subject to general conditions (i) existence of
development strategy (sectoral strategy for SBS which includes sector reforms, improvement of
sectoral governance and service delivery); (ii) macroeconomic stability (meaning to avoid
unsustainable deficits, high or volatile inflation rate, volatility in exchange rate or financial markets)
and (iii) PFM improvements (EC uses PEFA-PFM Performance measurement Framework instrument
elaborated by the EC and WB) (European Commission,2012:33-39) and specific conditions which
apply to the disbursement of each individual tranche (European Union, 2007:16). The fixed tranche
is disbursed in “all or nothing” form – should any of the general or specific condition not be
achieved, then the disbursement is not taking place. While the variable tranche is dependent on the
extent to which certain pre-specified general and specific targets are attained (result-based
approach). These are linked to the MDGs or they are powerful proxies to them. They are normally
drawn from the sectoral development strategies and the targets are decided jointly by the EC and
PG, for each year (EC Directorate General for Development,2006: 81-89). In addition to these
conditions which should be better called eligibility criteria, there should be mentioned the political
conditions applicable to all EU aid programs: good governance, democracy, human rights and rule of
law (Holland, Doidge, 2012: 192-196). The EU may sanction the beneficiary country if there is any
breach of these principles.
The policy theory behind the EU BS is the same as for the BS programmes of other donors.
The programme’s inputs are the financial resources and the policy dialogue; its implementation
should respect the 4 Paris principles. The previewed outputs could be classified in flow-of-funds,
institutional and policy effects. The outcomes are the enhanced government effectiveness and the
impact – sustainable growth and poverty reduction (check Annex 6).
1.5.2. The Evolution of Budget Support in the EU
The popularity of Budget Support started to rise with the Paris process for the reformation
of aid system. Unfortunately, the OECD CRS does not have the data for BS during 2000-2006 but
some data can be extracted from different reports. The amount of EU BS rose from $1bn in 2000, to
$3.8 billion in 2008. The share of budget support in total EU commitments increased from 14.3% in
2000 to 42% in 2008 (Kitt, 2010:14). The ACP countries were the main beneficiaries (Schimdt,2006:

Chapter I: The Budget Support Context
18
42). The trend of EU BS commitments and disbursements for 2006-2016 is presented in the graph
1.1:
Graph 1.1.: EU Institutions BS commitments and disbursements
Source: OECD.Stat CRS 1 database
It shows: the BS commitments increased by 2008 and after it demonstrated a cyclical trend. Another
observation is that the adoption of the BS seems to lead to the improvement of disbursement rate,
and this refers to both the BS and the entire EU aid flow (check also Annex 7). An explanation could
be: BS is a “bureaucracy’s nirvana” (Collier, n.d) in the sense that large amounts of money can be
released on schedule without much trouble. Nevertheless, another interpretation not linked with BS
would say the 1990s-2000s EU aid reforms brought results. As well, looking to the disbursements
curve (graph 1.1.), the year 2009 seems to put an end to the constant growing trend from the
previous years.
Returning back to the Budget Support, another observed trend is the declining curve of GBS
commitments and the ascending one of SBS from 2009 (check graph 1.3. and the Annex 7).
Graph 1.2.: The EU GBS and SBS commitments, 2006-2016
Source: OECD.Stat CRS 1 database

Chapter I: The Budget Support Context
19
The graph 1.2. reconfirms that starting from 2009, the GBS looses constantly from
popularity. Instead of promised 50%, in 2015, only 20% of EU official development assistance funds
were disbursed through BS (European Commission,2016). The evidence shows that in reality the
preferred EU method remains the project approach (check Annex 8). Nowadays, most of the BS is
provided as SBS, GBS is rarely used. According to OECD, the EU GBS disbursements decreased from
$1,385 mln to $657 mln (2016 prices). The MS reduced GBS even sharper. The reason could be the
multiple corruption scandals, election frauds or conflicts in the recipient countries. The Koch et al.
(2016) comes with another explanation. It says the Paris process and the use of GBS attempted to
solve the principal-agent problem of aid by dropping the donors (the principal) interests through the
ownership and alignment. As well, it tried to solve the collective action problem originating in a high
number of donors, through the harmonization. According to the authors, the Paris Declaration did
not take into account the high political, financial and technical costs of applying these principles, as
well, it omitted the free-ride incentive of each individual donor.
After the drop of the GBS by most of the MS (see graph 7.3, Annex 7), the EU has been
persuaded to do the same thing. In 2010, the EU launched a consultation for reforming the BS
(European Commission,2011). The new BS Guidelines (European Commission,2012) transforms BS
into a political instrument for promoting the western models of political governance (Tavakoli,
2011). It includes transparency and oversight of the budget as 4th eligibility criterion. EU is no longer
seeking to have 50% of aid delivered through BS and it strengthens the risk management framework.
Also, it offers greater differentiation in BS instruments by moving from 2 to 3 types of BS: Good
Governance and Development Contracts, Sector Reform Contracts, State Building Contracts.
As aforementioned, after the heyday of GBS, the heyday of SBS came. The main sectors
that the EU finances through the SBS are: education, government and civil society, and economic
infrastructure (check the Annex 8). As this thesis focuses on the SBS in health sector (BS Health), the
rest of this subsection analyzes the trends of EU aid in this sector and the use of BS Health.
The project approach remains the EU’s most used method in providing aid in health sector.
Between 2010 and 2016, 51% of EU aid funds in health care sector were delivered through projects.
26% corresponds to BS, though the share of BS is relatively higher here than in the other sectors. The
graph 1.4. depicts the evolution of the EU aid modalities in the Health Sector.
Turning to the countries that are recipients of the EU BS Health, from 2004 to 2016, they
were 17. By GDP per capita in 2017 (World Bank classification), only 5 are classified as low income
countries (LIC) (Afghanistan, Burkina Faso, Liberia, Mozambique, Rwanda) and one as high income

Chapter I: The Budget Support Context
20
country (HIC) – Barbados. The other 11 countries are lower middle income countries (LMIC). This
should not be a surprise, usually, the LMIC are countries in need of financial resources and with
relatively greater chances to satisfy BS eligibility criteria than the LIC. Analyzing the flow of BS funds
in health sector, it is necessary to mention that the other donors are quite active. Only 5 out the 17
countries received BS in health support from EU only (Afghanistan, Barbados, Egypt, Liberia, South
Africa). If other aid instruments are considered, then all these 17 countries received aid in health
sector from other donors. This means that EU should closely monitor the activity of other donors in
this field.
Graph 1.4.: The evolution of the main EU aid methods in Health sector, disbursements
Source: OECD.Stat CRS 1 database and EU Aid Explorer for SBS amounts during 2004-20096
The next Chapter is going to present the literature review. It firstly clarifies that despite a
relatively large body of literature on EU development policy, the aid effectiveness literature has
been deemed capable to suggest the hypotheses for having the response to the main question of
this master thesis.
6 OECD started to apply more rigurous criteria to classify the aid methods per sector only in 2010; before,
OECD had less diverse categories for aid methods classification. “Not Applicable” category includes all of the
aid flows that could not be included in the then existent categories;

Chapter II: The literature review
21
Chapter II: The literature review
The studies on EU development policy and Budget Support have proliferated in the last
decades. Nevertheless, the aid effectiveness aspects have been slightly analyzed in these studies and
this literature provides few hints on the possible effectiveness conditions for EU BS. As a
generalization, the literature on EU development policy might be categorized as studies on: general
aspects as historical evolution, institutional set-up, priorities, coherence… (e.g. Holland 2002;
Carbone, 2007, 2008; Frisch, 2008; Grimm, 2008; Holand, Doidge, 2012, Bodestien et al 2016); EU
impact on the international development arena and its relations with the other donors (e.g.
Carbone, 2011; Carbone 2013a, Carbone, 2013b; Lightfoot, Kim, 2017; Verschaeve, Orbie 2018); and
the relations between EU’s and its MS’ development policies (e.g. Carbone 2013a; Bodestien et al
2016; Orbie, Carbone 2016). The studies on BS, as well, focused around certain subjects as: novelty
of this instrument (Hauck et al., 2005; Gerster, 2007; Knoll, 2008), donor coordination and collective
action problem ( Faust, Koch,2014; Leiderer, 2015; Koch et al., 2016), conditionality, ownership and
policy dialogue (Alvarez, 2010; Molenaers et al., 2010; Knoll, 2008; Langan, 2015; Del Biondo, Orbie,
2014). Thereby, the Aid Effectiveness, rather than European development policy or BS literature,
deemed capable of providing potential answers to the thesis’ main research question. This chapter
presents the studies that served as sources of inspiration for the hypotheses of this master thesis:
that BS is more effective in (i) a qualitative institutional environment; (ii) in a qualitative policy
environment; (iii) in a country with high domestic resources invested in health sector. It surveys,
also, different reviews about these studies and opinions of other authors.
The chapter is structured in five sections. The first one clarifies the main debate of Aid
Effectiveness Literature (AEL). The next three present the literature review underpinning each of the
three hypotheses. The last section informs about some dismissed hypotheses.
2.1. Aid Effectiveness debate
It is redundant to say that the main AEL question is: “Is aid effective in promoting growth
and fighting poverty?” Generally speaking, the impressive amount of literature on this subject gives
three responses: (i) aid is never working; (ii) aid is always working; and (iii) aid is conditionally
effective. This thesis’ problem and hypotheses are based on studies supporting the last response.
They are analyzed in the next sections. The remaining of this section presents few well known
studies supporting the first two positions7.
7 The number of papers referring to each category is much more extensive. Clemens et al, 2004 provides a
quite comprehensive literature review following a similar classification.

Chapter II: The literature review
22
Most of the literature backing the pessimistic stance was produced during the 2000s (Tarp,
2015). Moyo, 2009 is famous for her harsh criticism of systemic aid. She affirms aid negatively
impacted the economic growth and democracy in Africa. Instead of aid, she argues for improved
access to capital and to markets for the developing countries. Djankov et al., 2006 come with a
similar view. They confirm that aid may harm the institutions of recipient countries. William Easterly
is another well-known skeptic. Like Moyo, he affirms that the way aid works at the moment can
neither stimulate growth nor improve the institutional framework (Easterly, 2001, 2002, 2003).
Hansen and Tarp, 2000 bring evidence that: aid is working everywhere. They survey the
empirical cross country studies spanning from 1970s to 1990s. Based on different theoretical
paradigms and empirical tools, they classify these studies into 3 generations. The first generation
confirmed that aid increases the savings while the second generation - aid increases investments.
Both savings and investments should spur the growth. The third generation refers to more
sophisticated econometric studies. These used better data, better analytical tools and new insights
from economic growth theories. A leading paper is Burnside and Dollar’s one, 2000. Its conclusion is:
aid has a positive impact if the recipients pursue good policies. Hansen and Tarp, 2000 disagree with
it. They bring as argument other papers from the same generation that established a positive
relation between aid and growth, irrespective of the policy and institutional environments. Hansen
and Tarp observe the majority of empirical cross country studies proves aid to be effective, but the
skeptical studies or the ones supporting conditional aid effectiveness are more popular.
2.2. Institutions and Aid Effectiveness
Before looking to what AEL says about the institutions, it is necessary to mention some
important works concerning them. It is barely possible to argue that the institutions don’t matter,
although the neoclassical models clearly ignore them (North, 1991: 16). The work of Douglass North
brought them into the attention of the economists, while the one of Acemoglu et al. (2001) provided
the necessary evidence of the crucial role of institutions on the economic performance of a country.
Because it is difficult to conclude whether better institutions make the countries rich or just the rich
countries can afford better institutions, Acemoglu et al. (2001) use the settler mortality of the
Europeans in the colonies as an instrumental variable for the quality of institutions. The theory
behind this technique is that the Europeans established inclusive institutions in the colonies where
the environment was favorable for their settlement; and extractive institutions in the unfavorable
environments or highly populated colonies, so, they could better exploit the colonies’ natural and
human resources.

Chapter II: The literature review
23
The same authors develop other papers stressing the impact of the institutions on a
country’s welfare. For example, Acemoglu et al. 2005 investigate what types of institutions matter
when it comes to different economic outcomes. Most of these papers constitute the basis for their
theory about the inclusive and extractive institutions for explaining the success of a society; theory -
presented in their famous book: “Why nations fail” (Acemoglu, Robinson, 2012a). The inclusive
institutions are the ones that create incentives and opportunities necessary to value the energy,
creativity and entrepreneurship in society. The extractive institutions do not do it. In this book, they
observe that aid is offered to countries with highly extractive institutions. As well, they mention the
way aid is provided gives little if any incentives to the elite for changing the institutional set-up (Ibid.
450-455). Despite numerous accolades, the work of Acemoglu and Robinson did not remain without
critics. A heated debate was between Sachs and these two authors (Sachs, 2012a; Acemoglu,
Robinson, 2012b; Sachs, 2012b). Sachs considered (i) the institutional explanation as an
oversimplified response to a complex problem; (ii) factors as geography, natural resources, healthy
environment should not be neglected; (iii) the data on mortality rate and political institutions
definition is not reliable; and (iv) the institutions are not as persistent.
The AEL has not been as critical. Burnside and Dollar, 2004 conclude that aid works better in
a better institutional environment. They use a cross-section data set covering 124 countries during
the 1990s and KKZ indicators as institutional quality measure. In comparison with their previous
paper on policies (check section 2.3.), they were hesitant to base their conclusion only on cross-
country statistical results. They brought, as well, some case studies as evidence to support their
conclusion.
2.3. Policies and Aid Effectiveness
One of the most famous and cited study from AEL is Burnside, Dollar, 2000 (BD). This study
put forward two questions (in the original paper there were three). The one presenting interest for
this dissertation was: “Does aid have a positive effect in the presence of good economic policies?”
Using a neoclassical model, new data on foreign aid and panel data instead of cross section analysis,
BD runs a number of regressions where the growth rate in developing countries depends on the
initial income level, an institutional and policy distortion index, foreign aid and aid interacted with
policies. Its conclusion is intuitively perfect: aid is effective when combined with good policies. BD
defines good policies as a mixture of fiscal, monetary and trade policies: budget surplus, inflation
rate, and Sachs and Warner openness dummy. The authors did the robustness check by including
and excluding the outliers and middle-income countries.

Chapter II: The literature review
24
BD had a huge influence on the development policy being used by aid agencies to advocate
the increase in foreign aid (Easterly, 2003) and greater selectivity in favor of good policies. As well, it
stirred a tsunami of other papers, part of them supported its vision, and the other doubted it. A
couple of papers belonging to each of these categories is presented below.
BD constituted the basis for the influential report of World Bank (WB): Assessing Aid
published in 1998. This report advocated for directing aid to countries with good macroeconomic
policies and it had a major impact on other donors’ policies. Lensink and White, 2000 criticizes the
report’s theoretical basis which assumes that aid can reduce poverty only by increasing the
economic growth. These authors mention other channels for attacking the poverty: the income
distribution and investment in human development. Also, they call into question the need for good
policies for the aid effectiveness noticing the problems with the BD policy index and with the
robustness of the regressions’ results. Hansen and Tarp, 2001 show that the inclusion of cases
discarded by BD as outliers, or the change in model’s specifications ( e.g. entering the square of aid)
make the findings non-robust. Using different techniques, they arrive to a different conclusion: the
interaction among aid and good macroeconomic policy is insignificant. Collier and Dehn, 2001
incorporate the export price shocks into the BD model and the BD outcome becomes robust to the
Hansen and Tarp, 2001 sample modifications.
Like many other studies from the skeptical camp regarding BD, Easterly et al., 2003 question
the robustness of the obtained results. In comparison with them, they don’t deviate from BD
specifications like introducing additional control variables or using non-linear specifications. They
follow the BD methodology extending only the period of time from 1993 to 1997 and adding more
countries. With this additional data, the BD’s conclusion doesn’t hold. Easterly, 2003 and Easterly et
al., 2004 raise doubts about the robustness of BD’s results, if alternative definitions of aid, good
policy and growth are used. It is necessary to be noted the BD’s definition of good policy fitted very
well the Washington Consensus conditionality.
2.4. Aid instruments, diminishing returns and Aid Effectiveness
The last hypothesis is based on Cordella, Dell’Ariccia’ study (2003). This is one of the works
that differentiate between aid instruments8. It distinguishes between budgetary aid and project aid.
In case of budgetary aid, the donor has some influence over the recipient government expenditure,
but it does not totally control its own funds. It may control its funds through project aid; though, it
has no influence over the government spending. Considering these differences, the study’s
hypothesis is: BS works better if the recipient is development oriented and it has a higher budget
8 For more example of such papers, check Clemens et al, 2004

Chapter II: The literature review
25
comparative to the provided aid. Firstly, the authors develop a theoretical model, next they are
performing an empirical research to prove the veracity of their theoretical findings, and finally they
check the robustness of their results. The regressions performed are based on BD approach using
data for 45 countries during 1973-1993. Their hypothesis is validated: BS performs better when the
funds are limited in comparison with the recipient’s resources. In addition, they confirm the BD’s
findings (aid works better in a good policy environment). Their main result may, also, be interpreted
as a confirmation of diminishing returns of BS. A drawback concerning this study is its inaccurate
definition of BS. It includes: debt forgiveness, swaps, buybacks, rescheduling and financing. Probably,
this explains the totally absolute results obtained by Beynon, Dusu, 2010. According to them, the
countries receiving higher amount of GBS had a better MDGs performance than the ones receiving
lower amounts or no GBS at all. However, their study was based on correlation analysis.
Another interesting study is Clemens et al. 2004. It differentiates between (i) emergency aid
which is usually negatively correlated with growth; (ii) aid that affects growth for a long period of
time like aid targeting education, health, democracy; and (iii) aid affecting short term growth.
Budget support is included in the third category. The authors believe that it is wrong to try finding
any short term relationship between growth and aggregate aid, as different aid categories follow
different purposes, thus they have different impacts on economic growth. Instead such a
relationship should be searched between the short term growth rate and their third aid category.
They perform an extensive regression analysis typical for the aid-growth literature and various
robustness tests. The conclusion is: the short-term impact aid has a significant positive effect on
short-term growth. Moreover, the positive effect is present everywhere, however, it becomes
stronger if the recipient country has better policies and institutions. Therefore, this study should be
attached to the unconditional aid literature strand. As well, the authors identify that aid is subject to
diminishing returns. This goes in line with other studies like Cordella, Dell’Ariccia, 2003 and Hansen,
Tarp, 2001. The diminishing returns are interpreted as a problem of absorptive capacity of large
amount of aid by the recipient economy.
Ouattara, Stroble 2008 criticize both studies from above. They object the use of
commitments instead of disbursements in the case of Cordella, Dell’Ariccia, 2003. In case of Clemens
et al. 2004, they question the criteria for classifying aid in three categories. Moreover, Ouattara,
Stroble 2008 bring diametrically opposed results concerning the impact of different aid modalities
on growth. Based on the way the donors disburse the aid, the researchers distinguish 4 aid
categories: project aid, financial aid, technical assistance and food aid. Their study shows that
project aid affects economic growth positively. Financial programme aid, which includes BS, appears

Chapter II: The literature review
26
to have a negative impact at 10% significance level. This study confirms the importance of policy
environment for aid effectiveness and it suggests that only project aid leads to diminishing returns.
2.5. Dismissed Hypotheses
There are three possible hypotheses not considered by this Master thesis: (i) BS is more
effective when there is trust among the donor and recipient; (ii) aid and respectively BS is more
effective if the recipient country is affected by negative external shocks; and (iii) aid is efficient
outside the tropics.
The first hypothesis is based on Mosley and Abrar work (2006). According to it, the major
determinant of aid effectiveness is the social capital or trust. The idea is: if there is trust between the
donor and recipient, each of the parties avoids breaching the agreement: the donor disburses the
agreed amount and the recipient implements the reforms, so the program will be effective. This is
similar with the conclusion of Cordella, Dell’Ariccia, 2003: if the donors and recipients’ interests
coincide – both are development oriented - the BS is functioning well. Such a hypothesis has not
been included mostly because of the lack of data. For measuring how trustworthy a relation
between the EU and a recipient of BS is, the stability or frequency of interruptions of agreed
disbursements should be analyzed. A proxy could have served the BS suspensions from Molenaers et
al., 2016. But, this won’t be a perfect proxy for measuring the trust between EU and its BS recipients
as it counts only the suspensions. Plus, this dataset ends in 2014 and it would have limited the
number of observations.
A number of studies pointed that aid should be directed to countries affected by negative
external shocks (eg. Collier and Dehn, 2001 or Guillamont and Chauvet, 2001). The difficulty for
considering such an explanatory variable relies on having a proxy for negative shocks. Collier and
Dehn, 2001 used the average price change and the average commodity price change of all shocks.
But there were negative price change shocks offset by positive price shocks. Such cases should be
dropped, thus building such a proxy is not an easy task.
The last potential hypothesis steams from the work of Dalgaard et al. (2004). They say aid
does not work in tropics. Ouattara and Stroble 2008 confirm these findings. Nevertheless, this result
may simply corroborate the institutional hypothesis. The tropics did not have the most favorable
environment for Europeans’ settlement. Thereby, following Acemoglu et al. (2001) argument aid
works badly in the tropics because of extractive institutions.
Chapter III: Research design and Methodology
27
Chapter III: Research design and Methodology
After getting familiar with the context of budget support and the literature review
underpinning the hypotheses of this thesis, the current chapter aims at presenting the research
design and methodology. First of all, it announces the analytical framework. Secondly, it introduces
the research design and the chosen method for responding to the research question. Last but not
least, this chapter ends by providing the details about the used data and the limits of this study.
3.1. The Rational Choice Institutionalism as analytical framework
The game theory (e.g. Mosley, Abrar, 2006: 311-331; Svensson, 1998), contract theory (e.g
Gunning, 2006) or principal-agent theory (e.g. Koch, S et al., 2016) are the most often employed
tools when the BS, or in general aid, is analyzed. This Master Thesis uses a different approach. The
reasons for not going with any of those approaches are diverse. Firstly, the subject of this study is
the effectiveness of an aid instrument delivered by a single donor: the European Union which, at
least in theory, should follow the same purposes and approaches when providing aid9. Thus the
effectiveness conditions should be searched on the other side of relation - the agent (PGs). Other
reasons are linked to the scarcity of data, sensitivity of the subject (e.g.: EU geopolitical interests)
and to the chosen methodological approach. This study proposes to use the Rational Choice
Institutionalism (RCI) (Hall, Taylor, 1996) as an analytical framework. With the other words, the
institutions in the PGs are the key for answering to the research question. A short description of RCI
ideas and their implication in analyzing the EU Budget Support are provided below.
The institutions are “the rules of the game in a society […] that shape [the] human
interaction”( North,1990:3). There should be made a clear distinction between the institutions and
the organizations. If the institutions are the rules of game, the organizations are its players and the
policies are their outcome (Ibidem). By establishing a stable human structure, the role of the
institutions is to reduce the uncertainty (Ibid. 6) and to solve collective actions dilemmas (Hall,
Taylor, 1996). Even if the actors/organizations are utility-maximizers, they act on incomplete
information. This means that the political and economic competition is not efficient and the
frequent result is: the adoption of inefficient institutions (North,1990:8).
9 Nevertheless, it could be possible to claim such things from the EU. According to its Treaties, the EU
development cooperation policy should follow such objectives as: Eradication of Poverty (Art. 208 TFEU),
democracy, the rule of law, human rights, fundamental freedoms or other objectives of Foreign Policy as trade
and security (Art. 21 TEU).

Chapter III: Research design and Methodology
28
Intuitively, the role of the institutions in the aid recipient societies should be crucial for
managing the received financial transfers. The aid and especially, BS are usually targeting the
institutional change (see Annex 6). Very often this is a too difficult task. The institutions, inefficient
or outdated, are difficult to change (Ibidem.). The Historical Institutionalism (HI) provides the best
tools for understanding why it is like that. The HI and RCI are viewed as different schools (Thelen,
Steinmo, 1992). Nevertheless, as Pollack, 2009 mentions the HI could be considered as a particular
form of RCI if it is allowed to adopt the same assumptions about the actors and their preferences as
RCI. HI developed an important concept of path dependence: “the early decisions provide incentives
to the actors to perpetuate institutional and policy choices inherited from the past” (Ibidem.). The
path dependence might be also explained following North’s reasoning. According to him, the
institutions create the opportunities in the society (North, 1990:9). The organizations are designed
to take advantage of these opportunities, as consequence, there will be a lock-in steaming from the
relationship between the institutions and organizations.
Consider a country with disastrous institutions enshrined at the foundations of that society.
The BS is the support given to one of the most important players: the government. If the reasons of
that country’s failure consist in its foundations, the government will have little if any incentives to
reform the institutions of that society. Thus, acting through the government for providing the aid is
not a solution and BS is a bad method. This explains why BS may fail to achieve its purposes.
However, what aspects of the society show when BS is not a good method? Is it, in general the
institutional framework, or the policies adopted by the governments; or the resources it is ready to
invest in developmental sectors? The purpose would be to come to a response to this question.
3.2. The research design
For responding to the research question, there are stated 3 hypotheses based on AEL. The
identified variables and hypotheses are introduced through the descriptive-inferential model
(Creswell, 2003:112-113). For each variable, there are a short clarification, a descriptive question
and an inferential question to relate the independent variable with the dependent one. The
hypotheses are presented under the form of affirmative sentences.
3.2.1. The Dependent Variables
Effectiveness of Budget Support refers to the degree to which BS programme is achieving its
envisaged objectives. As BS was considered the best method for achieving the MDGs, thus, this
study considers the evolution of 2000 MDGs indicators in Health (MDG 4, 5, 6 ) as a measurement
for the BS effectiveness (see Annex 4). Each of the chosen indicators is analyzed separately.

Chapter III: Research design and Methodology
29
The descriptive question related to the dependent variables is: What is the variation in the
success rate of the EU BS in contributing to the achievement of 2000 MDGs in Health?
3.2.2. The Independent Variables and Hypotheses
Qualitative Institutions: This variable is inspired by the work of Acemoglu and Robinson,
2012, they distinguish between inclusive (qualitative) institutions and extractive institutions.
Descriptive question: What is the variation in the quality of institutions of EU SBS Health Beneficiary
Countries?
Inferential Question: Is the variation in EU SBS effectiveness related to variation of the institutions
quality of beneficiary countries?
Hypothesis 1: The EU SBS in Health is more effective in countries with qualitative institutions.
Good Policies: This variable is based on the conclusion of the Burnside and Dollar, 2000
seminal work. Aid can be effective if it is delivered in a good policy environment.
Descriptive question: What is the variation in the policy environment of Beneficiary Countries of EU
SBS in Health?
Inferential Question: Is the variation in EU SBS effectiveness related to variation of PGs’ policy
environment?
Hypothesis 2: The EU SBS in Health is more effective in a good policy environment.
Aid funds versus government resources: the last independent variable is based on the paper
of Cordella and Dell’Ariccia, 2003. According to their study the budget support is a better instrument
if the aid funds are relatively smaller than the government’s resources.
Descriptive question: What is the variation of the ratio of EU SBS disbursements and Beneficiaries’
budgets in health?
Inferential Question: Is the variation in EU SBS effectiveness related to variation of the ratio of EU
SBS disbursements and Beneficiaries’ budgets in health?
Hypothesis 3: The EU SBS in Health is more effective if the EU SBS disbursements are smaller than
the Beneficiaries’ budgets in Health.
3.2.3. Method and scope
The evaluation of programmes brings important methodological challenges. According to
Dijkstra and de Kemp, 2005, there are possible 4 approaches for evaluating the BS programme (see
Annex 10). Considering the complexity of this aid method, they propose combining the econometric

Chapter III: Research design and Methodology
30
and case studies approaches. This suggestion won’t be followed because of the limits of this study.
Instead, it will do cross-country regressions by employing an econometric method. The reason lies in
the advantage of econometric methods which is its rigorous hypotheses testing.
The chosen method will be the Ordinary Least Square regression (OLS). The study will use a
data sample comprehending all 16 EU SBS Health recipients in the period 2004-2015 (see Annex 9).
3.2.4. The operationalization of variables and the data
The current subsection is previewed for the operationalization of the above-identified
variables and for the clarification concerning the used data.
The dependent variable: Effectiveness of BS will be measured using 3 indicators linked to
monitoring the progress of MDGs 4, 5, 6. These are: (i) Maternal mortality ratio (modeled estimate,
per 100,000 live births); (ii) Infant mortality rate (per 1,000 live births); (iii) Prevalence of HIV, total
(% of population ages 15-49). Each of them is regressed separately. It would be possible to combine
them, but by doing it, it is assumed that all three indicators measure identical problems with
identical solutions. There are more indicators for monitoring the MDGs 2000 in health sector (United
Nations,2003:3), but these three permit having all data available for the entire sample and analyzed
period. Most of the AEL uses the GDP per capita growth rate for operationalization of the dependent
variable. But considering the analyzed sector and time span, this won’t make sense. The
improvement in Health sector may positively affects the growth rate in a long period of time through
the improvement of labor productivity (Clemens et al, 2004). In short term, it has negative effects on
GDP per capita as the number of population increases. The positive impact of labor productivity
improvement may need 20 years or even more to outweigh the effect of increased population
number in the GDP per capita (Acemoglu, Johnson, 2007).
The first independent variable: Inclusiveness of Institutions is probably the most difficult one
to be operationalized due to the complexity of its notion. This thesis follows the same approach as
Burnside and Dollar, 2004 using the average of the 6 Kaufmann, Kraay and Zoido-Lobaton indicators
(KKZ indicators). The main raison for choosing this database is the availability of data for all 16 EU
SBS Health recipients. There could have been used other alternatives, like International Country Risk
Guide (ICRG) or Freedom House index, though; these don’t have all of the data available. As well, if
performing some regressions, KKZ seem to combine the information from these two sources
(Burnside, Dollar, 2004).
The second independent variable: Good policies use the trade-to-GDP ratio and inflation rate
(consumer prices, annual %). Ideally, the Good Policies variable should have followed the same

Chapter III: Research design and Methodology
31
definition as given in Dollar and Burnside, 2000. The reason for applying such a definition of good
policy for Health sector is that if a government is following good economic policies, then it
implements good policies in the other sectors, as well. Burnside and Dollar employed a policy index
which included the Sachs and Warner dummy as a trade openness index, inflation and fiscal surplus.
Unfortunately, there is no updated dataset for Sachs and Warner dummy. In addition, the dummy
has been criticized for its subjectivity and for being opaque (a close economy may mean different
things) (Easterly, 2003). An alternative could have served the data originating from Global Enabling
Trade Reports issued by World Economic Forum. Unfortunately, these reports provide data only for
a couple of years and it excludes 6 out of the 16 analyzed countries. A similar problem refers to fiscal
surplus10. Another option for measuring the quality of policies could be the CPIA provided by WB;
once again, certain countries have no data provided. Thus, the study will follow Easterly, 2003
suggestion using the trade-to-GDP ratio for measuring the integration with global trade and the
inflation rate for monetary policy.
The last variable which tests the findings of Cordella and Dell’Ariccia is simply operationalized
through the ratio between the total BS disbursements and the total PGs’ public spending in health
sector during the analyzed period.
The databank of the WB Data constitutes the source for all three indicators for measuring
the MDGs performance, the KKZ indicators, the trade-to-GDP ratio, inflation rate (consumer prices,
annual %), the government expenditure in the health sector (% GDP) and the number of population.
The data on EU BS disbursements in health sector was collected from the OECD CRS1.
Unfortunately, this database distinguishes the BS from other aid instruments’ flows only starting
from 2010. Such data can be found using OECD microdata feature. Thereby, the EU Aid explorer
permitted to identify the beneficiaries of EU SBS in Health sector during 2004-2009 and the name of
the programmes, while the microdata of OECD CRS1 provided the disbursed amounts in every year
(in USD, current prices). The OECD CRS1 was also the source for the total aid in health sector
received by the 15 beneficiaries of EU SBS, from all donors, during 2004-2015.
The Sub-Saharan Africa dummy is a control variable widely used in AEL. It will be applied in
this study, as well. It was possible to use some other control variables like ethnic fractionalization
index proposed by Alesina et al., 2003. Although, this index shows a high positive correlation with
the Sub-Saharan Africa dummy (this should be of no surprise taking into account the way the African
10
It could have been calculated using “Revenue, excluding grants (% of GDP)”, “Grants, excluding technical
cooperation (BoP, current US$)”, “Expense (% of GDP)” from WB Database, but there is missing data for a
number of countries;

Chapter III: Research design and Methodology
32
countries borders were traced by the colonizers) and a high negative correlation with the quality of
institutions indicators. The Annex 11 contains the names of all variables and their description.
3.2.5. The limits of the Research design and data
This master thesis has important limits which should not be ignored. These limits refer to
each of the variable and the chosen research method.
The BS programmes may have various objectives and the recipient countries may be
confronted with different problems in the health sector (as tuberculosis in Moldova). Thus, the
above 3 MDGs for measuring the effectiveness of BS health are not grasping the entire BS impact. In
addition, the aid funds, BS included, are fungible. It does not automatically mean that the BS funds
could be diverted to achieve non-development objectives, though, this is a possibility. The BS funds
could be used for other development programmes (let suppose some urgent expenses). Once again,
there will be a positive effect of BS on development in general, but not visible in the 3 chosen MDGs.
The measurement of independent variables has, as well, drawbacks. The institutional
quality indicators are subjective and the KKZ is not an exception. Thereby, there is the risk of “hallo
effect”. This means the fast growing economies could be better rated even if the institutional
framework has not improved (Burnside, Dollar, 2014). Regarding the institutions, there could be the
risk of endogeneity, eg: influence of BS on institutional quality or of MDGs performance on
institutional quality. But having analyzed only 12 years, there should be no causation from BS or
MDGs performance on the institutions.
Some of problems linked to good policy measurement have been already stated above. The
lack of the policy index following the BD Approach is an important one. Neither the inflation rate nor
the trade-to-GDP ratio reflects the quality of government policies. Very often, the government has
little influence on the inflation, while trade-to-GDP ratio may reflect the size of the economy. The
small countries have higher trade-to-GDP ratios. Nevertheless, the most important issue is what
would be the correct definition of good policies. The correct answer would be: it depends on the
context and sector and this study ignores this aspect.
The chosen method has important limits as well. The reduced number of observations and
the limited time span does not allow establishing a veritable causal link between the dependent and
independent variables. There are performed some robustness checks but with reduced explanatory
power. Such an exercise would require more observations, a longer period of time and the
application of other methodologies.

Chapter IV: Empirical Research
33
Chapter IV: Empirical research
The last chapter of this dissertation is of a crucial importance for concluding this study. Its
aim is twofold. Firstly, it intends to shade light on the chosen empirical strategy for checking the
hypothesis mentioned above. Secondly, it provides the obtained results and interpretation.
4.1. The empirical strategy and the descriptive statistics
The two sub-sections from below aim to swiftly inform about the empirical strategy adopted
to confirm or dismiss the hypotheses from the above and to summarize the used data used by this
study.
4.1.1. The empirical strategy
The adopted strategy allows looking for the responses to the two questions raised in section
1.2. The first one is about the impact of EU BS in the achievement of MDGs. In fact, this is the same
question as the descriptive question related to the dependent variables (see subsection 3.2.1). This
question ignores the mixed results of the evaluation reports and checks whether EU SBS in the
health sector works no matter of the circumstances in the beneficiary country. The second question
which is the main question of this study tries to identify whether there are any conditions for the BS
to be effective in the MDGs’ attainment. Its response permits confirming or rejecting the
aforementioned hypotheses.
For having the response to the first question, there is created a dummy for introducing the
EU BS Health funds in the regression equation. The BS dummy (bsdummy) receives the value “1” for
the years with EU BS disbursements in the health sector, and “0” for the years with no
disbursements. Thus, the results tell us whether the countries performed better in the years with BS
disbursements or not. The critics to such an approach would be that it is looking for instantaneous
results and it is needed to allow the control variable: BS dummy to influence the dependent one
with a time lag. The reason for following this approach is that the dialogue between the PGs and the
EU concerning the strategy in the Health sector is taking place long before the funds to be disbursed.
During the dialogue period, the PGs receive technical assistance from EU for identifying the
problems and elaborating the strategy for the health sector. At the moment of funds’ transfer, the
agreed strategies should be started to be implemented.
Thus, the econometric model for having the response to the first question is:
(1)

Chapter IV: Empirical Research
34
where denotes the infant mortality rate, maternal mortality ratio and HIV prevalence
ratio, is the Budget Support dummy, is a set of control variables: government
expenditure in the health sector, total aid received in health sector, the average of KKZ indicators,
inflation, trade-to-GDP ratio, GDP growth rate, number of population and Sub-Saharan Africa
dummy (check Annex 11 for the abbreviations and notions of each of the variables). Before running
the regression, it is checked that the correlation between the independent variables to be low. There
are performed three separate regressions, each of them taking different dependent variables:
.
The year and country effects are controlled, too. The use of country (year) variables allows
to wash out the effect of non-observed country (year) characteristics; however, especially with small
dataset and in presence of variables with relatively small variance, fixed effect control variables tend
to reduce the significance of the explanatory variables. This is an important weakness, but this is
mostly the consequence of the reduced dimension of the dataset.
The response to the second question is given by following a similar strategy. But, this time,
there is used a categorical variable for representing the BS funds (bscat). This ranges from 1 to 4. It
receives: (i) the value “1” for the years with no BS disbursements; (ii)“2” – for the years when BS
disbursements were between 0.001-1.999% of Government expenditure in Health sector; (iii) “3” -
BS disbursements between 2% - 4.999%; (iv) “4” - BS disbursements > 4.999%. The regression model
is similar to equation (1):
(2)
where the dependent and independent variables are the same as in equation (1) except the
categorical variable inclusion for representing the BS funds (bscat). This model tells us whether the
ratio between the received Budget Support funds and the Government expenditure in the health
sector matters. The positive and significant coefficient for bscat would confirm the third hypothesis.
The introduction of an interaction terms between the bscat and the variable for measuring
the institutional quality (kkz)11, trade integration (trad) and inflation (infl) allows rejecting or not the
first and second hypotheses. As an example, the equation for the interaction between institutional
quality (kkz) and bscat is below:
(3)
11
For avoiding having negative numbers or numbers less than 1 ( - these would affect the interaction between
the bscat and kkz differently), the kkz indicators scores have been summed with 3.5, like that they range from
1 to 6, after that the average has been calculated. This manipulation has been done only for the OLS
regressions. The tab 4.1. reflects the original values.

Chapter IV: Empirical Research
35
where the dependent and independent variables are the same as in equation (1) except the
use of bscat and the interaction term between bscat and the variable for measuring the institutional
quality ( ). This time, there are run 9 regressions, basically (3 per each dependent
variable). Once again, the year and country effects are controlled.
4.1.3. The descriptive statistics
The table 4.1. summarizes the data used by this study which refers to all 16 analyzed
countries during 2004-2015.
Table 4.1: Descriptive statistics
Variable Mean Std. Dev.
Min Max
Infant mortality rate (per 1000 live births) 41.01 21.73 11.70 94.50
Maternal mortality ratio (per 100 000 live births) 256.15 255.74 23.00 1110.00
Prevalence of HIV (% of pop. ages 15-49) 3.56 5.86 0.10 18.90
Government health expenditure (% of GDP) 1.90 1.21 0.30 5.83
Total aid received in health sector (per capita) 4.56 5.65 0.00 48.48
Total aid received in health sector (% of GDP) 0.76 1.28 0.00 10.72
*BS to Government health expenditure ratio 0.02 0.05 0.0007 0.23
Inflation, consumer prices (annual %) 6.74 4.85 -8.28 30.55
Trade (% of GDP) 82.18 44.86 34.85 311.36
Average of KKZ indicators -0.46 0.57 -1.77 1.21
Voice and accountability -0.40 0.72 -1.57 1.15
Political Stability -0.52 0.86 -2.71 1.28
Regulatory Quality -0.35 0.59 -1.86 1.16
Rule of Law -0.71 0.64 -1.90 1.44
Control of Corruption -0.41 0.65 -1.64 1.73
GDP growth rate 5.70 3.14 -6.00 21.02
GDP per capita (in current USD) 2764.98 3886.43 272.86 16762.71
Population, total (mln) 107.00 209.00 0.27 1310.00
Number of observations 192.00
*BS to Government health expenditure ratio represents the ratio between the total amount of EU BS
Health and the total amount of Government health expenditure during 2004-2015 (both in current
USD).
The first three rows cover the data on the dependent variables and they show how different
the analyzed countries are in terms of MDGs referring to the healthcare. The most striking difference
refers to maternal mortality, with a lowest record of 23 deaths per 100’000 live births registered in
Moldova, in 2015; and a highest one of 1110 deaths recorded in Liberia, in 2004. South Africa has a
negative record for Prevalence of HIV for this sample of countries, with around 18% of people ages
15-49 infected with HIV.

Chapter IV: Empirical Research
36
These 16 countries spent on average 1.9% of their GDP12 in the health sector. Afghanistan,
India and South Africa spent less than 1%. The countries that allocate the highest GDP shares are
Barbados (3-4% of GDP) and Moldova (on average 5.2% of GDP during the analyzed period). Liberia
received the highest amount of aid in this period with $48.48 USD per habitant (current prices) in
2015 which constituted 10.72% of Liberia’s GDP in that year. This should be of no surprise. After
more than 10 years of civil wars, this country is still in profound need of external assistance. If only
the flows of EU BS funds to Liberia are analyzed, they represented 0.23% of the total amount of
Liberia’s government spending in health sector (the first EU BS disbursement was in 2012). In 2014,
the EU BS disbursement was of 115% of Liberia’s public spending in health sector. This should be
viewed as exception as on average the EU BS funds constituted only 0.02% of all 16 countries’ public
expenditure during this period.
The data on inflation rate, trade-to GDP ratio, and the KKZ indicators respond to the
descriptive questions referring to the first and second hypothesis (see subsection 2.2.2.). It might be
said that there is a quite high heterogeneity. It is interesting to take a look to institutional indicators.
The outliers are Afghanistan and Tajikistan with the worst average score of KKZ indicators. The
minimum of -2.7 score for Political stability is odd as the lowest score should be of -2.5. This has
been given to Afghanistan in 2009 for underlining the highly unstable political situation. In general,
the Afghanistan Political stability average score is of -2.45 for this period. The best institutions seem
to be in Barbados, just as the highest GDP/cap: $16762.71 USD (current prices) registered in 2007.
There have been many voices criticising the transfer of aid funds to a high income country like
Barbados, especially considering such countries as Afghanistan, Burkina Faso, Liberia, Mozambique
from our sample with a GDP/cap with less than 700 USD (current prices). The development
cooperation transfers to Barbados, in fact, ceased in 2011.
4.2. Presentation and Interpretation of the Research results
This subsection presents the results obtained by this study and their interpretation. First of
all, it reveals the findings on the impact of EU BS Health on the analyzed MDGs. Secondly, it provides
the results on checked hypotheses and it presents them per each of the dependent variable.
4.2.1 The impact of budget support on MDGs indicators
The Tab. 12.1 of Annex 12 reports the results of the estimations on the relationship between
the Budget Support dummy and the evolution of infant mortality, maternal mortality and prevalence
of HIV rates. There are 3 columns per each dependent variable. The first one presents the
12
This includes only the public expenditure on health from domestic sources.

Chapter IV: Empirical Research
37
estimations without controlling for the fixed effects of countries and years. The second one reports
the estimations controlling the countries’ effects, whilst the third one controls for both the countries
and years unobserved effects. The years and countries dummies aren’t included in Tab. 12.1 to save
space.
Considering the limited sample of countries and time span, it should be of no surprise that
the results are quite weak and few conclusions can be drawn. Nevertheless, it is possible to notice
that except when controlling for years fixed effects, the Budget Support Dummy coefficients are
negative and significant for infant mortality as regressand variable. Such a result is resilient to
exclusion and inclusion of different control variables. A first conclusion would be that the 16
analyzed countries had better results in diminishing the infant mortality, in the years with EU BS
Health disbursements. It won’t be possible to say, though, that there is a causal relationship. The
study of Beynon, Dusu 2010 confirms that the countries receiving BS (it was GBS in their case)
performed better at decreasing the child mortality rate.
The impact BS Dummy on the other two dependent variables is, unfortunately, unclear. This
might seem strange in case of maternal mortality rate; especially, taking into account that there is a
high correlation between the infant and maternal mortality ratios (0.85 for the sample of 16
analyzed countries). An explanation would be that very often the causes of infant mortality may be
easily remediated through access to basic services and simple, inexpensive interventions (Viguera
Esteret al., 2011). The vaccine-preventable diseases, oral rehydration therapy or insecticide-treated
nets makes a huge difference for diminishing infant mortality rate. The increase of public spending
thanks to BS may improve the access to these types of interventions and an instantaneous impact is
observed. On the other hand, the causes of maternal mortality rate are more complex (Fillipi et al.,
2016). Its amelioration requires very often skilled care during and after the childbirth. Thus, a simple
increase in public spending won’t bring immediate results. A long-term strategy implying investment
in medical personnel trainings, constructions of hospitals in remote rural areas and better
equipment for the existed ones should be envisaged.
The HIV prevention strategies involve large information campaigns and AIDS-prevention
education programs. This doesn’t suppose only the state intervention, but also active participation
of non-governmental groups. BS is focused mostly on the improvement of public administration and
services in health sector. Most likely, it is difficult to find a clear link between Budget Support and
HIV prevalence rate, even if this is one of the MDGs indicators. As well, Beynon, Dusu 2010 excluded
the analysis of HIV/AIDS indicator from their study about the BS and MDG performance because of

Chapter IV: Empirical Research
38
the high amount of money provided through vertical funds. Thus, probably, there are important
factors affecting the HIV prevalence that are not taken into account by the used econometric model.
4.2.2. The verdict on the analyzed hypotheses
The analyses of the regressions embodying the created BS categorical variable give the
responses whether the three stated hypotheses of this master thesis may be rejected or confirmed.
The results referring to each of the dependent variable: infant mortality, maternal mortality and HIV
prevalence are presented separately in the tables 12.2, 12.3 and 12.4 of Annex 12. These tables
include 4 columns for the results. The first column reports the OLS regression using the BS
categorical variable. The second one provides the estimates of the regression which incorporates the
interaction between the BS categorical variable and the average of KKZ indicators variable. The other
two refer to the BS categorical variable interaction with inflation variable and trade variable,
respectively. Each of these 4 regressions control for the countries and years fixed effects, but the
years and countries dummies are excluded to save space.
4.2.2.1 Infant Mortality rate
It can be seen in Table 12.2. of Annex 12, that the significance level for the budget support
categorical variable is low for infant mortality rate as dependent variable, in most of the performed
regressions. The only exception is the inclusion of BS x Inflation interaction term. This implies that
the ratio between the BS disbursements and the government expenditure amounts in health sector
doesn’t have a significant impact on the evolution of infant mortality. This confirms neither the
findings of Beynon, Dusu, 2010 nor the ones of Cordella, Dell’Ariccia, 2003. Thereby, the third
hypothesis doesn’t hold, most likely.
Unexpectedly, the interaction between the institutional quality variable and BS categorical
one receives low and insignificant coefficients. In general, the average of KKZ indicators variable
does not receive significant coefficients if the dependent variable is infant mortality. This goes
against the findings of Burnside and Dollar, 2004 which uses the same indicator for measuring the
institutional quality. An explanation would be that the interaction term requires a time lag for
manifesting the impact on infant mortality. Nevertheless, the first hypothesis can be neither
confirmed nor dismissed. The interaction between BS categorical variable and trade-to-GDP ratio
variable has insignificant results. But the interaction with the inflation variable acquire a positive
coefficient and significant at 0.01 (significance) level. This may be a hint that the second hypothesis
which stresses the importance of good economic policies. This hypothesis has more chances to point
into the right direction. The provision of budgetary aid in countries with high inflation levels appears

Chapter IV: Empirical Research
39
to be harmful for the decrease of infant mortality rate. A stable economic environment may be very
important for the provision of budgetary aid. Thus, despite all of the critics, the conclusion of
Burnside and Dollar, 2000 might be true in case of Budget Support in health sector.
In conclusion, if the dependent variable is infant mortality, the first and third hypotheses are
not confirmed. In case of quality of institutions as the independent variable, a time lag may be
needed. If the definition of good economic policies resumes to low level of inflation, then probably
the second hypothesis has more chances not to be rejected. Nevertheless, the limits mentioned in
section 3.2.5 should be taken into consideration when interpreting the results. In the case of all
three hypotheses, there are needed deeper studies with better data, more observations, longer
periods of time, the use of time lags for arriving to firmer statements.
4.2.2.2. Maternal Mortality rate
The results for the regressions with the maternal mortality ratio as dependent variable are
presented in Table 12.3. of Annex 12. They are very similar with the ones when the dependent
variable is infant mortality. The coefficients of BS categorical variable are not significant. The
interactions between BS categorical variable and KKZ indicators average variable or trade-to-GDP
one, as well, do not acquire significant results. Only the one with inflation is significant at 0.1 level.
The conclusion is as for the above subsection: the first and third hypotheses are rather
dismissed, but the limits of this study should be considered. The second hypothesis about the
importance of economic policies appears to be more veridical; nevertheless, further investigations
are needed.
It is also necessary to bring into attention that trade-to-GDP variable appears to be
important for maternal mortality. It receives positive coefficients at high significance level and the
results appear to be quite robust (check both 12.1. and 12.3. of Annex 12). It means, higher values of
trade-to-GDP correspond to higher levels of maternal mortality. It may indicate that the trade-to-
GDP ratio does not show the integration in the world trade in this case, but rather the economic
dependence of the outside world because of weak economic activity inside the country. During the
high instability periods in Liberia, for example, this ratio constituted more than 250%. Still, further
studies are needed for clarifying the real relationship among these two variables.
4.2.2.3. HIV prevalence ratio
The Table 12.4 of Annex 12 reports the OLS regressions with HIV prevalence ration as
regressand variable and BS categorical variable as one of the independent ones. The coefficients of
BS categorical variable tell that just as in case of infant and maternal mortality rates, the third

Chapter IV: Empirical Research
40
hypothesis is not confirmed. The countries that received lower amounts of BS comparing to the
domestic resources neither performed better nor worse.
The obtained coefficient for the interaction term between BS categorical variable and the
average of KKZ indicators one has a positive sign and it is significant at 0.1 level. This goes against the
expectations. The countries with better institutions and higher amounts of budget support had
fewer successes in fighting the HIV prevalence. The average of KKZ indicators control variable, on the
other hand, shows all of the time negative coefficients at high significance level. Thus, the countries
with better and improving institutions are more successful at fighting HIV prevalence. There might
be various explanations for the positive coefficient of the interaction term. A first would refer to the
drawbacks of the model and the possibility that it omitted important control variables for the HIV
prevalence. Thereby, it will call for further investigations. Nevertheless, a second explanation would
collude with the opinions of Moyo, 2009 and Djankov et al., 2006. The high amounts of budget
support harm the institutions in the recipient countries and this affects the achievement of MDGs.
But, there would be a number of problems. Firstly, it is unclear why the other two dependent
variables don’t show the same relation. Secondly, it is doubtful within 12 years the institutional set-
up in the EU BS beneficiaries to be modified as result of Budget Support, especially considering its
reduced amounts. Thirdly, if the coefficients of total aid control variable are analyzed in all 4 tables
of Annex 12, they are, in majority of cases, negative and significant. Therefore, this study would
rather agree with the literature supporting the idea of either conditional or unconditional
effectiveness of aid (e.g. Clemens et al. 2004), rather than the pessimistic strand. Finally, it may be
an indirect confirmation of Cordella, Dell’Ariccia, 2003: the higher amounts of BS made the
interaction term to have positive coefficient, and not the quality of institutions. However, it is
strange that the BS categorical variable does not show it. Therefore, the first mentioned reason
concerning the drawbacks of the model is the preferred one.
The other interaction terms acquire no significance levels, so far. Thereby, if economic
stability (considered as low inflation) may give some hints towards what conditions are needed for
having some immediate effects in reducing the child and maternal morbidity rates, this cannot be
said about the HIV prevalence. The hypothesis based on Burnside and Dollar, 2000 study cannot be
confirmed, and, the limits of the current study should be taken into consideration, as well.
Conclusion
41
Conclusion
This master thesis attempts to identify whether the Budget Support delivered by the
European Union contributed to the achievement of MDGs, and more importantly, to identify
whether there were any conditions in the recipient countries that made the BS to be more effective.
It uses the Rational Choice Institutionalism as an analytical framework. The EU as a benevolent
donor by providing Budget Support assists one of the most important actors in the recipient country:
the government. But if the government is one of the causes for the recipient country’s failure, it is
necessary to identify the aspects making worth supporting that government. Based on aid
effectiveness literature, there are three hypotheses put forward: i) a qualitative institutional
environment; (ii) a qualitative policy environment; and (iii) that the resources it is ready to invest in
developmental sectors.
Analyzing the 16 beneficiaries of EU BS in the health sector during 2004-2015 by employing
an econometric method, the study finds that countries obtained better results in diminishing the
infant mortality in the years with EU BS disbursements. Nevertheless, it is not possible to say that
there is a true causal relation. The results show BS combined with low inflation influences positively
the reduction of child and maternal morbidity. If low inflation is viewed as a sign of good economic
policies, then, this evidence supports the findings of Burnside and Dollar, 2000: a qualitative policy
environment makes aid to be effective. Once again, it is difficult to speak about a veritable causal
link. In case of HIV prevalence there is an unexpected outcome. The provision of higher volumes of
budget support in a country with qualitative institutions affects negatively the reduction of HIV
prevalence rate. Such results are subscribed to the limits of the used model, and it calls for further
investigations. Apparently, the countries that received lower amounts of BS comparing to the
domestic resources neither performed better nor worse. In general, the obtained results are quite
fragile. There is the need for deeper studies with better data, more observations, longer periods of
time, the use of time lags for arriving to firmer statements. At the same time, such econometric
studies should be complemented with case studies.
This master thesis concludes by suggesting how this study could be extended so, that new
light can be shed on the effectiveness of Budget Support delivered by the EU. The reality dismisses
the assumption that the EU acts as a benevolent donor. It clearly follows strategic purposes. Its
Budget Support programmes are designed for meeting two sets of objectives: the EU strategic
objectives and the development ones. If the definition of Budget Support effectiveness is extended
so it embodies the EU foreign policy objectives, one may ask: how many and how well the EU
strategic and developmental objectives are met thanks to Budget Support?

Bibliography
42
Bibliography
Acemoglu, D. et al. (2001) “The colonial origins of comparative development: an empirical
investigation”, American Economic Review, American Economic Association, vol. 91(5), pp. 1369-
1401;
Acemoglu, D. et al. (2001) “Unbundling Institutions”, Journal of Political Economy, vol. 113,
no. 5, pp. 949-995;
Acemoglu, D. and Johnson, S. (2007) “Disease and Development: the effect of life
expectancy on Economic growth” Journal of Political Economy 115(6), pp. 925-985;
Acemoglu, D., Robinson, J. (2012a) “Why Nations Fail: the origins of power, prosperity and
poverty” Crown Business, New York;
Acemoglu, D., Robinson, J. (2012b) “Response to Jeffrey Sachs”, WhyNationsFail blog,
available at http://whynationsfail.com/blog/2012/11/21/response-to-jeffrey-sachs.html , last
checked 1st of August, 2018;
Alesina A. Et al. (2003) “Fractionalization”, Journal of Economic growth, 8, pp. 155-194;
Alvarez, R. (2010) “The rise of Budget Support in European Development cooperation: a false
panacea”, FRIDE, policy brief, No. 2010;
Beynon, J., Dusu, A. (2010) “Budget Support and MDG performance” , European
Commission, Directorate-General for Development and Relations with African Caribbean and Pacific
States, Development Paper No. 2010/01;
Bodenstein, T. et al. (2016) “European Union Development Policy: Collective Action in times
of global transformation and domestic crises”, Development policy review, 0 (0): 1-13;
Burnside, C. and Dollar D. (2000) “Aid, policies and growth”, American Economic Review,
90(4), pp. 847-868;
Burnside, C. and Dollar D. (2004) “Aid, policies and growth: Revisiting the evidence”, Policy
Research Paper Number O-2834, The World Bank, Development Research Group, Washington, D. C;
Carbone, M. (2007) “The European Union and International Development: the politics of
Foreign Aid”, London: Routledge;

Bibliography
43
Carbone, M. (2008) “Mission Impossible: the European Union and Policy Coherence for
Development”, European Integration, 30:3, pp. 323-342;
Carbone, M. (2011) “The European Union and China’s rise in Africa: Competing visions,
external coherence and trilateral cooperation”, Journal of Contemporary African Studies, Vol, 29,
No. 2, pp. 203-221;
Carbone, M. (2013a) “Between EU Actorness and Aid Effectiveness: The logics of EU aid to
sub-Saharan Africa”, International Relations;
Carbone, M. (2013b) “International development and the European Union’s external
policies: changing contexts, problematic nexuses, contested partnerships” Cambridge Review of
International Affairs;
Clemens et al. (2004) “Counting chickens when they hatch: the short term effect of aid on
growth”, Center for Global Development, Working paper number 44;
Collier, P. (n.d.) “Should Budget Support Be Discontinued?” Washington, DC: International
Monetary Fund;
Cordella, T., Dell’Ariccia, G. (2003) “Budget Support versus Project Aid”, International
Monetary Fund Working Paper 88/03, Washington, DC: IMF;
Creswell, J. (2003) “Research design: qualitative, quantitative, and mixed methods
approaches”, London : Sage;
DAC (2006a) “DAC in dates: the History of OECD’s Development Assistance Committee”,
Paris: DAC;
DAC (2006b) “Development cooperation report 2005”, Paris: DAC, available at
http://www.oecd.org/development/effectiveness/36364587.pdf (last checked 10thf April, 2018);
Defraigne, J-C, Belliogoli, S. (2010) "Ties between business and aid programs in Africa: A
comparative analysis between the European and the Chinese cases" EBHA annual conference;
Dalgaard et al. (2004) “On the Empirics of Foreign Aid and Growth”, The Economic Journal
114(496), pp. 191-216;
Degnbol-Martinussen, J., Engberg-Pedersen, P. (2003) "AID : understanding international
development cooperation" London, Zed books;

Bibliography
44
Del Biondo, K., Orbie J. (2014) “The European Commission’s implementation of budget
support and the governance incentive tranche in Ethiopia: democracy promoter or development
donor”, third World Quarterly, Vol. 35, No. 3, pp. 411-427;
DEval (2017) "What we know about Budget Support. Evaluation Synthesis", Bonn: German
Institute for Development Evaluation (DEval);
Dijkstra, G., de Kemp, A. (2015) “Challenges in evaluating budget support and how to solve
them”, Evaluation 21(1):83-98;
Djankov, S. Et al (2006) “Does Foreign aid help?” Cato Journal, Vol. 26, No. 1, pp. 1-28;
Easterly, W. (2001)” The Elusive Quest for Growth”, MIT Press: Cambridge MA;
Easterly, W. (2002) “The cartel of good intentions: The problem of bureaucracy in foreign
aid”, The Journal of Policy Reform, 5 (4): 223-250;
Easterly, W. (2003) “Can Foreign Aid buy growth?”, Journal of Economic Perspective –
Volume 17, Number 3- Summer: 23-48;
Easterly, W., et al. (2004) “New data, new doubts: A Comment on Burnside and Dollar’s 'Aid,
Policies, and Growth' (2000)." American Economic Review 94, 3: 774-780;
EC Directorate General for Development (2006) European Commission Budget Support: An
innovative approach to Conditionality in Koeberle, Stefan, Zoran Stavreski, and Jan Walliser (eds)
Budget Support as More Effective Aid? Recent Experiences and Emerging Lessons. Washington, DC:
World Bank Publications;
European Commission (2004) “Aid Delivery Methods: Project Cycle Management
Guidelines”, Brussels: European Commission;
European Commission (2007) Guidelines on the Programming, Design and Management of
the general Budget Support, AIDCO DEV RELEX, Brussels;
European Commission (2008) “Budget Support: A question of Mutual Trust”. Brussels:
European Commission;
European Commission (2011) “Communication from the Commission to European
Parliament, the Council, the EESC and CoR. The Future Approach to EU Budget Support to Third
Countries”, Brussels: European Commission;

Bibliography
45
European Commission (2012) “Budget Support Guidelines”, Brussels: European Commission;
European Commission (2016) Budget Support Annual Report 2016, Brussels: European
Commission;
ECA (2010) "EU development assistance for basic education in Sub-Saharan Africa and South
Asia", Special Report No 12, Luxembourg: European Court of Auditors;
ECA Press (2013) "EU Support for governance in Egypt - "well-intentioned but ineffective”,
say Auditors", Luxembourg: European Court of Auditors;
ECA Press (2016a) "Moldova: "only limited evidence of progress" from EU Support say
Auditors", Luxembourg: European Court of Auditors;
ECA Press (2016b) "EU assistance to Ukraine: results so far are “fragile”, say Auditors",
Luxembourg: European Court of Auditors;
Faust, J., Koch, S. (2014) “Foreign Aid and the Domestic Politics of European Budget
Support”, German Development Institute, Discussion paper 21/2014;
Filippi V., et al. (2016) "Chapter 3: Levels and Causes of Maternal Mortality and Morbidity" in
Black, R., Laxminarayan, R., Temmerman, M., and Walker N. (eds) "Reproductive, Maternal,
Newborn, and Child Health" Washington (DC): The International Bank for Reconstruction and
Development / The World Bank;
Frisch, D. (2008) "The European Union’s development policy. A personal view of 50 years of
international cooperation" Maastricht-ECDPM;
Gerster, R. (2007) “Aid Effectiveness: The Case of General Budget Support”, Swiss Review of
International Economic Relations (Aussenwirtschaft) of the University of St. Gall;
Grimm, S. (2008) “Reforms in the EU's aid architecture and management: the Commission is
no longer the key problem; let's turn to the system”, Bonn, German Development Institute
(Discussion Paper 11/2008);
Guillaumont, P., Chauvet, L. (2001) “Aid and performance: a reassessment”, Journal of
Development studies, 37(6), pp. 66-7;
Gunning, J. W (2006) “Budget Support, Conditionality and Impact evaluation” in Koeberle, S.
et al. (eds.) “Budget Support as More Effective Aid? Recent Experiences and Emerging Lessons”,
Washington, DC: World Bank Publications;

Bibliography
46
Hall, P. A., Taylor R. C. R. (1996) “Political Science and the Three institutionalisms”, Political
Studies, XVIV, 936-957;
Hansen, H., Tarp, F. (2000) “Aid effectiveness disputed”, Journal of International
Development, 12: 375-398;
Hansen, H., Tarp, F., (2001) "Aid and growth regressions," Journal of Development
Economics, Elsevier, vol. 64(2):547-570;
Hauck, V. et al. (2005) “EC Budget Support: thumbs up or down?” Discussion Paper No. 63,
European Centre for Development Policy Management;
Holland, M. (2002) "The European Union and the Third World" Palgrave MacMillan;
Holland, M., Doidge, M. (2012) “Development Policy of the European Union”, Palgrave
MacMillan;
IDD and Associates (2005) “Joint Evaluation of General Budget Support 1994-2004. Inception
Report”, International Development Department, School of Public Policy, Birmingham;
IOB Evaluation (2012) Budget Support: Conditional Results, Review of an Instrument (2000-
2011), Ministry of Foreign affairs of the Netherlands;
Kitt, F. (2010) “EU Aid Architecture: Recent Trends and Policy Directions.” Washington, DC:
World Bank, p. 15
Knoll, M. (2008) “Budget Support: A reformed approach or old wine in new skins?”
UNCTAD/ OSG/ DP/ 2008/ 5;
Koch, S et al.(2016) “The rise and demise of European budget support: political economy of
collective European Union donor action”, Development Policy Review;
Koeberle, S. and Stavreski, Z. (2006) “Budget Support, Concepts and Issues” in Koeberle, S. et
al. (eds.) “Budget Support as More Effective Aid? Recent Experiences and Emerging Lessons”,
Washington, DC: World Bank Publications;
Langan, M. (2015) “Budget support and Africa–European Union relations: Free market
reform and neocolonialism?” European Journal of International Relations;
Lensink, R., White, H. (2000) “Policy Arena: Aid Allocation, Poverty Reduction and the
Assessing Aid Report”, Journal of International Development, 12 pp. 399-412;
Bibliography
47
Leiderer, S. (2015) “Donor Coordination for effective government policies?”, Journal of
International Development 27, pp. 1422-1445;
Lightfoot S., Kim S. (2017) “The EU and the Negotiation of the Global Development Norms:
The Case of Aid Effectiveness”, European Foreign Affairs Review;
Molenaers, N. et al. (2010) “Budget Support and policy/political dialogue, donor practices in
handling (political) crises”, Institute of Development Policy and Management, Discussion paper/
2010.06;
Molenaers, N. et al. (2016) "Dataset Budget Support suspensions 1999-2014 (DBSS)",
University fof Antwerp: Institute of Development Policy and Management;
Mosley P., Abrar S. (2006) “Trust, Conditionality and Aid Effectiveness” in Koeberle, S., Zoran
S., and Walliser, J. (eds.) “Budget Support as More Effective Aid? Recent Experiences and Emerging
Lessons”, Washington, DC: World Bank Publications, p. 311-331;
Moyo, D. (2009) “Dead Aid: Why Aid Is Not Working and How There Is a Better Way for
Africa”, Penguin, London;
North, D. C. (1990) “Institutions, institutional change and economic performance”,
Cambridge University Press;
Oxfam (July 29, 2011) Budget support aid: good or bad for development? Available at:
https://oxfameu.blogactiv.eu/2011/07/29/budget-support-aid-good-or-bad-for-development/; last
checked on the of 14th of April, 2018;
Orbie, J., Carbone, M. (2016) “The Europeanization of development policy”, European
Politics and Society, vol. 17, NO. 1, 1-11;
Outtara B., Strobl, E. (2008) “Ai, Policy and Growth: Does aid modality matter?”, Review of
World Economics, 144 (2), 1037-1053;
Pollack, M. A. (2009) “New Institutionalism and European Integration” in Wierner A., Diez T.
(eds.) “European Integration Theory” 2nd edition, New York, Oxford University Press, p. 125-143;
Riddell, R. C. (2007) "Does foreign aid really work?", Oxford: Oxford university press;
Sachs, J. (2012a) "Government, Geography, and Growth", Foreign Affairs,
September/October 2012 issue, available at: https://www.foreignaffairs.com/reviews/review-
essay/government-geography-and-growth, last checked: 1st of August, 2018;

Bibliography
48
Sachs, J. (2012b) "Reply to Acemoglu and Robinson’s Response to My Book Review",
JeffSachs Blog, December 3rd, 2012, http://jeffsachs.org/2012/12/reply-to-acemoglu-and-robinsons-
response-to-my-book-review/ last checked: 1st of August, 2018;
Schimdt, P. (2006) “Budget Support in the EC’s development cooperation”, German
Development Institute, Bonn;
Saurenbach, V. (2012) “Sector Budget Support in the European Neighbourhood Policy:
Promoting reform through conditionality” Master Thesis, College of Europe, Department Of
European Interdisciplinary Studies;
Svensson, J. (1998) "Foreign Aid and Rent Seeking", The World Bank;
Tarp, F. (2015) "Aid Effectiveness", Report prepared for United Nations Development Group
UNDG, available at: http://www.un.org/en/ecosoc/newfunct/pdf/aid_effectiveness-finn_tarp.pdf
last checked July, 17th, 2018;
Tavakoli H. (2011) “EU budget support: both a ‘name changer’ and a ‘game changer’”,
Overseas Development Institute, available at: https://www.odi.org/comment/6045-eu-budget-
support-both-name-changer-and-game-changer; last checked 14th of April, 2018;
Thelen, K., Steinmo, S. (1992) “Historical Institutionalism in comparative politics” in Steinmo,
S., Thelen, K., Longstreth, F. (eds.)“Structuring politics, Historical Institutionalism in Comparative
Analysis” Cambridge University Press;
Tommasi D. (2007) “Options for Sector Wide Approaches (SWAps), 2nd Africa Region
Education Capacity Development Workshop - Country Leadership and Implementation for Results in
the EFA FTI Partnership”, Tunis;
Van Bilzen, G (2015) "The development of aid", Newcastle upon Tyne: Cambridge Scholars;
Viguera Ester, P. et al. (2011) "Factors associated to infant mortality in Sub-Saharan Africa", J
Public Health Africa, 2(2): a27;
Verschaeve J., Orbie J. (2018) "Ignoring the elephant in the room? Assessing the impact of
the European Union on the Development Assistance Committee's role in international
development", Dev Policy Rev.; 36:O44–O58;
United Nations (2003) "Indicators for monitoring the Millennium Development Goals.
Definitions, Rationale, Concepts and Sources" New York: United Nations.

Annexes
49
Annexes
Annex 1: The project approach
Tab. 1.1: Definition, advantages and disadvantages of project approach
Definition a series of activities aimed at bringing about clearly specified objectives
within a defined time-period and with a defined budget”100
Advantages Disadvantages
If the PG is not reliable, it allows to
circumvent it and promote
development101;
The donor has maximum control over
the use resources (maximum
consistency with the donors’ priorities) 102;
Donor’s possibility to come with
tangible results and “show the flag”103;
The public opinion in donor country
may be intolerant to financial transfer
to recipients’ governments104;
Regional initiatives, pilot projects,
cooperation with non-state actors, or
large international tenders with high
transaction costs are better suited by
the projects105;
Narrow view on how the funds are used
without adequate appreciation of the
‘fungibility’ issue106.
Inadequate local ownership107;
Establishment of parallel systems (outside
the PG budget) for managing the
resources108;
The donor has limited influence over the
PGs programmes and policies (reduced
consistency with the PG strategies)109;
Aid fragmentation - each project may adopt
different rules for tendering,
implementation, reporting and
evaluation110;
High Transaction costs steaming from aid
fragmentation111;
Low disbursement rate112;
High emphasis on new projects and reduced
interest for maintenance servicing113;
100
European Commission (2004) Aid Delivery Method : Project Cycle Management Guidelines, Brussels, p. 8 ; 101
Ibid. p. 14; 102
Ibid. p. 13; 103
Van Bilzen, G (2015) "The development of aid" Newcastle upon Tyne : Cambridge Scholars, p. 197; 104
Ibidem; 105
European Commission (2004) Aid Delivery Method : Project Cycle Management Guidelines, Brussels, pag. 14 ; 106
Fungibility refers to the fact that donors’ projects frees financial resources of national budgets so, the PGs can re-direct
them to other purposes like instead of building schools they would construct government palaces. However, the fungibility
of aid does not characterize only the project approach, the other approaches suffer of it too (Ibid. p. 10); 107
Ibid. p. 11; 108
Ibidem; 109
Ibid. p. 13 ; 110
IOB Evaluation (2012) Budget Support: Conditional Results, Review of an Instrument (2000-2011), Ministry of Foreign
affairs of the Netherlands (pag. 33); 111
European Commission (2004) Aid Delivery Method : Project Cycle Management Guidelines, Brussels, p. 13 ; 112
Van Bilzen, G (2015) "The development of aid" Newcastle upon Tyne : Cambridge Scholars, p. 197; 113
Ibidem;

Annexes
50
Annex 2: Sector Approach
Figure 2.1: The place of Sector Approach in the framework of European Commission Aid delivery
Methods
Source: The figure represents a combination of two charts originating from: European Union (2007)
Aid Delivery Methods. Guidelines on the Programming, Design & Management of General Budget
Support, Brussels (pag. 12) and Tommasi D. (2007) “Options for Sector Wide Approaches (SWAps),
2nd Africa Region Education Capacity Development Workshop - Country Leadership and
Implementation for Results in the EFA FTI Partnership”, Tunis, (p. 4).
Tab 2.2: Distinction between sector and Project approach
Sector approach Conventional project approach
• Country holistic view on entire sector • Focus on project to support narrowly defined
objectives
• Partnerships with mutual trust and
shared accountability
• Recipient accountable to donor
• External partners' co-ordination and
collective dialogue
• Bilateral negotiations and agreements
• Increased use of local procedures • Parallel implementation arrangements
• Long-term capacity/system development
in sector
• Short-term disbursement and success of
projects
• Process-oriented approach through
learning by doing
• Blueprint approach
Source: Saurenbach, V. (2012) “Sector Budget Support in the European Neighbourhood Policy:
Promoting reform through conditionality” Master Thesis, College of Europe, Department Of
European Interdisciplinary Studies, p. 7;

Annexes
51
Annex 3: Comparison between the SAPs and BS
Figure 3.1: Structural Adjustment Programmes compared with Budget Support
* Country Strategy Paper in case of the EU;
Source: Hauck, Volker, Hasse, Oliver, Koppensteiner, Martin (2005) EC Budget Support: thumbs up
or down? Discussion Paper No. 63 March 2005, European Centre for Development Policy
Management;
Structural Adjustment
Programme (SAP)
Budget Support
(BS)
Donors and PGs
“negotiate” though
conditions are generally
dictated by donors
Policy Dialogue
between the donors
and PGs with mutual
conditions, indicators…
Formulation of an SAP which includes
requirements to implement certain
macroeconomic policies as:
- Cutting government expenditure;
- Raising export oriented domestic
production;
- Liberalizing trade and investments;
- Privatizing government services;
- Measures to guarantee currency
stability;
Formulation of PRSP* containing:
- A description of a country’s macro-
economic structural and social policies;
- A description of a programmes
designed to help the country to
achieve certain goals for poverty
reduction and economic growth;
- Clear targets, performance indicators,
sources of financing;
- description of participatory process
used for producing the PRSP.
Implementation by partner countries
assisted by the development partners
Implementation by partner countries
assisted by the development partners

Annexes
52
Annex 4: Millennium Declaration: Goals and targets
Goal Targets
GOAL 1: ERADICATE EXTREME
POVERTY AND HUNGER
TARGET 1: Halve, between 1990 -2015, the proportion of people whose income is less than
one dollar a day
TARGET 2: Halve, between 1990 -2015, the proportion of people who suffer from hunger
GOAL 2: ACHIEVE UNIVERSAL
PRIMARY EDUCATION
TARGET 3: Ensure that, by 2015, children everywhere, boys and girls alike, will be able to
complete a full course of primary schooling.
GOAL 3: PROMOTE GENDER
EQUALITY AND EMPOWER
WOMEN
TARGET 4: Eliminate gender disparity in primary and secondary education, preferably by
2005, and in all levels of education no later than 2015.
GOAL 4: REDUCE CHILD
MORTALITY
TARGET 5: Reduce by two thirds, between 1990 -2015, the under-five mortality rate
GOAL 5: IMPROVE MATERNAL
HEALTH
TARGET 6: Reduce by three quarters, between 1990 -2015, the maternal mortality ratio.
GOAL 6: COMBAT HIV/AIDS,
MALARIA AND OTHER DISEASES
TARGET 7: Have halted by 2015 and begun to reverse the spread of HIV/AIDS
TARGET 8: Have halted by 2015 and begun to reverse the incidence of malaria and other
major diseases.
GOAL 7: ENSURE
ENVIRONMENTAL
SUSTAINABILITY
TARGET 9: Integrate the principles of sustainable development into country policies and
programmes and reverse the loss of environmental resources
TARGET 10: Halve, by 2015, the proportion of people without sustainable access to safe
drinking water and basic sanitation
TARGET 11: By 2020, to have achieved a significant improvement in the lives of at least 100
million slum dwellers.
GOAL 8: DEVELOP A GLOBAL
PARTNERSHIP FOR DEVELOPMENT
TARGET 12: Develop further an open, rule-based, predictable, non-discriminatory trading
and financial system. Includes a commitment to good governance, development and poverty
reduction – both nationally and internationally;
TARGET 13: Address the special needs of the least developed countries.
Includes: tariff and quota free access for the least developed countries’ exports; enhanced
programme of debt relief for heavily indebted poor countries (HIPC) and cancellation of
official bilateral debt; and more generous ODA for countries committed to poverty
reduction.
TARGET 14: Address the special needs of landlocked countries and small island developing
States.
TARGET 15 : Deal comprehensively with the debt problems of developing countries
through national and international measures in order to make debt sustainable in the long
term;
TARGET 16: In cooperation with developing countries, develop and implement strategies for
decent and productive work for youth;
TARGET 17: In cooperation with pharmaceutical companies, provide access to affordable
essential drugs in developing countries;
TARGET 18: In cooperation with private sector, make available the benefits of new
technologies, especially information and communications.
Source: United Nations (2003) "Indicators for Monitoring the Millennium Development Goals.
Definitions, Rationale, Concepts and Sources" United Nations Publications, New York, p. 3-4;
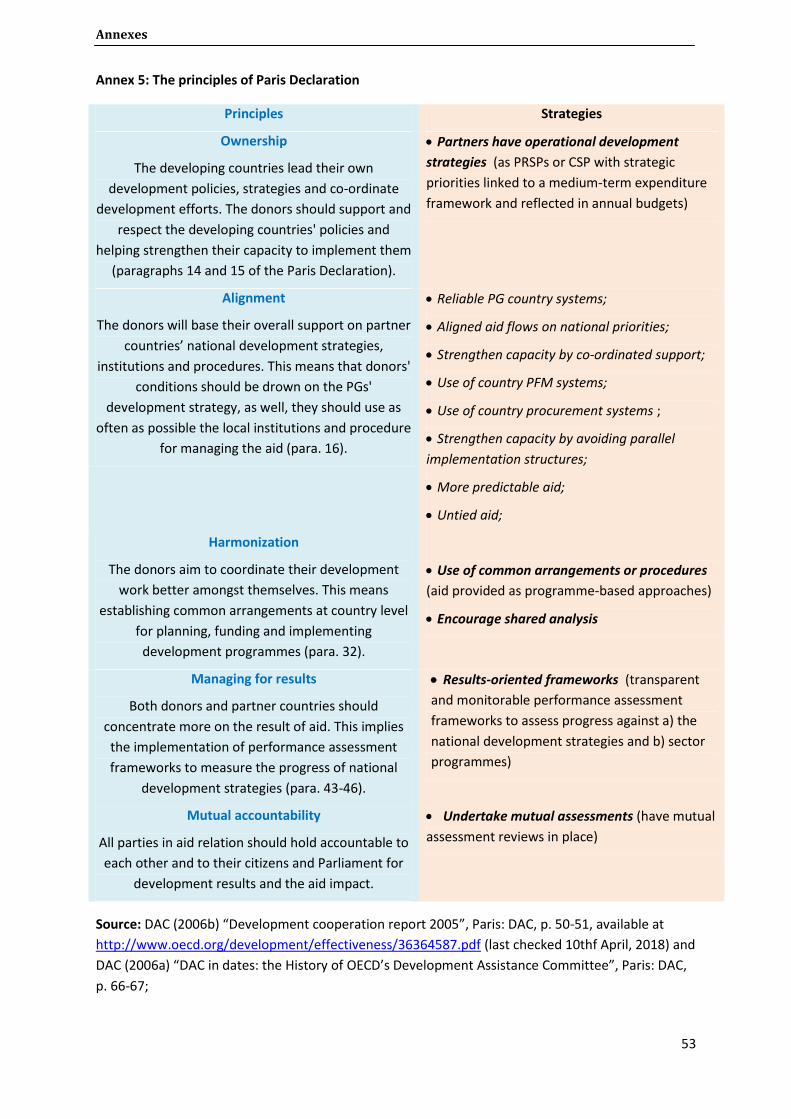
Annexes
53
Annex 5: The principles of Paris Declaration
Principles Strategies
Ownership
The developing countries lead their own
development policies, strategies and co-ordinate
development efforts. The donors should support and
respect the developing countries' policies and
helping strengthen their capacity to implement them
(paragraphs 14 and 15 of the Paris Declaration).
Partners have operational development
strategies (as PRSPs or CSP with strategic
priorities linked to a medium-term expenditure
framework and reflected in annual budgets)
Alignment
The donors will base their overall support on partner
countries’ national development strategies,
institutions and procedures. This means that donors'
conditions should be drown on the PGs'
development strategy, as well, they should use as
often as possible the local institutions and procedure
for managing the aid (para. 16).
Reliable PG country systems;
Aligned aid flows on national priorities;
Strengthen capacity by co-ordinated support;
Use of country PFM systems;
Use of country procurement systems ;
Strengthen capacity by avoiding parallel
implementation structures;
More predictable aid;
Untied aid;
Harmonization
The donors aim to coordinate their development
work better amongst themselves. This means
establishing common arrangements at country level
for planning, funding and implementing
development programmes (para. 32).
Use of common arrangements or procedures
(aid provided as programme-based approaches)
Encourage shared analysis
Managing for results
Both donors and partner countries should
concentrate more on the result of aid. This implies
the implementation of performance assessment
frameworks to measure the progress of national
development strategies (para. 43-46).
Results-oriented frameworks (transparent
and monitorable performance assessment
frameworks to assess progress against a) the
national development strategies and b) sector
programmes)
Mutual accountability
All parties in aid relation should hold accountable to
each other and to their citizens and Parliament for
development results and the aid impact.
Undertake mutual assessments (have mutual
assessment reviews in place)
Source: DAC (2006b) “Development cooperation report 2005”, Paris: DAC, p. 50-51, available at
http://www.oecd.org/development/effectiveness/36364587.pdf (last checked 10thf April, 2018) and
DAC (2006a) “DAC in dates: the History of OECD’s Development Assistance Committee”, Paris: DAC,
p. 66-67;

Annexes
54
Annex 6: Intervention logic of Budget Support
Inputs Implementation Outputs Outcomes Impacts
PG policy and spending Respect of good principles Improved public policies, institutions, spending, and
public services delivery
Positive responses by beneficiaries (service users and economic actors) to enhanced government public policy and
service delivery
Sustainable Growth and Poverty Reduction
- Transfer of funds;
- Policy Dialogue;
- Capacity Building activities.
- Respect for ownership;
- Alignment;
- Harmonization;
- Predictability.
-Improved macroeconomic and budget management;
- Improved public services delivery;
- Strengthened PFM and procurement systems;
- Improved public policy formulation and execution processes;
- …
- Increased use of public goods and services ;
- Increased business confidence and private sector investment and production deriving from more effective macro-economic and regulatory policies;
-Improved competitiveness of economy;
- …
- Enhanced and sustainable growth;
- Reduction in income and non-income poverty;
- Empowerment and social improvement of poor people and disadvantaged groups;
- Other areas, according to specific partnership frameworks and priorities;
Source: based on European Commission (2012) “Budget Support Guidelines”, Brussels: European Commission, p. 16

Annexes
55
Annex 7: BS Commitments and Disbursements trends, EU and its Member States
Graph 7.1: EU Institutions commitments and disbursements, overall aid flows, 2002-2016
Source: OECD.Stat CRS 1 database
Graph 7.2: The EU GBS and SBS disbursements
Source: OECD.Stat CRS 1 database
Graph 7.3: The GBS commitments of the most important European donors, 2006-2016
Source: OECD.Stat CRS 1 database

Annexes
56
Annex 8: The evolution of aid methods of EU institutions
Graph 8.1.: The evolution of EU aid methods, 2006-2016, commitments
Source: OECD.Stat CRS 1 database
Graph 8.2.: The evolution of EU SBS per sector, 2010-2016
Source: OECD.Stat CRS 1 database

Annexes
57
Annex 9: EU SBS recipients during 2004-2016
Tab. 9.1: EU Health SBS recipients during 2004-2016, Gross Disbursements, USD mln, current prices
Country 2004 2005 2006 2007 2008 2009 2010 2011 2012 2013 2014 2015 2016*
Afghanistan 1.360 0.284
Barbados 0.256 1.410 2.381 4.679 3.217
Burkina Faso 12.485 11.564 13.841 1.821
Egypt 37.655 43.271 27.417 28.527 0.072 0.038 0.021
India 0.090 27.851 32.848 46.170 2.126 53.959 2.384
Lao PDR* 0.707
Liberia 12.853 12.948 26.599 0.745
Moldova 16.711 1.060 18.926 7.838 7.982 0.325
Morocco 0.031 22.634 9.520 35.029 22.078 8.036 15.470 22.316 10.998 29.494 38.819
Mozambique 14.775 11.051 11.372 12.256 11.321 11.141 9.272 2.050 1.604 1.033
Peru 34.814 0.013 22.839 22.013 0.164
Philippines 3.258 5.145 3.322 13.904 8.676 0.199 10.340 21.079 5.777
Rwanda 26.788 0.249 4.679
South Africa 23.272 21.636 16.864 0.097 48.888 31.037 58.151 2.940 1.664 7.956
Tajikistan 0.666
Viet Nam 12.853 17.492 18.724 34.329 37.584
Zambia 6.845 16.014 11.819 15.424
Source: OECD.Stat CRS 1 database and EU Aid explorer
*The study is focused only on the period: 2004-2015. Lao PDR received the first installment only in 2016, thereby it is not included in the sample.

Annexes
58
Annex 10: Budget Support evaluation approaches
Tab 10.1.: A typology of budget support evaluation approaches
Qualitative Quantitative
Country case study Empirical scrutiny of policy
theory
Analysis of the impact of
government interventions using
regression based approaches
Cross Country Comparison of country case
studies Cross country regression
Source: Dijkstra, Geske, de Kemp, Antoine (2015) “Challenges in evaluating budget support and how
to solve them”, Evaluation 21(1):83-98;

Annexes
59
Annex 11: Variables names and description
Tab 11.1.: Indicators for measuring the dependent and independent variables
Indicator Description
Mortality rate, infant (per 1,000
live births) (infmort)
Infant mortality rate is the number of infants dying before reaching one year of
age, per 1,000 live births in a given year.
Maternal mortality ratio
(modeled estimate, per 100,000
live births)27
(matmort)
Maternal mortality ratio is the number of women who die from pregnancy-related
causes while pregnant or within 42 days of pregnancy termination per 100,000 live
births. The data are estimated with a regression model using information on the
proportion of maternal deaths among non-AIDS deaths in women ages 15-49,
fertility, birth attendants, and GDP.
Prevalence of HIV, total (% of
population ages 15-49) (hivprev)
Prevalence of HIV refers to the percentage of people ages 15-49 who are infected
with HIV.
Domestic general government
health expenditure (% of GDP)
Public expenditure on health from domestic sources as a share of the economy as
measured by GDP.
Budget Support Dummy
(bsdummy)
Dummy [1 for the year with BS disbursements].
Budget Support Categorical
variable (bscat)
1 - for the year with no BS disbursements; 2 - BS disbursements between 0.001-
1.999% of Domestic general government health expenditure; 3 - BS disbursements
between 2% - 4.999%; 4 - BS disbursements > 4.999%.
Total Aid flows in Health sector Total aid provided by all donors in health sector (per habitant).
Kaufmann, Kraay and Zoido-
Lobaton indicators, average(kkz)
Average of 6 governance indicators (ranges from -2.5 to 2.5, increasing with better
institutions). The 6 governance indicators are: Voice and Accountability, Political
Stability and Absence of Violence, Government Effectiveness, Regulatory Quality,
Rule of Law, Control of Corruption.
Inflation, consumer prices
(annual %)
Inflation as measured by the consumer price index reflects the annual percentage
change in the cost to the average consumer of acquiring a basket of goods and
services that may be fixed or changed at specified intervals, such as yearly. The
Laspeyres formula is generally used.
Trade (% of GDP) Trade is the sum of exports and imports of goods and services measured as a share
of gross domestic product.
Sub-Saharan Africa Dummy Dummy for Sub-Saharan Africa countries [1 if country in Sub Saharan].
GDP growth (annual %)
Annual percentage growth rate of GDP at market prices based on constant local
currency. Aggregates are based on constant 2010 U.S. dollars. GDP is the sum of
gross value added by all resident producers in the economy plus any product taxes
and minus any subsidies not included in the value of the products. It is calculated
without making deductions for depreciation of fabricated assets or for depletion
and degradation of natural resources.
Population, total Total population is based on the de facto definition of population, which counts all
residents regardless of legal status or citizenship. The values shown are midyear
estimates.
Source: WorldBank and OECD CSR 1
27
The databank of the WB Database provides two indicators for maternal mortality. One is a national estimate
and the other one is a modelled estimated. The second one has been preferred because of the full availability
of data for all 16 countries.

Annexes
60
Annex 12: The Regressions’ results
Tab. 12.1.: Budget Support Impact regressions (using the Budget Support Dummy)
Dependent variable Infant mortality Maternal mortality HIV prevalence
(1) (2) (3) (1) (2) (3) (1) (2) (3) Budget Support (dummy)
-5.145** -2.047** 1.091 -28.47 -3.227 10.55 1.880*** -0.0589 0.156
(2.107) (1.006) (0.770) (25.98) (8.760) (9.518) (0.547) (0.132) (0.157) Government expenditure
-3.916*** (1.047)
1.760 (1.535)
1.962** (0.903)
-39.33*** (14.07)
16.33 (12.43)
19.16* (10.42)
-0.514* (0.279)
0.277 (0.180)
0.251 (0.195)
Total aid 0.146 -0.552*** -0.309*** 11.30*** -2.494* -1.216 -0.244*** -0.0751* -0.0587*
(0.206) (0.165) (0.0874) (3.117) (1.371) (1.294) (0.0543) (0.0406) (0.0305)
KKZ indicators -12.48*** -5.411 -3.319 -112.8*** 11.61 26.52 1.647*** -4.046** -4.091**
(2.152) (4.719) (3.616) (27.80) (68.22) (71.05) (0.529) (1.987) (1.903)
Inflation 0.0587 0.430*** 0.147* -3.467 3.708*** 2.957** 0.208*** 0.0201 0.0106
(0.214) (0.115) (0.0857) (3.147) (1.177) (1.332) (0.0632) (0.0177) (0.0210)
Trade-to-GDP 0.0276 0.0272 0.0211 1.559*** 0.765** 0.805** -0.00855 -0.0111* -0.0124*
(0.0217) (0.0245) (0.0176) (0.320) (0.330) (0.347) (0.00723) (0.00651) (0.00711)
Sub-Saharan Africa 27.06*** 2.153 0.759 244.5*** 112.6 91.46 8.991*** 6.700*** 6.825***
(3.074) (5.438) (3.946) (37.80) (92.02) (93.86) (0.890) (2.311) (2.262)
GDP growth rate 0.403 0.283 -0.0131 5.178 1.262 0.0940 -0.0319 -0.00365 -0.0152
(0.375) (0.176) (0.125) (5.288) (2.612) (2.521) (0.105) (0.0213) (0.0198)
Population 1.13e-08*** -1.46e-07*** -5.45e-08*** 1.05e-07*** -1.34e-06*** -9.19e-07** -2.07e-09*** 1.31e-08 1.73e-08*
(2.37e-09) (1.53e-08) (1.28e-08) (2.68e-08) (3.26e-07) (3.64e-07) (5.71e-10) (9.12e-09) (1.04e-08)
Constant 28.03*** 58.83*** 63.30*** 3.012 592.1*** 596.7*** 1.897* -5.726* -5.905**
(4.370) (8.718) (6.361) (57.40) (129.9) (132.5) (0.988) (2.978) (2.825)
Observations 192 192 192 192 192 192 192 192 192
R-squared 0.706 0.939 0.971 0.633 0.954 0.960 0.633 0.963 0.966
Robust standard errors in parentheses
*** p<0.01, ** p<0.05, * p<0.1

Annexes
61
Tab. 12.2: Infant Mortality rate as dependent variable
Dependent variable Infant Mortality rate
(1) (2) (3) (4)
Budget Support (categorical variable)
0.255 0.567 -1.690** -0.885
(0.490) (0.640) (0.709) (1.325)
Government expenditure
2.021** 1.986** 2.214** 2.006**
(0.905) (0.907) (0.905) (0.918)
Total aid -0.293*** -0.309*** -0.302*** -0.339***
(0.0879) (0.0925) (0.0857) (0.109)
KKZ indicators -3.436 -4.481 -4.362 -3.305
(3.601) (3.753) (3.350) (3.614)
Inflation 0.149* 0.145* -0.284** 0.165*
(0.0863) (0.0854) (0.142) (0.0878)
Trade-to-GDP 0.0226 0.0187 0.0326* 0.00817
(0.0176) (0.0171) (0.0167) (0.0271)
Sub-Saharan Africa 0.502 39.23*** 39.76*** 40.39***
(3.912) (2.344) (2.369) (2.377)
GDP growth rate -0.0179 -0.0351 -0.0988 -0.0148
(0.123) (0.125) (0.124) (0.125)
Population -5.25e-08*** -5.41e-08*** -5.84e-08*** -5.23e-08***
(1.19e-08) (1.21e-08) (1.17e-08) (1.20e-08)
BS x KKZ indicators
0.766
(0.890)
BS x Inflation
0.301***
(0.0891)
BS x Trade-to-GDP
0.0142
(0.0154)
Constant 62.69*** 6.442 7.998* 6.583
(6.337) (4.614) (4.397) (4.955)
Observations 192 192 192 192
R-squared 0.971 0.971 0.974 0.971
Robust standard errors in parentheses *** p<0.01, ** p<0.05, * p<0.1

Annexes
62
Tab. 12.3: Maternal Mortality Ratio as dependent variable
Dependent variable Maternal Mortality ratio
(1) (2) (3) (4)
Budget Support (categorical variable)
6.453 13.60** -4.588 14.05
(4.384) (6.785) (6.424) (13.67)
Government expenditure
18.66* 17.86* 19.75* 18.75*
(10.32) (10.29) (10.43) (10.28)
Total aid -1.267 -1.637 -1.319 -0.962
(1.258) (1.283) (1.268) (1.347)
KKZ indicators 25.36 1.361 20.10 24.49
(71.06) (77.31) (70.91) (70.30)
Inflation 2.990** 2.887** 0.529 2.883**
(1.328) (1.312) (1.918) (1.389)
Trade-to-GDP 0.825** 0.735** 0.881** 0.921**
(0.344) (0.349) (0.346) (0.417)
Sub-Saharan Africa 88.17 238.3*** 247.9*** 241.8***
(93.70) (37.65) (38.69) (40.87)
GDP growth rate 0.110 -0.286 -0.350 0.0898
(2.515) (2.518) (2.540) (2.535)
Population -9.08e-07** -9.45e-07*** -9.41e-07** -9.09e-07**
(3.59e-07) (3.60e-07) (3.63e-07) (3.61e-07)
BS x KKZ indicators
17.60
(13.20)
BS x Inflation
1.709*
(0.914)
BS x Trade-to-GDP
-0.0945
(0.152)
Constant 587.5*** -67.25 -71.22 -90.13
(131.1) (72.82) (75.37) (73.70)
Observations 192 192 192 192
R-squared 0.960 0.960 0.960 0.960
Robust standard errors in parentheses *** p<0.01, ** p<0.05, * p<0.1
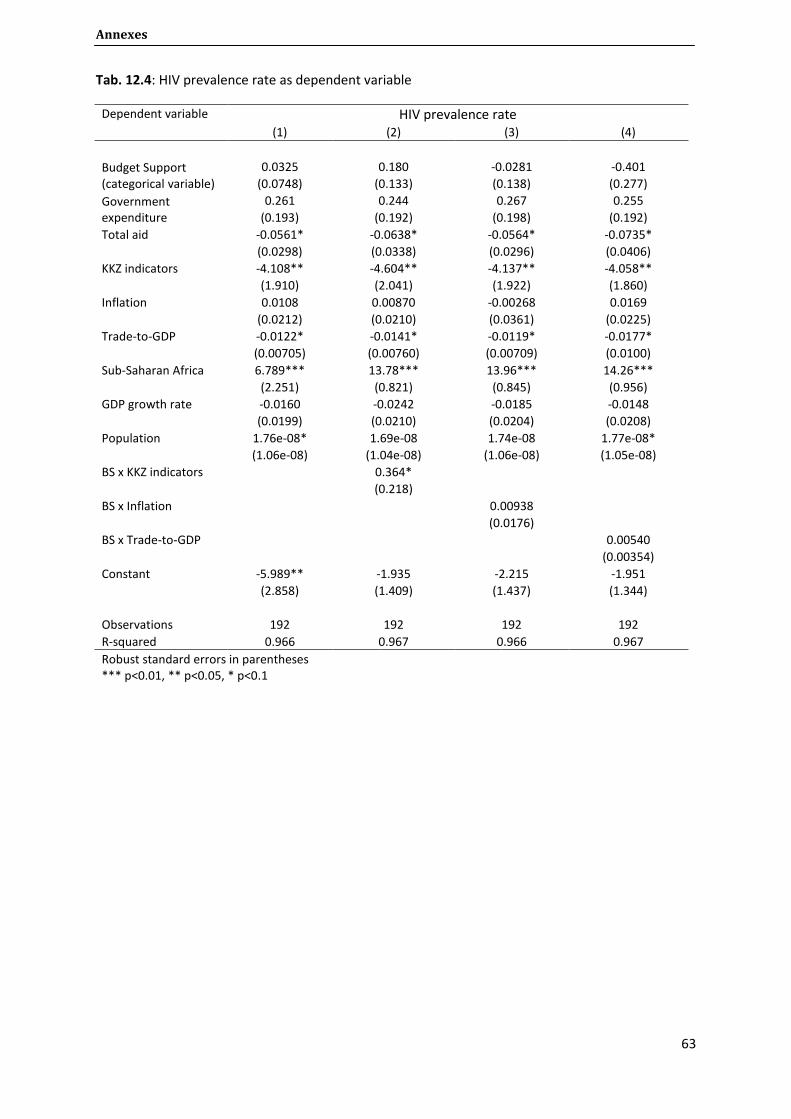
Annexes
63
Tab. 12.4: HIV prevalence rate as dependent variable
Dependent variable HIV prevalence rate
(1) (2) (3) (4)
Budget Support (categorical variable)
0.0325 0.180 -0.0281 -0.401
(0.0748) (0.133) (0.138) (0.277)
Government expenditure
0.261 0.244 0.267 0.255
(0.193) (0.192) (0.198) (0.192)
Total aid -0.0561* -0.0638* -0.0564* -0.0735*
(0.0298) (0.0338) (0.0296) (0.0406)
KKZ indicators -4.108** -4.604** -4.137** -4.058**
(1.910) (2.041) (1.922) (1.860)
Inflation 0.0108 0.00870 -0.00268 0.0169
(0.0212) (0.0210) (0.0361) (0.0225)
Trade-to-GDP -0.0122* -0.0141* -0.0119* -0.0177*
(0.00705) (0.00760) (0.00709) (0.0100)
Sub-Saharan Africa 6.789*** 13.78*** 13.96*** 14.26***
(2.251) (0.821) (0.845) (0.956)
GDP growth rate -0.0160 -0.0242 -0.0185 -0.0148
(0.0199) (0.0210) (0.0204) (0.0208)
Population 1.76e-08* 1.69e-08 1.74e-08 1.77e-08*
(1.06e-08) (1.04e-08) (1.06e-08) (1.05e-08)
BS x KKZ indicators
0.364*
(0.218)
BS x Inflation
0.00938
(0.0176)
BS x Trade-to-GDP
0.00540
(0.00354)
Constant -5.989** -1.935 -2.215 -1.951
(2.858) (1.409) (1.437) (1.344)
Observations 192 192 192 192
R-squared 0.966 0.967 0.966 0.967
Robust standard errors in parentheses *** p<0.01, ** p<0.05, * p<0.1