Mapping malaria risk in Bangladesh using Bayesian geostatistical models
7
861 Am. J. Trop. Med. Hyg., 83(4), 2010, pp. 861–867 doi:10.4269/ajtmh.2010.10-0154 Copyright © 2010 by The American Society of Tropical Medicine and Hygiene BACKGROUND Because of the wide range of vectors able to transmit malaria, each with unique ecological requirements, malaria is transmit- ted in a wide range of eco-epidemiological settings. The dis- ease can be coarsely grouped into four such settings: malaria of deep forests, forest fringe, and hills; rural malaria attribut- able to water-resources development (e.g., irrigation and large dams); rural malaria attributable to wetlands, rivers, streams, coasts, and non-agricultural manmade habitats; and urban and peri-urban malaria. 1 Within counties and even across rela- tively small areas, there may be variations in eco-epidemiolog- ical settings and thus, variations in malaria epidemiology. The advancement of geographical information systems (GIS) and spatial statistics has greatly improved our under- standing of malaria dynamics, including its dependence on ecological factors. 2–9 More recently, Bayesian geostatistics have been embraced for disease mapping, with the advantages that both environmental covariates and spatial autocorrelation are able to be estimated simultaneously and that full posterior dis- tributions are produced, which can be used to quantify uncer- tainties in parameters of interest (e.g., predicted prevalence of infection). 10 Spatial prediction models have been used to pro- duce malaria risk maps at national, 3,8,11–18 sub-continental, 18,19 and global scales. 20,21 Within Bangladesh, malaria is recognized to occur in two different ecological zones, hilly forested areas and floodplain areas, 22 with separate vectors thought to sustain transmission in the different zones. 23 In 2006, the Global Fund for AIDS, Tuberculosis, and Malaria awarded Bangladesh $39.6 million US dollars (USD) to support the national malaria-control program. 24 Three key objectives of the program are to provide effective diagnosis and treatment to 80% of estimated malaria cases by 2012, to promote the use of long-lasting insecticidal nets (ITNs) in 80% of households in these districts, and to use selective indoor residual spraying (IRS) for containment of outbreaks. 24 To help guide the program, a comprehensive malaria survey was conducted in malaria-endemic areas in Bangladesh in 2007. 25 The aim of this present study was to produce accurate, vali- dated maps of predicted Plasmodium falciparum prevalence for 2- to 10-year-old children ( PfPR 2–10 ) in the endemic areas of Bangladesh and identify high-risk populations at a preci- sion useful for national and sub-national level control priority settings. The applicability of the methods and the implications of the results are discussed in the context of Bangladesh’s malaria-control program, which faces challenges of high- risk areas in remote locations and the spread of multi-drug– resistant P. falciparum. 26,27 METHODS Datasets. Malaria survey data. Data analyzed had been collected during a 2007 malaria-prevalence survey across the malaria-endemic thanas (fourth administrative unit) in Bangladesh 25 (Figure 1). The endemic thanas lies within 13 of 64 districts (third administrative unit) in Bangladesh and represents approximately 10% of the country’s population. Based on existing knowledge of malaria prevalence in the country, the survey was designed using a multi-stage cluster sampling technique more fully described in Haque and others. 25 Blood samples from 9,750 people (0–92 years of age) were tested, with diagnosis based on the results of rapid diagnostic tests (RDTs). The average Plasmodium prevalence was 3.97%, with 90% of cases being P. falciparum. 25 The 9,750 individuals could be geo-located to 354 villages. Mapping Malaria Risk in Bangladesh Using Bayesian Geostatistical Models Heidi Reid,* Ubydul Haque, Archie C. A. Clements, Andrew J. Tatem, Andrew Vallely, Syed Masud Ahmed, Akramul Islam, and Rashidul Haque Pacific Malaria Initiative Support Centre (PacMISC), University of Queensland, School of Population Health, Brisbane, Queensland, Australia; International Centre for Diarrhoeal Disease Research, Bangladesh (ICDDR,B), Dhaka, Bangladesh; Australian Centre for International and Tropical Health, Queensland Institute of Medical Research, Brisbane, Queensland, Australia; Emerging Pathogens Institute and Department of Geography, University of Florida, Gainesville, Florida; BRAC, Dhaka, Bangladesh Abstract. Background malaria-control programs are increasingly dependent on accurate risk maps to effectively guide the allocation of interventions and resources. Advances in model-based geostatistics and geographical information systems (GIS) have enabled researchers to better understand factors affecting malaria transmission and thus, more accu- rately determine the limits of malaria transmission globally and nationally. Here, we construct Plasmodium falciparum risk maps for Bangladesh for 2007 at a scale enabling the malaria-control bodies to more accurately define the needs of the program. A comprehensive malaria-prevalence survey ( N = 9,750 individuals; N = 354 communities) was carried out in 2007 across the regions of Bangladesh known to be endemic for malaria. Data were corrected to a standard age range of 2 to less than 10 years. Bayesian geostatistical logistic regression models with environmental covariates were used to predict P. falciparum prevalence for 2- to 10-year-old children ( PfPR 2–10 ) across the endemic areas of Bangladesh. The pre- dictions were combined with gridded population data to estimate the number of individuals living in different endemicity classes. Across the endemic areas, the average PfPR 2–10 was 3.8%. Environmental variables selected for prediction were vegetation cover, minimum temperature, and elevation. Model validation statistics revealed that the final Bayesian geo- statistical model had good predictive ability. Risk maps generated from the model showed a heterogeneous distribution of PfPR 2–10 ranging from 0.5% to 50%; 3.1 million people were estimated to be living in areas with a PfPR 2–10 greater than 1%. Contemporary GIS and model-based geostatistics can be used to interpolate malaria risk in Bangladesh. Importantly, malaria risk was found to be highly varied across the endemic regions, necessitating the targeting of resources to reduce the burden in these areas. * Address correspondence to Heidi Reid, Level 2 Public Health Building, School of Population Health, University of Queensland, Herston Road, Herston, QLD, 4006. E-mail: [email protected].
Transcript of Mapping malaria risk in Bangladesh using Bayesian geostatistical models

861
Am. J. Trop. Med. Hyg., 83(4), 2010, pp. 861–867doi:10.4269/ajtmh.2010.10-0154Copyright © 2010 by The American Society of Tropical Medicine and Hygiene
BACKGROUND
Because of the wide range of vectors able to transmit malaria, each with unique ecological requirements, malaria is transmit-ted in a wide range of eco-epidemiological settings. The dis-ease can be coarsely grouped into four such settings: malaria of deep forests, forest fringe, and hills; rural malaria attribut-able to water-resources development (e.g., irrigation and large dams); rural malaria attributable to wetlands, rivers, streams, coasts, and non-agricultural manmade habitats; and urban and peri-urban malaria. 1 Within counties and even across rela-tively small areas, there may be variations in eco-epidemiolog-ical settings and thus, variations in malaria epidemiology.
The advancement of geographical information systems (GIS) and spatial statistics has greatly improved our under-standing of malaria dynamics, including its dependence on ecological factors. 2– 9 More recently, Bayesian geostatistics have been embraced for disease mapping, with the advantages that both environmental covariates and spatial autocorrelation are able to be estimated simultaneously and that full posterior dis-tributions are produced, which can be used to quantify uncer-tainties in parameters of interest (e.g., predicted prevalence of infection). 10 Spatial prediction models have been used to pro-duce malaria risk maps at national, 3, 8, 11– 18 sub-continental, 18, 19 and global scales. 20, 21
Within Bangladesh, malaria is recognized to occur in two different ecological zones, hilly forested areas and floodplain areas, 22 with separate vectors thought to sustain transmission in the different zones. 23 In 2006, the Global Fund for AIDS, Tuberculosis, and Malaria awarded Bangladesh $39.6 million US dollars (USD) to support the national malaria-control
program. 24 Three key objectives of the program are to provide effective diagnosis and treatment to 80% of estimated malaria cases by 2012, to promote the use of long-lasting insecticidal nets (ITNs) in 80% of households in these districts, and to use selective indoor residual spraying (IRS) for containment of outbreaks. 24 To help guide the program, a comprehensive malaria survey was conducted in malaria-endemic areas in Bangladesh in 2007. 25
The aim of this present study was to produce accurate, vali-dated maps of predicted Plasmodium falciparum prevalence for 2- to 10-year-old children ( Pf PR 2–10 ) in the endemic areas of Bangladesh and identify high-risk populations at a preci-sion useful for national and sub-national level control priority settings. The applicability of the methods and the implications of the results are discussed in the context of Bangladesh’s malaria-control program, which faces challenges of high-risk areas in remote locations and the spread of multi-drug–resistant P. falciparum . 26, 27
METHODS
Datasets. Malaria survey data. Data analyzed had been collected during a 2007 malaria-prevalence survey across the malaria-endemic thanas (fourth administrative unit) in Bangladesh 25 ( Figure 1 ). The endemic thanas lies within 13 of 64 districts (third administrative unit) in Bangladesh and represents approximately 10% of the country’s population. Based on existing knowledge of malaria prevalence in the country, the survey was designed using a multi-stage cluster sampling technique more fully described in Haque and others. 25 Blood samples from 9,750 people (0–92 years of age) were tested, with diagnosis based on the results of rapid diagnostic tests (RDTs). The average Plasmodium prevalence was 3.97%, with 90% of cases being P. falciparum . 25 The 9,750 individuals could be geo-located to 354 villages.
Mapping Malaria Risk in Bangladesh Using Bayesian Geostatistical Models
Heidi Reid ,* Ubydul Haque , Archie C. A. Clements , Andrew J. Tatem , Andrew Vallely , Syed Masud Ahmed , Akramul Islam , and Rashidul Haque
Pacific Malaria Initiative Support Centre (PacMISC), University of Queensland, School of Population Health, Brisbane, Queensland, Australia; International Centre for Diarrhoeal Disease Research, Bangladesh (ICDDR,B), Dhaka, Bangladesh; Australian Centre for International and
Tropical Health, Queensland Institute of Medical Research, Brisbane, Queensland, Australia; Emerging Pathogens Institute and Department of Geography, University of Florida, Gainesville, Florida; BRAC, Dhaka, Bangladesh
Abstract. Background malaria-control programs are increasingly dependent on accurate risk maps to effectively guide the allocation of interventions and resources. Advances in model-based geostatistics and geographical information systems (GIS) have enabled researchers to better understand factors affecting malaria transmission and thus, more accu-rately determine the limits of malaria transmission globally and nationally. Here, we construct Plasmodium falciparum risk maps for Bangladesh for 2007 at a scale enabling the malaria-control bodies to more accurately define the needs of the program. A comprehensive malaria-prevalence survey ( N = 9,750 individuals; N = 354 communities) was carried out in 2007 across the regions of Bangladesh known to be endemic for malaria. Data were corrected to a standard age range of 2 to less than 10 years. Bayesian geostatistical logistic regression models with environmental covariates were used to predict P. falciparum prevalence for 2- to 10-year-old children ( Pf PR 2–10 ) across the endemic areas of Bangladesh. The pre-dictions were combined with gridded population data to estimate the number of individuals living in different endemicity classes. Across the endemic areas, the average Pf PR 2–10 was 3.8%. Environmental variables selected for prediction were vegetation cover, minimum temperature, and elevation. Model validation statistics revealed that the final Bayesian geo-statistical model had good predictive ability. Risk maps generated from the model showed a heterogeneous distribution of Pf PR 2–10 ranging from 0.5% to 50%; 3.1 million people were estimated to be living in areas with a Pf PR 2–10 greater than 1%. Contemporary GIS and model-based geostatistics can be used to interpolate malaria risk in Bangladesh. Importantly, malaria risk was found to be highly varied across the endemic regions, necessitating the targeting of resources to reduce the burden in these areas.
* Address correspondence to Heidi Reid, Level 2 Public Health Building, School of Population Health, University of Queensland, Herston Road, Herston, QLD, 4006. E-mail: [email protected] .

862 REID AND OTHERS
Because of the development of immunity, Pf PR is age-dependent, rising during early childhood, peaking in older children, and falling through adolescence and adulthood under stable endemic transmission. The assembled Pf PR data were, therefore, standardized to the classical age range of 2–10 years using an algorithm based on catalytic conversion models first adapted for malaria by Pull and Grab 28 and modi-fied by Smith and others. 29
Environmental variables. A number of ecological and climatic factors affect both the extrinsic life cycle of the malaria parasite and that of the Anopheline vectors. 30 Based on published literature, variables thought pertinent to malaria transmission in Bangladesh were selected for statistical analysis.
A measure of vegetation cover was selected for analysis as the principle malaria vector in Bangladesh; Anopheles dirus
( An. dirus ) is known to be a forest-breeding mosquito. 23, 31 Data concerning vegetation cover were obtained from the GlobCover Land Cover product, which is derived from satellite imagery from 2005 to 2006. 32 Vegetation was labeled accord-ing to the United Nations (UN) Land Cover Classification System 33 at a resolution of 300 m. For this analysis, vegetation cover was dichotomized into forested, which included a num-ber of more specific forest categories, and not forested, which included all other vegetation categories). Enhanced vegetation index (EVI) data were generated using methods described by Scharlemann and others. 34
Increases in altitude are commonly associated with cooler temperatures, thus providing a less suitable environment for malaria transmission, 35– 37 whereas increased precipitation has been found to support malaria transmission by creat-ing additional water bodies for malaria vectors to complete
Figure 1. District map of Bangladesh showing the Pf PR 2–10 from the 354 villages geo-located and the location of Bangladesh within the Asia-Pacific region ( Inset ). This figure appears in color at www.ajtmh.org .

863MALARIA RISK IN BANGLADESH
their lifecycle. 38, 39 Data for elevation, minimum temperature, and precipitation were obtained from the WorldClim Project at 1 km 2 resolution. 40 Peak malaria season in Bangladesh is from May to August, 41 coinciding with the monsoon season. Monthly precipitation and temperature were obtained for 6 months over the period from April to September. Values were averaged to give mean minimum temperature and monthly precipitation over this monsoonal period.
Rural and remote populations are purported to face differ-ent malaria risks compared with those in urban areas, 42– 46 par-ticularly with respect to access to health care and prophylactic measures, including bed nets. To further investigate this rela-tionship between malaria prevalence and remoteness, acces-sibility (measured as travel time in minutes) to the nearest settlement of size > 50,000 people was calculated using the methods outlined in Uchida and Nelson, 47 which are based on GIS data of road networks, road quality, land cover, settle-ments, and topography.
Using the spatial analyst extension of the GIS software ArcView version 9.3 (ESRI, Redlands, CA), data on vegeta-tion, precipitation, minimum temperature, EVI, and access were extracted for the 354 village locations.
Population data. Gridded population data for 2005 at a resolution of 30-arc second (approximately 1 km 2 ) were obtained from the Global Rural-Urban Mapping Project (GRUMP) 48 and imported into ArcMap. A 2008 study found GRUMP to be the most accurate spatial population dataset available. 49 The 2005 population data was projected forward to 2007 using the UN determined growth rate of 1.7% per annum for Bangladesh over this period. 50
Analysis. Assessing spatial autocorrelation. Statistical anal-yses of spatial autocorrelation in the prevalence data were done using semivariograms in R version 2.9.0 (The R foundation for Statistical Computing, Vienna ) with the GeoR package.
Assessing ecological variables. Backwards step-wise regres-sion analysis was conducted on environmental variables (EVI, elevation, precipitation, minimum temperature, forest cover, and access) using the Stata/SE Version 10 (Stata Corp., College Station, TX) statistical software package to determine their inclusion into the final spatial prediction models. Those variables with a P < 0.1 were retained.
Bayesian geostatistical model. Spatial prediction models were constructed based on the principle of model-based geostatistics 51 using the Bayesian statistical software WinBUGS version 14.1 (MRC Biostatistics Unit, Cambridge, UK). Based on the RDT results, a binomial logistic regression model was constructed with the proportion infected at each surveyed location as the outcome. The predictor variables included two components: a deterministic component consisting of the fixed environmental effects and a stochastic (i.e., random effect) component with covariance in the random effects modeled using an isotropic, stationary spatial autocorrelation function. For comparison, two similar models were constructed, one without the deterministic component and one without the stochastic component. The deviance information criterion (DIC) statistic was calculated for the models to determine statistically if inclusion of both fixed and stochastic effects improved model fit (models with a lower DIC statistic are considered to show a better fit).
To predict the prevalence at unsampled sites within the endemic thanas, a grid of prediction locations was generated with locations spaced at 0.01 decimal degrees (approximately
1 km). Using the in-built spatial.unipred function in WinBUGS, the geostatistical random effect was interpolated to all pre-diction locations, and predicted prevalence was calculated by adding the random effect to the sum of the products of the coefficients for the covariates and the values of the covariates at each prediction location. The key outputs of this final anal-ysis are probability distributions of the predicted prevalence at each of the unsampled locations, with each of distributions able to be summarized by a median, standard deviation (SD), and credible intervals (CrI). In this analysis, the median and lower 25% and upper 75% CrI will be presented.
Model validation and measures of uncertainty. Validation of predicted prevalence was undertaken by partitioning the data into five random subsets, running the model using four of five subsets, and validating the model with the remaining subset. Five separate models were run, each with a different subset excluded for validation. The accuracy of the prediction was determined in terms of area under curve (AUC) of the receiver-operating characteristic (ROC), with observed prevalence, dichotomized at 0 and ≥ 0, taken as the comparator. This gave an indication of the ability of the model to discriminate between areas where transmission did and did not occur. Mean error and mean absolute error values were also calculated for the predicted prevalences to give an indication of prediction bias and overall precision respectively.
Defining at-risk population. Using the mean predicted Pf PR 2–10 various at-risk populations, > 0.5%, > 1.0%, and > 5.0%, were defined. The adjusted GRUMP population surface was used to calculate population at risk and the predicted number of cases at a given point in time. With high-risk areas purported to occur in remote locations, the aforementioned accessibility surface was used to determine number of cases reached by targeting 80% of the most affected populations (i.e., those with the highest predicted prevalences) or alternatively targeting 80% of at-risk populations that are most accessible (i.e., closest to centers > 50,000 people).
RESULTS
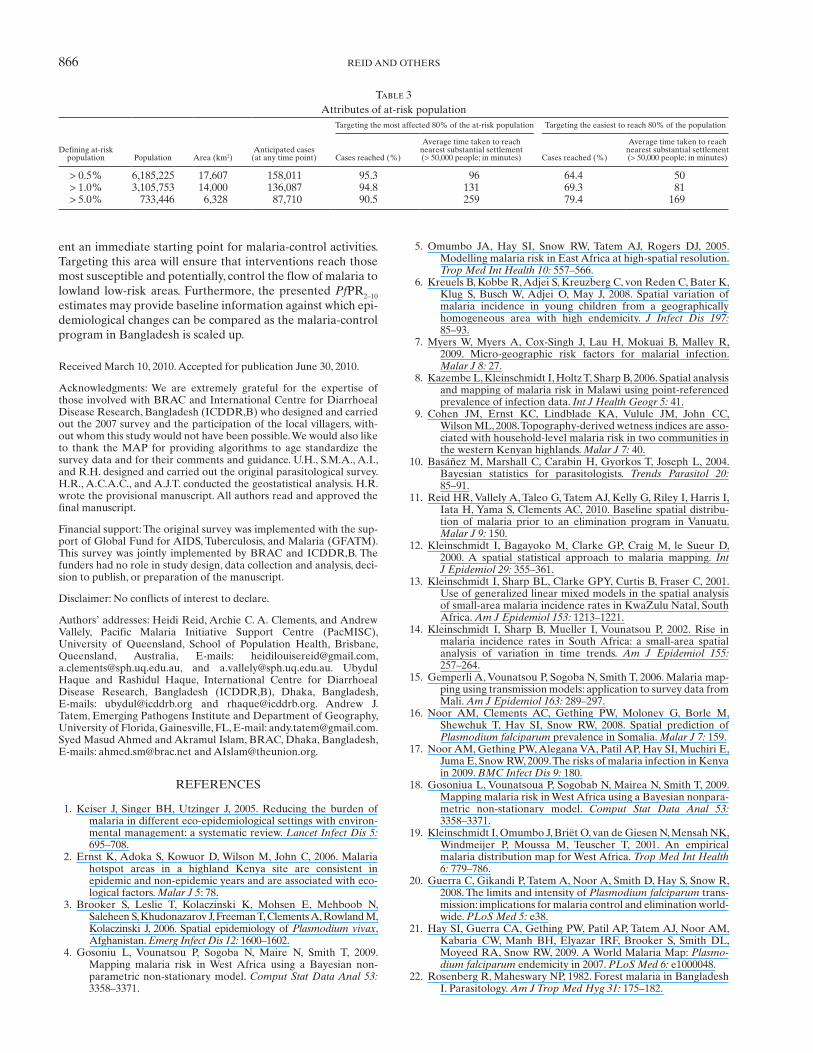
The spatial distribution of Pf PR 2–10 in the 354 location vil-lages surveyed is presented in Figure 1 . A diagnostic vario-gram ( Figure 2 ) revealed that spatial autocorrelation was a feature of age-standardized data with spatial autocorrelation observed at distances up to approximately 50 km. More sim-ply, malaria prevalence at a given location is affected by the prevalence of neighboring locations (at distances of up to 50 km), necessitating the use of a geostatistical model to correct for this observed spatial dependence.
Forest cover, minimum temperature, and elevation were retained from the backwards step-wise regression analysis and included as fixed effects in the models. The model with both fixed and random effects performed marginally better than the model with no fixed environmental effects, with a DIC of 404.1 compared with 405.5 ( Table 1 ). These two models had similar predictive performance, but the model including fixed environmental effects had marginally lower mean error and mean absolute error estimates ( Table 2 ).
Maps of the median and lower 25% and upper 75% Bayesian credible interval for the posterior distributions of Pf PR 2–10 in Bangladesh are also presented in Figure 3 . The distribution of P. falciparum shows a large degree of heterogeneity ranging from 0% to 50%.

864 REID AND OTHERS
Approximately 6.2 million, 3.1 million, and 0.7 million people were calculated to be living in areas with a predicted Pf PR 2–10 of > 0.5%, > 1.0%, and > 5.0%, respectively ( Table 3 ). Within these different at-risk populations, targeting the 80% of the population closest to centers > 50,000 people reached far fewer cases than if priority was given to reaching the 80% in highest prevalence areas.
DISCUSSION
The results of this analysis build on the findings of the Malaria Atlas Project (MAP), which previously defined the
spatial limits of malaria within all endemic countries, 20, 21 to present a more detailed empirical description of malaria risk in Bangladesh. The findings indicate that malaria in the coun-try exhibits a unique spatial pattern, with varying prevalence levels and significant and justifiable relationships to environ-mental variables. Importantly, there exist areas of relatively high transmission that should not be neglected because of their remoteness.
The presentation of spatial variation in disease risk is one of the most important functions of spatial analysis, 52 with a diag-nostic semi-variogram the first step in this process. For malaria in Bangladesh, the observed spatial autocorrelation at dis-tances up to 50 km is approximately one-half of that observed in Kenya 17 but about 10 times that observed on a small island in Vanuatu. 11 The practical implication of this is that malaria control in Bangladesh will need to be targeted at a finer spa-tial scale than in Kenya but not with the same precision as that in Vanuatu.
The observed variation in risk can then be formally included in the geostatistical model to generate a continuous predic-tion surface, with this surface being the enabling link between the original point-prevalence survey and instructive outputs to guide the control program. For example, if the program managers decide that they will first target populations living in areas with prevalences above 5%, the predicted prevalence map shown in Figure 3 clearly demarcates their targeted area. The calculations in Table 3 are then able to inform program managers of the number of bed nets, for example, that need to be procured to cover 80% of the population in this area. The number of cases averted, however, will depend on which 80% of the population is provided with bed nets: those liv-ing closest to settlements > 50,000 people or those living in the highest risk areas. This has important implications in meet-ing the first key objective of the control program, which is to effectively diagnosis and treat 80% of estimated malaria cases.
Targeting those higher endemicity regions located within for-ested areas will become particularly important as Bangladesh
Table 1 Results of Bayesian geostatistical models for Bangladesh Pf PR 2–10 in 2007
Coefficient (posterior mean) Odds ratio (posterior mean; 95% Bayesian credible intervals) * DIC †
Bayesian geostatistical model with environmental covariates and no random spatial effectα (intercept) −2.42 (−3.67 to −1.46)Elevation 0.64 (0.06–1.05) 14.72 (1.29–82.45) OR/100 mMinimum temperature 0.35 (0.07–0.82) 1.23 (1.02–1.31) OR/°CForest ‡ 1.93 (1.51–2.22) 6.87 (4.52–9.23)DIC 593.7
Bayesian geostatistical model with spatial random effect but no environmental covariatesα (intercept) −4.96 (−5.92 to −3.93)Φ (rate of decay of spatial correlation) § 4.07 (1.19–8.12)σ 2 (variance of geostatistical random effect) ¶ 4.17 (2.38–10.0)DIC 405.2
Bayesian geostatistical model with spatial random effect and environmental covariatesα −5.34 (−6.18 to −4.56)Φ 7.96 (1.96–24.64)σ 2 3.0 (1.72–6.67)Elevation 0.34 (0.08–0.84) 4.17 (1.40–34.11) OR/100 mMinimum temperature 0.77 (0.21–1.37) 1.29 (1.07–1.58) OR/°CForest 0.79 (0.15–1.52) 2.34 (1.61–4.73)DIC 404.1
* Bayesian credible intervals can be interpreted as having a similar meaning to confidence intervals used in frequentist statistics. † Models with a lower DIC statistic are considered to show a better fit. ‡ Unforested is used as the reference category. § The unit is change in spatial autocorrelation per decimal degree. A lower Φ indicates that spatial correlation occurs over longer distances (i.e., spatial clusters are larger). ¶ A higher variance indicates a greater tendency to spatial clustering.
Figure 2. Sample semi-variogram of Pf PR 2–10 dataset indicating the presence of spatial autocorrelation in the Pf PR 2–10 data up to lags of 0.5 decimal degrees (the equivalent of ~50 km at the equator).

865MALARIA RISK IN BANGLADESH
scales up control operations with the forest foci thought to serve as reservoirs from which the lowland and floodplain areas are reinfected. 23 Movement of people to and from the forest not only provides a constant flow of malaria parasites from the forest to rural communities 53 but also exposes immu-nologically naive individuals to high levels of transmission. 23 To what extent the flow of malaria from the hilly, forested regions maintains transmission in the unforested, lowland areas is an important issue that warrants further research.
An additional challenge for the national control program is the flow of drug-resistant malaria across the border from Myanmar. 54 Areas of elevated transmission along the border region with Myanmar, which can be identified from the risk maps ( Figure 3 ), present strategic locales for both the surveil-lance of imported malaria cases and drug-resistant malaria. Any attempt to control malaria in Bangladesh is jeopardized by unmonitored migration across the border.
An earlier study identified the most influential environ-mental parameters for the distribution of An. dirus to be for-est cover, altitude, rainfall, and temperature. 55 The current analysis replicated the positive associations with forest cover, altitude, and temperature but did not find a significant rela-tionship with rainfall, possibly because of high and relatively
consistent levels of rainfall across the study region over the monsoonal period. The positive association between malaria risk and increasing elevation, although unusual for some vec-tor species, is to be expected for An. dirus , 55 with higher alti-tudes providing denser forest cover and thus, a more favorable ecological environment. 56
As GIS and geostatistical techniques become more sophis-ticated, there is a need to foster better links between malaria-program managers and researchers such that the most useful data are generated and that these data are accessible and usable outside the research community. Strong research-program links in Kenya led to the development of a 2009 malaria-risk map for Kenya, which is now the cornerstone for planning the scale up of malaria interventions such as ITNs and malaria diag-nostics in the country beyond 2009. 17 Additionally, risk maps and geo-spatial data are increasingly being used to support malaria elimination in the southwest Pacific. 11 With closer ties to national programs, the results of model-based geostatistics can be better used.
In conclusion, geographic targeting has tremendous poten-tial to enhance the effectiveness of the national malaria-control program in Bangladesh. In Bangladesh, the areas of relatively high malaria transmission in the hilly, forested region pres-
Table 2 Summary of validation statistics for predicting continuous Pf PR 2–10 in Bangladesh in 2007 Model AUC * Mean error † (% prevalence) Mean absolute error ‡ (% prevalence)
Bayesian geostatistical model with spatial random effect and environmental covariates 0.78 (0.74–0.82) −0.11 5.06%
Bayesian geostatistical model with spatial random effect but no environmental covariates 0.77 (0.73–0.81) −0.16 5.64%
* Area under curve (AUC) between 0.5 and 0.7 indicates a poor discriminative capacity, 0.7–0.9 indicates a reasonable capacity, and > 0.9 indicates a very good capacity. † Mean error is a measure of the bias of predictions (the overall tendency to over or under predict). ‡ Mean absolute error is a measure of overall precision (the average magnitude of error in individual predictions).
Figure 3. Median predicted spatial distribution of Pf PR 2–10 across the endemic thanas of Bangladesh at 1- × 1-km resolution, upper 75% pre-dicted prevalence ( Upper Inset ), and lower 25% predicted prevalence ( Lower Inset ). This figure appears in color at www.ajtmh.org .
866 REID AND OTHERS
ent an immediate starting point for malaria-control activities. Targeting this area will ensure that interventions reach those most susceptible and potentially, control the flow of malaria to lowland low-risk areas. Furthermore, the presented Pf PR 2–10 estimates may provide baseline information against which epi-demiological changes can be compared as the malaria-control program in Bangladesh is scaled up.
Received March 10, 2010. Accepted for publication June 30, 2010.
Acknowledgments: We are extremely grateful for the expertise of those involved with BRAC and International Centre for Diarrhoeal Disease Research, Bangladesh (ICDDR,B) who designed and carried out the 2007 survey and the participation of the local villagers, with-out whom this study would not have been possible. We would also like to thank the MAP for providing algorithms to age standardize the survey data and for their comments and guidance. U.H., S.M.A., A.I., and R.H. designed and carried out the original parasitological survey. H.R., A.C.A.C., and A.J.T. conducted the geostatistical analysis. H.R. wrote the provisional manuscript. All authors read and approved the final manuscript.
Financial support: The original survey was implemented with the sup-port of Global Fund for AIDS, Tuberculosis, and Malaria (GFATM). This survey was jointly implemented by BRAC and ICDDR,B. The funders had no role in study design, data collection and analysis, deci-sion to publish, or preparation of the manuscript.
Disclaimer: No conflicts of interest to declare.
Authors’ addresses: Heidi Reid, Archie C. A. Clements, and Andrew Vallely, Pacific Malaria Initiative Support Centre (PacMISC), University of Queensland, School of Population Health, Brisbane, Queensland, Australia, E-mails: [email protected] , [email protected] , and [email protected] . Ubydul Haque and Rashidul Haque, International Centre for Diarrhoeal Disease Research, Bangladesh (ICDDR,B), Dhaka, Bangladesh, E-mails: [email protected] and [email protected] . Andrew J. Tatem, Emerging Pathogens Institute and Department of Geography, University of Florida, Gainesville, FL, E-mail: [email protected] . Syed Masud Ahmed and Akramul Islam, BRAC, Dhaka, Bangladesh, E-mails: [email protected] and [email protected] .
REFERENCES
1. Keiser J , Singer BH , Utzinger J , 2005 . Reducing the burden of malaria in different eco-epidemiological settings with environ-mental management: a systematic review . Lancet Infect Dis 5: 695 – 708 .
2. Ernst K , Adoka S , Kowuor D , Wilson M , John C , 2006 . Malaria hotspot areas in a highland Kenya site are consistent in epidemic and non-epidemic years and are associated with eco-logical factors . Malar J 5 : 78 .
3. Brooker S , Leslie T , Kolaczinski K , Mohsen E , Mehboob N , Saleheen S , Khudonazarov J , Freeman T , Clements A , Rowland M , Kolaczinski J , 2006 . Spatial epidemiology of Plasmodium vivax , Afghanistan. Emerg Infect Dis 12: 1600 – 1602 .
4. Gosoniu L , Vounatsou P , Sogoba N , Maire N , Smith T , 2009 . Mapping malaria risk in West Africa using a Bayesian non-parametric non-stationary model . Comput Stat Data Anal 53: 3358 – 3371 .
5. Omumbo JA , Hay SI , Snow RW , Tatem AJ , Rogers DJ , 2005 . Modelling malaria risk in East Africa at high-spatial resolution . Trop Med Int Health 10: 557 – 566 .
6. Kreuels B , Kobbe R , Adjei S , Kreuzberg C , von Reden C , Bater K , Klug S , Busch W , Adjei O , May J , 2008 . Spatial variation of malaria incidence in young children from a geographically homogeneous area with high endemicity . J Infect Dis 197: 85 – 93 .
7. Myers W , Myers A , Cox-Singh J , Lau H , Mokuai B , Malley R , 2009 . Micro-geographic risk factors for malarial infection . Malar J 8: 27 .
8. Kazembe L , Kleinschmidt I , Holtz T , Sharp B , 2006 . Spatial analysis and mapping of malaria risk in Malawi using point-referenced prevalence of infection data . Int J Health Geogr 5: 41 .
9. Cohen JM , Ernst KC , Lindblade KA , Vulule JM , John CC , Wilson ML , 2008 . Topography-derived wetness indices are asso-ciated with household-level malaria risk in two communities in the western Kenyan highlands . Malar J 7: 40 .
10. Basáñez M , Marshall C , Carabin H , Gyorkos T , Joseph L , 2004 . Bayesian statistics for parasitologists . Trends Parasitol 20: 85 – 91 .
11. Reid HR , Vallely A , Taleo G , Tatem AJ , Kelly G , Riley I , Harris I , Iata H , Yama S , Clements AC, 2010 . Baseline spatial distribu-tion of malaria prior to an elimination program in Vanuatu . Malar J 9: 150 .
12. Kleinschmidt I , Bagayoko M , Clarke GP , Craig M , le Sueur D , 2000 . A spatial statistical approach to malaria mapping . Int J Epidemiol 29: 355 – 361 .
13. Kleinschmidt I , Sharp BL , Clarke GPY , Curtis B , Fraser C , 2001 . Use of generalized linear mixed models in the spatial analysis of small-area malaria incidence rates in KwaZulu Natal, South Africa. Am J Epidemiol 153: 1213 – 1221 .
14. Kleinschmidt I , Sharp B , Mueller I , Vounatsou P , 2002 . Rise in malaria incidence rates in South Africa: a small-area spatial analysis of variation in time trends . Am J Epidemiol 155: 257 – 264 .
15. Gemperli A , Vounatsou P , Sogoba N , Smith T , 2006 . Malaria map-ping using transmission models: application to survey data from Mali . Am J Epidemiol 163: 289 – 297 .
16. Noor AM , Clements AC , Gething PW , Moloney G , Borle M , Shewchuk T , Hay SI , Snow RW , 2008 . Spatial prediction of Plasmodium falciparum prevalence in Somalia . Malar J 7: 159 .
17. Noor AM , Gething PW , Alegana VA , Patil AP , Hay SI , Muchiri E , Juma E , Snow RW , 2009 . The risks of malaria infection in Kenya in 2009 . BMC Infect Dis 9: 180 .
18. Gosoniua L , Vounatsoua P , Sogobab N , Mairea N , Smith T , 2009 . Mapping malaria risk in West Africa using a Bayesian nonpara-metric non-stationary model . Comput Stat Data Anal 53: 3358 – 3371 .
19. Kleinschmidt I , Omumbo J , Briët O , van de Giesen N , Mensah NK , Windmeijer P , Moussa M , Teuscher T , 2001 . An empirical malaria distribution map for West Africa . Trop Med Int Health 6: 779 – 786 .
20. Guerra C , Gikandi P , Tatem A , Noor A , Smith D , Hay S , Snow R , 2008 . The limits and intensity of Plasmodium falciparum trans-mission: implications for malaria control and elimination world-wide . PLoS Med 5: e38 .
21. Hay SI , Guerra CA , Gething PW , Patil AP , Tatem AJ , Noor AM , Kabaria CW , Manh BH , Elyazar IRF , Brooker S , Smith DL , Moyeed RA , Snow RW , 2009 . A World Malaria Map: Plasmo-dium falciparum endemicity in 2007 . PLoS Med 6: e1000048 .
22. Rosenberg R , Maheswary NP , 1982 . Forest malaria in Bangladesh I. Parasitology. Am J Trop Med Hyg 31: 175 – 182 .
Table 3 Attributes of at-risk population
Defining at-risk population Population Area (km 2 )
Anticipated cases (at any time point)
Targeting the most affected 80% of the at-risk population Targeting the easiest to reach 80% of the population
Cases reached (%)
Average time taken to reach nearest substantial settlement (> 50,000 people; in minutes) Cases reached (%)
Average time taken to reach nearest substantial settlement (> 50,000 people; in minutes)
> 0.5% 6,185,225 17,607 158,011 95.3 96 64.4 50> 1.0% 3,105,753 14,000 136,087 94.8 131 69.3 81> 5.0% 733,446 6,328 87,710 90.5 259 79.4 169

867MALARIA RISK IN BANGLADESH
23. Rosenberg R , Maheswary NP , 1982 . Forest malaria in Bangladesh. II. Transmission by Anopheles dirus . Am J Trop Med Hyg 31: 183 – 191 .
24. World Health Organization , 2009 . Malaria Situation in Bangladesh. 2008 Malaria Situation in SEAR Countries . Geneva, Switzerland : World Health Organization .
25. Haque U , Ahmed SM , Hossain S , Huda M , Hossain A , Alam MS , Mondal D , Khan WA , Khalequzzaman M , Haque R , 2009 . Malaria prevalence in endemic districts of Bangladesh . PLoS ONE 4: e6737 .
26. Noedl H , Faiz MA , Yunus EB , Rahman MR , Hossain MA , Samad R , Miller RS , Pang LW , Wongsrichanalai C , 2003 . Drug-resistant malaria in Bangladesh: an in vitro assessment . Am J Trop Med Hyg 68: 140 – 142 .
27. Wongsrichanalai C , Sirichaisinthop J , Karwacki JJ , Congpuong K , Miller RS , Pang L , Thimasarn K , 2001 . Drug resistant malaria on the border of the Thai-Myanmar and Thai-Cambodian bor-ders . Southeast Asian J Trop Med Public Health 32: 41 – 49 .
28. Pull JH , Grab B , 1974 . A simple epidemiological model for evalu-ating the malaria inoculation rate and the risk of infection in infants . Bull World Health Organ 51: 507 – 516 .
29. Smith DL , Guerra CA , Snow RW , Hay SI , 2007 . Standardizing estimates of the Plasmodium falciparum parasite rate . Malar J 6: 131 .
30. Molineaux L , 1988 . The epidemiology of human malaria as an explanation of its distribution, including some implications for its control . Wernsdorfer WH , McGregor I , eds. Malaria: Principles and Practice of Malariology , Vol. 2 . London, UK : Churchill Livingstone , 913 – 998 .
31. Rosenberg R , 1982 . Forest malaria in Bangladesh. III. Breeding habitats of Anopheles dirus . Am J Trop Med Hyg 31: 192 – 201 .
32. GlobCover Land Cover v2 2008 database, 2008. European Space Agency, European Space Agency GlobCover Project, led by MEDIAS-France. Available at: http://ionia1.esrin.esa.int/index.asp.
33. Di Gregorio A , Jansen LJM , 2000 . Land Cover Classification System (LCCS) . Rome, Italy : Food and Agriculture Organization (FAO ).
34. Scharlemann JPW , Benz D , Hay SI , Purse BV , Tatem AJ , Wint GRW , Rogers DJ , 2008 . Global data for ecology and epi-demiology: a novel algorithm for temporal fourier processing MODIS data . PLoS ONE 3: e1408 .
35. Drakeley C , Carneiro I , Reyburn H , Malima R , Lusingu J , Cox J , Theander T , Nkya WMM , Lemnge MM , Riley EM , 2005 . Altitude-dependent and independent variations in Plasmodium falciparum prevalence in northeastern Tanzania . J Infect Dis 191: 1589 – 1598 .
36. Lindsay SW , Martens WJM , 1998 . Malaria in the African high-lands: past, present and future . Bull World Health Organ 76: 33 – 45 .
37. Hay SI , Omumbo J , Craig M , Snow RW , 2000 . Earth observa-tion, geographic information systems and Plasmodium fal-ciparum malaria in sub-Saharan Africa . Adv Parasitol 47: 173 – 215 .
38. Thomson MC , Doblas-Reyes FJ , Mason SJ , Hagedorn R , Connor SJ , Phindela T , Morse AP , Palmer TN , 2006 . Malaria early warn-ings based on seasonal climate forecasts from multi-model ensembles . Nature 439: 576 – 579 .
39. Thomson MC , Mason SJ , Phindela T , Connor SJ , 2005 . Use of rain-fall and sea surface temperature monitoring for malaria early warning in Botswana . Am J Trop Med Hyg 73: 214 – 221 .
40. Hijmans RJ , Cameron SE , Parra JL , Jones PG , Garvis A , 2005 . Very high resolution interpolated climate surfaces for global land areas . Int J Climatol 25: 1965 – 1978 .
41. Shafiul Alam M , Khan MGM , Chaudhury N , Deloer S , Nazib F , Bangali AM , Haque R , 2010 . Prevalence of anopheline species and their Plasmodium infection status in epidemic-prone bor-der areas of Bangladesh . Malar J 9: 15 .
42. Robert V , Macintyre K , Keating J , Trape JF , Duchemin JB , McWilson W , Beier JC , 2003 . Malaria transmission in urban sub-Saharan Africa . Am J Trop Med Hyg 68: 169 – 176 .
43. Keiser J , Utzinger J , De Castro MC , Smith TA , Tanner M , Singer BH , 2004 . Urbanisation in sub-Saharan Africa and implications for malaria control . Am J Trop Med Hyg 71: 118 – 127 .
44. Donnelly MJ , McCall PJ , Lengeler C , Bates I , D’Alessandro U , Barnish G , Konradsen F , Klinkenberg E , Townson H , Trape JF , Hastings IM , Mutero C , 2005 . Malaria and urbanization in sub-Saharan Africa . Malar J 4: 12 .
45. Omumbo JA , Guerra CA , Hay SI , Snow RW , 2005 . The influence of urbanisation on measures of Plasmodium falciparum infec-tion prevalence in East Africa . Acta Trop 93: 11 – 21 .
46. Hay S , Guerra C , Tatem A , Atkinson P , Snow R , 2005 . Urbanization, malaria transmission and disease burden in Africa . Nat Rev Microbiol 3: 81 – 90 .
47. Uchida H , Nelson A , 2008 . Agglomeration Index: Toward a New Measure of Urban Concentration. Background Paper to World Development Report 2009 World Bank . Washington, DC: World Bank.
48. Center for International Earth Science Information Network, Columbia University , International Food Policy Research Institute, The World Bank, Centro International de Agricultura Tropical , 2004 . Global Rural-Urban Mapping Project (GRUMP): Urban Extents . Palisades, NY.
49. Tatem A , Guerra C , Kabaria C , Noor A , Hay S , 2008 . Human pop-ulation, urban settlement patterns and their impact on Plasmodium falciparum malaria endemicity . Malar J 7: 218 .
50. United Nations , 2006 . United Nations Population Division: World Population Prospects, 2006 Revision . New York, NY : United Nations .
51. Diggle PJ , Tawn JA , Moyeed R , 1998 . Model-based geostatistics . J Appl Stat 47: 299 – 350 .
52. Pfeiffer DU , Robinson T , Stevenson M , Stevens K , Rogers DJ , Clements A , 2008 . Spatial Analysis in Epidemiology . Oxford, UK : Oxford University Press .
53. Verdrager J , 1995 . Localised permanent epidemics: the genesis of chloroquine resistance in Plasmodium falciparum . Southeast Asian J Trop Med Public Health 26: 23 – 28 .
54. Childs DZ , Cattadori IM , Suwonkerd W , Prajakwong S , Boots M , 2006 . Spatiotemporal patterns of malaria incidence in northern Thailand . Trans R Soc Trop Med Hyg 100: 623 – 631 .
55. Srivastava A , Nagpal BN , Saxena R , Subbarao SK , 2001 . Predictive habitat modelling for forest malaria vector species An. dirus in India—a GIS-based approach . Curr Sci 80: 1129 – 1134 .
56. Oo TT , Storch V , Becker N , 2003 . Anopheles dirus and its role in malaria transmission in Myanmar . J Vector Ecol 28: 175 – 183 .