
Mapping fisheries for marine spatial planning: gear-specific vessel monitoring system, conservation...
8
Mapping fisheries for marine spatial planning: Gear-specific vessel monitoring system (VMS), marine conservation and offshore renewable energy Maria S. Campbell a , Kilian M. Stehfest b , Stephen C. Votier a , Jason M. Hall-Spencer a,n a Marine Biology and Ecology Research Centre/Marine Institute, Plymouth University, A428, Plymouth PL4 8 AA, United Kingdom b CSIRO-UTAS Quantitative Marine Science Program, University of Tasmania, Australia article info Article history: Received 3 June 2013 Received in revised form 18 June 2013 Accepted 9 September 2013 Available online 7 October 2013 Keywords: Marine protected area Marine renewable energy Marine spatial planning Gear type Displacement Vessel monitoring system abstract Vessel Monitoring System (VMS) data from 2005 to 2008 in ICES Divisions VIIe-h were used to assess the distribution and intensity of fishing activity in and around the western English Channel, one of the most intensively used marine areas on the planet. The distribution of the UK fleet of large ( 415 m length) fishing vessels was analysed and clear gear-specific temporal and spatial differences in activity were found. Mobile demersal gears had the highest intensity and widest distribution of activity in the study area, and so might be expected to have the most widespread ecosystem-level impacts. The potential effects of two proposed fisheries closures; a planned wave energy testing facility (Wave Hub) and a candidate offshore Marine Protected Area (Haig Fras) are described. Maps indicate that mobile demersal gear fleets would be little affected if they were excluded from these proposed closures, but if the static gear fleets were excluded this would likely result in displacement of certain vessels, increasing fishing pressure on other rocky grounds and other fishers. Predictions concerning the effects of fisheries displacement can be improved through the use of high-resolution gear-specific activity data. This study shows that VMS can provide an invaluable source of such data, provided that gear information is made available to fisheries managers and scientists. & 2013 Elsevier Ltd. All rights reserved. 1. Introduction Over the last 20 years, management approaches have shifted from the conservation of species to the more holistic management of spaces, designed to help reduce damage to ecosystems and the goods and services they provide [1–4]. Marine protected areas (MPAs) are emerging as a central tool for this approach, with the World Summit for Sustainable Development calling for the estab- lishment of a representative and coherent network of MPAs [5–7]. In addition, the world's oceans are increasingly being tapped as a source of renewable wind, tidal and wave energy [8–11] to address the decline in fossil fuel reserves and reduce the rates of changes caused by anthropogenic carbon dioxide emissions [12,13]. The UK has set a target of producing 33 gigawatts from marine renewable sources by 2020, meeting the EU target of supplying 20% of its gross consumption of energy from marine renewable sources by 2020 [14]. However, large scale offshore marine renewable energy installations (MREIs) have the potential to exclude certain fishing gear-types from large areas of the sea, from construction to operational phases [11]. The development of MREIs and the designation of marine protected areas are two rapidly emerging demands on marine space that compete with or displace fishing activities [9,15] and are likely to alter spatial patterns of fishing activity. For example, in relation to MPAs, North Sea and Baltic beam trawl cod fisheries could be forced to concentrate activity onto smaller grounds, leading to increased competition, reallocation of activity and lower catch [16,17]. To address conservation and economic activity and to aid in the resolution of stakeholder conflict, marine policy- making has shifted away from sector-by-sector management towards an integrated, multi-sector, ecosystem-based and trans- parent planning process, known as marine spatial planning (MSP) [18–25,26]. This is intended to help managers optimise sustainable use of the sea, for example by avoiding long-term damage to benthic habitats or the wasteful bycatch of non-target species. Recently, a group of international experts met to devise priority needs for the successful practical implementation of MSP [26]. One of the key elements identified, high-resolution, spatially and temporally accurate types of data and information on the various activities taking place in the marine environment [26,27]. Contents lists available at ScienceDirect journal homepage: www.elsevier.com/locate/marpol Marine Policy 0308-597X/$ - see front matter & 2013 Elsevier Ltd. All rights reserved. http://dx.doi.org/10.1016/j.marpol.2013.09.015 n Corresponding author. Tel.: þ44 7152 584629. E-mail address: [email protected] (J.M. Hall-Spencer). Marine Policy 45 (2014) 293–300
Transcript of Mapping fisheries for marine spatial planning: gear-specific vessel monitoring system, conservation...

Mapping fisheries for marine spatial planning: Gear-specific vesselmonitoring system (VMS), marine conservation and offshorerenewable energy
Maria S. Campbell a, Kilian M. Stehfest b, Stephen C. Votier a, Jason M. Hall-Spencer a,n
a Marine Biology and Ecology Research Centre/Marine Institute, Plymouth University, A428, Plymouth PL4 8 AA, United Kingdomb CSIRO-UTAS Quantitative Marine Science Program, University of Tasmania, Australia
a r t i c l e i n f o
Article history:Received 3 June 2013Received in revised form18 June 2013Accepted 9 September 2013Available online 7 October 2013
Keywords:Marine protected areaMarine renewable energyMarine spatial planningGear typeDisplacementVessel monitoring system
a b s t r a c t
Vessel Monitoring System (VMS) data from 2005 to 2008 in ICES Divisions VIIe-h were used to assess thedistribution and intensity of fishing activity in and around the western English Channel, one of the mostintensively used marine areas on the planet. The distribution of the UK fleet of large (415 m length)fishing vessels was analysed and clear gear-specific temporal and spatial differences in activity werefound. Mobile demersal gears had the highest intensity and widest distribution of activity in the studyarea, and so might be expected to have the most widespread ecosystem-level impacts. The potentialeffects of two proposed fisheries closures; a planned wave energy testing facility (Wave Hub) and acandidate offshore Marine Protected Area (Haig Fras) are described. Maps indicate that mobile demersalgear fleets would be little affected if they were excluded from these proposed closures, but if the staticgear fleets were excluded this would likely result in displacement of certain vessels, increasing fishingpressure on other rocky grounds and other fishers. Predictions concerning the effects of fisheriesdisplacement can be improved through the use of high-resolution gear-specific activity data. This studyshows that VMS can provide an invaluable source of such data, provided that gear information is madeavailable to fisheries managers and scientists.
& 2013 Elsevier Ltd. All rights reserved.
1. Introduction
Over the last 20 years, management approaches have shiftedfrom the conservation of species to the more holistic managementof spaces, designed to help reduce damage to ecosystems and thegoods and services they provide [1–4]. Marine protected areas(MPAs) are emerging as a central tool for this approach, with theWorld Summit for Sustainable Development calling for the estab-lishment of a representative and coherent network of MPAs [5–7].In addition, the world's oceans are increasingly being tapped as asource of renewable wind, tidal and wave energy [8–11] to addressthe decline in fossil fuel reserves and reduce the rates of changescaused by anthropogenic carbon dioxide emissions [12,13]. The UKhas set a target of producing 33 gigawatts from marine renewablesources by 2020, meeting the EU target of supplying 20% of itsgross consumption of energy from marine renewable sources by2020 [14]. However, large scale offshore marine renewable energyinstallations (MREIs) have the potential to exclude certain fishing
gear-types from large areas of the sea, from construction tooperational phases [11].
The development of MREIs and the designation of marineprotected areas are two rapidly emerging demands on marinespace that compete with or displace fishing activities [9,15] andare likely to alter spatial patterns of fishing activity. For example,in relation to MPAs, North Sea and Baltic beam trawl cod fisheriescould be forced to concentrate activity onto smaller grounds,leading to increased competition, reallocation of activity and lowercatch [16,17]. To address conservation and economic activity andto aid in the resolution of stakeholder conflict, marine policy-making has shifted away from sector-by-sector managementtowards an integrated, multi-sector, ecosystem-based and trans-parent planning process, known as marine spatial planning (MSP)[18–25,26]. This is intended to help managers optimise sustainableuse of the sea, for example by avoiding long-term damage tobenthic habitats or the wasteful bycatch of non-target species.Recently, a group of international experts met to devise priorityneeds for the successful practical implementation of MSP [26]. Oneof the key elements identified, high-resolution, spatially andtemporally accurate types of data and information on the variousactivities taking place in the marine environment [26,27].
Contents lists available at ScienceDirect
journal homepage: www.elsevier.com/locate/marpol
Marine Policy
0308-597X/$ - see front matter & 2013 Elsevier Ltd. All rights reserved.http://dx.doi.org/10.1016/j.marpol.2013.09.015
n Corresponding author. Tel.: þ44 7152 584629.E-mail address: [email protected] (J.M. Hall-Spencer).
Marine Policy 45 (2014) 293–300

Until recently, marine managers had to rely on surveillancedata from observer planes/vessels or logbook catch data todetermine the spatial distribution of fishing activity [28]. Thesedata lacked temporal coverage and spatial resolution, preventingfull integration of fisheries data into marine spatial plans [4].Satellite vessel monitoring systems (VMS) are increasingly beingused to overcome these limitations. Introduced in the 1990s invarious parts of the world [29], VMS were originally established toallow fisheries administrators to control and monitor fishingactivity [28,30]. In European Union waters, VMS were introducedin 2000 when all vessels 424 m in length (and all vessels 415 min length since 2005) were required to submit information on theirposition every 2 h to a Fisheries Monitoring Centre [31]. Vesselspeeds have been included since 2005. From 1st January 2012,vessels 412 m in length will have to install VMS [32] and thereare discussions about extending the systems to towed gear vessels48 m in length [33]. VMS data have proven valuable in spatialanalyses of fishing activity [28,30,34] and have been used as aproxy for the distribution of target fish stocks [35]. Such data canalso show how spatial closures can displace fisheries activity[36,37]. VMS is now being used to inform the design of MPAs toavoid displacement of destructive fishing activities onto vulner-able marine ecosystems in the deep sea [38,39]. In addition, gear-specific VMS analyses have been carried out within the GermanEEZ [4,40], the Irish EEZ [41], the UK EEZ [42–45] and for theDanish fleet [46] which have the potential to greatly improve theassessment of fisheries impacts. Such work has considerableimplications for management, as different fishing sectors havespecific responses to various management measures for exampleclosures.
Here, VMS data are used to provide an overview of thedistribution of fishing activity by gear type in ICES DivisionsVIIe-h (Fig. 1a), which borders the south-eastern coast of Ireland,the south-western coast of the UK, and the north-western coast ofFrance. This area covers parts of the English Channel, Celtic Seaand Atlantic Ocean and is one of the most highly used marineareas in terms of all marine activity on the planet [28,47]. How twopotential fisheries closures may affect the distribution of bothstatic and mobile gear users is described. The potential effects ofdisplacement and the influence of bathymetry and seabed sedi-ment type on fisheries activity are also investigated. One of theproposed closures is for an MREI, a facility for testing prototypeWave Energy Converters (WECs), Wave Hub the UK's first marineenergy park located 10 NM from Hayle North Cornwall resulting inan 8 km2 exclusion zone. Coupled with this, due to the nature of
the exclusion zones associated with offshore marine renewableenergy developments, there is a great deal of interest in these sitesas de facto MPAs [11]. The other proposed closure is Haig Fras, a45 km long granite reef that is the only substantial area of rockyreef in the Celtic Sea [48] and was put forward as a Natura 2000conservation area in 2008 [49].
2. Materials and methods
2.1. VMS data
VMS data were available for all UK registered vessels 415 m inlength that were active in ICES Divisions VIIe-h from 2005 to 2008and were obtained from the Marine Management Organisation(MMO), formerly the UK Marine and Fisheries Agency. In addition,access to gear-type information was not available for non-UK fishingvessels fishing in UK waters, thus were excluded from analyses. TheUK vessel VMS dataset contained vessel records, each consisting of arandomly created vessel identification number (to separate indivi-dual vessels while retaining their anonymity), speed, vessel positionin decimal degrees, and the date and time of transmission. Access tologbook information was not permitted by the MMO for this study,although gear-type information was extracted from logbooks by theMMO and submitted with the initial VMS dataset. The followingfishing gear-type classifications were used: scallop dredge, longline,gillnet, potter/whelker, beam trawl and demersal otter trawl, all ofwhich conform as close as possible to European Union level 3 and4 Data Collection Regulation (DCR) [50,51] considering the level ofdata made available for this study.
2.2. Fishing activity analyses
2.2.1. VMSVMS data analysis closely followed the recently established
approach for estimating fishing activity by Lee et al. [43].In summary, the removal of records: (1) without an associatedgear type, (2) within 3 NM of ports, and (3) duplicates. The intervalbetween each successive record was calculated and a vessel wasdeemed to be engaged in fishing activity if its speed was between1 and 6 knots (for all gear types). This filtered data was subject to apoint summation method, using a grid cell size of 0.051 or 3 minsWGS84, this is the resolution to provide fishing data to informmarine spatial planning in the UK [44]. Fishing activity in eachICES Division VIIe-h was calculated separately.
Fig. 1. Study area showing ICES Divisions VIIe-h boundaries, the location of the proposed Haig Fras Natura 2000 site and the location of the proposed Wave Hubdeployment area.
M.S. Campbell et al. / Marine Policy 45 (2014) 293–300294

To quantify the differences in spatial patterns of fishing activitybetween gear types and within the same gear type but betweenyears, the index of difference in spatial pattern developed by [43]was used. In brief, “activity in each cell was calculated so that thesum of all activity in ICES Divisions VIIe-h was one. To facilitatecomparison, the absolute differences in proportion of activity ineach cell were calculated, summed for ICES Divisions VIIe-h thendivided by 2, resulting in an index of difference in spatial patternvarying from zero to one. In this way, zero represents identicalspatial fishing patterns in the same cells, and one represents nocommon spatial pattern in the same cells” [43].
2.2.2. EU-defined fleet-effort analysisFishing effort of fleets is defined in the EC Regulation of 2002
(Article 3(h)) [52] as the product of capacity and activity. Capacitycan be measured roughly in terms of the number of vessels ormore precisely, the size of vessels (either gross tonnage (GT) orengine power (kW)) and activity is commonly measured as theperiod of time in which a vessel is active, for example the numberof days at sea. In this study, capacity is presented as number ofvessels, because neither GT nor kW was made available andcalculated days at sea for each vessel within the specified geartypes. Each ICES Division VIIe-h were analysed separately.
2.2.3. Fishing activity and marine landscapesThe distributions of fishing activity were analysed with respect
to five marine landscape types, which were derived from UKSeaMap data [53]. The five categories were; sand, mixed sediment,coarse sediment, rock, and mud. Fishing activity was assessed bycalculating the average number of fishing hours per 1 km2 of eachmarine landscape. By aggregating all fishing effort by gear type itwas possible to assess fishing activity on a regional level (ICESVIIe-h) rather than sub-divisional as before.
3. Results
The spatial and temporal distributions of fishing effort per ICESDivision (Fig. 2), particularly with reference to seabed sedimenttype (Fig. 3) and bathymetry (Fig. 1), reveal a great deal of insightinto factors governing fishing site selection by various gear types.For the purposes of brevity here we outline some of the majorfindings, whereas a more exhaustive analysis is the subject ofongoing work.
The spatial distribution of fishing activity was highly hetero-geneous and distinct areas of intense fishing could be identified forall gear types (Fig. 2). Spatial patterns were more consistent withingears between 2005 and 2008, with the index of difference(Section 2.2.1) for mobile gears ranging from 0.2698 to 0.5151(Table 1). For the static fleet, similar consistencies between yearswere observed for both potting and whelking and gillnetting from2005 to 2008, ranging from 0.3837 to 0.5025, and in longliningfrom 2005 to 2006. However, for the longlining fleet, spatialpatterns from 2006 to 2008 ranged from 0.6629 to 0.721, indicat-ing a slight shift in spatial distribution from the previous year.Patterns of fishing activity between individual pairings of gearsranged from 0.8472 to 0.9979, indicating distinct spatial zonationby gear type (Table 2), although some lower values were observedbetween beam trawling and scallop dredging across all yearsranging from 0.6089 to 0.6832, indicating an overlap of fishingactivity.
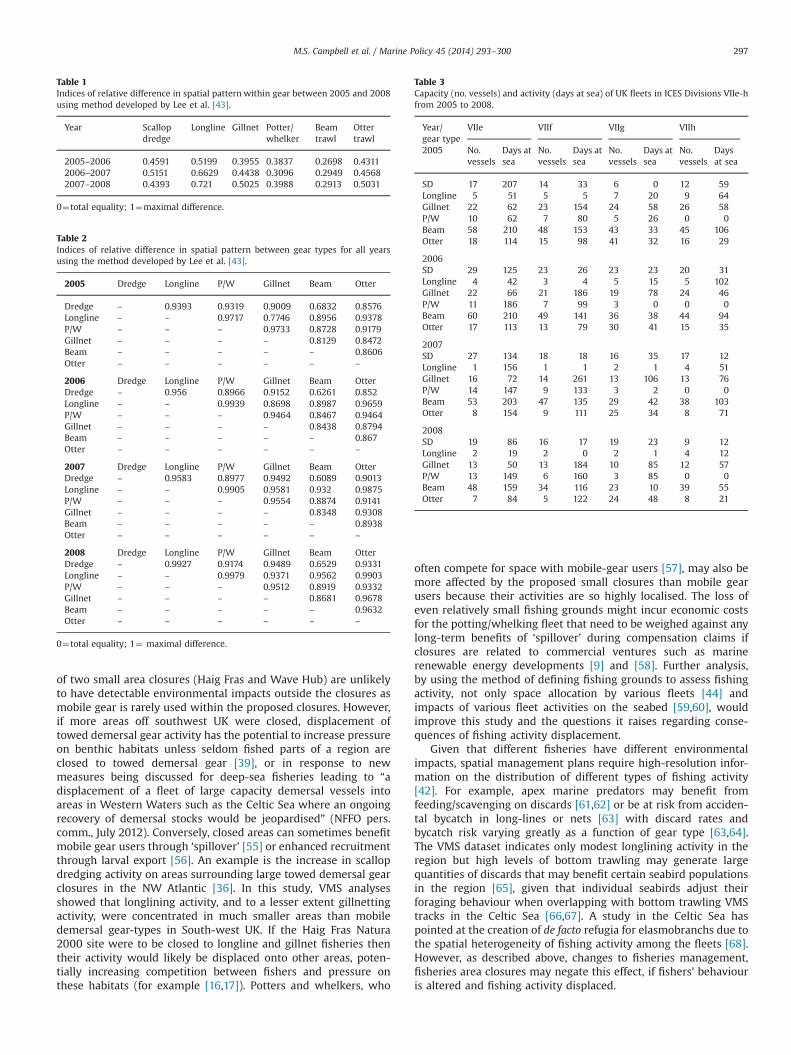
Fishing effort of the fleets (Table 3), showed some veryinteresting results within ICES Division VIIf, with some of thehighest potting and whelking effort, as well as gillnetting,although some variation in this effort occurred over the studyperiod. ICES Division VIIe represented the highest scallop dredging
effort. Haig Fras, in ICES Division VIIg, also represented highfishing effort by gillnetting and longlining fleets, in comparisonto other fishing gears in the area, with Haig Fras being the maingillnetting ground for these vessels 2005–2008. Beam trawlingand otter trawling are widespread throughout the study area, withhighest effort in ICES Divisions VIIe and f.
Fishing with mobile gear was more widely distributed (Fig. 2a,e and f) with beam trawling occurring over the largest part of thestudy area (Fig. 2e) but also widespread otter trawling (Fig. 2f).Static gear fishing was focused in fewer areas (Fig. 2b–d). For staticgear, and in particular the potting and whelking fleet, this patternis clearly linked to the availability of suitable seabed sediment(Fig. 3), with fishing activity concentrated on rocky areas (Table 4),which covered the smallest percentage of the study area, but alsoto a certain extent coarse sediment (Fig. 3). This pattern was alsopresent, to a smaller extent, for gillnetting (Table 4). Longliningactivity per unit area was highest over muddy substrates, howeverhigh values were also observed over mixed sediment, and rock.Mobile gear activity per unit area of marine landscape type variedbetween all marine landscape types: scallop dredging occurringover mixed sediment or mud; beam and otter trawling mainly inmuddy areas, and with high coverage per unit time in mixed andsand respectively. Some overlap with rocky areas did occur withthe mobile fleets (Table 4).
In addition to marine landscape type, bathymetry also influ-ences the distribution of intensely fished areas for some geartypes. For example, the continental shelf break in the south-western corner of the study area was a hotspot for gillnettingand longlining. Furthermore, Hurd's Deep (491 30′N: 31 34′W), anarrow channel at which depths drop below 100 m to the north ofJersey is preferentially targeted by beam trawlers.
4. Discussion
Vessel Monitoring Scheme data from southwest UK reveal cleargear-specific differences in spatial patterns of fishing activity andallow analyses of the use of shared resources by UK fleets. Asexpected, the VMS data show that intensely fished areas varybetween gear types with towed demersal gear users generallyavoiding the rocky grounds that are targeted by other static gearfleets. When the data is not analysed per gear type, usefulinformation (for example seasonal patterns in the locations ofareas that are intensely used by sectors of the fleet) is lost and theoverall impression of fleet activity is dominated by the mostcommon fishing method [28]. Previously, VMS data have beenused to plan the sites of offshore marine protected areas, designedto minimise displacement of activity and to identify areas thatwere most likely to have untrawled biogenic habitats [39]. Gear-specific fishing activity was not analysed for the design of theseoffshore MPAs as such data were not released by the authorities.Given the diversity of fishing gears used in inshore waters, a lackof gear specific information could lead to poor marine spatialmanagement decisions. Results illustrate that gear-based VMSanalyses can offer greater detail on fleet activities than traditionalsources of fisheries data, such as over flight data, and provides anopportunity to improve marine spatial planning. However, insightcould be significantly improved if higher level data were available(for example, [43,44]). This is particularly important in areas suchas southwest UK as this area currently harbours most of the UKfishing fleet [54].
The effects of fishery closures (for example for nature con-servation, or for offshore renewable energy developments) willvary considerably between different sectors of the fishing industry.In the present study, beam trawling was the most widespread typeof fishing, followed by demersal otter trawling. ' areas that effects
M.S. Campbell et al. / Marine Policy 45 (2014) 293–300 295

Fig. 3. Seabed type derived from UK Seamap data [53] within the boundaries of ICES Divisions VIIeh.
Fig. 2. Fishing effort distribution of UK vessels 415 m in length in ICES Divisions VIIe-h from 2005 to 2008 (a) scallop dredge (b) longline (c) gillnet (d) potters/whelkers(e) beam trawl and (f) otter trawl. Logarithmic scale bar (h) is shown.
M.S. Campbell et al. / Marine Policy 45 (2014) 293–300296
of two small area closures (Haig Fras and Wave Hub) are unlikelyto have detectable environmental impacts outside the closures asmobile gear is rarely used within the proposed closures. However,if more areas off southwest UK were closed, displacement oftowed demersal gear activity has the potential to increase pressureon benthic habitats unless seldom fished parts of a region areclosed to towed demersal gear [39], or in response to newmeasures being discussed for deep-sea fisheries leading to “adisplacement of a fleet of large capacity demersal vessels intoareas in Western Waters such as the Celtic Sea where an ongoingrecovery of demersal stocks would be jeopardised” (NFFO pers.comm., July 2012). Conversely, closed areas can sometimes benefitmobile gear users through ‘spillover’ [55] or enhanced recruitmentthrough larval export [56]. An example is the increase in scallopdredging activity on areas surrounding large towed demersal gearclosures in the NW Atlantic [36]. In this study, VMS analysesshowed that longlining activity, and to a lesser extent gillnettingactivity, were concentrated in much smaller areas than mobiledemersal gear-types in South-west UK. If the Haig Fras Natura2000 site were to be closed to longline and gillnet fisheries thentheir activity would likely be displaced onto other areas, poten-tially increasing competition between fishers and pressure onthese habitats (for example [16,17]). Potters and whelkers, who
often compete for space with mobile-gear users [57], may also bemore affected by the proposed small closures than mobile gearusers because their activities are so highly localised. The loss ofeven relatively small fishing grounds might incur economic costsfor the potting/whelking fleet that need to be weighed against anylong-term benefits of ‘spillover’ during compensation claims ifclosures are related to commercial ventures such as marinerenewable energy developments [9] and [58]. Further analysis,by using the method of defining fishing grounds to assess fishingactivity, not only space allocation by various fleets [44] andimpacts of various fleet activities on the seabed [59,60], wouldimprove this study and the questions it raises regarding conse-quences of fishing activity displacement.
Given that different fisheries have different environmentalimpacts, spatial management plans require high-resolution infor-mation on the distribution of different types of fishing activity[42]. For example, apex marine predators may benefit fromfeeding/scavenging on discards [61,62] or be at risk from acciden-tal bycatch in long-lines or nets [63] with discard rates andbycatch risk varying greatly as a function of gear type [63,64].The VMS dataset indicates only modest longlining activity in theregion but high levels of bottom trawling may generate largequantities of discards that may benefit certain seabird populationsin the region [65], given that individual seabirds adjust theirforaging behaviour when overlapping with bottom trawling VMStracks in the Celtic Sea [66,67]. A study in the Celtic Sea haspointed at the creation of de facto refugia for elasmobranchs due tothe spatial heterogeneity of fishing activity among the fleets [68].However, as described above, changes to fisheries management,fisheries area closures may negate this effect, if fishers' behaviouris altered and fishing activity displaced.
Table 1Indices of relative difference in spatial pattern within gear between 2005 and 2008using method developed by Lee et al. [43].
Year Scallopdredge
Longline Gillnet Potter/whelker
Beamtrawl
Ottertrawl
2005–2006 0.4591 0.5199 0.3955 0.3837 0.2698 0.43112006–2007 0.5151 0.6629 0.4438 0.3096 0.2949 0.45682007–2008 0.4393 0.721 0.5025 0.3988 0.2913 0.5031
0¼total equality; 1¼maximal difference.
Table 2Indices of relative difference in spatial pattern between gear types for all yearsusing the method developed by Lee et al. [43].
2005 Dredge Longline P/W Gillnet Beam Otter
Dredge – 0.9393 0.9319 0.9009 0.6832 0.8576Longline – – 0.9717 0.7746 0.8956 0.9378P/W – – – 0.9733 0.8728 0.9179Gillnet – – – – 0.8129 0.8472Beam – – – – – 0.8606Otter – – – – – –
2006 Dredge Longline P/W Gillnet Beam OtterDredge – 0.956 0.8966 0.9152 0.6261 0.852Longline – – 0.9939 0.8698 0.8987 0.9659P/W – – – 0.9464 0.8467 0.9464Gillnet – – – – 0.8438 0.8794Beam – – – – – 0.867Otter – – – – – –
2007 Dredge Longline P/W Gillnet Beam OtterDredge – 0.9583 0.8977 0.9492 0.6089 0.9013Longline – – 0.9905 0.9581 0.932 0.9875P/W – – – 0.9554 0.8874 0.9141Gillnet – – – – 0.8348 0.9308Beam – – – – – 0.8938Otter – – – – – –
2008 Dredge Longline P/W Gillnet Beam OtterDredge – 0.9927 0.9174 0.9489 0.6529 0.9331Longline – – 0.9979 0.9371 0.9562 0.9903P/W – – – 0.9512 0.8919 0.9332Gillnet – – – – 0.8681 0.9678Beam – – – – – 0.9632Otter – – – – – –
0¼total equality; 1¼ maximal difference.
Table 3Capacity (no. vessels) and activity (days at sea) of UK fleets in ICES Divisions VIIe-hfrom 2005 to 2008.
Year/gear type
VIIe VIIf VIIg VIIh
2005 No.vessels
Days atsea
No.vessels
Days atsea
No.vessels
Days atsea
No.vessels
Daysat sea
SD 17 207 14 33 6 0 12 59Longline 5 51 5 5 7 20 9 64Gillnet 22 62 23 154 24 58 26 58P/W 10 62 7 80 5 26 0 0Beam 58 210 48 153 43 33 45 106Otter 18 114 15 98 41 32 16 29
2006SD 29 125 23 26 23 23 20 31Longline 4 42 3 4 5 15 5 102Gillnet 22 66 21 186 19 78 24 46P/W 11 186 7 99 3 0 0 0Beam 60 210 49 141 36 38 44 94Otter 17 113 13 79 30 41 15 35
2007SD 27 134 18 18 16 35 17 12Longline 1 156 1 1 2 1 4 51Gillnet 16 72 14 261 13 106 13 76P/W 14 147 9 133 3 2 0 0Beam 53 203 47 135 29 42 38 103Otter 8 154 9 111 25 34 8 71
2008SD 19 86 16 17 19 23 9 12Longline 2 19 2 0 2 1 4 12Gillnet 13 50 13 184 10 85 12 57P/W 13 149 6 160 3 85 0 0Beam 48 159 34 116 23 10 39 55Otter 7 84 5 122 24 48 8 21
M.S. Campbell et al. / Marine Policy 45 (2014) 293–300 297

Another example where mangers require gear-specific fishingactivity information is in mitigating the impacts of certain types offishing activity on the seabed. Areas of strong fishing activity bymobile gear types can modify the magnitude of natural sedimenttransport and sedimentation patterns by waves and currents [69].In a hitherto unique study from the continental shelf in the Gulf ofLions, the impact of bottom trawls on fine sediment resuspensionwas found to be comparable with that of the largest storms, and isresponsible for more than 30 per cent of the total erosion ofsediment from that area.
When managing seabed habitats for biodiversity conservation,or for the commercial protection of nursery areas and brood stock,gear specific VMS data will prove useful in spatial planning sincemobile demersal gear types have major impacts on certain benthiccommunities [70,71], with scallop dredging known to cause moredamage to seabed habitats than potting, for example [72,73].An analysis of which fishing gears are used where is important,both in assessing the cumulative impacts on marine eco-systems but also in the context of marine planning, given thepotential for MPAs and MREIs to cause displacement of fishingactivity [42,47,74–77].
Marine reserve planners and renewable energy developers areincreasingly using multicriteria decision analysis tools such asMarxan to optimise site selection [78–81], as this allows consid-eration of a variety of different spatially explicit selection criteria.While the main consideration is the distribution of the naturalresource in question, the inclusion of gear-specific high-resolutionfisheries data can minimise environmental costs of closuresincurred by activity displacement [82] and increase the economicbenefits of closures to fishers [83], who are one of the mainstakeholders in the marine environment [9], thereby makingclosures more politically feasible [83].
Although gear-type-specific VMS data analyses need to becarried out to sensibly manage the marine environment, thereare caveats. The fact that only vessels 415 m length are presentlyincluded in VMS means these data cannot be used to predicteffects of inshore marine renewable energy installations on thedistribution of inshore fishing activity. However, mobile phoneVMS for small inshore vessels are being trialled throughout the EU,and initial results suggest that fishing vessels of certain lengthstend to follow predictable patterns of fishing activity [84]. Currentwork being carried out by the Centre for Environment, Fisheriesand Aquaculture Science (CEFAS) in conjunction with the InshoreFisheries and Conservation Authorities (IFCAs) will lead the wayfor finer scale inshore fishing analysis. Data on non-UK vessels wasunavailable for this study and concerns over data inaccuracies, inparticular the lack of gear-type [43], precluded its use. Clearly,accurate assessment of the environmental impacts of internationalfisheries activity requires knowledge of activity distribution of allvessels, regardless of their length and nationality. Other issuesarise in the VMS analyses. For example, the analyses are based onrecords that are transmitted every 2 h, and there are risks inmisclassification of fishing vs. non-fishing. When interpreting
fishing activity in the smaller area of Wave Hub, this is an issuewhich needs to be explored further, especially in the case of staticgear use, where more data is needed on net and trap character-istics and soak times, in order to fully gage fishing effort [43].In this analysis, a point summation method is used as it is deemedmore transparent, but underestimations of activity are a potentialrisk [44]. Reconstruction of tracks is an option [85], but vesselsrarely travel in straight lines and again, it may not be appropriatefor those using static gear and the 2 h polling frequency is an issue[44]. In terms of track reconstruction, recent work has helpedimprove VMS analysis using spline polynomials rather than linearsegments for tracks of beam trawl [86] and subsequently othergear types [87]. However, no interpolation technique will over-come the basic necessity for more frequent polling, prompting [45]to suggest polling at intervals of 30 min, supporting more accurateassessments of fishing activity and resulting impacts on theseabed.
In January 2005, transmission of speed data became compul-sory in EU VMS. A simple speed filter allows the correct identifica-tion of a high percentage of both steaming and fishing activity[43,44]. The speed filters used, although necessary to indicatefishing gear deployment, could overestimate fishing activity asvessels might slow down due to bad weather or to reduce fuelcosts for example [88], and/or local or sectoral differences infishing speeds of individual vessels or at fleet level [43]. As marinespatial planning advances there is an opportunity to includefishers' knowledge (FK) with VMS and logbook data as well asstudies of the biological, sociological and psychological influenceson fishing fleet behaviour [89–91] in order to predict the move-ment of vessels across fleets in both the short-term and long-term.
There is room for improvement in the VMS, such as includingsmaller vessels and facilitating easier access to the data forresearchers and spatial planners across EU Member States. Pre-sently, EU VMS data for purposes other than those relating to theCommon Fisheries Policy (CFP) is “constrained by a combination ofhuman rights law; data protection law; the law of confidence andEU law, in particular the EU confidentiality obligation under Article113 of EC Regulation 1224/2009 (the ‘Control Regulation’)” [92].VMS are considered to provide personal data obtained via surveil-lance although if data analyses are for marine planning purposes,and if such analyses are integral to the CFP, then anonymized,aggregated data may be released [92]. Since 2009, changes toaccess to VMS data, and the level of resolution due to EU Councilregulations, changes which have adversely affected this study, mayprove severely disadvantageous to accurately assessing fishingfleet activity and the consequences of displacement for thesefleets, hence having societal implications [93].
5. Conclusions
A lack of access to high-resolution gear-specific fisheries datafor analyses raises scientific and socio-economic concerns about
Table 4Activity (h/km2�10�5) of all UK fleets respective of marine landscape type from 2005 to 2008.
Gear type/Marine landscape Sand Coarse Mixed Rock Mud
MobileScallop dredge 11.02615 9.555377 38.19663 26.15827 40.09043Beam trawl 61.42465 42.33229 63.59778 21.14759 355.342Otter trawl 8.3149726 2.6548399 4.179753 21.18380 246.67104
StaticLongline 1.1745026 1.5800855 4.2812401 1.7274331 11.162576Gillnet 11.624799 5.2034432 10.637948 23.562868 143.6178Potter/whelker 2.441716 5.8374971 4.9672157 15.623484 7.332280
M.S. Campbell et al. / Marine Policy 45 (2014) 293–300298

the underpinning of ongoing marine spatial management deci-sions. Given the current rapid expansion in European marine spaceleased to marine renewable energy, and plans for a network ofMPAs that restrict certain fishing gear types, it is imperative topredict and plan for the likely effects of spatial restrictions onfisheries.
Acknowledgements
This project was funded by PRIMaRE, and the EU Charm III andKNOWSEAS (Grant no. 226675) Programmes. We thank theMarine Management Organisation (formerly the UK Marine andFisheries Agency) for providing VMS data. We gratefully acknowl-edge the critical comments of our anonymous reviewer and thoseof Dr Victor Abbott, Plymouth University, which helped improvethe present manuscript. The authors would also like Dr DanielBuscombe, United States Geological Survey, for his assistance withdata processing and analysis.
References
[1] Zacharias MA, Roff JC. A hierarchical ecological approach to conserving marinebiodiversity. Conservation Biology 2000;14:1327–34.
[2] Roberts CM, Hawkins JP, Gell FR. The role of marine reserves in achievingsustainable fisheries. Philosophical Transactions of the Royal Society B:Biological Sciences 2005;360:123–32.
[3] Apitz SE, Elliott M, Fountain M, Galloway TS. European environmentalmanagement: moving to an ecosystem approach. Integrated EnvironmentalAssessment and Management 2006;2(1):80–5.
[4] Pedersen SA, Fock HO, Sell AF. Mapping fisheries in the German exclusiveeconomic zone with special reference to offshore Natura 2000 sites. MarinePolicy 2009;33:571–90.
[5] United Nations. Report of the world summit on sustainable development. Para.32(c), UN; 2002.
[6] Spalding MD, Fish L, Wood LJ. Toward representative protection of the world’scoasts and oceans—progress, gaps, and opportunities. Conservation Letters2008;1:217–26.
[7] Jones PJS, Carpenter A. Crossing the divide: The challenges of designing anecologically coherent and representative network of MPAs for the UK. MarinePolicy 2009;33:737–43.
[8] Clement A, McCullen P, Falcão A, Fiorentino A, Gardner F, Hammarlund K, et al.Wave energy in Europe: current status and perspectives. Renewable andSustainable Energy Reviews 2002;6:405–31.
[9] Gray T, Haggett C, Bell D. Offshore wind farms and commercial fisheries in theUK: a study in Stakeholder Consultation. Ethics, Place and Environment2005;8:127–40.
[10] Breton SP, Moe G. Status, plans and technologies for offshore wind turbines inEurope and North America. Renewable Energy 2009;34:646–54.
[11] Inger R, Attrill MJ, Bearhop S, Broderick AC, Grecian WJ, Hodgson DJ, et al.Marine Renewable energy: potential benefits to biodiversity? An urgent callfor research Journal of Applied Ecology 2009;46:1145–53.
[12] Hall-Spencer JM, Rodolfo-Metalpa R, Martin S, Ransome E, Fine M, Turner SM,et al. Volcanic carbon dioxide vents reveal ecosystem effects of oceanacidification. Nature 2008;454:96–9.
[13] Sheilds MA, Dillon LJ, Woolf DK, Ford AT. Strategic priorities for assessingecological impacts of marine renewable energy devices in the Pentland Firth(Scotland, UK). Marine Policy 2009;33:635–42.
[14] United Kingdom House of Lords. 27th report of session 2007–08: the EU'starget for renewable energy: 20% by 2020 volume I: report. House ofLords European Union Committee. Available from: ⟨http://www.publications.parliament.uk/pa/ld200708/ldselect/ldeucom/175/175.pdf⟩; 2008 [accessed08.09.11].
[15] Stewart RR, Possingham HP. Efficiency, costs and trade-offs in marine reservesystem design. Environmental Modeling and Assessment 2005;10:203–13.
[16] Rijnsdorp AD, BPLv Mourik, Visser EG. Competitive interactions among beamtrawlers exploiting local patches of flatfish in the North Sea. ICES Journal ofMarine Science 2000;57:894–902.
[17] Suuronen P, Jounela P, Tschernij V. Fishermen responses on marine protectedareas in the Baltic cod fishery. Marine Policy 2010;34:237–43.
[18] Smith MD, Wilen JE. Economic impacts of marine reserves: the importance ofspatial behaviour. Journal of Environmental Economics and Management2003;46:183–206.
[19] Crowder LB, Osherenko G, Young OR, Airamé S, Norse EA, Baron N, et al.Resolving mismatches in U.S. ocean governance. Science 2006;313:617–8.
[20] Tyldesley D. A vision for marine spatial planning. Ecos 2006;27:33–9.[21] Douvere F. The importance of marine spatial planning in advancing
ecosystem-based sea use management. Marine Policy 2008;32:762–71.
[22] EC (European Commission). Directive 2008/56/EC of the European Parliamentand of the Council of 17 June 2008 establishing a framework for communityaction in the field of marine environmental policy (Marine Strategy Frame-work Directive); 2008.
[23] Gilliland PM, Laffoley D. Key elements and steps in the process of developingecosystem-based marine spatial planning. Marine Policy 2008;32:787–96.
[24] Douvere F, Ehler CN. New perspectives on sea use management: initial findngsfrom European experience with marine spatial planning. Journal of Environ-mental Management 2009;90:77–88.
[25] Foley MM, Halpern BS, Micheli F, Armsby MH, Caldwell MR, Crain CM, et al.Guiding principles for marine spatial planning. Marine Policy 2010;34:955–66.
[26] Halpern BS, Diamond J, Gaines S, Gelcich S, Gleason M, Jennings S, et al. Neartime priorities for the science, policy and practice of Coastal and MarineSpatial planning (CMSP). Marine Policy 2012;36:198–205.
[27] Eastwood PD, Mills CM, Aldridge JN, Houghton CA, Rogers SI. Human activitiesin UK offshore waters: an assessment of direct, physical pressure on theseabed. ICES Journal of Marine Science 2007;64:453–63.
[28] Witt MJ, Godley BJA. Step Towards Seascape Scale Conservation: using vesselmonitoring systems (VMS) to map fishing activity. PLoS One 2007;2:e1111.
[29] Marshall P, Robert T. FAO technical guidelines for responsible fisheries, no.1Suppl.1. Food and Agriculture Organization of the United Nations. 1998.
[30] Davies A, Roberts JM, Hall-Spencer JM. Preserving deep-sea natural heritage:emerging issues in offshore conservation and management. Biological Con-servation 2007;138:299–312.
[31] EC. Commission Regulation no. 2244/2003 of 18 December 2003 laying downdetailed provisions regarding satellite-based vessel monitoring systems.Official Journal of the European Union, vol. 17–27; 2003. L 333.
[32] EC. Commission Implementing Regulation (EU) no. 404/2011 of 8th April 2011.Laying down detailed rules for the implementation of Council Regulation ECNo 1224/2009 establishing a community control system for ensuring com-pliance with the rules of the Common Fisheries Policy. Official Journal of theEuropean Union; 2011. L112/1.
[33] EC. Proposal for a Council Regulation establishing a Community controlsystem for ensuring compliance with the rules of the Common FisheriesPolicy DS 329/09; 20 May 2009.
[34] Deng R, Dichmont C, Milton D, Haywood M, Vance D, Hall N, et al. Can vesselmonitoring system data also be used to study trawling intensity and popula-tion depletion? The example of Australia's northern prawn fishery CanadianJournal of Fisheries and Aquatic Sciences 2005;62:611–22.
[35] Bertrand S, Diaz E, Lengaigne M. Patterns in the spatial distribution ofPeruvian anchovy (Engraulis ringens) revealed by spatially explicit fishingdata. Progress in Oceanography 2008;79:379–89.
[36] Murawski SA, Wigley SE, Fogarty MJ, Rago PJ, Mountain DG. Activity distribu-tion and catch patterns adjacent to temperate MPAs. ICES Journal of MarineScience 2005;62:1150–67.
[37] Hiddink JG, Hutton T, Jennings S, Kaiser MJ. Predicting the effects of areaclosures and fishing activity restrictions on the production, biomass, andspecies richness of benthic invertebrate communities. ICES Journal of MarineScience 2006;63:822–30.
[38] Rogers AD, Clark MR, Hall-Spencer JM, Gjerde KM. A scientific guide to theFAO draft international guidelines (December 2007) for the management ofdeep-sea fisheries in the high seas. Switzerland: IUCN; 2008.
[39] Hall-Spencer JM, Tasker M, Soffker M, Christiansen S, Rogers S, Campbell M,et al. The design of marine protected areas on high seas and territorial watersof Rockall. Marine Ecology Progress Series 2009;397:305–8.
[40] Fock HO. Fisheries in the context of marine spatial planning: defining principalareas for fisheries in the German EEZ. Marine Policy 2008;32:728–39.
[41] Gerritsen H, Lordan C. Integrating vessel monitoring systems (VMS) data withdaily catch data from logbooks to explore the spatial distribution of catch andactivity at high resolution. ICES Journal of Marine Science 2011;68:245–52.
[42] Stelzenmüller V, Rogers SI, Mills CM. Spatio-temporal patterns of fishingpressure on UK marine landscapes, and their implications for spatial planningand management. ICES Journal of Marine Science 2008;65:1081–91.
[43] Lee J, South A, Jennings S. Developing reliable, repeatable, and accessiblemethods to provide high-resolution estimates of fishing-activity distributionsfrom vessel monitoring system (VMS) data. ICES Journal of Marine Science2010;67:1260–71.
[44] Jennings S, Lee J. Defining fishing grounds with vessel monitoring system data.ICES Journal of Marine Science 2012;69(1):51–63.
[45] Lambert G, Jennings S, Hiddink JG, Hinzten NT, Hinz H, Kaiser MJ, et al.Implications of using alternative methods of vessel monitoring system dataanalysis to describe fishing activities and impacts. ICES Journal of MarineScience 2012;69:682–93.
[46] Bastardie F, Nielsen JR, Ulrich C, Egekvist J, Degel H. Detailed mapping offishing activity and landings by coupling fishing logbooks with satellite-recorded vessel geo-location. Fisheries Research 2010;106:41–53.
[47] Halpern BS, Walbridge S, Selkoe KA, Kappel CV, Micheli F, D’Agrosa C, et al.Global map of human impact on marine ecosystems. Science 2008;319:948–52.
[48] Rees E.I.S. Preliminary observations on benthic biotopes at Haig Fras: anisolated submmerged rock in the Celtic Sea. In: Proceedings of the 2ndworkshop on habitat classification. Southampton: OSPAR/ICES/EEA; 18–22Sepetmber 2000.
[49] JNCC 2008. Offshore special area of conservation: Haig Fras. SAC Selection siteVersion 4.0. 14 pp. Available from: ⟨http://jncc.defra.gov.uk/PDF/haigFras_selectionAsseessment_4.0.pdf⟩ [accessed September 2010].
M.S. Campbell et al. / Marine Policy 45 (2014) 293–300 299

[50] European Commission. Commission Regulation (EC) no. 665/2008 of 14 July2008 laying down detailed rules for the application of Council Regulation (EC)no. 199/2008 concerning the establishment of a Community framework forthe collection, management and use of data in the fisheries sector and supportfor scientific advice regarding the common fisheries policy. Official Journal ofthe European Union 2008;L186:3–5.
[51] European Commission. Commission Decision of 6 November 2008 adopting amultiannual Community programme pursuant to Council Regulation (EC) no.199/2008 establishing a Community framework for the collection, manage-ment and use of data in the fisheries sector and support for scientific adviceregarding the Common Fisheries Policy (2008/949/EC). Official Journal of theEuropean Union 2008;L346:37–88.
[52] European Commission. Commission Regulation (EC) no. 2371/2002 of 20December 2002 on the conservation sustainable exploitation of fisheriesresources under the Common Fisheries Policy. Official Journal of the EuropeanUnion 2002;L358:59–80.
[53] Connor DW, Gilliland PM, Golding N, Robinson P, Todd D, Verling E. UKSeaMap: the mapping of seabed and water column features of UK seas.Peterborough: Joint Nature Conservation Committee; 2006.
[54] Barratt C, Irwin C. United Kingdom sea fisheries statistics. London: Depart-ment of Environment, Food and Rural Affairs (DEFRA); 2007.
[55] Gell FR, Roberts CM. Benefits beyond boundaries: the fishery effects of marinereserves. Trends in Ecology and Evolution 2003;18:448–55.
[56] Beukers-Stewart BD, Vause BJ, Mosley MWJ, Rossetti HL, Brand AR. Benefits ofclosed area protection for a population of scallops. Marine Ecology ProgressSeries 2005;298:189–204.
[57] Blyth RE, Kaiser MJ, Edwards-Jones G, Hart PJB. Voluntary management in aninshore fishery has conservation benefits. Environmental Conservation 2002;29:493–508.
[58] Berkenhagen J, Döring R, Fock HO, Kloppmann MHF, Pedersen SA, Schulze T.Decision bias in marine spatial planning of offshore wind farms: Problems ofsingular versus cumulative assessments of economic impacts on fisheries.Marine Policy 2010;34:733–6.
[59] Jennings S, Lee J, Hiddink JG. Assessing fishery footprints and the trade-offsbetween landings value, habitat sensitivity and fihsing impacts to informmarine spatial planning and an ecosystem approach. ICES Journal of MarineScience 2012;69(6):1053–63.
[60] Gerritsen HD, Minto C, Lordan C. How much of the seabed is impacted bymobile gear? Absolute estimates from vessel monitoring system (VMS) pointdata ICES Journal of Marine Science 2013;70(3):523–31.
[61] Bicknell AWJ, Oro D, Camphuysen CJ, Votier SC. Potential consequences ofdiscard reform for seabird communities. Journal of Applied Ecology 2013;50(3):649–58.
[62] Votier SC, Furness RW, Bearhop S, Crane JE, Caldow RWG, Catry P, et al.Changes in fisheries discard rates and seabird communities. Nature2004;427:727–30.
[63] Lewison RL, Crowder LB, Read AJ, Freeman SA. Understanding impacts offisheries bycatch on marine megafauna. Trends in Ecology and Evolution2004;19:598–604.
[64] Furness RW, Edwards AE, Oro D. Influence of management practices and ofscavenging seabirds on availability of fisheries discards to benthic scavengers.Marine Ecology Progress Series 2007;350:235–44.
[65] Mitchell PI, Newton SF, Ratcliffe N, Dun TE. Seabird populations of Britain andIreland. London: T&A D Poyser; 2004.
[66] Votier SC, Bearhop S, Witt MJ, Inger R, Thompson D, Newton J. Individualresponses of seabirds to commercial fisheries revealed using GPS tracking,stable isotopes and vessel monitoring systems. Journal of Applied Ecology2010;47:487–97.
[67] Votier SC, Bicknell AWJ, Cox SL, Scales KL, Patrick S. A bird's eye view ofdiscard reforms: bird borne cameras reveal seabird/fishery interactions. PLoSOne 2013;8:e53576.
[68] Shephard S, Gerritsen H, Kaiser MJ, Reid DG. Spatial heterogeneity in fishingcreates de facto refugia for endangered Celtic Sea elasmobranchs. PLoS One2012;7(11):e49307.
[69] Syvitski JPM, Kettner A. Sediment flux and the anthropocene. PhilosophicalTransactions of the Royal Society of London A: Mathematical, Physical andEngineering Sciences 2011;369(1938):957–75.
[70] Kaiser MJ, Clarke KR, Hinz H, Austen MCV, Somerfield PJ, Karakassis I. Globalanalysis and the prediction of the response of benthic biota to fishing. MarineEcology Progress Series 2006;311:1–14.
[71] Pedersen SA, Fock H, Krause JK, Push C, Sell AF, Böttcher U, et al. Natura 2000sites and fisheries in German offshore waters. ICES Journal of Marine Science2009;66:155–69.
[72] Hall-Spencer JM, Moore PG. Scallop dredging has profound, long-term impactson maerl habitats. ICES Journal of Marine Science 2000;57:1407–15.
[73] Tyler-Walters H, Rogers SI, Marshall CE, Hiscock K. A method to assess thesensitivity of sedimentary communities to fishing communities. AquaticConservation Marine and Freshwater Systems 2009;19:285–300.
[74] Stelzenmüller V, Lee J, Garnacho E, Rogers SI. Assessment of a Bayesian beliefnetwork-GIS framework as a practical tool to support marine planning. MarinePollution Bulletin 2010;60:1743–54.
[75] Stelzenmüller V, Lee J, South A, Rogers SI. Quantifying cumulative impacts ofhuman pressures on the marine environment: a geospatial modelling frame-work. Marine Ecology Progress Series 2010;398:19–32.
[76] Hinz H, Prieto V, Kaiser MJ. Trawl disturbance on benthic communities: chroniceffects and experimental predictions. Ecological Applications 2009;19(3):761–73.
[77] Hiddink JG, Johnson AF, Kingham R, Hinz H. Could our fisheries be moreproductive? Indirect negative effects of bottom trawl fisheries on fish condi-tion Journal of Applied Ecology 2011;48(6):1441–9.
[78] Baban SMJ, Parry T. Developing and applying a GIS-assisted approach tolocating wind farms in the UK. Renewable Energy 2001;24:59–71.
[79] Villa F, Tunesi L, Agardy T. Zoning marine protected areas through spatialmultiple-criteria analysis: the case of the Asinara Island National MarineReserve of Italy. Conservation Biology 2002;16:515–26.
[80] Bruce EM, Eliot IG. A spatial model for marine park zoning. Coastal Manage-ment 2006;34:17–38.
[81] Prest R, Daniell T, Ostendorf B. Using GIS to evaluate the impact of exclusionzones on the connection cost of wave energy to the electricity grid. EnergyPolicy 2007;35:4516–28.
[82] Dinmore TA, Duplisea DE, Rackham BD, Maxwell DL, Jennings S. Impact of alarge-scale area closure on patterns of fishing disturbance and the conse-quences for benthic communities. ICES Journal of Marine Science2003;60:371–80.
[83] Richardson EA, Kaiser MJ, Edwards-Jones G, Possingham H. Sensitivity ofmarine-reserve design to the spatial resolution of socioeconomic data.Conservation Biology 2006;20:1191–202.
[84] Witt MJ, Sheehan EV, Bearhop S, Broderick AC, Conley DC, Cotterell SP, et al.Assessing wave energy effects on biodiversity: the Wave Hub experience.Philosophical Transactions of the Royal Society of London A: Mathematical,Physical and Engineering Sciences 2012;370(1959):502–29.
[85] Mills CM, Townsend SE, Jennings S, Eastwood PD, Houghton CA. Estimatinghigh resoltution fishing effort from satellite based vessel monitoring systemdata. ICES Journal of Marine Science 2007;64:248–55.
[86] Hintzen NT, Piet GJ, Brunel T. Improved estimation of trawling tracks usingcubic Hermite spline interpolation of position registration data. FisheriesResearch 2010;101:108–15.
[87] Russo T, Parisi A, Cataudella S. new insights in interpolating fishing tracksfrom VMS data for different métiers. Fisheries Research 2011;108:184–94.
[88] Abernethy KE, Trebilcock P, Kebede B, Allison EH, Dulvy NK. Fuelling thedecline in UK fishing communities. ICES Journal of Marine Science2010;67:1076–85.
[89] Murray LG, Hinz H, Kaiser MJ. Functional response of fishers in the Isle of Manscallop fishery. Marine Ecology Progress Series 2011;430:157–69.
[90] Rees S, Fletcher S, Glegg G, Marshall C, Rodwell L, Jefferson R, et al. Priorityquestions to shape the marine and coastal policy research agenda in theUnited Kingdom. Marine Policy 2013;38:531–7.
[91] van Putten IE, Kulmala S, Thébaud O, Dowling N, Hamon KG, Hutton T, et al.Theories and behavioural drivers underlying fleet dynamics models. Fish andFisheries 2011;13(2):216–35.
[92] ICES. Report of the study group on VMS data, its storage, access and tools foranalysis (SGVMS), 8–9th September 2010. Hamburg, Germany. ICES CM 2010/SSGSUE: 12; 2010. 46p.
[93] Hinz H, Murray LG, Lambert GI, Hiddink JG, Kaiser MJ. Confidentiality overfishing effort data threatens science and management progress. Fish andFisheries 2013;14(1):110–7.
M.S. Campbell et al. / Marine Policy 45 (2014) 293–300300