Management of High-Throughput DNA Sequencing Projects: Alpheus
23
Management of High-Throughput DNA Sequencing Projects: Alpheus Neil A. Miller 1 , Stephen F. Kingsmore 1 , Andrew Farmer 1 , Raymond J. Langley 1 , Joann Mudge 1 , John A. Crow 1 , Alvaro J. Gonzalez 1,3 , Faye D. Schilkey 1 , Ryan J. Kim 1 , Jennifer van Velkinburgh 1 , Gregory D. May 1 , C. Forrest Black 1 , M. Kathy Myers 1 , John P. Utsey 1 , Nicholas S. Frost 1 , David J. Sugarbaker 2 , Raphael Bueno 2 , Stephen R. Gullans 2 , Susan M. Baxter 1,4 , Steve W. Day 1 , and Ernest F. Retzel 1,* 1 National Center for Genome Resources, 2935 Rodeo Park Drive East, Santa Fe, NM 87505, USA 2 International Mesothelioma Program, Division of Thoracic Surgery, Department of Pathology, Brigham and Women’s Hospital and Harvard Medical School, 75 Francis Street, Boston, MA 02115, USA Abstract High-throughput DNA sequencing has enabled systems biology to begin to address areas in health, agricultural and basic biological research. Concomitant with the opportunities is an absolute necessity to manage significant volumes of high-dimensional and inter-related data and analysis. Alpheus is an analysis pipeline, database and visualization software for use with massively parallel DNA sequencing technologies that feature multi-gigabase throughput characterized by relatively short reads, such as Illumina-Solexa (sequencing-by-synthesis), Roche-454 (pyrosequencing) and Applied Biosystem’s SOLiD (sequencing-by-ligation). Alpheus enables alignment to reference sequence(s), detection of variants and enumeration of sequence abundance, including expression levels in transcriptome sequence. Alpheus is able to detect several types of variants, including non- synonymous and synonymous single nucleotide polymorphisms (SNPs), insertions/deletions (indels), premature stop codons, and splice isoforms. Variant detection is aided by the ability to filter variant calls based on consistency, expected allele frequency, sequence quality, coverage, and variant type in order to minimize false positives while maximizing the identification of true positives. Alpheus also enables comparisons of genes with variants between cases and controls or bulk segregant pools. Sequence-based differential expression comparisons can be developed, with data export to SAS JMP Genomics for statistical analysis. Keywords Alpheus; sequencing-by-synthesis; pyrosequencing; GMAP; GSNAP; resequencing; transcriptome sequencing *Corresponding author: Ernest F. Retzel, Ph.D., Program Leader, National Center for Genome Resources, 2935 Rodeo Park Drive East, Santa Fe, NM 87505, [email protected]. 3 Current address: Computer and Information Sciences Department, 101 Smith Hall, University of Delaware, Newark, DE 19716, 4 Current address: San Diego State University, 5500 Campanile Dr., San Diego, CA This is an open-access article distributed under the terms of the Creative Commons Attribution License, which permits unrestricted use, distribution, and reproduction in any medium, provided the original author and source are credited. NIH Public Access Author Manuscript J Comput Sci Syst Biol. Author manuscript; available in PMC 2010 February 10. Published in final edited form as: J Comput Sci Syst Biol. 2008 December 26; 1: 132. NIH-PA Author Manuscript NIH-PA Author Manuscript NIH-PA Author Manuscript
-
Upload
independent -
Category
Documents
-
view
0 -
download
0
Transcript of Management of High-Throughput DNA Sequencing Projects: Alpheus

Management of High-Throughput DNA Sequencing Projects:Alpheus
Neil A. Miller1, Stephen F. Kingsmore1, Andrew Farmer1, Raymond J. Langley1, JoannMudge1, John A. Crow1, Alvaro J. Gonzalez1,3, Faye D. Schilkey1, Ryan J. Kim1, Jennifervan Velkinburgh1, Gregory D. May1, C. Forrest Black1, M. Kathy Myers1, John P. Utsey1,Nicholas S. Frost1, David J. Sugarbaker2, Raphael Bueno2, Stephen R. Gullans2, Susan M.Baxter1,4, Steve W. Day1, and Ernest F. Retzel1,*1 National Center for Genome Resources, 2935 Rodeo Park Drive East, Santa Fe, NM 87505, USA2 International Mesothelioma Program, Division of Thoracic Surgery, Department of Pathology,Brigham and Women’s Hospital and Harvard Medical School, 75 Francis Street, Boston, MA 02115,USA
AbstractHigh-throughput DNA sequencing has enabled systems biology to begin to address areas in health,agricultural and basic biological research. Concomitant with the opportunities is an absolute necessityto manage significant volumes of high-dimensional and inter-related data and analysis. Alpheus isan analysis pipeline, database and visualization software for use with massively parallel DNAsequencing technologies that feature multi-gigabase throughput characterized by relatively shortreads, such as Illumina-Solexa (sequencing-by-synthesis), Roche-454 (pyrosequencing) and AppliedBiosystem’s SOLiD (sequencing-by-ligation). Alpheus enables alignment to reference sequence(s),detection of variants and enumeration of sequence abundance, including expression levels intranscriptome sequence. Alpheus is able to detect several types of variants, including non-synonymous and synonymous single nucleotide polymorphisms (SNPs), insertions/deletions(indels), premature stop codons, and splice isoforms. Variant detection is aided by the ability to filtervariant calls based on consistency, expected allele frequency, sequence quality, coverage, and varianttype in order to minimize false positives while maximizing the identification of true positives.Alpheus also enables comparisons of genes with variants between cases and controls or bulksegregant pools. Sequence-based differential expression comparisons can be developed, with dataexport to SAS JMP Genomics for statistical analysis.
KeywordsAlpheus; sequencing-by-synthesis; pyrosequencing; GMAP; GSNAP; resequencing; transcriptomesequencing
*Corresponding author: Ernest F. Retzel, Ph.D., Program Leader, National Center for Genome Resources, 2935 Rodeo Park Drive East,Santa Fe, NM 87505, [email protected] address: Computer and Information Sciences Department, 101 Smith Hall, University of Delaware, Newark, DE 19716,4Current address: San Diego State University, 5500 Campanile Dr., San Diego, CAThis is an open-access article distributed under the terms of the Creative Commons Attribution License, which permits unrestricted use,distribution, and reproduction in any medium, provided the original author and source are credited.
NIH Public AccessAuthor ManuscriptJ Comput Sci Syst Biol. Author manuscript; available in PMC 2010 February 10.
Published in final edited form as:J Comput Sci Syst Biol. 2008 December 26; 1: 132.
NIH
-PA Author Manuscript
NIH
-PA Author Manuscript
NIH
-PA Author Manuscript

IntroductionHigh-throughput DNA sequencing using the Illumina GA series, the Roche 454 and the ABISOLiD platforms have enabled a plethora of methods previously either prohibitively expensiveor technologically impractical to be developed. Among these are whole genome shotgunsequencing [WGSS] and whole transcriptome shotgun sequencing [WTSS]. The output fromthese technologies currently ranges from 1–20 gigabases of raw sequence information perexperiment, with a relatively high error rate compared to Sanger sequencing. The sheer quantityof output, the relative shortness of reads and the frequency of errors have created problematicareas for data management in terms of organization, analysis and information extraction. Whileseveral genome browsers currently exist (e.g., Ensembl (Flicek, et al., 2008), the UCSCGenome Browser (Mangan, et al., 2008), and the Broad Institute Integrative Genomics Viewer[http://www.broad.mit.edu/igv/], these tools presently include a significant structural overheadthat make their application to so-called generation-2 sequencing efforts generally intractable.We have developed a streamlined application focusing on the acquisition, storage, analysis,organization, exploration and export of high-throughput sequencing data.
In this paper, we will describe the infrastructure and application necessary to perform thesetasks, and focus on three of many applications in resequencing: genome variant detection,transcript expression analysis and protocol evaluation and analysis.
Genome Variant DetectionIn DNA analysis, non-synonymous genetic variations (nsVariants; nsV) that cause an aminoacid change are critical to understanding various diseases and traits (i.e., phenotypes) in allorganisms. Single nucleotide polymorphisms (SNPs) represent the most frequent type of DNAvariation, often having a neutral effect on phenotype (a synonymous SNP); nsVariants resultin an amino acid change in the protein products of genes, and thus are believed to have themost significant impact on phenotype (Ramensky, et al., 2002). Aberrations resulting in pointmutations, genome rearrangements, and insertions/deletions (indels) have been linked totumorigenesis (Morozova and Marra, 2008).
SNPs have traditionally been found using Sanger sequencing methods at considerable cost.Microarray-based studies have also been used to detect known SNPs (Ropers, 2007), and theInternational HapMap Project was developed to determine patterns of human heritability toimprove the success of genetic heritability studies (Manolio, et al., 2008). However, whilearray-based analysis has improved and has led to the discovery of almost 100 loci for nearly40 common diseases and traits (Manolio, et al., 2008), the large number of unknown SNPs aswell as poor hybridization of probes has caused some frustration on the part of researchers(Ropers, 2007). Sequencers such as Illumina Genome Analyzer (sequencing-by-synthesis;Illumina, Inc., San Di-ego, CA]), Roche-454 GS20 (pyrosequencing; Roche Applied Science,Inc., Indianapolis, IN) and Applied Biosystems SOLiD (sequencing-by-ligation; AppliedBiosystems, Foster City, CA) have recently been used to perform massive sequencing of humanand plant genomes and transcriptomes at low cost as compared to Sanger sequencing methods.Direct sequencing is likely to replace indirect approaches (SNP-HapMap), making it possibleto screen entire genomes to examine introns, UTRs, and promoter regions as well as exons forlikely pathogenic variation (Mardis, 2008). The generation-2 sequencing technologies enablecomprehensive resequencing of common, complex disorders and feature relatively deepcoverage. However, the nature of the technology also leads to relatively high sequence errorrates that can cause false discovery of SNPs that can be expensive and time-consuming tovalidate.
Miller et al. Page 2
J Comput Sci Syst Biol. Author manuscript; available in PMC 2010 February 10.
NIH
-PA Author Manuscript
NIH
-PA Author Manuscript
NIH
-PA Author Manuscript

Expression AnalysisEvolving from the WTSS methodologies, a variety of transcriptome sequencing methodologiesare developing collectively referred to as RNA-seq (Lister, et al., 2008; Marioni, et al., 2008;Mortazavi, et al., 2008; Nagalakshmi, et al., 2008; Pan, et al., 2008; Wang, et al., 2009;Wilhelm, et al., 2008). Transcriptome sequencing has evolved from the low-coverage EST andcDNA projects which provided early gene discovery projects, and resulted in such databasesas the NCBI dbEST and the Unigene databases (Wheeler, et al., 2008). With a variety of human,animal and plant genomes now completely sequenced, and vast assemblies of cDNAs andESTs, WTSS projects have evolved into gene discovery, novel exon determination (Shin, etal., 2008; Wang, et al., 2008), whole transcriptome differential expression analysis (Mudge, etal., 2008), and quantitative tag-based methodologies, the latter with sensitivities in the 1–10molecule per cell range (t Hoen, et al., 2008). Moreover, miRNA and other small transcribednon-coding RNAs can be captured using modified RNA isolation protocols (Chellappan andJin, 2009; Hafner, et al., 2008; Lu, et al., 2007), and sequenced in parallel with transcriptomes.This has resulted in the discovery of a significant number of new miRNAs in animals (Burnside,et al., 2008) and plants (Lu, et al., 2008; Lu, et al., 2006; Lu, et al., 2007), and the technologyhas developed to the point that parallel sequencing of mRNAs and miRNAs on the samelibraries have been used to develop the concept of an RNA degradome (Addo-Quaye, et al.,2008; Addo-Quaye, et al., 2008; German, et al., 2008).
Our focus has been the development of a hardware and software infrastructure sufficientlyrobust as to support both variant detection and RNA expression analysis. This hardware andsoftware infrastructure serves multiple purposes. First, it provides a data management systemfor the data acquired in multiple internal and contract sequencing projects, as well as a gatewayto statistical analysis tools. Second, it provides us with a querying mechanism for informationderived from these projects necessary for publication of large-scale sequencing results (Mudge,et al., 2008; Sugarbaker, et al., 2008). Third, because publications frequently focus on thenarrow subset of the information pertinent to that paper, while WTSS generally provides muchmore information than might necessarily be published, it provides a mechanism for bothvalidation of results presented by external reviewers and users, and a resource that can bequeried by the community for additional information that may not have been captured in orthe focus of the publication. Finally, the primary national archive for data of this type is theNCBI Short Read Archive [SRA; (Wheeler, et al., 2008) andhttp://www.ncbi.nlm.nih.gov/Traces/sra], designed in large part to serve the needs of the 1000Genomes Project (Siva, 2008) and http://www.1000genomes.org. While the logic of this designis indisputable, it remains that data deposited in the SRA will require a significantcomputational effort to realign to reference sequence data.
MethodsSequencing
While Alpheus is capable of handling Sanger, Roche 454, Illumina GA2 and SOLiD data, muchof our focus has been on Illumina GA2 output. The output sequence data from the GA2 isintermediate in size (36–106 bp) compared to the ABI instrument (26 bp) and Roche 454 (200–450bp).
Base-callingBase-calling is generally performed using instrument-specific software.
Miller et al. Page 3
J Comput Sci Syst Biol. Author manuscript; available in PMC 2010 February 10.
NIH
-PA Author Manuscript
NIH
-PA Author Manuscript
NIH
-PA Author Manuscript

Hardware: Clustering and AlignmentsAlignments are performed on a cluster of 50 SunBlade X6220s with 2 dual core processorswith 16 GB of RAM and 146 GB local disk per blade. Cluster management is provided byPlatform Rocks (Platform Computing, Markham, Ontario, Canada); resource management isprovided by Platform LSF/HPC. At present, we are experimenting with the deployment of thealignment resources at the New Mexico Computing Applications Center (NMCAC) on an SGI/Intel Altix cluster (14,336 cores).
The distributed WX2 database cluster (see below) consists of 4 Sun X4240 servers each withtwo quad core processors, 64 GB RAM, 16 × 146 GB disks, and additional Sun x4140 serverwith 2 quad core processors, 64 GB RAM and 8 × 146 GB disks. The X4240 servers host therelational database, and the X4140 acts as the application server.
Database Management SystemsAlpheus was designed with an underlying relational database management system. The currentinstallation is on Sybase 12.5.4. We are, however, presently experimenting with animplementation on the Kognitio’s (Berkshire, UK & Chicago, IL, USA) WX2 analyticaldatabase.
AlignmentsWe have tested a variety of alignment tools for resequencing. These include GMAP (Wu andWatanabe, 2005), Blast (Altschul, et al., 1997), MegaBlast (Zhang, et al., 2000) and Eland[Illumina, Inc.]. Though the pipeline is insensitive to the source of the alignments, ourworkhorse alignment software remains GMAP, originally developed to by Tom Wu atGenentech, Inc., to align EST and cDNA data to reference genomes and transcriptomes, butwhich can be parameterized to handle short-read data. GMAP implements a collection ofsophisticated algorithms producing gene models associated with cDNA sequences throughcomparison with a genomic reference. Following an initial mapping step, the cDNA sequenceis aligned to its mapping target, establishing an approximate gene structure. This structure isrefined through the use of a novel splice site inference algorithm, ultimately producing its genemodel. It is notable that GMAP gene models accommodate the presence of microexons.
Genomic mapping in GMAP makes use of exact searches based upon 24 bp oligomers.Beginning from the ends of the query cDNA sequence, oligomers are mapped onto the genomicreference. The resulting maps are examined for reasonable levels of proximity. Expecting thatthe cDNA is “expanded” in the genome sequence, this process is continued from the endsinward along the cDNA in order to accumulate additional supporting evidence of proximalgenomic coordinates. The mapping is complete if this process produces a small number ofsignificant candidate regions on the genome; otherwise a different strategy is employed. In thiscase, oligomers are sampled from the interior of the cDNA instead. Segments of the genomicreference with sufficient density and colinearity of these 24-mers define the genomic map.
GMAP’s algorithm for approximate alignment of the cDNA to these mapped regions allowsfor local mismatches, cDNA insertions, and genomic insertions. Each position of the cDNA isassociated with an 8-mer (e.g., an eight-nucleotide oligomer beginning at that position), andthat 8-mer associated with several coordinates on the genomic reference. From this perspective,various alignments can be created by running along the cDNA, selecting monotonicallyincreasing (or decreasing) genomic coordinates. GMAP produces its “approximate alignment”using dynamic programming, identifying the highest scoring path through this set of feasiblealignments.
Miller et al. Page 4
J Comput Sci Syst Biol. Author manuscript; available in PMC 2010 February 10.
NIH
-PA Author Manuscript
NIH
-PA Author Manuscript
NIH
-PA Author Manuscript

Refinement of this approximate alignment between the cDNA and the genomic segment, tolocalize introns, for example, is performed by a technique Wu & Watanabe refer to as“sandwich dynamic programming.” This method involves the computation of two globalalignment matrices (Needleman-Wunsch) in the vicinity of significant gaps in the approximatealignment, and the selection of an optimal transition from one to the other. Scoring includesrewards for transitions occurring across standard splicing donor-acceptor pairs.
Our experience with GMAP has shown it to be robust and reliable, and well-suited for a rolein high-volume processing pipelines such as Alpheus.
Wu has also made his recently-developed GSNAP software available to us (T. Wu, personalcommunication). GSNAP was specifically designed to handle short-read data (26–100 bp),including paired-end sequence data. Paired-end data includes both 5′- and 3′- ends of theclonally amplified fragments, and is particularly useful in resequencing of genomic samples(which include duplicate genes, introns, and intergenic regions). Paired ends are also useful inde novo sequencing applications (i.e., those sequences for which no reference genome exists).
GSNAP is a program for aligning short reads to a reference sequence, typically a genome, butpossibly a set of transcripts. The program is designed to be both fast and flexible. GSNAP isdesigned to be fast through its use of multiple specialized algorithms, each one handling adifferent mapping type. The program is flexible in that it can handle arbitrarily long readlengths, which is becoming important as sequencing technologies are currently generatingreads of 100 bp and longer. The program can also find and report alignments containingmultiple mismatches, a single insertion or a single deletion, or a combination of these. Theprogram is also able to map transcriptional reads that span an exon-exon boundary in a referencegenome, including distant translocation events.
GSNAP also has flexibility in the types of input data it can process, including single-end,paired-end and circular-end reads. Paired-end reads are obtained when the sample DNA orRNA is fragmented into uniform lengths, typically 200—500~bp, and sequences obtained fromboth ends. Circular-end reads are obtained when long fragments of 10,000 bases or more arecircularized with a 200–500 bp linker and then cut at the appropriate places to provide readsat the ends of the original long fragment.
The ability of GSNAP to handle paired-end reads, circular-end reads, and arbitrarily distanttranslocation events depends on having random access to the entire genome. Most other short-read mapping programs do not have this capability, because they are designed to have onlysequential access. The prevailing architecture is to index a given dataset of short reads, andthen to use that data-based index to scan the reference sequence. In contrast, GSNAP is one ofonly a few programs that depend on pre-indexing the reference genome or transcriptome.
The reference indices used by GSNAP are in the same format as those used by GMAP, and areference index per genome or transcriptome serves both programs. A reference index is builtby scanning the reference sequence for 12-mers, at a sampling interval of 3 bp. The positionsfor each sampled 12-mer are sorted and stored in a positions file. An offsets file containspointers to the positions for each sampled 12-mer. Therefore, a reference index allows aprogram to find a uniform sampling of genomic or transcriptional positions for any given 12-mer. In addition to the offsets and positions files, the pre-indexing process also stores acompressed version of the reference sequence that essentially stores each 32 nucleotides inthree 4-byte words. This compression allows storage of non-ACGT characters in the referencegenome.
The GSNAP program then processes short reads to find alignments of the following types:
Miller et al. Page 5
J Comput Sci Syst Biol. Author manuscript; available in PMC 2010 February 10.
NIH
-PA Author Manuscript
NIH
-PA Author Manuscript
NIH
-PA Author Manuscript
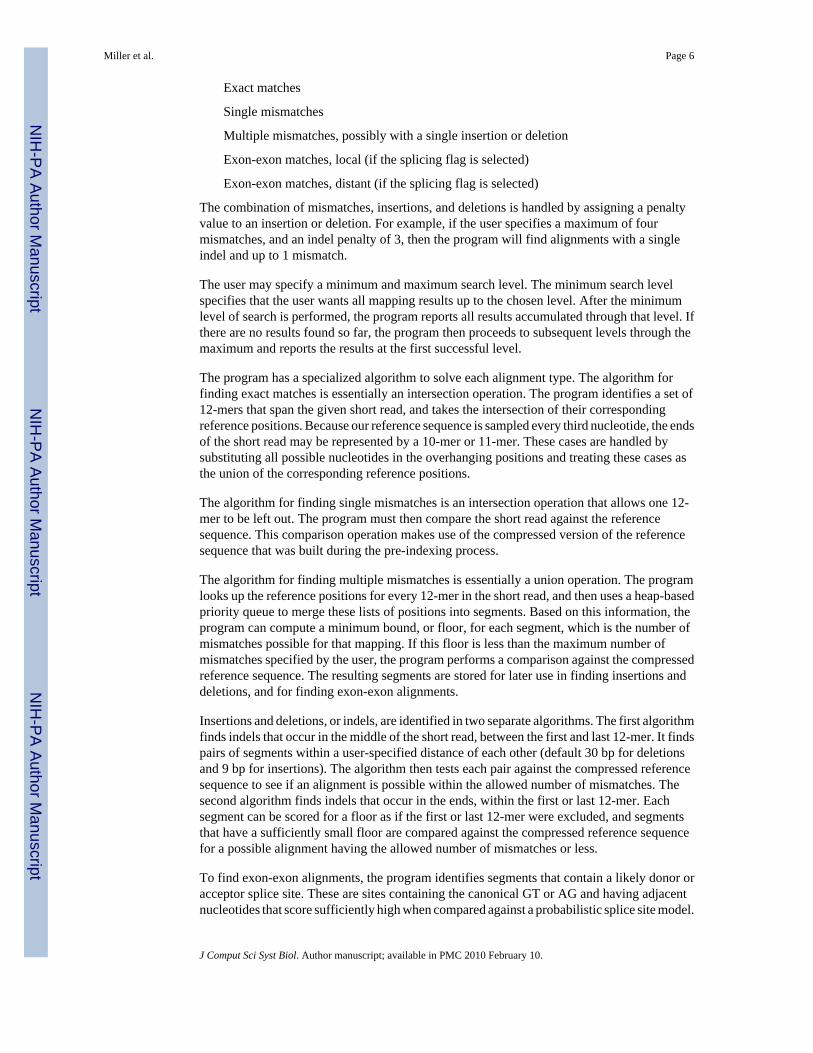
Exact matches
Single mismatches
Multiple mismatches, possibly with a single insertion or deletion
Exon-exon matches, local (if the splicing flag is selected)
Exon-exon matches, distant (if the splicing flag is selected)
The combination of mismatches, insertions, and deletions is handled by assigning a penaltyvalue to an insertion or deletion. For example, if the user specifies a maximum of fourmismatches, and an indel penalty of 3, then the program will find alignments with a singleindel and up to 1 mismatch.
The user may specify a minimum and maximum search level. The minimum search levelspecifies that the user wants all mapping results up to the chosen level. After the minimumlevel of search is performed, the program reports all results accumulated through that level. Ifthere are no results found so far, the program then proceeds to subsequent levels through themaximum and reports the results at the first successful level.
The program has a specialized algorithm to solve each alignment type. The algorithm forfinding exact matches is essentially an intersection operation. The program identifies a set of12-mers that span the given short read, and takes the intersection of their correspondingreference positions. Because our reference sequence is sampled every third nucleotide, the endsof the short read may be represented by a 10-mer or 11-mer. These cases are handled bysubstituting all possible nucleotides in the overhanging positions and treating these cases asthe union of the corresponding reference positions.
The algorithm for finding single mismatches is an intersection operation that allows one 12-mer to be left out. The program must then compare the short read against the referencesequence. This comparison operation makes use of the compressed version of the referencesequence that was built during the pre-indexing process.
The algorithm for finding multiple mismatches is essentially a union operation. The programlooks up the reference positions for every 12-mer in the short read, and then uses a heap-basedpriority queue to merge these lists of positions into segments. Based on this information, theprogram can compute a minimum bound, or floor, for each segment, which is the number ofmismatches possible for that mapping. If this floor is less than the maximum number ofmismatches specified by the user, the program performs a comparison against the compressedreference sequence. The resulting segments are stored for later use in finding insertions anddeletions, and for finding exon-exon alignments.
Insertions and deletions, or indels, are identified in two separate algorithms. The first algorithmfinds indels that occur in the middle of the short read, between the first and last 12-mer. It findspairs of segments within a user-specified distance of each other (default 30 bp for deletionsand 9 bp for insertions). The algorithm then tests each pair against the compressed referencesequence to see if an alignment is possible within the allowed number of mismatches. Thesecond algorithm finds indels that occur in the ends, within the first or last 12-mer. Eachsegment can be scored for a floor as if the first or last 12-mer were excluded, and segmentsthat have a sufficiently small floor are compared against the compressed reference sequencefor a possible alignment having the allowed number of mismatches or less.
To find exon-exon alignments, the program identifies segments that contain a likely donor oracceptor splice site. These are sites containing the canonical GT or AG and having adjacentnucleotides that score sufficiently high when compared against a probabilistic splice site model.
Miller et al. Page 6
J Comput Sci Syst Biol. Author manuscript; available in PMC 2010 February 10.
NIH
-PA Author Manuscript
NIH
-PA Author Manuscript
NIH
-PA Author Manuscript

For local exon-exon alignments, the program identifies pairs of segments, one with a donorand one with an acceptor, that are within a certain distance on the genome corresponding to amaximal intron length (default 100,000 bp). If a local exon-exon alignment cannot be found,the program attempts to find distant exon-exon alignments by pairing segments with donor andacceptor splice sites, regardless of their genomic distance.
Alpheus PipelineAlpheus is a multi-component system that includes processing and analytical pipelines,information storage and retrieval services, and web-based applications (see Figure 1). Thepipeline begins with quality assessment of new read data, stores the data, maps the reads ontogenome and transcriptome references and creates alignments, computes coverage statistics forthese references, performs variant prediction, and stores the computed results for reuse. Withrespect to mapping and alignment, the system is significantly flexible, typically customized tothe kind of read data being processed. This is necessary since by design Alpheus is intendedto accommodate high volume data produced by different technologies including Illumina GA2,Roche 454, SOLiD, and Sanger. The system itself, developed in Java, makes extensive use ofclear data abstraction, tiered architecture principles, adapters, etc., in order to support thisfundamental flexibility and to facilitate its continuing improvement. The Alpheusimplementation is based upon industrial grade technologies (Java, Sybase), and makes use ofcommunity standards (e.g., XML, GFF3), software (e.g., BioJava), and current best practices.
Available mapping and alignment methods include GMAP and GSNAP, as described earlier,as well as MegaBLAST and Eland. Potential variants are identified using an Enumeration/Characterization module, which makes use of the computed alignments. This module reportssynonymous and nonsynonymous SNPs, indels, premature stop codons, and candidatealternative splicing. The variant module can accommodate different read and library types.Read coverage is reported by gene, transcript, and chromosome. Other modules addresssequencing-based gene expression and small/micro RNA studies.
Alpheus provides researchers who lack programming or bioinformatic sophistication theability to explore and analyze tens of gigabases of sequence results and hundreds of samplesthrough the Alpheus web tools. In addition to a project summary, users can view read data,coverage statistics, variant data, and perform sophisticated differential analysis. Data isaccessible to clients by download, and as discussed later, by export for use in other analyticaltools such as SAS JMP Genomics.
Alpheus Inputs: Read and Reference DataThere are a number of formats in current use for sequence data, both reads and reference. Sangerreads typically are presented in FASTA format. Roche 454 quality scores are supplied in asimilar fashion: FASTA format with tagged to match their associated reads. Illumina reads areprovided in FASTQ format, similar to FASTA but with read and quality data residing in thesame file. Reference data includes not only genomic or transcript reference sequences, but alsoannotations (e.g., gene, CDS) on the references. These are most often available as GFF3 orGenbank feature table formats. Parsers for all of these are used in Alpheus.
Alignment to reference library and variant enumeration/characterization. GMAP and GSNAPprovide essential mapping and alignment for short read data, and these results are used foridentification of variants. Alignments to the references are made, typically require 95 percentidentity and an identity count of 34 bp for a 36 bp read. Best-match alignments for the readsare stored in the database; all alignments equivalent to the best-match are stored which isimportant in the case of hits to shared exons in alternate splicing. All positions at which a readdiffers from the aligned reference sequence are enumerated. Contiguous indel events are treated
Miller et al. Page 7
J Comput Sci Syst Biol. Author manuscript; available in PMC 2010 February 10.
NIH
-PA Author Manuscript
NIH
-PA Author Manuscript
NIH
-PA Author Manuscript

as single polymorphisms. All occurrences of potential polymorphisms in reads with respect toa given position are unified as a “single polymorphism,” with associated statistics on frequency,alignment quality, base quality, and other attributes that may be used to assess the likelihoodthat the polymorphism is a true variant. Candidate variants are further characterized by type(SNP, indel, alternate splicing or stop codon) and as synonymous variant (sV) or non-synonymous variant (nsV).
Data ModelData is stored in sample-specific tables, which are created dynamically by the Alpheus pipelineas each sample is processed. Sample-specific tables are differentiated from each other throughthe use of a sample-specific suffix that identifies each table as belonging to the sample withthat primary key identifier. Transcriptome reference sequences are stored in theRefSeqTranscript table; genome reference data (e.g. chromosomes) is stored in theRefSeqGenome table. Gene data, including the genomic position of the gene, is stored in theTranscription Unit table. Figure 2 shows a sub-section of the Alpheus database that storestranscriptome alignments and substitution sequence variants. Data stored in sample-specifictables include a record of all sequences and their accompanying quality scores, (SeqRead_1),read alignments to the transcriptomic reference (RSTAlignmentInfo_1,ReadRSTAlignment_1), and all substitution variants detected in each read (SNP_RST_1).Sequence variants are initially recorded for each read, then “unified” into the RSTUnifiedSNPtable where each unique combination of reference position and allele is recorded once. If it canbe determined that a substitution results in an amino acid change, a row is stored for the SNPin the NSSNP table, which records the reference and variant amino acid, as well BLOSUM62(Henikoff and Henikoff, 1993) matrix score for the amino acid shift. Sample-specific statisticssuch as the number of reads showing the variant allele, the total number of reads covering thevariant position and quality metrics for reads showing the allele are stored in theRSTSNP_SampleFrequency table. Transcriptomic indels are stored in tables parallel to thesubstitution tables. All positions are recorded with start and stop coordinates rather than a singleposition. Similarly, genomic alignment, substitution, insertion/deletion and frequency tablesare stored in another parallel set of tables, with the difference that reference coordinates arerecorded on a genomic rather than a transcriptomic reference entity.
Alpheus QueriesThe Alpheus system features a web-interface in which researchers select between two principaltypes of queries by selecting boxes or items from pull-down menus. First, a collection ofsequences from an individual sample or set of samples can be queried for particular events(principally, nucleotide variants or loci expressed at a certain level). Second, collections ofsequences from case-control cohorts can be queried for particular events that differ in frequencyor magnitude between groups. The query interface provides a considerable degree of flexibilityin inclusion or exclusion of particular samples in group comparisons and in cutoffs formagnitude of change, event type, coverage, quality score or event frequency. This allows, forexample, a query to be performed with or without the inclusion of an outlier sample. Queriescan be performed in sequences aligned to more than one reference (for example, againstalignments to RefSeq transcript or a genome reference, which can return quite different datasets[Wang et al., 2008]). Typically, an investigator will perform a query repetitively, modifyingfilters, cutoffs and samples based on results returned. A researcher is able provide a set ofcandidate genes or known features when an instance of Alpheus is developed for a particularproject. Such a reference gene or event set can provide the investigator with guidance regardingoptimal design of a filter set (by, for example, optimizing a query so that it will return a geneset that the investigator knows to be altered in that experiment). Alpheus offers extensive link-outs to accessory data that can greatly assist in annotating results of queries or assessing putativebiological significance on a gene-by-gene basis. These include gene- or variant-specific link-
Miller et al. Page 8
J Comput Sci Syst Biol. Author manuscript; available in PMC 2010 February 10.
NIH
-PA Author Manuscript
NIH
-PA Author Manuscript
NIH
-PA Author Manuscript

outs to Entrez gene, Genbank, OMIM and dbSNP. Alpheus also enables drill down from genelists to individual gene-associated events to sequences and alignments associated with specificvariants. With these tools, an investigator can undertake exploratory, iterative analyses of largeor complex datasets that provide an understanding of data complexity, stratification, limitationsand confounding effects. Having undertaken such exploratory analyses, an investigator canperform a final query with optimized cutoffs and filters, returning a final data set fordownstream analyses.
Statistics and Analysis: SAS JMP GenomicsAfter querying and adjustment of filters to provide appropriate data screening for sequencingerrors, coverage, and differentially expression, data returned by queries can be exported toExcel or SAS JMP Genomics SAS, Inc., Cary, NC) format. Because of the quantitative andreproducible nature of data derived by direct sequencing (Marioni, et al., 2008), we havecollaborated with Russ Wolfinger of SAS to develop a suite of statistical analyses comparableto those used for microarrays (Mudge, et al., 2008). Utilizing experimental and instrumentmetadata associated with the sequencing run in Alpheus and stored in a locally-developedlaboratory information management system (LIMS), general assessment approaches such asdistribution analyses, correlation analysis at the sample and gene level, and principalcomponents analysis (PCA) can be applied to summarized sequence counts and proportionsof variant and reference alleles. JMP Genomics quality assessment tools are particularly usefulfor partitioning variance due to experimental and technical factors, and for guiding the decisionfor which factors should be included in downstream modeling. Additionally, JMP Genomicstools can be applied in identifying potential outlier samples which should be excluded prior topursuing more detailed analyses.
Once outliers have been detected and removed, JMP Genomics provides a variety of modelingmethods, including analysis of variation (ANOVA) and association testing approaches, thatcan be used to detect differences between groups of sequenced samples. Examples includecomparing transcript counts or variant proportions between cases and controls, or examiningchanges in treatment effects for different sample groups over time. More complex analysescan include combining different data types derived from sequence data to relate variantsequences to gene expression changes, for example to identify cis-acting eQTLs (Kingsmoreet al., submitted).
The wealth of pattern discovery tools available to visualize patterns in high-dimensionalgenomics data is also a particular strength of JMP Genomics. In addition to hierarchicalclustering, other methods such as K-Means clustering, principal components analysis, anddistance matrix creation offer visual representations of patterns which connect gene sets. Afteridentifying interesting gene or variant subsets through pattern discovery and modeling toolsin JMP Genomics, predictive modeling tools can also be used to discover well-supportedsubsets of these which best predict classes of samples. Extensive cross-validation options areavailable to ensure the selection of high-quality predictor profiles. The application of thissoftware is demonstrated in our examples below.
Results and ExamplesAs examples of the efficacy of Alpheus in practical large-scale data analysis, we enumeratethree examples of work made possible using the software system. Specifically, 1.) A variantdiscovery project in which mesothelioma tissues were explored for SNP discovery; 2. Aschizophrenia project which utilized the gene expression capabilities; and 3.) A protocolevaluation project, in which the effects of modifying protocols were evaluated.
Miller et al. Page 9
J Comput Sci Syst Biol. Author manuscript; available in PMC 2010 February 10.
NIH
-PA Author Manuscript
NIH
-PA Author Manuscript
NIH
-PA Author Manuscript

Variant Discovery: MesotheliomaOne of Alpheus primary functions is for discovery of single nucleotide polymorphisms (SNPs).Alpheus was successfully used to determine candidate causal single nucleotide variants (SNVs)in malignant pleural mesothelioma (MPM) tissues, an asbestos-related, rapidly fatal cancer(Sugarbaker, et al., 2008). It is known that cancers arise due to multiple mutations; howeverthe causative mutations remain largely unknown. To determine possible mechanisms that leadto the development of MPM transcriptome sequencing was performed to determine SNVs.Whole-transcriptome 454 pyrosequencing was performed on cDNA from tumors of four MPMpatients as well as an adenocarcinoma lung tumor and normal lung tissue from an MPM patient.For the six samples > 260 Mb of the transcriptome sequence were obtained by shotgun 454pyrosequencing with the 454 Life Sciences GS20. More than 98% of the 15 million,approximately 105 bp sequence reads aligned to human mRNA and DNA databases. Transcriptsequences mapped to 19,306 human reference mRNAs present in the RefSeq mRNAs database(Pruitt, et al., 2005). In each sample, approximately 15,000 known RefSeq genes were detectedby one or more reads, with approximately 10,000 genes with at least 20 or more reads per gene,corresponding to 1X coverage. To facilitate analysis and visualization, the data was importedinto Alpheus. Filter parameters include patient sample, gene name, read coverage, variantfrequency, variant type, variant location and links to NCBI sequence and gene functiondatabases.
Due to the high number of false positive SNVs characteristic of early high-throughput shotgunsequencing, the data was filtered to determine true mutations. Inclusion criteria were that thevariant must be present in at least four reads covering the base position, present in at least 30%of the total number of reads covering the variant, have a GS20 quality score = 20, be observedin reads from both orientations and be located within a read that is >90% identical along theentire length of the target RefSeq mRNA sequence. Under these constraints there was 96%sensitivity in identification of 2,465 annotated SNPs found in dbSNP(www.ncbi.nlm.nih.gov/projects/SNP). The authors found 100% agreement of 94 SNVs thatwere independently confirmed using conventional Sanger sequencing. The six tissuessequenced contained 659 to 1,155 known RefSeq genes with at least one coding SNV (cSNV).Within the MPM tissues 153–220 genes contained previously uncharacterized cSNV – whichrepresent candidate causal mutations. The four tumors contained a total of 619 nonredundant,previously uncharacterized cSNVs and 2,369 known SNVs. nsV not present in dbSNP werefurther explored due to the possible functional relevance. Twelve nsV were common to all fivetumors but absent in the normal lung, four were common only to MPM tissues; sequencing ofthe genomic DNA determined that they were germ-line variants and not mutations. 54 of 69nsV tested within the mesothelioma tissue were present in the genomic DNA, indicatingpolymorphisms and not mutations. The remaining 15 nsV were tumor-specific relating tosomatic mutations (n = 7), RNA editing (n = 1), loss of heterozygosity due to chromosomaldeletions (n = 3), and epigenetic silencing (n = 3). The frequency of the seven nsV somaticmutations were evaluated in 49 additional MPM tumors by genotyping cDNA and gDNA inthe specific exons affected by the individual mutations. Three of the mutations were presentin 4–6% of a larger cohort of MPM tissues; COL5A2 mutation in 3 of 53 (c2773t,NM_000393.3); UQCRC1 mutation in 3 of 53 (g851a, NM_003365.2) and MXRA5 mutationin 2 of 53 (c7862a, NM_015419.1).
Differential Gene Expression: SchizophreniaThe schizophrenia data described below is based on 20 transcriptome samples, >475 millionreads, >16 gigabases of high-quality base-called data, and comprises more than 825 gigabytesof data inserted in to the database.
Miller et al. Page 10
J Comput Sci Syst Biol. Author manuscript; available in PMC 2010 February 10.
NIH
-PA Author Manuscript
NIH
-PA Author Manuscript
NIH
-PA Author Manuscript

Schizophrenia genome convergence analysis using Alpheus—One of Alpheusprimary functions is to assist in the analysis of large genome-wide association studies with theuse of JMP Genomics statistical software. Mudge, et al. (Mudge, et al., 2008) used mRNAtranscripts isolated from 20 postmortem cerebellums to find candidate genes possibly involvedin schizophrenia (SCZ). While several studies have identified candidate SCZ risk genes, fewhave been replicated or translated into causal alleles, diagnostics or therapeutics. Deepsequencing was performed on mRNA transcripts of 14 SCZ patients and 6 matched controls.12.5–38.7 million high quality sequences of 32–36 bp were generated per sample. Thesequences were aligned to the human genome and RefSeq transcript databases using the GMAPalgorithm allowing for < 2 mismatches. Interestingly 43.5 ± 6.7% of sequences aligned to atranscript while 69.4 ± 9.6% to the genome. There was little difference in the total number oftranscripts (33,200 ± 1,000) between samples, corresponding to 85 ± 3% of RefSeq transcriptentries. 12.5 million sequences per sample were sufficient to reach a plateau in the number oftranscripts detected, with deeper sequencing resulting in a linear increase in average depth ofcoverage. Alpheus was used to normalize the reads per million. Results were imported intoJMP Genomics and read frequencies were Log10 transformed which improved overlaid kerneldensity estimates, univariate distribution and Mahalanobis distances. Using unsupervised PCA(with Pearson product-momentum correlation) SCZ patients were easily distinguished betweencontrols. Principal components of variance (with Pearson correlations) were used to surveydiagnosis against other sources of variability such as patient, sample and experimentalparameters. The diagnosis attributed to 45.3% of variance with cause of death (9.6%),instrument (12.5%), year sequenced (19%) and post-mortem interval (0.1%) as the other majorcomponents of variance with a low unknown residual variance (13.5%). Analysis-of-variancewas performed using the diagnosis as the discriminatory effect and the major non-diagnosiscomponents of variance as fixed effects. Following FDR-correction 88 genes exhibiteddifferences in expression in genome-aligned read frequencies and 152 genes differedsignificantly in transcript-aligned reads, 25 genes were common to both genome- andtranscript-aligned sequences. GO annotation determined that 23 genes significantly affectedwere related to Golgi function or presynaptic vesicular transport and GABAergicneurotransmission which may define a unifying molecular hypothesis for dysfunction incerebellar cortex in SCZ.
Protocol Evaluation using Transcriptome SequencingWhole Blood RNA Isolation
Human whole blood samples were collected in PAX gene tubes (Qiagen Inc., Valencia, CA)from one of the co-authors at three random time points over a two-month period. The sampleswere frozen at −80°C for at least 24h. RNA isolation was performed per manufacture’sinstructions.
Sequencing-by-synthesisTranscriptomic libraries were prepared using Illumina’s standard protocols as previouslydescribed (Mudge, et al., 2008) except with either poly-A selection, ribominus [Ribo (−)]selection, or zinc fragmentation after poly-A tail selection. Briefly, following RNA qualityassessment using Bioanalyzer 2100 (Agilent Inc., Santa Clara, CA), poly A+ RNA was isolatedfrom 1 ì g total RNA by two rounds of oligo-dT selection (Invitrogen Inc., Santa Clara, CA.)or rRNA depletion using a RiboMinus kit (Invitrogen) per manufacturer’s instructions. Forone sample, zinc fragmentation was performed for 10m at 70°C using Ambion RNAFragmentation Reagents (Applied Biosystems Inc., Austin TX) and ethanol/glycogenprecipitated. All mRNA samples were then annealed to high concentration of random hexamersand reverse transcribed. Following second strand synthesis, end repair and A-tailing, adapterscomplementary to sequencing primers were ligated to cDNA fragment ends. Libraries were
Miller et al. Page 11
J Comput Sci Syst Biol. Author manuscript; available in PMC 2010 February 10.
NIH
-PA Author Manuscript
NIH
-PA Author Manuscript
NIH
-PA Author Manuscript

size fractionated on agarose gels, 200 bp fragments excised and amplified by 15 cycles ofpolymerase chain reaction. Following quality assessment, single-stranded cDNA fragmentswere randomly annealed to the surface of a flow cell. Annealed fragments were extended withDNA polymerase and unlabeled dNTPs in a solid phase “bridge amplification.” The resultantdouble strand fragments were denatured and bridge amplification repeated for 35 cycles,generating approximately 30–40 million clusters. Subsequently, 36 cycles of sequencing-by-synthesis chemistry were performed in Illumina Genome Analyzer II instruments (IlluminaInc.) with dNTPs featuring cleavable dyes and reversible terminators. Following baseextensions, four images are taken upon laser excitation. Incorporation of the next base occurredafter removal of the blocked 3′-terminus and fluorescent tag of the previously incorporatednucleotide. High quality sequence reads, as defined by default filtering parameters used in theIllumina GA Pipeline GERALD stage, were retained.
Read Alignment-based Gene Expression ProfilingHigh quality reads were aligned to the human genome, Build 36.2, RefSeq Transcript database,Release 22 (Pruitt, et al., 2005), Unigene Hs, build 215 using the algorithm GMAP (Wu andWatanabe, 2005) and Alpheus. Adjustments for SBS reads were oligomer overlap interval = 3nt, identities = 34/36. A read was denoted aligned to a locus if its sequence alignment to thegenomic reference sequence (NCBI build 36.2) fell within the boundaries of the locuscoordinates on the chromosome. Locus boundaries on the genome were defined by NCBIannotations, as reported through the Nucleotide database. Reads with a single best alignmentor with equally good alignments to alternative transcripts of the same locus were considereduniquely aligned. Aligned read frequencies (per million reads) were calculated for each sampleand locus expression and locus using Alpheus.
Statistical AnalysisRead frequencies were log2 transformed prior to evaluation of inter-sample differences.Overlaid kernel density estimates, correlation coefficients of pairwise sample comparisons andunsupervised PCA (by Pearson product-momentum) of read frequencies were performed withJMP Genomics. Heat maps were compared by selecting genes with a least a two-fold differenceof expression within one of the comparison groups and then hierarchal clustering of the dataset was performed.
ResultsLibrary Prep Techniques Leads to Highly Variably Transcriptomic Expression Profiles
To compare the differences in transcriptomic expression variance in the Ilumina library prepprotocols we compared expression data of the normal Illumina library preparation protocol, azinc mRNA fragmentation protocol after normal library prep, or after performing ribosomalexclusion. Whole blood was collected in PAX gene tubes from one of the coauthors at threeseparate time points over a three-month time period. It is believed that zinc fragmentationwould improve 3′-bias, while ribosomal exclusion would allow for screening of non-generelated transcribed RNA. After SBS and pipelining into Alpheus, uniquely aligned expressiondata was imported into JMP Genomics for statistical analysis. After import, the data was log2transformed. While the all of the samples were from the same individual we found vastlydifferent expression results from the three library preparation techniques as demonstrated byparallel plots (fig. 3) and the unsupervised PCA (fig. 4). To determine changes in expression,we subtracted log transformed values to find genes that had at least a two-fold difference inexpression. Under these constraints, 13,791 genes out of 33,887 total genes were at least two-fold different in expression. As visualized by the hierarchal cluster analysis, overall expressionwas much lower in the ribo(−) selection as compared to the normal technique and thefragmented technique (fig. 5). The pairwise comparisons of fragmented versus non-fragmented
Miller et al. Page 12
J Comput Sci Syst Biol. Author manuscript; available in PMC 2010 February 10.
NIH
-PA Author Manuscript
NIH
-PA Author Manuscript
NIH
-PA Author Manuscript

protocols (r2= 0.8845) were fairly regular as compared to fragmented versus ribo(−) (r2 =0.6945) and non-fragmented versus ribo(−) (r2 = 0.7582) (fig. 6). We were not able to determineany major advantage using the fragmented technique over the non-fragmented technique interms of 3′ bias or overall expression data (data not shown). However, the data did highlightexpression differences of the two protocols (fig. 5). Both the non-fragmented and fragmentedtechniques were preferred over ribo(−) selection as it appeared robust changes in transcriptomicexpression was muted using the ribo(−) technique as well as a very poor pairwise correlationresults as previously mentioned.
DiscussionAlpheus is a modular, robust data management and exploratory tool. It has been utilized formultiple high-throughput genome and transcriptome sequencing projects with differingobjectives (total data presently stored in the production databases is approximately seventerabytes). Because the environment of second-generation sequencing is evolving extremelyrapidly, we have scoped this project not to encompass all aspects of annotation, but rather toleverage existing, supported resources. For example, while performing essential alignmentservices, we rely on RefSeq, OMIM, pathway databases and other functional annotationresources for primary information. Where necessary and appropriate (e.g., in differential geneexpression and exon discovery projects), we extract information from our database for furtheranalysis. For example, in quests for new or un-annotated genes and exons in specific tissues,treated or pathologic tissues, we query the database for alignment information represented inthe genome sequence, but not present in the transcriptome-based unigene assemblies.Occasionally, these are represented as gene models; however, frequently, even in heavilyannotated reference sequences (e.g., human and the model plant, Arabidopsis thaliana), readsidentify un-identified areas. An example of this is demonstrated above for mesothelioma;however, the value of this query type has been shown in a variety of animal and plant projects(manuscripts in preparation).
The design of the resource is amenable to expansion to accommodate new sequencingtechnologies. While genome and transcriptome resequencing has been the focus of manyprojects, particularly variant discovery and differential gene expression, a module toaccommodate miRNA sequencing is being added with relative ease. Developments insequencing technologies have thus far driven our development efforts. In recent months,additions to the repertoire of production-level technologies are helping us prioritize theevolution of Alpheus. These technologies include epigenetic mapping (e.g., methylomeanalysis, (Butcher and Beck, 2008; Lister, et al., 2008; Pomraning, et al., 2008) and combinedRNA-seq techniques, such as those which define the RNA degradome (Addo-Quaye, et al.,2008) and quantification of alternative splice isoform and alternative polyadenylation (Wanget al., 2008). As per-run data outputs increase, methods for bar-coding or indexing of individuallibraries so that samples can be combined in sequencing runs and later deconvoluted becomemore important, and difficult to decipher on a production scale (Craig, et al., 2008; Goossens,et al., 2008; Hillier, et al., 2008). Analysis of structural variation in shotgun sequences fromsets of individual eukaryotic genomes (such as the 1000 genomes project) is also driving theevolution of Alpheus. While much of our work is in higher eukaryotes with genomes rangingfrom 1–3 gigabases, bacterial and lower eukaryotes have genomes that range from 3–50megabases, and survey level sequencing (5–10x coverage) can be accommodated in a mixedsamples. Finally, metagenomes will present a particular challenge. Metagenomes are mixturesof microorganisms from environmental, plant and animal samples, most of which areunculturable and unidentified, which represent generally stable populations. The aggregaterepresentation of the DNA sequence of the population is thus referred to as the metagenome(review, (Medini, et al., 2008). At present, the sequencing issues are approachable on aproduction scale, but the informatics issues remain subtle (review, (Kunin, et al., 2008).
Miller et al. Page 13
J Comput Sci Syst Biol. Author manuscript; available in PMC 2010 February 10.
NIH
-PA Author Manuscript
NIH
-PA Author Manuscript
NIH
-PA Author Manuscript

Automating and organizing the subtlety of metagenomic analysis will be challenging, to saythe least.
As discussed in the introduction, we consider the Alpheus infrastructure as an adjunct topublication of the results of high-throughput sequencing efforts. The NCBI Trace Archiveevolved from a need to present the raw data from genome and transcriptome sequencingprojects to allow the validation of experimental results, and to make the data available to alarger community than the sequencing teams involved in the project. These resources continueto be mined using new algorithmic methods, and frequently re-assembled by other groups. TheNCBI Short Read Archive is designed to serve a similar purpose. However, the computationalproblem of utilizing this data, either resequencing alignments or particularly de novosequencing efforts, remains challenges. A single deep transcriptome alignment can take up to1600 CPU hours to completely analyze. Alpheus can be used to present the underlyingassumptions used in complex experiments, and particularly to make the entire analyzed dataset available to the community in a fashion that it not only can be examined, but can be furtherexplored by others in the research community. As implemented, Alpheus can present virtuallyany level of access, from the complete sequencing data set and underlying query tools to thenarrower data set necessary to confirm published experiments. The mesothelioma andschizophrenia results are examples of this, with varying levels of accessibility to data at theweb sites.
The scale of contemporary high-throughput sequencing has migrated DNA data acquisitionfrom a simple tool to an essential platform for systems biology. We have developed Alpheusas a data management and exploration tool to complement experimentation and provide leadsin a plethora of human, agricultural and basic biological research. As discussed, we intend tocontinue to develop the system to extend into new technologies and research arenas.
AcknowledgmentsAlpheus is trademarked to the National Center for Genome Resources. We appreciate the collaboration and trust ofDr. Thomas Wu of Genentech, Inc., for allowing us access to unreleased versions of GMAP, as well as for pre-publication access to source code for GSNAP. We are grateful for the collaboration of Drs. Russell Wolfinger, WendyCzika, Tzu-Ming Chu and Shannon Conners of SAS JMP Genomics for their active collaboration with NCGR indeveloping robust statistical methods for sequence-based analysis using the SAS framework. The New MexicoComputing Applications Center (NMCAC) has provided access to and support for the SGI/Intel supercomputer,Encanto, on which future development work is being carried out We particularly acknowledge Drs. Thomas Bowlesand William Feiereisen of the Governors Office of the State of New Mexico in this respect. Dr. Tom Brettin of LosAlamos National Laboratories has collaborated on the development of NMCAC projects. Dr. Damian Gessler hasprovided input to the development of this paper. This work was supported by and established cross-disciplinary,collaborative partnership of universities and national laboratories. The work on Characterization of candidate SZnsSNPs and CD indels (nsV) was performed by research staff at the National Center for Genome Resources (NCGR),Santa Fe, NM, UNM and MIND Institute (both Albuquerque, NM), and, notably, by three faculty and five minorityundergraduate students at Northern New Mexico College (NNMC), Espanola, NM, and two volunteers (a familyphysician in Los Alamos, NM, and a physician-software engineer in Santa Fe, NM). Alpheus development was fundedinternally at NCGR and by the International Mesopthelioma program (led by Dr. David Sugarbaker and Dr. RaphaelBueno at the Brigham and Women’s Hospital, Boston, MA), by grant support from NCRR (5P20RR016480-08, ledby Dr. Jeff Arterburn at New Mexico State University), from NIAID (under Contract number HHSN266200400064C,led by Dr. Jeff Gulcher of deCODE Genetics, Reykjavik, Iceland), from the Nancy Davis Foundation for MultipleSclerosis, Los Angeles, CA, and by Macrogen Inc, Seoul, Korea. A deo lumen, ab amicis auxilium.
Abbreviations
ANOVA Analysis of variation
cSNV Coding SNV
indels Insertions/deletions
MPM Malignant pleural mesothelioma
Miller et al. Page 14
J Comput Sci Syst Biol. Author manuscript; available in PMC 2010 February 10.
NIH
-PA Author Manuscript
NIH
-PA Author Manuscript
NIH
-PA Author Manuscript
nsV Non-synonymous genetic variations
SRA NCBI Short Read Archive
PCA Principal components analysis
ribo(−) Ribominus
SNPs Single nucleotide polymorphisms
SNVs Single nucleotide variants
sV Synonymous variant
WGSS Whole genome shotgun sequencing
WTSS Whole transcriptome shotgun sequencing
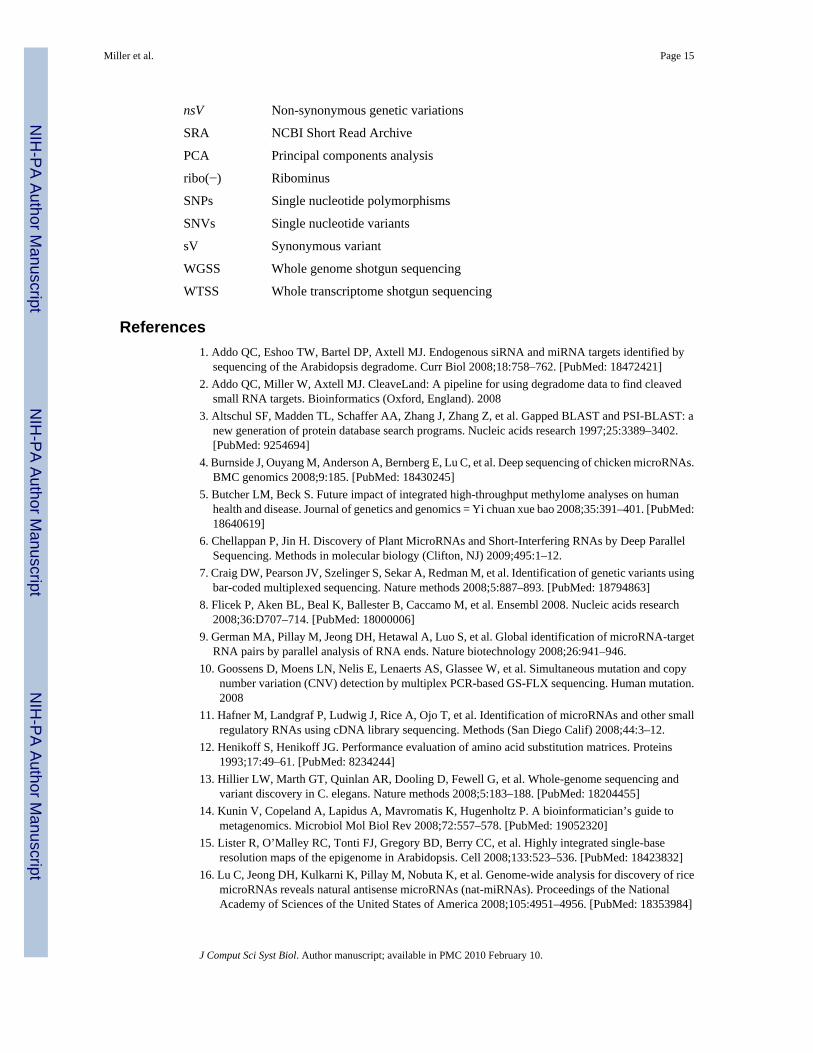
References1. Addo QC, Eshoo TW, Bartel DP, Axtell MJ. Endogenous siRNA and miRNA targets identified by
sequencing of the Arabidopsis degradome. Curr Biol 2008;18:758–762. [PubMed: 18472421]2. Addo QC, Miller W, Axtell MJ. CleaveLand: A pipeline for using degradome data to find cleaved
small RNA targets. Bioinformatics (Oxford, England). 20083. Altschul SF, Madden TL, Schaffer AA, Zhang J, Zhang Z, et al. Gapped BLAST and PSI-BLAST: a
new generation of protein database search programs. Nucleic acids research 1997;25:3389–3402.[PubMed: 9254694]
4. Burnside J, Ouyang M, Anderson A, Bernberg E, Lu C, et al. Deep sequencing of chicken microRNAs.BMC genomics 2008;9:185. [PubMed: 18430245]
5. Butcher LM, Beck S. Future impact of integrated high-throughput methylome analyses on humanhealth and disease. Journal of genetics and genomics = Yi chuan xue bao 2008;35:391–401. [PubMed:18640619]
6. Chellappan P, Jin H. Discovery of Plant MicroRNAs and Short-Interfering RNAs by Deep ParallelSequencing. Methods in molecular biology (Clifton, NJ) 2009;495:1–12.
7. Craig DW, Pearson JV, Szelinger S, Sekar A, Redman M, et al. Identification of genetic variants usingbar-coded multiplexed sequencing. Nature methods 2008;5:887–893. [PubMed: 18794863]
8. Flicek P, Aken BL, Beal K, Ballester B, Caccamo M, et al. Ensembl 2008. Nucleic acids research2008;36:D707–714. [PubMed: 18000006]
9. German MA, Pillay M, Jeong DH, Hetawal A, Luo S, et al. Global identification of microRNA-targetRNA pairs by parallel analysis of RNA ends. Nature biotechnology 2008;26:941–946.
10. Goossens D, Moens LN, Nelis E, Lenaerts AS, Glassee W, et al. Simultaneous mutation and copynumber variation (CNV) detection by multiplex PCR-based GS-FLX sequencing. Human mutation.2008
11. Hafner M, Landgraf P, Ludwig J, Rice A, Ojo T, et al. Identification of microRNAs and other smallregulatory RNAs using cDNA library sequencing. Methods (San Diego Calif) 2008;44:3–12.
12. Henikoff S, Henikoff JG. Performance evaluation of amino acid substitution matrices. Proteins1993;17:49–61. [PubMed: 8234244]
13. Hillier LW, Marth GT, Quinlan AR, Dooling D, Fewell G, et al. Whole-genome sequencing andvariant discovery in C. elegans. Nature methods 2008;5:183–188. [PubMed: 18204455]
14. Kunin V, Copeland A, Lapidus A, Mavromatis K, Hugenholtz P. A bioinformatician’s guide tometagenomics. Microbiol Mol Biol Rev 2008;72:557–578. [PubMed: 19052320]
15. Lister R, O’Malley RC, Tonti FJ, Gregory BD, Berry CC, et al. Highly integrated single-baseresolution maps of the epigenome in Arabidopsis. Cell 2008;133:523–536. [PubMed: 18423832]
16. Lu C, Jeong DH, Kulkarni K, Pillay M, Nobuta K, et al. Genome-wide analysis for discovery of ricemicroRNAs reveals natural antisense microRNAs (nat-miRNAs). Proceedings of the NationalAcademy of Sciences of the United States of America 2008;105:4951–4956. [PubMed: 18353984]
Miller et al. Page 15
J Comput Sci Syst Biol. Author manuscript; available in PMC 2010 February 10.
NIH
-PA Author Manuscript
NIH
-PA Author Manuscript
NIH
-PA Author Manuscript

17. Lu C, Kulkarni K, Souret FF, MuthuValliappan R, Tej SS, et al. MicroRNAs and other small RNAsenriched in the Arabidopsis RNA-dependent RNA poly-merase-2 mutant. Genome research2006;16:1276–1288. [PubMed: 16954541]
18. Lu C, Meyers BC, Green PJ. Construction of small RNA cDNA libraries for deep sequencing.Methods (San Diego, Calif) 2007;43:110–117.
19. Mangan ME, Williams JM, Lathe SM, Karolchik D, Lathe WC 3rd. UCSC genome browser: deepsupport for molecular biomedical research. Biotechnology annual review 2008;14:63–108.
20. Manolio TA, Brooks LD, Collins FS. A HapMap harvest of insights into the genetics of commondisease. The Journal of clinical investigation 2008;118:1590–1605. [PubMed: 18451988]
21. Mardis ER. The impact of next-generation sequencing technology on genetics. Trends Genet2008;24:133–141. [PubMed: 18262675]
22. Marioni JC, Mason CE, Mane SM, Stephens M, Gilad Y. RNA-seq: an assessment of technicalreproducibility and comparison with gene expression arrays. Genome research 2008;18:1509–1517.[PubMed: 18550803]
23. Medini D, Serruto D, Parkhill J, Relman DA, Donati C, et al. Microbiology in the post-genomic era.Nat Rev Microbiol 2008;6:419–430. [PubMed: 18475305]
24. Morozova O, Marra MA. From cytogenetics to next-generation sequencing technologies: advancesin the detection of genome rearrangements in tumors. Biochemistry and cell biology = Biochimie etbiologie cellulaire 2008;86:81–91. [PubMed: 18443621]
25. Mortazavi A, Williams BA, McCue K, Schaeffer L, Wold B. Mapping and quantifying mammaliantranscriptomes by RNA-Seq. Nature methods 2008;5:621–628. [PubMed: 18516045]
26. Mudge J, Miller NA, Khrebtukova I, Lindquist IE, May GD, et al. Genomic convergence analysis ofschizophrenia: mRNA sequencing reveals altered synaptic vesicular transport in post-mortemcerebellum. PLoS ONE 2008;3:e3625. [PubMed: 18985160]
27. Nagalakshmi U, Wang Z, Waern K, Shou C, Raha D, Gerstein M, et al. The transcriptional landscapeof the yeast genome defined by RNA sequencing. Science (New York, N.Y) 2008;320:1344–1349.
28. Pan Q, Shai O, Lee LJ, Frey BJ, Blencowe BJ. Deep surveying of alternative splicing complexity inthe human transcriptome by high-throughput sequencing. Nature genetics 2008;40:1413–1415.[PubMed: 18978789]
29. Pomraning KR, Smith KM, Freitag M. Genome-wide high throughput analysis of DNA methylationin eukaryotes. Methods (San Diego, Calif). 2008
30. Pruitt KD, Tatusova T, Maglott DR. NCBI Reference Sequence (RefSeq): a curated non-redundantsequence database of genomes, transcripts and proteins. Nucleic acids research 2005;33:D501–504.[PubMed: 15608248]
31. Ramensky V, Bork P, Sunyaev S. Human non-synonymous SNPs: server and survey. Nucleic acidsresearch 2002;30:3894–3900. [PubMed: 12202775]
32. Ropers HH. New perspectives for the elucidation of genetic disorders. American journal of humangenetics 2007;81:199–207. [PubMed: 17668371]
33. Shin H, Hirst M, Bainbridge MN, Magrini V, Mardis E, et al. Transcriptome analysis forCaenorhabditis elegans based on novel expressed sequence tags. BMC biology 2008;6:30. [PubMed:18611272]
34. Siva N. 1000 Genomes project. Nature biotechnology 2008;26:256.35. Sugarbaker DJ, Richards WG, Gordon GJ, Dong L, et al. Transcriptome sequencing of malignant
pleural mesothelioma tumors. Proceedings of the National Academy of Sciences of the United Statesof America 2008;105:3521–3526. [PubMed: 18303113]
36. Hoen PA, Ariyurek Y, Thygesen HH, Vreugdenhil E, Vossen RH, et al. Deep sequencing-basedexpression analysis shows major advances in robustness, resolution and inter-lab portability overfive microarray platforms. Nucleic acids research 2008;36:e141. [PubMed: 18927111]
37. Wang ET, Sandberg R, Luo S, Khrebtukova I, Zhang L, et al. Alternative isoform regulation in humantissue transcriptomes. Nature 2008;456:470–476. [PubMed: 18978772]
38. Wang Z, Gerstein M, Snyder M. RNA-Seq: a revolutionary tool for transcriptomics. Nature reviews2009;10:57–63.
Miller et al. Page 16
J Comput Sci Syst Biol. Author manuscript; available in PMC 2010 February 10.
NIH
-PA Author Manuscript
NIH
-PA Author Manuscript
NIH
-PA Author Manuscript

39. Wheeler DL, Barrett T, Benson DA, Bryant SH, Canese K, et al. Database resources of the NationalCenter for Biotechnology Information. Nucleic acids research 2008;36:D13–21. [PubMed:18045790]
40. Wilhelm BT, Marguerat S, Watt S, Schubert F, Wood V, et al. Dynamic repertoire of a eukaryotictranscriptome surveyed at single-nucleotide resolution. Nature 2008;453:1239–1243. [PubMed:18488015]
41. Wu TD, Watanabe CK. GMAP: a genomic mapping and alignment program for mRNA and ESTsequences. Bioinformatics (Oxford, England) 2005;21:1859–1875.
42. Zhang Z, Schwartz S, Wagner L, Miller W. A greedy algorithm for aligning DNA sequences. J ComputBiol 2000;7:203–214. [PubMed: 10890397]
Miller et al. Page 17
J Comput Sci Syst Biol. Author manuscript; available in PMC 2010 February 10.
NIH
-PA Author Manuscript
NIH
-PA Author Manuscript
NIH
-PA Author Manuscript

Figure 1.Key components of Alpheus and data flow through the system.
Miller et al. Page 18
J Comput Sci Syst Biol. Author manuscript; available in PMC 2010 February 10.
NIH
-PA Author Manuscript
NIH
-PA Author Manuscript
NIH
-PA Author Manuscript

Figure 2.Partial schema of Alpheus. Transcriptome alignments and substitution sequence variants arestored in this core schema, as described in detail in Materials and Methods.
Miller et al. Page 19
J Comput Sci Syst Biol. Author manuscript; available in PMC 2010 February 10.
NIH
-PA Author Manuscript
NIH
-PA Author Manuscript
NIH
-PA Author Manuscript

Figure 3.Overlaid kernel density estimates of gene expression by sequence read frequencies. Geneexpression of whole blood mRNA for normal Illumina library prep (red), fragmented afterpoly-A selection, and with Ribo(−) exclusion. The X-axis show log2 transformed geneexpression values, while the Y-axis shows kernel densities. Without log transformation,samples showed greater variability in kernel densities and sequence read frequencies showednear exponential decay.
Miller et al. Page 20
J Comput Sci Syst Biol. Author manuscript; available in PMC 2010 February 10.
NIH
-PA Author Manuscript
NIH
-PA Author Manuscript
NIH
-PA Author Manuscript

Figure 4.Unsupervised PCA of expression data. Three dimensional plot of unsupervised PCA byPearson product-moment correlation of log sequence expression. Normal (Red) andfragmented (Blue) libraries are more similar than the Ribo(−) prepped libraries (blue).
Miller et al. Page 21
J Comput Sci Syst Biol. Author manuscript; available in PMC 2010 February 10.
NIH
-PA Author Manuscript
NIH
-PA Author Manuscript
NIH
-PA Author Manuscript

Figure 5.Hierarchal clustering of log transformed expression data. 13,791 genes out of 33,887 totalgenes were at least two-fold different. Most genes had much higher expression in both normaland fragmented library preps than Ribo(−). Normal and fragmented prep had 6,577 genes thatwere at least two fold different. 10,404 genes were different between normal and ribo(−), while11,104 genes were two fold different between fragmented and ribo(−) library preps
Miller et al. Page 22
J Comput Sci Syst Biol. Author manuscript; available in PMC 2010 February 10.
NIH
-PA Author Manuscript
NIH
-PA Author Manuscript
NIH
-PA Author Manuscript

Figure 6.Pairwise sample correlations of Log2 transformed read frequencies, showing pairwisecorrelation coefficients. Pairwise comparisons suggest fairly linear distribution of geneexpression of the normal library technique versus the fragmented technique, while there ismuch great frequency distribution between ribo (−) and the normal and fragmented techniques.
Miller et al. Page 23
J Comput Sci Syst Biol. Author manuscript; available in PMC 2010 February 10.
NIH
-PA Author Manuscript
NIH
-PA Author Manuscript
NIH
-PA Author Manuscript