High throughput sequencing in mice: a platform comparison identifies a preponderance of cryptic SNPs
11
BioMed Central Page 1 of 11 (page number not for citation purposes) BMC Genomics Open Access Research article High throughput sequencing in mice: a platform comparison identifies a preponderance of cryptic SNPs Nicole AR Walter 1,2,3 , Daniel Bottomly 4,5 , Ted Laderas 5,6 , Michael A Mooney 4 , Priscila Darakjian 2,3 , Robert P Searles 7 , Christina A Harrington 6,7 , Shannon K McWeeney 2,4,5,6,8 , Robert Hitzemann 1,2,3 and Kari J Buck* 1,2,3 Address: 1 Research and Development Service, Portland VA Medical Center, Portland, OR, USA, 2 Portland Alcohol Research Center, Oregon Health & Science University, Portland, OR, USA, 3 Department of Behavioral Neuroscience, Oregon Health & Science University, Portland, OR, USA, 4 Department of Medical Informatics and Clinical Epidemiology, Oregon Health & Science University, Portland, OR, USA, 5 Oregon Clinical and Translational Research Institute, Oregon Health & Science University, Portland, OR, USA, 6 Knight Cancer Institute, Oregon Health & Science University, Portland, OR, USA, 7 Gene Microarray Shared Resource, Oregon Health & Science University, Portland, OR, USA and 8 Division of Biostatistics in the Department of Public Health and Preventive Medicine, Oregon Health & Science University, Portland, OR, USA Email: Nicole AR Walter - [email protected]; Daniel Bottomly - [email protected]; Ted Laderas - [email protected]; Michael A Mooney - [email protected]; Priscila Darakjian - [email protected]; Robert P Searles - [email protected]; Christina A Harrington - [email protected]; Shannon K McWeeney - [email protected]; Robert Hitzemann - [email protected]; Kari J Buck* - [email protected] * Corresponding author Abstract Background: Allelic variation is the cornerstone of genetically determined differences in gene expression, gene product structure, physiology, and behavior. However, allelic variation, particularly cryptic (unknown or not annotated) variation, is problematic for follow up analyses. Polymorphisms result in a high incidence of false positive and false negative results in hybridization based analyses and hinder the identification of the true variation underlying genetically determined differences in physiology and behavior. Given the proliferation of mouse genetic models (e.g., knockout models, selectively bred lines, heterogeneous stocks derived from standard inbred strains and wild mice) and the wealth of gene expression microarray and phenotypic studies using genetic models, the impact of naturally-occurring polymorphisms on these data is critical. With the advent of next-generation, high-throughput sequencing, we are now in a position to determine to what extent polymorphisms are currently cryptic in such models and their impact on downstream analyses. Results: We sequenced the two most commonly used inbred mouse strains, DBA/2J and C57BL/ 6J, across a region of chromosome 1 (171.6 – 174.6 megabases) using two next generation high- throughput sequencing platforms: Applied Biosystems (SOLiD) and Illumina (Genome Analyzer). Using the same templates on both platforms, we compared realignments and single nucleotide polymorphism (SNP) detection with an 80 fold average read depth across platforms and samples. While public datasets currently annotate 4,527 SNPs between the two strains in this interval, thorough high-throughput sequencing identified a total of 11,824 SNPs in the interval, including Published: 17 August 2009 BMC Genomics 2009, 10:379 doi:10.1186/1471-2164-10-379 Received: 11 February 2009 Accepted: 17 August 2009 This article is available from: http://www.biomedcentral.com/1471-2164/10/379 © 2009 Walter et al; licensee BioMed Central Ltd. This is an Open Access article distributed under the terms of the Creative Commons Attribution License (http://creativecommons.org/licenses/by/2.0 ), which permits unrestricted use, distribution, and reproduction in any medium, provided the original work is properly cited.
Transcript of High throughput sequencing in mice: a platform comparison identifies a preponderance of cryptic SNPs

BioMed CentralBMC Genomics
ss
Open AcceResearch articleHigh throughput sequencing in mice: a platform comparison identifies a preponderance of cryptic SNPsNicole AR Walter1,2,3, Daniel Bottomly4,5, Ted Laderas5,6, Michael A Mooney4, Priscila Darakjian2,3, Robert P Searles7, Christina A Harrington6,7, Shannon K McWeeney2,4,5,6,8, Robert Hitzemann1,2,3 and Kari J Buck*1,2,3Address: 1Research and Development Service, Portland VA Medical Center, Portland, OR, USA, 2Portland Alcohol Research Center, Oregon Health & Science University, Portland, OR, USA, 3Department of Behavioral Neuroscience, Oregon Health & Science University, Portland, OR, USA, 4Department of Medical Informatics and Clinical Epidemiology, Oregon Health & Science University, Portland, OR, USA, 5Oregon Clinical and Translational Research Institute, Oregon Health & Science University, Portland, OR, USA, 6Knight Cancer Institute, Oregon Health & Science University, Portland, OR, USA, 7Gene Microarray Shared Resource, Oregon Health & Science University, Portland, OR, USA and 8Division of Biostatistics in the Department of Public Health and Preventive Medicine, Oregon Health & Science University, Portland, OR, USA
Email: Nicole AR Walter - [email protected]; Daniel Bottomly - [email protected]; Ted Laderas - [email protected]; Michael A Mooney - [email protected]; Priscila Darakjian - [email protected]; Robert P Searles - [email protected]; Christina A Harrington - [email protected]; Shannon K McWeeney - [email protected]; Robert Hitzemann - [email protected]; Kari J Buck* - [email protected]
* Corresponding author
AbstractBackground: Allelic variation is the cornerstone of genetically determined differences in geneexpression, gene product structure, physiology, and behavior. However, allelic variation,particularly cryptic (unknown or not annotated) variation, is problematic for follow up analyses.Polymorphisms result in a high incidence of false positive and false negative results in hybridizationbased analyses and hinder the identification of the true variation underlying genetically determineddifferences in physiology and behavior. Given the proliferation of mouse genetic models (e.g.,knockout models, selectively bred lines, heterogeneous stocks derived from standard inbredstrains and wild mice) and the wealth of gene expression microarray and phenotypic studies usinggenetic models, the impact of naturally-occurring polymorphisms on these data is critical. With theadvent of next-generation, high-throughput sequencing, we are now in a position to determine towhat extent polymorphisms are currently cryptic in such models and their impact on downstreamanalyses.
Results: We sequenced the two most commonly used inbred mouse strains, DBA/2J and C57BL/6J, across a region of chromosome 1 (171.6 – 174.6 megabases) using two next generation high-throughput sequencing platforms: Applied Biosystems (SOLiD) and Illumina (Genome Analyzer).Using the same templates on both platforms, we compared realignments and single nucleotidepolymorphism (SNP) detection with an 80 fold average read depth across platforms and samples.While public datasets currently annotate 4,527 SNPs between the two strains in this interval,thorough high-throughput sequencing identified a total of 11,824 SNPs in the interval, including
Published: 17 August 2009
BMC Genomics 2009, 10:379 doi:10.1186/1471-2164-10-379
Received: 11 February 2009Accepted: 17 August 2009
This article is available from: http://www.biomedcentral.com/1471-2164/10/379
© 2009 Walter et al; licensee BioMed Central Ltd. This is an Open Access article distributed under the terms of the Creative Commons Attribution License (http://creativecommons.org/licenses/by/2.0), which permits unrestricted use, distribution, and reproduction in any medium, provided the original work is properly cited.
Page 1 of 11(page number not for citation purposes)

BMC Genomics 2009, 10:379 http://www.biomedcentral.com/1471-2164/10/379
7,663 new SNPs. Furthermore, we confirmed 40 missense SNPs and discovered 36 new missenseSNPs.
Conclusion: Comparisons utilizing even two of the best characterized mouse genetic models,DBA/2J and C57BL/6J, indicate that more than half of naturally-occurring SNPs remain cryptic. Themagnitude of this problem is compounded when using more divergent or poorly annotated geneticmodels. This warrants full genomic sequencing of the mouse strains used as genetic models.
BackgroundWith the recent completion of the Perlegen/NIEHS mouseresequencing [1], over ten million mouse single nucle-otide polymorphisms (SNPs) are now annotated in thepublic databases, resulting in a dramatic increase in thegenome-wide knowledge of variation among 16 of themost widely used mouse strains. Importantly, this is alower bound estimate because the C57BL/6J (B6) strain,used for the mouse genome reference sequence (NCBIm37, Apr 2007), is the only mouse strain sequenced in itsentirety. Given the proliferation of mouse genetic models(e.g., knockout models, selectively bred lines, heterogene-ous stocks derived from standard inbred strains and wildmice) and the recent insurgence of gene expression micro-array and phenotypic studies using these mouse models,the impact of naturally-occurring polymorphisms onthese data is critical. With the advent of next-generation,high-throughput sequencing (HTS), we are now in a posi-tion to determine to what extent polymorphisms remaincryptic (either undiscovered or not previously annotatedas a SNP in a specific strain comparison) in various mousemodels and assess their impact on downstream analyses.As an example, we demonstrate that cryptic SNPs are prev-alent, even between two of the most commonly used andwell-annotated inbred mouse strains, B6 and DBA/2J(D2).
The onset of next-generation HTS enabled us to obtainfull sequence coverage of a region of chromosome 1 in theD2 and B6 mouse strains. There are several platforms formassively parallel DNA sequencing currently on the mar-ket [2], and we took this opportunity to directly comparethe same dataset on two of the three most widely usedplatforms: Illumina (Genome Analyzer) and Applied Bio-systems (SOLiD). The Genome Analyzer implements aversion of cyclic reversible termination chemistry [3], andsimilarly, the SOLiD platform uses a self-checking ligationchemistry that maps into color space [4]. Both methodsgenerated short reads that were then realigned to a refer-ence sequence.
The present analyses were limited to a region of chromo-some 1 from 171.6 – 174.6 megabases (Mb). This intervalwas selected for four reasons. First, it is representative ofthe genome in that it spans discrete regions of high andlow SNP densities. Second, it is a gene dense region con-
taining 79 protein coding genes, 2 retrotransposed genes,and 6 noncoding RNA genes. Third, it harbors numerousquantitative trait loci (QTLs) affecting a wide variety ofphysiological and behavioral phenotypes [for summary,see [5]]. And finally, the low incidence of annotated poly-morphisms in a SNP-sparse block has hindered high-res-olution mapping in this region [6].
We report that comparisons utilizing two well-annotatedmouse genetic models, D2 and B6, predict that more thanhalf of naturally-occurring SNPs remain unknown or notannotated. These cryptic SNPs lead to a high incidence ofgene expression microarray false-positive and false-nega-tive results and lead to failures in identifying allelically-variant genes that can underlie QTL phenotypic effects.
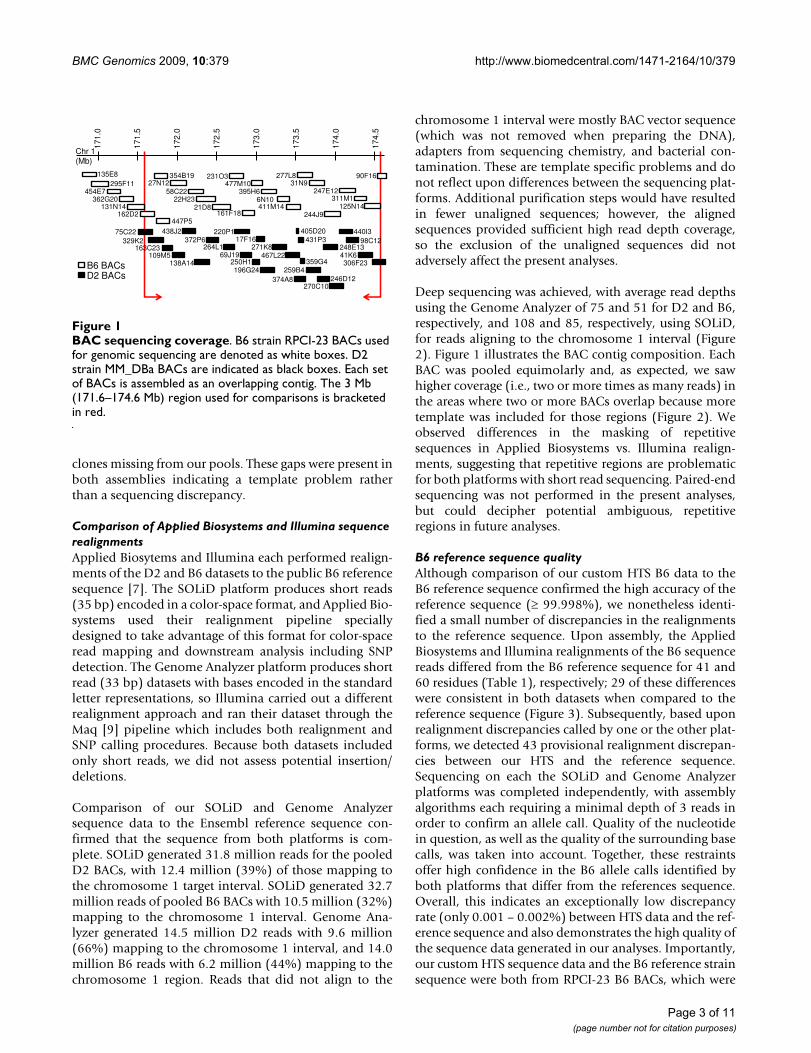
Results and discussionD2 BAC contig and sequenceUsing 32 PCR probes spanning the 171.6 – 174.6 Mbinterval of chromosome 1, we screened a commerciallyavailable D2 strain bacterial artificial chromosome (BAC)library, MM_DBa. End-sequencing of the BACs identifiedby these PCR probes allowed us to assemble a minimaloverlapping contig of 27 D2 BACs (Figure 1). The result-ing D2 BAC contig spanned a total of 3.1 Mb from171,509,721 – 174,625,201 bp on chromosome 1 (Build37). Contig sequence data from the SOLiD and GenomeAnlayzer platforms were assembled via realignment to theEnsembl reference sequence [7] and covered the regionsurveyed without any large gaps.
B6 BAC contig and sequenceTo evaluate our realignment strategy, we sequenced thecorresponding region from the B6 strain, for which fullreference sequence is available [7]. We prepared a B6 con-tig based on public end-sequence data for BAC clonesfrom the RPCI-23 library [8]. The resulting B6 BAC contigspanned 170,806,384 – 174,768,169 bp on chromosome1 (Figure 1). Using both the SOLiD and Genome Analyzerdatasets we attained realignment coverage with the excep-tion of two gaps. The first gap (11 kb) was expected sincethe RPCI-23 BAC library map lacks annotated coverage inthis region. The second gap (100 kb) could be due to anerror in the mapping of one or two of the RPCI-23 BACs,since we relied upon reported locations of the B6 BAClibrary clones, or, alternatively, could be due to one or two
Page 2 of 11(page number not for citation purposes)
BMC Genomics 2009, 10:379 http://www.biomedcentral.com/1471-2164/10/379
clones missing from our pools. These gaps were present inboth assemblies indicating a template problem ratherthan a sequencing discrepancy.
Comparison of Applied Biosystems and Illumina sequence realignmentsApplied Biosytems and Illumina each performed realign-ments of the D2 and B6 datasets to the public B6 referencesequence [7]. The SOLiD platform produces short reads(35 bp) encoded in a color-space format, and Applied Bio-systems used their realignment pipeline speciallydesigned to take advantage of this format for color-spaceread mapping and downstream analysis including SNPdetection. The Genome Analyzer platform produces shortread (33 bp) datasets with bases encoded in the standardletter representations, so Illumina carried out a differentrealignment approach and ran their dataset through theMaq [9] pipeline which includes both realignment andSNP calling procedures. Because both datasets includedonly short reads, we did not assess potential insertion/deletions.
Comparison of our SOLiD and Genome Analyzersequence data to the Ensembl reference sequence con-firmed that the sequence from both platforms is com-plete. SOLiD generated 31.8 million reads for the pooledD2 BACs, with 12.4 million (39%) of those mapping tothe chromosome 1 target interval. SOLiD generated 32.7million reads of pooled B6 BACs with 10.5 million (32%)mapping to the chromosome 1 interval. Genome Ana-lyzer generated 14.5 million D2 reads with 9.6 million(66%) mapping to the chromosome 1 interval, and 14.0million B6 reads with 6.2 million (44%) mapping to thechromosome 1 region. Reads that did not align to the
chromosome 1 interval were mostly BAC vector sequence(which was not removed when preparing the DNA),adapters from sequencing chemistry, and bacterial con-tamination. These are template specific problems and donot reflect upon differences between the sequencing plat-forms. Additional purification steps would have resultedin fewer unaligned sequences; however, the alignedsequences provided sufficient high read depth coverage,so the exclusion of the unaligned sequences did notadversely affect the present analyses.
Deep sequencing was achieved, with average read depthsusing the Genome Analyzer of 75 and 51 for D2 and B6,respectively, and 108 and 85, respectively, using SOLiD,for reads aligning to the chromosome 1 interval (Figure2). Figure 1 illustrates the BAC contig composition. EachBAC was pooled equimolarly and, as expected, we sawhigher coverage (i.e., two or more times as many reads) inthe areas where two or more BACs overlap because moretemplate was included for those regions (Figure 2). Weobserved differences in the masking of repetitivesequences in Applied Biosystems vs. Illumina realign-ments, suggesting that repetitive regions are problematicfor both platforms with short read sequencing. Paired-endsequencing was not performed in the present analyses,but could decipher potential ambiguous, repetitiveregions in future analyses.
B6 reference sequence qualityAlthough comparison of our custom HTS B6 data to theB6 reference sequence confirmed the high accuracy of thereference sequence (≥ 99.998%), we nonetheless identi-fied a small number of discrepancies in the realignmentsto the reference sequence. Upon assembly, the AppliedBiosystems and Illumina realignments of the B6 sequencereads differed from the B6 reference sequence for 41 and60 residues (Table 1), respectively; 29 of these differenceswere consistent in both datasets when compared to thereference sequence (Figure 3). Subsequently, based uponrealignment discrepancies called by one or the other plat-forms, we detected 43 provisional realignment discrepan-cies between our HTS and the reference sequence.Sequencing on each the SOLiD and Genome Analyzerplatforms was completed independently, with assemblyalgorithms each requiring a minimal depth of 3 reads inorder to confirm an allele call. Quality of the nucleotidein question, as well as the quality of the surrounding basecalls, was taken into account. Together, these restraintsoffer high confidence in the B6 allele calls identified byboth platforms that differ from the references sequence.Overall, this indicates an exceptionally low discrepancyrate (only 0.001 – 0.002%) between HTS data and the ref-erence sequence and also demonstrates the high quality ofthe sequence data generated in our analyses. Importantly,our custom HTS sequence data and the B6 reference strainsequence were both from RPCI-23 B6 BACs, which were
BAC sequencing coverageFigure 1BAC sequencing coverage. B6 strain RPCI-23 BACs used for genomic sequencing are denoted as white boxes. D2 strain MM_DBa BACs are indicated as black boxes. Each set of BACs is assembled as an overlapping contig. The 3 Mb (171.6–174.6 Mb) region used for comparisons is bracketed in red.
354B19135E8295F11
454E7362G20
131N14162D2
447P5
21D8
27N12395H6
277L8477M10
231O3
161F18
22H2358C22
311M16N10247E12
31N9
244J9411M14
138A14109M5
163C23329K2
75C22
125N14
90F16
438J2372P6
264L1
374A8196G24
250H169J19
220P1
259B4359G4
467L22271K8
17F16248E13
431P3405D20
270C10246D12
306F2341K6
98C12440I3
171.
0
171.
5
172.
0
172.
5
173.
0
173.
5
174.
0
Chr 1(Mb)
174.
5
B6 BACsD2 BACs
Page 3 of 11(page number not for citation purposes)

BMC Genomics 2009, 10:379 http://www.biomedcentral.com/1471-2164/10/379
generated from a pool of five female B6 mice from theJackson Laboratory. Thus, it is extremely unlikely thatstrain or template inconsistency contributed to the dis-crepancies in the realignment of our sequence to the B6reference sequence.
SNP identification and confirmationIn order to compare the SOLiD and Genome Analyzerplatforms under optimal conditions for each platformand to compare in a manner the majority of end-users arelikely to employ, the manufacturers used parametersdetermined to be optimal for SNP calling on their partic-ular platform. The Illumina SNP calling method (Maq)relies upon quality scores and applies a filter based onthese qualities, read depth, and neighboring SNPs inorder to discriminate between a SNP and a base-callingerror. Applied Biosystems calls SNPs based on two-baseencoding in color-space allowing for more sensitive dis-crimination between SNPs and base-calling errors. Illu-mina's method produced fewer no calls (Ns) than AppliedBiosystems' method based upon realignments performedby each vendor (Table 1). No nucleotide bias was appar-ent in the frequency of the calls using the Genome Ana-lyzer and SOLiD platforms. We conclude that because ofMaq's probabilistic approach using qualities, more SNPsare called by Illumina/Maq than by Applied Biosystems;however, it remains to be confirmed if Illumina has morefalse positive calls. It is important to keep in mind thatbecause the vendors used independent mapping and SNPcalling approaches, differential results due to the platformcannot be distinguished from those due to the analysispipeline.
Currently, the Mouse Phenome Database (MPD), whichincludes dbSNP and Perlegen data among other resources,offers the most inclusive SNP queries for mouse strains,including comparisons of the D2 and B6 strains (seeMethods for further explanation of SNP Databases).While, MPD currently annotates 4,527 D2 vs. B6 SNPs inthe chromosome 1 interval (171.6–174.6 Mb), customHTS identified 11,824 SNPs (Figure 3) for the same inter-val (referred to as PARC SNPs because they weresequenced by one or both platforms in work supported inpart by the Portland Alcohol Research Center, PARC).9,152 (77%) of the 11,824 PARC SNPs identified by cus-tom HTS were identified using both the Applied Biosys-tems and Illumina realignments (i.e., were identified bytwo independent experiments) and are therefore of veryhigh quality (Figure 3). 2,033 (17.2%) PARC SNPs wereidentified only by Illumina's realignment, and 639(5.4%) PARC SNPs were identified only by Applied Bio-systems realignment. Only 271 (13%) of the Illumina-specific PARC SNPs and 56 (10%) of the Applied Biosys-tems-specific PARC SNPs confirmed known SNPs inMPD.
The SOLiD and Genome Anlayzer datasets were mergedfor subsequent comparisons. Our results confirmed 4,161(92%) of the D2 vs. B6 SNPs currently annotated in theMPD public dataset within the chromosome 1 interval,while 236 (5%) of the SNPs reported in MPD for thisinterval were determined to be false-positive SNPs. The130 remaining either lie in gaps in our realignments orhad ambiguous (undetermined or low quality) calls in thesequence data. Our results identified numerous SNPs notpreviously annotated in MPD. In fact, our results identi-fied 7,663 new SNPs, more than doubling the number ofD2 vs. B6 SNPs found in this chromosome 1 interval.
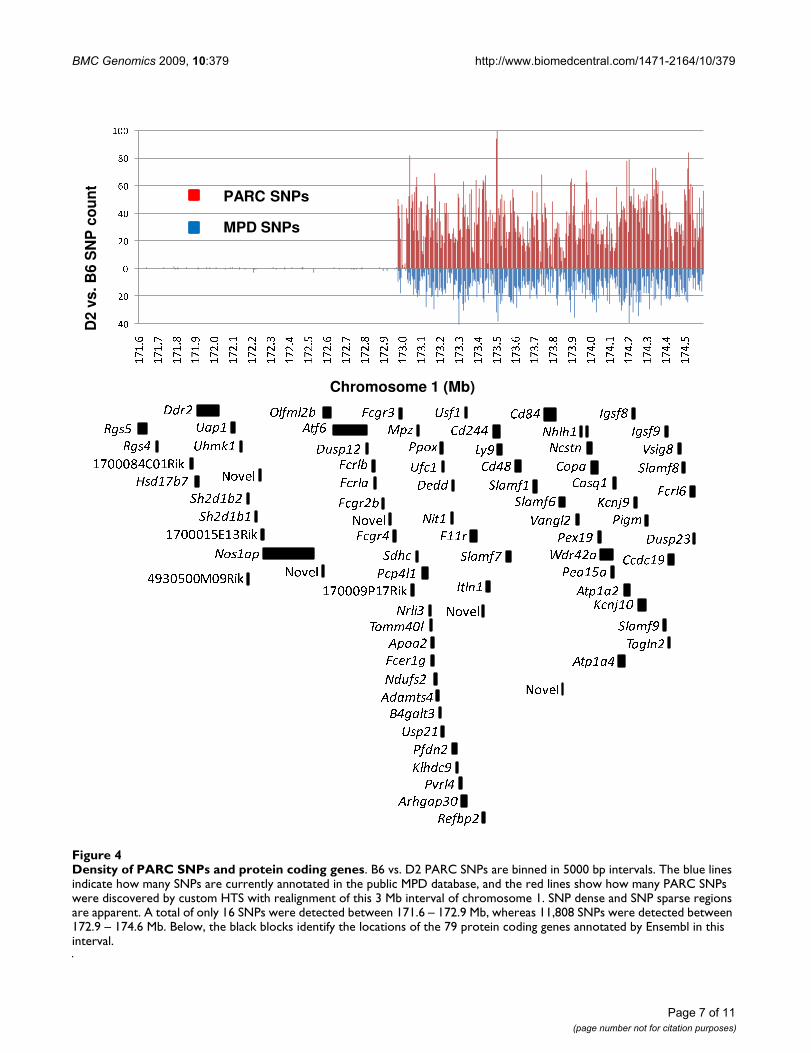
This chromosome 1 interval spans a clear haplotypebreak, resulting in a SNP sparse region (171.6–172.9 Mb)and a more distal SNP dense region (172.9 – 174.6 Mb)(Figure 4). The SNP sparse region contains only 16 PARCSNPs based on our custom sequencing, and the SNPdense region harbors 11,808 D2 vs. B6 PARC SNPs. Thisdata further defines the haplotype break between D2 andB6 and, importantly, provides additional genetic markersfor fine mapping within the SNP-sparse region which pre-viously was not possible [6]. Additionally, full SNP anno-tation will inform future SNP array chips allowing formore precise genotyping.
SNP impact on protein function or expressionWe assessed non-synonymous SNPs that result in aminoacid changes in proteins because of their clear impact onprotein activity. Based on our custom HTS, we found 76missense (non-synonymous coding) PARC SNPs thatchanged an amino acid residue between the D2 and B6strains. 36 of these were new missense SNPs (Table 2).Confirmation experiments (e.g., transcriptome sequenc-ing and PCR directed sequencing) and interrogation ofadditional datasets [6,10] already have confirmed 30 ofthe 36 new missense SNPs (Table 2), with the remainingsix lacking additional data. In an effort to determinewhether the 36 new missense SNPs affect protein func-tion, we used SIFT (Sorting Intolerant From Tolerant)[11], which uses sequence homology to predict whetheran amino acid substitution affects protein function, andPolyPhen (Polymorphism Phenotyping) [12], which usesmultiple sequence alignments and protein 3D structure topredict protein sequence effects on function. Based onthese two prediction methods, eight of the new missenseSNPs were predicted to affect protein function, althoughonly one of these amino acid changes was predicted to bedamaging by both methods (Table 2). Our data also con-firmed 40 missense SNPs annotated in MPD. Finally, fivemissense SNPs in MPD were not confirmed by our data,including three that had full sequence coverage in ourdata and were determined to have identical D2 and B6alleles. Our data indicate that these three are false positivemissense SNPs in the public dataset: Fcgr2b (K203Q),
Page 4 of 11(page number not for citation purposes)

BMC Genomics 2009, 10:379 http://www.biomedcentral.com/1471-2164/10/379
Fcgr3 (A81S), Itln1 (Y133F). The other two had ambigu-ous coverage in our alignments and could not be evalu-ated: Fcgr3 (G72W) and Itln1 (N162K).
In addition to the new missense SNPs, we identified 7,627new PARC SNPs in non-coding regions. These SNPs werenot previously known or annotated and may regulategene and/or protein expression. For example, in the Kcnj9gene, which demonstrates differential transcript expres-sion between the D2 and B6 strains [13], we identified 18new SNPs within 2 kb upstream of the transcriptionalstart site as well as nine new SNPs in the 3' untranslatedregion (Figure 5). We also identified one false-positiveSNP annotated in MPD in the 3' untranslated region.Thus, for Kcnj9 and other differentially expressed genes,elucidation of cryptic SNPs could identify nucleotide var-iation that underlies QTL phenotypic effects.
SNP impact on gene expression microarraysNaturally occurring genetic polymorphisms dramaticallyimpact hybridization based techniques, including gene
expression microarray analyses [14]. With the ability toassess alternative transcript expression, exon microarrayshave ten times as many probes as previous gene expres-sion microarrays, so eliminating hybridization bias usingSNP masks is increasingly critical. We have developed andapplied a complete SNP mask using all of the PARC SNPsfound by our custom HTS, which allowed us to rigorouslyassess differential expression between the D2 and B6strains. We assessed the impact of 124 SNPs that lie withincore probesets on the detection of differential (genotype-dependent) exon expression for genes in the chromosome1 region of interest using Affymetrix Mouse Exon 1.0 STarray data (for details, please see Mooney et al., compan-ion publication). 629 core probesets interrogate this inter-val. When compared to our unmasked data, maskedresults were consistent for 141 differentially expressedprobesets and 437 non-differentially expressed probesets,but indicated 47 false positive and 4 false negative resultsdue to SNPs.
Furthermore, we overlaid D2 vs. B6 SNPs discovered byour custom HTS with the probe locations of all four typesof probesets within the chromosome 1 interval (i.e., core,extended, full, and free) for the Affymetrix Exon 1.0 STgene expression microarray platform. For chromosome 1(171.6 – 174.6 Mb), there are 8201 probes and 2126probesets on the Affymetrix Mouse Exon 1.0 ST array, andwe identified 861 probes that spanned at least one SNPencompassing 480 probesets or 23% of the probesets thatinterrogate this interval (unpublished data). Thus, com-pared to publicly available D2 vs. B6 SNPs, custom HTSidentified 60% more probesets that span SNPs.
ConclusionWe report that comparisons utilizing even two of the mostcommonly used mouse genetic models, D2 and B6, pre-dict that more than half of naturally-occurring SNPsremain unknown or not annotated. This is particularlystriking given that the present comparison is between theB6 strain, upon which the mouse reference is based [7],and the D2 strain, which is one of the best annotatedmouse strains with sequence from Celera and extensiveSNP detection data primarily from Perlegen [1]. There areapproximately 1.8 million SNPs currently annotatedbetween the D2 and B6 strains in MPD [14]. Thus, crypticSNPs would have been even more prevalent had we usedmore divergent or poorly annotated genetic models.
We compare two methods for next-generation HTS. Bysequencing the same templates on both Applied Biosys-tems' SOLiD and Illumina's Genome Analyzer sequencingplatforms, we determined that the platforms offer compa-rable results at a high read depth. More SNPs were calledby Illumina/Maq than by Applied Biosystems, butbecause the vendors used independent mapping and SNPcalling approaches, differential results are likely due to
Read depth for Applied Biosystems' SOLiD (red) and Illu-mina's Genome Analyzer (blue) realignmentsFigure 2Read depth for Applied Biosystems' SOLiD (red) and Illumina's Genome Analyzer (blue) realignments. For D2 and B6 strains for the 171.6–174.6 Mb region of chromo-some 1, each tick indicates the average read depth within the corresponding 25,000 bp bin.
Ave
rage
Rea
d D
epth
25 kb bins on chromosome 1, Mb
� � � � � � � � � �
� � � � �
� �17
1.5
172.
0
172.
5
173.
0
173.
5
174.
0
174.
5
� �
500
450
400
350
300
250
200
150
100
50
0
350
300
250
200
150
100
50
0
Page 5 of 11(page number not for citation purposes)

BMC Genomics 2009, 10:379 http://www.biomedcentral.com/1471-2164/10/379
differences in the analysis pipelines, as no nucleotide biasin the frequency of the calls made by the Genome Ana-lyzer and SOLiD was apparent.
Mouse models are an invaluable tool for identifyingallelic variation that contributes to genetically determined
differences in physiology and behavior. However, allelicvariation is problematic for follow-up analyses, andremoving technical bias resulting from naturally-occur-ring sequence variation is critical. Previously, we illus-trated the impact of SNPs on gene expression microarrayanalyses [14] and argued that complete SNP masks forgene expression microarray and other hybridization tech-niques are essential to appropriately interpret these data.Here, we have taken the next step and sequenced a regionof two of the most widely used mouse strains in order todetermine the comprehensiveness of SNP data. What wehave found is that the mouse SNP data currently availableis incomplete. In fact, for the D2 vs. B6 strains, we predictthat less than half of the true SNPs are currently anno-tated. As more divergent mouse strains, harboring evenmore cryptic SNPs, are used in studies, the impact of SNPson interpreting results will become increasingly problem-atic. This glimpse at complete sequence data for twostrains demonstrates that full genomic sequencing of themouse strains used as research models is warranted.
MethodsD2 BAC library screenUsing 32 chemiluminescent labeled PCR probes designedacross a 3 Mb region of chromosome 1 (see AdditionalFile 1 for PCR probe primer pairs), we systematicallyprobed a D2 BAC library consisting of 215,040 clonesspotted on 12 nylon filters. The MM_DBa BAC library wasgenerated at Clemson University Genome Institute [15] in2002 using a single male D2 strain mouse from the Jack-son Laboratory where their Genetic Stability Program usesa cryopreservation approach to effectively limit geneticdrift and ensure strain stability. 90 BACs were identified inthe library screen using the standard Roche DIG chemilu-minescent protocol for probing DNA library filters.
D2 BAC end sequencingBAC ends were sequenced in order to determine if we hadoverlap. This was done in several rounds, in which we
Table 1: Comparison of Illumina and Applied Biosystems realignment data.
Illumina SOLiD
B6 D2 B6 D2
Total basepairs covered 2898101 3000000 2898101 3000000
Ns in realignment 547 23207 82499 116135
Realignment discrepancies to B6 reference or SNPs detected in D2 128 11221 41 9823
Ambiguous alleles 244 2047 37 635
Results are based upon realignments performed by each vendor for chromosome 1 (171.6–174.6 Mb). N's indicate a 'no call' in the realignment. Realignment discrepancies to B6 reference indicate a mismatch to the reference sequence, and SNP detection in D2 indicates a different allele than the B6 reference sequence. An ambiguous allele indicates that more than one base was called at that base, and since these are inbred animals, those calls are ignored and considered the same as a no call or an 'N'.
D2 vs. B6 SNPs and B6 realignment discrepancies vs. refer-ence sequenceFigure 3D2 vs. B6 SNPs and B6 realignment discrepancies vs. reference sequence. Custom HTS of chromosome 1 (171.6 – 174.6 Mb) data reveals D2 vs. B6 PARC SNPs and realignment discrepancies when compared to the B6 refer-ence sequence. A) B6 vs. D2 PARC SNPs identified by Illu-mina's realignment of Genome Analyzer data (blue circle) and/or Applied Biosystems' realignment of SOLiD data (red circle). D2 vs. B6 SNPs annotated in the Mouse Phenome Database (MPD) are also illustrated for comparison (green circle). Of the 11,824 PARC SNPs found using custom HTS by at least one sequencing method, 7,663 were previously unknown or not annotated as D2. vs. B6 SNPs, demonstrat-ing that public data for D2 vs. B6 SNPs is currently far from complete. B) Identification of 12 and 31 provisional discrep-ancies in the comparison of the B6 reference sequence to Illumina's (blue circle) and Applied Biosystems' (red circle) realignments; and confirmation (i.e., detected by both HTS platforms) of realignment discrepancies at 29 positions when compared to reference sequence.
Page 6 of 11(page number not for citation purposes)
BMC Genomics 2009, 10:379 http://www.biomedcentral.com/1471-2164/10/379
Page 7 of 11(page number not for citation purposes)
Density of PARC SNPs and protein coding genesFigure 4Density of PARC SNPs and protein coding genes. B6 vs. D2 PARC SNPs are binned in 5000 bp intervals. The blue lines indicate how many SNPs are currently annotated in the public MPD database, and the red lines show how many PARC SNPs were discovered by custom HTS with realignment of this 3 Mb interval of chromosome 1. SNP dense and SNP sparse regions are apparent. A total of only 16 SNPs were detected between 171.6 – 172.9 Mb, whereas 11,808 SNPs were detected between 172.9 – 174.6 Mb. Below, the black blocks identify the locations of the 79 protein coding genes annotated by Ensembl in this interval.
� � � � �
� � � � � � � � � �
� � � �� � � �
� � � � � � � � � � � �� � � � � � �
� � � � � � �
� � � ! "
# ! " �$ � % �
� � � � � � �
# � & ' �( ) * +
, - . / - 0 1
2 3 � % � �
$ 4 � " � �2 3 % 5 �
2 3 % 5 !
� � � 3
2 3 � % �
6 3 " � 5 �� � � � � 7 8 � � � �
9 & & � : 5; < - = >
( " ! �
? @ . 1 A 0
( � ! & ) � �� � 4 * � �
2 3 B % � �
( % � � ! " C :6 D % 5 �
E 5 � � 3 F6 * � G �
H I A 0 JK � � ! 5 ) C
2 � � %� L ) �
M @ N N# * 3 �
6 " OP " Q
R S T < >
U - V / . J
W � � XY Z F
W � � � �H I . J
[ ) 5 G �
� 5 ! & * �
E 3 G \ � :( ) " � ! �
] @ V J ^ V_ � % � � !
6 B O � F` ! G � 5 �
� 5 ! & * +
W ! � a �W " !
� 3 � ) G� � 5 � �
W � X �
9 ! � 5 G �� 5 ! & * F
� 5 ! & * X
` � L � X[ � � * F
[ � � * X
$ 4 � " � C
6 L � &E 3 G \ F
2 3 % 5 +
W 3 � 3 � F
b c d e f
( ) " � ! �
b c d e f
b c d e f
� 7 � � � � g � 7 � �
b c d e f
Chromosome 1 (Mb)
D2
vs. B
6 S
NP
co
un
t
h i
j i
k
j i
h i
l i
m i
n i i
opo qr
sts ut
sts uv
opo qw
opx qy
stz us
opx qx
opx q{
stz u|
stz u}
opx qr
opx qp
stz uv
opx qw
op{ qy
st~ us
st~ uz
op{ q{
st~ u|
st~ u}
op{ qr
op{ qp
st~ uv
op{ qw
op� qy
st| us
st| uz
op� q{
op� q�
st| u}
PARC SNPs
MPD SNPs
h i
j i
k
j i
h i
l i
m i
n i i
opo qr
sts ut
sts uv
opo qw
opx qy
stz us
opx qx
opx q{
stz u|
stz u}
opx qr
opx qp
stz uv
opx qw
op{ qy
st~ us
st~ uz
op{ q{
st~ u|
st~ u}
op{ qr
op{ qp
st~ uv
op{ qw
op� qy
st| us
st| uz
op� q{
op� q�
st| u}
PARC SNPs
MPD SNPs

BMC Genomics 2009, 10:379 http://www.biomedcentral.com/1471-2164/10/379
Table 2: Missense B6 vs. D2 PARC SNPs discovered by custom HTS.
SNP identifier Build 37Chromosome 1
location (bp)
Gene Ensembl ProteinID(ENSMUS)
Amino acidchange
SIFT PolyPhen
PARCsnp_1.001151 172981853 Fcgr3 P00000027964 D244E tolerated benign (A)
PARCsnp_1.008771 173088929 Mpz P00000066701 T94A tolerated benign (A+S)
PARCsnp_1.011031,2 173126252 Pcp4l1 P00000049205 A40T unknown benign (A)
PARCsnp_1.015781,2,4 173186807 Adamts4 P00000006570 F574Y tolerated benign (A)
PARCsnp_1.017351 173214749 Usp21 P00000064002 C341R tolerated benign (A)
PARCsnp_1.020571 173268767 Nit1 P00000106927 L236R* damaging probably damaging (A)
PARCsnp_1.021491,4 173290449 Klhdc9 P00000056212 E115G* tolerated probably damaging (A)
PARCsnp_1.022521 173300263 Pvrl4 P00000106917 S12T unknown benign (A)
PARCsnp_1.025094 173335292 Arhgap30 P00000059389 L458S tolerated benign (A)
PARCsnp_1.032023,4 173433896 Refbp2 P00000080242 R37S* tolerated possibly damaging (A)
PARCsnp_1.03321 173446982 novel P00000048799 L84V unknown benign (A)
PARCsnp_1.14401 173503917 Cd244 P00000004829 T56K tolerated benign (A+S)
PARCsnp_1.037241 173503965 Cd244 P00000004829 D72G tolerated benign (A+S)
PARCsnp_1.037251 173504048 Cd244 P00000004829 K100Q tolerated benign (A+S)
PARCsnp_1.144055 173504085 Cd244 P00000004829 T112I* tolerated probably damaging (A+S)
PARCsnp_1.03726 173504100 Cd244 P00000004829 K117R tolerated benign (A+S)
PARCsnp_1.037271,5 173504109 Cd244 P00000004829 N120T tolerated benign (A+S)
PARCsnp_1.037331,4 173504395 Cd244 P00000004829 I186T tolerated benign (A)
PARCsnp_1.03736 173504497 Cd244 P00000004829 S220L tolerated benign (A)
PARCsnp_1.14470 173510893 Cd244 P00000004829 S333F* damaging benign (A)
PARCsnp_1.039961 173537415 Ly9 P00000004827 G14S tolerated benign (A)
PARCsnp_1.056321,4 173826546 anon P00000095074 T98A unknown benign (A)
PARCsnp_1.161624 173826619 anon P00000095074 G122E unknown benign (A)
PARCsnp_1.067891,2,3,5 174012752 Ncstn P00000003550 S21F tolerated benign (A)
PARCsnp_1.067061,2,4 173996899 Ncstn P00000003550 T678I* tolerated possibly damaging (A)
PARCsnp_1.067052,4 173996894 Ncstn P00000003550 V680I tolerated benign (A)
PARCsnp_1.069901,2,4 174044893 Copa P00000027833 S761T* tolerated possibly damaging (A)
Page 8 of 11(page number not for citation purposes)
BMC Genomics 2009, 10:379 http://www.biomedcentral.com/1471-2164/10/379
designed new probes as needed to fill in gaps in our 3 Mbcontig. In total, we sequenced the ends of the 99 BACclones and aligned these BAC end-sequences to the refer-ence mouse sequence. Given that the stringency of the fil-ter hybridizations was variable, that interpretation ofpositive filter spots was not always straightforward, andthat the quality of BAC end-sequencing was not always
consistent, we proceeded to confirm each clone we iden-tified. We confirmed a BAC as positive for our region if theend-sequence mapped uniquely to the region of chromo-some 1, and the PCR probe mapped in between the endsequences. We confirmed 57 positive BACs for the chro-mosome 1 region and aligned these to create a minimalcontig of 27 overlapping MM_DBa BACs: clones 75C22,329K2, 163C23, 109M5, 438J2, 138A14, 372P6, 264L1,69J19, 220P1, 196G24, 250H1, 17F16, 374A8, 271K8,467L22, 405D20, 431P3, 359G4, 259B4, 246D12,248E11, 270C10, 440I3, 98C12, 41K6, and 306F23.
B6 BAC identificationFor the B6 BAC contig, we used the RPCI-23 B6 MouseBAC Library available from Children's Hospital OaklandResearch Institute [16], which was generated from a poolof five female B6 strain mice from the Jackson Laboratory,where strain stability is carefully controlled. This is thesame library used by the Mouse Genome SequencingConsortium to generate the B6 reference strain sequence.We used publically available BAC end-sequence for theBAC clones and assembled a minimal contig of 25 over-lapping BACs including clones 27N12, 162D2, 90F16,135E8, 161F18, 244J9, 247E12, 311M1, 354B19, 31N9,395H6, 231O3, 362G20, 21D8, 295F11, 277L8, 125N14,447P5, 58C22, 477M10, 22H23, 454E7, 411M14,131N14, and 6N10.
DNA preparationOnce the clones were identified, the same DNA prepara-tion protocol was used for the D2 and B6 BAC clones. Vec-
PARCsnp_1.070031,2,3,5 174049099 Copa P00000027833 N984S tolerated benign (A)
PARCsnp_1.077794 174185185 Atp1a4 P00000007346 I74V tolerated benign (A)
PARCsnp_1.076931,4 174174231 Atp1a4 P00000007346 N476S tolerated benign (A)
PARCsnp_1.076641,4 174170189 Atp1a4 P00000007346 M546T tolerated benign (A)
PARCsnp_1.083791,2,4 174247711 Igsf8 P00000041232 H221R tolerated benign (A)
PARCsnp_1.083891,2 174248843 Igsf8 P00000041232 T489S tolerated benign (A)
PARCsnp_1.088381,2,4 174299836 Kcnj10 P00000054356 T262S tolerated benign (A)
PARCsnp_1.098311,4 174415000 Igsf9 P00000058275 H49R* tolerated possibly damaging (A)
PARCsnp_1.10673 174530187 Fcrl6 P00000091861 E11D tolerated benign (A)
Thirty-six of the seventy-six missense PARC SNPs between the D2 and B6 strains detected by custom HTS were not previously annotated in MPD. Confirmed SNPs are defined as those SNPs detected using two or more independent methods, including the Illumina and Applied Biosystems methods presented here. 30 of the 36 missense SNPs have been confirmed by one or more datasets. 1confirmed by both Illumina and Applied Biosystems sequencing pipelines, 2confirmed by transcriptome sequencing (see Methods), 3confirmed by PCR directed sequencing [6], 4confirmed by realignment of Celera raw reads (see SNP Databases in Methods), or 5supported by imputed SNPs [24]. Ensembl protein IDs and respective amino acid differences are shown with the B6 amino acid residue indicated first and the D2 residue given last. Each amino acid change was assessed using two programs to determine whether or not the amino acid change is predicted to damage protein function. SIFT uses sequence conservation for predictions and PolyPhen predicts damaging changes using both multiple sequence alignments (A) and/or protein 3D structures (S).
Table 2: Missense B6 vs. D2 PARC SNPs discovered by custom HTS. (Continued)
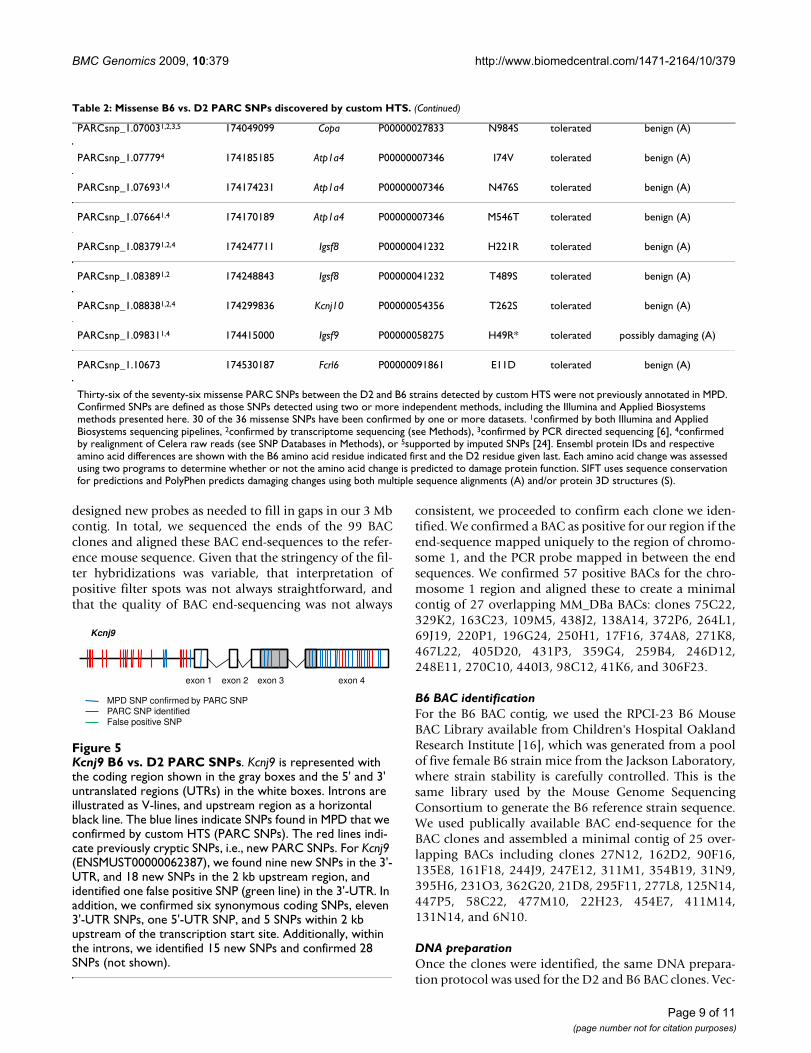
Kcnj9 B6 vs. D2 PARC SNPsFigure 5Kcnj9 B6 vs. D2 PARC SNPs. Kcnj9 is represented with the coding region shown in the gray boxes and the 5' and 3' untranslated regions (UTRs) in the white boxes. Introns are illustrated as V-lines, and upstream region as a horizontal black line. The blue lines indicate SNPs found in MPD that we confirmed by custom HTS (PARC SNPs). The red lines indi-cate previously cryptic SNPs, i.e., new PARC SNPs. For Kcnj9 (ENSMUST00000062387), we found nine new SNPs in the 3'-UTR, and 18 new SNPs in the 2 kb upstream region, and identified one false positive SNP (green line) in the 3'-UTR. In addition, we confirmed six synonymous coding SNPs, eleven 3'-UTR SNPs, one 5'-UTR SNP, and 5 SNPs within 2 kb upstream of the transcription start site. Additionally, within the introns, we identified 15 new SNPs and confirmed 28 SNPs (not shown).
exon 1 exon 2
Kcnj9
exon 3 exon 4
MPD SNP confirmed by PARC SNPPARC SNP identifiedFalse positive SNP
Page 9 of 11(page number not for citation purposes)

BMC Genomics 2009, 10:379 http://www.biomedcentral.com/1471-2164/10/379
tors were not removed. Each clone was prepared from aglycerol stock by Clemson University using a standardprotocol [15]. This resulted in high-quality end-sequencedata. We quantified the BAC DNA using a Nanodrop 1000(Thermo Scientific) and assessed quality of the 260/280ratios of each BAC clone. For each of two final samples(B6 and D2), BACs were pooled equimolarly and sent toApplied Biosystems (Foster City, CA) and Illumina (SanDiego, CA) for next-generation short read DNA sequenc-ing.
Illumina (Genome Analyzer) sequence and assemblyAs per Illumina's requirements, equimolarly pooled BACDNA was submitted for each B6 and D2 samples: 8.5 ugof B6 BACs and 22.8 ug of D2 BACs. Illumina preparedsingle read libraries and performed sequencing on theGenome Analyzer I (previously, Solexa) as per standardprotocol [17]. Briefly, the sequencing process relies on theamplification of fragmented DNA to form clusters. Thesequence content of these clusters is then queried usingcycles of fluorescently labeled dNTP addition, detection,and fluorescent groupremoval. The data was optimallyassembled by Illumina using Maq (Mapping and Assem-bly with Quality) [18] with the default parameters in theeasyrun script [9]. We used the cns.final.snp output filewith minimum read depth of 3 and minimum consensusquality of 30 required to call a SNP for these analyses.
Applied Biosystems (SOLiD) sequence and assemblyEquimolarly pooled BAC DNA samples were sent toApplied Biosystems as per their requirements: 49.7 ug ofB6 BACs and 69.3 ug of D2 BACs. Applied Biosystems pre-pared two fragment libraries for sequencing from eachpool of genomic DNA via standard methods on theirSOLiD platform [19]. In short, the SOLiD process attachesclonally-amplified template DNA to a bead and adaptersubstrate and queries cyclically by adding fluorescentlylabeled probes specific to two bases, detecting these di-base-calls, removing the fluorescent group, and repeating.This is followed by a primer-reset which shifts the startingprimer, allowing different bases to be queried using theabove base-calling cycle.SOLiD data was analyzed byApplied Biosystems using their freely available softwarepackage. The SOLiD Analysis Tools (SAT) process thearray image, perform data filtering, calculate quality val-ues, align to a reference genome, and generate base callsusing default parameters [20]. SNPs were called with aminimum read depth of 3 as a requirement.
Determining non-synonymous SNPsNon-synonymous SNPs were computed using theEnsembl CDS sequence from UCSC for each transcript.Any SNP falling within coding region and the exonboundaries were used to convert the B6 allele into the D2allele predicted by the realignments. The coding
sequences were then reassembled and translated in silicousing CLC Sequence Viewer 5 [21]. The amino acidsequences were compared and any differences were noted.
Transcriptome sequencingStriatal tissue from D2 (n = 8) and B6 (n = 8) males andfemales was dissected and total RNA isolated using stand-ard Trizol (Invitrogen) protocol. 3 μg of total RNA waspooled (n = 8) for each strain and sent to Illumina forlibrary construction and standard transcriptome sequenc-ing. The realignment was performed using ELAND with 2errors allowed in the first 32 bases of a read. Because wehad incomplete read coverage for lowly expressed genes,strain-specific sequence results were analyzed for highlyexpressed genes only. So this dataset offers confirmationof some of the SNPs detected in our DNA sequencing, butdid not achieve complete transcriptome coverage.
SNP Databases1. Mouse Phenome database (MPD). The MPD SNPcollection [22] contains data for approximately 10million mouse SNPs for an expansive list of strainsfrom a variety of sources, including datasets such asBroad Institute and Wellcome Trust that are not yetavailable in other databases. A significant portion ofthese SNPs are from Perlegen (NIEHS) [1]. Genotypeallele tables are generally provided by investigators;however, Perlegen did not include B6 in their analyses.In this case, MPD annotated the reference B6 alleleswith the Perlegen data making SNP queries includingthe B6 strain more inclusive. Specifically, MPD has4,527 D2 vs. B6 SNPs in the chromosome 1 interval(171.6–174.6 Mb) of interest. All SNPs are mapped toNCBI mouse genome build 37.1 reference assembly(B6). This MPD SNP data build includes annotationfrom dbSNP 128, Ensembl 48, and NCBI extractedduring Dec 2007. The 18 strains with high density SNPdata are B6, D2, 129S1/SvImJ, A/J, AKR/J, BALB/cByJ,BTBR_T+_tf/J, C3H/HeJ, CAST/EiJ, FVB/NJ, KK/HlJ,MOLF/EiJ, NOD/ShiLtJ, NZW/LacJ, PWD/PhJ, WSB/EiJ, 129X1/SvJ, and CZECHII/EiJ.
2. dbSNP Build 128. dbSNP is maintained at NCBI[23] and includes more than 14 million mouse SNPs.When querying for strain specific polymorphisms,dbSNP identifies 2,903 D2 vs. B6 SNPs in the chromo-some 1 interval (171.6–174.6 Mb) of interest. Thisnumber is significantly lower than those found inMPD because the Perlegen data does not include B6alleles, so dbSNP does not retrieve these in the strainspecific queries.
3. Ensembl variation 53. The Ensembl SNP dataset isqueried using Biomart [24] and primarily incorporatesdbSNP 128. There are some additional SNPs specific
Page 10 of 11(page number not for citation purposes)

BMC Genomics 2009, 10:379 http://www.biomedcentral.com/1471-2164/10/379
to Ensembl without reference SNP (rs) accession num-bers. When querying for strain specific polymor-phisms, Ensembl retrieves 2,832 D2 vs. B6 SNPs in thechromosome 1 interval (171.6–174.6 Mb) of interest.Additionally, individual transcript queries in Ensemblinclude strain variation data that contain realignmentsof the original strain specific raw reads from Celera(including D2) to the reference B6 sequence. TheseSNPs provide independent confirmation of some ofthe SNPs identified by custom HTS and are annotatedas confirmation by "Realignment of Celera raw reads"in Table 2.
Data availabilityAll of the PARC SNPs discovered from both Applied Bio-systems' SOLiD and Illumina's Genome Analyzersequencing pipelines have been deposited in dbSNP atNCBI under the Handle PARC_SEQ as ComputationalSNPs (ss#119994841-120015816). D2 BAC endsequence has been submitted to GenBank as GSS(genome survey sequences). Raw sequencing data forSOLiD sequencing has been submitted to GenBank in theSRA (short read archive) without intensity data. Rawsequencing data for the Illumina sequencing is availableupon request; however this data was generated before SRAstandards were established, and the specific raw filesneeded for SRF format are no longer available.
Competing interestsThe authors declare that they have no competing interests.
Authors' contributionsAll authors assisted with the concept and design of thestudy. All of the BAC library screening and sample prepa-ration was conducted by NW, as well as primary manu-script writing. DB analyzed the SOLiD and Illuminasequencing results and assessed the protein codingchanges. TL and MM conducted the overlay of the SNPsonto annotated sequences and probes for SNP masks. PDand NW analyzed the SNP lists and masks and depositeddata. RS, CH, SKM, RH, and KJB contributed to discus-sions and manuscript edits. All authors read and approvedthe final manuscript.
Additional material
AcknowledgementsThis work is supported by 5R01AA011114, 5R01DA005228, 5P60AA10760, 5R01AA11034, 5R01AA13484, 5T15LM007088, 5P30CA069533, UL1RR024140, and the VA. We thank Illumina and Applied Biosystems for their assistance in the generation and realignment of these sequencing data.
References1. Frazer KA, Eskin E, Kang HM, Bogue MA, Hinds DA, Beilharz EJ,
Gupta RV, Montgomery J, Morenzoni MM, Nilsen GB, et al.: Asequence-based variation map of 8.27 million SNPs in inbredmouse strains. Nature 2007, 448:1050-3.
2. Mardis ER: Next-generation DNA sequencing methods. AnnuRev Genomics Hum Genet 2008, 9:387-402.
3. Metzker ML: Emerging technologies in DNA sequencing.Genome Res 2005, 15:1767-76.
4. Shendure J, Porreca GJ, Reppas NB, Lin X, McCutcheon JP, Rosen-baum AM, Wang MD, Zhang K, Mitra RD, Church GM: Accuratemultiplex polony sequencing of an evolved bacterialgenome. Science 2005, 309:1728-32.
5. Mozhui K, Ciobanu DC, Schikorski T, Wang X, Lu L, Williams RW:Dissection of a QTL hotspot on mouse distal chromosome 1that modulates neurobehavioral phenotypes and geneexpression. PLoS Genet 2008, 4:e1000260.
6. Denmark DL, Buck KJ: Molecular analyses and identification ofpromising candidate genes for loci on mouse chromosome 1affecting alcohol physical dependence and associated with-drawal. Genes Brain Behav 2008, 7:599-608.
7. Ensembl [http://www.ensembl.org/Mus_musculus]. Sequence buildused in this manuscript is NCBI m37, Apr 2007
8. Osoegawa K, Tateno M, Woon PY, Frengen E, Mammoser AG, Cat-anese JJ, Hayashizaki Y, de Jong PJ: Bacterial artificial chromo-some libraries for mouse sequencing and functional analysis.Genome Res 2000, 10:116-28.
9. Li H, Ruan J, Durbin R: Mapping short DNA sequencing readsand calling variants using mapping quality scores. Genome Res2008, 18:1851-8.
10. Szatkiewicz JP, Beane GL, Ding Y, Hutchins L, Pardo-Manuel de VillenaF, Churchill GA: An imputed genotype resource for the labo-ratory mouse. Mamm Genome 2008, 19:199-208.
11. Ng PC, Henikoff S: SIFT: Predicting amino acid changes thataffect protein function. Nucleic Acids Res 2003, 31:3812-4.
12. Ramensky V, Bork P, Sunyaev S: Human non-synonymous SNPs:server and survey. Nucleic Acids Res 2002, 30:3894-900.
13. Hitzemann R, Malmanger B, Reed C, Lawler M, Hitzemann B, Cou-lombe S, Buck K, Rademacher B, Walter N, Polyakov Y, et al.: Astrategy for the integration of QTL, gene expression, andsequence analyses. Mamm Genome 2003, 14:733-47.
14. Walter NA, McWeeney SK, Peters ST, Belknap JK, Hitzemann R,Buck KJ: SNPs matter: impact on detection of differentialexpression. Nat Methods 2007, 4:679-80.
15. Clemson Univsersity Genomics Institute [http://www.genome.clemson.edu]
16. CHORI [http://bacpac.chori.org/femmouse23.htm]17. Illumina DNA sequencing [http://www.illumina.com/
pages.ilmn?ID=251]18. Mapping and Assembly with Quality [http://maq.source
forge.net]19. Applied Biosystems DNA sequencing [https://prod
ucts.appliedbiosystems.com/ab/en/US/adirect/ab?cmd=catNavigate2&catID=604409]
20. SOLiD Analysis Tools [http://solidsoftwaretools.com/gf/project/corona/]
21. CLC Sequence Viewer 5 [http://www.clcbio.com]22. The Mouse Phenome Database [http://www.jax.org/phenome/
SNP]23. dbSNP Mouse SNP query [http://www.ncbi.nlm.nih.gov/SNP/
MouseSNP.cgi]24. Ensembl Biomart SNP query [http://www.ensembl.org/biomart/
martview]
Additional file 1D2 BAC probe primer sequences. Custom PCR primer pairs that were used to generate PCR probes to screen MM_DBa BAC library across chro-mosome 1 region of interest. All primers are listed 5'-3' orientation.Click here for file[http://www.biomedcentral.com/content/supplementary/1471-2164-10-379-S1.xls]
Page 11 of 11(page number not for citation purposes)