SNPRanker: a tool for identification and scoring of SNPs associated to target genes
15
SNPRanker: a tool for identification and scoring of SNPs associated to target genes Andrea Calabria 1,2,3 , Ettore Mosca 1,2 , Federica Viti 1 , Ivan Merelli 1 and Luciano Milanesi *,1 1 Institute for Biomedical Technologies, National Research Council, via F.lli Cervi 93, 20090, Segrate (MI), Italy, http://www.itb.cnr.it 2 Dept. of Informatics, Systems and Communication, University of Milano Bicocca, Viale Sarca, 336, 20126 Milano, Italy, http://www.disco.unimib.it 3 Dept. of Medicine, Surgery and Dentistry, University of Milano, Via Di Rudini 8, 20142 Milano, Italy, http://www.unimi.it Summary The identification of genes and SNPs involved in human diseases remains a challenge. Many public resources, databases and applications, collect biological data and perform an- notations, increasing the global biological knowledge. The need of SNPs prioritization is emerging with the development of new high-throughput genotyping technologies, which allow to develop customized disease-oriented chips. Therefore, given a list of genes re- lated to a specific biological process or disease as input, a crucial issue is finding the most relevant SNPs to analyse. The selection of these SNPs may rely on the relevant a-priori knowledge of biomolecular features characterising all the annotated SNPs and genes of the provided list. The bioinformatics approach described here allows to retrieve a ranked list of significant SNPs from a set of input genes, such as candidate genes associated with a specific disease. The system enriches the genes set by including other genes, associated to the original ones by ontological similarity evaluation. The proposed method relies on the integration of data from public resources in a vertical perspective (from genomics to systems biology data), the evaluation of features from biomolecular knowledge, the com- putation of partial scores for SNPs and finally their ranking, relying on their global score. Our approach has been implemented into a web based tool called SNPRanker, which is accessible through at the URL http://www.itb.cnr.it/snpranker . An inter- esting application of the presented system is the prioritisation of SNPs related to genes involved in specific pathologies, in order to produce custom arrays. 1 Introduction In the recent past years, genotyping technologies knew a great development and studies about genotype markers are increasing in importance [1, 2]. Among them, the evaluation of Single Nucleotide Polimorphisms, also known as SNPs, is revealing very promising. SNPs are nowa- days widely exploited for Genome Wide Association Studies (GWAS) [13, 4, 5], identification of Copy Number Variations (CNV) [6], observations of Population Stratification [7] and so * E-Mail Addresses: {andrea.calabria; ettore.mosca; federica.viti; ivan.merelli; luciano.milanesi}@itb.cnr.it Journal of Integrative Bioinformatics, 7(3):138, 2010 http://journal.imbio.de doi:10.2390/biecoll-jib-2010-138 1
Transcript of SNPRanker: a tool for identification and scoring of SNPs associated to target genes
SNPRanker: a tool for identification and scoring of SNPsassociated to target genes
Andrea Calabria 1,2,3, Ettore Mosca 1,2, Federica Viti 1, Ivan Merelli 1 andLuciano Milanesi *,1
1Institute for Biomedical Technologies, National Research Council, via F.lli Cervi 93, 20090,Segrate (MI), Italy, http://www.itb.cnr.it
2Dept. of Informatics, Systems and Communication, University of Milano Bicocca, VialeSarca, 336, 20126 Milano, Italy, http://www.disco.unimib.it
3Dept. of Medicine, Surgery and Dentistry, University of Milano, Via Di Rudini 8, 20142Milano, Italy, http://www.unimi.it
Summary
The identification of genes and SNPs involved in human diseases remains a challenge.Many public resources, databases and applications, collect biological data and perform an-notations, increasing the global biological knowledge. The need of SNPs prioritization isemerging with the development of new high-throughput genotyping technologies, whichallow to develop customized disease-oriented chips. Therefore, given a list of genes re-lated to a specific biological process or disease as input, a crucial issue is finding the mostrelevant SNPs to analyse. The selection of these SNPs may rely on the relevant a-prioriknowledge ofbiomolecular featurescharacterising all the annotated SNPs and genes of theprovided list. The bioinformatics approach described here allows to retrieve a ranked listof significant SNPs from a set of input genes, such as candidate genes associated with aspecific disease. The system enriches the genes set by including other genes, associatedto the original ones by ontological similarity evaluation. The proposed method relies onthe integration of data from public resources in a vertical perspective (from genomics tosystems biology data), the evaluation of features from biomolecular knowledge, the com-putation of partial scores for SNPs and finally their ranking, relying on their global score.Our approach has been implemented into a web based tool calledSNPRanker, which isaccessible through at the URLhttp://www.itb.cnr.it/snpranker . An inter-esting application of the presented system is the prioritisation of SNPs related to genesinvolved in specific pathologies, in order to produce custom arrays.
1 Introduction
In the recent past years, genotyping technologies knew a great development and studies aboutgenotype markers are increasing in importance [1, 2]. Among them, the evaluation of SingleNucleotide Polimorphisms, also known as SNPs, is revealing very promising. SNPs are nowa-days widely exploited for Genome Wide Association Studies (GWAS) [13, 4, 5], identificationof Copy Number Variations (CNV) [6], observations of Population Stratification [7] and so
* E-Mail Addresses:{andrea.calabria;ettore.mosca; federica.viti; ivan.merelli; luciano.milanesi}@itb.cnr.it
Journal of Integrative Bioinformatics, 7(3):138, 2010 http://journal.imbio.de
doi:10.2390/biecoll-jib-2010-138 1
forth. SinceSNPsrepresent established genomic differences, their knowledge can be exploitedto characterize each subject from others on study by correlating specific phenotype with a cor-responding genomic pattern.The total number of SNPs in the whole human genome exceeds 12 millions and each SNP isrelated to different genomic properties depending on its position on the DNA strand: i.e. a SNPcan be located within inter-gene regions or within intra-gene ones. Nowadays chip technologiesallow to analyze up to one million SNPs for each patient due to chemical and physical limitsthat affect probe density. To overcome this limit, together with technological improvements,researchers are trying to define reasonable strategies to filter the initial amount of 12 millionsSNPs.The first approach to optimize the SNPs probeset relies on the concept of Linkage Disequi-librium [8] (LD). LD mapping exploits a statistical similarity measure between adjacent SNPsand computes how much two SNPs are related each other, thus defining what is the geneticinformation improvement using both or just one of them. LD mapping is thus used to optimizethe information contained into 1 million SNPs arrays. The second method able to reduce thenumber of SNP probes within a chip regards the possibility to create disease-oriented chip. Thisapproach not only allows adapting the analysis to specific genetic studies but even to producesmaller arrays. In fact, this aspect relies on a crucial topic: which strategy can be followed toselect the subset of SNPs suitable to create a specific disease-oriented chip.
The presented work is related to SNPs’ probeset identification for producing genotyping arraysdedicated to pathologies, starting from genes or biological processes involved in such diseases.The tool scores different biomolecular features for SNPs associated to a set of genes, that isgiven as input and that can be expanded through an ontology-based engine. Once the SNPsfinal scores are computed, the system provides a ranked list of the most significant SNPs asso-ciated to the input set of genes.MoreoverSNPRankercan be used for gene enrichment through the identification of the onto-logical similarity between the input genes and whole set of human genes. This allows to extendthe initial gene list, by including also genes presenting a similar biological function (accordingto the considered ontology) thus potentially involved in the same disease.
The paper is organized as follows. Section 2 describes the related works; Section 3 lists thefunctional elements the system is composed by; Section 4 describes the activities pipeline per-formed by the system; Section 5 overviews the system’s capabilities and presents a use case;Section 6 provides conclusions and future works.
2 Related works
The analysis of genomic variations is usually performed following two main approaches: statis-tical methods or machine learning techniques. The main difference is that while the exploitationof statistical methods requires a data model involving a set of a-priori hypotheses and param-eters values, the use of machine learning approaches do not need a-priori evaluations, sincemodels and rules are derived directly from a training set of data and the system is trained to fita general model which will be then adopted for all other data. An alternative solution is offeredby data mining approaches where users can visualize, plot and reorder data without fixed mod-els and, if the system supports customizations, they can also validate their own new models ondata and infer new knowledge.
Journal of Integrative Bioinformatics, 7(3):138, 2010 http://journal.imbio.de
doi:10.2390/biecoll-jib-2010-138 2
Statisticalmethodsarewidely used in epidemiology and got many positive results in applica-tion studies [9, 10]. Nevertheless, statistical approaches are often computationally intensive,especially when dealing with large amount of data produced by high-throughput techniques,and this approach is often impracticable for most of the research laboratories. Therefore, manyscientists found machine learning approaches very attractive: so far many studies exist exploit-ing machine learning approaches and are providing encouraging results [11, 12].Machine learning methods are among the most promising approaches due to the flexibility andadaptation to data. When exploitingsupervisedmethods, the training set must be carefully se-lected, since the model is created on it: the training set must therefore embed all peculiaritiesof the considered data type, thus allowing the model a-priori knowledge. In our case data aresingle nucleotide genomic variations (SNPs) and the a-priori knowledge is represented by fea-tures that characterize each SNP or the related gene and protein.Data mining methods are mostly employed in business fields, for example for intelligent cus-tomer support and business analyses. In the genetic context a few significant works have beenproduced, for example in [13] the authors mine SNPs from families; we need a tool for scoringSNPs based on a priori information and where users can infer knowledge by setting parameters,like data mining facilities usually support.Only a few applications exploit machine learning in genotyping context. An example, concern-ing the genes ranking, is the so calledgene prioritization[14], a method that, given a set oftraining genes, considers a number of features from them, which represent the a-priori knowl-edge available from multiple data sources. Given a set of test genes, the cited system computesfeatures values and ranks test genes with respect to their similarities, achieving the prioritizationand highlighting the most important genes, with respect to the selected features.
No methods are available in literature to achieve, in SNPs context, results similar to gene priori-tization through data mining and machine learning approach. The paper presents a new methodfor evaluating SNPs by features scoring.
3 System’s functional components
The core of the designed system can be decoupled into four levels:
• gene list enrichment: exploitation of gene ontological annotation to enrich the initial listof genes provided as input;
• data integration: creation of a database for the integration of biomolecular knowledgeretrieved from public sources;
• features set: choice of the features characterizing each SNP;
• evaluation function: definition of the function that provides a final score for each SNP.
Following subsections present in details the levels mentioned above and the related character-istics of the implemented prototype.
Journal of Integrative Bioinformatics, 7(3):138, 2010 http://journal.imbio.de
doi:10.2390/biecoll-jib-2010-138 3
3.1 Data integration
Thefirst step concerns the design of a database for integrating genes and genes products infor-mation, in order to provide a solid knowledge base on which the whole SNP-scoring systemrelies on. For this purpose a systems biology oriented and ontology-based database has beendeveloped, which integrates data from a wide range of public resources.It exploits a MySQL server and relies on a data warehouse approach, which consists in col-lecting and transforming heterogeneous data from different sources, to allow their integrationand accessibility. This approach is typical of data integration models and differs from data in-tegrity models, often used for normalized databases which are widely used to maintain primaryresources.The database is gene-centric and considers at the moment only human genes which are anno-tated, among other features, by symbol, description, aliases and sequences. Data about SNP aredownloaded from dbSNP [15], which allows to integrate data about chromosomal andcontigposition, heterozygosity, alleles and function of the related DNA portion. Moreover, gene prod-ucts have been collected as list of mRNAs sequences and related protein isoforms accordingto the NCBI RefSeq annotations (NCBI Nucleotide [15]). Data about proteins include all theidentifiers suitable to download the related sequences, functional domains [16, 17] and struc-tural models from the Protein Data Bank [18].The systems biology perspective leads to consider data such as the list of the biochemicalpathways (KEGG [19] and Reactome [20]) where human gene products are involved, and in-formation about protein-protein interactions (PPIs), collected from BioGRID [21], which com-plement knowledge about pathways and enable crucial network based analysis.The peculiarity of the developed database is represented by the multi-level approach to dataintegration, which enables a more comprehensive view of the examined process or disease:therefore, it should lead to a better selection of the set of SNPs to be included in a disease-oriented custom chip.Finally, in order to provide a standard framework for data integration and a reliable engine forSNPs selection, the database has been built on a strong ontology layer. Whenever available,data have been annotated using ontological terms: Gene Ontology [22] for genes and KEGGPathway ontology (derived from the hierarchical organization of KEGG pathways) for path-ways are just some of the hierarchically structured vocabularies that underlie the infrastructure.Additionally, ontology structures allow to improve the performance of statistical and analyticalevaluations by means of the graphs that undergo the hierarchically structured vocabularies andthat shed light on the relationships between biological components.
3.2 Features set
The term “features” indicates a set of characteristics, related to each SNP, the machine learningapproach relies on, in a direct way or through the gene and the gene product knowledge. The setof features chosen to characterize each SNP represents an a-priori knowledge of the scientificproblem.Since the described approach considers as input a list of genes, the system must considerbiomolecular elements as related to genes in avertical perspective. Therefore informationis considered in both a top-down view, from proteins interactions to sequences of nucleotides,and a bottom-up perspective, starting from genes characterization and climbing up to processesand complex biological systems.
Journal of Integrative Bioinformatics, 7(3):138, 2010 http://journal.imbio.de
doi:10.2390/biecoll-jib-2010-138 4
The featuresset includes genomic (Minor Allele Frequencies, localization on the DNA se-quence), proteomic (InterPro [17] domains), interactomic (hub proteins), phenotypic informa-tion (essential genes).In the following, a complete list of the considered features will be described.
Hub proteins The evaluation of the number of protein-protein interactions (PPIs) estab-lished by a protein, i.e. the degree of the protein in the PPIs network, is an important aspect inassessing the biological relevance of a SNP occurring within or close to the gene that encodesfor that protein. Indeed, it is known thathubproteins play a crucial role for the cell functioningand, in fact, are often encoded by essential genes. The database used in this work integratesPPIs data from HPRD [23] and BioGRID. By means of this information it is possible to scorea SNP (x) associated to a gene with the following characteristic function, which considers thenumber of PPIskx established by the protein encoded in the gene:
f1(x) =
{1, kx ≥ α0, kx < α
whereα is the number of PPIs requested to be considered as hub. By defaultα = 20, accordingto [24]: through the web interface the user is able to modify this value.
Protein domain A SNP can create a missense or even a frame shift in the coding sequence,thus causing changes in the protein amino acid sequence, which can have a deep impact on theprotein function according to the region where the modification occurs. In fact, if a change islocalized within a domain, thus being functionally important, its effect on the biological func-tion is potentially more relevant than if it is placed within a inter-domain region.Information related to the domain localization of the SNPs can be obtaining by linking InterProDomain Architecture (IDA) data (which report the localization of the protein domain accordingto the amino acid position within the protein chain) with the knowledge concerning the aminoacid position (which indicates the position of the amino acid modified by the SNP). This infor-mation can be easily accessed from the integrative database.The score of this feature is provided by a characteristic function, which applies greater valuesto SNPs occurring into protein domains (D) encoding regions.
f2(x) =
{1, x ∈ D0, x /∈ D
Minor Allele Frequencies The Minor Allele Frequency (MAF) represents the frequencyof the less frequent allele of a SNP in a specific population: it defines how much an allele(and thus its SNP) is relevant for a population. MAF score can even be employed to measurethe “penetrance” of a disease in a population, in case the minor allele is more diffused in theaffected phenotype than in the unaffected one in the control population.Since we are designing a general system for different studies and applications, all populationsconsidered in the HapMap project [25] have been included, with their MAF values. The user isrequired to choose the MAF of interest.For this feature, the scoring function is expressed as the original MAF valuemx ∈ <|(0 ≤mx < 0.5) obtained from the HapMap project:
f3(x) = mx.
Journal of Integrative Bioinformatics, 7(3):138, 2010 http://journal.imbio.de
doi:10.2390/biecoll-jib-2010-138 5
Whenthe“1000 Genomes Project” [26] will provide more accurate and updated values aboutMAF scores, we will update these values.
Localization on the DNA sequence According to the annotation provided by dbSNP [27],functional relationship between SNPs (and possibly alleles) and genes are defined. Relying onthis annotation the following categories have been consideredC = { “unknown”, “coding-synonymous”, “intron”, “near-gene 3”’, “near-gene 5”’, “nonsense”, “missense”, “frameshift”,“untranslated 3”’, “untranslated 5”’}.According to the user’s specific analysis the whole setC or subsets of it can be considered.Considering the vectorc = (c1, ..., c10), whose elementsci ∈ 0, 1 indicate the selection or theexclusion of the elements ofC, the scoring function can be formalized as follows:
f4(x) = cT × v
wherev is a weight vector.
Essential genes Another important feature for SNP scoring is the kind of gene where thepolymorphism occurs. It is known that some genes areessentialto support cellular life, i.e. iftheir products are not correctly produced the cell hardly survives. The knowledge base usedin this work includes data providing such information forhomo sapiens[28]. Considering theset of human genesG and the subset of essential genesE ⊂ G, the scoring function is thefollowing characteristic function:
f5(x) =
{1, x ∈ E0, x ∈ G− E
3.3 Core scoring function
In order to obtain a significant score for each SNP, features’ values must be processed througha core scoring function. This engine allows to compute the final SNP value as a real number,considering genes and genes’ products information embedded in the defined set of features.Given the a-priori knowledge embedded in the described set of features, the user can interactwith this information in order to better adapt it to his scientific studies: this is possible by asso-ciating each feature to aweightthat represents the importance of that feature for the calculationof the final SNP score. The default values for all the elements in the vector~w of the featuresappears in the tool web page: this model assigns the same importance to each feature, withoutassuming any specific perspective while performing the analysis. The scoring functiong mapsthe values returned by the features scoring functionsf1, . . . , f5 and the weights vectorw ∈ R5
to a single final value, which is used to calculate the final SNPs ranked list:
g : B× B× R× R× B× R5 → R
whereB = {0, 1}. The scoring functiong has been defined in two forms; as the sum 1 or theproduct 2 (which determines a more restrictive SNPs selection) of the values returned byf1, f2,f3, f4, f5 according to the weightsw
g : (f1, f2, f3, f4, f5,w) 7→ w1f1 + w2f2 + w3f3 + w4f4 + w5f5 (1)
Journal of Integrative Bioinformatics, 7(3):138, 2010 http://journal.imbio.de
doi:10.2390/biecoll-jib-2010-138 6
g : (f1, f2, f3, f4, f5,w) 7→ w1f1 × w2f2 × w3f3 × w4f4 × w5f5 (2)
3.4 Gene list enrichment
Ontologies are controlled vocabularies hierarchically organized. Their exploitation allows notonly the use of standardized and recognized descriptive terms, but even to infer relations amongobjects that are annotated through ontologies. In the implemented system the ontology layer isexploited, other than for annotation aims, to enrich the list of genes provided to the system asinput. From the input genes listg1 the system generates the listg2 ⊇ g1, which includes also thegenes that present a high semantic similarity with the genes ing1. Four main methods exist inliterature to carry on this task: three methods [29, 30, 31] determine the semantic similarities oftwo terms based on their distances to the closest common ancestor term and/or the annotationstatistics of their common ancestor terms.A crucial drawback of these methods is that the distances to the closest common ancestor termcannot accurately represent the semantic difference of two terms: if two terms sharing the sameparent are near the root of the ontology, thus being more general and less informative, theyshould have larger semantic difference than two terms having the same parent and being faraway from the root of the ontology. Moreover, measuring the semantic similarity of two onto-logical terms based only on the number of common ancestor terms cannot discern the semanticcontributions of the ancestor terms to these two specific terms. The fourth method [32] evalu-ates these limits and provides an alternative solution for measuring ontological terms similarity:the measure is based on the graph of the considered ontology.Within the proposed system, the [32] and the [31] strategies have been implemented, thus pro-viding the user the possibility to choose the preferred method.
4 System design
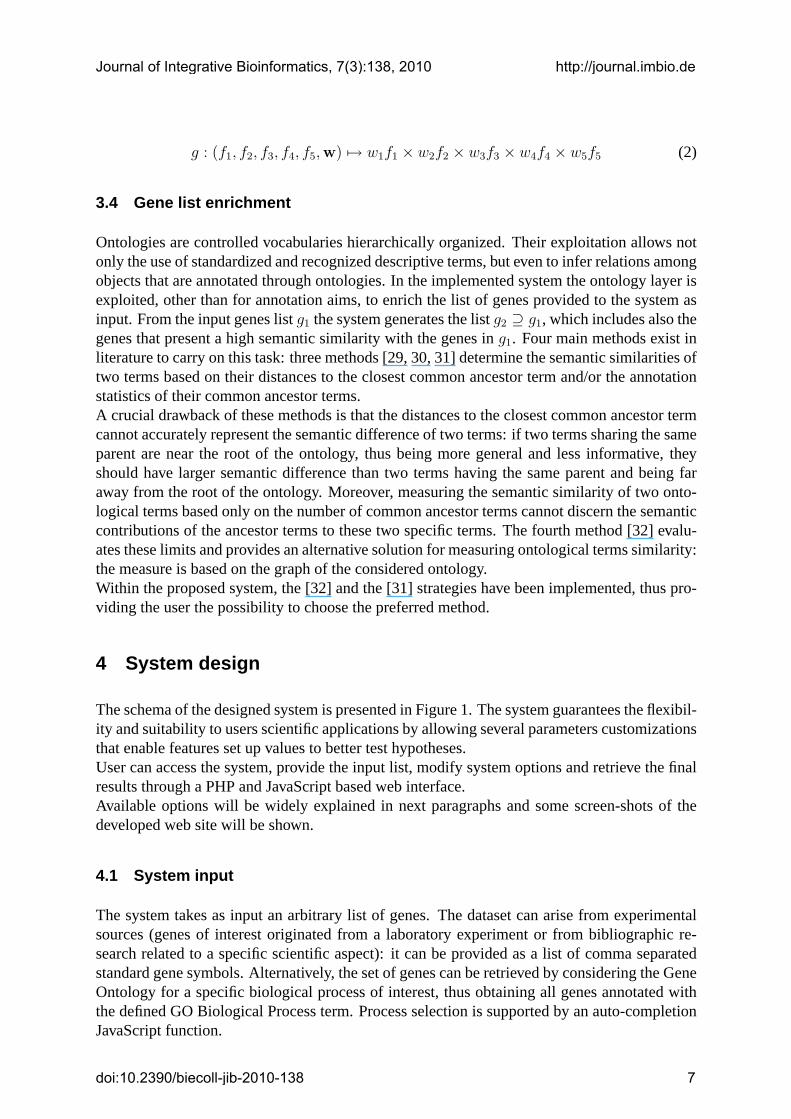
The schema of the designed system is presented in Figure 1. The system guarantees the flexibil-ity and suitability to users scientific applications by allowing several parameters customizationsthat enable features set up values to better test hypotheses.User can access the system, provide the input list, modify system options and retrieve the finalresults through a PHP and JavaScript based web interface.Available options will be widely explained in next paragraphs and some screen-shots of thedeveloped web site will be shown.
4.1 System input
The system takes as input an arbitrary list of genes. The dataset can arise from experimentalsources (genes of interest originated from a laboratory experiment or from bibliographic re-search related to a specific scientific aspect): it can be provided as a list of comma separatedstandard gene symbols. Alternatively, the set of genes can be retrieved by considering the GeneOntology for a specific biological process of interest, thus obtaining all genes annotated withthe defined GO Biological Process term. Process selection is supported by an auto-completionJavaScript function.
Journal of Integrative Bioinformatics, 7(3):138, 2010 http://journal.imbio.de
doi:10.2390/biecoll-jib-2010-138 7
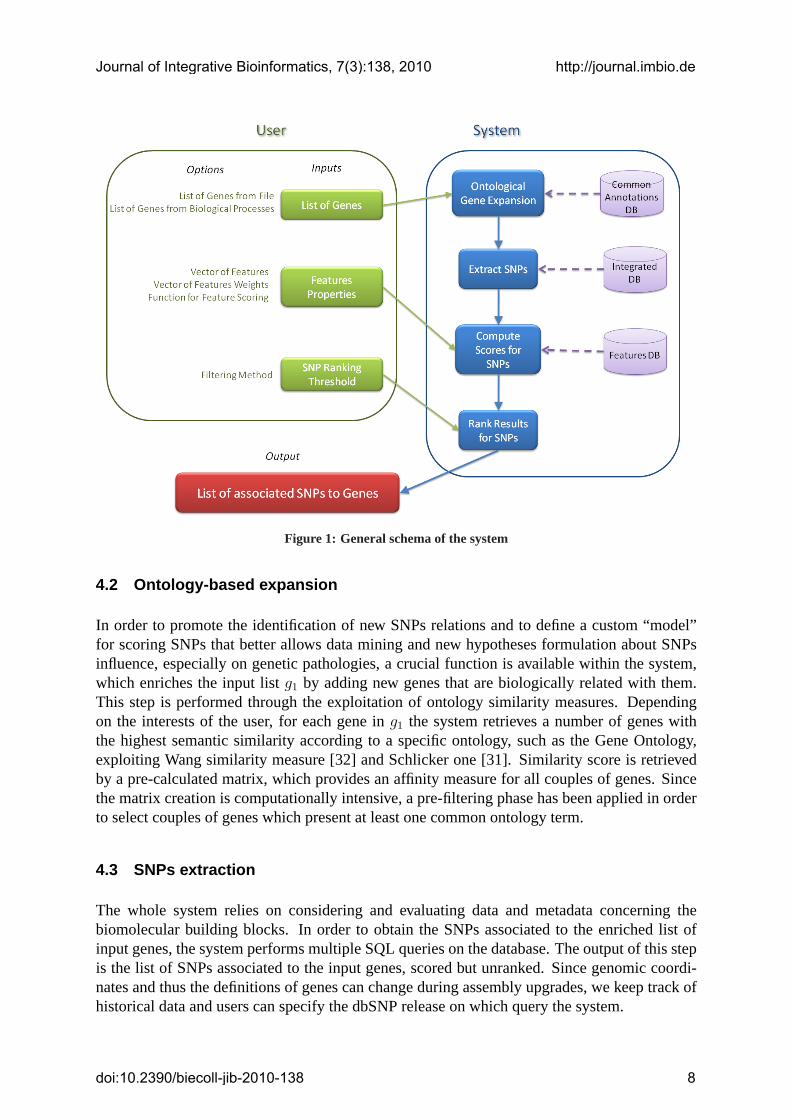
Figure1: General schema of the system
4.2 Ontology-based expansion
In order to promote the identification of new SNPs relations and to define a custom “model”for scoring SNPs that better allows data mining and new hypotheses formulation about SNPsinfluence, especially on genetic pathologies, a crucial function is available within the system,which enriches the input listg1 by adding new genes that are biologically related with them.This step is performed through the exploitation of ontology similarity measures. Dependingon the interests of the user, for each gene ing1 the system retrieves a number of genes withthe highest semantic similarity according to a specific ontology, such as the Gene Ontology,exploiting Wang similarity measure [32] and Schlicker one [31]. Similarity score is retrievedby a pre-calculated matrix, which provides an affinity measure for all couples of genes. Sincethe matrix creation is computationally intensive, a pre-filtering phase has been applied in orderto select couples of genes which present at least one common ontology term.
4.3 SNPs extraction
The whole system relies on considering and evaluating data and metadata concerning thebiomolecular building blocks. In order to obtain the SNPs associated to the enriched list ofinput genes, the system performs multiple SQL queries on the database. The output of this stepis the list of SNPs associated to the input genes, scored but unranked. Since genomic coordi-nates and thus the definitions of genes can change during assembly upgrades, we keep track ofhistorical data and users can specify the dbSNP release on which query the system.
Journal of Integrative Bioinformatics, 7(3):138, 2010 http://journal.imbio.de
doi:10.2390/biecoll-jib-2010-138 8

4.4 Score computation
The function exploited to obtain the final score associated to each SNP relying on a-prioriknowledge has been introduced in section 3.3. From the application point of view, the user canwidely interact with the system to perform this step. First of all the user can specify which fea-tures to adopt for SNPs scoring: actually he could be interested to consider some characteristicswhile neglecting others. The default condition is considering all the listed gene and gene prod-ucts features. Moreover, user can freely assign different weights to each feature, according tothe scientific challenge that has to be faced: in specific context some properties might be morevaluable than others. By default all features have a weight assigned by authors on the basis ofmost common genotyping studies. User can even interact with some thresholds considered inthe system. He can freely choose: whether applying the ontological expansion or not and whatsimilarity score threshold to consider; the minimum number of interactions valid to consider aprotein as a hub protein; whether to exploit a sum-based or a multiplication-based scoring func-tion, to provide respectively similar importance to all the chosen features in the computation ofthe SNPs score or to select just those SNPs that are significant in a specific biological context.
4.5 SNPs ranking and Filtering
Once all scores have been computed, the last step consists in ranking all SNPs relying on theirscore value. Due to the great amount of SNPs potentially reported as output, the user candecide to cut the list. In fact, before running the processing, user can select the percentilewhere he wants the result list to be cut. Available options are “Percentage” (followed by thecorresponding threshold) or “No filters”. Final results have to be written in a file and then usercan download file through the web link.
5 Results and Discussion
SNPRankeris available at the web linkhttp://www.itb.cnr.it/snpranker . The de-veloped system is aimed to support SNPs analysis, particularly interesting for helping SNPs/dis-ease association studies. The input of the system can be either a predefined list of genes,typically whose evidences have been found related to the same pathology, or a set of genesassociated to a particular biological process, as shown in Figure 2. The ontological expansionis an important tool for studying SNPs related to pathologies, since it allows to extend the anal-ysis to SNPs that could potentially be involved in a pathology onset but that have not beinghighlighted by more traditional approaches. In fact, this tool permits to increase the number ofSNPs in analysis even considering those belonging to genes that present similar semantic an-notations with the genes initially considered. For instance, in Table 1, we show the top rankedgenes showing the highest semantic similarity with the geneCCND1encoding for thecyclinD1, which controls the cell cycle process. The semantic similarity was calculated by meansof the Wang’s method [32] considering the Gene Ontology Biological Process. The methodsuccessfully identifies the genes annotated similarly to CCND1.
The setting of SNPs feature weights values has been thought as a support for population ge-netics studies. Actually, this property allows to assign different levels of importance to diversebiomolecular aspects. For instance, depending on the aim of the specific study, it is possible
Journal of Integrative Bioinformatics, 7(3):138, 2010 http://journal.imbio.de
doi:10.2390/biecoll-jib-2010-138 9

Figure2: Screenshot from the web site. Input gene list definition.
EGID EGSymbol semanticsimilarity score
894 CCND2 0.81896 CCND3 0.818941 CDK5R2 0.7256647 BCCIP 0.7228984 C13orf15 0.72
Table 1: Wang’s method [32] semantic similarity scores using the GO Biological Processes: thetop 5 ranked genes are listed.
to assign a high relevance to SNPs associated to hub proteins or SNPs occurring in regulatoryregions such as the 5’ near gene region. An overview of these possibilities is provided in Figure3. Finally, the retrieval of the scored SNPs ranked list is specifically aimed to support evaluationof genetic diseases.
Starting from the queried gene CCND1 and its semantically more similar genes (CCND2,CCND3, BCCIP, CDK5R, C13orf15) a list of ranked SNPs has been obtained exploiting thedeveloped core scoring function. The whole list includes more than 1500 SNPs characterizedby diverse features and thus assuming different degree of importance. Considering just geneswith a final score≥ 0.01 the list can be reduced to 499 genes. Part of the results obtained fromCCND1 gene is reported in Figure 4. At the top of the ranked list there are 4 SNPs belongingto CCND1 (which codes for an hub protein), and placed on functional protein domains. Infor-mation about essential genes in not exploited in the described example, since no genes fromthe input list (nor in the original version neither in the enriched one) are labeled as essential forlife. An interesting parameter is represented by DNA localization. Within this feature crucialinformation related to the position of the SNP on the DNA chain is included: different forms oflocalization can be considered and a weight can be provided to each of them, according to thespecific use case. In particular, referring to the considered example, while performing evalua-tions about DNA localization of listed SNPs it results that most of them are placed on intronicregions (around 60%) on DNA: this is obvious considering the high percentage of intronic re-gions on DNA strand compared to the esonic areas. According to the considered weight valuesSNPs present on introns are localized at lower positions within the ranked list, while at the
Journal of Integrative Bioinformatics, 7(3):138, 2010 http://journal.imbio.de
doi:10.2390/biecoll-jib-2010-138 10
Figure3: Screenshot from the web site. Features selection and weights values setting.
top of it many “frameshift” and “missense” are concentrated. The latter localization types areonly around the 3% of the whole set but SNPs in these positions obtained higher scores. De-scending the ranked list, SNPs occur that are localised in UTR regions and near the gene. The“unknown” value is important for covering other DNA regions.
6 Conclusions and Future works
The presented work concerns a system aimed at supporting SNPs based pathologies and bio-logical pathways studies, especially in the context of clinical genotyping chips single-diseaseoriented. It relies on the identification of a set of crucial features characterizing each SNP re-lated to a list of input genes. This represents the a-priori knowledge and allows to assign afinal score, that can be modulated by the user according to the considered scientific aspect, toeach SNP. A ranked list of SNPs is retrieved. The system can be exploited to identify the mostimportant SNPs in population genetics studies.Although SNPs scoring features have been carefully selected by performing an overview of allthe biomolecular available knowledge, the system still lacks a solid reference to disease directknowledge. The availability of even sparse data associating specific SNPs to defined patholo-gies can in fact be relevant for a more precise evaluation of SNPs importance in disease onset.Future developments of the presented system will consist in the identification and integrationof well established disease-oriented databases, such as OMIM [33] which contains manuallycurated data about clinical evidences of genes/pathologies correlations, and other sources ofnon-mendeliandiseases.
Journal of Integrative Bioinformatics, 7(3):138, 2010 http://journal.imbio.de
doi:10.2390/biecoll-jib-2010-138 11

Figure 4: Screenshot from the web site. Results page showing SNPs ranked list obtained fromCCND1 example, discussed in the text. SNPs are sorted by features score. Ontological expansionis performed with similarity threshold set to 0.7; chosen features weights are shown in Figure3.
Journal of Integrative Bioinformatics, 7(3):138, 2010 http://journal.imbio.de
doi:10.2390/biecoll-jib-2010-138 12

Ackno wledg ements
This work has been designed to solve a problem on the project Hypergenes. This work hasbeen supported by the Hypergenes European Network for Genetic-Epidemiological Studies(HEALTH-F4-2007-20150), NET2DRUG, EGEE-III, BBMRI, EDGE European projects andby the MIUR FIRB LITBIO (RBLA0332RH), ITALBIONET (RBPR05ZK2Z), BIOPOPGEN(RBIN064YAT), CNR-BIOINFORMATICS initiatives.
References
[1] Paul I W de Bakker, Roman Yelensky, Itsik Pe’er, Stacey B Gabriel, Mark J Daly,and David Altshuler. Efficiency and power in genetic association studies.Nat Genet,37(11):1217–1223, Nov 2005.
[2] David B Goldstein and Gianpiero L Cavalleri. Genomics: understanding human diversity.Nature, 437(7063):1241–1242, Oct 2005.
[3] Heping Zhang, Lei Liu, Xueqin Wang, and Jeffrey R Gruen. Guideline for data analysisof genomewide association studies.Cancer Genomics Proteomics, 4(1):27–34, 2007.
[4] P. C. Sham, S. S. Cherny, and S. Purcell. Application of genome-wide snp data for un-covering pairwise relationships and quantitative trait loci.Genetica, 136(2):237–243, Jun2009.
[5] William Paul Hanage and David Michael Aanensen. Methods for data analysis.MethodsMol Biol, 551:287–304, 2009.
[6] Gloria W C Tam, Richard Redon, Nigel P Carter, and Seth G N Grant. The role of dnacopy number variation in schizophrenia.Biol Psychiatry, 66(11):1005–1012, Dec 2009.
[7] Hemant K Tiwari, Jill Barnholtz-Sloan, Nathan Wineinger, Miguel A Padilla, Laura KVaughan, and David B Allison. Review and evaluation of methods correcting for popula-tion stratification with a focus on underlying statistical principles.Hum Hered, 66(2):67–86, 2008.
[8] David Altshuler, Mark J Daly, and Eric S Lander. Genetic mapping in human disease.Science, 322(5903):881–888, Nov 2008.
[9] Claire Infante-Rivard, Lucia Mirea, and Shelley B Bull. Combining case-control andcase-trio data from the same population in genetic association analyses: overview of ap-proaches and illustration with a candidate gene study.Am J Epidemiol, 170(5):657–664,Sep 2009.
[10] Peter J Taub and Emily Westheimer. Biostatistics.Plast Reconstr Surg, 124(2):200e–208e, Aug 2009.
[11] Jianlin Cheng and Pierre Baldi. A machine learning information retrieval approach toprotein fold recognition.Bioinformatics, 22(12):1456–1463, Jun 2006.
Journal of Integrative Bioinformatics, 7(3):138, 2010 http://journal.imbio.de
doi:10.2390/biecoll-jib-2010-138 13

[12] L. Hamel,N. Nahar, M. S. Poptsova, O. Zhaxybayeva, and J. P. Gogarten. Unsupervisedlearning in detection of gene transfer.J Biomed Biotechnol, 2008:472719, 2008.
[13] Zhang Fan, Li Xia, Krivosheev Ivan, Viktorovich, Gong Binsheng, Du Lei and Li Chun-quan. A Heuristic Approach for Target SNP Mining Based on Genome-Wide IBD Profile.ICNC ’07 ProceedingsIEEE Computer Society, 2007:227–232.
[14] Stein Aerts, Diether Lambrechts et al. Gene prioritization through genomic data fusion.Nat Biotechnol, 24(5):537–544, May 2006.
[15] Benson DA Bryant SH et al. Database resources of the national center for biotechnologyinformation.Nucleic Acids Res, 37(Database issue):D5–D15, 2009.
[16] UniProt Consortium. The universal protein resource (uniprot).Nucleic Acids Res,37(Database issue):D169–D174, 2009.
[17] http://www.ebi.ac.uk/interpro/
[18] Nakamura H Markley JL Berman H, Henrick K. The worldwide protein data bank (ww-pdb): ensuring a single, uniform archive of pdb data.Nucleic Acids Res, 35(Databaseissue):D301–D303, 2007.
[19] Kanehisa M Aoki-Kinoshita KF. Gene annotation and pathway mapping in kegg.MethodsMol Biol, 396:71–91, 2007.
[20] Gillespie M Caudy M et al. Reactome knowledgebase of human biological pathways andprocesses.Nucleic Acids Res, 37(Database issue):D619–D622, 2009.
[21] Chris Stark, Bobby-Joe Breitkreutz, Teresa Reguly, Lorrie Boucher, Ashton Breitkreutz,and Mike Tyers. Biogrid: a general repository for interaction datasets.Nucleic Acids Res,34(Database issue):D535–D539, Jan 2006.
[22] The Gene Ontology Consortium. The gene ontology’s reference genome project: a unifiedframework for functional annotation across species.PLoS Comput Biol, 5(7), 2009.
[23] Prasad, T. S. K. et al. Human Protein Reference Database - 2009 Update.Nucleic AcidsResearch, 37, D767-72, 2009.
[24] Aragues R, Sali A, Bonet J, Marti-Renom MA, Oliva B. Characterization of protein hubsby inferring interacting motifs from protein interactions.PLoS Comput Bio, 3: e178,2007.
[25] The International HapMap Consortium. A second generation human haplotype map ofover 3.1 million SNPs.Nature449, 851-861. 2007
[26] Nayanah Siva. 1000 genomes project.Nat Biotechnol, 26(3):256, Mar 2008.
[27] E. M. Smigielski, K. Sirotkin, M. Ward, and S. T. Sherry. dbsnp: a database of singlenucleotide polymorphisms.Nucleic Acids Res, 28(1):352–355, Jan 2000.
[28] Ren Zhang, Hong-Yu Ou, and Chun-Ting Zhang. Deg: a database of essential genes.Nucleic Acids Res, 32(Database issue):D271–D272, Jan 2004.
Journal of Integrative Bioinformatics, 7(3):138, 2010 http://journal.imbio.de
doi:10.2390/biecoll-jib-2010-138 14
[29] ResnikPhilip. Semanticsimilarity in a taxonomy: An Information-Based measure and itsapplication to problems of ambiguity in natural language.Journal of Artificial IntelligenceResearch, 11:95-130, 1999.
[30] Jay J. Jiang and David W. Conrath. Semantic similarity based on corpus statistics andlexical taxonomy.Proceedings of 10th Interna-tional Conference on Research In Compu-tational Linguistics, 1997.
[31] Andreas Schlicker, Francisco S Domingues, Jörg Rahnenführer, and ThomasLengauer. A new measure for functional similarity of gene products based on gene ontol-ogy. BMC Bioinformatics, 7:302, 2006.
[32] James Z Wang, Zhidian Du, Rapeeporn Payattakool, Philip S Yu, and Chin-Fu Chen. Anew method to measure the semantic similarity of go terms.Bioinformatics, 23(10):1274–1281, May 2007.
[33] A. Hamosh, A. F. Scott, J. Amberger, D. Valle, and V. A. McKusick. Online mendelianinheritance in man (omim).Hum Mutat, 15(1):57–61, 2000.
Journal of Integrative Bioinformatics, 7(3):138, 2010 http://journal.imbio.de
doi:10.2390/biecoll-jib-2010-138 15