
Target Sustainability Target Energy Business Guide
39
Target Sustainability Target Energy Business Guide
-
Upload
khangminh22 -
Category
Documents
-
view
2 -
download
0
Transcript of Target Sustainability Target Energy Business Guide
Target Sustainability
Target Energy
Business Guide

Updated February 2008 Target Sustainability - The Path to Sustainability Page 2 of 39
Table of Contents 1. Introduction ..................................................................................................4
2. Energy - An Overview...................................................................................4 2.1. International/National issues............................................................................................................4 2.2. Canterbury and Christchurch issues.................................................................................................5 2.3. Waste hierarchy ................................................................................................................................6
3. Energy Use - Office ......................................................................................7 3.1. Measuring office energy use .............................................................................................................8 3.1.1. Energy supply measurements............................................................................................................8 3.1.2. Lighting.............................................................................................................................................8 3.1.3. Office equipment ............................................................................................................................11 3.2. Opportunities for reducing office energy use..................................................................................12 3.2.1. Lighting...........................................................................................................................................12 3.2.2. HVAC (heating, ventilation and air conditioning) ..........................................................................12 3.2.3. Domestic hot water (DHW) ............................................................................................................13 3.2.4. Kitchens ..........................................................................................................................................13 3.2.5. Transport.........................................................................................................................................13 3.3. Energy ratings and labels ...............................................................................................................14 3.3.1. Energy Star .....................................................................................................................................14 3.3.2. Energy rating labels ........................................................................................................................14 3.4. Developing key performance indicators .........................................................................................15 3.4.1. Benchmark your performance.........................................................................................................15 3.5. Top tips – Office..............................................................................................................................16 3.5.1. Red flags (common waste areas).....................................................................................................16 3.5.2. Basics ..............................................................................................................................................16 3.5.3. Quick fixes ......................................................................................................................................16 3.5.4. Medium and long term....................................................................................................................16
4. Energy Use - Manufacturing ......................................................................17 4.1. Measuring and understanding energy use ......................................................................................17 4.1.1. Energy supply measurements..........................................................................................................18 4.2. Identifying energy improvement opportunities ...............................................................................20 4.2.1. Determine where energy is being used ...........................................................................................21 4.2.2. Identifying significant energy users ................................................................................................21 4.3. Developing key performance indicators .........................................................................................26 4.4. Top Tips – Manufacturing...............................................................................................................27 4.4.1. Red flags (common waste areas).....................................................................................................27 4.4.2. Basics ..............................................................................................................................................27 4.4.3. Quick fixes ......................................................................................................................................27 4.4.4. Medium and long term....................................................................................................................28
5. Expert advice ..............................................................................................28
6. Glossary......................................................................................................28
7. Target Sustainability Business Guide series............................................29

Updated February 2008 Target Sustainability - The Path to Sustainability Page 3 of 39
8. On-line Worksheets and Calculators ........................................................29 Lighting Option Comparison calculator .......................................................................................................34 Energy Waste from Refrigerated Door calculator ........................................................................................35 Heat Loss from a Heated Tank calculator ....................................................................................................37 Heat Loss from a Pipe calculator..................................................................................................................38 Compressor Air-Leak calculator...................................................................................................................39 © Christchurch City Council 2007. The material in this resource has been developed by or for the Christchurch City
Council. The Council allows you a limited licence to copy this material for your own personal use in development of a
sustainability plan for your organisation. It must not be copied for any other purpose or used for commercial gain
(such as by resale to third parties). Use of this resource is conditional on it being attributed to the Christchurch City
Council.

Updated February 2008 Target Energy Business Guide Page 4 of 39
1. Introduction The Target Sustainability Programme has been developed to help your business improve the efficiency of resource use and improve profitability.
The Target Energy Business Guide is one of a series of Target Sustainability Guides written to help your business use both natural and manufactured resources more efficiently. Other Guides in the series include The Target Waste Business Guide and The Target Water Business Guide and an implementation Guide called The Path to Sustainability Business Guide.
This Guide focuses on efficient use of our energy resources and provides suggestions to help improve efficiency in both the office and manufacturing environment.
This Guide will be more effective for your business if read in conjunction with The Path to Sustainability Business Guide which outlines the basics of how to go about implementing the kinds of changes necessary to make significant and lasting improvements.
2. Energy - An Overview Energy is essential to industry and our lifestyle. While the availability of energy has been seemingly unlimited for the greater part of our recent history, concerns regarding the security of the supply of electricity, the environmental impact of the combustion of fossil fuels and its increasing cost are forcing change upon us. An unchecked growth in energy demand has the potential to significantly impact our environment, as well as New Zealand’s international obligations under Kyoto and trade (e.g. air miles).
How well we use the energy resources available to us, as well as having potential global effects (on trade and climate change), also directly effects our immediate living environment.
The cost of energy is increasing relative to other costs and impacting the profitability of companies. Energy efficiency and conservation provides an excellent opportunity to increase that profitability.
These impacts not only include the direct impacts of what the energy is used for (i.e. fumes generated by combustion) but also the impacts that are caused by its generation or production (i.e. extraction of coal, construction of hydro-dams).
There is increasing media coverage on the contribution of energy sources toward global warming gases such as CO2 as well as ozone impacting gases such as nitrogen and sulphur oxides. Localised impacts such as particulates can significantly impact public health. This is a significant issue in Canterbury. Electricity generation also adds to these impacts - up to 20% of the electricity generated in New Zealand is generated using CO2 producing methods such as the combustion of coal.
2.1. International/National issues Internationally, the energy debate centres around our dependence on fossil based fuels and their contribution to global warming and air pollution. By taking initiatives now, gains can be made which will benefit both business and our local environment.
At a national level, the issues are similar. As the pressure on energy sources continues, then business will need to be more efficient in their use of energy, or be prepared to pay a premium as energy becomes a less available resource.
The Resource Management Act (1991) and it’s subsequent amendments outline specific requirements which require regions to take into account: the effects of climate change, the efficient use of energy from minerals and other sources of energy and to consider the benefits that are likely to be derived from the use of and development from renewable energy.

Updated February 2008 Target Energy Business Guide Page 5 of 39
The following table provides a breakdown of energy use by industry group in New Zealand.
Energy Use by Industry Group and Energy Type1 By reported units for Year ended March 2006
Energy type
Industry group Electricity (GWh)
Wood(1) (tonnes)
Natural gas (GJ)
Coal (tonnes)
Diesel (litres 000)
Fuel oil (litres 000)
LPG (litres 000)
Petrol (litres 000)
Food, beverage and tobacco 2,181,237 ..C ..C 540,230 70,255 14,093 47,014 9,568
Textile, clothing, footwear and leather 208,586 ..C 710,497 31,156 1,163 ..C 2,249 2,466
Wood and paper product 3,630,678 2,414,247 7,961,255 47,346 17,006 6,388 20,990 5,025
Printing, publishing and recorded media 141,114 0 19,922 395 951 0 1,798 5,283
Petroleum, coal, and chemical 954,260 0 5,996,204 ..C 6,501 59,859 7,637 4,811
Non-metallic mineral product 292,544 21,321 1,409,430 ..C 20,448 ..C 9,774 1,745 Metal product 6,904,012 0 3,967,865 488 13,290 20,352 6,276 7,937
Machinery and equipment 290,856 0 ..C ..C 6,589 ..C 1,565 11,005 Other manufacturing 55,431 ..C 60,770 0 1,913 ..C 390 2,857 Total manufacturing 14,658,719 2,437,855 29,196,886 816,048 138,115 119,648 97,694 50,698
(1) Includes wood waste
Note: Due to rounding the figures may not add to the stated totals.
Symbols: C confidential .. data not available
2.2. Canterbury and Christchurch issues Energy use in the Canterbury region and Christchurch is important, given the specific air pollution issues faced by the region. Christchurch City frequently exceeds the World Health Organisation guidelines for safe levels of particulate matter (for more information visit the Environment Canterbury website at www.ecan.govt.nz). The Ministry for the Environment has also put out Air Quality Standards that the region will have to meet. This will mean that there will be tighter controls for any energy consumption that leads to increased particulate matter. This includes such things as burning of coal, oil, diesel and wood.
In 2004, Environment Canterbury conducted a survey of both residential and industrial activities to identify the main types of energy uses. The survey results2 showed that:
• 70% of the total energy consumed in Canterbury is from fossil fuels (mainly oil and coal) • 63% of the total energy consumed is from oil • 25% of the total energy consumed is electricity • 55% of total energy consumed is in transport and this produces 78% of the regions CO2
emissions
1 Source: Statistics New Zealand www.statistics.govt.nz 2 Source: O’Connell, Mike 2005: Energy into the future for the Canterbury region Report No. U05/90 Environment Canterbury available www.ecan.govt.nz

Updated February 2008 Target Energy Business Guide Page 6 of 39
BEST
BETTER
GOOD
LAST
RESORT
Prevention
Reduction
Reuse
Recycle
Waste Recovery
Residue Disposal
2.3. Waste hierarchy The importance of preventing waste is a common theme of the Target Sustainability Programme, whether we are looking at water, energy or solid material resources. The waste hierarchy illustrated below clearly shows where we should start – can this waste be prevented from occurring at all?
It is important to keep this hierarchy in mind as you look at ways of improving the efficiency of how energy resources are used in your business.
Looking at energy efficiency, the reduction of energy consumption through a combination of efficient technology and efficient behaviour, the key focus within the hierarchy is on at source prevention and reduction as well as the recovery of energy (usually as heat) for further utilisation.
The waste management hierarchy

Updated February 2008 Target Energy Business Guide Page 7 of 39
3. Energy Use - Office The biggest energy consumers in offices are typically:
• Lighting • HVAC (heating, ventilation, and air conditioning) • Office equipment (computers, printers, photocopiers etc) • Domestic hot water (DHW) • Kitchen equipment
A typical energy split of an all electric building with heat pumps is shown below:
Generic Office Building - Electricity Split
HVAC27%
Computer/Office Equip29%
Lights32%
Kitchen Equip6%
DHW6%
We will discuss the categories shown above and discuss ways of how to reduce the energy consumption in these areas in the remainder of this section. Section 3.5 lists some useful tips for reducing energy consumption which can be used as a quick guide.
You should approach energy efficiency systematically, following the approach outlined in The Path to Sustainability Business Guide. The following table illustrates the link between the main sections of the office related portion of this Guide and The Path to Sustainability Business Guide.
Office energy use sections The Path to Sustainability Business Guide
3.1 Measuring office energy use 3.2 Opportunities for reducing office energy use 3.4 Developing key performance indicators
Step 3: Measure the baseline Step 4: Identify opportunities… Step 6: Monitor, review and report…
As you work through this section, please also incorporate the other Steps in The Path to Sustainability Business Guide not explicitly mentioned, especially Step 1, Commitment and Step 2, Planning and organisation.

Updated February 2008 Target Energy Business Guide Page 8 of 39
3.1. Measuring office energy use Understanding office energy use is an important step.
It is useful in the first instance to gain an understanding of the office’s total consumption, as this can be used as an indicator of progress in your energy reduction efforts, as well as a means of comparing your performance with other offices.
At a more detailed level, understanding what contribution individual energy end users are making to the total can help identify where to start making improvements.
3.1.1. Energy supply measurements Overall energy use can be identified by looking at the invoices for electricity and other energy sources. Use a table similar to below to help to identify and document these. (You can modify Worksheet 2, Section 8.6).
Energy Source Start Date
Finish Date Cost per Month ($) Quantity Used (units)
Electricity LPG (bottles) LPG (reticulated) Diesel Petrol Other Other In a shared or multi-tenanted building it may be difficult to get a figure for actual energy consumption. In such situations, measure energy use by looking at the individual items of equipment that are in use in the office, or consider installing check meters for each tenant/floor.
3.1.2. Lighting Construct a table similar to the following example to account for all the lighting in an office (or industrial setting):
Lighting Type Number of Items
Power Rating kW
Hours/day of Operation
Days/yr of Operation
Power Use (kWh/yr) =rating x hrs x days
Incandescent 20 0.1 8 240 3,840 kWh/yr Compact
fluorescent 15 0.023 24 365 3,022 kWh/yr
Tubular fluorescent 45 0.0583 16 240 10,022 kWh/yr
Halogen 4 0.05 3 240 144 kWh/yr
Security lights 2 0.15 16 365 1,752 kWh/yr
3 Older tubular fluorescents also have ballasts which consume approximately 10-20% extra in addition to the lamp rating (standard wound ballasts use approximately 20% and low loss wound ballasts use approximately 10%. Electronic ballasts use power which is typically offset by the increased efficiency of the lamp; so a 58W fluorescent tube with electronic ballast will use approximately 58W). The example for tubular fluorescents in the table above assumes electronic ballasts.

Updated February 2008 Target Energy Business Guide Page 9 of 39
3.1.2.1. Cost calculations The information which follows gives an indication of the costs incurred to operate an older style standard 58 watt fluorescent fitting (twin tube fitting). It is worked out on a cost of 18 cents per kilowatt hour. As stated above, ballast losses must be included unless the lamps use newer style electronic ballasts. A 58 watt fluorescent lamp with 12 watt standard ballast has a combined power consumption of 70W, as used in the calculations below:
• 24 hours per day for 7 days per week for 52 weeks will cost $220 /yr
(70x2 watts) x (24x7x52 hrs/yr) x ($0.18/kWh) ÷ (1,000 watts/kilo-watt)
• 10 hours per day for 5 days per week for 52 weeks will cost $66 /yr
(70x2 watts) x (10x5x52 hrs/yr) x ($0.18/kWh) ÷ (1,000 watts/kilo-watt)
• 5 hours per day for 5 days per week for 52 weeks will cost $33 /yr
(70x2 watts) x (5x5x52 hrs/yr) x ($0.18/kWh) ÷ (1,000 watts/kilo-watt)
• One standard twin 58 watt fluorescent fitting therefore costs 2.5 cents per hour to run (based on a cost of 18 cents per kWh).
(70x2 watts) x ($0.18/kWh) ÷ (1,000 watts/kilo-watt)
It is a common urban myth that fluorescent fittings should be left running as it is cheaper than turning them off and on. The pay-back period in terms of energy savings for a fluorescent light fitting is approximately ten seconds. What this means is that if you leave an office powered by a fluorescent light fitting for longer than ten seconds, you will save energy if you switch the light off for the duration you leave the office.
If your comings and goings are frequent however, a high number of on-off cycles will shorten lamp life, so a reasonable rule of thumb would be to turn off lights if you are away longer than 5 to 10 minutes.
3.1.2.2. Calculating the lighting density To calculate the amount of energy used by lighting per square metre in an office:
• Measure the area of the office • Count up the number of lights and their wattage (including ballast losses for tubular
fluorescents), as per the table above • Calculate the total wattage used and divide this by the area in square metres
For example, if an office has an area of 150 m2 and has 20 standard twin 58 watt fluorescent light fittings, then the calculation is: 2 x 20 x (58 + 12) watts = 2,800 watts.
The energy use per square metre is: 2,800 W / 150 m2 = 18.7 watts per m2.
As a general rule of thumb, anything more than 10 watts per m2 is an inefficient use of energy for lighting in an office type environment.
However, it is also important to balance energy efficiency and health and safety requirements. Conforming to the AS/NZ 1680 Standard will ensure that the levels of lighting are sufficient. This is important since insufficient lighting levels can contribute to:
• Loss in productivity • Eye strain • Worker fatigue • Increased accidents

Updated February 2008 Target Energy Business Guide Page 10 of 39
3.1.2.3. Measuring light levels
A light meter is a useful way to check your lighting levels. The picture illustrates a typical light meter. Typical meter readouts are in ‘lux’.
The following standard lighting levels are requirements from the AS/NZ 1680 Standard (available for purchase at www.standards.org.nz). Note that these light levels need to be maintained as the lamps near the end of their life.
Area Recommended lighting
levels (AS/NZ 1680)
(Lux) Fine work and inspection 600 Laboratories inspection and sorting 400 Office work 320 Filing and storage rooms 240 Storage routinely involving reading tasks and large scale assembly 160 Storage used frequently bulky items 80 Storage used infrequently bulky items 40 Passageways and toilet blocks 80
For more information about energy saving refer to the Energy Efficiency Conservation Authority technical guides available at www.eeca.govt.nz.
Updated February 2008 Target Energy Business Guide Page 11 of 39
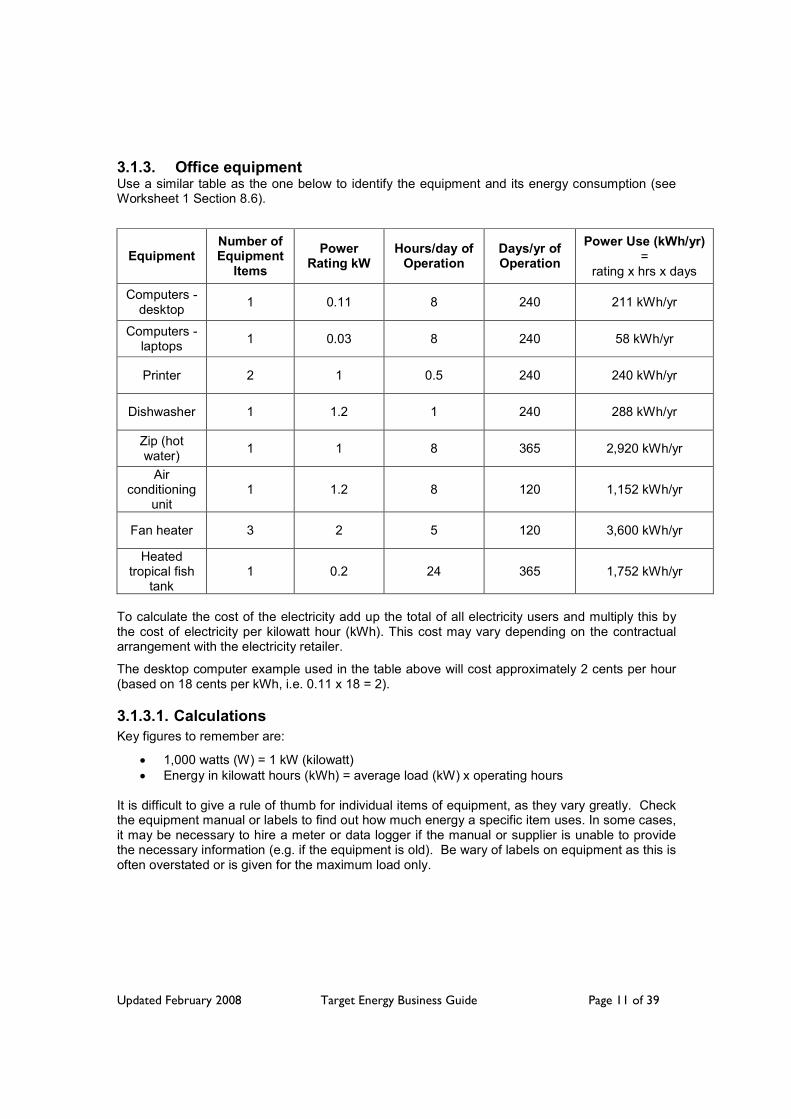
3.1.3. Office equipment Use a similar table as the one below to identify the equipment and its energy consumption (see Worksheet 1 Section 8.6).
Equipment Number of Equipment
Items
Power Rating kW
Hours/day of Operation
Days/yr of Operation
Power Use (kWh/yr) =
rating x hrs x days
Computers -desktop 1 0.11 8 240 211 kWh/yr
Computers -laptops 1 0.03 8 240 58 kWh/yr
Printer 2 1 0.5 240 240 kWh/yr
Dishwasher 1 1.2 1 240 288 kWh/yr
Zip (hot water) 1 1 8 365 2,920 kWh/yr
Air conditioning
unit 1 1.2 8 120 1,152 kWh/yr
Fan heater 3 2 5 120 3,600 kWh/yr
Heated tropical fish
tank 1 0.2 24 365 1,752 kWh/yr
To calculate the cost of the electricity add up the total of all electricity users and multiply this by the cost of electricity per kilowatt hour (kWh). This cost may vary depending on the contractual arrangement with the electricity retailer.
The desktop computer example used in the table above will cost approximately 2 cents per hour (based on 18 cents per kWh, i.e. 0.11 x 18 = 2).
3.1.3.1. Calculations Key figures to remember are:
• 1,000 watts (W) = 1 kW (kilowatt) • Energy in kilowatt hours (kWh) = average load (kW) x operating hours
It is difficult to give a rule of thumb for individual items of equipment, as they vary greatly. Check the equipment manual or labels to find out how much energy a specific item uses. In some cases, it may be necessary to hire a meter or data logger if the manual or supplier is unable to provide the necessary information (e.g. if the equipment is old). Be wary of labels on equipment as this is often overstated or is given for the maximum load only.

Updated February 2008 Target Energy Business Guide Page 12 of 39
The table below provides examples of energy usage for office equipment.
Equipment Energy use when in use Energy in stand by mode Laptop 15 – 30 watts 5 watts
Computer and monitor 90 – 150 watts 10 watts (monitor off) Energy star rated monitors 20 watts (LCD) nil
Photocopiers 1,400 –1,600 watts 40 – 70 watts Microwave oven 200 – 900 watts n/a
Dishwasher 1200 watts n/a Ovens 900 – 1500 watts n/a
A word of caution It may be necessary to determine how often equipment is being used at full capacity compared to stand-by mode. Often the only way to determine exactly how much energy is being used by an item of equipment is to use a watt meter and a data logger. An electrician may be required to perform this task.
3.2. Opportunities for reducing office energy use 3.2.1. Lighting Lighting uses approximately $3 to $10 per square metre of floor space per year. It has been found that most offices can save approximately 40% on lighting by making effective changes. Ideas for minimising lighting costs and increasing efficiency include:
• Turning off lights when they are not needed, check that infrequently used areas are not lit continuously
• Replacing fluorescent tubes that need replacing (as they dull off over time). This can save energy as staff are less likely to use additional lighting to supplement the lower light levels.
• Use a light meter and look for areas that are under lit (a safety concern) or over lit (energy wasting)
• Cleaning or improving reflectors or removing diffusers (diffusers are plastic covers used to scatter light and were mostly installed to remove glare on CRT computer monitors which is not an issue with newer flat screens and LCD displays)
• Carrying out re-tubing all at the same time rather than selective re-tubing (bulk re-tubing) • Using technology such as motion sensors, lux (daylight) sensors, dimmers, timers and
sectional controlled lighting • Check that maximum use is made of natural lighting • Check that lighting and lamps are of an energy efficient type • Efficient night lights (or on motion sensors) • Do not over-light night areas
3.2.2. HVAC (heating, ventilation and air conditioning) Air conditioning and heating is an area that is quite often forgotten and left to its own means within an office environment. Simple gains can be made by:
• Ensuring time clocks are programmed to switch off when the office is not occupied (e.g. overnight, lunch breaks etc). Note that time clocks are often not reset when we switch to and from daylight savings.

Updated February 2008 Target Energy Business Guide Page 13 of 39
• If timeclocks are used to control HVAC equipment, trial setting the morning start-up time as close as possible to the time the building is first occupied. Often timeclocks are set to come earlier than required.
• Ensuring that air conditioning and heating is switched off when external temperatures are such that opening a window would be more effective.
• Ensure that the control of the air conditioning or heating system is assigned to one person and that staff agree on the temperature required.
• Ensure that the cooling (air conditioning) and heating (heaters, heat pumps) do not fight each other by operating at the same time.
3.2.3. Domestic hot water (DHW) Simple ways to minimise energy use with amenities include:
• Set the domestic hot water temperature to 60°C • Ensure you are using tempered water systems. Tempered water systems mix in cold
water near the hot water source so losses of heat in the pipe work are minimised. This also means you are putting less cold water into your heating water unit
• Investigate using instant water heaters rather than hot water cylinders • Investigate solar water heating or night rate water heating opportunities
3.2.4. Kitchens Simple ways to minimise energy use in the kitchen include:
• Use the microwave to heat food rather than an oven • Fix dripping hot water taps quickly • Only use the dishwasher when it is full • Use a jug rather than using large wall mounted water heaters or zips
3.2.5. Transport Transport accounts for 55% of total energy consumption in the Canterbury region. It is important to look at the use of transport in an organisation including transport that is outsourced such as couriers, freight and company vehicles.
Simple ways of minimising energy use in relation to transport include:
• Ensure trips are well planned - combining trips and ensuring that deliveries are planned to minimise mileage
• Schedule regular servicing of vehicles and ensure engines are well tuned • Check that high mileage vehicles are run on CNG, LPG or are high efficiency diesels • Ensure that freight is transported by rail or coastal shipping wherever possible • Reward staff for good practice • Minimising the use of air conditioning systems in vehicles - they increase fuel
consumption (up to 10% more fuel) • Avoiding short trips (up to 20% more fuel is used when a car is first started until it is
warm) • Driving smoothly and avoid over revving the engine (this will also mean your vehicle lasts
longer) • Avoiding idling • Encourage alternative transport for staff by providing carpooling spaces, bike racks,
showers and changing rooms and bus timetables • Using public transport • Using teleconferencing and videoconferencing • Consider purchasing hybrid or alternative fuel vehicles

Updated February 2008 Target Energy Business Guide Page 14 of 39
3.3. Energy ratings and labels 3.3.1. Energy Star Energy rating and labelling schemes are a useful tool to help people understand the energy consumption of appliances. They also act as a guide when purchasing new appliances.
Energy Star is a global mark of energy efficiency and indicates the most energy efficient products. It is promoted in New Zealand by the Energy Efficiency and Conservation Authority (EECA) and is already recognised and trusted in the US, Canada, Europe, Australia and Asia.
In New Zealand, the brand is used to indicate equipment that has been tested and awarded the Energy Star mark. This includes
computer and office equipment. Ideally equipment used and purchased for offices should be Energy Star rated.
For more information on energy efficient appliances visit the Energy Star website at http://www.energystar.govt.nz/index.aspx .
3.3.2. Energy rating labels
Energy rating labels are another tool designed to help when making a choice about buying new appliances. The labels help purchasers to work out how much energy an appliance will consume, and to compare the energy efficiency of different models. The labels use a six star rating with one star being the most inefficient and six stars the most efficient.
This label shows an appliance with a 4.5 star rating. Each extra star means an extra 10 per cent or more saving in running costs. Many top model appliances have four or more stars.
Some appliances have more than one ‘band’ of stars. Air conditioners have blue for cooling and red for heating performance. Washing machines and dishwashers have red for warm washes and blue for cold washes.
When comparing models for energy efficiency make sure that they are similar in capacity and features.
Updated February 2008 Target Energy Business Guide Page 15 of 39
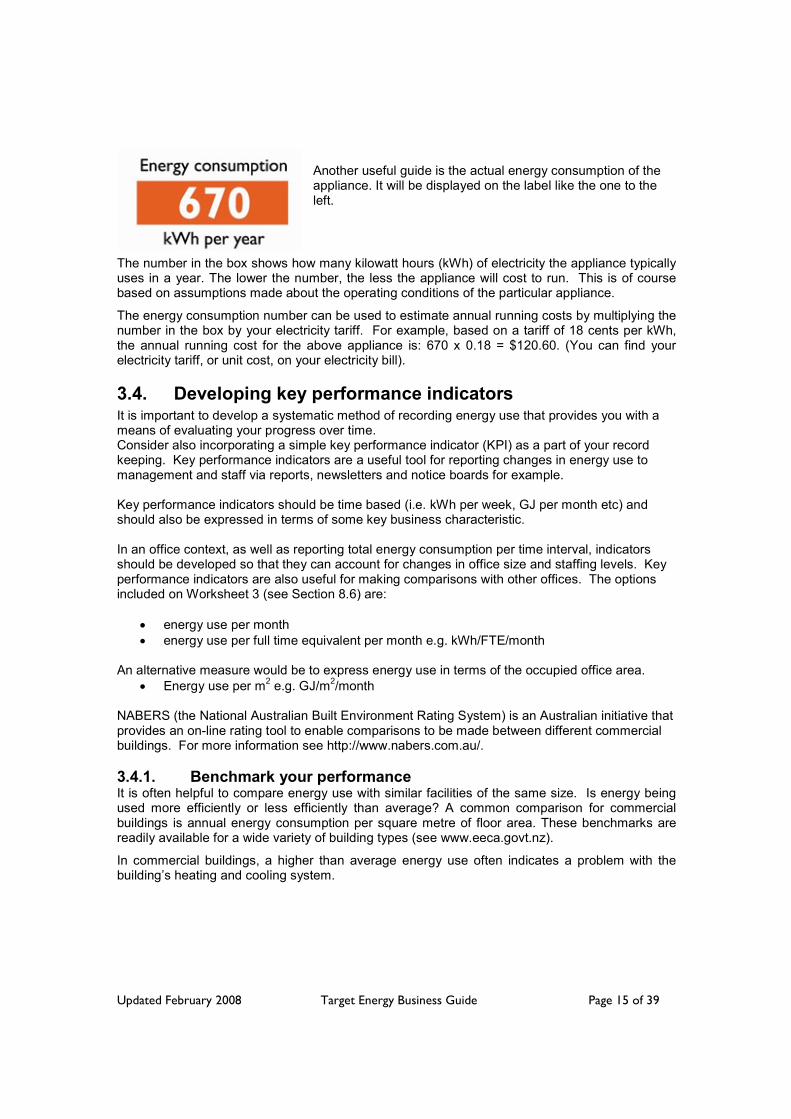
Another useful guide is the actual energy consumption of the appliance. It will be displayed on the label like the one to the left.
The number in the box shows how many kilowatt hours (kWh) of electricity the appliance typically uses in a year. The lower the number, the less the appliance will cost to run. This is of course based on assumptions made about the operating conditions of the particular appliance.
The energy consumption number can be used to estimate annual running costs by multiplying the number in the box by your electricity tariff. For example, based on a tariff of 18 cents per kWh, the annual running cost for the above appliance is: 670 x 0.18 = $120.60. (You can find your electricity tariff, or unit cost, on your electricity bill).
3.4. Developing key performance indicators It is important to develop a systematic method of recording energy use that provides you with a means of evaluating your progress over time. Consider also incorporating a simple key performance indicator (KPI) as a part of your record keeping. Key performance indicators are a useful tool for reporting changes in energy use to management and staff via reports, newsletters and notice boards for example. Key performance indicators should be time based (i.e. kWh per week, GJ per month etc) and should also be expressed in terms of some key business characteristic. In an office context, as well as reporting total energy consumption per time interval, indicators should be developed so that they can account for changes in office size and staffing levels. Key performance indicators are also useful for making comparisons with other offices. The options included on Worksheet 3 (see Section 8.6) are:
• energy use per month • energy use per full time equivalent per month e.g. kWh/FTE/month
An alternative measure would be to express energy use in terms of the occupied office area.
• Energy use per m2 e.g. GJ/m2/month NABERS (the National Australian Built Environment Rating System) is an Australian initiative that provides an on-line rating tool to enable comparisons to be made between different commercial buildings. For more information see http://www.nabers.com.au/. 3.4.1. Benchmark your performance It is often helpful to compare energy use with similar facilities of the same size. Is energy being used more efficiently or less efficiently than average? A common comparison for commercial buildings is annual energy consumption per square metre of floor area. These benchmarks are readily available for a wide variety of building types (see www.eeca.govt.nz).
In commercial buildings, a higher than average energy use often indicates a problem with the building’s heating and cooling system.
Updated February 2008 Target Energy Business Guide Page 16 of 39
3.5. Top tips – Office 3.5.1. Red flags (common waste areas)
• Lights on at night or when the business is shut down (i.e. public holidays) • Lights left on in storage areas • Computers and photocopiers left on after hours • Unexplained changes in the energy bill • Excessive energy use during holiday periods • Heating and/or air conditioning is on all the time (including time clocks set incorrectly)
The following outlines some useful tips for reducing energy consumption in office buildings: 3.5.2. Basics
• Know how much energy you are using through monitoring and measurements • Educate staff on energy efficiency and conservation techniques • Install signage and reminders for staff
3.5.3. Quick fixes • Ensure lighting and equipment is switched off when not in use • Switch off your computer and screen when not in use and activate E-Star (built into
Windows operating system) • Ensure doors and windows are closed in the winter (except where needed for ventilation) • Make a list of the equipment that can be switched off at night and circulate around the
office • Use energy efficient compact fluorescent lighting (these use only approximately 20% of
the energy of conventional bulbs) • Use natural light where possible • Encourage staff to dress appropriately for the time of year
3.5.4. Medium and long term • Install motion sensors for areas not used often • Install lux (daylight) sensors for outdoor lighting and in areas that have adequate natural
light • Install a thermostat to maintain temperature and switch air conditioning off when offices
are unoccupied • Use night rate power including night store hot water heaters • Purchase energy efficient appliances • Install a control switch to enable you to turn off all lighting when you leave • Install control switches in individual departments so individual areas can be lit while in
use rather than lighting the whole floor • Reduce excessive lighting levels by removing unnecessary lighting • Use area specific heating and don’t heat unoccupied areas

Updated February 2008 Target Energy Business Guide Page 17 of 39
4. Energy Use - Manufacturing The biggest energy users in manufacturing are typically:
• Process heating • Electric motors • Air compressors • Steam • Hot water • Refrigeration • Lighting • Transport
The proportions of energy consumed by each of the categories above in a manufacturing plant are specific to each application.
We will discuss the categories shown above in the remainder of this section and discuss ways of how to reduce the energy consumption in these areas.
Section 4.4 lists some useful tips for reducing energy consumption which can be used as a quick guide.
You should approach energy efficiency systematically, following the approach outlined in The Path to Sustainability Business Guide. The following table illustrates the link between the main sections of the manufacturing related portion of this Guide and The Path to Sustainability Business Guide.
Office manufacturing energy use sections The Path to Sustainability Business Guide
4.1 Measuring and understanding energy use 4.2 Identifying opportunities for reducing energy use in
manufacturing 4.4 Developing key performance indicators
Step 3: Measure the baseline Step 4: Identify opportunities… Step 6: Monitor, review and report…
As you work through this section, please also incorporate the other Steps in The Path to Sustainability Business Guide not explicitly mentioned, especially Step 1, Commitment and Step 2, Planning and organisation.
4.1. Measuring and understanding energy use "When you can measure what you are speaking about, and express it in numbers, you know something about it; but when you cannot measure it, when you cannot express it in numbers, your knowledge is of a meagre and unsatisfactory kind"4 .
The successful management of any business is dependent on a good understanding of what is actually happening so that the opportunities for changes and improvements can be identified, implemented and ultimately verified. The same is true for managing energy use. Energy management is built on the fact that “you cannot manage what you do not measure” – if you do not know what is being used where and why, you are not in control of what is being used and what you are spending.
4 (Lord Kelvin, PLA, Vol. 1, "Electrical Units of Measurement", 1883-05-03)
Updated February 2008 Target Energy Business Guide Page 18 of 39
4.1.1. Energy supply measurements Measurement is important because it helps to:
• Give an understanding of existing inefficiencies • Prioritise where to start making changes • Establish a baseline performance against which improvement can be compared • Demonstrate success to gain further support from management
Measurement should be appropriate; being too complex and comprehensive is exhausting and often unnecessary.
The frequency of measurement is also important:
• Snapshot for steady processes • Repeated over time to pick up trends and variation
• Consider using an energy meter The level of accuracy required influences the type of measuring equipment used. For example, where a business has a small value project looking at replacing one motor with a more efficient one, then the level of testing will be quite low. By comparison a multi-department review of motor systems and drives will require more complex monitoring, utilising data loggers and measurement equipment, to verify energy use and potential gains.
The outline that follows describes a basic method of measuring high level energy use and includes suggestions on how this data could be used.
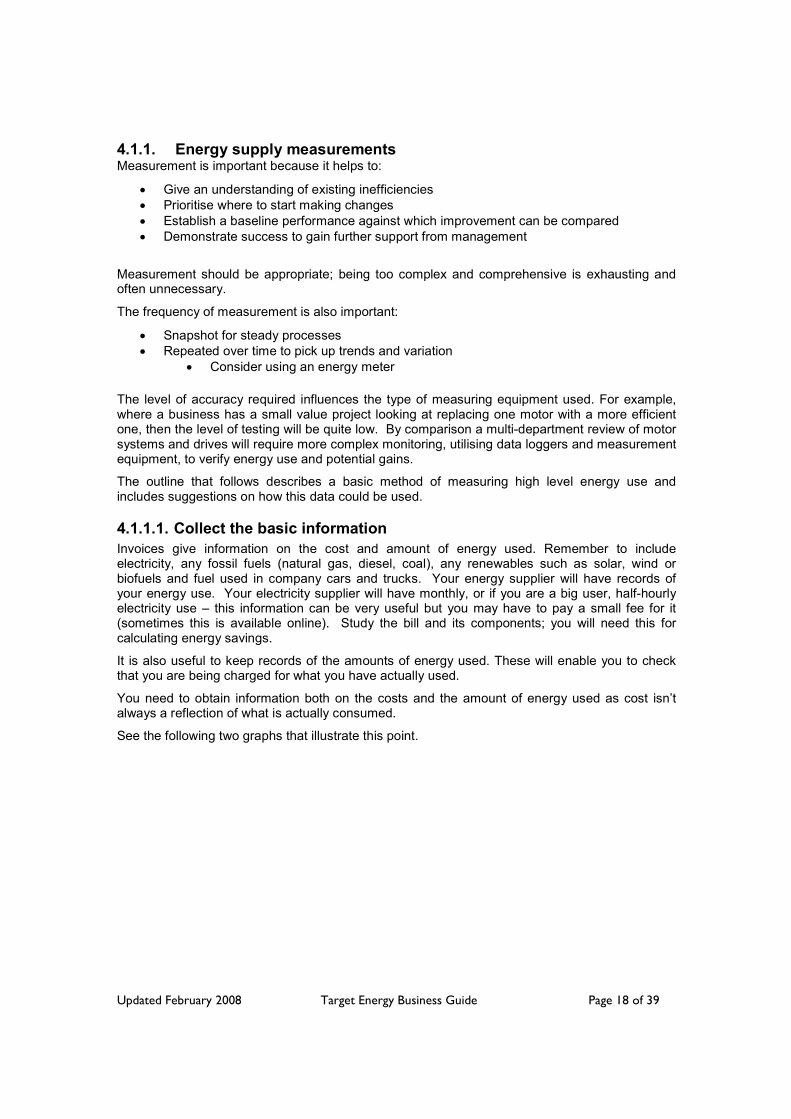
4.1.1.1. Collect the basic information Invoices give information on the cost and amount of energy used. Remember to include electricity, any fossil fuels (natural gas, diesel, coal), any renewables such as solar, wind or biofuels and fuel used in company cars and trucks. Your energy supplier will have records of your energy use. Your electricity supplier will have monthly, or if you are a big user, half-hourly electricity use – this information can be very useful but you may have to pay a small fee for it (sometimes this is available online). Study the bill and its components; you will need this for calculating energy savings.
It is also useful to keep records of the amounts of energy used. These will enable you to check that you are being charged for what you have actually used.
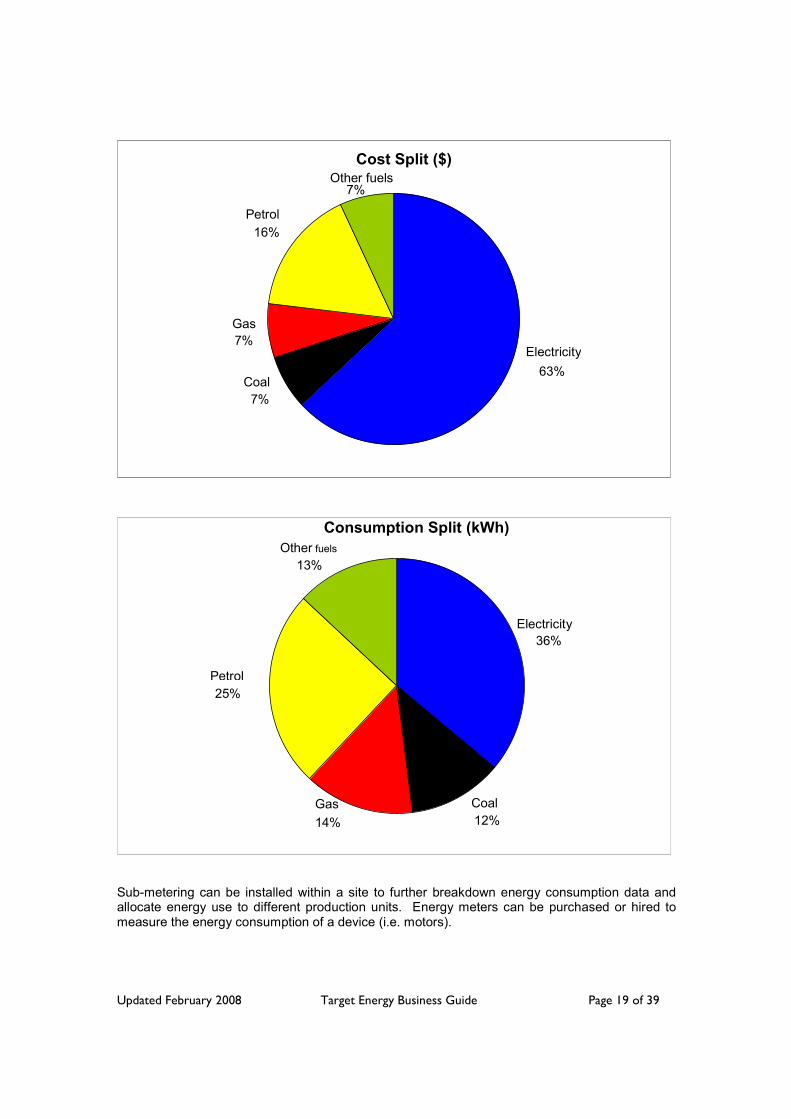
You need to obtain information both on the costs and the amount of energy used as cost isn’t always a reflection of what is actually consumed.
See the following two graphs that illustrate this point.
Updated February 2008 Target Energy Business Guide Page 19 of 39
Cost Split ($)
Electricity 63%
Coal 7%
Gas7%
Petrol 16%
Other fuels7%
Sub-metering can be installed within a site to further breakdown energy consumption data and allocate energy use to different production units. Energy meters can be purchased or hired to measure the energy consumption of a device (i.e. motors).
14%
Consumption Split (kWh)
Electricity 36%
Coal12%
Gas
Petrol25%
Other fuels 13%

Updated February 2008 Target Energy Business Guide Page 20 of 39
4.1.1.2. Look for seasonal and daily patterns The starting point to gaining an understanding of energy use is looking for patterns i.e. annual, weekly, daily use and then working out what the patterns mean.
Start by collecting the energy bills for the last year and graphing the amount used each month for each of the energy sources. Look at the pattern of peaks and troughs. Look at seasonality and changes in production to assist in understanding what the patterns mean - are the highest peaks in winter (reflecting additional heating) or in summer (when seasonal produce is being processed or air conditioning is in use)?
The following graphs show two examples of how this could be graphed to aid further analysis.
Monthly Energy Consumption (kWh)
0
20,000
40,000
60,000
80,000
100,000
120,000
140,000
Jan Feb Mar Apr May Jun Jul Aug Sep Oct Nov DecMonth
kWh
24 Hour Electrical Load
0
50
100
150
200
250
1 3 5 7 9 11 13 15 17 19 21 23
Hours
kVA
4.2. Identifying energy improvement opportunities The big picture of energy use helps provide an indication of the scope for energy efficiency improvements. The next stage is identifying where in the process these opportunities exist.
Updated February 2008 Target Energy Business Guide Page 21 of 39
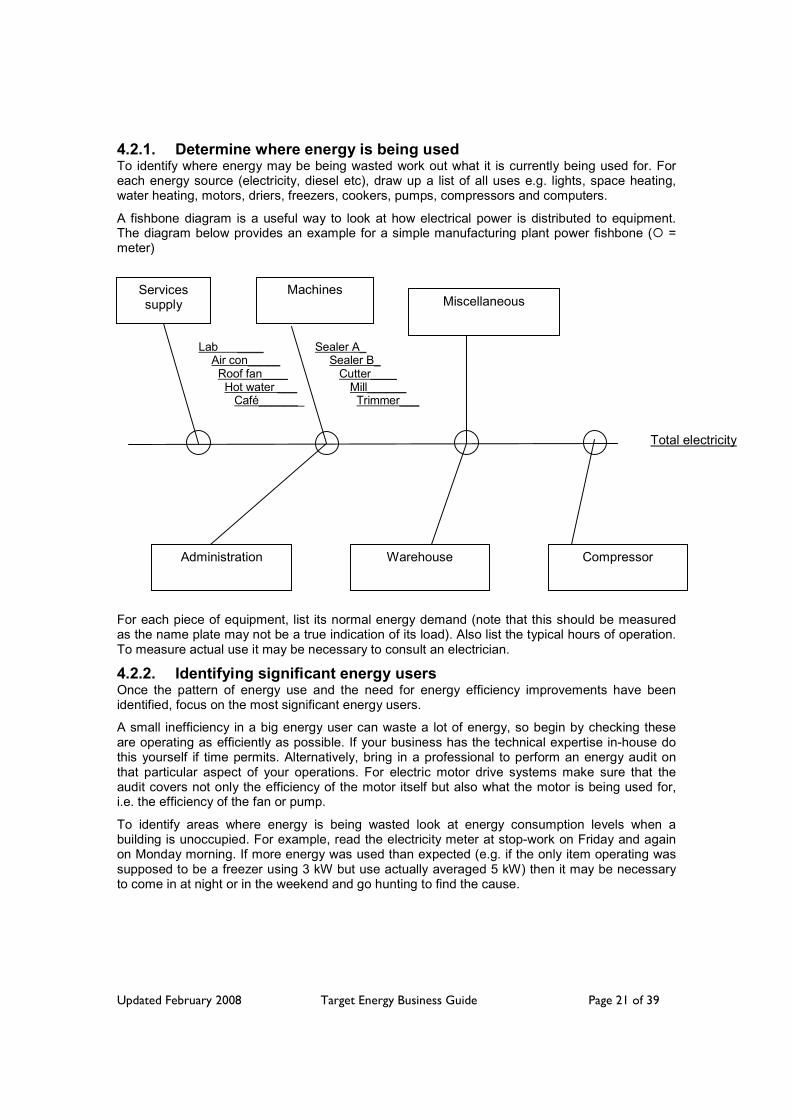
4.2.1. Determine where energy is being used To identify where energy may be being wasted work out what it is currently being used for. For each energy source (electricity, diesel etc), draw up a list of all uses e.g. lights, space heating, water heating, motors, driers, freezers, cookers, pumps, compressors and computers.
A fishbone diagram is a useful way to look at how electrical power is distributed to equipment. The diagram below provides an example for a simple manufacturing plant power fishbone ( = meter)
Lab ____ Sealer A_ Air con_____ Sealer B_ Roof fan____ Cutter____ Hot water ___ Mill______ Café_______ Trimmer___
For each piece of equipment, list its normal energy demand (note that this should be measured as the name plate may not be a true indication of its load). Also list the typical hours of operation. To measure actual use it may be necessary to consult an electrician.
4.2.2. Identifying significant energy users Once the pattern of energy use and the need for energy efficiency improvements have been identified, focus on the most significant energy users.
A small inefficiency in a big energy user can waste a lot of energy, so begin by checking these are operating as efficiently as possible. If your business has the technical expertise in-house do this yourself if time permits. Alternatively, bring in a professional to perform an energy audit on that particular aspect of your operations. For electric motor drive systems make sure that the audit covers not only the efficiency of the motor itself but also what the motor is being used for, i.e. the efficiency of the fan or pump.
To identify areas where energy is being wasted look at energy consumption levels when a building is unoccupied. For example, read the electricity meter at stop-work on Friday and again on Monday morning. If more energy was used than expected (e.g. if the only item operating was supposed to be a freezer using 3 kW but use actually averaged 5 kW) then it may be necessary to come in at night or in the weekend and go hunting to find the cause.
Services supply
Administration
Machines
Warehouse
Miscellaneous
Compressor
Total electricity

Updated February 2008 Target Energy Business Guide Page 22 of 39
The following generalised points may help you to find areas requiring attention. More specific tips are included in the sections that follow.
• Focus on the bigger loads (5kW or more) such as compressors, boilers, large pumps, motors, heating and cooling equipment
• Look and listen - for equipment and lights left on, dripping taps, for air and steam leaks etc
• Check that motors which run for long hours are high efficiency models (new motors must now meet a minimum energy performance standard)
• Focus on the smaller loads that no-one notices but which are operating for long hours (e.g. lights, computers)
• Check pipes are lagged • Systems fighting each other, such as unnecessary simultaneous heating and cooling in a
process (e.g. air conditioners working to cool a bakery when the ovens are open to the room and heating the air)
• Use of high grade energy for low grade work e.g. use of steam or electricity to heat water when you could use waste heat, or use of high pressure compressed air to aerate a fluid when a fan would do
• Doors left open between heated and unheated areas or cooled and uncooled areas • Broken or cracked windows, cladding or badly sealed doors • Dirty lamps, fittings, filters or heat exchange surfaces • Dirty heating and cooling coils (blast clean with compressed air 2 to 4 times per year)
4.2.2.1. Process Heat It is important to understand where heat is being wasted in your business. The loss of heat means some of the money spent raising the temperature of the water or product has been wasted. Even if the product then needs to be cooled improvement opportunities exist by utilising this excess heat for other purposes.
The following outlines some useful tips for identifying opportunities for reducing process heat waste:
• Track energy consumption and cost on at least a monthly basis (preferably weekly) • Compare energy consumption against production output over the same period • Identify areas where heat is escaping • Ensure all pipes that contain heated materials are lagged • Look for areas where heating and cooling exist in the same area (double potential) • Look for high grade heat (liquids or heat above 40ºC). High grade heat offers very good
opportunities for heat recovery • Look for low grade heat (liquids or heat below 40ºC). Even low grade heat offers
opportunities for heat recovery • Heat loss from tanks and pipe work can be assessed using a digital infra-red
thermometer (particularly useful for difficult to reach locations) • A digital insertion thermometer is useful for measuring both ambient and liquid
temperatures • Tanks contents – Check to see that you are only heating the tank contents to the required
temperature • Ambient temperature outside refrigeration door - Ensure that refrigerator doors are
sealed and that the doors are closed quickly after opening to keep cool air in and warm air out of the refrigeration unit

Updated February 2008 Target Energy Business Guide Page 23 of 39
4.2.2.2. Electric motors The energy supplied to electric motors accounts for 70% to 80% of the electricity consumed by New Zealand manufacturing industries (source: EECA). Electric motors are the prime-mover for a wide range of functions, including fans, pumps, conveyors, refrigeration and air compressors.
Motor run time of selected motors (e.g. driving a key fan or pump etc) can be monitored by requesting an electrician to install a simple run-time meter. There are two main methods for estimating the power drawn by a motor:
• A tong meter (clip-on Current Tester) can be used to measure the drawn amps by a motor and the load calculated using the 3-phase motor load equation below). The power can be obtained from your electricity supplier.
• Using equipment nameplate kW data. In the absence of drawn amps, the nameplate kW is multiplied by an estimate of the % loading. While electric motors have been designed to operate most efficiently at 100% load, the average motor is probably operating closer to 60% (and many less than 50%).
Some useful electrical relationships for use in motor calculations:
• Energy (kWh) = Load (kW) x Operating hours • Single phase motor load (kW) = (Volts x Amps x Power factor)/1000 • 3-phase motor load (kW) = (Volts x Amps x √3 x Power factor)/1000 • Load (kW) = kVA x Power factor • kVA = Volts x Amps (x √3 for 3-phase motors)
Note √3 = square root of 3. Where there is equipment with inductive loads, such as motors and fluorescent lamp ballasts, have an electrician check that the power factor is 0.95 or greater. If the power factor is lower than 0.95 the business could be charged for high kVA demands and for more power than it is actually getting work out of.
Poor power factor can be expensive because the lower the power factor the more you are paying. Seek expert advice if your power factor is consistently below 0.95 as it may be cost effective for you to install power factor correction equipment.
If you have any questions about power factor correction visit www.eeca.govt.nz or consult an electrician.
Business tips and guidelines for electric motor selection, replacement and maintenance • The energy consumed by an electric motor in its lifetime can cost up to 100 times more
than the initial purchase price • Rewinding a failed motor reduces its efficiency (a poor quality rewind can reduce a
motors electrical efficiency by 3%). In many applications it is more cost effective to replace the failed motor with a new MEPS 2006 compliant motor.
• New motors in New Zealand must meet a minimum energy performance standard (MEPS) see www.energyrating.gov.au
• Motors operate most efficiently when operating between 50% and 100% of their design load (fit for purpose is the key)
• Correct commissioning and good maintenance practices reduce downtime and maintain efficiency
• Correct alignment, lubrication and voltage are necessary to maintain an efficient motor system
Updated February 2008 Target Energy Business Guide Page 24 of 39
Develop a site motor replacement policy that ensures the financial and energy benefits of improved efficiency are achieved • The up-front cost saving of rewinding a failed motor compared to purchasing a new motor
can quickly dissipate through the additional energy costs incurred from using a less efficient motor. In many cases, the payback from purchasing a new MEPS motor can be less than two years.
• Motor replacement is more manageable if it is implemented using a site-wide policy. A site-wide policy takes account of purchase, rewind and energy costs as well as operating hours and eliminates the need for time consuming motor-by-motor analysis.
• Where possible, downsize motors that are less than 7.5 kW and consistently operate below 50% of their design load. Such motors are not running at maximum efficiency and as such a smaller motor running at its best efficiency will mean that the power use for the same drive output is achieved.
• It can be misleading to make a blanket statement regarding downsizing because the higher efficiency of larger motors means there is not always a significant benefit in downsizing. Each case should be assessed on its merits.
Develop a motor inventory so you can track the replacement, failure and maintenance history of individual motors • Maintaining a motor inventory is an important step in motor management. Many
businesses maintain a store of used motors, many of which have previously failed and been repaired. Although it can seem like an easy solution to grab an old motor from the store, the costs to the business in terms of higher energy costs and reduced reliability can be very high.
Note: Three phase induction motors tend to reduce power factor, requiring the addition of power factor correction equipment to ensure you are only paying for the power you are using. Contact your electrician if you need help.
4.2.2.3. Air compressors Air compressors are present on almost every industrial site and are estimated to account for as much as 10% of the electricity consumed by industry. They are often a neglected plant item and their low efficiency (as little as 10% of the electrical energy supplied is available as useful air energy) is eroded even further by leaking reticulation networks and poor maintenance.
Basic advice • Although air is free, compressed air is an expensive utility • Air leaks represent over half the achievable energy and cost savings for air compressor
systems • Many air compressor systems have leakage rates between 10% and 30% of the
compressed air consumed • Air wands (long nozzles used to blow material around like a broom) are very expensive
brooms! • Regularly measure and repair air leaks. Setting a target of reducing air leaks to less than
5% of the compressed air system capacity is a realistic goal.
Updated February 2008 Target Energy Business Guide Page 25 of 39
Improvement options • Check pipes, joints, flexible hoses, couplings and valves for leaks • Check condensate traps for leaks • Have an annual ultrasonic test conducted to find leaks • Eliminate wasteful end-use applications of compressed air, especially where more
efficient alternatives exist • Eliminate (or at least minimise) the use of air wands for cleaning • Replace air driven tools and motors with electric motor driven equipment wherever
practical • Do not use compressed air for drying – a lower pressure centrifugal fan is far more
efficient • Check the intake temperature of the air compressor. If it is hot then efficiencies will be
gained by dropping the temperature. When assessing the demand for a compressed air system upgrade ensure the assessment is based on a low leak system. Many businesses have additional compressor capacity installed simply to service system leaks!
Compressed air capacity can be worked out by service providers as can the amount of leaks a system is servicing. (Contact your compressor service provider to assess your system).
Useful rules • Position the compressor air inlet on the outside of a shaded external wall to ensure a cool
ambient air supply. Every 3ºC reduction in the inlet temperature improves the air compressor efficiency by about 1%. This is because air density is greater at lower temperatures so the compressor doesn’t need to work as hard to compress the air
• Do not position an air inlet inside the hot compressor room • Do not set the system pressure higher than necessary. The highest pressure end-use
application usually determines the compressor discharge pressure. If it is a low volume, high pressure application, consider installing a dedicated compressor
• Eliminating causes of pressure loss (such as leaks and use of air wands) is a more efficient method of managing the air supply than raising the system pressure to compensate
• Check that the system pressure loss is below 10% of the system‘s discharge pressure (Contact your service provider to check this)
• Where there is significant variation in compressed air demand consider using a variable speed compressor. When a compressor is idling it still uses a significant (around 35%) load
4.2.2.4. Steam Steam system savings have very good short-term payback. This is because in order to generate the steam, money has already been spent on
• Treating the water • Delivering the water (pipe-work and insulation) • Heating the water and converting into steam
Examples of efficiencies in steam systems • If a 15mm steam trap continuously leaks steam, then it loses approximately 40 kg/hr of
water. Over a year this will cost approximately $2,350 per year (based on 10 bar
Updated February 2008 Target Energy Business Guide Page 26 of 39
pressure differential across the trap, operating 40 hrs per week, 75% boiler efficiency and $10 per GJ for fuel).
• A steam leak that has a visible plume of 1.0 metre high costs approximately $950 per year (based on 7 bar pressure, operating 40 hrs per week, 75% boiler efficiency and $10 per GJ for fuel).
For more examples from the EECA energy efficiency guides visit www.eeca.govt.nz
Condensate return is important. Because money has been spent to treat and heat the water it is most efficient to return it to the boiler to use again. Heat from the returned condensate can be used to heat the input water to the boiler.
4.2.2.5. Hot water Hot water systems are a well documented area for savings. Ensure:
• Leaking taps or valves are identified and fixed promptly • Pipes and hot water cylinders which deliver hot water are lagged • Hot water cylinders used for hand washing etc are set to 60°C. Higher temperatures are
unnecessary and will incur greater heat energy input. Temperatures lower than 60°C are not recommended to avoid contamination from legionnaire.
4.2.2.6. Refrigeration Coolth is the energy lost from refrigeration systems through infiltration or leaks in seals and doors that allow the cooled air to escape and/or warm air to enter. When looking for opportunities to reduce coolth keep in mind:
• Open doors - energy is lost to the outside and the refrigeration unit will be trying to cool the room
• Ice on pipe work - this indicates that the chiller is using energy to freeze water in the room rather than dropping temperature
• Open freezers - Coolth is lost to the atmosphere • Areas where cooling is right next door to a heating area (i.e. machines fighting against
each other double the potential for energy savings)
There are also more technical savings available from:
• Replacing evaporator fan motors and hot gas defrost (approximately 9% savings) - this improves the efficiency of the refrigeration unit
• Heat recovery systems from refrigeration oil • Installing de-superheaters (heat exchangers) to recover heat from the hot gasses leaving
the compressor • Reduce the condensing temperature to reduce the work required by the refrigeration
compressors
4.2.2.7. Lighting and transport See Sections 3.2.1 and 3.2.5 in this Guide.
4.3. Developing key performance indicators It is important to develop a systematic method of recording energy use that provides you with a means of evaluating your progress over time. Consider also incorporating a simple key performance indicator (KPI) as a part of your record keeping. Key performance indicators are a useful tool for reporting changes in energy use to management and staff via reports, newsletters and notice boards for example.

Updated February 2008 Target Energy Business Guide Page 27 of 39
Key performance indicators should be time based (i.e. kWh per week, GJ per month etc) and should also be expressed in terms of some key business characteristic.
In a manufacturing business KPIs should be developed that can account for how energy use changes with changes in production. For example, dividing the weekly energy consumption by the total number of widgets produced in the same week could give a KPI expressed as kWh of electricity (or GJ of coal, gas etc) per widget. Similarly, the energy use could be related to the weight of product produced over the same time period, giving a KPI expressed as GJ of gas per kg of product.
Note that kWh and GJ are both measures of energy use and a simple conversion can be made if you want to standardise energy use to one unit (see Glossary). Typically electricity is expressed as kWh (or MWh) and fossil fuels in terms of GJ.
Worksheet 4 includes an option for expressing energy use in absolute terms and per widget. The choice of production unit will depend on the type of industry, as production could be measured according to volume, weight, number, area or dollar value.
It is important that measurements are made regularly and that key performance indicators are only compared for equivalent time periods.
Monitoring energy use performance indicators will help you:
• Identify energy use trends • Indicate high usage • Indicate the need for further investigation i.e. looking for plant left running outside normal
operating hours
4.4. Top Tips – Manufacturing 4.4.1. Red flags (common waste areas)
• Equipment and lights left on at night or when the business is shut down (i.e. public holidays)
• Unexplained changes in the energy bill • Excessive energy use during public holidays or shut down periods
The following outlines some useful tips for reducing energy consumption in industrial settings.
4.4.2. Basics • Know how much energy you are using through monitoring and measurement • Educate staff on energy efficiency and conservation techniques • Install signs and reminders for staff • Undertake a site wide energy audit
4.4.3. Quick fixes
• Ensure lighting and equipment is switched off when not in use • Make a list of the equipment that can be switched off at night or in between shifts and
circulate it to production staff • Regularly monitor and manage any compressed air system leaks • De-tube lights in areas that are over-lit • Use natural light where possible • Perform flue gas analysis on boilers to ensure they are running under optimum conditions
Updated February 2008 Target Energy Business Guide Page 28 of 39
4.4.4. Medium and long term • Maintaining a high power factor (0.95 and above) will help minimise demand charges.
(For more information on power factor correction see www.eeca.govt.nz/eeca-library ) • Consider the life-cycle cost of any equipment upgrade to account for the benefits of more
energy efficient equipment options • Install and maintain lagging of hot surfaces such as tanks and pipes • Install lids on heated tanks to reduce heat loss • Regularly maintain energy intensive plant equipment such as boilers and air compressors • Investigate more energy efficient lighting including lamp, control and design options • Investigate options for recovering heat where steam, hot water or space heating is
required. Refrigeration systems and air compressors can be significant sources of waste heat
5. Expert advice Because of the complexities of energy systems, it is important to involve experts when evaluating options. For many organisations this may mean involving a registered electrician or engineer specialized in energy.
The Energy Efficiency and Conservation Authority (EECA) is charged with providing organisations with information and resources to support energy efficiency. They can put you in touch with experts who can conduct energy audits and provide other advice. They also have a pool of funding that is available for energy related investment projects in business. For more information visit www.eeca.govt.nz.
6. Glossary
1 kilowatt (kW) = 1,000 watts (W) = 1,000 joules/second: a measure of power
,or rate of energy use
1 kilowatt hour (kWh) = 0.0036 GJ; a measure of energy equivalent to what is
used by 1 kilowatt in one hour
1 Gigajoule (GJ) = 1,000,000,000 Joules; a measure of energy
Lux = is a measurement of luminance and is Lumens per square metre
Power factor correction = Equipment can be installed (typically capacitor
banks) to remedy poor power factor to avoid unnecessary charges.
Updated February 2008 Target Energy Business Guide Page 29 of 39
7. Target Sustainability Business Guide series The following guides will help you undertake your sustainability programme.
• Target Sustainability - The Path to Sustainability Business Guide • Target Waste Business Guide • Target Water Business Guide
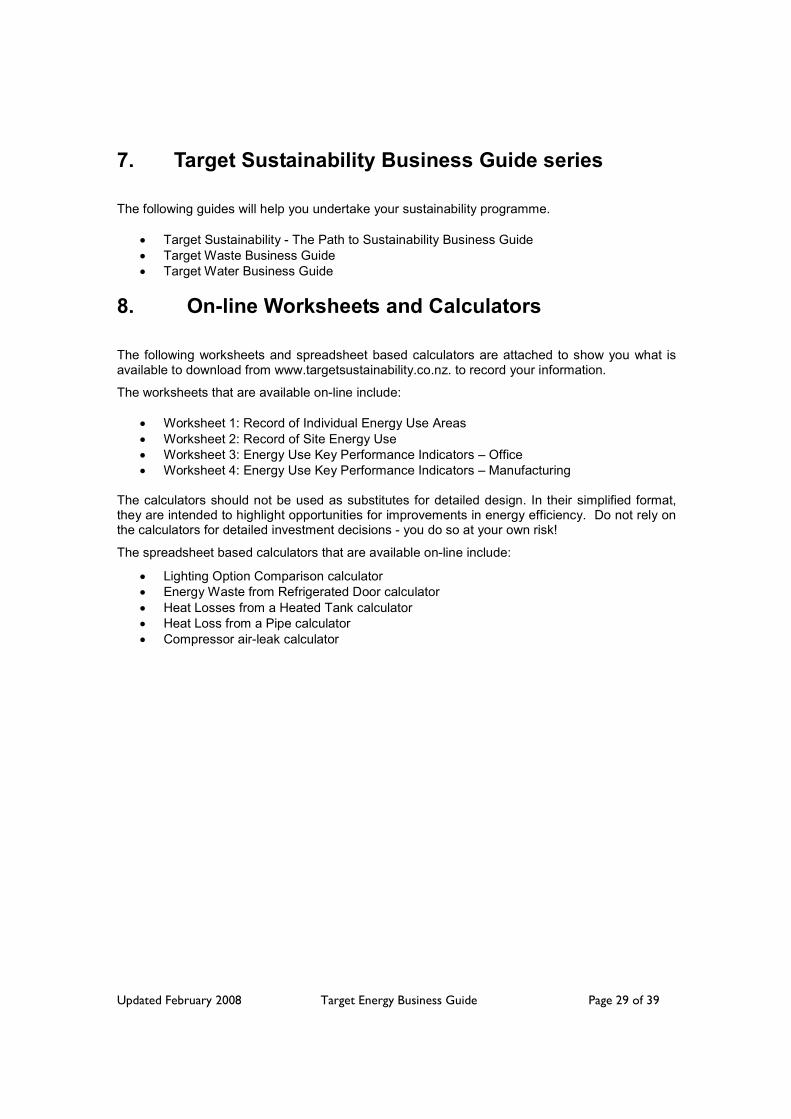
8. On-line Worksheets and Calculators The following worksheets and spreadsheet based calculators are attached to show you what is available to download from www.targetsustainability.co.nz. to record your information.
The worksheets that are available on-line include:
• Worksheet 1: Record of Individual Energy Use Areas • Worksheet 2: Record of Site Energy Use • Worksheet 3: Energy Use Key Performance Indicators – Office • Worksheet 4: Energy Use Key Performance Indicators – Manufacturing
The calculators should not be used as substitutes for detailed design. In their simplified format, they are intended to highlight opportunities for improvements in energy efficiency. Do not rely on the calculators for detailed investment decisions - you do so at your own risk!
The spreadsheet based calculators that are available on-line include:
• Lighting Option Comparison calculator • Energy Waste from Refrigerated Door calculator • Heat Losses from a Heated Tank calculator • Heat Loss from a Pipe calculator • Compressor air-leak calculator

Updated February 2008
Target Energy Business Guide
Page 30 of 39
Appliance / Facility N
umber of
Equipment
Items
Power R
ating kWH
ours/day of O
perationDays/yr of O
perationPow
er Use (kW
h/yr) = rating x hrs x days
Example: C
omputers -
desktop1
0.118
240211
Total 211
Worksheet 1: R
ecord of Individual Energy Use Areas
Date:
Physical address of the site:
Nam
e of recorder:

Updated February 2008
Target Energy Business Guide
Page 31 of 39
Month
Date
Meter reading
Energy usedN
ame of recorder
Com
ments
January
February
March
April
May
June
July
August
September
October
Novem
ber
Decem
ber
Note: You can m
odify this form to record data from
monthly invoices. W
hile monthly data recording is a useful start, w
eekly data will prove m
ore useful if you are actively trying to reduce energy use.
Worksheet 2: R
ecord of Site Energy Use
Physical address of the site:
Year:
Energy meter location:

Updated February 2008 Target Energy Business Guide Page 32 of 39
Month Date Energy used, kWh1/month
Average number of level, FTE2
KPI, kWh/FTE/month
January
February
March
April
May
June
July
August
September
October
November
December
Note 2: Floor area, expressed as m 2 , can be used as an alternate to FTE.
Worksheet 3: Energy Use Key Performance Indicators - Office
Physical address of the site:
Year:
Note 1: kWh is typically used for electicity use. You may also want to record gas use where appropriate in GJ, or combine all energy use and express in a common unit.

Updated February 2008 Target Energy Business Guide Page 33 of 39
Month Date Energy used,
GJ1/monthProduction,
Widgets2/month KPI GJ/widget
January
February
March
April
May
June
July
August
September
October
November
December
Note 1: Alternative, or multiple, measures of production can be used. Examples include $ value, kg, m, m 3 , with the production unit selected appropriate to the type of production
Worksheet 4: Energy Use Key Performance Indicators - Manufacturing
Physical address of the site:
Year:
Note 1: The energy unit used can be modified (e.g.GJ, kWh, MWh etc) to be most appropriate to the size of the unit production used, and what is most readily understood by your target auidence.
Updated February 2008 Target Energy Business Guide Page 34 of 39
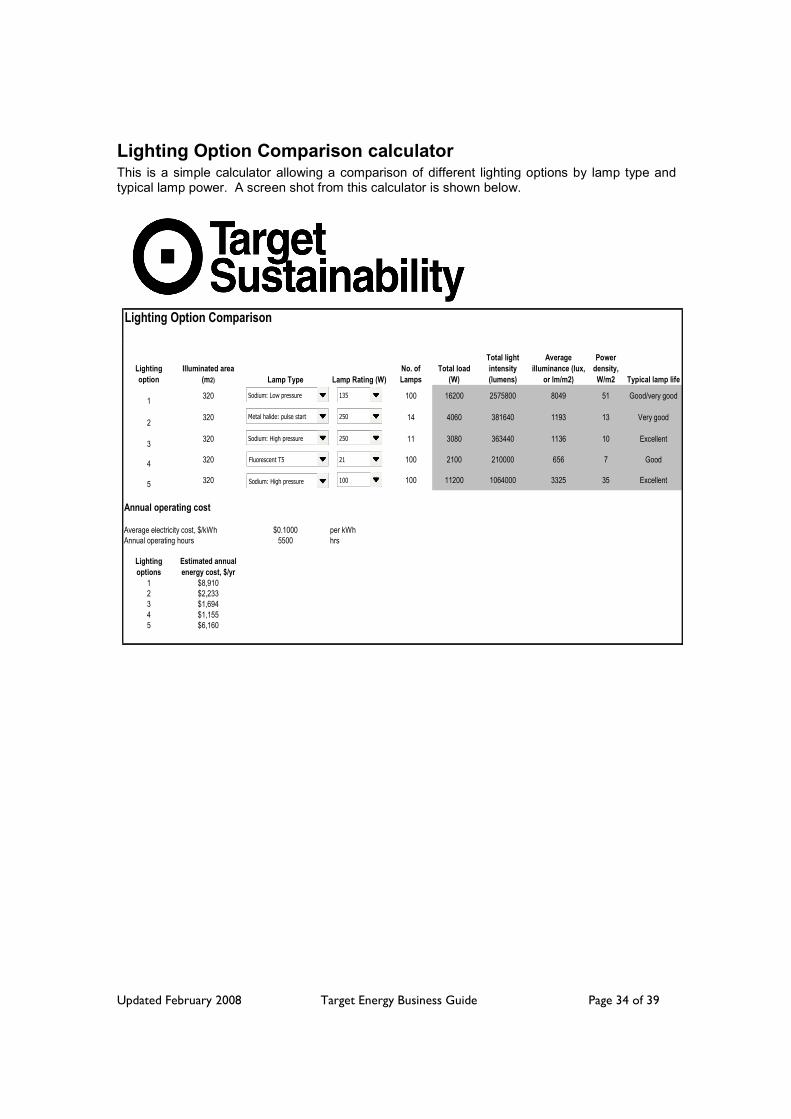
Lighting Option Comparison calculator This is a simple calculator allowing a comparison of different lighting options by lamp type and typical lamp power. A screen shot from this calculator is shown below.
Lighting Option Comparison
Lighting option
Illuminated area (m2) Lamp Type Lamp Rating (W)
No. of Lamps
Total load (W)
Total light intensity (lumens)
Average illuminance (lux,
or lm/m2)
Power density, W/m2 Typical lamp life
1 320 100 16200 2575800 8049 51 Good/very good
2 320 14 4060 381640 1193 13 Very good
3 320 11 3080 363440 1136 10 Excellent
4 320 100 2100 210000 656 7 Good
5 320 100 11200 1064000 3325 35 Excellent
Annual operating cost
$0.1000 per kWh5500 hrs
Lighting options
Estimated annual energy cost, $/yr
1 $8,9102 $2,2333 $1,6944 $1,1555 $6,160
Average electricity cost, $/kWhAnnual operating hours
Sodium: Low pressure 135
Metal halide: pulse start
Sodium: High pressure
Fluorescent T5
Sodium: High pressure
250
250
21
100

Updated February 2008 Target Energy Business Guide Page 35 of 39
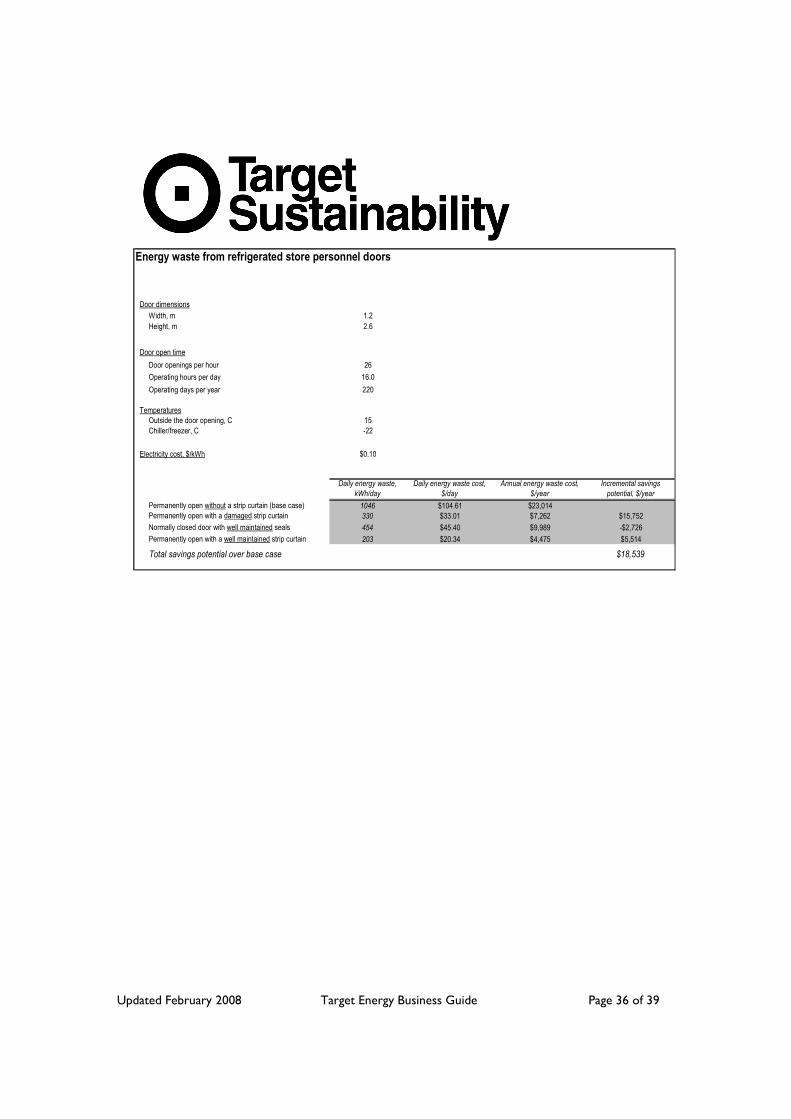
Energy Waste from Refrigerated Door calculator Air infiltration contributes up to 50% of the load of many refrigeration systems. This calculator illustrates the impact of appropriate access door control on energy usage and costs for forklift and personnel access doors. A screen shot from this calculator is shown below.
Energy waste from refrigerated store forklift doors
Door dimensionsWidth, m 0.9Height, m 3.2
Door open timeForklift movements per hour 25Operating hours per day 16.0Operating days per year 210
TemperaturesOutside the door opening, C 15Chiller/freezer, C 4
Electricity cost, $/kWh $0.10
Daily energy waste, kWh/day
Daily energy waste cost, $/day
Annual energy waste cost, $/year
Incremental savings potential, $/year
Permanently open without a strip curtain (base case ) 196 $20 $4,112Permanently open with a damaged strip curtain 45 $4 $938 $3,174Permanently open with a well maintained strip curtain 19 $2 $407 $531Sliding door plus a well maintained strip curtain 16 $2 $346 $60
Total savings potential over base case $3,766
Updated February 2008 Target Energy Business Guide Page 36 of 39
Energy waste from refrigerated store personnel doors
Door dimensionsWidth, m 1.2Height, m 2.6
Door open timeDoor openings per hour 26Operating hours per day 16.0Operating days per year 220
TemperaturesOutside the door opening, C 15Chiller/freezer, C -22
Electricity cost, $/kWh $0.10
Daily energy waste, kWh/day
Daily energy waste cost, $/day
Annual energy waste cost, $/year
Incremental savings potential, $/year
Permanently open without a strip curtain (base case) 1046 $104.61 $23,014Permanently open with a damaged strip curtain 330 $33.01 $7,262 $15,752Normally closed door with well maintained seals 454 $45.40 $9,989 -$2,726Permanently open with a well maintained strip curtain 203 $20.34 $4,475 $5,514
Total savings potential over base case $18,539

Updated February 2008 Target Energy Business Guide Page 37 of 39
Heat Loss from a Heated Tank calculator Many processes require liquids to be heated, often in tanks. The tank heat loss calculator demonstrates the impact of insulation on energy consumption and operating costs. A screen shot from this calculator is shown below.
Heat loss from a heated tank
Select tank geometry
Round tank
Rectangular tank
Round tankDiameter, m 2.5 Rectangular tankHeight, m 3.1 Width, m 1.5
Length, m 4Height of liquid in tank, m 2.3 Height, m 2.5
Liquid temperature, C 90Ambient temperature, C 12Insulation thickness, m 0.1
Operating hoursHours per day 16Days per year 220
Fuel typeDieselLFO (light fuel oil)LPGCoalElectricity
Fuel cost, $/tonne $100.00Heat raising efficiency 65%
Savings summary Daily energy waste, kWh/day
Daily energy waste cost, $/day
Annual energy waste cost, $/year
Incremental savings potential,
$/yearNo insulation or lid, kW (base case) 933 $30.41 $6,691Insulated tank, but no lid 604 $19.67 $4,327 $2,363Fitting a lid only 422 $13.75 $3,025 $1,302Fully insulating tank and lid 10 $0.32 $70 $2,955Total savings potential over base case $6,621
Updated February 2008 Target Energy Business Guide Page 38 of 39
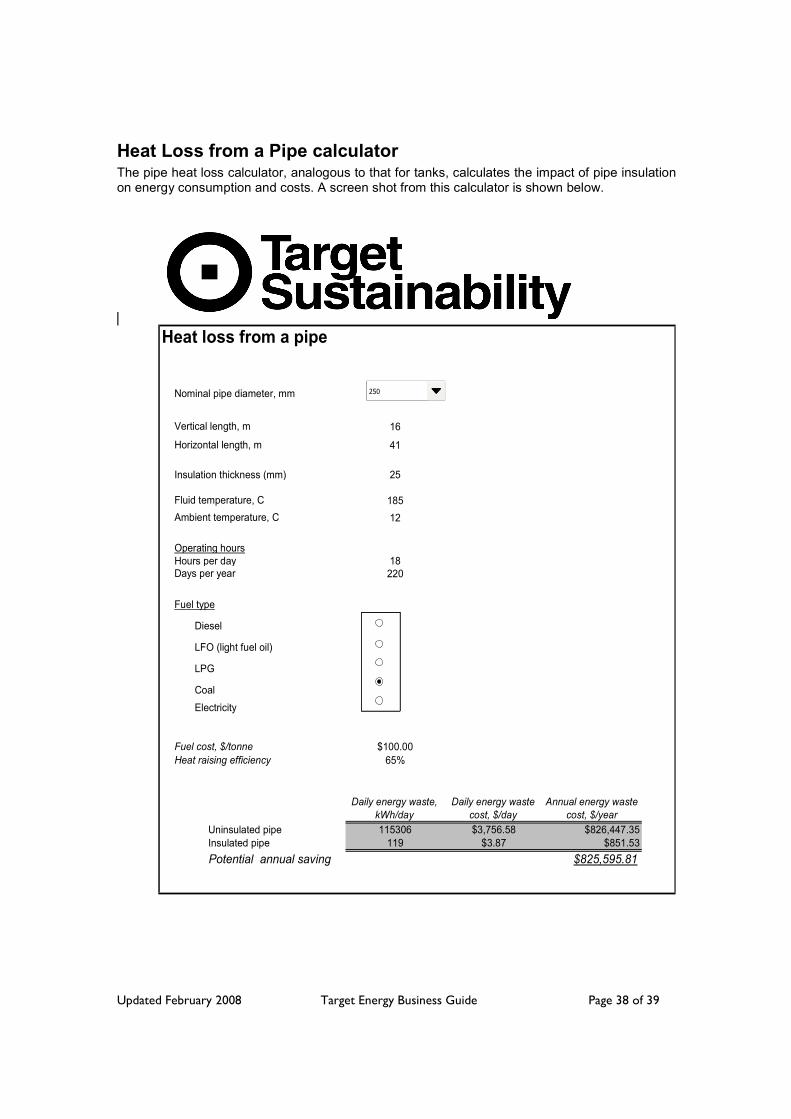
Heat Loss from a Pipe calculator The pipe heat loss calculator, analogous to that for tanks, calculates the impact of pipe insulation on energy consumption and costs. A screen shot from this calculator is shown below.
Heat loss from a pipe
Nominal pipe diameter, mm
Vertical length, m 16
Horizontal length, m 41
Insulation thickness (mm) 25
Fluid temperature, C 185Ambient temperature, C 12
Operating hoursHours per day 18Days per year 220
Fuel type
Diesel
LFO (light fuel oil)
LPG
CoalElectricity
Fuel cost, $/tonne $100.00Heat raising efficiency 65%
Daily energy waste, kWh/day
Daily energy waste cost, $/day
Annual energy waste cost, $/year
Uninsulated pipe 115306 $3,756.58 $826,447.35Insulated pipe 119 $3.87 $851.53Potential annual saving $825,595.81
250

Updated February 2008 Target Energy Business Guide Page 39 of 39
Compressor Air-Leak calculator Air leaks from compressed air systems can be equivalent to 30% of the system capacity. This calculator provides a simple method of estimating the proportion of capacity required to service system leaks for fixed speed air compressors. A screen shot from this calculator is shown below.
Compressor Air Leak Calculator
This simple test method is applicable to load-unload and on-off compressors (not variable speed compressors).
Select compressor type
On-off
Load-unload
Select rated compressor power
Rated power kW
Compressor Operating hours
Estimated operating hours/week 168 per week
Energy cost ($/kWh) $0.087 per kWh
Record the load/unload running times
Time Loaded (seconds)
Time Unloaded (seconds)
Run 1 71 90Run 2 77 111Run 3 73 142Run 4 76 94Run 5 78 103
The mean leakage rate is 45.9% of the generated compressed air.Target leakage rate 5%
The potential cost saving is $11,720 per year
The cost savings result from an estimated 134,709 kWh/yr reduction in electricity
consumption.
10891.5
Record in the table below, over a number of cycles, the time the compressor is loaded and unloaded (or off) respectively.
Choose a period when there is no demand for compressed air and shut down any air operated equipment.
Leave isolating valves open.
Start the compressor and allow it to come up to its operating pressure. A small compressor (less than 10 kW) may turn off completely, while larger models will unload. The 'unload' state can usually be identified by a change in the sound of the compressor, or a drop in the displayed motor amps (where available).
55