Genome-wide SNP detection in the great tit Parus major using high throughput sequencing
11
Genome-wide SNP detection in the great tit Parus major using high throughput sequencing NIKKIE E. M. VAN BERS,* KEES VAN OERS,† HINDRIK H. D. KERSTENS,* BERT W. DIBBITS,* RICHARD P. M. A. CROOIJMANS,* MARCEL E. VISSER† and MARTIEN A. M. GROENEN* *Animal Breeding and Genomics Centre, Wageningen University, Marijkeweg 40, Wageningen, 6709 PG, The Netherlands, †Department of Animal Ecology, Netherlands Institute of Ecology (NIOO-KNAW), PO Box 40, 6666 ZG Heteren, The Netherlands Abstract Identifying genes that underlie ecological traits will open exiting possibilities to study gene–environment interactions in shaping phenotypes and in measuring natural selection on genes. Evolutionary ecology has been pursuing these objectives for decades, but they come into reach now that next generation sequencing technologies have dramatically lowered the costs to obtain the genomic sequence information that is currently lacking for most ecologically important species. Here we describe how we generated over 2 billion basepairs of novel sequence information for an ecological model species, the great tit Parus major. We used over 16 million short sequence reads for the de novo assembly of a reference sequence consisting of 550 000 contigs, covering 2.5% of the genome of the great tit. This reference sequence was used as the scaffold for mapping of the sequence reads, which allowed for the detection of over 20 000 novel single nucleotide polymorphisms. Contigs harbouring 4272 of the single nucleotide polymor- phisms could be mapped to a unique location on the recently sequenced zebra finch genome. Of all the great tit contigs, significantly more were mapped to the microchro- mosomes than to the intermediate and the macrochromosomes of the zebra finch, indicating a higher overall level of sequence conservation on the microchromosomes than on the other types of chromosomes. The large number of great tit contigs that can be aligned to the zebra finch genome shows that this genome provides a valuable framework for large scale genetics, e.g. QTL mapping or whole genome association studies, in passerines. Keywords: natural population, next generation sequencing, Parus major, reduced representation libraries, short sequence reads, single nucleotide polymorphisms Received 29 May 2009; revision received 30 September 2009; accepted 15 October 2009 Introduction Genetic variation underlying phenotypic differences between individuals, either of the same or of different species, has been demonstrated in many, often long- term, studies throughout the world (Garant & Kruuk 2005; Nussey et al. 2005; Postma & Van Noordwijk 2005; Charmantier et al. 2008). Understanding this genetic variation is essential to estimate the rate at which species can adapt to their changing environment, due to e.g. global climate change (Visser 2008), and whether this rate of adaptation is sufficient to prevent species extinction (Both et al. 2006). Passeriformes are likely to be the most widely studied vertebrate taxo- nomic order in ecology and evolution (Lack 1968; Ben- nett & Owens 2002). The ease with which passerines can be studied in the wild, in particular by marking individuals and following them through time, has resulted in many, often long-term, research pro- grammes on a wide diversity of passerine species. Hence, extensive knowledge has been gathered by researchers investigating natural selection, sexual selec- tion, behavioural ecology and speciation. In addition, Correspondence: Kees van Oers, Fax: 31 26 4723227; E-mail: [email protected] ȑ 2010 Blackwell Publishing Ltd Molecular Ecology (2010), 19 (Suppl. 1), 89–99 doi: 10.1111/j.1365-294X.2009.04486.x
-
Upload
independent -
Category
Documents
-
view
1 -
download
0
Transcript of Genome-wide SNP detection in the great tit Parus major using high throughput sequencing

Molecular Ecology (2010), 19 (Suppl. 1), 89–99 doi: 10.1111/j.1365-294X.2009.04486.x
Genome-wide SNP detection in the great tit Parus majorusing high throughput sequencing
NIKKIE E. M. VAN BERS,* KEES VAN OERS,† HINDRIK H. D. KERSTENS,* BERT W. DIBBITS , *
RICHARD P. M. A. CROOIJMANS,* MARCEL E. VISSER† and MARTIEN A. M. GROENEN*
*Animal Breeding and Genomics Centre, Wageningen University, Marijkeweg 40, Wageningen, 6709 PG, The Netherlands,
†Department of Animal Ecology, Netherlands Institute of Ecology (NIOO-KNAW), PO Box 40, 6666 ZG Heteren, The
Netherlands
Corresponde
k.vanoers@ni
� 2010 Black
Abstract
Identifying genes that underlie ecological traits will open exiting possibilities to study
gene–environment interactions in shaping phenotypes and in measuring natural
selection on genes. Evolutionary ecology has been pursuing these objectives for decades,
but they come into reach now that next generation sequencing technologies have
dramatically lowered the costs to obtain the genomic sequence information that is
currently lacking for most ecologically important species. Here we describe how we
generated over 2 billion basepairs of novel sequence information for an ecological model
species, the great tit Parus major. We used over 16 million short sequence reads for the denovo assembly of a reference sequence consisting of 550 000 contigs, covering 2.5% of the
genome of the great tit. This reference sequence was used as the scaffold for mapping of
the sequence reads, which allowed for the detection of over 20 000 novel single
nucleotide polymorphisms. Contigs harbouring 4272 of the single nucleotide polymor-
phisms could be mapped to a unique location on the recently sequenced zebra finch
genome. Of all the great tit contigs, significantly more were mapped to the microchro-
mosomes than to the intermediate and the macrochromosomes of the zebra finch,
indicating a higher overall level of sequence conservation on the microchromosomes
than on the other types of chromosomes. The large number of great tit contigs that can be
aligned to the zebra finch genome shows that this genome provides a valuable
framework for large scale genetics, e.g. QTL mapping or whole genome association
studies, in passerines.
Keywords: natural population, next generation sequencing, Parus major, reduced representation
libraries, short sequence reads, single nucleotide polymorphisms
Received 29 May 2009; revision received 30 September 2009; accepted 15 October 2009
Introduction
Genetic variation underlying phenotypic differences
between individuals, either of the same or of different
species, has been demonstrated in many, often long-
term, studies throughout the world (Garant & Kruuk
2005; Nussey et al. 2005; Postma & Van Noordwijk
2005; Charmantier et al. 2008). Understanding this
genetic variation is essential to estimate the rate at
which species can adapt to their changing environment,
nce: Kees van Oers, Fax: 31 26 4723227; E-mail:
oo.knaw.nl
well Publishing Ltd
due to e.g. global climate change (Visser 2008), and
whether this rate of adaptation is sufficient to prevent
species extinction (Both et al. 2006). Passeriformes are
likely to be the most widely studied vertebrate taxo-
nomic order in ecology and evolution (Lack 1968; Ben-
nett & Owens 2002). The ease with which passerines
can be studied in the wild, in particular by marking
individuals and following them through time, has
resulted in many, often long-term, research pro-
grammes on a wide diversity of passerine species.
Hence, extensive knowledge has been gathered by
researchers investigating natural selection, sexual selec-
tion, behavioural ecology and speciation. In addition,

90 N. E . M. VAN BERS ET AL.
reviews on quantitative genetic analysis in natural pop-
ulations make it clear that also many of the long-term
studies of marked individuals have been conducted in
passerines (Merila & Sheldon 2001; Kruuk 2004). Link-
ing quantitative genetic variation in life-history traits to
polymorphisms in the actual genes that code for this
variance is essential for our understanding of the causes
and consequences of trait diversity. Quantitative genetic
techniques such as the ‘animal model’ (Kruuk 2004)
and QTL analyses conducted in specially created map-
ping crosses (Slate 2005) have undoubtedly enhanced
our understanding of adaptation, reproductive isolation
and speciation.
In order to perform QTL-mapping studies in a natu-
ral population, several requirements need to be met: (i)
the population should be sufficiently large and pedigree
information needs to be available; (ii) the traits of inter-
est should have been determined quantitatively; and
(iii) the availability of a genetic map, consisting of poly-
morphic markers (Kruuk 2004; Slate 2005). For many
non-model wild species, advances have been hampered
by the lack of pedigree information as well as the lack
of sufficient numbers of markers to be able to construct
genetic maps. Over the past two decades, personality
traits and timing of reproduction have been determined
quantitatively for pedigreed populations of the great tit
(Parus major). These traits affect important ecological
processes such as reproduction, survival and dispersal
and as a result have important consequences for the fit-
ness of an individual (for a review see e.g. Van Oers
et al. 2005). However, a genetic map is not yet available
for this ecological model species and the number of
publicly available polymorphic markers, e.g. microsatel-
lites, amplified fragment length polymorphisms (AF-
LPs) and single nucleotide polymorphisms (SNPs), is
very limited. At the time of writing, the NCBI database
only contains 23 microsatellite sequences for P. major,
and no SNP (but see Fidler et al. 2007) or AFLP mark-
ers (http://www.ncbi.nlm.nih.gov). Microsatellites have
been the markers of choice for the construction of the
majority of linkage maps of natural populations of ver-
tebrates (Slate et al. 2002; Hansson et al. 2005; Beraldi
et al. 2006). However, SNPs have several advantages
that favour their use as markers for gene mapping
[reviewed by Vignal et al. (2002) and Slate et al. (2009)].
SNP genotyping is highly automated: over 10 000 SNPs
can be typed simultaneously using a single custom
made chip (Illumina). Additionally, SNPs are more
abundant in the genome, and their discovery is more
time efficient.
The development of novel sequencing platforms, like
Roche ⁄ 454 Life Sciences’ Genome Sequencer and Illu-
mina’s Genome Analyzer, have dramatically lowered
the costs for generating vast amounts of sequence data.
For example, Illumina’s Genome Analyzer produces in
a single sequence run of a couple of days several giga-
basepairs (Gbp) of sequence data, in short sequence
reads. These short sequences form an excellent resource
for the detection of SNPs (Hillier et al. 2008; Van Tassell
et al. 2008), however, for genotyping assays, sufficient
sequence flanking the SNP needs to be available to
allow for probe design. For species with a (partially)
sequenced genome, this information can relatively eas-
ily be retrieved by mapping the reads onto the (draft)
genome (Van Tassell et al. 2008; Matukumalli et al.
2009; Ramos et al. 2009). Although for many species the
lack of a sequenced reference genome presents a serious
drawback, the de novo assembly of the short sequence
reads into contigs providing the sequence context of a
SNP is an efficient approach to overcome this problem
(Kerstens et al. 2009). To allow for contig assembly and
reliable SNP detection, the number of sequences cover-
ing a genomic region needs to be sufficiently large.
Reducing the complexity of the dataset, which corre-
sponds to the portion of the genome covered, is a
straightforward strategy to reach sufficient sequence
depth at reasonable costs. Reduced representation
libraries (RRLs) generally represent 1–5% of the gen-
ome and are created by the size selection of fragments
in a limited size range, produced by enzymatic diges-
tion of the DNA (Altshuler et al. 2000). RRLs have suc-
cessfully been employed for the discovery of thousands
of SNPs in species for which a genome sequence is
available, such as humans (Altshuler et al. 2000),
bovines (Van Tassell et al. 2008) and pigs (Wiedmann
et al. 2008; Ramos et al. 2009). Recently, an RRL was
used for highly efficient SNP detection in turkey (Ker-
stens et al. 2009), a species for which a reference gen-
ome is currently still lacking.
Here, we describe the discovery of 20 000 novel SNPs
in the genome of an ecological model species currently
lacking a sequenced genome. By using the combination
of RRLs and next generation sequencing we generated
over 2 billion nucleotides of novel sequence information
for this species. For SNP detection, we assembled this
information into reference sequences for mapping of
the reads. The reference sequences and the SNPs were
mapped onto the recently sequenced zebra finch Taenio-
pygia guttata genome, thereby investigating the possibili-
ties of using this passerine genome in future genetic
studies of the great tit and other passerines.
Materials and methods
Library preparation and sequencing
Blood from ten wild caught hand-reared male great tits
(Parus major) from ten different broods was used as the
� 2010 Blackwell Publishing Ltd
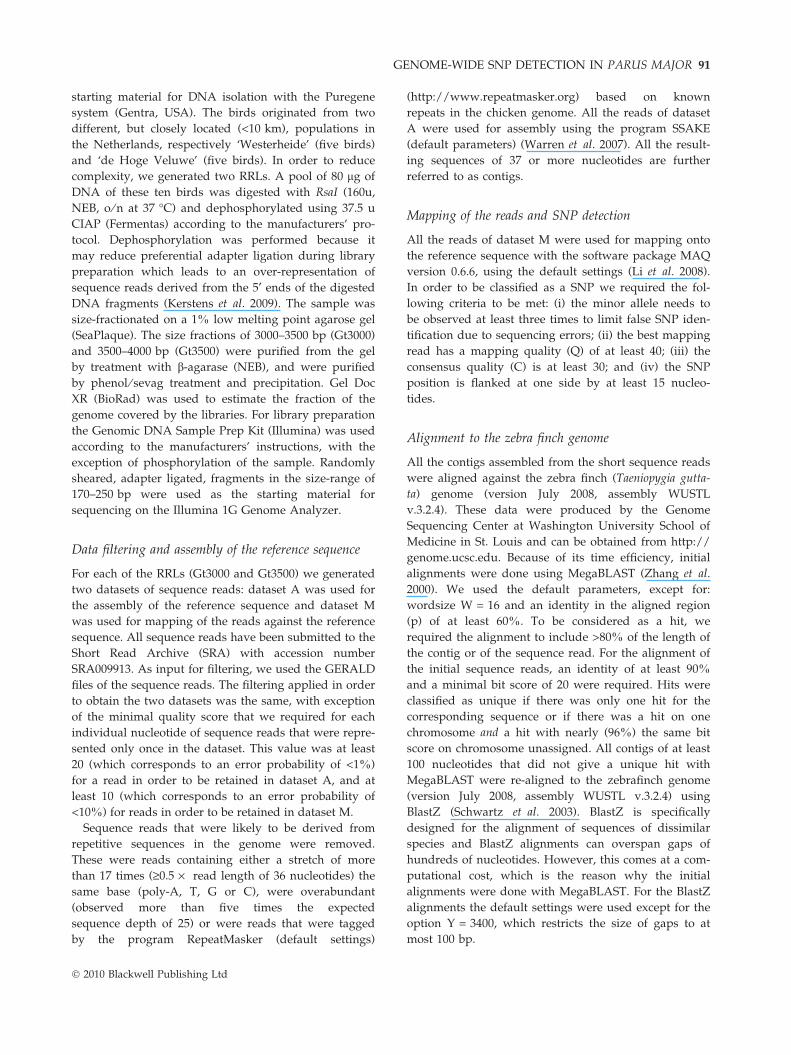
GENOME-WIDE SNP DETECTION IN PARUS MAJOR 91
starting material for DNA isolation with the Puregene
system (Gentra, USA). The birds originated from two
different, but closely located (<10 km), populations in
the Netherlands, respectively ‘Westerheide’ (five birds)
and ‘de Hoge Veluwe’ (five birds). In order to reduce
complexity, we generated two RRLs. A pool of 80 lg of
DNA of these ten birds was digested with RsaI (160u,
NEB, o ⁄ n at 37 �C) and dephosphorylated using 37.5 u
CIAP (Fermentas) according to the manufacturers’ pro-
tocol. Dephosphorylation was performed because it
may reduce preferential adapter ligation during library
preparation which leads to an over-representation of
sequence reads derived from the 5¢ ends of the digested
DNA fragments (Kerstens et al. 2009). The sample was
size-fractionated on a 1% low melting point agarose gel
(SeaPlaque). The size fractions of 3000–3500 bp (Gt3000)
and 3500–4000 bp (Gt3500) were purified from the gel
by treatment with b-agarase (NEB), and were purified
by phenol ⁄ sevag treatment and precipitation. Gel Doc
XR (BioRad) was used to estimate the fraction of the
genome covered by the libraries. For library preparation
the Genomic DNA Sample Prep Kit (Illumina) was used
according to the manufacturers’ instructions, with the
exception of phosphorylation of the sample. Randomly
sheared, adapter ligated, fragments in the size-range of
170–250 bp were used as the starting material for
sequencing on the Illumina 1G Genome Analyzer.
Data filtering and assembly of the reference sequence
For each of the RRLs (Gt3000 and Gt3500) we generated
two datasets of sequence reads: dataset A was used for
the assembly of the reference sequence and dataset M
was used for mapping of the reads against the reference
sequence. All sequence reads have been submitted to the
Short Read Archive (SRA) with accession number
SRA009913. As input for filtering, we used the GERALD
files of the sequence reads. The filtering applied in order
to obtain the two datasets was the same, with exception
of the minimal quality score that we required for each
individual nucleotide of sequence reads that were repre-
sented only once in the dataset. This value was at least
20 (which corresponds to an error probability of <1%)
for a read in order to be retained in dataset A, and at
least 10 (which corresponds to an error probability of
<10%) for reads in order to be retained in dataset M.
Sequence reads that were likely to be derived from
repetitive sequences in the genome were removed.
These were reads containing either a stretch of more
than 17 times (‡0.5 · read length of 36 nucleotides) the
same base (poly-A, T, G or C), were overabundant
(observed more than five times the expected
sequence depth of 25) or were reads that were tagged
by the program RepeatMasker (default settings)
� 2010 Blackwell Publishing Ltd
(http://www.repeatmasker.org) based on known
repeats in the chicken genome. All the reads of dataset
A were used for assembly using the program SSAKE
(default parameters) (Warren et al. 2007). All the result-
ing sequences of 37 or more nucleotides are further
referred to as contigs.
Mapping of the reads and SNP detection
All the reads of dataset M were used for mapping onto
the reference sequence with the software package MAQ
version 0.6.6, using the default settings (Li et al. 2008).
In order to be classified as a SNP we required the fol-
lowing criteria to be met: (i) the minor allele needs to
be observed at least three times to limit false SNP iden-
tification due to sequencing errors; (ii) the best mapping
read has a mapping quality (Q) of at least 40; (iii) the
consensus quality (C) is at least 30; and (iv) the SNP
position is flanked at one side by at least 15 nucleo-
tides.
Alignment to the zebra finch genome
All the contigs assembled from the short sequence reads
were aligned against the zebra finch (Taeniopygia gutta-
ta) genome (version July 2008, assembly WUSTL
v.3.2.4). These data were produced by the Genome
Sequencing Center at Washington University School of
Medicine in St. Louis and can be obtained from http://
genome.ucsc.edu. Because of its time efficiency, initial
alignments were done using MegaBLAST (Zhang et al.
2000). We used the default parameters, except for:
wordsize W = 16 and an identity in the aligned region
(p) of at least 60%. To be considered as a hit, we
required the alignment to include >80% of the length of
the contig or of the sequence read. For the alignment of
the initial sequence reads, an identity of at least 90%
and a minimal bit score of 20 were required. Hits were
classified as unique if there was only one hit for the
corresponding sequence or if there was a hit on one
chromosome and a hit with nearly (96%) the same bit
score on chromosome unassigned. All contigs of at least
100 nucleotides that did not give a unique hit with
MegaBLAST were re-aligned to the zebrafinch genome
(version July 2008, assembly WUSTL v.3.2.4) using
BlastZ (Schwartz et al. 2003). BlastZ is specifically
designed for the alignment of sequences of dissimilar
species and BlastZ alignments can overspan gaps of
hundreds of nucleotides. However, this comes at a com-
putational cost, which is the reason why the initial
alignments were done with MegaBLAST. For the BlastZ
alignments the default settings were used except for the
option Y = 3400, which restricts the size of gaps to at
most 100 bp.

92 N. E . M. VAN BERS ET AL.
Single Nucleotide Polymorphism* (SNP*), which is
the number of SNPs corrected for the number of nucle-
otides mapping to each of the zebra finch chromo-
somes, is calculated as follows for each of the zebra
finch autosomes: SNP* =P
SNP ⁄ m, where m is the
number of mapped nucleotides per 1000 basepairs of
chromosome. SNP* and m were tested for significance
by performing t-test.
Validation
We selected 66 SNPs located on 40 different contigs for
validation by PCR amplification and sequencing (the
primer and contig sequences are available as supple-
mentary info online). Primers for contig amplification
were designed using the web-based software Primer 3
v 0.4.0 (Rozen & Skaletsky 2000). The amplification was
performed on DNA isolated from at least four of the
individual birds used for the library preparation.
Amplification products were used as the template for
sequencing on a ABI 3730 DNA analyzer (Applied Bio-
systems), and sequencing results were analysed with
the STADEN package. Confirmed SNPs have been sub-
mitted to dbSNP with accession numbers:
NCBI_ss161110015-NCBI_ss161110056.
Results
Building a reference sequence
For reliable SNP prediction, the putative SNP position
needs to be covered by a sufficient number of
sequence reads (Van Tassell et al. 2008). To reach a
sequence depth of about 25, we reduced the complex-
ity of our dataset by only sequencing a few percent of
the great tit’s genome. This was accomplished by gen-
erating RRLs (Van Tassell et al. 2008). DNA was
digested with the restriction enzyme RsaI and after
separation of the DNA fragments on an agarose gel,
the size fractions of 3000–3500 bp and of 3500–4000 bp
were isolated. These two fractions represent an esti-
mated �4.1% and �3.3% of the great tit genome
assuming a genome size of �1.2 · 109 bp, similar to
the genome size of the zebra finch Taeniopygia guttata.
The libraries are further referred to as Gt3000 and
Gt3500, respectively.
In total, 61 million short sequence reads (36 bp) were
generated, 32 million of Gt3000 and 29 million of
Gt3500 (Fig. 1). This corresponds to around 1 billion
nucleotides of data for each of the libraries. Sequencing
errors in the reads can lead to the abortion of contig
extension and as a result, shorter contigs. Therefore, we
only selected those reads for the assembly of which all
the bases were called with an error probability of <1%,
unless the exact sequence of the read was found more
than once. Additionally, we used the RepeatMasker
program to remove reads that are likely to be derived
from repetitive sequences in the genome, which corre-
sponded to about 70 000 reads for each of the libraries.
Repetitive sequences are more likely to match ambigu-
ously during the assembly. This will result in incor-
rectly assembled contigs or in shorter contigs due to
premature termination of the assembly (Warren et al.
2007). In addition to the RepeatMasker program we
used an abundancy filter to limit the number of repeti-
tive sequences in the dataset. After the filtering steps,
we retained 9.4 million (29%) of the reads of Gt3000
and 7.0 million (24%) of the reads of Gt3500 for contig
assembly (Fig. 1).
In the absence of a sequenced genome of the great tit
we build an in silico set of sequences that served as ref-
erence for the subsequent detection of SNPs. Addition-
ally, it provides the SNP sequence context necessary for
the design of probes for use in genotyping (Fig. 1). The
filtered reads were assembled using the assembly soft-
ware SSAKE, which is specifically designed for the
assembly of short sequence reads (Warren et al. 2007).
The resulting reference sequence consisted of over
250 000 contigs for each of the RRLs, with a total length
of 16.2 and 14.8 million nucleotides for Gt3000 and
Gt3500, respectively (Table 1). The assembly of the
Gt3000 reads has a N50 value of 53, and the assembly
of the Gt3500 has a N50 of 52. The N50 length of an
assembly is the length x such that 50% of the genome,
or, in this case, reference sequence, is contained in seg-
ments of length x or greater (Adams et al. 2003).
Validation of the reference sequence by alignment tothe zebra finch genome
For the validation of our assembly we used two differ-
ent strategies. The first was alignment of the assembled
contigs against the genome of a closely related species,
the zebra finch [divergence time great tit-zebra finch is
40–45 million years (Barker et al. 2004)], and the second
was the independent amplification of a subset of the
assembled contigs. For alignment against the recently
sequenced zebra finch genome we used the programs
MegaBLAST and BlastZ. Of the initial short sequence
reads, we could align 26% (Gt3000) and 32% (Gt3500)
against the zebra finch genome. Subsequent assembly
increased this percentage to 35% and 37%, respectively,
for contigs smaller than 100 nucleotides. Of the contigs
larger than 100 nucleotides, we could map in total 62%
(Gt3000) and 63% (Gt3500) to the zebra finch genome
(Table 2). A graphical representation of the distribution
of the contigs over the zebra finch genome is provided
as supplementary data. For validation by re-amplifica-
� 2010 Blackwell Publishing Ltd

Table 1 Assembly statistics
Contig size Gt3000 Gt3500
37–49 154 228 143 588
50–75 112 046 97 396
76–100 19 830 17 649
101–150 8655 6907
151–200 1761 1350
201–300 703 622
301–400 170 198
401–500 77 86
501–601 42 43
>601 51 88
Total number 297 563 267 927
Total length 16.2 · 106 14.8 · 106
N50 53 52
32 million reads (Gt3000) 29 million reads (Gt3500)
Quality (>20), polyA,G,T or C and repeat filtering 9.4 million reads (Gt3000) or
7.0 million reads (Gt3500)
Quality (>10), polyA,G,T or C filtering
21.4 million reads (Gt3000) or 15.1 million reads (Gt3500)
Assembly into contigs
Contigs function as reference sequence for mapping and SNP detection
>20.000 SNPs
2 RRLs: Gt3000 and Gt3500
*** *
**
Fig. 1 Schematic overview of the SNP
detection pipeline. Two RRLs, gt3000
and gt3500, were used for the genera-
tion of in total 61 million short sequence
reads. These reads were filtered with
two different filter settings: a base call
quality score of at least 20 was required
for all uniquely represented reads that
were used for the assembly of the con-
tigs. These contigs form the framework
for the mapping of all the reads with a
base call quality score of at least 10 (in
grey). Single nucleotide polymorphisms
(*) are detected between reads that map
to the same position on the reference
sequences.
GENOME-WIDE SNP DETECTION IN PARUS MAJOR 93
tion, we selected 40 contigs, ranging in size from 200 to
500 bp. Of the selected contigs 35 mapped uniquely to
locations distributed over the whole zebra finch gen-
ome, while five contigs could not be mapped. For 85%
of the contigs a product of the expected size was ampli-
fied (supplementary information is available online).
� 2010 Blackwell Publishing Ltd
Mapping distribution over the different chromosometypes
Avian chromosomes are highly variable in size, which
led to their classification into micro- (<20 Mb), inter-
mediate- (20–40 Mb) and macrochromosomes (�50–
200 Mb) (ICGSC 2004, Axelsson et al. 2005). Based on
the convention of the ICGSC (ICGSC 2004), the zebra
finch chromosomes covered by the genome assembly
can be classified into six macrochromosomes (Tgu1A
and Tgu1–5), eight intermediate chromosomes (Tgu4A
and Tgu6–12) and 17 microchromosomes (Tgu1B and
Tgu13–28). Because our dataset is expected to ran-
domly cover the whole great tit genome, it allows a
comparison of sequence conservation between the
great tit and the zebra finch on the different chromo-
some types (Table 3). The results show that signifi-
cantly more nucleotides map to microchromosomes
than to intermediate (P < 10)4) or macrochromosomes
(P < 10)6), and that the number of great tit nucleotides
mapping to intermediate chromosomes is significantly
higher than the number mapping to macrochromo-
somes (P < 10)3).

Table 2 Alignment against the zebra finch genome
Unique hit Two hits More than two hits Total
Gt3000 All sequence reads MegaBLAST 18.7% (1 759 890) 3.7% (344 609) 3.8% (354 478) 26.2%
BlastZ — — —
Contigs < 100 nucleotides MegaBLAST 27.9% (79 634) 4.8% (13 676) 2.6% (7356) 35.3%
BlastZ — — —
Contigs ‡ 100 nucleotides MegaBLAST 35.2% (4174) 4.6% (546) 2.9% (344) 42.7%
BlastZ 15.6% (1850) 2.4% (290) 1.0% (116) 19.0%
Total (MegaBLAST&BlastZ) 50.7% (6024) 7.0% (836) 3.9% (460) 61.7%
Gt3500 All sequence reads MegaBLAST 22.4% (1575856) 4.5% (313116) 5.8% (410 444) 32.7%
BlastZ – – –
Contigs < 100 nucleotides MegaBLAST 28.2% (72 879) 4.7% (12 227) 4.4% (11 467) 37.3%
BlastZ – – –
Contigs ‡ 100 nucleotidest MegaBLAST 28.0% (2695) 4.0% (389) 8.5% (818) 40.5%
BlastZ 17.4% (1676) 3.1% (300) 1.5% (140) 22.0%
Total (MegaBLAST&BlastZ) 45.4% (4371) 7.2% (689) 10.0% (958) 62.5%
15 30 450
10
20
30
40
50
60
70
80
90
100
Num
ber
of S
NP
s (%
)
Number of flanking nucleotides on side 1
>30 nt on side 2
>2 nt on side 2
>15 nt on side 2
Fig. 2 The distribution of the number of nucleotides flanking
the SNP positions on one side (side 1), which are flanked at the
other side (side 2) by at least two nucleotides (straight line), 15
nucleotides (dashed line) or 30 nucleotides (dot-dash line).
94 N. E . M. VAN BERS ET AL.
Large scale SNP identification
To identify SNPs within the DNA pool used for the
construction of the RRLs, we mapped 21 million
(Gt3000) and 15 million (Gt3500) reads, respectively
onto the reference sequences. These are all the reads
containing only bases with a probability of >90% of
being called correctly (Fig. 1). Nucleotide differences
were marked as SNPs if the difference at that position
in the reference sequence was observed at least three
times, with a minimal mapping quality of 10 for all of
the reads and a minimal mapping quality of 40 for the
best mapping read. Using these thresholds, we detected
13 153 SNPs in Gt3000 and 7556 SNPs in Gt3500. 89%
of the SNPs was flanked by at least 30 nucleotides on
one side and two nucleotides on the other (Fig. 2),
which is sufficient to allow probe design for an iSelect
(Illumina) genotyping assay. The allele frequencies of
the SNPs can be estimated based on the proportion of
sequence reads harbouring the minor allele. A plot of
the estimated allele frequencies of the SNPs in our data-
set (Fig. 3) shows that SNPs with a minor allele fre-
quency (MAF) of <0.2 are under-represented in our
dataset, as compared to the allele frequency distribution
Table 3 Mapping statistics
Mapped
number
nucleotides ⁄ kbp SNP*
Macrochromosomes
(Tgu1A&Tgu1–5)
4.62 ± 1.13 46.6 ± 17.4
Intermediate
chromosomes (Tgu6–12)
10.24 ± 2.31 11.3 ± 3.1
Microchromosomes
(Tgu13–28&Tgu1B)
21.00 ± 5.50 4.4 ± 3.0
reported for human SNPs (The International HapMap
Consortium 2005).
Sequencing errors are often found in the last nucleo-
tides of the sequence reads (Dohm et al. 2008). If a sub-
stantial amount of the SNPs in the dataset is the result
of sequencing errors, than an increase in the number of
SNPs towards the end of the reads is expected. As a
first indication for the validity of our SNP detection
approach, we plotted the distribution of the SNPs over
the 36 positions in the sequence reads (Fig. 4). Except
for an under-representation at the termini of the reads
(positions 1 and 36), the SNPs are equally distributed
over the reads. Additionally, we calculated the transi-
tion:transversion ratio of the SNPs in our dataset. If
polymorphisms would be introduced at random, a tran-
sition (AMG or CMT) to transversion (A or G M C or
T) rate of 1:2 is expected. The observed transition:trans-
version ratio for our dataset is 1.7:1.
� 2010 Blackwell Publishing Ltd

02468
101214161820
0.05 0.1 0.15 0.2 0.25 0.3 0.35 0.4 0.45 0.5MAF
SN
Ps
(%)
Fig. 3 The allele frequency distribution (bin size 0.05) of the
total SNP dataset.
0 5 10 15 20 25 30 350
750
1500
2250
3000
3750
4500
5250
6000
6750
7500(a)
(b)
Gt3000
Read position
nr o
f SN
Ps
Read position0 5 10 15 20 25 30 35
0
500
1000
1500
2000
2500
3000
3500
4000Gt3500
nr o
f SN
Ps
Fig. 4 The number of SNPs detected on each of the 36 posi-
tions of the sequence reads of (a) gt3000 and (b) gt3500.
GENOME-WIDE SNP DETECTION IN PARUS MAJOR 95
In order to confirm the validity of our approach, we
sequenced 40 different contigs, containing in total 66
SNPs. Due to technical limitations (e.g. no amplification
� 2010 Blackwell Publishing Ltd
product), 16 SNPs could not be typed. Of the remaining
SNPs, the presence of 84% could be confirmed by
sequencing of amplification products of the individual
birds used for the construction of the dataset (supple-
mentary information is available online).
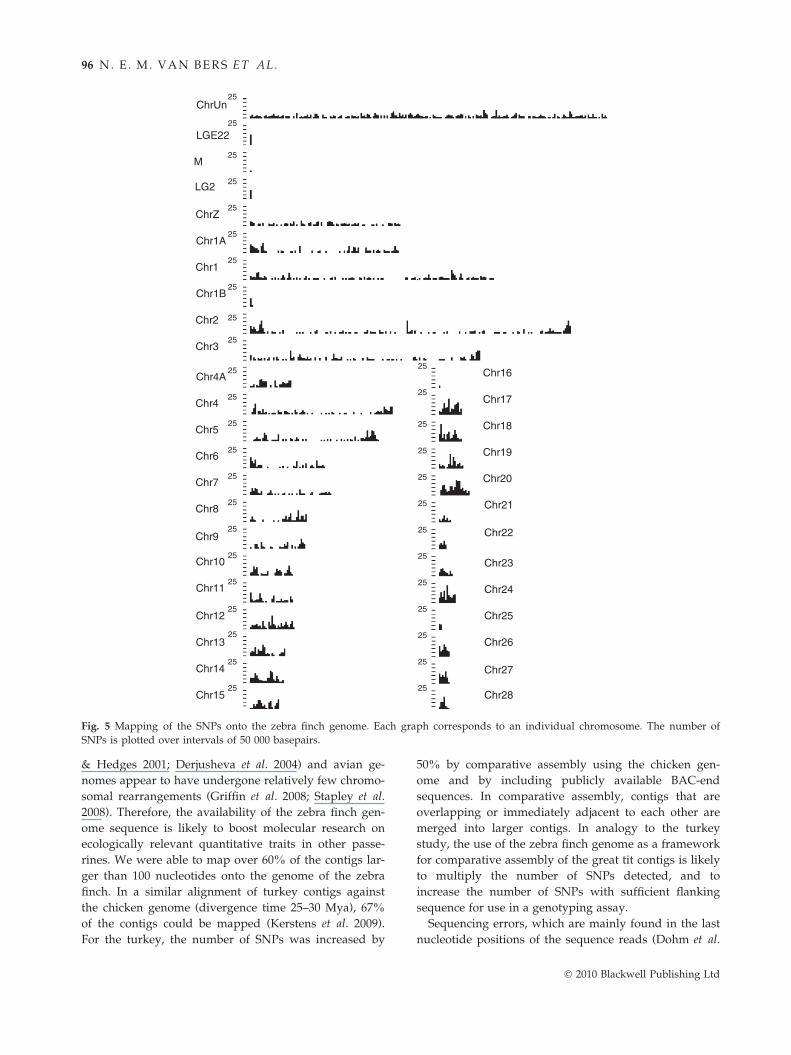
For future use in the build of a genetic map of the
great tit it is essential that the SNPs are widely distrib-
uted over the genome. In the absence of the sequence of
the great tit genome, we used the genome of the zebra
finch for the mapping of the contigs (see above, and
Table 2). We plotted the distribution of the SNPs found
in the two RRLs over the zebra finch chromosomes
(Fig. 5). A total of 4272 SNPs were located on contigs
that could be mapped to unique locations evenly distrib-
uted over the zebra finch genome. Of these, 2660 SNPs
were located on contigs smaller than 100 bp, and 1609
SNPs were located on contigs of at least 100 bp.
A comparison of the chicken and turkey genome
revealed that nucleotide divergence between these bird
species is higher on microchromosomes than on macro-
chromosomes (Axelsson et al. 2005). To investigate
whether the same holds true for the great tit, we calcu-
lated the mean number of SNP harbouring contigs that
mapped to each of the different chromosome types of the
zebra finch (SNP*, see ‘Methods’). To avoid a bias intro-
duced due to the significant difference in number of nu-
cleotides mapping to each of the chromosome types (see
above), we corrected for the number of nucleotides that
mapped to each chromosome. SNP* decreases with the
size of the chromosomes and is significantly higher for
macrochromosomes than for intermediate (P < 10)5) and
for microchromosomes (P < 10)8), and is also signifi-
cantly higher for intermediate chromosomes than for mi-
crochromosomes (P < 10)4).
Discussion
Here we report the discovery of over 20 000 novel SNPs
in the great tit genome by high throughput sequencing.
We assembled 16 million short sequence reads, derived
from two RRLs, into a total of over 550 000 contigs.
These contigs have a total length of more than 30 million
basepairs, which corresponds to about 2.5% of the great
tit genome. Linking SNPs to positions on the genome is
problematic for species for which a genome sequence is
currently lacking. This can partially be circumvented by
mapping the sequence reads onto the genome of a
related species, e.g. the sequenced chicken genome in
the case of turkey (Kerstens et al. 2009). Recently, the
first passerine genome sequence; that of the zebra finch,
was released. The great tit and the zebra finch diverged
from their common ancestor 40–45 million years ago
(Mya) (Barker et al. 2004). Furthermore, the avian karyo-
type is highly conserved (Shetty et al. 1999; Van Tuinen
ChrUn
LGE22
M
LG2
ChrZ
Chr1A
Chr1
Chr1B
Chr2
Chr3
Chr4A
Chr4
Chr5
Chr6
Chr7
Chr8
Chr9
Chr10
Chr11
Chr12
Chr13
Chr14
Chr15
Chr16
Chr17
Chr18
Chr19
Chr20
Chr21
Chr22
Chr23
Chr24
Chr25
Chr26
Chr27
Chr28
25
25
25
25
25
25
25
25
25
25
25
25
25
25
25
25
25
25
25
25
25
25
25
25
25
25
25
25
25
25
25
25
25
25
25
25
Fig. 5 Mapping of the SNPs onto the zebra finch genome. Each graph corresponds to an individual chromosome. The number of
SNPs is plotted over intervals of 50 000 basepairs.
96 N. E . M. VAN BERS ET AL.
& Hedges 2001; Derjusheva et al. 2004) and avian ge-
nomes appear to have undergone relatively few chromo-
somal rearrangements (Griffin et al. 2008; Stapley et al.
2008). Therefore, the availability of the zebra finch gen-
ome sequence is likely to boost molecular research on
ecologically relevant quantitative traits in other passe-
rines. We were able to map over 60% of the contigs lar-
ger than 100 nucleotides onto the genome of the zebra
finch. In a similar alignment of turkey contigs against
the chicken genome (divergence time 25–30 Mya), 67%
of the contigs could be mapped (Kerstens et al. 2009).
For the turkey, the number of SNPs was increased by
50% by comparative assembly using the chicken gen-
ome and by including publicly available BAC-end
sequences. In comparative assembly, contigs that are
overlapping or immediately adjacent to each other are
merged into larger contigs. In analogy to the turkey
study, the use of the zebra finch genome as a framework
for comparative assembly of the great tit contigs is likely
to multiply the number of SNPs detected, and to
increase the number of SNPs with sufficient flanking
sequence for use in a genotyping assay.
Sequencing errors, which are mainly found in the last
nucleotide positions of the sequence reads (Dohm et al.
� 2010 Blackwell Publishing Ltd

GENOME-WIDE SNP DETECTION IN PARUS MAJOR 97
2008), can falsely be identified as SNPs. The fact that
we did not observe a bias in the number of SNPs in the
last nucleotides of the reads supports our approach.
Furthermore, the SNPs in our dataset show a transi-
tion:transversion rate of 1.7:1, which is only slightly less
than the ratio of 2:1 observed in neutrally evolving
genes in humans (Zhang & Gerstein 2003) and the ratio
of 2.2:1 calculated for chicken based on more than 3
million chicken SNPs present in dbSNP.
Single nucleotide polymorphisms (SNPs) with an
MAF < 0.2 are under-represented in our dataset. This is
due to the combination of the stringent requirement of
a minor allele count of at least three times, which we
set to avoid false SNP discovery due to sequencing
errors and the average sequence coverage of our dataset
of 15 times (after quality filtering). Increasing the
sequence depth of the dataset will also allow the detec-
tion of SNPs with a lower allele frequency. We vali-
dated our assembly and SNP detection by PCR
amplification and sequencing of 40 contigs. Eighty-five
per cent of the selected contigs was amplified success-
fully and of the 50 SNPs that could be typed, the pres-
ence of 84% was confirmed by sequencing.
The majority of the contigs that we assembled are
small (<75 bp), which is reflected in the N50 values of
52 (Gt3000) and 53 (Gt3500), respectively. The total
length of the contigs assembled was 16.2 Mbp for
Gt3000 and 14.8Mbp for Gt3500. This means that our
contigs represent at most 1.3% and 1.2%, respectively
of the great tit genome, which is considerably less than
the 4.1% and 3.3% that we estimated to cover with
these two RRLs. This is mainly due to the fact that not
all sequence reads are assembled into contigs. However,
in a similar study Kerstens et al. (2009) assembled 3%
of the turkey genome, while the dataset was expected
to cover 5–6% of the genome. Even though this is only
60% of the expected target, it is still more than the
�35% of the target we retrieved in our assembly. An
explanation for this is the difference in the proportion
of larger sized contigs (>100 nucleotides) between the
datasets, e.g. 7.2% of the turkey contigs is larger than
100 nucleotides vs. 3.9% (Gt3000) and 3.5% (Gt3500),
respectively in our dataset. We attribute the lower pro-
portion of contigs > 100 nucleotides to the higher level
of diversity between the individuals used for the prepa-
ration of the datasets: six turkeys from two interbred
lines vs. ten wild great tits from two different popula-
tions in the Netherlands. This difference in diversity is
further reflected in the numbers of SNPs detected: using
the same methods Kerstens and coworkers detected 207
SNPs ⁄ million base pairs of reference sequence, while
we detected over 645 SNPs ⁄ million base pairs of refer-
ence sequence. Based on this, we expect that SNP detec-
tion can be optimized by using sequence reads derived
� 2010 Blackwell Publishing Ltd
from only one individual for the assembly of the refer-
ence sequence, and reads from a pool of highly diverse
individuals for subsequent SNP detection.
Chicken micro- and intermediate chromosomes have
a higher G + C content, a lower repeat density and a
higher gene density than macrochromosomes (ICGSC
2004). We find that significantly more nucleotides of the
great tit contigs map to zebra finch microchromosomes
than to intermediate and to macrochromosomes, indi-
cating that the overall level of sequence conservation
between the great tit and the zebra finch is higher on
microchromosomes than on the other types of chromo-
somes, which is probably the result of a higher gene
density on the zebra finch microchromosomes. On the
other hand, this observation could be due to a bias in
our dataset, e.g. over-representation of sequences from
smaller chromosomes or a better assembly of contigs
derived from microchromosomes. However, we do not
find a significant difference in the average length of
contigs mapping to the different chromosome types
(data not shown) and it is reported for Sanger sequenc-
ing that microchromosomal sequences tend to be
under-represented rather than over-represented (ICGSC
2004). Chicken microchromosomes are estimated to
account for 18% of the genome, while they harbour
31% of all chicken genes (ICGSC 2004). Macrochromo-
somes, on the other hand, generally have larger inter-
genic regions, which tend to be more variable. This is
reflected in both the higher overall level of sequence
conservation that we find for the microchromosomes
and also in the observation that we find significantly
less SNPs on microchromosomes than on intermediate-
and macrochromosomes. This may seem contradictory
to the higher rate of nucleotide divergence reported for
chicken and turkey microchromosomes (ICGSC 2004;
Axelsson et al. 2005), but these previous studies focused
on the intronic and coding regions of the chromosomes,
while our study also includes intergenic regions. Cod-
ing regions are under different evolutionary constraints
and for future analysis of the nucleotide divergence on
the different chromosome types of the great tit and the
zebra finch it will be beneficial to separately focus on
the coding regions as well.
Contigs harbouring 4272 (21%) of the SNPs could be
mapped to a unique location on the zebra finch gen-
ome. This number is lower than expected based on the
observation that 28–51% of the contigs result in a
unique hit on the zebra finch genome. This observation
that a relatively high number of SNPs are located on
contigs that do not align to the zebra finch genome can
partially be explained by regions that are highly con-
served between the great tit and the zebra finch, which
will result in a relatively high number of contigs that
map, but will, due to selective constraint, harbour rela-

98 N. E . M. VAN BERS ET AL.
tively less SNPs. Additionally, in regions that are not
highly conserved, the presence of SNPs will hamper the
alignment, further reducing the number of contigs with
SNPs that map to the zebra finch genome. A further
increase of the size of the reference genome sequence
will also improve the alignment of great tit sequences
to the zebra finch genome. This in turn will enhance the
number of great tit SNPs that can be uniquely mapped
onto the zebra finch genome, further facilitating the
analysis of the molecular evolution of bird genomes.
Recently, paired end sequencing was added to the pos-
sibilities of next generation sequencing. In this case, the
sequence template is sequenced from both the 5¢ and
the 3¢ end, resulting in two sequence reads with a spac-
ing of known size. This, together with the increase in
read length (currently 50–75 bp) will improve the
length of the assembled sequence. As a result, the effi-
ciency of SNP mapping and SNP detection will multi-
ply, and also the fraction of SNPs with sufficient
suitable sequence context to allow the design of a probe
for use in genotyping assays will increase.
In conclusion, we showed that combining next genera-
tion sequencing with RRLs is an efficient strategy for the
detection of thousands of SNPs in an ecological model
species for which a sequenced genome is currently lack-
ing. This approach can be further optimized by including
paired end data, longer sequence reads and by compara-
tive assembly to the zebra finch genome. We showed
that the zebra finch genome can provide the framework
to select several thousands of evenly distributed SNPs.
In the near future, these SNPs will be used for the geno-
typing of a panel of individual great tits and the con-
struction of a linkage map of the great tit. This map can
provide further insight into the evolution of (bird) ge-
nomes, but, above all, this map will be essential in identi-
fying genomic regions that explain phenotypic variation
between individuals in loci associated with quantitative
traits, e.g. behavioural and life history traits.
Acknowledgements
This project was financed by the Horizon program of the
Netherlands Genomics Initiative. Supercomputer facilities
were sponsored by the National Computing Facilities Founda-
tion (NCF), grant number SH-088-2-08, with financial support
from the Netherlands Organization for Scientific Research,
NWO. The authors would like to thank the Genome Sequenc-
ing Center at Washington University School of Medicine in
St. Louis for letting us use the zebra finch genome sequence
data.
Conflicts of interest
The authors have no conflict of interest to declare and note that
the sponsors of the issue had no role in the study design, data
collection and analysis, decision to publish, or preparation of
the manuscript.
References
Adams MD, Sutton GG, Smith HO, Myers EW, Craig Venter J
(2003) The independence of our genome assemblies.
Proceedings of the National Academy of Sciences of the United
States of America, 100, 3025–3026.
Altshuler D, Pollara VJ, Cowles CR et al. (2000) An SNP map
of the human genome generated by reduced representation
shotgun sequencing. Nature, 407, 513–516.
Axelsson E, Webster MT, Smith NGC, Burt DW, Ellegren H
(2005) Comparison of the chicken and turkey genomes reveals
a higher rate of nucleotide divergence on microchromosomes
than macrochromosomes. Genome Research, 15, 120–125.
Barker FK, Cibois A, Schikler P, Feinstein J, Cracraft J (2004)
Phylogeny and diversification of the largest avian radiation.
Proceedings of the National Academy of Sciences of the United
States of America, 101, 11040–11045.
Bennett PM, Owens IPF (2002) Evolutionary Ecology of Birds: Life
History, Mating System and Extinction. Oxford University
Press, Oxford, UK.
Beraldi D, McRae AF, Gratten J, Slate J, Visscher PM,
Pemberton JM (2006) Development of a linkage map and
mapping of phenotypic polymorphisms in a free-living
population of soay sheep (Ovis aries). Genetics, 173, 1521–1537.
Both C, Bouwhuis S, Lessells CM, Visser ME (2006) Climate
change and population declines in a long-distance migratory
bird. Nature, 441, 81–83.
Charmantier A, McCleery RH, Cole LR, Perrins C, Kruuk LEB,
Sheldon BC (2008) Adaptive phenotypic plasticity in
response to climate change in a wild bird population.
Science, 320, 800–803.
Derjusheva S, Kurganova A, Habermann F, Gaginskaya E
(2004) High chromosome conservation detected by
comparative chromosome painting in chicken, pigeon and
passerine birds. Chromosome Research, 12, 715–723.
Dohm JC, Lottaz C, Borodina T, Himmelbauer H (2008)
Substantial biases in ultra-short read data sets from high-
throughput DNA sequencing. Nucleic Acids Research, 36, e105.
Fidler AE, Van Oers K, Drent PJ, Kuhn S, Mueller JC,
Kempenaers B (2007) Drd4 gene polymorphisms are
associated with personality variation in a passerine bird.
Proceedings of the Royal Society of London. Series B: Biological
Sciences, 274, 1685–1691.
Garant D, Kruuk LEB (2005) How to use molecular marker
data to measure evolutionary parameters in wild
populations. Molecular Ecology, 14, 1843–1859.
Griffin DK, Robertson LB, Tempest HG et al. (2008) Whole
genome comparative studies between chicken and turkey
and their implications for avian genome evolution. BMC
Genomics, 9, 168.
Hansson B, Akesson M, Slate J, Pemberton JM (2005) Linkage
mapping reveals sex-dimorphic map distances in a passerine
bird. Proceedings of the Royal Society of London. Series B:
Biological Sciences, 272, 2289–2298.
Hillier LW, Marth GT, Quinlan AR et al. (2008) Whole-genome
sequencing and variant discovery in C. elegans. Natural
Methods, 5, 183–188.
� 2010 Blackwell Publishing Ltd
GENOME-WIDE SNP DETECTION IN PARUS MAJOR 99
ICGSC (2004) Sequence and comparative analysis of the
chicken genome provide unique perspectives on vertebrate
evolution. Nature, 432, 695–716.
Kerstens H, Crooijmans R, Veenendaal A et al. (2009) Large scale
single nucleotide polymorphism discovery in unsequenced
genomes using second generation high throughput sequenc-
ing technology: applied to turkey. BMC Genomics, 10, 479.
Kruuk LEB (2004) Estimating genetic parameters in natural
populations using the ‘animal model’. Philosophical
Transactions of the Royal Society of London. Series B: Biological
Sciences, 359, 873–890.
Lack D (1968) Ecological Adaptions for Breeding in Birds.
Methuen, London.
Li H, Ruan J, Durbin R (2008) Mapping short DNA sequencing
reads and calling variants using mapping quality scores.
Genome Research, 18, 1851–1858.
Matukumalli LK, Lawley CT, Schnabel RD et al. (2009)
Development and characterization of a high density SNP
genotyping assay for cattle. PLoS ONE, 4, e5350.
Merila J, Sheldon BC (2001) Avian quantitative genetics.
Current Ornithology, 16, 179–255.
Nussey DH, Postma E, Gienapp P, Visser ME (2005) Evolution:
selection on heritable phenotypic plasticity in a wild bird
population. Science, 310, 304–306.
Postma E, Van Noordwijk AJ (2005) Genetic variation for
clutch size in natural populations of birds from a reaction
norm perspective. Ecology, 86, 2344–2357.
Ramos AM, Crooijmans RP, Affara NA et al. (2009) Design of
a high density SNP genotyping assay in the pig using SNPs
identified and characterized by next generation sequencing
technology. PLoS ONE, 4, e6524.
Rozen S, Skaletsky H (2000) Primer3 on the WWW for general
users and for biologist programmers. Methods in Molecular
Biology (Clifton, N.J.), 132, 365–386.
Schwartz S, Kent WJ, Smit A et al. (2003) Human-mouse
alignments with BLASTZ. Genome Research, 13, 103–107.
Shetty S, Griffin DK, Graves JAM (1999) Comparative painting
reveals strong chromosome homology over 80 million years
of bird evolution. Chromosome Research, 7, 289–295.
Slate J (2005) Quantitative trait locus mapping in natural
populations: progress, caveats and future directions.
Molecular Ecology, 14, 363–379.
Slate J, Van Stijn TC, Anderson RM et al. (2002) A deer
(subfamily cervinae) genetic linkage map and the evolution
of ruminant genomes. Genetics, 160, 1587–1597.
Slate J, Gratten J, Beraldi D, Stapley J, Hale M, Pemberton JM
(2009) Gene mapping in the wild with SNPs: guidelines and
future directions. Genetica, 136, 97–107.
Stapley J, Birkhead TR, Burke T, Slate J (2008) A linkage map
of the zebra finch Taeniopygia guttata provides new insights
into avian genome evolution. Genetics, 179, 651–667.
The International HapMap Consortium (2005) A haplotype
map of the human genome. Nature, 437, 1299–1320.
Van Oers K, De Jong G, Van Noordwijk AJ, Kempenaers B,
Drent PJ (2005) Contribution of genetics to the study of
animal personalities: a review of case studies. Behaviour, 142,
1185–1206.
Van Tassell CP, Smith TPL, Matukumalli LK et al. (2008) SNP
discovery and allele frequency estimation by deep
sequencing of reduced representation libraries. Natural
Methods, 5, 247–252.
� 2010 Blackwell Publishing Ltd
Van Tuinen M, Hedges SB (2001) Calibration of avian
molecular clocks. Molecular Biology and Evolution, 18, 206–213.
Vignal A, Milan D, SanCristobal M, Eggen A (2002) A review
on SNP and other types of molecular markers and their use
in animal genetics. Genetics Selection Evolution, 34, 275–305.
Visser ME (2008) Keeping up with a warming world; assessing
the rate of adaptation to climate change. Proceedings of the Royal
Society of London. Series B: Biological Sciences, 275, 649–659.
Warren RL, Sutton GG, Jones SJM, Holt RA (2007) Assembling
millions of short DNA sequences using SSAKE.
Bioinformatics, 23, 500–501.
Wiedmann RT, Smith TPL, Nonneman DJ (2008) SNP
discovery in swine by reduced representation and high
throughput pyrosequencing. BMC Genetics, 9, 8.
Zhang Z, Gerstein M (2003) Patterns of nucleotide substitution,
insertion and deletion in the human genome inferred from
pseudogenes. Nucleic Acids Research, 31, 5338–5348.
Zhang Z, Schwartz S, Wagner L, Miller W (2000) A greedy
algorithm for aligning DNA sequences. Journal of
Computational Biology, 7, 203–214.
This paper is part of an ongoing project on SNP discovery to
map QTLs for timing of breeding and personality in great tits.
Nikkie van Bers is a postdoctoral fellow working on this pro-
ject. Knees van Oers is at the Netherlands Institute of Ecology
and its interested in the evolutionary genetics of animal per-
sonality. Hindrik Kerstens is a PhD at Animal Breeding and
Genomics Centre, Wageningen University and has a strong
interest in bioinformatics. Bert Dibbits is technical assistant in
molecular biology at Animal Breeding and Genomics Centre,
Wageningen University. Richard Crooijmans is assistant pro-
fessor at Animal Breeding and Genomics Centre, Wageningen
University, Dand is interested in genome research of farm ani-
mals. Marcel Visser is professor at the Department of Animal
Ecology at the Netherlands institute of Ecology and is inter-
ested in great tit lay date plasticity and its micro-evolution in
response to climate change. Martien Groenen is Professor in
Animal Genomics at Animal Breeding and Genomics Centre,
Wageningen University, Project and has a broad interest in
comparative and population genomics of animals.
Supporting Information
Additional supporting information may be found in the online
version of this article.
Supplementary information is available online containing the
primer and contig sequences, used for the validation of the
assembly and the SNP detection. It also contains the mapping
positions of these contigs, the confirmation status of the SNPs
used for the validation and the accession numbers of the con-
firmed SNPs. Furthermore, a graphical representation of the
distribution of the great tit contigs over the zebra finch genome
is provided.
Please note: Wiley-Blackwell are not responsible for the content
or functionality of any supporting information supplied by the
authors. Any queries (other than missing material) should be
directed to the corresponding author for the article.