The extended Moran effect and large-scale synchronous fluctuations in the size of great tit and blue...
11
Journal of Animal Ecology 2007 76, 315–325 © 2007 The Authors. Journal compilation © 2007 British Ecological Society Blackwell Publishing Ltd The extended Moran effect and large-scale synchronous fluctuations in the size of great tit and blue tit populations BERNT-ERIK SÆTHER 1 , STEINAR ENGEN 2 , VIDAR GRØTAN 1 , WOLFGANG FIEDLER 3 , ERIK MATTHYSEN 4 , MARCEL E. VISSER 5 , JONATHAN WRIGHT 1 , ANDERS PAPE MØLLER 6 , FRANK ADRIAENSEN 4 , HANS VAN BALEN 5 , DAWN BALMER 7 , MARK C. MAINWARING 8 , ROBIN H. MCCLEERY 9 , MIRIAM PAMPUS 10 and WOLFGANG WINKEL 11 1 Department of Biology, Norwegian University of Science and Technology, NO-7491 Trondheim, Norway; 2 Department of Mathematical Sciences, Norwegian University of Science and Technology, NO-7491 Trondheim, Norway; 3 Max Planck Institute for Ornithology, Vogelwarte Radolfzell, Schlossallee 2, D-78315 Radolfzell, Germany; 4 Laboratory of Animal Ecology, Department of Biology, University of Antwerp, B-2610 Antwerp, Belgium; 5 Netherlands Institute of Ecology, PO Box 40, NL-6666 ZG Heteren, the Netherlands; 6 Laboratorie de Parasitologie Evolutive, CNRS UMR 7103, Université Pierre et Marie Curie, Bâtiment A, 7ème étage, 7 quai St. Bernard, Case 237, FR-75252 Paris Cedex 05, France; 7 British Trust for Ornithology, The Nunnery, Thetford, Norfolk IP24 2PU, UK; 8 Department of Biological Sciences, University of Lancaster, Lancaster LA1 4YQ, UK; 9 Department of Zoology, University of Oxford, South Parks Road, OX1 3PS Oxford, UK; 10 Ökologische Forschungsstation Schlüchtern, Schlagweg 19, D-36381 Schlüchtern, Germany; and 11 Institute of Avian Research ‘Vogelwarte Helgoland’, Working Group Population Ecology, Bauernstrasse 14, D-38162 Cremlingen, Germany Summary 1. Synchronous fluctuations of geographically separated populations are in general explained by the Moran effect, i.e. a common influence on the local population dynamics of environmental variables that are correlated in space. Empirical support for such a Moran effect has been difficult to provide, mainly due to problems separating out effects of local population dynamics, demographic stochasticity and dispersal that also influ- ence the spatial scaling of population processes. Here we generalize the Moran effect by decomposing the spatial autocorrelation function for fluctuations in the size of great tit Parus major and blue tit Cyanistes caeruleus populations into components due to spatial correlations in the environmental noise, local differences in the strength of density regulation and the effects of demographic stochasticity. 2. Differences between localities in the strength of density dependence and nonlinearity in the density regulation had a small effect on population synchrony, whereas demo- graphic stochasticity reduced the effects of the spatial correlation in environmental noise on the spatial correlations in population size by 21·7% and 23·3% in the great tit and blue tit, respectively. 3. Different environmental variables, such as beech mast and climate, induce a common environmental forcing on the dynamics of central European great and blue tit popula- tions. This generates synchronous fluctuations in the size of populations located several hundred kilometres apart. 4. Although these environmental variables were autocorrelated over large areas, their contribution to the spatial synchrony in the population fluctuations differed, dependent on the spatial scaling of their effects on the local population dynamics. We also dem- onstrate that this effect can lead to the paradoxical result that a common environmental variable can induce spatial desynchronization of the population fluctuations. Correspondence: Bernt-Erik Sæther, Department of Biology, NTNU, Realfagsbygget, N-7491 Trondheim, Norway. Tel.: +4773590584. Fax: +4773596100. E-mail: [email protected] Re-use of this article is permitted in accordamce with the Creative Commons Deed, Attribution 2.5, which does not permit commercial exploitation.
-
Upload
independent -
Category
Documents
-
view
3 -
download
0
Transcript of The extended Moran effect and large-scale synchronous fluctuations in the size of great tit and blue...
Journal of Animal Ecology
2007
76
, 315–325
© 2007 The Authors.Journal compilation© 2007 British Ecological Society
Blackwell Publishing Ltd
The extended Moran effect and large-scale synchronous fluctuations in the size of great tit and blue tit populations
BERNT-ERIK SÆTHER
1
, STEINAR ENGEN
2
, VIDAR GRØTAN
1
, WOLFGANG FIEDLER
3
, ERIK MATTHYSEN
4
, MARCEL E. VISSER
5
, JONATHAN WRIGHT
1
, ANDERS PAPE MØLLER
6
, FRANK ADRIAENSEN
4
, HANS VAN BALEN
5
, DAWN BALMER
7
, MARK C. MAINWARING
8
, ROBIN H. MCCLEERY
9
, MIRIAM PAMPUS
10
and WOLFGANG WINKEL
11
1
Department of Biology, Norwegian University of Science and Technology, NO-7491 Trondheim, Norway;
2
Department of Mathematical Sciences, Norwegian University of Science and Technology, NO-7491 Trondheim, Norway;
3
Max Planck Institute for Ornithology, Vogelwarte Radolfzell, Schlossallee 2, D-78315 Radolfzell, Germany;
4
Laboratory of Animal Ecology, Department of Biology, University of Antwerp, B-2610 Antwerp, Belgium;
5
Netherlands Institute of Ecology, PO Box 40, NL-6666 ZG Heteren, the Netherlands;
6
Laboratorie de Parasitologie Evolutive, CNRS UMR 7103, Université Pierre et Marie Curie, Bâtiment A, 7ème étage, 7 quai St. Bernard, Case 237, FR-75252 Paris Cedex 05, France;
7
British Trust for Ornithology, The Nunnery, Thetford, Norfolk IP24 2PU, UK;
8
Department of Biological Sciences, University of Lancaster, Lancaster LA1 4YQ, UK;
9
Department of Zoology, University of Oxford, South Parks Road, OX1 3PS Oxford, UK;
10
Ökologische Forschungsstation Schlüchtern, Schlagweg 19, D-36381 Schlüchtern, Germany; and
11
Institute of Avian Research ‘Vogelwarte Helgoland’, Working Group Population Ecology, Bauernstrasse 14, D-38162 Cremlingen, Germany
Summary
1.
Synchronous fluctuations of geographically separated populations are in generalexplained by the Moran effect, i.e. a common influence on the local population dynamicsof environmental variables that are correlated in space. Empirical support for such aMoran effect has been difficult to provide, mainly due to problems separating out effectsof local population dynamics, demographic stochasticity and dispersal that also influ-ence the spatial scaling of population processes. Here we generalize the Moran effect bydecomposing the spatial autocorrelation function for fluctuations in the size of great tit
Parus major
and blue tit
Cyanistes caeruleus
populations into components due to spatialcorrelations in the environmental noise, local differences in the strength of densityregulation and the effects of demographic stochasticity.
2.
Differences between localities in the strength of density dependence and nonlinearityin the density regulation had a small effect on population synchrony, whereas demo-graphic stochasticity reduced the effects of the spatial correlation in environmentalnoise on the spatial correlations in population size by 21·7% and 23·3% in the great titand blue tit, respectively.
3.
Different environmental variables, such as beech mast and climate, induce a commonenvironmental forcing on the dynamics of central European great and blue tit popula-tions. This generates synchronous fluctuations in the size of populations located severalhundred kilometres apart.
4.
Although these environmental variables were autocorrelated over large areas, theircontribution to the spatial synchrony in the population fluctuations differed, dependenton the spatial scaling of their effects on the local population dynamics. We also dem-onstrate that this effect can lead to the paradoxical result that a common environmentalvariable can induce spatial desynchronization of the population fluctuations.
Correspondence: Bernt-Erik Sæther, Department of Biology, NTNU, Realfagsbygget, N-7491 Trondheim, Norway.Tel.:
+
4773590584. Fax:
+
4773596100. E-mail: [email protected] of this article is permitted in accordamce with the Creative Commons Deed, Attribution 2.5, which does not permit commercialexploitation.
316
B.-E. Sæther
et al.
© 2007 The Authors.Journal compilation© 2007 British Ecological Society,
Journal of Animal Ecology
,
76
, 315–325
5.
This demonstrates that a proper understanding of the ecological consequences ofenvironmental changes, especially those that occur simultaneously over large areas,will require information about the spatial scaling of their effects on local populationdynamics.
Key-words
: blue tit, density dependence, environmental stochasticity, great tit, Moraneffect, population synchrony, spatial population dynamics.
Journal of Animal Ecology
(2007)
76
, 315–325doi: 10.1111/j.1365-2656.2006.01195.x
Introduction
Synchronous fluctuation in the size of populations thatare widely separated in space is a striking biologicalphenomenon that has been documented in a wide rangeof taxa (Ranta, Kaitala & Lindström 1998; Bjørnstad,Ims & Lambin 1999; Koenig 1999; Liebhold, Koenig &Bjørnstad 2004). However, it has been difficult to quan-tify the contribution of different ecological mechanismsto the observed variation in the level of population syn-chrony (Bjørnstad
et al
. 1999). This in turn has reducedour ability to predict the population consequences ofchanges in the environment that occur simultaneouslyover large areas, such as expected changes in the climate(Houghton
et al
. 2001), which will affect populationfluctuations both locally and regionally, and therebythe risk of extinction of populations (Engen, Lande &Sæther 2002a).
Spatial correlations in ecological variables caused by,for instance, similar climates, were intially suggested tobe synchronizing agents for the fluctuations in size ofspatially segregated populations. This led Moran, morethan 50 years ago (1953), to develop one of the fewquantitative predictions in population ecology. Hepredicted that if population synchrony is caused by cor-relation in an environmental variable, this should resultin an autocorrelation in population fluctuations equalto the autocorrelation in environmental noise, assum-ing the same linear density regulation on a logarithmicscale in all populations. According to this Moran effect,the correlation in the fluctuations between two geograph-ically separated populations will always be the same,irrespective of initial population sizes (Royama 1992).
Unfortunately, support for the idea of environmentalvariables as synchronizing agents in space for temporalvariation in size or growth rates of populations has beendifficult to find, except in only a few cases (Grenfell
et al
.1998; Benton, Lapsley & Beckerman 2002). A patternthat often emerges is that when population synchronyis examined at large spatial scales; the spatial scaling ofmany environmental variables that are known to influencelocal population dynamics is often far larger than thescaling of the synchrony in the population fluctuations(Koenig 2001). Even in an experimental laboratory sys-tem in which different populations were provided foodwith a correlation of 1, the correlations in the popula-
tion fluctuations were still significantly smaller than 1(Benton, Lapsley & Beckerman 2001). This may suggestthat dispersal or the form of density regulation in thelocal dynamics (Ranta
et al
. 1998; Lande, Engen & Sæther1999; Lundberg
et al
. 2000; Liebhold
et al
. 2004; Benton& Beckerman 2005; Ranta, Lundberg & Kaitala 2006),are more important in creating such synchronousfluctuations than any spatial covariation that exists inthe environment.
The results of Moran (1953) are based on severalsimplifying assumptions (Ranta
et al
. 2006). First, a log-linear model of density regulation is assumed. Com-parative studies of the population dynamics of birds havedemonstrated that density dependence is not necessarilylinear on a logarithmic scale (Sæther & Engen 2002;Sæther, Engen & Matthysen 2002a; Williams, Ives &Applegate 2003). Second, Moran (1953) assumed thatenvironmental variables affect the local dynamicssimilarly over the entire geographical range (Lundberg
et al
. 2000). However, analyses of intraspecific variationin environmental influences on the population dynamicsof several vertebrate species do indicate large regionalvariation in the impact of the same environmentalvariable on population fluctuations (Stenseth
et al
. 1999;Mysterud
et al
. 2000; Sæther
et al
. 2003). Theoreticalanalyses have shown (Engen & Sæther 2005) that relax-ing those quite restrictive assumptions and generalizingthe early results by Moran (1953) show that envir-onmental variables may contribute substantially topopulation synchrony, although the spatial scaling ofthe synchrony may be far less than expected from thegeographical scale of covariation in the environment.
Here we analyse patterns in the dynamics of great tit
Parus major
L. and blue tit
Cyanistes caeruleus
(L.)populations that have been studied for decades in sev-eral localities across central Europe. We will examinewhether a common environmental forcing across largerdistances on the population dynamics is present in thosespecies by taking account of local variation in the popu-lation dynamics. We will then quantitatively analysewhether spatial heterogeneity in the contribution ofdifferent environmental variables to local populationdynamics can explain any proportion of the spatialsynchrony in the population fluctuations. In particular,we will examine the theoretical prediction (Engen &Sæther 2005) that an environmental variable that is

317
Spatial synchrony in tit population fluctuations
© 2007 The Authors.Journal compilation© 2007 British Ecological Society,
Journal of Animal Ecology
,
76
, 315–325
correlated over large areas can act to
desynchronize
thepopulation dynamics if there are large differencesamong localities in its effect on the local dynamics.
Population model
Engen & Sæther (2005) derived a simple expression forthe spatial synchrony in population fluctuations usingthe diffusion approximation to the theta-logistic model(Gilpin & Ayala 1973; Lande, Engen & Sæther 2003)with expected change in population size
N
from oneyear to the next equal to
eqn 1
The parameter
r
is the specific growth rate at populationsize
N
=
1,
K
is the carrying capacity and
θ
is a para-meter in the theta-logistic model (Gilpin & Ayala 1973)determining the form of density regulation (Sæther
et al
. 2002a; Lande
et al
. 2003). Engen & Sæther (2005)derived a simple equation expressing the deviationfrom the Moran (1953)-effect due to nonlinearity indensity regulation as well as in parameters describingthe dynamics. The results were expressed in terms of atransformed population size,
eqn 2
which turns out to have a rather simple linear type ofdynamics. Following Engen & Sæther (2005) the spatialcorrelation between two transformed population sizescan be shown equal to
eqn 3
for small or moderate fluctuations around
K.
Here
ρ
e
isthe spatial correlation between the environmental noiseterms, and, using indices 1 and 2 for two populations at
different locations, repre-
sents the component due to demographic stochasticity and
is the effect of spatial heterogeneity in the density regu-lation. Furthermore, is the demographic variance,
, and the strength of densityregulation at a scale of transformed population sizes
.Our next step was to examine how the environmental
stochasticity in the local dynamics can be partitioned intothe effects of regional or local environmental covariates.Following Sæther
et al
. (2003; Sæther, Sutherland &Engen 2004b), we introduce environmental covariatesas random effects in each locality by writing the effects ofan environmental variable
Z
=
τ
V
on the environmentalnoise term in the local population dynamics as a linearfunction , where
U
and
V
are standard nor-mal variates with zero means,
τ
is the standard deviationof
Z
,
q
is the regression coefficient expressing the effect
of
Z
and is the variance in the local dynamics unex-plained by
Z.
The proportion of the local dynamicsexplained by covariate
Z
becomes .Finally, we express the environmental correlation
ρ
e
between localities 1 and 2 as a linear combination of thespatial covariation in the covariate
Z
,
ρ
Z
=
corr(
Z
1
,
Z
2
), andin the component unexplained by
Z
,
ρ
res
=
corr(
U
1
,
U
2
),
eqn 4
where
p
denotes the proportion of variance of localdynamics explained by the covariate
Z
. Thus, the effecton the spatial environmental correlation
ρ
e
betweenlocalities 1 and 2 increases with the spatial correlationof
Z
if sign(
q
1
,
q
2
) > 0, but depends also upon how
Z
affects the local population dynamics.A direct effect as well as a lagged effect of 1 year of
the covariates was included in the analyses.
Methods and population model
This study is based on 28 great tit and 18 blue tit popu-lations in central Europe that have been studied in 15 ormore years (Fig. 1).
At all study sites the two species mainly breed in nestboxes. Thus, any bias in population estimates will be small.
The North Atlantic Oscillation (NAO) is a global climatephenomenon (Hurrell
et al
. 2003) expressed as an indexbased on the difference in normalized sea level pres-sures between Lisbon, Portugal and Stykkisholmur,Iceland, from 1864 through 2002 for the winter period
E( )
.∆N N n rn
n
K| = = −
−−
1
1
1
θ
θ
g N N( ) ( )/ ,= − −1 θ θ
ρ ρ ω ωθX e d =
ω ε εd K K= + + / ( / )( / )1 1 11 1 2 2
ω β θ σ β θ σ β β ρ σ σ θ θθ ( )( )/( )= − − + −2 21 12
12
2 22
22
1 2 1 2 1 2e
σd2
ε σ σ /= d e2 2 σ σ σ2 2 2= + /e d K
β θσ / ( ) ( / )= −r g K 1 2 2
σe2
σ τresU q V2 +
σres2
Fig. 1. The locations of population with time series of bothgreat tit and blue tit (squares) or only the great tit (circles).
p q qres /( )= +2 2 2 2 2τ σ τ
ρ ρ ρe res Zp p q q p p= − − +( )( ) ( , )( ),1 11 2 1 2 1 2sign
318B.-E. Sæther et al.
© 2007 The Authors.Journal compilation© 2007 British Ecological Society, Journal of Animal Ecology, 76, 315–325
(see http://www.cgd.ucar.edu/cas/climind). A high pos-itive NAO index is generally associated with relativelywarm winters with a lot of precipitation in northernAtlantic coastal Europe, whereas low values of the indextend to result in cold winters with low levels of precipi-tation (Hurrell et al. 2003). NAO influences local popu-lation dynamics either through an effect on climate suchas snow- or ice-cover or over larger areas (Engen et al.2005; Grøtan et al. 2005) or influencing complex inter-actions among local climate variables (Hallett et al. 2004).
The production of superabundant seeds by differenttree species, ‘masting’, has effects throughout manytemperate ecosystems (Ostfeld & Keesing 2000; Koenig& Knops 2005) and has also been identified as animportant factor in the population ecology of tits(Lebreton 1990; Slagsvold 1975; Perdeck, Visser & vanBalen 2000). Data on annual variation in beech mast werecollected at different localities in England (Packham &Hilton 2002), the Netherlands (Perdeck et al. 2000) andGermany (Zang 2003). Three levels of masting were used:(1) small; (2) moderate; and (3) high.
Data on monthly mean temperatures during the periodJanuary–July were obtained from local weather stationsclose to the study areas. We used monthly, bimonthlyand 3-monthly means in the analyses.
Estimates of the demographic variance were obtainedusing individual based data for seven great tit and fiveblue tit populations. For those populations, in whichno individual data were available, the mean values wereused ( and for great tits and bluetits, respectively). Because the contribution of to thevariance in the specific growth rate r (eqn 1) is density-dependent (Lande et al. 2003), we excluded populationsin which K < 15.
We modelled the density dependence using the dis-crete logistic model (May 1981). This model of densityregulation is typical for many populations of passerinebirds (Sæther et al. 2000, 2002b; Sæther & Engen 2002).We fitted the model following the approach by Sætheret al. (2002b) and Engen et al. (2005).
The spatial analysis of ρres is based on studying theresiduals Rt obtained from fitting the model to timeseries observations at each location z,
eqn 5
where E is the estimated expected value using the dis-crete logistic model, Yt denotes the vector of covariatesand Ue and Ud are standard normal variates with zeromeans describing the environmental and demographicstochasticity, respectively.
We used the normal approximation and chose an expon-ential model for the spatial autocorrelation functionρe (Engen et al. 2005; Lillegård, Engen & Sæther 2005),characterized by the correlation at zero distance ρ0, the
correlation at very long distance ρ∞ and the scaling l.Although several measures of the scaling of the spatialautocorrelation function have been suggested (e.g.Roughgarden 1977; Myers, Mertz & Bridson 1997), wehere define scaling simply as the standard distributionof the autocorrelation function, following the approachby Lande et al. (1999). A graphical presentation of theparameters characterizing the autocorrelation functionis found in fig. 1 in Lillegård et al. (2005).
The sampling properties of the estimates were foundby parametric bootstrapping (Engen et al. 2005; Lillegårdet al. 2005), simulating the residuals from the appro-priate multinormal model as defined by the autocorre-lation function, the distance matrix and estimates of localpopulation parameters (Engen et al. 2005). We alsocomputed the spatial correlation of the residual noise ρe
obtained from fitting the dynamic model with covariateZ and a set of parameters (q1, q2) from two differentsites. The significance of a change in the estimates wascalculated by examining whether 0 was included in theappropriate lower and upper quantiles of the distribu-tion of differences between the two bootstrap distribu-tions (Lillegård et al. 2005).
Results
Because the spatial autocorrelation function for thetransformed population sizes in ρX (eqn 3) is based on acontinuous approximation, we first demonstrate itsapplicability in describing the dynamics of great tit andblue tit populations, which is modelled by the discretelogistic model. Assuming moderate fluctuations inpopulation size, we assume that the total variance ofthe noise on the logarithmic scale is approximately aconstant σ2 and that expected dynamics at each localityis independent of its spatial location. For each pair ofpopulations the parameter ρe is then calculated as thecorrelation between the environmental components ofthe noise terms. The factors ωθ and ωd in eqn 3 were foundby inserting the estimates of the dynamical parametersof the two populations. These estimates of ρX can nowbe compared to the direct calculation of the correlationsbetween the transformed population sizes . Figure 2shows these two different estimates of ρX plotted againsteach other for each pair of populations.
Although the actual correlations in transformedpopulation size were often slightly higher than thosecalculated from parameters characterizing the localpopulation dynamical as well as the environmentalcovariation in space (Fig. 2), this still indicates that eqn3 gives valid estimates of the correlation in temporalvariation in size of two populations located at differentlocalities. Furthermore, the spatial autocorrelation inpopulation fluctuations decreased with distance betweenthe localities in both great tit and blue tit (Fig. 3). In thegreat tit a significant (P < 0·001) common spatial com-ponent ρX,∞ was present in the correlation at all localities,whereas in the blue tit the spatial autocorrelationapproached zero at long distances.
σd2
)d2 0 483 = ⋅ )d
2 0 415 = ⋅σd
2
R z N z N z N z Y
z U z z U z N zt t t t t
e e d d t
( ) ln ( ) [ln ( ) ln ( ), ]
( ) ( ) ( ) ( )/ ( ),
= − | ≈
++ +1 1E
σ σ
′ρX

319Spatial synchrony in tit population fluctuations
© 2007 The Authors.Journal compilation© 2007 British Ecological Society, Journal of Animal Ecology, 76, 315–325
We can then use eqn 3 to decompose this spatialautocorrelation in population fluctuations into multi-plicative components due to spatial heterogeneity inthe effects of density regulation on local dynamics ωθ,demographic stochasticity ωd and the spatial correla-tion in the environmental noise ρe.
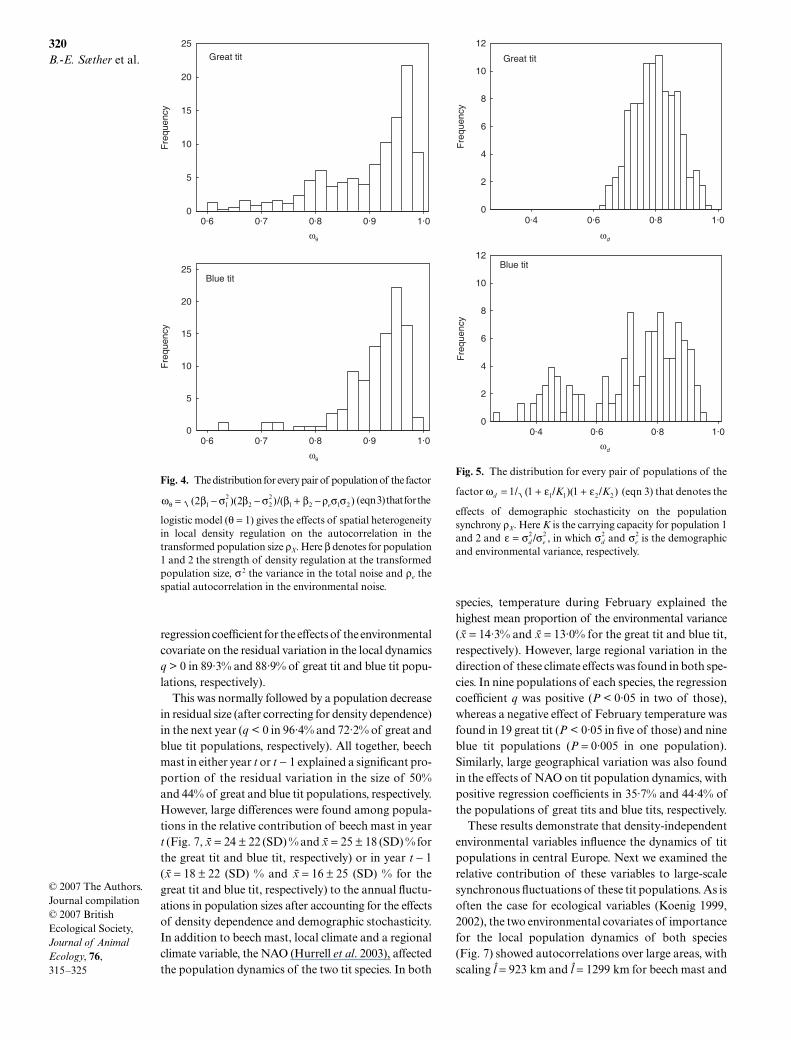
Local variation in the effects of density dependenceon the population dynamics had a small effect on thepopulation synchrony because the median value of factorωθ in eqn 3 was 0·929 and 0·928 for the great tit and theblue tit, respectively (Fig. 4).
In contrast, the effects of the component in the spa-tial autocorrelation due to demographic stochasticityon the population synchrony was larger (Fig. 5, themedian value of ωd was 0·793 and 0·767 for the great titand blue tit, respectively). This shows that the spatialsynchrony in the population dynamics was mainly gen-erated by spatial correlation in the noise and was onlyto a small degree influenced by nonlinearity and localheterogeneity in the expected dynamics.
Although spatial covariation was found in the popu-lation fluctuations of both species (Fig. 3), the patternof decay in synchrony with distance differed betweenthe two species, which in turn was related to an inter-specific difference in the pattern of spatial covariationin the environmental noise. In the great tit, a common
environmental force acted on all populations, giving anenvironmental correlation in the noise at infinite dis-tances that was significantly (P < 0·001) greater than 0(Fig. 6, )e,∞ = 0·33 (95% CI = 0·23–0·43)). In contrast,the blue tit data showed that no common environmentalcorrelation was present at infinite distances (Fig. 6,)e,∞ = 0). This indicates a larger common environmentcomponent in the population dynamics of great tit thanin the dynamics of the blue tit populations. However,there was a lower rate of decay with distance in envi-ronmentally induced covariation in population sizes inblue tits (spatial scaling of the environmental noise le =380 km (95% CI = 64–1665 km)) as compared withgreat tit populations (le = 34 km (95% CI = 10–86 km);interspecific difference in le significant P = 0·014).
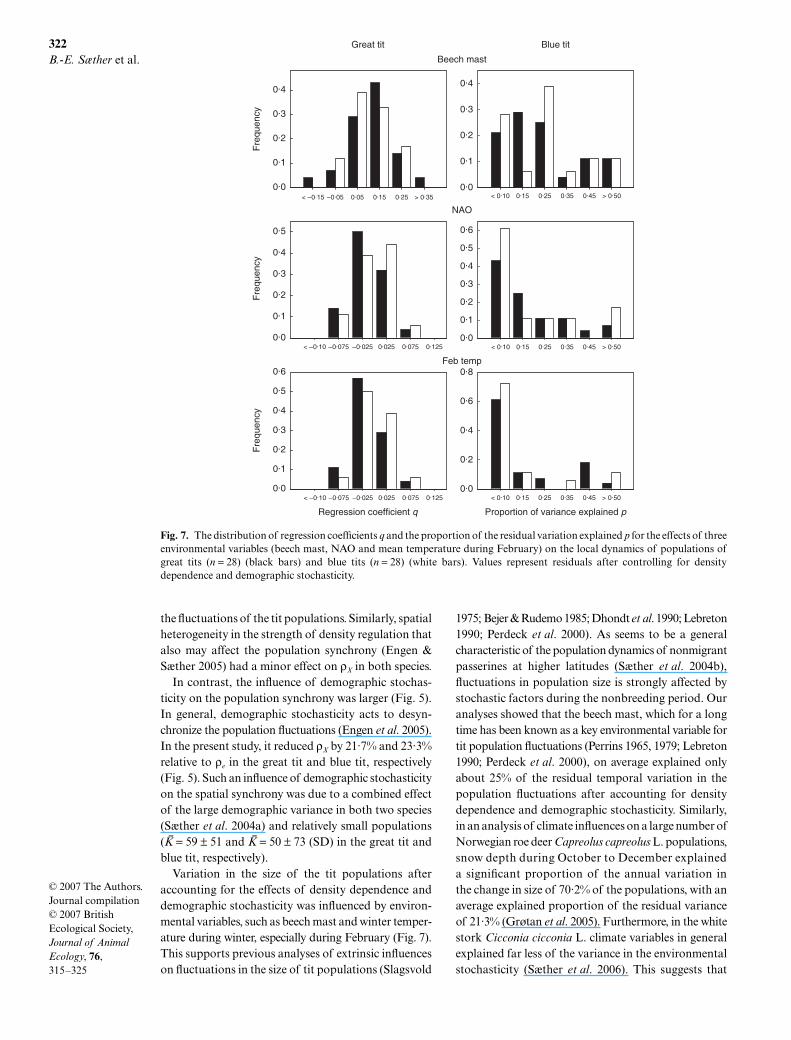
We then examined how different environmental var-iables affected the local dynamics of the two tit species.Variation in beech mast was found to strongly influencethe population dynamics of most of the tit populations.In general, relatively large population sizes were foundduring breeding seasons following masting (Fig. 7,
Fig. 2. The correlation in transformed population sizes(eqn 2) for each pair of populations calculated by using theestimates of local population parameters (eqn 3) ρX in relationto the actual correlation in transformed population size in thetime series . The dashed line indicates the line with a slope of 1.′ρX
Fig. 3. The correlation between temporal variation intransformed sizes (eqn 2) of Great tit and Blue tit populationsin Continental Europe as function of distance. The solid linedenotes the 50% quantile of the bootstrap-distributions of ρX
that were calculated (eqn 3) from the parameters describing ρe
as well as those describing local dynamics. Because the localparameters r and K were approximately uncorrelated in space,a bootstrap-replicate of ρX was computed by first calculatinga replicate of ρe, then choosing with replacement two sets ofparameters from two different sites chosen at randomand finally inserting these in eqn 3.
′ρX
( , )β σe2
320B.-E. Sæther et al.
© 2007 The Authors.Journal compilation© 2007 British Ecological Society, Journal of Animal Ecology, 76, 315–325
regression coefficient for the effects of the environmentalcovariate on the residual variation in the local dynamicsq > 0 in 89·3% and 88·9% of great tit and blue tit popu-lations, respectively).
This was normally followed by a population decreasein residual size (after correcting for density dependence)in the next year (q < 0 in 96·4% and 72·2% of great andblue tit populations, respectively). All together, beechmast in either year t or t − 1 explained a significant pro-portion of the residual variation in the size of 50%and 44% of great and blue tit populations, respectively.However, large differences were found among popula-tions in the relative contribution of beech mast in yeart (Fig. 7, ≈ = 24 ± 22 (SD) % and ≈ = 25 ± 18 (SD) % forthe great tit and blue tit, respectively) or in year t − 1(≈ = 18 ± 22 (SD) % and ≈ = 16 ± 25 (SD) % for thegreat tit and blue tit, respectively) to the annual fluctu-ations in population sizes after accounting for the effectsof density dependence and demographic stochasticity.In addition to beech mast, local climate and a regionalclimate variable, the NAO (Hurrell et al. 2003), affectedthe population dynamics of the two tit species. In both
species, temperature during February explained thehighest mean proportion of the environmental variance(≈ = 14·3% and ≈ = 13·0% for the great tit and blue tit,respectively). However, large regional variation in thedirection of these climate effects was found in both spe-cies. In nine populations of each species, the regressioncoefficient q was positive (P < 0·05 in two of those),whereas a negative effect of February temperature wasfound in 19 great tit (P < 0·05 in five of those) and nineblue tit populations (P = 0·005 in one population).Similarly, large geographical variation was also foundin the effects of NAO on tit population dynamics, withpositive regression coefficients in 35·7% and 44·4% ofthe populations of great tits and blue tits, respectively.
These results demonstrate that density-independentenvironmental variables influence the dynamics of titpopulations in central Europe. Next we examined therelative contribution of these variables to large-scalesynchronous fluctuations of these tit populations. As isoften the case for ecological variables (Koenig 1999,2002), the two environmental covariates of importancefor the local population dynamics of both species(Fig. 7) showed autocorrelations over large areas, withscaling l = 923 km and l = 1299 km for beech mast and
Fig. 4. The distribution for every pair of population of the factor
(eqn 3) that for the
logistic model (θ = 1) gives the effects of spatial heterogeneityin local density regulation on the autocorrelation in thetransformed population size ρX. Here β denotes for population1 and 2 the strength of density regulation at the transformedpopulation size, σ 2 the variance in the total noise and ρe thespatial autocorrelation in the environmental noise.
ω β σ β σ β β ρ σ σθ = − − + − ( )( )/( )2 21 12
2 22
1 2 1 2e
Fig. 5. The distribution for every pair of populations of the
factor (eqn 3) that denotes the
effects of demographic stochasticity on the populationsynchrony ρX. Here K is the carrying capacity for population 1and 2 and , in which and is the demographicand environmental variance, respectively.
ω ε εd K K / ( / )( / )= + +1 1 11 1 2 2
ε σ σ /= d e2 2 σd
2 σe2

321Spatial synchrony in tit population fluctuations
© 2007 The Authors.Journal compilation© 2007 British Ecological Society, Journal of Animal Ecology, 76, 315–325
February temperatures, respectively. However, there weredifferences in their contribution to the environmentalcomponent of spatial autocorrelation in the popula-tion dynamics. In the great tit, variation in beech mastexplained a similar proportion of the spatial correlationat all distances (Fig. 6), but a significant (P < 0·005)proportion of the common noise still remained unex-plained even at very long distances. A similar, but smallereffect of NAO was also found in this species. In con-trast, in the blue tit, variation in beech mast as well asNAO explained a larger proportion of the synchronyat much shorter distances. At longer distances, thesetwo variables acted so as to desynchronize the popula-tion fluctuations (Fig. 6), because the spatial corre-lation in the noise increased after accounting for theirlocal effects. In both species, February temperatureexplained all of the common environmental noise atlonger distances (Fig. 6). This shows that environmentalvariables that are highly correlated over larger areasmay differ greatly in their influence on the spatial syn-chrony in population fluctuations, depending upondifferences in spatial variation in local effects on popu-lation dynamics.
Discussion
Our analyses demonstrate that a common autocorre-lation is present across central Europe in the fluctuationsin the size of great tit and blue tit populations (Fig. 3).Spatial heterogeneity and nonlinearities in the dynamicsreduced the spatial correlation in the populationfluctuations ρX to 73·7% and 71·2% of the spatial cor-relation in the environmental noise ρe in the great tit andblue tit, respectively (Figs 4 and 5). Thus, the synchronousfluctuations in the size of spatially separated popula-tions of these two species are to a large extent caused bythe influence of environmental variables, such as thebeech mast and temperature during February that arecorrelated in space over large areas (Fig. 6). This providesa quantitative demonstration, as predicted by Moran(1953), that environmental variables can synchronizepopulation fluctuations over larger areas. However, thespatial scaling of population fluctuations is far lessthan the spatial scaling in the environmental variablesbecause of regional variation in the strength of densitydependence and environmental influences on the localpopulation dynamics (Fig. 7). A similar pattern wasalso found in the effects of rainfall on the spatial synchronyin the dynamics of red kangaroos Macropus rufusDesmarest (Jonzén et al. 2005) as well as in a labora-tory study of soil mites Sanscassania berlesei (Michael)(Benton et al. 2001).
Our approach allows the calculation of the effectsof various factors, such as density dependence anddemographic stochasticity, on the spatial autocorrelation(eqn 3). This enables us to quantitatively estimate therelative contribution of various factors to the popula-tion synchrony. Although this approach is based onseveral simplifying assumptions, the close relationshipbetween the predicted correlation from eqn 3 and theactual correlation in transformed population sizes (Fig. 2)suggest that this may be a valid approach to model thespatial dynamics of tit populations. Another advantageis that many of the estimated parameters can be inter-preted within a general theoretical framework that hasbeen developed for analyses of spatial synchrony inpopulation fluctuations (Lande et al. 1999; Engen et al.2002a; Engen, Lande & Sæther 2002b).
In our study system nonlinearities and spatial hetero-geneity in the local dynamics slightly reduced the effectsof autocorrelation in the environmental noise on thesynchrony in population fluctuations (Fig. 4). In ahomogeneous environment, Engen & Sæther (2005)showed that the effects of variation in the form of densityregulation on the spatial synchrony could be expressedas , where forthe logistic model. In our study populations, we foundthat the mean of the estimates of these two parametersfor all populations was ® = 0·84 and )2 = 0·0790 for thegreat tit, and ® = 0·80 and )2 = 0·0794 for the blue tit,giving ( = 0·053 and ( = 0·10 for the great tit and blue tit,respectively. Hence, nonlinearities in density depend-ence had only a small effect on the spatial synchrony in
Fig. 6. The correlations in the fluctuations of great tit andblue tit populations in central Europe due to environmentalcovariation ρe as a function of distance (red line). Black linesdenote the spatial autocorrelation in residuals that remainafter accounting for the effects on local population dynamicsof either beech mast, NAO or temperature during February.
ρ ρ δ δρX e e= − − ( )/( )1 1 δ σ σ ( / )≈ −2 22r
322B.-E. Sæther et al.
© 2007 The Authors.Journal compilation© 2007 British Ecological Society, Journal of Animal Ecology, 76, 315–325
the fluctuations of the tit populations. Similarly, spatialheterogeneity in the strength of density regulation thatalso may affect the population synchrony (Engen &Sæther 2005) had a minor effect on ρX in both species.
In contrast, the influence of demographic stochas-ticity on the population synchrony was larger (Fig. 5).In general, demographic stochasticity acts to desyn-chronize the population fluctuations (Engen et al. 2005).In the present study, it reduced ρX by 21·7% and 23·3%relative to ρe in the great tit and blue tit, respectively(Fig. 5). Such an influence of demographic stochasticityon the spatial synchrony was due to a combined effectof the large demographic variance in both two species(Sæther et al. 2004a) and relatively small populations(K = 59 ± 51 and K = 50 ± 73 (SD) in the great tit andblue tit, respectively).
Variation in the size of the tit populations afteraccounting for the effects of density dependence anddemographic stochasticity was influenced by environ-mental variables, such as beech mast and winter temper-ature during winter, especially during February (Fig. 7).This supports previous analyses of extrinsic influenceson fluctuations in the size of tit populations (Slagsvold
1975; Bejer & Rudemo 1985; Dhondt et al. 1990; Lebreton1990; Perdeck et al. 2000). As seems to be a generalcharacteristic of the population dynamics of nonmigrantpasserines at higher latitudes (Sæther et al. 2004b),fluctuations in population size is strongly affected bystochastic factors during the nonbreeding period. Ouranalyses showed that the beech mast, which for a longtime has been known as a key environmental variable fortit population fluctuations (Perrins 1965, 1979; Lebreton1990; Perdeck et al. 2000), on average explained onlyabout 25% of the residual temporal variation in thepopulation fluctuations after accounting for densitydependence and demographic stochasticity. Similarly,in an analysis of climate influences on a large number ofNorwegian roe deer Capreolus capreolus L. populations,snow depth during October to December explaineda significant proportion of the annual variation inthe change in size of 70·2% of the populations, with anaverage explained proportion of the residual varianceof 21·3% (Grøtan et al. 2005). Furthermore, in the whitestork Cicconia cicconia L. climate variables in generalexplained far less of the variance in the environmentalstochasticity (Sæther et al. 2006). This suggests that
Fig. 7. The distribution of regression coefficients q and the proportion of the residual variation explained p for the effects of threeenvironmental variables (beech mast, NAO and mean temperature during February) on the local dynamics of populations ofgreat tits (n = 28) (black bars) and blue tits (n = 28) (white bars). Values represent residuals after controlling for densitydependence and demographic stochasticity.

323Spatial synchrony in tit population fluctuations
© 2007 The Authors.Journal compilation© 2007 British Ecological Society, Journal of Animal Ecology, 76, 315–325
single climate variables rarely explains more than 20%of the residual variation in annual fluctuations in popu-lation size after accounting for the effects of densitydependence and demographic stochasticity. One rea-son for this is covariation among different environ-mental variables that affect local population dynamics.For instance, as pointed out by Perrins (1965), theeffects of the beech mast on tit populations may bestronger after mild than after cold winters.
An additional aspect of climate influences on titpopulation dynamics was that the direction of the effectof the same environmental variable could also differamong populations located close to each other (Fig. 7).For instance, changes in population size of both specieswere negatively associated with beech mast in the sametwo localities (in addition to one in which only great titdata were available). This shows that large spatialheterogeneity is often present in the effects of the sameenvironmental variables on local population fluctuations(Stenseth et al. 1999; Mysterud et al. 2000; Sætheret al. 2003, 2004b). Consequently, the presence of suchspatial variation will according to eqn 4 reduce theimpact on the spatial synchrony in the population fluc-tuations of an environmental covariate that in itself iscorrelated over large areas. Accordingly, in both speciesNAO had nearly a similar contribution the spatialsynchrony in the population fluctuations, although itexplained on average a smaller proportion of the localpopulation fluctuations than the beech mast (Fig. 6). Asimilar spatial synchronizing effect of NAO have pre-viously been found in the Continental great cormorantPhalacrocorax carbo sinensis L. (Engen et al. 2005).
Theoretical analyses have shown that in addition toenvironmental covariation in space, dispersal can influ-ence the degree of synchrony in population fluctu-ations (Lande et al. 1999; Kendall et al. 2000). However,analysis of dispersal in the Belgian populations of greattits and blue tits (Tufto et al. 2005) indicated only shortspatial scales of movement (dispersal standard devi-ations ranging from 0·7 km to 4·4 km). Such shortmovement distances are therefore unlikely to signi-ficantly affect the spatial scaling of noise in local popu-lation dynamics (Lande et al. 2003; Engen et al. 2005)because the density regulation in these populations israther strong (the mean time to return to equilibrium1/® = 1·23 years and 1·32 years for the great tit and bluetit, respectively).
This demonstration of an environmentally inducedcommon component in the population dynamics ofcentral European tit populations has three major impli-cations. First, even with large spatial heterogeneity inlocal population dynamics and interchange of individualsbetween local populations, environmental variables canbe the major synchronizing agents for the large-scalesynchrony in population fluctuations. Second, theoret-ical studies have already shown that the presence of suchautocorrelations in environmental variables, which havea common influence on populations separated in space,can affect important characteristics of populations, such
as the probability of extinction (Engen et al. 2002b) andthe dynamical consequences of trophic interactions(Satake & Bjørnstad 2004). Third, our study shows thatevaluating the ecological consequences of large-scalechanges in the environment, such as expected climatechange (Houghton et al. 2001), may be more difficultthan previously realized because this requires that thespatial scaling of effects on local population dynamicsare known. However, this study exemplifies that anextension of Moran’s (1953) initial approach can improveour general insight into how such expected changesin climate will affect population dynamics at differentgeographical scales.
Acknowledgements
The paper was financed by the EU (project METABIRD)and the Research Council of Norway (NORKLIMA).We are grateful to T.N. Coulson and R. Freckleton forcomments on previous versions of the manuscript.
References
Bejer, B. & Rudemo, M. (1985) Fluctuations of tits (Paridae)in Denmark and their relations to winter food and climate.Ornis Scandinavica, 16, 29–37.
Benton, T.G. & Beckerman, A.P. (2005) Population dynamicsin a noisy world: lessons from a mite experimental system.Advances in Ecological Research, 37, 143–181.
Benton, T.G., Lapsley, C.T. & Beckerman, A.P. (2001)Population synchrony and environmental variation: anexperimental demonstration. Ecology Letters, 4, 236–243.
Benton, T.G., Lapsley, C.T. & Beckerman, A.P. (2002) Thepopulation response to environmental noise: populationsize, variance and correlation in an experimental system.Journal of Animal Ecology, 71, 320–332.
Bjørnstad, O.N., Ims, R.A. & Lambin, X. (1999) Spatialpopulation dynamics: analyzing patterns and processes ofpopulation synchrony. Trends in Ecology & Evolution, 14,427–432.
Dhondt, A.A., Matthysen, E., Adriaensen, F. & Lambrechts,M.M. (1990) Population dynamics and regulation of a highdensity Blue Tit population. In: Population Biology ofPasserine Birds (eds J. Blondel, A. Gosler, J.-D. Lebreton &R. McCleery), pp. 39–53. Springer-Verlag, Berlin.
Engen, S. & Sæther, B.-E. (2005) Generalizations of the Moraneffect explaining spatial synchrony in population fluctuations.American Naturalist, 166, 603–612.
Engen, S., Lande, R. & Sæther, B.-E. (2002a) The spatial scaleof population fluctuations and quasi-extinction risk.American Naturalist, 160, 439–451.
Engen, S., Lande, R. & Sæther, B.-E. (2002b) Migration andspatiotemporal variation in population dynamics in aheterogeneous environment. Ecology, 83, 570–579.
Engen, S., Lande, R., Sæther, B.-E. & Bregnballe, T. (2005)Estimating the synchrony of fluctuating populations.Journal of Animal Ecology, 74, 601–611.
Gilpin, M.E. & Ayala, F.J. (1973) Globals models of growthand competition. Proceedings of the National Academy ofSciences USA, 70, 3590–3593.
Grenfell, B.T., Wilson, K., Finkenstädt, B.F., Coulson, T.N.,Murray, S., Albon, S.D., Pemberton, J.M., Clutton- Brock, T.H.& Crawley, M.J. (1998) Noise and determinism in sychronizedsheep dynamics. Nature, 394, 674–677.
Grøtan, V., Sæther, B.-E., Engen, S., Solberg, E.J., Linnell, J.D.C.,Andersen, R., Brøseth, H. & Lund, E. (2005) Climate causes
324B.-E. Sæther et al.
© 2007 The Authors.Journal compilation© 2007 British Ecological Society, Journal of Animal Ecology, 76, 315–325
large-scale spatial synchrony in population fluctuations of atemperate herbivore. Ecology, 86, 1472–1482.
Hallett, T.B., Coulson, T., Pilkington, J.G., Clutton-Brock, T.H.,Pemberton, J.M. & Grenfell, B.T. (2004) Why large-scaleclimate indices seem to predict ecological processes betterthan local weather. Nature, 430, 71–75.
Houghton, J.T., Ding, Y., Griggs, D.J., Noguer, M., van derLinden, P.J., Dai, X., Maskell, K. & Johnson, C.A. (2001)Climate Change 2001: the Scientific Basis. CambridgeUniversity Press, Cambridge.
Hurrell, J.W., Kushnir, Y., Ottersen, G. & Visbeck, M. (2003)An overview of the North Atlantic Oscillation. The NorthAtlantic Oscillation Climate Significance and EnvironmentalImpact (eds J.W. Hurrell, Y. Kushnir, G. Ottersen & M.Visbeck), pp. 1–35. American Geophysical Union, Wash-ington, DC.
Jonzén, N., Pople, A.R., Grigg, G.C. & Possingham, H.P.(2005) of sheep and rain: large-scale population dynamicsof the red kangaroo. Journal of Animal Ecology, 74, 22–30.
Kendall, B.E., Bjørnstad, O.N., Bascompte, J., Keitt, T.H. &Fagan, W.F. (2000) Dispersal, environmental correlation,and spatial synchrony in population dynamics. AmericanNaturalist, 155, 628–636.
Koenig, W.D. (1999) Spatial autocorrelation of ecologicalphenomena. Trends in Ecology and Evolution, 14, 22–26.
Koenig, W.D. (2001) Spatial autocorrelation and local disap-pearances in wintering North American birds. Ecology, 82,2636–2644.
Koenig, W.D. (2002) Global patterns of environmental syn-chrony and the Moran effect. Ecography, 25, 283–288.
Koenig, W.D. & Knops, J.M.H. (2005) The mystery of mastingin trees. American Scientist, 93, 340–347.
Lande, R., Engen, S. & Sæther, B.-E. (1999) Spatial scale ofpopulation synchrony: environmental correlation versusdispersal and density regulation. American Naturalist, 154,271–281.
Lande, R., Engen, S. & Sæther, B.E. (2003) Stochastic Popu-lation Dynamics in Ecology and Conservation. OxfordUniversity Press, Oxford.
Lebreton, J.-D. (1990) Modelling density dependence, envi-ronmental variability, and demographic stochasticity frompopulation counts: an example using Wytham Wood GreatTits. Population Biology of Passerine Birds (eds J. Blondel,A. Gosler, J.-D. Lebreton & R. McCleery), pp. 89–102.Springer-Verlag, Berlin.
Liebhold, A., Koenig, W.D. & Bjørnstad, O.N. (2004) Spatialsynchrony in population dynamics. Annual Review inEcology and Systematics, 35, 467–490.
Lillegård, M., Engen, S. & Sæther, B.E. (2005) Bootstrapmethods for estimating spatial synchrony of fluctuatingpopulations. Oikos, 109, 342–350.
Lundberg, P., Ranta, E., Ripa, J. & Kaitala, V. (2000) Popu-lation variability in space and time. Trends in Ecology andEvolution, 15, 427–432.
May, R.M. (1981) Models for single populations. TheoreticalEcology (ed. R.M. May), pp. 5–29. Blackwell ScientificPublications, Oxford.
Moran, P.A.P. (1953) The statistical analysis of the Canadianlynx cycle. II. Synchronization and meteorology. AustralianJournal of Zoology, 1, 291–298.
Myers, R.A., Mertz, G. & Bridson, J. (1997) Spatial scales ofinterannual recruitment variations of marine, anadromous,and freshwater fish. Canadian Journal of Fisheries and AquaticSciences, 54, 1400–1407.
Mysterud, A., Yoccoz, N.G., Stenseth, N.C. & Langvatn, R.(2000) Relationships between sex ratio, climate and densityin red deer: the importance of spatial scale. Journal ofAnimal Ecology, 69, 959–974.
Ostfeld, R.S. & Keesing, F. (2000) Pulsed resources andcommunity dynamics of consumers in terrestrial ecosystems.Trends in Ecology and Evolution, 15, 232–237.
Packham, J.R. & Hilton, G.M. (2002) Inter- and intra-specificvariation in the fruiting of common beech (Fagus sylvaticaL.) in England over a twenty two year period (1980–2001).Arboricultural Journal, 26, 1–22.
Perdeck, A.C., Visser, M.E. & van Balen, J.H. (2000) GreatTit Parus major survival, and the beech-crop cycle. Ardea,88, 99–108.
Perrins, C.M. (1965) Population fluctuations and clutch sixein the Great Tit, Parus major. Journal of Animal Ecology,34, 601–647.
Perrins, C.M. (1979) British Tits. Collins, London.Ranta, E., Kaitala, V. & Lindström, J. (1998) Spatial dynamics
of populations. Modeling Spatiotemporal Dynamics in Ecology(eds J. Bascompte & R.V. Solé), pp. 47–62. Springer-Verlag,Berlin.
Ranta, E., Lundberg, P. & Kaitala, V. (2006) Ecology of Popu-lations. Cambridge University Press, Cambridge.
Roughgarden, J. (1977) Patchiness in the spatial distributionof a population caused by stochastic fluctuations in resources.Oikos, 29, 52–59.
Royama, T. (1992) Analytical Population Dynamics. Chapman& Hall, London.
Sæther, B.-E. & Engen, S. (2002) Pattern of variation in avianpopulation growth rates. Philosophical Transactions of theRoyal Society B, 357, 1185–1195.
Sæther, B.-E., Engen, S., Lande, R., Arcese, P. & Smith, J.N.M.(2000) Estimating the time to extinction in an island popu-lation of song sparrows. Proceedings of the Royal SocietyLondon B, 267, 621–626.
Sæther, B.-E., Engen, S. & Matthysen, E. (2002a) Demographiccharacteristics and population dynamical patterns of solitarybirds. Science, 295, 2070–2073.
Sæther, B.-E., Engen, S., Lande, R., Visser, M. & Both, C.(2002b) Density dependence and stochastic variation in anewly established population of a small songbird. Oikos,99, 331–337.
Sæther, B.-E., Engen, S., Møller, A.P., Matthysen, E.,Adriansen, F., Fiedler, W., Leivits, A., Lambrechts, M.M.,Visser, M.E., Anker-Nilssen, T., Both, C., Dhondt, A.A.,McCleery, R.H., McMeeking, J., Potti, J., Røstad, O.W. &Thomson, D. (2003) Climate variation and regional gradi-ents in population dynamics of two hole-nesting passerines.Proceedings of the Royal Society London B, 270, 2397–2404.
Sæther, B.-E., Engen, S., Møller, A.P., Weimerskirch, H.,Visser, M.E., Fiedler, W., Matthysen, E., Lambrechts, M.M.,Badyaev, A., Becker, P.H., Brommer, J.E., Bukacinski, D.,Bukacinska, M., Christensen, H., Dickinson, J., du Feu, C.,Gehlbach, F., Heg, D., Hötker, H., Merilä, J., Nielsen, J.T.,Rendell, W., Robertson, R.J., Thomson, D.L., Török, J. &Van Hecke, P. (2004a) Life-history variation predicts theeffects of demographic stochasticity on avian populationdynamics. American Naturalist, 164, 793–802.
Sæther, B.-E., Sutherland, W.J. & Engen, S. (2004b) Climateinfluences on a population dynamics. Advances in EcologicalResearch, 35, 185–209.
Sæther, B.-E., Grøtan, V., Tryjanowski, P., Barbraud, C.,Engen, S. & Fulin, M. (2006) Climate and spatio-temporalvariation in the population dynamics of a long-distance migrant,the white stork. Journal of Animal Ecology, 75, 80–90.
Satake, A. & Bjørnstad, O.N. (2004) Spatial dynamics ofspecialist seed predators on synchronized and intermittentseed production of host plants. American Naturalist, 163,591–605.
Slagsvold, T. (1975) Critical period for regulation of Great Tit(Parus major L.) and Blue Tit (Parus caeruleus L.) popula-tions. Norwegian Journal of Zoology, 23, 67–88.
Stenseth, N.C., Chan, K.S., Tong, H., Boonstra, R., Boutin, S.,Krebs, C.J., Post, E., O’Donoghue, M., Yoccoz, N.G.,Forchhammer, M.C. & Hurrell, J.W. (1999) Commondynamic structure of Canada lynx populations within threeclimatic regions. Science, 285, 1071–1073.

325Spatial synchrony in tit population fluctuations
© 2007 The Authors.Journal compilation© 2007 British Ecological Society, Journal of Animal Ecology, 76, 315–325
Tufto, J., Ringsby, T.H., Dhondt, A.A., Adriaensen, F. &Matthysen, E. (2005) A parametric model for estimation ofdispersal patterns applied to five passerine spatially structuredpopulations. American Naturalist, 165, E13–E26.
Williams, C.K., Ives, A.R. & Applegate, R.D. (2003) Populationdynamics across geographical ranges: time-series analysesof three small game species. Ecology, 84, 2654–2667.
Zang, H. (2003) Wie beeinflussen Fruktifikationen derRotbuche Fagus sylvatica Bestandsdichte und Brutbiologiedes Kleibers Sitta europaea im Harz? Vogelwelt, 124,193–200.
Received 4 June 2006; accepted 20 October 2006