Sporadic decentralized resource maintenance for P2P distributed storage networks
Upload
independentCategory
view
0download
0
Bioinformatics and Biology Insights 2007: 1 1–16 1
ORIGINAL RESEARCH
Please note that this article may not be used for commercial purposes. For further information please refer to the copyright statement at http://www.la-press.com/copyright.htm
Rarity of Somatic Mutation and Frequency of Normal Sequence Variation Detected in Sporadic Colon Adenocarcinoma Using High-Throughput cDNA SequencingTakatsugu Kan, Bogdan C. Paun, Yuriko Mori, Fumiaki Sato, Zhe Jin, James P. Hamilton, Tetsuo Ito, Yulan Cheng, Stefan David, Alexandru V. Olaru, Jian Yang, Rachana Agarwal, John M. Abraham and Stephen J. MeltzerGastroenterology Division, Department of Medicine, Johns Hopkins University School of Medicine, 1503 E. Jefferson Street, Rm 106 Baltimore MD 21287.
Abstract: We performed high-throughput cDNA sequencing in colorectal adenocarcinoma and matching normal colorectal epithelium. All six hundred three genes in the UCSC database that were expressed in colon cancers and contained open reading frames of 1000 nucleotides or less were selected for study (total basepairs/bp, 366,686). 304,350 of these 366,686 bp (83.0%) were amplified and sequenced successfully. Seventy-eight sequence variants present in germline (i.e. normal) as well as matching somatic (i.e. tumor) DNA were discovered, yielding a fre-quency of 1 variant per 3,902 bp. Fifty-one of these sequence variants were homozygous (26 synonymous, 25 non-synonymous), while 27 were heterozygous (11 synonymous, 16 non-synonymous). Cancer tissue contained only one sequence-altered allele of the gene ATP50, which was present heterozygously alongside the wild-type allele in match-ing normal epithelium. Despite this relatively large number of bp and genes sequenced, no somatic mutations unique to tumor were found. High-throughput cDNA sequencing is a practical approach for detecting novel sequence variations and alterations in human tumors, such as those of the colon.
IntroductionIt is widely believed that somatic as well as germline mutations play important roles in the origin and progression of colorectal cancers (Calvert and Frucht, 2002). Many genes have been inves-tigated for mutation to elucidate mechanisms of colorectal cancer development, with these inves-tigations demonstrating the involvement of mutations in colorectal carcinogenesis and progression. Samuels et al. reported that PIK3CA, a catalytic subunit of the class IA phosphatidylinositol 3-kinases, was somatically mutated in 32% of colorectal cancers, resulting in the attenuation of apoptosis and facilitated tumor invasion(Samuels et al. 2004). A comprehensive study entitled, “The Tyrosine Phosphatome” was accomplished by sequencing all genes involved in tyrosine phosphorylation in a large cancer cohort consisting of 175 colorectal cancer patients(Wang et al. 2004). Most mutational studies, however, have been preoccupied with the prevalence of somatic mutations in a specific single candidate gene in relatively small colorectal cancer patient cohorts. Recently, Sjoblom et al. reported the genome-wide frequencies of somatically mutated genes in human breast and colorectal cancers(Sjoblom et al. 2006). However, the methods these used were extremely expensive, time-consuming, and labor-intensive for a typical laboratory to perform. More practical strategies, amenable to smaller laboratories with more conservative budgets, would be of great value in the continuing quest to answer questions in the fields of tumor genomics and mutatomics. To this end, we present herein a circumscribed, practical mutational study employing high-throughput cDNA sequencing in colon adenocarcinoma, in which we demonstrate the eminent feasibility and results of determining sequence variation efficiently and at low cost.
Correspondence: Stephen J. Meltzer, M.D., Professor of Medicine and Oncology, Division of Gastroenterol-ogy, Department of Medicine, The Johns Hopkins University School of Medicine 1503 E. Jefferson Street, Rm. 112, Baltimore, MD 21287. Tel: 410-502-6071; Fax: 410-502-1329; Email: [email protected]

2
Kan et al
Bioinformatics and Biology Insights 2007: 1
Materials and Methods
Tissue samplesColorectal cancer and its matching normal colonic mucosa from a patient undergoing surgical resec-tion at the Baltimore VA Hospital after signing informed research consent was used for this study. Clinicopathological data were as follows: 75 year-old male; moderately-differentiated colorectal adenocarcinoma of the ascending colon; tumor size, 2.5 × 1.1 × 0.5 cm; TNM stage (Fifth Edition of the TNM classifi cation of the UICC, 1997), T2N0MX, without any other malignancies. Both colorectal adenocarcinoma and normal colonic epithelium (obtained at the location within the surgically resected specimen furthest from the tumor) were cut into smaller pieces and frozen in liquid nitrogen immediately after removal. A frozen aliquot of each specimen was crushed into pieces and lysed immediately in either TRIZOL reagent (Invitrogen Corp., Carlsbad, CA,) to extract total RNA, or lysis buffer of a DNeasy Tissue kit (QIAGEN Inc., Valencia, CA) to extract DNA, according to these manufacturers’ instruc-tions.
Cell linesHeLa S3, HT29, HCT15, HCT116, LoVo, CaCo2, LS174T, LS411N, and DLD1, purchased from the American Type Culture Collection (ATCC), and KYSE30, 70, 110, 150, 220, 410, 770, 850 and OE33, obtained from Dr. Yutaka Shimada at Kyoto University in Japan (Shimada et al. 1992), were enrolled in the current study in order to validate our fi ndings in the ATP50 gene. Culture conditions for each cell line were according to ATCC and the establisher’s recommendations. All cell lines were supplemented with 10% fetal bovine serum plus an appropriate concentration of penicillin and streptomycin.
Gene selectionTo increase our chances of successfully amplifying and sequencing cDNAs, we restricted our study to genes that are known to be expressed in colorectal cancer cells, based on a gene expression database at the University of California, Santa Cruz (UCSC) [http://genome.ucsc.edu/index.html]. From among this gene set, we selected a subset of genes (approximately 600) containing open reading
frames (ORFs) 1000 nucleotides or shorter in length. To automate design of the large number of primer sets required, we developed an in-house primer design algorithm based on the publicly available primer design software program, Primer3 (http://frodo.wi.mit.edu/cgi-bin/primer3/primer3_www_slow.cgi). PCR products were designed to range from 300 to 500 bp in length. ORFs of cDNAs longer than 500 bp were divided into 2 or 3 fragments; primers were then designed with adjacent fragments overlapped, in order to completely cover these longer ORFs. Finally, for each heterozygous sequence alteration, genomic DNA primers (available on request) were designed to confi rm cDNA sequencing results.
RT-PCRTotal RNA extracted from colorectal adenocarci-noma and normal colonic epithelium was reverse-transcribed using a SuperScript III First-Strand kit (Invitrogen, Carlsbad, CA), and respective cDNA pools were made. RT-PCR was performed using an AccuPrime Supermix I Kit (Invitrogen). The PCR protocol was as follows: 1 min at 96 °C followed by 35 cycles of 30 sec at 94 °C, 45 sec at 58 °C, and 1 min at 72 °C. Secondary PCR was performed on purifi ed template from the fi rst RT-PCR product, using the same protocol.
SequencingA BigDye Terminator v3.1 Kit (Applied Biosys-tems, Foster City, CA) was used for the sequencing reaction, and sequence products were read on an SCE 9610 automated 96-capil-lary sequencer (Spectruby BaseSpectrum v2.10 (SpectruMedix) and analyzed with Mutation Surveyor v2.2 (SoftGenetics LLC, State College, PA). Each time candidate sequence alterations were discovered in cDNA from colorectal cancer tissue, identical procedures were followed in matched normal epitheliam to confirm whether or not they represented somatic alterations. After candidate alterations were confirmed, the entire procedure was repeated separately on a fresh aliquot of cDNA from both the cancer and normal specimens in order to exclude amplification or technical errors due to two-stage PCR. Genomic DNA sequencing was also performed on heterozygous sequence vari-ants to confirm that identical sequence altera-tions were present in genomic DNA.

3
WT1 Gene Expression in Acute Leukemia
Bioinformatics and Biology Insights 2007: 1
Methylation-specifi c PCR (MSP)Because the gene ATP50 was apparently mutated, raising the possibility that it was a tumor suppressor gene, we evaluated this gene for alternative inac-tivation via promoter hypermethylation. MSP primer sequences of ATP50 for the methylated reaction were: forward (5′-CGAGTGGGAGC-GATTTAGGAC-3′) and reverse (5′-AACGC-CAAAATTACGACACG-3′), which amplify a 94-bp product. Β-actin was selected as an internal control gene, using previously published MSP primers (Eads et al. 2001). CpGenome Universal Methylated DNA (Chemicon International, Inc., Temecula, CA) was used as a positive control. The detailed MSP procedure has been previously published (Sato et al. 2002).
Microsatellite instability (MSI) assayMSI at each locus was determined by analyses of the length of each PCR-amplifi ed microsatellite. MSI status was confi rmed by MSI assays at fi ve consensus loci (BAT25, BAT26, D2S123, D5S346, and D17S250) according to criteria from a National Cancer Institute workshop (Boland et al. 1998). Detailed procedures were as previously described (Mori et al. 2001).
Results
Project overview A total of 603 genes (S-Table 1) were selected based on their length (under 1,000 bp) and their predicted expression in colorectal cancers according to the UCSC database. One thousand thirty-eight primer pairs (available on request) were designed to cover the entire ORFs (total bp, 366,687) of these 603 genes. Sequence data from 862 (83.0%) of these 1,038 primer sets were successfully analyzed, meaning that approximately 304,350 total bp were successfully sequenced (all primer sets for RT-PCR and cDNA sequencing are avail-able on request).
Sequence variantsSeventy-eight sequence variants within 50 genes were found among the 603 genes studied (Table 1) (S-Table 2 for detailed information). Thus, the frequency of sequence variants was 1 per 3,902 bp (78 total variants/304,350 total bp). Of these 78 sequence alterations, 51 were homozygous (26 synonymous, 25 non-synonymous) and 27 were heterozygous (11 synonymous, 16
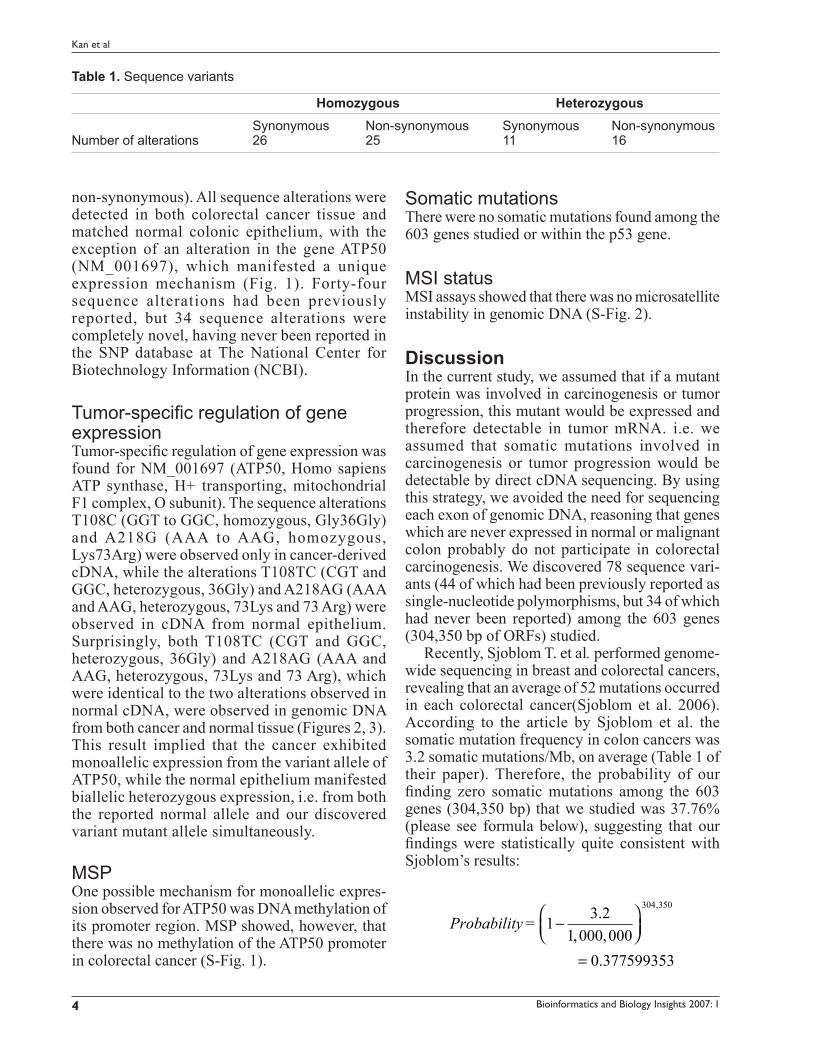
Figure 1. cDNA sequencing of ATP50. Two different alteration sites were detected. At the 108th nucleotide, colorectal cancer tissue had only a mutant cytosine nucleotide, while normal colon contained both a thymine (wild) and a cytosine (mutant). Both codons GGT and GGC encoded glycine (synonymous alteration). At the 218th mucleotide, colorectal cancer tissue had only a mutant guanine nucleotide, while normal tissue contained both an adenine (wild) and a guanine (mutant). AAA encoded lysine and AGA encoded arginine (non-synonymous alteration). Gly, glycine; Arg, arginine.
4
Kan et al
Bioinformatics and Biology Insights 2007: 1
non-synonymous). All sequence alterations were detected in both colorectal cancer tissue and matched normal colonic epithelium, with the exception of an alteration in the gene ATP50 (NM_001697), which manifested a unique expression mechanism (Fig. 1). Forty-four sequence alterations had been previously reported, but 34 sequence alterations were completely novel, having never been reported in the SNP database at The National Center for Biotechnology Information (NCBI).
Tumor-specifi c regulation of gene expressionTumor-specifi c regulation of gene expression was found for NM_001697 (ATP50, Homo sapiens ATP synthase, H+ transporting, mitochondrial F1 complex, O subunit). The sequence alterations T108C (GGT to GGC, homozygous, Gly36Gly) and A218G (AAA to AAG, homozygous, Lys73Arg) were observed only in cancer-derived cDNA, while the alterations T108TC (CGT and GGC, heterozygous, 36Gly) and A218AG (AAA and AAG, heterozygous, 73Lys and 73 Arg) were observed in cDNA from normal epithelium. Surprisingly, both T108TC (CGT and GGC, heterozygous, 36Gly) and A218AG (AAA and AAG, heterozygous, 73Lys and 73 Arg), which were identical to the two alterations observed in normal cDNA, were observed in genomic DNA from both cancer and normal tissue (Figures 2, 3). This result implied that the cancer exhibited monoallelic expression from the variant allele of ATP50, while the normal epithelium manifested biallelic heterozygous expression, i.e. from both the reported normal allele and our discovered variant mutant allele simultaneously.
MSPOne possible mechanism for monoallelic expres-sion observed for ATP50 was DNA methylation of its promoter region. MSP showed, however, that there was no methylation of the ATP50 promoter in colorectal cancer (S-Fig. 1).
Somatic mutationsThere were no somatic mutations found among the 603 genes studied or within the p53 gene.
MSI statusMSI assays showed that there was no microsatellite instability in genomic DNA (S-Fig. 2).
DiscussionIn the current study, we assumed that if a mutant protein was involved in carcinogenesis or tumor progression, this mutant would be expressed and therefore detectable in tumor mRNA. i.e. we assumed that somatic mutations involved in carcinogenesis or tumor progression would be detectable by direct cDNA sequencing. By using this strategy, we avoided the need for sequencing each exon of genomic DNA, reasoning that genes which are never expressed in normal or malignant colon probably do not participate in colorectal carcinogenesis. We discovered 78 sequence vari-ants (44 of which had been previously reported as single-nucleotide polymorphisms, but 34 of which had never been reported) among the 603 genes (304,350 bp of ORFs) studied.
Recently, Sjoblom T. et al. performed genome-wide sequencing in breast and colorectal cancers, revealing that an average of 52 mutations occurred in each colorectal cancer(Sjoblom et al. 2006). According to the article by Sjoblom et al. the somatic mutation frequency in colon cancers was 3.2 somatic mutations/Mb, on average (Table 1 of their paper). Therefore, the probability of our fi nding zero somatic mutations among the 603 genes (304,350 bp) that we studied was 37.76% (please see formula below), suggesting that our fi ndings were statistically quite consistent with Sjoblom’s results:
Probability = 1 3 21 000 000
0 377599353
304 350
−⎛⎝⎜
⎞⎠⎟
=
., ,
.
,
Table 1. Sequence variants
Homozygous Heterozygous Synonymous Non-synonymous Synonymous Non-synonymousNumber of alterations 26 25 11 16

5
WT1 Gene Expression in Acute Leukemia
Bioinformatics and Biology Insights 2007: 1
The Sjoblom team also defi ned “CAN-genes” (candidate cancer genes) as those that were frequently mutated in colorectal cancers, and found that 69 genes could be included in this category. Although the CAN-genes KRAS, GNAS and TP53 were studied by us, no somatic mutations were found in these genes. Furthermore, in addition to the genes mentioned above, NRAS, HRAS, p16, and p27 were included in the current study, but these genes also contained no somatic mutations. Finally, results of MSI assays revealed MS-stability (MSS), implying an absence of mutations in the major DNA mismatch repair genes (although these genes were not studied due to their long ORFs). It is possible that other molecular pathogenetic pathways were involved in this colorectal tumorigenesis, such as those containing APC, MCC, DCC, or the TGF-β cascade: these genes were also not examined in the current study due to ORF length.
Approximately 24,000,000 bp among the entire genomic DNA sequence are reported as ORFs in
the UCSC database. The average density of each SNP is once per 1.9 kilobases (i.e. 1,419,190 SNPs/2 .7 g igabases of human genome sequence)(Sachidanandam et al. 2001). We sequenced 304,350 bp of ORFs (viz., 1.26% of the total ORFs in the UCSC database: 304,350 bp/24,000,000 bp) and discovered 78 sequence variants, yielding a frequency of 1 alteration per 3,902 bp (78/304,350 bp). Our observed sequence variant distribution may provide a basis with which to estimate the number of SNPs in a single indi-vidual with colon cancer. That is, the SNPs reported above are one possible subset of the entire database; there is no guarantee that a given individual will always harbor all SNPs in the database.
The human ATP50 gene (X83218, NM_001697), encoding a 213-amino acid ATP synthase OSCP subunit, is a key structural component of the stalk of the mitochondrial respiratory chain F1F0-ATP synthase, which is a vital element in the cellular pathway of energy conversion (Senior,
Figure 2. Representative result of cDNA sequencing of ATP50 in normal and cancer tissues. The red box in the left panel shows the 36th codon, while the red box in the right panel shows the 73rd codon. All alterations were confi rmed by both forward and reverse sequencing.

6
Kan et al
Bioinformatics and Biology Insights 2007: 1
1988). Although a mutant strain of yeast in which the delta subunit of F1F0-ATP synthase had been inactivated by insertional mutagenesis showed little or no ATPase activity(Giraud and Velours, 1994), and dysfunction of ATP synthase can cause a variety of degenerative diseases(Wallace, 1994), there have been no previous reports detailing a relationship between ATP synthase and tumorigen-esis. We found restricted monoallelic (i.e. monoal-lelically silenced) expression of an altered allele from ATP50 in our colon cancer tissue, which would be expected to exert the same effect as would a somatic mutation of this gene. Genomic DNA sequencing of ATP50 revealed that this monoallelic expression was not due to LOH. We therefore studied the methylation status of the CpG island in the promoter region of ATP50 by MSP, but we found no methylation of this region. Other epigenetic mechanisms, such as histone deacety-lation, might have contributed to monoallelic expression of ATP50. There was no monoallelic expression of ATP50 in 20 cancer cell lines that we examined. Although monoallelic expression of this altered ATP50 allele may be involved in a subset of colorectal cancers, further study is required to clarify the potential functional role of this gene in carcinogenesis.
This study poses several advantages as well as limitations. Firstly, it has been reported that some synonymous mutations may influence the stability of mRNA(Duan and Antezana, 2003; Chamary and Hurst, 2005) because they affect the thermodynamic stability of mRNA secondary structures (Fitch, 1974; Klambt, 1975). Nonsense-mediated mRNA decay (NMD) is also known as a surveillance pathway that rapidly degrades mRNAs containing premature termination codons(Culbertson and Leeds, 2003; Amrani et al. 2006). These mechanisms may cause instability of mRNA, accelerate the degradation of mRNA, and consequently result in difficulty in detecting sequence alterations by cDNA sequencing. Since we used cDNA as our starting material for sequencing, we may have ignored some key genes because of RNA degradation. Nevertheless, many sequence variants were detected reasonably well in the current study, suggesting that degradation of mRNA occurred rarely, if at all, as a consequence of sequence alterations. Instead, we considered it more important to increase our chances of finding sequence alterations by using cDNA rather than genomic DNA because of the lower cost, time, and labor involved in sequencing cDNA, as well
Figure 3. Genomic DNA sequencing of ATP50 in normal and cancer tissues. Upper panels, forward sequencing; lower panels, reverse sequencing. The red boxes show the 36th and 73rd codons. Both normal and colorectal cancer tissues contain identical heterozygosities at the 108th and 218th nucleotides.

7
WT1 Gene Expression in Acute Leukemia
Bioinformatics and Biology Insights 2007: 1
as the increased relevance of only studying genes that are expressed in the colon.
Secondly, it is conceivable that we lost some gene sequence information due to extremely low expression levels. Therefore, we employed two-stage PCR to increase our chances of successful sequencing, thereby achieving a relatively high success rate of 862/1,038 reactions, or 83.0%. Possibly, this result still may have included genes that were not expressed in our particular colorectal cancer, even though we used the UCSC database to select genes that were purportedly expressed in colorectal cancers. Our sequencing success rate appears favorable when compared to genomic DNA sequencing, where 92% of genes were successfully analyzed (Wang et al. 2004). The total number of exons sequenced in our study was 2107, implying that at least 2107 primer pairs would have been necessary to conduct this study had it been attempted by genomic DNA sequencing; in contrast, we accomplished this task using only 1038 primer sets for cDNA sequencing. This contrast demonstrates that our method is useful to explore mutations because it is not only more cost-effective, but also less demanding in time and labor.
AcknowledgementsThis work was supported by NIH grants
CA77057, CA95323 and CA85069 (to S.J.M.).
ReferencesAmrani, N., Sachs, M.S. and Jacobson, A. 2006. Nat. Rev. Mol. Cell Biol.,
7:415–25.Boland, C.R., Thibodeau, S.N., Hamilton, S.R., Sidransky, D., Eshleman,
J.R., Burt, R.W., Meltzer, S.J., Rodriguez-Bigas, M.A., Fodde, R., Ranzani, G.N. and Srivastava, S. 1998. Cancer Res., 58:5248–57.
Calvert, P.M. and Frucht, H. 2002. Ann. Intern. Med., 137:603–12.Chamary, J.V. and Hurst, L.D. 2005. Genome. Biol., 6:R75.Culbertson, M.R. and Leeds, P.F. 2003. Curr. Opin. Genet. Dev., 13:207–14.Duan, J. and Antezana, M.A. 2003. J. Mol. Evol., 57:694–701.
Eads, C.A., Lord, R.V., Wickramasinghe, K., Long, T.I., Kurumboor, S.K., Bernstein, L., Peters, J.H., DeMeester, S.R., DeMeester, T.R., Skin-ner, K.A. and Laird, P.W. 2001. Cancer Res., 61:3410–8.
Fitch, W.M. 1974. J. Mol. Evol., 3:279–91.Giraud, M.F. and Velours, J. 1994. Eur. J. Biochem., 222:851–9.Klambt, D. 1975. J. Theor. Biol., 52:57–65.Mori, Y., Yin, J., Rashid, A., Leggett, B.A., Young, J., Simms, L., Kuehl,
P.M., Langenberg, P., Meltzer, S.J. and Stine, O.C. 2001. Cancer Res., 61:6046–9.
Sachidanandam, R., Weissman, D., Schmidt, S.C., Kakol, J.M., Stein, L. D., Marth, G., Sherry, S., Mullikin, J.C., Mortimore, B.J., Willey, D.L., Hunt, S.E., Cole, C.G., Coggill, P.C., Rice, C.M., Ning, Z., Rogers, J., Bentley, D.R., Kwok, P.Y., Mardis, E.R., Yeh, R.T., Schultz, B., Cook, L., Davenport, R., Dante, M., Fulton, L., Hillier, L., Waterston, R. H., McPherson, J. D., Gilman, B., Schaffner, S., Van Etten, W.J., Reich, D., Higgins, J., Daly, M.J., Blumenstiel, B., Baldwin, J., Stange-Thomann, N., Zody, M.C., Linton, L., Lander, E.S. and Altshuler, D. 2001. Nature, 409:928–33.
Samuels, Y., Wang, Z., Bardelli, A., Silliman, N., Ptak, J., Szabo, S., Yan, H., Gazdar, A., Powell, S.M., Riggins, G.J., Willson, J.K., Markow-itz, S., Kinzler, K.W., Vogelstein, B. and Velculescu, V.E. 2004. Science, 304:554.
Sato, F., Harpaz, N., Shibata, D., Xu, Y., Yin, J., Mori, Y., Zou, T.T., Wang, S., Desai, K., Leytin, A., Selaru, F.M., Abraham, J.M. and Meltzer, S.J. 2002. Cancer Res., 62:1148–51.
Senior, A.E. 1988. Physiol Rev., 68:177–231.Shimada, Y., Imamura, M., Wagata, T., Yamaguchi, N. and Tobe, T. 1992.
Cancer, 69:277–84.Sjoblom, T., Jones, S., Wood, L.D., Parsons, D.W., Lin, J., Barber, T.D.,
Mandelker, D., Leary, R.J., Ptak, J., Silliman, N., Szabo, S., Buck-haults, P., Farrell, C., Meeh, P., Markowitz, S.D., Willis, J., Dawson, D., Willson, J.K., Gazdar, A.F., Hartigan, J., Wu, L., Liu, C., Parmi-giani, G., Park, B.H., Bachman, K.E., Papadopoulos, N., Vogelstein, B., Kinzler, K.W. and Velculescu, V.E. 2006. Science, 314:268–74.
Wallace, D.C. 1994. Proc. Natl. Acad. Sci. U.S.A., 91:8739–46.Wang, Z., Shen, D., Parsons, D.W., Bardelli, A., Sager, J., Szabo, S., Ptak,
J., Silliman, N., Peters, B. A., van der Heijden, M.S., Parmigiani, G., Yan, H., Wang, T.L., Riggins, G., Powell, S.M., Willson, J.K., Mar-kowitz, S., Kinzler, K.W., Vogelstein, B. and Velculescu, V.E. 2004. Science, 304:1164–6.

8
Kan et al
Bioinformatics and Biology Insights 2007: 1
Supplement Material
S-Figure 2. A representative result of MSI typing. Both cancer and normal tissue showed microsatellite stable in the marker of D5S346 and D17S250. The similar results were obtained in the marker of D2S123, BAT25, and BAT26.
S-Figure 1. Result of MSP for ATP50. (A) Bisulfi ted DNA from cancer tissue, normal tissue, and HT29 were used. The MSPs for ATP50 were triplicated. The MSP product for ATP50 was 94 bp and beta actin was 133bp. (B) Universal methylated DNA was used for the positive control in various amounts. M.W., molecular weight.

9
WT1 Gene Expression in Acute Leukemia
Bioinformatics and Biology Insights 2007: 1
S-Table-1. Gene list
GenBank Gene GenBank Gene GenBank Gene Accession No. Symbol Accession No. Symbol Accession No. Symbol NM_000100.2 CSTB NM_198057.1 TSC22D3 NM_002811.3 PSMD7 NM_000999.2 RPL38 NM_022652.2 DUSP6 NM_002812.3 PSMD8 NM_001827.1 CKS2 NM_021121.2 EEF1B2 NM_002813.4 PSMD9 NM_001863.3 COX6B1 NM_001412.2 EIF1AX NM_170750.1 PSMD10 NM_001866.2 COX7B NM_004094.3 EIF2S1 NM_004577.3 PSPH NM_001867.2 COX7C NM_001423.1 EMP1 NM_175847.1 PTBP1 NM_002489.2 NDUFA4 NM_001424.3 EMP2 NM_198974.1 PTK9 NM_002491.1 NDUFB3 NM_001425.1 EMP3 NM_002823.2 PTMA NM_002966.1 S100A10 NM_207168.1 ENSA NM_002824.4 PTMS NM_003009.2 SEPW1 NM_001005915.1 ERBB3 NM_133377.1 RAD1 NM_003063.1 SLN NM_001983.2 ERCC1 NM_153824.1 PYCR1 NM_003095.1 SNRPF NM_001984.1 ESD NM_000320.1 QDPR NM_003133.1 SRP9 NM_001439.1 EXTL2 NM_004161.3 RAB1A NM_003498.3 SNN NM_001997.2 FAU NM_004162.3 RAB5A NM_003746.1 DYNLL1 NM_005247.2 FGF3 NM_002868.2 RAB5B NM_003860.2 BANF1 NM_002007.1 FGF4 NM_198896.1 RAB6A NM_003945.3 ATP6V0E NM_002010.1 FGF9 NM_002870.2 RAB13 NM_004045.2 ATOX1 NM_023108.1 FGFR1 NM_183235.1 RAB27A NM_004485.2 GNG4 NM_001449.3 FHL1 NM_201434.1 RAB5C NM_004541.2 NDUFA1 NM_054014.1 FKBP1A NM_198829.1 RAC1 NM_004772.1 C5orf13 NM_002013.2 FKBP3 NM_002872.3 RAC2 NM_005274.1 GNG5 NM_016725.1 FOLR1 NM_133630.1 RAD51L3 NM_005517.2 HMGN2 NM_004477.1 FRG1 NM_002881.2 RALB NM_005694.1 COX17 NM_000146.2 FTL NM_006325.2 RAN NM_005770.3 SERF2 NM_198903.1 GABRG2 NM_002884.1 RAP1A NM_005887.1 DLEU1 NM_000166.2 GJB1 NM_015646.3 RAP1B NM_005949.1 MT1F NM_024009.2 GJB3 NM_032626.5 RBBP6 NM_005954.2 MT3 NM_002061.2 GCLM NM_181558.1 RFC3 NM_005978.3 S100A2 NM_006708.1 GLO1 NM_181578.1 RFC5 NM_006156.1 NEDD8 NM_002066.1 GML NM_134427.1 RGS3 NM_006274.2 CCL19 NM_016592.1 GNAS NM_005614.2 RHEB NM_006304.1 SHFM1 NM_005301.2 GPR35 NM_000326.3 RLBP1 NM_006353.2 HMGN4 NM_002083.2 GPX2 NM_002938.2 RNF4 NM_006698.2 BLCAP NM_002084.2 GPX3 NM_183045.1 RNF6 NM_006829.2 C10orf116 NM_203506.1 GRB2 NM_002946.3 RPA2 NM_007233.1 TP53AP1 NM_001512.2 GSTA4 NM_002947.3 RPA3 NM_007281.1 SCRG1 NM_147149.1 GSTM4 NM_033301.1 RPL8 NM_012456.1 TIMM10 NM_145871.1 GSTZ1 NM_033251.1 RPL13 NM_012458.2 TIMM13 NM_004492.1 GTF2A2 NM_000985.2 RPL17 NM_012460.2 TIMM9 NM_002095.3 GTF2E2 NM_000984.3 RPL23A NM_013332.1 HIG2 NM_000858.3 GUK1 NM_000992.2 RPL29 NM_013343.1 LOH3CR2A NM_005318.2 H1F0 NM_001001.3 RPL36AL NM_014041.1 SPCS1 NM_002106.3 H2AFZ NM_021029.3 RPL36A NM_014051.2 TMEM14A NM_005324.3 H3F3B NM_001002.3 RPLP0 NM_014221.1 MTCP1 NM_005326.3 HAGH NM_002949.2 MRPL12 NM_014356.2 C6orf123 NM_005327.1 HADHSC NM_001007.3 RPS4X NM_014445.2 SERP1 NM_005330.3 HBE1 NM_001015.3 RPS11 NM_014624.3 S100A6 NM_004494.1 HDGF NM_001019.3 RPS15A NM_014792.2 KIAA0125 NM_139011.1 HFE NM_001020.3 RPS16 NM_016096.2 ZNF706 NM_005340.3 HINT1 NM_001022.3 RPS19 NM_016305.1 SS18L2 NM_002118.3 HLA-DMB NM_001023.2 RPS20 NM_016565.2 CHCHD8 NM_002128.3 HMGB1 NM_001025.3 RPS23 NM_020142.3 LOC56901 NM_002129.2 HMGB2 NM_002960.1 S100A3 NM_020179.1 FN5 NM_004965.6 HMGN1 NM_005620.1 S100A11 NM_020181.1 C14orf162 NM_002131.2 HMGA1 NM_000664.3 ACACA NM_020248.1 CTNNBIP1 NM_173158.1 NR4A1 NM_198970.1 AES
(Continued)

10
Kan et al
Bioinformatics and Biology Insights 2007: 1
S-Table-1. (Continued)
GenBank Gene GenBank Gene GenBank Gene Accession No. Symbol Accession No. Symbol Accession No. Symbol NM_020408.3 C6orf149 NM_002136.1 HNRPA1 NM_001636.1 SLC25A6 NM_021104.1 RPL41 NM_031314.1 HNRPC NM_001001787.1 ATP1B1 NM_021127.1 PMAIP1 NM_002138.3 HNRPD NM_001687.4 ATP5D NM_021177.3 LSM2 NM_021644.2 HNRPH3 NM_001002256.1 ATP5G3 NM_023937.2 MRPL34 NM_006896.2 HOXA7 NM_004047.2 ATP6V0B NM_031286.2 SH3BGRL3 NM_153715.1 HOXA10 NM_198589.1 BSG NM_031287.2 SF3B5 NM_156037.1 HOXB6 NM_004927.2 MRPL49 NM_032412.2 ORF1-FL49 NM_004502.2 HOXB7 NM_006136.2 CAPZA2 NM_032574.1 LOC84661 NM_024016.2 HOXB8 NM_022845.2 CBFB NM_032747.1 USMG5 NM_014620.2 HOXC4 NM_001760.2 CCND3 NM_052871.2 MGC4677 NM_153693.1 HOXC6 NM_171827.1 p32/CD8A NM_052971.1 LEAP-2 NM_006897.1 HOXC9 NM_001773.1 CD34 NM_080677.1 DYNLL2 NM_014212.2 HOXC11 NM_000611.4 CD59 NM_138448.2 ACYP2 NM_024501.1 HOXD1 NM_001780.3 CD63 NM_139286.3 CDC26 NM_134421.1 HPCAL1 NM_004359.1 CDC34 NM_194327.1 GALIG NM_182638.1 HPS1 NM_058197.2 p16/CDKN2A NM_198835.1 ACACA NM_005524.2 HES1 NM_001280.1 CIRBP NM_020115.3 ACRV1 NM_198431.1 HSPA4 NM_001833.1 CLTA NM_001124.1 ADM NM_001540.2 HSPB1 NM_022645.2 CSH2 NM_000674.1 ADORA1 NM_005528.1 DNAJC4 NM_012140.3 SLC25A10 NM_000676.2 ADORA2B NM_181353.1 ID1 NM_148979.1 CTSH NM_001630.1 ANXA8 NM_002166.4 ID2 NM_000396.2 CTSK NM_001154.2 ANXA5 NM_174856.1 IDH3B NM_001336.2 CTSZ NM_080649.1 APEX1 NM_004508.2 IDI1 NM_001915.2 CYB561 NM_000041.2 APOE NM_005533.2 IFI35 NM_004418.2 DUSP2 NM_152876.1 FAS NM_021068.1 IFNA4 NM_004427.2 PHC2 NM_000486.3 AQP2 NM_000612.2 IGF2 NM_001970.3 EIF5A NM_053286.1 AQP6 NM_001552.1 IGFBP4 NM_001419.2 ELAVL1 NM_001659.1 ARF3 NM_000576.2 IL1B NM_198194.1 STOM NM_001660.2 ARF4 NM_172200.1 IL15RA NM_202001.1 ERCC1 NM_001663.2 ARF6 NM_005536.2 IMPA1 NM_023110.1 FGFR1 NM_001664.2 RHOA NM_014214.1 IMPA2 NM_201557.1 FHL2 NM_004040.2 RHOB NM_198219.1 ING1 NM_004468.3 FHL3 NM_175744.3 RHOC NM_198337.1 INSIG1 NM_057092.1 FKBP2 NM_005168.2 RND3 NM_002198.1 IRF1 NM_016730.1 FOLR1 NM_001665.2 rho G NM_004030.1 IRF7 NM_004477.1 FRG1 NM_004309.3 ARHGDIA NM_181493.1 ITPA NM_002032.1 FTH1 NM_001177.3 ARL1 NM_002228.3 JUN NM_002035.1 FVT1 NM_004311.2 ARL3 NM_002231.2 CD82 NM_001487.1 BLOC1S1 NM_004314.1 ART1 NM_004137.2 KCNMB1 NM_004483.3 GCSH NM_032468.2 ASPH NM_033360.2 KRAS NM_004124.2 GMFB NM_005171.2 ATF1 NM_002295.2 RPSA NM_000581.2 GPX1 NM_004024.2 ATF3 NM_005563.3 STMN1 NM_002085.1 GPX4 NM_001677.3 ATP1B1 NM_005564.2 LCN2 NM_147148.1 GSTM4 NM_001679.2 ATP1B3 NM_005566.1 LDHA NM_002095.3 GTF2E2 NM_001001977.1 ATP5E NM_201544.1 LGALS8 NM_002107.3 H3F3A NM_001002015.1 ATP5F1 NM_004987.3 LIMS1 NM_005342.1 HMGB3 NM_005175.2 ATP5G1 NM_005574.2 LMO2 NM_002133.1 HMOX1 NM_001002258.1 ATP5G3 NM_002346.1 LY6E NM_002134.2 HMOX2 NM_001003701.1 ATP5J NM_002353.1 TACSTD2 NM_156036.1 HOXB6 NM_001694.2 ATP6V0C NM_014220.1 TM4SF1 NM_024017.3 HOXB9 NM_001697.2 ATP5O NM_002354.1 TACSTD1 NM_000194.1 HPRT1 NM_004322.2 BAD NM_030885.2 MAP4 NM_005343.2 HRAS NM_053056.1 CCND1 NM_203378.1 MB NM_174856.1 IDH3B NM_138578.1 BCL2L1 NM_002386.2 MC1R NM_000628.3 IL10RB NM_004050.2 BCL2L2 NM_182763.1 MCL1 NM_181431.1 FOXK2
(Continued)

11
WT1 Gene Expression in Acute Leukemia
Bioinformatics and Biology Insights 2007: 1
S-Table-1. (Continued)
GenBank Gene GenBank Gene GenBank Gene Accession No. Symbol Accession No. Symbol Accession No. Symbol NM_000713.1 BLVRB NM_012328.1 DNAJB9 NM_181468.1 ITGB4BP NM_005180.5 PCGF4 NM_005370.4 RAB8A NM_201543.1 LGALS8 NM_004331.2 BNIP3L NM_177524.1 MEST NM_002359.2 MAFG NM_032515.3 BOK NM_005371.3 METTL1 NM_004528.2 MGST3 NM_004332.1 BPHL NM_017459.1 MFAP2 NM_022792.2 MMP19 NM_007306.1 BRCA1 NM_145791.1 MGST1 NM_002448.1 MSX1 NM_198590.1 BSG NM_002413.3 MGST2 NM_005962.3 MXI1 NM_001207.3 BTF3 NM_002414.3 CD99 NM_079424.1 MYL6 NM_001731.1 BTG1 NM_002415.1 MIF NM_032104.1 PPP1R12B NM_007311.2 BZRP NM_022791.2 MMP19 NM_004547.4 NDUFB4 NM_172369.1 C1QG NM_002434.1 MPG NM_182739.1 NDUFB6 NM_001217.2 CA11 NM_021126.3 MPST NM_005005.1 NDUFB9 NM_000387.3 SLC25A20 NM_012331.2 MSRA NM_020529.1 NFKBIA NM_006888.2 CALM1 NM_002451.3 MTAP NM_002520.4 NPM1 NM_005184.1 CALM3 NM_015675.1 GADD45B NM_002607.2 PDGFA NM_005185.2 CALML3 NM_001002841.1 (MYL4 NM_005022.2 PFN1 NM_001745.2 CAMLG NM_079423.1 MYL6 NM_000942.4 PPIB NM_001003962.1 CAPNS1 NM_002478.3 MYOD1 NM_206873.1 PPP1CA NM_004346.2 CASP3 NM_032103.1 PPP1R12B NM_183079.1 PRNP NM_001755.2 CBFB NM_005594.2 NACA NM_002765.2 PRPS2 NM_004059.3 CCBL1 NM_182744.1 NBL1 NM_145888.1 KLK10 NM_001759.2 CCND2 NM_014222.2 NDUFA8 NM_002790.2 PSMA5 NM_199246.1 CCNG1 NM_004548.1 NDUFB10 NM_152255.1 PSMA7 NM_001239.2 CCNH NM_004549.3 NDUFC2 NM_176783.1 PSME1 NM_001763.1 CD1A NM_002496.1 NDUFS8 NM_183236.1 RAB27A NM_000733.2 CD3E NM_181827.1 NF2 NM_004583.2 RAB5C NM_001769.2 CD9 NM_001001716.1 NFKBIB NM_133629.1 RAD51L3 NM_005191.2 CD80 NM_005008.2 NHP2L1 NM_021033.4 RAP2A NM_152942.1 TNFRSF8 NM_198175.1 NM23A/NME1 NM_002899.2 RBP1 NM_001244.2 TNFSF8 NM_000904.1 NQO2 NM_000976.2 RPL12 NM_001001392.1 CD44 NM_000270.1 NP NM_001016.2 RPS12 NM_198793.1 CD47 NM_199185.1 NPM1 NM_000331.2 SAA1 NM_000560.2 CD53 NM_006172.1 NPPA NM_005981.3 TSPAN31 NM_203330.1 CD59 NM_002524.2 NRAS NM_002970.1 SAT NM_004357.3 CD151 NM_004559.2 YBX1 NM_006745.2 SC4MOL NM_001786.2 CDC2 NM_007105.1 SLC22A18AS NM_006746.3 SCML1 NM_033534.1 CDC2L2 NM_005602.4 CLDN11 NM_001037.3 SCN1B NM_052827.1 CDK2 NM_175568.1 P2RX4 NM_003000.1 SDHB NM_000075.2 CDK4 NM_175081.1 P2RX5 NM_183352.1 SEC13L1 NM_078467.1 CDKN1A NM_002567.2 PBP NM_014563.2 TRAPPC2 NM_004064.2 CDKN1B NM_002573.2 PAFAH1B3 NM_003016.2 SFRS2 NM_000077.3 CDKN2A NM_181696.1 PRDX1 NM_152235.1 SFRS8 NM_078626.1 CDKN2C NM_000281.2 TCF1/PCBD1 NM_004593.1 SFRS10 NM_005195.2 CEBPD NM_032403.1 PCDHGC3 NM_173217.1 ST6GAL1 NM_001806.2 CEBPG NM_002592.2 PCNA NM_170679.1 SKP1A NM_001809.2 CENPA NM_033023.1 PDGFA NM_005984.1 SLC25A1 NM_004365.2 CETN3 NM_002608.1 PDGFB NM_022875.1 SMN2 NM_005507.2 CFL1 NM_213612.1 SLC25A3 NM_004596.3 SNRPA NM_001817.1 CEACAM4 NM_002642.3 PIGC NM_198216.1 SNRPB NM_152253.1 CHKB NM_002648.2 PIM1 NM_198220.1 SNRPB2 NM_013324.4 CISH NM_006224.2 PITPNA NM_177542.1 SNRPD2 NM_001281.2 CKAP1 NM_002653.3 PITX1 NM_004175.3 SNRPD3 NM_001284.2 AP3S1 NM_000929.1 PLA2G5 NM_022807.2 SNRPN NM_001288.4 CLIC1 NM_001005376.1 PLAUR NM_000454.4 SOD1 NM_001291.2 CLK2 NM_021910.1 FXYD3 NM_006943.2 SOX12 NM_001293.1 CLNS1A NM_021105.1 PLSCR1 NM_001047.1 SRD5A1
(Continued)

12
Kan et al
Bioinformatics and Biology Insights 2007: 1
S-Table-1. (Continued)
GenBank Gene GenBank Gene GenBank Gene Accession No. Symbol Accession No. Symbol Accession No. Symbol NM_007097.2 CLTB NM_153321.1 PMP22 NM_003132.1 SRM NM_004368.2 CNN2 NM_174930.2 PMS2L5 NM_003135.1 SRP19 NM_007310.1 COMT NM_001003686.1 PMS2L3 NM_003144.2 SSR1 NM_001300.3 KLF6 NM_022716.1 PRRX1 NM_003155.1 STC1 NM_001861.2 OX4I1 NM_002696.1 POLR2G NM_177528.1 SULT1A2 NM_001305.3 CLDN4 NM_006232.2 POLR2H NM_004177.3 STX3A NM_001306.2 CLDN3 NM_006233.4 POLR2I NM_004604.3 STX4A NM_001307.3 CLDN7 NM_021129.2 PPA1 NM_003164.2 STX5A NM_001878.2 CRABP2 NM_203430.1 PPIA NM_177534.1 SULT1A1 NM_004379.2 CREB1 NM_000943.4 PPIC NM_003166.2 SULT1A3 NM_001310.2 CREBL2 NM_177951.1 PPM1A NM_181491.1 SURF5 NM_181571.1 CREM NM_177969.1 PPM1B NM_014231.3 VAMP1 NM_005206.3 CRK NM_206877.1 PPP1CB NM_014232.1 VAMP2 NM_005207.2 CRKL NM_002710.1 PPP1CC NM_005638.3 SYBL1 NM_001889.2 CRYZ NM_006241.3 PPP1R2 NM_006754.2 SYPL1 NM_139014.1 MAPK14 NM_002715.1 PPP2CA NM_003187.3 TAF9 NM_177436.1 CSE1L NM_178002.1 PR 53/PPP2R4 NM_005643.2 TAF11 NM_022644.2 CSH2 NM_000945.3 PPP3R1 NM_172208.1 TAPBP NM_177560.2 CSNK2A1 NM_005399.3 PRKAB2 NM_134324.1 TARBP2 NM_001320.5 CSNK2B NM_207578.1 PRKACB NM_201437.1 TCEA1 NM_001321.1 CSRP2 NM_212461.1 PRKAG1 NM_213648.1 TCF7 NM_000396.2 CTSK NM_138981.1 MAPK10 NM_181738.1 PRDX2 NM_004394.1 DAP NM_002756.2 MAP2K3 NM_201443.1 TEAD4 NM_020548.4 DBI NM_002764.2 PRPS1 NM_003201.1 TFAM NM_001924.2 GADD45A NM_139277.1 KLK7 NM_174886.1 TGIF NM_004083.4 DDIT3 NM_002774.2 KLK6 NM_003255.3 TIMP2 NM_001355.2 DDT NM_213633.1 PSG4 NM_003270.2 TSPAN6 NM_030655.2 DDX11 NM_203287.1 PSG11 NM_003271.3 TSPAN4 NM_213566.1 DFFA NM_148976.1 PSMA1 NM_021137.3 TNFAIP1 NM_000791.2 DHFR NM_002789.3 PSMA4 NM_000363.3 TNNI3 NM_007326.1 CYB5R3 NM_002791.1 PSMA6 NM_005079.1 TPD52 NM_138281.1 DLX4 NM_002794.3 PSMB2 NM_003287.2 TPD52L1 NM_203316.1 DPAGT1 NM_002801.2 PSMB10 NM_199362.1 TPD52L2

13
WT1 Gene Expression in Acute Leukemia
Bioinformatics and Biology Insights 2007: 1
S-Ta
ble
2. S
eque
nce
varia
nts
H
omoz
ygou
s al
tera
tion
Het
eroz
ygou
s al
tera
tion
Gen
Ban
k G
ene
Syno
nym
ous
NC
BI S
NP
Non
- N
CB
I SN
P Sy
nony
mou
s N
CB
I SN
P N
on-
NC
BI S
NP
Acc
essi
on
Sym
bol
alte
ratio
n D
atab
ase
Syno
nym
ous
Dat
abas
e al
tera
tion
Dat
abas
e Sy
nony
mou
s D
atab
ase
No.
alte
ratio
n
alte
ratio
nN
M_0
0032
0 Q
DP
R
G39
6A,
rs25
9777
5
Leu1
32Le
uN
M_0
0033
1 S
AA
1
C
209T
, rs
1136
743
Ala
70Va
l
T2
24C
, rs
1136
747
Val7
5Ala
NM
_001
007
RP
S4X
G
492A
, rs
7580
Le
u164
Leu
NM
_001
020
RP
S16
C
15T,
rs
1762
6
Gly
5Gly
T2
7G,
rs
1762
8
Ser
9Ser
NM
_001
047
SR
D5A
1
A
309A
G,
rs38
2243
0
P
ro10
3Pro
G34
8GA
, rs
8192
186
Ala
116A
laN
M_0
0132
0 C
SN
K2B
T1
38C
, rs
1436
5
Tyr4
6Tyr
NM
_001
636
SLC
25A
6 T4
08C
, rs
7205
P
he13
6Phe
NM
_001
697
ATP
50
T108
C,
rs17
7286
65
A21
8AG
, *
G
ly36
Gly
Ly
s73A
rgN
M_0
0176
0 C
CN
D3
T775
TG,
rs10
5113
0
S
er25
9Ala
NM
_001
817
CE
AC
AM
4
T6
68A
, *
Val2
23G
lu.
NM
_001
861
CO
X4I
1
G
7GA
, rs
1785
5751
Ala
3Thr
NM
_001
889
CR
YZ
G54
A,
rs46
5028
4
T1
38C
, *
G
ly18
Gly
G
ly46
Gly
NM
_002
131
HM
GA
1 T6
C,
* G
49A
, *
S
er2S
er
Glu
17Ly
s
G78
T,
*
G11
2A,
*
Arg
26A
rg
Gly
38A
rg
C25
5A,
*
C14
3T,
*(C
ontin
ued)

14
Kan et al
Bioinformatics and Biology Insights 2007: 1
Tabl
e 2.
(Con
tinue
d)
H
omoz
ygou
s al
tera
tion
Het
eroz
ygou
s al
tera
tion
Gen
Ban
k G
ene
Syno
nym
ous
NC
BI S
NP
Non
- N
CB
I SN
P Sy
nony
mou
s N
CB
I SN
P N
on-
NC
BI S
NP
Acc
essi
on
Sym
bol
alte
ratio
n D
atab
ase
Syno
nym
ous
Dat
abas
e al
tera
tion
Dat
abas
e Sy
nony
mou
s D
atab
ase
No.
alte
ratio
n
alte
ratio
n
Gly
85G
ly
P
ro48
Leu
C
217T
, *
A
rg73
Gly
C
236T
, *
A
237G
,
Pro
79Le
u
G28
6A,
*
Glu
96Ly
sN
M_0
0213
6 H
NR
PA1
C74
4T,
*
G
ly24
8Gly
NM
_002
414
CD
99
C36
9CT,
rs
4575
010
Ala
121A
laN
M_0
0264
2 P
IGC
T2
67C
, rs
2230
471
G
ly89
Gly
NM
_002
813
PS
MD
9
T5
0C,
rs22
3068
1
Va
l17A
laN
M_0
0314
4 S
SR
1
C
388T
, *
His
130T
yrN
M_0
0325
5 TI
MP
2
G
303G
A,
rs22
7769
8
S
er10
1Ser
NM
_004
064
CD
KN
1B
T326
TG,
rs20
6682
7
Va
l109
Gly
NM
_004
137
KC
NM
B1
G19
3GA
, rs
1173
9136
Glu
65Ly
sN
M_0
0417
5 S
NR
PD
3 T3
03C
, rs
3176
991
A
la10
1Ala
NM
_004
365
CE
TN3
G28
GC
, rs
4873
Val1
0Leu
NM
_004
468
FHL3
G
540A
, rs
7366
048
P
ro18
0Pro
NM
_004
549
ND
UFC
2
C
136C
G,
rs88
75
Le
u46V
alN
M_0
0517
1 AT
F1
C32
7CT,
rs
1129
406
Tyr1
09Ty
rN
M_0
0519
1 C
D80
G
135G
A,
rs22
2801
7(C
ontin
ued)

15
WT1 Gene Expression in Acute Leukemia
Bioinformatics and Biology Insights 2007: 1
Tabl
e 2.
(Con
tinue
d)
H
omoz
ygou
s al
tera
tion
Het
eroz
ygou
s al
tera
tion
Gen
Ban
k G
ene
Syno
nym
ous
NC
BI S
NP
Non
- N
CB
I SN
P Sy
nony
mou
s N
CB
I SN
P N
on-
NC
BI S
NP
Acc
essi
on
Sym
bol
alte
ratio
n D
atab
ase
Syno
nym
ous
Dat
abas
e al
tera
tion
Dat
abas
e Sy
nony
mou
s D
atab
ase
No.
alte
ratio
n
alte
ratio
n
Val4
5Val
NM
_005
301
GP
R35
G
85G
A,
*
A
la29
Thr.
A88
0AC
, rs
3749
172
NM
_005
342
HM
GB
3 C
558G
, *
Ser
294A
rg
Asn
186L
ysN
M_0
0559
4 N
AC
A
T5
43TA
, rs
4788
Ile18
1Ile
NM
_005
984
SLC
25A
1 A
831G
, *
Ly
s277
Lys
NM
_006
353
HM
GN
4 G
198A
rs
4871
G
ly66
Gly
NM
_006
896
HO
XA
7 T9
6G,
rs23
0172
0 G
52A
, rs
2301
721
A
la32
Ala
A
la18
Thr
NM
_007
310
CO
MT
C36
T,
rs46
33
G32
2A,
rs46
80
His
12H
is
Val1
08M
etN
M_0
0731
1 B
ZRP
A15
8G,
rs69
71
G20
4GA
, rs
6972
H
is53
Arg
A
la68
Ala
NM
_012
328
DN
AJB
9 G
183A
, rs
1043
615
P
ro61
Pro
NM
_013
332
HIG
2 A
84G
, *
G
lu28
Glu
NM
_014
212
HO
XC
11
T36G
, rs
4759
315
S
er12
Ser
NM
_014
232
VAM
P2
T346
A,
*
S
er11
6Thr
NM
_021
068
IFN
A4
A14
6AC
, *
H
is49
Pro
G
178G
C,
*
Gly
60A
rg
T190
TA,
*
Phe
64Ile
G
187G
C,
rs
3203
576
G
lu63
Gln
N
M_0
2400
9 G
JB3
C
357C
T,
*(C
ontin
ue)

16
Kan et al
Bioinformatics and Biology Insights 2007: 1
Tabl
e 2.
(Con
tinue
d)
H
omoz
ygou
s al
tera
tion
Het
eroz
ygou
s al
tera
tion
Gen
Ban
k G
ene
Syno
nym
ous
NC
BI S
NP
Non
- N
CB
I SN
P Sy
nony
mou
s N
CB
I SN
P N
on-
NC
BI S
NP
Acc
essi
on
Sym
bol
alte
ratio
n D
atab
ase
Syno
nym
ous
Dat
abas
e al
tera
tion
Dat
abas
e Sy
nony
mou
s D
atab
ase
No.
alte
ratio
n
alte
ratio
n
A
sn11
9Asn
NM
_033
251
RP
L13
G33
4A,
rs99
3056
7
A
la11
2Thr
NM
_052
871
MG
C46
77
G28
T,
rs28
6738
96
C12
CT,
*
C10
9CT,
*
Ala
10S
er
Th
r4Th
r
Arg
37C
ysN
M_0
5819
7 C
DK
N2A
A
160T
,
*
Arg
54G
lyN
M_1
4588
8 K
LK10
A
318C
, rs
2075
688
T347
C,
*
G
ly10
6Gly
Leu1
16P
ro
C
336G
, rs
1061
368
Thr1
12Th
r
G
423A
, rs
2075
689
Leu1
41Le
uN
M_1
7220
0 IL
15R
A
C
248T
,
*
Pro
83Le
u
A
337C
,
*
Thr1
13P
roN
M_1
7236
9 C
1QG
G
644A
,
*
Gly
215G
luN
M_1
8157
1 C
RE
M
T410
C,
*
Ile
137T
hrN
M_1
9897
0 TE
AD
4
C
580C
T,
*
P
ro19
4Leu
NM
_201
544
LGA
LS8
A16
6AG
, rs
1041
937
Met
56Va
l.
G
542G
C,
*
G
ly18
1Ala
* N
o re
port
foun
d.
Copyright © 2022 FDOKUMEN