Rigorous calculation method for resonance frequencies in ...
Upload
independentCategory
view
0download
0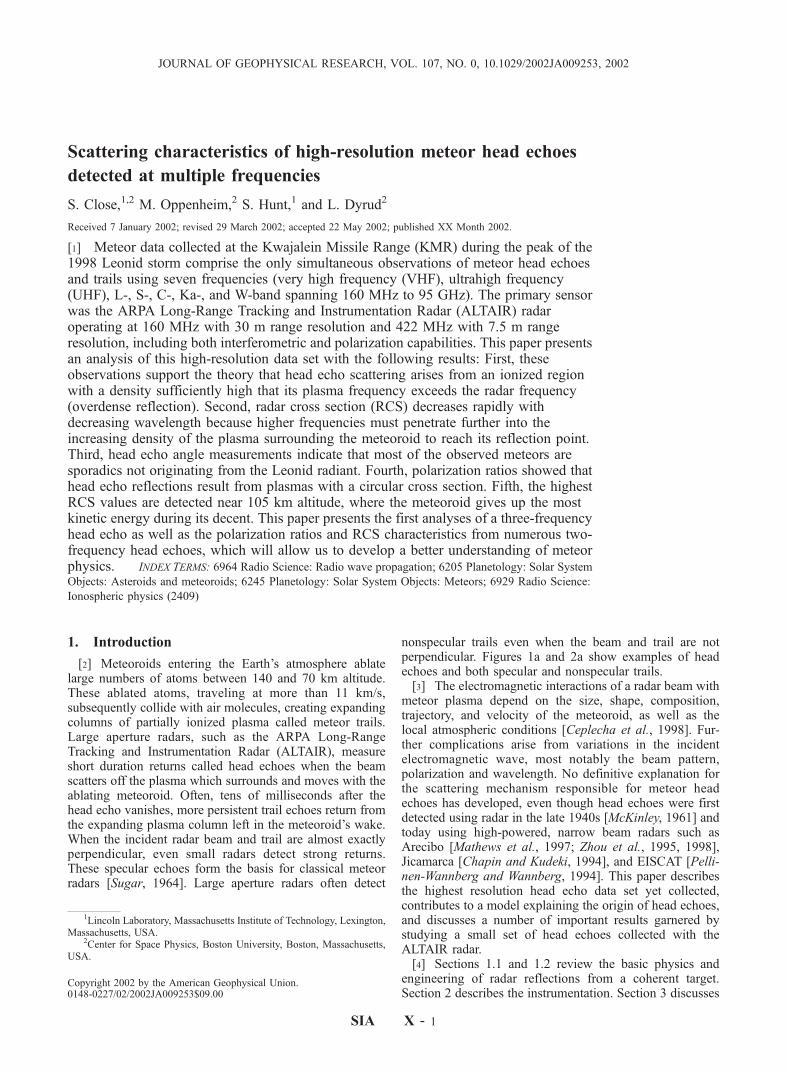
Scattering characteristics of high-resolution meteor head echoes
detected at multiple frequencies
S. Close,1,2 M. Oppenheim,2 S. Hunt,1 and L. Dyrud2
Received 7 January 2002; revised 29 March 2002; accepted 22 May 2002; published XX Month 2002.
[1] Meteor data collected at the Kwajalein Missile Range (KMR) during the peak of the1998 Leonid storm comprise the only simultaneous observations of meteor head echoesand trails using seven frequencies (very high frequency (VHF), ultrahigh frequency(UHF), L-, S-, C-, Ka-, and W-band spanning 160 MHz to 95 GHz). The primary sensorwas the ARPA Long-Range Tracking and Instrumentation Radar (ALTAIR) radaroperating at 160 MHz with 30 m range resolution and 422 MHz with 7.5 m rangeresolution, including both interferometric and polarization capabilities. This paper presentsan analysis of this high-resolution data set with the following results: First, theseobservations support the theory that head echo scattering arises from an ionized regionwith a density sufficiently high that its plasma frequency exceeds the radar frequency(overdense reflection). Second, radar cross section (RCS) decreases rapidly withdecreasing wavelength because higher frequencies must penetrate further into theincreasing density of the plasma surrounding the meteoroid to reach its reflection point.Third, head echo angle measurements indicate that most of the observed meteors aresporadics not originating from the Leonid radiant. Fourth, polarization ratios showed thathead echo reflections result from plasmas with a circular cross section. Fifth, the highestRCS values are detected near 105 km altitude, where the meteoroid gives up the mostkinetic energy during its decent. This paper presents the first analyses of a three-frequencyhead echo as well as the polarization ratios and RCS characteristics from numerous two-frequency head echoes, which will allow us to develop a better understanding of meteorphysics. INDEX TERMS: 6964 Radio Science: Radio wave propagation; 6205 Planetology: Solar System
Objects: Asteroids and meteoroids; 6245 Planetology: Solar System Objects: Meteors; 6929 Radio Science:
Ionospheric physics (2409)
1. Introduction
[2] Meteoroids entering the Earth’s atmosphere ablatelarge numbers of atoms between 140 and 70 km altitude.These ablated atoms, traveling at more than 11 km/s,subsequently collide with air molecules, creating expandingcolumns of partially ionized plasma called meteor trails.Large aperture radars, such as the ARPA Long-RangeTracking and Instrumentation Radar (ALTAIR), measureshort duration returns called head echoes when the beamscatters off the plasma which surrounds and moves with theablating meteoroid. Often, tens of milliseconds after thehead echo vanishes, more persistent trail echoes return fromthe expanding plasma column left in the meteoroid’s wake.When the incident radar beam and trail are almost exactlyperpendicular, even small radars detect strong returns.These specular echoes form the basis for classical meteorradars [Sugar, 1964]. Large aperture radars often detect
nonspecular trails even when the beam and trail are notperpendicular. Figures 1a and 2a show examples of headechoes and both specular and nonspecular trails.[3] The electromagnetic interactions of a radar beam with
meteor plasma depend on the size, shape, composition,trajectory, and velocity of the meteoroid, as well as thelocal atmospheric conditions [Ceplecha et al., 1998]. Fur-ther complications arise from variations in the incidentelectromagnetic wave, most notably the beam pattern,polarization and wavelength. No definitive explanation forthe scattering mechanism responsible for meteor headechoes has developed, even though head echoes were firstdetected using radar in the late 1940s [McKinley, 1961] andtoday using high-powered, narrow beam radars such asArecibo [Mathews et al., 1997; Zhou et al., 1995, 1998],Jicamarca [Chapin and Kudeki, 1994], and EISCAT [Pelli-nen-Wannberg and Wannberg, 1994]. This paper describesthe highest resolution head echo data set yet collected,contributes to a model explaining the origin of head echoes,and discusses a number of important results garnered bystudying a small set of head echoes collected with theALTAIR radar.[4] Sections 1.1 and 1.2 review the basic physics and
engineering of radar reflections from a coherent target.Section 2 describes the instrumentation. Section 3 discusses
JOURNAL OF GEOPHYSICAL RESEARCH, VOL. 107, NO. 0, 10.1029/2002JA009253, 2002
1Lincoln Laboratory, Massachusetts Institute of Technology, Lexington,Massachusetts, USA.
2Center for Space Physics, Boston University, Boston, Massachusetts,USA.
Copyright 2002 by the American Geophysical Union.0148-0227/02/2002JA009253$09.00
SIA X - 1
the data set used in this study. Section 4 discusses the resultsof analyzing this data set and includes the following: section4.1 presents the observed distribution of echoes, section 4.2evaluates the meteor plasma shape using polarization data,sections 4.3 and 4.4 compares radar cross section (RCS) toradarwavelength andmeteor velocity and altitude, section 4.5compares a number of possible mechanisms which mayproduce head echoes, and section 4.6 contains a detailedanalysis of a single meteor which returned head echoes at 3frequencies. Section 5 summarizes and concludes.
1.1. Head Echo Reflection and RCS
[5] The source of head echo scattering remains undeter-mined; a number of scattering mechanisms may play a rolein interpreting radar data and head echoes. The RCS, s, of ahead echo is obtained by using the radar range equation fora point scatterer [Skolnik, 1990]
s ¼R4 S
N
� �C
Pt
ð1Þ
where (S/N) is the signal-to-noise ratio (SNR) of the target,R is the range, Pt is the transmitted power, and C is the
calibration constant. The calibration constant is embeddedin the ALTAIR system files and contains the Boltzmannconstant, bandwidth, system noise temperature, antennagain and radar wavelength.[6] A number of possible scattering mechanisms may
cause head echoes. One possible mechanism results fromcoherent returns from a volume of electrons that is smallcompared with the incident radar wavelength [Mathews etal., 1997]. Backscatter from this volume is proportional toN 2 (number of electrons) according to
s ¼ 4pa2o N2 ð2Þ
where ao is the classical electron radius. This assumes thatthe electrons scatter in-phase and that the scattered E fieldsadd. If a region is to contribute substantially to the RCS itsdiameter must be less than l/4; regions outside this willtend to average to the incoherent scatter RCS (s / N) (J.Mathews, private communication).
Figure 1. (a) Range-time-intensity image from 12 August1998, showing head echo and specular trail pair at 160 MHzand (b) corresponding maximum LC and RC signal for bothhead echo and trail as a function of time.
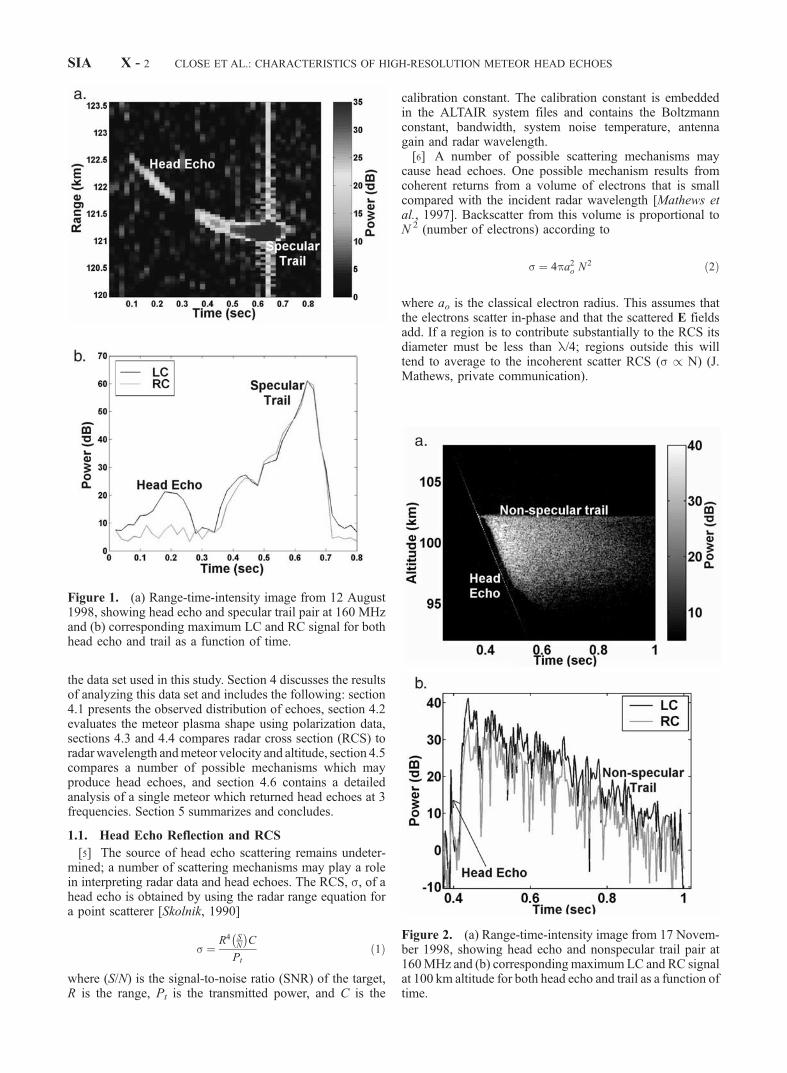
Figure 2. (a) Range-time-intensity image from 17 Novem-ber 1998, showing head echo and nonspecular trail pair at160MHz and (b) correspondingmaximum LC and RC signalat 100 km altitude for both head echo and trail as a function oftime.
SIA X - 2 CLOSE ET AL.: CHARACTERISTICS OF HIGH-RESOLUTION METEOR HEAD ECHOES

[7] Another possibility is overdense scattering [Wann-berg et al., 1996], which occurs when the plasma frequencyexceeds the radar frequency
f ¼ 9000ffiffiffin
pð3Þ
where f is the incident radar frequency in Hz and n is theelectron volume density in cm�3. In this scenario, we canassume that the plasma behaves approximately as aconducting sphere of some arbitrary size.[8] The exact solution for the cross section of a sphere
was first given by Mie (1908) and illustrates the dependencebetween the measured cross section and the physical size ofthe object. The Mie series can be broken down into threeregions, including objects that are much less than a wave-length (Rayleigh regime), object sizes that are of the orderof the wavelength (resonance region), and objects that aremuch greater than a wavelength (optical region).[9] In the Rayleigh regime, where 0 < ka < 1, the RCS is
proportional to the square of the area of the body
spa2
ffi 92pal
� �4
ð4Þ
where k = 2p/l, a is the Rayleigh radius of the target’s crosssection and l is the incident wavelength. The resonantscattering regime occurs when 1/2 < ka < 10 and ischaracterized by undulations of s caused by the addition ofa specular reflection from the front of the sphere with acreeping wave that traverses its shadowed sides. Thespecular reflection and creeping wave go in and out ofphase due to the difference in their path lengths. Finally, theoptical region, where ka > 10, gives rise to RCS values thatapproximate the physical cross section, or s = pa2, where ais the physical radius.[10] This Mie series also applies to dielectric spheres,
although the scattering is more complicated since the inci-dent energy may enter the body and incur several internalreflections before emerging [Blake, 1986]. For a dielectricsphere that is large compared to the incident wavelength, theRCS of the sphere decays gradually with increasing size. Asmall dielectric sphere, such as the target scattering the headecho, exhibits an RCS that increases with increasing size.The RCS of a very small dielectric sphere of complexdielectric constant e can be approximated as
spa2
ffi 42pal
� �4 e� 1
eþ 2
��������2
ð5Þ
which assumes that the size of the body is so smallcompared to a wavelength that secondary scattering isunimportant. This expression conforms to the well-knownRayleigh scattering law, which has been used to study theRCS of raindrops. If the radar frequency exceeds the plasmafrequency, e/eo < 1; the dielectric constant approaches 1 asthe radar frequency increases far above the plasmafrequency.
1.2. Polarization Effects
[11] ALTAIR transmits a right-circularly polarized waveand receives both right-circular (RC) and left-circular (LC)
energy. An object elongated in only one dimension quasi-perpendicular to the radar beam will reflect only half of theincident power which will be equally distributed in the LCand RC components, while an object with a more circularcross section will reflect all of the incident power as LC.The following section describes the physics of polarizedscattering, which we will use to evaluate the shape of themeteor plasmas in section 4.[12] The ratio of the LC to RC SNR data is defined as the
polarization ratio (PR), and is computed using
PR ¼ 10 log10LC
RC
� �ð6Þ
The case of a high polarization ratio typically indicatesreflection from a sphere or flat object, while a lowpolarization ratio indicates reflection from a cylinder (orline)-like object. A depolarized signal (transmit and receiveonly RC) is thought of as having completed one ‘‘bounce,’’such as from a corner reflector. However, these simplifica-tions are usually applied to highly reflective surfaces(orbiting satellites, for instance) and cannot necessarily beutilized when referring to ionospheric reflections. This ideacan be applied to overdense scattering when the plasmafrequency exceeds the radar frequency and the plasmabehaves like a metallic object from a scattering perspective.
2. Instrumentation
[13] ALTAIR resides in the central Pacific at 9�N and167�E (geographic) on the island of Roi-Namur in theKwajalein Atoll, Republic of the Marshall Islands. ALTAIRis a high-power, two-frequency radar capable of collectingaccurate measurements on small targets at long ranges.ALTAIR has a 46 m diameter, mechanically steered, para-bolic dish that transmits a peak power of 6 MW simulta-neously at two frequencies. A complex transmit and receiveradiofrequency antenna feed system allows the simultane-ous operation at both very high frequency (VHF) andultrahigh frequency (UHF). Targets are illuminated withRC polarized signal energy in a narrow half-power beamwidth of 2.8� and 1.1� at VHF and UHF, respectively. Thereflected signal energy is focused by the dish into the duallypolarized feed horn, which receives the LC and RC polar-ized signal energies separately. These two channel measure-ments are recorded as sum LC and sum RC. ALTAIR alsohas four additional receive horns that collect LC signalreturns for the purpose of angle measurement. The receivedchannels are offset from the focus of the dish, and themeasured signal energy is differenced to produce twoadditional channels of data, including the LC azimuthdifference (ALC) and LC elevation difference (ELC).ALC and ELC are combined in a process known asamplitude comparison monopulse [Blake, 1986], a form ofphase interferometry, to measure the angle of arrival of theradar return (for each pulse) to within a small fraction of thebeam width. Combined with a range measurement derivedfrom the time delay of the target return, ALTAIR candetermine the position of an object in three dimensions.Using the most sensitive waveforms available, ALTAIR canreliably detect a target as small as �74 decibels-relative-to-a-square-meter (dBsm) at VHF (�80 dBsm at UHF) at a
CLOSE ET AL.: CHARACTERISTICS OF HIGH-RESOLUTION METEOR HEAD ECHOES SIA X - 3

range of 100 km. This high system sensitivity makesALTAIR well suited for the detection of weak head echoesand nonspecular trails.[14] TRADEX transmits RC polarization at L-band and
S-band and receives both RC and LC in both bands. Angletrack capability exists at L-band only; range track ispossible at both frequencies. The system utilizes both uni-form train and burst subpulse spacing to achieve high rangeand velocity resolution. Two Gould 9780 computers providereal-time control of tracking functions, waveform selectionand multiplexing, data recording, and system test andcalibration. The parameters associated with the ALTAIRand TRADEX radars are contained in Table 1.
3. Observations
[15] Meteor data were collected at Kwajalein MissileRange (KMR) on 18 November 1998, during a 4-hourperiod in 2-min segments, which was designed to span thepredicted peak of the Leonid storm (0730 local time). Fourradars, including ALTAIR, TRADEX, ALCOR and MMWas well as a ballistic camera were pointed simultaneously onand off radiant. ALTAIR (160, 422 MHz) and TRADEX(1320, 2950 MHz) data are described herein, due to theirlower operating frequencies and therefore higher detectionrates. The peak detection rate was approximately 1.6 VHFhead echoes every second [Close et al., 2000]. Amplitudeand phase data were recorded for each frequency andfour receive channels for altitudes spanning 70–140 kmat VHF and 90–110 km at UHF. The UHF altitudeextent was smaller due to the very small (7.5 m) rangesample spacing and the corresponding limit on diskspace. The two ALTAIR waveforms used to collect the datawere a 40 ms VHF pulse (30 m range spacing), and a 150 msUHF pulse (7.5 m range spacing). A 333 Hz pulse-repetitionfrequency (PRF) was utilized for its high sampling rate,which allowed the precise calculation of the deceleration as afunction of altitude. Even using this high sampling rate(interpulse period of 0.003 s), every head echo data pointwas confined within a pulse; this justifies treating headechoes as point scatterers and using equation (1) to calculatethe RCS.[16] Radar amplitude and phase measurements were
reduced using signal processing algorithms developed atMIT Lincoln Laboratory. The following quantities werecomputed: RC RCS, LC RCS, monopulse azimuth andelevation angle offset, time duration, altitude, range rate,3D position, 3D velocity and deceleration, and polarizationratio.
[17] Meteoroid 3D velocities and decelerations werecalculated by fitting the head echo range versus time datato a third-order polynomial and correcting for the 3Dposition in the beam by applying the monopulse data. Oncethe 3D position of the meteoroid was determined as afunction of time and altitude, the 3D velocity and deceler-ation was computed by differencing successive data pointsalong the meteoroid’s path. These data were also used tocompute the angle of the head echo trajectory with the radarline-of-sight.[18] Range rates were used to correct the target ranges
(and altitudes) for range–Doppler coupling. Range–Dop-pler coupling is a property of a chirp-type pulse, whereDoppler shifts of the radar echo cause an offset in theapparent range of the echo. The relationship betweentarget range rate and the range–Doppler coupling rangeoffset is �r = (Tf0vr)/B, where �r is the range offset, T isthe pulse width, f0 is the radar RF frequency, vr is thetarget radial velocity, and B is the chirp bandwidth [Blake,1986]. The quantity (Tf0)/B has units of time and is calledthe range–Doppler coupling constant. The range–Dopplercoupling constant for the ALTAIR waveforms primarilyused in this study are 2.13 10�3 s (VHF) and 3.52 10�3 s (UHF).[19] Unless otherwise stated, the analysis contained
herein applies only to 422 VHF and 210 UHF headechoes that were contained within the main beam of theALTAIR system, or 2.8� at VHF and 1.1� at UHF. TheLC and RC RCS for each head echo was also correctedfor position in the mainbeam so that the variation in RCSwith time or altitude does not simply trace out the beampattern.
4. Discussion
[20] The remainder of this paper presents data analysis insupport of the theory that meteor head echo scatteringresults from an overdense plasma with a circular crosssection and an RCS that depends upon frequency, velocityand altitude. In section 4.1, we show that the angular offsetdata indicate that most meteors detected during the Leonidshower were actually sporadics and not associated with theshower. In section 4.2, we present polarization ratio data,which show that the head echo target has a circular crosssection. Section 4.3 contains an analysis of two-frequencydetections and reveals that RCS increases with wavelength.Section 4.4 describes the RCS dependence on velocity andaltitude. Section 4.5 contains head echo radii and densities,which all fall within the overdense scattering regime.Finally section 4.6 contains a discussion of the first headecho/nonspecular trail pair that was detected simultaneouslyat VHF, UHF and L-band and revisits the arguments madein sections 4.1, 4.2, 4.3, and 4.4 in support of overdensescattering.
4.1. Head Echo Angular Offset
[21] The monopulse (interferometric) capabilities of theALTAIR system give the 3D position of the head echowithin the beam. We calculated the angular offset from theALTAIR boresight for all head echoes when ALTAIR waspointing both on and off radiant to the Leonid shower.These data revealed that most head echoes are not parallel to
Table 1. Summary of Radar Characteristics for ALTAIR (VHF/
UHF) and TRADEX (L-/S-band)
VHF UHF L-band S-band
Antenna diameter 46 m 46 m 26 m 26 mFrequency 160 MHz 422 MHz 1320 MHz 2950 MHzBeam width 2.8� 1.1� 0.6� 0.3�Peak Power 6.0 MW 6.4 MW 2.0 MW 2.0 MWRange Resolution 30 m 7 m 15 m 15 mSensitivity �55 dBsm �75 dBsm �47 dBsm �43 dBsmBandwidth 3 MHz 18 MHz 20 MHz 17.6 MHzPRF 333 333 Hz 2000 Hz 2000 HzPulsewidth 40 us 150 us 50 us 9 us
SIA X - 4 CLOSE ET AL.: CHARACTERISTICS OF HIGH-RESOLUTION METEOR HEAD ECHOES
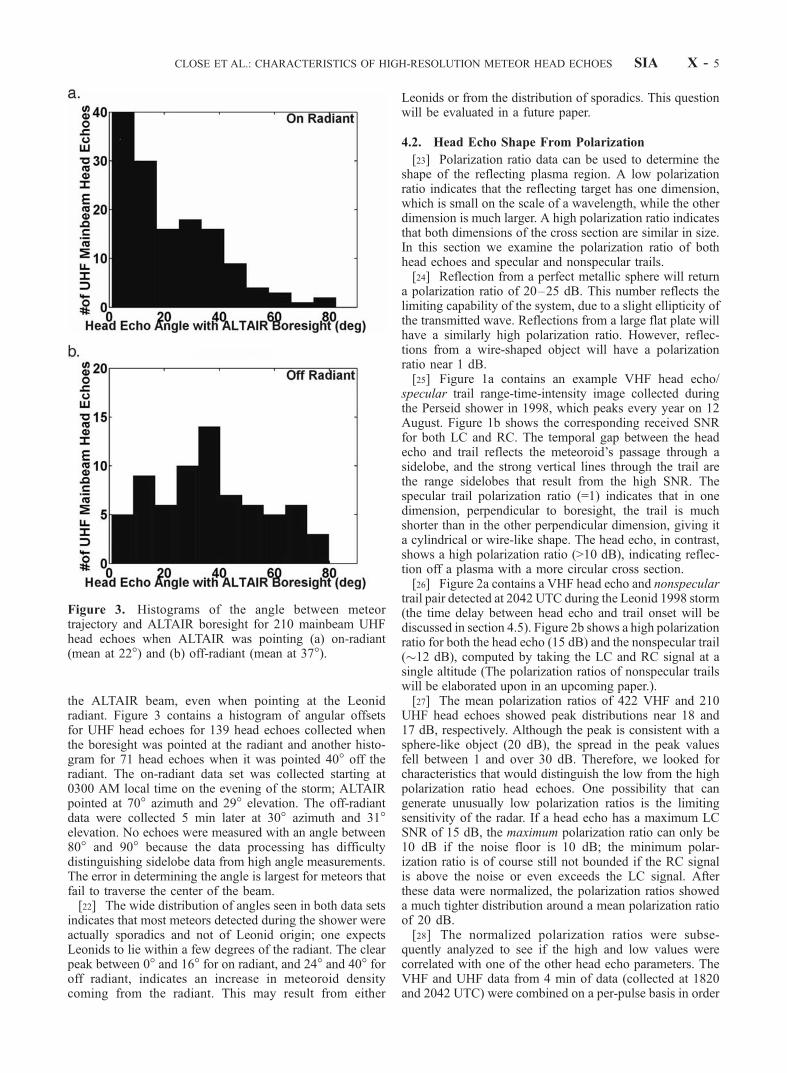
the ALTAIR beam, even when pointing at the Leonidradiant. Figure 3 contains a histogram of angular offsetsfor UHF head echoes for 139 head echoes collected whenthe boresight was pointed at the radiant and another histo-gram for 71 head echoes when it was pointed 40� off theradiant. The on-radiant data set was collected starting at0300 AM local time on the evening of the storm; ALTAIRpointed at 70� azimuth and 29� elevation. The off-radiantdata were collected 5 min later at 30� azimuth and 31�elevation. No echoes were measured with an angle between80� and 90� because the data processing has difficultydistinguishing sidelobe data from high angle measurements.The error in determining the angle is largest for meteors thatfail to traverse the center of the beam.[22] The wide distribution of angles seen in both data sets
indicates that most meteors detected during the shower wereactually sporadics and not of Leonid origin; one expectsLeonids to lie within a few degrees of the radiant. The clearpeak between 0� and 16� for on radiant, and 24� and 40� foroff radiant, indicates an increase in meteoroid densitycoming from the radiant. This may result from either
Leonids or from the distribution of sporadics. This questionwill be evaluated in a future paper.
4.2. Head Echo Shape From Polarization
[23] Polarization ratio data can be used to determine theshape of the reflecting plasma region. A low polarizationratio indicates that the reflecting target has one dimension,which is small on the scale of a wavelength, while the otherdimension is much larger. A high polarization ratio indicatesthat both dimensions of the cross section are similar in size.In this section we examine the polarization ratio of bothhead echoes and specular and nonspecular trails.[24] Reflection from a perfect metallic sphere will return
a polarization ratio of 20–25 dB. This number reflects thelimiting capability of the system, due to a slight ellipticity ofthe transmitted wave. Reflections from a large flat plate willhave a similarly high polarization ratio. However, reflec-tions from a wire-shaped object will have a polarizationratio near 1 dB.[25] Figure 1a contains an example VHF head echo/
specular trail range-time-intensity image collected duringthe Perseid shower in 1998, which peaks every year on 12August. Figure 1b shows the corresponding received SNRfor both LC and RC. The temporal gap between the headecho and trail reflects the meteoroid’s passage through asidelobe, and the strong vertical lines through the trail arethe range sidelobes that result from the high SNR. Thespecular trail polarization ratio (=1) indicates that in onedimension, perpendicular to boresight, the trail is muchshorter than in the other perpendicular dimension, giving ita cylindrical or wire-like shape. The head echo, in contrast,shows a high polarization ratio (>10 dB), indicating reflec-tion off a plasma with a more circular cross section.[26] Figure 2a contains a VHF head echo and nonspecular
trail pair detected at 2042 UTC during the Leonid 1998 storm(the time delay between head echo and trail onset will bediscussed in section 4.5). Figure 2b shows a high polarizationratio for both the head echo (15 dB) and the nonspecular trail(12 dB), computed by taking the LC and RC signal at asingle altitude (The polarization ratios of nonspecular trailswill be elaborated upon in an upcoming paper.).[27] The mean polarization ratios of 422 VHF and 210
UHF head echoes showed peak distributions near 18 and17 dB, respectively. Although the peak is consistent with asphere-like object (20 dB), the spread in the peak valuesfell between 1 and over 30 dB. Therefore, we looked forcharacteristics that would distinguish the low from the highpolarization ratio head echoes. One possibility that cangenerate unusually low polarization ratios is the limitingsensitivity of the radar. If a head echo has a maximum LCSNR of 15 dB, the maximum polarization ratio can only be10 dB if the noise floor is 10 dB; the minimum polar-ization ratio is of course still not bounded if the RC signalis above the noise or even exceeds the LC signal. Afterthese data were normalized, the polarization ratios showeda much tighter distribution around a mean polarization ratioof 20 dB.[28] The normalized polarization ratios were subse-
quently analyzed to see if the high and low values werecorrelated with one of the other head echo parameters. TheVHF and UHF data from 4 min of data (collected at 1820and 2042 UTC) were combined on a per-pulse basis in order
Figure 3. Histograms of the angle between meteortrajectory and ALTAIR boresight for 210 mainbeam UHFhead echoes when ALTAIR was pointing (a) on-radiant(mean at 22�) and (b) off-radiant (mean at 37�).
CLOSE ET AL.: CHARACTERISTICS OF HIGH-RESOLUTION METEOR HEAD ECHOES SIA X - 5

to assess the normalized frequency-dependent polarizationratios for each head echo. The resultant 34 dual-frequencyhead echoes were plotted as a function of their aspect angle,altitude, and RCS, however no trend was found. Head echoeslooked equally sphere-like regardless of whether ALTAIRwas viewing them ‘‘head-on’’ or at some angle and regardlessof detection altitude and RCS. We therefore conclude thathead echoes are not sensitive to the off-specular angle andsuggest at an isotropic scattering mechanism, which is con-sistent with the work of Jones and Webster [1991].
4.3. RCS Dependence on Frequency
[29] Head echoes measured by ALTAIR appear mostcommonly as single-frequency VHF measurements and,less frequently, as single-frequency UHF and two-frequencydetections. The analysis in this section indicates that headechoes result from an overdense scattering from meteoroidplasma.[30] Previously, we reported that the VHF RCS values
were, on average, 20–25 dBsm higher than the UHF RCS[Close et al., 2002]. Further, we showed that UHF crosssections ranged from 3.2 10�8 m2 (limit of the UHFsensitivity) up to 2.5 10�3 m2 while VHF cross sectionswere between 3.2 10�6 m2 (limit of the VHF sensitivity)and 1.8 10�1 m2. These values are consistent with theworks of Mathews et al. [1997], Zhou et al. [1998], andErickson et al. [2001]. We can further explore the wave-length dependence by comparing the RCS values on a per-pulse basis. This technique was applied to 34 head echoesthat were detected simultaneously at VHF and UHF. Themaximum VHF cross sections were between 12 and 32dBsm higher than their corresponding maximum UHFdetection. By assuming that the RCS is proportional to lx,the x values varied from 2.8 to 7.6 and averaged at 4.1.[31] A possible explanation for the frequency trend
follows. If the plasma density increases as you approachthe meteoroid as illustrated in Figure 4, a smaller incidentwavelength will penetrate further into the meteor plasmabefore reaching the critical density where the plasma andradar frequency match. Hence, smaller wavelengths will
return smaller RCS values. We begin by assuming that theelectron concentration falls off as r�a (where a is someconstant) after reaching its peak density. The peak density isalso proportional to f 2, where f is the radar frequency,therefore for our x values of 2.8 to 7.6, we find that theelectron density falls off as r1.02 to r1.76. This is slightly lessthan what you would expect from a strictly spherical,collisionless expansion (r2). By using multifrequency headecho data and analysis of this type, it should be possible tobetter characterize the size and shape of meteor plasmaduring its early, rapid expansion phase [Jones, 1995].[32] Many head echo detections appeared only in UHF or
VHF but not both; this was also reported by Zhou et al.[1998]. Using our monopulse capabilities, we were able toexclude beam width as a possible reason for this observation.For instance, in the 2042 UTC data file, a total of 100 VHFand 48 UHF head echoes were detected. Of these, 28 VHFand 25 UHF head echoes were contained within the mainUHF beam (±0.55 degrees in azimuth and elevation) andbetween 90 and 110 km altitude. Only 13 of the 28 VHF and25 UHF head echoes were dual-frequency detections.[33] The single-frequency UHF detections most likely
resulted from the minimum sensitivity of the VHF wave-form (�45 dBsm after accounting for the noise threshold).We examined the mean and maximum RCS values of thesingle- and dual-frequency UHF detections to confirm thisidea. The single-frequency UHF detections had RCS valuesbetween �60 and �65 dBsm with a mean of �63 dBsm,while the dual-frequency UHF detections had higher RCSvalues that ranged from �40 to �65 dBsm with a mean of�56 dBsm. This evidence suggests that the minimumdetectable VHF RCS is the cause of the single-frequencyUHF detections. The single-frequency UHF detections alsooccurred at slightly lower altitudes, suggesting a correlationbetween RCS and altitude, and had average velocities thatwere similar to the two-frequency detections (65 km/s).The connection between RCS, altitude, and velocity isdiscussed in section 4.4.[34] Dual-frequency detections show a correlation
between the UHF RCS and the VHF RCS. Figure 5 containsa plot of the maximum UHF RCS for 30 head echoes versusthe difference between the maximum RCS at VHF and themaximum UHF RCS. Figure 5 also includes a line showingthe minimum detectable difference. The limiting trend inFigure 5 is evident—low UHF RCS head echoes can onlycreate VHF head echoes that have RCS values above �45dBsm, therefore a low UHF RCS will correspond to ahigher VHF � UHF RCS difference. The new result is thathigh UHF RCS values tend to correlate with small VHF toUHF differences. For instance, a �25 dBsm UHF head echowill not, for example, form a �5 dBsm VHF echo, butinstead will create a smaller (e.g., �10 dBsm) head echo. Incontrast, a �55 dBsm UHF head echo does create a �25dBsm VHF head echo. This can be explained by one of twotheories: (1) a highly compact region of N electrons willhave the same RCS at both frequencies as described byequation (2) (J. Mathews, private communication) or (2) thevariation of electron density with radius indicates a smallerdifference in head echo size as you get further away fromthe meteoroid particle.[35] Our measurements also suggest that there is a
maximum RCS that a small meteoroid can produce. If we
Figure 4. Illustration of how the electron density theore-tically varies as a function of distance from the meteoroid.The solid black center represents the meteoroid, the redportion denotes the region where the electron densityincreases, and the subsequent blue rings show how theelectron density decreases with radius. By assumingoverdense reflection, the UHF wave (higher criticalfrequency) penetrates further into the meteoroid than theVHF reflection, thus explaining the lower UHF RCS (radiusof head echo).
SIA X - 6 CLOSE ET AL.: CHARACTERISTICS OF HIGH-RESOLUTION METEOR HEAD ECHOES
assume overdense scattering, then as the meteor plasmaexpands the RCS will increase until the peak density fallsbelow the critical density for a given radar frequency—atthis point the RCS will drop rapidly. This maximum RCSwill depend strongly on the plasma density and mean freepath between collisions with atmospheric molecules, andweakly on a number of additional variables, includingplasma composition and temperature.[36] The single-frequency VHF head echo RCS values, in
contrast, were similar to the dual-frequency RCS values.Zhou et al. [1998] also identified this trend, stating thatArecibo’s two-frequency UHF meteors had higher SNR thanthe single-frequency UHF meteors, but that no such correla-tion was found in Arecibo’s VHF detections. The ALTAIRdata did reveal one notable distinction between the single-frequency and two-frequency VHF echoes, namely a differ-ence in the average velocity. The single-frequency VHFdetections had average 3D velocities near 52 km/s, whilethe two-frequency detections had average 3D velocities near65 km/s. Meteoroids that travel with higher velocities alsoform plasma regions with higher electron line densitiesbecause the electron line density is proportional to v0.8
[Jones, 1995]. It is therefore probable that these lower-velocity, single-frequency VHF head echoes were simplynot dense enough to meet the criterion for a UHF overdensereflection.[37] It is clear that a strong dependence exists between
the RCS of a head echo and its velocity and altitude. In thenext section we explore these dependencies and theirrelation to overdense scattering.
4.4. RCS Dependence on Velocity and Altitude
[38] The RCS dependence on velocity and altituderevealed a strong correlation between the size of a headecho and the altitude, or mean free path. We began by
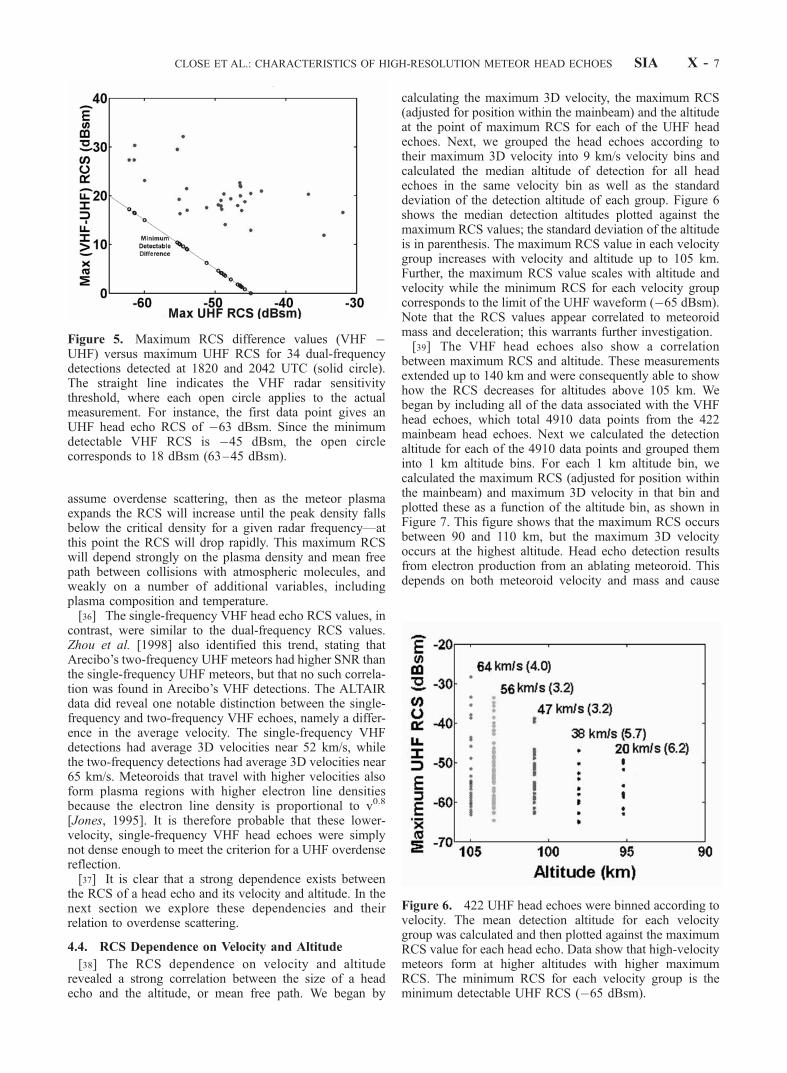
calculating the maximum 3D velocity, the maximum RCS(adjusted for position within the mainbeam) and the altitudeat the point of maximum RCS for each of the UHF headechoes. Next, we grouped the head echoes according totheir maximum 3D velocity into 9 km/s velocity bins andcalculated the median altitude of detection for all headechoes in the same velocity bin as well as the standarddeviation of the detection altitude of each group. Figure 6shows the median detection altitudes plotted against themaximum RCS values; the standard deviation of the altitudeis in parenthesis. The maximum RCS value in each velocitygroup increases with velocity and altitude up to 105 km.Further, the maximum RCS value scales with altitude andvelocity while the minimum RCS for each velocity groupcorresponds to the limit of the UHF waveform (�65 dBsm).Note that the RCS values appear correlated to meteoroidmass and deceleration; this warrants further investigation.[39] The VHF head echoes also show a correlation
between maximum RCS and altitude. These measurementsextended up to 140 km and were consequently able to showhow the RCS decreases for altitudes above 105 km. Webegan by including all of the data associated with the VHFhead echoes, which total 4910 data points from the 422mainbeam head echoes. Next we calculated the detectionaltitude for each of the 4910 data points and grouped theminto 1 km altitude bins. For each 1 km altitude bin, wecalculated the maximum RCS (adjusted for position withinthe mainbeam) and maximum 3D velocity in that bin andplotted these as a function of the altitude bin, as shown inFigure 7. This figure shows that the maximum RCS occursbetween 90 and 110 km, but the maximum 3D velocityoccurs at the highest altitude. Head echo detection resultsfrom electron production from an ablating meteoroid. Thisdepends on both meteoroid velocity and mass and cause
Figure 5. Maximum RCS difference values (VHF �UHF) versus maximum UHF RCS for 34 dual-frequencydetections detected at 1820 and 2042 UTC (solid circle).The straight line indicates the VHF radar sensitivitythreshold, where each open circle applies to the actualmeasurement. For instance, the first data point gives anUHF head echo RCS of �63 dBsm. Since the minimumdetectable VHF RCS is �45 dBsm, the open circlecorresponds to 18 dBsm (63–45 dBsm).
Figure 6. 422 UHF head echoes were binned according tovelocity. The mean detection altitude for each velocitygroup was calculated and then plotted against the maximumRCS value for each head echo. Data show that high-velocitymeteors form at higher altitudes with higher maximumRCS. The minimum RCS for each velocity group is theminimum detectable UHF RCS (�65 dBsm).
CLOSE ET AL.: CHARACTERISTICS OF HIGH-RESOLUTION METEOR HEAD ECHOES SIA X - 7

radar to preferentially detect fast-moving meteors of aparticular mass. Once the velocity and mass dependenceof ionization production (selection effects) are removedfrom the radar data, the peak of the velocity distributionresides at a value far below the 60 km/s typically quotedfrom head echo data.[40] Simple arguments about the nature of meteor abla-
tion, atmospheric density, and head echo detection explainthe general trends seen in Figure 7. We argue that only thefastest meteoroids will have sufficiently high ionizationrates to create overdense plasma in the thin atmosphereabove 110 km altitude. Meteoroids penetrating deeper intothe atmosphere encounter an exponentially increasing neu-tral density that allows for detection of slower meteors. Athigh altitudes the meteoroid region electron contentincreases as the rate of ablation and ionization increaseswith increasing penetration depth. At low altitudes (<90km), the meteoroid region electron content decreases as themeteoroid loses mass. The line density peaks at an altitudewhere the meteoroid dissipates the maximum amount ofkinetic energy at approximately 105 km [Ceplecha, 1998].The kinetic energy is dependent upon the air density (r), thephysical cross section of the meteoroid (s) and the velocity(v); kinetic energy is proportional to (sr v3). The RCSdependence on altitude reflects the variation in line densityand the size of the detected region. At high altitudes, thelarge mean free path causes a relatively low plasma densityeven for high ablation rates; we therefore expect a low RCSbecause the incident wavelength must penetrate further intothe plasma region before encountering the reflecting plasmadensity. At low altitudes, where the mean free path is small,the plasma is radially confined (less diffuse) so the criticaldensity is also reached at a smaller radius yielding a smallerRCS below 100 km. At these low altitudes, the RCS of thehead echo approximately follows the mean free path varia-tion with altitude. The maximum RCS, centered around 105km, occurs at that point because of both the high electrondensity regions and sufficient confinement by the surround-ing neutral atmosphere. Using simple models of meteorablation, atmospheric expansion of meteor plasma, and head
echo detection, it should be possible to refine our under-standing of meteor distributions and characteristics withanalysis based on the type of data collected here.[41] The RCS variation with altitude is roughly propor-
tional to the daytime electron density variation with heightin the E region ionosphere (the Chapman function). Thiscorrespondence is consistent with models of electron linedensity [Opik, 1958].[42] The altitude where the RCS is maximized (105 km)
is also where head echoes exhibit their maximum deceler-ation. Figure 8 shows the maximum deceleration for each ofthe VHF head echoes as a function of its correspondingdetection altitude; the largest decelerating head echoes weredetected near 104 km altitude. This result is consistent withthe RCS dependence on altitude: the height where themaximum amount of kinetic energy is given off is alsothe height of maximum deceleration.
4.5. Head Echo Radii
[43] Using the ALTAIR data and assumptions about themechanism responsible for head echoes, we can estimate thesize of the meteoroid plasma region and its plasma density.However, the differing mechanisms for creating head ech-oes, discussed in section 1.1, each lead to different densityestimates, with the lowest density usually being sufficient tocreate an overdense echo. In this section we evaluate thesemechanisms and conclude that most, if not all, head echoobservations result from overdense scattering.[44] Assuming head echoes result from overdense scat-
tering, we use the RCS to calculate the radius of theoverdense plasma region and the number of electronscontained within that volume. Equation (4) allows one toapproximate the radius of a reflective object given its RCS,assuming the object is smaller than the incident wavelength.The exact solution for scattering by a conducting sphere isthe Mie series as discussed in section 1.1 [Blake, 1986]. Weused the Mie formula to calculate the radii of the headechoes through an iterative process, whereby the RCS andtransmit frequency were input into the solution and the
Figure 7. The maximum RCS (open circles) and max-imum 3D velocity (filled circles) was calculated over each500 m altitude bin. These data include 4910 VHF hits or210 total VHF head echoes.
Figure 8. The maximum deceleration of each head echoas a function of the first (maximum) altitude of detection for422 VHF head echoes. The highest decelerations corre-spond to head echoes detected 104.5 km.
SIA X - 8 CLOSE ET AL.: CHARACTERISTICS OF HIGH-RESOLUTION METEOR HEAD ECHOES
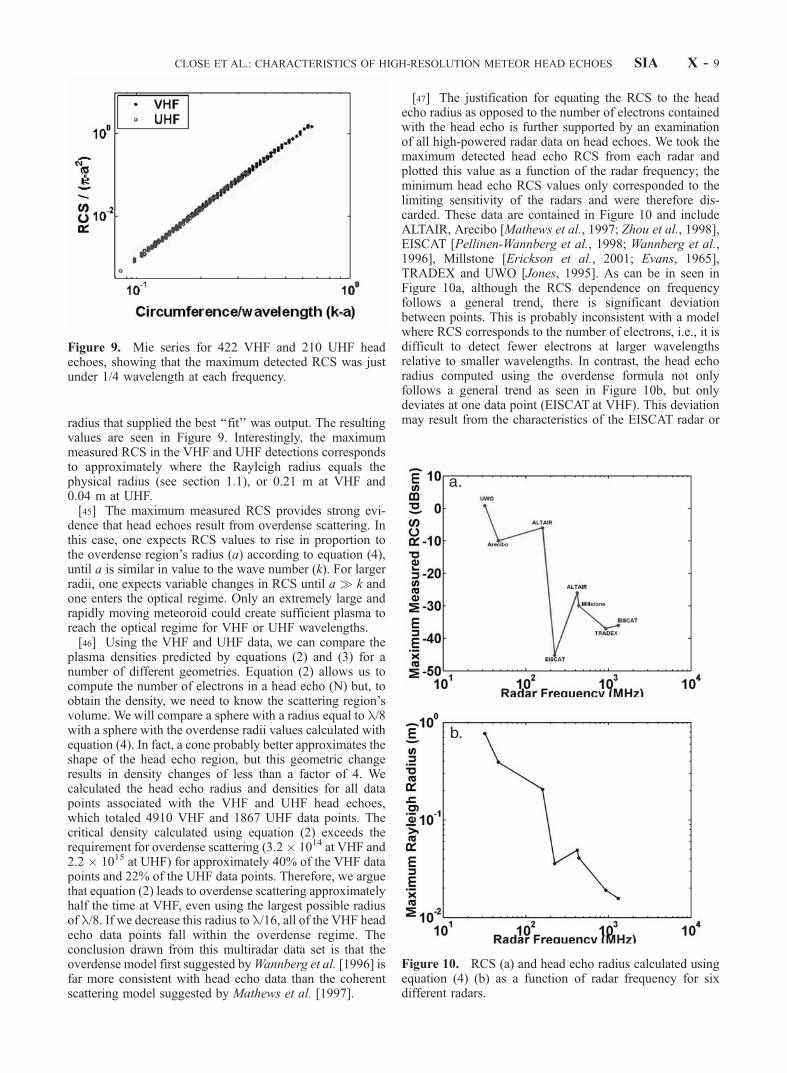
radius that supplied the best ‘‘fit’’ was output. The resultingvalues are seen in Figure 9. Interestingly, the maximummeasured RCS in the VHF and UHF detections correspondsto approximately where the Rayleigh radius equals thephysical radius (see section 1.1), or 0.21 m at VHF and0.04 m at UHF.[45] The maximum measured RCS provides strong evi-
dence that head echoes result from overdense scattering. Inthis case, one expects RCS values to rise in proportion tothe overdense region’s radius (a) according to equation (4),until a is similar in value to the wave number (k). For largerradii, one expects variable changes in RCS until a � k andone enters the optical regime. Only an extremely large andrapidly moving meteoroid could create sufficient plasma toreach the optical regime for VHF or UHF wavelengths.[46] Using the VHF and UHF data, we can compare the
plasma densities predicted by equations (2) and (3) for anumber of different geometries. Equation (2) allows us tocompute the number of electrons in a head echo (N) but, toobtain the density, we need to know the scattering region’svolume. We will compare a sphere with a radius equal to l/8with a sphere with the overdense radii values calculated withequation (4). In fact, a cone probably better approximates theshape of the head echo region, but this geometric changeresults in density changes of less than a factor of 4. Wecalculated the head echo radius and densities for all datapoints associated with the VHF and UHF head echoes,which totaled 4910 VHF and 1867 UHF data points. Thecritical density calculated using equation (2) exceeds therequirement for overdense scattering (3.2 1014 at VHF and2.2 1015 at UHF) for approximately 40% of the VHF datapoints and 22% of the UHF data points. Therefore, we arguethat equation (2) leads to overdense scattering approximatelyhalf the time at VHF, even using the largest possible radiusof l/8. If we decrease this radius to l/16, all of the VHF headecho data points fall within the overdense regime. Theconclusion drawn from this multiradar data set is that theoverdense model first suggested byWannberg et al. [1996] isfar more consistent with head echo data than the coherentscattering model suggested by Mathews et al. [1997].
[47] The justification for equating the RCS to the headecho radius as opposed to the number of electrons containedwith the head echo is further supported by an examinationof all high-powered radar data on head echoes. We took themaximum detected head echo RCS from each radar andplotted this value as a function of the radar frequency; theminimum head echo RCS values only corresponded to thelimiting sensitivity of the radars and were therefore dis-carded. These data are contained in Figure 10 and includeALTAIR, Arecibo [Mathews et al., 1997; Zhou et al., 1998],EISCAT [Pellinen-Wannberg et al., 1998; Wannberg et al.,1996], Millstone [Erickson et al., 2001; Evans, 1965],TRADEX and UWO [Jones, 1995]. As can be in seen inFigure 10a, although the RCS dependence on frequencyfollows a general trend, there is significant deviationbetween points. This is probably inconsistent with a modelwhere RCS corresponds to the number of electrons, i.e., it isdifficult to detect fewer electrons at larger wavelengthsrelative to smaller wavelengths. In contrast, the head echoradius computed using the overdense formula not onlyfollows a general trend as seen in Figure 10b, but onlydeviates at one data point (EISCAT at VHF). This deviationmay result from the characteristics of the EISCAT radar or
Figure 9. Mie series for 422 VHF and 210 UHF headechoes, showing that the maximum detected RCS was justunder 1/4 wavelength at each frequency.
Figure 10. RCS (a) and head echo radius calculated usingequation (4) (b) as a function of radar frequency for sixdifferent radars.
CLOSE ET AL.: CHARACTERISTICS OF HIGH-RESOLUTION METEOR HEAD ECHOES SIA X - 9
the data set used. In addition, Doppler processing was alsoperformed on a subset of these head echoes in order tocompare 3D velocities with Doppler velocities. An importantresult was that there was virtually no Doppler spread,indicating that the head echo represents a point-like target. Ifthe head echo reflects as a coherent plasma (equation (2)), it isprobable that we would see some width to the Doppler signal.
The conclusion drawn from this multiradar data set is that theoverdense model is more consistent with head echo data thanthe coherent scattering model.
4.6. Head Echo Detected at Three Frequencies
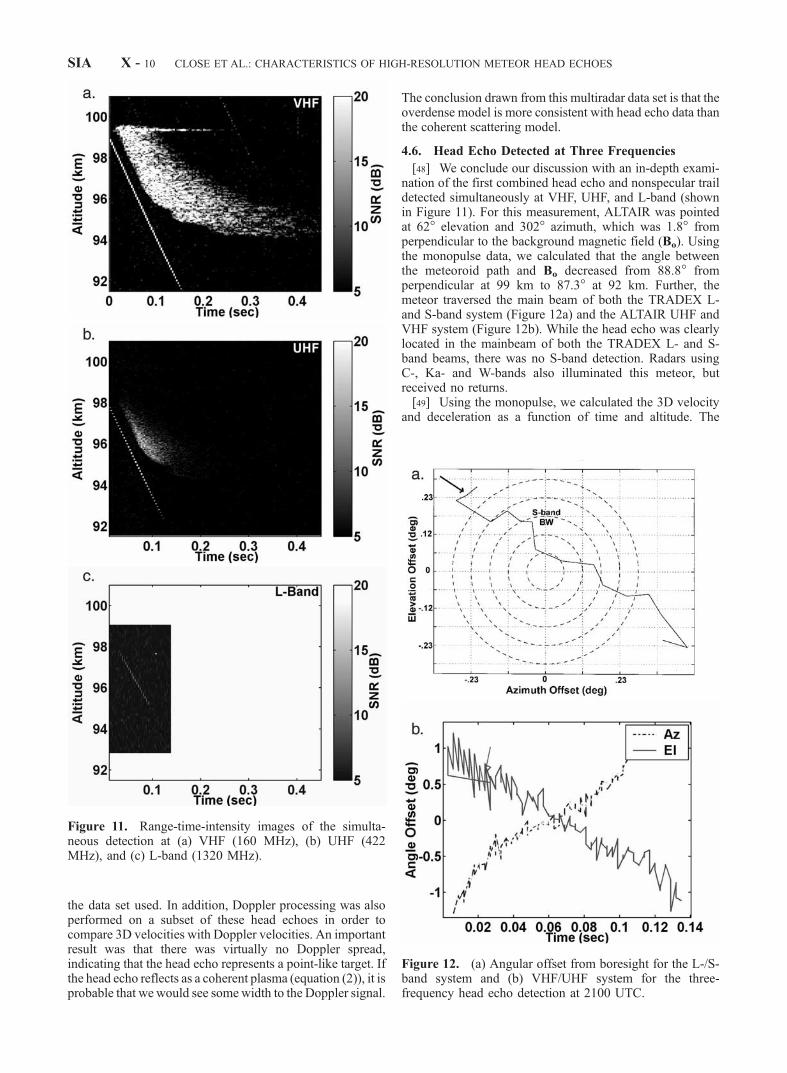
[48] We conclude our discussion with an in-depth exami-nation of the first combined head echo and nonspecular traildetected simultaneously at VHF, UHF, and L-band (shownin Figure 11). For this measurement, ALTAIR was pointedat 62� elevation and 302� azimuth, which was 1.8� fromperpendicular to the background magnetic field (Bo). Usingthe monopulse data, we calculated that the angle betweenthe meteoroid path and Bo decreased from 88.8� fromperpendicular at 99 km to 87.3� at 92 km. Further, themeteor traversed the main beam of both the TRADEX L-and S-band system (Figure 12a) and the ALTAIR UHF andVHF system (Figure 12b). While the head echo was clearlylocated in the mainbeam of both the TRADEX L- and S-band beams, there was no S-band detection. Radars usingC-, Ka- and W-bands also illuminated this meteor, butreceived no returns.[49] Using the monopulse, we calculated the 3D velocity
and deceleration as a function of time and altitude. The
Figure 11. Range-time-intensity images of the simulta-neous detection at (a) VHF (160 MHz), (b) UHF (422MHz), and (c) L-band (1320 MHz).
Figure 12. (a) Angular offset from boresight for the L-/S-band system and (b) VHF/UHF system for the three-frequency head echo detection at 2100 UTC.
SIA X - 10 CLOSE ET AL.: CHARACTERISTICS OF HIGH-RESOLUTION METEOR HEAD ECHOES
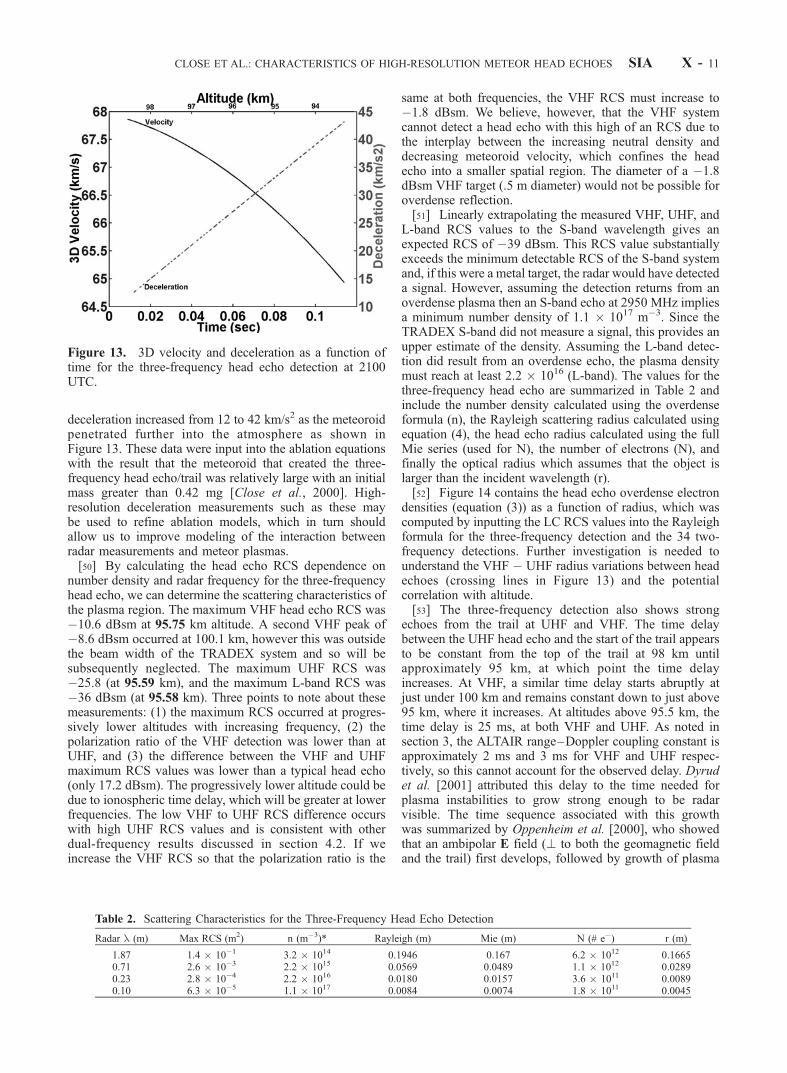
deceleration increased from 12 to 42 km/s2 as the meteoroidpenetrated further into the atmosphere as shown inFigure 13. These data were input into the ablation equationswith the result that the meteoroid that created the three-frequency head echo/trail was relatively large with an initialmass greater than 0.42 mg [Close et al., 2000]. High-resolution deceleration measurements such as these maybe used to refine ablation models, which in turn shouldallow us to improve modeling of the interaction betweenradar measurements and meteor plasmas.[50] By calculating the head echo RCS dependence on
number density and radar frequency for the three-frequencyhead echo, we can determine the scattering characteristics ofthe plasma region. The maximum VHF head echo RCS was�10.6 dBsm at 95.75 km altitude. A second VHF peak of�8.6 dBsm occurred at 100.1 km, however this was outsidethe beam width of the TRADEX system and so will besubsequently neglected. The maximum UHF RCS was�25.8 (at 95.59 km), and the maximum L-band RCS was�36 dBsm (at 95.58 km). Three points to note about thesemeasurements: (1) the maximum RCS occurred at progres-sively lower altitudes with increasing frequency, (2) thepolarization ratio of the VHF detection was lower than atUHF, and (3) the difference between the VHF and UHFmaximum RCS values was lower than a typical head echo(only 17.2 dBsm). The progressively lower altitude could bedue to ionospheric time delay, which will be greater at lowerfrequencies. The low VHF to UHF RCS difference occurswith high UHF RCS values and is consistent with otherdual-frequency results discussed in section 4.2. If weincrease the VHF RCS so that the polarization ratio is the
same at both frequencies, the VHF RCS must increase to�1.8 dBsm. We believe, however, that the VHF systemcannot detect a head echo with this high of an RCS due tothe interplay between the increasing neutral density anddecreasing meteoroid velocity, which confines the headecho into a smaller spatial region. The diameter of a �1.8dBsm VHF target (.5 m diameter) would not be possible foroverdense reflection.[51] Linearly extrapolating the measured VHF, UHF, and
L-band RCS values to the S-band wavelength gives anexpected RCS of �39 dBsm. This RCS value substantiallyexceeds the minimum detectable RCS of the S-band systemand, if this were a metal target, the radar would have detecteda signal. However, assuming the detection returns from anoverdense plasma then an S-band echo at 2950 MHz impliesa minimum number density of 1.1 1017 m�3. Since theTRADEX S-band did not measure a signal, this provides anupper estimate of the density. Assuming the L-band detec-tion did result from an overdense echo, the plasma densitymust reach at least 2.2 1016 (L-band). The values for thethree-frequency head echo are summarized in Table 2 andinclude the number density calculated using the overdenseformula (n), the Rayleigh scattering radius calculated usingequation (4), the head echo radius calculated using the fullMie series (used for N), the number of electrons (N), andfinally the optical radius which assumes that the object islarger than the incident wavelength (r).[52] Figure 14 contains the head echo overdense electron
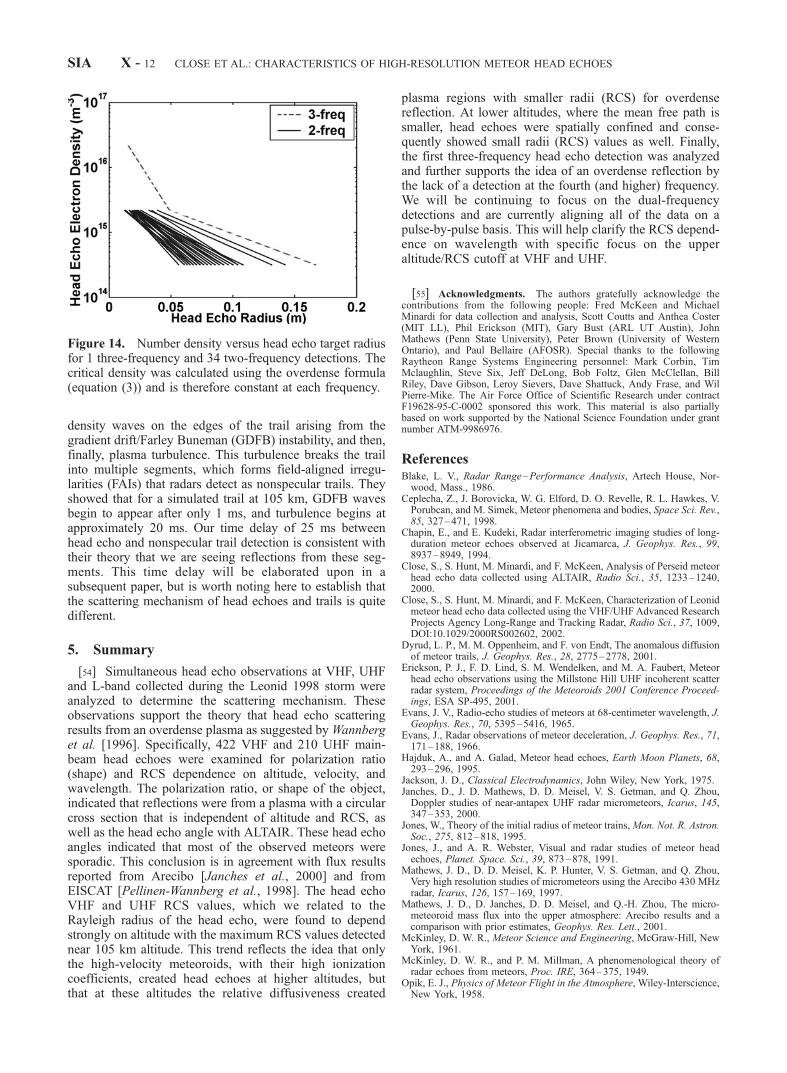
densities (equation (3)) as a function of radius, which wascomputed by inputting the LC RCS values into the Rayleighformula for the three-frequency detection and the 34 two-frequency detections. Further investigation is needed tounderstand the VHF � UHF radius variations between headechoes (crossing lines in Figure 13) and the potentialcorrelation with altitude.[53] The three-frequency detection also shows strong
echoes from the trail at UHF and VHF. The time delaybetween the UHF head echo and the start of the trail appearsto be constant from the top of the trail at 98 km untilapproximately 95 km, at which point the time delayincreases. At VHF, a similar time delay starts abruptly atjust under 100 km and remains constant down to just above95 km, where it increases. At altitudes above 95.5 km, thetime delay is 25 ms, at both VHF and UHF. As noted insection 3, the ALTAIR range–Doppler coupling constant isapproximately 2 ms and 3 ms for VHF and UHF respec-tively, so this cannot account for the observed delay. Dyrudet al. [2001] attributed this delay to the time needed forplasma instabilities to grow strong enough to be radarvisible. The time sequence associated with this growthwas summarized by Oppenheim et al. [2000], who showedthat an ambipolar E field (? to both the geomagnetic fieldand the trail) first develops, followed by growth of plasma
Figure 13. 3D velocity and deceleration as a function oftime for the three-frequency head echo detection at 2100UTC.
Table 2. Scattering Characteristics for the Three-Frequency Head Echo Detection
Radar l (m) Max RCS (m2) n (m�3)* Rayleigh (m) Mie (m) N (# e�) r (m)
1.87 1.4 10�1 3.2 1014 0.1946 0.167 6.2 1012 0.16650.71 2.6 10�3 2.2 1015 0.0569 0.0489 1.1 1012 0.02890.23 2.8 10�4 2.2 1016 0.0180 0.0157 3.6 1011 0.00890.10 6.3 10�5 1.1 1017 0.0084 0.0074 1.8 1011 0.0045
CLOSE ET AL.: CHARACTERISTICS OF HIGH-RESOLUTION METEOR HEAD ECHOES SIA X - 11
density waves on the edges of the trail arising from thegradient drift/Farley Buneman (GDFB) instability, and then,finally, plasma turbulence. This turbulence breaks the trailinto multiple segments, which forms field-aligned irregu-larities (FAIs) that radars detect as nonspecular trails. Theyshowed that for a simulated trail at 105 km, GDFB wavesbegin to appear after only 1 ms, and turbulence begins atapproximately 20 ms. Our time delay of 25 ms betweenhead echo and nonspecular trail detection is consistent withtheir theory that we are seeing reflections from these seg-ments. This time delay will be elaborated upon in asubsequent paper, but is worth noting here to establish thatthe scattering mechanism of head echoes and trails is quitedifferent.
5. Summary
[54] Simultaneous head echo observations at VHF, UHFand L-band collected during the Leonid 1998 storm wereanalyzed to determine the scattering mechanism. Theseobservations support the theory that head echo scatteringresults from an overdense plasma as suggested byWannberget al. [1996]. Specifically, 422 VHF and 210 UHF main-beam head echoes were examined for polarization ratio(shape) and RCS dependence on altitude, velocity, andwavelength. The polarization ratio, or shape of the object,indicated that reflections were from a plasma with a circularcross section that is independent of altitude and RCS, aswell as the head echo angle with ALTAIR. These head echoangles indicated that most of the observed meteors weresporadic. This conclusion is in agreement with flux resultsreported from Arecibo [Janches et al., 2000] and fromEISCAT [Pellinen-Wannberg et al., 1998]. The head echoVHF and UHF RCS values, which we related to theRayleigh radius of the head echo, were found to dependstrongly on altitude with the maximum RCS values detectednear 105 km altitude. This trend reflects the idea that onlythe high-velocity meteoroids, with their high ionizationcoefficients, created head echoes at higher altitudes, butthat at these altitudes the relative diffusiveness created
plasma regions with smaller radii (RCS) for overdensereflection. At lower altitudes, where the mean free path issmaller, head echoes were spatially confined and conse-quently showed small radii (RCS) values as well. Finally,the first three-frequency head echo detection was analyzedand further supports the idea of an overdense reflection bythe lack of a detection at the fourth (and higher) frequency.We will be continuing to focus on the dual-frequencydetections and are currently aligning all of the data on apulse-by-pulse basis. This will help clarify the RCS depend-ence on wavelength with specific focus on the upperaltitude/RCS cutoff at VHF and UHF.
[55] Acknowledgments. The authors gratefully acknowledge thecontributions from the following people: Fred McKeen and MichaelMinardi for data collection and analysis, Scott Coutts and Anthea Coster(MIT LL), Phil Erickson (MIT), Gary Bust (ARL UT Austin), JohnMathews (Penn State University), Peter Brown (University of WesternOntario), and Paul Bellaire (AFOSR). Special thanks to the followingRaytheon Range Systems Engineering personnel: Mark Corbin, TimMclaughlin, Steve Six, Jeff DeLong, Bob Foltz, Glen McClellan, BillRiley, Dave Gibson, Leroy Sievers, Dave Shattuck, Andy Frase, and WilPierre-Mike. The Air Force Office of Scientific Research under contractF19628-95-C-0002 sponsored this work. This material is also partiallybased on work supported by the National Science Foundation under grantnumber ATM-9986976.
ReferencesBlake, L. V., Radar Range–Performance Analysis, Artech House, Nor-wood, Mass., 1986.
Ceplecha, Z., J. Borovicka, W. G. Elford, D. O. Revelle, R. L. Hawkes, V.Porubcan, and M. Simek, Meteor phenomena and bodies, Space Sci. Rev.,85, 327–471, 1998.
Chapin, E., and E. Kudeki, Radar interferometric imaging studies of long-duration meteor echoes observed at Jicamarca, J. Geophys. Res., 99,8937–8949, 1994.
Close, S., S. Hunt, M. Minardi, and F. McKeen, Analysis of Perseid meteorhead echo data collected using ALTAIR, Radio Sci., 35, 1233–1240,2000.
Close, S., S. Hunt, M. Minardi, and F. McKeen, Characterization of Leonidmeteor head echo data collected using the VHF/UHFAdvanced ResearchProjects Agency Long-Range and Tracking Radar, Radio Sci., 37, 1009,DOI:10.1029/2000RS002602, 2002.
Dyrud, L. P., M. M. Oppenheim, and F. von Endt, The anomalous diffusionof meteor trails, J. Geophys. Res., 28, 2775–2778, 2001.
Erickson, P. J., F. D. Lind, S. M. Wendelken, and M. A. Faubert, Meteorhead echo observations using the Millstone Hill UHF incoherent scatterradar system, Proceedings of the Meteoroids 2001 Conference Proceed-ings, ESA SP-495, 2001.
Evans, J. V., Radio-echo studies of meteors at 68-centimeter wavelength, J.Geophys. Res., 70, 5395–5416, 1965.
Evans, J., Radar observations of meteor deceleration, J. Geophys. Res., 71,171–188, 1966.
Hajduk, A., and A. Galad, Meteor head echoes, Earth Moon Planets, 68,293–296, 1995.
Jackson, J. D., Classical Electrodynamics, John Wiley, New York, 1975.Janches, D., J. D. Mathews, D. D. Meisel, V. S. Getman, and Q. Zhou,Doppler studies of near-antapex UHF radar micrometeors, Icarus, 145,347–353, 2000.
Jones, W., Theory of the initial radius of meteor trains,Mon. Not. R. Astron.Soc., 275, 812–818, 1995.
Jones, J., and A. R. Webster, Visual and radar studies of meteor headechoes, Planet. Space. Sci., 39, 873–878, 1991.
Mathews, J. D., D. D. Meisel, K. P. Hunter, V. S. Getman, and Q. Zhou,Very high resolution studies of micrometeors using the Arecibo 430 MHzradar, Icarus, 126, 157–169, 1997.
Mathews, J. D., D. Janches, D. D. Meisel, and Q.-H. Zhou, The micro-meteoroid mass flux into the upper atmosphere: Arecibo results and acomparison with prior estimates, Geophys. Res. Lett., 2001.
McKinley, D. W. R., Meteor Science and Engineering, McGraw-Hill, NewYork, 1961.
McKinley, D. W. R., and P. M. Millman, A phenomenological theory ofradar echoes from meteors, Proc. IRE, 364–375, 1949.
Opik, E. J., Physics of Meteor Flight in the Atmosphere, Wiley-Interscience,New York, 1958.
Figure 14. Number density versus head echo target radiusfor 1 three-frequency and 34 two-frequency detections. Thecritical density was calculated using the overdense formula(equation (3)) and is therefore constant at each frequency.
SIA X - 12 CLOSE ET AL.: CHARACTERISTICS OF HIGH-RESOLUTION METEOR HEAD ECHOES

Oppenheim, M. M., A. F. von Endt, and L. P. Dyrud, Electrodynamics ofmeteor trail evolution in the equatorial E-region ionosphere, GeophysRes. Lett., 2000.
Pellinen-Wannberg, A., and G. Wannberg, Meteor observations with theEuropean incoherent scatter UHF radar, J. Geophys. Res., 99, 11,379–11,390, 1994.
Pellinen-Wannberg, A., A. Westman, G. Wannberg, and K. Kaila, Meteorfluxes and visual magnitudes from EISCAT radar event rates: A compar-ison with cross-section based magnitude estimates and optical data, Ann.Geophys., 116, 1475–1485, 1998.
Skolnik, M. I., Radar Handbook, McGraw-Hill, New York, 1990.Sugar, Radio propagation by reflection from meteor trails, Proc. IEEE,116–136, 1964.
Wannberg, G., A. Pellinen-Wannberg, and A. Westman, An ambiguity-function-based method for analysis of Doppler decompressed radar sig-
nals applied to EISCAT measurements of oblique UHF–VHF meteorechoes, Radio Sci., 31, 497–518, 1996.
Zhou, Q., C. A. Tepley, and M. P. Sulzer, Meteor observation by theArecibo 430 MHz ISR, I, Results from time-integrated observations, J.Atmos. Terr. Phys., 57, 421, 1995.
Zhou, Q. H., P. Perillat, J. Y. N. Cho, and J. D. Mathews, Simultaneousmeteor echo observations by large aperture VHF and UHF radars, RadioSci., 33, 1641–1654, 1998.
�����������S. Close and S. Hunt, Lincoln Laboratory, Massachusetts Institute of
Technology, 244 Wood Street, Lexington, MA 02420, USA. ([email protected])L. Dyrud and M. Oppenheim, Center for Space Physics, Boston
University, Boston, MA, USA.
CLOSE ET AL.: CHARACTERISTICS OF HIGH-RESOLUTION METEOR HEAD ECHOES SIA X - 13
Copyright © 2022 FDOKUMEN